Associating particulate essential fatty acids of the omega3 family with phytoplankton species...
14
Associating particulate essential fatty acids of the x3 family with phytoplankton species composition in a Siberian reservoir NADEZHDA N. SUSHCHIK,* MICHAIL I. GLADYSHEV,* OLESIA N. MAKHUTOVA,* GALINA S. KALACHOVA,* ELENA S. KRAVCHUK* AND ELENA A. IVANOVA † *Institute of Biophysics of Siberian Branch of Russian Academy of Sciences, Akademgorodok, Krasnoyarsk, Russia † Krasnoyarsk State Agricultural University, Krasnoyarsk, Russia SUMMARY 1. We studied variation in the composition of fatty acids in the seston of a small freshwater reservoir with changes in phytoplankton composition during four growth seasons. We focused on the dynamics of the x3 fatty acids because of their potential importance for zooplankton nutrition. 2. Total diatoms were related to the 20:5x3 fatty acid (eicosapentaenoic, EPA) content in seston. Among two dominant diatom genera, Cyclotella was not associated with EPA content. In contrast, there was a significant correlation between Stephanodiscus and the percentage contribution and content of EPA throughout the study. Hence, freshwater diatoms can differ strongly in content of the essential EPA. 3. We considered abundant cyanobacteria as a potential source of 18:3x3 fatty acid (linolenic, ALA) to aquatic food webs. Among four dominant cyanobacteria species, two (Anabaena flos-aquae and Planktothrix agardhii) showed significant correlation with the ALA content of the seston, while the other two (Aphanizomenon flos-aquae and Microcystis aeruginosa) did not. 4. Dinophyta had a relatively high level of 22:6x3 (docosahexaenoic, DHA) for freshwater species and can be also a source of EPA to aquatic food webs. 5. Our results show that various species of diatoms as well as cyanobacteria can be of contrasting nutritional value for zooplankton because of their different content of the essential PUFAs. Diatoms, which are low in EPA, could not be considered as a valuable food, while some field populations of cyanobacteria might be valuable sources of essential ALA. Keywords: cyanobacteria, diatoms, fatty acids, food quality, species composition Introduction Fatty acids in particulate matter and sediments are widely studied as biomarkers of the sources and transfer of organic matter in aquatic food webs (Claustre et al., 1989; Ederington, McManus & Harvey, 1995; Desvilettes et al., 1997; Volkman et al., 1998). Some of them, namely polyunsaturated fatty acids of the x3 family (x3 PUFA), are now recognised as essential for the nutrition of a wide range of animals (Sargent et al., 1995; Ahlgren et al., 1997; Gulati & DeMott, 1997; Arts, Ackman & Holub, 2001). The x3 PUFAs in freshwater ecosystems are produced mainly by micro-algae, with their syn- thesis depending strongly upon genetic (Cobalas & Lechado, 1989; Gugger et al., 2002) and environmental factors, such as temperature, mineral nutrients, Correspondence: Nadezhda N. Sushchik, Institute of Biophysics of Siberian Branch of Russian Academy of Sciences, Akademgorodok, Krasnoyarsk, 660036, Russia. E-mail: [email protected] Freshwater Biology (2004) 49, 1206–1219 doi:10.1111/j.1365-2427.2004.01263.x 1206 ȑ 2004 Blackwell Publishing Ltd
-
Upload
independent -
Category
Documents
-
view
3 -
download
0
Transcript of Associating particulate essential fatty acids of the omega3 family with phytoplankton species...

Associating particulate essential fatty acids of the x3family with phytoplankton species composition in aSiberian reservoir
NADEZHDA N. SUSHCHIK,* MICHAIL I . GLADYSHEV,* OLESIA N. MAKHUTOVA,*
GALINA S. KALACHOVA,* ELENA S. KRAVCHUK* AND ELENA A. IVANOVA†
*Institute of Biophysics of Siberian Branch of Russian Academy of Sciences, Akademgorodok, Krasnoyarsk, Russia†Krasnoyarsk State Agricultural University, Krasnoyarsk, Russia
SUMMARY
1. We studied variation in the composition of fatty acids in the seston of a small freshwater
reservoir with changes in phytoplankton composition during four growth seasons. We
focused on the dynamics of the x3 fatty acids because of their potential importance for
zooplankton nutrition.
2. Total diatoms were related to the 20:5x3 fatty acid (eicosapentaenoic, EPA) content in
seston. Among two dominant diatom genera, Cyclotella was not associated with EPA
content. In contrast, there was a significant correlation between Stephanodiscus and the
percentage contribution and content of EPA throughout the study. Hence, freshwater
diatoms can differ strongly in content of the essential EPA.
3. We considered abundant cyanobacteria as a potential source of 18:3x3 fatty acid
(linolenic, ALA) to aquatic food webs. Among four dominant cyanobacteria species, two
(Anabaena flos-aquae and Planktothrix agardhii) showed significant correlation with the ALA
content of the seston, while the other two (Aphanizomenon flos-aquae and Microcystis
aeruginosa) did not.
4. Dinophyta had a relatively high level of 22:6x3 (docosahexaenoic, DHA) for freshwater
species and can be also a source of EPA to aquatic food webs.
5. Our results show that various species of diatoms as well as cyanobacteria can be of
contrasting nutritional value for zooplankton because of their different content of the
essential PUFAs. Diatoms, which are low in EPA, could not be considered as a valuable
food, while some field populations of cyanobacteria might be valuable sources of essential
ALA.
Keywords: cyanobacteria, diatoms, fatty acids, food quality, species composition
Introduction
Fatty acids in particulate matter and sediments are
widely studied as biomarkers of the sources and
transfer of organic matter in aquatic food
webs (Claustre et al., 1989; Ederington, McManus &
Harvey, 1995; Desvilettes et al., 1997; Volkman et al.,
1998). Some of them, namely polyunsaturated fatty
acids of the x3 family (x3 PUFA), are now recognised
as essential for the nutrition of a wide range of
animals (Sargent et al., 1995; Ahlgren et al., 1997;
Gulati & DeMott, 1997; Arts, Ackman & Holub,
2001). The x3 PUFAs in freshwater ecosystems
are produced mainly by micro-algae, with their syn-
thesis depending strongly upon genetic (Cobalas &
Lechado, 1989; Gugger et al., 2002) and environmental
factors, such as temperature, mineral nutrients,
Correspondence: Nadezhda N. Sushchik, Institute of Biophysics
of Siberian Branch of Russian Academy of Sciences,
Akademgorodok, Krasnoyarsk, 660036, Russia.
E-mail: [email protected]
Freshwater Biology (2004) 49, 1206–1219 doi:10.1111/j.1365-2427.2004.01263.x
1206 � 2004 Blackwell Publishing Ltd

light, salinity and others (Pohl & Zurheide, 1982;
Roessler, 1990).
The PUFA content of seston has been considered
to be one of the main factors potentially controlling
the growth of zooplankton in freshwater ecosystems
and, therefore, to be a good predictor of the
nutritional quality of the environment, although its
role in zooplankton nutrition is still uncertain (Gulati
& DeMott, 1997). Among PUFAs, eicosapentaenoic
acid 20:5x3 (EPA) is thought to be central to the
nutrition of herbivorous zooplankton, because corre-
lative evidence suggests that this PUFA limits
Daphnia growth (Muller-Navarra, 1995b; Muller-
Navarra et al., 2000). Diatoms usually contain large
amounts of EPA (Cobalas & Lechado, 1989; Dunstan
et al., 1994; Shin et al., 2000) and, along with the
other EPA-rich algal taxa (cryptophytes and chrys-
ophytes), are thought to be of high quality as food
for herbivores. However, it has been shown that
some marine diatom plankton communities con-
tained little EPA (Morris, 1984; Claustre et al., 1989).
During a seasonal survey of two small reservoirs, we
also found a relatively low percentage of 20:5x3 in
seston, even when diatoms were dominant in early
spring (Sushchik et al., 2003a).
Fatty acid composition within the higher taxa of
algae may be quite variable. For instance, cyanobac-
terial species have been divided into four or five
groups showing different patterns and content of x3
PUFAs (Murata, Wada & Gombos, 1992; Cohen,
Margheri & Tomaselli, 1995). The variation in the
EPA content of diatoms is probably related to
differences between species. Therefore, to estimate
correctly the nutritional value of a diatom community
(as well as that of the whole phytoplankton commu-
nity) its species composition and PUFA content of the
dominant species under natural conditions must be
known. However, most studies of the fatty acids in
micro-algae have been carried out in laboratory
cultures (Ahlgren, Gustafsson & Boberg, 1992; Dun-
stan et al., 1994) or in the seston of marine ecosystems
(Kattner, Gercken & Eberlein, 1983; Morris, 1984;
Mayzaud, Claustre & Augier, 1990; Ederington et al.,
1995; Shin et al., 2000), whereas data on the fatty acids
of the freshwater phytoplankton are sparse (Miyazaki,
1983; Leveille, Amblard & Bourdier, 1997).
Besides the EPA limitation hypothesis, recent
studies emphasise the importance of the whole x3
family of PUFAs in the growth of freshwater
cladocerans (Ahlgren et al., 1997; DeMott & Muller-
Navarra, 1997; De Lange & Arts, 1999). There is also
strong correlative evidence that another x3 PUFA,
a-linolenic acid (ALA, 18:3x3), could be the main
limiting factor for growth of a Daphnia population,
whereas EPA was of moderate significance only
(Wacker & von Elert, 2001; von Elert, 2002). We also
found a strong correlation between the biomass of
Daphnia and the content of 18:3x3 in the seston of a
small reservoir (Sushchik et al., 2003a). According to
the literature, cyanobacteria and green algae in
laboratory cultures may contain large amounts of
this essential PUFA (Ahlgren et al., 1992; Gugger
et al., 2002), although different species may vary
greatly in their content. Therefore, we suggest that
besides the obvious differences in PUFA content
amongst the higher taxa, the nutritional value of the
phytoplankton community with respect to the major
x3 PUFAs may vary significantly because of
different species composition. To check this we
need detailed information on the fatty acids in
freshwater phytoplankton communities, taking into
account species composition and interannual differ-
ences.
We carried out a long-term study of fatty acids in
the seston of a freshwater reservoir, which is charac-
terised by distinct periods of domination by cyano-
bacteria and eukaryotic algae during the growth
season and has a variable species composition. The
aim of the study was to elucidate the relationship
between species composition within the higher taxa
(diatoms and cyanobacteria) and the content of
essential PUFAs of the x3 family in the seston.
Methods
Study site
Bugach reservoir (surface area, 0.32 km2; maximum
depth, 7 m) is near Krasnoyarsk City (Siberia, Russia,
56�05¢N, 92�40¢E) and is used for recreation and
fishing. Detailed descriptions of the reservoir are
given elsewhere (Gladyshev et al., 2001; Trusova &
Gladyshev, 2002; Sushchik et al., 2003a). Hydro-
chemical and hydrobiological measurements were
made weekly from May to September in 1999–2002,
from a site near the middle of the reservoir. Samples
were taken from the surface, at the transparency
depth (near 1 m) and at 3 m with a Ruttner-like 8-L
Fatty acids in a freshwater reservoir 1207
� 2004 Blackwell Publishing Ltd, Freshwater Biology, 49, 1206–1219

sampler and were pooled immediately to form a final
bulk sample.
Field and laboratory measurements
Water temperature and dissolved oxygen were meas-
ured with a meter (N5221; MERA-ELWRO, Warsaw,
Poland, in 1999–2000 and with a MO128; Mettler
Toledo, Schwerzenbach, Switzerland in 2001–02).
Phytoplankton subsamples (0.15–0.5 L) were fil-
tered through membrane filters (Vladipor, Mytischi,
Russia; pore size, 0.75–0.85 lm). Micro-algae were
counted and identified under a light microscope. To
calculate biovolume and wet biomass of algae, they
were equated to appropriate geometrical shapes (or
their combinations) and relevant sizes were measured
using an ocular micrometer.
For diatom identification water samples were cen-
trifuged to concentrate phytoplankton cells. The
material collected was oxidised with a 1% solution
of K2Cr2O7 in concentrated sulphuric acid under
modest heat. For scanning electron microscopy
[(SEM), JSM-25S; JEOL, Tokyo, Japan] samples were
rinsed several times with distilled water and air-
dried. SEM photographs were made under magnifi-
cation ·3500–10 000.
To assay particulate fatty acids, 300–500 mL water
subsamples were first filtered through a 0.08 mm
nylon mesh. The seston was then collected from these
prescreened water samples by vacuum filtration onto
membrane filters (‘Vladipor’ pore size 0.75–0.85 lm),
precovered with a layer of BaSO4 to facilitate the
separation of residues. The filters were dried at 35 �Cfor about 30 min, and the residues then separated
from filters, placed into methanol and frozen.
Further fatty acid analysis is described in detail
elsewhere (Gladyshev et al., 2000). Briefly, lipids were
extracted by chloroform–methanol (2 : 1, v/v) three
times. After evaporation of the solvent, methyl esters
of fatty acids were prepared in a mixture of methanol–
sulphuric acid (20 : 1, v/v) at 90 �C for 2 h.
In 1999–2000, methyl esters of fatty acids (FAME)
were analysed on a gas chromatograph equipped with
a mass spectrometer detector (GCD Plus; Hewlett-
Packard, La Jolla, CA, U.S.A.) with a low polar
column as described earlier (Gladyshev et al., 2000).
In 2001–02, a 30 m long · 0.32 mm internal diameter
capillary column HP-FFAP was used for analyses. The
column temperature programming was as follows:
from 100 to 190 �C at 3 �C min)1, 5 min isothermally,
to 230 �C at 10 �C min)1, and 20 min isothermally.
Other instrumental conditions were as described
elsewhere (Gladyshev et al., 2000) The change of the
column type resulted in a higher resolution and the
detection of more FA isomers, but had no significant
influence on peak abundance. Peaks of FAMEs were
identified by their mass spectra similar to those in the
database (Hewlett-Packard) and to those of available
authentic standards (Sigma, St Louis, MI, U.S.A.). The
position of double bonds in monoenoic acids was
determined by GS-MS of FAME dimethyldisulphide
adducts prepared as described elsewhere (Christie,
1989). To determine double bond positions in poly-
enoic acids, GC-MS of dimethyloxazoline derivatives
of fatty acids was used. The dimethyloxazoline
derivatives of fatty acids were prepared as described
elsewhere (Sushchik et al., 2003b).
Canonical correlation analyses between fatty acids
and phytoplankton was carried out conventionally
(Jeffers, 1981), using STATISTICA software, version
6.0 (StatSoft Inc., Tulsa, OK, U.S.A.). Canonical corre-
lation is a multivariate procedure (a special case of the
GLM) for assessing the relationship between two sets
of variables. The parameters from the tables are
weighted, and the weighted sum scores correlated
against each other.
Results
Phytoplankton biomass and species composition
Seasonal changes in temperature varied substantially
between years, reaching a maximum of about 20–
25 �C in July. The total biomass of phytoplankton
varied in the range of 2–200 mg L)1.
In each year the phytoplankton consisted mainly of
Cyanophyceae, Bacillariophyceae, Chlorophyceae,
Euglenophyceae and Dinophyceae, while the biomass
of Xanthophyceae, Cryptophyceae and Chrysophy-
ceae was much lower (the three latter taxa were
combined and presented as miscellaneous) (Fig. 1). In
general, the seasonal succession of phytoplankton was
similar between years, although interannual varia-
tions in species composition, abundance and the
period of domination of particular taxa were
observed.
Initially the phytoplankton was dominated by
diatoms each spring until early June (Fig. 1). Diatoms
1208 N.N. Sushchik et al.
� 2004 Blackwell Publishing Ltd, Freshwater Biology, 49, 1206–1219

peaked again in the late August of 2000–02. Two
genera were distinctly dominant in this taxon:
Stephanodiscus and Cyclotella. Each of these genera
was represented by several species, although some of
them were difficult to differentiate under a light
microscope. SEM of acid-treated diatom samples
showed that the main representatives were Stephano-
discus hantzschii Grun., Stephanodiscus minutulus (Kutz)
Cleve and Moller, Cyclotella atomus Hust., and Cyclo-
tella meneghiniana Kutz. (Fig. 2). The cells of S. hantz-
schii and S. minutulus were 11 and 8 lm, respectively,
while those of C. atomus were 6 lm and of
C. meneghiniana somewhat larger, up to 17 lm in
diameter. Because of the identification difficulties
under light microscopy, in further calculations the
combined biomass of species belonging to Stephano-
discus or Cyclotella genera was used. It should be noted
that in our previous paper (Sushchik et al., 2003a)
species of Cyclotella genera were erroneously identi-
fied as the single species, Cyclotella comta (Ehr.) Kutz.
The seasonal dynamics of diatoms belonging to
the two dominant genera, Stephanodiscus and
0
30
60
90
120nay
Cabo
tcaire
0
20
40
60
80
Di
motas
0
4
8
hporolhC
tya
0
20
40
Eug
leno
phyt
a
0
5
10
15
Din
ophy
ta
–1B
imo
am(
ssL
gerf
shie
wg
)th
100
200
0
1
2
Mis
cella
neou
s
May May May May JulJul Sep SepJul Se
Date
pJul Sep
1999 2000 2001 2002
Fig. 1 The biomass of major taxa of phytoplankton in Bugach
reservoir. May to October, 1999–2002.
S. hantzschii
S. minutulus
C. atomus
C. meneghiniana
Fig. 2 Scanning electron micrographs of the main diatom spe-
cies of the dominant genera of diatoms: Stephanodiscus and
Cyclotella. Left panels – external view of frustules; right panels –
internal view of frustules. Scale bar – 10 lm for S. hantzschii,
S. minutulus and C. meneghiniana, and – 1 lm for C. atomus.
Fatty acids in a freshwater reservoir 1209
� 2004 Blackwell Publishing Ltd, Freshwater Biology, 49, 1206–1219

Cyclotella, differed significantly (Fig. 3). In the first
year (1999) an early spring peak of diatoms was
composed mainly of Cyclotella spp., while in the
other years this was mostly Stephanodiscus spp.
(Fig. 3). Stephanodiscus was moderately abundant in
summer 2000 (Fig. 3), while in the other years it was
very scarce or absent. In contrast, Cyclotella biomass
reached a peak in August in three of the 4 years,
and once in September, with the strongest develop-
ment in mid-summer of 2002 (Fig. 3). The other
species (miscellaneous) accounted for a negligible
fraction of the diatom flora, except for biomass in
August 2001 and in May 2002 (note different scales
of biomass in Fig. 3).
In the summer of each year there was an intensive
‘bloom’ of cyanobacteria (Fig. 1). In 1999–2000 this
started in the middle of June, but in the next 2 years
at the beginning of June. In general, the cyanobac-
terial bloom lasted throughout the summer and into
early autumn, except in the second half of the
summer and autumn of 2002, when a biomanipula-
tion of fish was carried out (Fig. 1). The most
intensive bloom was observed in 2000, when biomass
reached 140 mg L)1. There were four dominant
species of cyanobacteria, which differed in abun-
dance between years: Anabaena flos-aquae (Lyngb.)
Breb., Microcystis aeruginosa Kutz. emend. Elenk,
Aphanizomenon flos-aquae (L.) Ralfs, and Planktothrix
agardhii (Gom.) Anagn.
Anabaena flos-aquae was the main dominant cyano-
bacterium species in each growth season, except for its
relatively low abundance in 2000 (Fig. 4). Aphanizom-
enon flos-aquae developed strongly in 1999 and 2000,
reaching the seasonal maximum after or simulta-
neously with An. flos-aquae. Microcystis aeruginosa was
one of the dominant species among the cyanobacteria
only in 1999 (Fig. 4), being sparse in the following
years. In contrast, P. agardhii was completely absent in
the first year of the study, but abundant at the end of
the summer of 2000, and at the beginning of the
summer of 2001 and 2002 (Fig. 4).
Green algae generally accounted for little of the
total phytoplankton biomass, except in mid- and late-
summer of 2001 (Fig. 1). The green algae were
taxonomically very diverse, but peaks in their biomass
(2000–01) generally consisted of Chlamydomonas sp.
and Pandorina morum (O.Mull.) Bory. The biomass of
euglenoids was usually <5 mg L)1. However, eugle-
noids became numerous in 2001: first, Euglena proxima
Dang. peaked in the middle of June and then
Trachellomonas volvocina Ehr. dominated from late
August until the middle of September (Fig. 1).
0
30
60C
ycl
toleal
10
20
0
10
20
St
peonah
sucsid
0
1
2
3
Mi
oenallecssuB
iossa
m g
m( L
hserf )thgie
w–1
May Jul Sep May Jul Sep May Jul Sep May Jul Sep
1999 2000 2001 2002
Date
Fig. 3 The biomass of main diatom groups in Bugach reservoir.
May to October, 1999–2002.
0
10
20
30
a-solf .nA
quea
0
40
80
120
Aa-solf .hp
quea
0
5
10
a .M
eur
giason
0
10
20
30
a .P
raghd
ii
Bio
mas
s
gm(
L erf
she
wig
)th
2
4
–1May Jul Sep May Jul Sep May Jul Sep May Jul Sep
1999 2000 2001 2002
Date
Fig. 4 The biomass of dominant cyanobacteria in Bugach res-
ervoir. May to October, 1999–2002.
1210 N.N. Sushchik et al.
� 2004 Blackwell Publishing Ltd, Freshwater Biology, 49, 1206–1219
Dinophyceae were represented by a single species,
Peridinium sp., throughout the study. It was abundant
in 2001 and dominated strongly in 2002, with a
maximum biomass of 195 mg L)1 in the middle of
September (Fig. 1).
Fatty acids
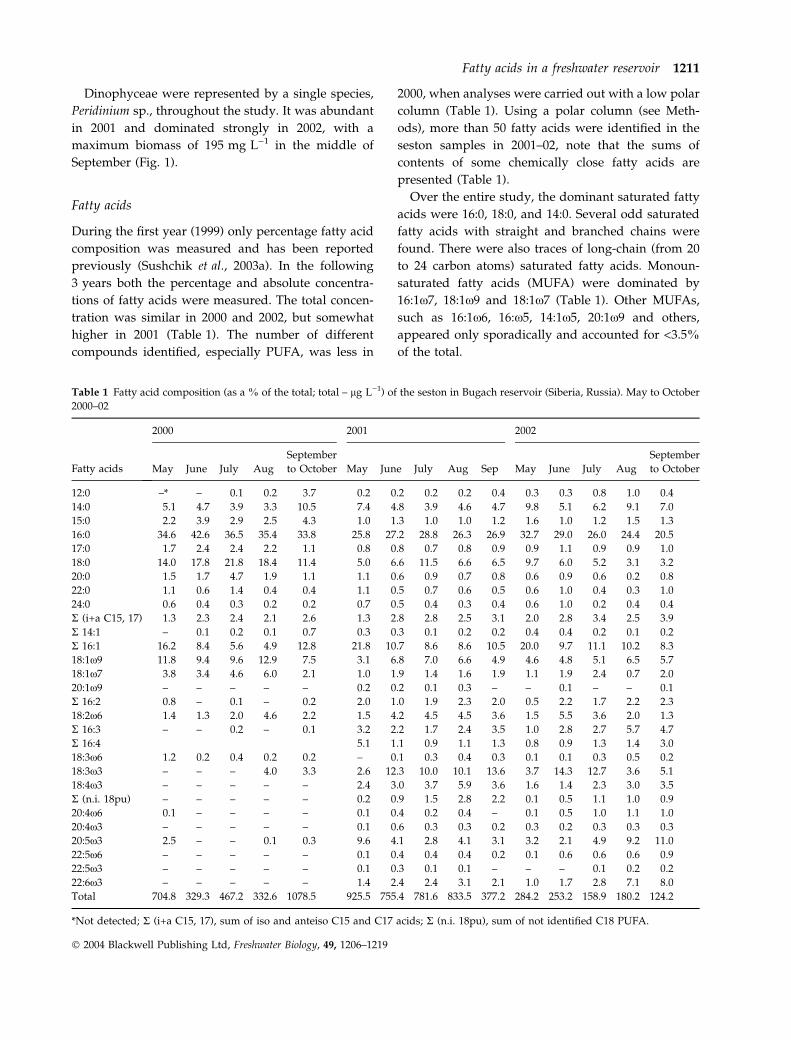
During the first year (1999) only percentage fatty acid
composition was measured and has been reported
previously (Sushchik et al., 2003a). In the following
3 years both the percentage and absolute concentra-
tions of fatty acids were measured. The total concen-
tration was similar in 2000 and 2002, but somewhat
higher in 2001 (Table 1). The number of different
compounds identified, especially PUFA, was less in
2000, when analyses were carried out with a low polar
column (Table 1). Using a polar column (see Meth-
ods), more than 50 fatty acids were identified in the
seston samples in 2001–02, note that the sums of
contents of some chemically close fatty acids are
presented (Table 1).
Over the entire study, the dominant saturated fatty
acids were 16:0, 18:0, and 14:0. Several odd saturated
fatty acids with straight and branched chains were
found. There were also traces of long-chain (from 20
to 24 carbon atoms) saturated fatty acids. Monoun-
saturated fatty acids (MUFA) were dominated by
16:1x7, 18:1x9 and 18:1x7 (Table 1). Other MUFAs,
such as 16:1x6, 16:x5, 14:1x5, 20:1x9 and others,
appeared only sporadically and accounted for <3.5%
of the total.
Table 1 Fatty acid composition (as a % of the total; total – lg L)1) of the seston in Bugach reservoir (Siberia, Russia). May to October
2000–02
Fatty acids
2000 2001 2002
May June July Aug
September
to October May June July Aug Sep May June July Aug
September
to October
12:0 –* – 0.1 0.2 3.7 0.2 0.2 0.2 0.2 0.4 0.3 0.3 0.8 1.0 0.4
14:0 5.1 4.7 3.9 3.3 10.5 7.4 4.8 3.9 4.6 4.7 9.8 5.1 6.2 9.1 7.0
15:0 2.2 3.9 2.9 2.5 4.3 1.0 1.3 1.0 1.0 1.2 1.6 1.0 1.2 1.5 1.3
16:0 34.6 42.6 36.5 35.4 33.8 25.8 27.2 28.8 26.3 26.9 32.7 29.0 26.0 24.4 20.5
17:0 1.7 2.4 2.4 2.2 1.1 0.8 0.8 0.7 0.8 0.9 0.9 1.1 0.9 0.9 1.0
18:0 14.0 17.8 21.8 18.4 11.4 5.0 6.6 11.5 6.6 6.5 9.7 6.0 5.2 3.1 3.2
20:0 1.5 1.7 4.7 1.9 1.1 1.1 0.6 0.9 0.7 0.8 0.6 0.9 0.6 0.2 0.8
22:0 1.1 0.6 1.4 0.4 0.4 1.1 0.5 0.7 0.6 0.5 0.6 1.0 0.4 0.3 1.0
24:0 0.6 0.4 0.3 0.2 0.2 0.7 0.5 0.4 0.3 0.4 0.6 1.0 0.2 0.4 0.4
R (i+a C15, 17) 1.3 2.3 2.4 2.1 2.6 1.3 2.8 2.8 2.5 3.1 2.0 2.8 3.4 2.5 3.9
R 14:1 – 0.1 0.2 0.1 0.7 0.3 0.3 0.1 0.2 0.2 0.4 0.4 0.2 0.1 0.2
R 16:1 16.2 8.4 5.6 4.9 12.8 21.8 10.7 8.6 8.6 10.5 20.0 9.7 11.1 10.2 8.3
18:1x9 11.8 9.4 9.6 12.9 7.5 3.1 6.8 7.0 6.6 4.9 4.6 4.8 5.1 6.5 5.7
18:1x7 3.8 3.4 4.6 6.0 2.1 1.0 1.9 1.4 1.6 1.9 1.1 1.9 2.4 0.7 2.0
20:1x9 – – – – – 0.2 0.2 0.1 0.3 – – 0.1 – – 0.1
R 16:2 0.8 – 0.1 – 0.2 2.0 1.0 1.9 2.3 2.0 0.5 2.2 1.7 2.2 2.3
18:2x6 1.4 1.3 2.0 4.6 2.2 1.5 4.2 4.5 4.5 3.6 1.5 5.5 3.6 2.0 1.3
R 16:3 – – 0.2 – 0.1 3.2 2.2 1.7 2.4 3.5 1.0 2.8 2.7 5.7 4.7
R 16:4 5.1 1.1 0.9 1.1 1.3 0.8 0.9 1.3 1.4 3.0
18:3x6 1.2 0.2 0.4 0.2 0.2 – 0.1 0.3 0.4 0.3 0.1 0.1 0.3 0.5 0.2
18:3x3 – – – 4.0 3.3 2.6 12.3 10.0 10.1 13.6 3.7 14.3 12.7 3.6 5.1
18:4x3 – – – – – 2.4 3.0 3.7 5.9 3.6 1.6 1.4 2.3 3.0 3.5
R (n.i. 18pu) – – – – – 0.2 0.9 1.5 2.8 2.2 0.1 0.5 1.1 1.0 0.9
20:4x6 0.1 – – – – 0.1 0.4 0.2 0.4 – 0.1 0.5 1.0 1.1 1.0
20:4x3 – – – – – 0.1 0.6 0.3 0.3 0.2 0.3 0.2 0.3 0.3 0.3
20:5x3 2.5 – – 0.1 0.3 9.6 4.1 2.8 4.1 3.1 3.2 2.1 4.9 9.2 11.0
22:5x6 – – – – – 0.1 0.4 0.4 0.4 0.2 0.1 0.6 0.6 0.6 0.9
22:5x3 – – – – – 0.1 0.3 0.1 0.1 – – – 0.1 0.2 0.2
22:6x3 – – – – – 1.4 2.4 2.4 3.1 2.1 1.0 1.7 2.8 7.1 8.0
Total 704.8 329.3 467.2 332.6 1078.5 925.5 755.4 781.6 833.5 377.2 284.2 253.2 158.9 180.2 124.2
*Not detected; R (i+a C15, 17), sum of iso and anteiso C15 and C17 acids; R (n.i. 18pu), sum of not identified C18 PUFA.
Fatty acids in a freshwater reservoir 1211
� 2004 Blackwell Publishing Ltd, Freshwater Biology, 49, 1206–1219

The PUFAs comprised acids of the x6, x3, x4 and
x1 families with 16–22 carbon atoms. The seasonal
dynamics of the most important essential x3 PUFAs,
18:3x3, 20:5x3 and 22:6x3, are presented in Fig. 5.
Sixteen carbon PUFAs were very diverse and scarce,
each accounting for 0.5–2%. An increase in 16:3x3
fatty acid occurred in late August and September
2001, corresponding to the strong peak in the biomass
of euglenoids (Table 1; Fig. 1). There was a marked
increase in the percentage of 16:3x4 and 16:4x1 fatty
acids in August to September 2002, when dinophyta
dominated the phytoplankton (Table 1; Fig. 1).
Among 18-carbon PUFAs, 18:3x3, 18:4x3 and 18:2x6
were the most abundant over the entire study. The
essential linolenic acid, 18:3x3, increased in late
August 2000, in mid-summer 2001 and in June to
early July 2002 (Fig. 5). Three more 18-carbon PUFAs
were found occasionally, although their double bond
positions unfortunately could not be identified
(Table 1). In 2000, the only long chain (>18 carbon
atoms) PUFA occurred, EPA, 20:5x3, while in the next
2 years several 20, 22 and 24-carbon PUFA belonging
to the x3 and x6 families were found. In these years,
EPA and docosahexaenoic acid (DHA), 22:6x3, were
dominant among the long chain PUFAs and accoun-
ted for 2–15% and 0.5–15% of total fatty acids,
respectively (Fig. 5).
Canonical correlation analyses of phytoplankton and
essential fatty acids of the x3 family
The seston of Bugach reservoir was enriched in three
main x3 essential fatty acids: 18:3x3, 20:5x3 and
22:6x3 (Fig. 5). Based on the literature, we suggest
that their most probable sources among phytoplank-
ton taxa inhabiting the reservoir are species of
diatoms, cyanobacteria, greens and dinophyta. Evi-
dently, several species may contribute to each of the
PUFAs. To define relationships between phytoplank-
ton taxa and the x3 PUFA content of the seston we
performed canonical correlation analyses of four data
complexes. Two of them used the percentage content
of the PUFAs in the seston (of the total fatty acids) and
the percentage of phytoplankton groups in the total
biomass, while the other two analysed the absolute
concentrations of the PUFAs (lg L)1) and the biomass
of phytoplankton groups (mg L)1).
The first analysis was based on percentages, inclu-
ded data for all 4 years 1999–2002, and had 10
phytoplankton taxa, total diatoms, Stephanodiscus,
Cyclotella, miscellaneous diatom species, total cyano-
bacteria, An. flos-aquae, M. aeruginosa, Aph. flos-aquae,
P. agardhii and total green algae as variables within
the phytoplankton matrix and two x3 fatty acids,
20:5x3 and 18:2x3, as variables within the PUFA
matrix. The results are given in Table 2 and depicted
in Fig. 6. The overall canonical correlation coefficient,
R1, pertaining to the first canonical root, was high
(0.81) and statistically significant (P < 0.001). More-
over, the second canonical correlation coefficient, R2,
was also high and statistically significant (Table 2).
Values of the extracted variance and total redundancy
(59%) also indicated a strong relationship between the
two matrixes, i.e. between the 10 phytoplankton taxa
and the two x3 acids.
0
5
10
15)latot fo %(
AP
Eµ (
AP
EL g
)
0
10
20
ALA
)latot fo %(
µ ( A L
A gL
) A
HD
( %
o f
ot ta
)l
50
100
150
–1
0
50
100
–1
0
5
10
15
May Jul Sep
May Jul Sep
May Jul Sep May Jul Sep
1999
2000
2001 2002
µ
0
20
40
60
AH
Dg
() L–1
Date
Fig. 5 The percentages (of total fatty acids) and content (lg L)1)
in the seston of the main x3 PUFAs: eicosapentaenoic, a-lino-
lenic and docosahexaenoic acids. Bugach reservoir. May to
October, 1999–2002.
1212 N.N. Sushchik et al.
� 2004 Blackwell Publishing Ltd, Freshwater Biology, 49, 1206–1219

Regarding factor loadings (Table 2), only total
cyanobacteria and total diatoms show substantial
loadings (positive and negative, respectively) on the
first canonical factor. Obviously, these variables were
determined largely by the Anabaena and Planktothrix,
on the one hand, and by Stephanodiscus on the other.
For the PUFAs both variables show substantial
loadings. Thereby, the first canonical correlation, R1,
was due to the associations of Anabaena and Plankto-
thrix with 18:3x3 and also to the association of
Stephanodiscus with 20:5x3 (Table 2). The second
significant canonical correlation, R2, was attributable
to a negative association of Aphanizomenon in the
phytoplankton percentage matrix with both x3 FA
species in the PUFA matrix. Considering the phyto-
plankton taxa as the explanatory variable, one could
conclude that only Anabaena, Planktothrix, Stephanodis-
cus and Aphanizomenon contributed significantly to the
canonical correlations of the two sets of variables
compared.
The second canonical correlation analysis was
performed for data from 2001–02, when an additional
x3 PUFA, 22:6x3, was detected. As results of the first
canonical correlation analysis revealed unimportant
variables among phytoplankton groups, which were
not correlated with the canonical variable, these
variables were excluded from the second analysis.
The reduction in the variables also allowed optimising
–3 –2 –1 0 1 2
–4
–2
0
2
PU
FA
% –3 –2 –1 0 1 2
–3
–2
–1
0
1
2
–3 –2 –1 0 1 2Phytoplankton % Phytoplankton %
–3
–2
–1
0
1
2
–2 –1 0 1 2 3
–2
0
2
–4 –2 0 2
–6
–4
–2
0
2
–4 –2 0 2
–3
–2
–1
0
1
–3 –2 –1 0 1 2Phytoplankton conc. Phytoplankton conc.
–4
–2
0
2
PU
FA
con
c.
–3 –2 –1 0 1 2 3
–3
–1
1
3
Matrix No. 1
Matrix No. 2
Matrix No. 3
Matrix No. 4
1st Canonical Axis 2nd Canonical Axis
Fig. 6 Plots of correlations between the two canonical variables
of the first and second canonical roots for four data matrices (see
text for details). Solid lines represent linear approximations.
Note that R2 for matrix No. 3 is insignificant. Matrix No. 1
includes the percentages of 10 phytoplankton groups and of two
x3 PUFAs (of the total) as y- and x-axis variables, respectively;
matrix No. 2 – percentages of five phytoplankton groups and
three x3 PUFAs; matrix No.3 – biomass of nine phytoplankton
groups (mg L)1) and concentrations of two x3 PUFAs (lg L)1);
matrix No. 4 – biomass of five phytoplankton groups (mg L)1)
and concentrations of three x3 PUFAs (lg L)1).
Table 2 Results of canonical correlation analysis of matrix No. 1
of the percentages of two x3 PUFAs (of total fatty acids) in
seston and the percentages of 10 phytoplankton groups (of total
biomass) in Bugach reservoir. Samples were collected in the
period May to October in 1999–2002
Phytoplankton (%) PUFAs (%)
Number of variables 10 2
Variance extracted (%) 26.0 100.0
Total redundancy (%) 16.0 59.0
Number of valid cases 72
Root 1 Root 2
Eigenvalues 0.656 0.533
Canonical R 0.810 0.730
Chi-square 118.0 49.1
d.f. 20 9
P <0.001 <0.001
Phytoplankton (%) Factor loadings
Diatoms )0.393 0.359
Cyclotella )0.108 0.248
Stephanodiscus )0.404 0.275
Miscellaneous diatoms )0.130 )0.069
Cyanobacteria 0.878 )0.024
Anabaena 0.508 )0.314
Aphanizomenon 0.242 0.595
Microcystis 0.066 0.302
Planktothrix 0.447 )0.306
Greens 0.054 0.232
PUFAs (%)
20:5x3 )0.900 )0.437
18:3x3 0.336 )0.942
Fatty acids in a freshwater reservoir 1213
� 2004 Blackwell Publishing Ltd, Freshwater Biology, 49, 1206–1219

of the ratio between the number of variables and the
number of cases (observations), because the latter was
reduced to a 2-year set. Furthermore, the dinophyta
Peridinium was added because it could be a source of
22:6x3. Hence, the matrix correlated included
percentages of 18:3x3, 20:5x3 and 22:6x3, for the
PUFAs, and of Anabaena, Planktothrix, Stephanodiscus,
Aphanizomenon and Peridinium, for phytoplankton
percentages. The analysis revealed a very strong
relationship between the two sets of variables
(Table 3; Fig. 6). The overall variance extracted, as
well as total redundancy, was higher than that for the
previous correlation (Tables 2 and 3). Canonical cor-
relations, R1 and R2, pertaining to the first and the
second canonical roots, were both high and statisti-
cally significant (Table 3). In this analysis three
canonical roots were calculated, because there were
three variables in the PUFA matrix. Nevertheless, the
third canonical correlation was small (R3 ¼ 0.162),
statistically insignificant (v2 ¼ 0.92, d.f. ¼ 3) and
thereby excluded from the following interpretation.
Factor loadings (Table 3) indicated that the overall
relationship between the two sets was attributable to
associations between Anabaena and Planktothrix and
18:3x3, as well as Stephanodiscus and Peridinium with
20:5x3 and 22:6x3 in the first canonical root, and an
association between Peridinium rather than Stephano-
discus with 22:6x3 in the second canonical root.
The third correlation analysis included data on
concentrations of 20:5x3 and 18:3x3 fatty acids and
the biomass of phytoplankton groups in 2000–02. The
overall canonical correlation (R1), as well as the
redundancy and variance extracted (Table 4; Fig. 6),
was slightly lower than that of correlation matrix No. 1
(Table 2), but the second canonical root was insignifi-
cant (Table 4). Therefore, an interpretation of factor
loadings of the second canonical root was omitted.
Factor loadings of the first canonical root revealed a
high association of Stephanodiscus with 20:5x3 only, in
contrast to factor loadings of the percentages, where
one more association between Anabaena and Plankto-
thrix and 18:3x3 took place (Table 2).
Correlation No. 4 included data on concentrations
of 20:5x3, 18:3x3 and 22:6x3 in the PUFA matrix and
the biomass of five phytoplankton groups obtained in
Table 3 Results of canonical correlation analysis of matrix No. 2
of the percentages of three x3 PUFAs (of total fatty acids) in
seston and the percentages of five phytoplankton groups (of
total biomass) in Bugach reservoir. Samples were collected in the
period May to October in 2001–02
Phytoplankton (%) PUFAs (%)
Number of variables 5 3
Variance extracted (%) 68.4 100
Total redundancy (%) 43.1 68.2
Number of valid cases 40
Root 1 Root 2
Eigenvalues 0.836 0.646
Canonical R 0.914 0.804
Chi-square 99.08 36.74
d.f. 15 8
P <0.001 <0.001
Phytoplankton (%) Factor loadings
Stephanodiscus )0.418 0.864
Anabaena 0.632 )0.263
Aphanizomenon 0.241 0.091
Planktothrix 0.629 0.127
Peridinium )0.728 )0.679
PUFAs (%)
20:5x3 )0.925 )0.189
18:3x3 0.808 )0.241
22:6x3 )0.712 )0.668
Table 4 Results of canonical correlation analysis of matrix No. 3
of the absolute concentrations (lg L)1) of two x3 PUFAs in
seston and biomass (mg L)1) of nine phytoplankton groups in
Bugach reservoir. Samples were collected in the period May to
October in 2000–02
Phytoplankton
(concentration)
PUFAs
(concentration)
Number of variables 9 2
Variance extracted (%) 35.9 100.0
Total redundancy (%) 16.6 36.6
Number of valid cases 56
Root 1 Root 2
Eigenvalues 0.577 0.257
Canonical R 0.759 0.507
Chi-square 56.71 14.58
d.f. 18 8
P <0.001 >0.05
Phytoplankton (concentration) Factor loadings
Diatoms )0.874 )0.069
Cyclotella )0.093 )0.030
Stephanodiscus )0.939 )0.020
Miscellaneous diatoms )0.141 )0.421
Cyanobacteria 0.246 0.120
Anabaena 0.321 )0.584
Aphanizomenon 0.080 0.338
Microcystis 0.271 )0.655
Planktothrix 0.403 )0.265
PUFAs (concentration)
20:5x3 )0.776 )0.631
18:3x3 0.277 )0.961
1214 N.N. Sushchik et al.
� 2004 Blackwell Publishing Ltd, Freshwater Biology, 49, 1206–1219

2001–02 in the phytoplankton matrix. Total redund-
ancy and the two first canonical R (Table 5; Fig. 6)
were significantly lower than those for the corres-
ponding percentage data of correlation No. 2
(Table 5). The third canonical correlation, R3, pertain-
ing to the third root, was small (0.337) and insignifi-
cant (v2 ¼ 4.1, d.f. ¼ 3, P > 0.05), and therefore
omitted. Factor loadings (Table 5) revealed an associ-
ation between Stephanodiscus and 20:5x3 in the first
and in the second root, and between Planktothrix and
18:3x3 in the first root. A negative correlation between
Peridinium and Stephanodiscus also contributed in the
second root.
In general, the canonical correlations revealed
significantly higher interactions between the percent-
age content of x3 PUFAs and the relative abundance
of phytoplankton, than between their absolute con-
centrations and biomass.
Discussion
The fatty acid composition of diatoms has been
studied widely in laboratory conditions for aquacul-
ture purposes (Dunstan et al., 1994; Brown et al., 1997).
Field studies on fatty acids of marine diatom com-
munities are also numerous (e.g. Claustre et al., 1989;
Mayzaud et al., 1990; Shin et al., 2000), whereas such
data on natural freshwater diatom phytoplankton are
sparse (Leveille et al., 1997; Sushchik et al., 2003a). It is
well known that the species composition of marine
diatoms differs strongly from that of freshwaters, and
the species used in laboratory cultures are limited in
number and rarely the same as natural freshwater
habitants. Moreover, fatty acid composition of the
same species under specific laboratory conditions and
in natural environment may be rather different.
Here we report the seasonal dynamics of particulate
fatty acid composition in a freshwater reservoir,
including several spring periods of strong (almost
100% of total biomass) domination by two wide-
spread diatom genera. The interesting finding is that
the early spring diatom community in the reservoir
could be dominated either by Stephanodiscus or by
Cyclotella spp. and that high concentrations of the
essential EPA in spring seston were recorded only
when Stephanodiscus dominated. Moreover, high and
significant canonical correlations in all four data sets
were associated partly by the strong relationship
between Stephanodiscus and EPA content, whereas
factor loadings for Cyclotella were low for both the
percentage and absolute concentration of EPA
(Tables 2 and 4). Cyclotella species often peaked in
mid- or late-summer, as did Stephanodiscus species on
one occasion, although these summer diatom sub-
populations were probably low in EPA. It is known
that high temperature often leads to a decrease in the
PUFA content of micro-algae (Roessler, 1990; Sushc-
hik et al., 2003c). Higher summer temperature might
also result in a decrease in the PUFA content,
including the EPA, of the diatoms in Bugach. Hence,
the spring population of Stephanodiscus could be a
valuable source of EPA while Cyclotella, which usually
developed in the summer at higher temperature,
seemed to be a poor source of the EPA.
Note that, besides diatoms, there were other poss-
ible sources of EPA in summer, including Eugleno-
phyceae (Sushchik et al., 2003a) and Dinophyceae. In
support of this, the euglenoid Euglena gracilis con-
tained EPA up to 7% of the total FA (Regnault et al.,
1995). The dinophyte alga Peridinium sp. also showed
a relationship with the EPA percentage in the data
from 2 years, but was not correlated with absolute
Table 5 Results of canonical correlation analysis of matrix No. 4
of the absolute concentrations (lg L)1) of three x3 PUFAs in
seston and biomass (mg L)1) of five phytoplankton groups in
Bugach reservoir. Samples were collected in the period May to
October in 2001–02
Phytoplankton
(concentration)
PUFAs
(concentration)
Number of variables 5 3
Variance extracted (%) 67.5 100
Total redundancy (%) 34.0 31.5
Number of valid cases 40
Root 1 Root 2
Eigenvalues 0.718 0.508
Canonical R 0.848 0.713
Chi-square 72.3 28.6
d.f. 15 8
P <0.001 <0.001
Phytoplankton (concentration) Factor loadings
Stephanodiscus )0.779 0.614
Anabaena 0.374 0.085
Aphanizomenon 0.470 0.496
Planktothrix 0.567 0.484
Peridinium )0.270 )0.624
PUFAs (concentration)
20:5x3 )0.638 0.528
18:3x3 0.520 0.372
22:6x3 )0.224 )0.035
Fatty acids in a freshwater reservoir 1215
� 2004 Blackwell Publishing Ltd, Freshwater Biology, 49, 1206–1219

EPA concentration in the same period (Tables 3 and
5). This could be explained by marked variation in the
fatty acid concentration, as many disparate factors
could occasionally determine the concentration in the
reservoir. Calculation of the percentages of PUFAs
and algae seemed to normalise the data and smoothed
this variation, and hence correlations with the per-
centage composition appeared to be more reliable in
determining the potential sources of the PUFAs.
It has been shown previously that, in laboratory
culture conditions with sufficient P, C. meneghiniana
Kutz. contained only moderate amounts of EPA (6.7%
of total), and even smaller amounts (2.1%) under
P-limiting conditions (Muller-Navarra, 1995a), while
S. hantzschii Grun. was very rich in EPA (24 % of total;
see von Elert, 2002). These species constituted the
diatom community in this study. Thus, our field data
on the essential PUFA content of the representatives
of these two diatom genera were in good agreement
with laboratory data. The EPA percentage values in 17
marine diatoms used in marine aquaculture ranged
from 5 to 30% of total FA (Brown et al., 1997).
Evidently, variation in the essential EPA content
among diatom taxa (including species) is significant.
Therefore, to estimate correctly the nutritional value
of natural diatom plankton, it is necessary to know
those species that are high or low in EPA.
Evidently, EPA is of great physiological importance
for Daphnia, because it is readily accumulated in the
biomass and is converted into other PUFAs (von Elert,
2002). Potentially it can be supplied directly from food
or synthesised from the biochemical precursor, ALA,
which is considered to be strictly essential for most
invertebrates (Tocher, Leaver & Hodson, 1998). How-
ever, the conversion of ALA to EPA, although
widespread among animals, may be too low to meet
the demand for EPA in many species.
In contrast to the EPA-limitation hypothesis
(Muller-Navarra, 1995a,b; Muller-Navarra et al.,
2000), in the recent literature there is accumulating
evidence that another PUFA, a-linolenic acid (Wacker
& von Elert, 2001; von Elert, 2002) or the whole x3
PUFA family, can be the main limiting factor for
zooplankton growth (Ahlgren et al., 1997; DeMott &
Muller-Navarra, 1997; Park et al., 2002). We have
found that the biomass of the two dominant Daphnia
species in Bugach correlated strongly with the content
of ALA in seston in 1999 (Sushchik et al., 2003a).
Recent data have indicated that some Daphnia
populations are able to show relatively high growth
rates without a food source of EPA, provided they are
supplied with ALA as an x3 PUFA (von Elert, 2002).
We suggest that there may be strong differences
between Daphnia species, and also between clones or
populations of a given species, in their requirements
for EPA and C18 x3 PUFAs in the diet. It is likely that
in lakes and reservoirs daphniids with a high demand
for EPA would be abundant when diatoms rich in
EPA are dominant. On the contrary, a phytoplankton
composed of species rich in ALA or other C18-PUFAs
would favour the growth of Daphnia populations with
a high requirement for ALA.
Bugach is a typical eutrophic freshwater reservoir
characterised by strong nuisance blooms in summer
of the ubiquitous freshwater cyanobacteria (Figs 1 &
4). We previously found a relationship between
essential C18-PUFA-ALA and the biomass of cyano-
bacteria and have investigated its distribution among
the dominant species. Evidently, the four main species
of cyanobacteria in Bugach differed in their fatty acid
composition and gave an unequal contribution to the
ALA content in the seston. According to canonical
correlation results, the factor loadings of An. flos-aquae
and P. agardhii were significantly higher than those of
Aph. flos-aquae and M. aeruginosa in both the percen-
tage content and absolute concentration data matrixes
(Tables 2 and 4). Moreover, the significant second root
of correlation No. 1 was explained by the strong
negative association between Aphanizomenon and both
ALA and EPA. Thus, it appeared that An. flos-aquae
and P. agardhii were good sources of essential ALA for
the aquatic food web, whereas Aph. flos-aquae and
M. aeruginosa were not.
There are numerous data in the literature on fatty
acids in the cyanobacteria that form nuisance blooms
in freshwaters, most information originating from
laboratory cultures (Ahlgren et al., 1992). Anabaena
strains were always considered as an ALA-rich group,
in some strains percentage ALA accounted for 41% of
total FA (Vargas et al., 1998; Li & Watanabe, 2001;
Gugger et al., 2002). Planktothrix strains have also been
shown to be high in ALA, up to 30% (Gugger et al.,
2002). Microcystis aeruginosa has been classified previ-
ously to ‘group 4’ according to the Kenyon–Murata
classification of cyanobacteria (Kenyon, Rippka &
Stanier, 1972; Murata et al., 1992), i.e. it can synthesise
the 18:3x3, 18:3x6 and 18:4x3 fatty acids. Reported
concentrations of the C18-PUFAs in this cyanobacte-
1216 N.N. Sushchik et al.
� 2004 Blackwell Publishing Ltd, Freshwater Biology, 49, 1206–1219

rium differ strongly. Some authors have found that
M. aeruginosa contained mainly 18:3x6, rather than
ALA (Ikawa, Haney & Sasner, 1996; Gugger et al.,
2002), while there are contrary data showing high
levels of x3 PUFA compared with x6 PUFA (Ahlgren
et al., 1992; Hayakawa et al., 2002). Aphanizomenon
strains in laboratory cultures were rich in ALA
(Gugger et al., 2002), while Aph. flos-aquae field sam-
ples taken from blooms in lakes contained only
negligible amounts of ALA (Dembitsky, Shkrob &
Go, 2001). Thus, our data on the essential PUFA of
cyanobacteria during blooms in the reservoir agree
with most literature data. We speculate that variations
in the concentrations of the main C18-PUFAs within
the same or taxonomically close species are explained
either by environmental factors or by culture state and
age, and this is particularly true of strains of Micro-
cystis and Aphanizomenon). In any case, potential
variation in the essential PUFA content among strains
and populations should be considered when the
nutritional potential of phytoplankton communities
dominated by the cyanobacteria is estimated.
We suggest tentatively that an appreciable part of
the variation in the ALA concentration might be
explained by the influence of the other ALA-rich taxa,
possibly including the green algae which sometimes
accounted for a relatively large part of the total
phytoplankton biomass of Bugach. However, this
possibility was not supported by canonical correlation
results: the factor loading for the greens was low
compared with those for the cyanobacteria (Table 2).
It has been shown that in invertebrates, including
daphniids, retroconversion of DHA to EPA occurred
(von Elert, 2002). Hence, DHA-rich species of plank-
ton can be a valuable source of essential PUFAs for the
aquatic food web. When Peridinium sp. dominated
strongly in Bugach, the DHA content of the seston
was high, up to 15% of the total fatty acids on some
dates. The freshwater dinophyte Peridinium cinctum
(O.F. Mull.) Ehr. contained up to 11% of DHA in the
total fatty acids (Ahlgren et al., 1992), while most
marine dinophyta usually showed a much higher
content of the PUFA, up to 30–38% (Cobalas &
Lechado, 1989; Parrish et al., 1993). We conclude that
the dinophyte species in Bugach had a relatively high
concentration of DHA for freshwaters, although sig-
nificantly lower than that in most marine species. Our
data also confirmed the presence of appreciable
amounts of EPA in the freshwater dinophyta.
Although having high essential PUFA content, Peridi-
nium is unlikely to be a direct source of PUFAs for
zooplankton, because its size prevents efficient inges-
tion by daphniids. However, its valuable PUFAs
might be transferred to zooplankton indirectly, via
the food chain.
In conclusion, we speculate that freshwater dia-
toms, or some populations of a given species, can
differ strongly in the content of the essential fatty acid,
EPA. Some of the diatoms, which are low in EPA,
could not be considered as a valuable food for
zooplankton. Moreover, there are differences between
populations of cyanobacteria in C18 PUFA content,
and some of them may be rich in ALA. The latter
populations can be an alternative source of the
essential x3 PUFAs to aquatic food webs.
Acknowledgments
We used the GS-MS of the Joint Equipment Unit of the
Krasnoyarsk Scientific the Centre of Siberian Branch
of the Russian Academy of Sciences. The work was
supported by a personal grant (MK-1846.2003.04) for
young candidates of science (PhD) of the President of
the Russian Federation, by award No. KY-002-X1 of
the U.S. Civilian Research and Development Founda-
tion for the Independent States of the Former Soviet
Union (CRDF) and the Ministry of Education of the
Russian Federation, and by grant No. UR-07-01-011
from the Ministry of Education of the Russian Feder-
ation. At the stage of generalisation the work was also
supported by a personal grant from the Russian
Science Support Foundation. We thank Dr S.I. Genkal
for the electron microscopy and identification of major
diatom species.
References
Ahlgren G., Gustafsson I.-B. & Boberg M. (1992) Fatty
acid content and chemical composition of freshwater
microalgae. Journal of Phycology, 28, 37–50.
Ahlgren G., Goedkoop W., Markensten H., Sonesten L. &
Boberg M. (1997) Seasonal variations in food quality
for pelagic and benthic invertebrates in lake Erken –
the role of fatty acids. Freshwater Biology, 38, 555–570.
Arts M.T., Ackman R.G. & Holub B.J. (2001) ‘Essential
fatty acids’ in aquatic ecosystems: a crucial link
between diet and human health and evolution. Cana-
dian Journal of Fisheries and Aquatic Sciences, 58, 122–137.
Fatty acids in a freshwater reservoir 1217
� 2004 Blackwell Publishing Ltd, Freshwater Biology, 49, 1206–1219

Brown M.R., Jeffrey S.W., Volkman J.K. & Dunstan G.A.
(1997) Nutritional properties of microalgae for mar-
iculture. Aquaculture, 151, 315–331.
Christie W.W. (1989) Gas Chromatography and Lipids: a
Practical Guide. The Oily Press, Ayr. Scotland.
Claustre H., Marty J.C., Cassiani L. & Dagaut J. (1989)
Fatty acid dynamics in phytoplankton and microzoo-
plankton communities during a spring bloom in the
coastal Ligurian Sea: ecological implications. Marine
Microbial Food Webs, 3, 51–66.
Cobalas M.A. & Lechado J.Z. (1989) Lipids in microalgae.
A review I. Biochemistry. Grasas y aceites (Esp), 40, 118–
145.
Cohen Z., Margheri M.C. & Tomaselli L. (1995) Chemo-
taxonomy of cyanobacteria. Phytochemistry, 40, 1155–
1158.
De Lange H.J. & Arts M.T. (1999) Seston composition and
the potential for Daphnia growth. Aquatic Ecology, 33,
387–398.
Dembitsky V.M., Shkrob I. & Go J.V. (2001) Dicarboxylic
and fatty acid compositions of cyanobacteria of the
genus Aphanizomenon. Biochemistry (Moscow), 66, 72–76.
DeMott W.R. & Muller-Navarra D.C. (1997) The
importance of highly unsaturated fatty acids in
zooplankton nutrition: evidence from experiments
with Daphnia, a cyanobacterium and lipid emulsions.
Freshwater Biology, 38, 649–664.
Desvilettes C., Bourdier G., Amblard C. & Barth B. (1997)
Use of fatty acids for the assessment of zooplankton
grazing on bacteria, protozoans and microalgae. Fresh-
water Biology, 38, 629–637.
Dunstan G.A., Volkman J.K., Barrett S.M., Leroi J.M. &
Jeffrey S.W. (1994) Essential polyunsaturated fatty
acids from fourteen species of diatom (Bacillariophy-
ceae). Phytochemistry, 35, 155–161.
Ederington M., McManus G.B. & Harvey R. (1995)
Trophic transfer of fatty acids, sterols, and a triterpe-
noid alcohol between bacteria, a ciliate, and the
copepod Acartia tonsa. Limnology and Oceanography,
40, 860–867.
von Elert E. (2002) Determination of limiting polyunsat-
urated fatty acids in Daphnia galeata using a new
method to enrich food algae with single fatty acids.
Limnology and Oceanography, 47, 1764–1773.
Gladyshev M.I., Emelianova A.Y., Kalachova G.S., Zotina
T.A., Gaevsky N.A. & Zhilenkov M.D. (2000) Gut
content analysis of Gammarus lacustris from Siberian
lake using biochemical and biophysical methods.
Hydrobiologia, 431, 155–163.
Gladyshev M.I., Gribovskaya I.V., Moskvichova A.V.,
Muchkina E.Y., Chuprov S.M. & Ivanova E.A. (2001)
Content of metals in compartments of ecosystem of a
Siberian pond. Archives of Environmental Contamination
and Toxicology, 41, 157–162.
Gugger M., Lyra C., Suominen I., Tsitko I., Humbert J.-F.,
Salkinoja-Salonen M.S. & Sivonen K. (2002) Cellular
fatty acids as chemotaxonomic markers of the genera
Anabaena, Aphanizomenon, Microcystis, Nostoc and
Planktothrix (cyanobacteria). International Journal of
Systematic and Evolutionary Microbiology, 52, 1007–1015.
Gulati R.D. & DeMott W.R. (1997) The role of food quality
for zooplankton: remarks on the state-of-the-art,
perspectives and priorities. Freshwater Biology, 38,
753–768.
Hayakawa K., Tsujimura S., Napolitano G.E., Nakano S.,
Kumagai M., Nakajima T. & Jiao C. (2002) Fatty acid
composition as an indicator of physiological condition
of the cyanobacterium Microcystis aeruginosa. Limnol-
ogy, 3, 29–35.
Ikawa M., Haney J.F. & Sasner J.J. (1996) Inhibition of
Chlorella growth by the lipids of cyanobacterium
Microcystis aeruginosa. Hydrobiologia, 331, 167–170.
Jeffers J. (1981) An Introduction to System Analysis: with
Ecological Application. ‘Mir’, Moscow. 252 pp (transla-
ted from English).
Kattner G., Gercken G. & Eberlein K. (1983) Development
of lipids during a spring plankton bloom in the
northern North Sea. 1. Particulate fatty acids. Marine
Chemistry, 14, 159–162.
Kenyon C.N., Rippka R. & Stanier R. (1972) Fatty acid
composition and physiological properties of some
filamentous blue-green algae. Archives of Microbiology,
83, 216–236.
Leveille J.C., Amblard C. & Bourdier G. (1997) Fatty acids
as specific algal markers in a natural lacustrian
phytoplankton. Journal of Plankton Research, 19, 469–
490.
Li R. & Watanabe M.M. (2001) Fatty acid profiles
and their chemotaxonomy in planktonic species of
Anabaena (Cyanobacteria) with straight trichomes.
Phytochemistry, 57, 727–731.
Mayzaud P., Claustre H. & Augier P. (1990) Effect of
variable nutrient supply on fatty acid composition of
phytoplankton grown in an enclosed experimental
ecosystem. Marine Ecology Progress Series, 60, 123–140.
Miyazaki T. (1983) Compositional changes of fatty acids
in particulate matter and water temperature, and their
implications to the seasonal succession of phytoplank-
ton in a hypereutrophic Lake, Lake Kasumigaura,
Japan. Archiv fur Hydrobiologie, 99, 1–14.
Morris R.J. (1984) Studies of spring phytoplankton bloom
in an enclosed experimental ecosystem. 2. Changes in
the components fatty acids and sterols. Journal of
Experimental Marine Biology and Ecology, 75, 59–70.
1218 N.N. Sushchik et al.
� 2004 Blackwell Publishing Ltd, Freshwater Biology, 49, 1206–1219

Muller-Navarra D.C. (1995a) Biochemical versus mineral
limitation in Daphnia. Limnology and Oceanography, 40,
1209–1214.
Muller-Navarra D.C. (1995b) Evidence that a highly
unsaturated fatty acid limits Daphnia growth in nature.
Archiv fur Hydrobiologie, 132, 297–307.
Muller-Navarra D.C., Brett M.T., Liston A.M. & Goldman
C.R. (2000) A highly unsaturated fatty acid predicts
carbon transfer between primary producers and
consumers. Nature, 403, 74–77.
Murata N., Wada H. & Gombos Z. (1992) Modes of fatty-
acid desaturation in cyanobacteria. Plant Cell Physiol-
ogy, 33, 933–941.
Park S., Brett M.T., Muller-Navarra D.C. & Goldman C.R.
(2002) Essential fatty acid content and the phosphorus
to carbon ratio in cultured algae as indicators of food
quality for Daphnia. Freshwater Biology, 47, 1377–1390.
Parrish C.C., Bodennec G., Sebedio J.-L. & Gentien P.
(1993) Intra- and extracellular lipids in cultures of the
toxic dinoflagellate Gyrodinium aureolum. Phytochemis-
try, 32, 291–295.
Pohl P. & Zurheide F. (1982) Fat production in freshwater
and marine algae. In: Marine Algae in Pharmaceutical
Science, Vol. 2. (Eds H.A. Hoppe, T. Levring & Y.
Tanaka), pp. 65–80. Walter de Gruyter & Co., Berlin,
New York.
Regnault A., Chervin D., Chammai A., Piton F.,
Calvayrac R. & Mazliak P. (1995) Lipid composition
of Euglena gracilis in relation to carbon-nitrogen
balance. Phytochemistry, 40, 725–733.
Roessler P.G. (1990) Environmental control of glyceroli-
pid metabolism in microalgae: commercial implica-
tions and future research directions. Journal of
Phycology, 26, 393–399.
Sargent J.R., Bell J.G., Bell M.V., Henderson R.J. & Tocher
D.R. (1995) Requirement criteria for essential fatty
acids. Journal of Applied Ichthyology, 11, 183–198.
Shin K.H., Hama T., Yoshie N., Noriki S. & Tsunogai S.
(2000) Dynamics of fatty acids in newly biosynthesized
phytoplankton cells and seston during a spring bloom
off the west coast of Hokkaido Island, Japan. Marine
Chemistry, 70, 243–256.
Sushchik N.N., Gladyshev M.I., Kalachova G.S.,
Kravchuk E.S., Dubovskaya O.P. & Ivanova E.A.
(2003a) Particulate fatty acids in two small Siberian
reservoirs dominated by different groups of phyto-
plankton. Freshwater Biology, 48, 394–403.
Sushchik N.N., Gladyshev M.I., Moskvichova A.V.,
Makhutova O.N. & Kalachova G.S. (2003b) Compar-
ison of fatty acid composition in major lipid classes of
the dominant benthic invertebrates of the Yenisei river.
Comparative Biochemistry and Physiology, B134, 111–
122.
Sushchik N.N., Kalachova G.S., Zhila O.N., Gladyshev
M.I. & Volova T.G. (2003c) A temperature dependence
of the intra- and extracellular fatty acid composition of
green algae and cyanobacterium. Russian Journal of
Plant Physiology, 50, 374–380.
Tocher D.R., Leaver M.J. & Hodson P.A. (1998) Recent
advances in the biochemistry and molecular biology of
fatty acyl desaturases. Progress in Lipid Research, 37, 73–
117.
Trusova M.Y. & Gladyshev M.I. (2002) Phylogenetic
diversity of winter bacterioplankton of eutrophic
Siberian reservoirs as revealed by 16S rRNA gene
sequences. Microbial Ecology, 44, 252–259.
Vargas M.A., Rodriguez H., Moreno J., Olivares H., Del
Campo J.A., Rivas J. & Guerrero M.G. (1998) Biochem-
ical composition and fatty acid content of filamentous
nitrogen-fixing cyanobacteria. Journal of Phycology, 34,
812–817.
Volkman J.K., Barrett S.M., Blackburn S.I., Mansour M.P.,
Sikes E. & Gelin F. (1998) Microalgal biomarkers: a
review of recent research developments. Organic
Geochemistry, 29, 1163–1179.
Wacker A. & von Elert E. (2001) Polyunsaturated fatty
acids: evidence for non-substitutable biochemical
resources in Daphnia galeata. Ecology, 82, 2507–2520.
(Manuscript accepted 1 July 2004)
Fatty acids in a freshwater reservoir 1219
� 2004 Blackwell Publishing Ltd, Freshwater Biology, 49, 1206–1219