FACTORS ASSOCIATING WITH THE FUTURE CITATION ...
249
FACTORS ASSOCIATING WITH THE FUTURE CITATION IMPACT OF PUBLISHED ARTICLES: A STATISTICAL MODELLING APPROACH FERESHTEH DIDEGAH A thesis submitted in partial fulfilment of the Requirements of the University of Wolverhampton For the degree of Doctor of Philosophy February 2014 This work or any part thereof has not previously been presented in any form to the University or to any other body whether for the purposes of assessment, publication or for any other purpose (unless otherwise indicated). Save for any express acknowledgments, references and/or bibliographies cited in the work, I confirm that the intellectual content of the work is the result of my own efforts and of no other person. The right of Fereshteh Didegah to be identified as author of this work is asserted in accordance with ss.77 and 78 of the Copyright, Designs and Patents Act 1988. At this date copyright is owned by the author. Signature……………………………………….. Date……………………………………………..
-
Upload
khangminh22 -
Category
Documents
-
view
0 -
download
0
Transcript of FACTORS ASSOCIATING WITH THE FUTURE CITATION ...

FACTORS ASSOCIATING WITH THE FUTURE
CITATION IMPACT OF PUBLISHED ARTICLES:
A STATISTICAL MODELLING APPROACH
FERESHTEH DIDEGAH
A thesis submitted in partial fulfilment of the
Requirements of the University of Wolverhampton
For the degree of Doctor of Philosophy
February 2014
This work or any part thereof has not previously been presented in any
form to the University or to any other body whether for the purposes of
assessment, publication or for any other purpose (unless otherwise indicated).
Save for any express acknowledgments, references and/or bibliographies cited
in the work, I confirm that the intellectual content of the work is the result of
my own efforts and of no other person.
The right of Fereshteh Didegah to be identified as author of this work is
asserted in accordance with ss.77 and 78 of the Copyright, Designs and Patents
Act 1988. At this date copyright is owned by the author.
Signature………………………………………..
Date……………………………………………..

ii

iii
ABSTRACT
This study investigates a range of metrics available when an article is published
to see which metrics associate with its eventual citation count. The purposes are to
contribute to developing a citation model and to inform policymakers about which
predictor variables associate with citations in different fields of science. Despite the
complex nature of reasons for citation, some attributes of a paper’s authors, journal,
references, abstract, field, country and institutional affiliations, and funding source
are known to associate with its citation impact. This thesis investigates some
common factors previously assessed and some new factors: journal author
internationality; journal citing author internationality; cited journal author
internationality; cited journal citing author internationality; impact of the author(s),
publishing journal, affiliated institution, and affiliated country; length of paper;
abstract and title; number of references; size of the field; number of authors,
institutions and countries; abstract readability; and research funding. A sample of
articles and proceedings papers in the 22 Essential Science Indicators subject fields
from the Web of Science constitute the research data set. Using negative binomial
hurdle models, this study simultaneously assesses the above factors using large scale
data. The study found very similar behaviours across subject categories and broad
areas in terms of factors associating with more citations. Journal and reference
factors are the most effective determinants of future citation counts in most subject
domains. Individual and international teamwork give a citation advantage in
majority of subject areas but inter-institutional teamwork seems not to contribute to
citation impact.

iv

v
ACKNOWLEDGEMENT
My deepest appreciation goes to my Director of Studies, Professor Mike Thelwall,
who without his persistent help and great support I would not have been able to finish
this thesis successfully. He played a significant role as a great supervisor, teacher, co-
author and friend and is one of the most inspiring and influential people in my life. He
gave me courage, confidence, and strength with his patience, generosity and great
personality. I would like to thank him from the bottom of my heart for being always
available to help and support me, for all his great ideas, quick and useful comments and
feedback on my thesis and papers and for teaching me a lot about doing research. His
inspiration and encouragement made me fall in love with research and my area of
interest far more than before. My enormous gratitude to my second supervisor, Dr. Paul
Wilson, who assisted me a lot with finding and fitting the most appropriate statistical
model to the data and also had great perseverance and patience to read my work and
provide me with useful comments.
I would like to give a big ‘thank you’ to Dr. Ali Gazni, my former boss and great
co-author, from SCI, the Regional Information Center for Science & Technology in Iran
for all his kind help and great ideas for the data analysis part of the thesis. I would also
like to thank my colleagues at the Statistical Cybermetrics Research Group for
providing me with their ideas and suggestions about my work in the monthly group
meetings in all these years.
Many special thanks to my lovely family, my parents and siblings, who supported
me with their love and affection during all these years. Their belief in me and their
support from a distance encouraged me a lot to be able to manage my life abroad. I
cannot thank my parents enough who are continuously supporting and encouraging me
to not stop and carry on reaching my goals. They have done everything for me and
sacrificed their joys so that I could be happy in my life. I would like to thank my friends
especially Bengin Herki (Ben) and his lovely family who were actually my second
family in the UK. Their kindness and support prevented me from feeling homesick and
helped me to have a great social life.
Overall, without great support and help from my supervisors, colleagues, family
and friends, this thesis would not have been possible and I do apologise if I forgot to
mention anyone.

vi
Table of Contents
ABSTRACT ...................................................................................................................................... iii
ACKNOWLEDGEMENT ............................................................................................................... v
LIST OF TABLES ............................................................................................................................ x
LIST OF FIGURES ........................................................................................................................ xii
ABBREVIATIONS ....................................................................................................................... xiii
CHAPTER 1. INTRODUCTION ................................................................................................... 1
1.1 Research background .................................................................................................. 1
1.1.1 Citation factors .................................................................................................... 3
1.2 Research aim and objectives ....................................................................................... 7
1.3 Research significance ............................................................................................... 10
1.4 Thesis structure ......................................................................................................... 10
CHAPTER 2. LITERATURE REVIEW ..................................................................................... 12
2.1 Introduction ............................................................................................................... 12
2.2 Theories of citation ................................................................................................... 13
2.3 Citation Analysis ....................................................................................................... 15
2.4 Motivations for citations ........................................................................................... 15
2.5 Article properties as citation factors ......................................................................... 16
2.5.1 Research collaboration ...................................................................................... 17
2.5.2 Article properties impact .................................................................................. 19
2.5.3 Internationalisation ........................................................................................... 24
2.5.4 Interdisciplinarity .............................................................................................. 27
2.5.5 Article size-related properties ........................................................................... 29
2.5.6 Document and field type ................................................................................... 31
2.5.7 Article and abstract readability ......................................................................... 32
2.5.8 Research funding .............................................................................................. 33
2.5.9 Social Networks ................................................................................................ 34
2.5.10 Other factors ................................................................................................... 34
2.6 Metrics for citation motivations and factors ............................................................. 35
2.6.1 Journal impact indicators .................................................................................. 36
2.6.2 Author impact indicators .................................................................................. 37
2.6.3 Institution and country impact indicators ......................................................... 38
2.6.4 Journal internationality index ........................................................................... 38
2.7 Statistical methods in citation factor studies ............................................................. 39
CHAPTER 3. PRELIMINARY STUDIES: Determinants of Research Citation Impact in
Nanoscience and Nanotechnology ................................................................................................ 42

vii
3.1 Introduction ............................................................................................................... 42
3.2 Methods .................................................................................................................... 44
3.2.1 Collecting data .................................................................................................. 44
3.2.2 Outcome and predictor variables ...................................................................... 45
3.2.3 Statistical procedures ........................................................................................ 47
3.3 Results ....................................................................................................................... 49
3.4 Discussion and conclusions ...................................................................................... 52
CHAPTER 4. RESEARCH QUESTIONS .................................................................................. 60
4.1 Introduction ............................................................................................................... 60
4.2 Research Questions ................................................................................................... 61
CHAPTER 5. METHODS ............................................................................................................. 63
5.1 Introduction ............................................................................................................... 63
5.2 Data collection .......................................................................................................... 63
5.3 Assigning a subject field to each article ................................................................... 67
5.4 Variables and measurements ..................................................................................... 67
5.4.1 Internationality factors ...................................................................................... 69
5.4.2 Impact factors ................................................................................................... 71
5.4.3 Field size ........................................................................................................... 75
5.4.4 Title, abstract and article length ........................................................................ 76
5.4.5 Abstract readability ........................................................................................... 76
5.4.6 Research funding .............................................................................................. 77
5.5 Statistical procedures ................................................................................................ 77
5.5.1 Count regression models ................................................................................... 77
5.5.2 Multicollinearity ............................................................................................... 79
CHAPTER 6. RESULTS ............................................................................................................... 82
6.1 Introduction ............................................................................................................... 82
6.2 Agricultural Sciences ................................................................................................ 83
6.3 Biology & Biochemistry ........................................................................................... 84
6.4 Chemistry .................................................................................................................. 86
6.5 Clinical Medicine ...................................................................................................... 89
6.6 Computer Science ..................................................................................................... 90
6.7 Economics & Business ............................................................................................. 93
6.8 Engineering ............................................................................................................... 94
6.9 Environment/Ecology ............................................................................................... 97
6.10 Geosciences ............................................................................................................ 98

viii
6.11 Immunology .......................................................................................................... 101
6.12 Materials Science .................................................................................................. 103
6.13 Mathematics .......................................................................................................... 104
6.14 Microbiology ........................................................................................................ 106
6.15 Molecular Biology & Genetics ............................................................................. 109
6.16 Multidisciplinary ................................................................................................... 111
6.17 Neuroscience & Behaviour ................................................................................... 113
6.18 Pharmacology & Toxicology ................................................................................ 114
6.19 Physics .................................................................................................................. 116
6.20 Plant & Animal Science ........................................................................................ 119
6.21 Psychiatry/Psychology .......................................................................................... 121
6.22 Social Sciences, General ....................................................................................... 122
6.23 Space Sciences ...................................................................................................... 124
6.24 Research Funding in the four broad areas ............................................................. 126
6.24.1 Physical Sciences .......................................................................................... 127
6.24.2 Life Sciences ................................................................................................. 129
6.24.3 Medicine ....................................................................................................... 131
6.24.4 Social Sciences ............................................................................................. 133
6.25 Summary ............................................................................................................... 135
CHAPTER 7. DISCUSSION ...................................................................................................... 137
7.1 Introduction ............................................................................................................. 137
7.2 Individual collaboration .......................................................................................... 137
7.3 Institutional collaboration ....................................................................................... 140
7.4 International collaboration ...................................................................................... 142
7.5 Journal Impact Factor ............................................................................................. 144
7.6 Reference impact .................................................................................................... 145
7.7 Author impact ......................................................................................................... 147
7.8 Institution impact .................................................................................................... 148
7.9 Country impact ....................................................................................................... 150
7.10 Journal internationality ......................................................................................... 151
7.11 Reference internationality ..................................................................................... 153
7.12 Number of references ............................................................................................ 155
7.13 Field size ............................................................................................................... 156
7.14 Title, abstract and article length ............................................................................ 157
7.15 Abstract readability ............................................................................................... 160

ix
7.16 Research funding .................................................................................................. 162
7.17 Limitations ............................................................................................................ 163
7.18 Summary ............................................................................................................... 165
CHAPTER 8. CONCLUSIONS ................................................................................................. 167
8.1 Introduction ............................................................................................................. 167
8.2 Answers to the research questions .......................................................................... 167
8.3 Implications of the findings and recommendations ................................................ 171
8.4 Research contributions ............................................................................................ 172
8.5 Recommendations for future studies ...................................................................... 173
8.6 Concluding remarks ................................................................................................ 174
REFERENCES .............................................................................................................................. 175
APPENDIX A: LIST OF PUBLICATIONS ............................................................................. 196
APPENDIX B: MULTICOLLINEARITY RESULTS IN THE 22 SUBJECT
CATEGORIES AND 4 BROAD AREAS ................................................................................. 197
APPENDIX C: HURDLE MODELS RESULTS IN THE 22 SUBJECT CATEGORIES 210
APPENDIX D: HURDLE MODELS RESULTS IN THE FOUR BROAD AREAS ......... 232
APPENDIX E: EXTRA HURDLE MODELS FOR THE NUMBER OF INSTITUTIONS236

x
LIST OF TABLES
Table 3.1. Significant determinants of citation impact based on previous studies ................. 56
Table 3.2. Dependent and independent variables ................................................................... 57
Table 3.3. The results of the ZINB model for publications in 2007 ....................................... 57
Table 3.4. The results of the ZINB model for publications in 2008 ....................................... 58
Table 3.5. The results of the ZINB model for publications in 2009 ....................................... 58
Table 3.6. The results of the ZINB model for publications in 2007-2009 .............................. 59
Table 3.7. Summary of the results of the ZINB model for all time intervals examined ......... 59
Table 5.1. The sample size in the 22 ESI subject categories (2000-2009) ............................. 65
Table 5.2. The mapping of the 21 ESI subject categories into 4 broad areas ......................... 66
Table 5.3. Independent variables and measures ...................................................................... 68
Table 5.4. Gini coefficient calculation example ..................................................................... 70
Table 5.5. The correlation between the seven readability scores in Biology & Biochemistry 76
Table 6.1. Analysis of hurdle model results for Agricultural Sciences. ................................. 84
Table 6.2. Analysis of hurdle model results for Biology & Biochemistry. ............................ 86
Table 6.3. Analysis of hurdle model results for Chemistry. ................................................... 88
Table 6.4. Analysis of hurdle model results for Clinical Medicine. ....................................... 90
Table 6.5. Analysis of hurdle model results for Computer Science. ....................................... 92
Table 6.6. Analysis of hurdle model results for Economics & Business. ............................... 94
Table 6.7. Analysis of hurdle model results for Engineering. ................................................ 96
Table 6.8. Analysis of hurdle model results for Environment/Ecology. ................................. 97
Table 6.9. Analysis of hurdle model results for Geosciences. .............................................. 100
Table 6.10. Analysis of hurdle model results for Immunology. ........................................... 102
Table 6.11. Analysis of hurdle model results for Materials Science. ................................... 104
Table 6.12. Analysis of hurdle model results for Mathematics. ........................................... 106
Table 6.13. Analysis of hurdle model results for Microbiology. .......................................... 108
Table 6.14. Analysis of hurdle model results for Molecular Biology & Genetics. ............... 110
Table 6.15. Analysis of hurdle model results for Multidisciplinary. .................................... 112
Table 6.16. Analysis of hurdle model results for Neuroscience & Behaviour...................... 114
Table 6.17. Analysis of hurdle model results for Pharmacology & Toxicology. ................. 116
Table 6.18. Analysis of hurdle model results for Physics. .................................................... 118
Table 6.19. Analysis of hurdle model results for Plant & Animal Science. ......................... 120
Table 6.20. Analysis of hurdle model results for Psychiatry/Psychology. ........................... 122
xi
Table 6.21. Analysis of hurdle model results for Social Sciences, General. ........................ 124
Table 6.22. Analysis of hurdle model results for Space Science. ......................................... 126
Table 6.23. Analysis of hurdle model results for Physical Sciences. ................................... 129
Table 6.24. Analysis of hurdle model results for Life Sciences. .......................................... 131
Table 6.25. Analysis of hurdle model results for Medicine. ................................................. 133
Table 6.26. Analysis of hurdle model results for Social Sciences. ....................................... 135
Table B.1. VIF results in Agricultural Sciences ................................................................... 131
Table B.2. VIF results in Biology & Biochemistry .............................................................. 192
Table B.3. VIF results in Chemistry .................................................................................... 193
Table B.4. VIF results in Clinical Medicine ......................................................................... 193
Table B.5. VIF results in Computer Science ........................................................................ 194
Table B.6. VIF results in Economics & Business ................................................................ 194
Table B.7. VIF results in Engineering ................................................................................. 195
Table B.8. VIF results in Environment/Ecology .................................................................. 195
Table B.9. VIF results in Geosciences .................................................................................. 196
Table B.10. VIF results in Immunology .............................................................................. 196
Table B.11. VIF results in Materials Science ...................................................................... 197
Table B.12. VIF results in Mathematics ............................................................................... 197
Table B.13. VIF results in Microbiology ............................................................................. 198
Table B.14. VIF results in Molecular Biology & Genetics .................................................. 198
Table B.15. VIF results in Multidisciplinary ....................................................................... 199
Table B.16. VIF results in Neuroscience & Behaviour ....................................................... 199
Table B.17. VIF results in Pharmacology & Toxicology .................................................... 200
Table B.18. VIF results in Physics ....................................................................................... 200
Table B.19. VIF results in Plant & Animal Science ............................................................ 201
Table B.20. VIF results in Psychiatry/Psychology .............................................................. 201
Table B.21. VIF results in Social Sciences, General ........................................................... 202
Table B.22. VIF results in Space Science ............................................................................ 202
Table B.23. VIF results in Physical Sciences ...................................................................... 203
Table B.24. VIF results in Life Sciences ............................................................................. 203
Table B.25. VIF results in Medicine .................................................................................... 204
Table B.26. VIF results in Social Sciences .......................................................................... 204
Table C.1. The results of hurdle model in Agricultural Sciences ......................................... 210
Table C.2. The results of hurdle model in Biology & Biochemistry .................................... 211
Table C.3. The results of hurdle model in Chemistry ........................................................... 212

xii
Table C.4. The results of hurdle model in Clinical Medicine ............................................... 213
Table C.5. The results of hurdle model in Computer Science .............................................. 214
Table C.6. The results of hurdle model in Economics & Business ....................................... 215
Table C.7. The results of hurdle model in Engineering ........................................................ 216
Table C.8. The results of hurdle model in Environment/Ecology ........................................ 217
Table C.9. The results of hurdle model in Geosciences ........................................................ 218
Table C.10. The results of hurdle model in Immunology ..................................................... 219
Table C.11. The results of hurdle model in Materials Science ............................................. 220
Table C.12. The results of hurdle model in Mathematics ..................................................... 221
Table C.13. The results of hurdle model in Microbiology .................................................... 222
Table C.14. The results of hurdle model in Molecular Biology & Genetics ........................ 223
Table C.15. The results of hurdle model in Multidisciplinary .............................................. 224
Table C.16. The results of hurdle model in Neuroscience & Behaviour .............................. 225
Table C.17. The results of hurdle model in Pharmacology & Toxicology ........................... 226
Table C.18. The results of hurdle model in Physics ............................................................. 227
Table C.19. The results of hurdle model in Plant & Animal Science ................................... 228
Table C.20. The results of hurdle model in Psychiatry/Psychology ..................................... 229
Table C.21. The results of hurdle model in Social Sciences, General .................................. 230
Table C.22. The results of hurdle model in Space Sciences ................................................. 231
Table D.1. The results of hurdle model in Physical Sciences ............................................... 232
Table D.2. The results of hurdle model in Life Sciences ...................................................... 233
Table D.3. The results of hurdle model in Medicine ............................................................ 234
Table D.4. The results of hurdle model in Social Sciences .................................................. 235
Table E1. The results of extra hurdle models ....................................................................... 236
LIST OF FIGURES
Figure 3.1. Calculation process of the internationality of references................................... 47
Figure 5.1. The calculation process for journal and reference internationality.................... 71

xiii
ABBREVIATIONS
AIF Adjusted Impact Factor
ARI Automated Readability Index
CWTS Centre for Science and Technology Studies
ESI Essential Science Indicators
ISI Institute for Scientific Information
JCR Journal Citation Reports
JIF Journal Impact Factor
MNCS Mean Normalised Citation Score
NB Negative Binomial
REF Research Excellence Framework
SEM Structural Equation Modelling
SNIP Source Normalized Impact per Paper
WoS Web of Science

1
CHAPTER 1. INTRODUCTION
1.1 Research background
This study investigates the properties of an article as a text document when it
is published to find which properties associate with the number of citations to the
article. Citation counts are widely acknowledged to be the main research impact
indicator (Furnham, 1990) and the normative citation perspective views citation
counts as indicators of scientific merit. Although the use of citations in research
quality assessment has been criticised, they have long been the main source of
indicators for the impact of individual articles (Bornmann & Daniel, 2008; Wilson,
1999; Baird & Oppenheim, 1994; Cole & Cole, 1971). In support of this, previous
studies of specific samples of articles have found that high-quality articles tend to
be cited more often (Patterson & Harris, 2009; Lawani, 1986) and highly cited
articles significantly associate with quality measures such as winning awards, and
professional prestige and recognition (Cole & Cole, 1973). Good research methods
and high quality statistical reporting also significantly associate with increased
citations to papers (Bergh, Perry & Hanke, 2006; Nieminen, Carpenter, Rucker &
Schumacher, 2006). Moreover, the quality scores given to articles by some experts
significantly correlate with the number of citations to the articles (Patterson &
Harris, 2009). A number of previous studies yield insights into whether article
properties other than research quality contribute to citation impact. Such properties
are called “citation factors” in this thesis. Citation factors are called determinants
of citations, in the statistical sense of the word, if they are shown to associate with
higher rates of citation, irrespective of any cause-and-effect relationship. A large-
2
scale study of ecological journals concluded that there was a positive association
between various explanatory factors and citation counts but found no evidence of a
causal connection (Padial et al., 2010). For example, a low-quality paper, even if
published in a prestigious journal or written by a well-known author, would
probably not become highly cited. Nevertheless, well known authors tend to write
better articles. Publishing in a high-impact journal will also give an article higher
visibility, and better articles are more likely to be published in good journals.
Authors’ perceptions of articles have been explored through questionnaires or
interviews. The first survey study was published by Brooks (1985), revealing that
“persuasiveness” is the citers’ main motivation, describing their desire to provide
evidence to confirm their points of view. Owing to the time-consuming nature of
qualitative research and the complex and discipline-dependent nature of citers’
motives, such qualitative studies usually involve only a small sample of scholars
ranging between 2 citing authors in communication studies (Case & Higgins.
2000) to a maximum of 192 citing psychologists (Shadish, Tolliver, Gray &
Sengupta, 1995).
Context or content analyses employing text analysis and semantic content
analysis methods are two other approaches to explore citers’ motives. Context
analysis aims to discover citation motives from the citing author’s point of view
and requires reading the citing article text to determine the reasons behind giving
the citation based on its context. The most comprehensive citation context analyses
were carried out by Moravcsik and Murugesan (1975) and Chubin and Moitra
(1975). Content analysis is a method that has been used to characterize the cited
work through analysing the content of its citing articles. Although context analysis

3
seeks to find why a citation was given, while content analyses have tried to find
out why an article is cited, both methods look for the reasons behind a citation.
The samples investigated in such studies are usually small since the articles need
to be read carefully to infer the citing authors’ motivations.
1.1.1 Citation factors
Despite the complex nature of citation motivations, some article properties,
including attributes of the cited paper’s authors, abstract, journal, field, and
references, are known to associate with the citation impact of individual papers. A
number of empirical studies have been carried out to seek associations between
citation counts and various objective and easily measurable properties of the
research (Bornmann, Schier, Marx, & Daniel, 2012; Gazni & Didegah, 2010;
Larivière & Gingras, 2010; Boyack & Klavans, 2005). These factors are
sometimes called extrinsic because they are not related to the paper’s intellectual
contribution. Extrinsic factors can be used to predict future citation impact,
particularly when they can be quantified and calculated easily on a large scale.
Extrinsic factors may not directly cause future citation counts, but can nevertheless
provide indirect evidence of likely future citation impact. In contrast, the number
of downloads of a paper is a factor that can help to predict future citations but it is
not considered here because it is not available at the time of publication (Chen,
2012). The same is true for using early citation counts to predict later citation
counts (Levitt & Thelwall, 2011). Bornmann and Daniel (2008) divided extrinsic
factors affecting the citation impact of an article into seven categories: Author,

4
Article, Journal, Time, Field, Availability and Technical problems-related. These
factors are summarised below.
1.1.1.1 Journal factors
Journal prestige, mainly measured by the Journal Impact Factor (explained
later in section 2.6.1), has been identified as the most important determinant of
future citation impact for articles in some scientific fields (Bornmann & Daniel,
2007a; Boyack & Klavans, 2005; Van Dalen & Henkens, 2005; Callaham, Wears,
& Weber, 2002). The degree of internationalisation of authors and editorial boards
are characteristics of journals which moderately correlate with their Impact Factor
(Yue, 2004; Zitt & Bassecoulard, 1998) and hence may associate with the future
citation impact of individual articles.
1.1.1.2 Reference factor
Articles citing high-impact works will be themselves more cited (Lancho-
Barrantes, Guerrero-Bote, & Moya-Anegon, 2010; Boyack & Klavans, 2005).
Similarly, the h-index (explained later in section 2.6) of an article's references
correlates with the citation impact of the article (Bornmann, Schier, Marx, &
Daniel, 2012). Research works with a higher number of references will be cited
more (Vieira & Gomes, 2010; Webster, Jonason, & Schember, 2009; Haslam et
al., 2008; Lokker, Mckibbon, Mckinlay, Wilczynski, & Haynes, 2008; Kostoff,
2007; Walters, 2006; Peters & Van Raan, 1994; Moed, Burger, Frankfort, & Van
Raan, 1985). An interpretation of this result could be that references make the

5
work more visible or many references could indicate membership of a subfield
with an extensive referencing culture and hence a high average citation count.
1.1.1.3 Research collaboration
The number of authors has shown no correlation with the citation counts of
papers in chemistry (Bornmann, Schier, Marx, & Daniel, 2012), but positively
correlates in a wide variety of other subject areas and disciplines (Gazni &
Didegah, 2010; Borsuk, Budden, Leimu, Aarssen, & Lortie, 2009; Sooryamoorthy,
2009; Lokker et al., 2008; Kostoff, 2007; Glänzel, Debackere, Thijs, & Schubert,
2006; Leimu & Koricheva, 2005a&b). Multinational papers have also been found
to be more highly cited (Persson, 2010; Sooryamoorthy, 2009; Schmoch &
Schubert, 2008; Aksnes, 2003; Glänzel, 2001; Van Raan, 1998; Katz & Hicks,
1997; Narin, Stevens, & Whitlow, 1991), although some studies have found a
negative correlation between countries per paper and citation impact (Gazni &
Didegah, 2010). Furthermore, a higher number of institutions contributing to a
paper positively affects its citation impact (Gazni & Didegah, 2010;
Sooryamoorthy, 2009; Narin & Whitlow, 1990).
1.1.1.4 Field and document characteristics
The size of the field in terms of number of publications and authors could
influence the impact of individual papers in it (Moed, Burger, Frankfort, & Van
Raan, 1985). Articles in smaller fields normally receive fewer citations than those
in more general fields (King, 1987). Type of field (Bornmann, Schier, Marx, &
Daniel, 2012; Kulkarni, Busse, & Shams, 2007; Peters & Van Raan, 1994) and

6
type of document are also related to the number of citations received by articles in
some subject fields (Amin & Mabe, 2000; Peters & Van Raan, 1994).
1.1.1.5 Country and institution impact
Research from non-English-speaking countries is less cited than research
conducted by native English speakers; this is referred to as the effect of country
affiliation on the impact of research in science. Moreover, researchers from high-
ranked institutions receive more citations to their papers than those from low-
ranked institutions (Leimu & Koricheva, 2005a) presumably at least partly because
they tend to be better researchers.
1.1.1.6 Research approaches
In terms of research approaches, study design and study topic also
significantly associate with citation impact. For instance, in urological literature,
articles with randomized control trials design received higher numbers of citations
than articles with prospective observational design or case reports (Willis, Bahler,
Neuberger, & Dahm, 2011); in orthopedic literature meta-analyses, randomized
trials and basic science reports were significantly more cited than the other designs
(Bhandari et al., 2007). The topic of a paper can also be considered as a
determinant of citation impact; for example, articles published on h-index highly
benefited from short term citations (Rousseau, García-Zorita, & Sanz-Casado,
2013).

7
1.2 Research aim and objectives
Although a number of studies have investigated extrinsic factors in some
subject areas, many areas and some factors have not yet been examined. The
current study assesses common extrinsic factors that have previously been found to
influence the citation impact of individual papers in some subject fields. It also
introduces a new factor: internationality.
This study examines the association between 19 factors:
journal author internationality;
journal citer internationality;
reference author internationality;
reference citer internationality;
author impact;
institution impact;
country impact;
reference impact;
journal impact;
individual collaboration;
institutional collaboration;
international collaboration;
number of references;
article length;
abstract length;
title length;
field size;

8
abstract readability;
and research funding
and citation counts as the dependent variable in 22 subject categories and 4 broad
areas. The purposes are: to contribute to citation theory; to inform scholars of the
factors that are most important for the production of high-impact research and are
under their control such as research collaboration, journal and reference impact or
abstract readability; and to aid science policy makers by identifying independent
variables for the citation impact of papers in a range of subject areas.
This thesis does not attempt to distinguish between factors that reflect the
quality of research in an article and factors that help to attract citations to an article
irrespective of its quality.
The above factors have not been examined simultaneously for multiple
research fields using an appropriate statistical model. This is an important
omission because inappropriate models may generate misleading conclusions and
non-simultaneous tests may identify apparently important factors that are not
relevant when other factors are also considered. This study fills this gap by
applying a negative binomial-logit hurdle model to many scientific fields.
The development of citation theory is the main motivation for conducting this
study. The main objective is to obtain a more complete understanding of the
extrinsic factors associated with the impact of an article. A number of factors are
already in the literature of citation theory and citation behaviour. Moreover, some
new factors will also be analysed and examined on a large-scale population. More
specifically, the present study aims to:

9
identify attributes of papers associating with citations through reviewing
previous studies;
recommend and assess new factors which may associate with citation
impact;
determine the main predictors of citation impact in each of 22 broad subject
categories using a single appropriate statistical model.
To reach the research goals, the study seeks to answer the following research
questions:
1. Which types of research collaboration (individual, institutional and
international) associate with increased citation impact?
2. Do author, institution and country impact associate with increased citation
impact?
3. Do journal and reference characteristics (journal impact and
internationality, reference impact and internationality, and total references)
associate with increased citation impact?
4. Which field size and article size attributes (article, abstract, and title length)
associate with increased citation impact?
5. Do articles with more readable abstracts receive more citations?
6. Do funded articles receive more citations than unfunded articles?
7. To what extent do the above factors associate with increased citation
counts?
These questions will be discussed again in Chapter 4.

10
1.3 Research significance
Although the motives for citations have been widely discussed in the
literature, there is no empirical study attempting to assess factors influencing
citation counts on a large scale and trying to examine the most significant extrinsic
factors. This will help towards a more comprehensive theory of citations. This will
also help prediction which could be useful to varied groups of people, and
particularly scholars, to enhance the probability of conducting high impact work.
As this research is conducting a comparison across all fields of science, the results
will be helpful and significant to a wide range of audiences.
1.4 Thesis structure
The thesis comprises eight chapters: introduction; literature review;
methodology; results; discussion; and conclusions.
After this chapter, Chapter 2 presents a comprehensive and critical review of
previous studies. After a brief introduction, theories of citations are reviewed and
discussed. A brief review of citation analysis literature comes after and then
studies on citation motivations are reviewed. The next part critically and
extensively discusses studies of factors associating with higher rates of citation.
Following this, evaluative methods for citation motivations and factors are
discussed.
In Chapter 3, Preliminary studies, a pilot study of Nanoscience and
Nanotechnology has been presented. The chapter starts with an introduction
following by methods, collecting data, outcome and predictor variables, statistical
procedures, results and discussion and conclusions.

11
Chapter 4 presents research questions including 7 different questions.
In Chapter 5, Methodology, methods for data collection and assigning subject
fields to articles are outlined. Sources and databases used to collect data are also
introduced. The process of analysis for each factor is discussed and finally the
statistical procedure implemented to model the citation factors is explained in
detail.
Chapter 6, Results, focuses on the findings of each statistical model for the
citation factors in each field, in 26 different parts for the 22 subject categories and
4 broad areas.
In Chapter 7, Discussion, the results of each factor are discussed and the
section ends with a summary.
Chapter 8, Conclusion, is divided into 6 parts. After a brief introduction, the
findings for each research question are summarised. The contributions of the study
to the scientific community, especially scientometrics and bibliometrics research,
are discussed. The next part discusses the research limitations and then,
considering the limitations of this study, some recommendations are put forward
for future studies.

12
CHAPTER 2. LITERATURE REVIEW
2.1 Introduction
The reasons for citing a particular document at a particular time and in a
specific field of science vary widely (Case & Higgins, 2000). Some reasons, like
those involved in the persuasional nature of citations, are intangible and not
measurable. A pioneering work by Garfield (1965) provides many reasons for
citation; some reasons are hard to identify, like “paying homage or giving credit”,
but others are more easily detected, like the aim of criticizing or correcting the
works of others. However, it is hard to identify the reasons behind citation counts
as they do not yield insights into the motivations of citing authors or the reasons
for citing a specific part of an article (Brooks, 1985).
Citing motives also vary considerably between researchers and between cited
works. The study of researchers’ motives for citing has been mostly conducted via
surveys or interviews. The aim of persuading audiences about the findings of an
article has been found to be the main citing motivation of authors (Brooks, 1985,
1986). Perceiving the cited work as a classic reference written by a well-known
researcher in the field and using a comprehensive overview of previous literature
are two other recognised motivations (Case & Higgins, 2000; Shadish, Tolliver,
Gray, & Sengupta, 1995), showing that the intellectual content of a paper may not
be the only reason why it is cited.
This chapter reviews citation theory and behaviour and seeks the gaps in prior
literature. The literature review will briefly discuss theories of citation and also
citation analysis methods. Then prior literature on factors associating with article

13
citation impact will be reviewed and the measures and methodologies used to
quantify and examine citation factors will be discussed.
2.2 Theories of citation
The lack of a sophisticated citation theory has been noted by many scholars
(Leydesdorff, 1998; Zuckerman, 1987; Cronin, 1984). There are two rival theories
of citation behaviour developed over the last two decades, the normative view (or
Mertonian view) and the social constructivist view (or Latour’s view). The
normative theory of citation holds that citations reflect the scientific quality and
merits of research outputs because citers use them to reward the works of their
colleagues (Small, 2004; White, 2004; MacRoberts & MacRoberts, 1987; Merton,
1973) whereas the social constructivist theory holds that authors use the references
to support their own claims and points made. According to this latter theory, the
author references earlier research to persuade readers about their claims, hence
they may even misquote the work referenced to suit their needs (Latour, 1987).
This theory emphasises factors affecting citations other than the quality and
content of the cited article (White, 2004; Baldi, 1998; Gilbert, 1977). The
normative view of citation behaviour allows citations to be measures of impact.
However, some citations are redundant or not valuable (Moravcsik & Murugesan,
1975) which is a problem for this perspective. The constructivist view calls the
hypotheses of the normative view into question. It criticizes the efficacy of citation
analysis for evaluative purposes. The results of few empirical studies in which it
was found that articles are cited for relevant content rather than for characteristics
of its authors or other characteristics of the article itself cast some doubt on the

14
constructivist claims (Cronin, 2004; White, 2004; Baldi, 1998; Stewart, 1990,
1983) but there are many studies showing that citation impact is affected by some
external factors rather than content.
A third theory, the symbolic theory of citation, describes cited works as
symbolic concept markers. According to this theory, despite other motives for
citation, the cited concept should fit in the context of the cited work and
complement the text (Small, 1978). In a more comprehensive and reinforced
description of symbolic theory, Small (1998) argues that the normative and
constructivist views of citation are overlooking the symbolic functions of citations.
A number of studies have acknowledged the perspective of considering citations as
symbolic concepts in particular and the rationality of the symbolic theory in
general, although this theory has been criticized for not exploring citation
motivations (Cronin, 1982).
Leydesdorff (1998) discusses theory of citations distinguishing between
citation practice and citation analysis. He further argues that citation networks are
dual-layered inducing “the perception of a cognitive dimension in scientific
communication” and concludes that social and cognitive dimensions of citation
practices are both necessary for theories of citation.
Owing to the complex nature of citations, a comprehensive theory of citation
is unlikely. Van Raan (1998) criticises the claim that a theory is needed for citation
analysis and suggests replacing theory with a feasible model that provides a
plausible approximation of reality.
This study mainly attempts to identify the foremost factors contributing to
citations other than intrinsic research quality. Therefore, it is a theory-driven study

15
following both the social constructivist view and Van Raan’s (1998) suggestion to
help develop a sophisticated citation model rather than a theory.
2.3 Citation Analysis
Citation analysis examines the relationship between cited and citing works
(Smith, 1981) and comprises a variety of ways to analyse the cited works (Moed,
2005). The main use of this method is to assess journal articles (White & White,
1977; Brown & Gardner, 1985; Sylvia, 1998; Schloegl & Stock, 2004), theses and
dissertations (Kuruppu & Moore, 2008; Chan, Chen, & Cheng, 2009; Feyereisen
& Spoiden, 2009), and patents (Karki, 1997; von Wartburg, Teichert, & Rost,
2005; Hu, Chen, Huang, & Roco, 2007). The validity of citation analysis has been
criticized (MacRoberts & MacRoberts, 1989, 2010) particularly for measuring the
impact of articles. With respect to the social constructivist view of citations,
citations are tools of persuasion but bearing in mind the complexity of citation
behaviour and citation motivations, persuasion is not the only reason for citation
and many other factors contribute to citations (Zuckerman, 1987).
2.4 Motivations for citations
The study of researchers’ motives for citing the works of others has been
mostly conducted via surveys or interviews. The results of interviewing twenty
authors from different subject areas, such as library science, philosophy, surgery,
and religion, suggested that persuasiveness was the main purpose of citations
(Brooks, 1985, 1986). In chemistry, the documentary reason for citation, defined
to be the need for a complete literature review, which is a professional type of

16
motivation, was the main motivation to cite other works (Vinkler, 1987). In
psychology, citers were motivated to cite a number of highly cited papers as they
perceived the papers to be classic references written by well-known authors and
because the citers were less creative and had less innovative methods or theoretical
perspectives (Shadish, Tolliver, Gray & Sengupta, 1995). In another study of
researchers’ motivations for citing two highly cited papers, the main motivations
were: the cited work gave an overview of preceding literature in the area; and the
cited work developed a specific concept in the field (Case & Higgins, 2000). In a
recent study, Case and Miller (2011) investigated how differently bibliometricians
cite from scholars in Psychology (Case & Higgins, 2000) and Communication
(Shadish et al., 1995) and found similar manners for citing between the fields. The
main reason for citing an article in Bibliometrics was that a genre of studies or a
specific concept of the field is presented in the cited article. Citation motivations
are mainly related to researchers’ perceptions and needs. Personal perceptions and
needs are not fixed and differ from one person to another and that is why
discovering absolute reasons behind citations is not an easy task. In addition,
studies of motivations for citation cannot easily be carried out on a large sample of
scholars due to their time-consuming nature.
2.5 Article properties as citation factors
Although the content and quality of a research paper is presumably the main
determinant of its citation impact, other factors associate with the citation counts
of articles. Bornmann and Daniel (2008) reviewed citation behaviour studies and

17
found extrinsic factors in seven categories: Author, Article, Journal, Time, Field,
Availability and Technical problems-related.
2.5.1 Research collaboration
Multi-author research is becoming more common (Gazni, Sugimoto, &
Didegah, 2012; Persson, Glänzel, & Danell, 2004) and tends to receive more
citations than does solo research (Franceschet & Costantini, 2010; Gazni &
Didegah, 2010; Persson, 2010; Borsuk et al., 2009; Sooryamoorthy, 2009; Lokker,
Mckibbon, Mckinlay, Wilczynski, & Haynes, 2008; Kostoff, 2007; Glänzel,
Debackere, Thijs, & Schubert, 2006; Leimu & Koricheva, 2005a&b; Nemeth &
Goncalo, 2005; Beaver, 2004; Goldfinch, Dale & Rouen, 2003; Glänzel, 2001;
Rousseau, 2001; Baldi, 1998; Katz & Hicks, 1997; Van Raan, 1997; Peters & Van
Raan, 1994; Bordons, Garcia Jover, & Barrigon, 1993; Lawani, 1986; Smart &
Bayer, 1986). Using a Bayesian argument, Rousseau (1992) simply explains that
while a multi-authored paper has 100% or 77% chances of being cited, a single-
authored paper has only 8% chance of being cited. However, a few studies have
found no correlation between more authors and increased citations (Bornmann,
Schier, Marx, & Daniel, 2012; Haslam et al., 2008; Hart, 2007; Medoff, 2003;
Avkiran, 1997). However, these studies' findings are often not generalizable
because they are limited to a single country (Sooryamoorthy, 2009), a single
institution (Gazni & Didegah, 2010), a single field of study (Haslam et al., 2008;
Hart, 2007; Leimu & Koricheva, 2005a&b; Medoff, 2003; Avkiran, 1997) or a
specific journal (Bornmann, Schier, Marx, & Daniel, 2012). Using correlation and
regression tests, a correlation between citation counts and the number of authors

18
has been found (Gazni & Didegah, 2010; Sooryamoorthy, 2009; Haslam et al.,
2008; Leimu & Koricheva, 2005a&b) but the extent to which the number of
authors contributes to increased or decreased citations has not been widely
examined for different fields. The differences between the previous studies might
be due to the differing samples of publications used and, in particular, there may
be disciplinary differences. Whereas previous studies have conducted detailed
micro-level analyses, this thesis operates at a macro level and is not limited to a
single country, institution, field or journal.
International collaboration has been rapidly growing in recent decades
(Leydesdorff, Wagner, Park, & Adams, 2013). A positive influence for
international collaboration on research citation impact has been reported in
previous studies (Sooryamoorthy, 2009; Glänzel, 2001; Glänzel & Schubert, 2001;
Katz & Hicks, 1997; Narin, Stevens, & Whitlow, 1991). Conversely, however, an
investigation of Harvard University publications found no correlation between
international collaboration and citation counts (Gazni & Didegah, 2010), but this
may be a special case for Harvard, as a world-leading institution. Most studies are
geographically or institutionally limited and hence are difficult to generalise. Two
studies (Glänzel, 2001; Glänzel & Schubert, 2001) avoid this issue by taking the
full Science Citation Index (SCI) during a one or two-year period. However, they
do not cover social sciences fields. This research fills this gap in the literature by
studying social sciences in comparison to medical, life and physical sciences. To
measure the impact of international collaboration on citation counts, the very
simple method of comparing the mean citation of domestic collaboration with
international collaboration is often used. This has the limitation that the difference

19
may be spurious: caused by factors other than the ones investigated. International
collaboration seems to be particularly beneficial for small institutions (Goldfinch,
Dale, & Rouen, 2003) rather than big institutions (Gazni & Didegah, 2010).
Institutional collaboration, which involves researchers from different
institutions in the same country, also associates with the higher citation impact of
papers (Gazni & Didegah, 2010; Sooryamoorthy, 2009; Narin & Whitlow, 1990).
A simple correlation was calculated in these papers to assess the association
between institutional collaboration and citation counts. These studies are also
geographically and institutionally limited and do not have the coverage of this
thesis.
2.5.2 Article properties impact
2.5.2.1 Journal impact
Journal prestige, mainly measured by the journal Impact Factor, has been
identified as the most important determinant of future citation impact for articles in
some scientific fields (Vanclay, 2013; Bornmann & Daniel, 2007a; Judge, Cable,
Colbert & Rynes, 2007; Kulkarni, Busse, & Shams, 2007; Boyack & Klavans,
2005; Van Dalen & Henkens, 2005; Callaham, Wears, & Weber, 2002). High
impact journals gain more attention and hence articles in them are more visible
(Haslam et al., 2008; Meadows, 1998). The impact of the publishing journal is an
important signal for gaining attention to a research paper in the field of
demography (Van Dalen & Henkens, 2005), for example. In a micro-level study of
emergency medicine, the journal impact factor was also the most significant

20
determinant of the number of citations to a paper (Callaham, Wears, & Weber,
2002).
A large scale study also found the journal impact factor to be the most
important determinant of citation impact in 17 out of 24 disciplines, with a positive
significant correlation between this factor and article citation counts (Boyack &
Klavans, 2005). The extent to which this factor associates with increased citations
was not determined in the studies above, however. In an exception to this, an
investigation of a few articles in biomedicine, found the journal impact factor to
contribute to an 11% increase in the number of citations to papers (Bornmann &
Daniel, 2007a).
While most studies confirmed that the publishing journal impact factor
significantly associates with citation counts for articles, one marketing study is an
exception. This may be due to the similarity between marketing journals that all
journals tested were high impact and were published in USA. Furthermore, only
the five top journals in marketing were taken into account and the results of such a
small sample may not be generalizable (Stremersch, Verniers & Verhoef, 2007).
2.5.2.2 Reference impact
Articles citing high impact works are cited more in the future (Lancho-
Barrantes, Guerrero-Bote, & Moya-Anegon, 2010; Boyack & Klavans, 2005). This
observation is related to the Newton hypothesis, according to which, highly cited
articles are mainly connected to previous high impact articles. In a study of four
fields, Physical Sciences, Life Sciences, Health Sciences, and Social Sciences,
Bornmann, Anegón & Leydesdorff (2010) found that highly cited papers are

21
mainly based on previous highly cited studies further confirming the Newton
hypothesis. However, the Ortega hypothesis suggests that highly cited papers are
based on previous medium impact articles which was called into question by
Bornmann, Anegón & Leydesdorff (2010) and also Cole & Cole (1972). Similarly,
the impact of an article's references, where the h-index is used on all of an article’s
references, positively correlates with article citation impact (Bornmann, Schier,
Marx, & Daniel, 2012).
2.5.2.3 Author impact
The reputation of authors is also a determinant of citation impact (Peters &
Van Raan, 1994). The reputation of authors can increase the visibility and impact
of their new research works (Walters, 2006; Boyack & Klavans, 2005; Van Dalen
& Henkens, 2005; Peters & Van Raan, 1994). Authors’ publication counts,
citations, prizes and also the prestige of their department, institution or country can
also bring attention to authors’ publications (Walters, 2006; Leimu & Koricheva,
2005a; Van Dalen & Henkens, 2005; Cole & Cole, 1967).
A highly cited author tends to remain highly cited according to the Matthew
Effect, based on which, prestigious authors gain increased recognition over time
(Merton, 1968; 1988). The works by more productive and eminent researchers
may also receive more citations (Haslam et al., 2008; Baldi, 1998). For a variety of
reasons, scientists tend to read and then use the works of high prestige and well-
known authors in their fields (Bornmann, Schier, Marx, & Daniel, 2012; Peters &
Van Raan, 1994; Merton, 1968).

22
White (2004) examined the effect of authors’ reputations on the number of
citations they received. The number of citations to the works of very well-known
and also unknown authors was found to be roughly equal and authors with a
middling reputation received the most citations. The results of his study suggest
that citations are given to relevant intellectual content, supporting the normative
view of citations rather than the social constructivist view.
The social prestige of authors in terms of editorial board membership also
associates with higher citation impact to their articles in marketing which is a sub-
field of Social Sciences (Stremersch, Verniers & Verhoef, 2007). An author’s h-
index has a significant correlation with the number of citations to their papers
(Kostoff, 2007). The h-index of publications in the first twelve years has a
significant positive correlation with the number of citations to publications from
the second twelve years (Hirsch, 2007). Articles published by high-impact authors,
measured by the maximum h-index for multi-author publications, received a
higher number of citations in environmental sciences (Vanclay, 2013).
2.5.2.4 Institution and country impact
Many studies have shown that the prestige and reputation of the university or
country that the authors are affiliated with may positively affect their articles’
citation impact (Borry, Schotsmans, & Dierickx, 2006; Leimu & Koricheva,
2005a; Baldi, 1998) and are assumed to be signals calling attention to authors
(Peters & Van Raan, 1994) which may result in higher visibility for their works.
For example, ecological papers affiliated with the high-ranked institutions based

23
on the Shanghai Academic Ranking of World Universities received more citations
(Leimu & Koricheva, 2005a).
The results of a study in a sub-field of Social Sciences, management, found
institution impact to be a significant predictor of increased citations (Judge, Cable,
Colbert & Rynes, 2007). Two micro-studies of management journals also showed
that research from top institutions receives more citations (Mingers & Xu, 2010;
Bergh, Perry, & Hanke, 2006). In contrast, one study found institutional impact to
have no effect on the citation impact of papers in social and personality
psychology (Haslam et al., 2008).
Researchers from a particular nation may produce papers with relatively
higher impact (West & McIlwaine, 2002; Campbell, 1990; Greenwald & Shuh,
1994; Peters & Van Raan, 1994; Lancaster, Porta, Plagenz, Szymborski, & Krebs,
1986; Lange, 1985). For example, in ecological journals, UK authors receive more
citations than authors from other European countries (Leimu & Koricheva, 2005a).
Given that the US is the most productive country in the world, it is perhaps
unsurprising that US researchers receive more citations per paper than authors
from other countries (Fava, Guidi, & Sonino, 2004).
Moreover, a journal’s country (i.e., whether the journal publisher is from the
leading countries in the world or not) also affects the citation rates of its articles.
Articles published in the journals of the leading publishing countries (i.e. USA,
UK and Netherlands) are cited more often than articles published in other journals
(Schubert & Michels, 2013), presumably because these countries currently own
the best publishers. In a comparison of Citation per Paper (CpP) to English

24
journals in Physics and Chemistry with that of non-English journals in the same
fields, English journals had a higher CpP (Liang, Rousseau, & Zhong, 2013).
2.5.3 Internationalisation
Science is inherently international (The Royal Society, 2011). Global
scientific problems can lead to a compression of the world so that scholars across
the world cooperate to find solutions (Hakala, 1998). Internationalisation in
science is also reflected in journal internationality, which can be measured by the
geographic dispersion of authors, readers and editorial boards (Calver, Wardell-
Johnson, Bradley, & Taplin, 2010; Yue, 2004; Rey-Rocha & Martín-Sempere,
2004). Journal internationality seems to be important since a number of studies
have shown that in terms of publishing authors, citing authors and editorial boards
the more international the journal, the higher its citation impact (Kim, 2010; Yu,
2004; Zitt & Bassecoulard, 1998). It seems that better journals will tend to be more
international since science is international (with a few exceptions, such as law) and
so it is not surprising that the degree of internationalisation of authors and editorial
boards is a characteristic of journals which moderately correlates with their Impact
Factor (Yue, 2004; Zitt & Bassecoulard, 1998). Hence national journals may not
always make full contributions to mainstream research or may be below
international standards.
In bibliometric studies, article internationality has also been gauged at the
level of references through the geographic dispersion of the cited authors (Watson,
Annells, Amella, & Wong, 2007; Schubert & Glänzel, 2006; Glänzel & Schubert,

25
2005) but this form of internationalisation has not been widely explored and there
is no literature about the influence of this factor on article citation impact.
2.5.3.1 Journal internationality
With respect to journals, the inclusion of a journal in international databases
can be used to classify the journal as international (Rey-Rocha & Martín-Sempere,
1999). Journal internationality has also been measured more deeply based upon the
geographic dispersion of its authors, readers, and editorial boards (Calver,
Wardell-Johnson, Bradley, & Taplin, 2010; Yue, 2004; Rey-Rocha & Martín-
Sempere, 2004; Brice & Bligh, 2004; Wormell, 1998; Christensen & Ingwersen,
1996; Braun & Bujdoso, 1983). International journals are accessible to a wide
range of scholars (Lawrence, 2003) whereas non-English local journals tend to
have more limited audiences (Schönbach, 2006). Whilst scholars may want to
publish in international journals to help find foreign partners, to improve their
writing to an international level, to publish in cheap journals and to help find
sabbatical opportunities in a particular country, the foremost reason is to publish in
high impact journals with global audience (Uzun, 2004).
Since the more international a journal is, the wider its potential readership, a
high citation impact for international journals may be expected. Previous literature
has confirmed a significant positive association between journal internationality
and journal citation impact. Garfield (2003) predicted a higher citation impact for
journals with international boards of editors. A strong positive correlation has been
found between journal internationality (measured in terms of the geographic
dispersion of publishing authors) and journal impact factors in the earth & space

26
and applied biology disciplines (Zitt & Bassecoulard, 1998). Conversely, however,
a study of journals in industrial engineering and another study of ten Chinese
English language journals have found a negative correlation between journal
internationality and journal citation impact (Kao, 2009; Wang, Wang & Weldon,
2007). The Chinese journals did not have a high degree of internationality in terms
of both publishing and citing countries since less than 20% of their publishing and
citing authors were international. Moreover, the Chinese journals had mostly
national titles (such as Chinese Phys or Chinese Phys Lett) that may limit them
from getting global audiences and negatively affect their visibility. The journal
citation impact is however high and hence resulting in the negative association
between journal internationality and journal impact factor in this study (Wang,
Wang & Weldon, 2007). Industrial engineering seems to be relatively
geographically concentrated and the majority of the top journals in this area are
published in few countries, including Taiwan and China. However,
internationalisation is not highly demonstrated in the top industrial engineering
journals, especially the Chinese journals, since they are not well-known at the
global level.
Previous studies have used simple correlation tests to evaluate the relationship
between journal internationality and journal citation impact (Kim, 2010; Kao,
2009; Wang, Wang & Weldon, 2007; Zitt & Bassecoulard, 1998). Only in
neurology has an advanced statistical approach, Structural Equation Modelling
(SEM), been used to evaluate this relationship. Journal internationality was
measured in this study based upon the geographic dispersion of authors and editors
27
and it significantly associated with a higher journal Impact Factor in neurology
(Yue, 2004).
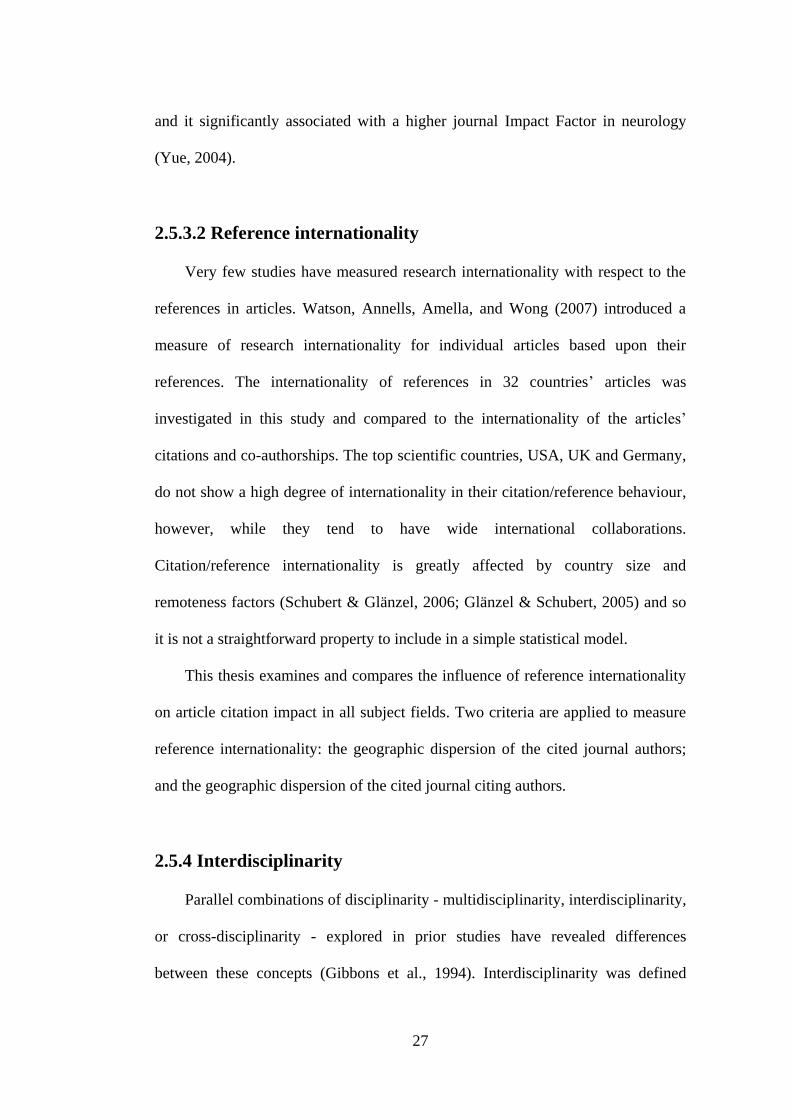
2.5.3.2 Reference internationality
Very few studies have measured research internationality with respect to the
references in articles. Watson, Annells, Amella, and Wong (2007) introduced a
measure of research internationality for individual articles based upon their
references. The internationality of references in 32 countries’ articles was
investigated in this study and compared to the internationality of the articles’
citations and co-authorships. The top scientific countries, USA, UK and Germany,
do not show a high degree of internationality in their citation/reference behaviour,
however, while they tend to have wide international collaborations.
Citation/reference internationality is greatly affected by country size and
remoteness factors (Schubert & Glänzel, 2006; Glänzel & Schubert, 2005) and so
it is not a straightforward property to include in a simple statistical model.
This thesis examines and compares the influence of reference internationality
on article citation impact in all subject fields. Two criteria are applied to measure
reference internationality: the geographic dispersion of the cited journal authors;
and the geographic dispersion of the cited journal citing authors.
2.5.4 Interdisciplinarity
Parallel combinations of disciplinarity - multidisciplinarity, interdisciplinarity,
or cross-disciplinarity - explored in prior studies have revealed differences
between these concepts (Gibbons et al., 1994). Interdisciplinarity was defined
28
through receiving citations from other fields whereas for studies of
multidisciplinarity, different subjects are studied separately from different angles.
Morillo, Bordons and Gómez (2003) suggest that ‘interdisciplinarity’ is an
umbrella term covering all other related concepts, but these terms are probably not
used consistently in the literature. Co-citation, co-word, co-authorship, and
collaboration between subject fields are among the bibliometric methods used to
measure interdisciplinarity.
Bibliometric studies have found positive associations between
interdisciplinary research and citation impact. Publishing in an interdisciplinary
journal may increase the likelihood of citations to articles published in the journal
as they may be read by authors from a variety of subject fields (Peng & Zhu,
2012). For example, interdisciplinary articles in forestry are significantly more
highly cited (Steele & Stier, 2000). In some disciplines, including biology,
medicine, social sciences (health-related subfields), and humanities, more
interdisciplinary papers, measured by the percentage of their references to journals
in other disciplines, significantly correlated with higher citation impact, although
no correlation was found for a combination of all 14 disciplines (Larivière &
Gingras, 2010). In an investigation of journals classified into one subject (‘mono-
disciplinary’ journals) and more than one subject (‘multi-disciplinary’ journals),
Levitt and Thelwall (2008) found that, except for social sciences, papers published
in mono-disciplinary journals are more cited than those in multi-disciplinary
journals. At a micro level, using the same method for measuring journal
interdisciplinarity, Rinia et al. (2001) found no significant correlation between
publishing in interdisciplinary journals and research citation impact. The same

29
result was also found in a study of two UK universities (Adams, Jackson &
Marshall, 2007).
The above studies of the association between research interdisciplinarity and
citation impact have been conducted at different micro and macro levels, using
descriptive statistics and simple correlations. The differences between the findings
may be due to the different subject areas studied, and perhaps also the different
sampling mechanisms.
2.5.5 Article size-related properties
Medical papers with longer abstracts have been found to receive more
citations (Kostoff, 2007) whereas papers with longer titles in psychology seem to
receive fewer citations (Haslam et al., 2008). In contrast, title length, measured by
the number of significant words in the title, does not associate with citations to
articles in marketing (Stremersch, Verniers and Verhoef, 2007). However, the
shorter the title, the higher the number of citations for law reviews (Ayres & Vars,
1999). No macro-studies have considered this factor simultaneously with other
factors, such as abstract length, however.
Longer papers may likely be cited more if they have more content (Vanclay,
2013; Haslam et al., 2008; Lokker, Mckibbon, Mckinlay, Wilczynski, & Haynes,
2008; Hudson, 2007; Kostoff, 2007; Leimu & Koricheva, 2005a; Van Dalen &
Henkens, 2005; Baldi, 1998; Abt, 1993; Stewart, 1983, 1990; Laband, 1990;
Stewart, 1983). A number of micro-studies in different subject areas have
confirmed that the more pages, the higher the number of citations to a paper. In
social and personality psychology, longer papers with more figures and tables are

30
cited more often (Haslam et al., 2008). Perhaps longer papers publish more
original ideas and hence need more extensive and comprehensive explanations.
The same result was found for publications in The Lancet, a leading journal in
general medicine. Longer medical papers receiving more citations have also many
references and this may be another influence (Kostoff, 2007).
Research works with a higher number of references will be cited more (Vieira
& Gomes, 2010; Webster, Jonason, & Schember, 2009; Haslam et al., 2008;
Lokker, Mckibbon, Mckinlay, Wilczynski, & Haynes, 2008; Kostoff, 2007;
Walters, 2006; Peters & Van Raan, 1994; Moed, Burger, Frankfort, & Van Raan,
1985). More citations to works with more references is expected for two reasons:
first, the comprehensiveness of the paper; and second, references make the work
more visible (e.g., via citation-based searching in databases that allow it, such as
Google Scholar and the Web of Science). The “Tit-for-Tat” hypothesis may also
apply here: that authors tend to cite the works of their ex-citers (Webster, Jonason,
& Schember, 2009). In a comparison of four subject areas (Mathematics, Physics,
Chemistry and Biology & Biochemistry), the number of references positively and
very significantly correlates with the number of citations (Vieira & Gomes, 2010).
In chemical engineering, the number of references was found to be a more
significant determinant of citation impact than the recency of the references, as
measured by the Price Index (Peters & Van Raan, 1994). A hot topic paper may
use many recent references and it is assumed that a large number of references,
including many recent ones, will result in more citations to a paper (Haslam et al.,
2008; Douglas, 1992; Stewart, 1983). The Price Index, the percentage of
references to works published in the most recent five years (Price, 1965),

31
associates with the citation scores of publications in a range of natural and life
sciences areas (Moed, 1989), although a weak correlation has been found between
this factor and increased citations to articles in chemical engineering (Peters &
Van Raan, 1994).
The field size in terms of number of publications and authors could influence
the impact of individual papers (Moed, Burger, Frankfort, & Van Raan, 1985).
Articles in smaller fields normally receive fewer citations than those in more
general fields (King, 1987) and for this reason, the citation assessment of
institutions is always related to the average citation impact of the field (Van Raan,
2003). However, it has been found that a large field size will positively correlate
with the impact of its publications only when the publications are characterized by
a large number of references (Lovaglia, 1989).
2.5.6 Document and field type
Papers of different types have different citation rates due to the specific
features of each type. Among all types of papers, reviews are the most cited (Amin
& Mabe, 2000; Peters & Van Raan, 1994). This discrepancy has been
hypothesised to result from the length of the papers involved (Shaw, 1987) but this
hypothesis was rejected by Peters and Van Raan (1994) as they found that review
articles are more cited than normal articles of the same length. Field type, in terms
of Natural Sciences vs. Social Sciences or theoretical sciences vs. applied sciences,
is also a driver of citations (Kulkarni, Busse, & Shams, 2007; Callaham, Wears, &
Weber, 2002; Peters & Van Raan, 1994) and, using articles from the UK Research
Assessment Exercise (RAE) in 2001, the mean citation counts for biomedical
32
articles is about 30, for social science articles 5 and for humanities articles 2
(Mahdi, D’Este, & Neely, 2008).
2.5.7 Article and abstract readability
A strong relationship has not been found between journal readability and
prestige (Shelley & Schuh, 2001; Hartley & Trueman, 1992; Bottle, Rennie, Russ
& Sardar, 1983) nor between article readability and citation impact (Stremersch,
Verniers, & Verhoef, 2007; Hartley, Sotto, & Pennebaker, 2002).
Readability refers to the level of difficulty of the language used to write a text.
Using the Flesch difficulty score, Gazni (2011) found that papers with more
difficult abstracts to read (low Flesch score) were cited more than the papers with
easier abstracts, at least in the five top institutions in the world. It may be that in
the world’s top institutions their high prestige ensures that their more difficult
abstracts seem more impressive, whereas unreadable abstracts may be taken as a
sign of incompetence for researchers at many other institutions. Alternatively,
more difficult abstracts may associate with higher citation areas of study, such as
the more quantitative fields. However, structured abstracts, using different sections
in a way that is known to be more readable (Hartley & Benjamin, 1998) can be of
a higher quality than articles with traditional unstructured abstracts (Taddio et al.,
1994 quoted in Hartley & Sydes, 1997).
It seems that there is not a strong relationship between article readability and
citation impact in three Social Sciences: marketing, psychology and education
science (Stremersch, Verniers, & Verhoef, 2007; Hartley, Sotto, & Pennebaker,
2002; Hartley & Trueman, 1992). Finally, three decades ago, Bottle, Rennie, Russ

33
and Sardar (1983) claimed that the readability of articles was significantly
decreasing, although the reasons for this were not clear and it is not known if this
trend has continued.
Given that the readability of abstracts and their association with research
citation impact has been studied only to a limited degree, larger scale
investigations are needed. This thesis partly addresses this demand.
2.5.8 Research funding
It is widely believed that insufficient funding can lead to shortcomings in
research (Reed et al., 2007). For example, higher citation impact is expected when
funding is provided (Levitt, 2011). A number of studies have claimed an
association between research impact and funding in medical education research
(Reed et al., 2007), library and information science (Zhao, 2010), biomedical
research (Lewison & Dawson, 1998) and Schistosomiasis literature (Pao &
Goffman, 1990), although it may vary across subject domains in a single country
(Jowkar, Didegah, & Gazni, 2011). However, a decade before Zhao (2010), Cronin
and Shaw (1999) did not find an association between research grants and the
citation impact of papers in information science. Research funding also seems not
to be a significant determinant of increased citations in psychology (Haslam et al.,
2008) and so there may be disciplinary differences in the importance of funding.
The researchers in the above studies basically compared the average citations of all
funded research with that of the unfunded research in a single field whereas this
thesis will examine and compare the citation impact of funded vs. unfunded
research at the paper level.

34
2.5.9 Social Networks
The impact of authors’ social networks has been investigated in several
studies (Cronin, 2005; Sandstrom, Wadskog, & Karlsson, 2005; White, 2001;
Mahlck & Persson, 2000). In information science, a positive correlation has been
found between social closeness and citation counts (Johnson & Oppenheim, 2007).
In the same area, a significant correlation has been found between impact of
different measures of centrality in social networks and citation counts for articles
(Yan & Ding, 2009). Social networks could be traced through co-authorship
networks or institutional ties. Scholars may have a higher propensity to cite the
works of people from their institutions since they will be more aware of them and
have easier access to them. Social acquaintances through both co-authorship and
institutional relations may affect the citation impact of individuals who are
involved in the relations. Authors in some fields are inclined to cite the works of
their collaborators and have few citations outside their co-authoring circle
(Wallace, Larivière & Gingras, 2011).
2.5.10 Other factors
Some other potential determinants of article citation impact have also been
investigated, such as characteristics of the research (Peters & Van Raan, 1994),
open access (Vanclay, 2013; Lansingh & Carter, 2009; Eysenbach, 2006;
Antelman, 2004; Lawrence, 2001), methodology type (Patsopoulos, Analatos, &
Ioannidis, 2005; West & McIlwaine, 2002), title type (Jamali & Nikzad, 2011),
number of tables and graphs (Stremersch, Verniers & Verhoef, 2007) and study
35
design and topic (Bornmann, Schier, Marx, & Daniel, 2012; Willis, Bahler,
Neuberger, & Dahm, 2011; Bhandari et al., 2007).
2.6 Metrics for citation motivations and factors
To explore the extrinsic factors for citations related to article properties,
researchers have developed a range of quantitative indicators. The journal Impact
Factor is one of the indicators frequently used to quantify journal prestige
(Bornmann & Daniel, 2007a; Callaham, Wears, & Weber, 2002). Author impact
and reputation is commonly measured by the h-index (Vanclay, 2013; Kostoff,
2007). An author with an index of h has received at least h citations to each of h of
their publications. The h-index has also been used to gauge reference impact
(Bornmann, Schier, Marx, & Daniel, 2012). This index was originally developed
to evaluate individual outputs (Hirsch, 2005) but it has also been implemented for
journal and single publication assessment purposes (Schubert, 2009; Bornmann &
Daniel, 2007b). The prestige of institutional affiliations is mostly measured based
on their ranks in popular academic ranking systems such as Shanghai (Leimu &
Koricheva, 2005a). To quantify the readability of abstracts, the Flesch reading ease
score has been used (Gazni, 2011). Journal internationality has been measured
through the Gini coefficient (Yue, 2004), which is an absolute measure of the
geographic dispersion of authors, readers or editorial boards in a journal. The
measures used to quantify the citation factors are reviewed in more detail and
presented in the following sections. Moreover, the indicators that are not
specifically used in the studies of the citation factors but are customarily used for
the evaluation of article properties are also described below.

36
2.6.1 Journal impact indicators
The Journal Impact Factor (JIF), introduced by Eugene Garfield (2003) and
then published in the Journal Citation Reports (JCR) by the Institute for Scientific
Information (ISI), is the most common indicator for journal significance and
impact. The JIF is defined to be the number of citations in the current year to
journal articles published over the previous two years divided by the number of
articles published in these two years.
Despite the JIF’s flaws (Glänzel & Moed, 2002; Moed, Van Leeuwen, &
Reedijk, 1999; Seglen, 1997), a large number of studies of citation factors have
used the JIF as a proxy for journal impact and prestige. There are many studies on
the JIF’s flaws, and Scientometrics (2012, 92(2)) has devoted an issue to
discussions on the JIF in which a number of papers argue about the factor’s flaws
or introduce alternatives. Flaws in JIF calculations such as limiting the factor to
the citable documents (i.e. articles, notes and reviews), not considering different
citation behaviours across subject domains (Moed & Van Leeuwen, 1995), or the
limitation of considering a single citing year have provoked many discussions
about the factor’s accuracy and led to developing new journal impact measures
such as the Adjusted Impact Factor (AIF) (Asai, 1981) or the Source Normalized
Impact per Paper (SNIP) (Moed, 2010). The AIF addresses the limitation of
considering a single citing year in the JIF calculation and suggests a four-year
period instead of one-year (Asai, 1981). The SNIP is a recent attempt to normalize
the JIF in terms of citation variations across subject fields and is measured by
dividing the average impact per paper in the journal by the journal field citation
potential (Moed, 2010).
37
The JIF’s comprehensibility, availability, and reproducibility (Glänzel &
Moed, 2002) are among its strengths. Comprehensibility refers to the fact that the
JIF gauges the average number of citations that an article published in a given
journal receives in a specific year. The factor is reproducible since one could
readily measure it for any given journal using the frequency of citations and
publications in the journal, although errors made by scholars, indexers and editors
particularly in the articles’ reference list prevents exact reproduction of JIF (Wu,
Fu, & Rousseau, 2008).
2.6.2 Author impact indicators
The number of publications, the raw or average numbers of citations, the
impact of publishing journals or a combination of measures have been used to
gauge an author’s reputation and impact. The h-index is the main current author
impact metric combining quantity and impact into a single figure. Hirsch (2005)
originally suggested this index to quantify an individual’s reputation and impact,
but it has also been used to measure the impact of research groups (Van Raan,
2006), journals (Braun, Glänzel, & Schubert, 2005) and references (Bornmann,
Schier, Marx, & Daniel, 2012).
A number of studies provide insights into the h-index’s disadvantages: its
dependency on the scholar’s research age, so that older scholars have greater h-
indexes than equivalent young scholars; discipline dependency, since citation
patterns vary across subject domains (Bornmann & Daniel, 2007b); and ignoring
the effect of co-authors (Egghe, 2006). But the h-index has many advantages: it is
simple and easy to measure; it is related to other bibiliometric indicators and peer

38
review results and one study claimed it to be a valid measure of an individual’s
impact across different subject domains (Cronin & Meho, 2006; Van Raan, 2006).
2.6.3 Institution and country impact indicators
Bibliometric methods are widely implemented for institutional research
evaluations and citation counts are popularly used as a proxy for research impact.
The h-index can be used for evaluating institutional impact (Van Raan, 2006). A
more sophisticated measure of institutional impact, Mean Normalised Citation
Score (MNCS), has been introduced by the Centre for Science and Technology
Studies (CWTS) of Leiden University and applied in the Leiden ranking of world
universities. MNCS is a combined measure of the normalised citation counts and
the publications of an institution. This score may also be used for country research
impact evaluations (Waltman, et al., 2011).
2.6.4 Journal internationality index
Different criteria may measure journal internationality: multinational
collaboration; the geographic dispersion of the journal authors; the geographic
dispersion of editors and editorial board members (Buela-Casal, Perakakis, Taylor
& Checa, 2006); the geographic dispersion of the journal readers (Perakakis,
Taylor, Buela-Casal, & Checa, 2005; Yue, 2004); language; online and open
access; the word “international” in the journal title; and inclusion in international
databases (Buela-Casal & Zych, 2012). The geographic dispersion of authors
seems to be the foremost measure of internationality (Buela-Casal, Perakakis,
Taylor & Checa, 2006). For a number of psychology journals, the degree of

39
internationality with respect to the geographic diversity of authors has been gauged
through dividing the number of articles with authors from different countries in the
journal by the total number of articles published (Casal, Zych, & Sánchez, 2007).
There are absolute and relative approaches to measure journal internationality.
Relative approaches try to normalize for national size and are complicated to
calculate but absolute approaches can employ indices, such as the Gini coefficient,
that are easily calculated (Zitt & Bassecoulard, 1998). The Gini coefficient,
originally a measure of income inequality, is often used for gauging the geographic
dispersion of journal authors, editorial members, and readers (He & Liu, 2009;
Buela-Casal, Perakakis, Taylor & Checa, 2006).
2.7 Statistical methods in citation factor studies
Various statistical methods have been implemented to examine associations
between citation factors and citation counts for articles. Some studies have just
looked for simple correlations between variables (Leimu & Koricheva, 2005 a&b)
but others have gone further and used different regression models to determine the
main predictors of citation counts. In the case of normally distributed samples,
linear (Borsuk, Budden, Leimu, Aarssen, & Lortie, 2009), multiple (Bornmann,
Schier, Marx, & Daniel, 2012; Haslam et al., 2008; Lokker, Mckibbon, Mckinlay,
Wilczynski, & Haynes, 2008; Peters & Van Raan, 1994), and multivariate
(Bhandari et al., 2007) regressions have been performed. Logistic regression has
also been used (Willis, Bahler, Neuberger, & Dahm, 2011). The ANOVA test has
also been performed to compare the citation means of different groups of entities,
such as journals or study topics (Haslam et al., 2008). The General Linear Model

40
(GLM) has been used to examine the effects of some nominal explanatory
variables such as gender on citation counts. The influence of the first author’s
language and gender and the number of authors on the citations to ecological
articles has been examined using the GLM. Neither the language nor the gender
were good predictors of citations but the number of authors significantly correlated
with increased citations to articles (Borsuk, Budden, Leimu, Aarssen, & Lortie,
2009).
If the outcome variable is count data, count regression models are the logical
choice. In particular, Poisson regression models are suitable for count data
(Walters, 2006). In case of an overdispersed dependent variable, negative binomial
regression is more appropriate. In a study of a single journal in Chemistry, the
number of authors, reference impact, the language of the publishing journal, the
number of highly cited authors, and type of chemical field were modelled to
determine predictors of citation counts. The results of a negative binomial model
showed that all factors except for the number of authors significantly associated
with increased citations (Bornmann, Schier, Marx, & Daniel, 2012), a surprising
result given that the number of authors has been found to be an important factor in
many other studies.
The effect of multiple publications of a single study on the total number of
citations to all publications has been examined. Using a negative binomial model,
the number of articles of a single study together with five other factors, the mean
number of pages and the mean number of authors per article, the mean Impact
Factor of the publishing journals, and two quality assessment factors were
modelled. A significant association was found between the number of articles and

41
mean JIFs with increased citations to biomedical research papers (Bornmann &
Daniel, 2007a). In a study of 12 crime-psychology journals in 2003, nine citation
factors (author, article and journal characteristics) were examined. The citation
data was tested for overdispersion, truncation and also excess zeros, with only
overdispersion appearing. A standard negative binomial model was applied to
resolve the overdispersion. The model revealed that author impact (measured by
the number of citations to the first author publications in 2001-2002) is a better
predictor of citations than journal impact (measured by the number of citation per
journal article in 2000) (Walters, 2006). Recent studies have also used zero-
inflated negative binomial models to overcome excess citation zeros in five
different cases and to identify good predictors of zero citations. Three structural
variation metrics, modularity change rate, cluster linkage, and centrality
divergence, and three common citation factors, number of co-authors, number of
references, and number of pages, were examined in another study for their main
effects on citation counts. The results of a zero-inflated negative binomial model
showed that, among the structural variation metrics, cluster linkage is a good
determinant of citations and the number of co-authors and the number of
references are also good predictors of citation counts to articles (Chen, 2012).

42
CHAPTER 3. PRELIMINARY STUDIES:
Determinants of Research Citation Impact in
Nanoscience and Nanotechnology
3.1 Introduction
This chapter investigates properties of an article as a text document when it is
published to find the determinants that associate with the number of citations to the
article. Knowledge of these factors could be useful to science evaluators to help
them to make early estimates of the number of citations that a set of published
articles is likely to receive. Although the use of citations in research assessment
has been criticised, they have long been the main source of indicators for the
impact of individual articles (Bornmann & Daniel, 2008; Wilson, 1999; Baird &
Oppenheim, 1994; Cole & Cole, 1971). In support of this, previous studies have
found that high quality articles tend to be cited more often (Patterson & Harris,
2009; Lawani, 1986).
Despite the complex nature of citation motivations, some article properties are
known to associate with the citation impact of individual papers. Some factors
result from authors’ intellectual perceptions of an article and these reasons have
been explored through questionnaires or interviews. Owing to the time-consuming
nature of qualitative research and the complex and discipline-dependent nature of
citers’ motives, such qualitative studies usually involve only a small sample of
scholars. Content or context analyses employing semantic content analysis and text
analysis methods are two other approaches to explore citers’ motives. Some other

43
factors influencing citation rates include attributes of the cited paper’s authors,
abstract, journal, field, and references. These factors are sometimes called extrinsic
because they are properties of the article other than its intellectual contribution to
research. Extrinsic factors can be used to predict future citation impact,
particularly when they can be quantified and calculated easily on a large scale (see
below). Extrinsic factors may not directly determine future citation counts, but can
provide indirect evidence of likely future citation impact. In contrast, the rate of
downloading a paper is a factor which can directly contribute to predicting citation
counts but it cannot be gauged at the time of publication and needs a longer time
interval (Chen, 2012). The same is true for using early citations to predict eventual
citations (Levitt & Thelwall, 2011). Although a number of studies have
investigated extrinsic factors in some subject areas, many areas and some factors
have not yet been examined.
Nanoscience and nanotechnology, the focus of this chapter, is a fairly well-
established multidisciplinary field that connects to many other disciplines, such as
physics, chemistry, material sciences, life sciences and electrical engineering
(Huang, Notten, & Rasters, 2011; Porter & Youtie, 2009). The current study aims
to contribute to citation theory and to aid science policy makers by identifying
independent variables for the citation impact of nanoscience and nanotechnology
papers.
As no prior work has explored the extrinsic determinants of future citation
impact in nanoscience and nanotechnology research, the current study fills this gap
by identifying some determinants of citation counts in this important area. In
addition, this study introduces and assesses a new determinant of the citation

44
impact of papers: the internationality of the journal containing the article and the
internationality of the article’s references. Six other common factors associating
with differing citation impact introduced above are examined: journal impact, the
impact of the journals containing the cited references, the number of authors,
institutions, and references and the internationality of the authors. These properties
were chosen as they have been significant determinants of citations in many
previous studies. The research questions are as follows:
- What are the main extrinsic determinants of citation impact for papers in
nanoscience and nanotechnology?
- Do the main determinants of citation impact vary over time?
- Does the degree of internationality of journals and references associate with
increased citations for papers in nanoscience and nanotechnology?
3.2 Methods
We searched for nanoscience and nanotechnology publications in the Web of
Science (WoS), calculated a range of metrics for them and used regression to
determine the significant variables of citation counts.
3.2.1 Collecting data
All nanoscience and nanotechnology publications published in nanoscience and
nanotechnology journals listed in the Journal Citation Reports (JCR) 2007-2009
were retrieved from the Web of Science (WoS). A total of 50,162 publications was
found for this search in the time period 2007-2009. Previous studies have used
various strategies to find documents related to a topic, including simple term

45
searching, keyword searching (searching several terms in the title, abstract and
keywords of documents), subject category searching (Hu & Rousseau, 2013) and
reference searching (Chen, 2012). These strategies are particularly suitable when
no topic has been specifically devoted to the desired subject area in citation
databases. Nanoscience and Nanotechnology is a specific WoS subject category
and in our judgement seemed to give a reasonable coverage. The Thomson
Scientific database (Formerly ISI) was used in preference to other popular citation
databases, including Scopus and Google scholar, since neither Scopus nor Google
scholar contains a specific subject category for nanoscience and nanotechnology.
The time period 2007-2009 was selected to ensure that documents would have had
enough time to be cited but would be recent enough to give relevant findings in
this fast moving area.
3.2.2 Outcome and predictor variables
The outcome or criterion variable in this study is citation counts and the
predictor variables are the internationality, impact and the frequency of various
attributes of the papers (see Table 3.2).
To measure the internationality of journals, the Gini coefficient was calculated.
The internationality of a journal in a year was gauged in terms of geographic
dispersion of authors publishing in the journal in the same year1.
There are absolute and relative approaches to measure the internationality of
journals (Zitt & Bassecoulard, 1998). Relative approaches try to normalize
national size biases and are complicated to gauge (Zitt & Bassecoulard, 1998) but
1 In previous studies, the internationality of journals has been measured in terms of the geographic variety of
their authors, readers, and editorial boards (Brice & Bligh, 2004; Rey-Rocha & Martin-Sempere, 2004; Yue,
2004; Braun & Bujdoso, 1983).

46
absolute approaches can employ indices, such as the Gini diversity coefficient, that
are easily calculated. This study implements the absolute approach with the Gini
coefficient. Scientometricians have borrowed this coefficient from economics to
measure the internationality of journals (He & Liu, 2009; Buela-Casal, Perakakis,
Taylor, & Checa, 2006). This coefficient ranges between 0 and 1; zero is perfect
equality (totally international) whilst 1 is absolute inequality (no internationality).
The Gini coefficient for a journal is as follows, where N is the number of distinct
countries contributing to the journal and, for the ith country, X’i is cumulated
proportion of countries with authors contributing articles to the journal (therefore
X’i, = i/N), Y’i is cumulated proportion of authors publishing in the journal from
countries 1 to i, where the countries are arranged in descending order of the
number of authors contributing to the journal:
| ∑
|
To measure the internationality of references, we gauged the internationality of
the journals of the references. The internationality of a journal was again measured
in terms of the geographic dispersion of the publishing authors. The journal Gini
coefficient was calculated for each reference and an average of the Gini coefficient
for all references was reported for each article in the data set. Figure 3.1 clearly
visualizes the calculation process of the internationality of references.

47
A paperReferences
Geographic dispersion of
authors (Gini coe.)
Is it the last reference?
YesAverage gini
coe. of all references
has
The internationality
of each reference
JournalEach reference has a Authorshas
No
Figure 3.1. Calculation process of the internationality of references
To measure the internationality of authors, the number of country affiliations of
the authors contributing to a paper was calculated.
The journal Impact Factor was used as the indicator of journal impact. To gauge
the impact of the references, the average number of citations to the matched
references of each paper from other WoS papers published from 2000 to 2009 was
calculated. To measure the internationality and impact of references, reference
matching was conducted to find the original documents in a data set of 2000 to
2009. We did not have access to data about references before 2000 so only
references dated between 2000-2009 were analysed. In addition, almost half of the
references were not indexed in WoS. Therefore, a number of references could not
be analysed and they were ignored for references internationality and impact
purposes.
3.2.3 Statistical procedures
To identify the determinants of citation impact, regression models were used
since they can deal with multiple simultaneous and overlapping factors. As the
outcome variable (the number of citations) is count-type data, the Poisson

48
regression model is an appropriate type and is commonly used. The assumption
behind this model is that the outcome variable is discrete count data with a Poisson
distribution. Nevertheless, the Poisson model is deficient for overdispersed
outcome data, where the variance exceeds the mean (Cameron & Trivedi, 2001).
In contrast, negative binomial (NB) regression is a method that may be used where
the variance of the outcome data is greater than its mean. Moreover, the zero
inflated negative binomial regression (ZINB) controls for both overdispersion and
excess of zeros in the dependent variable (Hilbe, 2007; Long, 1997). The Vuong
test can be used to compare the ZINB model with the NB model to show which
model fits the data best. When the z-value is significant, the Vuong test suggests
using the zero-inflated model rather than the standard NB model (Vuong, 1989).
The dataset used here was found to be overdispersed relative to a Poisson
distribution. Moreover, the dataset suffers from an excess of zeros, so the zero-
inflated model was used and all eight variables were included in the model. The
Vuong test confirmed that the zero-inflated model was a significant improvement
on the standard NB model. The results of the ZINB model comprise two parts: the
count model (NB model) and the logit model for predicting excess zeros. The
analysis of the citation factors was conducted in four time periods (2007-2009
separately and accumulated). To examine the ZINB model for the entire three
years, publication year has been included in the model as a logarithmically
transformed year of publication.

49
3.3 Results
The determinants of citation impact for publications in nanoscience and
nanotechnology were examined in 2007, 2008 and 2009 separately and also for the
three years together.
Table 3.3 reports the ZINB model for the effect of predictor variables on
citation outcomes in 2007. The ZINB model not only identifies variables that are
significant in predicting future citations but also identifies the relative contribution
of each predictor variable to the citation counts of papers. The ZINB model
assumes two latent groups in the data: a “not always zero” group and “always
zero” group. Essentially, for the citation model, the always zero group is a set of
articles that is predicted to have zero citations, whereas the not always zero group
is a set of articles (the remainder) with citations that conform to a negative
binomial regression model, in which some will be predicted to receive zero
citations and some will be predicted to receive more citations. The first step of the
ZINB model identifies the variables that help to predict the number of citations
that an article will receive and also the relative contribution of each variable to the
number of citations while all other variables are kept constant. The second step of
the model estimates how many additional articles will have zero citations based on
the first model. Factors in Tables 3.3 to 3.6 are ranked in decreasing order of
%StdX. The results of the first step show that in 2007 the journal Impact Factor
and journal internationality were significant determinants of citations given to
nanoscience and nanotechnology publications. In addition, references also
associate with the citation counts of papers: impact and frequency all significantly
associated with the number of citations.

50
%StdX assesses the percentage change in the value of the dependent variable
for a change in one standard deviation in the value of the independent variable. A
positive or negative sign for %StdX implies that the higher values of the
independent variable associate with increased and decreased citations,
respectively. Keeping all other variables constant, the percentage change in the
exponent of the x-standardized coefficient for the Impact Factor and journal
internationality implies that a one standard deviation increase in the Impact Factor
associates with a 39.1% increase and a one standard deviation increase in the Gini
coefficient associates with 11% decrease in citations to papers in 2007. Moreover,
a one standard deviation increase in the impact of references associates with a 34%
increase in the number of citations. The number of authors, number of institutions
and internationality of authors had less effect in comparison with the other
significant variables. The second step of the model determines the factors that
associate with zeros or the situation of no citations. As shown in Table 3.3, the
internationality of the references and the journal internationality significantly
associate with increased zero citations showing that articles published in less
international journals and with less international references are more likely to
remain uncited. The number of authors also associates with increased zero
citations while it significantly associated with increased citation counts.
The results for 2008 show that the author internationality (i.e., the degree of
international collaboration) and number of authors were not found to be significant
determinants of citation counts (p-value> 0.05). The journal Impact Factor and the
impact of references are significant determinants of citations given to nanoscience
and nanotechnology publications in 2008. The number of institutions and the

51
number of references are two other factors that contribute to increased citations to
publications. Articles published in more international journals and with more
international references receive fewer citations. The percentage change in the
exponent of the x-standardized coefficient (%StdX) for Impact Factor implies that
a one standard deviation increase in the Impact Factor predicted a 52.7% increase
in citations to papers and a one standard deviation increase in the impact of
references predicted a 35% increase in the number of citations. The second step of
the model determines that articles published in more international journals
associated with less zero citations to publications (i.e., a larger always 0 group)
(%StdX= 32.1%) but a decreased citation count (%StdX= 17.1% for the not
always 0 group) (Table 3.4), which is opposing evidence and so the overall
significance of journal internationality in this year is unclear.
In 2009, author internationality, journal internationality and number of authors
are not significant determinants of citation counts of publications in nanoscience
and nanotechnology (p-value> 0.05). Similar to the results of 2007 and 2008, the
journal Impact Factor and impact of references have significant effects in the
ZINB model. A one standard deviation increase in the journal Impact Factor and
impact of references contributed to a 59.2% and 29.2% increase in citation counts
of publications respectively, if the other variables were held constant (Table 3.5).
In the whole three years of publications in nanoscience and nanotechnology, the
number of authors is not a significant determinant of citation counts (p-value>
0.05) but the other seven factors contributed to increased or decreased rates of
citations given to publications. The journal Impact Factor, the journal
internationality and the impact of references associate with increased citation
52
counts more strongly. The number of references associates with a 19.2% increase
in citations whereas more international references are likely to see a 17.3%
decrease in citations. However, articles with more international references or that
are published in more international journals are less likely to remain uncited. The
overall results are summarised in Table 3.7 in terms of significant associations
rather than association strengths.
3.4 Discussion and conclusions
For nanoscience and nanotechnology publications in all three years both
separately and cumulatively, the journal Impact Factor and the impact of
references are the most important factors associating with citations of publications.
Prestigious journals presumably receive increased attention due to a perception
that they contain higher quality content. This agrees with a number of studies
which also found that journal impact is the most important determinant of citations
in a range of other scientific fields (Bornmann & Daniel, 2007; Kulkarni, Busse, &
Shams, 2007; Boyack & Klavans, 2005; Callaham, Wears, & Weber, 2002).
Also in agreement with previous studies (Bornmann, Schier, Marx, & Daniel,
2012; Lancho-Barrantes, Guerrero-Bote, & Moya-Anegon, 2010; Boyack &
Klavans, 2005), the impact of references also significantly associated with an
increased number of citations to publications in nanoscience and nanotechnology.
Hence nanoscience and nanotechnology articles citing high-impact works tend to
be more cited. Two possible explanations for this are that papers with high impact
references are citing more important works and tackling more significant

53
problems, or that papers with high impact references are in subfields with high
citation norms.
A higher number of references also correlated with higher citation counts in all
three years. A higher number of citations to works with more references is
expected for two reasons: first, the comprehensiveness of the paper; and second,
the large size of the related field since the size of the field may affect the impact of
single papers (Moed, Burger, Frankfort, & Van Raan, 1985). Moreover, it has been
found that a large field size will positively correlate with the impact of its
publications only when the publications are characterized by a large number of
references (Lovaglia, 1989).
Another feature of references - internationality - is not a significant factor of
increased citation counts in each year and during the entire time period.
The internationality of the publishing journal has previously been found to
moderately correlate with the journal Impact Factor (Yue, 2004; Zitt &
Bassecoulard, 1998) and contributed to increased citations to the individual papers
in nanoscience and nanotechnology in the full three years; this factor contributes to
a decrease in citations to publications in 2008. Journal internationality gauges how
globally widespread the journal is. Therefore, international journals in terms of
their authors are expected to complement the Impact Factor and positively
influence the citation impact of the related paper and our findings confirm this
hypothesis, although not in 2008. It seems possible that some national journals in
nanoscience and nanotechnology in these two years, perhaps mainly in the USA,
are relatively prestigious and help articles to attract citations.

54
The number of institutions collaborating to produce a paper also slightly
associates with an increased rate of citations to publications in each year separately
and in the entire examined period. A positive correlation between this factor and
citations to papers has been reported in previous studies (Gazni & Didegah, 2010;
Sooryamoorthy, 2009; Narin & Whitlow, 1990).
Author numbers do not clearly associate with citation counts in any of the
periods studied: the results are only significant in 2007 and in this year they are
contradictory. Author internationality marginally contributes to increased citation
counts in just one year (2007) and overall, perhaps because national collaboration
in the large and research intensive US may be similar in character to international
collaboration in Europe, creating an anomaly in the calculation of internationality.
The value of individual and international team collaboration in science and
technology research has been pointed out by several studies (Gazni & Didegah,
2010; Persson, 2010; Borsuk et al., 2009; Lokker et al., 2008; Kostoff, 2007;
Schmoch and Schubert, 2008; Aksnes, 2003; Glänzel, 2001), but the results of this
study do not concur, so nanoscience and nanotechnology may be different in this
regard.
In conclusion, this study revealed that the impact of the publishing journal and
references are the main extrinsic factors of the citation impact of individual papers
in nanoscience and nanotechnology. The main factors examined in this study had
approximately the same effects on the citation impact of publications in all four
time periods. The impact of the publishing journal and references are fixed
prominent factors in each year and the entire three-year period (2007-2009).
Journal internationality, author numbers and author internationality are three

55
factors whose positions changed in different time periods while the other factors
had approximately the same effect. One new proposed factor, the internationality
of references with respect to journals, did not associate with citation impact and
the results were ambiguous. The other proposed factor, the internationality of a
journal with respect to its authors is a significant factor of citation impact in the
full three years. Journal internationality could also be measured with respect to
readers and editors (Yue, 2004; Zitt & Bassecoulard, 1998). In addition, the
internationality of references could be gauged in terms of the geographic
distribution of authors. Therefore, further studies are needed to explore the
relationship between the internationality indicator measured in other ways and the
citation impact of papers in nanoscience and nanotechnology.
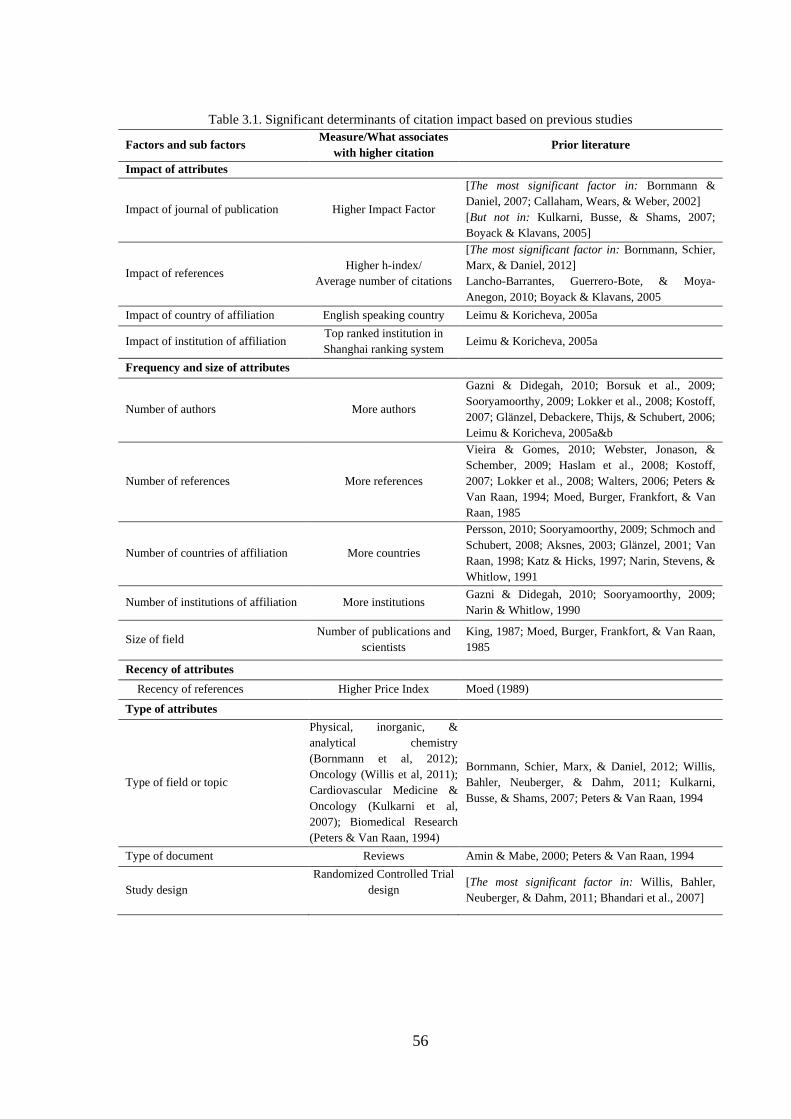
56
Table 3.1. Significant determinants of citation impact based on previous studies
Factors and sub factors Measure/What associates
with higher citation Prior literature
Impact of attributes
Impact of journal of publication Higher Impact Factor
[The most significant factor in: Bornmann &
Daniel, 2007; Callaham, Wears, & Weber, 2002]
[But not in: Kulkarni, Busse, & Shams, 2007;
Boyack & Klavans, 2005]
Impact of references Higher h-index/
Average number of citations
[The most significant factor in: Bornmann, Schier,
Marx, & Daniel, 2012]
Lancho-Barrantes, Guerrero-Bote, & Moya-
Anegon, 2010; Boyack & Klavans, 2005
Impact of country of affiliation English speaking country Leimu & Koricheva, 2005a
Impact of institution of affiliation Top ranked institution in
Shanghai ranking system Leimu & Koricheva, 2005a
Frequency and size of attributes
Number of authors More authors
Gazni & Didegah, 2010; Borsuk et al., 2009;
Sooryamoorthy, 2009; Lokker et al., 2008; Kostoff,
2007; Glänzel, Debackere, Thijs, & Schubert, 2006;
Leimu & Koricheva, 2005a&b
Number of references More references
Vieira & Gomes, 2010; Webster, Jonason, &
Schember, 2009; Haslam et al., 2008; Kostoff,
2007; Lokker et al., 2008; Walters, 2006; Peters &
Van Raan, 1994; Moed, Burger, Frankfort, & Van
Raan, 1985
Number of countries of affiliation More countries
Persson, 2010; Sooryamoorthy, 2009; Schmoch and
Schubert, 2008; Aksnes, 2003; Glänzel, 2001; Van
Raan, 1998; Katz & Hicks, 1997; Narin, Stevens, &
Whitlow, 1991
Number of institutions of affiliation More institutions Gazni & Didegah, 2010; Sooryamoorthy, 2009;
Narin & Whitlow, 1990
Size of field Number of publications and
scientists
King, 1987; Moed, Burger, Frankfort, & Van Raan,
1985
Recency of attributes
Recency of references Higher Price Index Moed (1989)
Type of attributes
Type of field or topic
Physical, inorganic, &
analytical chemistry
(Bornmann et al, 2012);
Oncology (Willis et al, 2011);
Cardiovascular Medicine &
Oncology (Kulkarni et al,
2007); Biomedical Research
(Peters & Van Raan, 1994)
Bornmann, Schier, Marx, & Daniel, 2012; Willis,
Bahler, Neuberger, & Dahm, 2011; Kulkarni,
Busse, & Shams, 2007; Peters & Van Raan, 1994
Type of document Reviews Amin & Mabe, 2000; Peters & Van Raan, 1994
Study design
Randomized Controlled Trial
design
[The most significant factor in: Willis, Bahler,
Neuberger, & Dahm, 2011; Bhandari et al., 2007]

57
Table 3.2. Dependent and independent variables
Variables Measure
Dependent variable
Citation count
Independent variables
Internationality of properties
Internationality of authors No. of countries of affiliation
Internationality of publishing journal Geographic dispersion of
publishing authors using Gini coe.
Internationality of references
Geographic dispersion of
publishing authors of the journals
of the references using Gini coe.
Impact of properties
Impact of publishing journal Impact Factor (IF)
Impact of references An average of number of
citations to the cited references
Number of properties
Number of authors -
Number of institutions -
Number of references -
Table 3.3. The results of the ZINB model for publications in 2007*
Count model: Factor and percentage change in expected count for the not always 0 group.
Factor (X) b z p e^b e^bStdX %StdX SDofX
Journal Impact Factor 0.108 44.316 0.000 1.115 1.391 39.1 3.044
Impact of references 0.002 26.561 0.000 1.002 1.34 34 158.46
No. of references 0.007 15.54 0.000 1.008 1.188 18.8 23.11
Journal internationality 1.217 13.104 0.000 0.296 0.893 10.7 0.093
No. of authors 0.004 3.329 0.001 1.004 1.059 5.9 13.009
No. of institutions 0.025 4.322 0.000 1.025 1.059 5.9 2.343
Internationality of authors 0.053 4.436 0.000 0.949 0.949 5.1 0.996
Internationality of references -1.32 -17.293 0.000 3.743 1.182 -18.2 0.127
Logit model: Factor and percentage change in odds of being in the always 0 group
No. of authors 0.019 2.651 0.008 1.019 1.279 27.9 13.009
Internationality of authors -0.216 -1.844 0.065 0.806 0.807 -19.4 0.996
Journal internationality -1.987 -3.241 0.001 7.291 1.202 -20.2 0.093
Internationality of references -2.154 -3.999 0.000 8.62 1.313 -31.3 0.127
No. of institutions -0.171 -3.884 0.000 0.843 0.67 -33 2.343
Journal Impact Factor -0.178 -3.447 0.001 0.837 0.581 -41.9 3.044
No. of references -0.086 -6.527 0.000 0.917 0.136 -86.4 23.11
Impact of references -0.118 -5.542 0.000 0.889 0.000 -100 158.46
Vuong Test = 10.51 (p=0.000) favouring ZINB over NB
*b=unstandardized coefficient; z=Z-score for test of b=0; p=significance level; e^b=X-
standardized coefficient; e^bStdX=exponent of X-standardized coefficient;
%StdX=percentage change in expected count for 1 SD increase in X; SDofX=standard
deviation of X.

58
Table 3.4. The results of the ZINB model for publications in 2008
Count model: Factor and percentage change in expected count for the not always 0 group.
Factor (X) b z p e^b e^bStdX %StdX SDofX
Journal Impact Factor 0.142 48.479 0.000 1.152 1.527 52.7 2.976
Impact of references 0.001 30.241 0.000 1.001 1.349 35 169.27
No. of references 0.005 12.255 0.000 1.005 1.126 12.6 22.481
No. of institutions 0.04 7.163 0.000 1.041 1.098 9.9 2.306
Internationality of authors -0.013 -1.155 0.248 0.986 0.986 -1.3 0.997
No. of authors -0.002 -1.757 0.079 0.997 0.97 -2.9 12.838
Internationality of references -0.494 -6.097 0.000 1.639 1.062 -6.3 0.123
Journal internationality -1.427 -18.705 0.000 4.167 1.171 -17.1 0.11
Logit model: Factor and percentage change in odds of being in the always 0 group
No. of authors 0.005 0.597 0.55 1.005 1.074 7.4 12.838
Internationality of references 0.396 0.82 0.412 0.672 0.952 4.8 0.123
Internationality of authors 0.011 0.131 0.896 1.011 1.011 1.2 0.997
No. of institutions -0.078 -1.94 0.052 0.924 0.835 -16.5 2.306
Journal internationality -2.516 -5.86 0.000 12.385 1.321 -32.1 0.11
Impact of references -0.006 -2.196 0.028 0.99 0.36 -64 169.27
No. of references -0.084 -9.004 0.000 0.919 0.15 -85 22.481
Journal Impact Factor -1.296 -12.96 0.000 0.273 0.021 -97.9 2.976
Vuong Test = 13.30 (p=0.000) favouring ZINB over NB
Table 3.5. The results of the ZINB model for publications in 2009
Count model: Factor and percentage change in expected count for the not always 0 group.
Factor (X) b z p e^b e^bStdX %StdX SDofX
Journal Impact Factor 0.133 37.039 0.000 1.142 1.592 59.2 3.501
Impact of references 0.001 23.849 0.000 1.001 1.293 29.2 214.723
No. of references 0.005 10.317 0.000 1.005 1.121 12.1 23.735
No. of institutions 0.024 3.981 0.000 1.025 1.061 6.1 2.436
Journal internationality -0.006 -0.068 0.946 1.006 1.001 -0.1 0.112
No. of authors 0 -0.141 0.888 1 0.998 -0.3 13.694
Internationality of authors -0.008 -0.635 0.525 0.992 0.992 -0.8 1.021
Internationality of references -1.019 -10.287 0.000 2.77 1.137 -13.7 0.126
Logit model: Factor and percentage change in odds of being in the always 0 group
No. of authors 0.016 1.184 0.236 1.016 1.241 24.1 13.694
Internationality of references 0.028 0.056 0.956 0.972 0.996 0.4 0.126
Internationality of authors -0.029 -0.301 0.764 0.972 0.971 -2.9 1.021
Journal internationality -0.791 -1.566 0.117 2.205 1.093 -9.3 0.112
No. of institutions -0.16 -3.32 0.001 0.852 0.678 -32.2 2.436
No. of references -0.03 -4.248 0.000 0.971 0.494 -50.6 23.735
Journal Impact Factor -0.634 -10.43 0.000 0.53 0.109 -89.1 3.501
Impact of references -0.017 -4.353 0.000 0.983 0.027 -97.3 214.723
Vuong Test = 10.86 (p=0.000) favouring ZINB over NB

59
Table 3.6. The results of the ZINB model for publications in 2007-2009
Count model: Factor and percentage change in expected count for the not always 0 group.
Factor (X) b z p e^b e^bStdX %StdX SDofX
Journal Impact Factor 0.103 58.706 0.000 1.109 1.395 39.5 3.221
Impact of references 0.001 31.9 0.000 1.0013 1.265 26.5 185.093
No. of references 0.007 23.595 0.000 1.0076 1.191 19.2 23.144
No. of institutions 0.028 7.304 0.000 1.0286 1.069 6.9 2.365
Journal internationality 0.231 4.021 0.000 0.793 0.975 2.4 0.106
No. of authors 0.001 1.334 0.182 1.0012 1.015 1.5 13.208
Internationality of authors -0.037 -4.637 0.000 0.9633 0.963 -3.7 1.005
Internationality of references -1.275 -23.189 0.000 3.5811 1.173 -17.3 0.125
Logit model: Factor and percentage change in odds of being in the always 0 group
No. of authors 0.007 1.488 0.137 1.007 1.1 10.9 13.208
Internationality of authors -0.028 -0.434 0.664 0.971 0.971 -2.9 1.005
Internationality of references -1.332 -4.000 0.000 3.792 1.181 -11.2 0.125
Journal internationality -1.674 -5.146 0.000 5.338 1.195 -19.6 0.106
No. of institutions -0.147 -5.24 0.000 0.862 0.705 -29.5 2.365
Journal Impact Factor -0.511 -8.583 0.000 0.599 0.192 -80.8 3.221
No. of references -0.083 -11.43 0.000 0.919 0.144 -85.5 23.144
Impact of references -0.039 -5.492 0.000 0.961 0.0007 -99.9 185.093
Vuong Test = 16.86 (p=0.000) favouring ZINB over NB
Table 3.7. Summary of the results of the ZINB model for all time intervals examined
Subject to the more detailed explanations below, + indicates higher overall citations associated with
the factor and – associates with lower overall citations being associated with the factor.
Factor (X)* 2007 2008 2009 2007-2009
Journal Impact Factor ++ ++ ++ ++
Impact of references ++ ++ ++ ++
No. of references ++ ++ ++ ++
Internationality of references +- +. +. +-
No. of institutions ++ +. ++ ++
No. of authors +- .. .. ..
Journal internationality -- +- .. --
Internationality of authors -. .. .. -.
*+ on the left indicates that higher citation counts are associated with higher X values; a + on the right
indicates fewer members of the always zero group are associated with higher X values.
– indicates the opposite of + in both cases
. indicates that the association is not significant

60
CHAPTER 4. RESEARCH QUESTIONS
4.1 Introduction
This thesis aims to fill three knowledge gaps in the literature: first, there is a
lack of consensus on the influence of citation factors since different studies have
reached different conclusions on the effect of a specific factor; second, the
literature is silent on the extent to which many of the factors determine the impact;
and lastly, most literature on the influence of factors considered them separately
and mostly within a single field. In respect of the last point, there is a particular
problem with overlapping factors, such as collaboration and internationality. For
example, more international papers tend to have more authors so if international
research is more cited is this because it is international or because it has more
authors (and vice versa)? Therefore, this study seeks to simultaneously analyse
several citation factors in 22 different subject categories and 4 broad areas of
science. It goes further than seeking simple correlations between the factors and
citation counts by providing evidence of the extent to which these factors associate
with increased or decreased citations for a unit change and also percentage change
between lower and upper quartiles in the citation factors. In addition, this study
introduces and assesses two new determinants of the citation impact of papers: the
internationality of the publishing journal and the internationality of the article’s
references.
Bearing in mind the limitations of previous studies and the gaps in the area,
this study will provide a first wide overview of effective extrinsic citation factors
across all subject domains.
61
4.2 Research Questions
This study seeks to answer the following research questions:
1. Which types of research collaboration (individual, institutional and
international) associate with increased citation impact?
2. Do author, institution and country impact associate with increased citation
impact?
3. Do journal and reference characteristics (journal impact and
internationality, reference impact and internationality, and total references)
associate with increased citation impact?
4. Which field size and article size attributes (article, abstract, and title length)
associate with increased citation impact?
5. Do articles with more readable abstracts receive more citations?
6. Do funded articles receive more citations than unfunded articles?
7. To what extent do the above factors associate with increased citation
counts?
Although a great deal of previous research has examined extrinsic factors of
citations, no previous study has analysed many factors for a large number of fields.
Most studies have examined only a single field and many fields have remained
unexamined; given that the citation behaviour of researchers varies across different
subject domains, the extrinsic factors of citations may also vary. In addition, only a
few factors have been tested in each work and no comprehensive study exists to
identify the effects of a large number of factors and their interrelationships on a
large scale dataset. However, a few factors are not examined in this study, such as
document type and field type. These factors are not considered in this research

62
since first, only two types of documents, articles and conference proceedings, are
used in this study and these are arguably the most important kind. Adding other
types of document would add additional complications to the models generated
without giving substantial extra information. Second, measuring and quantifying
field type was not practical for this large-scale study. Social networks were also
not examined in the current study. Analysis of co-authorship or institutional
networks at the author level was also impractical for this large scale study and
would in any case add substantial complications to the analysis with probably little
value in the results. Another limitation is that this study is limited to single
indicators for each factor rather than testing a range of indicators for each one. For
instance, while there are some other factors for measuring journal impact that do
not have some JIF limitations (such as the SNIP factor which does not suffer from
a lack of subject field normalization) only JIF was chosen for this study. But factor
accessibility is the main reason that the current study uses the JIF to measure
journal impact and prestige. Annual updates of JIF publishing by JCR made it
easily accessible for such a large scale study whereas in case of choosing any other
factors, they could not be readily accessible for the study time duration, 2000-
2009. In addition, the JIF is a natural choice because the citation counts used in the
model are also not field normalised. To measure journal internationality, there are
absolute and relative measures of diversity. This study uses the absolute approach
using the Gini coefficient since the absolute approach is more transparent whereas
normalization options using country academic size are needed to calculate relative
indices. The Gini coefficient is used to represent the geographic distribution of a
journal’s authors.

63
CHAPTER 5. METHODS
5.1 Introduction
The methods for collecting data and the sources used are outlined in this
section. Assigning a unique subject field to each article was essential since the
main objective of this research is to draw comparisons across subject domains in
terms of citation factors. The way of categorizing articles under unique subject
fields is therefore explained. Moreover, the analysis process for each factor is also
described. Finally, the statistical model applied to examine citation factors is also
introduced and described.
5.2 Data collection
The publications selected for this study were taken from Thomson Reuters’
Web of Science (WoS). WoS provides access to several well-established citation
databases such as the Science Citation Index, the Social Sciences Citation Index
and the Arts and Humanities Citation Index. These databases index influential
journals from all scientific fields since 1900. In addition to WoS, Thomson
Reuters provides access to two other databases that are used for some parts of this
research: Journal Citation Reports (JCR) and Essential Science Indicators (ESI).
JCR covers the most important science and social sciences journals and includes
the Journal Impact Factor (JIF) to compare journals and is used to quantify journal
prestige in the current study.
ESI lists influential authors, publications, institutions and countries using
publication and citation data from the citation databases. This tool uses a subject

64
classification of 22 fields to present its analytical results and this is used in the
current study for comparisons across different subject domains. Moreover, ESI
provides a baseline table based on the average citation rates in the 22 fields. These
average citation rates are used to calculate indicators of institution and country
impact used in this research.
In a pool of articles and conference proceedings, as defined in WoS, samples
in the 22 ESI fields from 2000 to 2009 were selected from the three citation
databases. The sample size was calculated for each field separately. Articles in
each field were published from 2000 to 2009. The sample of each field was taken
from each year in proportion to the number of articles in each year using a random
sampling (See Table 5.1 for the number of publications in each field) and was
stored in a database for automatic analyses. Research funding for the 2009 sample
data in the four broad areas of science was also extracted (See Table 5.2 for the
mapping of 22 subject categories to 4 broad areas). The reason why only the 2009
sample data is considered for examining research funding is explained in section
5.4.6.

65
Table 5.1. The sample size in the 22 ESI subject categories (2000-2009)
Subject category Total
articles
Sample
Size
Sample
(%)
Agricultural Sciences 235,931 15,488 6.56
Biology & Biochemistry 292,916 15,689 5.36
Chemistry 1,154,906 16,342 1.42
Clinical Medicine 1,430,268 16,387 1.15
Computer Science 295,996 15,698 5.30
Economics & Business 156,281 14,987 9.59
Engineering 513,914 16,059 3.12
Environment/Ecology 249,050 15,542 6.24
Geosciences 240,293 15,507 6.45
Immunology 169,999 15,104 8.88
Materials Science 393,589 15,907 4.04
Mathematics 256,315 15,570 6.07
Microbiology 191,237 15,254 7.98
Molecular Biology & Genetics 550,142 16,092 2.93
Multidisciplinary 101,427 14,248 14.05
Neuroscience & Behaviour 358,827 15,845 4.42
Pharmacology & Toxicology 110,321 14,411 13.06
Physics 719,271 16,203 2.25
Plant & Animal Science 370,928 15,867 4.28
Psychiatry/Psychology 124,988 14,636 11.71
Social Sciences, General 554,855 16,096 2.90
Space Science 123,421 14,614 11.84
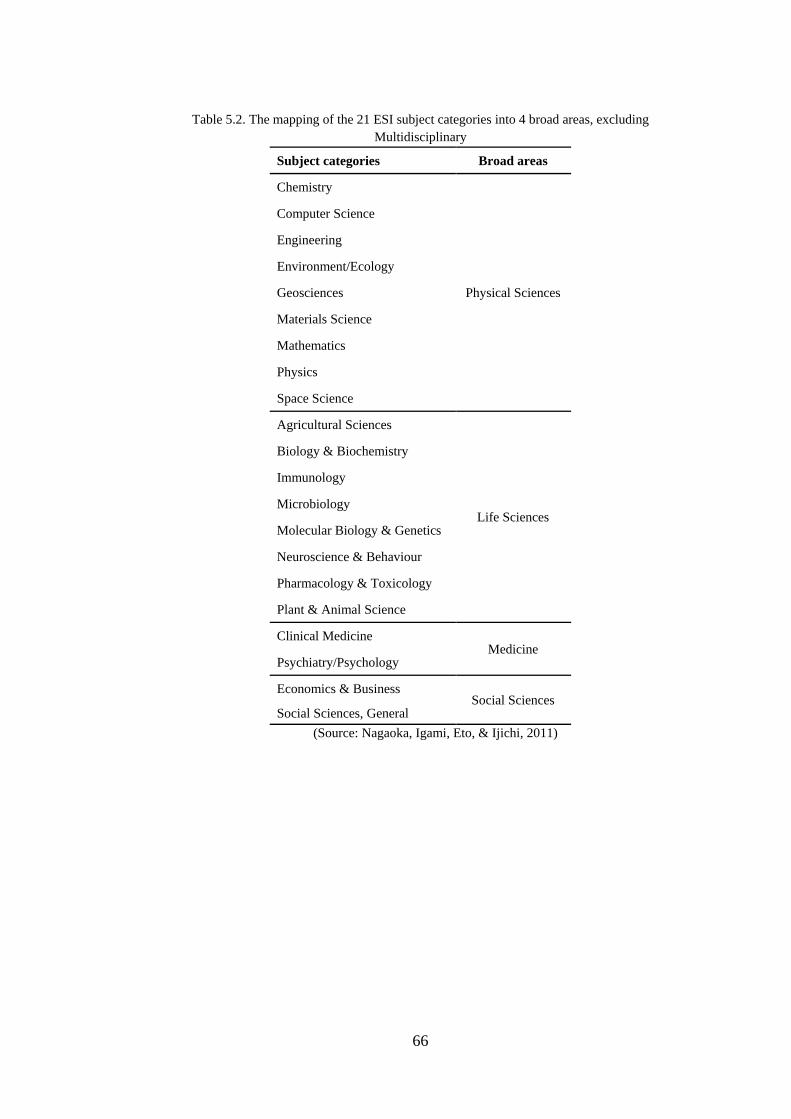
66
Table 5.2. The mapping of the 21 ESI subject categories into 4 broad areas, excluding
Multidisciplinary
Subject categories Broad areas
Chemistry
Physical Sciences
Computer Science
Engineering
Environment/Ecology
Geosciences
Materials Science
Mathematics
Physics
Space Science
Agricultural Sciences
Life Sciences
Biology & Biochemistry
Immunology
Microbiology
Molecular Biology & Genetics
Neuroscience & Behaviour
Pharmacology & Toxicology
Plant & Animal Science
Clinical Medicine Medicine
Psychiatry/Psychology
Economics & Business Social Sciences
Social Sciences, General
(Source: Nagaoka, Igami, Eto, & Ijichi, 2011)

67
5.3 Assigning a subject field to each article
ScienceWatch2 from Thomson Reuters contains a list of JCR journals. These
journals have been classified into the 22 ESI subject fields and each journal and
hence each article in the dataset is categorized under a single subject field. The
JCR journals were matched with the ScienceWatch journal list based on their
abbreviated titles. The subject classification is journal-based but it is well-
established and provides the possibility to assign a single subject to individual
articles in the dataset. The same method of subject assignment to the journals
using ScienceWatch has been used in previous scientometric studies (Schubert &
Michels, 2013).
The 21 subject categories (without Multidisciplinary) were mapped into 4
broad areas (Nagaoka, Igami, Eto, & Ijichi, 2011): Physical Sciences (16,960
articles in 2009), Life Sciences (10,385 articles in 2009), Clinical Medicine (3,677
articles in 2009) and Social Sciences (3,953 articles in 2009).
To distinguish between the 22 subject fields and the 4 broad areas, the 22
areas are called ‘subject categories’ and the 4 broad areas are called ‘broad areas’
from this point forward.
5.4 Variables and measurements
The dependent variable is the citation counts for papers and the independent
variables are: journal and reference internationality; author, institution, country,
reference and journal impacts; individual, institutional and international
2 www.ScienceWatch.com

68
collaborations; number of references; article, abstract, and title lengths; field size;
abstract readability and research funding (Table 5.3).
Table 5.3. Independent variables and measures
Main factor Sub-factors Measure
Research collaboration
Individual collaboration Number of authors listed in the WoS AU field
for the article.
Institutional collaboration Number of different institution names listed in
the WoS C1 field for the article.
International collaboration Number of different country names listed in
the WoS C1 field for the article.
Impact of the paper
Impact of author(s) Maximum H-index of the publishing authors
listed in the WoS AU field for the articles.
Impact of publishing journal Journal Impact Factor retrieved from JCR for
the publishing journal in the WoS SO field for
the article.
Impact of references Median citations to references
Impact of institution of affiliation Maximum Mean Normalized Citation Score
(MNCS) of different institution names listed in
the WoS C1 field for the article.
Impact of country of affiliation Maximum Mean Normalized Citation Score
(MNCS) of different country names listed in
the WoS C1 field for the article.
Internationality of the paper
Journal author internationality (J. auth.
internationality) Gini coefficient of the publishing journal in the
WoS SO field for the article.
Journal citing author internationality (J.
citer internationality) Gini coefficient of the publishing journal in the
WoS SO field for the article.
Cited journal author internationality (Ref.
auth. internationality) Average Gini coefficient of the references
listed in the WoS CR field for the article.
Cited journal citing author internationality
(Ref. citer internationality) Average Gini coefficient of the references
listed in the WoS CR field for the article.
Size of the paper
Length of paper Number of pages in the WoS PG field for the
article.
Length of abstract Number of words in the abstract in the WoS
AB field for the article.
Length of title Number of words in the title in the WoS TI
field for the article.
Number of references Number of references listed in the WoS CR
field for the article.
Size of field Number of publications in the related sub-
field; number of authors; number of journals;
number of institutions; number of countries.
Readability of the paper Abstract readability Flesch readability score of the abstract in the
WoS AB field for the article.
Research funding Funded (1) if there is an entry in the WoS FU
field for the article; Unfunded (0) if there is no
entry in the WoS FU field for the article.

69
5.4.1 Internationality factors
Each internationality factor was calculated with two different approaches,
giving four variables: the country dispersion of authors in a journal (hereafter J.
auth. internationality); the country dispersion of citing authors in a journal
(hereafter J. citer internationality); the country dispersion of cited authors in the
journals of the references (hereafter Ref. auth. internationality) and the country
dispersion of citing authors in the journals of the references (hereafter Ref. citer
internationality) (see Figure 5.1). For the calculation of reference internationality
factors, reference matching was conducted to identify the journals of the
references. Some references were not identified since their journals were not
indexed in WoS. Moreover, some papers did not have any references. In total, the
reference internationality factors could not be calculated for 3% of the publications
in the 22 fields.
Previous studies have applied two approaches to measure internationality:
relative and absolute methods. Absolute methods implement diversity indices such
as the Gini diversity coefficient and are easy to calculate since only the
information of the journal itself is needed. Relative methods use normalization
techniques and need aggregated information of the field, speciality and country
academic size to normalize the measurement. To measure the internationality
variables in this study, the Gini coefficient was selected as the most
straightforward approach automatically calculated for each journal in the dataset.
Given that this thesis uses a large scale dataset, normalized approaches requiring
additional information of the journal, subject field and affiliated country are
difficult to measure (Zitt & Bassecoulard, 1998). Hence, absolute measures are

70
intuitively a better choice to measure internationality. The Gini coefficient is a
value between 0 and 1 where the value of 0 represents the highest level of
internationality and the value of 1 represents the least internationality (Buela-
Casal, Perakakis, Taylor & Checa, 2006). The Gini formula is:
| ∑
|
Where:
N = Number of countries contributing to the journal;
Xi = Cumulated proportion of X where X=1/N;
Yi = Cumulated proportion of authors publishing in or citing the journal from
countries 1 to i, where the countries are arranged in descending order of the
number of authors contributing to the journal.
Note: When i=1, and equal zero.
An example of Gini calculation is as follows:
Suppose a journal in which 13 authors from 3 different countries are
publishing their articles. To measure the Gini coefficient for this journal, the
following table is constructed:
Table 5.4. Gini coefficient calculation example
A B
Countries
publishing in
the journal
Number of
authors from
each country
X Y X' Y' X'(i)-X'(i-1) Y'(i)+Y'(i-1) A*B
US 10 0.3331 0.7692 0.3333 0.7694 0.333 0.769 0.256
UK 2 0.333 0.154 0.667 0.923 0.333 1.692 0.564
Canada 1 0.333 0.077 1.000 1.000 0.333 1.923 0.641
SUM 13
1.461
Gini coef. 0.4615
1 1/Total no. of countries (i.e. 1/3= 0.333) 2 No. of authors/Total authors (i.e. 10/13= 0.769) 3 Cumulative distribution of X 4 Cumulative distribution of Y 5 | ∑ | (i.e. |1-1.461|= 0.461)
Journal internationality may vary over years. A journal may be highly
international (publish articles from a wide range of countries) in 2000 but it may

71
not be at that level of internationality in 2009. So, the Gini coefficient was
calculated for each journal in each year from 2000-2009. So, article i published in
journal j in 2009 was assigned the internationality score calculated for journal j in
2009.
Figure 5.1. The calculation process for journal and reference internationality
5.4.2 Impact factors
5.4.2.1 Journal impact
JIFs were retrieved from JCR from 2000 to 2009 and were assigned to each
article based on its publication year. Although there are some criticisms about this
factor, it is a well-established indicator of journal prestige and quality widely used
by academicians around the world (Brody & Foster, 1995; Ohniwaa, Denawaa,
Kudob, Nakamurab, & Takeyasua, 2004; Kurmis & Kurmis, 2006).

72
5.4.2.2 Author impact
The h-index was used for author impacts. As mentioned above, the h-index is
a combined measure of productivity and impact and an index of h for an author
means that the author has received at least h citations to each of h of their
publications (Hirsch, 2005). The h-index is not sensitive to highly cited
publications and ignores the author’s research activity duration. Several
alternatives (e.g., g-index, a-index, m-index, h(2)-index) have been published to
compensate for h-index weaknesses. However, research on the relationship
between alternatives to the h-index shows a high correlation between the h-index
and the later published indices (Ravichandra Rao, 2007; Kosmulski, 2006) and
popular citation databases such as Google Scholar, Thomson Reuters’ Web of
Science and Scopus use the h-index as an indicator of author impact.
In the case of multi-author papers, the maximum h-index of all authors was
used, assuming that the most prestigious author’s contribution to the paper
attracted the most attention to the paper. Vanclay (2013) also measured article
author impact by the maximum h-index of all the authors. The h-index for each
author was calculated based upon the articles in the full data set analysed: WoS
papers from 2000-2009.
In order to accurately calculate h-indexes, author names in the dataset need to
be disambiguated. Previous attempts at author name disambiguation have used
topic similarity (Yang et al., 2008), co-authorship tracing (Kang et al., 2009),
affiliation similarity (Torvik, Weeber, Swanson & Smalheiser, 2005), and self-
citations (McRae-Spencer & Shadbolt, 2006). Using a combination of these
techniques should help to obtain more accurate results.

73
In this study affiliation names and self-citations were used in an attempt to
identify different articles from the same author. Cases with the same author names
and the same affiliations were considered to be a single person. Since there may be
authors with the same full names working for the same institution, one more step
of disambiguation following self-citations was taken through which a self-citation
network was constructed connecting two papers with a reference in one of the
papers citing another paper of the citing author. Using a modularity optimization
clustering algorithm, all papers in the self-citation network were clustered
together. The number and size of the clusters produced by the modularity
optimization clustering algorithm have the maximum modularity property which is
reasonable for author name disambiguation. This method will have a high
precision since the authors are inclined to cite their own previous work rather than
the work of other authors with the same names. But it may fail to cluster the
articles of the authors who do not cite their own works or may incorrectly cluster
the articles of the authors with common names citing the works of other authors
with the same names.
Another problem is that there may be authors writing their names differently
in their different works and are therefore split into different authors.
5.4.2.3 Institution and country impact
Publications were assigned to institutions and countries based on their
authors’ institutional and country affiliations. WoS devotes a specific field (C1) to
the authors’ addresses, including their institutional and country affiliations and
these were used. This field is complete for documents between 2000-2009 as

74
confirmed by Thomson Reuters Technical Support3. The Mean Normalised
Citation Score (MNCS) was used to measure the institution and country impact.
MNCS, or the new crown indicator, was first published and used to rank world
universities by the Centre for Science and Technology Studies (CWTS) of Leiden
University. This indicator is used to measure country impact (Waltman, et al,
2011) using numbers of publications and citations. This indicator has been also
used in the new Research Excellence Framework (REF) in the UK. For multi-
institutional and multinational articles, the maximum MNCS of collaborating
institutions and countries were used with the assumption that the most prestigious
institutions and countries in the article may attract the most attention.
This indicator is normalised by the paper subject field and publication year
and it is defined as follows:
∑
Where:
n= The number of an institution’s or a country’s publications in each year (1
…, n publications);
ci= The number of citations that publication i had received by 2011;
ei= The expected number of citations to publication i based upon its subject
field and publication year, using the ESI baseline table for the 22 subject fields
from 2000-2009.
The MNCS for each institution or country was calculated based upon their
articles in each year. So, for instance, USA has 10 MNCS for each year from 2000
to 2009. For an article from an American author published in 2009, the calculated
MNCS for 2009 is used.
3 ip-science.thomsonreuters.com/techsupport
75
5.4.2.4 Reference impact
To estimate the impact of an article’s references, the median number of
citations from other WoS papers published from 2000 to 2009 to its references was
used. Reference matching was conducted to identify the number of citations to the
references. As also mentioned in section 5.4.1, some references were not identified
since they were not indexed in WoS. In addition, some articles did not have any
references. Reference impact could not be calculated for 3% of the publications in
the 22 fields.
5.4.3 Field size
To measure field size, each article needed to be assigned to a sub-category.
The sub-categories given to the articles in WoS were used for this purpose. The
articles in WoS are categorised under one or several sub-categories and the WC
field in the recent version of WoS contains this information. To prevent replicating
an article under different sub-categories, only the first sub-category given to the
article was used. Field size was calculated by the number of publications, number
of authors, number of journals, number of institutions, and number of countries in
the sub-category. These measures were highly correlated and so only field size in
terms of the number of publications was used in the models. Since the field size in
terms of the number of publications includes big numbers and will result in very
small coefficients in the models such as 0.000002, the number of publications was
multiplied by 10,000 and so our example coefficient becomes 0.02.

76
5.4.4 Title, abstract and article length
The title and abstract lengths were measured in terms of the number of words
and the article length was measured by the number of pages in the article.
5.4.5 Abstract readability
There are numerous formulae to measure the readability of a text but their
validity is still a matter of debate. To prevent readability formula limitations
affecting the results of this study, seven different readability formulae were used:
Kincaid, Automated Readability Index (ARI), Coleman-Liau, Flesch Reading
Ease, Fog Index, Lix, and SMOG Grading. The STYLE program was used to
automatically calculate these scores (Cherry & Vesterman, 1981). There is a
significant correlation between the seven readability scores in all subject
categories (See Table 5.5 for an example of correlations between the scores in one
of the categories). The Flesch Reading Ease Score was used since it seems to be
the most popular measure of readability and also has a high correlation with the
other six scores (r ~0.8). The Flesch Score ranges between 0 and 100 where 0
indicates a text that is the most difficult to read and 100 represents the easiest text
to read.
Table 5.5. The correlation between the seven abstract readability scores in Biology & Biochemistry
Spearman Correlation Kincaid ARI Coleman-
Liau
Flesch
Score
Fog
Index Lix
SMOG-
Grading
Kincaid 1
ARI 0.961 1
Coleman-Liau 0.464 0.522 1
Flesch Score -0.868 -0.819 -0.772 1
Fog Index 0.954 0.909 0.462 -0.849 1
Lix 0.898 0.92 0.571 -0.827 0.88 1
SMOG-Grading 0.948 0.905 0.457 -0.842 0.99 0.874 1

77
5.4.6 Research funding
An article was counted as funded if there is an entry in its WoS funding field.
WoS contains funding acknowledgement data from August 2008 onwards
(Thomson Reuters Technical Support, 2013) and so the funding variable could not
be used in the model for the whole ten years. We ran extra models and included
the funding variable for 2009 data only across the 4 broad areas. All other
variables were also included in the model. The new models including the funding
factor were not run across the 22 subject categories since the 2009 data sample in
the 22 subject categories is small (1000-1800 in the different categories) and this
may affect the results. So, an aggregation of articles into four broad areas was used
instead for research funding.
5.5 Statistical procedures
5.5.1 Count regression models
Count data models provide a statistical framework for analysing count data.
Given that the dependent variable of our study is count data (citation counts), these
types of regression models are the most appropriate. The basic models for count
data are the Poisson and Negative Binomial (NB) distributions. Because of data
overdispersion, the Poisson model, in which the mean and the variance are
assumed to be equal (Cameron & Trivedi, 1998), is not appropriate whereas the
NB model is more appropriate. The data had more zeros than are accounted for by
a NB distribution (i.e., uncited articles) for the NB distribution, however, requiring
additional modifications.

78
Initially, standard, zero-inflated and hurdle negative binomial models were
tested. A standard negative binomial model is frequently used to model
overdispersed data. This model has been used in previous studies of citation
factors (Bornmann, Schier, Marx, & Daniel, 2012; Mingers & Xu, 2010). Zero-
inflated models assume that there are two types of zeros in the data: zeros which
arise from a negative binomial count distribution and zeros which arise from a
“perfect-zero” distribution (Hilbe, 2011). Hurdle models seek to determine the
probability of an observation being positive or zero, and then determine the
parameters of the count distribution for positive observations.
We fitted these three models on the dataset and hurdle models were found to
give the best fit to the data. The assumption behind the hurdle model is that zero
counts and non-zero counts are generated by different underlying processes and
should be modelled separately. With this model, after passing a hurdle in order to
gain positive counts, the positive counts follow a Poisson or NB distribution. The
number of citations to a paper has been previously shown to take a Poisson or
negative binomial distribution after passing the hurdle (Mingers & Burrell, 2006;
Burrell, 2003). The hurdle model is intuitively a good choice because it seems
reasonable to assume that it is a significant hurdle for a paper to receive its first
citation but after this it is more likely to be cited in the future. More citations may
occur because a cited paper is listed higher in information retrieval systems (e.g.,
Google Scholar) or because of the endorsement of a citation reported in such
systems.
A hurdle model has two parts: a count model and a binary model. There are
also different types: for example NB-logit, NB-cloglog (complementary log-log),

79
Poisson-logit and Poisson-cloglog. For the count model, the NB model was the
best fit to the data due to the data overdispersion. The hurdle model was fitted
using both logit and complementary log-log (cloglog) procedures to determine the
estimate of the proportions of the zeros and found to have identical AIC values.
AIC (Akaike Information Criterion) is an indicator of the statistical goodness of fit
and helps to choose between two models. The logit and cloglog models are binary
models for modelling the proportion of zero counts and specify the relationship
between the predictors and the dependent variable. Given that for the purposes of
this research the log odds ratio, Log [P(citations>1)/P(citations=0)], (Hilbe, 2011)
is a more readily interpretable statistic NB-logit hurdle models are used
throughout.
Since the citation counts are not normalized by year of publication, the
publication year was entered into both the logit and negative binomial models to
control for the effect of the publication year.
5.5.2 Multicollinearity
When two independent variables are highly correlated, it is very difficult to
determine which variable affects the dependent variable. This problem is called
multicollinearity. It is difficult to analyse collinear predictor (independent)
variables since their effect on the outcome (dependent) variable may result from
either true associations or spurious correlations.
A popular metric to diagnose multicollinearity is the Variance Inflation Factor
(VIF). The VIF is based on the proportion of variance that a predictor variable
shares with other predictors in the model. However, there is no agreement on

80
which VIF values cause serious multicollinearity and different practitioners
recommend different rules for unacceptable VIF values (O’Brien, 2007). For
example, there are different rules of thumb of 4, 10, 20, and over, based on which
VIFs over 4, 10, 20, or more are said to show severe multicollinearity (Chatterjee,
Hadi, & Price, 2000). With respect to the rule of thumb of 4, when the VIF of an
independent variable exceeds 4, the rule of thumb casts doubt on the results of the
regression model for that independent variable. However, the magnitude of a VIF
value indicating a high level of multicollinearity depends upon the factors studied
as even VIFs over 2.5, indicating a moderate correlation, may be a reason for
concern (O’Brien, 2007).
In small samples, gathering more data may help to reduce collinearity between
variables. Combining the collinear variables into a new variable and regressing the
new variable is also another way of reducing multicollinearity (O’Brien, 2007). A
common remedy to deal with multicollinearity is to drop multicollinear predictors
from the model but this ignores the contributions of the excluded variable on the
dependent variable and may bias the coefficient estimates of the remaining
predictor variables (Greene, 2000). Hence, the exclusion approach should not be
used unless the omitted variable is unlikely to have an effect on the outcome
variable.
The remedies to cure multicollinearity can result in more serious problems in
the analysis; hence, unless strictly necessary, it is best not to manipulate the model
because of the risk of bias in the regression coefficients. Multicollinearity makes
the estimation of coefficients uncertain and less precise but it does not bias the
coefficient estimates (Arceneaux & Huber, 2007).

81
The exclusion approach is not used in this study. All factors are included in
the models and the existence of multicollinearity based on VIF tests is reported in
order to highlight results that may be unreliable.
As it is apparent from Appendix B, there is little multicollinearity in the data,
very few VIF values exceeding 4, and none exceeding 10. Any potential problems
with multicollinearity are discussed when they arise.

82
CHAPTER 6. RESULTS
6.1 Introduction
The empirical results of the hurdle model introduced and described in the
previous chapter are presented in this chapter. First, the results of hurdle models in
the 22 subject categories are presented and then, the results of the models in the 4
broad areas are given. The results of the hurdle model in each subject domain are
presented in two parts: the NB model (positive citation counts) and the logit model
(zero citations). It should be noted that the overdispersion parameters are
significant in all models, further justifying the use of the negative binomial model
(p for alpha< 0.01). The extent to which a factor associates with increased or
decreased citation counts and zero citations per unit increase and between the
lower and upper quartiles in the factors (i.e., the percentage change in the
probability of zero citations or the mean parameter of positive citation counts
when the factor value changes from the 25th
quartile to the 75th
quartile) is
presented in each model. The percentage change from the lower to the upper
quartile is included as a simple way to highlight the effect size of each factor on
the basis that it would often be possible to expect a researcher to be able to modify
a paper to move from the lower to the upper quartile for these parameters.
Tables 6.1-6.26 show interpretations of the results presented in Tables C.1-
C.22 and D.1-D.4. Each table presents information about the significance level, the
association status (decreasing or increasing citations), the extent to which the
factor associates with increased or decreased citations and the unit of change in the
factor according to which citations decrease or increase.
83
6.2 Agricultural Sciences
Eighteen factors are modelled in Agricultural Sciences. The results of the VIF
test do not show any serious multicollinearity (as VIF<4) among the factors
modelled (Table B.1).
With respect to the NB model of Table 6.1, all factors except for abstract length
and abstract readability are significant for positive citation counts. The number of
institutions and title length significantly associate with decreased citation counts
and a unit increase in the number of institutions (i.e., an extra institution) and title
length (i.e., an extra word in the title) associates with 5.3% and 1.2% decreases in
citation counts. Journal author internationality and reference citer internationality
also significantly associate with decreased citation counts (2.9% and 6.7%
decrease of what it was, respectively) showing that articles published in less
international journals received less citations and vice versa. The percentage
increase in citation counts resulting from a unit increase in field size, reference
impact, author impact, and number of references is small (less than 2%) but the
percentage increase in the citation counts for the change between 25th
quartile and
75th
quartiles of each factor is considerable (15%, 30.9%, 30.4%, and 14.2%,
respectively).
With respect to the logit model of Table 6.1, field size, number of countries,
reference citer internationality, abstract length, and abstract readability are not
significant factors for zero citations. Among the other factors, institutional
collaboration, journal author internationality, reference author internationality, and
title length contribute to increased zero citations while the others significantly
associate with decreased zero citations.

84
Table 6.1. Analysis of hurdle model results for Agricultural Sciences.
Logit model Significance Decreasing/Increasing
zero citations
% change in
the
probability of
zero citations
for a unit
increase
% change
between
lower and
upper
quartiles
Unit
Field size Insignificant
No. authors Significant Decreasing -11.4 -38.3 Citations per extra author
No. institutions Significant Increasing 15.5 15.5 Citations per extra institution
No. countries Insignificant
JIF Significant Decreasing -73.2 -49.3 Citations per extra IF
Ref. impact Significant Decreasing -1.5 -49.9 Citations per extra citations
Author impact Insignificant Decreasing -2.6 -41.9 Citations per extra h-index
Institution impact Significant Decreasing -35.8 -30.9 Citations per extra MNCS
Country impact Significant Decreasing -18.2 -52.7 Citations per extra MNCS
J. auth. internationality Significant Increasing 0.9 61.6 Citations per extra GINI
J. citer internationality Significant Decreasing -29.6 -70.7 Citations per extra GINI
Ref. auth. internationality Significant Increasing 67.7 12.2 Citations per extra GINI
Ref. citer internationality Insignificant
No. refs Significant Decreasing -0.6 -12.1 Citations per extra reference
No. pages Significant Decreasing -8.1 -36.6 Citations per extra page
Title Length Significant Increasing 2.0 13.7 Citations per extra word
Abs. length Insignificant
Abs. readability Insignificant
NB model Significance Decreasing/Increasing
citations
% change in
the mean
parameter of
positive
citation
counts for a
unit increase
% change
between
lower and
upper
quartiles
Unit
Field size Significant Increasing 1.7 15.0 Citations per extra paper
No. authors Significant Increasing 2.0 5.8 Citations per extra author
No. institutions Significant Decreasing -5.3 -5.3 Citations per extra institution
No. countries Significant Increasing 5.9 5.9 Citations per extra country
JIF Significant Increasing 47.0 77.8 Citations per extra IF
Ref. impact Significant Increasing 1.0 30.9 Citations per extra citations
Author impact Significant Increasing 1.9 30.4 Citations per extra h-index
Institution impact Significant Increasing 3.9 3.0 Citations per extra MNCS
Country impact Significant Increasing 22.9 13.8 Citations per extra MNCS
J. auth. internationality Significant Decreasing -2.9 -51.5 Citations per extra GINI
J. citer internationality Significant Increasing 58.5 46.8 Citations per extra GINI
Ref. auth. internationality Significant Increasing 62.5 8.2 Citations per extra GINI
Ref. citer internationality Significant Decreasing -6.7 -17.1 Citations per extra GINI
No. refs Significant Increasing 0.7 14.2 Citations per extra reference
No. pages Significant Increasing 2.3 9.1 Citations per extra page
Title Length Significant Decreasing -1.2 -8.1 Citations per extra word
Abs. length Insignificant
Abs. readability Insignificant
85
6.3 Biology & Biochemistry
The VIF test shows that reference citer internationality and reference author
internationality have serious multicollinearity (VIF>4; Table B.2).
With respect to the NB model of Table 6.2, field size and number of pages are
insignificant factors for positive citation counts. The number of institutions,
reference author internationality, title length, and abstract readability associate
with decreased citation counts. A unit increase in the number of institutions, title
length, and abstract readability associates with 4.2%, 0.9% and 0.3% decrease in
the citation counts, respectively. The reference author internationality factor
associates with decreased citation counts and a unit increase in this factor
associates with 8.6% decrease in the citations. A change from the lower quartile to
the upper quartile in the factor results in 19.4% decrease. A unit increase in
reference impact, number of references, and abstract length associates with a less
than 1% increase in the positive citation counts but the change between lower and
upper quartiles results in 32.6%, 12.2% and 9.2% increases, respectively.
With respect to the logit model of Table 6.2, field size, number of institutions,
number of pages, title length, abstract length, and abstract readability are not
significant factors for zero citations. Both journal author internationality and
reference author internationality associate with increased zero citations showing
that articles published in less international journals and also with less international
references are more likely to receive no citations and an increase from the lower
quartile to upper quartile in the factors (less internationality) results in 22.9% and
34.8% increases in the zero citations, respectively.

86
Table 6.2. Analysis of hurdle model results for Biology & Biochemistry.
Logit model Significance Decreasing/Increasing
zero citations
% change in
the probability
of zero
citations for a
unit increase
% change
between
lower and
upper
quartiles
Unit
Field size Insignificant
No. authors Significant Decreasing -9.2 -30.2 Citations per extra author
No. institutions Insignificant
No. countries Significant Decreasing -19.6 -19.6 Citations per extra country
JIF Significant Decreasing -25.0 -80.7 Citations per extra IF
Ref. impact Significant Decreasing -0.2 -12.0 Citations per extra citation
Author impact Significant Decreasing -2.2 -48.6 Citations per extra h-index
Institution impact Significant Decreasing -28.0 -37.9 Citations per extra MNCS
Country impact Significant Decreasing -12.4 -81.2 Citations per extra MNCS
J. auth. internationality Significant Increasing 76.1 22.9 Citations per extra GINI
J. citer internationality Significant Decreasing -28.2 -63.7 Citations per extra GINI
Ref. auth. internationality Significant Increasing 98.2 34.8 Citations per extra GINI
Ref. citer internationality Significant Decreasing -67.7 -48.6 Citations per extra GINI
No. refs Significant Decreasing -0.6 -28.8 Citations per extra reference
No. pages Insignificant
Title Length Insignificant
Abs. length Insignificant
Abs. readability Insignificant
NB model Significance Decreasing/Increasing
citations
% change in
the mean
parameter of
positive
citation counts
for a unit
increase
% change
between
lower and
upper
quartiles
Unit
Field size Insignificant
No. authors Significant Increasing 6.0 19.0 Citations per extra author
No. institutions Significant Decreasing -4.2 -4.1 Citations per extra institution
No. countries Significant Increasing 7.9 7.9 Citations per extra country
JIF Significant Increasing 10.0 30.8 Citations per extra IF
Ref. impact Significant Increasing 0.5 32.6 Citations per extra citations
Author impact Significant Increasing 1.6 33.4 Citations per extra h-index
Institution impact Significant Increasing 1.2 1.5 Citations per extra MNCS
Country impact Significant Increasing 19.9 50.8 Citations per extra MNCS
J. auth. internationality Significant Increasing 71.2 10.3 Citations per extra GINI
J. citer internationality Significant Increasing 43.1 14.3 Citations per extra GINI
Ref. auth. internationality Significant Decreasing -8.6 -19.4 Citations per extra GINI
Ref. citer internationality Significant Increasing 0.1 15.9 Citations per extra GINI
No. refs Significant Increasing 0.5 12.2 Citations per extra reference
No. pages Insignificant
Title Length Significant Decreasing -0.9 -5.3 Citations per extra word
Abs. length Significant Increasing 0.1 9.2 Citations per extra word
Abs. readability Significant Decreasing -0.3 -5.1 Citations per extra Flesch Score
87
6.4 Chemistry
No serious multicollinearity (as VIF<4) was found for the factors in the model
but reference citer internationality and reference author internationality have the
maximum VIFs (3.69 and 3.43, respectively; Table B.3).
With respect to the NB model of Table 6.3, abstract readability is the only
insignificant factor for citations in Chemistry. Field size, number of institutions,
journal author internationality, reference author internationality, and title length
significantly associate with decreased citations. A change between lower and
upper quartiles in field size, number of institutions and title length decreases the
citation counts by 7.7%, 9.1%, and 3.5%, respectively. Moreover, a change from
lower to upper quartile in journal author internationality and reference author
internationality decreases the citation counts by 23.9% and 20.7%, respectively.
With respect to the logit model of Table 6.3, field size, reference impact,
number of pages, title length, abstract length, and abstract readability are not
significant factors for zero citations. All the other factors except for the number of
institutions, journal author internationality, and reference author internationality
significantly associate with decreased zero citations.

88
Table 6.3. Analysis of hurdle model results for Chemistry.
Logit model Significance Decreasing/Increasing
zero citations
% change in
the probability
of zero
citations for a
unit increase
% change
between
lower and
upper
quartiles
Unit
Field size Insignificant
No. authors Significant Decreasing -12.1 -25.6 Citations per extra author
No. institutions Significant Increasing 12.5 12.5 Citations per extra institution
No. countries Significant Decreasing -61.7 -61.7 Citations per extra country
JIF Significant Decreasing -42.8 -26.3 Citations per extra IF
Ref. impact Insignificant
Author impact Significant Decreasing -3.6 -75.1 Citations per extra h-index
Institution impact Significant Decreasing -26.7 -25.7 Citations per extra MNCS
Country impact Significant Decreasing -11.3 -76.1 Citations per extra MNCS
J. auth. internationality Significant Increasing 92.3 28.7 Citations per extra GINI
J. citer internationality Significant Decreasing -36.9 -49.2 Citations per extra GINI
Ref. auth. internationality Significant Increasing 98.2 35.7 Citations per extra GINI
Ref. citer internationality Significant Decreasing -71.3 -25.9 Citations per extra GINI
No. refs Significant Decreasing -0.6 -13.4 Citations per extra reference
No. pages Insignificant
Title Length Insignificant
Abs. length Insignificant
Abs. readability Insignificant
NB model Significance Decreasing/Increasing
citations
% change in
the mean
parameter of
positive
citation counts
for a unit
increase
% change
between
lower and
upper
quartiles
Unit
Field size Significant Decreasing -0.6 -7.7 Citations per extra paper
No. authors Significant Increasing 3.3 6.6 Citations per extra author
No. institutions Significant Decreasing -9.1 -9.1 Citations per extra institution
No. countries Significant Increasing 12.4 12.4 Citations per extra country
JIF Significant Increasing 15.9 40.4 Citations per extra IF
Ref. impact Significant Increasing 0.02 0.8 Citations per extra citations
Author impact Significant Increasing 2.3 44.5 Citations per extra h-index
Institution impact Significant Increasing 2.9 2.1 Citations per extra MNCS
Country impact Significant Increasing 16.9 28.2 Citations per extra MNCS
J. auth. internationality Significant Decreasing -12.6 -23.9 Citations per extra GINI
J. citer internationality Significant Increasing 45.8 36.8 Citations per extra GINI
Ref. auth. internationality Significant Decreasing -7.6 -20.7 Citations per extra GINI
Ref. citer internationality Significant Increasing 78.3 39.2 Citations per extra GINI
No. refs Significant Increasing 0.4 8.8 Citations per extra reference
No. pages Significant Increasing 1.9 10.0 Citations per extra page
Title Length Significant Decreasing -0.6 -3.5 Citations per extra word
Abs. length Significant Increasing 0.1 10.2 Citations per extra word
Abs. readability Insignificant

89
6.5 Clinical Medicine
The results of the VIF test show no excessive multicollinearity among the
factors. The maximum VIFs are 3.47 and 2.82 for reference citer internationality
and reference author internationality (Table B.4).
With respect to the NB model of Table 6.4, field size and title length are
insignificant factors for citation counts. Journal author internationality and the
reference author internationality significantly associate with decreased citations
showing that publishing in less international journals decreases the probability of
receiving citations by 24.1% and also using less international references decreases
the probability of being cited by 16.5%. Abstract readability also significantly
associates with decreased citation counts. A unit increase in the readability score
decreases citations by 0.2% but a change from the lower to upper quartiles in the
factor associates with a 3.5% decrease. The number of institutions significantly
associates with increased citation counts in this field whereas it associates with
decreased citation counts in the above categories.
With respect to the logit model of Table 6.4, field size, number of pages, title
length and abstract readability do not significantly associate with zero citations
whereas all the other factors except for journal author internationality and
reference author internationality significantly associate with decreased zero
citations.

90
Table 6.4. Analysis of hurdle model results for Clinical Medicine.
Logit model Significance Decreasing/Increasing
zero citations
% change in
the probability
of zero
citations for a
unit increase
% change
between
lower and
upper
quartiles
Unit
Field size Insignificant
No. authors Significant Decreasing -13.1 -63.6 Citations per extra author
No. institutions Significant Decreasing -7.2 -7.2 Citations per extra institution
No. countries Significant Decreasing -45.4 -45.4 Citations per extra country
JIF Significant Decreasing -3.2 -7.7 Citations per extra IF
Ref. impact Significant Decreasing -0.6 -35.8 Citations per extra citation
Author impact Significant Decreasing -0.7 -16.6 Citations per extra h-index
Institution impact Significant Decreasing -18.4 -28.8 Citations per extra MNCS
Country impact significant Decreasing -14.9 -4.6 Citations per extra MNCS
J. auth. internationality Significant Increasing 1.5 46.2 Citations per extra GINI
J. citer internationality Significant Decreasing -44.6 -0.8 Citations per extra GINI
Ref. auth. internationality Significant Increasing 2.6 23.3 Citations per extra GINI
Ref. citer internationality Significant Decreasing -14.2 -30.9 Citations per extra GINI
No. refs Significant Decreasing -0.9 -20.8 Citations per extra reference
No. pages Insignificant
Title Length Insignificant
Abs. length Significant Decreasing -0.2 -21.7 Citations per extra word
Abs. readability Insignificant
NB model Significance Decreasing/Increasing
citations
% change in
the mean
parameter of
positive
citation counts
for a unit
increase
% change
between
lower and
upper
quartiles
Unit
Field size Insignificant
No. authors Significant Increasing 6.8 30.2 Citations per extra author
No. institutions Significant Increasing 7.5 7.5 Citations per extra institution
No. countries Significant Increasing 14.2 14.2 Citations per extra country
JIF Significant Increasing 5.1 12.7 Citations per extra IF
Ref. impact Significant Increasing 0.4 22.6 Citations per extra citations
Author impact Significant Increasing 0.9 19.2 Citations per extra h-index
Institution impact Significant Increasing 2.1 3.2 Citations per extra MNCS
Country impact Significant Increasing 23.3 73.5 Citations per extra MNCS
J. auth. internationality Significant Decreasing -24.1 -18.9 Citations per extra GINI
J. citer internationality Significant Increasing 29.8 10.6 Citations per extra GINI
Ref. auth. internationality Significant Decreasing -16.5 -12.2 Citations per extra GINI
Ref. citer internationality Significant Increasing 5.3 8.8 Citations per extra GINI
No. refs Significant Increasing 0.2 4.3 Citations per extra reference
No. pages Significant Increasing 2.1 6.5 Citations per extra page
Title Length Insignificant
Abs. length Significant Increasing 0.2 21.7 Citations per extra word
Abs. readability Significant Decreasing -0.2 -3.5 Citations per extra Flesch Score

91
6.6 Computer Science
No excessive multicollinearity was found among the variables based on the VIF
test (Table B.5).
With respect to the NB model of Table 6.5, the number of countries, reference
author internationality, and reference citer internationality are not significant
factors for citation counts. The number of institutions, journal author
internationality, title length, abstract length and abstract readability significantly
associate with decreased citation counts. An increase between lower and upper
quartiles in the number of institutions, title length, abstract length and abstract
readability associates with 5.9%, 22.5%, 7.9%, and 8.7% decreases in the citations,
respectively.
With respect to the logit model of Table 6.5, the number of countries, reference
author internationality, reference citer internationality, number of references, title
length, abstract length, and abstract readability are not significant factors for zero
citations. All the other factors except for field size, number of institutions, and
journal author internationality significantly associate with decreased zero citations.

92
Table 6.5. Analysis of hurdle model results for Computer Science.
Logit model Significance Decreasing/Increasing
zero citations
% change in
the probability
of zero
citations for a
unit increase
% change
between
lower and
upper
quartiles
Unit
Field size Significant Increasing 1.9 4.4 Citations per extra paper
No. authors Significant Decreasing -9.2 -19.2 Citations per extra author
No. institutions Significant Increasing 11.0 11.0 Citations per extra institution
No. countries Insignificant
JIF Significant Decreasing -61.4 -71.5 Citations per extra IF
Ref. impact Significant Decreasing -0.6 -46.8 Citations per extra citation
Author impact Significant Decreasing -2.6 -23.1 Citations per extra h-index
Institution impact Significant Decreasing -42.8 -32.9 Citations per extra MNCS
Country impact Significant Decreasing -16.3 -65.5 Citations per extra MNCS
J. auth. internationality Significant Increasing 0.1 27.3 Citations per extra GINI
J. citer internationality Significant Decreasing -95.0 -78.9 Citations per extra GINI
Ref. auth. internationality Insignificant
Ref. citer internationality Insignificant
No. refs Insignificant
No. pages Significant Decreasing -2.8 -25.1 Citations per extra page
Title Length Insignificant
Abs. length Insignificant
Abs. readability Insignificant
NB model Significance Decreasing/Increasing
citations
% change in
the mean
parameter of
positive
citation counts
for a unit
increase
% change
between
lower and
upper
quartiles
Unit
Field size Significant Increasing 0.6 1.5 Citations per extra paper
No. authors Significant Increasing 5.2 10.5 Citations per extra author
No. institutions Significant Decreasing -5.9 -5.9 Citations per extra institution
No. countries Insignificant
JIF Significant Increasing 52.2 60.5 Citations per extra IF
Ref. impact Significant Increasing 0.2 13.7 Citations per extra citations
Author impact Significant Increasing 3.4 31.3 Citations per extra h-index
Institution impact Significant Increasing 6.4 5.0 Citations per extra MNCS
Country impact Significant Increasing 35.3 65.9 Citations per extra MNCS
J. auth. internationality Significant Decreasing -2.7 -50.2 Citations per extra GINI
J. citer internationality Significant Increasing 27.3 63.0 Citations per extra GINI
Ref. auth. internationality Insignificant
Ref. citer internationality Insignificant
No. refs Significant Increasing 0.8 14.6 Citations per extra reference
No. pages Significant Increasing 2.6 23.1 Citations per extra page
Title Length Significant Decreasing -5.0 -22.5 Citations per extra word
Abs. length Significant Decreasing -0.1 -7.9 Citations per extra word
Abs. readability Significant Decreasing -0.5 -8.7 Citations per extra Flesch Score

93
6.7 Economics & Business
The VIF test shows that there is no excessive multicollinearity among the
variables. The number of institutions has the maximum VIF (2.83; Table B.6).
With respect to the NB model of Table 6.6, the number of institutions, number
of countries, reference citer internationality, abstract length, and abstract
readability insignificantly associate with citation counts. Field size, journal author
internationality, reference author internationality and title length significantly
associate with decreased citations but all the other factors are significant
determinants of increased citation counts.
With respect to the logit model of Table 6.6, the number of institutions, number
of countries, reference citer internationality, title length, abstract length and
abstract readability are not significant factors for zero citations. Field size
significantly associates with increased zero citations and a change between the
lower and upper quartiles in the factor associates with an 18.6% increase in the
zero citations. All other factors except for journal author internationality and
reference author internationality significantly associate with decreased zero
citations.

94
Table 6.6. Analysis of hurdle model results for Economics & Business.
Logit model Significance Decreasing/Increasing
zero citations
% change in the
probability of
zero citations for
a unit increase
% change
between
lower and
upper
quartiles
Unit
Field size Significant Increasing 3.3 18.6 Citations per extra paper
No. authors Significant Decreasing -27.0 -61.3 Citations per extra author
No. institutions Insignificant
No. countries Insignificant
JIF Significant Decreasing -2.8 -78.3 Citations per extra IF
Ref. impact Significant Decreasing -0.7 -44.4 Citations per extra citation
Author impact Significant Decreasing -6.8 -58.7 Citations per extra h-index
Institution impact Significant Decreasing -36.0 -35.5 Citations per extra MNCS
Country impact Significant Decreasing -24.9 -0.5 Citations per extra MNCS
J. auth. internationality Significant Increasing 1.0 51.0 Citations per extra GINI
J. citer internationality Significant Decreasing -58.8 -60.8 Citations per extra GINI
Ref. auth. internationality Significant Increasing 83.0 14.8 Citations per extra GINI
Ref. citer internationality Insignificant
No. refs Significant Decreasing -0.5 -15.0 Citations per extra reference
No. pages Significant Decreasing -2.5 -38.4 Citations per extra page
Title Length Insignificant
Abs. length Insignificant
Abs. readability Insignificant
NB model Significance Decreasing/Increasing
citations
% change in the
mean parameter
of positive
citation counts
for a unit
increase
% change
between
lower and
upper
quartiles
Unit
Field size Significant Decreasing -1.2 -6.8 Citations per extra paper
No. authors Significant Increasing 16.3 35.3 Citations per extra author
No. institutions Insignificant
No. countries Insignificant
JIF Significant Increasing 11.6 0.3 Citations per extra IF
Ref. impact Significant Increasing 0.5 30.0 Citations per extra citations
Author impact Significant Increasing 5.1 41.9 Citations per extra h-index
Institution impact Significant Increasing 3.0 2.9 Citations per extra MNCS
Country impact Significant Increasing 32.1 66.6 Citations per extra MNCS
J. auth. internationality Significant Decreasing -15.4 -25.6 Citations per extra GINI
J. citer internationality Significant Increasing 43.2 79.1 Citations per extra GINI
Ref. auth. internationality Significant Decreasing -36.6 -8.7 Citations per extra GINI
Ref. citer internationality Insignificant
No. refs Significant Increasing 0.6 18.3 Citations per extra reference
No. pages Significant Increasing 1.5 21.5 Citations per extra page
Title Length Significant Decreasing -0.8 -3.9 Citations per extra word
Abs. length Insignificant
Abs. readability Insignificant

95
6.8 Engineering
Multicollinearity was tested for and no excessive correlation was found among
the variables (Table B.7).
With respect to the NB model of Table 6.7, the number of institutions, number
of countries, reference citer internationality, abstract length, and abstract
readability are insignificant factors for citation counts in Engineering. Journal
author internationality, reference author internationality and title length
significantly associate with decreased citation counts while all the other factors
significantly associate with increased citations.
With respect to the logit model of Table 6.7, field size, number of countries,
title length, and abstract readability do not significantly associate with zero
citations. The number of institutions, journal author internationality and reference
author internationality significantly associate with increased zero citations.
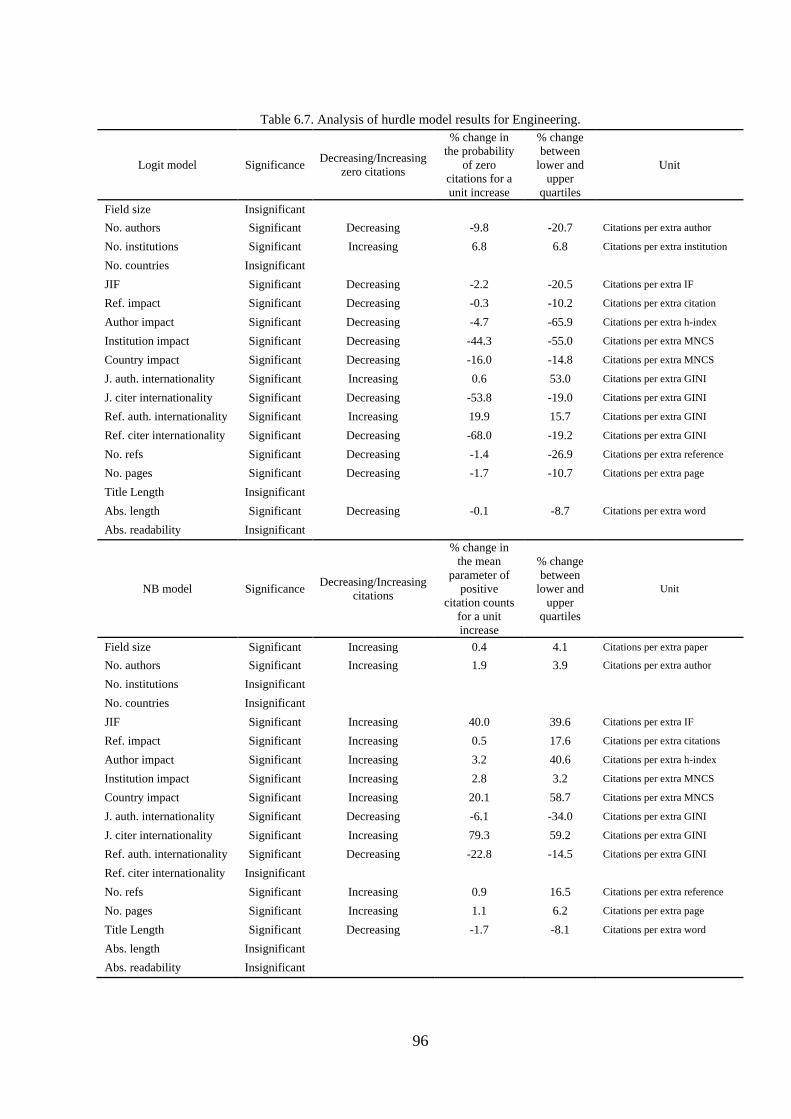
96
Table 6.7. Analysis of hurdle model results for Engineering.
Logit model Significance Decreasing/Increasing
zero citations
% change in
the probability
of zero
citations for a
unit increase
% change
between
lower and
upper
quartiles
Unit
Field size Insignificant
No. authors Significant Decreasing -9.8 -20.7 Citations per extra author
No. institutions Significant Increasing 6.8 6.8 Citations per extra institution
No. countries Insignificant
JIF Significant Decreasing -2.2 -20.5 Citations per extra IF
Ref. impact Significant Decreasing -0.3 -10.2 Citations per extra citation
Author impact Significant Decreasing -4.7 -65.9 Citations per extra h-index
Institution impact Significant Decreasing -44.3 -55.0 Citations per extra MNCS
Country impact Significant Decreasing -16.0 -14.8 Citations per extra MNCS
J. auth. internationality Significant Increasing 0.6 53.0 Citations per extra GINI
J. citer internationality Significant Decreasing -53.8 -19.0 Citations per extra GINI
Ref. auth. internationality Significant Increasing 19.9 15.7 Citations per extra GINI
Ref. citer internationality Significant Decreasing -68.0 -19.2 Citations per extra GINI
No. refs Significant Decreasing -1.4 -26.9 Citations per extra reference
No. pages Significant Decreasing -1.7 -10.7 Citations per extra page
Title Length Insignificant
Abs. length Significant Decreasing -0.1 -8.7 Citations per extra word
Abs. readability Insignificant
NB model Significance Decreasing/Increasing
citations
% change in
the mean
parameter of
positive
citation counts
for a unit
increase
% change
between
lower and
upper
quartiles
Unit
Field size Significant Increasing 0.4 4.1 Citations per extra paper
No. authors Significant Increasing 1.9 3.9 Citations per extra author
No. institutions Insignificant
No. countries Insignificant
JIF Significant Increasing 40.0 39.6 Citations per extra IF
Ref. impact Significant Increasing 0.5 17.6 Citations per extra citations
Author impact Significant Increasing 3.2 40.6 Citations per extra h-index
Institution impact Significant Increasing 2.8 3.2 Citations per extra MNCS
Country impact Significant Increasing 20.1 58.7 Citations per extra MNCS
J. auth. internationality Significant Decreasing -6.1 -34.0 Citations per extra GINI
J. citer internationality Significant Increasing 79.3 59.2 Citations per extra GINI
Ref. auth. internationality Significant Decreasing -22.8 -14.5 Citations per extra GINI
Ref. citer internationality Insignificant
No. refs Significant Increasing 0.9 16.5 Citations per extra reference
No. pages Significant Increasing 1.1 6.2 Citations per extra page
Title Length Significant Decreasing -1.7 -8.1 Citations per extra word
Abs. length Insignificant
Abs. readability Insignificant

97
6.9 Environment/Ecology
Based on the VIF test, no excessive multicollinearity was found among the
variables (Table B.8).
With respect to the NB model of Table 6.8, field size, reference author
internationality, and abstract readability are not significant factors for citations.
The number of institutions, journal author internationality, reference citer
internationality and title length significantly associate with decreased citations.
The other factors significantly associate with increased citations to articles but the
extent to which the abstract length associates with citation counts is small (0.03%
per a unit increase). Moreover, a change from the lower quartile to upper quartile
in this factor associates with only a 3.8% increase in the citations.
With respect to the logit model of Table 6.8, field size, reference author
internationality, reference citer internationality, title length, abstract length and
abstract readability do not significantly associate with zero citations. All the other
factors except for the number of institutions and journal author internationality
significantly associate with decreased zero citations.

98
Table 6.8. Analysis of hurdle model results for Environment/Ecology.
Logit model Significance Decreasing/Increasing
zero citations
% change in
the probability
of zero
citations for a
unit increase
% change
between
lower and
upper
quartiles
Unit
Field size Insignificant
No. authors Significant Decreasing -8.9 -29.0 Citations per extra author
No. institutions Significant Increasing 12.5 12.5 Citations per extra institution
No. countries Significant Decreasing -24.0 -24.0 Citations per extra country
JIF Significant Decreasing -80.3 -65.7 Citations per extra IF
Ref. impact Significant Decreasing -0.9 -33.4 Citations per extra citation
Author impact Significant Decreasing -1.9 -30.5 Citations per extra h-index
Institution impact Significant Decreasing -24.9 -49.1 Citations per extra MNCS
Country impact Significant Decreasing -18.9 -45.0 Citations per extra MNCS
J. auth. internationality Significant Increasing 0.1 59.1 Citations per extra GINI
J. citer internationality Significant Decreasing -31.2 -56.4 Citations per extra GINI
Ref. auth. internationality Insignificant
Ref. citer internationality Insignificant
No. refs Significant Decreasing -1.0 -28.4 Citations per extra reference
No. pages Significant Decreasing -3.4 -18.5 Citations per extra page
Title Length Insignificant
Abs. length Insignificant
Abs. readability Insignificant
NB model Significance Decreasing/Increasing
citations
% change in
the mean
parameter of
positive
citation counts
for a unit
increase
% change
between
lower and
upper
quartiles
Unit
Field size Insignificant
No. authors Significant Increasing 2.0 6.2 Citations per extra author
No. institutions Significant Decreasing -4.1 -4.1 Citations per extra institution
No. countries Significant Increasing 13.5 13.5 Citations per extra country
JIF Significant Increasing 30.2 54.8 Citations per extra IF
Ref. impact Significant Increasing 0.6 21.2 Citations per extra citations
Author impact Significant Increasing 2.0 30.5 Citations per extra h-index
Institution impact Significant Increasing 1.4 2.6 Citations per extra MNCS
Country impact Significant Increasing 23.3 67.9 Citations per extra MNCS
J. auth. internationality Significant Decreasing -1.0 -44.8 Citations per extra GINI
J. citer internationality Significant Increasing 52.3 53.0 Citations per extra GINI
Ref. auth. internationality Insignificant
Ref. citer internationality Significant Decreasing -15.2 -9.9 Citations per extra GINI
No. refs Significant Increasing 0.4 10.5 Citations per extra reference
No. pages Significant Increasing 0.9 4.6 Citations per extra page
Title Length Significant Decreasing -1.3 -6.3 Citations per extra word
Abs. length Significant Increasing 0.03 3.8 Citations per extra word
Abs. readability Insignificant

99
6.10 Geosciences
Based on the VIF test, no excessive multicollinearity was found among the
variables. The number of institutions and reference citer internationality have the
maximum VIFs (Table B.9).
With respect to the NB model of Table 6.9, the number of institutions and
abstract readability do not significantly associate with citations counts. Journal
author internationality, reference author internationality and title length
significantly associate with decreased citations. The extent to which field size,
reference impact, number of references and abstract length associate with
increased citations is small (less than 1%) due to a unit change in the factors but a
change from the lower to upper quartiles in each factor associates with 4.3%,
23.7%, 6.2% and 3.5% increases in citation counts, respectively.
With respect to the logit model of Table 6.9, field size and number of references
are insignificant factors for zero citations. All other factors except for journal
author internationality, reference author internationality, title length, and abstract
length significantly associate with decreased zero citations.

100
Table 6.9. Analysis of hurdle model results for Geosciences.
Logit model Significance Decreasing/Increasing
zero citations
% change in the
probability of
zero citations for
a unit increase
% change
between
lower and
upper
quartiles
Unit
Field size Insignificant
No. authors Significant Decreasing -5.7 -17.9 Citations per extra author
No. institutions Significant Decreasing -11.9 -25.1 Citations per extra institution
No. countries Significant Decreasing -21.8 -21.8 Citations per extra country
JIF Significant Decreasing -9.6 -46.9 Citations per extra IF
Ref. impact Significant Decreasing -1.2 -53.1 Citations per extra citation
Author impact Significant Decreasing -4.3 -80.0 Citations per extra h-index
Institution impact Significant Decreasing -24.0 -38.1 Citations per extra MNCS
Country impact Significant Decreasing -15.3 -7.8 Citations per extra MNCS
J. auth. internationality Significant Increasing 11.7 32.0 Citations per extra GINI
J. citer internationality Significant Decreasing -67.9 -10.5 Citations per extra GINI
Ref. auth. internationality Significant Increasing 2.5 34.1 Citations per extra GINI
Ref. citer internationality Significant Decreasing -48.1 -28.7 Citations per extra GINI
No. refs Insignificant
No. pages Significant Decreasing -5.7 -55.3 Citations per extra page
Title Length Significant Increasing 1.6 11.2 Citations per extra word
Abs. length Significant Increasing 0.1 10.8 Citations per extra word
Abs. readability Significant Decreasing -0.9 -16.2 Citations per extra Flesch Score
NB model Significance Decreasing/Increasing
citations
% change in the
mean parameter
of positive
citation counts
for a unit
increase
% change
between
lower and
upper
quartiles
Unit
Field size Significant Increasing 0.6 4.3 Citations per extra paper
No. authors Significant Increasing 4.4 13.8 Citations per extra author
No. institutions Insignificant
No. countries Significant Increasing 4.8 4.8 Citations per extra country
JIF Significant Increasing 43.9 84.4 Citations per extra IF
Ref. impact Significant Increasing 0.6 23.7 Citations per extra citations
Author impact Significant Increasing 3.4 58.7 Citations per extra h-index
Institution impact Significant Increasing 2.6 4.0 Citations per extra MNCS
Country impact Significant Increasing 24.4 7.4 Citations per extra MNCS
J. auth. internationality Significant Decreasing -57.9 -9.3 Citations per extra GINI
J. citer internationality Significant Increasing 27.3 40.7 Citations per extra GINI
Ref. auth. internationality Significant Decreasing -11.2 -21.9 Citations per extra GINI
Ref. citer internationality Significant Increasing 66.0 30.8 Citations per extra GINI
No. refs Significant Increasing 0.2 6.2 Citations per extra reference
No. pages Significant Increasing 2.1 18.3 Citations per extra page
Title Length Significant Decreasing -2.3 -14.9 Citations per extra word
Abs. length Significant Increasing 0.03 3.5 Citations per extra word
Abs. readability Insignificant

101
6.11 Immunology
The reference citer internationality and the journal citer internationality have
excessive multicollinearity (VIF>4). Reference author internationality and journal
author internationality also have high VIFs (3.66 and 3.44, respectively) (Table
B.10).
With respect to the NB model of Table 6.10, the number of institutions and
reference author internationality are not significant determinants of citation counts.
Field size, journal author internationality, reference citer internationality, title
length and abstract readability significantly associate with decreased citations.
With respect to the logit model of Table 6.10, the number of institutions,
reference citer internationality, number of references, number of pages, title
length, abstract length and abstract readability do not significantly associate with
zero citations. Field size, journal author internationality, and reference author
internationality significantly associate with increased zero citations.
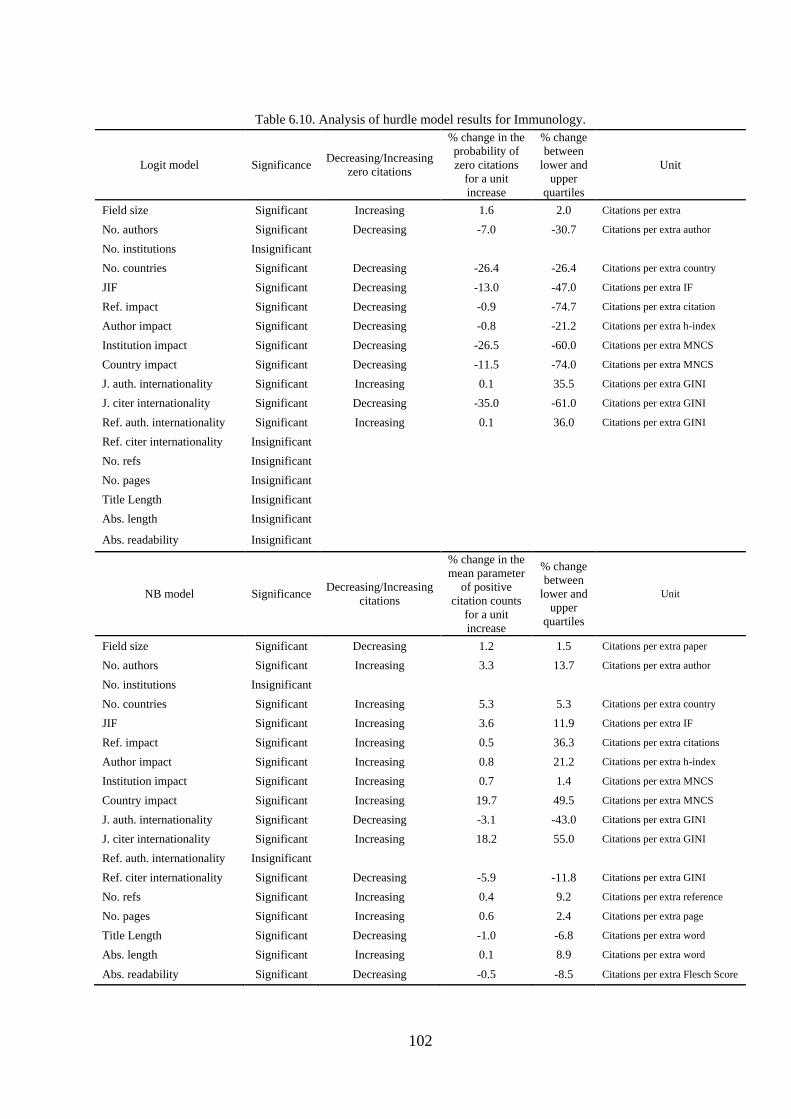
102
Table 6.10. Analysis of hurdle model results for Immunology.
Logit model Significance Decreasing/Increasing
zero citations
% change in the
probability of
zero citations
for a unit
increase
% change
between
lower and
upper
quartiles
Unit
Field size Significant Increasing 1.6 2.0 Citations per extra
No. authors Significant Decreasing -7.0 -30.7 Citations per extra author
No. institutions Insignificant
No. countries Significant Decreasing -26.4 -26.4 Citations per extra country
JIF Significant Decreasing -13.0 -47.0 Citations per extra IF
Ref. impact Significant Decreasing -0.9 -74.7 Citations per extra citation
Author impact Significant Decreasing -0.8 -21.2 Citations per extra h-index
Institution impact Significant Decreasing -26.5 -60.0 Citations per extra MNCS
Country impact Significant Decreasing -11.5 -74.0 Citations per extra MNCS
J. auth. internationality Significant Increasing 0.1 35.5 Citations per extra GINI
J. citer internationality Significant Decreasing -35.0 -61.0 Citations per extra GINI
Ref. auth. internationality Significant Increasing 0.1 36.0 Citations per extra GINI
Ref. citer internationality Insignificant
No. refs Insignificant
No. pages Insignificant
Title Length Insignificant
Abs. length Insignificant
Abs. readability Insignificant
NB model Significance Decreasing/Increasing
citations
% change in the
mean parameter
of positive
citation counts
for a unit
increase
% change
between
lower and
upper
quartiles
Unit
Field size Significant Decreasing 1.2 1.5 Citations per extra paper
No. authors Significant Increasing 3.3 13.7 Citations per extra author
No. institutions Insignificant
No. countries Significant Increasing 5.3 5.3 Citations per extra country
JIF Significant Increasing 3.6 11.9 Citations per extra IF
Ref. impact Significant Increasing 0.5 36.3 Citations per extra citations
Author impact Significant Increasing 0.8 21.2 Citations per extra h-index
Institution impact Significant Increasing 0.7 1.4 Citations per extra MNCS
Country impact Significant Increasing 19.7 49.5 Citations per extra MNCS
J. auth. internationality Significant Decreasing -3.1 -43.0 Citations per extra GINI
J. citer internationality Significant Increasing 18.2 55.0 Citations per extra GINI
Ref. auth. internationality Insignificant
Ref. citer internationality Significant Decreasing -5.9 -11.8 Citations per extra GINI
No. refs Significant Increasing 0.4 9.2 Citations per extra reference
No. pages Significant Increasing 0.6 2.4 Citations per extra page
Title Length Significant Decreasing -1.0 -6.8 Citations per extra word
Abs. length Significant Increasing 0.1 8.9 Citations per extra word
Abs. readability Significant Decreasing -0.5 -8.5 Citations per extra Flesch Score

103
6.12 Materials Science
No serious multicollinearity was found among the variables (Table B.11). The
maximum VIF is 3.23 for reference citer internationality.
With respect to the NB model of Table 6.11, number of institutions and
reference author internationality have no significant association with citation
counts. Field size, journal author internationality, reference citer internationality,
title length, and abstract readability significantly associate with decreased
citations.
With respect to the logit model of Table 6.11, number of institutions, reference
citer internationality, number of references, number of pages, title length, abstract
length and abstract readability are not significant factors for zero citations. The
field size, journal author internationality and reference author internationality
significantly contribute to increased zero citations.

104
Table 6.11. Analysis of hurdle model results for Materials Science.
Logit model Significance Decreasing/Increasing
zero citations
% change in the
probability of
zero citations for
a unit increase
% change
between
lower and
upper
quartiles
Unit
Field size Significant Increasing 1.6 2.0 Citations per extra paper
No. authors Significant Decreasing -7.0 -30.7 Citations per extra author
No. institutions Insignificant
No. countries Significant Decreasing -26.4 -26.4 Citations per extra country
JIF Significant Decreasing -13.0 -47.0 Citations per extra IF
Ref. impact Significant Decreasing -0.9 -74.7 Citations per extra citation
Author impact Significant Decreasing -0.8 -21.2 Citations per extra h-index
Institution impact Significant Decreasing -26.5 -33.1 Citations per extra MNCS
Country impact Significant Decreasing -11.5 -74.0 Citations per extra MNCS
J. auth. internationality Significant Increasing 0.1 35.5 Citations per extra GINI
J. citer internationality Significant Decreasing -35.0 -61.0 Citations per extra GINI
Ref. auth. internationality Significant Increasing 0.1 36.0 Citations per extra GINI
Ref. citer internationality Insignificant
No. refs Insignificant
No. pages Insignificant
Title Length Insignificant
Abs. length Insignificant
Abs. readability Insignificant
NB model Significance Decreasing/Increasing
citations
% change in the
mean parameter
of positive
citation counts
for a unit
increase
% change
between
lower and
upper
quartiles
Unit
Field size Significant Decreasing 1.2 1.5 Citations per extra paper
No. authors Significant Increasing 3.3 13.7 Citations per extra author
No. institutions Insignificant
No. countries Significant Increasing 5.3 5.2 Citations per extra country
JIF Significant Increasing 3.6 11.9 Citations per extra IF
Ref. impact Significant Increasing 0.5 36.3 Citations per extra citations
Author impact Significant Increasing 0.8 21.2 Citations per extra h-index
Institution impact Significant Increasing 0.7 3.0 Citations per extra MNCS
Country impact Significant Increasing 19.7 49.5 Citations per extra MNCS
J. auth. internationality Significant Decreasing -3.1 -43.0 Citations per extra GINI
J. citer internationality Significant Increasing 18.2 55.0 Citations per extra GINI
Ref. auth. internationality Insignificant
Ref. citer internationality Significant Decreasing -5.9 -11.8 Citations per extra GINI
No. refs Significant Increasing 0.4 9.2 Citations per extra reference
No. pages Significant Increasing 0.6 2.4 Citations per extra page
Title Length Significant Decreasing -1.0 -6.8 Citations per extra word
Abs. length Significant Increasing 0.1 8.9 Citations per extra word
Abs. readability Significant Decreasing -0.5 -8.5 Citations per extra Flesch Score

105
`6.13 Mathematics
Based on the VIF test, there is no excessive multicollinearity among the
variables (Table B.12).
With respect to the NB model of Table 6.12, field size, number of institutions,
number of countries, reference impact, institution impact, abstract length, and
abstract readability are not significant factors for positive citation counts. Journal
author internationality, reference author internationality and title length
significantly associate with decreased citations. In comparison to the other fields,
there are fewer significant factors for increased citation counts in Mathematics.
With respect to the logit model of Table 6.12, field size, number of institutions,
reference impact, abstract length, and abstract readability are insignificant
determinants of zero citations. All the other factors except for journal author
internationality, reference author internationality and title length significantly
associate with decreased zero citations.

106
Table 6.12. Analysis of hurdle model results for Mathematics.
Logit model Significance Decreasing/Increasing
zero citations
% change in
the probability
of zero
citations for a
unit increase
% change
between
lower and
upper
quartiles
Unit
Field size Insignificant
No. authors Significant Decreasing -15.4 -15.4 Citations per extra author
No. institutions Insignificant
No. countries Significant Decreasing -23.8 -23.8 Citations per extra country
JIF Significant Decreasing -86.8 -38.3 Citations per extra IF
Ref. impact Insignificant
Author impact Significant Decreasing -5.2 -41.9 Citations per extra h-index
Institution impact Significant Decreasing -22.3 -1.4 Citations per extra MNCS
Country impact Significant Decreasing -17.5 -31.8 Citations per extra MNCS
J. auth. internationality Significant Increasing 0.4 53.6 Citations per extra GINI
J. citer internationality Significant Decreasing -52.8 -72.7 Citations per extra GINI
Ref. auth. internationality Significant Increasing 9.7 18.6 Citations per extra GINI
Ref. citer internationality Significant Decreasing -11.5 -41.5 Citations per extra GINI
No. refs Significant Decreasing -1.3 -19.9 Citations per extra reference
No. pages Significant Decreasing -1.8 -24.1 Citations per extra page
Title Length Significant Increasing 3.4 13.1 Citations per extra word
Abs. length Insignificant
Abs. readability Insignificant
NB model Significance Decreasing/Increasing
citations
% change in
the mean
parameter of
positive
citation counts
for a unit
increase
% change
between
lower and
upper
quartiles
Unit
Field size Insignificant
No. authors Significant Increasing 15.8 15.8 Citations per extra author
No. institutions Insignificant
No. countries Insignificant
JIF Significant Increasing 32.9 55.1 Citations per extra IF
Ref. impact Insignificant
Author impact Significant Increasing 6.6 56.5 Citations per extra h-index
Institution impact Insignificant
Country impact Significant Increasing 20.6 65.5 Citations per extra MNCS
J. auth. internationality Significant Decreasing -4.5 -35.3 Citations per extra GINI
J. citer internationality Significant Increasing 32.6 18 Citations per extra GINI
Ref. auth. internationality Significant Decreasing -22.4 -12.3 Citations per extra GINI
Ref. citer internationality Significant Increasing 49.5 26.9 Citations per extra GINI
No. refs Significant Increasing 0.5 7.2 Citations per extra reference
No. pages Significant Increasing 1.3 16.8 Citations per extra page
Title Length Significant Decreasing -2.3 -9.2 Citations per extra word
Abs. length Insignificant
Abs. readability Insignificant

107
6.14 Microbiology
Based on the VIF test, reference citer internationality and reference author
internationality have excessive multicollinearity (VIF>4; Table B.13).
With respect to the NB model of Table 6.13, the number of countries and the
number of pages are insignificant factors for citation counts. The number of
institutions, reference author internationality, title length and abstract readability
significantly associate with decreased citation counts. A unit increase in field size,
reference impact, number of references, and abstract length associates with a small
increase (less than 1%) in the citation counts but a change between the lower and
upper quartiles in these factors results in higher percentages (4.2%, 4.2%, 6.8%,
20.2%, respectively)
With respect to the logit model of Table 6.13, field size, number of authors,
number of countries, reference impact, number of references, title length and
abstract length do not significantly associate with zero citations. The number of
institutions, journal author internationality, reference author internationality, and
abstract readability significantly associate with increased zero citations but the
other factors significantly associate with decreased zero citations.

108
Table 6.13. Analysis of hurdle model results for Microbiology.
Logit model Significance Decreasing/Increasing
zero citations
% change in
the probability
of zero
citations for a
unit increase
% change
between
lower and
upper
quartiles
Unit
Field size Insignificant
No. authors Insignificant
No. institutions Significant Increasing 17.5 17.5 Citations per extra institution
No. countries Insignificant
JIF Significant Decreasing -36.4 -68.8 Citations per extra IF
Ref. impact Insignificant
Author impact Significant Decreasing -3.0 -71.6 Citations per extra h-index
Institution impact Significant Decreasing -30.4 -48.8 Citations per extra MNCS
Country impact Significant Decreasing -11.6 -77.8 Citations per extra MNCS
J. auth. internationality Significant Increasing 33.8 15.2 Citations per extra GINI
J. citer internationality Significant Decreasing -72.1 -36.3 Citations per extra GINI
Ref. auth. internationality Significant Increasing 0.1 48.4 Citations per extra GINI
Ref. citer internationality Significant Decreasing -85.0 -20.4 Citations per extra GINI
No. refs Insignificant
No. pages Significant Decreasing -6.8 -30.2 Citations per extra page
Title Length Insignificant
Abs. length Insignificant
Abs. readability Significant Increasing 0.8 13.4 Citations per extra Flesch Score
NB model Significance Decreasing/Increasing
citations
% change in
the mean
parameter of
positive
citation counts
for a unit
increase
% change
between
lower and
upper
quartiles
Unit
Field size Significant Increasing 0.4 4.2 Citations per extra paper
No. authors Significant Increasing 2.0 6.1 Citations per extra author
No. institutions Significant Decreasing -3.5 -3.5 Citations per extra institution
No. countries Insignificant
JIF Significant Increasing 12.8 30.4 Citations per extra IF
Ref. impact Significant Increasing 0.1 4.2 Citations per extra citations
Author impact Significant Increasing 1.8 38.2 Citations per extra h-index
Institution impact Significant Increasing 1.7 2.6 Citations per extra MNCS
Country impact Significant Increasing 20.9 68.9 Citations per extra MNCS
J. auth. internationality Significant Increasing 36.3 4.8 Citations per extra GINI
J. citer internationality Significant Increasing 51.2 6.4 Citations per extra GINI
Ref. auth. internationality Significant Decreasing -0.5 -38.5 Citations per extra GINI
Ref. citer internationality Significant Increasing 73.6 37.6 Citations per extra GINI
No. refs Significant Increasing 0.3 6.8 Citations per extra reference
No. pages Insignificant
Title Length Significant Decreasing -1.0 -6.8 Citations per extra word
Abs. length Significant Increasing 0.2 20.2 Citations per extra word
Abs. readability Significant Decreasing -0.6 -10.2 Citations per extra Flesch Score

109
6.15 Molecular Biology & Genetics
Based on the VIF test, reference citer internationality and reference author
internationality have serious multicollinearity (VIF>4; Table B.14).
With respect to the NB model of Table 6.14, field size and number of
institutions are not significant factors for citation counts. All the other factors
except for journal author internationality, reference author internationality, title
length, and abstract readability significantly associate with increased citation
counts.
With respect to the logit model of Table 6.14, field size, number of
institutions, number of references, number of pages, title length and abstract
readability are not significant factors for zero citations. Journal author
internationality and reference author internationality significantly associate with
increased zero citations while the other factors significantly associate with
decreased zero citations.

110
Table 6.14. Analysis of hurdle model results for Molecular Biology & Genetics.
Logit model Significance
Decreasing/Increasing
probability of zero
citations
% change in the
probability of
zero citations
for a unit
increase
% change
between
lower and
upper
quartiles
Unit
Field size Insignificant
No. authors Significant Decreasing -8.3 -37.7 Citations per extra author
No. institutions Insignificant
No. countries Significant Decreasing -19.9 -19.9 Citations per extra country
JIF Significant Decreasing -21.1 -25.7 Citations per extra IF
Ref. impact Significant Decreasing -0.7 -58.7 Citations per extra citations
Author impact Significant Decreasing -2.5 -64.8 Citations per extra h-index
Institution impact Significant Decreasing -17.2 -11.8 Citations per extra MNCS
Country impact Significant Decreasing -18.5 -40.0 Citations per extra MNCS
J. auth. internationality Significant Increasing 2.7 38.2 Citations per extra GINI
J. citer internationality Significant Decreasing -44.1 -69.8 Citations per extra GINI
Ref. auth. internationality Significant Increasing 0.1 29.9 Citations per extra GINI
Ref. citer internationality Significant Decreasing -80.8 -36.1 Citations per extra GINI
No. refs Insignificant
No. pages Insignificant
Title Length Insignificant
Abs. length Significant Decreasing -0.4 -36.0 Citations per extra word
Abs. readability Insignificant
NB model Significance Decreasing/Increasing
citations
% change in the
mean parameter
of positive
citation counts
for a unit
increase
% change
between
lower and
upper
quartiles
Unit
Field size Insignificant
No. authors Significant Increasing 5.5 24.1 Citations per extra author
No. institutions Insignificant
No. countries Significant Increasing 9.7 9.7 Citations per extra country
JIF Significant Increasing 6.6 31.1 Citations per extra IF
Ref. impact Significant Increasing 0.5 39.0 Citations per extra citations
Author impact Significant Increasing 1.1 24.6 Citations per extra h-index
Institution impact Significant Increasing 1.1 0.7 Citations per extra MNCS
Country impact Significant Increasing 23.2 39.7 Citations per extra MNCS
J. auth. internationality Significant Decreasing -59.7 -6.7 Citations per extra GINI
J. citer internationality Significant Increasing 70.3 55.3 Citations per extra GINI
Ref. auth. internationality Significant Decreasing -0.4 -27.0 Citations per extra GINI
Ref. citer internationality Significant Increasing 6.4 35.8 Citations per extra GINI
No. refs Significant Increasing 0.3 7.4 Citations per extra reference
No. pages Significant Increasing 0.7 3.5 Citations per extra page
Title Length Significant Decreasing -0.9 -5.3 Citations per extra word
Abs. length Significant Increasing 0.1 8.0 Citations per extra word
Abs. readability Significant Decreasing -0.3 -5.0 Citations per extra Flesch Score
111
6.16 Multidisciplinary
Based on the VIF test for multicollinearity, reference citer internationality has
excessive multicollinearity (Table B.15).
With respect to the NB model of Table 6.15, number of institutions, number of
countries, number of pages, and title length are not significant factors for citation
counts. Field size, journal author internationality, reference author internationality
and abstract readability significantly associate with decreased citation counts.
With respect to the logit model of Table 6.15, field size, number of authors,
number of countries, reference author internationality, number of pages, title
length and abstract length insignificantly associate with zero citations. The number
of institutions, journal author internationality, and abstract readability significantly
associate with increased zero citations whereas all the other factors significantly
associate with decreased zero citations.

112
Table 6.15. Analysis of hurdle model results for Multidisciplinary.
Logit model Significance Decreasing/Increasing
zero citations
% change in the
probability of
zero citations
for a unit
increase
% change
between
lower and
upper
quartiles
Unit
Field size Insignificant
No. authors Insignificant
No. institutions Significant Increasing 11.7 22.0 Citations per extra institution
No. countries Insignificant
JIF Significant Decreasing -29.3 -54.2 Citations per extra IF
Ref. impact Significant Decreasing -0.2 -17.8 Citations per extra citations
Author impact Significant Decreasing -2.3 -48.8 Citations per extra h-index
Institution impact Significant Decreasing -50.7 -44.6 Citations per extra MNCS
Country impact Significant Decreasing -7.8 -47.3 Citations per extra MNCS
J. auth. internationality Significant Increasing -2.7 -72.4 Citations per extra GINI
J. citer internationality Significant Decreasing -41.3 -62.1 Citations per extra GINI
Ref. auth. internationality Insignificant
Ref. citer internationality Significant Decreasing -31.8 -20.3 Citations per extra GINI
No. refs Significant Decreasing -0.8 -19.2 Citations per extra reference
No. pages Insignificant
Title Length Insignificant
Abs. length Insignificant
Abs. readability Significant Increasing 0.9 15.2 Citations per extra Flesch Score
NB model Significance Decreasing/Increasing
citations
% change in the
mean parameter
of positive
citation counts
for a unit
increase
% change
between
lower and
upper
quartiles
Unit
Field size Significant Decreasing -12.7 -14.5 Citations per extra paper
No. authors Significant Increasing 1.3 5.3 Citations per extra author
No. institutions Insignificant
No. countries Insignificant
JIF Significant Increasing 5.4 61.0 Citations per extra IF
Ref. impact Significant Increasing 0.4 38.8 Citations per extra citations
Author impact Significant Increasing 0.9 26.3 Citations per extra h-index
Institution impact Significant Increasing 2.0 1.8 Citations per extra MNCS
Country impact Significant Increasing 24.4 8.3 Citations per extra MNCS
J. auth. internationality Significant Decreasing -0.1 -42.9 Citations per extra GINI
J. citer internationality Significant Increasing 74.8 56.1 Citations per extra GINI
Ref. auth. internationality Significant Decreasing -35.9 -7.9 Citations per extra GINI
Ref. citer internationality Significant Increasing 36.8 12.4 Citations per extra GINI
No. refs Significant Increasing 0.8 19.2 Citations per extra reference
No. pages Insignificant
Title Length Insignificant
Abs. length Significant Increasing 0.04 3.5 Citations per extra word
Abs. readability Significant Decreasing -0.3 -5.4 Citations per extra Flesch Score

113
6.17 Neuroscience & Behaviour
No serious multicollinearity was found among the variables based on the VIF
test. The maximum VIFs were 3.90 and 3.23 for reference citer internationality
and reference author internationality, respectively (Table B.16).
With respect to the NB model of Table 6.16, the number of countries and the
number of pages are insignificant factors for citation counts. Field size, number of
institutions, reference author internationality, title length, and abstract readability
significantly associate with decreased citations.
With respect to the logit model of Table 6.16, field size, number of references,
number of pages, title length and abstract readability are not significant factors for
zero citations. The number of institutions, number of countries, journal author
internationality, and reference author internationality significantly associate with
increased zero citations while all the other factors significantly associate with
decreased zero citations.

114
Table 6.16. Analysis of hurdle model results for Neuroscience & Behaviour.
Logit model Significance Decreasing/Increasing
zero citations
% change in the
probability of
zero citations for
a unit increase
% change
between
lower
and
upper
quartiles
Unit
Field size Insignificant
No. authors Significant Decreasing -4.6 -14.5 Citations per extra author
No. institutions Significant Increasing 11.5 21.7 Citations per extra institution
No. countries Significant Increasing 17.6 17.6 Citations per extra country
JIF Significant Decreasing -25.2 -67.4 Citations per extra IF
Ref. impact Significant Decreasing -0.9 -62.6 Citations per extra citations
Author impact Significant Decreasing -2.4 -61.6 Citations per extra h-index
Institution impact Significant Decreasing -20.8 -25.5 Citations per extra MNCS
Country impact Significant Decreasing -12.0 -79.5 Citations per extra MNCS
J. auth. internationality Significant Increasing 20.7 16.0 Citations per extra GINI
J. citer internationality Significant Decreasing -36.6 -51.2 Citations per extra GINI
Ref. auth. internationality Significant Increasing 0.03 36.4 Citations per extra GINI
Ref. citer internationality Significant Decreasing -23.8 -16.1 Citations per extra GINI
No. refs Insignificant
No. pages Insignificant
Title Length Insignificant
Abs. length Significant Decreasing -0.2 -20.0 Citations per extra word
Abs. readability Insignificant
NB model Significance Decreasing/Increasing
citations
% change in the
mean parameter
of positive
citation counts for
a unit increase
% change
between
lower
and
upper
quartiles
Unit
Field size Significant Decreasing -0.8 -5.8 Citations per extra paper
No. authors Significant Increasing 1.6 4.9 Citations per extra author
No. institutions Significant Decreasing -1.8 -3.5 Citations per extra institution
No. countries Insignificant
JIF Significant Increasing 11.9 29.2 Citations per extra IF
Ref. impact Significant Increasing 0.6 38.3 Citations per extra citations
Author impact Significant Increasing 1.2 27.1 Citations per extra h-index
Institution impact Significant Increasing 1.2 1.5 Citations per extra MNCS
Country impact Significant Increasing 21.5 74.3 Citations per extra MNCS
J. auth. internationality Significant Increasing 27.8 2.8 Citations per extra GINI
J. citer internationality Significant Increasing 92.4 10.4 Citations per extra GINI
Ref. auth. internationality Significant Decreasing -0.5 -26.1 Citations per extra GINI
Ref. citer internationality Significant Increasing 20.8 15.8 Citations per extra GINI
No. refs Significant Increasing 0.3 8.8 Citations per extra reference
No. pages Insignificant
Title Length Significant Decreasing -1.1 -6.4 Citations per extra word
Abs. length Significant Increasing 0.2 20.0 Citations per extra word
Abs. readability Significant Decreasing -0.3 -5.1 Citations per extra Flesch Score

115
6.18 Pharmacology & Toxicology
Based on the VIF test, reference citer internationality has excessive
multicollinearity (VIF>4) and reference author internationality has also a high VIF
(3.91) (Table B.17).
With respect to the NB model of Table 6.17, field size, number of institutions,
and abstract readability are not significant factors for citation counts. Journal
author internationality, reference author internationality, reference citer
internationality and title length significantly associate with decreased citation
counts. All the other factors significantly associate with increased citation counts.
With respect to the logit model of Table 6.17, the field size, the number authors,
reference impact, reference author internationality, reference citer internationality,
number of references, title length, abstract length and abstract readability are
insignificant factors for zero citations. All the other factors, except for the number
of institutions and journal author internationality, significantly associate with
decreased zero citations.

116
Table 6.17. Analysis of hurdle model results for Pharmacology & Toxicology.
Logit model Significance Decreasing/Increasing
zero citations
% change in the
probability of
zero citations
for a unit
increase
% change
between
lower and
upper
quartiles
Unit
Field size Insignificant
No. authors Insignificant
No. institutions Significant Increasing 15.0 15.0 Citations per extra institution
No. countries Significant Decreasing -24.7 -24.7 Citations per extra country
JIF Significant Decreasing -81.5 -84.7 Citations per extra IF
Ref. impact Insignificant
Author impact Significant Decreasing -1.8 -35.8 Citations per extra h-index
Institution impact Significant Decreasing -21.7 -36.8 Citations per extra MNCS
Country impact Significant Decreasing -18.9 -49.3 Citations per extra MNCS
J. auth. internationality Significant Increasing 0.7 51.5 Citations per extra GINI
J. citer internationality Significant Decreasing -66.0 -42.8 Citations per extra GINI
Ref. auth. internationality Insignificant
Ref. citer internationality Insignificant
No. refs Insignificant
No. pages Significant Decreasing -8.8 -39.9 Citations per extra page
Title Length Insignificant
Abs. length Insignificant
Abs. readability Insignificant
NB model Significance Decreasing/Increasing
citations
% change in the
mean parameter
of positive
citation counts
for a unit
increase
% change
between
lower and
upper
quartiles
Unit
Field size Insignificant
No. authors Significant Increasing 1.6 4.9 Citations per extra author
No. institutions Insignificant
No. countries Significant Increasing 4.3 4.3 Citations per extra country
JIF Significant Increasing 25.8 49.5 Citations per extra IF
Ref. impact Significant Increasing 0.6 28.6 Citations per extra citations
Author impact Significant Increasing 1.4 26.8 Citations per extra h-index
Institution impact Significant Increasing 1.3 2.1 Citations per extra MNCS
Country impact Significant Increasing 21.0 74.2 Citations per extra MNCS
J. auth. internationality Significant Decreasing -5.2 -33.0 Citations per extra GINI
J. citer internationality Significant Increasing 52.4 32.3 Citations per extra GINI
Ref. auth. internationality Significant Decreasing -28.2 -10.1 Citations per extra GINI
Ref. citer internationality Significant Decreasing -7.5 -15.1 Citations per extra GINI
No. refs Significant Increasing 0.5 10.5 Citations per extra reference
No. pages Significant Increasing 2.8 11.8 Citations per extra page
Title Length Significant Decreasing -1.2 -7.0 Citations per extra word
Abs. length Significant Increasing 0.1 9.4 Citations per extra word
Abs. readability Insignificant

117
6.19 Physics
Based on the results of the VIF test, the number of institutions (VIF=9.98) and
the number of authors (VIF=6.08) have excessive multicollinearity (VIF>4; Table
B.18). The number of countries and reference citer internationality follow these
two factors with VIFs of 3.34 and 3.20, respectively.
With respect to the NB model of Table 6.18, the number of authors (discussed
in depth in section 7.2), number of institutions, title length and abstract readability
are not significant factors for citation counts. All the other factors except for the
number of countries, journal author internationality and reference author
internationality, significantly associate with increased citations.
With respect to the logit model of Table 6.18, field size, number of authors,
number of countries, title length, and abstract readability are not significant factors
for zero citations. The number of institutions, journal author internationality, and
reference author internationality significantly associate with increased zero
citations while all the other factors significantly associate with decreased zero
citations.

118
Table 6.18. Analysis of hurdle model results for Physics.
Logit model Significance Decreasing/Increasing
zero citations
% change in
the probability
of zero
citations for a
unit increase
% change
between
lower and
upper
quartiles
Unit
Field size Insignificant
No. authors Insignificant
No. institutions Significant Increasing 9.6 9.6 Citations per extra
institution No. countries Insignificant
JIF Significant Decreasing -39.9 -68.3 Citations per extra IF
Ref. impact Significant Decreasing -0.1 -6.5 Citations per extra citations
Author impact Significant Decreasing -1.9 -38.1 Citations per extra h-index
Institution impact Significant Decreasing -33.6 -22.4 Citations per extra MNCS
Country impact Significant Decreasing -15.9 -13.0 Citations per extra MNCS
J. auth. internationality Significant Increasing 0.5 43.2 Citations per extra GINI
J. citer internationality Significant Decreasing -22.3 -46.8 Citations per extra GINI
Ref. auth. internationality Significant Increasing 4.1 23.0 Citations per extra GINI
Ref. citer internationality Significant Decreasing -67.1 -24.4 Citations per extra GINI
No. refs Significant Decreasing -0.6 -10.7 Citations per extra reference
No. pages Significant Decreasing -1.8 -9.4 Citations per extra page
Title Length Insignificant
Abs. length Significant Decreasing -0.2 -13.8 Citations per extra word
Abs. readability Insignificant
NB model Significance Decreasing/Increasing
citations
% change in
the mean
parameter of
positive
citation counts
for a unit
increase
% change
between
lower and
upper
quartiles
Unit
Field size Significant Increasing 0.4 6.1 Citations per extra paper
No. authors Insignificant
No. institutions Insignificant
No. countries Significant Decreasing -9.6 -9.6 Citations per extra country
JIF Significant Increasing 27.9 65.3 Citations per extra IF
Ref. impact Significant Increasing 0.2 13.4 Citations per extra citations
Author impact Significant Increasing 2.9 60.9 Citations per extra h-index
Institution impact Significant Increasing 2.4 1.6 Citations per extra MNCS
Country impact Significant Increasing 22.3 79.3 Citations per extra MNCS
J. auth. internationality Significant Decreasing -8.5 -23.5 Citations per extra GINI
J. citer internationality Significant Increasing 55.9 41.3 Citations per extra GINI
Ref. auth. internationality Significant Decreasing -22.4 -11.6 Citations per extra GINI
Ref. citer internationality Significant Increasing 90.3 11.0 Citations per extra GINI
No. refs Significant Increasing 0.7 12.6 Citations per extra reference
No. pages Significant Increasing 0.9 4.6 Citations per extra page
Title Length Insignificant
Abs. length Significant Increasing 0.2 13.8 Citations per extra word
Abs. readability Insignificant

119
6.20 Plant & Animal Science
The results of the VIF test show that there is no excessive multicollinearity
among the variables (Table B.19).
With respect to the NB model of Table 6.19, abstract readability is not a
significant factor for citation counts. The number of institutions, journal author
internationality, reference author internationality and title length significantly
associate with decreased citation counts whereas all the other factors significantly
associate with increased citations.
With respect to the logit model of Table 6.19, the number of institutions,
number of references, title length, abstract length and abstract readability are
insignificant factors for zero citations. All the other factors except for field size,
journal author internationality and reference author internationality significantly
associate with decreased zero citations.
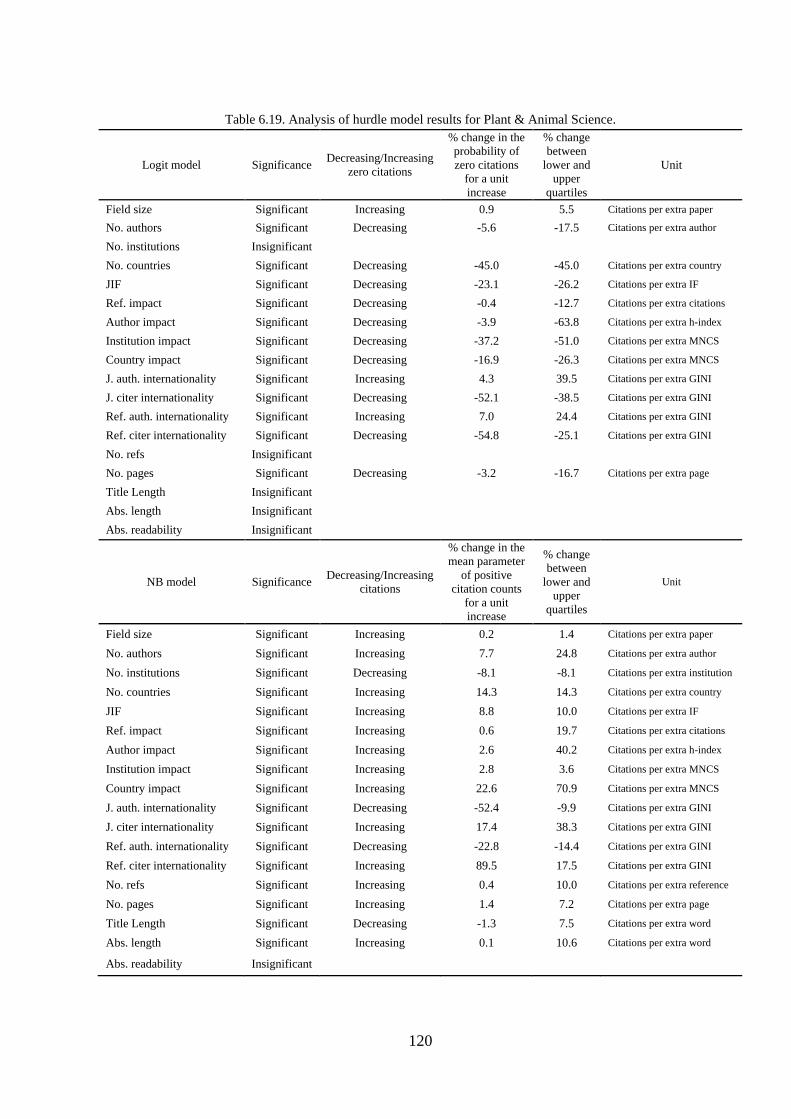
120
Table 6.19. Analysis of hurdle model results for Plant & Animal Science.
Logit model Significance Decreasing/Increasing
zero citations
% change in the
probability of
zero citations
for a unit
increase
% change
between
lower and
upper
quartiles
Unit
Field size Significant Increasing 0.9 5.5 Citations per extra paper
No. authors Significant Decreasing -5.6 -17.5 Citations per extra author
No. institutions Insignificant
No. countries Significant Decreasing -45.0 -45.0 Citations per extra country
JIF Significant Decreasing -23.1 -26.2 Citations per extra IF
Ref. impact Significant Decreasing -0.4 -12.7 Citations per extra citations
Author impact Significant Decreasing -3.9 -63.8 Citations per extra h-index
Institution impact Significant Decreasing -37.2 -51.0 Citations per extra MNCS
Country impact Significant Decreasing -16.9 -26.3 Citations per extra MNCS
J. auth. internationality Significant Increasing 4.3 39.5 Citations per extra GINI
J. citer internationality Significant Decreasing -52.1 -38.5 Citations per extra GINI
Ref. auth. internationality Significant Increasing 7.0 24.4 Citations per extra GINI
Ref. citer internationality Significant Decreasing -54.8 -25.1 Citations per extra GINI
No. refs Insignificant
No. pages Significant Decreasing -3.2 -16.7 Citations per extra page
Title Length Insignificant
Abs. length Insignificant
Abs. readability Insignificant
NB model Significance Decreasing/Increasing
citations
% change in the
mean parameter
of positive
citation counts
for a unit
increase
% change
between
lower and
upper
quartiles
Unit
Field size Significant Increasing 0.2 1.4 Citations per extra paper
No. authors Significant Increasing 7.7 24.8 Citations per extra author
No. institutions Significant Decreasing -8.1 -8.1 Citations per extra institution
No. countries Significant Increasing 14.3 14.3 Citations per extra country
JIF Significant Increasing 8.8 10.0 Citations per extra IF
Ref. impact Significant Increasing 0.6 19.7 Citations per extra citations
Author impact Significant Increasing 2.6 40.2 Citations per extra h-index
Institution impact Significant Increasing 2.8 3.6 Citations per extra MNCS
Country impact Significant Increasing 22.6 70.9 Citations per extra MNCS
J. auth. internationality Significant Decreasing -52.4 -9.9 Citations per extra GINI
J. citer internationality Significant Increasing 17.4 38.3 Citations per extra GINI
Ref. auth. internationality Significant Decreasing -22.8 -14.4 Citations per extra GINI
Ref. citer internationality Significant Increasing 89.5 17.5 Citations per extra GINI
No. refs Significant Increasing 0.4 10.0 Citations per extra reference
No. pages Significant Increasing 1.4 7.2 Citations per extra page
Title Length Significant Decreasing -1.3 7.5 Citations per extra word
Abs. length Significant Increasing 0.1 10.6 Citations per extra word
Abs. readability Insignificant

121
6.21 Psychiatry/Psychology
No serious multicollinearity was found among the variables in this field (Table
B.20).
With respect to the NB model of Table 6.20, number of institutions, number of
countries, and abstract readability are insignificant factors for citation counts. Field
size, journal author internationality, reference author internationality and title
length significantly associate with decreased citations whereas all the other factors
are significant determinants of increased citation counts.
With respect to the logit model of Table 6.20, field size, number of countries,
reference author internationality, reference citer internationality, number of
references, abstract length and abstract readability do not significantly associate
with zero citations. Except for journal author internationality and title length,
which significantly associate with increased zero citations, all the other factors are
significant determinants of decreased zero citations.

122
Table 6.20. Analysis of hurdle model results for Psychiatry/Psychology.
Logit model Significance Decreasing/Increasing
zero citations
% change in
the probability
of zero
citations for a
unit increase
% change
between
lower and
upper
quartiles
Unit
Field size Insignificant
No. authors Significant Decreasing -14.1 -30.2 Citations per extra author
No. institutions Significant Decreasing -9.1 -9.1 Citations per extra institution
No. countries Insignificant
JIF Significant Decreasing -0.7 -1.2 Citations per extra IF
Ref. impact Significant Decreasing -0.6 -33.0 Citations per extra citations
Author impact Significant Decreasing -2.5 -54.0 Citations per extra h-index
Institution impact Significant Decreasing -17.0 -15.2 Citations per extra MNCS
Country impact Significant Decreasing -15.9 -66.9 Citations per extra MNCS
J. auth. internationality Significant Increasing 2.2 43.5 Citations per extra GINI
J. citer internationality Significant Decreasing -10.7 -64.8 Citations per extra GINI
Ref. auth. internationality Insignificant
Ref. citer internationality Insignificant
No. refs Insignificant
No. pages Significant Decreasing -3.4 -30.2 Citations per extra page
Title Length Significant Increasing 3.4 18.9 Citations per extra word
Abs. length Insignificant
Abs. readability Insignificant
NB model Significance Decreasing/Increasing
citations
% change in
the mean
parameter of
positive
citation counts
for a unit
increase
% change
between
lower and
upper
quartiles
Unit
Field size Significant Decreasing -1.5 -2.9 Citations per extra paper
No. authors Significant Increasing 11.3 23.9 Citations per extra author
No. institutions Insignificant
No. countries Insignificant
JIF Significant Increasing 3.9 6.9 Citations per extra IF
Ref. impact Significant Increasing 0.8 46.2 Citations per extra citations
Author impact Significant Increasing 1.4 28.7 Citations per extra h-index
Institution impact Significant Increasing 2.1 1.9 Citations per extra MNCS
Country impact Significant Increasing 29.9 30.9 Citations per extra MNCS
J. auth. internationality Significant Decreasing -40.9 -12.5 Citations per extra GINI
J. citer internationality Significant Increasing 1.2 41.2 Citations per extra GINI
Ref. auth. internationality Significant Decreasing -37.0 -9.8 Citations per extra GINI
Ref. citer internationality Significant Increasing 29.9 2.1 Citations per extra GINI
No. refs Significant Increasing 0.5 14.5 Citations per extra reference
No. pages Significant Increasing 1.8 15.5 Citations per extra page
Title Length Significant Decreasing -1.1 -6.9 Citations per extra word
Abs. length Significant Increasing 0.1 7.4 Citations per extra word
Abs. readability Insignificant

123
6.22 Social Sciences, General
Based on the VIF test, no serious mutlicollinearity was found among the
variables in this field (Table B. 21).
With respect to the NB model of Table 6.21, field size and number of countries
insignificantly associate with citation counts. Except for journal author
internationality, reference author internationality and title length, all the other
factors significantly associate with increased citation counts to articles.
With respect to the logit model of Table 6.21, field size, number of countries,
reference author internationality, reference citer internationality, and title length
are not significant factors for zero citations. All the other factors except for the
number of institutions and journal author internationality contribute to decreased
zero citations.

124
Table 6.21. Analysis of hurdle model results for Social Sciences, General.
Logit model Significance Decreasing/Increasing
zero citations
% change in
the probability
of zero
citations for a
unit increase
% change
between
lower and
upper
quartiles
Unit
Field size Insignificant
No. authors Significant Decreasing -17.3 -37.7 Citations per extra author
No. institutions Significant Increasing 15.0 15.0 Citations per extra institution
No. countries Insignificant
JIF Significant Decreasing -19.2 -69.9 Citations per extra IF
Ref. impact Significant Decreasing -0.4 -13.2 Citations per extra citations
Author impact Significant Decreasing -3.4 -35.8 Citations per extra h-index
Institution impact Significant Decreasing -28.4 -27.8 Citations per extra MNCS
Country impact Significant Decreasing -22.9 -56.8 Citations per extra MNCS
J. auth. internationality Significant Increasing 12.2 32.1 Citations per extra GINI
J. citer internationality Significant Decreasing -11.9 -61.8 Citations per extra GINI
Ref. auth. internationality Insignificant
Ref. citer internationality Insignificant
No. refs Significant Decreasing -0.8 -27.1 Citations per extra reference
No. pages Significant Decreasing -3.0 -41.6 Citations per extra page
Title Length Insignificant
Abs. length Significant Decreasing -0.2 -18.3 Citations per extra word
Abs. readability Significant Decreasing -0.9 -17.5 Citations per extra Flesch Score
NB model Significance Decreasing/Increasing
citations
% change in
the mean
parameter of
positive
citation counts
for a unit
increase
% change
between
lower and
upper
quartiles
Unit
Field size Insignificant
No. authors Significant Increasing 10.6 22.4 Citations per extra author
No. institutions Significant Increasing 5.0 5.0 Citations per extra institution
No. countries Insignificant
JIF Significant Increasing 61.1 50.9 Citations per extra IF
Ref. impact Significant Increasing 0.6 20.4 Citations per extra median
citations
Author impact Significant Increasing 2.9 29.8 Citations per extra h-index
Institution impact Significant Increasing 4.4 4.8 Citations per extra MNCS
Country impact Significant Increasing 28.6 61.1 Citations per extra MNCS
J. auth. internationality Significant Decreasing -68.6 -6.7 Citations per extra GINI
J. citer internationality Significant Increasing 3.0 12.7 Citations per extra GINI
Ref. auth. internationality Significant Decreasing -38.7 -15.9 Citations per extra GINI
Ref. citer internationality Significant Increasing 57.0 9.8 Citations per extra GINI
No. refs Significant Increasing 0.5 16.2 Citations per extra reference
No. pages Significant Increasing 0.8 10.1 Citations per extra page
Title Length Significant Decreasing -2.0 -11.3 Citations per extra word
Abs. length Significant Increasing 0.1 8.8 Citations per extra word
Abs. readability Significant Increasing 0.3 5.5 Citations per extra Flesch Score

125
6.23 Space Sciences
Based on the VIF test, with a VIF of 5.58, the number of institutions has
excessive multicollinearity. The number of authors with a VIF of 3.24 has the next
highest multicollinearity (Table B.22).
With respect to the NB model of Table 6.22, the number of countries and
abstract readability are not significant factors for citation counts. The number of
institutions, journal citer internationality, reference author internationality, and title
length significantly associate with decreased citations. All the other factors
significantly associate with increased citations.
With respect to the logit model of Table 6.22, the number of countries,
reference impact, title length, abstract length, and abstract readability are not
significant factors for zero citations. The number of institutions, country impact,
and reference author internationality significantly associate with increased zero
citations whereas all the other factors significantly associate with decreased zero
citations.
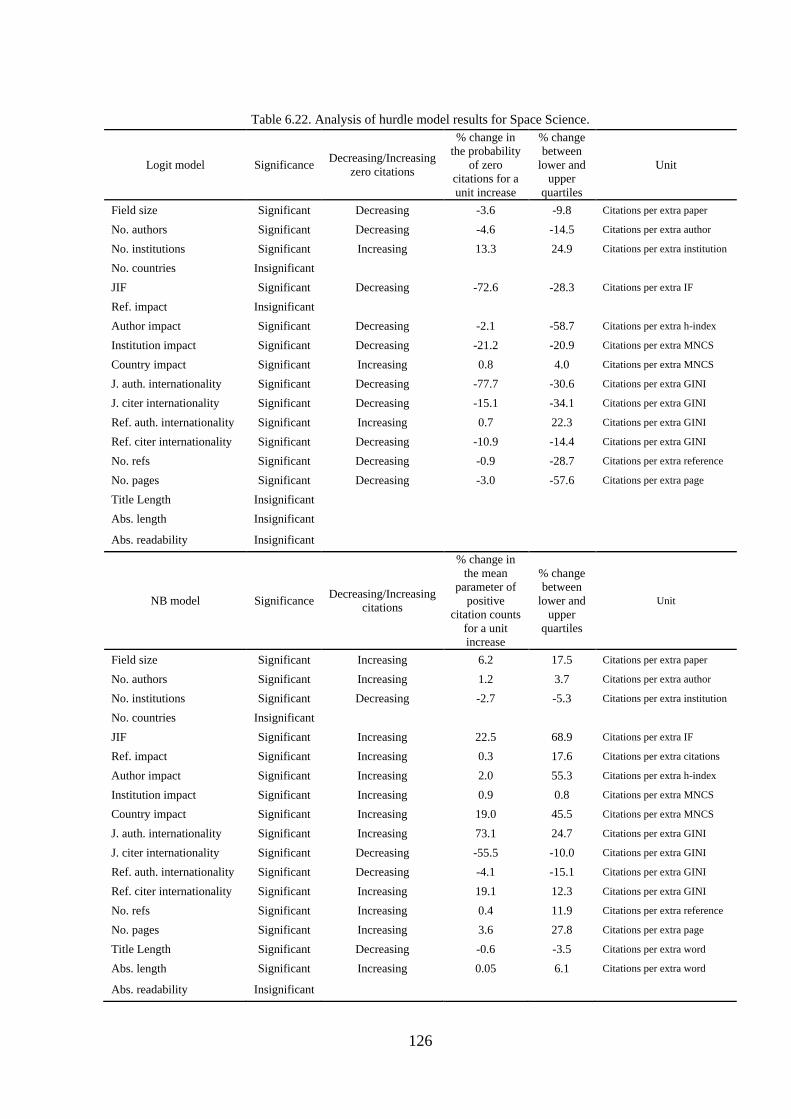
126
Table 6.22. Analysis of hurdle model results for Space Science.
Logit model Significance Decreasing/Increasing
zero citations
% change in
the probability
of zero
citations for a
unit increase
% change
between
lower and
upper
quartiles
Unit
Field size Significant Decreasing -3.6 -9.8 Citations per extra paper
No. authors Significant Decreasing -4.6 -14.5 Citations per extra author
No. institutions Significant Increasing 13.3 24.9 Citations per extra institution
No. countries Insignificant
JIF Significant Decreasing -72.6 -28.3 Citations per extra IF
Ref. impact Insignificant
Author impact Significant Decreasing -2.1 -58.7 Citations per extra h-index
Institution impact Significant Decreasing -21.2 -20.9 Citations per extra MNCS
Country impact Significant Increasing 0.8 4.0 Citations per extra MNCS
J. auth. internationality Significant Decreasing -77.7 -30.6 Citations per extra GINI
J. citer internationality Significant Decreasing -15.1 -34.1 Citations per extra GINI
Ref. auth. internationality Significant Increasing 0.7 22.3 Citations per extra GINI
Ref. citer internationality Significant Decreasing -10.9 -14.4 Citations per extra GINI
No. refs Significant Decreasing -0.9 -28.7 Citations per extra reference
No. pages Significant Decreasing -3.0 -57.6 Citations per extra page
Title Length Insignificant
Abs. length Insignificant
Abs. readability Insignificant
NB model Significance Decreasing/Increasing
citations
% change in
the mean
parameter of
positive
citation counts
for a unit
increase
% change
between
lower and
upper
quartiles
Unit
Field size Significant Increasing 6.2 17.5 Citations per extra paper
No. authors Significant Increasing 1.2 3.7 Citations per extra author
No. institutions Significant Decreasing -2.7 -5.3 Citations per extra institution
No. countries Insignificant
JIF Significant Increasing 22.5 68.9 Citations per extra IF
Ref. impact Significant Increasing 0.3 17.6 Citations per extra citations
Author impact Significant Increasing 2.0 55.3 Citations per extra h-index
Institution impact Significant Increasing 0.9 0.8 Citations per extra MNCS
Country impact Significant Increasing 19.0 45.5 Citations per extra MNCS
J. auth. internationality Significant Increasing 73.1 24.7 Citations per extra GINI
J. citer internationality Significant Decreasing -55.5 -10.0 Citations per extra GINI
Ref. auth. internationality Significant Decreasing -4.1 -15.1 Citations per extra GINI
Ref. citer internationality Significant Increasing 19.1 12.3 Citations per extra GINI
No. refs Significant Increasing 0.4 11.9 Citations per extra reference
No. pages Significant Increasing 3.6 27.8 Citations per extra page
Title Length Significant Decreasing -0.6 -3.5 Citations per extra word
Abs. length Significant Increasing 0.05 6.1 Citations per extra word
Abs. readability Insignificant

127
6.24 Research Funding in the four broad areas
Funding data in WoS is only available from August 2008 onwards. Therefore,
only 2009 data could be considered for the evaluation of the funding factor. Extra
models were run for 2009 data in the four broad areas, Physical Sciences, Life
Sciences, Medicine, and Social Sciences, to evaluate the funding factor and
compare the results across the fields.
All the factors including the research funding factor are considered in the new
models. The original results of the models are presented in Tables D.1-D.4 and the
interpreted results are given in Tables 6.23-6.26.
6.24.1 Physical Sciences
The results of the VIF test show that the number of institutions has excessive
multicollinearity (VIF>4; Table B.23).
With respect to the NB model of Table 6.23, field size, number of institutions,
institution impact, reference citer internationality, number of pages, title length,
and abstract readability are not significant factors for citation counts in Physical
Sciences. Journal author internationality and abstract length significantly associate
with decreased citation counts. The newly added factor, research funding,
significantly associates with increased citation counts (43.6% increase due to a
unit increase in the factor and a 56.7% increase for a change between the lower
and upper quartiles).
With respect to the logit model of Table 6.23, field size, number of institutions,
reference impact, reference author internationality, reference citer internationality,
number of pages, title length, abstract length, and abstract readability are

128
insignificant factors for zero citations. Institution impact and journal author
internationality significantly associate with increased zero citations while all the
other factors significantly associate with decreased zero citations.

129
Table 6.23. Analysis of hurdle model results for Physical Sciences.
Logit model Significance Decreasing/Increasing
zero citations
% change in the
probability of
zero citations for
a unit increase
% change
between
lower and
upper
quartiles
Unit
Field size Insignificant
No. authors Significant Decreasing -2.8 -8.4 Citations per extra author
No. institutions Insignificant
No. countries Significant Decreasing -41.1 -41.1 Citations per extra country
JIF Significant Decreasing -26.0 -64.3 Citations per extra IF
Ref. impact Insignificant
Author impact Significant Decreasing -1.5 -25.2 Citations per extra h-index
Institution impact Significant Increasing 15.0 11.3 Citations per extra MNCS
Country impact Significant Decreasing -31.0 -23.1 Citations per extra MNCS
J. auth. internationality Significant Increasing 9.1 69.9 Citations per extra GINI
J. citer internationality Significant Decreasing -11.1 -20.7 Citations per extra GINI
Ref. auth. internationality Insignificant
Ref. citer internationality Insignificant
No. refs Significant Decreasing -1.1 -28.8 Citations per extra reference
No. pages Insignificant
Title Length Insignificant
Abs. length Insignificant
Abs. readability Insignificant
Funding Significant Decreasing -4.2 -58.9 Extra citations if funded
NB model Significance Decreasing/Increasing
citations
% change in the
mean parameter
of positive
citation counts
for a unit
increase
% change
between
lower and
upper
quartiles
Unit
Field size Insignificant
No. authors Significant Increasing 0.9 2.7 Citations per extra author
No. institutions Insignificant
No. countries Significant Increasing 24.1 24.1 Citations per extra country
JIF Significant Increasing 13 30.3 Citations per extra IF
Ref. impact Significant Increasing 0.9 32.2 Citations per extra citations
Author impact Significant Increasing 1.3 21.5 Citations per extra h-index
Institution impact Insignificant
Country impact Significant Increasing 10.6 8.1 Citations per extra MNCS
J. auth. internationality Significant Decreasing -8.0 -31.4 Citations per extra GINI
J. citer internationality Significant Increasing 61.5 13.6 Citations per extra GINI
Ref. auth. internationality Significant Increasing 18.3 24.2 Citations per extra GINI
Ref. citer internationality Insignificant
No. refs Significant Increasing 0.8 20.2 Citations per extra reference
No. pages Insignificant
Title Length Insignificant
Abs. length Significant Decreasing -0.1 -10 Citations per extra word
Abs. readability Insignificant
Funding Significant Increasing 43.6 43.6 Extra citations if funded

130
6.24.2 Life Sciences
Reference citer internationality and reference author internationality have
excessive multicollinearity (VIF>4; Table B.24).
With respect to the NB model of Table 6.24, field size, number of institutions,
and abstract length are not significant factors of citation counts. Journal author
internationality, reference citer internationality, title length, and abstract
readability significantly associate with decreased citations. All the other factors
significantly associate with increased citation counts. Funding significantly
associates with increased citations and an increase from the lower to upper quartile
in the factor associated with a 37.3% increase in citation counts.
With respect to the logit model of Table 6.24, field size, number of institutions,
reference impact, reference author internationality, reference citer internationality,
number of pages, title length, abstract length and abstract readability are
insignificant factors of zero citations. All remaining factors except for journal
author internationality significantly associate with decreased zero citations.

131
Table 6.24. Analysis of hurdle model results for Life Sciences.
Logit model Significance
Decreasing/Increasing
probability of zero
citations
% change in the
probability of
zero citations for
a unit increase
% change
between
lower and
upper
quartiles
Unit
Field size Insignificant
No. authors Significant Decreasing -4.3 -18.3 Citations per extra author
No. institutions Insignificant
No. countries Significant Decreasing -35.5 -35.5 Citations per extra country
JIF Significant Decreasing -74.7 -37.9 Citations per extra IF
Ref. impact Insignificant
Author impact Significant Decreasing -1.4 -26.9 Citations per extra h-index
Institution impact Significant Decreasing -15.6 -24.3 Citations per extra MNCS
Country impact Significant Decreasing -49.0 -31.2 Citations per extra MNCS
J. auth. internationality Significant Increasing 16.5 24.6 Citations per extra GINI
J. citer internationality Significant Decreasing -47.2 -65.6 Citations per extra GINI
Ref. auth. internationality Insignificant
Ref. citer internationality Insignificant
No. refs Significant Decreasing -0.9 -23.0 Citations per extra reference
No. pages Insignificant
Title Length Insignificant
Abs. length Insignificant
Abs. readability Insignificant
Funding Significant Decreasing -26.7 -26.7 Extra citations if funded
NB model Significance Decreasing/Increasing
citations
% change in the
mean parameter
of positive
citation counts
for a unit
increase
% change
between
lower and
upper
quartiles
Unit
Field size Insignificant
No. authors Significant Increasing 2.9 11.9 Citations per extra author
No. institutions Insignificant
No. countries Significant Increasing 21.7 21.7 Citations per extra country
JIF Significant Increasing 25.7 64.8 Citations per extra IF
Ref. impact Significant Increasing 0.3 10.4 Citations per extra citations
Author impact Significant Increasing 1.2 20.6 Citations per extra h-index
Institution impact Significant Increasing 1.3 2.0 Citations per extra MNCS
Country impact Significant Increasing 6.4 4.3 Citations per extra MNCS
J. auth. internationality Significant Decreasing -28.7 -17.8 Citations per extra GINI
J. citer internationality Significant Increasing 82.3 72.6 Citations per extra GINI
Ref. auth. internationality Significant Increasing 69.2 22.4 Citations per extra GINI
Ref. citer internationality Significant Decreasing -3.2 -23.7 Citations per extra GINI
No. refs Significant Increasing 0.6 14.8 Citations per extra reference
No. pages Significant Increasing 1.6 6.2 Citations per extra page
Title Length Significant Decreasing -1.0 -5.8 Citations per extra word
Abs. length Insignificant
Abs. readability Significant Decreasing -0.4 -7.0 Citations per extra Flesh Score
Funding Significant Increasing 37.3 37.3 Extra citations if funded

132
6.24.3 Medicine
No serious multicollinearity was found among the variables in Medicine. The
maximum VIFs were 2.41 and 2.25 for reference author internationality and
reference citer internationality, respectively (Table B.25).
With respect to the NB model of Table 6.25, field size, title length, and abstract
readability are not significant determinants of citation counts. All the other factors
except for journal author internationality and reference citer internationality
significantly associate with increased citations. Research funding significantly
associates with increased citations and contributes to a 30.6% increase in the
citation counts.
With respect to the logit model of Table 6.25, field size, reference author
internationality, reference citer internationality, title length, abstract length, and
abstract readability insignificantly associate with zero citations. All the other
factors except for institution impact and journal author internationality
significantly associate with decreased zero citations.

133
Table 6.25. Analysis of hurdle model results for Medicine.
Logit model Significance Decreasing/Increasing
zero citations
% change in the
probability of
zero citations
for a unit
increase
% change
between
lower and
upper
quartiles
Unit
Field size Insignificant
No. authors Significant Decreasing -9.5 -31.4 Citations per extra author
No. institutions Significant Decreasing -6.9 -14.3 Citations per extra institution
No. countries Significant Decreasing -16.6 -16.6 Citations per extra country
JIF Significant Decreasing -56.9 -70.4 Citations per extra IF
Ref. impact Significant Decreasing -0.4 -14.6 Citations per extra citations
Author impact Significant Decreasing -1.5 -33.0 Citations per extra h-index
Institution impact Significant Increasing 17.2 3.9 Citations per extra MNCS
Country impact Significant Decreasing -25.7 -13.6 Citations per extra MNCS
J. auth. internationality Significant Increasing 5.9 33.7 Citations per extra GINI
J. citer internationality Significant Decreasing -29.6 -4.0 Citations per extra GINI
Ref. auth. internationality Insignificant
Ref. citer internationality Insignificant
No. refs Significant Decreasing -1.9 -56.8 Citations per extra reference
No. pages Significant Decreasing -2.2 -11.6 Citations per extra page
Title Length Insignificant
Abs. length Insignificant
Abs. readability Insignificant
Funding Significant Decreasing -69.8 -69.8 Extra citations if funded
NB model Significance Decreasing/Increasing
citations
% change in the
mean parameter
of positive
citation counts
for a unit
increase
% change
between
lower and
upper
quartiles
Unit
Field size Insignificant
No. authors Significant Increasing 0.9 29.0 Citations per extra author
No. institutions Significant Increasing 6.5 13.4 Citations per extra institution
No. countries Significant Increasing 21.2 21.2 Citations per extra country
JIF Significant Increasing 24.7 62.8 Citations per extra IF
Ref. impact Significant Increasing 1.4 31.0 Citations per extra citations
Author impact Significant Increasing 1.1 23.2 Citations per extra h-index
Institution impact Significant Increasing 26.4 4.8 Citations per extra MNCS
Country impact Significant Increasing 49.8 25.4 Citations per extra MNCS
J. auth. internationality Significant Decreasing -43.3 -11.4 Citations per extra GINI
J. citer internationality Significant Increasing 86.7 76.5 Citations per extra GINI
Ref. auth. internationality Significant Increasing 81.5 42.3 Citations per extra GINI
Ref. citer internationality Significant Decreasing -0.1 -30.1 Citations per extra GINI
No. refs Significant Increasing 0.9 25.2 Citations per extra reference
No. pages Significant Increasing 3.1 16.2 Citations per extra page
Title Length Insignificant
Abs. length Significant Increasing 0.1 10.6 Citation per extra word
Abs. readability Insignificant
Funding Significant Increasing 30.6 30.6 Extra citations if funded

134
6.24.4 Social Sciences
There is no serious multicollinearity among the factors and the maximum VIF
was 3.91 for the number of institutions (Table B.26).
With respect to the NB model of Table 6.26, field size, number of institutions,
number of countries, reference impact, number of pages, title length, abstract
length, abstract readability, and research funding are not significant factors for
citation counts in Social Sciences. Journal author internationality and reference
citer internationality significantly associate with decreased citation counts whereas
all the other factors significantly associate with increased citations.
With respect to the logit model of Table 6.26, field size, number of institutions,
number of countries, reference impact, author impact, reference author
internationality, reference citer internationality, abstract length, the abstract
readability and research funding are not significant determinants of zero citations
but all the other factors except for institution impact and journal author
internationality significantly associate with decreased zero citations.

135
Table 6.26. Analysis of hurdle model results for Social Sciences.
Logit model Significance Decreasing/Increasing
zero citations
% change in the
probability of
zero citations for
a unit increase
% change
between
lower and
upper
quartiles
Unit
Field size Insignificant
No. authors Significant Decreasing -7.1 -14.8 Citations per extra author
No. institutions Insignificant
No. countries Insignificant
JIF Significant Decreasing -45.1 -39.6 Citations per extra IF
Ref. impact Insignificant
Author impact Insignificant
Institution impact Significant Increasing 50.1 5.4 Citations per extra MNCS
Country impact Significant Decreasing -16.3 -3.7 Citations per extra MNCS
J. auth. internationality Significant Increasing 16.8 26.6 Citations per extra GINI
J. citer internationality Significant Decreasing -76.0 -85.3 Citations per extra GINI
Ref. auth. internationality Insignificant
Ref. citer internationality Insignificant
No. refs Significant Decreasing -1.8 -68.5 Citations per extra reference
No. pages Significant Decreasing -1.9 -25.6 Citations per extra page
Title Length Significant Decreasing -3.0 -19.0 Citations per extra word
Abs. length Insignificant
Abs. readability Insignificant
Funding Insignificant
NB model Significance Decreasing/Increasing
citations
% change in the
mean parameter
of positive
citation counts
for a unit
increase
% change
between
lower and
upper
quartiles
Unit
Field size Insignificant
No. authors Significant Increasing 0.1 0.2 Citations per extra author
No. institutions Insignificant
No. countries Insignificant
JIF Significant Increasing 25.5 22.5 Citations per extra IF
Ref. impact Insignificant
Author impact Significant Increasing 2.7 28.2 Citations per extra h-index
Institution impact Significant Decreasing -11.5 -16.0 Citations per extra MNCS
Country impact Significant Increasing 6.9 1.6 Citations per extra MNCS
J. auth. internationality Significant Decreasing -77.2 -4.4 Citations per extra GINI
J. citer internationality Significant Increasing 11.0 47.3 Citations per extra GINI
Ref. auth. internationality Significant Increasing 42.9 37.5 Citations per extra GINI
Ref. citer internationality Significant Decreasing -3.3 -24.2 Citations per extra GINI
No. refs Significant Increasing 0.9 29.8 Citations per extra reference
No. pages Insignificant
Title Length Insignificant
Abs. length Insignificant
Abs. readability Insignificant
Funding Insignificant

136
6.25 Summary
This chapter presented the results from modelling associations between
citation factors and citation counts in 22 subject categories and also in 4 broad
areas. The results show that there are some significant factors for citations in each
field that strongly associate with increased citation counts and decreased zero
citations. The extent to which each factor associates with increased positive
citation counts and decreased zero citations is reported in the tables above.

137
CHAPTER 7. DISCUSSION
7.1 Introduction
This study simultaneously assessed the existence and strength of associations
between 19 article properties and article citation impact in 22 subject categories
and in four broad areas of science. Using the VIF test, excessive multicollinearity
was found among variables in some areas but none of the variables were excluded
from the models. The VIF test results were reported to show reduced confidence in
the values of some of the variables. The results are discussed factor-by-factor
below.
7.2 Individual collaboration
Individual collaboration, measured by the number of authors per article, is a
significant determinant of increased citation counts in all subject categories except
for Physics and also in all four broad areas. This factor associates with decreased
zero citations in all categories except for Microbiology, Multidisciplinary,
Pharmacology & Toxicology, and Physics, in all of which the number of authors is
an insignificant factor. As discussed in the literature review, many studies in
different fields of science also confirm that multi-author research receives more
citations than does solo research (Chen, 2012; Franceschet & Costantini, 2010;
Gazni & Didegah, 2010; Persson, 2010) except in library and information science
(Hart, 2007), economy and finance (Medoff, 2003; Avkiran, 1997), social and
personality psychology (Haslam, et al., 2008), and chemistry (Bornmann, Schier,
Marx, & Daniel, 2012). Higher-quality research is expected from team working

138
due to multiple perspectives generating more ideas and discussions, and multiple
skills enhancing the final product quality. Another study, of molecular biology in a
number of institutions, credits self-citations for the higher citation impact of
collaborative research compared to solo research (Herbertz, 1995) whereas a study
of astronomical research in the Netherlands found contrary results that self-
citations do not amplify the effect of collaboration on citation impact (Van Raan,
1998).
The negative results above may be due to the smaller sample sizes giving
insufficient statistical power to identify any association. It is also possible that
collaboration is not helpful in some narrow fields. The findings here confirm that
more authors associate with more citations in all areas of science and social
sciences except for Physics. This contradictory finding for Physics may be due to
the multicollinearity found for the number of authors (VIF=6.08), highly
correlating with the number of institutions (r=0.66). Modelling the number of
authors separately, this factor significantly associates with increased citations and
decreased zero citations in Physics (NB model: Coef.= 0.007, p< 0.001; logit
model: Coef.= 0.015, p< 0.001). Most importantly, the findings for the importance
of collaboration in the 21 fields are robust in the sense of taking into account all
other major extrinsic document properties likely to affect citation counts.
Regarding the extent to which the number of authors associates with increased
citation counts, the percentage increase due to a unit increase in the number of
authors (i.e. an extra author) ranges from 1.2% in Space Sciences to 16.3% in
Economics & Business. A change from the lower to upper quartile in the factor
results in 3.7% (in Space Sciences) to 35.3% (in Economics & Business) increases

139
in the citation counts. As with previous studies, the propensity for research
collaboration is different across subject fields and is higher in natural sciences than
in social sciences (Larivière, Gingras, & Archambault, 2006; Nederhof, 2006;
Cronin, Shaw & La Barre, 2004; Moody, 2004). A closer look at the sample data
shows that space scientists extensively collaborate since only 11% of Space
Sciences articles are single-authored and the average number of authors per article
is 4.96, whereas 39% of articles in Social Sciences are written by single authors
and the average number of authors per article is 1.99. So, team working,
particularly with a large number of authors, to conduct research is very common in
Space Sciences whereas economists collaborate less. About 40% of articles in
Economics & Business are single-authored and the 16% increase in the citation
counts in this field is mainly due to the difference between the citation counts for
single-author articles versus multi-author articles. A unit increase in the number of
authors also associates with about a 16% increase in the citation counts in
Mathematics. Researchers in this field have similar collaboration behaviours to
Economists in the sense that 40% of articles in Mathematics are single-authored
and the average number of authors per article is 1.89.
Overall, the percentage increase in the citation counts per extra author
negatively correlates with the average number of authors per article in each field
(r= -0.63, p< 0.001, n=22) suggesting that the impact of individual collaborations
on citations is higher in fields with less collaboration. This finding suggests that
fields with little collaboration benefit most from research collaboration and this
should motivate their researchers to take part in team working and collaboration.
This is based upon the assumption that collaborative research is better because it

140
attracts more citations. It is possible that there is a greater benefit from
collaboration for all research with a small number of authors, but the models report
only a single figure for the effect of an increase in collaboration and are not
capable of showing any effect of collaboration size on collaboration citation
impact in different research areas.
7.3 Institutional collaboration
Institutional collaboration significantly associates with increased citations only
in Clinical Medicine and Social Sciences, General, in which a unit increase and
also an increase from the lower to upper quartile in the number of institutions
associates with 7.5% and 5% increases in Clinical Medicine and Social Sciences,
General, respectively. The factor is not significant for citation counts in Economics
& Business, Engineering, Geosciences, Immunology, Mathematics, Molecular
Biology & Genetics, Multidisciplinary, Pharmacology & Toxicology, Physics,
Psychology/Psychiatry, and Space Science. It significantly associates with
decreased citation counts in the remaining subject categories, such as in
Agricultural Sciences, Biology & Biochemistry, and Chemistry. In the 2009
sample data, the factor significantly associates with increased citations in Medicine
but it is an insignificant factor for citations in Physical Sciences, Life Sciences,
and Social Sciences.
Institutional collaboration significantly associates with increased zero citations
in most fields but it associates with decreased zero citations in Clinical Medicine,
Geosciences, and Psychology/Psychiatry. Moreover, the factor is insignificant for
zero citations in Biology & Biochemistry, Economics & Business, Immunology,

141
Mathematics, and Molecular Biology & Genetics. Among the four broad areas,
institutional collaboration significantly associates with decreased zero citations
only in Medicine.
Institutional collaboration has a moderate to high correlation with individual
collaboration and international collaboration. The results of the VIF tests also
show that this factor has serious multicollinearity in some categories (see
Appendix B). This issue may have affected the results of the hurdle models for this
factor since it is not an important factor in most areas. Perhaps because of
collinearity, the results of the simultaneous hurdle model and the separate hurdle
model for the number of institutions differ. In other words, in the analysis of the
number of institutions together with the other variables, this variable associates
with decreased citation counts or is insignificant in most areas while in a separate
hurdle model for the number of institutions only, it significantly associates with
increased citation counts in all areas. This suggests that, analysed separately,
institutional collaboration appears to be beneficial but this is only because it is a
type of collaboration and not because additional institutions help research. In other
words, studies that benefit from extra authors are not likely to benefit from
recruiting them from other institutions rather than from the local institution.
The effect of institutional collaboration on citation counts was analysed
separately in more detail for Biology & Biochemistry and Chemistry. Keeping the
number of authors and the number of countries constant at different values, extra
hurdle models were run. In the majority of cases, the coefficient of the number of
citations was not significant and the results were not consistent and varied from
one number of countries to another. So the overall evidence of the impact of the

142
number of institutions in Biology & Biochemistry and Chemistry is unclear (Table
E1), but it seems that this is not an important factor.
7.4 International collaboration
International collaboration is not a significant factor for citation counts in
Computer Science, Economics & Business, Engineering, Mathematics,
Microbiology, Multidisciplinary, Neuroscience & Behaviour,
Psychology/Psychiatry, Social Sciences, General, and Space Sciences. This factor
significantly associates with increased citations in all the other categories and
broad areas except for Physics. The contradictory finding in Physics may be due to
the high multicollinearity found for research collaboration factors in this field
(Table B.18). Regarding the logit model, international collaboration is not a
significant factor for zero citations in several categories: Agricultural Science,
Computer Science, Economics & Business, Engineering, Microbiology,
Multidisciplinary, Physics, Psychology/Psychiatry, Social Sciences, General,
Space Sciences, and among the broad areas in Social Sciences. International
collaboration means that the authors of a paper are from different countries. The
number of countries has been found to be significant for increased citations in the
majority of previous studies (Sin, 2011; Persson, 2010; Sooryamoorthy, 2009;
Schmoch and Schubert, 2008; Aksnes, 2003; Glänzel, 2001; Van Raan, 1998; Katz
& Hicks, 1997; Narin, Stevens, & Whitlow, 1991) and collaborating with high-
prestige countries in terms of research and development increases the citation
impact of publications even more (Bordons, Aparicio, & Costas, 2012; Lancho-
Barrantes, Guerrero-Bote & de Moya-Anegón, 2013).

143
The contradiction between the results of this study and some previous studies
of international collaboration may be due to the limited geographical and
institutional coverage of previous research or may be due to the simpler statistical
models used in most previous studies, which mostly did not analyse multiple
factors simultaneously. The association between the number of countries and
citations for all subject areas except for a few areas is confirmed here. The finding
is robust in the sense of considering many other major factors likely to affect
citation counts.
The percentage increase in citation counts due to either a unit increase or an
increase between the lower and upper quartiles in international collaboration
ranges from 4.3% in Pharmacology & Toxicology to 14.3% in Plant & Animal
Science and averages 9.26% for all categories, showing that the contribution is
substantial although not large in the majority of categories. Among the four broad
areas in 2009, international collaboration very strongly associates with increased
citations in Physical Sciences and each extra country affiliation associates with an
increase in the citation counts of 24.1%. Bearing in mind that international
collaboration is not a significant determinant of citation counts in Economics &
Business and Social Sciences, General for the whole ten years, it is an insignificant
factor for citation counts also in the broad Social Sciences, consisting of these two
categories.
There is a moderate correlation between the three research collaboration
factors in all areas and that is why the number of institutions has the maximum
VIF in most areas (See Appendix B), although it is not counted as excessive

144
multicollinearity except for Physics. In summary, the correlation between these
factors is likely to affect their associations with citation counts.
7.5 Journal Impact Factor
The JIF significantly associates with increased citations and decreased zero
citations in all the subject categories and broad areas. This is unsurprising because
JIFs are based upon average citations and so article citations should be
mathematically related to the publishing journal JIF. Top journals in a field
presumably also receive increased attention due to a perception that they contain
higher-quality content (Haslam et al., 2008; Meadows, 1998). In agreement with
the current findings, a number of studies have also found that journal impact is an
important determinant of citations in a range of scientific fields (Bornmann &
Daniel, 2007a; Boyack & Klavans, 2005; Van Dalen & Henkens, 2005; Callaham,
Wears, & Weber, 2002; Lovaglia, 1989) with some minor exceptions (e.g.,
Stremersch, Verniers & Verhoef, 2007). Therefore, the results of the current study
confirm the association between the JIF and citations for all subject areas. The
finding is robust in the sense of considering many other major factors likely to
affect citation counts.
A unit increase in the JIF associates with citation increases from 1.8% in
Materials Science to 61.1% in Social Sciences, General. A change between the
lower and upper quartiles in JIFs of Materials Science and Social Sciences journals
also results in increases of between 2.2% and 50.9% in the citation counts. A
closer look at the sample data reveals that the average impact of journals differs
substantially across subject categories. The average JIF in Social Sciences,

145
General is 0.93 in the sample data, whereas it is 3.5 for Materials Science journals
and 11 for Multidisciplinary journals. There are several high-impact journals in
Multidisciplinary and Materials Science but not all papers published in these
journals are highly cited since citation distributions are typically highly skewed.
Therefore, there may be a number of articles in these categories that have few
citations but are in high impact journals and hence negatively affect the association
between article citation counts and publishing journal JIFs. Another possible
explanation is that the numerical JIF difference between high impact journals in
categories like Multidisciplinary is less significant for the average article than the
difference between high JIF and low JIF journals in the typical subject category.
It seems that in subject categories with a lower average journal Impact Factor,
a higher percentage increase in citation counts is expected from JIF increases. In
addition to Social Sciences, the extent to which the JIF associates with mean
citation counts in Computer Science (52.2% increase per unit increase, 60.5%
increase between quartiles) and Geosciences (43.9% increase per unit increase,
84.4% increase between quartiles) is also quite high and the average journal
impacts in these categories are 0.98 and 1.75, respectively.
The JIF very strongly associates with decreased zero citations in all categories
and fields, revealing that while publishing in high-impact journals may not always
lead to many citations, it is still very important.
7.6 Reference impact
The impact of references associates with increased citations in all subject
categories and broad areas except for Mathematics and the broad Social Sciences,
146
in which it is insignificant. Regarding the logit model, the reference impact is an
insignificant factor for zero citations in Chemistry, Mathematics, Microbiology,
Pharmacology & Toxicology, and Space Science. The factor is significant for
decreased zero citations in all other categories. As with previous studies
(Bornmann, Schier, Marx, & Daniel, 2012; Lancho-Barrantes, Guerrero-Bote, &
Moya-Anegon, 2010; Haslam et al., 2008; Boyack & Klavans, 2005; Peters & Van
Raan, 1994), higher reference impact significantly associates with increased
citations to articles in most fields. Two possible explanations for this are that
papers with high-impact references are citing more important works and tackling
more significant problems, or that papers with high-impact references are in
subfields with high citation norms.
In summary, the association between the reference impact and citation counts
for all subject areas except for a few subfields is confirmed. The result is robust in
the sense of considering many other major article properties likely to affect
citation counts.
Reference impact does not contribute to a large change in the citation counts
of articles; for a unit increase in the factor, the percentage increase averages
around only 0.5% for all categories and fields. Whilst this change seems to be too
small to be significant, the percentage increase for a change between the upper and
lower quartiles averages 26.7%, ranging from 46.2% in Psychiatry/Psychology to
0.8% in Chemistry. In practical terms, this might mean that forgetting to cite two
key highly cited articles could be very costly for the eventual impact of an article.
This factor weakly correlates with the number of references, and the number of
references significantly associates with increased citation counts in all categories

147
and fields. Therefore, using an appropriate number of high-impact references will
increase the likelihood of greater citation impact for an article.
No significant association between reference impact and citation counts was
found in Mathematics. The average median citation impact of references in
Mathematics is 18, whereas it is much higher in other categories, such as Physics
(Avg.= 85), Clinical Medicine (Avg.= 70) and Social Sciences (Avg.= 42), and
this suggests a different citation culture in Mathematics. The number of references
associates with increased citation counts in this category but does not correlate
with reference impact. Therefore, presumably having more references suffices to
enhance article citation impact in Mathematics and it is not necessary to pick high-
impact references. This also suggests that mathematicians may be less impressed
by important references than are other researchers.
Reference impact is not a significant factor for citation counts in the broad
Social Sciences whereas it is significant in its two sub-fields (i.e. Economics &
Business and Social Sciences, General). This result may be due to the smaller
sample size of the broad Social Sciences, which is limited to the 2009 data only.
Reference impact associates with decreased zero citations in most fields.
Although a unit increase in the factor associates with an average 0.6% decrease in
the zero citations in all categories, a change between the lower and upper quartiles
contributes to an average 33.4% decrease.
7.7 Author impact
Author impact significantly associates with increased citation counts in all
categories and broad areas. The factor contribution to an increase in article citation

148
impact ranges from a 0.6% per unit increase in the h-index in Pharmacology &
Toxicology and Plant & Animal Science to 6.6% in Mathematics. The average
increase in the citation counts due to a unit increase in the factor is 2.3% for all
categories whereas an increase from the lower to the upper quartile in the factor
associates with an average 36.1% increase in the citations. Similarly, author
impact significantly associates with decreased zero citations in all categories and
broad areas except for the broad Social Sciences, in which this factor is not
significant. A unit increase in the h-index associates with an average 2.8%
decrease in zero citations in all categories while an increase from the lower to
upper quartile in the factor associates with an average 48.3% decrease.
The association between the author impact and citation counts for all subject
areas is confirmed. The result is robust in the sense of considering many other
major article properties likely to affect citation counts. The results of previous
studies concur with the findings of this study (Vanclay, 2013; Stremersch,
Verniers & Verhoef, 2007). Highly cited authors tend to continue to produce
highly cited articles according to the Matthew Effect (Haslam et al., 2008; Merton,
1968; 1988). Moreover, prestigious authors are inclined to publish in high-impact
journals (Vanclay, 2013), but this factor does not explain the finding because the
JIF is taken into account as a separate factor in this thesis.
7.8 Institution impact
Institution impact, as measured by the average number of citations that an
institution received to its publications normalized by the subject field, divided by
the total number of publications from the institution, is a significant determinant of

149
increased citation counts in all categories and broad areas except for Mathematics
and the broader Physical Sciences. The percentage increase in the mean parameter
for citations due to a unit increase in institution impact ranges from 0.7%
(Molecular Biology & Genetics) to 5% (Computer Science) whereas it averages
2.5% for all subject categories for a change between the lower and upper quartiles.
With respect to the logit model, institution impact associates with decreased
zero citations in all subject categories and a unit increase in the factor associates
with an average 28.5% decrease in the probability of zero citations in all
categories. The factor contribution to decreased zero citations due to an increase
from the lower to upper quartile in MNCS scores also averages 33.4% for all
categories. It significantly associates with increased zero citations in three of the
four broad areas (Physical Sciences, Medicine, and Social Sciences). The four
broad areas were examined with a sample of 2009 data and the results show that
institution impact behaves differently in 2009 in comparison to the full ten years
(2000-2009). The smaller sample size may have affected the different results for
2009. The pilot study of Nanoscience & Nanotechnology (see Chapter 3) also
found that some factors behave differently in the full three years compared to each
year separately.
The current findings show no significant association between institution
impact and article citation impact in Mathematics, suggesting that the prestige of
affiliated institutions cannot help to determine the citation counts for single articles
in this area. Institution impact was gauged by the expected number of citations
divided by the total number of publications from the institution, disregarding all
qualitative merits such as awards, prizes or number of highly qualified members,
150
which may better reflect institutional prestige. Based on the results, highly cited
research in Mathematics is not published predominantly by top-ranked universities
based on their MNCS score. Given that many universities are specialized and
perform well in a specific field (Moed, de Moya-Anegón, López-Illescas, &
Visser, 2011) and that the MNCS score used in the current study is not field-
specific, a university may be highly ranked based on the MNCS score but, for
instance, its Mathematics department may not perform well in research and vice
versa. Hence, the insignificant association found in some fields may be due to the
limitation of the indicator used to measure the factor, assuming that highly cited
mathematicians do not tend to gravitate towards high impact institutions and that
other academics do.
Overall, the findings here confirm the existence of an association between
institutional impact and citations for all subject areas except for Mathematics. The
finding is robust in the sense of considering many other major factors likely to
affect citation counts.
7.9 Country impact
Country impact is a significant factor for both positive citation counts and zero
citations in all subject categories and broad areas. This factor was measured by the
MNCS indicator, which is a field-normalised estimator of the average number of
citations per article for a country. These findings concur with the results of
previous studies examining the effect of country prestige on article citation impact
in which country impact positively affects the citation impact of articles published
in the country (Leimu & Koricheva, 2005a).
151
A unit increase in country impact associates with an average 22.7% increase
and a change from the lower to upper quartile in the factor associates with a 47.6%
increase in the positive citation counts. With respect to the logit model, an increase
from the lower to upper quartile in the MNCS score associates with an average
47% decrease in the zero citations in all categories and areas.
In summary, the existence of an association between country impact and
citations is confirmed for all categories and areas examined. The finding is robust
in the sense of considering many other major factors likely to affect citation
counts.
7.10 Journal internationality
Using the Gini coefficient, journal internationality was measured from two
perspectives: the geographic dispersion of authors in a journal and the geographic
dispersion of authors citing a journal. Journal author internationality is a
significant factor for decreased citations in most subject categories except for
Biology & Biochemistry, Microbiology, Neuroscience & Behaviour, and Space
Science in which it associates with increased citation counts. Gini coefficients
closer to 1 indicate less internationality, so a negative association between the
internationality score and citation counts means that more international journals
receive more citations and vice versa. An increase from the lower to upper quartile
in Gini coefficients associates with an average 28.7% decrease in the citation
counts for articles in 18 categories, ranging from 51.5% in Agricultural Sciences to
6.7% in Social Sciences, General. This factor also associates with decreased
citation counts in the four broad areas. With respect to the logit model, journal

152
author internationality associates with increased zero citations in most fields and it
only associates with decreased zero citations in Multidisciplinary and Space
Science showing that more international journals in these two fields are more
likely to remain uncited and receive 50% more zero citations for a change from the
lower to upper quartile in the Gini. The factor also associates with increased zero
citations in Physical Sciences, Life Sciences, Medicine and Social Sciences in
2009.
Journal citer internationality significantly associates with increased citation
counts in all subject categories and broad areas except for Space Science, in which
the factor contributes to decreased citation counts. The factor contribution to
increased citation counts averages 51% for all subject categories showing that
more international journals in terms of their citers receive 51% less citations for an
increase from the lower to upper quartile in Gini coefficient. In the logit model,
journal citer internationality significantly associates with decreased zero citations
in all subject categories and broad areas showing that more international journals
in terms of geographic dispersion of their citers are likely to remain uncited. The
journal citer internationality was also separately modelled and contrary results
were found showing that the factor significantly associates with decreased citation
counts in all categories. The negative association found for this factor in the
simultaneous models may result from the correlation between the factor and
journal author internationality (average r for all categories= 0.58), although the
VIF tests show no serious collinearity for these factors in any of the areas.
Overall, journal internationality in terms of the geographic dispersion of
authors is a good determinant of citation counts in most areas but journal citer

153
internationality did not perform as expected showing that being cited from across
the world does not matter for citation increase whereas having authors from
different countries publishing in the journal positively affects citations to the
articles.
The internationality of the publishing journal has previously been found to
moderately correlate with JIFs (Yue, 2004; Zitt & Bassecoulard, 1998). Journal
internationality gauges how globally widespread the journal is. Therefore,
international journals in terms of their authors are expected to complement the
Impact Factor and positively influence the citation impact of the related papers and
the results of the current study confirm this hypothesis except in a few fields. It
seems possible that some national journals in these areas, perhaps mainly in the
USA, are relatively prestigious and help articles to attract citations. The finding for
this factor is robust in the sense of considering many other major extrinsic
document properties likely to affect citation counts.
7.11 Reference internationality
Reference internationality was also measured in two ways with the Gini
coefficient, the geographic dispersion of the cited journal authors and of the cited
journal citers. There are moderate to high correlations between these two
measures of reference internationality and VIF tests confirm strong
multicollinearity for these two factors in some areas, undermining the results for
these. This is maybe why reference citer internationality significantly associates
with increased citation counts or is an insignificant factor for citations in most
categories. This factor only associates with decreased citation counts in

154
Agricultural Sciences, Environment/Ecology, Immunology, and Pharmacology &
Toxicology, however, suggesting that, in general, it is not an important factor.
Reference author internationality significantly associates with decreased
citation counts in most categories except for Agricultural Sciences in which it
associates with increased citations and for Computer Science,
Environment/Ecology and Immunology in which it is not a significant factor. The
results show that articles with more international references in terms of geographic
dispersion of their authors receive more citations than do articles with less
international references. The decrease in citation counts for an increase between
the lower and upper quartiles in the reference author internationality score ranges
from 7.6% in Materials Science to 38.5% in Microbiology and averages 16.3% for
all categories. The results here confirm the association between reference author
internationality and citations to articles in most subject areas. The finding is robust
in the sense of considering many other major factors likely to affect citation
counts. In the 2009 sample data, however reference author internationality
significantly associates with increased citations in the four broad areas but
reference citer internationality significantly associates with decreased citation
counts in Life Sciences, Medicine, and Social Sciences. The contrary findings for
2009 may result from a smaller sample size in this year compared to the full ten
years.
With respect to the logit part of the models, reference author internationality
mostly associates with increased zero citations showing that articles with more
international references are less likely to remain uncited. Reference citer
internationality mostly associates with decreased zero citations in most categories

155
and broad areas. In the 2009 sample data, both factors were found to be
insignificant factors for zero citations.
7.12 Number of references
The number of references significantly associates with increased citation
counts in all categories and fields. Each additional reference associates with 0.2%
to 0.9% increases in the mean parameter for citations in all categories. These
changes are potentially substantial since an author could reasonably easily add ten
references to a paper through a more extensive literature review, hence expecting
to gain up to 9% extra citations. Moreover, an increase from the lower to upper
quartile in the number of references increases the citation counts by an average
11.25%, ranging from 19.2% in Multidisciplinary to 4.3% in Clinical Medicine.
With respect to the logit model, the number of references is not a significant
factor for zero citations in Computer Science, Immunology, Microbiology,
Molecular Biology & Genetics, Neuroscience & Behaviour, Pharmacology &
Toxicology, Plant & Animal Science, and Psychology but it significantly
associates with decreased zero citations in all other categories. A change between
lower and upper quartiles in the factor associates with an average 20.55% decrease
in the zero citations in all categories in which the number of references is a
significant factor.
It is known that articles with more references are cited more (Mingers & Xu,
2010; Vieira & Gomes, 2010; Webster, Jonason, & Schember, 2009; Haslam et al.,
2008; Lokker, Mckibbon, Mckinlay, Wilczynski, & Haynes, 2008; Judge, Cable,
Colbert & Rynes, 2007; Kostoff, 2007; Walters, 2006; Peters & Van Raan, 1994;

156
Moed, Burger, Frankfort, & Van Raan, 1985) and the association between the
number of references and citations to articles in all subject areas is confirmed here.
The finding is robust in the sense of considering many other major external factors
likely to affect citation counts.
7.13 Field size
Field size in terms of the number of publications in the area is not a
significant factor for positive citation counts in Biology & Biochemistry, Clinical
Medicine, Environment/Ecology, Mathematics, Molecular Biology, Pharmacology
& Toxicology, and Social Sciences, General. In Agricultural Sciences,
Engineering, Geosciences, Microbiology, Physics, Plant & Animal Science, and
Space Science, field size significantly associates with increased positive citation
counts. Although the association is small due to a unit increase in the field size, it
associates with an average 7.5% increase for a change between lower and upper
quartiles. The factor is also not an important determinant of zero citations in most
categories and broad areas. It significantly associates with decreased zero citations
in Space Science only while it contributes to increased zero citations in Computer
Science, Economics & Business, Immunology, and Plant & Animal Science.
The insignificant and negative impact of field size on article citation impact
may result from the research data limitation that each article in the dataset was
only assigned to the first sub-category given to it in the WoS database and the size
of that category was considered as the article’s field size. The majority of articles
in the dataset are classified into more than a single sub-category, but in practice,
only a single sub-category could be assigned to each article to gauge article field

157
size. The first sub-category given to the article is taken into account but it is not
absolutely reliable. Moreover, the WoS field categories are likely to only loosely
correspond to the fields existing in science, with new fields likely to be completely
omitted.
Overall, the findings confirm that field size is not a good determinant of
citation in most categories and broad areas. The finding is robust in the sense of
considering many other major external factors likely to affect citation counts.
7.14 Title, abstract and article length
Title length statistically associates with decreased citations in most fields. It is
an insignificant factor in Clinical Medicine, Multidisciplinary, and Physics but it
significantly associates with decreased citation counts in all other categories
showing that articles with shorter titles receive more citations and therefore
concurring with Ayres and Vars’s (1999) study of law articles for example. It may
be that longer titles cannot easily draw a reader’s attention to the article’s main
message whereas a shorter title could speed decisions about article relevancy. The
association between title length and decreased citation counts for an extra word in
the title is small and an increase from the lower to upper quartile in the title length
only associates with an average 8% decrease in the citation counts in all
categories. The title length is an insignificant factor for zero citations in most
categories except for Agricultural Sciences, Geosciences, Materials Science,
Mathematics, and Physics in which the factor associates with increased zero
citations.

158
Abstract length significantly associates with increased citation counts in all
categories except for Agricultural Sciences, Economics & Business, Engineering,
and Mathematics, in which it is not a significant factor for citation counts. An
increase from the lower to upper quartile in the factor associates with an average
9.1% increase in the citation counts in all categories. Among the 4 broad areas, the
factor significantly associates with increased citation counts in Medicine whereas
it is not an important determinant in Physical Sciences, Life Sciences and Social
Sciences. It could be expected that the longer the abstract, the higher the article
citation impact, although the extent of its association is small. The same result was
found in Kostoff (2007): the longer the abstract, the higher the number of citations
to medical articles. Perhaps an extensive abstract is a more complete
representation of a paper, providing readers with more details and enabling them to
make a decision about the paper’s usefulness, and this explains why an article with
a longer abstract may receive more citations.
Paper length is a significant factor for increased citation counts in all
categories and broad areas except for Biology & Biochemistry, Microbiology, and
Multidisciplinary and also Physical Sciences and broad Social Sciences, in which
the factor is an insignificant factor for citations. The factor contribution to
increased citations averages 11.6% for a change from the lower to upper quartile in
the number of pages for all categories. With respect to the logit model, the factor
significantly associates with decreased citations in the majority of areas except for
Biology & Biochemistry, Chemistry, Clinical Medicine, Immunology, Molecular
Biology & Genetics, Multidisciplinary, and Neuroscience & Behaviour.

159
In a related study in Chemical Engineering, a significant correlation was
found between the number of references and the number of citations whereas no
correlation was found between article length and citation counts. However, the
number of references and article length were significantly correlated and the
authors considered it an indirect association between article length and article
citation impact (Peters & Van Raan, 1994).
Paper length significantly associates with increased citation counts when it is
individually modelled in the categories in which the factor is insignificant. Perhaps
the paper length does not associate with increased citations unless many references
are cited. In other words, long articles with few cited references do not necessarily
receive more citations. In all the other subject categories, the number of pages is a
significant determinant of increased citations together with the number of cited
references. An additional page increases the citation counts of articles by an
average of 1.7% in these categories. This suggests that long articles do not
necessarily need to have a long list of cited references to receive more citations in
these areas of science. A number of micro-studies in different subject areas have
also confirmed that the more pages, the higher the number of citations to a paper
(Vanclay, 2013; Mingers & Xu, 2010; Haslam et al., 2008; Stremersch, Verniers &
Verhoef, 2007; Kostoff, 2007; Leimu & Koricheva, 2005a; Van Dalen & Henkens,
2005). Perhaps longer papers publish more original ideas and hence need more
extensive and comprehensive explanations for different sections of the paper.
However, associations between article length and citation counts for review
articles in law have been shown to be complex since the number of citations
increases with the number of pages up to a turning point of 53 pages but after that

160
it shows a declining trend per additional page (Ayres & Vars, 1999). This suggests
that the statistical model used in this thesis may not reveal the full picture.
The results confirm the existence of an association between title length,
abstract length, and paper length and citations to articles in all subject areas except
perhaps for a few categories. The finding is robust in the sense of considering
many other major extrinsic factors likely to affect citation counts.
7.15 Abstract readability
Abstract readability is a significant determinant of decreased citations in eight
categories, such as Microbiology in which a unit increase in the readability score
decreases the mean parameter for citation count by 0.6% (decreases of up to 0.5%
occurred in other categories). An increase from the lower to the upper quartile for
the Flesch scores associates with an average 6.3% decrease in citation counts in
the eight categories showing that more difficult to read abstracts receive more
citations. No significant association was found between this variable and citation
counts in thirteen other categories, including Agricultural Sciences, Chemistry and
Economics & Business.
Abstract readability significantly associates with increased citation counts in
Social Sciences, General and an increase from the lower to upper quartile in Flesch
scores (from difficult to easier abstracts) increases the mean parameter for citation
counts by 5.5%. In agreement with this finding, a weak relationship has also been
found between article readability and citation impact in three sub-fields of Social
Sciences: Marketing, Psychology and Education Science (Stremersch, Verniers, &
Verhoef, 2007; Hartley, Sotto, & Pennebaker, 2002; Hartley & Trueman, 1992).

161
Moreover, with respect to the logit model, abstract readability associates with
decreased zero citations in Geosciences and Social Sciences, General and a change
between the lower and upper quartiles results in 16.2% and 17.5% decreases in the
zero citations, respectively. The factor associates with increased zero citations in
Microbiology and Multidisciplinary and is an insignificant factor for zero citations
in other categories and all broad areas.
Regarding the four broad areas, abstract readability is not an important factor
for citations in any of them.
Abstracts, which are sometimes the only part of an article that is read, are
expected to be beneficial if more readable and informative but the current findings
do not confirm this hypothesis. The unexpected results of this study and previous
studies may be due to the limitations of the readability score used. However, the
different readability formulae significantly correlate with each other, so this seems
unlikely. However, all readability measures have two common limitations: first,
they do not consider reader characteristics; the readers of scientific papers are
experts in their own fields and may have prior knowledge of their complex
terminologies. Second, they fail to consider some text characteristics affecting text
comprehension, such as content familiarity, text structure, and author style
(Armbruster, Osborn, & Davison, 1985). Hence an abstract graded as difficult
based on its Flesch score may not be difficult for the scholars in the field (Gazni,
2011). On the other hand, scholars may scan the abstracts for keywords to find if a
paper is relevant rather than reading the entire abstract. Therefore, this limitation
may have affected the results.

162
In summary, more readable (easier) abstracts receive higher numbers of
citations and less zero citations in Social Sciences, General only but vice versa in
some other categories.
7.16 Research funding
Due to data limitations, this factor was only modelled in the four broad areas
and for 2009 data. Grants from funding agencies support researchers and pave the
way for creative and high-quality research, especially in equipment-based research
fields. The current study found that while there is a very strong impact of funding
on citation counts in Physical Sciences, Life Sciences and Medicine, there is no
significant association in Social Sciences. The finding is robust in the sense of
considering many other major external factors likely to affect citation counts. The
factor associates with increased citations in Physical Sciences, where funded
articles receive 43.6% more citations than unfunded articles, in Life Sciences (a
37.3% increase) and in Medicine (a 30.6% increase). Moreover, research funding
strongly associates with decreased zero citations in Physical Sciences, Life
Sciences and Medicine whereas no significant association was found in Social
Sciences. Therefore, it seems that natural sciences need funding more than do the
Social Sciences. This probably results from the different natures of the subject
fields that are experiment-based and expensive equipment-based such as Physical
or Life Sciences. Receiving funds is vital to an expensive experiment-based
research project to provide the required equipment to conduct its experiments.

163
7.17 Limitations
There are some methodological and measurement limitations in this research
that are discussed in this section. First, each article in the dataset was classified
under a single subject category but the definition of subject categories in WoS is
journal-based and up to 6 subjects are assigned to a journal and its articles. The
ScienceWatch journal subject classification, based on which each journal is
assigned to a specific subject category, was chosen in order to avoid duplication of
articles under different subjects. This journal-based classification has limitations,
including the classification of multidisciplinary journals such as Nature, Science
and PNAS. A fine-grained subject classification based upon article references has
revealed that the journal-based subject classification fails for these journals
(Glänzel, Schubert, & Czerwon, 1999).
Second, a limitation of the citation data in all categories, and particularly for
Social Sciences, is that different sub-categories within each category will have
different average citation levels. We chose not to normalise the citation counts
(e.g., by dividing article citations by the average for their WoS subject area) in
order to test the simplest model but future research could evaluate the impact of
this choice.
Third, in order to have consistency in the indicators and subject classifications
used, the data for this study were only collected from Thomson Reuters databases.
For example, the ESI database provides the data for the expected citations to
articles in each subject field per year which is used to measure the MNCS, the
indicator of institution and country impact. But there are some limitations with the
data collected from these databases. For example, to measure the internationality

164
and impact of references, reference matching was conducted to find the original
documents in a dataset dated from 2000 to 2009. There were difficulties in finding
references dating before the year 2000. Therefore, a number of references could
not be analysed and their citations could not be counted. However, this limitation
may not greatly influence the results since the study deals with samples in each
field and the missing data are not a huge amount in proportion to the sample size.
The research is limited to quantitative factors since this is a large-scale study
across all subject domains whereas a sophisticated citation model requires the
inclusion of the maximum number of factors available. But measuring qualitative
factors, such as title type (which needs an expert in the field to assign a type to
each article’s title), article methodology type or study design in such a macro-level
study is impractical.
Another limitation is that many of the indicators used incorporated
simplifying assumptions. For example, the h-index calculations were based upon
available data rather than a comprehensive list of publications for each author, and
also used a heuristic for author name disambiguation. Another likely case of the
assumptions being oversimplified is that the internationality indicator does not
differentiate between the countries involved, treating high and low impact
countries as equal and it is not an optimal choice.
Given that Gini coefficients closer to 1 indicate less internationality, a
negative association between the internationality factor and citation counts shows
that a more international journal is cited more than a less international journal and
vice versa. In this way, the results are a bit difficult to interpret. Therefore, it

165
would be more natural to use a diversity measure that points in the same direction
as all other measures (Didegah & Thelwall, 2014).
An important overall limitation is the assumptions underlying the negative
binomial models. Perhaps most significantly, the models assume a regular change
in the dependant variable for increases in the independent variables. This
assumption is likely to be violated in some cases, such as with the effect of
increasing the number of authors decreasing as each additional author is added.
Finally, the differences and changes identified may be spurious in the sense of
being caused by factors that were not investigated in the model.
7.18 Summary
This chapter used a combined statistical model to simultaneously assess a
large number of factors across 22 subject domains over a long period of time, and
obtained evidence about the effects of a range of extrinsic document factors on
article citation impact. Whilst the findings broadly agree with previous studies,
writing more readable abstracts seems not to favour citation impact in any of the
fields, which may be due to the limitation of readability measures implemented. A
new finding is that whilst it seems to be useful to collaborate and to collaborate
internationally, there seems to be no particular need to collaborate with other
institutions within the same country in most subject areas. The collinearity
between institutional collaboration and international and individual collaborations
may have negatively affected the results for institutional collaboration. Articles
from prestigious authors and high impact institutions receive more citations while
this is not necessarily true for high impact countries. Moreover, it does not matter

166
if an article is from a small or big field in any of the areas studied, although this
finding may be a result of the unreliable way in which field size was estimated.

167
CHAPTER 8. CONCLUSIONS
8.1 Introduction
This study provides a large-scale analysis of many citation factors across a
range of subject fields over a long period of time. The results fill important gaps in
previous research through the use of a powerful statistical model, the analysis of
many different subject areas (22) and the simultaneous consideration of many
factors.
This chapter draws conclusions about the main findings for each research
question. Theoretical and practical contributions of the research and research
limitations are then outlined. Finally, some recommendations for future research
are given.
8.2 Answers to the research questions
To answer the first research question, two types of research collaboration - the
number of authors and the number of countries - significantly associate with
increased citations in most categories and fields. The number of authors
significantly associates with increased citations in all categories and broad areas
except for Physics. The extent to which this factor associates with increased
citation counts differs across the domains and it seems that it is less important for
subject categories with a higher propensity for research collaboration, such as
Space Science. The number of countries is significant for increased citations in all
subject categories and fields except for Computer Science, Economics & Business,
Engineering, Mathematics, Microbiology, Multidisciplinary, Neuroscience &

168
Behaviour, Physics, Psychology/Psychiatry, Social Sciences, General, and Space
Sciences. There is substantial multicollinearity among the research collaboration
factors in Physics and this may be the reason that the number of authors and the
number of countries are not important factors for citation counts in this area.
The number of institutions associates with decreased citations or is an
insignificant factor for citation counts even though it associates with increased
citation counts in all categories when separately modelled. Nevertheless, this
factor significantly associates with increased citation counts in Clinical Medicine
and Social Sciences, General. Overall, it seems that the number of institutions
contributing to a collaboration is unimportant even though it may appear to be
important if it is modelled separately from the number of collaborating authors. In
other words, the citation benefit of multi-institutional collaboration is probably due
to the extra authors involved rather than due to the extra institutions involved.
For the second question, author impact is a significant factor for citation
counts in all categories and broad areas. Institutional impact is a significant
determinant of increased citation counts in all categories and broad areas except
for Mathematics and Physical Sciences. However, the factor association with
increased citations is weak (average 0.1% for an increase from the lower to upper
quartile in MNCS scores). The unexpected results in the two subject areas may
result from the limitations of the measure used to quantify institutional prestige.
Country impact is a significant factor of increased citation counts and decreased
zero citations in all the categories and an increase from the lower to upper quartile
in the factor associates with an average 50% increase in the citation counts.

169
To answer the third question, journal and reference characteristics are
significant determinants of increased citations to articles in all subject categories
and broad areas. The Journal Impact Factor (JIF) very significantly associates with
increased citation counts and decreased zero citations in all categories and fields
and the percentage increase in the citation counts for each unit increase in JIF
averages 20%. It seems that the JIF contribution to an increase in citation counts is
higher in subject areas with a lower average journal Impact Factor such as Social
Sciences, General. Reference impact significantly associates with increased
citations to articles in the majority of categories except for Mathematics.
Perceiving the cited work as a classic reference written by a well-known
researcher in the field and using a comprehensive overview of high-impact
literature are two recognised motivations for citations (Case & Higgins, 2000;
Shadish, Tolliver, Gray, & Sengupta, 1995), showing that the intellectual content
of a paper may not be the only reason why it is cited. Articles published in more
international journals in terms of geographic dispersion of publishing authors
receive more citations in most categories except for Biology & Biochemistry,
Microbiology, Neuroscience & Behaviour, and Space Science. Articles using more
international references in terms of geographic dispersion of authors also receive
more citations in most categories except for Agricultural Sciences, Computer
Science, Environment/Ecology and Immunology whereas reference citer
internationality is not a good determinant of citation counts. Excessive
multicollinearity was found for these factors in most fields, and this may have
negatively affected the results of simultaneous models. The number of references
170
is also associated with increased citation counts in all categories and fields,
although it is not a significant factor for zero citation in a number of categories.
To answer the fourth question, field size associates with increased citation
counts in a number of fields, but is an insignificant determinant of either citation
counts or zero citations in most categories and broad areas. This may be due to an
ineffective measure of field size being used, however. Among the article size
attributes, title length significantly associates with decreased citation counts in
most categories showing that articles with shorter titles receive a higher number of
citations whereas abstract length significantly associates with increased citation
counts in all categories except for Agricultural Sciences, Economics & Business,
Engineering, and Mathematics. Article length is not a good determinant of
increased citations in Biology & Biochemistry, Microbiology, and
Multidisciplinary but significantly associates with increased citations in all the
other categories.
For the fifth question, abstract readability is not an important factor for
citations in the majority of categories except for Social Sciences, General, in
which it associates with increased citations.
To answer the sixth question, research funding was only modelled in the four
broad areas due to data limitations. Based on the results, funded articles receive
more citations in Physical Sciences, Life Sciences and Medicine but not in Social
Sciences.

171
8.3 Implications of the findings and recommendations
Knowledge of properties of documents that associate with higher citation rates
could be useful to science evaluators to help them make early estimates of the
number of citations that a set of published articles is likely to receive.
Moreover, conducting high-impact research seems to be a common goal for
researchers and so authors seeking to maximise the impact of their research may
benefit from the above findings. They confirm the importance of publishing in
high-impact journals and suggest that authors should be particularly careful to
ensure that their literature review does not miss any relevant highly cited papers. If
they wish to conduct high-impact research then they may also seek to engage in
collaborations (hence generating more co-authors). This would be beneficial,
assuming that the factors identified genuinely improve the quality or value of the
research produced. Attempts to artificially manipulate these factors, such as by
adding honorary international authors or irrelevant high-impact interdisciplinary
references, would probably not work since factors associated with higher citations
presumably reflect underlying properties of research rather than surface features of
an article. Nevertheless, knowledge of important factors may naturally push
authors towards higher-impact types of research, for example by looking to expand
their collaboration network, by being open to interdisciplinary research influences,
and by paying particular attention to relevant research in high-impact international
journals (e.g., rather than national research).
The results provide new and particularly strong statistical evidence that the
authors should consider publishing in high impact and international journals,
ensure that they do not omit relevant high impact references, and write extensive

172
abstracts. Moreover, science policy makers should continue to encourage
researchers to collaborate, particularly on an international scale.
8.4 Research contributions
Article citation impact factors have been widely scrutinized in previous
literature but have been considered separately (and mostly within a single field)
whereas, in reality, many factors correlate and so a factor may appear to contribute
because it correlates with another factor that does contribute. This is an important
omission because non-simultaneous tests may identify apparently important
factors that have no effect when other factors are controlled. There is a particular
problem with overlapping factors, such as collaboration and internationality. For
example, more international papers tend to have more authors so if international
research is more cited is this because it is international or because it has more
authors (and vice versa)? Therefore, this research fills these gaps through a
simultaneous assessment of these factors.
Furthermore, the current study goes further than simple correlations between
the factors and citation impact. Using an advanced statistical model, the NB-Logit
Hurdle model, the research provides evidence of the extent to which citation
factors associate with increased or decreased citations.
In addition, some factors, such as research collaboration, journal and reference
impact, number of references, article size properties, abstract readability and
research funding, are at least to some extent under the control of the authors and so
it would be useful to know whether researchers should pay attention to them to
ensure that their research has the greatest possible impact. Regarding this

173
contribution, the current results show that at least some aspects of collaboration,
journal and document properties significantly and substantially associate with
higher citations. The results provide new and particularly strong statistical evidence
that authors should consider publishing in high-impact journals, ensure that they do
not omit relevant references (particularly high impact relevant references), engage
in the widest possible team working when appropriate, and write extensive
abstracts.
Finally, there have been few attempts to describe factors associating with
citations on a large-scale level across all scientific domains. The results can thus
contribute to a comprehensive citation model and aid science policymakers and
evaluators by identifying factors associating with the citation impact of articles in
many fields of science.
8.5 Recommendations for future studies
More qualitative studies considering both the quantitative factors applied in
this study and qualitative factors are needed to help develop a more sophisticated
citation model. Since conducting such studies at a macro-level is time-consuming,
smaller samples from different fields could be used for this.
Moreover, several alternative indicators have been introduced which mainly
aim to correct the existing indicators’ flaws and imperfections. Alternatives such
as SNIP, an alternative for JIF, could be used to quantify the citation factors and
the association results could be compared.
Journal internationality has been estimated through the geographic dispersion
of authors and citers but previous studies have measured journal internationality in

174
terms of the country dispersion of the editorial boards and the referees. It would be
interesting to examine the influence of journal editorial board internationality and
journal referee internationality on article citation impact and compare the results
with the associations found between the journal author and citer internationality
and citation counts to the article. Moreover, absolute measures of internationality,
such as the Gini coefficient used in this study, have limitations since such an index
measures internationality at the level of a single journal and does not consider the
journal as belonging to a field (subfield) but relative indices are normalised and
consider the structure of science in the field. Using the relative measures of
internationality to gauge journal and reference internationality, examining their
association with article citation impact across domains and comparing the results
with the results of this study will be valuable to find out whether the factors have
the same influence on citation counts using the new measurements.
8.6 Concluding remarks
To summarize, this study revealed that journal and reference characteristics
are the main extrinsic properties of articles that associate with their citation impact
in the majority of subject areas. In particular, the new proposed factors, journal
and reference internationality, can help with the prediction of future citation
impact. Research collaboration and research funding can help to predict citation
counts for articles in the majority of subject areas. However, article size properties
and abstract readability are not important determinants of citation counts. These
conclusions have been obtained using a method that minimises the chance that
spurious factors have been identified due to their correlation with genuine factors.

175
REFERENCES
Abt, H.A. (1993). Institutional productivities. Publications of the
Astronomical Society of the Pacific, 105, 794-798.
Adams, J., Jackson, L. & Marshall, S. (2007). Bibliometric analysis of
interdisciplinary. Report to the Higher Education Funding Council for
England.
Aksnes, D.W. (2003). Characteristics of highly cited papers. Research
Evaluation, 12(3), 159-170.
Amin, M. & Mabe, M. (2000). Impact factors: Use and abuse.
Perspectives in Publishing, 1, 1-6.
Antelman, K. (2004). Do open-access articles have a greater research
impact?. College & Research Libraries, 65(5), 372-382.
Arceneaux, K., & Huber, G. A. (2007). What to do (and not do) with
multicollinearity in state politics research. State Politics & Policy
Quarterly, 7(1), 81-101.
Armbruster, B.B. Osborn, J. H. & Davison, A. L. (1985). Readability
Formulas May Be Dangerous to Your Textbooks. Educational
Leadership, 42, 7, 18-20.
Asai, I. (1981). Adjusted age distribution and its application to impact
factor and immediacy index. Journal of the American Society for
Information Science, 32(3), 172-174.
Avkiran, N.K. (1997). Scientific collaboration in finance does not lead to
better quality research. Scientometrics, 39, 173–184.
Ayres, I. & Vars, F.E. (1999). Determinants of citations to articles in
elite law reviews. In: Conference on Interpreting Legal Citations,
Evanston, Illinois.
Baird, L. M. & Oppenheim, C. (1994). Do citations matter? Journal of
Information Science, 20(1), 2-15.
Baldi, S. (1998). Normative versus social constructivist processes in the
allocation of citations: a network-analytic model. American
Sociological Review, 63, 829-46.
Beaver, D. B. (2004). Does collaborative research have greater epistemic
authority? Scientometrics, 60, 399-408.

176
Bergh, D.D., Perry, J., & Hanke, R. (2006). Some predictors of SMJ
article impact. Strategic Management Journal, 27, 81-100.
Bhandari, M., Busse, J., Devereaux, P.J., …, Schemitsch, E.H. (2007).
Factors associated with citation rates in the Orthopedic literature.
Canadian Journal of Surgery, 50 (2), 119-123.
Bordons, M., Garcia Jover, F., & Barrigon, S. (1993). Is collaboration
improving research visibility? Research Evaluation, 3(1), 19-24.
Bordons, M., Aparicio, J. & Costas, R. (2012). Trends in the
collaborative structure of the Spanish pharmacological scientific
production and its influence over research impact. Proceedings of 17th
International Conference on Science and Technology Indicators,
Montreal, Canada.
Bornmann, L., de Moya Anegón, F., & Leydesdorff, L. (2010). Do
scientific advancements lean on the shoulders of giants? A bibliometric
investigation of the Ortega hypothesis. PLoS One, 5(10), e13327.
Bornmann, L. & Daniel, H. D. (2007a). Multiple publication on a single
research study: does it pay? The influence of number of research
articles on total citation counts in biomedicine. Journal of American
Society for Information Science, 58, 1100-1117.
Bornmann, L., & Daniel, H. D. (2007b). What do we know about the h
index? Journal of the American Society for Information Science and
technology, 58(9), 1381-1385.
Bornmann, L. & Daniel, H. D. (2008). What do citation counts measure?
A review of studies on citing behaviour. Journal of Documentation, 64
(1), 45-80.
Bornmann, L., Schier, H., Marx, W. & Daniel, H-D. (2012). What
factors determine citation counts of publications in chemistry besides
their quality? Journal of Informetrics, 6, 11-18.
Borry, P., Schotsmans, P., & Dierickx, K. (2006). How international is
bioethics? A quantitative retrospective study. BMC Medical Ethics, 7,
1.
Borsuk, R. M., Budden, A. E., Leimu, R., Aarssen, L. W., & Lortie, C. J.
(2009). The influence of author gender, national language and number
of authors on citation rate in ecology. The Open Ecology Journal, 2,
25-28.

177
Bottle, R. S., Rennie, J. S., Russ, S. & Sardar, Z. (1983). Changes in the
communication of chemical information I: some effects of growth.
Journal of Information Science, 6, 103-108.
Boyack, K. W. & Klavans, R. (2005). Predicting the Importance of
Current Papers. Proceedings of ISSI 2005, 335–342. Edited by P.
Ingwersen and B. Larsen. July 24-28, Stockholm, Sweden.
Braun, T. & Bujdoso, E. (1983). Gatekeeping patterns in the publication
of analytical chemistry research. Talanta, 30(3), 161-167.
Brice, L.J. & Bligh, J.G. (2004). How international is medical
education?. Medical Education, 38(1), 96-102.
Brody, S. & Foster, W. R. (1995). Impact factor as the best operational
measure of medical journals. The Lancet, 346 (8985), 1300-1301.
Brooks, T. A. (1985). Private acts and public objects – an investigation
of citer motivations. Journal of the American Society for Information
Science, 36, 223-229.
Brooks, T. A. (1986). Evidence of complex citer motivations. Journal of
the American Society for Information Science, 37, 34-36.
Brown, L. & Gardner, J. (1985). Using citation analysis to assess the
impact of journals and articles on contemporary accounting research
(CAR). Journal of Accounting Research, 23(1): 84-109.
Buela-Casal, G., Perakakis, P., Taylor, M., & Checa, P. (2006).
Measuring Internationality: Reflections and Perspectives on Academic
Journals. Scientometrics, 67(1), 45-65.
Buela-Casal, G., & Zych, I. (2012). How to measure the internationality
of scientific publications. Psicothema, 24(3), 435-441.
Burrell, Q. L. (2003). Predicting future citation behaviour. Journal of the
American Society for Information Science and Technology, 54(5), 372-
378.
Callaham, M., Wears, R. L., & Weber, E. (2002). Journal prestige,
publication bias, and other characteristics associated with citation of
published studies in peer-reviewed journals. Journal of the American
Medical Association, 287, 2847-2850.
Calver, M., Wardell-Johnson, G., Bradley, S., & Taplin, R. (2010). What
makes a journal international? A case study using conservation biology
journals. Scientometrics, 85(2), 387-400.

178
Cameron, C. A. & Trivedi, P. K. (1998). Regression analysis of count
data. Cambridge, UK: Cambridge University Press.
Campbell, F. M. (1990). National bias: a comparison of citation practices
by health professionals. Bulletin of Medical Library Association, 78,
376-82.
Casal, G. B., Zych, I., & Sánchez, M. P. B. (2007). The internationality
index of the Spanish psychology journals. International Journal of
Clinical and Health Psychology, 7(3), 899-910.
Case, D. O. & Higgins, G. M. (2000). How can we investigate citation
behavior? A study of reasons for citing literature in communication.
Journal of the American Society for Information Science, 51, 635-45.
Case, D. O. & Miller, J. (2011). Do bibliometricians cite differently from
other scholars? Journal of the American Society for Information
Science, 62(3), 421-432.
Chan, K. C., Chen, C. R., & Cheng, L. T. W. (2009). Ranking
accounting journals using dissertation citation analysis: A research
note. Accounting, Organizations and Society, 34, 875-885.
Chatterjee, S., Hadi, A. S. & Price, B. (2000). Regression analysis by
example. John Wiley and Sons, New York, New York, USA.
Chen, C. (2012). Predictive Effects of Structural Variation on Citation
Counts. Journal of the American Society for Information Science. doi:
10.1002/asi.21694.
Christensen, F.H. & Ingwersen, P. (1996). Online citation analysis. A
methodological approach. Scientometrics, 37(1), 36-92.
Chubin, D. E. & Moitra, S. D. (1975). Content analysis of references:
adjunct or alternative to citation counting? Social Studies of Science, 5,
423-441.
Cole, J. R. & Cole, S. (1971). Measuring quality of sociological research
– problems in use of science citation index. American Sociologist, 6,
23-29.
Cole, J. R., & Cole, S. (1972). The Ortega Hypothesis Citation analysis
suggests that only a few scientists contribute to scientific progress,
Science, 178(4059), 368-375.
Cole, J. R., & Cole, S. (1973). Social Stratification in Science. Chicago:
The University of Chicago Press.

179
Collins, H. M. (1999). Tantalus and the aliens: publications, audiences
and the search for gravitational waves. Social Studies of Science, 29,
163-97.
Cozzens, S. E. (1989). What do citations count? The rhetoric-first model.
Scientometrics, 15, 437-47.
Cronin, B. (1982). Norms and functions in citation: the view of journal
editors and referees in psychology. Social Science Information Studies,
2 (2), 65-78.
Cronin, B. (1984). The Citation Process. The Role and Significance of
Citations in Scientific Communication. Oxford: Taylor Graham.
Cronin, B. & Shaw, D. (1999). Citation, funding acknowledgement and
author nationality in four information science journals. Journal of
Documentation, 55, 402–408.
Cronin, B., Shaw, D., & La Barre, K. (2004). Visible, less visible, and
invisible work: Patterns of collaboration in 20th century chemistry.
Journal of the American Society for Information Science and
Technology, 55(2), 160–168.
Cronin, B. (2005). A hundred million acts of whimsy? Current Science,
89, 1505-9.
Cronin, B. & Meho, L. (2006). Using the h-index to rank influential
information scientists. Journal of the American Society for Information
Science and Technology, 57(9), 1275–1278.
Didegah, F., Thelwall, M., & Gazni, A. (2012). An international
comparison of journal publishing and citing behaviours. Journal of
Informetrics, 6, 516-531.
Didegah, F., & Thelwall, M. (2014, Submitted). Article Properties
Associating with the Citation Impact of Individual Articles in the Social
Sciences. Science & Technology Indicators Conference, September,
Leiden, Netherlands.
Douglas, R. J. (1992). How to write a highly cited article without even
trying. Psychological Bulletin, 112, 405-408.
Egghe, L. (2006). Theory and practice of the g-index. Scientometrics,
69(1), 131-152.

180
Eysenbach, G. (2006). Citation advantage of open access articles. PLoS
Biology, 4, e157.
Fava, G. A., Guidi, J., & Sonino, N. (2004). How citation analysis can
monitor the progress of research in clinical medicine. Psychotherapy
and Psychosomatics, 73, 331–333.
Feyereisen, P. & Spoiden, A. (2009). Can local citation analysis of
master's and doctoral theses help decision-making about the
management of the collection of periodicals? A case study in
psychology and education sciences. Journal of Academic
Librarianship, 35(6), 514-522.
Franceschet, M. & Costantini, A. (2010). The effect of scholar
collaboration on impact and quality of academic papers. Journal of
Informetrics, 4(4), 540-553.
Frost, C. O. (1989). The literature of online public access catalogues,
1980-85 – an analysis of citation patterns. Library Resources &
Technical Services, 33, 344-357.
Furnham, A.F. (1990). Quantifying Quality: An Argument in Favour of
Citation Counts. Journal of Further and Higher Education, 14(2), 105-
110.
Garfield, E. (1965). Can citation indexing be automated? In Stevens,
M.E. (Ed.), Statistical Association Methods for Mechanized
Documentation, National Bureau of Standards, Washington, DC, pp.
189-92.
Garfield, E. & Welljamsdorof, A. (1990). The impact of fraudulent
research on the scientific literature – the Stephen E. Breuning case.
Journal of the American Medical Association, 263, 1424-1426.
Garfield, E. (2003). The meaning of the impact factor. Revista
internacional de psicología clínica y de la salud= International journal
of clinical and health psychology, 3(2), 363-369.
Gazni, A. & Didegah, F. (2010). Investigating Different Types of
Research Collaboration and Citation Impact: A Case Study of Harvard
University’s Publications. Scientometrics, 87(2), 251-265.
Gazni, A. (2011). Are the abstracts of high impact articles more
readable? Investigating the evidence from top research institutions in
the world. Journal of Information Science, 37 (3), 273-281.
Gazni, A., Sugimoto, C. R., & Didegah, F. (2012). Mapping world
scientific collaboration: authors, institutions, and countries. Journal of
181
the American Society for Information Science & Technology, 63(2),
323-335.
Gibbons, M., Limoges, C., Nowotny, H., Schwartzman, S., Scott, P. &
Trow, M. (1994). The new production of knowledge: the dynamics of
science and research in contemporary societies. London: Sage.
Gilbert, G. N. (1977). Referencing as persuasion. Social Studies of
Science, 7, 113-122.
Glänzel, W., Schubert, A., & Czerwon, H.J. (1999). An item-by-item
subject classification of papers published in multidisciplinary and
general journals using reference analysis. Scientometrics, 44(3), 427–
439.
Glänzel, W. (2001). National characteristics in international scientific
co-authorship relations. Scientometrics, 51, 69-115.
Glänzel, W., & Moed, H. F. (2002). Journal impact measures in
bibliometric research. Scientometrics, 53(2), 171-193.
Glänzel, W. & Schubert, A. (2001). Double effort=Double impact? A
critical view at international co-authorship in chemistry.
Scientometrics, 50(2), 199-214.
Glänzel, W. & Moed, H. F. (2002). Journal impact measures in
bibliometric research. Scientometrics, 53(2), 171-193.
Glänzel, W. & Schubert, A. (2005). Domesticity and internationality in
co-authorship, references and citations. Scientometrics, 65(3), 323-342.
Glänzel, W., Debackere, K., Thijs, B. & Schubert, A. (2006). A concise
review on the role of author self-citations in information science,
bibliometrics and science policy. Scientometrics, 67(2), 263-277.
Goldfinch, S., Dale, T., & Rouen, K. D. (2003). Science from the
periphery: publication, collaboration and ‘periphery effects’ in article
citation rates of the New Zealand Crown Research Institutes 1995-
2000. Scientometrics, 57 (3), 321–337.
Greene, W. H. (2000). Econometric Analysis. 4th ed. Upper Saddle
River, NJ: Prentice Hall.
Greenwald, A. S. & Shuh, E. S. (1994). An ethnic bias in scientific
citations. European Journal of Social Psychology, 24, 623-639.
Hakala, J. (1998). Internationalisation of science views of the scientific
elite in Finland. Science Studies, 11(1), 52-74.

182
Hanney, S., Frame, I., Grant, J., Green, P. & Buxton, M. (2003). From
Bench to Bedside: Tracing the Payback Forwards from Basic or
Clinical Research – A Preliminary Exercise and Proposals for a
Future Study. HERG Research Report No. 31, Health Economics
Research Group, Brunel University, Uxbridge.
Hart, R.L. (2007). Collaboration and article quality in the literature of
academic librarianship. The Journal of Academic Librarianship, 33(2),
190–195.
Hartley, J., & Benjamin, M. (1998). An evaluation of structured abstracts
in journals published by the British Psychological Society. British
Journal of Educational Psychology, 68(3), 443-456.
Hartley, J., Sotto, E., Pennebaker, J. (2002). Style and substance in
psychology: Are influential articles more readable than less influential
ones? Social Studies of Science, 32, 321-334.
Hartley, J. & Sydes, M. (1997). Are structured abstracts easier to read
than traditional ones? Journal of Research in Reading, 20(2), 122-136.
Hartley, J. & Trueman, M. (1992). Some observations on using journal
articles in the teaching of psychology. Psychology Teaching Review,
1(1), 46-51.
Hartley, J. (2003). Improving the Clarity of Journal Abstracts in
Psychology The Case for Structure. Science Communication, 24(3),
366-379.
Haslam, N. et al. (2008). What makes an article influential? Predicting
impact in social and personality psychology. Scientometrics, 76(1),
169-185.
He, T., & Liu, W. (2009). The internationalisation of Chinese scientific
journals: A quantitative comparison of three chemical journals from
China, England and Japan. Scientometrics, 80(3), 583-593.
Herbertz, H. (1995). Does it pay to cooperate? A bibliometric case study
in molecular biology. Scientometrics, 33, 117–122.
Hilbe, J. M. (2011). Negative Binomial Regression, second edition (5th
print, 2012). Cambridge, UK: Cambridge University Press.
Hirsch, J.E. (2005). An index to quantify an individual’s scientific
research output. Proceedings of the National Academy of Sciences of
the United States of America, 102(46), 16569-16572.

183
Hirsch, J. E. (2007). Does the h-index have predictive power?
Proceedings of the National Academy of Sciences, 104(49), 19193-
19198.
Hu, D., Chen, H., Huang, Z., & Roco, M. (2007). Longitudinal Study on
Patent Citations to Academic Research Articles in Nanotechnology
(1976-2004). Journal of Nanoparticle Research, 9: 529-542.
Hu, X., & Rousseau, R. (2013). Are Chinese nanoscience citation curves
converging towards their American counterparts?. Malaysian Journal
of Library & Information Science, 18(3), 49-56.
Hudson, J. (2007). Be known by the company you keep: Citations –
quality or chance? Scientometrics, 71, 231-238.
Jamali, H. R., & Nikzad, M. (2011). Article title type and its relation
with the number of downloads and citations. Scientometrics, 88(2),
653-661.
Johnson, B. & Oppenheim, C. (2007). How socially connected are citers
to those that they cite? Journal of Documentation, 63, 5, 609-637.
Jowkar, A., Didegah, F. & Gazni, A. (2011). The Effect of Funding on
Academic Research Impact: A case study of Iranian publications. Aslib
Proceedings, 63(6): 593-602.
Judge, T.A., Cable, D.M., Colbert, A.E., & Rynes, S.L. (2007). What
causes a management article to be cited – article, author, or journal?
Academy of Management Journal, 50(3), 491–506.
Kang, I.S., Na, S.H., Lee, S., Jung, H., Kim, P., Sung, W.K., et al.
(2009). On co-authorship for author disambiguation. Information
Processing & Management, 45(1), 84–97.
Kao, C. (2009). The authorship and internationality of Industrial
Engineering Journals. Scientometrics, 81(1), 123-136.
Karki, M. M. S. (1997). Patent citation analysis: a policy analysis
tool. World Patent information, 19(4): 269-272.
Katz, J. S., & Hicks, D. (1997). How much is a collaboration worth? A
calibrated bibliometric model. Scientometrics, 40(3), 541-554.
Kim, M.-J. (2010). Visibility of Korean science journals: an analysis
between citation measures among international composition of editorial
board and foreign authorship. Scientometrics, 84, 505-522.

184
King, J. (1987). A review of bibliometric and other science indicators
and their role in research evaluation. Journal of lnformation Science,
13, 261-276.
Kosmulski, M. (2006). A new Hirsch-type index saves time and works
equally well as the original h-index. ISSI Newsletter, 2(3), 4-6.
Kostoff, R. (2007). The difference between highly and poorly cited
medical articles in the journal Lancet. Scientometrics, 72, 513-520.
Krampen, G. & Montada, L. (2002). Wissenschaftsforschung in der
Psychologie. Gottingen: Hogrefe.
Kulkarni, A. V., Busse, J. W. & Shams, I. (2007). Characteristics
associated with citation rate of the medical literature. PLoS One, 2(5),
e403.
Kurmis, A. P. & Kurmis, T. P. (2006). Exploring the relationship
between impact factor and manuscript rejection rates in radiologic
journals. Acad Radiol, 13, 77-83.
Kuruppu, P. U. & Moore, D. C. (2008). Information use by PhD students
in agriculture and biology: A dissertation citation analysis. Portal, 8
(4), 387-405.
Laband, D. N. (1990). Is there value-added from the review process in
economics? Preliminary evidence from authors. Quarterly Journal of
Economics, 105, 341-52.
Lancaster, F. W., Porta, M. A., Plagenz, K., Szymborski, K., & Krebs,
M. (1986). Factors influencing sources cited by scientists: A case study
for Cuba. Scientometrics, 10, 243-257.
Lancho-Barrantes, B. S., Guerrero-Bote, V. P. & Moya-Anegon, F.
(2010). What lies behind the averages and significance of citation
indicators in different disciplines? Journal of Information Science,
36(3), 371-382.
Lancho-Barrantes, B.S., Guerrero-Bote, V.P. & de Moya-Anegón, F.
(2013). Citation increments between collaborating countries.
Scientometrics, 94(3), 817-831.
Lansingh, V. C. & Carter, M. J. (2009). Does Open Access in
ophthalmology affect how articles are subsequently cited in research?
Ophthalmology, 116 (8), 1425-1431.

185
Lange, L. (1985). Effects of disciplines and countries on citation habits:
An analysis of empirical papers in behavioral sciences. Scientometrics,
8, 205-215.
Larivière, V., Gingras, Y., & Archambault, E. (2006). Canadian
collaboration networks: a comparative analysis of the natural sciences,
social sciences and the humanities. Scientometrics, 68 (3), 519–533.
Larivière, V. & Gingras, Y. (2010). On the relationship between
interdisciplinarity and scientific impact. Journal of the American
Society for Information Science and Technology, 61, 126-131.
Latour, B. (1987). Science in action: How to follow scientists and
engineers through society. Open University Press, Milton Keynes.
Lawani, S. M. (1986). Some bibliometric correlates of quality in
scientific research. Scientometrics, 9, 13-25.
Lawrence, S. (2001). Free online availability substantially increases a
paper’s impact. Nature, 411, 521.
Lawrence, J.S. (2003). What makes a journal ‘international’? Social
Psychology of Education, 6, 93-94.
Leimu, R., & Koricheva, J. (2005a). What determines the citation
frequency of ecological papers? Trends in Ecology & Evolution, 20,
28-32.
Leimu, R., & Koricheva, J. (2005b). Does scientific collaboration
increase the impact of ecological articles? BioScience, 55, 438-443.
Levitt, J. M. (2011). Are funded articles more highly cited than unfunded
articles? A preliminary investigation. Proceedings of ISSI 2011, 1013-
1015. Edited by E. Noyons, P. Ngulube, & J. Leta, July 4-7, Durban,
South Africa.
Levitt, J., & Thelwall, M. (2008). Is multidisciplinary research more
highly cited? A macro-level study. Journal of the American Society for
Information Science and Technology, 59(12), 1973-1984.
Levitt, J. & Thelwall, M. (2009). Citation levels and collaboration within
library and information science. Journal of the American Society for
Information Science and Technology, 60(3), 434–442.
Levitt, J., & Thelwall, M. (2011). A combined bibliometric indicator to
predict article impact. Information Processing & Management, 47 (2),
300-308.

186
Lewison, G. & Dawson, G. (1998). The effect of funding on the outputs
of biomedical research. Scientometrics, 41, 1-2, 17-27.
Leydesdorff, L. (1998). Theories of citation? Scientometrics, 43, 5-25.
Leydesdorff, L., Wagner, C. S., Park, H. W., & Adams, J. (2013).
International collaboration in science: The global map and the network.
El profesional de la información, 22(1), 87-95.
Liang, L., Rousseau, R., & Zhong, Z. (2013). Non-English journals and
papers in physics and chemistry: bias in citations?. Scientometrics,
95(1), 333-350.
Liu, M. (1993). Progress in documentation – the complexities of citation
practice: a review of citation studies. Journal of Documentation, 49,
370-408.
Lokker, C., Mckibbon, K. A., Mckinlay, R. J., Wilczynski, N. L., &
Haynes, R. B. (2008). Prediction of citation counts for clinical articles
at two years using data available within three weeks of publication:
Retrospective cohort study. British Medical Journal, 336, 655-657.
Lovaglia, M.J. (1989). Status characteristics of journal articles for
editor’s decisions and citations. The Society for Social Studies of
Science Annual Meeting, November 15- 18, University of California at
Irvine, Irvine, CA.
MacRoberts, M. H. & MacRoberts, B. R. (1987). Another test of the
normative theory of citing. Journal of the American Society for
Information Science, 38, 305-306.
MacRoberts, M. H. & MacRoberts, B. R. (1989). Problems of citation
analysis: a critical review. Journal of the American Society for
Information Science, 40 (5), 342-349.
MacRoberts, M. H. & MacRoberts, B. R. (2010). Problems of citation
analysis: A study of uncited and seldom-cited influences. Journal of the
American Society for Information Science and Technology, 61(1), 1–
12.
Mahdi, S., D’Este, P., & Neely, A. (2008). Citation counts: are they
good predictors of RAE scores? AIM Research, London.
Mahlck, P. & Persson, O. (2000). Socio-bibliometric mapping of intra-
departmental networks. Scientometrics, 49, 81-91.

187
McRae-Spencer, D. M. & Shadbolt, N. R. (2006). Also by the same
author: AKTiveAuthor, a citation graph approach to name
disambiguation. In Proceedings of the 6th ACM/IEEE-CS joint
conference on Digital libraries (pp. 53-54). ACM.
Meadows, A. J. (1998). Communicating Research. London: Academic
Press.
Medoff, M.H. (2003). Collaboration and the quality of economics
research. Labour Economics, 10, 597–608.
Merton, R. K. (1968). The Matthew effect in science. Science, 159, 56-
63.
Merton, R. K. (1973). The normative structure of science. The sociology
of science: Theoretical and empirical investigations, 267.
Merton, R. K. (1988). The Matthew effect in science II: cumulative
advantage and the symbolism of intellectual property. Isis, 79, 606-23.
Mingers, J. & Burrell, Q.L. (2006). Modeling citation behavior in
management science journals. Information Processing and
Management, 42(6), 1451–1464.
Mingers, J. & Xu, F. (2010). The drivers of citations in management
science journals. European Journal of Operational Research, 205,
422–430.
Moed, H. F., Burger, W. J. M., Frankfort, J. G., & Van Raan, A. F. J.
(1985). The use of bibliometric data for the measurement of university
research performance. Research Policy, 14, 131–149.
Moed, H. F. (1989). Bibliometric measurement of research performance
and Price’s theory of differences among the sciences. Scientometrics,
15, 473-485.
Moed, H. F. & Van Leeuwen, T. N. (1995). Improving the accuracy of
the Institute for Scientific Information's journal impact factor. Journal
of the American Society for Information Science, 46, 461-467.
Moed, H. F., Van Leeuwen, T. N., & Reedijk, J. (1999). Towards
appropriate indicators of journal impact. Scientometrics, 46(3), 575-
589.
Moed, H. F. (2005). Citation Analysis in Research Evaluation. New
York: Kluwer Academic Publishers.

188
Moed, H. F. (2010). Measuring contextual citation impact of scientific
journals. Journal of Informetrics, 4(3), 265-277.
Moed, H.F., de Moya-Anegón, F., López-Illescas, C., & Visser, M.
(2011). Is concentration of university research associated with better
research performance? Journal of Informetrics, 5(4), 649-658.
Moody, J. (2004). The structure of a social science collaboration
network: disciplinary cohesion from 1963 to 1999. American
Sociological Review, 69 (2), 213–238.
Moravcsik, M. J. & Murugesan, P. (1975). Some results on the function
and quality of citations. Social Studies of Science, 5, 86-92.
Morillo, F., Bordons, M. & Gómez, I. (2003). Interdisciplinarity in
science: a tentative typology of disciplines and research areas. Journal
of the American Society for Information Science and Technology,
54(13), 1237-1249.
Nagaoka, S., Igami, M., Eto, M., & Ijichi, T. (2011). Knowledge
Creation Process in Science: Basic findings from a large-scale survey
of researchers in Japan. Report by National Institute of Science and
Technology Policy (NISTEP), Institute of Innovation Research (IIR),
Hitotsubashi University.
Narin, F. & Whitlow, E. S. (1990). Measurement of scientific co-
operation and co-authorship in CEC related areas of science. Report
EUR 12900. Office for Official Publications in the European
Communities, Luxembourg.
Narin, F., Stevens, K., & Whitlow, E. S. (1991). Scientific cooperation in
Europe and the citation of multinationally authored papers.
Scientometrics, 21(3), 313-323.
Nederhof, A.J. (2006). Bibliometric monitoring of research performance
in the social sciences and the humanities: A review. Scientometrics,
66(1), 81–100.
Nemeth, C. J. & Goncalo, J. A. (2005). Creative collaborations from
afar: The benefits of independent authors, Creativity Research Journal,
17, 1-8.
Newman, M. E. J. (2001). Scientific collaboration networks. I. Network
construction and fundamental results. Physical Review E, 64, 016131.
Nieminen, P., Carpenter, J., Rucker, G., & Schumacher, M. (2006). The
relationship between quality of research and citation frequency. BMC
Medical Research Methodology, 6(1), 42.

189
O’Brien, R. M. (2007). A caution regarding rules of thumb for variance
inflation factors. Quality & Quantity, 41(5), 673-690.
Ohniwaa, R. L., Denawaa, M., Kudob, M., Nakamurab, K., &
Takeyasua, K. (2004). Perspective factor: a novel indicator for the
assessment of journal quality. Research Evaluation, 3, 175-180.
Oppenheim, C. & Renn, S. P. (1978). Highly cited old papers and
reasons why they continue to be cited. Journal of the American Society
for Information Science, 29, 225-31.
Padial, A.A., Nabout, J.C., Siqueira, T., Bini, L.M., & Diniz-Filho,
J.A.F. (2010). Weak evidence for determinants of citation frequency in
ecological articles. Sceintometrics, 85, 1-12.
Pao, M. L., & Goffman, W. (1990). Quality assessment of
schistosomiasis literature. Egghe, L. & Rousseau, R. (Ed.),
Informetrics, 89/90, Belgium, Diepenbeek, 229-242.
Patterson, M.S., & Harris, S. (2009). The relationship between
reviewers’ quality-scores and number of citations for papers published
in the journal Physics in Medicine and Biology from 2003–2005.
Scientometrics, 80, 345–351.
Patsopoulos, N.A., Analatos, A. A., & Ioannidis, J. P. (2005). Relative
citation impact of various study designs in the health sciences. Journal
of the American Medical Association, 293, 2362-2366.
Peng, T.Q. & Zhu, J.J.H. (2012). Where you publish matters most: A
multilevel analysis of factors affecting citations of Internet studies.
Journal of the American Society for Information Science, 63(9), 1789–
1803.
Perakakis, P., Taylor, M., Buela-Casal, G., & Checa, P. (2005). A neuro-
fuzzy system to calculate a journal internationality index. Symposium
on Fuzzy Logic and Soft Computing, 1, 157-163.
Persson, O. (2010). Are highly cited papers more international?
Scientometrics, 83(2), 397-401.
Persson, O., Glänzel, W., & Danell, R. (2004). Inflationary bibliometric
values: The role of scientific collaboration and the need for relative
indicators in evaluative studies. Scientometrics, 60(3), 421-432.
Peters, H.P.F. & Van Raan, A.F.J. (1994). On Determinants of Citation
Scores: A Case Study in Chemical Engineering. Journal of the
American Society for Information Science, 45(1), 39-49.

190
Porter, A. L., & Youtie, J. (2009). Where does nanotechnology belong in
the map of science?. Nature Nanotechnology, 4(9), 534-536.
Price, D.J. (1965). Networks of scientific papers. Science, 149, 510-515.
Ravichandra Rao, I.K. (2007). Distributions of Hirsch-index and G-
index: An empirical study. In D. Torres-Salinas and H. F. Moed (Eds.),
Proceedings of the 11th
Conference of the International Society for
Scientometrics and Informetrics, Madrid, Spain, 2, 655-658.
Reed, D. A. et al. (2007). Association between Funding and Quality of
Published Medical Education Research. Journal of American Medical
Association, 298(9), 1002-1009.
Rey-Rocha, J. & Martín-Sempere, M.J. (1999). The role of domestic
journals in geographically oriented disciplines: The case of Spanish
journals on Earth Sciences. Scientometrics, 45, 203-216.
Rey-Rocha, J. & Martín-Sempere, M.J. (2004). Patterns of the foreign
contributions in some domestic vs. international journals on Earth
Sciences. Scientometrics, 59, 95-115.
Rinia, E.J., van Leeuwen, Th.N., Bruins, E.E.W., van Vuren, H.G. &
Van Raan, A.F.J. (2001). Citation delay in interdisciplinary knowledge
exchange. Scientometrics, 51(1), 293–309.
Rousseau, R. (1992). Why am I not cited or, Why are multi-authored
papers more cited than others?. Journal of Documentation, 48(1), 79-
80.
Rousseau, R. (2001). Are multi-authored articles cited more than single-
authored ones? Are collaborations with authors from other countries
more cited than collaborations within the country? A case study. In: F.
Havemann, R. Roland-Döbler and H. Kretschmer (eds.) Gesellschaft
für Wissenschaftsforschung, Berlin, 173-176.
Rousseau, R., García-Zorita, C., & Sanz-Casado, E. (2013). The h-
bubble. Journal of Informetrics, 7(2), 294-300.
Sandstrom, U., Wadskog, D. & Karlsson, S. (2005). Research institutes
and universities: does collaboration pay? In Ingwersen, P. & Larsen, B.
(Eds), Proceedings of the 10th
International Conference of the
International Society for Scientometrics and Informetrics, Karolinska
University Press, Stockholm.
Schloegl, C., & Stock, W.G. (2004). Impact and relevance of LIS
journals: A scientometric analysis of international and German-

191
language LIS journals—Citation analysis versus reader survey. Journal
of the American Society for Information Science and Technology,
55(13), 1155-1168.
Schmoch, U. & Schubert, T. (2008). Are international co-publications an
indicator for quality of scientific research? Scientometrics, 74(3), 361-
377.
Schönbach, K. (2006). Are national communication journals still
necessary? A case study and some suggestions. Communications,
31(4), 447-454.
Schubert, A. & Glänzel, W. (2006). Cross-national preference in co-
authorship, references and citations. Scientometrics, 69 (2), 409-428.
Schubert, T., & Michels, C. (2013). Placing articles in the large publisher
nations: Is there a “free lunch” in terms of higher impact?. Journal of
the American Society for Information Science and Technology, 64(3),
596-611.
Shadish, W. R., Tolliver, D., Gray, M. & Sengupta, S. K. (1995). Author
judgments about works they cite – three studies from psychology
journals. Social Studies of Science, 25, 477-98.
Shaw, J. G. (1987). Article-by-article citation analysis of medical
journals. Scientometrics, 12, 101-110.
Shelley, M. & Schuh, J. H. (2001). Are the best higher education
journals really the best? A meta-analysis of writing quality and read-
ability. Journal of Scholarly Publishing, 33(1), 11-22.
Schubert, A. (2009). Using the h-index for assessing single publications.
Scientometrics, 78(3), 559-565.
Seglen, P. O. (1997). Why the impact factor of journals should not be
used for evaluating research. British Medical Journal, 314(7079), 498.
Sin, S.-C.J. (2011). International co-authorship and citation impact: A
bibliometric study of six LIS journals, 1980–2008. Journal of the
American Society for Information Science and Technology, 62(9),
1770–1783.
Small, H. (1978). Cited documents as concept symbols. Social Studies of
Science, 8 (3), 327-340.
Small, H. (1998). Citations and consilience in science. Scientometrics,
43(1), 143-148.

192
Small, H. (2004). On the shoulders of Robert Merton: towards a
normative theory of citation. Scientometrics, 60, 71-79.
Smart, J. C. and Bayer, A. E. (1986). Author collaboration and impact: A
note on citation rates of single and multiple authored articles.
Scientometrics, 10, 297-305.
Smith, L. C. (1981). Citation analysis. Library Trends, 30, 83-106.
Sooryamoorthy, R. (2009). Do types of collaboration change citation?
Collaboration and citation patterns of South African science
publications. Scientometrics, 81(1), 177–193.
Starbuck, W.H. (2005). How Much Better Are the Most-Prestigious
Journals? The Statistics of Academic Publication. Organization
Science, 16(2), 180-200.
Steele, T.W., & Stier, J.C. (2000). The impact of interdisciplinary
research in the environmental sciences: A forestry case study. Journal
of the American Society for Information Science, 51, 476–484.
Stewart, J. A. (1983). Achievement and ascriptive processes in the
recognition of scientific articles. Social Forces, 62, 166-89.
Stewart, J. A. (1990). Drifting Continents and Colliding Paradigms:
Perspectives on the Geoscience Revolution. Bloomington, IN: Indiana
University Press.
Stremersch, S. Verniers, I. & Verhoef, P. C. (2007). The quest for
citations: drivers of article impact. Journal of Marketing, 71, 171-193.
Sylvia, M. J. (1998). Citation analysis as an unobtrusive method for
journal collection evaluation using psychology student research
bibliographies. Collection Building, 17(1), 20-28.
The Royal Society (2011). Knowledge, networks and nations: Global
scientific collaboration in the 21st century. London: Elsevier, 113p.
Thomson Reuters Technical Support (2013). Available at: http://ip-
science.thomsonreuters.com/support/.
Torvik, V. I., Weeber, M., Swanson, D. R., & Smalheiser, N. R. (2005).
A probabilistic similarity metric for Medline records: a model for
author name disambiguation. Journal of the American Society for
information science and technology, 56(2), 140-158.

193
Uzun, A. (2004). Assessing internationality of scholarly journals through
foreign authorship patterns: the case of major journals in information
science, and scientometrics. Scientometrics, 61, 457-465.
Van Dalen, H. P. & Henkens, K. E. (2005). Signals in science – on the
importance of signalling in gaining attention in science. Scientometrics,
64, 209-33.
Van Raan, A. F. J. (1998). The influence of international collaboration
on the impact of research results. Scientometrics, 42(3), 423-428.
Van Raan, A. (2003). The use of bibliometric analysis in research
performance assessment and monitoring of interdisciplinary scientific
developments. Technology Assessment – Theory and Practice, 1(12),
20–29.
Vanclay, J.K. (2013). Factors affecting citation rates in environmental
science. Journal of Informetrics, 7(2), 265-271.
Vieira, E. S., & Gomes, J. A. N. F. (2010). Citation to scientific articles:
Its distribution and dependence on the article features. Journal of
Informetrics, 4 (1), 1-13.
Vinkler, P. (1987). A quasi-quantitative citation model. Scientometrics,
12, 47-72.
von Wartburg, I., Teichert, T., & Rost, K. (2005). Inventive progress
measured by multi-stage patent citation analysis. Research Policy,
34(10): 1591-1607.
Wallace, M. L., Larivière, V. & Gingras, Y. (2011). The small world of
citations: How close are citing authors to those they cite? Proceedings
of ISSI 2011, 1013-1015. Edited by E. Noyons, P. Ngulube, & J. Leta,
July 4-7, Durban, South Africa.
Walters, G. D. (2006). Predicting subsequent citations to articles
published in twelve crime-psychology journals: Author impact versus
journal impact. Scientometrics, 69(3), 499-510.
Waltman, L., Van Eck, N.J., Van Leeuwen, T.N., Visser, M. S., & Van
Raan, A.F.J. (2011). Towards a New Crown Indicator: Some
Theoretical Considerations. Journal of Informetrics, 5(1), 37-47.
Wang, S., Wang, H. & Weldon, P.R. (2007). Bibliometric analysis of
English-language academic journals of China and their
internationalisation. Scientometrics, 73(3), 331-343.

194
Watson, R., Annells, M., Amella, E., & Wong, T. (2007). What makes a
JCN paper international? Journal of Clinical Nursing, 16, 1-2.
Webster, G.D., Jonason, P.K. & Schember, T.O. (2009). Hot topics and
popular papers in evolutionary psychology: Analyses of title words and
citation counts in Evolution and Human Behaviour, 1979–2008.
Evolutionary Psychology, 7(3), 348–362.
West, R. & McIlwaine, A. (2002). What do citation counts count for in
the field of addiction? An empirical evaluation of citation counts and
their link with peer ratings of quality. Addiction, 87, 501-504.
White, H. D. (2001). Authors as citers over time. Journal of the
American Society for Information Science and Technology, 52(2), 87-
108.
White, H. D. (2004). Reward, persuasion, and the Sokal Hoax: a study in
citation identities. Scientometrics, 60(1), 93-120.
White, M. J. & White, G. (1977). Citation analysis of psychology
journals. American Psychologists, 32(5): 301-305.
Wilson, C.S. (1999). Informetrics. Annual Review of Information Science
and Technology, 34, 107-247.
Willis, D. L., Bahler, C. D., Neuberger, M. M., & Dahm, P. (2011).
Predictors of citations in the urological literature. BJU International,
107(12), 1876–1880.
Wormell, I. (1998). Informetric analysis of the international impact of
scientific journals: how ’international’ are the international journals?.
Journal of Documentation, 54(5), 584-605.
Wu, X. F., Fu, Q., & Rousseau, R. (2008). On indexing in the Web of Science
and predicting journal impact factor. Journal of Zhejiang University
SCIENCE B, 9(7), 582-590.
Yan, E. & Ding, Y. (2009). Applying centrality measures to impact
analysis: A coauthorship network analysis. Journal of the American
Society for Information Science and Technology, 60(10), 2107-2118.
Yang, K.H., Peng, H.T., Jiang, J.Y., Lee, H.M., & Ho, J.M. (2008).
Author Name Disambiguation for Citations Using Topic and Web
Correlation. Research and Advanced Technology for Digital Libraries,
185–196.

195
Yue, W. (2004). Predicting the Citation Impact of Clinical Neurology
Journals using Structural Equation Modeling with Partial Least
Squares. Doctoral thesis, University of New South Wales.
Zhao, D. Z. (2010). Characteristics and impact of grant-funded research:
a case study of the library and information science field.
Scientometrics, 84(2), 293-306.
Zimmerman, J. L. (1989). Improving a manuscript’s readability and
likelihood of publication. Issues in Accounting Education, 4, 458-466.
Zitt, M. & Bassecoulard, E. (1998). Internationalisation of scientific
journals: a measurement based on publication and citation scope.
Scientometrics, 41 (1-2), 255-271.
Zuckerman, H. (1987). Citation analysis and the complex problem of
intellectual influence. Scientometrics, 12(5-6), 329-338.

196
APPENDIX A: LIST OF PUBLICATIONS
Didegah, F. & Thelwall, M. (2013). Which Factors Help Authors Produce the
Highest Impact Research? Collaboration, Journal and Document Properties.
Journal of Informetrics, 7, 861-873.
Didegah, F. & Thelwall, M. (2013). Determinants of Research Citation Impact in
Nanoscience and Nanotechnology. Journal of the American Society for
Information Science & Technology (JASIS&T), 64(55), 1055-1064.
Didegah, F. & Thelwall, M. (2013). Modelling Article Citation Impact Factors
Using an Integrated Statistical Method. 76th ASIS&T Conference: Beyond the
Cloud: Rethinking Information Boundaries, Canada, Montreal, 1-5 November.
Didegah, F., Thelwall, M. & Wilson, P. (2013). A Simultaneous Assessment of
Article Citation Factors Using a Combined Statistical Modelling. 14th
ISSI
Conference, Vienna, Austria, 15-19 July.
Didegah, F. & Thelwall, M. (2012). Predictive Indicators of Research Citation
Impact in S&T Fields: A Case Study of Nanoscience and Nanotechnology.
Conference proceedings of STI conference, Canada, Montreal, 5-8 September.
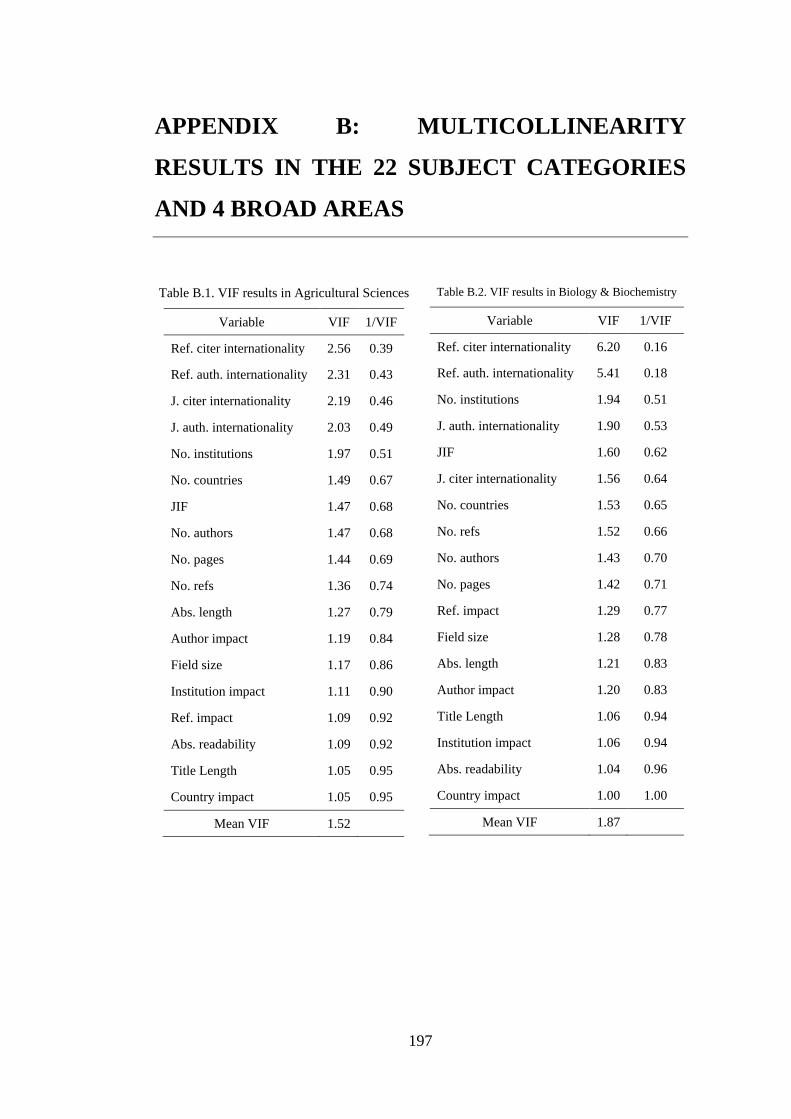
197
APPENDIX B: MULTICOLLINEARITY
RESULTS IN THE 22 SUBJECT CATEGORIES
AND 4 BROAD AREAS
Table B.1. VIF results in Agricultural Sciences
Variable VIF 1/VIF
Ref. citer internationality 2.56 0.39
Ref. auth. internationality 2.31 0.43
J. citer internationality 2.19 0.46
J. auth. internationality 2.03 0.49
No. institutions 1.97 0.51
No. countries 1.49 0.67
JIF 1.47 0.68
No. authors 1.47 0.68
No. pages 1.44 0.69
No. refs 1.36 0.74
Abs. length 1.27 0.79
Author impact 1.19 0.84
Field size 1.17 0.86
Institution impact 1.11 0.90
Ref. impact 1.09 0.92
Abs. readability 1.09 0.92
Title Length 1.05 0.95
Country impact 1.05 0.95
Mean VIF 1.52
Table B.2. VIF results in Biology & Biochemistry
Variable VIF 1/VIF
Ref. citer internationality 6.20 0.16
Ref. auth. internationality 5.41 0.18
No. institutions 1.94 0.51
J. auth. internationality 1.90 0.53
JIF 1.60 0.62
J. citer internationality 1.56 0.64
No. countries 1.53 0.65
No. refs 1.52 0.66
No. authors 1.43 0.70
No. pages 1.42 0.71
Ref. impact 1.29 0.77
Field size 1.28 0.78
Abs. length 1.21 0.83
Author impact 1.20 0.83
Title Length 1.06 0.94
Institution impact 1.06 0.94
Abs. readability 1.04 0.96
Country impact 1.00 1.00
Mean VIF 1.87

198
Table B.3. VIF results in Chemistry
Variable VIF 1/VIF
Ref. citer
internationality 3.69 0.27
Ref. auth.
internationality 3.43 0.29
No. institutions 1.84 0.54
J. auth. internationality 1.58 0.63
No. countries 1.57 0.64
No. pages 1.57 0.64
J. citer internationality 1.55 0.64
No. refs 1.51 0.66
JIF 1.41 0.71
Abs. length 1.39 0.72
No. authors 1.27 0.79
Author impact 1.21 0.83
Abs. readability 1.08 0.93
Title Length 1.07 0.93
Institution impact 1.07 0.93
Field size 1.05 0.95
Ref. impact 1.01 0.99
Country impact 1.01 0.99
Mean VIF 1.57
Table B.4. VIF results in Clinical Medicine
Variable VIF 1/VIF
Ref. citer
internationality 3.47 0.29
Ref. auth.
internationality 2.82 0.35
J. citer internationality 2.09 0.48
No. institutions 1.76 0.57
J. auth. internationality 1.74 0.58
No. refs 1.49 0.67
JIF 1.47 0.68
No. pages 1.47 0.68
No. countries 1.4 0.71
No. authors 1.35 0.74
Author impact 1.28 0.78
Ref. impact 1.19 0.84
Abs. length 1.13 0.89
Institution impact 1.11 0.9
Title Length 1.08 0.92
Field size 1.06 0.94
Abs. readability 1.06 0.95
Country impact 1.01 0.99
Mean VIF 1.55

199
Table B.5. VIF results in Computer Science
Variable VIF 1/VI
F
Ref. citer internationality 2.72 0.37
Ref. auth. internationality 2.28 0.44
J. citer internationality 2.14 0.47
No. institutions 1.95 0.51
J. auth. internationality 1.86 0.54
No. countries 1.59 0.63
No. pages 1.46 0.68
JIF 1.45 0.69
No. authors 1.39 0.72
No. refs 1.39 0.72
Author impact 1.17 0.86
Abs. length 1.17 0.86
Field size 1.13 0.89
Abs. readability 1.1 0.91
Ref. impact 1.09 0.92
Title Length 1.06 0.94
Institution impact 1.05 0.95
Country impact 1.01 0.99
Mean VIF 1.5
Table B.6. VIF results in Economics & Business
Variable VIF 1/VI
F
No. institutions 2.83 0.35
No. authors 1.97 0.51
Ref. citer internationality 1.96 0.51
J. citer internationality 1.96 0.51
No. countries 1.93 0.52
J. auth. internationality 1.71 0.58
Ref. auth. internationality 1.42 0.70
JIF 1.4 0.72
No. refs 1.37 0.73
Ref. impact 1.19 0.84
No. pages 1.17 0.86
Field size 1.15 0.87
Author impact 1.14 0.88
Abs. readability 1.07 0.93
Abs. length 1.07 0.93
Title Length 1.06 0.94
Institution impact 1.04 0.96
Country impact 1.03 0.97
Mean VIF 1.47

200
Table B.7. VIF results in Engineering
Variable VIF 1/VI
F
No. institutions 2.66 0.38
Ref. citer internationality 2.44 0.41
Ref. auth. internationality 2.26 0.44
No. authors 1.85 0.54
No. countries 1.79 0.56
J. citer internationality 1.78 0.56
J. auth. internationality 1.76 0.57
No. pages 1.44 0.70
No. refs 1.4 0.71
JIF 1.31 0.76
Author impact 1.21 0.83
Abs. length 1.16 0.87
Field size 1.13 0.88
Institution impact 1.09 0.92
Ref. impact 1.05 0.95
Abs. readability 1.04 0.96
Title Length 1.04 0.96
Country impact 1.01 0.99
Mean VIF 1.52
Table B.8. VIF results in Environment/Ecology
Variable VIF 1/VI
F
No. institutions 2.59 0.39
Ref. citer internationality 2.39 0.42
J. citer internationality 2.31 0.43
Ref. auth. internationality 2.14 0.47
J. auth. internationality 2.01 0.5
No. countries 1.78 0.56
No. authors 1.78 0.56
JIF 1.56 0.64
No. refs 1.51 0.66
No. pages 1.41 0.71
Abs. length 1.23 0.81
Author impact 1.22 0.82
Institution impact 1.1 0.91
Abs. readability 1.08 0.92
Field size 1.05 0.95
Title Length 1.04 0.96
Ref. impact 1.03 0.97
Country impact 1.01 0.99
Mean VIF 1.57
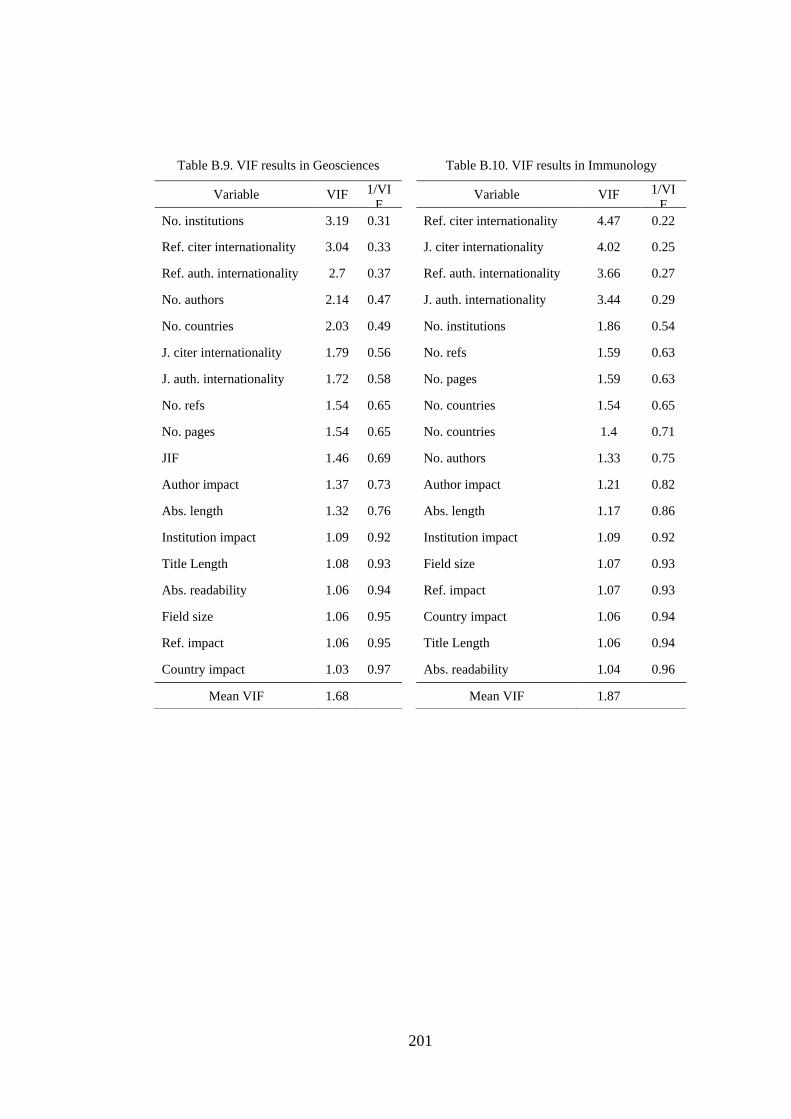
201
Table B.9. VIF results in Geosciences
Variable VIF 1/VI
F
No. institutions 3.19 0.31
Ref. citer internationality 3.04 0.33
Ref. auth. internationality 2.7 0.37
No. authors 2.14 0.47
No. countries 2.03 0.49
J. citer internationality 1.79 0.56
J. auth. internationality 1.72 0.58
No. refs 1.54 0.65
No. pages 1.54 0.65
JIF 1.46 0.69
Author impact 1.37 0.73
Abs. length 1.32 0.76
Institution impact 1.09 0.92
Title Length 1.08 0.93
Abs. readability 1.06 0.94
Field size 1.06 0.95
Ref. impact 1.06 0.95
Country impact 1.03 0.97
Mean VIF 1.68
Table B.10. VIF results in Immunology
Variable VIF 1/VI
F
Ref. citer internationality 4.47 0.22
J. citer internationality 4.02 0.25
Ref. auth. internationality 3.66 0.27
J. auth. internationality 3.44 0.29
No. institutions 1.86 0.54
No. refs 1.59 0.63
No. pages 1.59 0.63
No. countries 1.54 0.65
No. countries 1.4 0.71
No. authors 1.33 0.75
Author impact 1.21 0.82
Abs. length 1.17 0.86
Institution impact 1.09 0.92
Field size 1.07 0.93
Ref. impact 1.07 0.93
Country impact 1.06 0.94
Title Length 1.06 0.94
Abs. readability 1.04 0.96
Mean VIF 1.87

202
Table B.11. VIF results in Materials Science
Variable VIF 1/VIF
Ref. citer internationality 3.23 0.31
Ref. auth. internationality 2.73 0.37
J. citer internationality 2.24 0.45
J. auth. internationality 2.07 0.48
No. institutions 1.88 0.53
No. pages 1.52 0.66
No. countries 1.49 0.67
JIF 1.45 0.69
No. authors 1.43 0.7
No. refs 1.42 0.7
Author impact 1.3 0.77
Abs. length 1.18 0.85
Field size 1.15 0.87
Abs. readability 1.14 0.88
Institution impact 1.09 0.91
Ref. impact 1.09 0.92
Title Length 1.03 0.97
Country impact 1.02 0.98
Mean VIF 1.58
Table B.12. VIF results in Mathematics
Variable VIF 1/VIF
No. institutions 2.6 0.38
Ref. citer internationality 2.07 0.48
No. countries 1.9 0.53
J. citer internationality 1.87 0.53
No. authors 1.81 0.55
J. auth. internationality 1.76 0.57
Ref. auth. internationality 1.72 0.58
No. refs 1.43 0.7
No. pages 1.39 0.72
JIF 1.32 0.76
Field size 1.27 0.79
Author impact 1.24 0.81
Abs. length 1.19 0.84
Abs. readability 1.19 0.84
Institution impact 1.05 0.96
Title Length 1.04 0.96
Country impact 1.03 0.97
Ref. impact 1.01 0.99
Mean VIF 1.49

203
Table B.13. VIF results in Microbiology
Variable VIF 1/VIF
Ref. citer
internationality 5.98 0.17
Ref. auth.
internationality 5.54 0.18
JIF 2.39 0.42
No. pages 2.11 0.47
J. auth. internationality 2.02 0.5
No. institutions 2.01 0.5
No. refs 1.97 0.51
No. countries 1.56 0.64
No. authors 1.47 0.68
Abs. length 1.33 0.75
J. citer internationality 1.28 0.78
Author impact 1.23 0.81
Field size 1.11 0.9
Institution impact 1.09 0.92
Title Length 1.05 0.95
Abs. readability 1.04 0.96
Country impact 1.02 0.98
Ref. impact 1.01 0.99
Mean VIF 1.96
Table B.14. VIF results in Molecular Biology & Genetics
Variable VIF 1/VI
F
Ref. citer internationality 5.2
3 0.19
Ref. auth. internationality 4.5
7 0.22
No. institutions 3.0
0 0.33
J. citer internationality 2.1
9 0.46
No. authors 2.0
9 0.48
No. countries 1.9
1 0.52
J. auth. internationality 1.8
2 0.55
JIF 1.6
1 0.62
No. pages 1.5
4 0.65
No. refs 1.4
8 0.68
Author impact 1.2
3 0.81
Abs. length 1.2
2 0.82
Institution impact 1.0
7 0.93
Title Length 1.0
6 0.94
Ref. impact 1.0
5 0.95
Field size 1.0
4 0.96
Abs. readability 1.0
4 0.96
Country impact 1.0
0 1.00
Mean VIF 1.9
0

204
Table B.15. VIF results in Multidisciplinary
Variable VIF 1/VIF
Ref. citer
internationality 4.01 0.25
J. citer internationality 3.83 0.26
No. institutions 3.5 0.29
Ref. auth.
internationality 3.1 0.32
J. auth. internationality 2.82 0.35
No. countries 2.46 0.41
No. pages 2.18 0.46
No. authors 1.89 0.53
JIF 1.63 0.61
No. refs 1.57 0.64
Author impact 1.25 0.8
Ref. impact 1.22 0.82
Abs. length 1.17 0.86
Title Length 1.15 0.87
Field size 1.13 0.89
Institution impact 1.09 0.92
Abs. readability 1.03 0.97
Country impact 1.03 0.97
Mean VIF 2
Table B.16. VIF results in Neuroscience & Behaviour
Variable VIF 1/VIF
Ref. citer
internationality 3.9 0.26
Ref. auth.
internationality 3.23 0.31
No. institutions 2.01 0.5
No. pages 1.7 0.59
No. refs 1.67 0.6
No. authors 1.54 0.65
J. auth. internationality 1.52 0.66
No. countries 1.49 0.67
Ref. impact 1.4 0.71
J. citer internationality 1.4 0.71
JIF 1.4 0.71
Author impact 1.2 0.83
Abs. length 1.18 0.84
Field size 1.14 0.87
Institution impact 1.08 0.92
Abs. readability 1.08 0.93
Title Length 1.06 0.94
Country impact 1.01 0.99
Mean VIF 1.61
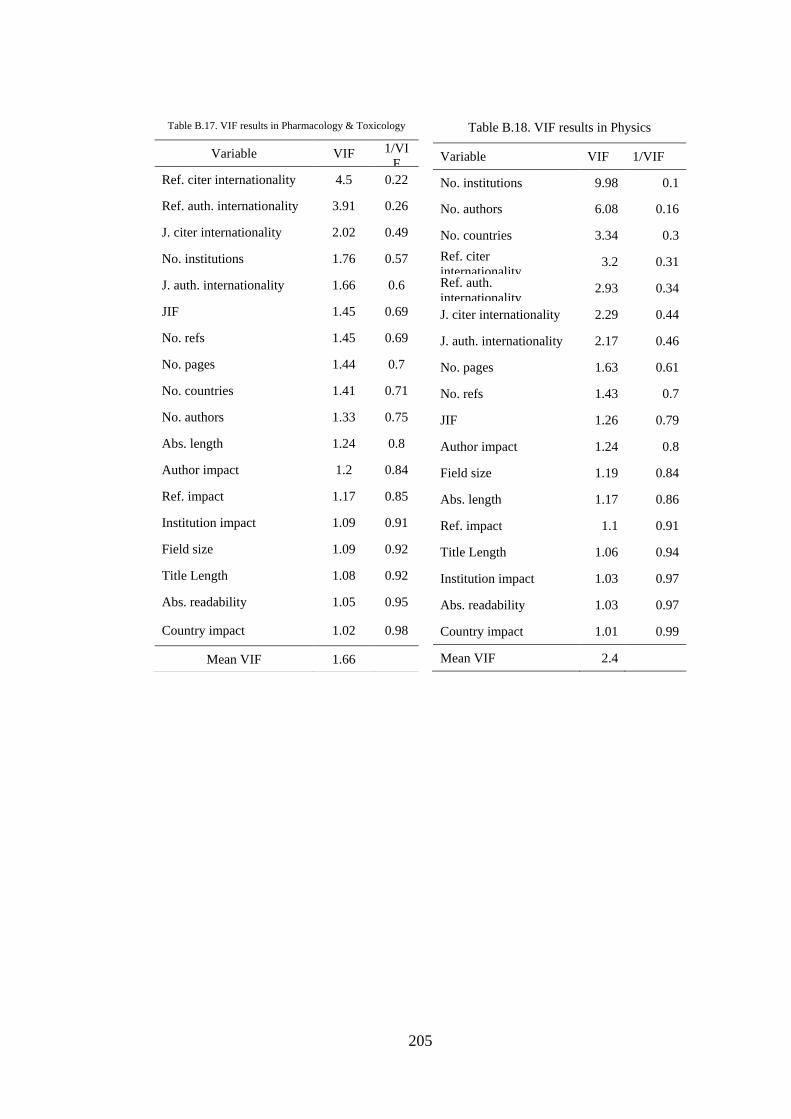
205
Table B.17. VIF results in Pharmacology & Toxicology
Variable VIF 1/VI
F
Ref. citer internationality 4.5 0.22
Ref. auth. internationality 3.91 0.26
J. citer internationality 2.02 0.49
No. institutions 1.76 0.57
J. auth. internationality 1.66 0.6
JIF 1.45 0.69
No. refs 1.45 0.69
No. pages 1.44 0.7
No. countries 1.41 0.71
No. authors 1.33 0.75
Abs. length 1.24 0.8
Author impact 1.2 0.84
Ref. impact 1.17 0.85
Institution impact 1.09 0.91
Field size 1.09 0.92
Title Length 1.08 0.92
Abs. readability 1.05 0.95
Country impact 1.02 0.98
Mean VIF 1.66
Table B.18. VIF results in Physics
Variable VIF 1/VIF
No. institutions 9.98 0.1
No. authors 6.08 0.16
No. countries 3.34 0.3
Ref. citer
internationality 3.2 0.31
Ref. auth.
internationality 2.93 0.34
J. citer internationality 2.29 0.44
J. auth. internationality 2.17 0.46
No. pages 1.63 0.61
No. refs 1.43 0.7
JIF 1.26 0.79
Author impact 1.24 0.8
Field size 1.19 0.84
Abs. length 1.17 0.86
Ref. impact 1.1 0.91
Title Length 1.06 0.94
Institution impact 1.03 0.97
Abs. readability 1.03 0.97
Country impact 1.01 0.99
Mean VIF 2.4

206
Table B.19. VIF results in Plant & Animal Science
Variable VIF 1/VIF
Ref. citer internationality 2.35 0.42
No. institutions 2.11 0.47
Ref. auth. internationality 1.96 0.51
J. citer internationality 1.67 0.60
No. countries 1.61 0.62
JIF 1.58 0.63
No. authors 1.54 0.65
No. refs 1.54 0.65
J. auth. internationality 1.49 0.67
No. pages 1.41 0.71
Author impact 1.32 0.76
Abs. length 1.23 0.81
Field size 1.21 0.83
Ref. impact 1.14 0.88
Institution impact 1.09 0.92
Abs. readability 1.09 0.92
Title Length 1.05 0.95
Country impact 1.02 0.98
Mean VIF 1.47
Table B.20. VIF results in Psychiatry/Psychology
Variable VIF 1/VIF
No. institutions 1.97 0.51
Ref. citer internationality 1.82 0.55
Ref. auth. internationality 1.81 0.55
No. authors 1.81 0.55
J. citer internationality 1.69 0.59
JIF 1.62 0.62
No. pages 1.55 0.65
J. auth. internationality 1.50 0.67
No. countries 1.43 0.70
Author impact 1.42 0.70
No. refs 1.37 0.73
Abs. length 1.25 0.80
Ref. impact 1.24 0.81
Field size 1.23 0.81
Abs. readability 1.08 0.93
Institution impact 1.07 0.93
Country impact 1.06 0.94
Title Length 1.05 0.95
Mean VIF 1.44

207
Table B.21. VIF results in Social Sciences, General
Variable VIF 1/VIF
No. institutions 2.09 0.48
No. authors 1.99 0.50
Ref. citer internationality 1.72 0.58
Ref. auth. internationality 1.66 0.60
No. pages 1.59 0.63
J. citer internationality 1.58 0.63
J. auth. internationality 1.36 0.74
No. refs 1.35 0.74
Author impact 1.33 0.75
No. countries 1.32 0.76
JIF 1.32 0.76
Field size 1.17 0.86
Abs. length 1.16 0.86
Institution impact 1.15 0.87
Ref. impact 1.11 0.90
Title Length 1.06 0.94
Abs. readability 1.05 0.95
Country impact 1.03 0.97
Mean VIF 1.39
Table B.22. VIF results in Space Science
Variable VIF 1/VIF
No. institutions 5.85 0.17
No. authors 3.24 0.31
Ref. citer internationality 2.66 0.38
No. countries 2.63 0.38
Ref. auth. internationality 2.39 0.42
JIF 1.89 0.53
J. auth. internationality 1.74 0.57
No. refs 1.59 0.63
No. pages 1.50 0.67
Author impact 1.47 0.68
Abs. length 1.38 0.73
Field size 1.21 0.83
Ref. impact 1.11 0.90
Title Length 1.07 0.94
Institution impact 1.05 0.95
J. citer internationality 1.05 0.96
Abs. readability 1.03 0.97
Country impact 1.00 1.00
Mean VIF 1.88
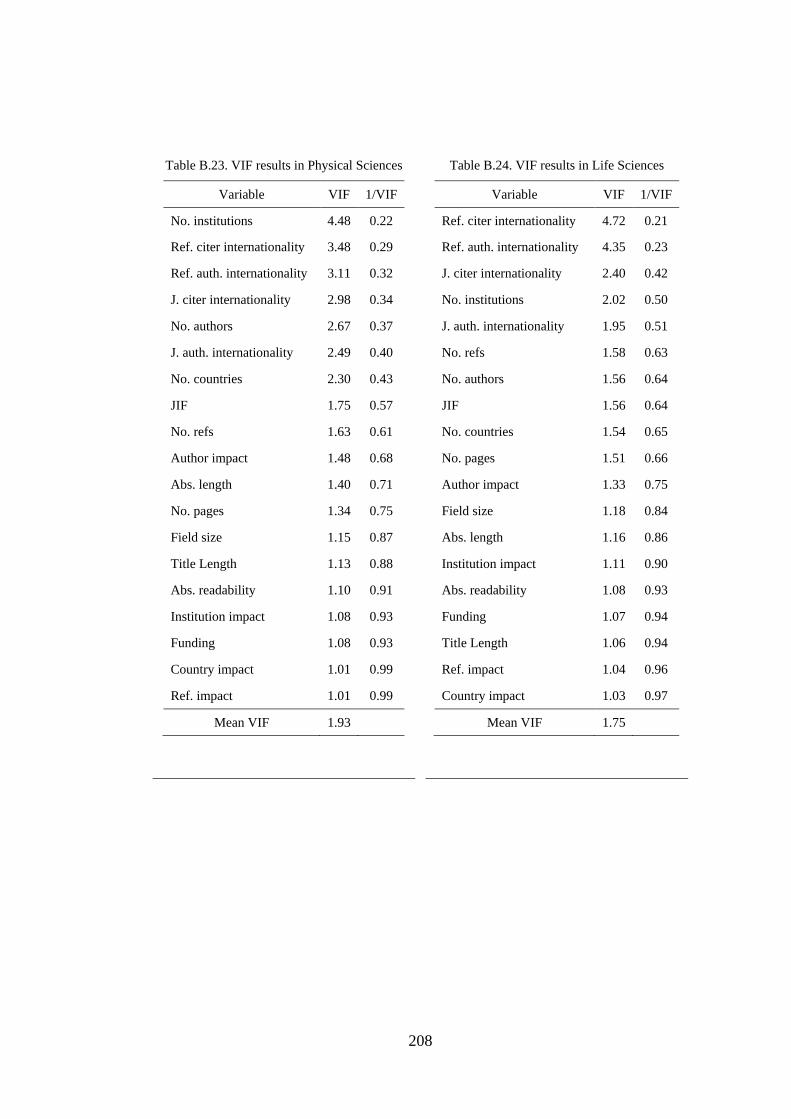
208
Table B.23. VIF results in Physical Sciences
Variable VIF 1/VIF
No. institutions 4.48 0.22
Ref. citer internationality 3.48 0.29
Ref. auth. internationality 3.11 0.32
J. citer internationality 2.98 0.34
No. authors 2.67 0.37
J. auth. internationality 2.49 0.40
No. countries 2.30 0.43
JIF 1.75 0.57
No. refs 1.63 0.61
Author impact 1.48 0.68
Abs. length 1.40 0.71
No. pages 1.34 0.75
Field size 1.15 0.87
Title Length 1.13 0.88
Abs. readability 1.10 0.91
Institution impact 1.08 0.93
Funding 1.08 0.93
Country impact 1.01 0.99
Ref. impact 1.01 0.99
Mean VIF 1.93
Table B.24. VIF results in Life Sciences
Variable VIF 1/VIF
Ref. citer internationality 4.72 0.21
Ref. auth. internationality 4.35 0.23
J. citer internationality 2.40 0.42
No. institutions 2.02 0.50
J. auth. internationality 1.95 0.51
No. refs 1.58 0.63
No. authors 1.56 0.64
JIF 1.56 0.64
No. countries 1.54 0.65
No. pages 1.51 0.66
Author impact 1.33 0.75
Field size 1.18 0.84
Abs. length 1.16 0.86
Institution impact 1.11 0.90
Abs. readability 1.08 0.93
Funding 1.07 0.94
Title Length 1.06 0.94
Ref. impact 1.04 0.96
Country impact 1.03 0.97
Mean VIF 1.75

209
Table B.25. VIF results in Medicine
Variable VIF 1/VI
F
Ref. auth. internationality 2.41 0.41
Ref. citer internationality 2.25 0.45
J. citer internationality 2.15 0.47
No. authors 1.95 0.51
No. institutions 1.92 0.52
J. auth. internationality 1.74 0.58
No. pages 1.64 0.61
JIF 1.62 0.62
No. refs 1.44 0.69
Ref. impact 1.37 0.73
Author impact 1.35 0.74
No. countries 1.34 0.75
Abs. length 1.32 0.76
Field size 1.3 0.77
Funding 1.28 0.78
Institution impact 1.11 0.9
Title Length 1.11 0.9
Abs. readability 1.08 0.92
Country impact 1.01 0.99
Mean VIF 1.55
Table B.26. VIF results in Social Sciences
Variable VIF 1/VIF
No. institutions 3.91 0.26
No. countries 2.73 0.37
No. authors 2.58 0.39
J. citer internationality 2.36 0.42
J. auth. internationality 1.74 0.57
Ref. citer internationality 1.74 0.57
JIF 1.69 0.59
Ref. auth.
internationality 1.54 0.65
No. pages 1.29 0.77
Ref. impact 1.28 0.78
No. refs 1.26 0.79
Author impact 1.21 0.83
Funding 1.19 0.84
Abs. length 1.14 0.88
Title Length 1.1 0.91
Field size 1.07 0.94
Country impact 1.06 0.94
Institution impact 1.06 0.94
Abs. readability 1.05 0.95
Mean VIF 1.63

210
APPENDIX C: HURDLE MODELS RESULTS IN
THE 22 SUBJECT CATEGORIES
Table C.1. The results of hurdle model in Agricultural Sciences
Logit model Coef. Exp (Coef.) Std. Err. z P>z [95% Conf. Interval]
Field size 0.000 1.000 0.000 -1.040 0.300 0.000 0.000
No. authors 0.108 1.114 0.011 10.040 0.000 0.087 0.129
No. institutions -0.168 0.845 0.045 -3.760 0.000 -0.256 -0.080
No. countries 0.065 1.067 0.086 0.760 0.448 -0.103 0.233
JIF 1.005 2.732 0.031 32.860 0.000 0.945 1.065
Ref. impact 0.015 1.015 0.002 7.130 0.000 0.011 0.019
Author impact 0.025 1.026 0.005 5.330 0.000 0.016 0.035
Institution impact 0.306 1.358 0.048 6.420 0.000 0.212 0.399
Country impact 0.167 1.182 0.006 27.460 0.000 0.155 0.179
J. auth. internationality -4.644 0.009 0.397 -11.670 0.000 -5.424 -3.864
J. citer internationality 6.143 465.296 0.151 40.710 0.000 5.847 6.438
Ref. auth. internationality -1.131 0.323 0.574 -1.970 0.049 -2.255 -0.006
Ref. citer internationality 0.098 1.103 1.043 0.090 0.925 -1.946 2.142
No. refs 0.006 1.006 0.003 1.990 0.047 0.000 0.012
No. pages 0.078 1.081 0.013 6.100 0.000 0.053 0.103
Title Length -0.021 0.980 0.008 -2.660 0.008 -0.036 -0.005
Abs. length -0.001 0.999 0.001 -1.310 0.189 -0.002 0.000
Abs. readability 0.004 1.004 0.003 1.330 0.183 -0.002 0.010
Constant -1.714 0.180 0.619 -2.770 0.006 -2.927 -0.501
NB model Coef. Exp (Coef.) Std. Err. z P>z [95% Conf. Interval]
Field size 0.020 1.017 0.000 5.730 0.000 0.000 0.000
No. authors 0.019 1.020 0.007 2.890 0.004 0.006 0.033
No. institutions -0.054 0.947 0.014 -3.790 0.000 -0.082 -0.026
No. countries 0.057 1.059 0.024 2.380 0.017 0.010 0.104
JIF 0.385 1.470 0.017 22.780 0.000 0.352 0.419
Ref. impact 0.010 1.010 0.000 22.850 0.000 0.009 0.011
Author impact 0.019 1.019 0.001 15.650 0.000 0.017 0.021
Institution impact 0.038 1.039 0.005 7.060 0.000 0.027 0.049
Country impact 0.206 1.229 0.005 43.840 0.000 0.197 0.215
J. auth. internationality -3.509 0.029 0.143 -24.500 0.000 -3.790 -3.228
J. citer internationality 5.574 263.585 0.121 46.220 0.000 5.338 5.811
Ref. auth. internationality 0.486 1.625 0.223 3.080 0.002 0.249 1.123
Ref. citer internationality -2.706 0.067 0.407 -6.640 0.000 -3.504 -1.907
No. refs 0.007 1.007 0.001 8.460 0.000 0.005 0.008
No. pages 0.022 1.023 0.004 6.020 0.000 0.015 0.030
Title Length -0.012 0.988 0.002 -5.390 0.000 -0.017 -0.008 Abs. length 0.000 1.000 0.000 0.950 0.341 0.000 0.001 Abs. readability -0.002 0.998 0.001 -1.890 0.059 -0.003 0.000
Constant -1.261 0.283 0.231 -5.450 0.000 -1.714 -0.808
Alpha -0.174 0.840 0.025 -7.010 0.000 -0.223 -0.126
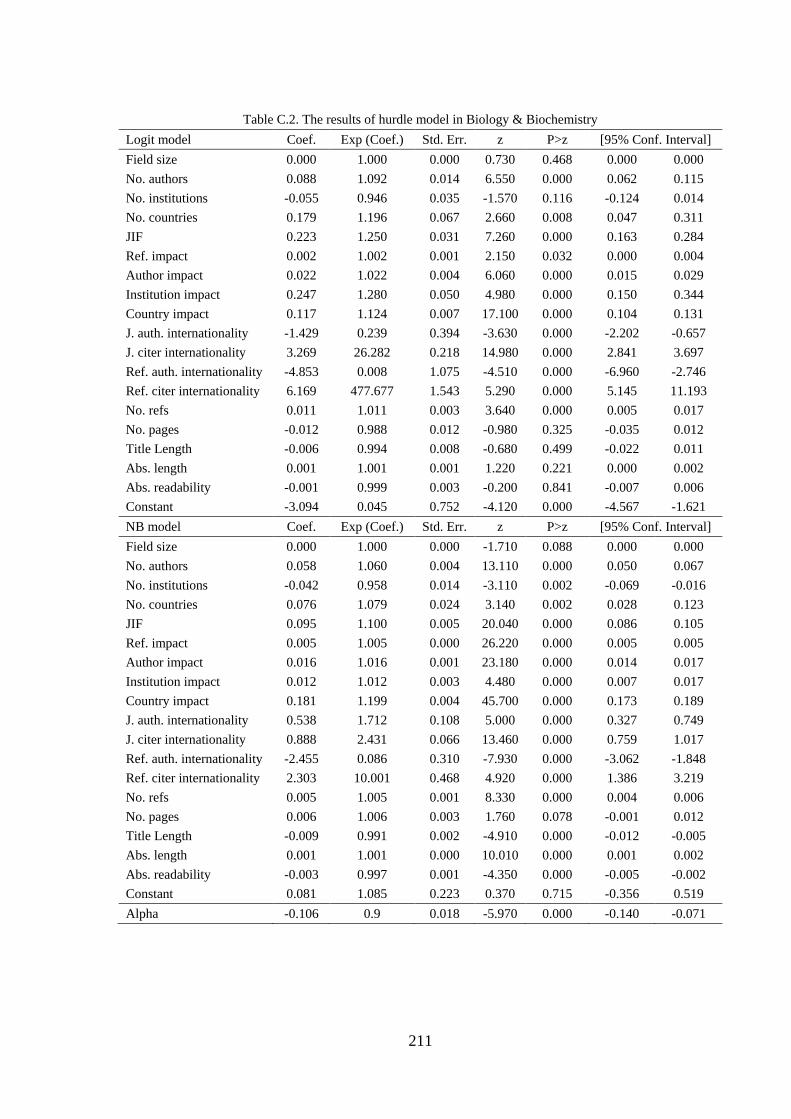
211
Table C.2. The results of hurdle model in Biology & Biochemistry
Logit model Coef. Exp (Coef.) Std. Err. z P>z [95% Conf. Interval]
Field size 0.000 1.000 0.000 0.730 0.468 0.000 0.000
No. authors 0.088 1.092 0.014 6.550 0.000 0.062 0.115
No. institutions -0.055 0.946 0.035 -1.570 0.116 -0.124 0.014
No. countries 0.179 1.196 0.067 2.660 0.008 0.047 0.311
JIF 0.223 1.250 0.031 7.260 0.000 0.163 0.284
Ref. impact 0.002 1.002 0.001 2.150 0.032 0.000 0.004
Author impact 0.022 1.022 0.004 6.060 0.000 0.015 0.029
Institution impact 0.247 1.280 0.050 4.980 0.000 0.150 0.344
Country impact 0.117 1.124 0.007 17.100 0.000 0.104 0.131
J. auth. internationality -1.429 0.239 0.394 -3.630 0.000 -2.202 -0.657
J. citer internationality 3.269 26.282 0.218 14.980 0.000 2.841 3.697
Ref. auth. internationality -4.853 0.008 1.075 -4.510 0.000 -6.960 -2.746
Ref. citer internationality 6.169 477.677 1.543 5.290 0.000 5.145 11.193
No. refs 0.011 1.011 0.003 3.640 0.000 0.005 0.017
No. pages -0.012 0.988 0.012 -0.980 0.325 -0.035 0.012
Title Length -0.006 0.994 0.008 -0.680 0.499 -0.022 0.011
Abs. length 0.001 1.001 0.001 1.220 0.221 0.000 0.002
Abs. readability -0.001 0.999 0.003 -0.200 0.841 -0.007 0.006
Constant -3.094 0.045 0.752 -4.120 0.000 -4.567 -1.621
NB model Coef. Exp (Coef.) Std. Err. z P>z [95% Conf. Interval]
Field size 0.000 1.000 0.000 -1.710 0.088 0.000 0.000
No. authors 0.058 1.060 0.004 13.110 0.000 0.050 0.067
No. institutions -0.042 0.958 0.014 -3.110 0.002 -0.069 -0.016
No. countries 0.076 1.079 0.024 3.140 0.002 0.028 0.123
JIF 0.095 1.100 0.005 20.040 0.000 0.086 0.105
Ref. impact 0.005 1.005 0.000 26.220 0.000 0.005 0.005
Author impact 0.016 1.016 0.001 23.180 0.000 0.014 0.017
Institution impact 0.012 1.012 0.003 4.480 0.000 0.007 0.017
Country impact 0.181 1.199 0.004 45.700 0.000 0.173 0.189
J. auth. internationality 0.538 1.712 0.108 5.000 0.000 0.327 0.749
J. citer internationality 0.888 2.431 0.066 13.460 0.000 0.759 1.017
Ref. auth. internationality -2.455 0.086 0.310 -7.930 0.000 -3.062 -1.848
Ref. citer internationality 2.303 10.001 0.468 4.920 0.000 1.386 3.219
No. refs 0.005 1.005 0.001 8.330 0.000 0.004 0.006
No. pages 0.006 1.006 0.003 1.760 0.078 -0.001 0.012
Title Length -0.009 0.991 0.002 -4.910 0.000 -0.012 -0.005
Abs. length 0.001 1.001 0.000 10.010 0.000 0.001 0.002
Abs. readability -0.003 0.997 0.001 -4.350 0.000 -0.005 -0.002
Constant 0.081 1.085 0.223 0.370 0.715 -0.356 0.519
Alpha -0.106 0.9 0.018 -5.970 0.000 -0.140 -0.071

212
Table C.3. The results of hurdle model in Chemistry
Logit model Coef. Exp (Coef.) Std. Err. z P>z [95% Conf. Interval]
Field size 0.000 1.000 0.000 -1.840 0.065 0.000 0.000
No. authors 0.114 1.121 0.013 8.700 0.000 0.088 0.139
No. institutions -0.134 0.874 0.035 -3.890 0.000 -0.202 -0.067
No. countries 0.479 1.614 0.066 7.210 0.000 0.349 0.609
JIF 0.356 1.428 0.035 10.130 0.000 0.287 0.425
Ref. impact 0.000 1.000 0.000 1.120 0.261 0.000 0.000
Author impact 0.035 1.036 0.004 9.270 0.000 0.028 0.043
Institution impact 0.237 1.267 0.047 4.990 0.000 0.144 0.329
Country impact 0.107 1.113 0.006 18.600 0.000 0.096 0.119
J. auth. internationality -2.553 0.077 0.382 -6.670 0.000 -3.304 -1.803
J. citer internationality 3.413 30.369 0.262 13.010 0.000 2.899 3.928
Ref. auth. internationality -4.890 0.008 0.782 -6.250 0.000 -6.423 -3.356
Ref. citer internationality 3.630 37.713 1.149 5.900 0.000 4.527 9.031
No. refs 0.006 1.006 0.003 2.110 0.035 0.000 0.011
No. pages 0.011 1.012 0.012 0.990 0.321 -0.011 0.034
Title Length 0.013 1.013 0.007 1.770 0.077 -0.001 0.027
Abs. length 0.000 1.000 0.001 0.300 0.767 -0.001 0.001
Abs. readability 0.001 1.001 0.003 0.580 0.563 -0.003 0.006
Constant -2.185 0.112 0.626 -3.490 0.000 -3.412 -0.959
NB model Coef. Exp (Coef.) Std. Err. z P>z [95% Conf. Interval]
Field size -0.005 0.994 0.000 -4.670 0.000 0.000 0.000
No. authors 0.032 1.033 0.007 4.820 0.000 0.019 0.045
No. institutions -0.095 0.909 0.020 -4.750 0.000 -0.134 -0.056
No. countries 0.117 1.124 0.034 3.480 0.000 0.051 0.183
JIF 0.148 1.159 0.009 16.610 0.000 0.130 0.165
Ref. impact 0.0002 1.0002 0.000 2.650 0.008 0.000 0.000
Author impact 0.023 1.023 0.001 26.230 0.000 0.021 0.025
Institution impact 0.028 1.029 0.006 4.950 0.000 0.017 0.040
Country impact 0.156 1.169 0.005 34.070 0.000 0.147 0.165
J. auth. internationality -2.068 0.126 0.160 -12.92 0.000 -2.382 -1.754
J. citer internationality 2.671 14.458 0.118 22.680 0.000 2.440 2.902
Ref. auth. internationality -2.572 0.076 0.329 -7.810 0.000 -3.218 -1.927
Ref. citer internationality 5.219 184.783 0.475 10.990 0.000 4.288 6.150
No. refs 0.004 1.004 0.001 5.250 0.000 0.002 0.005
No. pages 0.019 1.019 0.004 4.930 0.000 0.011 0.026
Title Length -0.006 0.994 0.002 -2.630 0.009 -0.010 -0.001
Abs. length 0.001 1.001 0.000 4.110 0.000 0.000 0.001
Abs. readability -0.002 0.998 0.001 -1.910 0.056 -0.003 0.000
Constant -1.601 0.202 0.239 -6.690 0.000 -2.071 -1.132
Alpha 0.097 1.102 0.023 4.210 0.000 0.052 0.143

213
Table C.4. The results of hurdle model in Clinical Medicine
Logit model Coef. Exp (Coef.) Std. Err. z P>z [95% Conf. Interval]
Field size 0.000 1.000 0.000 0.110 0.912 0.000 0.000
No. authors 0.123 1.131 0.010 12.900 0.000 0.104 0.142
No. institutions 0.070 1.072 0.023 3.060 0.002 0.025 0.115
No. countries 0.374 1.454 0.069 5.460 0.000 0.240 0.509
JIF 0.031 1.032 0.026 1.210 0.006 -0.019 0.082
Ref. impact 0.006 1.006 0.001 4.210 0.000 0.003 0.009
Author impact 0.007 1.007 0.003 2.000 0.046 0.000 0.014
Institution impact 0.169 1.184 0.032 5.210 0.000 0.105 0.232
Country impact 0.139 1.149 0.006 22.450 0.000 0.127 0.151
J. auth. internationality -4.197 0.015 0.504 -8.320 0.000 -5.185 -3.208
J. citer internationality 5.944 381.446 0.577 18.960 0.000 4.813 12.075
Ref. auth. internationality -3.658 0.026 1.201 -3.050 0.002 -6.012 -1.304
Ref. citer internationality 5.199 181.142 1.863 2.790 0.005 1.547 8.851
No. refs 0.009 1.009 0.004 2.660 0.008 0.002 0.016
No. pages 0.011 1.011 0.018 0.610 0.544 -0.024 0.045
Title Length 0.004 1.004 0.009 0.390 0.697 -0.015 0.022
Abs. length 0.002 1.002 0.001 3.660 0.000 0.001 0.004
Abs. readability 0.000 1.000 0.004 -0.110 0.916 -0.008 0.007
Constant -5.826 0.003 1.024 -5.690 0.000 -7.833 -3.820
NB model Coef. Exp (Coef.) Std. Err. z P>z [95% Conf. Interval]
Field size 0.000 1.000 0.000 -1.640 0.101 0.000 0.000
No. authors 0.066 1.068 0.005 13.470 0.000 0.057 0.076
No. institutions 0.072 1.075 0.010 7.050 0.000 0.052 0.092
No. countries 0.133 1.142 0.026 5.180 0.000 0.083 0.183
JIF 0.050 1.051 0.004 14.030 0.000 0.043 0.057
Ref. impact 0.004 1.004 0.000 18.760 0.000 0.004 0.005
Author impact 0.008 1.009 0.001 12.000 0.000 0.007 0.010
Institution impact 0.021 1.021 0.003 6.840 0.000 0.015 0.026
Country impact 0.209 1.233 0.005 40.980 0.000 0.199 0.219
J. auth. internationality -1.420 0.241 0.142 -10 0.000 -1.699 -1.142
J. citer internationality 6.351 573.298 0.181 35.150 0.000 5.997 6.706
Ref. auth. internationality -1.803 0.165 0.323 -5.590 0.000 -2.436 -1.170
Ref. citer internationality 1.620 5.053 0.548 2.960 0.003 0.547 2.694
No. refs 0.002 1.002 0.001 2.180 0.030 0.000 0.003
No. pages 0.021 1.021 0.005 4.550 0.000 0.012 0.030
Title Length -0.004 0.996 0.002 -1.840 0.065 -0.008 0.000
Abs. length 0.002 1.002 0.000 10.490 0.000 0.001 0.002
Abs. readability -0.002 0.998 0.001 -2.140 0.032 -0.004 0.000
Constant -2.598 0.074 0.307 -8.450 0.000 -3.200 -1.995
Alpha -0.069 0.933 0.021 -3.290 0.001 -0.111 -0.028

214
Table C.5. The results of hurdle model in Computer Science
Logit model Coef. Exp (Coef.) Std. Err. z P>z [95% Conf. Interval]
Field size -0.018 0.981 0.000 -3.180 0.001 0.000 0.000
No. authors 0.088 1.092 0.030 2.970 0.003 0.030 0.147
No. institutions -0.116 0.891 0.054 -2.160 0.030 -0.221 -0.011
No. countries -0.069 0.933 0.085 -0.810 0.420 -0.236 0.099
JIF 0.479 1.614 0.023 20.560 0.000 0.433 0.525
Ref. impact 0.006 1.006 0.001 6.690 0.000 0.004 0.008
Author impact 0.026 1.026 0.006 4.090 0.000 0.014 0.038
Institution impact 0.356 1.428 0.090 3.940 0.000 0.179 0.534
Country impact 0.151 1.163 0.006 24.390 0.000 0.139 0.164
J. auth. internationality -6.725 0.001 0.508 -13.240 0.000 -7.721 -5.729
J. citer internationality 5.572 262.950 0.401 21.380 0.000 5.786 9.358
Ref. auth. internationality 0.236 1.266 0.660 0.360 0.721 -1.057 1.529
Ref. citer internationality 0.765 2.149 0.852 0.900 0.370 -0.906 2.436
No. refs 0.004 1.004 0.003 1.210 0.228 -0.002 0.010
No. pages 0.028 1.028 0.006 4.740 0.000 0.016 0.040
Title Length -0.019 0.981 0.011 -1.740 0.082 -0.040 0.002
Abs. length 0.000 1.000 0.001 0.640 0.524 -0.001 0.002
Abs. readability -0.001 0.999 0.003 -0.410 0.680 -0.007 0.004
Constant -1.061 0.346 0.500 -2.120 0.034 -2.041 -0.080
NB model Coef. Exp (Coef.) Std. Err. z P>z [95% Conf. Interval]
Field size 0.006 1.006 0.000 2.090 0.037 0.000 0.000
No. authors 0.050 1.052 0.015 3.420 0.001 0.022 0.079
No. institutions -0.061 0.941 0.031 -1.970 0.049 -0.122 0.000
No. countries 0.012 1.012 0.047 0.260 0.797 -0.080 0.104
JIF 0.420 1.522 0.023 18.530 0.000 0.376 0.465
Ref. impact 0.002 1.002 0.000 9.190 0.000 0.002 0.003
Author impact 0.034 1.034 0.003 11.550 0.000 0.028 0.039
Institution impact 0.062 1.064 0.023 2.700 0.007 0.017 0.107
Country impact 0.303 1.353 0.009 33.090 0.000 0.285 0.321
J. auth. internationality -3.611 0.027 0.296 -12.19 0.000 -4.191 -3.030
J. citer internationality 5.254 191.273 0.279 28.260 0.000 7.334 8.428
Ref. auth. internationality 0.312 1.366 0.348 0.900 0.370 -0.370 0.993
Ref. citer internationality -0.796 0.451 0.498 -1.600 0.110 -1.773 0.181
No. refs 0.008 1.008 0.002 5.590 0.000 0.005 0.011
No. pages 0.026 1.026 0.003 8.020 0.000 0.019 0.032
Title Length -0.051 0.950 0.006 -8.630 0.000 -0.063 -0.040
Abs. length -0.001 0.999 0.000 -2.250 0.024 -0.001 0.000
Abs. readability -0.005 0.995 0.002 -2.930 0.003 -0.008 -0.002
Constant -1.310 0.270 0.294 -4.450 0.000 -1.886 -0.733
Alpha 0.830 2.293 0.049 17.100 0.000 0.735 0.925

215
Table C.6. The results of hurdle model in Economics & Business
Logit model Coef. Exp (Coef.) Std. Err. z P>z [95% Conf. Interval]
Field size -0.032 0.967 0.000 -2.410 0.016 0.000 0.000
No. authors 0.239 1.270 0.023 10.520 0.000 0.195 0.284
No. institutions -0.030 0.971 0.071 -0.410 0.679 -0.169 0.110
No. countries -0.018 0.982 0.096 -0.190 0.851 -0.205 0.169
JIF 1.108 3.028 0.037 30.080 0.000 1.036 1.180
Ref. impact 0.007 1.007 0.001 5.240 0.000 0.004 0.010
Author impact 0.066 1.068 0.010 6.590 0.000 0.046 0.085
Institution impact 0.308 1.360 0.087 3.530 0.000 0.137 0.479
Country impact 0.222 1.249 0.007 31.520 0.000 0.209 0.236
J. auth. internationality -4.524 0.010 0.550 -8.220 0.000 -5.603 -3.445
J. citer internationality 5.321 204.588 0.450 21.960 0.000 4.996 10.759
Ref. auth. internationality -1.769 0.170 0.690 -2.560 0.010 -3.121 -0.417
Ref. citer internationality 0.645 1.905 1.032 0.620 0.532 -1.379 2.668
No. refs 0.005 1.005 0.003 2.030 0.042 0.000 0.010
No. pages 0.025 1.025 0.006 4.290 0.000 0.013 0.036
Title Length 0.009 1.009 0.012 0.760 0.450 -0.014 0.032
Abs. length 0.002 1.002 0.001 1.840 0.066 0.000 0.003
Abs. readability 0.003 1.003 0.003 0.900 0.368 -0.004 0.010
Constant -2.083 0.125 0.664 -3.140 0.002 -3.383 -0.782
NB model Coef. Exp (Coef.) Std. Err. z P>z [95% Conf. Interval]
Field size -0.011 0.988 0.000 -2.490 0.013 0.000 0.000
No. authors 0.151 1.163 0.022 6.920 0.000 0.108 0.194
No. institutions -0.033 0.968 0.021 -1.530 0.126 -0.074 0.009
No. countries 0.004 1.004 0.030 0.140 0.886 -0.055 0.064
JIF 0.749 2.116 0.025 30.470 0.000 0.701 0.798
Ref. impact 0.005 1.005 0.000 17.140 0.000 0.005 0.006
Author impact 0.050 1.051 0.003 18.400 0.000 0.044 0.055
Institution impact 0.029 1.030 0.011 2.630 0.009 0.007 0.051
Country impact 0.278 1.321 0.007 38.080 0.000 0.264 0.293
J. auth. internationality -1.870 0.154 0.200 -9.320 0.000 -2.263 -1.476
J. citer internationality 3.236 25.432 0.214 34.680 0.000 3.009 3.848
Ref. auth. internationality -1.006 0.366 0.224 -4.490 0.000 -1.445 -0.567
Ref. citer internationality -0.690 0.502 0.410 -1.680 0.092 -1.493 0.113
No. refs 0.006 1.006 0.001 8.160 0.000 0.005 0.008
No. pages 0.015 1.015 0.002 8.220 0.000 0.011 0.018
Title Length -0.008 0.992 0.004 -2.060 0.039 -0.016 0.000
Abs. length 0.000 1.000 0.000 1.890 0.058 0.000 0.001
Abs. readability 0.001 1.001 0.001 1.250 0.211 -0.001 0.004
Constant -1.805 0.164 0.260 -6.950 0.000 -2.315 -1.296
Alpha -0.033 0.968 0.032 -1.020 0.006 -0.095 0.030
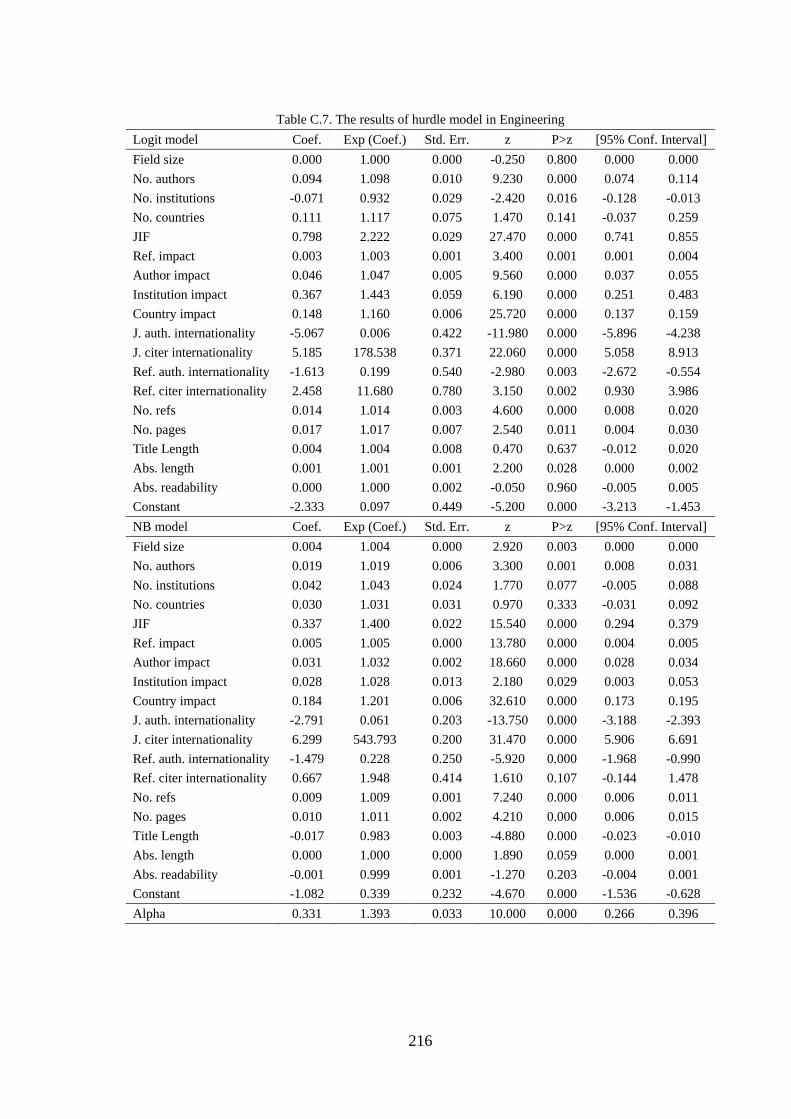
216
Table C.7. The results of hurdle model in Engineering
Logit model Coef. Exp (Coef.) Std. Err. z P>z [95% Conf. Interval]
Field size 0.000 1.000 0.000 -0.250 0.800 0.000 0.000
No. authors 0.094 1.098 0.010 9.230 0.000 0.074 0.114
No. institutions -0.071 0.932 0.029 -2.420 0.016 -0.128 -0.013
No. countries 0.111 1.117 0.075 1.470 0.141 -0.037 0.259
JIF 0.798 2.222 0.029 27.470 0.000 0.741 0.855
Ref. impact 0.003 1.003 0.001 3.400 0.001 0.001 0.004
Author impact 0.046 1.047 0.005 9.560 0.000 0.037 0.055
Institution impact 0.367 1.443 0.059 6.190 0.000 0.251 0.483
Country impact 0.148 1.160 0.006 25.720 0.000 0.137 0.159
J. auth. internationality -5.067 0.006 0.422 -11.980 0.000 -5.896 -4.238
J. citer internationality 5.185 178.538 0.371 22.060 0.000 5.058 8.913
Ref. auth. internationality -1.613 0.199 0.540 -2.980 0.003 -2.672 -0.554
Ref. citer internationality 2.458 11.680 0.780 3.150 0.002 0.930 3.986
No. refs 0.014 1.014 0.003 4.600 0.000 0.008 0.020
No. pages 0.017 1.017 0.007 2.540 0.011 0.004 0.030
Title Length 0.004 1.004 0.008 0.470 0.637 -0.012 0.020
Abs. length 0.001 1.001 0.001 2.200 0.028 0.000 0.002
Abs. readability 0.000 1.000 0.002 -0.050 0.960 -0.005 0.005
Constant -2.333 0.097 0.449 -5.200 0.000 -3.213 -1.453
NB model Coef. Exp (Coef.) Std. Err. z P>z [95% Conf. Interval]
Field size 0.004 1.004 0.000 2.920 0.003 0.000 0.000
No. authors 0.019 1.019 0.006 3.300 0.001 0.008 0.031
No. institutions 0.042 1.043 0.024 1.770 0.077 -0.005 0.088
No. countries 0.030 1.031 0.031 0.970 0.333 -0.031 0.092
JIF 0.337 1.400 0.022 15.540 0.000 0.294 0.379
Ref. impact 0.005 1.005 0.000 13.780 0.000 0.004 0.005
Author impact 0.031 1.032 0.002 18.660 0.000 0.028 0.034
Institution impact 0.028 1.028 0.013 2.180 0.029 0.003 0.053
Country impact 0.184 1.201 0.006 32.610 0.000 0.173 0.195
J. auth. internationality -2.791 0.061 0.203 -13.750 0.000 -3.188 -2.393
J. citer internationality 6.299 543.793 0.200 31.470 0.000 5.906 6.691
Ref. auth. internationality -1.479 0.228 0.250 -5.920 0.000 -1.968 -0.990
Ref. citer internationality 0.667 1.948 0.414 1.610 0.107 -0.144 1.478
No. refs 0.009 1.009 0.001 7.240 0.000 0.006 0.011
No. pages 0.010 1.011 0.002 4.210 0.000 0.006 0.015
Title Length -0.017 0.983 0.003 -4.880 0.000 -0.023 -0.010
Abs. length 0.000 1.000 0.000 1.890 0.059 0.000 0.001
Abs. readability -0.001 0.999 0.001 -1.270 0.203 -0.004 0.001
Constant -1.082 0.339 0.232 -4.670 0.000 -1.536 -0.628
Alpha 0.331 1.393 0.033 10.000 0.000 0.266 0.396

217
Table C.8. The results of hurdle model in Environment/Ecology
Logit model Coef. Exp (Coef.) Std. Err. z P>z [95% Conf. Interval]
Field size 0.000 1.000 0.000 0.000 0.998 0.000 0.000
No. authors 0.085 1.089 0.013 6.760 0.000 0.061 0.110
No. institutions -0.133 0.875 0.046 -2.900 0.004 -0.224 -0.043
No. countries 0.215 1.240 0.044 4.890 0.000 0.129 0.301
JIF 0.590 1.803 0.026 22.380 0.000 0.538 0.641
Ref. impact 0.009 1.009 0.002 5.000 0.000 0.005 0.012
Author impact 0.019 1.019 0.004 4.350 0.000 0.011 0.028
Institution impact 0.222 1.249 0.041 5.490 0.000 0.143 0.302
Country impact 0.173 1.189 0.007 24.980 0.000 0.160 0.187
J. auth. internationality -6.816 0.001 0.506 -13.46 0.000 -7.809 -5.824
J. citer internationality 3.444 31.312 0.509 24.450 0.000 3.453 5.449
Ref. auth. internationality 1.178 3.274 0.732 -0.300 0.761 -1.658 1.211
Ref. citer internationality -0.834 0.434 1.284 -0.650 0.516 -3.351 1.683
No. refs 0.010 1.010 0.003 3.530 0.000 0.004 0.015
No. pages 0.034 1.034 0.011 3.080 0.002 0.012 0.055
Title Length -0.017 0.983 0.009 -1.920 0.055 -0.034 0.000
Abs. length 0.001 1.001 0.001 1.510 0.130 0.000 0.002
Abs. readability 0.003 1.003 0.003 0.910 0.361 -0.003 0.009
Constant -2.452 0.086 0.763 -3.220 0.001 -3.947 -0.958
NB model Coef. Exp (Coef.) Std. Err. z P>z [95% Conf. Interval]
Field size 0.000 1.000 0.000 1.200 0.232 0.000 0.000
No. authors 0.020 1.020 0.005 3.780 0.000 0.010 0.030
No. institutions -0.041 0.959 0.012 -3.470 0.001 -0.065 -0.018
No. countries 0.127 1.135 0.019 6.660 0.000 0.090 0.164
JIF 0.264 1.302 0.010 26.350 0.000 0.244 0.284
Ref. impact 0.006 1.006 0.000 18.750 0.000 0.006 0.007
Author impact 0.019 1.020 0.001 20.750 0.000 0.018 0.021
Institution impact 0.014 1.014 0.003 4.150 0.000 0.007 0.021
Country impact 0.210 1.233 0.004 50.320 0.000 0.202 0.218
J. auth. internationality -4.527 0.010 0.154 -29.23 0.000 -4.830 -4.223
J. citer internationality 3.278 26.523 0.197 52.160 0.000 2.892 3.665
Ref. auth. internationality 0.319 1.376 0.202 1.580 0.114 -0.077 0.715
Ref. citer internationality -1.881 0.152 0.378 -4.970 0.000 -2.623 -1.139
No. refs 0.004 1.004 0.001 6.120 0.000 0.003 0.005
No. pages 0.009 1.009 0.003 3.700 0.000 0.004 0.014
Title Length -0.013 0.987 0.002 -5.720 0.000 -0.017 -0.008
Abs. length 0.0004 1.0004 0.0002 2.010 0.045 0.000 0.001
Abs. readability 0.000 1.000 0.001 -0.070 0.948 -0.002 0.002
Constant -1.886 0.152 0.223 -8.460 0.000 -2.323 -1.449
Alpha -0.232 0.793 0.021 -11.290 0.000 -0.273 -0.192

218
Table C.9. The results of hurdle model in Geosciences
Logit model Coef. Exp (Coef.) Std. Err. z P>z [95% Conf. Interval]
Field size 0.000 1.000 0.000 0.250 0.800 0.000 0.000
No. authors 0.055 1.057 0.015 3.790 0.000 0.027 0.084
No. institutions 0.112 1.119 0.031 3.610 0.000 0.051 0.173
No. countries 0.197 1.218 0.049 4.060 0.000 0.102 0.292
JIF 0.740 2.096 0.025 29.130 0.000 0.690 0.790
Ref. impact 0.012 1.012 0.002 5.930 0.000 0.008 0.015
Author impact 0.042 1.043 0.005 7.770 0.000 0.031 0.052
Institution impact 0.215 1.240 0.041 5.220 0.000 0.134 0.296
Country impact 0.142 1.153 0.006 24.350 0.000 0.131 0.153
J. auth. internationality -2.143 0.117 0.413 -5.180 0.000 -2.954 -1.332
J. citer internationality 4.857 128.679 0.285 17.050 0.000 4.299 5.416
Ref. auth. internationality -3.673 0.025 0.697 -5.270 0.000 -5.038 -2.307
Ref. citer internationality 3.650 38.481 1.049 3.480 0.001 1.594 5.706
No. refs -0.001 0.999 0.002 -0.320 0.748 -0.005 0.004
No. pages 0.055 1.057 0.008 6.780 0.000 0.039 0.071
Title Length -0.017 0.984 0.008 -2.040 0.041 -0.032 -0.001
Abs. length -0.001 0.999 0.000 -2.000 0.046 -0.002 0.000
Abs. readability 0.009 1.009 0.003 2.580 0.010 0.002 0.015
Constant -1.751 0.174 0.570 -3.070 0.002 -2.867 -0.634
NB model Coef. Exp (Coef.) Std. Err. z P>z [95% Conf. Interval]
Field size 0.006 1.006 0.000 3.040 0.002 0.000 0.000
No. authors 0.043 1.044 0.007 5.800 0.000 0.029 0.058
No. institutions -0.002 0.998 0.016 -0.100 0.922 -0.032 0.029
No. countries 0.047 1.048 0.023 2.070 0.039 0.002 0.092
JIF 0.364 1.439 0.014 25.900 0.000 0.336 0.392
Ref. impact 0.006 1.006 0.000 14.230 0.000 0.006 0.007
Author impact 0.033 1.034 0.001 23.250 0.000 0.030 0.036
Institution impact 0.026 1.026 0.005 5.310 0.000 0.016 0.035
Country impact 0.218 1.244 0.005 44.460 0.000 0.208 0.228
J. auth. internationality -0.545 0.579 0.145 -3.75 0.000 -0.831 -0.260
J. citer internationality 2.227 9.273 0.095 23.380 0.000 2.040 2.414
Ref. auth. internationality -2.186 0.112 0.249 -8.770 0.000 -2.674 -1.697
Ref. citer internationality 3.320 27.660 0.403 9.660 0.000 3.102 4.681
No. refs 0.002 1.002 0.001 3.630 0.000 0.001 0.004
No. pages 0.021 1.021 0.002 9.110 0.000 0.016 0.025
Title Length -0.023 0.977 0.003 -9.190 0.000 -0.028 -0.018
Abs. length 0.0003 1.0003 0.0001 2.350 0.019 0.000 0.001
Abs. readability 0.001 1.001 0.001 0.770 0.444 -0.001 0.003
Constant -1.834 0.160 0.215 -8.510 0.000 -2.256 -1.412
Alpha 0.088 1.092 0.025 3.490 0.000 0.039 0.137

219
Table C.10. The results of hurdle model in Immunology
Logit model Coef. Exp (Coef.) Std. Err. z P>z [95% Conf. Interval]
Field size -0.015 0.984 0.000 -2.360 0.018 0.000 0.000
No. authors 0.067 1.070 0.015 4.540 0.000 0.038 0.097
No. institutions 0.003 1.003 0.035 0.100 0.924 -0.065 0.071
No. countries 0.234 1.264 0.078 3.000 0.003 0.081 0.388
JIF 0.123 1.130 0.022 1.320 0.006 0.121 0.134
Ref. impact 0.009 1.009 0.002 5.500 0.000 0.006 0.012
Author impact 0.008 1.008 0.003 2.350 0.019 0.001 0.015
Institution impact 0.235 1.265 0.056 4.220 0.000 0.126 0.344
Country impact 0.109 1.115 0.008 13.620 0.000 0.093 0.125
J. auth. internationality -6.343 0.001 0.759 -8.350 0.000 -7.831 -4.854
J. citer internationality 5.310 202.350 0.856 17.610 0.000 3.396 6.750
Ref. auth. internationality -6.522 0.001 2.112 -4.030 0.000 -12.662 -4.382
Ref. citer internationality 6.012 408.352 3.092 1.940 0.052 -0.049 12.073
No. refs 0.005 1.005 0.004 1.330 0.184 -0.002 0.013
No. pages 0.021 1.021 0.022 0.970 0.331 -0.021 0.063
Title Length -0.009 0.991 0.010 -0.900 0.370 -0.029 0.011
Abs. length 0.002 1.002 0.001 1.830 0.067 0.000 0.003
Abs. readability -0.007 0.993 0.004 -1.720 0.086 -0.016 0.001
Constant -3.892 0.020 1.491 -2.610 0.009 -6.814 -0.971
NB model Coef. Exp (Coef.) Std. Err. z P>z [95% Conf. Interval]
Field size -0.011 0.988 0.000 -8.110 0.000 0.000 0.000
No. authors 0.032 1.033 0.004 7.730 0.000 0.024 0.040
No. institutions -0.009 0.991 0.009 -0.960 0.337 -0.028 0.009
No. countries 0.051 1.053 0.019 2.660 0.008 0.014 0.089
JIF 0.036 1.036 0.003 14.030 0.000 0.031 0.041
Ref. impact 0.005 1.005 0.000 27.900 0.000 0.004 0.005
Author impact 0.008 1.008 0.000 16.710 0.000 0.007 0.009
Institution impact 0.007 1.007 0.002 4.590 0.000 0.004 0.010
Country impact 0.180 1.197 0.004 47.200 0.000 0.173 0.188
J. auth. internationality -3.443 0.031 0.151 -22.73 0.000 -3.740 -3.146
J. citer internationality 3.718 41.182 0.225 43.510 0.000 3.345 4.227
Ref. auth. internationality -0.028 0.973 0.365 -0.080 0.940 -0.742 0.687
Ref. citer internationality -2.823 0.059 0.587 -4.810 0.000 -3.974 -1.672
No. refs 0.004 1.004 0.001 6.220 0.000 0.003 0.005
No. pages 0.006 1.006 0.004 1.640 0.101 -0.001 0.014
Title Length -0.010 0.990 0.002 -6.000 0.000 -0.013 -0.007
Abs. length 0.001 1.001 0.000 6.550 0.000 0.001 0.001
Abs. readability -0.005 0.995 0.001 -6.420 0.000 -0.006 -0.003
Constant -1.107 0.330 0.296 -3.730 0.000 -1.688 -0.526
Alpha -0.336 0.715 0.017 -20.230 0.000 -0.369 -0.303

220
Table C.11. The results of hurdle model in Materials Science
Logit model Coef. Exp (Coef.) Std. Err. z P>z [95% Conf. Interval]
Field size 0.000 1.000 0.000 -1.190 0.236 0.000 0.000
No. authors 0.123 1.131 0.012 10.290 0.000 0.100 0.146
No. institutions -0.082 0.921 0.029 -2.800 0.005 -0.140 -0.025
No. countries 0.371 1.450 0.055 6.720 0.000 0.263 0.480
JIF 0.115 1.122 0.039 2.950 0.003 0.039 0.192
Ref. impact 0.0008 1.0008 0.0002 2.950 0.003 0.0002 0.001
Author impact 0.017 1.017 0.004 4.620 0.000 0.010 0.024
Institution impact 0.301 1.351 0.048 6.310 0.000 0.207 0.394
Country impact 0.167 1.182 0.006 27.490 0.000 0.155 0.179
J. auth. internationality -6.839 0.001 0.475 -14.380 0.000 -7.771 -5.907
J. citer internationality 2.654 14.211 0.304 35.380 0.000 2.152 3.343
Ref. auth. internationality -2.720 0.065 0.639 -4.260 0.000 -3.972 -1.467
Ref. citer internationality 1.721 5.595 0.933 1.850 0.065 -0.107 3.551
No. refs 0.010 1.010 0.003 3.160 0.002 0.004 0.016
No. pages 0.049 1.051 0.012 4.290 0.000 0.027 0.072
Title Length -0.016 0.985 0.008 -1.990 0.047 -0.031 0.000
Abs. length 0.001 1.001 0.001 0.900 0.368 -0.001 0.002
Abs. readability 0.000 1.000 0.003 -0.020 0.980 -0.005 0.005
Constant -1.314 0.269 0.521 -2.520 0.012 -2.335 -0.292
NB model Coef. Exp (Coef.) Std. Err. z P>z [95% Conf. Interval]
Field size -0.002 0.997 0.000 -2.880 0.004 0.000 0.000
No. authors 0.076 1.079 0.009 8.480 0.000 0.058 0.094
No. institutions -0.101 0.904 0.023 -4.980 0.000 -0.163 -0.071
No. countries 0.091 1.096 0.041 2.250 0.024 0.012 0.171
JIF 0.018 1.018 0.007 2.480 0.013 0.004 0.032
Ref. impact 0.009 1.009 0.0003 23.930 0.000 0.008 0.010
Author impact 0.018 1.019 0.001 16.160 0.000 0.016 0.021
Institution impact 0.031 1.032 0.008 3.660 0.000 0.014 0.048
Country impact 0.191 1.210 0.006 32.080 0.000 0.179 0.203
J. auth. internationality -6.312 0.001 0.223 -28.190 0.000 -6.750 -5.873
J. citer internationality 3.918 50.300 0.218 49.970 0.000 2.465 3.319
Ref. auth. internationality -0.798 0.450 0.280 -2.850 0.004 -1.347 -0.248
Ref. citer internationality 0.703 2.021 0.459 1.530 0.126 -0.197 1.605
No. refs 0.005 1.005 0.001 5.280 0.000 0.003 0.008
No. pages 0.033 1.034 0.004 7.700 0.000 0.025 0.042
Title Length -0.010 0.990 0.003 -3.470 0.001 -0.016 -0.004
Abs. length 0.001 1.001 0.000 3.970 0.000 0.000 0.001
Abs. readability 0.001 1.001 0.001 1.030 0.301 -0.001 0.003
Constant -2.102 0.122 0.252 -8.340 0.000 -2.596 -1.608
Alpha 0.157 1.170 0.028 5.640 0.000 0.102 0.211

221
Table C.12. The results of hurdle model in Mathematics
Logit model Coef. Exp (Coef.) Std. Err. z P>z [95% Conf. Interval]
Field size 0.000 1.000 0.000 0.340 0.736 0.000 0.000
No. authors 0.143 1.154 0.025 5.620 0.000 0.093 0.193
No. institutions 0.005 1.005 0.037 0.140 0.892 -0.067 0.077
No. countries 0.214 1.238 0.047 4.540 0.000 0.122 0.306
JIF 0.625 1.868 0.044 14.190 0.000 0.538 0.711
Ref. impact 0.000 1.000 0.000 -0.770 0.444 -0.001 0.001
Author impact 0.050 1.052 0.007 7.680 0.000 0.037 0.063
Institution impact 0.201 1.223 0.080 2.510 0.012 0.044 0.358
Country impact 0.161 1.175 0.006 29.000 0.000 0.150 0.172
J. auth. internationality -5.459 0.004 0.413 -13.210 0.001 -6.269 -4.649
J. citer internationality 3.702 40.528 0.343 21.920 0.000 2.856 5.202
Ref. auth. internationality -2.336 0.097 0.538 -4.340 0.000 -3.391 -1.281
Ref. citer internationality 5.113 166.115 0.670 7.630 0.000 3.800 6.425
No. refs 0.013 1.013 0.003 4.090 0.000 0.007 0.019
No. pages 0.018 1.018 0.003 5.240 0.000 0.011 0.024
Title Length -0.035 0.966 0.009 -4.010 0.000 -0.052 -0.018
Abs. length 0.000 1.000 0.001 0.130 0.897 -0.001 0.001
Abs. readability 0.003 1.003 0.002 1.800 0.072 0.000 0.006
Constant -2.859 0.057 0.425 -6.720 0.000 -3.693 -2.026
NB model Coef. Exp (Coef.) Std. Err. z P>z [95% Conf. Interval]
Field size 0.000 1.000 0.000 -1.070 0.283 0.000 0.000
No. authors 0.147 1.158 0.024 6.050 0.000 0.099 0.194
No. institutions 0.052 1.053 0.038 1.380 0.168 -0.022 0.125
No. countries 0.079 1.082 0.047 1.680 0.094 -0.013 0.171
JIF 0.846 2.329 0.043 19.630 0.000 0.761 0.930
Ref. impact 0.000 1.000 0.000 1.370 0.171 0.000 0.001
Author impact 0.064 1.066 0.003 20.050 0.000 0.058 0.070
Institution impact -0.034 0.967 0.029 -1.150 0.252 -0.091 0.024
Country impact 0.187 1.206 0.006 28.860 0.000 0.174 0.200
J. auth. internationality -3.092 0.045 0.234 -13.180 0.000 -3.552 -2.632
J. citer internationality 5.280 196.326 0.222 23.750 0.000 4.844 5.716
Ref. auth. internationality -1.497 0.224 0.311 -4.820 0.000 -2.106 -0.888
Ref. citer internationality 3.511 33.495 0.423 8.300 0.000 2.682 4.340
No. refs 0.005 1.005 0.001 3.380 0.001 0.002 0.008
No. pages 0.013 1.013 0.002 8.010 0.000 0.009 0.016
Title Length -0.024 0.977 0.005 -5.000 0.000 -0.033 -0.014
Abs. length 0.000 1.000 0.000 1.310 0.189 0.000 0.001
Abs. readability 0.000 1.000 0.001 -0.230 0.817 -0.002 0.002
Constant -2.454 0.086 0.260 -9.440 0.000 -2.964 -1.945
Alpha 0.292 1.339 0.044 6.610 0.000 0.205 0.378

222
Table C.13. The results of hurdle model in Microbiology
Logit model Coef. Exp (Coef.) Std. Err. z P>z [95% Conf. Interval]
Field size 0.000 1.000 0.000 0.110 0.911 0.000 0.000
No. authors 0.028 1.028 0.021 1.350 0.177 -0.013 0.068
No. institutions -0.193 0.825 0.048 -4.020 0.000 -0.287 -0.099
No. countries 0.061 1.063 0.089 0.690 0.493 -0.113 0.235
JIF 0.310 1.364 0.044 6.990 0.000 0.223 0.397
Ref. impact 0.000 1.000 0.000 -0.490 0.623 0.000 0.000
Author impact 0.030 1.030 0.004 6.750 0.000 0.021 0.039
Institution impact 0.265 1.304 0.053 4.970 0.000 0.161 0.370
Country impact 0.110 1.116 0.006 17.540 0.000 0.098 0.122
J. auth. internationality -1.084 0.338 0.503 -2.150 0.031 -2.070 -0.098
J. citer internationality 2.044 7.721 0.188 10.860 0.000 1.675 2.413
Ref. auth. internationality -7.248 0.001 1.206 -6.010 0.000 -9.611 -4.884
Ref. citer internationality 2.882 17.850 1.649 7.400 0.000 1.972 5.436
No. refs 0.000 1.000 0.004 0.020 0.984 -0.008 0.008
No. pages 0.066 1.068 0.022 2.950 0.003 0.022 0.110
Title Length 0.000 1.000 0.009 -0.040 0.972 -0.018 0.017
Abs. length 0.001 1.001 0.001 1.300 0.193 -0.001 0.003
Abs. readability -0.008 0.992 0.004 -2.270 0.023 -0.016 -0.001
Constant -4.593 0.010 0.834 -5.510 0.000 -6.227 -2.959
NB model Coef. Exp (Coef.) Std. Err. z P>z [95% Conf. Interval]
Field size 0.004 1.004 0.000 3.960 0.000 0.000 0.000
No. authors 0.020 1.020 0.004 5.250 0.000 0.012 0.027
No. institutions -0.035 0.965 0.011 -3.360 0.001 -0.056 -0.015
No. countries -0.014 0.986 0.019 -0.730 0.468 -0.050 0.023
JIF 0.120 1.128 0.011 11.440 0.000 0.100 0.141
Ref. impact 0.001 1.001 0.000 5.760 0.000 0.001 0.002
Author impact 0.018 1.018 0.001 23.500 0.000 0.017 0.020
Institution impact 0.017 1.017 0.003 6.290 0.000 0.012 0.022
Country impact 0.189 1.209 0.004 47.530 0.000 0.182 0.197
J. auth. internationality 0.310 1.363 0.152 2.040 0.041 0.012 0.607
J. citer internationality 0.413 1.512 0.054 7.690 0.000 0.308 0.519
Ref. auth. internationality -5.317 0.005 0.368 -14.450 0.000 -6.038 -4.596
Ref. citer internationality 4.961 142.736 0.561 14.200 0.000 4.865 9.064
No. refs 0.003 1.003 0.001 3.420 0.001 0.001 0.004
No. pages 0.006 1.006 0.004 1.440 0.150 -0.002 0.014
Title Length -0.010 0.990 0.002 -5.120 0.000 -0.013 -0.006
Abs. length 0.002 1.002 0.000 11.090 0.000 0.001 0.002
Abs. readability -0.006 0.994 0.001 -7.030 0.000 -0.008 -0.004
Constant -1.984 0.138 0.267 -7.420 0.000 -2.508 -1.459
Alpha -0.026 0.975 0.019 -1.330 0.003 -0.063 0.012

223
Table C.14. The results of hurdle model in Molecular Biology & Genetics
Logit model Coef. Exp (Coef.) Std. Err. z P>z [95% Conf. Interval]
Field size 0.000 1.000 0.000 -1.650 0.098 0.000 0.000
No. authors 0.080 1.083 0.014 5.790 0.000 0.053 0.107
No. institutions -0.054 0.948 0.035 -1.550 0.121 -0.122 0.014
No. countries 0.182 1.199 0.069 2.650 0.008 0.047 0.316
JIF 0.192 1.211 0.029 6.690 0.000 0.136 0.248
Ref. impact 0.007 1.007 0.001 5.180 0.000 0.004 0.010
Author impact 0.025 1.025 0.004 5.750 0.000 0.016 0.033
Institution impact 0.159 1.172 0.045 3.560 0.000 0.071 0.246
Country impact 0.170 1.185 0.007 22.670 0.000 0.155 0.184
J. auth. internationality -3.611 0.027 0.488 -7.390 0.000 -4.569 -2.653
J. citer internationality 6.002 404.441 0.446 13.450 0.000 5.127 6.877
Ref. auth. internationality -6.254 0.001 1.591 -3.930 0.000 -9.373 -3.134
Ref. citer internationality 6.991 1086.808 2.346 3.810 0.000 4.350 13.549
No. refs 0.004 1.004 0.003 1.050 0.295 -0.003 0.010
No. pages 0.002 1.002 0.017 0.120 0.908 -0.032 0.036
Title Length 0.001 1.001 0.010 0.070 0.946 -0.019 0.020
Abs. length 0.004 1.004 0.001 4.750 0.000 0.002 0.006
Abs. readability -0.007 0.993 0.004 -1.680 0.093 -0.015 0.001
Constant -4.482 0.011 1.179 -3.800 0.000 -6.792 -2.173
NB model Coef. Exp (Coef.) Std. Err. z P>z [95% Conf. Interval]
Field size 0.000 1.000 0.000 -1.300 0.195 0.000 0.000
No. authors 0.054 1.055 0.004 12.270 0.000 0.045 0.063
No. institutions -0.019 0.981 0.013 -1.530 0.125 -0.044 0.005
No. countries 0.092 1.097 0.023 4.010 0.000 0.047 0.137
JIF 0.064 1.066 0.002 30.410 0.000 0.060 0.068
Ref. impact 0.005 1.005 0.000 27.070 0.000 0.004 0.005
Author impact 0.011 1.011 0.001 18.800 0.000 0.010 0.012
Institution impact 0.011 1.011 0.002 6.200 0.000 0.007 0.014
Country impact 0.208 1.232 0.004 47.860 0.000 0.200 0.217
J. auth. internationality -0.514 0.597 0.120 -4.270 0.000 -0.750 -0.278
J. citer internationality 3.843 46.703 0.122 31.270 0.000 3.602 4.084
Ref. auth. internationality -5.426 0.004 0.386 -14.050 0.000 -6.183 -4.669
Ref. citer internationality 6.938 1031.064 0.612 11.330 0.000 5.737 8.139
No. refs 0.003 1.003 0.001 5.850 0.000 0.002 0.005
No. pages 0.007 1.007 0.003 2.290 0.022 0.001 0.013
Title Length -0.009 0.991 0.002 -4.770 0.000 -0.012 -0.005
Abs. length 0.001 1.001 0.000 4.090 0.000 0.000 0.001
Abs. readability -0.003 0.997 0.001 -3.380 0.001 -0.004 -0.001
Constant -3.010 0.049 0.306 -9.840 0.000 -3.610 -2.411
Alpha -0.205 0.815 0.017 -12.300 0.000 -0.237 -0.172
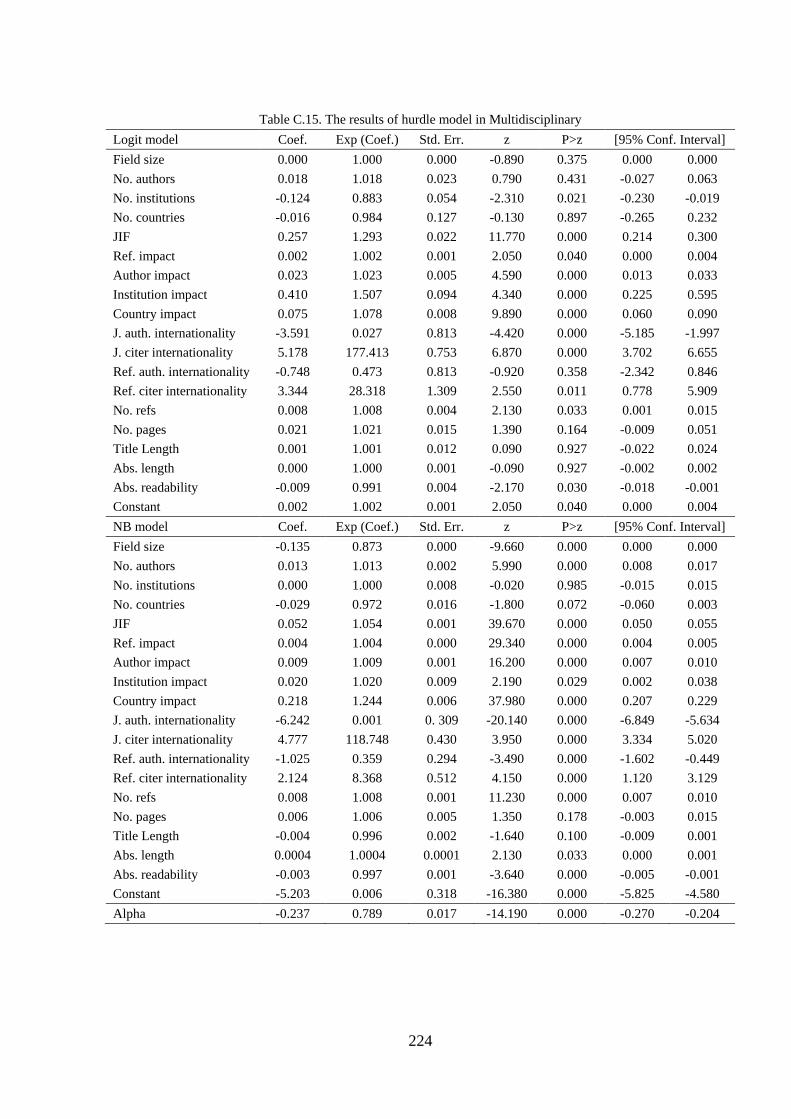
224
Table C.15. The results of hurdle model in Multidisciplinary
Logit model Coef. Exp (Coef.) Std. Err. z P>z [95% Conf. Interval]
Field size 0.000 1.000 0.000 -0.890 0.375 0.000 0.000
No. authors 0.018 1.018 0.023 0.790 0.431 -0.027 0.063
No. institutions -0.124 0.883 0.054 -2.310 0.021 -0.230 -0.019
No. countries -0.016 0.984 0.127 -0.130 0.897 -0.265 0.232
JIF 0.257 1.293 0.022 11.770 0.000 0.214 0.300
Ref. impact 0.002 1.002 0.001 2.050 0.040 0.000 0.004
Author impact 0.023 1.023 0.005 4.590 0.000 0.013 0.033
Institution impact 0.410 1.507 0.094 4.340 0.000 0.225 0.595
Country impact 0.075 1.078 0.008 9.890 0.000 0.060 0.090
J. auth. internationality -3.591 0.027 0.813 -4.420 0.000 -5.185 -1.997
J. citer internationality 5.178 177.413 0.753 6.870 0.000 3.702 6.655
Ref. auth. internationality -0.748 0.473 0.813 -0.920 0.358 -2.342 0.846
Ref. citer internationality 3.344 28.318 1.309 2.550 0.011 0.778 5.909
No. refs 0.008 1.008 0.004 2.130 0.033 0.001 0.015
No. pages 0.021 1.021 0.015 1.390 0.164 -0.009 0.051
Title Length 0.001 1.001 0.012 0.090 0.927 -0.022 0.024
Abs. length 0.000 1.000 0.001 -0.090 0.927 -0.002 0.002
Abs. readability -0.009 0.991 0.004 -2.170 0.030 -0.018 -0.001
Constant 0.002 1.002 0.001 2.050 0.040 0.000 0.004
NB model Coef. Exp (Coef.) Std. Err. z P>z [95% Conf. Interval]
Field size -0.135 0.873 0.000 -9.660 0.000 0.000 0.000
No. authors 0.013 1.013 0.002 5.990 0.000 0.008 0.017
No. institutions 0.000 1.000 0.008 -0.020 0.985 -0.015 0.015
No. countries -0.029 0.972 0.016 -1.800 0.072 -0.060 0.003
JIF 0.052 1.054 0.001 39.670 0.000 0.050 0.055
Ref. impact 0.004 1.004 0.000 29.340 0.000 0.004 0.005
Author impact 0.009 1.009 0.001 16.200 0.000 0.007 0.010
Institution impact 0.020 1.020 0.009 2.190 0.029 0.002 0.038
Country impact 0.218 1.244 0.006 37.980 0.000 0.207 0.229
J. auth. internationality -6.242 0.001 0. 309 -20.140 0.000 -6.849 -5.634
J. citer internationality 4.777 118.748 0.430 3.950 0.000 3.334 5.020
Ref. auth. internationality -1.025 0.359 0.294 -3.490 0.000 -1.602 -0.449
Ref. citer internationality 2.124 8.368 0.512 4.150 0.000 1.120 3.129
No. refs 0.008 1.008 0.001 11.230 0.000 0.007 0.010
No. pages 0.006 1.006 0.005 1.350 0.178 -0.003 0.015
Title Length -0.004 0.996 0.002 -1.640 0.100 -0.009 0.001
Abs. length 0.0004 1.0004 0.0001 2.130 0.033 0.000 0.001
Abs. readability -0.003 0.997 0.001 -3.640 0.000 -0.005 -0.001
Constant -5.203 0.006 0.318 -16.380 0.000 -5.825 -4.580
Alpha -0.237 0.789 0.017 -14.190 0.000 -0.270 -0.204

225
Table C.16. The results of hurdle model in Neuroscience & Behaviour
Logit model Coef. Exp (Coef.) Std. Err. z P>z [95% Conf. Interval]
Field size 0.000 1.000 0.000 -1.930 0.053 0.000 0.000
No. authors 0.045 1.046 0.021 2.100 0.036 0.003 0.087
No. institutions -0.122 0.885 0.047 -2.610 0.009 -0.213 -0.030
No. countries -0.194 0.823 0.089 -2.170 0.030 -0.370 -0.019
JIF 0.225 1.252 0.033 6.850 0.000 0.161 0.289
Ref. impact 0.009 1.009 0.002 5.490 0.000 0.006 0.012
Author impact 0.024 1.024 0.004 6.100 0.000 0.016 0.031
Institution impact 0.189 1.208 0.045 4.160 0.000 0.100 0.278
Country impact 0.113 1.120 0.007 15.440 0.000 0.099 0.127
J. auth. internationality -1.575 0.207 0.522 -3.020 0.003 -2.598 -0.553
J. citer internationality 4.504 90.366 0.330 13.650 0.000 3.857 5.151
Ref. auth. internationality -8.032 0.0003 1.653 -4.860 0.000 -11.272 -4.792
Ref. citer internationality 4.098 60.238 2.637 5.350 0.000 1.934 7.271
No. refs -0.002 0.998 0.003 -0.620 0.538 -0.007 0.004
No. pages 0.029 1.030 0.016 1.790 0.073 -0.003 0.061
Title Length -0.005 0.995 0.010 -0.540 0.591 -0.025 0.014
Abs. length 0.002 1.002 0.001 2.310 0.021 0.000 0.003
Abs. readability 0.004 1.004 0.004 0.980 0.326 -0.004 0.012
Constant -7.121 0.001 1.457 -4.890 0.000 -9.977 -4.265
NB model Coef. Exp (Coef.) Std. Err. z P>z [95% Conf. Interval]
Field size -0.007 0.992 0.000 -7.820 0.000 0.000 0.000
No. authors 0.016 1.016 0.003 4.640 0.000 0.009 0.022
No. institutions -0.018 0.982 0.008 -2.290 0.022 -0.034 -0.003
No. countries 0.001 1.001 0.016 0.050 0.963 -0.031 0.032
JIF 0.112 1.119 0.004 26.950 0.000 0.104 0.120
Ref. impact 0.006 1.006 0.000 29.230 0.000 0.006 0.007
Author impact 0.012 1.012 0.001 20.390 0.000 0.010 0.013
Institution impact 0.012 1.012 0.002 5.720 0.000 0.008 0.016
Country impact 0.195 1.215 0.004 49.310 0.000 0.187 0.203
J. auth. internationality 0.246 1.278 0.115 2.150 0.032 0.021 0.470
J. citer internationality 1.073 2.924 0.073 14.690 0.000 0.930 1.216
Ref. auth. internationality -5.369 0.005 0.356 -15.080 0.000 -6.067 -4.671
Ref. citer internationality 4.011 55.208 0.629 12.740 0.000 4.778 7.243
No. refs 0.003 1.003 0.001 6.560 0.000 0.002 0.004
No. pages 0.001 1.001 0.003 0.170 0.866 -0.005 0.006
Title Length -0.011 0.989 0.002 -6.050 0.000 -0.015 -0.008
Abs. length 0.002 1.002 0.000 12.810 0.000 0.002 0.002
Abs. readability -0.003 0.997 0.001 -3.480 0.001 -0.004 -0.001
Constant -2.591 0.075 0.356 -7.290 0.000 -3.288 -1.894
Alpha -0.167 0.846 0.017 -9.850 0.000 -0.200 -0.134

226
Table C.17. The results of hurdle model in Pharmacology & Toxicology
Logit model Coef. Exp (Coef.) Std. Err. z P>z [95% Conf. Interval]
Field size 0.000 1.000 0.000 -1.090 0.275 0.000 0.000
No. authors 0.024 1.024 0.018 1.350 0.176 -0.011 0.059
No. institutions -0.163 0.850 0.043 -3.830 0.000 -0.246 -0.079
No. countries 0.220 1.247 0.097 2.270 0.023 0.030 0.411
JIF 0.596 1.815 0.027 21.870 0.000 0.542 0.649
Ref. impact 0.001 1.001 0.001 1.000 0.316 -0.001 0.002
Author impact 0.018 1.018 0.004 4.540 0.000 0.010 0.025
Institution impact 0.196 1.217 0.039 5.070 0.000 0.120 0.272
Country impact 0.173 1.189 0.008 22.870 0.000 0.158 0.188
J. auth. internationality -4.888 0.007 0.443 -11.030 0.000 -5.757 -4.019
J. citer internationality 3.320 27.660 0.592 22.480 0.000 2.151 4.473
Ref. auth. internationality -1.402 0.246 1.242 -1.130 0.259 -3.837 1.032
Ref. citer internationality -0.430 0.651 1.777 -0.240 0.809 -3.913 3.053
No. refs 0.006 1.006 0.003 1.720 0.086 -0.001 0.012
No. pages 0.084 1.088 0.018 4.740 0.000 0.049 0.119
Title Length -0.003 0.997 0.009 -0.300 0.763 -0.020 0.015
Abs. length 0.000 1.000 0.001 -0.150 0.884 -0.001 0.001
Abs. readability 0.000 1.000 0.004 -0.040 0.970 -0.007 0.007
Constant -3.370 0.034 0.867 -3.890 0.000 -5.069 -1.672
NB model Coef. Exp (Coef.) Std. Err. z P>z [95% Conf. Interval]
Field size 0.000 1.000 0.000 -0.770 0.439 0.000 0.000
No. authors 0.016 1.016 0.005 3.300 0.001 0.006 0.025
No. institutions -0.019 0.981 0.010 -1.870 0.062 -0.039 0.001
No. countries 0.042 1.043 0.020 2.120 0.034 0.003 0.082
JIF 0.229 1.258 0.009 25.000 0.000 0.211 0.247
Ref. impact 0.006 1.006 0.000 22.010 0.000 0.006 0.007
Author impact 0.014 1.014 0.001 18.650 0.000 0.013 0.016
Institution impact 0.013 1.013 0.003 4.140 0.000 0.007 0.019
Country impact 0.191 1.210 0.004 47.810 0.000 0.183 0.199
J. auth. internationality -2.953 0.052 0.1230 -23.960 0.000 -3.194 -2.711
J. citer internationality 2.605 13.524 0.194 49.380 0.000 2.220 3.982
Ref. auth. internationality -1.265 0.282 0.320 -3.950 0.000 -1.892 -0.638
Ref. citer internationality -2.592 0.075 0.500 -5.180 0.000 -3.571 -1.612
No. refs 0.005 1.005 0.001 7.400 0.000 0.003 0.006
No. pages 0.028 1.028 0.003 7.910 0.000 0.021 0.034
Title Length -0.012 0.988 0.002 -6.300 0.000 -0.016 -0.008
Abs. length 0.001 1.001 0.000 3.920 0.000 0.000 0.001
Abs. readability -0.001 0.999 0.001 -1.620 0.106 -0.003 0.000
Constant -0.754 0.470 0.242 -3.120 0.002 -1.228 -0.281
Alpha -0.237 0.789 0.020 -11.650 0.000 -0.276 -0.197

227
Table C.18. The results of hurdle model in Physics
Logit model Coef. Exp (Coef.) Std. Err. z P>z [95% Conf. Interval]
Field size 0.000 1.000 0.000 1.310 0.191 0.000 0.000
No. authors 0.019 1.020 0.011 1.850 0.064 -0.001 0.040
No. institutions -0.101 0.904 0.043 -2.330 0.020 -0.186 -0.016
No. countries 0.028 1.028 0.069 0.410 0.683 -0.106 0.163
JIF 0.335 1.399 0.041 8.230 0.000 0.256 0.415
Ref. impact 0.001 1.001 0.000 1.970 0.049 0.000 0.001
Author impact 0.019 1.019 0.003 5.920 0.000 0.012 0.025
Institution impact 0.289 1.336 0.051 5.650 0.000 0.189 0.390
Country impact 0.148 1.159 0.005 27.880 0.000 0.137 0.158
J. auth. internationality -5.207 0.005 0.475 -10.940 0.000 -6.140 -4.274
J. citer internationality 3.719 41.223 0.463 16.690 0.000 2.818 4.632
Ref. auth. internationality -3.191 0.041 0.735 -4.340 0.000 -4.632 -1.749
Ref. citer internationality 3.706 40.671 1.086 3.410 0.001 1.576 5.835
No. refs 0.006 1.006 0.003 2.240 0.025 0.001 0.012
No. pages 0.018 1.018 0.008 2.230 0.026 0.002 0.034
Title Length -0.005 0.995 0.008 -0.640 0.521 -0.022 0.011
Abs. length 0.002 1.002 0.001 2.600 0.009 0.000 0.003
Abs. readability 0.003 1.003 0.002 1.250 0.211 -0.002 0.008
Constant -2.405 0.090 0.590 -4.080 0.000 -3.561 -1.248
NB model Coef. Exp (Coef.) Std. Err. z P>z [95% Conf. Interval]
Field size 0.004 1.004 0.000 2.630 0.009 0.000 0.000
No. authors 0.003 1.003 0.002 1.490 0.137 -0.001 0.008
No. institutions -0.015 0.985 0.018 -0.840 0.399 -0.051 0.020
No. countries -0.101 0.904 0.030 -3.430 0.001 -0.159 -0.043
JIF 0.246 1.279 0.014 18.140 0.000 0.219 0.273
Ref. impact 0.002 1.002 0.000 7.110 0.000 0.001 0.002
Author impact 0.028 1.029 0.001 19.910 0.000 0.025 0.031
Institution impact 0.024 1.024 0.009 2.570 0.010 0.006 0.042
Country impact 0.201 1.223 0.007 30.160 0.000 0.188 0.214
J. auth. internationality -2.462 0.085 0.243 -10.100 0.000 -2.940 -1.984
J. citer internationality 3.352 28.559 0.230 15.830 0.000 3.186 4.087
Ref. auth. internationality -1.496 0.224 0.417 -3.580 0.000 -2.315 -0.678
Ref. citer internationality 1.775 5.903 0.654 2.720 0.007 0.494 3.057
No. refs 0.007 1.007 0.001 5.590 0.000 0.004 0.009
No. pages 0.009 1.009 0.003 2.690 0.007 0.002 0.015
Title Length -0.007 0.993 0.004 -1.660 0.097 -0.014 0.001
Abs. length 0.002 1.002 0.000 5.570 0.000 0.001 0.002
Abs. readability 0.000 1.000 0.001 -0.020 0.983 -0.002 0.002
Constant -0.733 0.480 0.338 -2.170 0.030 -1.395 -0.071
Alpha 0.472 1.604 0.035 13.610 0.000 0.404 0.540

228
Table C.19. The results of hurdle model in Plant & Animal Science
Logit model Coef. Exp (Coef.) Std. Err. z P>z [95% Conf. Interval]
Field size -0.008 0.991 0.000 -1.970 0.049 0.000 0.000
No. authors 0.054 1.056 0.012 4.730 0.000 0.032 0.077
No. institutions -0.005 0.995 0.028 -0.180 0.854 -0.059 0.049
No. countries 0.371 1.450 0.052 7.120 0.000 0.269 0.474
JIF 0.207 1.231 0.048 4.320 0.000 0.113 0.302
Ref. impact 0.004 1.004 0.001 2.810 0.005 0.001 0.007
Author impact 0.038 1.039 0.005 7.840 0.000 0.029 0.048
Institution impact 0.317 1.372 0.044 7.240 0.000 0.231 0.402
Country impact 0.156 1.169 0.006 26.380 0.000 0.145 0.168
J. auth. internationality -3.135 0.043 0.329 -9.530 0.000 -3.780 -2.490
J. citer internationality 5.934 377.521 0.303 19.570 0.000 5.339 6.528
Ref. auth. internationality -2.661 0.070 0.546 -4.870 0.000 -3.731 -1.590
Ref. citer internationality 3.316 27.548 0.878 3.780 0.000 1.595 5.037
No. refs 0.001 1.001 0.003 0.560 0.578 -0.004 0.006
No. pages 0.031 1.032 0.010 3.230 0.001 0.012 0.050
Title Length -0.001 0.999 0.007 -0.200 0.839 -0.016 0.013
Abs. length 0.001 1.001 0.000 1.660 0.097 0.000 0.002
Abs. readability 0.001 1.001 0.003 0.520 0.603 -0.004 0.007
Constant -1.822 0.162 0.527 -3.460 0.001 -2.854 -0.790
NB model Coef. Exp (Coef.) Std. Err. z P>z [95% Conf. Interval]
Field size 0.002 1.002 0.000 2.170 0.030 0.000 0.000
No. authors 0.074 1.077 0.007 10.450 0.000 0.060 0.088
No. institutions -0.085 0.919 0.018 -4.730 0.000 -0.120 -0.050
No. countries 0.134 1.143 0.030 4.540 0.000 0.076 0.192
JIF 0.085 1.088 0.010 8.550 0.000 0.065 0.104
Ref. impact 0.006 1.006 0.000 14.440 0.000 0.006 0.007
Author impact 0.026 1.026 0.001 20.480 0.000 0.023 0.028
Institution impact 0.027 1.028 0.005 4.990 0.000 0.016 0.038
Country impact 0.204 1.226 0.005 42.820 0.000 0.195 0.213
J. auth. internationality -0.645 0.524 0.111 -5.780 0.000 -0.863 -0.426
J. citer internationality 2.216 9.174 0.094 23.600 0.000 2.032 2.400
Ref. auth. internationality -1.480 0.228 0.187 -7.900 0.000 -1.848 -1.113
Ref. citer internationality 2.388 10.895 0.334 7.140 0.000 1.733 3.044
No. refs 0.004 1.004 0.001 6.210 0.000 0.003 0.006
No. pages 0.014 1.014 0.003 5.020 0.000 0.008 0.019
Title Length -0.013 0.987 0.002 -5.670 0.000 -0.017 -0.008
Abs. length 0.001 1.001 0.000 6.750 0.000 0.001 0.001
Abs. readability 0.001 1.001 0.001 1.250 0.210 -0.001 0.003
Constant -1.107 0.331 0.211 -5.230 0.000 -1.521 -0.693
Alpha -0.067 0.935 0.025 -2.680 0.007 -0.116 -0.018

229
Table C.20. The results of hurdle model in Psychiatry/Psychology
Logit model Coef. Exp (Coef.) Std. Err. z P>z [95% Conf. Interval]
Field size 0.000 1.000 0.000 1.850 0.064 0.000 0.000
No. authors 0.132 1.141 0.015 8.910 0.000 0.103 0.161
No. institutions 0.087 1.091 0.030 2.940 0.003 0.029 0.146
No. countries 0.081 1.084 0.066 1.220 0.222 -0.049 0.210
JIF 0.007 1.007 0.034 0.210 0.035 -0.060 0.074
Ref. impact 0.006 1.006 0.001 4.210 0.000 0.003 0.008
Author impact 0.024 1.025 0.004 5.990 0.000 0.016 0.032
Institution impact 0.157 1.170 0.036 4.380 0.000 0.087 0.228
Country impact 0.148 1.159 0.007 21.060 0.000 0.134 0.162
J. auth. internationality -3.812 0.022 0.450 -8.470 0.000 -4.694 -2.929
J. citer internationality 4.501 90.107 0.388 21.900 0.000 4.748 6.270
Ref. auth. internationality -1.129 0.323 0.620 -1.820 0.069 -2.345 0.087
Ref. citer internationality 1.409 4.092 1.092 1.290 0.197 -0.732 3.550
No. refs 0.004 1.004 0.002 1.760 0.078 0.000 0.009
No. pages 0.033 1.034 0.008 4.160 0.000 0.018 0.049
Title Length -0.035 0.966 0.009 -3.750 0.000 -0.053 -0.017
Abs. length 0.001 1.001 0.001 1.720 0.085 0.000 0.003
Abs. readability 0.002 1.002 0.003 0.490 0.624 -0.005 0.008
Constant -2.696 0.067 0.775 -3.480 0.001 -4.215 -1.177
NB model Coef. Exp (Coef.) Std. Err. z P>z [95% Conf. Interval]
Field size 0.015 1.015 0.000 5.770 0.000 0.000 0.000
No. authors 0.107 1.113 0.008 13.630 0.000 0.092 0.123
No. institutions 0.028 1.028 0.015 1.810 0.071 -0.002 0.057
No. countries -0.049 0.952 0.033 -1.480 0.139 -0.115 0.016
JIF 0.039 1.039 0.007 5.550 0.000 0.025 0.052
Ref. impact 0.008 1.008 0.000 26.430 0.000 0.007 0.009
Author impact 0.014 1.014 0.001 16.140 0.000 0.012 0.016
Institution impact 0.021 1.021 0.004 5.040 0.000 0.013 0.029
Country impact 0.262 1.299 0.005 47.810 0.000 0.251 0.272
J. auth. internationality -0.891 0.409 0.126 -7.060 0.000 -1.139 -0.644
J. citer internationality 6.365 581.012 0.170 37.420 0.000 6.031 6.698
Ref. auth. internationality -0.994 0.370 0.183 -5.440 0.000 -1.352 -0.636
Ref. citer internationality -0.462 0.630 0.395 -1.170 0.243 -1.237 0.313
No. refs 0.005 1.005 0.001 8.890 0.000 0.004 0.006
No. pages 0.018 1.018 0.002 9.100 0.000 0.014 0.022
Title Length -0.012 0.989 0.003 -4.570 0.000 -0.016 -0.007
Abs. length 0.001 1.001 0.000 5.370 0.000 0.001 0.002
Abs. readability 0.001 1.001 0.001 1.440 0.149 0.000 0.003
Constant -2.248 0.106 0.268 -8.400 0.000 -2.772 -1.723
Alpha -0.108 0.898 0.022 -4.810 0.000 -0.151 -0.064

230
Table C.21. The results of hurdle model in Social Sciences, General
Logit model Coef. Exp (Coef.) Std. Err. z P>z [95% Conf. Interval]
Field size 0.000 1.000 0.000 0.780 0.433 0.000 0.000
No. authors 0.160 1.173 0.016 10.080 0.000 0.129 0.191
No. institutions -0.162 0.851 0.057 -2.850 0.004 -0.273 -0.050
No. countries 0.038 1.039 0.107 0.350 0.724 -0.172 0.248
JIF 0.785 2.192 0.032 24.260 0.000 0.721 0.848
Ref. impact 0.004 1.004 0.002 2.390 0.017 0.001 0.007
Author impact 0.034 1.034 0.007 4.910 0.000 0.020 0.047
Institution impact 0.250 1.284 0.067 3.730 0.000 0.119 0.382
Country impact 0.206 1.229 0.007 31.100 0.000 0.193 0.219
J. auth. internationality -2.098 0.122 0.423 -4.950 0.000 -2.929 -1.268
J. citer internationality 2.210 9.119 0.348 17.950 0.000 1.571 2.937
Ref. auth. internationality -0.770 0.463 0.453 -1.700 0.089 -1.657 0.118
Ref. citer internationality 0.891 2.436 0.695 1.280 0.200 -0.472 2.253
No. refs 0.008 1.008 0.003 2.990 0.003 0.003 0.013
No. pages 0.029 1.030 0.008 3.880 0.000 0.014 0.044
Title Length 0.004 1.004 0.011 0.350 0.727 -0.017 0.024
Abs. length 0.002 1.002 0.001 2.670 0.007 0.001 0.004
Abs. readability 0.009 1.009 0.004 2.460 0.014 0.002 0.017
Constant -2.341 0.096 0.541 -4.330 0.000 -3.402 -1.280
NB model Coef. Exp (Coef.) Std. Err. z P>z [95% Conf. Interval]
Field size 0.000 1.000 0.000 -0.620 0.534 0.000 0.000
No. authors 0.101 1.106 0.013 7.760 0.000 0.075 0.126
No. institutions 0.049 1.050 0.024 2.060 0.040 0.002 0.095
No. countries 0.052 1.053 0.045 1.130 0.256 -0.038 0.141
JIF 0.477 1.611 0.024 19.490 0.000 0.429 0.525
Ref. impact 0.006 1.006 0.001 10.590 0.000 0.005 0.007
Author impact 0.029 1.029 0.002 14.120 0.000 0.025 0.033
Institution impact 0.043 1.044 0.013 3.280 0.001 0.017 0.069
Country impact 0.252 1.286 0.007 37.630 0.000 0.239 0.265
J. auth. internationality -0.376 0.686 0.140 -2.670 0.007 -0.652 -0.100
J. citer internationality 3.467 32.030 0.141 24.650 0.000 3.191 3.742
Ref. auth. internationality -0.950 0.387 0.168 -5.660 0.000 -1.279 -0.621
Ref. citer internationality 0.944 2.570 0.315 3.000 0.003 0.327 1.560
No. refs 0.005 1.005 0.001 5.640 0.000 0.003 0.006
No. pages 0.008 1.008 0.003 3.230 0.001 0.003 0.013
Title Length -0.020 0.980 0.004 -5.470 0.000 -0.027 -0.013
Abs. length 0.001 1.001 0.000 4.470 0.000 0.001 0.002
Abs. readability 0.003 1.003 0.001 2.100 0.035 0.000 0.006
Constant -1.283 0.277 0.235 -5.470 0.000 -1.743 -0.823
Alpha 0.118 1.125 0.037 3.220 0.001 0.046 0.190

231
Table C.22. The results of hurdle model in Space Sciences
Logit model Coef. Exp (Coef.) Std. Err. z P>z [95% Conf. Interval]
Field size 0.035 1.036 0.000 2.720 0.007 0.000 0.000
No. authors 0.045 1.046 0.016 2.850 0.004 0.014 0.077
No. institutions -0.143 0.867 0.043 -3.310 0.001 -0.227 -0.058
No. countries 0.116 1.123 0.065 1.790 0.073 -0.011 0.243
JIF 0.546 1.726 0.016 33.410 0.000 0.514 0.578
Ref. impact 0.001 1.001 0.001 1.280 0.201 0.000 0.002
Author impact 0.021 1.021 0.004 5.680 0.000 0.014 0.028
Institution impact 0.192 1.212 0.042 4.610 0.000 0.111 0.274
Country impact -0.008 0.992 0.005 -1.450 0.146 -0.019 0.003
J. auth. internationality 3.249 25.777 0.550 5.900 0.000 2.171 4.328
J. citer internationality 1.639 5.151 0.271 6.040 0.000 1.108 2.171
Ref. auth. internationality -4.899 0.007 0.991 -4.940 0.000 -6.841 -2.957
Ref. citer internationality 3.692 40.109 1.324 5.050 0.000 2.096 4.286
No. refs 0.009 1.009 0.003 3.240 0.001 0.004 0.015
No. pages 0.065 1.067 0.011 6.010 0.000 0.044 0.086
Title Length -0.010 0.990 0.010 -1.000 0.317 -0.029 0.010
Abs. length 0.000 1.000 0.001 0.550 0.581 -0.001 0.001
Abs. readability -0.003 0.997 0.003 -0.770 0.443 -0.010 0.004
Constant -5.404 0.005 0.781 -6.920 0.000 -6.935 -3.872
NB model Coef. Exp (Coef.) Std. Err. z P>z [95% Conf. Interval]
Field size 0.060 1.062 0.000 10.010 0.000 0.000 0.000
No. authors 0.012 1.012 0.002 5.120 0.000 0.007 0.016
No. institutions -0.027 0.973 0.008 -3.370 0.001 -0.043 -0.011
No. countries 0.004 1.004 0.014 0.320 0.751 -0.022 0.031
JIF 0.203 1.225 0.007 28.430 0.000 0.189 0.217
Ref. impact 0.003 1.003 0.000 13.540 0.000 0.003 0.004
Author impact 0.020 1.020 0.001 22.720 0.000 0.018 0.022
Institution impact 0.009 1.009 0.004 2.100 0.035 0.001 0.018
Country impact 0.174 1.190 0.005 33.190 0.000 0.164 0.184
J. auth. internationality 2.690 14.731 0.202 12.670 0.000 2.164 2.956
J. citer internationality -0.588 0.555 0.069 -8.540 0.000 -0.723 -0.453
Ref. auth. internationality -3.194 0.041 0.380 -8.410 0.000 -3.939 -2.450
Ref. citer internationality 3.186 24.191 0.564 12.340 0.000 2.854 5.065
No. refs 0.004 1.004 0.001 5.390 0.000 0.002 0.005
No. pages 0.035 1.036 0.002 14.800 0.000 0.030 0.040
Title Length -0.006 0.994 0.003 -2.300 0.021 -0.011 -0.001
Abs. length 0.0005 1.0005 0.0001 3.240 0.001 0.000 0.001
Abs. readability -0.001 0.999 0.001 -1.450 0.146 -0.003 0.001
Constant -4.233 0.015 0.309 -13.720 0.000 -4.838 -3.628
Alpha 0.159 1.173 0.022 7.360 0.000 0.117 0.202

232
APPENDIX D: HURDLE MODELS RESULTS IN
THE FOUR BROAD AREAS
Table D.1. The results of hurdle model in Physical Sciences
Logit model Coef. Exp (Coef.) Std. Err. z P>z [95% Conf. Interval]
Field size 0.000 1.000 0.000 0.630 0.528 0.000 0.000
No. authors 0.027 1.028 0.011 2.540 0.011 0.006 0.048
No. institutions -0.041 0.960 0.028 -1.470 0.143 -0.095 0.014
No. countries 0.344 1.411 0.023 14.660 0.000 0.298 0.390
JIF 0.231 1.260 0.021 11.200 0.000 0.191 0.272
Ref. impact 0.000 1.000 0.000 0.910 0.363 0.000 0.000
Author impact 0.015 1.015 0.002 6.220 0.000 0.010 0.020
Institution impact -0.162 0.850 0.054 -2.980 0.003 -0.269 -0.055
Country impact 0.270 1.310 0.030 9.040 0.000 0.211 0.328
J. auth. internationality -2.394 0.091 0.340 -7.040 0.000 -3.061 -1.728
J. citer internationality 3.666 39.111 0.278 13.190 0.000 3.121 4.211
Ref. auth. internationality 0.030 1.030 0.513 0.060 0.954 -0.977 1.036
Ref. citer internationality -0.758 0.469 0.639 -1.190 0.236 -2.011 0.495
No. refs 0.011 1.011 0.002 6.690 0.000 0.007 0.014
No. pages 0.003 1.003 0.004 0.950 0.340 -0.004 0.011
Title Length 0.006 1.006 0.005 1.090 0.276 -0.005 0.016
Abs. length 0.000 1.000 0.000 0.440 0.660 -0.001 0.001
Abs. readability -0.001 0.999 0.002 -0.800 0.424 -0.004 0.002
Funding 0.672 1.958 0.031 21.410 0.000 0.610 0.733
Constant -1.039 0.354 0.334 -3.110 0.002 -1.693 -0.384
NB model Coef. Exp (Coef.) Std. Err. z P>z [95% Conf. Interval]
Field size 0.000 1.000 0.000 -1.600 0.110 0.000 0.000
No. authors 0.009 1.009 0.003 2.990 0.003 0.003 0.015
No. institutions -0.010 0.990 0.014 -0.730 0.467 -0.037 0.017
No. countries 0.216 1.241 0.021 10.170 0.000 0.175 0.258
JIF 0.123 1.130 0.011 11.430 0.000 0.102 0.144
Ref. impact 0.009 1.009 0.001 6.890 0.000 0.006 0.011
Author impact 0.013 1.013 0.001 9.510 0.000 0.010 0.015
Institution impact 0.032 1.032 0.066 0.490 0.626 -0.097 0.161
Country impact 0.101 1.106 0.043 2.360 0.018 0.017 0.184
J. auth. internationality -2.521 0.080 0.322 -7.840 0.000 -3.151 -1.891
J. citer internationality 3.515 33.615 0.298 11.820 0.000 2.941 4.110
Ref. auth. internationality 1.972 7.183 0.462 4.270 0.000 1.067 2.877
Ref. citer internationality -1.064 0.345 0.591 -1.800 0.072 -2.222 0.094
No. refs 0.008 1.008 0.001 7.880 0.000 0.006 0.010
No. pages 0.003 1.003 0.003 1.180 0.236 -0.002 0.009
Title Length -0.004 0.996 0.004 -1.030 0.301 -0.011 0.003
Abs. length -0.001 0.999 0.000 -3.460 0.001 -0.001 0.000
Abs. readability -0.001 0.999 0.001 -1.030 0.301 -0.004 0.001
Funding 0.362 1.436 0.040 9.080 0.000 0.284 0.440
Constant -1.251 0.286 0.290 -4.310 0.000 -1.820 -0.681
Alpha 0.028 1.028 0.058 0.470 0.035 -0.086 0.142

233
Table D.2. The results of hurdle model in Life Sciences
Logit model Coef. Exp (Coef.) Std. Err. z P>z [95% Conf. Interval]
Field size 0.000 1.000 0.000 0.850 0.396 0.000 0.000
No. authors 0.042 1.043 0.012 3.510 0.000 0.019 0.065
No. institutions -0.028 0.973 0.027 -1.020 0.306 -0.081 0.025
No. countries 0.304 1.355 0.036 8.430 0.000 0.233 0.375
JIF 0.558 1.747 0.017 33.520 0.000 0.525 0.591
Ref. impact 0.000 1.000 0.000 1.830 0.067 0.000 0.001
Author impact 0.014 1.014 0.002 6.200 0.000 0.010 0.019
Institution impact 0.145 1.156 0.048 4.630 0.000 0.120 0.528
Country impact 0.399 1.490 0.070 5.700 0.000 0.262 0.536
J. auth. internationality -1.803 0.165 0.342 -5.270 0.000 -2.474 -1.133
J. citer internationality 3.383 29.472 0.329 10.280 0.000 2.738 4.029
Ref. auth. internationality -0.420 0.657 0.782 -0.540 0.591 -1.953 1.113
Ref. citer internationality -0.865 0.421 1.010 -0.860 0.392 -2.844 1.114
No. refs 0.009 1.009 0.002 4.690 0.000 0.005 0.013
No. pages 0.010 1.010 0.010 1.040 0.297 -0.009 0.029
Title Length -0.004 0.996 0.006 -0.650 0.516 -0.015 0.008
Abs. length 0.000 1.000 0.000 0.180 0.857 -0.001 0.001
Abs. readability -0.003 0.997 0.002 -1.360 0.175 -0.008 0.001
Funding 0.819 2.267 0.042 19.340 0.000 0.736 0.902
Constant -1.718 0.179 0.469 -3.670 0.000 -2.637 -0.799
NB model Coef. Exp (Coef.) Std. Err. z P>z [95% Conf. Interval]
Field size 0.000 1.000 0.000 1.220 0.223 0.000 0.000
No. authors 0.028 1.029 0.006 4.410 0.000 0.016 0.041
No. institutions 0.026 1.027 0.016 1.650 0.099 -0.005 0.058
No. countries 0.197 1.217 0.031 6.340 0.000 0.136 0.258
JIF 0.229 1.257 0.010 24.020 0.000 0.210 0.247
Ref. impact 0.003 1.003 0.001 5.560 0.000 0.002 0.004
Author impact 0.011 1.012 0.001 9.490 0.000 0.009 0.014
Institution impact 0.013 1.013 0.004 5.850 0.000 0.007 0.018
Country impact 0.062 1.064 0.085 0.720 0.004 -0.106 0.229
J. auth. internationality -1.249 0.287 0.276 -4.520 0.000 -1.791 -0.707
J. citer internationality 2.987 19.823 0.287 10.410 0.000 2.424 3.549
Ref. auth. internationality 2.040 7.692 0.620 3.290 0.001 0.825 3.255
Ref. citer internationality -3.433 0.032 0.843 -4.070 0.000 -5.086 -1.781
No. refs 0.006 1.006 0.001 4.840 0.000 0.003 0.008
No. pages 0.015 1.016 0.006 2.390 0.017 0.003 0.028
Title Length -0.010 0.990 0.004 -2.550 0.011 -0.017 -0.002
Abs. length 0.000 1.000 0.000 -1.070 0.285 -0.001 0.000
Abs. readability -0.004 0.996 0.002 -2.760 0.006 -0.007 -0.001
Funding 0.317 1.373 0.046 6.840 0.000 0.226 0.408
Constant -0.938 0.391 0.389 -2.410 0.016 -1.701 -0.176
Alpha 0.192 1.212 0.060 3.180 0.001 0.074 0.311

234
Table D.3. The results of hurdle model in Medicine
Logit model Coef. Exp (Coef.) Std. Err. z P>z [95% Conf. Interval]
Field size 0.000 1.000 0.000 0.380 0.702 0.000 0.000
No. authors 0.091 1.095 0.014 6.450 0.000 0.063 0.119
No. institutions 0.067 1.069 0.031 2.150 0.032 0.006 0.127
No. countries 0.153 1.166 0.075 2.060 0.040 0.007 0.299
JIF 0.451 1.569 0.026 17.530 0.000 0.400 0.501
Ref. impact 0.004 1.004 0.001 4.230 0.000 0.002 0.006
Author impact 0.015 1.015 0.004 3.880 0.000 0.007 0.022
Institution impact -0.201 0.818 0.057 -3.550 0.000 -0.312 -0.090
Country impact 0.228 1.257 0.077 2.950 0.003 0.077 0.380
J. auth. internationality -2.833 0.059 0.636 -4.450 0.000 -4.080 -1.587
J. citer internationality 4.031 56.296 0.584 6.900 0.000 2.886 5.175
Ref. auth. internationality 1.536 4.646 1.105 1.390 0.164 -0.629 3.701
Ref. citer internationality -3.129 0.044 1.844 -1.700 0.090 -6.744 0.486
No. refs 0.018 1.019 0.002 9.800 0.000 0.015 0.022
No. pages 0.022 1.022 0.009 2.370 0.018 0.004 0.041
Title Length 0.002 1.002 0.011 0.170 0.866 -0.019 0.023
Abs. length 0.001 1.001 0.001 1.580 0.114 0.000 0.003
Abs. readability 0.003 1.003 0.004 0.750 0.451 -0.005 0.012
Funding 0.993 2.698 0.079 12.580 0.000 0.838 1.147
Constant -1.071 0.343 1.169 -0.920 0.359 -3.363 1.220
NB model Coef. Exp (Coef.) Std. Err. z P>z [95% Conf. Interval]
Field size 0.000 1.000 0.000 1.450 0.148 0.000 0.000
No. authors 0.085 1.089 0.014 6.090 0.000 0.058 0.112
No. institutions 0.063 1.065 0.030 2.090 0.037 0.004 0.122
No. countries 0.192 1.212 0.076 2.530 0.012 0.043 0.341
JIF 0.221 1.247 0.016 13.840 0.000 0.189 0.252
Ref. impact 0.014 1.014 0.001 10.140 0.000 0.011 0.017
Author impact 0.011 1.011 0.002 5.050 0.000 0.007 0.015
Institution impact 0.235 1.264 0.123 1.900 0.047 -0.007 0.476
Country impact 0.404 1.498 0.112 3.600 0.000 0.184 0.624
J. auth. internationality -0.837 0.433 0.499 -1.680 0.004 -1.816 0.142
J. citer internationality 3.214 24.867 0.552 5.820 0.000 2.132 4.295
Ref. auth. internationality 3.888 48.815 0.856 4.540 0.000 2.211 5.565
Ref. citer internationality -7.184 0.001 1.401 -5.130 0.000 -9.930 -4.438
No. refs 0.009 1.009 0.002 3.640 0.000 0.004 0.014
No. pages 0.030 1.031 0.007 4.470 0.000 0.017 0.044
Title Length -0.009 0.991 0.007 -1.240 0.216 -0.024 0.005
Abs. length 0.001 1.001 0.001 2.440 0.015 0.000 0.002
Abs. readability -0.004 0.996 0.003 -1.190 0.234 -0.009 0.002
Funding 0.835 2.306 0.082 10.210 0.000 0.675 0.996
Constant 0.263 1.301 0.904 0.290 0.771 -1.508 2.035
Alpha 0.223 1.250 0.113 1.970 0.049 0.001 0.444

235
Table D.4. The results of hurdle model in Social Sciences
Logit model Coef. Exp (Coef.) Std. Err. z P>z [95% Conf. Interval]
Field size 0.000 1.000 0.000 -0.420 0.677 0.000 0.000
No. authors 0.069 1.071 0.045 1.540 0.024 -0.019 0.156
No. institutions 0.067 1.069 0.076 0.880 0.379 -0.082 0.216
No. countries -0.004 0.996 0.116 -0.030 0.975 -0.231 0.224
JIF 0.373 1.451 0.086 4.310 0.000 0.203 0.542
Ref. impact 0.001 1.001 0.002 0.630 0.531 -0.003 0.006
Author impact 0.008 1.008 0.009 0.920 0.359 -0.009 0.026
Institution impact -0.691 0.501 0.205 -3.370 0.001 -1.094 -0.289
Country impact 0.151 1.163 0.080 1.880 0.006 -121.537 110.523
J. auth. internationality -1.781 0.168 0.611 -2.920 0.004 -2.978 -0.584
J. citer internationality 3.125 22.760 0.556 5.620 0.000 2.036 4.214
Ref. auth. internationality -0.365 0.694 0.841 -0.430 0.664 -2.013 1.282
Ref. citer internationality -0.135 0.874 1.077 -0.130 0.900 -2.245 1.975
No. refs 0.018 1.018 0.002 11.740 0.000 0.015 0.021
No. pages 0.019 1.019 0.008 2.390 0.017 0.003 0.034
Title Length 0.029 1.030 0.014 2.100 0.036 0.002 0.057
Abs. length 0.000 1.000 0.001 0.220 0.829 -0.002 0.002
Abs. readability 0.005 1.005 0.005 1.030 0.301 -0.004 0.014
Funding 0.100 1.105 0.190 0.530 0.599 -0.272 0.471
Constant -1.804 0.165 0.781 -2.310 0.021 -3.335 -0.274
NB model Coef. Exp (Coef.) Std. Err. z P>z [95% Conf. Interval]
Field size 0.000 1.000 0.000 1.760 0.078 0.000 0.000
No. authors 0.001 1.001 0.038 0.030 0.005 -0.074 0.076
No. institutions 0.007 1.007 0.064 0.100 0.919 -0.118 0.131
No. countries 0.011 1.011 0.099 0.110 0.909 -0.183 0.205
JIF 0.227 1.255 0.067 3.410 0.001 0.097 0.357
Ref. impact -0.001 0.999 0.002 -0.510 0.613 -0.005 0.003
Author impact 0.027 1.027 0.008 3.330 0.001 0.011 0.043
Institution impact -2.164 0.115 0.542 -3.990 0.000 -3.227 -1.101
Country impact 0.066 1.069 0.131 0.510 0.002 -.190 0.323
J. auth. internationality -0.259 0.772 0.667 -0.390 0.006 -1.567 1.049
J. citer internationality 1.962 7.110 0.617 3.180 0.001 0.752 3.171
Ref. auth. internationality 2.520 12.429 0.981 2.570 0.010 0.598 4.442
Ref. citer internationality -3.425 0.033 1.276 -2.690 0.007 -5.926 -0.925
No. refs 0.009 1.009 0.002 3.720 0.000 0.004 0.014
No. pages -0.002 0.998 0.007 -0.350 0.723 -0.016 0.011
Title Length 0.023 1.023 0.013 1.710 0.087 -0.003 0.049
Abs. length -0.001 0.999 0.001 -0.670 0.503 -0.002 0.001
Abs. readability -0.002 0.998 0.004 -0.390 0.696 -0.010 0.007
Funding -0.200 0.819 0.164 -1.220 0.222 -0.521 0.121
Constant -0.821 0.440 0.807 -1.020 0.309 -2.402 0.760
Alpha 0.560 1.750 0.260 2.150 0.031 0.050 1.070

236
APPENDIX E: EXTRA HURDLE MODELS FOR
THE NUMBER OF INSTITUTIONS
Table E1. The results of extra hurdle models
(only the negative binomial part) for the effect of the number of institutions on citation counts
using a range of different fixed numbers of authors and countries (e.g., 3au_2cnty means 3 authors
from 3 different countries)
Biology & Biochemistry Chemistry
Status Coef. Exp
(coef.) P>|z|
Sample
Size Status Coef.
Exp
(coef.) P>|z|
Sample
Size
2au_1cnty -0.044 0.96 0.52 1935 2au_1cnty -0.27 0.76 0.00 2562
3au_1cnty -0.054 0.95 0.05 2307 3au_1cnty -0.168 0.85 0.00 3090
4au_1cnty -0.098 0.91 0.01 2144 4au_1cnty -0.11 0.9 0.02 2686
5au_1cnty -0.0003 0.99 0.9 1772 5au_1cnty -0.065 0.94 0.18 1713
6au_1cnty 0.055 1.06 0.01 1315 6au_1cnty -0.102 0.9 0.05 1008
7au_1cnty -0.017 0.98 0.7 864 7au_1cnty -0.1 0.9 0.14 505
8au_1cnty -0.102 0.90 0.04 499 8au_1cnty 0.08 1.08 0.48 188
9au_1cnty 0.0054 1.01 0.9 325 9au_1cnty 0.03 1.03 0.74 135
10au_1cnty 0.125 1.13 0.1 199 10au_1cnty 0.028 1.03 0.8 67
3au_2cnty 0.02 1.02 0.85 377 3au_2cnty 0.03 1.03 0.84 424
4au_2cnty -0.125 0.88 0.2 452 4au_2cnty -0.069 0.93 0.53 513
5au_2cnty 0.02 1.02 0.68 448 5au_2cnty -0.056 0.95 0.5 448
6au_2cnty -0.11 0.9 0.04 423 6au_2cnty -0.25 0.78 0.01 289