COPYRIGHT AND CITATION CONSIDERATIONS FOR THIS ... - UJ IR
120
COPYRIGHT AND CITATION CONSIDERATIONS FOR THIS THESIS/ DISSERTATION o Attribution — You must give appropriate credit, provide a link to the license, and indicate if changes were made. You may do so in any reasonable manner, but not in any way that suggests the licensor endorses you or your use. o NonCommercial — You may not use the material for commercial purposes. o ShareAlike — If you remix, transform, or build upon the material, you must distribute your contributions under the same license as the original. How to cite this thesis Surname, Initial(s). (2012). Title of the thesis or dissertation (Doctoral Thesis / Master’s Dissertation). Johannesburg: University of Johannesburg. Available from: http://hdl.handle.net/102000/0002 (Accessed: 22 August 2017).
-
Upload
khangminh22 -
Category
Documents
-
view
5 -
download
0
Transcript of COPYRIGHT AND CITATION CONSIDERATIONS FOR THIS ... - UJ IR

COPYRIGHT AND CITATION CONSIDERATIONS FOR THIS THESIS/ DISSERTATION
o Attribution — You must give appropriate credit, provide a link to the license, and indicate if
changes were made. You may do so in any reasonable manner, but not in any way that
suggests the licensor endorses you or your use.
o NonCommercial — You may not use the material for commercial purposes.
o ShareAlike — If you remix, transform, or build upon the material, you must distribute your
contributions under the same license as the original.
How to cite this thesis
Surname, Initial(s). (2012). Title of the thesis or dissertation (Doctoral Thesis / Master’s Dissertation). Johannesburg: University of Johannesburg. Available from: http://hdl.handle.net/102000/0002 (Accessed: 22 August 2017).

1
Evaluating the effects of effluent from an acid mine drainage treatment
plant on the aquatic health of the Elsburgspruit
BY
NOMKHOSI PATIENCE MOHLAHLO
A dissertation submitted in partial fulfilment of the requirements for the
degree
of
MASTER OF SCIENCE
in
AQUATIC HEALTH
in the
FACULTY OF SCIENCE
at the
UNIVERSITY OF JOHANNESBURG
SUPERVISOR: DR AMINA NEL
JANUARY 2019
2
TABLE OF CONTENTS
TABLE OF CONTENTS ........................................................................................................................... 2
LIST OF FIGURES .................................................................................................................................... 6
LIST OF TABLES ...................................................................................................................................... 8
ABBREVIATIONS ................................................................................................................................... 10
ACKNOWLEDGEMENTS ...................................................................................................................... 12
ABSTRACT............................................................................................................................................... 13
CHAPTER 1: INTRODUCTION ............................................................................................................. 14
1.1 Background ............................................................................................................................. 14
1.2 Justification of study ............................................................................................................ 17
1.3 Hypothesis ............................................................................................................................... 19
1.4 Aim of this study .................................................................................................................... 19
1.5 Objectives of this study........................................................................................................ 20
1.6 Layout of the report ............................................................................................................... 20
CHAPTER 2: LITERATURE REVIEW ................................................................................................. 21
2.1 Introduction ............................................................................................................................. 21
2.1.1 Mining and acid mine drainage .................................................................................. 21
2.1.2 Metals produced as a result of AMD and their effects on the aquatic
environment ..................................................................................................................................... 25
2.1.3 Water quality parameters ............................................................................................. 28
2.2 Applicable Legislation .......................................................................................................... 30
2.2.1 Constitution of the Republic of South Africa Act No. 108 of 1996 .................... 30
2.2.2 National Environmental Management Act No. 107 of 1998 ................................. 30
2.2.3 National Water Act No. 36 of 1998 ............................................................................. 30
2.2.4 Mineral and Petroleum Resources Development Act No. 28 of 2002 (MPRDA) .. 32
2.3 Impacts of acid mine drainage ........................................................................................... 32
2.3.1 Contamination of shallow groundwater ......................................................................... 32
2.3.2 Ecological impacts .............................................................................................................. 33
2.3.3 Regional impacts on major river systems ..................................................................... 33
2.3.4 Effect of acid mine drainage on aquatic resources .............................................. 34
2.4 Acid mine drainage remediation systems ....................................................................... 35
2.5 Study area ................................................................................................................................ 36

3
2.6 The Baseline Receiving Environment .............................................................................. 40
2.7 Purpose of the study ............................................................................................................. 44
CHAPTER 3: MATERIALS AND METHODS ..................................................................................... 45
3.1 Sampling sites ........................................................................................................................ 45
3.1.1 Sampling site selection ............................................................................................... 46
3.2 Water Analysis ........................................................................................................................ 52
3.2.1 In-situ physical parameters ......................................................................................... 52
3.2.2 Acute Water Toxicity analysis .................................................................................... 54
3.3 Data analysis ........................................................................................................................... 56
3.3.1 Statistics ..................................................................................................................................... 57
CHAPTER 4: RESULTS ......................................................................................................................... 58
4.1 In-situ water quality parameters ........................................................................................ 58
4.1.1 Temperature .................................................................................................................... 58
4.1.2 pH ....................................................................................................................................... 60
4.1.3 Dissolved oxygen (%) ................................................................................................... 60
4.1.4 Dissolved oxygen (mg/L) ............................................................................................. 61
4.1.5 Electrical conductivity .................................................................................................. 61
4.2 General water quality parameters ...................................................................................... 62
4.2.1 Total Hardness ................................................................................................................ 62
4.2.2 Ortho Phosphates .......................................................................................................... 63
4.2.3 Nitrite ................................................................................................................................. 63
4.2.4 Nitrate ................................................................................................................................ 63
4.2.5 Sulphate ............................................................................................................................ 63
4.2.6 Ammonia .......................................................................................................................... 63
4.3 Metal, non-metals and metalloids analysis ..................................................................... 65
4.3.1 Aluminium ........................................................................................................................ 65
4.3.2 Iron ..................................................................................................................................... 65
4.3.3 Zinc .................................................................................................................................... 67
4.3.4 Manganese ....................................................................................................................... 67
4.3.5 Calcium ............................................................................................................................. 69
4.3.6 Copper ............................................................................................................................... 69
4.3.7 Boron ................................................................................................................................. 70
4.3.8 Nickel ................................................................................................................................. 71

4
4.3.9 Cobalt ................................................................................................................................ 73
4.3.10 Potassium ........................................................................................................................ 73
4.3.11 Magnesium ....................................................................................................................... 74
4.3.12 Sulphur ............................................................................................................................. 74
4.3.13 Strontium .......................................................................................................................... 74
4.3.14 Sodium .............................................................................................................................. 74
4.3.15 Silicon ............................................................................................................................... 74
4.4 Toxicology data ...................................................................................................................... 75
CHAPTER 5: DISCUSSION ................................................................................................................... 78
5.1 In-situ water quality parameters ........................................................................................ 78
5.1.1 Dissolve Oxygen ............................................................................................................ 78
5.1.2 Percentage Oxygen ....................................................................................................... 79
5.1.3 Temperature .................................................................................................................... 79
5.1.4 pH ....................................................................................................................................... 80
5.1.5 Electrical conductivity .................................................................................................. 80
5.2.1 Nitrate ................................................................................................................................ 81
5.2.2 Sulphate ............................................................................................................................ 81
5.2.3 Nitrite ................................................................................................................................. 82
5.2.4 Ammonia .......................................................................................................................... 82
5.2.5 Orthophosphate.............................................................................................................. 83
5.3 Metal, non-metals and metalloids analysis ..................................................................... 83
5.3.1 Aluminium ........................................................................................................................ 84
5.3.2 Iron ..................................................................................................................................... 84
5.3.3 Zinc .................................................................................................................................... 85
5.3.4 Manganese ....................................................................................................................... 85
5.3.5 Calcium ............................................................................................................................. 85
5.3.6 Cobalt ................................................................................................................................ 86
5.3.7 Copper ............................................................................................................................... 86
5.3.8 Nickel ................................................................................................................................. 86
5.3.9 Boron ................................................................................................................................. 87
5.3.10 Potassium ........................................................................................................................ 87
5.3.11 Magnesium ....................................................................................................................... 87
5.3.12 Sulphur ............................................................................................................................. 88
5
5.3.13 Strontium .......................................................................................................................... 88
5.3.14 Sodium .............................................................................................................................. 88
5.3.15 Silicon ............................................................................................................................... 89
5.4 Acute Water Toxicity Analysis and Hazard classification ........................................... 89
CHAPTER 6: CONCLUSION AND RECOMMENDATIONS ............................................................ 91
6.1 Conclusion ............................................................................................................................... 91
6.1.1 Hypothesis ....................................................................................................................... 91
6.1.2 Aim of this study ............................................................................................................ 91
6.1.3. Objectives of this study included: ............................................................................. 92
6.2. Recommendations ................................................................................................................. 94
6.2.1. An additional study that will look at the effects of AMD on the sediments
should be considered. .................................................................................................................. 94
6.2.2. Despite the somewhat positive effects of the ADM treatment plant, additional
treatment of the water was still required. ................................................................................ 94
6.2.3. Additional seepage areas along the Elsburgspruit should be identified. ....... 94
REFERENCES ......................................................................................................................................... 96
APPENDIX A .......................................................................................................................................... 109
APPENDIX B .......................................................................................................................................... 112
APPENDIX C .......................................................................................................................................... 119
6
LIST OF FIGURES
FigureError! No text of specified style in document.1-1: Witwatersrand Mining Basins
(Nepfumbada and Keet, 2011) 16
Figure 2-1: The three basins in the Witwatersrand (Liefferink, 2012. Federation for a
Sustainable Environment) 23
Figure 2-2: Major effects of AMD on a lotic system (Gray, 1997) 36
Figure 2-3: Locality map of the study area (BGIS Map Viewer Gauteng: C-Plan 3.3)
38
Figure 2-4: Image representing an overview of the central basin (DWA; 2012) 39
Figure 2-5: Map illustrating the ecosystem status in relation to the study area (BGIS Map
Viewer Gauteng: C-Plan 3.3) 41
Figure 2-6: Biomes of South Africa, Lesotho and Swaziland (Rouget et al, 2004) 42
Figure 2-7: Sensitivity map illustrating conservation status of the study site (BGIS Map
Viewer Gauteng: C-Plan 3.3) 43
Figure 3-1: Sampling sites selected for the execution of this study 46
Figure 3-2: Sampling Site 1 located within the Elsburgspruit (Source: Google maps, 2018)
48
Figure 3-3: Location of sampling site 1 (Source: Google earth) 48
Figure 3-4: Sampling Site 2 located within the Elsburgspruit at the treated AMD discharge
point (Source: Google earth, 2018) 49
Figure 3-5: Sampling site 2, AMD effluent discharge point (Source: Nomkhosi
Mohlahlo,2018) 49
Figure 3-6: Sampling Site 3 located within the Elsburgspruit, below the bridge at Brug
Street (Source: Google earth, 2018) 50

7
Figure 3-7: Sampling site 3 (Source: Nomkhosi Mohlahlo) 50
Figure 3-8: Sampling Site 4 located within the Elsparkspruit, which is a tributary to the
Elsburgspuit (Source: Google earth, 2018) 51
Figure 3-9: Location of sampling site 4 (Source: Google earth, 2018) 51
Figure 3-10: In situ water parameters were measured using a YSI probe (Source: Nomkhosi
Mohlahlo, 2018) 52
Figure 4-1: The median temperatures for Site 1 – Site 4 58
Figure 4-2: The median pH for Site 1 – Site 4. 60
Figure 4-3: The median DO% for Site 1 – Site 4. 61
Figure 4-4: The median DO for Site 1 – Site 4. 62
Figure 4-5: Aluminium concentrations (mg/L) measured at Sites 1 to 4. 66
Figure 4-6: Statistical difference in aluminium concentrations (mg/L) for Site 1- 4.
66
Figure 4-7: Iron concentration (mg/L) measured at Sites 1 to 4. 67
Figure 4-8: Zinc concentration (mg/L) measured at Sites 1 to 4. 68
Figure 4-9: Manganese concentrations (mg/L) measured at Sites 1 to 4. 69
Figure 4-10: Copper concentrations (mg/L) measured in Site 1 to 4. 70
Figure 4-11: Boron concentrations (mg/L) measured in Site 1 to 4. 71
Figure 4-12: Nickel concentrations (mg/L) measured at Site 1 to 4. 72
Figure 4-13: Statistical difference in nickel concentrations (mg/L) for Site 1- 4. 72
Figure 4-14: Cobalt concentrations (mg/L) measured at Sites 1 to 4. 73
8
LIST OF TABLES
Table 1-1: Target treated AMD discharge standards (DWA, 2012) 18
Table 3-1: Sampling sites location description and GPS coordinates 45
Table 3-2: Daphnia pulex bioassay test conditions. (Source: US EPA, 1985; 1991)
55
Table 3-3: Poecilia reticulata bioassay test condition (source: US EPA, 1985) 56
Table 3-4: A toxicity classification system for natural and wastewaters (Persoone et al.,
2003) 56
Table 4-1: In-situ water quality parameters of Sites 1 to 3 (Elsburgspruit) and Site 4
(Elsparkspruit). [ non-conformance to TWQR of the WQG/AE (DWAF, 1996)
and non-conformance to the TTAMDDS (DWA, 2012)] 59
Table 4-2: General water quality parameters of Sites 1 to 3 (Elsburgspruit) and Site 4
(Elsparkspruit) [ non-conformance to TWQR of the WQG/AE (DWAF, 1996)
non-conformance to the WWLV (DWA, 2013)]. 64
Table 4-3: A toxicity classification system for natural and wastewaters (Persoone et al.,
2003) 75
Table 4-4: Classification of Site 1 water samples in terms of hazard that maybe as a result
of the aquatic environment. 76
Table 4-5: Classification of Site 2 water samples in terms of hazard that maybe as a result
of the aquatic environment. 76
Table 4-6: Classification of Site 3 water samples in terms of hazard that maybe as a result
of the aquatic environment. 77
Table 4-7: Classification of Site 4 water samples in terms of hazard that maybe as a result
of the aquatic environment. 77
Table A1: Total Water Quality Range (TWQR) (DWAF, 1996) 109
Table A2: Target Treated Acid Mine Drainage Discharge standard (DWA, 2012) 109
9
Table A3: Wastewater Limit Values (DWA, 2013) 110
Table A4: A toxicity classification system for natural and wastewaters (Persoone et al.,
2003) 111
Table B1: In-situ water quality parameters of Sites 1 to 3 (Elsburgspruit) and Site 4
(Elsparkspruit) 112
Table B2: General water quality parameters of Sites 1 to 3 (Elsburgspruit) and Site 4
(Elsparkspruit) 113
Table B3: Metal analysis results 117
Table B4: Acute water toxicity results 118
Table C1: IBM SPSS v.25 Statistics Kruskal-Wallis test results 119

10
ABBREVIATIONS
AEV Acute Effect Value
AMD Acid mine drainage
Aq Dissolved in water
AWQG Ambient Water Quality Guidelines
CBD Central Business District
CEV Chronic Effect Value
DWAF Department of Water Affairs and Forestry
DWS Department of Water and Sanitation
ERPM East Rand Propriety Mines Ltd.
Fe2+ Aqueous ferrous ions
Fe3+ Ferric ions
FeS2 Pyrite
G Gas
H Hydrogen
H2O Dihydrogen Monoxide
ICP-MS Inductively Coupled Plasma-Mass Spectrometry
ICP-OES Inductively Coupled Plasma-Optical Emission Spectrometry
IIED International Institute for Environment & Development
L Liquid
MPRDA Mineral and Petroleum Resources Development Act 28 of 2002)
NEMA National Environmental Management Act
S Solid
SA South Africa
SANAS South African National Accreditation System
SO4' Sulphate
TTAMDDS Target Treated Acid Mine Drainage Discharged Standards

11
TWQR Target Water Quality Range
WQG Water Quality Guidelines
WQG/AE Water Quality Guide for Aquatic Ecosystems, Vol 7
YSI Yellow Springs Instrument

12
ACKNOWLEDGEMENTS
Completion of my study would have not been possible without the diligent support, commitment
and wisdom from my calm supervisor Dr Amina Nel. Thank you for carrying me through and for
believing in my ideas, thoughts and actions during the time of writing this dissertation.
Many thanks to Rand Water for funding this study and for providing the metals data. Furthermore,
I’d like to thank Rand Water scientific services for analysing the anions as well as for giving me
permission to reference their methodologies.
Many thanks to Mr Gregg Jansen van Rensburg PhD candidate at the University of Johannesburg
and Ms Samanta Stelli researcher scientist at Rand Water for assisting me with statistical
analysis.
My former colleague Mr Elmon Mbombi, thank you for assisting me with the field work.
My sincere gratitude to Mrs Gail Andrews Manager Environmental Authorisations and Compliance
at Rand Water, thank you ma’am for allowing me time off work to work on this study, Thank you
for walking this path with me, Thank you for providing an ear to listen, a thought to consider and
cautions to be mindful of along the way. I will forever be grateful to having you as my boss. You
are a true anchor.
Mr Leslie Hoy, Manager Environmental Management Services at Rand Water as well as PhD
candidate at UNISA, who also happens to be my line manager, for his intellectual input, guidance
and for his support.
To my husband Dr Gerald Mohlahlo and my daughter Kopano Mohlahlo, I wouldn’t have done
this without your support and love. Thank you for your endurance and giving me space and time
to work on this dissertation.
My sincere gratitude and love to my parents, Ms Mirriam Shili (Mom), Mr Patrick Zwane (dad) and
Mr Thulani Mbatha (step- dad) thank you for believing in me, for being pillars of my strength, and
for giving me an opportunity to make something of myself.

13
ABSTRACT
Freshwater resources in South Africa (SA) are under constant threat from pollution. Acid Mine
Drainage (AMD) is one of the major polluters resulting in a decrease in pH of water, a rise in
certain metals and sulphate concentrations, and negatively affecting water quality. Treated
effluent from an AMD treatment plant is discharged through a pipeline into the Elsburgspruit. An
AMD treatment plant was established in May 2014, in an effort to manage the acid water
emanating from old abandoned mine voids and preventing it from rising above the Environmental
Critical Level.
The project focused on assessing the physico-chemical parameters, general water quality and
chemical analysis at four selected sites as well as assessing the water toxicity of the Elsburgspruit.
As part of this study, Daphnia pulex (daphnia) and Poecilia reticulata (guppies) were used to
determine the toxicity of the water of the Elsburgspruit. Both D. pulex and P. reticulata are
internationally recognized species for the use in ecotoxicology to illustrate the acute and chronic
effects of chemicals on the aquatic environment.
Kruskal-Wallis statistical test, IBM SPSS v.25 was used to compare the data collected from the
different sampling sites. The results indicated that some of the physical parameters i.e. electrical
conductivity and pH; general water quality parameters i.e. ammonia and orthophosphates,
exceeded the Target Water Quality Range (TWQR) of the Water Quality Guidelines for the
Aquatic Environment (WQG/AE). Sampling also revealed high levels of metals such as iron, zinc,
manganese, and copper. High mortality is attributed to the physiological stress experienced by
the exposed organisms as a result of exposure to metals (Mason, 2002). High toxicity for D.
pulex and P. reticulata upstream of the Elsburgspruit was observed and can possibly be attributed
to AMD decanting from the tailings facility as well as seeping from the surrounding abandoned
shafts. Lower toxicity levels downstream as well as within the tributary stream can be attributed
to the remediation methods implemented by the ADM treatment plant.
The findings of this study indicated that although AMD is treated to a level where it is less acidic
and considered safe to be discharged into a natural water source, it is still harmful to the aquatic
life and is not suitable for human consumption. It can be concluded that despite the somewhat
positive effects of the ADM treatment plant, additional treatment of the water was still required.

14
CHAPTER 1: INTRODUCTION
1.1 Background
In South Africa (SA), water is regarded as the backbone of the country’s economy and essential
for the life on the planet (De Beer, 2005). Water is necessary mainly for industrial, agriculture,
domestic and recreational uses. South Africa is largely known as an arid country (Botha, 2013).
Growth in human population and economic development has led to an increase in water demand
and supply to the South African population (De Beer, 2005). Industrial development and the
expansion of agriculture fields requiring irrigation have increased the demand for more water (De
Beer, 2005). De Beer (2005), further stated that “South Africa is fast approaching the limits of its
available water supply, threatened in terms of both quantity and quality”. The problem is further
increased due to the fact that some parts of SA are more inclined to rain than others, resulting in
dry western regions (De Beer, 2005). Rainfall in SA is less than half of the world average (De
Beer, 2005). Van Niekerk and Seath (2011), predicted that with the increase in water demand
and the misuse of water, it can be expected that SA’s fresh water resources will be depleted in
the next twenty to thirty years.
Pollution of ground and surface water has contributed to exacerbating issues of water scarcity in
SA. Industrial effluents and acid mine drainage (AMD) are typical pollutants of ground and surface
water (Wangnick, 2002). Open cast and underground mining, mine residue deposits, metallurgical
plants and mining infrastructure are all sources of water pollution. De Beer (2005), stated that
large volumes of water is contaminated by the coal mining industry which is the largest contributor
to the South African economy. Van Niekerk and Seath (2011), also stated that regional salination
and acidification are often encountered in local streams as a result of occasional discharge of
industrial effluents such as sewage as well AMD. De Beer (2005), defined AMD as an effluent
highly concentrated in heavy metals, sulphate, and iron and with a low pH. Naturally-occurring
bacteria accelerate AMD production by increasing the rate of sulphide breakdown (Ziemkiewicz,
et al., 2003). Mining promotes AMD generation by exposing rock surfaces thereby increasing the
amount of rock surface that is exposed to oxygen (Holland and Witthuser, 2009). Acid mine
drainage is regarded as one of the greatest environmental problems (Ermite, 2004b).
Potential impacts of mining on the water environment are described by Ermite (2004b) as follows:
The act of mining itself;
15
Processes such as mineral beneficiation which is defined by Cabri (2002), as a process
of separating of gangue minerals from ores, resulting in production of mine residue
deposits. This results in the establishment of tailings facilities and waste rock dumps.
Often contaminated water seeps from these dumps resulting in environmental impact;
Dewatering of active mining operations for safe mining; and
Flooding of non-operational mine voids and discharge of untreated mine water.
Van Zyl et al. (2001), stated that AMD can be regarded as the main chemical threat to surface
water and groundwater quality. Contamination of local streams by AMD and industrial effluent can
be prevented by treating mine drainage and effluents to a quality where it can be re-used as
process water. This water can be treated to an under-saturated and neutral state suitable for
discharge into local streams and in compliance with the environmental legislation and other set
requirements (Van Zyl et al., 2001).
The effects of AMD are described by Jennings et al. (2008), as complex and includes the
following:
AMD has the potential to change the pH in water;
AMD has the potential to mobilize toxic substances such as metals;
The formation of ferric hydroxide precipitates that discolour water and have similar effects
on the water as suspended materials; and
AMD has the potential to mobilize sulphates.
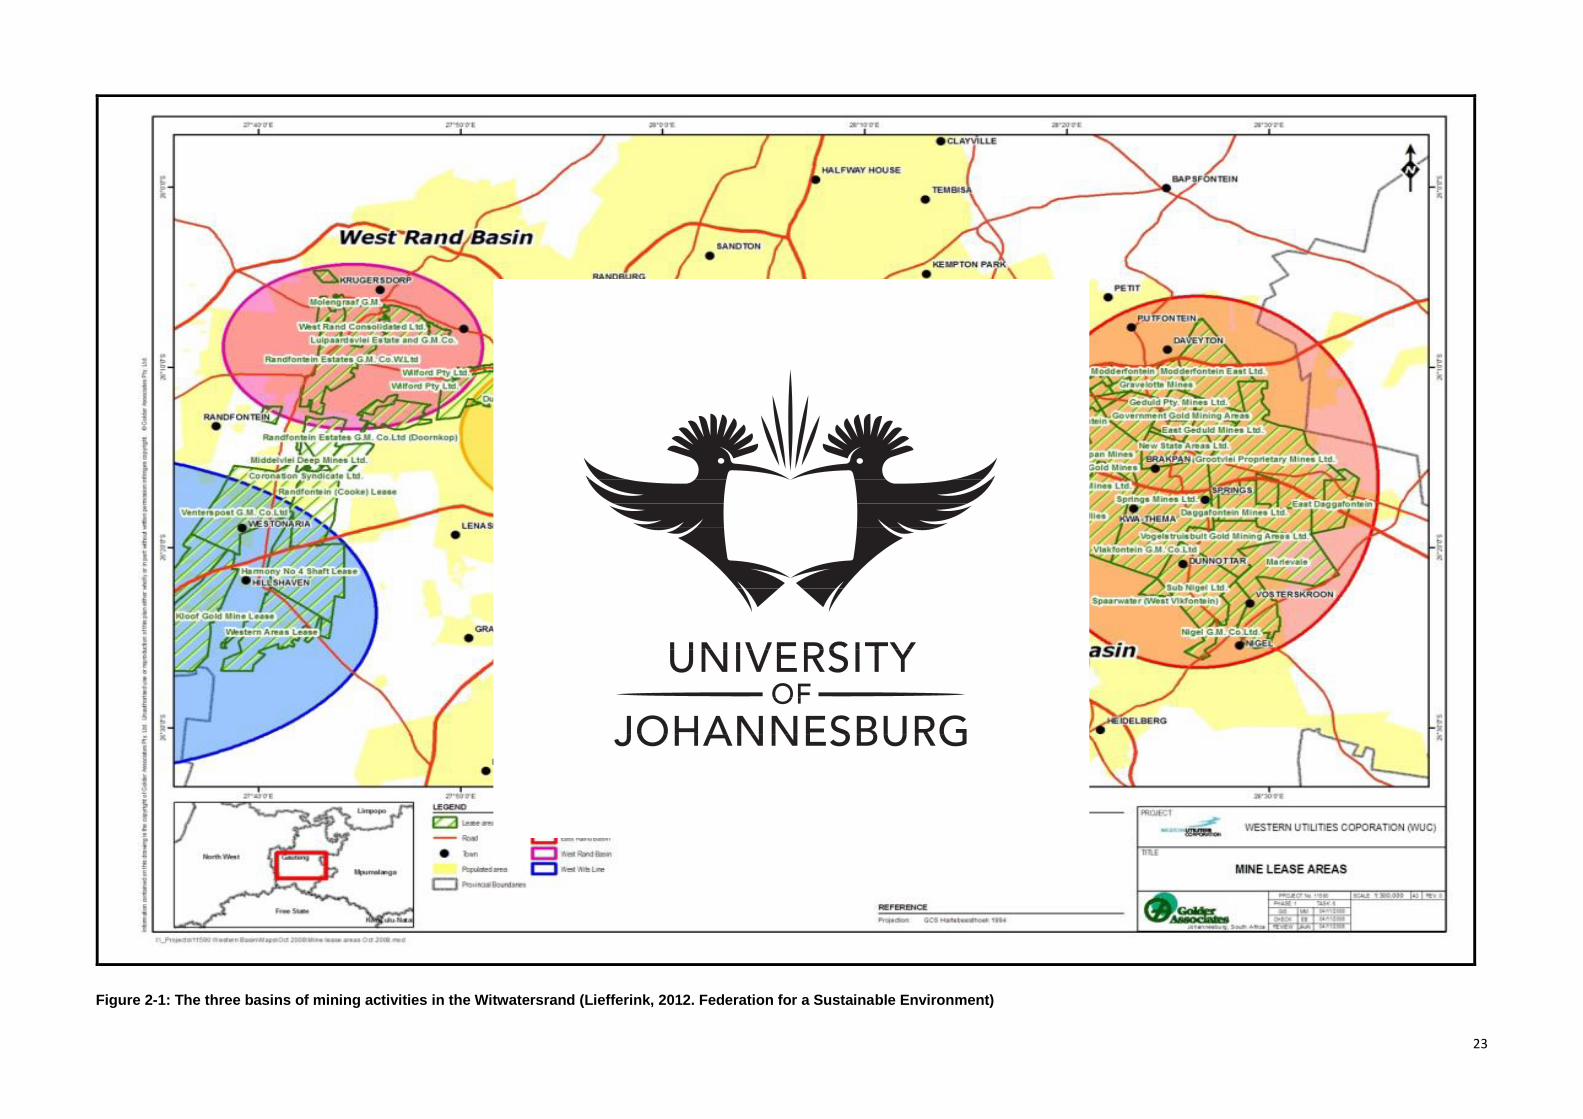
The mining of gold deposits on the Witwatersrand lead to the development of large underground
voids interconnecting the mines, which are referred to as Basins (Nepfumbada and Keet, 2011).
There are four underground Basins, i.e. the Eastern Basin (stretching from Nigel to Germiston),
Central Basin (Germiston to Roodepoort, including Johannesburg), the Western Basin
(Krugersdorp to Randfontein), as shown in Figure 1-1, as well as the Far Western Basin (Western
area to Carletonville) (Nepfumbada and Keet, 2011).

16
Figure 1-1: Witwatersrand Mining Basins (Nepfumbada and Keet, 2011)

17
1.2 Justification of study
The mining industry contributes significantly to SA’s economy and ensures that SA’s position in
the global market is maintained. A large number of mining operations around the central basin in
Gauteng have reached the operational life span (Bozeman and Montana, 2008). This resulted in
termination of mining operations and abandoning of the underground mine shafts and open pits.
Mining activities in general have resulted in environmental impacts such as water pollution. During
the operational phase of a mine, it is required that water which enters the mine work area be
pumped out to allow for safe mining conditions Mineral and Petroleum Resources Development
Act (MPRDA) 2002. Abandoning of previously mined out shafts have resulted in the accumulation
of water within mine voids. This in the end resulted in the formation of AMD. Dissolved iron and
sulphuric acid are part of the end products of AMD. As a result, water from vacant mine shafts is
decanting into the surface areas that contributes to ground and surface water pollution which
might have a detrimental effect on humans and the environment (Bozeman and Montana, 2008,
CGS, 2010).
The East Rand Propriety Mines Ltd. (ERPM) has been assisting in pumping acid water from
abandoned shafts since 1977 (DWA, 2012). In 2008 however, ERPM ceased the pumping
activities due to human fatalities from inadequate ventilation at the pump station, and the voids
began to fill. As part of a short term intervention, the Department of Water and Sanitation (DWS)
constructed an AMD treatment plant situated 1.8 km east of the Germiston’s Central Business
District (CBD), western portion of the ERPM Shaft area. The treatment plant came into operation
in May 2014 and has the capacity to treat 84 ML of AMD per day (DWA, 2012). The central basin
treatment plant is currently treating 72 ML of AMD per day. It uses limestone treatment for
neutralization of acid. The AMD undergoes an additional lime treatment for removal of heavy
metals and iron (II). The treated effluent is discharged into the Elsburgspruit and the quality of the
water is expected to be comparable to values given in Table 1-1.
According to Table 1-1, the discharge is expected to have high sulphate content as well as traces
of metals which may have an effect on the Elsburgspruit. According to the Water Report compiled
by DWS in 09 May 2012, the treated effluent should not be harmful to end users. This report is
only taking into consideration effects on humans and neglecting the receiving environment, such
aquatic health, biodiversity and water quality of the Elsburgspruit. No assessment has been
conducted to determine the effects of effluent discharge on the aquatic health and water quality
of Elsburgspruit system.

18
Table 1-1: Target treated AMD discharge standards (DWA, 2012)
Water Quality
Variable
Average water quality at
Central basin
High Density Sludge (HDS) plant
effluent standard
Sulphates (mg/L) 4344 2400
pH 4 6-9
Iron (mg/L) 768 <1
Aluminium (mg/L) 35 <1
Manganese (mg/L) 127 <3
Uranium (mg/L) 0.2 0.05
Although the AMD treatment plant treats acid water to a level where it is no longer acidic and
where some of the dissolved salts and metals are removed, it is still not suitable for human
consumption, but can possibly be used for industrial purposes. It is not known whether the
discharge of the treated water into the Elsburgspruit affects water quality downstream and the
exact effect of this will be highlighted by the proposed study. During the original operation, the
mines were treating and discharging water in a similar fashion to what is being done now. The
Elsburgspruit is expected to be affected in a similar way to what was the case when the mines
were still in operation.
Meays and Nordin (2013), described sulphate as a contaminant that is potentially harmful to the
aquatic ecosystems. Conley et al. (2010), indicated that many aquatic invertebrates, algae and
fish are unable to osmoregulate sulphate due to the fact that it’s a large and bulky molecule. High
concentrations of sulphate have the potential to increase phosphorus (P) availability and
susceptibility to eutrophication. It also causes mercury’s mobilization that has an indirect effect on
the aquatic ecosystem as indicated in the Ambient Water Quality Guidelines (AWQG) for sulphate
(Meays and Nordin, 2013).
The Water Quality Guide for Aquatic Ecosystems, Vol 7 (WQG/AE) (DWAF, 1996), indicates that
aquatic organisms are unable to withstand high concentrations of bio-available aluminium. How
the species responds to toxicity depends on the pH and availability of calcium in the water as well
as the life stage of the organism (Meays and Nordin, 2013).

19
Meays and Nordin (2013), further confirmed that pH usually ranges between 4 and 11 for surface
water, while Aluminium is more toxic in waters with a pH range of 4.4 - 5.4. Fresh water has a pH
that is more or less neutral, varying between 6 and 8, and is well buffered (McCarthy, 2010).
According to the WQG/AE (DWAF, 1996), the freshwater community structures change upon a
decrease in pH. This also results in the organisms which are able to live under acidic conditions,
replacing the less tolerant organisms. Acidic freshwater demonstrates a diverse micro fauna and
flora living on solid surface with a low overall production compared with less acidic streams
(Meays and Nordin, 2013). Heyl (2007), provided evidence that when the water quality
deteriorates, the number of aquatic macro-invertebrates found in the water, will decrease
proportionally.
Metals have negative effects on the aquatic organisms and species diversity (Greig et al., 2010).
Greig et al. (2010), further revealed that zinc, manganese, aluminium, iron and nickel are harmful
to fish communities resulting in variation in species richness. Greig et al. (2010), also confirmed
that iron hydroxide in AMD settles out of solution and forms a layer on the riverbed. This layer is
impenetrable to invertebrates present in the stream sediment (Durand, 2012). Iron hydroxides
and oxy hydroxides destroy habitats, reduce the availability of clean gravel used for spawning,
and reduce the availability of fish food items i.e. benthic macroinvertebrates (Jennings et al., 2008;
Hallberg, 2010). Ingestion of the polluted water results in the absorption of metals by organisms
(Durand, 2012). The proposed study will assist in highlighting the effects of the effluent
discharged from the central basin acid mine drainage treatment plant on the aquatic health of the
Elsburgspruit.
1.3 Hypothesis
The water quality of the Elsburgspruit is negatively affected by effluent discharged from the AMD
treatment plant located in the Germiston area.
1.4 Aim of this study
The aim of this study is:
To evaluate the effects of effluent discharge from an AMD treatment plant on the aquatic health
of the Elsburgspruit, through investigating the water quality of the Elsburgspruit.

20
1.5 Objectives of this study
To assess the water quality of the Elsburgspruit by focusing on in-situ and general water
quality parameters as well as metal analysis.
To compare the water quality parameter results to different water quality guidelines.
To assess the water toxicity by using Daphnia pulex and Poecilia reticulata for acute
screening water toxicity analysis.
To evaluate the toxicity of the water and possible influence of the effluent from the AMD
treatment plant based on the water toxicity analysis and water quality parameters.
1.6 Layout of the dissertation
This report is laid out as follows:
Chapter 1: Describes the background information of the study site. Most of the information on this
chapter is desktop. In addition, this chapter discusses the need and desirability of this study.
Chapter 2: Review of literature applicable to this study. The literature review focuses on the
impacts of AMD on the receiving water environment, its formation and occurrence. This chapter
also extensively looks at legislation applicable to water governance and environmental
management. The main environmental issues affecting the water quality in SA are introduced.
The importance of water is discussed. Biophysical properties of the site such as climate, geology,
fauna flora, as well as land uses are discussed. The flow of the Elsburgspruit is also discussed.
Chapter 3: Methods and materials employed in the execution of this study are discussed.
Locations of the sampling sites that were selected for this study, are discussed.
Chapter 4: Discussion of the results that were obtained from conducting the practical work.
Physical, chemical, and toxicological constituents were compared to various guidelines.
Chapter 5: Discussion of the findings of this study.
Chapter 6: Conclusion. This chapter shall entail recommendations.

21
CHAPTER 2: LITERATURE REVIEW
2.1 Introduction
Worldwide acid mine drainage (AMD) is regarded as a very costly and a significant environmental
impact emanating from the mining industries (Coetzee et al., 2010). The effects of mining activities
are a global problem emerging from abandoned mine shafts (Naidoo, 2017). These effects are
seen long after the mining operations have ceased and are mostly noticeable in the surface and
ground water (Naidoo, 2017). Naidoo (2017), defined abandoned mines as “sites where advanced
exploration, mining or mine production ceased without rehabilitation being implemented at all or
completed”. The IIED (2002), stated that abandoned mine sites are found in all regions with a
history of mining. Naidoo (2017); further stated that it has become a norm to abandon the mine
sites once the minerals have been depleted. During construction, operation and decommissioning
phases; the mining companies must ensure that water resources are protected even at times of
reduced mineral production (Naidoo, 2017). Before the late twentieth century, environmental
impacts arising from the abandoned mine site were not given attention, therefore environmental
regulations pertaining to mining were not effectively implemented (Naidoo, 2017). As a result, it
could not be predicted that these impacts will result in serious effects such as AMD in the future.
South Africa (SA) is well known for its richness in various minerals. These minerals are the largest
contributors to the economy of SA and the international market (Akcil and Koldas, 2006).
However, SA is a water-stressed country with between 500 m3 and 1000 m3 water available per
person (Ashton, 2002). South Africa relies a lot on the neighbouring countries such as Lesotho
for water supply. The ground water in SA is not sufficient to offer relief in this regard (Scholes,
2001). In addition, SA’s surface water is heavily committed for use (Scholes, 2001). Freshwater
resources in SA are under constant threat from pollution. Acid mine drainage is one of the major
polluters resulting in a decrease in pH of the water, a rise in metals and sulphate concentrations,
negatively affecting the water quality. Algae and bacteria are primary producers which are usually
the first to respond to a decrease in the pH, as well as a rise in metals and sulphate
concentrations.
2.1.1 Mining and acid mine drainage
In the year 1886, immense gold resources were discovered in SA resulting in extensive mining
activities specific within the Johannesburg area (Adler et al., 2007). According to Botha (2013),
the current mining activities within the greater Johannesburg, is divided into three underground
22
Basins, i.e. the Eastern Basin (stretching from Nigel to Germiston), Central basin (Germiston to
Roodepoort, including Johannesburg), the Western Basin (Krugersdorp to Randfontein) (Figure
2-1). Mining industries embarked on the extraction of the gold resources which has contributed to
the sustenance and maintenance of SA’s economic position in the global market. South Africa is
in position of highly diversified, profitable and plentiful minerals with the Far West Rand holding
the largest gold deposit in the world (Adler et al., 2007). This has resulted in the government
granting privileges to the mining industries allowing them to maximize profits (Adler et al., 2007).
Currently, SA’s constitution encompasses objectives of social justice and sustainability (Adler et
al., 2007). In the early days of the gold economy, mining was simply about extraction of the
minerals with no consideration given to the long-term adverse effects on the environment (Adler
et al., 2007).
For decades, the mining based economy was supported by water policies which looked at the
water being used by mines separately to water being used by other industries (Adler et al., 2007).
The extraction of the mineral deposits required application of physically dangerous and technically
complex processes, due to the deposits occurring at great depths and in areas characterized by
dolomitic aquifers (Adler et al., 2007). The mining industry had to establish stable systems that
would be able to remove groundwater from the shafts that were sunken. This resulted in
compromising of ground stability and lowering of the natural level of the water table. In addition,
exposure of groundwater to pyrite and minerals resulted in the formation of AMD and
contamination of water by metals (Adler et al., 2007). Bozeman and Montana (2008), defined
AMD as a “product generated when sulphide bearing minerals, often in the form of pyrite (which
is iron-sulphide or FeS2 found inter alia in reefs mined for gold), are exposed to oxygen and water”.
Stumm and Morgan (1996), described the process of AMD in the following four steps (Equations):
Equation 1 Oxidation of pyrite and solubilisation of ferrous Fe
2FeS2(s) + 7O2(g) + 2H2O(l) → 2Fe2+(aq) + 4SO4 2- (aq) + 4H+ (aq)
Equation 1: The weathering of pyrite which includes the oxidation of the sulphide mineral into
dissolved iron (~e"), sulphate (SO4') and hydrogen (H) by oxygen. The initial reaction entails
reaction of pyrite with water and oxygen to form ferrous ions. Ferrous ions and acidic hydrogen
ions are released into the waters that run off through the mine tunnels or refuse piles (Stumm and
Morgan, 1996).
23
Figure 2-1: The three basins of mining activities in the Witwatersrand (Liefferink, 2012. Federation for a Sustainable Environment)

24
Equation 2 Oxidation of ferrous to ferric Fe
4Fe2+(aq) + O2(g) + 4H+ (aq) → 4Fe3+(aq) + 2H2O(l)
Aqueous ferrous ions (Fe2+) react with oxygen and acidic hydrogen ions to form ferric ions (Fe3+)
and water. Often this reaction doesn't occur to any great extent underground because of limited
available oxygen. The conversion of ferrous iron to ferric iron consumes one mole of acidity. The
reaction rate is pH dependent with the reaction proceeding slowly under acidic conditions (pH 2-
3) with no bacteria present and several orders of magnitude faster at pH values near 5. This
reaction is referred to as the rate determining step in the overall acid-generating sequence.
Certain bacteria increase the rate of oxidation from ferrous to ferric iron. The pH of the water will
decrease because this reaction generates two moles of acidity for each mole of pyrite oxidized.
Dissolved, ferrous iron (Fe2' and sulphate ions) are colourless. The water may actually look crystal
clear. In some AMD discharges, this is the condition of the water as it makes its way to the surface.
Metals remain in solution below ground due to the lack of oxygen. When the water emerges from
the mine or borehole, it reacts with atmospheric oxygen and deposits iron, manganese and
aluminium on rocks and the streambed. If the surrounding environment is sufficiently oxidising
(dependent on O2 concentration, pH antibacterial activity), much of the ferrous iron will oxidise to
ferric iron (Stumm and Morgan, 1996).
Equation 3 Direct oxidation of pyrite by ferric Fe (pH<3)
FeS2(s) + 14Fe3+(aq) + 8H2O(l) → 15Fe2+(aq) + 2SO4 2- (aq) + 16H+ (aq)
The third step involves the hydrolysis of ferric iron with water to form the solid ferric hydroxide
(ferrihydrate) and the release of additional acidity (Stumm and Morgan, 1996).
Equation 4 Precipitation of ferric hydroxide (“yellow boy”) (pH>3)
Fe3+(aq) + 3H2O(l) → Fe(OH)3(s) + 3H+
The iron cation can then either react with water to produce iron hydroxide (Fe(OH)3) and more H+
as in equation (4) (Stumm and Morgan, 1996).

25
2.1.2 Metals produced as a result of AMD and their effects on the aquatic
environment
2.1.2.1 Zinc
Zinc is a common polluter of freshwater. According to Hale (1977), zinc is one of the metals that
are rare in nature and upon existence this metal is usually in sulphide form. Availability of zinc in
freshwaters is mainly due to discharge of industrial, mining and domestic effluents (Adendorff,
1997). Toxicity of zinc is affected by environmental factors such as pH, temperature, dissolved
oxygen, and the availability of organic and inorganic ligands (Hellawell, 1986). Taylor et al. (1982),
described zinc as an essential trace element of physiological importance for aquatic organisms
but toxic at high concentrations. Luoma (1983), explained that bioaccumulation in organisms
depends on the rate of feeding, the kind of food being fed, the concentrations of zinc as well as
the physico-chemical factors affecting the chemical form of metals in water.
2.1.2.2 Aluminium
Aluminium is a trace metal that is toxic and not essential to any organism (Hale, 1977). Solubility
of aluminium depends largely on pH, whereas its toxicity is largely dependent on the chemical
species (Dallas and Day, 1993). Acid-stressed ecosystems are often associated with a rise in the
concentrations of aluminium (Adendorff, 1997). In various acidic waters, aluminium species and
their salts form buffering systems (Hale, 1977). These carbonate/bicarbonate buffering systems
become non-operational under acidic conditions, increasing the pH values of the acidified water
(Hill, 1997). Furthermore, Dallas and Day (1993) indicated that the dissolution of aluminium has
the potential to regulate the low pH that is seen in acidic water. The effects of aluminium can be
neutralized through the addition of a significant amount of base to acidified water (Dallas and Day,
1993). According to DWAF (1996), aluminium occurs as available, soluble and toxic hexahydrate
species in acidic conditions (pH 4). At pH 4.5 – 6.5, aluminium occurs as partially soluble and
as hydroxy and polyhydroxo complexes. Under alkaline conditions (pH 6.5 and above), aluminium
occurs as a soluble biological hydroxide that is unavailable (DWAF, 1996).
2.1.2.3 Copper
Dallas and Day (1993), defined copper as a micronutrient that occurs naturally in waters. The
United States Environmental Protection Agency (US EPA) (2012f), regards copper as potentially
hazardous and as an important element in the cytochrome oxidase and other reduction oxidation
reactions. The occurrence of copper in the natural environment can be attributed to dissolving of

26
copper minerals as well as the weathering processes (Hill, 1997). Anthropogenic factors
contribute to about 33 - 60% of copper input into the aquatic environment (Hale, 1977). Availability
of copper as cuprous ions makes it soluble in water while metallic copper is insoluble (Hill, 1997).
More so, copper is said to be more soluble in acidic waters, and precipitates as copper hydroxides
at pH values above 6.5 (Hale, 1977). Copper toxicity is highly influenced by conditions of the
water quality. Toxicity of copper is said to increase when the hardness of water and dissolved
oxygen decreases, while it decreases as alkalinity increases (when agents such as amino acids,
suspended solids and humic acids are present) (Hill, 1997). At an alkaline pH, sediment easily
absorb and precipitate copper, which determines the copper’s abiotic fate in aquatic environments
(Taylor et al., 1982).
2.1.2.4 Iron
The geology of an area determines the quantity of iron present in natural waters. Iron may be
available in two states in water namely oxidized (Ferric, Fe3+) and reduced (ferrous, Fe2+) (Adler
et al., 2007). Iron toxicity is largely dependent on the state in which it is available. Availability of
iron in high concentrations increases its toxicity and iron has potential to inhibit various enzymes,
therefore vertebrates cannot easily absorb iron through their gastro-intestinal tract (Hill, 1997).
Hill (1997), further stated that iron is regarded a non-critical element due to its bioavailability, as
well as limited toxicity. When metamorphic and sedimentary rocks, and sulphide ores (pyrite,
FeS2) undergo weathering, the resulting iron is released naturally into the receiving environment
(Hill, 1997). Acid mine drainage also results in the release of iron into the natural environment.
Hill (1997), confirmed that contamination of streams by AMD, results in a decrease in pH of the
watercourse affected. The oxidation rate is slow in AMD affected streams, however, pH of the
water in the affected stream increases as well as the oxidation rate (Adler et al., 2007).
Precipitation of ferric oxide is the result, and the affected water becomes oxygen deficient.
Furthermore, it is believed that, under anaerobic conditions, ferrous iron predominates while ferric
iron becomes insurbodinate. (Hill, 1997).
2.1.2.5 Manganese
Both animal and plant life depend on manganese as a micronutrient. According to Pulles et al.
(1996), manganese is toxic at high concentrations, resulting in a disturbance in the formation of
dopamine, disturbing the central nervous system of animals. High concentrations of manganese
are usually encountered in AMD affected streams. Hill (1997), stated that salts and minerals are
the sources of manganese in aquatic environments, while the terrestrial environment relies on
27
metamorphic and sedimentary rocks, sediment and soil as the natural sources of manganese.
Furthermore, changes in the reduction oxidation reactions, organic matter, pH, and dissolved
oxygen, have potential to influence dissolved manganese concentration Pulles et al. (1996). At
low pH as well as low oxidation reduction potential, manganese exists as manganous (Mn2+)
which is a soluble form, and is oxidized to manganic (Mn4+) which is insoluble (Hill, 1997).
2.1.2.6 Nickel
Dallas and Day (1993), defined nickel as a toxic element that has potential to inhibit cytochrome
oxidase and other enzymes in the citric acid cycle of animals. Furthermore, Dallas and Day (1993)
indicated that nickel has a potential to bind to proteins such as mathallothionein. The effects of
nickel salts are carcinogenic and mutagenic (Dallas and Day, 1993). At pH less than 6.5, nickel
tends to be soluble, but insoluble hydroxides at pH greater than 6.7 (Dallas and Day; 1993).
Nickel presents itself in ionic forms in most fresh water (Dallas and Day; 1993). Nickel can also
form stable organic complexes, which are able to adsorb onto clay particles (Dallas and Day,
1993). The most toxic form of nickel is nickel carbonyl [Ni (CO)4], which is both lipid and water
soluble.
2.1.2.7 Sulphate
Sulphate ion (SO42-) is a form in which sulphur occurs in water. Dallas and Day (1993), described
sulphur dioxide as an originator of sulphate, which constitute a large part of acid precipitation.
Dallas and Day (1993), further stated that at moderate concentrations, sulphates are nontoxic to
aquatic organisms. Even though sulphuric acid is known as a strong acid with pH reducing
properties, its effects can be devastating to aquatic ecosystems (Dallas and Day, 1993). A major
decline in pH and a significant increase in sulphate levels can be experienced in poorly buffered
rivers (Dallas and Day, 1993).
2.1.2.8 Total Dissolved Salts
The total dissolved solids (TDS) in water consist of inorganic salts and dissolved materials (Dallas
and Day, 1993). In natural waters, salts are chemical compounds comprised of anions such as
carbonates, chlorides, sulphates, and nitrates (primarily in ground water), and cations such as
potassium (K), magnesium (Mg), calcium (Ca), and sodium (Na). In ambient conditions, these
compounds are present in concentrations that create a balanced solution (Dallas and Day, 1993).
If there are additional inputs of dissolved solids to the system, the balance is altered and

28
detrimental effects may be seen (Dallas and Day, 1993). Inputs include both natural and
anthropogenic source (Dallas and Day, 1993).
2.1.3 Water quality parameters
Pollution has been identified as one of the many pressures affecting freshwater systems and
resources in SA (Younger et. al, 2002). Mine water is a growing concern in water quality
management. The overall effect of mine water is the deterioration in water quality in many surface
water sources that may impact on the domestic, industrial and agricultural users (Wamsley and
Mazury, 1999). Discussed below are the water quality parameters that can be used to determine
the water quality of mine water.
2.1.3.1 pH
pH is described by Hill (1997), as a measure of ion activity in a water sample. In addition, Hill
(1997), continued to describe pure water as water with no solutes and at a temperature of 24C,
this water will demonstrate a pH of 7.0. Hill (1997), explained that this is an indication that water
is electrochemically neutral with an equal number of H and OH- ions. An increase in the hydrogen
ion [H+] concentration results in a decrease in pH making the solution more acidic (Hill, 1997). A
decrease in the hydrogen ion [H+] concentration, results in an increase in pH making the solution
more basic (Hill, 1997). Factors such as biological activity, temperature as well as the
concentration of organic and inorganic ions, affect pH (Pulles et al., 1996). In turn, pH has the
potential to affect the toxicity and availability of trace metals, ammonium and selenium (Hill, 1997).
2.1.3.2 Conductivity
Electrical conductivity indicates the presence of ions within water resulting from saline water and
leaching (Dallas and Day, 1993). It can also indicate industrial discharges. The removal of
vegetation and conversion into monocultures may cause run-off and thus decrease recharge
during drier period (Dallas and Day, 1993). Hence, saline intrusion may go upstream and this may
be indicated by higher conductivity (Dallas and Day, 1993).

29
2.1.3.3 Dissolved oxygen
Oxygen, although poorly soluble in water, is fundamental to aquatic life. Without free dissolved
oxygen, streams and lakes become uninhabitable to aerobic organisms, including fish and most
invertebrates (Dallas and Day, 1993). Dissolved oxygen is inversely proportional to temperature,
and the maximum amount of oxygen that can be dissolved in water at 0°C is 14.6 mg/L (Dallas
and Day, 1993).
2.1.3.4 Turbidity
Turbidity may be due to organic and/or inorganic constituents in water (Dallas and Day, 1993).
Organic particulates may harbour microorganisms. Turbid conditions may increase the possibility
for waterborne diseases (Mitsch and Wise, 1998). Inorganic constituents have no notable health
effects. The series of turbidity-induced changes that can occur in a water body may change the
composition of an aquatic community (Mitsch and Wise, 1998). According to Dallas and Day
(1993), turbidity due to a large volume of suspended sediment, will reduce light penetration,
thereby suppressing photosynthetic activity of phytoplankton, algae, and macrophytes, especially
those furthest from the surface. If turbidity is largely due to algae, light will not penetrate very far
into the water, and primary production will be limited to the uppermost layers of water (Dallas and
Day, 1993).
According to Dallas and Day (1993), if turbidity is largely due to organic particles, dissolved
oxygen depletion may occur in the water body. The excess nutrients available will encourage
microbial breakdown, a process that requires dissolved oxygen (Dallas and Day, 1993). In
addition, excess nutrients may result in algal growth. Although photosynthetic by day, algae
respire at night, using valuable dissolved oxygen (Dallas and Day, 1993). Fish kills often result
from extensive oxygen depletion (Dallas and Day, 1993).
2.1.3.5 Temperature
Temperature can exert great control over aquatic communities. If the overall water body
temperature of a system is altered, an aquatic community shift can be expected. In water above
30C, a suppression of all benthic organisms can be expected. Also, different plankton groups
will flourish under different temperatures. For example, diatoms dominate at 20 - 25 °C, green
algae dominate at 30 - 35 °C, and cyanobacteria dominate above 35 °C (Dallas and Day, 1993).
In addition, should temperatures in any water body be high, the solubility and toxicity of dissolved
30
metals in solution, e.g. cyanide and zinc will be elevated; in addition to this the metabolic oxygen
demand of aquatic species will become elevated (Botha; 2013).
2.2 Applicable Legislation
2.2.1 Constitution of the Republic of South Africa Act No. 108 of 1996
Section 24 of the Constitution of the Republic of South Africa (RSA) safeguards the environment,
the health and well-being of people (CRSA, 1996). This section 24(a) gives every citizen of SA
the right to an environment that is not harmful to human health or well-being and to environmental
protection for the benefit of present and future generations. According to section 24(b), all citizens
of SA have an obligation to promote conservation, prevent pollution, promote sustainable
development, and use natural resources including water and mineral resources in an
economically justifiable way (MPRDA, 2002).
The Constitution of the RSA (1996), has played a role in promoting sustainability situations where
social, ecological and developmental issues are considered to be equally important. In the past,
Department of Water Affairs and Forestry (DWAF) now referred to as the Department of Water
and Sanitation (DWS), was seen to be mainly focused on purification and utilisation of water. The
replacement of the Water Act No.54 of 1956, with the new National Water Act (NWA) No 36 of
1998, sores a change of thinking. The new act went from just protecting water as a commodity to
protecting water as an intricate resource with related aquatic ecosystems. The ecosystems
protection in turn contributes to the protection of the water resource. It becomes more a self-
governing body.
2.2.2 National Environmental Management Act No. 107 of 1998
According to the National Environmental Management Act (NEMA), Act 107 of 1998, it is every
citizen’s duty to prevent pollution through application of the NEMA principles.
2.2.3 National Water Act No. 36 of 1998
The provisions of the NWA (1998) are complementary to those of NEMA (1998) and must be
considered, since AMD causes severe water pollution. The NWA (1998), contains various
provisions related to water quality and the protection of water resources; specifically, a host of

31
liability provisions which would apply to mines in the context of AMD. Of these, section 19, which
is entitled "Prevention and remedying effects of pollution", is arguably the most important. Section
19 states:
“19 (1) An owner of land, a person in control of land or a person who occupies or uses the land
on which-
(a) any activity or process is or was performed or undertaken; or
(b) any other situation exists, which causes, has caused or is likely to cause pollution of a
water resource, must take all reasonable measures to prevent any such pollution from
occurring, continuing or recurring.”
The South African National Water Policy of 1996 and the NWA (1998) encourage the protection
of aquatic ecosystem from cultural eutrophication. The objective of these two legislations is to
achieve sustainability in terms of economic and social benefits. A balance has not yet been
achieved between achieving economic development and protecting the aquatic ecosystems. The
allocation of water is administered by the NWA (1998), through regulation of water use activities
and the issuance of water use licenses.
The DWS has implemented the reserve determination which aims at protecting the structure and
function of ecosystems as well as the basic human needs ensuring ecologically sustainable.
According to the NWA (1998), the reserve is defined as “the quality and quantity of water required
to satisfy the basic human needs, and to protect the aquatic ecosystem, in order to secure
ecologically sustainable development and use of relevant water resource”. Implementation of
reserve determination allows for freshwater supply, in turn the reserves are available to enable
the estuaries to perform their ecological functions and in the process maintain their integrity.
The DWS has developed environmental water requirements aimed at protecting freshwater
resources by setting suitable water quality and quantity standards that needs to be adhered to;
also by making sure that a suitable level of habitat as well as biotic integrity are maintained.
Implementation of surveillance and monitoring of freshwater resources and waterbodies or
watercourses into which waste is being discharged, are being monitored through a river health
monitoring programme that was established in 1996 by the DWS to measure the health of
selected rivers and avoiding issues such as eutrophication. Water quality and hydrological
monitoring points have been identified throughout the country. According to section 21 of the
NWA (1998), discharging water containing waste into water resources require a permit as well as
continuous monitoring of the discharge by the person undertaking the activity. This is done in
order to meet standards set out in the discharge permit.
32
A range of institutions undertook water quality monitoring and including water boards and national
governments (DWA, 2012). Polluters are issued out with a directive in terms of the NEMA (1998)
and the NWA (1998) to rectify and remedy impacts of their activities on the respective
environment. In instances where the polluter is not compliant with the directive by remedying the
situation, the legislation allows for the department to clean up the pollution and recover the costs
from the polluter.
The DWS has taken a decision not to issue any water use licenses in water stressed catchments.
No further allocation of water is being authorised. Department of Water and Sanitation is currently
in a process of developing a process of compulsory licencing and reallocation of water in stressed
catchments. The objective of this exercise is to meet the ecological requirements of water
resources and equity needs. National government is instructed to make sure that aquatic
ecosystems are protected and water use is sustainable which shall be achieved through
implementing the reserve.
2.2.4 Mineral and Petroleum Resources Development Act No. 28 of 2002 (MPRDA)
The main objective of the MPRDA (2002), is to make provision for equitable access to and
sustainable development of the nation’s mineral and petroleum resources; and to provide for
matters connected therewith. Mineral and Petroleum Resources Development Act No. 28 of 2002,
primarily aims to regulate access to and the beneficial exploitation and use of mineral resources.
The MPRDA (2002), also contains liability provisions which are relevant in the AMD context.
Section 38(1) (d) determines that a mine must "as far as it is reasonably practicable, rehabilitate
the environment affected by the prospecting or mining operations to its natural or predetermined
state or to a land use which conforms to the generally accepted principle of sustainable
development". A mine is also "responsible for any environmental damage, pollution or ecological
degradation as a result of his or her [sic] reconnaissance prospecting or mining operations and
which may occur inside and outside the boundaries of the area to which such right, permit or
permission relates".
2.3 Impacts of acid mine drainage
2.3.1 Contamination of shallow groundwater
Acid Mine Drainage within mine voids does not only contaminate surface water but it has potential
to seep into groundwater. This is made possible by ground water conduits which allow for the flow
of ground water down a gradient. This is mostly seen in areas with dolomitic aquifers adjacent to

33
mines within the western and eastern basins. Hobbs and Cobbing (2007), explained that dolomitic
aquifers of the western basins are found down gradient of the mining operations, and the Cradle
of Humankind World Heritage site is dependent on these aquifers for provision of clean water.
According to Lin and Hansen (2010); the dolomitic aquifers located at the south of Boksburg,
which is the Central basin, are vulnerable to an increase in the level of water.
2.3.2 Ecological impacts
Coetzee et al. (2008b), assessed the impacts of water that decanted into the Tweelopiespruit,
from a mine void in the western basin. Botha (2013), described the Tweelopiespruit as a stream
that drains into Krugersdorp Game Reserve. Biomonitoring conducted on the aquatic system
demonstrated that the quality of the system was deteriorating (Botha, 2013). The present
ecological state of the Tweelopiespruit changed from a Class C, which is regarded as good
ecological condition, to Class F, which is regarded as unsustainable with no ability to support
normal aquatic life (Botha, 2013). A number of faunal species died as a result of exposure and
ingestion of water with poor quality. A significant decrease in the reproduction rate of animals in
the game reserve, was also observed (Botha, 2013).
2.3.3 Regional impacts on major river systems
Acid mine drainage has major impacts on the aquatic systems of Southern Africa (Bell, et al.,
2001). Mines contribute significantly to the salinity of the Vaal and Crocodile River systems
(Durand, 2012). The DWS is currently the competent authority when it comes to management of
water quality within the Vaal System through monitoring clean water discharges emanating from
upstream sources (Braune, et al., 2008). The increase in the salinity levels requires huge
quantities of clean water inputs to be able to reach acceptable water quality levels (Qadir, et al.,
2007). According to Rademeyer et al., (2009), the sources from which the mine water originate
can be eliminated from the aquatic systems by desalination. Mine discharges have very high
concentrations of salts (Johnson and Hallberg, 2005). Discharge originating from coal mines,
waste water treatment works, and other industries needs to be properly managed prior to entry
into the stream to ensure security of water quality (Johnson and Hallberg, 2005).
34
2.3.4 Effect of acid mine drainage on aquatic resources
The overall effects of AMD are summarised in Figure 2-2. The process of mining includes
excavation, which results in the exposure of layers of soils and rocks covering a mineral being
excavated (Botha, 2013). The exposed layers may encompass traces of heavy metals such as
aluminium, iron and manganese. Gaikwad and Gupta (2008), stated that when acid water forms,
metals dissolve. Metals are the end products released into the receiving environment following
the formation of AMD (Gaikwad and Gupta, 2008). These metals become available to living
organisms (Gaikwad and Gupta, 2008). On entry of these metals into aquatic systems, organisms
such as fish, through their gills, come into contact with metals and H+ ions (Gaikwad and Gupta,
2008). This has an effect on their respiratory system resulting from chronic and acute toxicity
(Gaikwad and Gupta, 2008). Fish can also be exposed to metals through consumption of food
and sediments that are contaminated. Oxidation of sulphide, which is a product of weathering,
results in formation of iron hydroxide (Gaikwad and Gupta, 2008). Streams contaminated by AMD
are characterized by a precipitation which is red/orange in colour. Iron hydroxides have the
potential to reduce the gravels available for spawning, destroy species habitat and diminish food
items available for fish species (Gaikwad and Gupta, 2008). This is achieved through coating the
streambeds as well as stream sediments (Gaikwad and Gupta, 2008). Gaikwad and Gupta
(2008), concluded that acidic metalliferous which is a characteristic of AMD, has potential to
degrade the biological, physical and chemical properties of the stream habitat.
According to Kimmel (1988), AMD contaminated streams are characterised by high concentration
of metals which are detrimental to the health of aquatic species. As a result, streams contaminated
by AMD have a very low survival rate of living organisms. According to McFarland et al. (1997),
the pH of streams affected by AMD can be as low as 2.0 to 4.5, which is toxic to most aquatic
organisms. Fromm (1980), further stated that the low pH has an effect on reproduction and growth
of species which is related to the synthesis of proteins as well as metabolism. A pH of 6.0 is
regarded as favourable and result in successful reproduction (Fromm, 1980). However, Fromm
(1980), also stated that fish species can still survive and carry out functions at a pH ranging from
5.5 to 10.5. Understanding how pH, aluminium and calcium interact, is essential in making sense
of the effects on productivity and survival of fish (Howells et al., 1983). The gill membranes and
mucus become altered on exposure to low pH conditions. This leads to death as a result of
hypoxia. According to Fromm (1980), samonids which are raised in a hatchery, presented a
tolerance for pH 5.0. However, any pH lower than that, impaired the osmotic mechanisms as well
as haemostatic electrolytes.

35
Exposure of aquatic organisms to the acid, toxicity and the salts from the AMD, does not only
result in the death of the aquatic organisms, but iron hydroxide in the AMD has the potential to
leach out, resulting in the formation of an impenetrable layer on the river bed within the in stream
sediment (Durand, 2012). This in turn has an effect on invertebrates since these organisms are
unable to penetrate the iron hydroxide layer (Durand, 2012). Furthermore, Letendre et al., (2011)
stated that availability of oxy hydroxides and iron hydroxides in water, result in habitat destruction,
reduction of clean gravel used for spawning and a decline in the benthic macroinvertebrates which
serve as fish food items can be expected.
In a study conducted by Botha (2013), on the Tweelopiespruit, a relationship was discovered
between water quality and species diversity. Deterioration of the water quality resulted in a
proportional decrease in the number of invertebrates found in water (Botha, 2013). The discharge
of the mine effluent into the Tweelopiespruit resulted in the severe disappearance of macroscopic
life. Freshwater organisms ingest the polluted water resulting in the absorption of lead, copper,
manganese, iron, nickel and zinc (Durand, 2012).
2.4 Acid mine drainage remediation systems
Active and passive remediation technologies are applied to treat AMD worldwide. This is done to
mitigate the impacts that result from the contact of the AMD with the regional and local rivers,
streams as well as the natural environment (Ramontja et al., 2011). Botha (2013), explained that
the active process entails continuous addition of alkaline constituents to the AMD in an effort to
adjust the pH from an acidic to a neutral state. Johnson and Hallberg (2005), further indicated
that application of the active remediation technology to AMD, assist in precipitating out various
metals from the solution. Passive remediation technology involves passing the AMD through a
permeable system which retain the metals in the system through biogeochemical reactions
(Cortina et al., 2003). Passive remediation systems do not include active work such as pumping
of effluent through the system (Bayer and Finkel, 2006). The system simply relies on the natural
flow of water and biogeochemical reactions (Caraballo et al., 2011).
Younger et al. (2002), defined active treatment as a process of improving water quality through
the use of chemical reagents or technologies that require on-going maintenance. Younger et al.
(2002), also stated that treatment of impacts arising from AMD require implementation of the
following: reduction and oxidation of metals, addition of alkaline substances to the acidic water,
metal adsorption, exchange of ions, as well as implementation of reverse osmosis which is a
membrane process. Most active remediation systems consist of an inflow pipe, a storage tank

36
holding the chemicals; a system controlling the chemical application; a settling pond to capture
any precipitated metals; and a point where the treated water is discharged back into the original
course of the stream (Skousen et al., 1998). According to Skousen et al. (1998), active
remediation systems are effective in the treatment of AMD, however these systems are very costly
to purchase and maintain.
Figure 2-2: Major effects of AMD on a lotic system (Gray, 1997)
2.5 Study area
The Elsburgspruit is described by Kleynhans (2000), as a second order perennial tributary of the
Natalspruit which in turn flows into the Rietspruit and ultimately flows into the Vaal River.
Furthermore, the Elsburgspruit lies within the East Rand which is typically the most developed
industrial region on the Witwatersrand with its tributaries responsible for draining the East Rand.
Extensive wetlands characterize the Elsburgspruit-Natalspruit river complex. This complex covers

37
approximately 225 km2 (Viljoen and Scoon., 1985). The Elsburgspruit is considered by Ferrar and
Lotter (2007), to be irreplaceable. This means that within the Elsburg area, there is no other river
system with the potential to meet the ecological targets that are set for the catchment (Ferrar and
Lotter; 2007). As a result, protection of the Elsburgspruit is critical (Ferrar and Lotter; 2007).
Furthermore, Ferrar and Lotter (2007), described the Elsburgspruit’s aquatic biodiversity as
critically endangered, while Hendriks and Rossou (2009), confirmed the poor ecological integrity
of fish and macroinvertebrate in the system.
The watercourse constituting the study area, runs primarily from north to south of an AMD
treatment plant at the East Rand Proprietary mine shaft and is called the Elsburgspruit (Figure 2-
3). The Central Basin (Figure 2-4) AMD treatment plant, situated about 1.8 km east of the
Germiston’s Central Business District (CBD), decants treated AMD effluent into the Elsburgspruit,
which runs for some 7 km through Germiston South, close to Kutalo Station, past Martin du
Preezville, and passes under the N17 highway before flowing into the Natalspruit (Figure 2-6).
For a stretch of about 4 km, the river’s banks are characterised by fairly intense subsistence
farming by neighbouring communities such as Palm Ridge to the west and Zonkizizwe to the east.
The study site falls within quaternary catchment C22B as confirmed by Kleynhans (2000).
Kleynhans (2000), categorizes the present ecological management class for this quaternary
catchment as a Class E or F (seriously/critically modified) which is not an acceptable state.
Furthermore, the critically modified state also indicates that the system has almost completely lost
all biota and natural habitat (Kleynhans, 2000). The environmental degradation is irreversible as
the system’s basic ecosystem functions have been destroyed (Kleynhans and Louw, 2007).
The Elsburgspruit is a natural watercourse starting from Jet Park and it receives its water supply
from sewage discharges, urban runoff, mine works and non-perennial tributaries. The
Elsburgspruit-Natalspruit complex receives 60% of its water from effluent and seepage
discharges from the mines, sewage treatment work industries as well as urban areas during
summer (EMM, 2007). In winter, the bulk of water flowing in streams is mostly from effluent and
seepage discharges from the mines (EMM, 2007). The effluent inflows are the major sources of
dissolved metals as well as pollutants (Viljoen and Scoon., 1985). Germiston Lake, also known
as Victoria Lake (26° 14’ S 28° 09’ E), is a tributary of the Elsburgspruit system, with a catchment
area of 1100 hectares. Viljoen and Scoon (1985), explained that the lake has been used as a
reservoir for effluents from the now dysfunctional Simmer and Jack mine since 1904. It is a
relatively small lake with a surface area of approximately 58 ha when full (Bezuidenhout et al.,
1990).
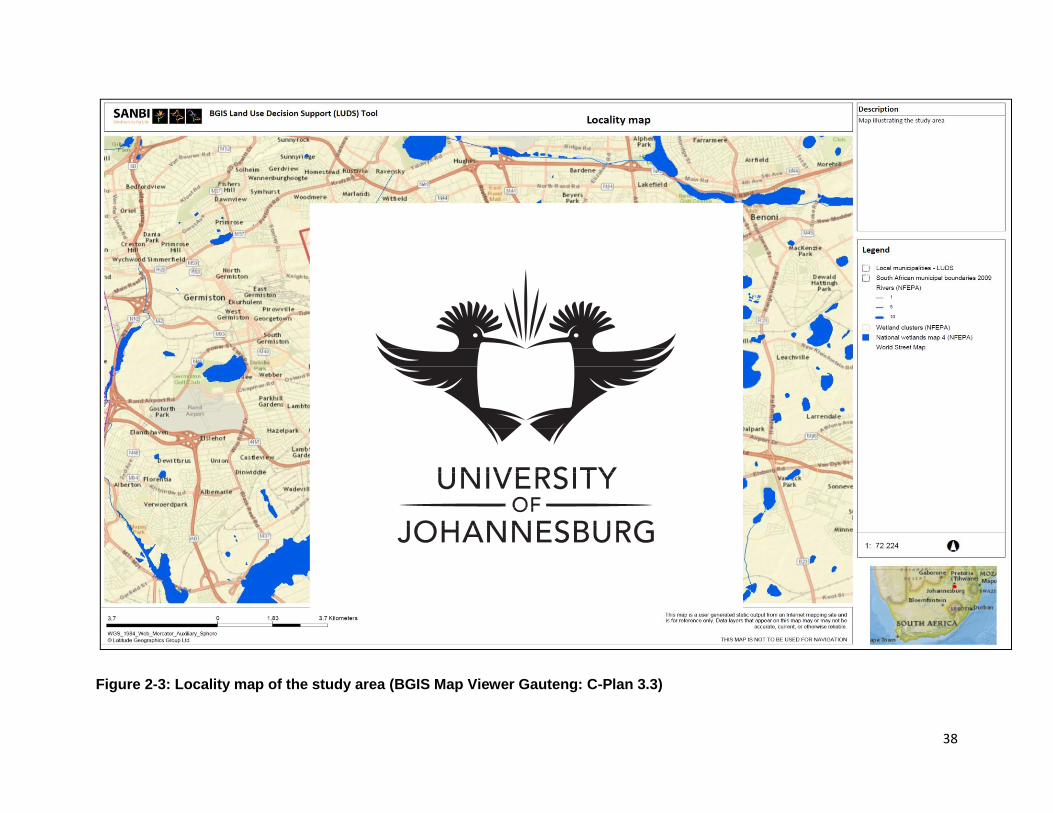
38
Figure 2-3: Locality map of the study area (BGIS Map Viewer Gauteng: C-Plan 3.3)
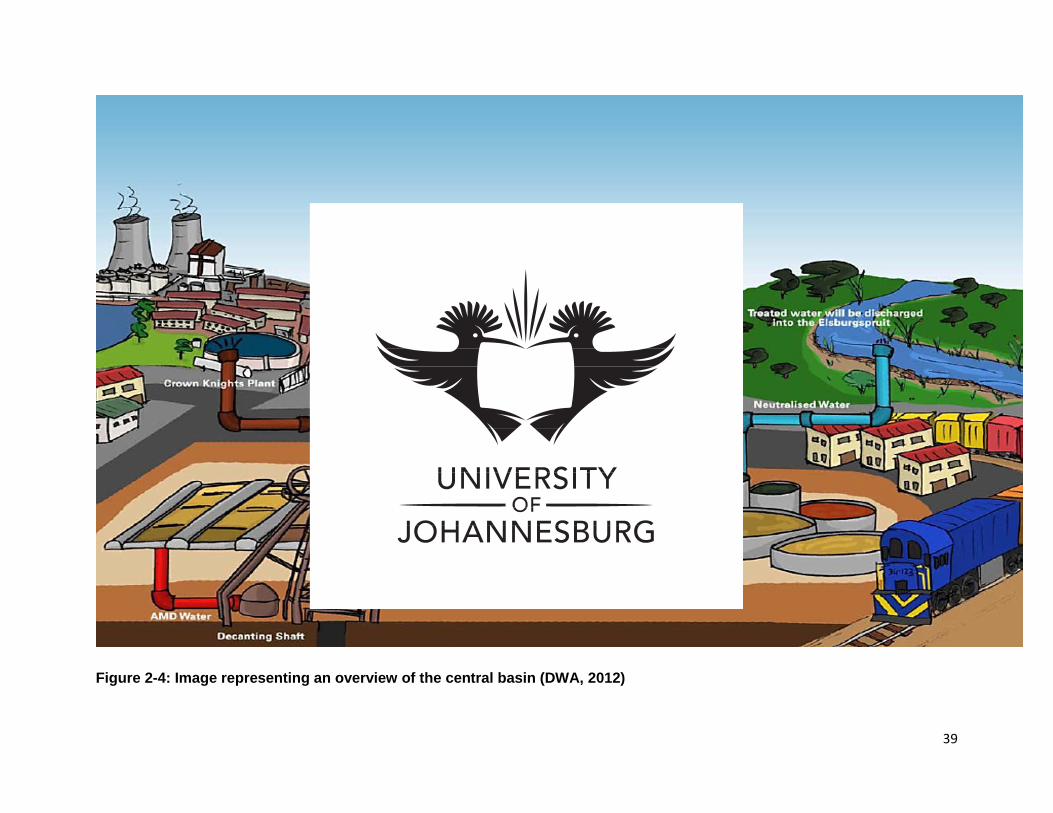
39
Figure 2-4: Image representing an overview of the central basin (DWA, 2012)

40
2.6 The Baseline Receiving Environment
Mucina and Rutherford (2006), described the study area as falling within the Grassland Biome
(Figure 2-5) that is found mainly on the high central plateau of SA and the inland areas of Kwa-
Zulu Natal and the Eastern Cape. The study area is characterized by the absence of trees and
an abundance of localized geophytes and habitats (Low and Rebelo, 1996). The study area falls
within the east rand region characterized by high summer rainfall occurring from October to April
with the average rainfall varying from 715 to 735 mm (Mucina and Rutherford 2006).
Temperatures can reach up to 30°C during summer (EMM, 2007) and during the winter months,
frost is common with temperatures reaching below freezing point. Northerly and north-westerly
winds occur during spring and winter and during summer north-easterly to north-north-easterly
winds occur (EMM, 2007). Agriculture activities such as irrigated agriculture, dry land agriculture,
urban agriculture and intensive agriculture take up almost 31 435 hectares of total land within the
Ekurhuleni Metropolitan Municipality (EMM, 2007). Of the total area, 16 842 hectares is
associated with mining activities.
The study area falls within the Klip River Highveld Grassland found in Johannesburg south
including Alberton, Springs and Grasmere (Gauteng C-Plan Version 2, 2006). The Klip River as
well as its associated wetlands and non-perennial drainage lines delineate the ecosystem.
Gauteng C-Plan Version 2 (2006) describes the main biodiversity features as including Orange
and Red data listed plant species. These species include Trachyandra erythrorrhiza (Conrath),
Delosperma purpureum (Klipvygie), Cineraria longipes (Wild parsley) and Delosperma
leendertziae (Klipvygie) (Gauteng C-Plan Version 2, 2006). Tyto capensis (African Grass-Owl),
Mirafra cheniana (Melodious Lark), Phoenicopterus roseus (Greater Flamingo) and Circus
ranivorus (African Marsh-Harrier) are the common red and orange listed bird species with priority
invertebrates being the Pterinochilus murinus (Golden Starburst Baboon Spider), Metisella
meninx (Marsh sylph), Aloeides dentatis (Roodepoort Copper Butterfly) and Orachrysops
mijburghi (Mijburgh's blue), (Gauteng C-Plan Version 2, 2006).
The ecosystem threat status is Critically Endangered (Figure 2-6 and 2-7) and listed under
Grassland, Savanna and Wetland Biomes. The original area of ecosystem is 89 000 ha but the
remaining natural area of ecosystem is 62%. Approximately 1% of the ecosystem is protected in
the Klipriviersberg Nature Reserve and Rondebult Bird Sanctuary (Gauteng C-Plan Version 2,
2006).

41
Figure 2-5: Biomes of South Africa, Lesotho and Swaziland (Rouget et al., 2004).
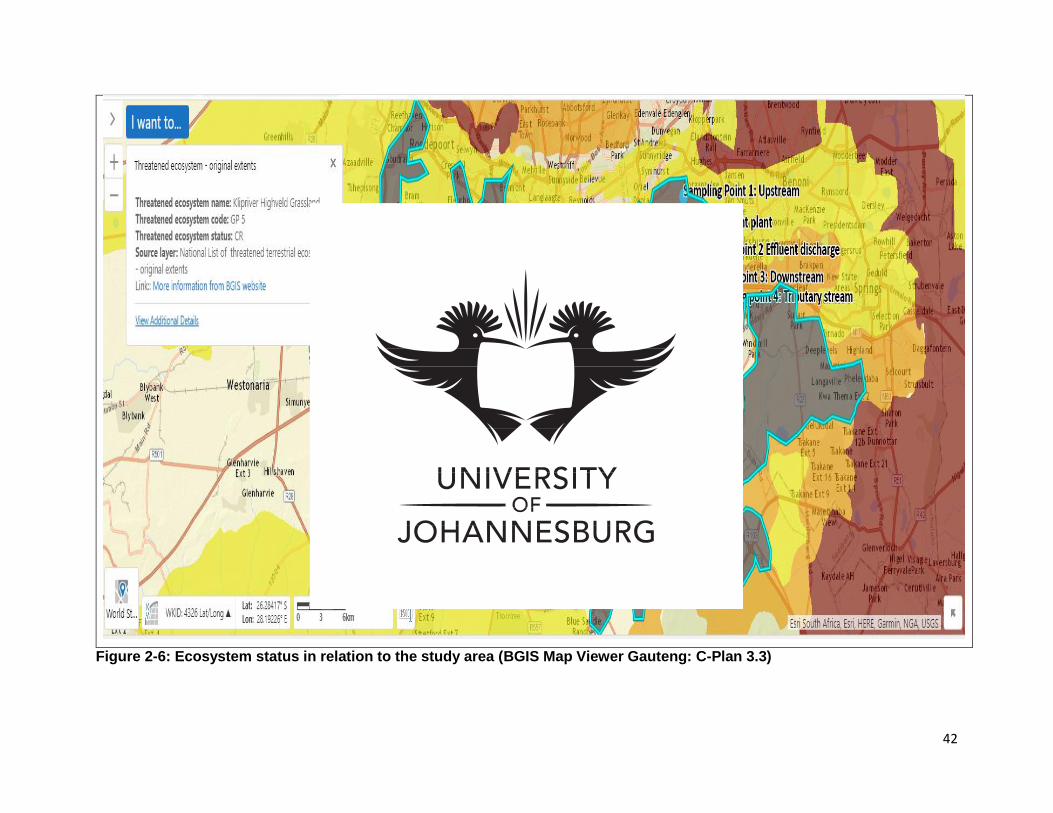
42
Figure 2-6: Ecosystem status in relation to the study area (BGIS Map Viewer Gauteng: C-Plan 3.3)

43
Figure 2-7: Conservation status of the study site (BGIS Map Viewer Gauteng: C-Plan 3.3)

44
2.7 Purpose of the study
The purpose of this study is to evaluate the possible effects of effluent discharge from an Acid
Mine Drainage (AMD) Treatment Plant, on the aquatic health of the Elsburgspruit through
assessing the water quality. Determining water quality entailed assessing the in-situ water quality
parameters, general water quality parameters and metal analysis at the study area as well as
assessing the water toxicity of the Elsburgspruit.
.

45
CHAPTER 3: MATERIALS AND METHODS
3.1 Sampling sites
This project focused on evaluating the effects of effluent discharge from an Acid Mine Drainage
Treatment Plant on the aquatic health of the Elsburgspruit. The project focused on assessing the
physico-chemical parameters, general water quality and chemical analysis at the study area as
well as addressing the water toxicity of the Elsburgspruit. As part of this study, bio indicators
such as Daphnia pulex (daphnia) and Poecilia reticulata (guppies) were used to determine the
toxicity of the water of the Elsburgspruit. Both D. pulex and P. reticulata are internationally
recognized species for the use in ecotoxicology to illustrate the acute and chronic effects of
chemicals on the aquatic environment. Four sampling sites (Table 3.1and figure 3.1) were
selected for the execution of this study which aims at evaluating the effects of the effluent
discharge from the acid mine drainage (AMD) treatment plant into the Elsburgspruit. The
samples were collected during the months of June, August and October in 2017.
Table 3-1: Sampling sites location description and GPS coordinates
Sample Site Site Location Description GPS Coordinates
Site 1 Elsburgspruit at Witwatersrand
goldmine
26°11'42.67"S
28°11'24.28"E
Site 2 Acid Mine Drainage Discharge
point
26°13'57.00"S
28°12'9.36"E
Site 3 Elsburgspruit at Elsburg Town 26°14'58.32"S
28°12'15.60"E
Site 4 Stream at Elspark (Reference
site)
26°15'41.69"S
28°13'18.09"E
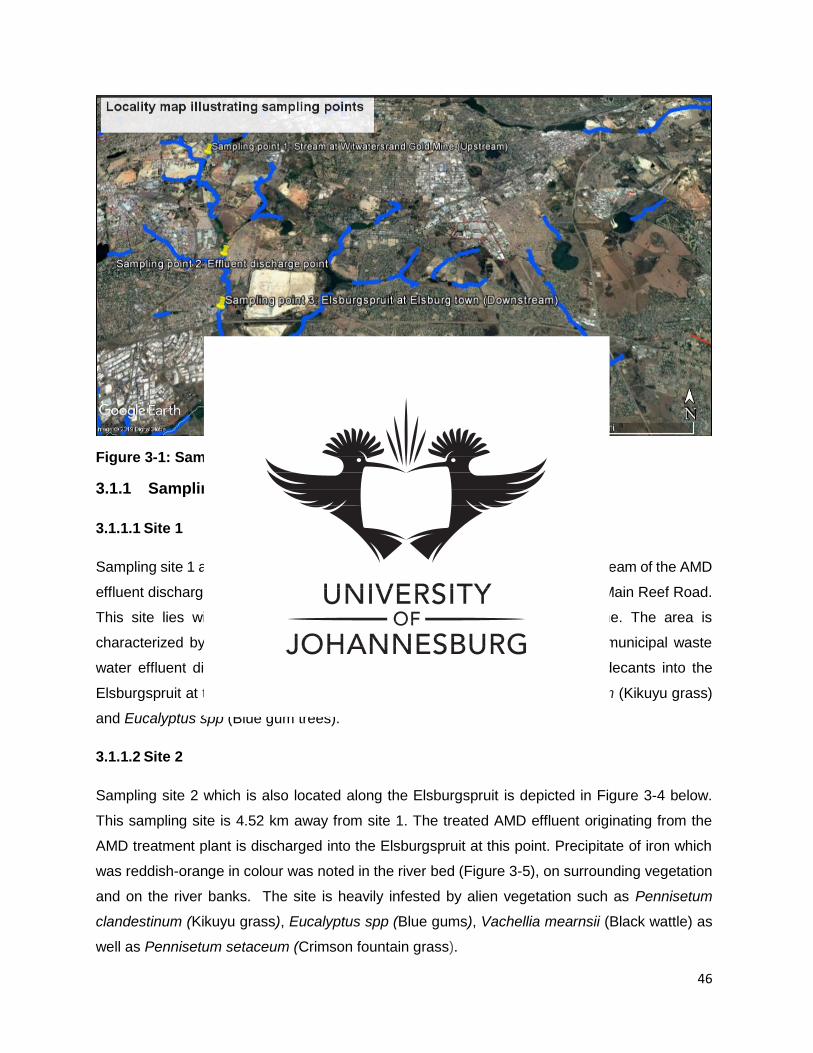
46
Figure 3-1: Sampling sites selected for the execution of this study
3.1.1 Sampling site selection
3.1.1.1 Site 1
Sampling site 1 as illustrated in Figure 3-2 and Figure 3-3 below, is located upstream of the AMD
effluent discharge point within the Elsburgspruit, along the R29 also known as Main Reef Road.
This site lies within the South-Eastern site of the Witwatersrand Gold Mine. The area is
characterized by the existence of tailings facilities and a pipeline conveying municipal waste
water effluent discharged at this site. Water from the tailings facilities also decants into the
Elsburgspruit at this point. Vegetation at site includes Pennisetum clandestinum (Kikuyu grass)
and Eucalyptus spp (Blue gum trees).
3.1.1.2 Site 2
Sampling site 2 which is also located along the Elsburgspruit is depicted in Figure 3-4 below.
This sampling site is 4.52 km away from site 1. The treated AMD effluent originating from the
AMD treatment plant is discharged into the Elsburgspruit at this point. Precipitate of iron which
was reddish-orange in colour was noted in the river bed (Figure 3-5), on surrounding vegetation
and on the river banks. The site is heavily infested by alien vegetation such as Pennisetum
clandestinum (Kikuyu grass), Eucalyptus spp (Blue gums), Vachellia mearnsii (Black wattle) as
well as Pennisetum setaceum (Crimson fountain grass).
47
3.1.1.3 Site 3
Sampling site 3 is located 2 km downstream of the AMD effluent discharge point along the
Elsburgspruit, below the bridge at Brug Street as shown in Figure 3-6 below. The site is heavily
infested by alien vegetation such as Tagetes minuta (Khaki bush), Andropogon spp, Pennisetum
clandestinum (Kikuyu grass), and Salix babylonica as shown in Figure 3-7 below.
3.1.1.4 Site 4
Sampling site 4 is shown in Figure 3-8 below and is located 3.75 km from the AMD effluent
discharge at Elsparkspruit along Heidelberg Road. The site is heavily infested by Phragmites
australis (Common reed), Grey popular, Eucalyptus spp, Black wattles, Pennisetum
clandestinum (Kikuyu grass), and Pennisetum setaceum (Crimson fountain grass) as depicted
by Figure 3-9 below. This sampling point was selected for use as a reference point since
Elsparkspruit is a tributary to the Elsburgspruit. The Elsparkspruit originates from Boksburg.
Upstream of Elspark spruit is Boksburg Meer dam, as well as pollution sources such as the
tailings facilities.

48
Figure 3-2: Sampling Site 1 located within the Elsburgspruit (Source: Google maps,
2018)
Figure 3-3: Location of sampling site 1 (Source: Google earth)

49
Figure 3-4: Sampling Site 2 located within the Elsburgspruit at the treated AMD
discharge point (Source: Google earth, 2018)
Figure 3-5 Sampling site 2, AMD effluent discharge point (Source: Nomkhosi Mohlahlo,
2018)

50
Figure 3-6: Sampling Site 3 located within the Elsburgspruit, below the bridge at Brug
Street (Source: Google earth, 2018)
Figure 3-7: Sampling site 3 (Source: Google earth)

51
Figure 3-8: Sampling Site 4 located within the Elsparkspruit, which is a tributary to the
Elsburgspuit (Source: Google earth, 2018)
Figure 3-9: Location of sampling site 4 (Source: Google earth, 2018)

52
3.2 Water Analysis
3.2.1 In-situ physical parameters
In situ water quality parameters such as water temperature (°C), pH, electrical conductivity
(μS/cm) and dissolved oxygen (% saturation and mg/L) were measured and recorded. A Yellow
Springs Instrument (YSI) multi parameter hand held probe was used for the measurements of in
situ water parameters (Figure 3-10). All results were recorded according to a prescribed
methods used by Rand Water (e.g. Methods numbers 1.1.2.16.1, 1.1.2.14.1, and 1.1.2.15.1)
(Rand Water, 2006 a, b, c).
Figure 3-10: In situ water parameters were measured using an YSI probe (Source:
Nomkhosi Mohlahlo, 2018)
3.2.1.2 General Water Quality parameters
Water samples for chemical analysis and toxicity testing were collected from each selected
sampling site using clean and labelled 1.5 L polyethylene terephthalate sampling bottles.
Sampling bottles were rinsed with the effluent. This was followed by submerging the sampling

53
bottles to approximately 10 - 15 cm below water surface, filling sampling bottles to the brim.
Sampling bottles were sealed, placed in a cooler box, and transported to Rand Water
Environmental Management Services where the samples were placed in a fridge and stored at
13°C until further analysis. The day before analysis, the frozen samples were removed from the
fridge, transferred into a cooler box and then transported to Rand Water Analytical Services
(South African National Accreditation System (SANAS) T0046 accredited laboratory) located in
Vereeniging.
During transportation, the samples were protected from Ultra Violet light and kept cool. Upon
arrival at Rand Water Analytical Services, the samples were removed from the cooler box, logged
at the Rand Water‘s Analytical Services ‘Laboratory Customer Services. The chain of custody
sheet and collection data sheets were completed and checked; and the samples were inspected
for possible damage during transportation. Samples were left at room temperature overnight to
allow it to defrost. Analysis that was conducted included the following Rand Water methods:
Method number 2.1.7.01.1 for analysis of the availability of nitrate (NO3-) and sulphates
(SO4),
Method number 2.1.8.01.2 for analysis of the availability of nitrite (NO2−),
Method number 2.1.8.03.2 for analysis of the availability of ortho phosphates (PO43−), and
Method number 2.1.8.04.2 for analysis of the availability of ammonia (NH3).
3.2.1.3 Metal analysis
Rand Water is currently monitoring the water quality of the Elsburgspruit on a continuous basis.
Sampling is conducted on a weekly basis by Rand Water staff. Metal analysis forms part of water
quality monitoring. Metal analysis data used for this study was provided by Rand Water. The
concentration of metals in a water body are often measured due to the severe health effects, e.g.
cancer due to ingesting the various metals (Rand Water, 2009a). To determine the concentration
of dissolved, suspended or total elements in a sample of water, Rand Water employ a techniques
called Inductively Coupled Plasma-Optical Emission Spectrometry (ICP-OES) that detects ions
such as barium; and Inductively Coupled Plasma-Mass Spectrometry (ICP-MS) capable of
detecting metals and several non-metals at concentrations as low as one part in 1015 (part per
quadrillion, ppq) on non-interfered low-background isotopes (Rand Water, 2011c).

54
3.2.2 Acute Water Toxicity analysis
The method used for acute water toxicity analysis was adapted from Slabbert (1996). Samples
for toxicity analysis were collected according to the method described in section 3.2.1.2
(Slabbert, 1996). These samples were analysed in the Aquarium of the Department of Zoology
at the University of Johannesburg. The samples were aerated to increase the amount of oxygen
to above 40% where necessary. This was followed by measurement of physical parameters such
as pH, temperature, dissolve oxygen and electrical conductivity.
3.2.2.1 Daphnia pulex
Dave (1993), defined Daphnia pulex as a crustacean common in freshwaters. A standard
bioassay, developed by Slabbert, 1996 was used to illustrate the acute and chronic effects of
chemicals on the aquatic environment. The D. pulex was specifically used during water toxicity
tests for this project. Culturing and testing of the D. pulex was done according to the United
States (US) Environmental Protection Agency (EPA) prescribed method (US EPA 1985, 1991).
Daphnia pulex of 24 hours or less in age are referred to as juveniles or neonates. The daphnia
cultures were kept in an environmental room in the Aquarium of the Department of Zoology at
the University of Johannesburg at 20 ± 1°C under 16 hours illumination. Culturing conditions
included keeping the cultures in synthetic moderately hard water and the daphnids were fed
dried yeast (Lukhele et al, 2015). The D. pulex bioassay test conditions are presented in Table
3-2.
The embryo bearing adult female D. pulex were removed from the stock cultures two days before
analysis. These females were also kept in synthetic moderately hard water and fed.
Test beakers (50 mL) were prepared and labelled according to sampling sites. Forty (40) mL of
effluent from each site was transferred to the glass beakers and all the tests were done in
duplicate. Five D. pulex neonates were transferred to each beaker. Mortalities of the young were
recorded after 24 and 48 hours and expressed as a percentage of the D. pulex that survived.
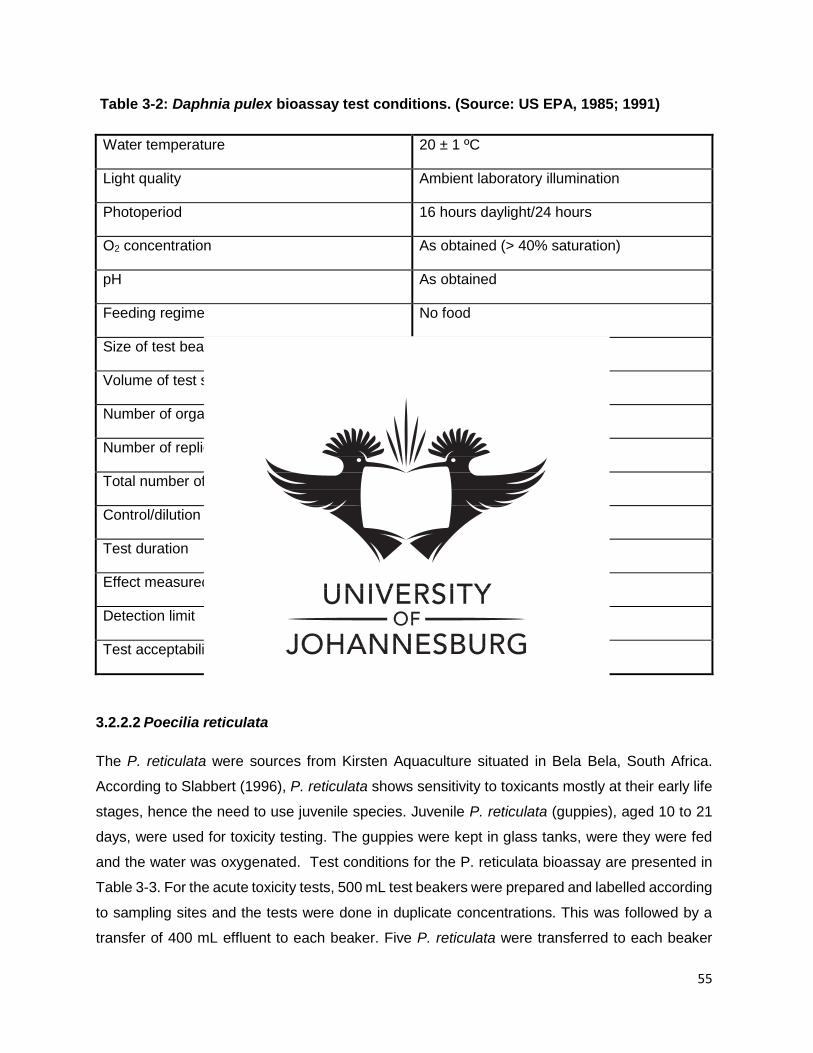
55
Table 3-2: Daphnia pulex bioassay test conditions. (Source: US EPA, 1985; 1991)
Water temperature 20 ± 1 ºC
Light quality Ambient laboratory illumination
Photoperiod 16 hours daylight/24 hours
O2 concentration As obtained (> 40% saturation)
pH As obtained
Feeding regime No food
Size of test beaker 50 mL
Volume of test sample 25 mL
Number of organisms/beaker 5
Number of replicate beakers 2
Total number of organisms/test 10
Control/dilution water Standard control water
Test duration 48 hours
Effect measured Lethality
Detection limit 10 %
Test acceptability Control lethality < 10 %
3.2.2.2 Poecilia reticulata
The P. reticulata were sources from Kirsten Aquaculture situated in Bela Bela, South Africa.
According to Slabbert (1996), P. reticulata shows sensitivity to toxicants mostly at their early life
stages, hence the need to use juvenile species. Juvenile P. reticulata (guppies), aged 10 to 21
days, were used for toxicity testing. The guppies were kept in glass tanks, were they were fed
and the water was oxygenated. Test conditions for the P. reticulata bioassay are presented in
Table 3-3. For the acute toxicity tests, 500 mL test beakers were prepared and labelled according
to sampling sites and the tests were done in duplicate concentrations. This was followed by a
transfer of 400 mL effluent to each beaker. Five P. reticulata were transferred to each beaker

56
and the test duration was 96 hours. The number of mortalities were recorded after every 24
hours.
Table 3-3: Poecilia reticulata bioassay test condition (source: US EPA, 1985)
Water temperature 20 ± 1 ºC
Light quality Laboratory illumination
Photoperiod 16 hours light/24 hours
O2 concentration As obtained
pH As obtained
Feeding regime No feeding
Age of fish 3 weeks (acclimatised)
Size of test container 500 mL
Volume of test sample 400 mL
Number of fish/container 5
Number of replicate containers 2
Total number of fish/test 10
Control/dilution water Standard control water
Test duration 96 hours
Effect measured Lethality
Detection limit 10 %
Test acceptability Control lethality < 10 %
3.3 Data analysis
The results from in situ physical parameters, general water quality, and ICP OES were compared
to water quality guidelines such as the South African Water Quality Guideline. Volume 7: Aquatic
Ecosystems (DWAF, 1996) (Appendix A: Table A1); General Authorisations in terms of Section

57
39 of the National Water Act, 1998 (Act No. 36 of 1998) that prescribes the Wastewater Limit
Values (DWA, 2013) (Appendix A: Table A3), and the Target Treated AMD discharge standards
(Appendix A: Table A2) prescribed in the Feasibility Study for a Long-Term solution to Address
the Acid Mine Drainage Associated with the East, Central and West Rand Underground Mining
Basins (DWA; 2012) all developed by the Department of Water and Sanitation. The objective of
the Water Quality Guidelines (WQG) is to protect the aquatic ecosystem (DWAF, 1996). When
the focus is on assessing the risk to aquatic ecosystems, the WQG focuses on the Target Water
Quality Range (TWQR), Chronic Effect Value (CEV) and Acute Effect Value (AEV). The TWQR
is defined as the level at which no detrimental effects are anticipated on the wellbeing of the
aquatic ecosystems, therefore protection of these ecosystems is expected (DWAF, 1996).
A hazard classification system, developed by Persoone et al. (2003) (Appendix A: Table A4),
was used to score and classify each site, based on the mortality responses percentages
recorded on each site for the exposure of Daphnia pulex and Poecilia reticulata. The hazard
classification system classifies hazards into five different classes. Class I is based on a hazard
range of ≤20 % mortality of organisms on exposure to a stressor. A site falling within a Class I
range can be said to be having no acute hazard. Class II is based on a hazard range of more or
equals to 20 % mortality response but less than or equal to 50%. This site can be said to have a
slight acute hazard. For a site to be classified as a Class III which a site with an acute hazard,
the mortality percentage effect should range between more or equal to 50% but less or equal to
100%. Class IV and Class V are characterized by a percentage effect of 100% in at least 1 test
and 100% in all tests respectively.
3.3.1 Statistics
IBM SPSS v.25 Statistics Kruskal-Wallis test was used to compare the data collected from the
different sampling sites. The data was grouped per site to have at least 3 sampling points to run
statistical analysis. The median, range, maximum and minimum value of each constituent tested
for in each sampling site was determined. Significant differences between sampling sites were
determined through running the raw data into the IBM SPSS v.25 Statistics Kruskal-Wallis test
and the results were used to compare the sites. The significance level was set at p<0.05. This
basically means that there’s 95% confident level that the differences identified are true.

58
CHAPTER 4: RESULTS
4.1 In-situ water quality parameters
In-situ water quality parameter results are presented in Table 4-1 as well as in Appendix B: Table
B1. These parameters include pH; electrical conductivity (μS/cm), temperature (C), and
dissolved oxygen (mg/L and % saturation) measured from Site 1 - 3 along the Elsburgspruit as
well as Site 4 which is in the Elsparkspruit. The parameters were compared to the target water
quality range (TWQR) prescribed in the water quality guidelines for the aquatic environment
(WQG/AE) and the target treated acid mine drainage discharged standards (TTAMDDS) (DWA,
2012).
4.1.1 Temperature
The temperature readings from the different sites ranged from 8.6 – 27C and was within TWQR
of the WQG/AE (DWAF, 1996) (Table 4-1 and Appendix B: Table B1). The results of the
Statistical Package for the Social Sciences Version 25 (SPSS) Statistics Kruskal-Wallis test
showed a significant difference (p<0.033) between the median temperature of Site 1 (13.1°C)
and Site 2 (26.63°C). In addition, a significant difference (<0.013) was also observed for the
median temperature of Site 2 (26.6C) compared to Site 4 (11.9C) (Figure 4-1 and Appendix B:
Table B1).
Figure 4-1: Statistical difference in the median temperatures for Site 1 – Site 4.
Sampling Sites (1-4)
Te
mp
era
ture
(°C
)
(°C
)
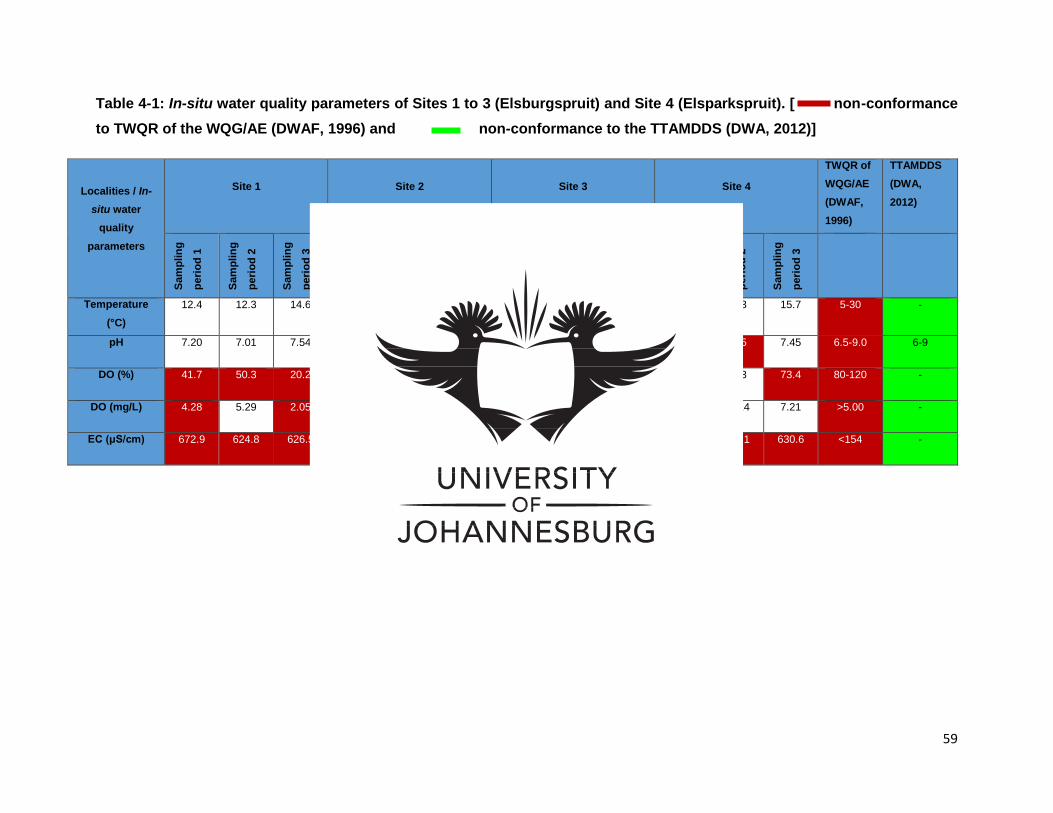
59
Table 4-1: In-situ water quality parameters of Sites 1 to 3 (Elsburgspruit) and Site 4 (Elsparkspruit). [ non-conformance
to TWQR of the WQG/AE (DWAF, 1996) and non-conformance to the TTAMDDS (DWA, 2012)]
Localities / In-
situ water
quality
parameters
Site 1 Site 2 Site 3 Site 4
TWQR of
WQG/AE
(DWAF,
1996)
TTAMDDS
(DWA,
2012)
Sam
plin
g
pe
rio
d 1
Sam
plin
g
pe
rio
d 2
Sam
plin
g
pe
rio
d 3
Sam
plin
g
pe
rio
d 1
Sam
plin
g
pe
rio
d 2
Sam
plin
g
pe
rio
d 3
Sam
plin
g
pe
rio
d 1
Sam
plin
g
pe
rio
d 2
Sam
plin
g
pe
rio
d 3
Sam
plin
g
pe
rio
d 1
Sam
plin
g
pe
rio
d 2
Sam
plin
g
pe
rio
d 3
Temperature
(°C)
12.4 12.3 14.6 27 26.7 26.2 26.5 26.4 25.6 8.6 11.3 15.7 5-30 -
pH 7.20 7.01 7.54 9 8.75 8.94 8.50 7.8 8.49 6.35 6.15 7.45 6.5-9.0 6-9
DO (%) 41.7 50.3 20.2 77.4 73.5 64.7 63.4 71.9 65.4 75.2 99.3 73.4 80-120 -
DO (mg/L) 4.28 5.29 2.05 6.07 6.02 5.05 5.05 5.78 4.47 8.66 11.14 7.21 >5.00 -
EC (μS/cm) 672.9 624.8 626.5 628 624.8 626.4 627.7 624.5 626.7 683.3 629.1 630.6 <154 -

60
4.1.2 pH
The pH readings ranged between 6.15 – 9.00 and were within the TWQR of the WQG/AE (DWAF,
1996) at all the sites except Site 4 sampling periods 1 and 2 (Table 4-1 and Appendix B: Table
B1) and above the TTAMDDS (DWA, 2012)
The results of the IBM SPSS v.25 Statistics Kruskal-Wallis test showed that there is a significant
difference (p<0.024) between the pH median ranks of Site 1 (7.25) and Site 2 (8.90). In addition,
a significant difference (0.05) was observed for the median pH for Site 2 (8.90) compared the
median pH for Site 4 (6.65) (Figure 4-2).
Figure 4-2: Statistical difference in the median pH for Site 1 – Site 4.
4.1.3 Dissolved oxygen (%)
The TWQR for dissolved oxygen is set between 80 -120% according to the WQG/AE (DWAF,
1996). Results from most of the sampling points were below 80%, while only Site 4, sampling
period 2 was above 80% (Table 4-1 and Appendix B: Table B1). The results of the IBM SPSS
v.25 Statistics Kruskal-Wallis test showed that there is a significant difference (p0.031 thus <0.05)
between the median ranks of Site 1 (37.4%) and Site 2 (71.9%). In addition, the median DO% for
Site 1 is 37.4 %, compared to 82.6% median DO% for Site 4, with a p-value of 0.07 indicating a
significant difference between Site 1 and 4 (Figure 4-3).
Sampling Sites (1-4)
pH

61
Figure 4-3: Statistical difference in the median DO% for Site 1 – Site 4.
4.1.4 Dissolved oxygen (mg/L)
The DO readings ranged between 2.05 and 11.14 mg/L (Table 4-1 and Appendix B: Table B1).
Site 1 sampling period 3, did not conform to the TWQR of >5.0 mg/L of the WQG/AE (DWAF,
1996) requirements with a reading of 2.05 mg/L. The results of the IBM SPSS v.25 Statistics
Kruskal-Wallis test showed that there is a significant difference (p0.006 thus <0.05) between the
median ranks of Site 1 (3.87 mg/L) and Site 4 (9.0 mg/L). In addition, the median DO for Site 3 is
5.1 mg/L compared to 9.00 mg/L median DO for Site 4, with a p-value of 0.036 indicating a
significant difference in the DO between Site 3 and 4 (Figure 4-4)
4.1.5 Electrical conductivity
Electrical conductivity for Sites 1 – 4 during the three sampling periods, ranged between 624.5
and 683.3 μS/cm. All the results were above the TWQR of 154 µS/cm for the WQG/AE (DWAF,
1996) (Table 4-1 and Appendix B: Table B1). IBM SPSS v.25 Statistics Kruskal-Wallis test
showed no significant difference in the electrical conductivity between the sampling sites
(Appendix B ; Table B1).
Sampling sites (1-4)
Dis
so
lve
d o
xyg
en
%

62
Figure 4-4: Statistical difference in the median DO for Site 1 – Site 4.
4.2 General water quality parameters
The general water quality results are presented in Table 4-2 as well as in Appendix 1: Table B2.
The parameters were compared against the TWQR of the WQG/AE (DWAF, 1996) and the waste
water limit values WWLV (DWA, 2013) (Appendix A: Table A3).
IBM SPSS v.25 Statistics Kruskal-Wallis test showed no significant difference in the general water
quality parameters between the different sampling sites (Appendix C).
4.2.1 Total Hardness
Total hardness ranged between 0.34 – 10.0 mmol/L for all the sampling periods at the different
sites (Table 4-2 and Appendix B: Table B2).
Sampling sites (1-4)
Dis
so
lve
d o
xyg
en
(m
g/L
)
63
4.2.2 Ortho Phosphates
The ortho phosphate readings ranged between 0.2 and 1.5 mg/L and all results were below the
WWLV of 10 mg/L in terms of the National Water Act (NWA) (Act 36 of 1998) (DWA, 2013) (Table
4-2 and Appendix B: Table B2).
4.2.3 Nitrite
The nitrite results recorded ranged between 0.03 and 2.5 mg/L (Table 4-2 and Appendix B: Table
B2). All the nitrite results recorded were below the WWLV of 15 mg/L (DWA, 2013), Sites 2, 3 and
4 presented incidences above the TWQR of 0.05 mg/L for the WQG/AE (DWAF, 1996).
4.2.4 Nitrate
The nitrate readings recorded ranged between 0.04 and 12 mg/L. The highest concentration of
nitrate (12 mg/L) was recorded at Site 4 during sampling period 2 (Table 4.2 and Appendix B:
Table B2). All the nitrate concentrations recorded during the study period exceeded TWQR limit
of 0.05 mg/L of the WQG/AE (DWAF, 1996), except for Site 4 during sampling period 3 (0.04
mg/L), while all the results were below the WWVL of 15 mg/L in terms of the NWA (Act 36 of
1998) (DWA, 2013).
4.2.5 Sulphate
The sulphate readings ranged between 9.7 and 5 220 mg/L (Table 4-2 and Appendix B: Table
B2). Most of the sulphate results were below the WWLV (DWA, 2013) of 2 400 mg/L, except for
Site 1, 3 and 4 during different sampling periods (Table 4-2 and Appendix B: Table B2).
4.2.6 Ammonia
Ammonia concentrations recorded at all sites ranged between 0.14 and 39 mg/L (Table 4-2 and
Appendix B: Table B2). Ammonia concentrations recorded at all sites during all the sampling
periods exceeded the TWQR limit of 0.007mg/L of the WQG/AE (DWAF, 1996). Most of the
ammonia concentrations recorded were below the WWLV (DWA, 2013) of 6 mg/L, except for Site
2 sampling periods 1, 2 and 3, and Site 4 sampling periods 1 and 3.
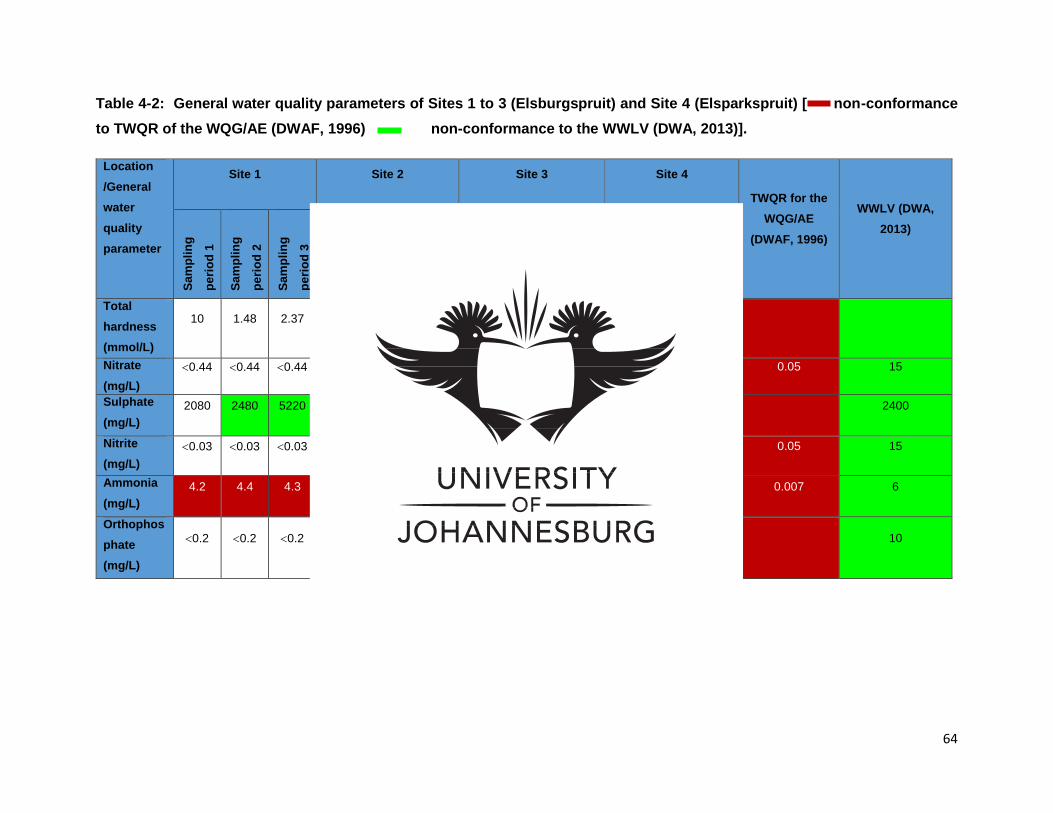
64
Table 4-2: General water quality parameters of Sites 1 to 3 (Elsburgspruit) and Site 4 (Elsparkspruit) [ non-conformance
to TWQR of the WQG/AE (DWAF, 1996) non-conformance to the WWLV (DWA, 2013)].
Location
/General
water
quality
parameter
Site 1 Site 2 Site 3 Site 4
TWQR for the
WQG/AE
(DWAF, 1996)
WWLV (DWA,
2013)
Sa
mp
lin
g
pe
rio
d 1
Sa
mp
lin
g
pe
rio
d 2
Sa
mp
lin
g
pe
rio
d 3
Sa
mp
lin
g
pe
rio
d 1
Sa
mp
lin
g
pe
rio
d 2
Sa
mp
lin
g
pe
rio
d 3
Sa
mp
lin
g
pe
rio
d 1
Sa
mp
lin
g
pe
rio
d 2
Sa
mp
lin
g
pe
rio
d 3
Sa
mp
lin
g
pe
rio
d 1
Sa
mp
lin
g
pe
rio
d 2
Sa
mp
lin
g
pe
rio
d 3
Total
hardness
(mmol/L)
10 1.48 2.37 1.25 0.34 0.65 1.75 1.83 2.13 1.76 0.91 0.34
Nitrate
(mg/L)
0.44 0.44 0.44 1.0 2.3 0.44 0.44 <0.44 0.58 1.9 12 0.04 0.05 15
Sulphate
(mg/L)
2080 2480 5220 190 340 9.7 205 4680 425 2680 1670 2850 2400
Nitrite
(mg/L)
0.03 0.03 0.03 0.11 0.47 0.03 0.07 0.03 0.03 0.03 2.5 0.03 0.05 15
Ammonia
(mg/L)
4.2 4.4 4.3 12 18 39 4.2 4.2 0.14 12 0.31 6.5 0.007 6
Orthophos
phate
(mg/L)
0.2 0.2 0.2 0.2 0.2 1.5 0.2 0.2 0.2 0.2 0.2 0.2 10

65
4.3 Metal, non-metals and metalloids analysis
Metals results determined for Site 1 - 3 along the Elsburgspruit as well as Site 4 in the
Elsparkspruit are presented in Figures 4-5 to 4.15 and Appendix B Table B3. The recorded
metal readings (section 4.3.1 – 4.3.9) were then compared to the target quality range (TWQR)
prescribed in the water quality guidelines for the aquatic environment (WQG/AE) (DWAF,
1996); with the focus on Critical Effect Value (CEV) and Acute Effect Value (AEV); the target
treated AMD discharged standards (TTAMDDS) (DWA, 2012) (Appendix 1: Table A3) and the
wastewater limit values (WWLV) (DWA, 2013) (Appendix A: Table A3). No TWQR for the
WQG/AE (DWAF, 1996) were available for the metal results for section 4.3.10 to 4.3.15.
4.3.1 Aluminium
Aluminium concentrations recorded ranged between 0.0125 and 0.19 mg/L (Figure 4-5 and
Appendix B: Table B3). These concentrations recorded from all the sites were below the
TTAMDDS of <1 mg/L (DWA, 2012).
When comparing aluminium results with the WQG, Site 2 (sampling period 1 and 3) showed
aluminium concentration exceeding the AEV, while Site 1 (sampling period 1), Site 2, Site 3
(sampling period 2; and 3) exceeding the CEV (Figure 4-5) TWQR for the WQG/AE (DWAF,
1996). A significant difference (p 0.029) for aluminium was observed between Site 1 (0.01
mg/L) and Site 2 (0.175 mg/L) and between Site 2 (0.175 mg/L) and Site 4 (0.01 mg/L), with
a p-value of 0.06 (Figure 4-6).
4.3.2 Iron
Iron concentrations recorded ranged between 0.019 and 0.78 mg/L (Figure 4-7 and Appendix
B: Table B3) and were below the TTAMDDS of <1 (DWA, 2012) at all the sampling sites
(Figure 4-7). Some of the results from Sites 1, 2, 3 and 4 were above the WWLV (DWS, 2013)
of 0.3 mg/L.
IBM SPSS v.25 Statistics Kruskal-Wallis test showed no significant difference in the iron
concentration between the sampling sites (Appendix B: Table B3).

66
Figure 4-5: Aluminium concentrations (mg/L) measured at Sites 1 to 4.
Figure 4-6: Statistical difference in median aluminium concentrations (mg/L) for Site 1-
4.
0
0.19
0 00
0.2
0.4
0.6
0.8
1
1.2
Site 1 Site 2 Site 3 Site 4
Sampling period 1 Sampling period 2 Sampling period 3 TWQRCEV AEV TTAMDDS
Alu
min
ium
(m
g/L)
Sampling sites
Sampling sites (1- 4)
Alu
min
ium
co
nc
en
tra
tio
ns
(m
g/l
)

67
Figure 4-7: Iron concentration (mg/L) measured at Sites 1 to 4.
4.3.3 Zinc
Zinc concentrations recorded ranged between 0.0075 and 0.13 mg/L (Figure 4-8 and
Appendix 1: Table B3). During all the sampling periods, zinc concentrations recorded at Site
1, 2, 3 and 4 exceeded the TWQR and CEV of the WQG/AE (DWAF, 1996), except for Site 1
during sampling period 3. Zinc concentrations recorded were all below the AEV limit for the
(WQG/AE) (DWAF, 1996).
Sites 2 and 4 presented sampling periods with zinc concentrations above the WWLV (DWA,
2013) (Figure 4-8). The Independent IBM SPSS v.25 Statistics Kruskal-Wallis test showed no
significant difference in the zinc concentration between the sampling sites (Appendix B: Table
B3).
4.3.4 Manganese
Manganese concentrations recorded for all the sites during all the sampling periods ranged
between 9.6 and 150 mg/L (Figure 4-9 and Appendix B: Table B3) and exceeded the CEV of
the WQG/AE (DWAF, 1996). Site 1, 2, 3 and 4 presented sampling periods where manganese
concentrations exceeded the AEV of the WQG/AE (DWAF, 1996) and the WWLV of 0.1 mg/L
(DWA, 2013).
0.019
0
0.2
0.4
0.6
0.8
1
1.2
Site 1 Site 2 Site 3 Site 4
Sampling period 1 Sampling period 2 Sampling period 3 WWLV TTAMDDS
Iro
n (
mg/
L)
Sampling sites

68
Figure 4-8: Zinc concentration (mg/L) measured at Sites 1 to 4.
0
0.02
0.04
0.06
0.08
0.1
0.12
0.14
0.16
Site 1 Site 2 Site 3 Site 4
Sampling period 1 Sampling period 2 Sampling period 3 TWQR
CEV AEV WWLV
Sampling sites
Zin
c (m
g/L)
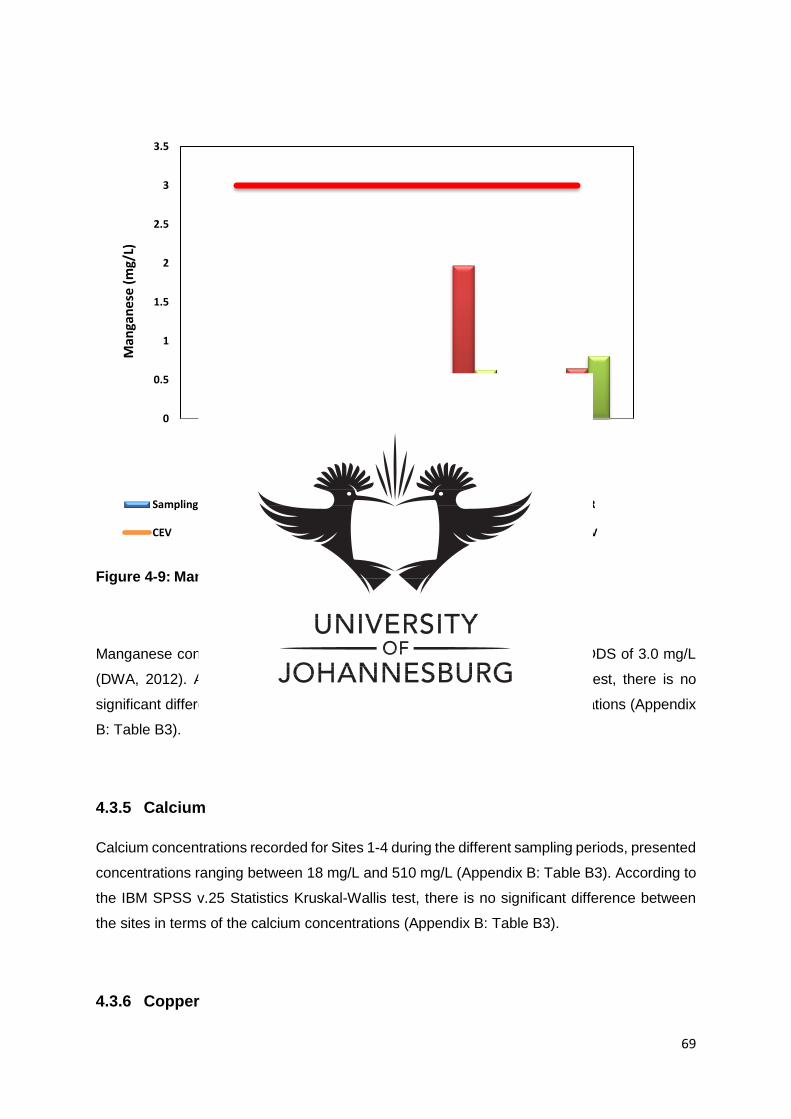
69
Figure 4-9: Manganese concentrations (mg/L) measured at Sites 1 to 4.
Manganese concentrations recorded for all the sites were below the TTAMDDS of 3.0 mg/L
(DWA, 2012). According to the IBM SPSS v.25 Statistics Kruskal-Wallis test, there is no
significant difference between the sites in terms of the manganese concentrations (Appendix
B: Table B3).
4.3.5 Calcium
Calcium concentrations recorded for Sites 1-4 during the different sampling periods, presented
concentrations ranging between 18 mg/L and 510 mg/L (Appendix B: Table B3). According to
the IBM SPSS v.25 Statistics Kruskal-Wallis test, there is no significant difference between
the sites in terms of the calcium concentrations (Appendix B: Table B3).
4.3.6 Copper
0
0.5
1
1.5
2
2.5
3
3.5
Site 1 Site 2 Site 3 Site 4
Sampling period 1 Sampling period 2 Sampling period 3 TWQR
CEV AEV TTADDDS WWLV
Sampling periods
Man
gan
ese
(m
g/L)
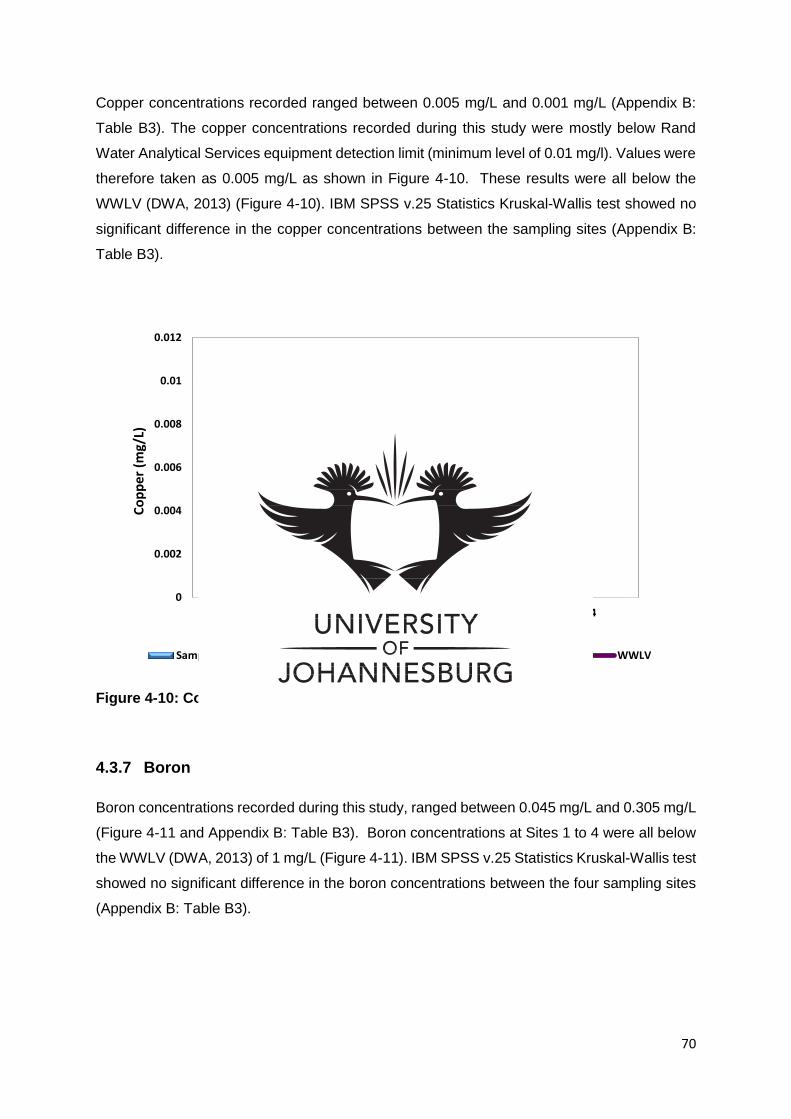
70
Copper concentrations recorded ranged between 0.005 mg/L and 0.001 mg/L (Appendix B:
Table B3). The copper concentrations recorded during this study were mostly below Rand
Water Analytical Services equipment detection limit (minimum level of 0.01 mg/l). Values were
therefore taken as 0.005 mg/L as shown in Figure 4-10. These results were all below the
WWLV (DWA, 2013) (Figure 4-10). IBM SPSS v.25 Statistics Kruskal-Wallis test showed no
significant difference in the copper concentrations between the sampling sites (Appendix B:
Table B3).
Figure 4-10: Copper concentrations (mg/L) measured in Site 1 to 4.
4.3.7 Boron
Boron concentrations recorded during this study, ranged between 0.045 mg/L and 0.305 mg/L
(Figure 4-11 and Appendix B: Table B3). Boron concentrations at Sites 1 to 4 were all below
the WWLV (DWA, 2013) of 1 mg/L (Figure 4-11). IBM SPSS v.25 Statistics Kruskal-Wallis test
showed no significant difference in the boron concentrations between the four sampling sites
(Appendix B: Table B3).
0
0.002
0.004
0.006
0.008
0.01
0.012
Site 1 Site 2 Site 3 Site 4
Sampling period 1 Sampling period 2 Sampling period 3 WWLV
Sampling sites
Co
pp
er
(mg/
L)

71
Figure 4-11: Boron concentrations (mg/L) measured in Site 1 to 4.
4.3.8 Nickel
Nickel concentrations recorded during the study ranged between 0.005 mg/L recorded at Site
2 (sampling period 1 and 2) and 0.49 mg/L recorded at Site 4 during sampling period 1 (Figure
4-12 and Appendix B: Table B3). According to the independent IBM SPSS v.25 Statistics
Kruskal-Wallis test, there’s a significance difference (p<0.05) for nickel concentration between
Site 2 (0.007 mg/L) and Site 4 (0.206 mg/L) (Figure 4-13).
0.305
0
0.2
0.4
0.6
0.8
1
1.2
Site 1 Site 2 Site 3 Site 4
Sampling period 1 Sampling period 2 Sampling period 3 WWLV
Bo
ron
(m
g/l)
Sampling sites

72
Figure 4-12: Nickel concentrations (mg/L) measured at Site 1 to 4.
Figure 4-13: Statistical difference in nickel concentrations (mg/L) for Site 1- 4.
0
0.1
0.2
0.3
0.4
0.5
0.6
Site 1 Site 2 Site 3 Site 4
Sampling period 1 Sampling period 2 Sampling period 3 Sampling period 4
Nic
kel (
mg/
L)
Sampling sites
Sampling sites (1-4)
Nic
ke
l co
nc
en
tra
tio
n (
mg
/L)

73
4.3.9 Cobalt
Cobalt concentrations recorded during this study ranged between 0.005 and 0.35 mg/L (Figure
4-14 and Appendix B and Table B3). These concentrations were below TWQR of <10 mg/L
prescribed by the WQG/AE (DWAF, 1996) for all the sites.
According to the IBM SPSS v.25 Statistics Kruskal-Wallis test, there are no significant
difference between the sites in terms of the cobalt concentrations (Appendix B and Table B3).
Figure 4-14: Cobalt concentrations (mg/L) measured at Sites 1 to 4.
4.3.10 Potassium
Potassium concentrations recorded at the four sampling sites ranged between 6.9 mg/L
recorded at Site 2 during sampling period 3, and the highest potassium concentration of 22
mg/L recorded at Site 1 during sampling period 1 (Appendix B and Table B3). IBM SPSS v.25
Statistics Kruskal-Wallis test showed no significant difference in the potassium concentrations
between the four sampling sites (Appendix B and Table B3).
0.35
0
2
4
6
8
10
12
Site 1 Site 2 Site 3 Site 4
Sampling period 1 Sampling period 2 Sampling period 3 TWQR
Sampling sites
Co
bal
t m
g/L

74
4.3.11 Magnesium
Magnesium concentrations recorded at the four sampling sites ranged between 5.6 mg/L
recorded at Site 1 sampling period 1 and 150 mg/L recorded at Site 3 sampling period 2
(Appendix B: Table B3). IBM SPSS v.25 Statistics Kruskal-Wallis test showed no significant
difference in the magnesium concentrations between the four sampling sites (Appendix B:
Table B3).
4.3.12 Sulphur
Sulphur concentrations ranged between 5.5 mg/L which was the lowest value recorded at Site
1 during sampling period 1, with the highest concentration of 680 mg/L recorded at Site 3
during both sampling period 1 and 2 (Appendix B: Table B3). IBM SPSS v.25 Statistics
Kruskal-Wallis test showed no significant difference in the sulphur concentrations between the
four sampling sites (Appendix B: Table B3).
4.3.13 Strontium
Strontium concentration recorded ranged between 0.1 mg/L (sampling period 3 at Site 1) and
0.65 mg/L (Site 4 during sampling period 3) (Appendix B: Table B3). IBM SPSS Statistics
Kruskal-Wallis test showed no significant difference in strontium concentrations between the
four sampling sites (Appendix 1: Table B3).
4.3.14 Sodium
The highest sodium concentration of 185 mg/L was recorded at Site 1 sampling period 1 and
Site 4 sampling period 3, with the lowest concentration of 22 mg/L recorded at Site 4 during
sampling 1 (Appendix 1: Table B3). IBM SPSS v.25 Statistics Kruskal-Wallis test showed no
significant difference in sodium concentrations between the four sampling sites (Appendix B:
Table B3).
4.3.15 Silicon

75
Silicon concentrations ranged between 0 and 11 mg/L. The lowest concentration was recorded
during sampling period 1 at Site 1, with the highest concentration of 6.9 mg/L recorded at Site
1 during sampling period 2 (Appendix B: Table B3). IBM SPSS v.25 Statistics Kruskal-Wallis
test showed no significant difference in silicon concentrations between the four sampling sites
(Appendix B: Table B3).
4.4 Toxicology data
As part of this study, Daphnia pulex and Poecillia reticulata species were used to determine
the water toxicity of the Elsburgspruit. Each site was classified according to its toxicity using
the hazard classification sysytem designed by Persoone et al. (2003) (Table 4-3; Appendix A
: Table A4).
Table 4-3: A toxicity classification system for natural and wastewaters (Persoone et al.,
2003)
Percentage effect (PE) Class Hazard Symbol
≤ 20% Class I No acute hazard
20% ≤ PE ≤ 50 % Class II Slight acute hazard
50% ≤ PE ≤ 100% Class III Acute hazard
PE 100% in at least one
test Class IV High acute hazard
PE 100% in all tests Class V Very high acute hazard
This classification system is based on the mortality rates expressed following exposure of the
D. pulex and P. reticulata to the water samples collected from Site 1 to Site 4 (Table 4-4 and
Appendix B: Table B4).
Site 1

76
Site 1, during sampling period 1 and 2, fell into Class III category and water from this site
may present an acute hazard to aquatic organisms exposed to this water (Table 4-4 and
Appendix B: Table B4).
During sampling period 3, this site fell into Class IV category and water from this site may
present high acute hazard to exposed aquatic organisms (Table 4-4 and Appendix B: Table
B4).
Table 4-4: Classification of Site 1 water samples in terms of hazard that maybe as a
result of the aquatic environment.
Class Hazard Percentage Effect
(PE) Symbol
Sampling
period
Class III Acute hazard 50% ≤ PE ≤
100% S1 & S2
Class IV High acute
hazard
PE 100% in at
least one test S3
Site 2
According to Table 4-5 and Appendix 1: Table B4, Site 2 recorded a percentage effect (PE) of
20% during sampling period 1. Site 2 for this sampling period falls in Class I category and
water from this site may present no acute hazard to exposed aquatic organisms. Sampling
period 2 and 3 recorded a PE between 50% but less than or equal to 100%, falling within Class
III. Water from this site may present an acute hazard to exposed aquatic organisms (Table 4-
5 and Appendix B: Table B4).
Table 4-5: Classification of Site 2 water samples in terms of hazard that maybe as a
result of the aquatic environment.
Class Hazard Percentage Effect
(PE) Symbol
Sampling
period
Class I No acute hazard 20% ≤
S1

77
Class III Acute hazard 50% ≤ PE ≤ 100%
S2 & S3
Sites 3 and 4
Table 4-6 and 4.-7 as well as and Appendix 1: Table B4, indicate that during sampling period
1 and 2 both Site 3 and 4 fall into Class III category and water from these sites may present
acute hazard to exposed organisms.
During the third sampling period, Site 3 and 4 fall in Class I category with a PE of less than
20%, thus the water from these sites present no acute hazard to exposed organisms.
Table 4-6: Classification of Site 3 water samples in terms of hazard that maybe as a
result of the aquatic environment.
Class Hazard Percentage Effect
(PE) Symbol
Sampling
period
Class I No acute hazard 20% ≤
S3
Class III Acute hazard 50% ≤ PE ≤
100% S1 & S2
Table 4-7: Classification of Site 4 water samples in terms of hazard that maybe as a
result of the aquatic environment.
Class Hazard Percentage
Effect (PE) Symbol
Sampling
period
Class I No acute hazard 20% ≤
S3
Class III Acute hazard 50% ≤ PE ≤
100% S1 & S2

78
CHAPTER 5: DISCUSSION
The fundamental aim of this study was to investigate the possible effects of treated discharge
or acid mine drainage (AMD) into the Elsburgspruit from the active AMD treatment plant
located within the Witwatersrand Gold Mine site, Germiston South. The in-situ, general and
chemical water quality parameters as well as acute water toxicity analysis, were assessed in
order to evaluate the current state of the aquatic environment.
5.1 In-situ water quality parameters
5.1.1 Dissolve Oxygen
Botha (2013), described oxygen as an element that is soluble and spontaneously dissolves in
water. Some of the oxygen in streams is generated by aquatic plants and some is from
atmospheric diffusion. Dissolved oxygen (DO) is critical in the survival of aquatic organisms,
therefore it essential that DO is available in adequate concentrations (Dallas and Day, 2004).
The median DO for Site 1 was 3.87 mg/L and was low compared to the median of 9.00 mg/L
for Site 4 (Figure 4-4).
The low DO concentrations at Site 1 could be attributed to water decanting from the tailing
facilities and surrounding abandoned shafts of the mine into the Elsburgspruit. According to
Kossof et al. (2014), tailing facilities are structures that are established during the operational
phase of a mine for storage of crushed rocks and a volume of processed fluids from the
different processing plants. These fluid filled structures remain after the extraction of
economic metals, minerals, mineral fuels or coal from the mine resources and are
characterized by low oxygen concentration (Kossof et al., 2014). The higher concentration of
DO at Site 4 may be as a result of natural processes such as atmospheric diffusion and
instream turbulence (Vermeulen et al., 2011). An increase in the median of 5.7 mg/L was
noted for Site 2 with a decrease towards 5.1 mg/L at Site 3. At Site 2, the release of treated
AMD effluent into the Elsburgspruit increases the DO concentration while it naturally
decreases towards Site 3 because of the potentially slower flow rate of the stream (Coleman
et al., 2011).

79
5.1.2 Percentage Oxygen
The percentage oxygen (O2%) results from most of the sampling points did not conform to the
minimum target water quality range (TWQR) of 80 - 120% of the water quality guideline for
aquatic environments (WQG/AE) (DWAF, 1996) (Table 4-1). Site 2 has shown an increase in
the solubility of oxygen. This may be as a result of the mechanical aeration part of the active
treatment process of AMD to ensure that reduced metals such as Mn2+ and Fe2+ are oxidized
to Fe3+ and Mn4+ (Trumm, 2010). Statistically, there is a significant difference in the O2%
between Site 1 and 4. The O2% at all the sites was however above the critical level of 40%
(DWAF, 1996). According to Singh (2014), long term exposure of aquatic life to water with
oxygen concentrations below the minimum requirement of 80%, may be harmful to these
organisms. Dallas and Day (2004), explained that repeated exposure of aquatic organisms to
low oxygen concentrations may result in the organisms becoming behaviourally and
physiologically stressed.
5.1.3 Temperature
Temperatures for Site 1 and 4 were low when compared to temperatures for Site 2 and 3
(Table 4-1). Statistically, there is a significant difference in the temperature of Site 2 and 4
(Figure 4-1). These elevated temperatures recorded for Site 2 and 3 were as a result of the
warmer treated AMD effluent discharged directly from the treatment process (Site 2) and
mixing with the natural water. Treated AMD is usually kept in a clarifier before being released
into a stream (Bobbins, 2015) and according to Lafferty (2009), this standing water may have
a higher temperature compared to natural flowing water.
According to Coleman et al. (2011), increased temperatures in any stream result in an
increase in the toxicity and solubility of dissolved metals. Coleman et al. (2011), further
confirmed that this may result in a decrease in DO, resulting in the deprivation of aquatic
organisms of metabolic oxygen and affecting these organisms’ respiration. Botha (2013),
stated that the presence and survival of aquatic biota in a water body is dependent and
determined by temperature. Aquatic organisms prefer a specific range of temperature for
survival (Botha, 2013). In instances where an elevation or a drop is encountered in the
preferred range, a substantial decrease in individual species will result (USGS, 2013a). Abel
(1996), confirmed that lower temperatures could have a detrimental effect on the aquatic
organisms in the water during warmer periods, while these low temperatures could also affect
these organisms’ metabolic functioning, e.g. hypoxia of the central nervous system (DWAF,
1996).

80
5.1.4 pH
The pH results from most of the sites were above the TWQR of the WQG/AE (DWAF, 1996)
(Table 4-1 and Appendix 1: Table B1). The low pH at Site 1 (compared to the other sites)
(Table 4-1 and Appendix 1: Table B1) could be attributed to acidic water seeping from the
surrounding tailing facilities of the Witwatersrand Gold Mine into the Elsburgspruit.
From Site 1 to Site 2, the IBM SPSS v.25 Statistics Kruskal-Wallis test indicated a significant
difference (p<0.05) in pH between the sites (Figure 4-2), while the overall median pH values
for the sites were above the average pH of 4 for the TTAMDDS (DWA, 2012) (Table 4-1 and
Appendix 1: Table B1). The slight increase in pH at Site 2 could be attributed to the addition
of lime to the clarifiers to neutralize the AMD effluent before being released into the natural
stream (Johnson and Hallberg, 2005). The AMD Treatment Plant is thus successful in
reducing the levels of acidity of the effluent from the clarifier. The lowest pH was recorded
at Site 4 (Table 4-1 and Appendix 1: Table B1). Possible seepage of AMD from the tailings
facility that is located within the vicinity of Site 4, might influence the pH of the stream due to
high loads of salts. This could also be attributed to sulphate concentrations that were above
the WWLV (DWA, 2013) (Table 4-2 and Appendix 1: Table B2) at Site 4.
Toxicity and availability of trace metals, essential elements and non-metallic ions are
dependent on pH (Singh, 2014). According to DWAF (1996), in a stream with a decreased
pH, an increase in metals and non-metallic ions solubility, accompanied by a reduction in the
essential elements solubility, can be expected. Survival of aquatic biota in a water body
requires an optimum pH of between 6 to 9 (Netto et al., 2013). In instances where the aquatic
biota is exposed to pH levels higher or lower than the level of tolerance, osmoregulatory and
respiratory disorders resulting in fatalities may occur (Netto et al., 2013).
5.1.5 Electrical conductivity
Botha (2013), defined electrical conductivity (EC) as a parameter that can be used to measure
the amount of available total dissolved solids in water as well as ions in a solution. Taylor
(2004), also described EC as a parameter that determines the amount of dissolved material
available within a watercourse and as a result can be used as a pollution indicator. The EC
at all the sites were above the TWQR of the WQG/AE (DWAF, 1996) (Table 4-1 and Appendix
1: Table B1). This can be attributed to high levels of metals such as iron (Figure 4-7), zinc
(Figure 4-8), and manganese (Figure 4-9) present throughout the Elsburgspruit. According to
81
Akcil and Koldas (2006), high EC can be as a result of untreated AMD entering the stream.
At all four the sites, high metal concentrations can be due to treated AMD still containing high
metal concentrations (Site 2), while possible seepage from the tailing facilities in the direct
vicinity of both the Elsburgspruit and Elsparkspruit, can contribute to metals present in the
water, thus resulting in elevated levels of EC. Weber-Scannell and Duffy (2007), explained
that high concentrations of EC have the potential to affect aquatic organisms by reducing their
ability to cycle nutrients and reducing metabolic rates. The results of the IBM SPSS v.25
Statistics Kruskal-Wallis test showed no significant difference in EC between the four sites
(Appendix 1: Table B1).
It can be concluded that the AMD treatment plant is not effective in the reduction of metals,
thus resulting in high EC concentrations in the Elsburgspruit. It is recommended that
additional measures be put in place to reduce metals entering the Elsburgspruit, thus
decreasing the EC.
5.2 General Water Quality
5.2.1 Nitrate
US EPA (2012i), described nitrate as a source of nitrogen important to plant life. Both
Dallas and Day (2004) and the US EPA (2012a), explained that high levels of nitrate in a
water body may result in eutrophication. Nitrate concentrations recorded during the study
period, exceeded TWQR limit of 0.05 mg/L of the WQG/AE (DWAF, 1996), except for Site 4
during sampling period 3 (0.04 mg/L). These concentrations were below the general limit of
15 mg/L of the WWLV (DWA, 2013) (Appendix 1: Table A2). The presence of nitrate within
the Elsburgspruit as well as Elsparkspruit cannot attributed to AMD pollution, but municipal
wastewater discharge (Site 1 and above Site 4) as well as external factors such as possible
faecal waste (informal settlements on the stream banks) or fertilizers (US EPA, 2012a).
5.2.2 Sulphate
According to the United States Department of the Interior Bureau of Reclamation (USBR)
(2010), sulphate is a common salt in surface water as well as waters decanting from
defunct mines. Sulphates are harmful to aquatic ecosystems as it has the potential to
form sulphuric acid (Dallas and Day, 2004). Site 1 presented the highest sulphate

82
concentration of 3 260 mg/L (Table 4-2 and Appendix 1: Table A2). This may possibly be
due to a tailing facility at Site 1 leaching AMD into the stream, resulting in a low pH that
allows for sulphate formation. Sulphates decreased substantially at Site 2 as a result of
treated AMD effluent from the AMD treatment plant. The decrease in the sulphate
concentration indicates effectiveness of the treatment plant in treating the AMD (Johnson
and Hallberg, 2005). An increase in the sulphate concentration noted at Site 3 and Site
4, could also be an indication of additional seepage of AMD from bordering tailing facilities
coming into contact with the water at these sites. No Water Quality Guidelines for the
Aquatic Environment exist for sulphate in natural water, but according to the US EPA
(2005b), sulphate is toxic to aquatic organisms such as aquatic mosses and fish at
concentrations above 100 mg/L. The high concentrations of sulphates recorded at Site 1,
3 and 4 could result in detrimental effects on the aquatic life.
5.2.3 Nitrite
During the conversion of nitrogen to nitrate, nitrite is formed as a result of nitrogen
oxidation (Dallas and Day, 2004). Concentrations of nitrite rise slightly from Site 1 to 2
(Table 4-2 and Appendix 1: Table B2), which could be ascribed to the water from Site 2
coming into contact with water from Site 1 which is the main recipient of municipal
wastewater discharge and external factors such as possible faecal waste (informal
settlements on the stream banks) or fertilizers (US EPA, 2012a).
5.2.4 Ammonia
Ammonia is described by Singh (2014), as a constituent of nitrogen that is toxic to aquatic life.
Singh (2014), further described ammonia as an element that does not contribute to
eutrophication of the stream upon availability in high concentrations. Furthermore, at high pH
as well as high temperature, the toxicity of ammonia in water becomes exacerbated (Singh,
2014).
Ammonia concentrations recorded at all sites during all the sampling periods, exceeded the
TWQR limit of 0.007 mg/L for the WQG/AE (DWAF, 1996) and at some sites the WWLV (DWA,
2013) (Table 4-1 and Appendix 1: Table B1). High ammonia concentration at Site 2 compared
to the other sites, is a result of the AMD treatment plant (Table 4-1 and Appendix 1: Table B1).

83
The AMD treatment process uses anhydrous ammonia as part of the process to raise the pH
in an effort to neutralize acidity and precipitate metals.
Site 1 and Site 3 ammonia concentrations were all below the WWLV (DWA, 2013) of 6 mg/L,
but above 0.007mg/L limit stipulated by the TWQR of the WQG/AE (DWAF, 1996). The lower
ammonia concentration at Site 1 (compared to Site 2), may possibly be due to the discharge
of municipal wastewater into the Elsburgspruit, while Site 3 resulted in the mixing of treated
water (Site 2) coming into contact with the untreated water from Site 1. Ammonia
concentrations at Site 4 may be due to possible discharge from municipal wastewater entering
the Boksburg Lake, which drains into Cinderella Dam and eventually feeds into the
Elsparkspruit. Precautionary measures must be implemented during application of lime to the
AMD treatment process, as this has the potential to increase the pH which in turn results in
an increase in the toxicity of ammonia. Dallas and Day (2004), stated that ammonia is toxic
to aquatic life, since it affects respiratory systems of many organisms.
5.2.5 Orthophosphate
Orthophosphate concentrations recorded along the Elsburgspruit as well as in the
Elsparkspruit, were all below the target of the WWLV of 10 mg/L (DWA, 2013). The presence
of orthophosphates within the study site is ascribed to municipal waste water discharge.
Phosphorus, which is the main constituent of orthophosphate, is an essential element that
stimulate plant growth (Oram, 2009). Oram (2009), described orthophosphates as being
produced by natural processes as well as treated and untreated sewage. Furthermore,
unpolluted fresh waters have very low concentration of orthophosphate which is available to
the biological community (Oram, 2009). At high concentrations in water, orthophosphate can
lead to eutrophication of the stream resulting the phytoplankton over production (Oram, 2009).
According to Baxter (2011), not all the species are able to survive and carry out their functions
under increased primary production conditions, some species find it difficult to adjust to
changes in natural conditions.
5.3 Metal, non-metals and metalloids analysis
The following metals were analysed: Aluminium, Iron, Zinc, Manganese, Calcium, Cobalt,
Copper, Boron, Potassium, Magnesium, Sodium, Silicon, Sulphur, Strontium and Nickel. The
metal concentrations were compared to the target water quality range (TWQR), the Critical
Effect Value (CEV) and Acute Effect Value (AEV) prescribed in the water quality guidelines

84
for the aquatic environment (WQG/AE) (DWAF, 1996), the target treated acid mine drainage
discharged standards (TTAMDDS) (DWA, 2012) and the wastewater limit values (WWLV)
(DWA, 2013).
5.3.1 Aluminium
Eight percent of the earth’s crust is made up of aluminium and is described by the World
Health Organisation (WHO) (2004b), as a metallic element that is most abundant on earth and
exists naturally within the environment. Even though aluminium concentrations at all sites
were below the TTAMDDS of <1 mg/L (DWA, 2012), high concentrations where noted at Site
2, with a decrease noted towards Site 3 and Site 4 (Figure 4-5 and Appendix 1: Table B3).
The high aluminium concentration at Site 2 was above the CEV and AEV of the WQG/AE
(DWAF, 1996). According to DWAF (1996), aluminium is said to be highly toxic to aquatic life.
It is evident that the treated AMD released into the Elsburgspruit at Site 2, still contains
aluminium and although the AMD treatment plant is achieving its set goals (concentrations
below TTAMDDS), aquatic life can be affected due to the high aluminium concentrations at
Site 2. The lower concentration of aluminium recorded at Site 4, indicates that this site is less
affected by possible AMD compared to the sites located within the Elsburgspruit.
5.3.2 Iron
Botha (2013), described iron as a metal that make up about 5 % of the earth‘s crust. According
to the US EPA (2013f); iron exists freely in groundwater. Exposure of iron to oxygen, results
in the formation of iron oxidises contributing to discolouration of water. The total iron
concentrations within the study area ranged between 0.019 and 0.86 mg/L (Figure 4-7 and
Appendix 1: Table B3). The iron concentrations recorded for all the sites were below the
TTAMDDS of <1 mg/L (DWA, 2013), some of the results from the sites were above the WWLV
(DWA, 2013), while some results did not conform to the US EPA (2013e) limit of 0 – 0.3 mg/L.
The AMD treatment plant is to a certain extent achieving its goal of reducing the iron
concentrations to below the TTAMDDS of <1 mg/L, (DWA, 2013). Sites 1, 3 and 4 are
presenting slightly higher iron concentrations compared to Site 2. The availability of iron
concentrations may be due to possible seepage of AMD from surrounding tailing facility into
the streams.

85
5.3.3 Zinc
According to Dallas and Day (2004), mammals require zinc for protein synthesis. During many
of the sampling periods, zinc results were above the TWQR and CEV of the WQG (DWAF,
1996) and the WWLV (DWA, 2013, but below the AEV of the WQG/AE (DWAF, 1996) (Figure
4-8 and Appendix 1: Table B3). Dallas and Day (2004), also explained that high levels of zinc
are of concern since zinc has the potential to detrimentally affect aquatic life. Exposure of
algal species to high levels of zinc, results in algae becoming the dominant species (Dallas
and Day, 2004). Availability of zinc at all the sites could be due to various factors such as that
aquatic systems have zinc as a naturally occurring micronutrient, it can be due to the
underlying geology (Botha, 2013) and the AMD treatment plant is not reducing zinc
concentrations before the effluent enters the Elsburgspruit.
5.3.4 Manganese
Dallas and Day (2004), described manganese as an essential micronutrient that is regarded
as toxic when available in high concentrations and may lead to skeletal deformities in
vertebrates when available in low concentrations. Manganese concentrations recorded for all
the sites were below the TTAMDDS of <3 mg/L (DWA, 2012), with a high concentration of 2
mg/L recorded at Site 3 (Figure 4-9 and Appendix 1: Table B3). Manganese concentrations
at Site 1, 3 and 4 were above the CEV and AEV of the WQG/AE (DWAF, 1996) and the WWLV
(DWA, 2013). The increase in manganese concentration recorded downstream of the AMD
treatment plant, may possibly be due to treated AMD effluent coming into contact with
untreated water or possible seepage of AMD from surrounding tailing facility into the system.
Concentration of manganese at Site 2 was below target ranges of the different guidelines,
thus the AMD treatment plant is effectively reducing the levels of manganese in the water.
Availability of manganese at Site 4 could be attributed to leaching of minerals from the
underlying geology (Vermeulen et al., 2011) or possible seepage of untreated mine water from
tailing facilities in the vicinity of the site. Exposure of aquatic life to high levels of manganese
can have detrimental effects, since manganese has potential to bio-concentrate (WHO,
2004b). An increase in mortality rates results from exposure of some aquatic organisms to
high concentration of manganese (Stubblefield et al., 1997).
5.3.5 Calcium
According to Botha (2013), calcium along with magnesium, are naturally existing alkaline
minerals in water bodies that determine water hardness. WQG/AE (DWAF, 1996) described

86
calcium as a component that plays an important role in the skeletal hardness of mammals.
High calcium concentrations at Site 2 could be attributed to the addition of limestone to the
AMD treatment process with the intention to increase the pH thus reducing acidity (Johnson
and Hallberg, 2011) as oppose to lower concentrations recorded at Site 1. Availability of
calcium at Site 3 and Site 4 can possibly be attributed calcite dissolution, and underlying
geology which is rich in dolomitic composition (Coleman et al., 2011).
5.3.6 Cobalt
Cobalt is described by Dallas and Day (2004), as a micronutrient that is essential to mammals,
yet toxic upon availability in small quantities. Furthermore, cobalt is available in the
environment in very low quantities. Exposure of the aquatic life to cobalt that is inorganic and
soluble, may result in toxicity (Dallas and Day, 2004), while insoluble inorganic cobalt is
carcinogenic. Cobalt concentrations were below TWQR of <10 mg/L of the WQG/AE (DWAF,
1996) at all the sites (Figure 4-12 and Appendix 1: Table B3). The presence of cobalt at Site
4, could potentially be ascribed to underlying geological structures with higher concentrations
of cobalt in the mineralogy (Botha, 2013).
5.3.7 Copper
Copper is regarded as an essential trace element that may become toxic at higher
concentrations (Abel, 1996). However, the toxicity of copper may be reduced in the presence
of zinc and sulphate (Olubami, 2006). Copper concentrations were all below the WWLV
(DWA, 2013) (Figure 4-10). Copper was only detectable at Site 2. The most likely source of
copper is dissolution from pipework and plumbing fittings within the AMD treatment plant over
a period of time (Barrett and Simmons, 2003).
5.3.8 Nickel
The US EPA (1994b), consider nickel as a metal that has potential to pose a threat to aquatic
life due to its hazardous composition, even when available in small doses. An increase in the
nickel concentrations at Site 3 could be ascribed to additional seepage of AMD into the
Elsburgspruit from the surrounding tailing facilities, as well as treated water coming into
contact with untreated water. A decrease in nickel at Site 2 indicates that the AMD treatment
plant is to a certain extent decreasing nickel concentrations in the water. An increase in nickel
concentrations noted at Site 4 (Figure 4-10 and Appendix 1: Table B3) and could be attributed
87
to possible leaching of metals from underlying geology as well as seepage from the tailing
facility into the Elsparkpruit (US EPA, 1994; Bowell and Parshley, 2005).
5.3.9 Boron
The US EPA (1985), described boron as an element that is ubiquitous in the environment as
well as naturally occurring in over 80 minerals. It is understood that boron makes up 0.001%
of the crust of the earth (US EPA, 1985). Site 1 presented the highest concentration of boron,
with a decrease noted towards Site 2 and 3, and a low concentration recorded at Site 4
(compared to the other sites) (Figure 4-11 and Appendix 1: Table B3). Butterwick et al. (1989),
described the major source of boron in aquatic system as the natural weathering of rocks that
contain boron. Availability of boron at all sites can be attributed to possible natural weathering,
but the high concentrations at Site 1 may also be as a result of municipal wastewater
discharge.
Sahely et al. (2006), did a literature review of Canadian wastewater discharges with the aim
to characterize the content of municipal effluent. Results from this review revealed that treated
and raw effluent released from Western Canadian wastewater treatment plants, all contain
between 110 to 180 µg/L boron. This confirms that the municipal wastewater does contribute
to boron concentrations but some may result from underlying geology.
5.3.10 Potassium
Potassium is described by Talling (2010), as a plant nutrient and a bio-constituent that when
available in high concentrations in inland waters, has a potential to limit the growth and
distribution of aquatic organisms. The highest concentration of potassium recorded at Site 1
(compared to the other sites), can be ascribed to municipal waste water discharge, with the
lowest concentration recorded at Site 2 (Appendix 1: Table B3). Talling (2010), further
confirmed that high concentrations of potassium can be toxic in natural waters.
5.3.11 Magnesium
Site 1 and Site 2 presented the lowest concentrations of magnesium, with an increase noted
at Site 3 and Site 4 (Appendix 1: Table B3). Soil types and the composition of underlying
geology may contribute to the levels of magnesium in natural water (US EPA, 1994b; Galan
et al., 2003). According to Galan et al. (2003), dolomites such as calcium magnesium
88
carbonate (CaMg (CO3)2) and magnesite (magnesium carbonate; MgCO3) contains
magnesium, that can potentially end up in water through natural processes such as erosion.
In addition, Galan et al. (2003), further explained that industries such as wastewater treatment
plants apply magnesium as a flocculent to waste water treatment, which in the case of the
Elsburgspruit, could explain the source of magnesium.
5.3.12 Sulphur
Site 1 and Site 2 recorded low concentrations of sulphur compared to higher
concentrations noted at Site 3 and a decrease at Site 4 (Appendix 1: Table B3). Bayer and
Finkel (2006), described sulphur as a major anion in waters located in forested headwater
catchments affected by air pollution and high concentration of SO24. The sulphur
concentration detected at Site 3, could be attributed to additional seepage of AMD into the
Elsburgspruit from the surrounding tailing facilities that produces sulphur in the form of
sulphates as well as possible bedrock weathering (Akcil and Koldas, 2006). ANZECC and
ARMCANZ (2000), described sulphur as a metal that binds organics, and has the potential
to influence the toxicity of the water.
5.3.13 Strontium
Strontium was detected at all the study sites, with the highest concentrations recorded at
Site 4 compared to the other sites’ concentrations (Appendix 1: Table B3). Strontium is
introduced into natural waters by underlying calcareous rocks, limestone, evaporite and
dolomite (Pacholski, 2009). Availability of strontium at all site may possibly be attributed
to underlying geology. Pacholski (2009), described strontium as not harmful to aquatic life if
available as background concentrations, however industrial processes such as mining, has
the potential to impact waters by increasing the strontium concentrations and in turn increasing
the water toxicity.
5.3.14 Sodium
Dallas and Day (2004), described sodium as an ion that plays a role in the water and ionic
balances of organisms. Furthermore, Dallas and Day (2004), explained that sodium is
commonly found in natural waters and has the potential to impact aquatic life by

89
contributing to the concentrations of total dissolved solids in water. Sodium
concentrations were recorded at all sites, with the lowest concentration recorded at Site 1
and the highest at Site 4 (Appendix 1: Table B3). Availability of sodium at all sites may be
as result of exposing underlying geology that is rich in sodium composition to acidic
conditions resulting in leaching of sodium (Bowell and Parshley, 2005). The high
concentrations of sodium recorded at Site 4 may suggest possible seepage of AMD from
the tailing facilities close to the Elsparkspruit at Site 4.
5.3.15 Silicon
Silicon was detected at all the study sites, with the highest concentrations recorded at Site 4
(compared to the other sites) (Appendix 1: Table B3). Doremus (1976), described silicon as
an element that is the most abundant element on earth after oxygen. Silicon is found in
freshwaters as silic acid, as well as various minerals (Doremus, 1976). According to Doremus
(1976), silicon is generally harmless when present in water, because it is naturally present in
large amount. However, high concentrations of this element have the potential to limit algal
growth.
5.4 Acute Water Toxicity Analysis and Hazard
classification
Dave (1993), described Daphnia pulex and Poecilia reticulata as common freshwater
species that are used as bio-indicators of water quality, through illustrating the acute and
chronic effects of possible chemicals on the aquatic environment.
In situ water quality parameters such as electrical conductivity (EC) presented high
concentrations at all sites, with low concentrations recorded for DO and O2% (Table 4-1
and Appendix 1: Table B1). Possible metals seeping from the Witwatersrand Gold Mine
tailing facilities and the AMD treatment plant, may contribute to the concentrations of these
parameters. Percentage oxygen (O2%) results for the sites, were below the minimum TWQR
of 80 - 120% for the WQG/AE) (DWAF, 1996) (Table 4-1 and Appendix 1: Table B1) but above
the critical concentration of above 40%. The EC at all the sites were above the TWQR of the
WQG/AE (DWAF, 1996) (Table 4-1 and Appendix 1: Table B1). This can be attributed to high
concentrations of metals present in the Elsburgspruit (Figures 4-7, 4-8 and 4-9). According
90
to Driesen (2015), Daphnia is sensitive to temperature, pH, dissolved oxygen,
conductivity, and chemical contaminants.
Acute water toxicity results for Site 1 indicated that this site was classified as Class III and IV
during the sampling period (Table 4-4 and Appendix 1: Table B4). High mortality results were
recorded for both daphnia and guppies. This may be due to metals that are present in the
water at this site (Figures 4-5 (aluminium), 4-7 (iron), 4-8 (zinc) and 4-9 (manganese)) because
of possible seepage from the tailing facility close to this site and municipal waste water
entering the spruit at this point. High mortality is attributed to the physiological stress
experienced by the exposed organisms as a result of exposure to metals (Mason, 2002).
A slight improvement in acute water toxicity results were noted for Site 2, 3 and 4 (Table
4-4 – 4.7 and Appendix 1: Table B4). These sites were classified as Class I and Class III
in terms of hazard classification during the sampling period. Electrical conductivity and
other water quality parameters such as ammonia, nitrite and nitrate as well as various
metals (such as boron, iron, manganese calcium, cobalt, potassium, magnesium, sodium,
nickel, silicon, strontium, sulphur and zinc), were above the different water quality
guidelines used during this study. These parameters result from municipal wastewater
discharge, treated AMD effluent from the AMD treatment plant and seepage from the
tailings facilities in close proximity to the sites as well as natural geological processes.
Considering the above, it is evident that these parameters all have an effect on the survival of
these test organisms and in turn will also affect the survival of other aquatic organisms within
the Elsburgspruit and Elsparkspruit.

91
CHAPTER 6: CONCLUSION AND RECOMMENDATIONS
6.1 Conclusion
The main objective of this study was to evaluate the effects of effluent discharged from an acid
mine drainage (AMD) treatment plant on the aquatic health of the Elsburgspruit, through
investigating the water quality of the Elsburgspruit. Freshwater resources in South Africa (SA)
are under constant threat from pollution. Acid Mine Drainage is one of the major polluters
resulting in a decrease in pH of water, a rise in certain metals and sulphate concentrations,
thus negatively affecting water quality.
6.1.1 Hypothesis
The hypothesis stated that the water quality of the Elsburgspruit is being negatively
affected by effluent discharged from the acid mine drainage treatment plant located in
the Germiston area.
The Department of Water and Sanitation (DWS) constructed an AMD treatment plant close to
Germiston’s Central Business District (CBD) and the treatment plant came into operation in
May 2014. From the study it was evident that the AMD treatment plant treats acid water to a
level where it is no longer acidic and where some of the dissolved salts and metals are
removed. It was also clear that water quality parameters such as electrical conductivity (EC)
and metals such as aluminium, iron, zinc and manganese, did not comply with the various
water and AMD discharge standards. The water quality from the Elsburgspruit is still a
concern, harmful to aquatic organisms and not suitable for human consumption.
The hypothesis is thus accepted.
6.1.2 Aim of this study
The aim of this study was to evaluate the effects of effluent discharged from an AMD
treatment plant on the aquatic health of the Elsburgspruit, through investigating the
water quality of the Elsburgspruit.
The water quality of the Elsburgspruit was assessed through addressing various in-situ and
general water quality parameters, as well as metal and acute water toxicity analysis. Results
indicated that some of the in-situ, general water quality parameters and metals did not comply
with water and AMD discharge guidelines. In-situ water quality parameter such as electrical
conductivity and dissolved oxygen did not comply to the target water quality range (TWQR)
prescribed in the water quality guidelines for the aquatic environment (WQG/AE), as well as
92
the target treated acid mine drainage discharged standards (TTAMDDS) (DWA, 2012). The
same was noted with ammonia, nitrates, nitrites as well as sulphates, with the concentrations
not complying with the wastewater limit value (WWLV) (DWA, 2013) and TWQR of the
WQG/AE (DWAF, 1996) guidelines. Metals such as aluminium, iron, zinc and manganese
presented concentrations that were above the limits prescribed within the TWQR of the
WQG/AE (DWAF, 1996), WWLV (DWA, 2013) and TTAMDDS (DWA, 2012). From the above
results, it is thus evident that water quality of the Elsburgspruit do not comply with various
water and AMD discharge standards. The water quality is negatively affected by effluent from
the AMD treatment plant and possibly the direct mining environment.
The aim of this study was successfully met.
6.1.3. Objectives of this study included:
6.1.3.1 Assess the water quality of the Elsburgspruit by focusing on in-situ and general
water quality parameters as well as metal analysis. The following water quality parameters
were used to evaluate the water quality of the Elsburgspruit. In-situ water quality parameters
such as water temperature, pH, electrical conductivity (EC) and dissolved oxygen (%
saturation and mg/L) were measured and recorded. Metals such as aluminium, iron, zinc,
manganese, calcium, cobalt, copper, boron, potassium, magnesium, sodium, silicon, sulphur,
strontium and nickel were analysed. Anions such as sulphates, orthophosphates, nitrates,
nitrites and ammonia were determined.
This objective was achieved.
6.1.3.2 Compare the water quality parameter results to different water quality
guidelines.
The data collected from in-situ water quality parameters, general water quality parameters,
and ICP OES or metal analysis was compared to the Target Water Quality Range (TWQR) of
the water quality guideline for the aquatic environment (WQG/AE) (DWAF, 1996) developed
by the department of Water and Sanitation (DWS) with specific focus on Chronic Effect Value
(CEV) and Acute Effect Value (AEV). The data collected was also compared to the target
treated acid mine drainage discharged standards (TTAMDDS) (DWA, 2012) as well as the
wastewater limit values (WWLV) (DWA, 2013).
Some of the parameters such as EC and dissolved oxygen did not comply with the target
water quality range (TWQR) prescribed by the WQG/AE (DWAF, 1996), as well as the
TTAMDDS (DWA, 2012). Parameters such as ammonia, nitrates, nitrites and sulphates
presented results that were above the WWLV (DWA, 2013) and TWQR of the WQG/AE

93
(DWAF, 1996). Metals such as aluminium, iron, zinc and manganese, did not comply with the
various water and AMD discharge standards.
This objective was achieved.
6.1.3.3 Assess the water toxicity by using Daphnia pulex and Poecilia reticulata as
bioindiactors for acute water toxicity analysis as well as possible influence of the
effluent from the AMD treatment plant based on the water toxicity analysis and water
quality parameters. This objective has been achieved.
Part of the original study was the use of the South African Scoring System (SASS) Version 5
Rapid Bio Assessment method for Rivers, (Dickens and Graham, 2002), to assess the
presence of macroinvertebrate species within the Elsburgspruit and Elsparkspruit. The
complete absence of macroinvertebrates at the sampling sites during this study, prompted the
use of acute water toxicity tests to evaluate the possible toxicity of the spruit’s water to aquatic
organisms.
Acute water toxicity analysis was performed using Daphnia pulex and Poecilia reticulata
bioassays. A hazard classification system, developed by Persoone et al. (2003), was used to
score and classify each site, based on the mortality responses recorded for each site following
exposure of D. pulex and P. reticulate to the effluent from the study area. From the results it
was evident that Site 1 was classified as Class III and IV during the sampling period. High
mortality results were recorded for both daphnia and guppies.
A slight improvement was noted in results for Site 2, 3 and 4 (Class I and III during the
sampling period). From the toxicity results it was evident that all the sites were affected by
the presence of metals (iron, manganese and aluminium) and various other water parameters
that were above the different guidelines used to evaluate the water quality of the Elsburgspruit.
Although Site 4 was selected as a reference site, water quality from this site is also affected
by various pollutants within the vicinity of the site. The water of the Elsburgspruit and the
Elsparkspruit is still considered a concern despite the implementation of an AMD treatment
plant. The remediation methods implemented by the treatment plant are to some extent
effective resulting in an increase in the pH of the effluent. However, additional factors such
as underlying geology, possible AMD seepage from tailing facilities in close proximity of
many of the sampling sites and waste water released into the Elsburgspruit, are
contributing to the current aquatic health of the spruit and should be investigated further.
This objective was achieved.
94
6.2. Recommendations
6.2.1. An additional study that will look at the effects of AMD on the sediments
should be considered.
Accumulation of contaminants from the water column in sediment is a concern. Introducing
the contaminants back into the water column may result in an environmental risk. It has the
potential to affect all living organisms in the water environment and those that rely on water
from the spruit for basic human needs and survival. The proposed sediment study should
include physico-chemical, general water quality and metal analysis, as well as sediment
toxicity analysis. The proposed study should assess sediments through implementation of
Diptera bioassay, Phytotoxkit-F and Ostracodtoxkit-F. In addition, the study should determine
if there is a linear decrease sediment toxicity from site 1 (Upstream) to site 4 (Downstream).
6.2.2. Despite the somewhat positive effects of the ADM treatment plant,
additional treatment of the water was still required.
Additional treatment should include precautionary measures that must be implemented during
application of lime to the treatment process, as this has potential to increase the pH which in
turn results in an increase in the toxicity of ammonia.
6.2.3. Additional seepage areas along the Elsburgspruit should be identified.
Results of this study showed the possibility of additional seepage of the AMD upstream and
downstream of the ADM treatment plant. This is supported by the increase in metal and
sulphate concentrations. The AMD treatment plant must implement additional monitoring to
identify problematic areas within the stream prone to additional seepage. Mitigation measures
must be implemented to manage the impacts resulting from additional seepage.
According to the South African constitution, everyone has a right to a clean environment that
is not harmful to their health and well-being. Pollution of water resources by industries and
companies is a direct contravention of a human right. The South African government should
focus on developing stricter control measures that will encourage industries and companies
to comply with the effluent discharge standards and guidelines developed by DWS. The
“polluters must pay” principle must be enforced on all the polluters. Companies and industries
should be held accountable for all their activities leading to pollution resulting in detrimental
effects on the aquatic environment. Rehabilitation guarantees must form part of the mining
right application to avoid environmental impacts emanating from abandoned mining activities
as a result of a lack of rehabilitation funds. The National Environmental Management Act
(NEMA) (Act 107 of 1998) principles must be enforced on companies and industries with the

95
assistance of Department of Environmental Affairs, GDARD and Department of Water and
Sanitation to make sure that industries and companies comply with environmental legislation.

96
REFERENCES
Abel, P.D., 1996. Water Pollution Biology. 2nd Edition, Taylor and Francis. London.
Adendorff, A., 1997. Effects of mining activities on selected aquatic organisms, Unpublished
PhD Thesis, Rand Afrikaans University, Johannesburg.
Adler, R.A., Claassen, M., Godfrey, L. and Turton, A.R., 2007. Water, mining, and waste: an
historical and economic perspective on conflict management in South Africa. The
economics of peace and security journal, 2: 2.
Akcil, A. and Koldas, S., 2006. Acid mine drainage (AMD): causes, treatment and case
studies. Journal of cleaner production, 14: 12-13.
ANZECC and ARMCANZ (Australian and New Zealand Environment and Conservation
Council and Agriculture and Resource Management Council of Australia and New
Zealand). 2002, A., 2000. Australian and New Zealand guidelines for fresh and marine
water quality. Volume 1. The guidelines. ANZECC and ARMCANZ, Artarmon.
Ashton, P.J., 2002. Avoiding conflicts over Africa’s water resources. Ambio, 31: 236-242.
Barrett, J. and Simmons, C., 2003. An ecological footprint of the UK: Providing a tool to
measure the sustainability of local authorities. York: Stockholm Environment Institute,
University of York.
Basson, G.R., Pulles, W. and Rooseboom, A., 1996. A manual on mine water treatment and
management practices in South Africa. WRC report no 527/1/96.
Bayer, P. and Finkel, M., 2006. Life cycle assessment of active and passive groundwater
remediation technologies. Journal of Contaminant Hydrology, 83: 3–4.
Bell, F.G., Bullock, S.E.T., Hälbich, T.F.J. and Lindsay, P., 2001. Environmental impacts
associated with an abandoned mine in the Witbank Coalfield, South
Africa. International Journal of Coal Geology, 45: 2-3.
Bezuidenhout, L.M., Schoonbee, H.J. and De Wet, L.P.D., 1990. Heavy metal content in
organs of the African sharptooth catfish, Ciarías gariepinus (Burchell), from a
Transvaal lake affected by mine and industrial effluents. Part 1. Zinc and
Copper. Water SA, 16.
Botha, E., 2013. Assessment of the surface water quality of the Tweelopiespruit, Gauteng,
South Africa. (Masters dissertation, University of Pretoria).

97
Bowell, R.J. and Parshley, J.V., 2005. Control of pit-lake water chemistry by secondary
minerals, Summer Camp pit, Getchell mine, Nevada. Chemical Geology, 215: 1-4.
Bozeman, S.R. and Montana, D.R., 2008. Acid mine drainage and effects on fish health and
ecology: A review. Reclamation Research Group: 25-38.
Braune, E., Hollingworth, B., Xu, Y., Nel, M., Mahed, G. and Solomon, H., 2008. Protocol for
the Assessment of the Status of Sustainable Utilization and Management of
Groundwater Resources with Special Reference to Southern Africa: Report to the
Water Research Commission. Pretoria: Water Research Commission.
Butterwick, L., de Oude, N. and Raymond, K., 1989. Safety assessment of boron in aquatic
and terrestrial environments. Ecotoxicology and environmental safety,17: 3.
Cabri, L.J., 2002. The geology, geochemistry, mineralogy and mineral beneficiation of
platinum-group elements. Canadian Institute of Mining, Metallurgy and Petroleum. Vol
54.
Canadian Council of Ministers of the Environment. 2009. Canadian water quality guidelines
for the protection of aquatic life: Boron. In: Canadian environmental quality guidelines,
2009, Canadian Council of Ministers of the Environment, Winnipeg.
Caraballo, M.A., Macías, F., Rötting, T.S., Nieto, J.M. and Ayora, C., 2011. Long Term
Remediation of Highly Polluted Acid Mine Drainage: A sustainable approach to restore
the environmental quality of the Odiel river basin. Environmental Pollution, 159: 12.
Coetzee, H., Hobb, P.J., Burgess, A., Thomas, M., Keet, B., Yibas, D., Van Tonder, D., Netili,
F., Rust, V., Wayde, P., and Maree, J. (2010). "Mine water management in the
Witwatersrand Gold Fields with special emphasis on acid mine drainage." Report to
the inter-ministerial committee on acid mine drainage: 1-128.
Coetzee, H., Singh, M. and Roux, R., 2008. Risks related to the flooding of gold mines in the
Central Rand. West Rand and KOSH Goldfields: Department of Minerals and Energy,
Pretoria, Council for Geoscience, Report, (2008-0241).
Coleman, T.J., Usher, B., Vermeulen, D., Scholtz, N. and Lorentz, S., 2011. Prediction of how
different management options will affect drainage water quality and quantity in the
Mpumalanga coal mines up to 2080. WRC Research Report, (1628/1).

98
Conley, J, N., Cariello, P. and Buchwalter, D. 2010. Preliminary investigations of TDS toxicity
and sulfate trafficking in mayflies. PowerPoint presentation. Presented at SETAC,
November 7- 11, 2010. Portland.
Cortina, J-S, Lagreca, I. and De Pablo, J., 2003. Passive in situ remediation of metal-polluted
water with caustic magnesia: Evidence from Column Experiments. Environmental
Science and Technology, 37: 9.
Council of Geoscience (CGS). 2010. Report to the Inter-Ministerial Committee on Acid Mine
Drainage. Mine water management in the Witwatersrand Gold Fields with special
emphasis on acid mine drainage. Prepared by The Expert Team of the Inter-Ministerial
Committee under the coordination of the Council of Geoscience: 6-12.
Dallas, H.F. and Day, J.A., 1993. The effect of water quality variables on riverine ecosystems:
a review. Freshwater Research Unit, University of Cape Town.
Dallas, H.F and Day, J.A., 2004. The Effect of Water Quality Variables on Aquatic Ecosystems:
A Review. Report Number: TT 224/04.Water Research Commission.
Dave, G., 1993. Replicability, repeatability and reproducibility of embryo-larval toxicity tests
with fish. In: Soares, A.M.V.M. and Calow, P., (Eds.). Progress in standardisation of
aquatic toxicity tests, CRC Press.
De Beer, M., 2005. Treatment of acid mine drainage and acidic effluents (Doctoral
dissertation, North-West University).
Department of Water Affairs (DWA). 2012: Feasibility Study for a Long-Term solution to
Address the Acid Mine Drainage Associated with the East, Central and West Rand
Underground Mining Basins. Assessment of the Water Quality and Quality of the
Witwatersrand Mine Voids. DWA Report No.: P RSA 000/00/16512/2 Pretoria, South
Africa.
Department of Water Affairs and Forestry (DWAF). 1996. South African Water Quality
Guidelines. Volume 7: Aquatic Ecosystems.
Department of Water Affairs (DWA). 2013. Revision of general authorisations in terms of
Section 39 of the National Water Act, 1998 (Act No. 36 of 1998), No. 665. Government
Gazette, (36820).
Doremus, R.H., 1976. Oxidation of silicon by water and oxygen and diffusion in fused
silica. The Journal of Physical Chemistry, 80: 16.

99
Driesen, K., 2015. Acute aquatic toxicity test of caffeine with Daphnia magna Straus and
biomonitoring of PRB and Intensive Green Filter wastewater treatment systems.
Masters Dissertation, Universiteit Gent.
Durand, J.F., 2012. The impact of gold mining on the Witwatersrand on the rivers and karst
system of Gauteng and North West Province, South Africa. Journal of African Earth
Sciences, 68.
Ekurhuleni Metropolitan Municipality (EMM). 2007. Environmental Management
Framework. Ekurhuleni Metropolitan Municipality, Ekurhuleni.
ERMITE Consortium. 2004b. Workshop Report 2.1 1st UK Stakeholder Meeting. Nuttall, C.,
Amezaga, J.M., & Younger, P.L. (Eds). Online. Available at: http://www.minewater.net
Ferrar, A.A. and Lötter, M.C., 2007. Mpumalanga biodiversity conservation plan
handbook. Mpumalanga Tourism & Parks Agency, Nelspruit.
Fromm, P.O., 1980. A review of some physiological and toxicological responses of freshwater
fish. Environmental Biology of Fish, 5 (1): 79-93.
Gaikwad, R.W. and Gupta, D.V., 2008. Review on removal of heavy metals from acid mine
drainage. Applied ecology and environmental research, 6: 3.
Galán, E., Gómez-Ariza, J.L., González, I., Fernández-Caliani, J.C., Morales, E. and Giráldez,
I., 2003. Heavy metal partitioning in river sediments severely polluted by acid mine
drainage in the Iberian Pyrite Belt. Applied Geochemistry, 18: 3.
Gauteng C-Plan Version 2. 2006. Gauteng Department of Agriculture, Conservation and
Environment.
Genter, R.B., 1995. Benthic algal populations respond to aluminum, acid, and aluminum-acid
mixtures in artificial streams. Hydrobiologia, 306: 1.
Geographical Information System (GIS), S.B., 2007. Biodiversity Geographical Information
systems. Retrieved, 10 (23). 2014.
Godfrey, L.K., Oelofse, S.H., Phiri, A., Nahman, A. and Hall, J., 2007. Mineral waste: the
required governance environment to enable re-use. Report No.
CSIR/NRE/PW/IR/2007/0080/C.
100
Gray N. F. (1997) Environmental impact and remediation of acid mine drainage: a
management problem. Environmental Geology 30: 62-71.
Greig, H.S., Niyogi, D.K., Hogsden, K.L., Jellyman, P.G. and Harding, J.S. 2010. Heavy
Metals: Confounding factors in the response of New Zealand Freshwater fish
assemblages to natural and anthropogenic acidity. Science of the Total Environment,
408: 3240-3250.
Hale, J.G., 1977. Toxicity of metal mining wastes. Bulletin of environmental contamination and
toxicology, 17: 1.
Hallberg, K.B. 2010. New Perspectives in Acid Mine Drainage Microbiology. Hydrometallurgy,
104: 448-453.
Hellawell, J.M., 1986. Biological indicators of freshwater pollution and environmental
management. Elsevier applied science publishers, London.
Hendriks, H. and Rossouw, J.N. 2009. Adopt-a-River Programme Phase II: Development of
an Implementation Plan. Water Resource Quality Situation Assessment. Prepared by
for Department of Water Affairs, Pretoria, South Africa.
Heyl, A.J. 2007. Effect of mining effluent on the distribution of fresh water invertebrates in the
Tweelopiespruit, Gauteng. Unpublished honours project. Department of Zoology,
University of Johannesburg.
Hill, L., 1997. Assessment of the biotic hazard of the acid mine drainage impacted Blesbok
Spruit near Witbank, Mpumalanga. Doctoral dissertation, University of Johannesburg.
Hobbs, P.J. and Cobbing, J.E., 2007. Hydrogeological assessment of acid mine drainage
impacts in the West Rand Basin, Gauteng Province. Report No.
CSIR/NRE/WR/ER/2007/0097/C.
Holland, M. and Witthüser, K.T., 2009. Geochemical characterization of karst groundwater in
the cradle of humankind world heritage site, South Africa. Environmental geology, 57:
3.
Howells, G.D., Brown, D.J. and Sadler, K., 1983. Effects of acidity, calcium, and aluminium on
fish survival and productivity—a review. Journal of the Science of Food and
Agriculture, 34: 6.

101
International Institute for Environment & Development (IIED) (2002). Mining for the Future,
Appendix C: Abandoned Mines Working Paper. No. 28. Mining, Minerals and
Sustainable Development project for the International Institute for Environment &
Development.
Jarvis, A.P. and Younger, P.L., 2001. Passive treatment of ferruginous mine waters using high
surface area media. Water research, 35: 15.
Jennings, S.R., Neuman, D.R. and Blicker, P.S. 2008. Acid Mine Drainage and Effects on Fish
Health and Ecology: A Review. Reclamation Research Group Publication, Bozeman,
MT.5: 78-92.
Johnson, D.B. and Hallberg, K.B., 2005. Acid mine drainage remediation options: a
review. Science of the total environment, 338: 1-2.
Kimmel, W.G., 1988. The impact of acid mine drainage on the stream ecosystem. in:
Majundar, S.J and Miller, W.W (Eds), Pennsylvania coal: Resources, Technology and
Utilisation, PA Acad of Science. 424-437.
Kleynhans, C.J., 2000. Desktop estimates of the ecological importance and sensitivity
categories (EISC), default ecological management classes (DEMC), present
ecological status categories (PESC), present attainable ecological management
classes (present AEMC), and best attainable ecological management class (best
AEMC) for quaternary catchments in South Africa. Institute for Water Quality Studies,
Department of Water Affairs and Forestry, Pretoria, South Africa.
Kleynhans, C.J., Louw, M.D. and Moolman, J., 2007. Reference frequency of occurrence of
fish species in South Africa. Report produced for the Department of Water Affairs and
Forestry (Resource Quality Services) and the Water Research Commission.
Kossoff, D., Dubbin, W.E., Alfredsson, M., Edwards, S.J., Macklin, M.G. and Hudson-
Edwards, K.A., 2014. Mine tailings dams: characteristics, failure, environmental
impacts, and remediation. Applied Geochemistry, 51.
Lafferty, K.D., 2009. The ecology of climate change and infectious diseases. Ecology, 90: 4.
Letendre, J., Leboulenger, F. and Durand, F., 2011. Oxidative challenge and redox sensing in
Mollusks: effects of natural and anthropic stressors. Oxidative Stress in Vertebrates
and Invertebrates: Molecular Aspects of Cell signalling, Wiley Black Well, USA.

102
Lin, L. and Hansen, R.N., 2010. Mine flooding, identification of decant site and determination
of environmental critical level on the Central Rand Gold Field. Council for Geoscience
Report, (20100199).
Low, A.B. and Rebelo, A.G., 1996. Vegetation of South Africa, Lesotho and Swaziland. A
companion to the vegetafion map of South Africa, Lesotho and Swaziland. Pretoria:
Department of Environmental Affairs and Tourism.
Lukhele, L.P., Mamba, B.B., Musee, N. and Wepener, V., 2015. Acute toxicity of double-walled
carbon nanotubes to three aquatic organisms. Journal of Nanomaterials, 2015: 3
Luoma, S.N., 1983. Bioavailability of trace metals to aquatic organisms—a review. Science of
the total environment, 28: 1-3.
Martin, M.T., Judson, R.S., Reif, D.M., Kavlock, R.J. and Dix, D.J., 2009. Profiling chemicals
based on chronic toxicity results from the US EPA ToxRef Database. Environmental
health perspectives, 117: 3.
Mason, C.F., 2002. Biology of Freshwater Pollution. 4th Edition. Sussex, Prentice Hall.
Mayer, B., Shanley, J.B., Bailey, S.W. and Mitchell, M.J., 2010. Identifying sources of stream
water sulfate after a summer drought in the Sleepers River watershed (Vermont, USA)
using hydrological, chemical, and isotopic techniques. Applied Geochemistry, 25: 5.
McCarthy, T. 2010. The decanting of acid mine water in the Gauteng City-Region. Analysis,
Prognosis and Solutions. Provocations Series Johannesburg Gauteng City-Region
Observatory: Analysis prognosis and solutions, 5: 22.
McFarland, B.H., Hill, B.H. and Willingham, W.T., 1997. Abnormal Fragilaria spp.
(Bacillariophyceae) in streams impacted by mine drainage. Journal of Freshwater
Ecology, 12: 1.
Meays, C. and Nordin, R. 2013. Ambient Water Quality Guidelines for sulphate. Technical
appendix. Ministry of Environment, Province of British Colombia, Canada 10: 22.
Mineral and Petroleum Resources Development Act (MPRDA). 2002. Act 28 of 2002, No
23922. Government Gazette, Republic of South Africa, 448: 1-62.
Mitsch, W.J. and Wise, K.M., 1998. Water quality, fate of metals, and predictive model
validation of a constructed wetland treating acid mine drainage. Water research, 32: 6.

103
Mucina, L. and Rutherford, M.C., 2006. The vegetation of South Africa, Lesotho and
Swaziland. South African National Biodiversity Institute.
Muralidharan, M., Selvakumar, C., Sundar, S. and Raja, M., 2010. Macroinvertebrates as
potential indicators of environmental quality. International Journal of Biological
Technology, 1.
Naidoo, B., 2009. Acid mine drainage single most significant threat to SA’s environment.
http://www.pea.org.za/latest news/news.php
Naidoo, S., 2017. Acid Mine Drainage in South Africa: Development Actors, Policy Impacts,
and Broader Implications. Springer International Publishing.
Nepfumbada, M. and Keet, M. 2011. Acid Drainage in South Africa with a focus on mine water
management in the Witwatersrand gold mining area. DWAF Presentation.
Netto, E., Madeira, R.A., Silveira, F.Z., Fiori, M.A., Angioleto, E., Pich, C.T. and Geremias, R.,
2013. Evaluation of the toxic and genotoxic potential of acid mine drainage using
physicochemical parameters and bioassays. Environmental toxicology and
pharmacology, 35: 3.
Nicholson, R.V., Gillham, R.W., Cherry, J.A. and Reardon, E.J., 1989. Reduction of acid
generation in mine tailings through the use of moisture-retaining cover layers as
oxygen barriers. Canadian Geotechnical Journal, 26: 1.
Olubami, P.A., Borode, J.O. and Ndlovu, S., 2006. Sulphuric acid leaching of zinc and copper
from Nigerian Complex Sulphide Ore in the presence of hydrogen peroxide. Journal-
South African Institute of Mining and Metallurgy, 106: 11.
Oram, B., 2009. Total Phosphorus and Phosphate Impact on Surface Waters. Dallas, USA:
Water Research Center.
Pacholski, L., 2009. Toxicity of stable strontium in surface freshwaters of the Oil Sands region
in Alberta, Canada-Deriving an aquatic guideline and refined chronic effects
benchmark University of Ulster, Londonderry, Northern Island.
Persoone, G., Marsalek, B., Blinova, I., Törökne, A., Zarina, D., Manusadzianas, L., Nalecz‐
Jawecki, G., Tofan, L., Stepanova, N., Tothova, L. and Kolar, B., 2003. A practical and
user‐friendly toxicity classification system with microbiotests for natural waters and
wastewaters. Environmental Toxicology: An International Journal, 18: 6.

104
Pulles, W., Heath, R. and Howard, M., 1996. A manual to assess and manage the impact of
gold mining operations on the surface water environment. Pulles Howard & de Lange
Incorporated.
Qadir, M., Sharma, B.R., Bruggeman, A., Choukr-Allah, R. and Karajeh, F., 2007. Non-
conventional water resources and opportunities for water augmentation to achieve
food security in water scarce countries. Agricultural water management, 87: 1.
Rademeyer, S., Coleman, T., Van Rooyen, P. and Wegelin, W., 2009. Vaal River system:
large bulk water supply reconciliation strategy. Civil Engineering= Siviele
Ingenieurswese, 2009(v17i5): 9-13.
Ramcharan A., 2009. An Investigation into the impact of the effluent from the wastewater
treatment works on the receiving Rietspruit Stream (June 2008 – June 2009).
Vereeniging, Rand Water Analytical Services, Hydrobiology.
Ramontja, T., Coetzee, H., Hobbs, P.J., Burgess, J.E., Thomas, A., Keet, M., Yibas, B., van
Tonder, D., Netili, F., Rust, U.A. and Wade, P., 2011. Mine Water Management in the
Witwatersrand Gold Fields with Special Emphasis on Acid Mine Drainage Inter-
Ministerial-Committee on Acid Mine Drainage. Pretoria.
Rand Water, 2006a. pH Determination: Portable Instruments. Rand Water Analytical Services,
Vereeniging, South Africa.
Rand Water, 2006b. Dissolved Oxygen Determination: Portable Instruments. Rand Water
Analytical Services, Vereeniging, South Africa.
Rand Water, 2006c. Conductivity Determination: Portable Instruments. Rand Water Analytical
Services, Vereeniging, South Africa.
Rand Water, 2009a. Determination of Ba, Be, Ti, Sr, Using Inductively Coupled Plasma-
Optical Emission Spectrometry (ICP-OES). Rand Water Analytical Services,
Vereeninging, South Africa.
Rand Water 2010d. Daphnia pulex Acute Toxicity Test. Rand Water Analytical Services,
Vereeniging, South Africa
Rand Water, 2011c. The Analysis of Arsenic, Selenium and Antimony via a Thermofisher Ice
3000 Atomic Absorption Spectrophotometer utilising the graphite furnace method.
Rand Water Analytical Services, Vereeniging, South Africa.

105
Republic of South Africa, 1996. Constitution of the Republic of South Africa, Act 108 of
1996. Government Gazette, 378.
Rouget, M., Richardson, D.M., Nel, J.L., Le Maitre, D.C., Egoh, B. and Mgidi, T., 2004.
Mapping the potential ranges of major plant invaders in South Africa, Lesotho and
Swaziland using climatic suitability. Diversity and Distributions, 10: 5‐6.
Sahely, H.R., MacLean, H.L., Monteith, H.D. and Bagley, D.M., 2006. Comparison of on-site
and upstream greenhouse gas emissions from Canadian municipal wastewater
treatment facilities. Journal of Environmental Engineering and Science, 5: 5.
Scholes, R., 2001. Global Terrestrial Observing System: Regional Implementation Plan for
Southern Africa. Food and agriculture organisation of the United Nations (GTOS-21).
Singh, P., Nel, A. and Durand, J.F., 2017. The use of bioassays to assess the toxicity of
sediment in an acid mine drainage impacted river in Gauteng (South Africa). Water
SA, 43: 4.
Skousen, J.G, Politan, K., Hilton, T. and Meek, A., 1990. Acid Mine Drainage Treatment
Systems: Chemicals and Costs. Green Lands, 20: 4.
Skousen, J.G., Rose, A.W., Geidel, G., Foreman, J., Evans, R. and Hellier, W., 1998.
Handbook of technologies for voidance and remediation of acid mine drainage.
National Mine Land Reclamation Center, Morgantown.
Slabbert, J.L. 1996. Guidelines for toxicity bioassying of waters and effluents in South Africa.
Contract Report for the Water Research Commission, Project No. K5/358/0/1, Division
of Water Technology, Pretoria.
Stubblefield, W.A., Brinkman, S.F., Davies, P.H., Garrison, T.D., Hockett J.R. and McIntrye,
M.W., 1997. Effects of water hardness on the toxicity of manganese to developing
brown trout (Salmo Trutta). Environmental Toxicology and Chemistry, 16: 10.
Stumm W., Morgan, J. J. (1996) Aquatic chemistry: chemical equilibria and rates in natural
waters, Third edition, Wiley-Interscience, New York.
Talling, J.F., 2010. Potassium—a non-limiting nutrient in fresh waters. Freshwater Reviews, 3:
2.
Taylor, P.R. and Littler, M.M., 1982. The roles of compensatory mortality, physical disturbance,
and substrate retention in the development and organization of a sand‐influenced,
rocky‐intertidal community. Ecology, 63: 1.

106
Taylor, J.C., 2004. The application of diatom-based pollution indices in the Vaal catchment.
Unpublished MSc thesis. University of North West. Potchefstroom
Trumm, D., 2010. Selection of active and passive treatment systems for AMD—flow charts
for New Zealand conditions. New Zealand journal of Geology and Geophysics, 53: 2-
3.
Turpie, J.K., Marais, C. and Blignaut, J.N., 2008. The working for water programme: Evolution
of a payments for ecosystem services mechanism that addresses both poverty and
ecosystem service delivery in South Africa. Ecological economics, 65: 4.
United States Department of the Interior Bureau of Reclamation (USBR), 2010. Sulfate.
Available at:
http://www.usbr.gov/pmts/water/publications/reportpdfs/Primer%20Files/08%20-
%20Sulfate.pdf [Accessed: 26 September 2018].
United States Environmental Protection Agency (USEPA), 2001. National Primary Drinking
Water Regulations: Arsenic and Clarifications to Compliance and New Source
Contaminants Monitoring. Federal Register, 66: 14.
United States Environmental Protection Agency (USEPA). 2005b. Guidelines for Carcinogen
Risk Assessment. EPA/630/P-03/001F. Washington, D.C.: United States
Environmental Protection Agency, Risk Assessment
Forum. http://www2.epa.gov/risk/guidelines-carcinogen-risk-assessment. [Accessed:
26 September 2018].
United States Environmental Protection Agency (US EPA), 2012a. EPI Suite. Estimation
Program Interface (EPI) Suite Version 4.11 United States Environmental Protection
Agency. http://www2.epa.gov/tsca-screening-tools/epi-suitetm-estimation-program-
interface.
United States Environmental Protection Agency (US EPA), 2012f. Water Quality Criteria
Copper Aquatic Life Criteria. Available at:
http://water.epa.gov/scitech/swguidance/standards/criteria/aqlife/copper/background.
cfm [Accessed: 03 September 2018].
United States Environmental Protection Agency (USEPA). 2012i. Vapor Intrusion Database:
Evaluation and Characterization of Attenuation Factors for Chlorinated Volatile
Organic Compounds and Residential Buildings. https://iavi.rti.org. [Accessed: 04
September 2018].

107
United States Environmental Protection Agency (USEPA). 2013e. ProUCL Software
Documentation. United States Environmental Protection
Agency. http://www2.epa.gov/land-research/proucl-software. [Accessed: 04
September 2018].
United States Environmental Protection Agency (USEPA). 2013f. Provisional Peer Reviewed
Toxicity Values for Superfund (PPRTV). United States Environmental Protection
Agency, Office of Superfund Remediation and Technology Innovation, Waste and
Cleanup Risk Assessment. http://hhpprtv.ornl.gov/. [Accessed: 04 September 2018].
United States Geological Services (USGS), 2013a. Water properties: Temperature. Available
at: http://ga.water.usgs.gov/edu/temperature.html [Accessed: 20 June 2018].
United States Environmental Protection Agency (USEPA), 1985. Methods for measuring the
acute toxicity of effluents to freshwater and marine organisms. EPA/600/4-85/013,
Environmental and Support Laboratory, Office of Research and Development, US
Environmental Protection Agency, Cincinnati.
United States Environmental Protection Agency (USEPA), 1991. Methods for measuring the
acute toxicity of effluents to aquatic organisms, 4th ed. EPA/600/4-90-027, Office of
Research and Development, US Environmental Protection Agency, Cincinnati.
United States Environmental Protection Agency (USEPA). 1994b. Methods for Derivation of
Inhalation Reference Concentrations (RfCs) and Application of Inhalation Dosimetry.
EPA/600/8-90/066F. Research Triangle Park, NC: United States Environmental
Protection Agency, Environmental Criteria and Assessment Office, Office of Health
and Environmental Assessment, Office of Research and Development, U.S.
Environmental
ProtectionAgency. http://cfpub.epa.gov/ncea/cfm/recordisplay.cfm?PrintVersion=True
&deid=71993#Download.
Van Niekerk, J.A. and Seath, S.G, 2011. Witwatersrand Gold Fields: Acid Mine Drainage
(Phase 1). Available at: http://www.amdshort.co.za/documents/J01599-
05%20Due%20Diligence%20-%20Final.pdf. [Accessed: 20 June 2018]
Van Zyl, H.C., Maree, J.P., Van Niekerk, A.M., Van Tonder, G.J. and Naidoo, C., 2001.
Collection, treatment and re-use of mine water in the Olifants River
Catchment. Journal-South African Institute of Mining and Metallurgy, 101: 1.

108
Vermeulen, P.D., Bester, M., Cruywagen, L.M. and Van Tonder, G.J., 2011. Scoping level
assessment of how water quality and quantity will be affected by mining method and
mining of the shallow Waterberg coal reserves west of the Daarby fault. Water
Research Commission Report, Pretoria. WRC Report, (1830/1).
Viljoen, M.J. and Scoon, R.N., 1985. The distribution and main geologic features of discordant
bodies of iron-rich ultramafic pegmatite in the Bushveld Complex. Economic
Geology, 80: 4.
Wamsley R.D. & Mazury D., 1999. A management plan for the Blesbokspruit Ramsar site.
Volume 2: Objectives and Management plan. University of Pretoria: Pretoria.
Wangnick, K., 2002. Worldwide Desalting Plants Inventory Report No. 17, produced by
Wangnick Consulting for IDA. Gnarrenburg, Germany.
Weatherley, A.H., Lake, P.S. and Rogers, S.C., 1980. Zinc Pollution and the Ecology of the
Freshwater Environment. John Wiley & Sons, 605 Third Ave., New York, NY 10016.
Weber-Scannell, P.K. and Duffy, L.K., 2007. Effects of Total Dissolved Solids on Aquatic
Organisms: A Review of Literature and Recommendation for Salmonid Species
American Journal of Environmental Sciences, 3: 1.
World Health Organisation (WHO), 2004b. Manganese and Its Compounds: Environmental
Aspects. Available at: http://www.who.int/ipcs/publications/cicad/cicad63_rev_1.pdf.
[Accessed: 04 September 2018].
Younger, P., Banwart, S.A. and Hedin, R.S., 2002. Mine Water: Hydrology, Pollution,
Remediation. The Netherlands: Kluwer Academic Press.
Ziemkiewicz, P.F., Skousen, J.G. and Simmons, J., 2003. Long-term performance of passive
acid mine drainage treatment systems. Mine Water and the Environment, 22: 3.
-

109
APPENDIX A
Table A1: Total Water Quality Range (TWQR) (DWAF, 1996)
Parameter TWQR (Limits)
pH 6.5-9.0
Electrical Conductivity <154
Total Dissolved Solids <1000
Dissolved oxygen mg/L >5.00
Dissolved oxygen (%) 80-120
Temperature oC 5-30
Nitrate 0.05 mg/l
Nitrite 0.05 mg/l
Phosphorus 0.01 mg/l
Ammonium 0.007 mg/l
Table A2: Target Treated Acid Mine Drainage Discharge standard (DWA, 2012)
Water Quality
Variable
Average water quality at
Central basin
High Density Sludge (HDS) plant
effluent standard
Sulphates (mg/L) 4344 2400
pH 4 6-9
Iron (mg/L) 768 <1
Aluminium (mg/L) 35 <1
Manganese (mg/L) 127 <3
Uranium (mg/L) 0.2 0.05

110
Table A3: Wastewater Limit Values (DWA, 2013)
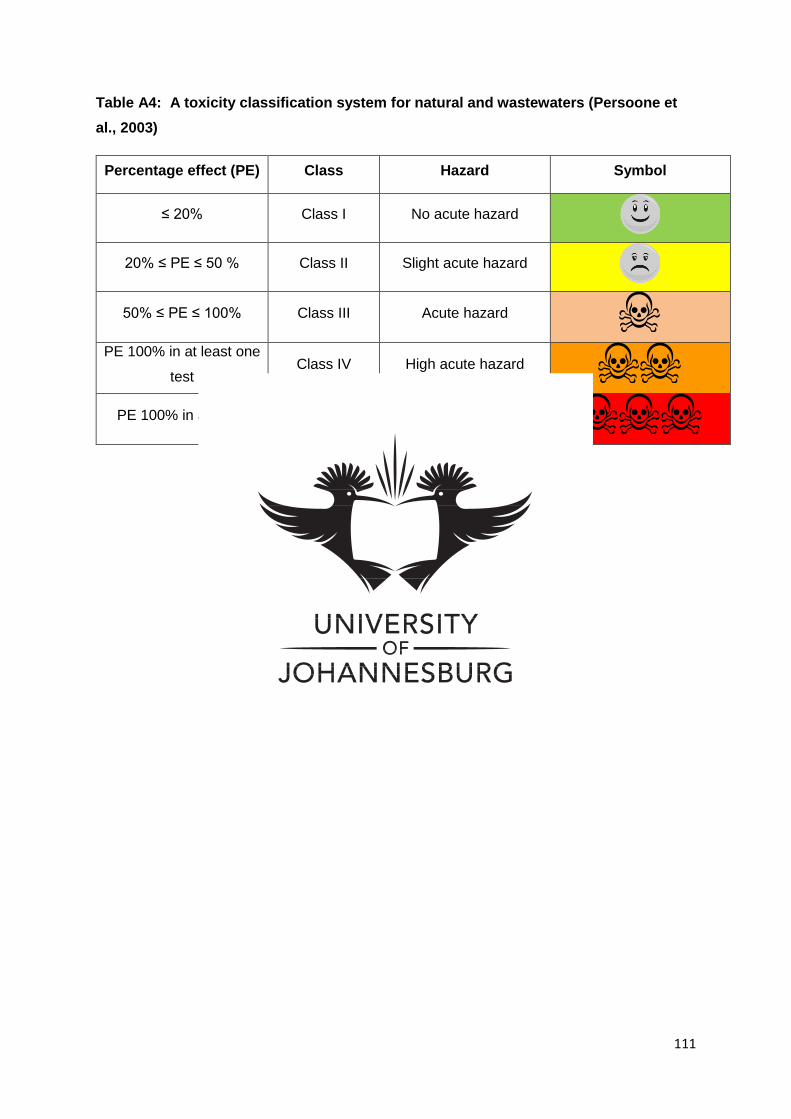
111
Table A4: A toxicity classification system for natural and wastewaters (Persoone et
al., 2003)
Percentage effect (PE) Class Hazard Symbol
≤ 20% Class I No acute hazard
20% ≤ PE ≤ 50 % Class II Slight acute hazard
50% ≤ PE ≤ 100% Class III Acute hazard
PE 100% in at least one
test Class IV High acute hazard
PE 100% in all tests Class V Very high acute hazard

112
APPENDIX B
Table B1: In-situ water quality parameters of Sites 1 to 3 (Elsburgspruit) and Site 4 (Elsparkspruit). [ non-conformance to
TWQR of the WQG/AE (DWAF, 1996) and non-conformance to the TTAMDDS (DWA, 2012)]
Localities / In-
situ water
quality
parameters
Site 1 Site 2 Site 3 Site 4
TWQR of
WQG/AE
(DWAF,
1996)
TTAMDDS
(DWA,
2012)
Sam
plin
g
pe
rio
d 1
Sam
plin
g
pe
rio
d 2
Sam
plin
g
pe
rio
d 3
Sam
plin
g
pe
rio
d 1
Sam
plin
g
pe
rio
d 2
Sam
plin
g
pe
rio
d 3
Sam
plin
g
pe
rio
d 1
Sam
plin
g
pe
rio
d 2
Sam
plin
g
pe
rio
d 3
Sam
plin
g
pe
rio
d 1
Sam
plin
g
pe
rio
d 2
Sam
plin
g
pe
rio
d 3
Temperature
(°C)
12.4 12.3 14.6 27 26.7 26.2 26.5 26.4 25.6 8.6 11.3 15.7 5-30 -
pH 7.20 7.01 7.54 9 8.75 8.94 8.50 7.8 8.49 6.35 6.15 7.45 6.5-9.0 6-9
DO (%) 41.7 50.3 20.2 77.4 73.5 64.7 63.4 71.9 65.4 75.2 99.3 73.4 80-120 -
DO (mg/L) 4.28 5.29 2.05 6.07 6.02 5.05 5.05 5.78 4.47 8.66 11.14 7.21 >5.00 -
EC (μS/cm) 672.9 624.8 626.5 628 624.8 626.4 627.7 624.5 626.7 683.3 629.1 630.6 <154 -

113
Table B2: General water quality parameters of Sites 1 to 3 (Elsburgspruit) and Site 4 (Elsparkspruit)
114

115
116

117
Table B3: Metal analysis results
Aluminium mg/l) Boron Zinc Calcium Iron Cobalt
Potassium mg/l Manganese Magnesium Sodium Nickel Phosphorus Silicon Sulphur Strontuim Lithium Copper
0.0125 0.045 0.03 340 0.15 0.35 22 90 90 185 0.033 0.025 0.5 425 0.49 0.0075 0.005
0.03 0.25 0.07 36 0.78 0.02 9.6 9.8 9.8 34 0.021 2.5 6.9 16 0.11 0.0075 0.005
0.0125 0.305 0.0075 36 0.345 0.005 8.3 9.6 9.6 26 0.026 0.56 3.6 18 0.1 0.0075 0.005
0.19 0.11 0.13 36 0.105 0.005 11 12 12 25 0.005 1.5 5 22 0.14 0.0075 0.005
0.145 0.087 0.02 28 0.44 0.005 7.6 10 10 30 0.005 1.1 4 22 0.13 0.0075 0.005
0.19 0.077 0.05 28 0.345 0.005 6.9 10 10 27 0.005 0.88 5 18 0.125 0.0075 0.01
0.0125 0.2 0.05 180 0.027 0.04 21 62 62 175 0.052 0.025 1.9 680 0.31 0.14 0.005
0.055 0.17 0.04 510 0.32 0.024 16 150 150 165 0.031 0.025 1.2 680 0.21 0.115 0.005
0.025 0.215 0.02 420 0.65 0.014 16 83 83 140 0.02 1 2.5 190 0.24 0.099 0.005
0.0125 0.096 0.11 56 0.6 0.215 13 73 73 22 0.49 0.025 2.5 72 0.52 0.0075 0.005
0.0125 0.073 0.04 195 0.019 0.145 9.4 82 82 130 0.12 0.025 11 310 0.495 0.0075 0.005
0.0125 0.079 0.07 280 0.028 0.28 13 120 120 185 0.14 0.025 1.6 165 0.65 0.0075 0.005

118
Table B4: Acute water toxicity results
Site 1 (Witwatersrand goldmine:
Upstream)
Site 2 (Acid Mine Drainage Discharge
point)
Site 3 (Elsburg Town: Downstream)
Site 4 (Stream at Elspark: Tributary)
Quality Variables
Sam
plin
g p
eri
od
1
Sam
plin
g p
eri
od
2
Sam
plin
g p
eri
od
3
Sam
plin
g p
eri
od
1
Sam
plin
g p
eri
od
2
Sam
plin
g p
eri
od
3
Sam
plin
g p
eri
od
1
Sam
plin
g p
eri
od
2
Sam
plin
g p
eri
od
3
Sam
plin
g p
eri
od
1
Sam
plin
g p
eri
od
2
Sam
plin
g p
eri
od
3
Daphnia pulex survival (%)
24 80 (4/4) 90 (5/4) 0(0/0) 100 (5/5) 80 (3/5) 80 (4/4) 90 (5/4) 100 (5/5) 90 (4/5) 90 (5/4) 90 (5/4) 100 (5/5)
48 30 (0/3) 10 (0/1) 0(0/0) 80 (4/4) 50 (3/2) 30 (2/1) 60 (4/2) 40 (3/1) 80 (4/4) 50 (4/1) 50 (3/2) 100(5/5)
Mortality % total 70(5/2) 90(5/4)) 100(0/0) 20(1/1) 50(2/3) 70(3/4) 40(1/3) 60(2/4) 20(1/1) 50(1/4) 50(2/3) 0(0/0)
Poecilia reticulate survival (%)
24 100 100 20 (1/1) 100 100 100 100 100 100 100 100 100
48 100 100 10 (0/1) 100 100 100 100 100 100 100 100 100
72 100 100 0 (0/0) 100 100 100 100 100 100 100 100 100
96 100 100 0 (0/0) 100 100 100 100 100 100 100 100 100
Mortality % total 0 0 90(5/4) 0 0 0 0 0 0 0 0 0

119
APPENDIX C
Table C1: IBM SPSS v.25 Statistics Kruskal-Wallis test results
Site Temperature pH DO(%) DO(mg/L)EC
(mmhg)SPC
Total
hardness
(mmol/l)
Nitrate
(mg/l)
Sulphate
(mg/l)
Nitrite
(mg/l)
Ammonia
(mg/l)
Orthopho
sphate
(mg/l)
Alumini
um
mg/l)
Boron ZincCalciu
mIron Cobalt
Potassi
um
mg/l
Manga
nese
Magne
siumSodium Nickel
Phosph
orusSilicon Sulphur
Strontu
imCopper
1.1 12.4 7.2 41.7 4.28 672.9 6126 10 0.22 2080 0.015 4.2 0.1 0.0125 0.045 0.03 340 0.15 0.35 22 90 90 185 0.033 0.025 0.5 425 0.49 0.005
1.2 12.3 7.01 50.3 5.29 624.8 831 1.48 0.22 2480 0.015 4.4 0.1 0.03 0.25 0.07 36 0.78 0.02 9.6 9.8 9.8 34 0.021 2.5 6.9 16 0.11 0.005
1.3 14.6 7.54 20.2 2.05 626.5 834 2.37 0.22 5220 0.015 4.3 0.1 0.0125 0.305 0.0075 36 0.345 0.005 8.3 9.6 9.6 26 0.026 0.56 3.6 18 0.1 0.005
2.1 27 9 77.4 6.07 628 3765 1.25 1 190 0.11 12 0.1 0.19 0.11 0.13 36 0.105 0.005 11 12 12 25 0.005 1.5 5 22 0.14 0.005
2.2 26.7 8.75 73.5 6.02 624.8 3933 0.34 2.3 340 0.47 18 0.1 0.145 0.087 0.02 28 0.44 0.005 7.6 10 10 30 0.005 1.1 4 22 0.13 0.005
2.3 26.2 8.94 64.7 5.05 626.4 4010 0.65 0.22 9.7 0.015 39 1.5 0.19 0.077 0.05 28 0.345 0.005 6.9 10 10 27 0.005 0.88 5 18 0.125 0.01
3.1 26.5 8.5 63.4 5.05 627.7 3690 1.75 0.22 205 0.07 4.2 0.1 0.0125 0.2 0.05 180 0.027 0.04 21 62 62 175 0.052 0.025 1.9 680 0.31 0.005
3.2 26.4 7.8 71.9 5.78 624.5 3900 1.83 0.44 4680 0.015 4.2 0.2 0.055 0.17 0.04 510 0.32 0.024 16 150 150 165 0.031 0.025 1.2 680 0.21 0.005
3.3 25.6 8.49 65.4 4.47 626.7 3869 2.13 0.58 425 0.015 0.14 0.1 0.025 0.215 0.02 420 0.65 0.014 16 83 83 140 0.02 1 2.5 190 0.24 0.005
4.1 8.6 6.35 75.2 8.66 683.3 1868 1.76 1.9 2680 0.015 12 0.1 0.0125 0.096 0.11 56 0.6 0.215 13 73 73 22 0.49 0.025 2.5 72 0.52 0.005
4.2 11.3 6.15 99.3 11.14 629.1 2254 0.91 12 1670 2.5 0.31 0.1 0.0125 0.073 0.04 195 0.019 0.145 9.4 82 82 130 0.12 0.025 11 310 0.495 0.005
4.3 15.7 7.45 73.4 7.21 630.6 934 0.34 0.04 2850 0.015 6.5 0.2 0.0125 0.079 0.07 280 0.028 0.28 13 120 120 185 0.14 0.025 1.6 165 0.65 0.005
1-2 1-2 1-2 1-2 1-2
1-3
1-4 1-4 1-4
2-3
2-4 2-4 2-4 2-4 2-4
3-4 3-4