Citation analysis for e-government research
10
Citation Analysis for e-Government Research Nuša Erman University of Ljubljana, Faculty of administration Gosarjeva ulica 5, SI-1000 Ljubljana, Slovenia +386 1 5805 515 [email protected] ABSTRACT Various research papers question and analyze the maturity of the e-government research area and its stance as a scientific discipline. The common conclusion of these papers is the exposure of the deficiency in common research methodology in the EGR field. However, this lack of common methods characterizes the papers that analyze the field as well. The aim of this paper is to propose a common methodology for the research of the EGR field in social network and citation analysis terms. The paper introduces and describes a data set that allows for such analysis and outlines the prospects for further research. Categories and Subject Descriptors E.1 [Data Structures]: graphs and networks; J.1 [Administrative data processing]: government; J.4 [Social and behavioral sciences]: sociology; General Terms Measurement, Documentation, Theory Keywords e-government, e-government research, social network analysis, citation analysis 1. INTRODUCTION e-Government Research (EGR) refers to the study of the use of modern Information and Communication Technology (ICT) in government activities and public administration. Research in the area of e-government started in late 1990’s and has significantly grown over the past decade. Although an increasing number of research papers, academic conferences and specialized journals bear witness to the growth of e-government research area, it is often claimed that e-government is yet not completely developed, its study is young and doubts about EGR as a discipline or a field are still present. Scholl [11] argues that EGR fails to implement some of the presumptions that define a discipline. In this sense, the area of EGR lacks a unifying theory or a scientific shared vision of the research impact. Grönlund [4, 5] divides the research papers related to e-government topic in five categories with respect to the nature of the paper and we can distinguish at least ten various classes of research, regarding the method used in the paper. Such a large range of procedures and methods clearly hinders above all the nature and the quality of contribution. On this basis, the presumption about the absence of disciplinary allegiance, promotional pathways, specific terminology, and common methodology is not completely irrelevant. With the intention to contribute and to reduce the lack of common methodology and with the purpose to help promoting the studies of EGR area, this paper proposes some new aspects in social network analysis in the EGR field. The present paper does not deal with analysis of social networks between citizens and government 1 , but is rather concerned with social network analysis from the citation point of view, i.e., analysis of citations between authors and papers in the e-government research. This will provide a new insight to the stage of development of EGR area. The aim of this paper is to introduce citation analysis as the common research analysis tool, which can in some way substitute or extend other methods for the research of the growth of the EGR area. The usage of common methodology will contribute to the comparability of similar researches, which represents an important step towards more rigorous study of the EGR area. The present paper first introduces the map of e-government research and outlines the main deficiencies of the related works. It then introduces the citation analysis in terms of statistical and social network analysis. It goes on with the specification of the research of EGR field with regard to the papers published in the proceedings of the International Conference on e-Government (EGOV) as well as the literature being referenced in those papers. In the same section it delineates the data description and data summary. It then goes on with outlining the prospects for further analysis and concludes with the summary of all ascertainments. 2. MAP OF E-GOVERNMENT RESEARCH Due to the nature of the present paper, in mapping the EGR we will concentrate primarily on existing research that focus on analyzing the development of the field of EGR. It is not surprising that in recent years among several authors, e.g. [4, 5, 11], the interest in the formal analysis of EGR is growing. The EGR is now present for several years and many authors putted an effort into the investigation and representation [5] of the current stage of the field. On the other hand, it was also shown that the EGR might be most effective as a multidiscipline and some argumentations about the reasons for its immaturity were made. In 2003, Grönlund [4] carried out the research examining the nature of papers published at three major e-Government conferences. He introduced a model for measuring the maturity of the field, which included phases through which the research fields 1 which is also a relevant topic addressed, e.g., in Cotterill and King [2]
-
Upload
independent -
Category
Documents
-
view
2 -
download
0
Transcript of Citation analysis for e-government research
Citation Analysis for e-Government Research Nuša Erman
University of Ljubljana, Faculty of administration Gosarjeva ulica 5,
SI-1000 Ljubljana, Slovenia +386 1 5805 515
ABSTRACT
Various research papers question and analyze the maturity of the
e-government research area and its stance as a scientific
discipline. The common conclusion of these papers is the
exposure of the deficiency in common research methodology in
the EGR field. However, this lack of common methods
characterizes the papers that analyze the field as well. The aim of
this paper is to propose a common methodology for the research
of the EGR field in social network and citation analysis terms.
The paper introduces and describes a data set that allows for such
analysis and outlines the prospects for further research.
Categories and Subject Descriptors
E.1 [Data Structures]: graphs and networks; J.1
[Administrative data processing]: government; J.4 [Social and
behavioral sciences]: sociology;
General Terms
Measurement, Documentation, Theory
Keywords e-government, e-government research, social network analysis,
citation analysis
1. INTRODUCTION e-Government Research (EGR) refers to the study of the use of
modern Information and Communication Technology (ICT) in
government activities and public administration. Research in the
area of e-government started in late 1990’s and has significantly
grown over the past decade. Although an increasing number of
research papers, academic conferences and specialized journals
bear witness to the growth of e-government research area, it is
often claimed that e-government is yet not completely developed,
its study is young and doubts about EGR as a discipline or a field
are still present.
Scholl [11] argues that EGR fails to implement some of the
presumptions that define a discipline. In this sense, the area of
EGR lacks a unifying theory or a scientific shared vision of the
research impact. Grönlund [4, 5] divides the research papers
related to e-government topic in five categories with respect to the
nature of the paper and we can distinguish at least ten various
classes of research, regarding the method used in the paper. Such
a large range of procedures and methods clearly hinders above all
the nature and the quality of contribution. On this basis, the
presumption about the absence of disciplinary allegiance,
promotional pathways, specific terminology, and common
methodology is not completely irrelevant.
With the intention to contribute and to reduce the lack of common
methodology and with the purpose to help promoting the studies
of EGR area, this paper proposes some new aspects in social
network analysis in the EGR field. The present paper does not
deal with analysis of social networks between citizens and
government1, but is rather concerned with social network analysis
from the citation point of view, i.e., analysis of citations between
authors and papers in the e-government research. This will
provide a new insight to the stage of development of EGR area.
The aim of this paper is to introduce citation analysis as the
common research analysis tool, which can in some way substitute
or extend other methods for the research of the growth of the EGR
area. The usage of common methodology will contribute to the
comparability of similar researches, which represents an important
step towards more rigorous study of the EGR area.
The present paper first introduces the map of e-government
research and outlines the main deficiencies of the related works. It
then introduces the citation analysis in terms of statistical and
social network analysis. It goes on with the specification of the
research of EGR field with regard to the papers published in the
proceedings of the International Conference on e-Government
(EGOV) as well as the literature being referenced in those papers.
In the same section it delineates the data description and data
summary. It then goes on with outlining the prospects for further
analysis and concludes with the summary of all ascertainments.
2. MAP OF E-GOVERNMENT RESEARCH Due to the nature of the present paper, in mapping the EGR we
will concentrate primarily on existing research that focus on
analyzing the development of the field of EGR. It is not surprising
that in recent years among several authors, e.g. [4, 5, 11], the
interest in the formal analysis of EGR is growing. The EGR is
now present for several years and many authors putted an effort
into the investigation and representation [5] of the current stage of
the field. On the other hand, it was also shown that the EGR
might be most effective as a multidiscipline and some
argumentations about the reasons for its immaturity were made.
In 2003, Grönlund [4] carried out the research examining the
nature of papers published at three major e-Government
conferences. He introduced a model for measuring the maturity of
the field, which included phases through which the research fields
1 which is also a relevant topic addressed, e.g., in Cotterill and
King [2]
pass in the process of becoming mature. The data set for research
is based mainly on the context of presented papers, which were
coded according to selected categories for assessing rigor and
relevance. He concluded that descriptive papers dominate in the
EGR field and that most papers focus on the Information
Technology itself. He stressed that the field if still immature,
although there were contributions from various disciplines
present. In 2005, Grönlund [5] reiterated his research, but this
time he narrowed the scope of the study to the papers published in
the proceedings of International Conference on e-Government
(EGOV) held in 2005.. He ascertained some progress in the
examined scientific field, as the share of philosophical research
has decreased and the efforts to comply with the research
publication standards have increased. He also noted an enormous
growth in the number of references of the papers, which indicates
better involvement with previous research. The collaboration of
authors from various institutions has increased, and the number of
dubious claims has been reduced. However, some disappointing
facts remain present, since descriptive research clearly increased
in two years (2003-2005) on one hand, but theory testing and
creating has only slightly increased on the other. Finally,
Grönlund summarized that there has been a change in positive
direction and that the field has clearly matured from 2003 to 2005,
as the papers became more rigorous. He also concludes that the
change in founding principles was so enormous, that the applied
model of delineating the growth of the research field cannot be
used any more.
On the basis of Grönlund’s examination, various attempts for
improvements and further formal analysis of the EGR were made.
Scholl [11] concentrated on the examination of the EGR as a
discipline, questioning whether EGR even qualifies as a legitimate
discipline. With his precise specification of several criteria which
define a discipline, comparison of the study of EGR with two
neighboring disciplines and delineation of the challenges and
opportunities for EGR as a cross-discipline, he proposed that it is
possible that EGR wants to avoid being a traditional legitimate
discipline. Because of the fact that the scope of the field is so
wide that the development towards traditional discipline would
signify merely a restriction, EGR should be thriven as a multi-,
inter-, or as a trans-discipline. He concluded that in the field of
EGR the disciplinary allegiance has not yet been found, as the
established rules, procedures and promotional pathways are
absent.
As a respond to the already presented findings about the growth
and limitations in the EGR field, Flak et al. [3] made some further
argumentation on this subject and proposed the necessary
foundations for understanding the basic concepts in the field. As a
reaction to the reproaches that in the EGR field there has been
little theoretical progress with the lack of a cumulative tradition,
they expose the cause for the poor growth of the field. In their
opinion, the main reason is the deficiency of shared understanding
of the basic concepts and entities among scientists in the EGR
field. That is why they propose a fundamental and exact
conceptualization of basic concepts, without which the
comparison of findings and the transfer of knowledge between
different parts of EGR field, as well as a cumulative tradition are
not possible.
According to this brief review of the map of EGR, it is possible to
delineate some aspects, advantages and disadvantages from the
research point of view. Grönlund’s work [4,5] exposed the state
of maturity of the EGR field. In his latter work, he described the
area of EGR as being more mature as it was a couple of years
before that. He also ascertained that the model of phases through
which disciplines pass on their way of growing became unusable
as the changes in a field were so dramatic. Here we are confronted
with a slightly disadvantage situation, as the other works
(especially the work of Flak et al. [3]) clearly pointed out that the
research in e-Government field should have established rules,
procedures, shared understanding and in the addition to all of that
also common research methods and methodology, which will be
applicable in any situation, no matter how huge the changes in the
disciplines are. To address this issue, we propose a citation
analysis as a novel alternative method for analysis of the scientific
field research, which enables the insight into the characteristics,
patterns, growth, and other relevant features of the EGR.
3. CITATION ANALYSIS The citation analysis can be briefly defined as a research of the
frequency, patterns and graphs of citations or references in various
scientific literatures, such as journal articles, books, and papers in
conference proceedings. Citation analysis itself is strongly related
to social network analysis on one hand, and to the statistical
analysis on the other. Over the past few decades, the citation
analysis has been increasingly used to quantify and value the
significance of scientists and scientific research. If social network
analysis offers the methodology to analyze social relations,
citation analysis offers the methodology to analyze relations,
based on citations or references of scientific papers. Although
some authors, e.g. Meho [7], claim that citation analysis evolves
only the counting of times a single scientist or a scientific paper is
cited, citation analysis offers much more. When the desired scope
of the study is formed in the citation analysis sense, many
possibilities for various analyses arise.
According to Nooy et al. [8], citations are a precious and valuable
source of data for the study of scientometrics, history and
sociology of science. Such data enable to study a development of
the science and characteristics of scientific communities, reveal
the impact of papers and their authors on further scientific work
and expose specialities with sharing knowledge.
The citation analysis has been proposed and used for evaluation of
several journals, conferences and research areas, but there is still
no evidence of its use in the field of EGR. Moreover, the
examination of various literature, dealing with the citation
analysis in other research areas, e.g. [6, 1, 9], does not offer to
establish a common methodology for citation analysis in a broad
sense. Most closely related to the approach proposed in this paper
is the study of the publications in the area of inductive logic
programming presented by Sabo et al. [10], which perform
analysis of an actual social network based on bibliography
database. In the next subsections, we present the citation analysis
methodology in terms of social network analysis.
3.1 Defining the citation network The first and the most important step in citation analysis is the
determination of the proper research units (vertices) and the
relations (lines) between them. These must be defined on the
structural level, as the analysis will be primarily concerned with
exploration of the meaningful patterns in the network. Units and
relations between them define a graph, which represents the
structure of a network and can be defined as a set of vertices and a
set of lines between pairs of vertices.
3.2 Describing the citation network When building a data set for the social network analysis, it is
important to gather as much information about the units as
possible. Such a rich data set enables not only to perform the
social network analysis, but also to perform some other analysis
from the statistical point of view that describes the details of the
components of the network. Here we are confronted with the basic
descriptive statistical analysis, which helps us to describe the
network in terms of its constituent units. If the data set is collected
over a longer period of time, we can also observe the dynamic
changes of the outlined characteristics.
3.3 Exploring the citation network After the definition of the research units and relations among
them, description of the units and importation of the collected
data into a proper program for social network analysis, we can
continue with the exploration of the network.
Based on the program for social network analysis, we can gather
some general information about the network, e.g. number of
units, number of directed lines (arcs), number of undirected lines
(edges), and number of loops and density of the network.
Further analysis of the network enables to explore and describe
the patterns and the specialities of the network. We can identify
cohesive subgroups of the network, which are, according to
Wasserman and Faust [12], represented by units, among which
relative strong, direct and frequent connections exist. Cohesive
subgroups in the network can be identified with different
techniques of social network analysis. These techniques are: 1)
finding the components in the network, which represent clusters
of vertices in which any vertex can be reached from all other
vertices from the same cluster, 2) finding the cores, which are
defined as clusters of vertices where each vertex from a cluster is
connected to the fixed number of other vertices from the same
cluster, and 3) finding cliques, which represent a special case of
cores where each vertex from a cluster is connected to all other
vertices from the same cluster.
In directed networks some units receive many positive choices
and these units are considered to be more prestigious as the
others, which means that they are more important. Several
measures can be used to reveal prestigious units in the network: 1)
popularity and is measured by the number of arcs the vertex
receives, 2) input domain of a vertex which refers to the number
or percentage of all other vertices, from which, regarding the
direction of connections, we can reach the selected vertex, and 3)
proximity prestige which is calculated on the basis of the vertex
input domain size divided by the mean distance from all vertices
in the input domain of the vertex.
The unit in the network can appear in various brokerage roles,
namely as a coordinator, itinerant broker, representative,
gatekeeper or as a liaison. In the citation analysis, the brokerage
roles point out the path of exchanging the information or
knowledge between authors or between publications. The concept
of brokerage founds on the notions of centrality and betweenness.
The concept of centrality refers to positions of individual vertices
within the network. The centrality of a vertex can be measured by
a degree centrality and by a closeness centrality. The concept of
betweenness rests on the idea that a unit within a network is more
central if it is more important as an intermediary and is measured
by a betweenness centrality. On the basis of data, gathered over a
longer time period, we can also explore the diffusion. It is defined
as an important social process and represents a special case of
brokerage, which includes the time dimension.
In the case of directed networks, ranking is associated with
asymmetry or hierarchy, meaning that the arcs represent “point-
up” relations and not down. In this respect, the network can be
presented as a set of ranks where each rank contains one or more
clusters. The ranked clusters model represents a simple hierarchy.
4. DATA SET FOR CITATION ANALYSIS
OF E-GOVERNMENT RESEARCH e-Government related papers are being published in various
journals and presented at several conferences worldwide. In this
respect, we decided to begin our analysis of an EGR field with
analyzing the papers published in the seven proceedings of the
International Conference on e-Government (EGOV), which was
held annually since 2002. We collected electronic versions of the
papers published in these proceedings and applied semi-automatic
procedure to build the first data set for citation analysis in the
EGR field. In the continuation of this section, we will first outline
the data set structure and the procedure for extracting data from
papers, and then second, provide descriptive statistics that
summarizes the collected data set.
4.1 Data set description In order to build a data set for citation analysis, we first establish
its structure, presented in Figure 1. Since there is different amount
of information available for the papers published in the
proceedings (full affiliations of authors) and the referenced
literature (only authors and source), we established two separate
entities of EGOV_Paper and Rererence. They both share the
fields Authors, Title, and Year of publication. EGOV_paper entity
that collects data about published paper also includes two
additional fields: countries where the authors come from and
number of references. Reference entity includes two additional
fields: type of publication (e.g., an article, a paper in conference
proceeding, or book) and source that identifies the conference or
journal where the reference comes from.
Figure 1. Structure of the data set for citation analysis
In the following step we gathered data from the electronic
versions (PDF files) of the papers published in the seven
proceedings of the annual EGOV conference. We used a simple
parser to automatically extract data needed for the EGOV-Paper
entity from the front page of the paper (these include data about
authors, countries, title, and year) as well as data needed for the
EGOV_Paper Reference
Authors
Countries
Title
Num_of_refs
Year
Authors
Title
Type
Source
Year
Reference entity from the last section of each paper (these include
reference authors, title, type, source, and year). Once we collect
all the references from a paper, we can also determine the value of
the number of reference field in the EGOV_paper entity.
Note however, that the differences in formatting the front pages
and especially references posed a non-negligible challenges to the
parser. A lot of manual work was needed on data cleansing after
the first phase of automatic data collection. Many manual
corrections were also related to the inconsistencies in referencing
styles used by different authors. To name few of them: some
references enlist authors using full initials (including middle
names) while others do not; some references fully specify source
(journal or conference title) while other specify acronyms.
Following this semi-automatic procedure, we collected data about
the papers published in the seven proceedings of the annual
EGOV conference from 2002 to 2008. Our data set includes data
about 399 papers and about 5000 references. We have already
cleaned all the data about the 399 papers included in the
EGOV_paper entity, while the references data is clean only for the
papers published in the four proceedings from 2005 onward.
4.2 Data summary In this subsection, we present some basic statistical analysis to
introduce the collected data set. Here the focus is directed merely
to the presentation of the conference proceedings from the
statistical point of view, which in relation to the presented
methodology in the previous section means, that the description of
the network is introduced.
The EGOV conference in all seven years of its existence included
399 papers. On the basis of these papers, we outline some of the
characteristics of the conference, collaborating authors and their
presented papers, as well as the changes which took place in the
observed period of time.
In Table 1, the basic descriptive statistics for the number of
authors, the number of countries and the number of references for
the whole time period is presented.
The basic descriptive statistics show that in case of EGOV
conference as a whole, the minimum authors per paper is 1,
although there exist also paper(s) with 10 author(s). The average
number of authors per paper in EGOV conference is 2.43, which
means that in average 2 persons share the authorship of the paper.
The authors collaborating in the EGOV conference come from
different countries. It can be outlined, that per paper the
collaboration of authors from maximum 3 different countries can
be traced. Although, in average, papers are mainly written by
authors from the same country, as the average number of countries
per paper is 1.09.
Table 1. Descriptive statistics for EGOV conferences’ papers
for a 2002-2008 period
Variable N Minimum Maximum Mean
# authors 399 1 10 2.43
# countries 399 1 3 1.09
# refs 399 0 66 12.58
The range of the number of references is huge. We can find papers
with 0 (zero) references, as well as paper(s) with the maximum
number of 66 references. In average, authors in their papers
include approximate 12 references.
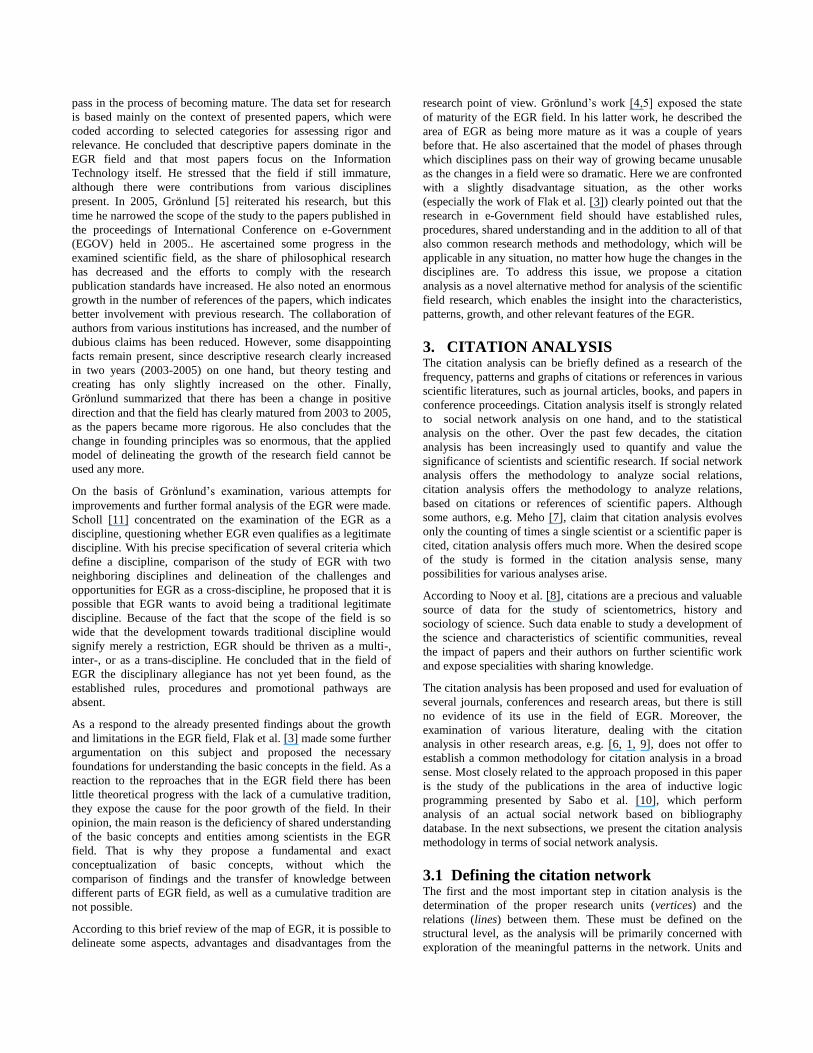
In Figure 2, the number of papers for each year is presented, as
well as its change through seven years. The numbers of papers are
represented by the dots in the diagram, and the trend of change is
indicated by the horizontal fractured line, connecting the dots.
Figure 2. Decrease in the number of papers through the years
As we can see in Figure 2, the number of presented papers
steadily increased during the first 3 years. In 2004, 100 papers
were presented at the EGOV conference. From 2004 to 2005, we
observe a huge decrease in the number of papers, as in year 2005
only 30 papers were included in the conference. The decrease can
be attributed to the fact, that the EGOV organizers have made an
effort to improve paper quality by improving the review process
[5] and the improvements were made between 2004 and 2005
conferences. This means that in the last 4 years we are witnessing
higher quality papers being published in the conference
proceedigns.
The following figures present the average numbers of authors per
paper, the average numbers of countries per paper and the average
number of references per paper. The average number are
represented by dots, the change in those numbers is represented
by the horizontal fractured line, connecting the dots, and the
vertical lines represent the minimum and maximum numbers of
authors, countries and references per paper.
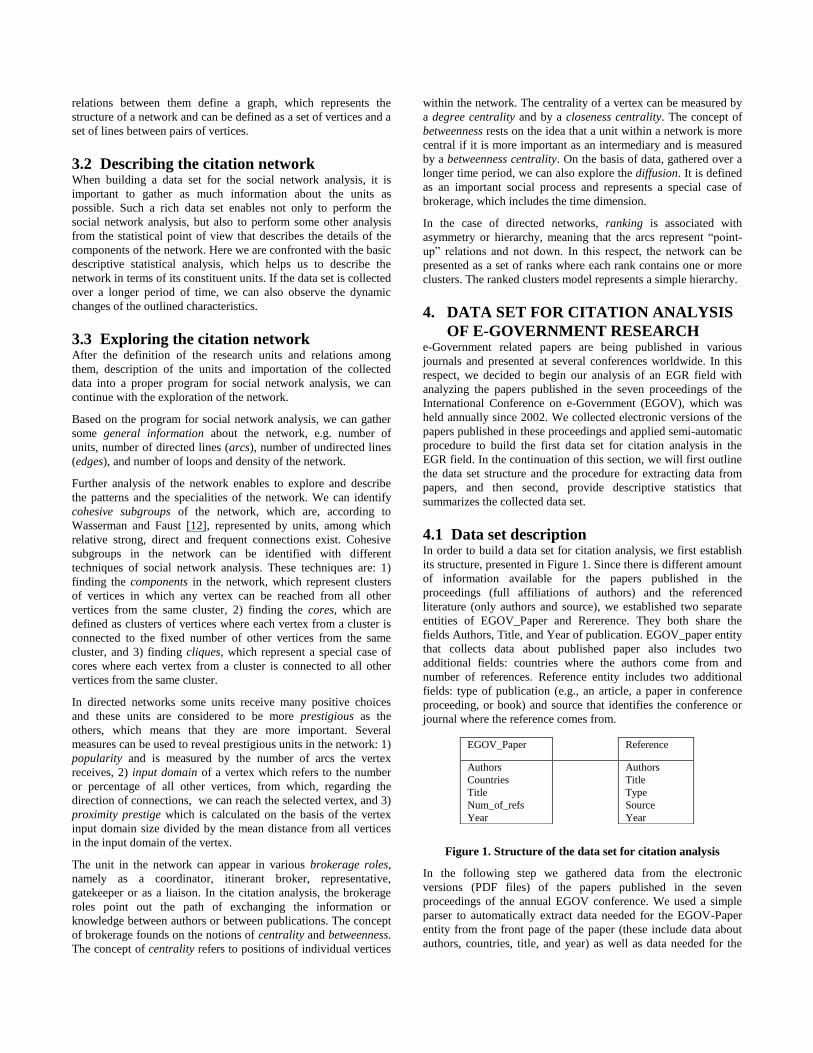
In Figure 3, the average number of authors per paper as well as its
trend is presented.
Figure 3. Change in the average number of authors per paper
through years
During the period of seven years, we can ascertain minor increase
in average number of authors per paper (Figure 3), although in
2008, as regards to 2007, the average number of authors per paper
decreased a little. Greater differences can be perceived in the
maximum number of authors, where in 2002 the number was 10,
which means, that a paper was written by 10 authors. In later
years, the difference in maximum number of authors was not so
high anymore, as the number varies for ±1 author.
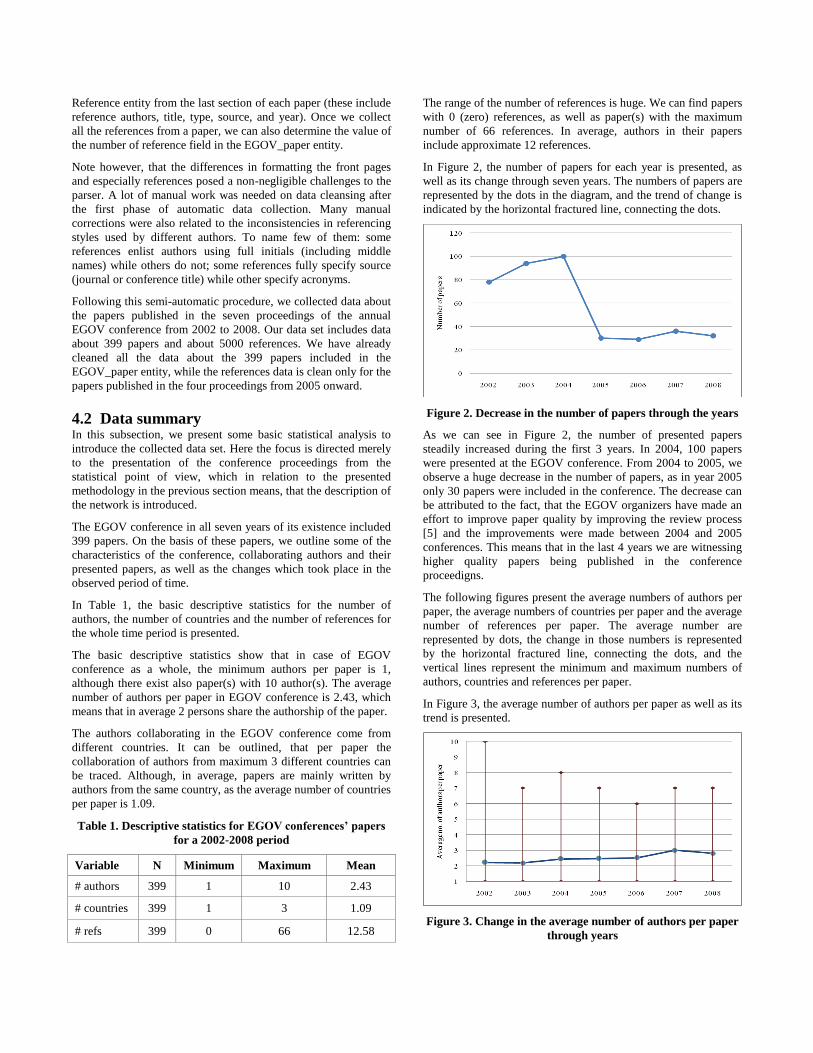
In the next figure, the average number of countries per paper and
its change is presented.
Figure 4. Change in the average number of countries per
paper through years
Similar as the average number of authors per paper, the average
number of countries per paper also increased a little (Figure 4),
although the average number of countries in all years vary from 1
to 3. In 2002, the maximum number of countries, from which
authors of one paper originated, is 3. In 2003, 2004 and 2005, the
maximum number decreased to 2, and in the last 3 years the same
paper is written by authors from at most 3 different countries.
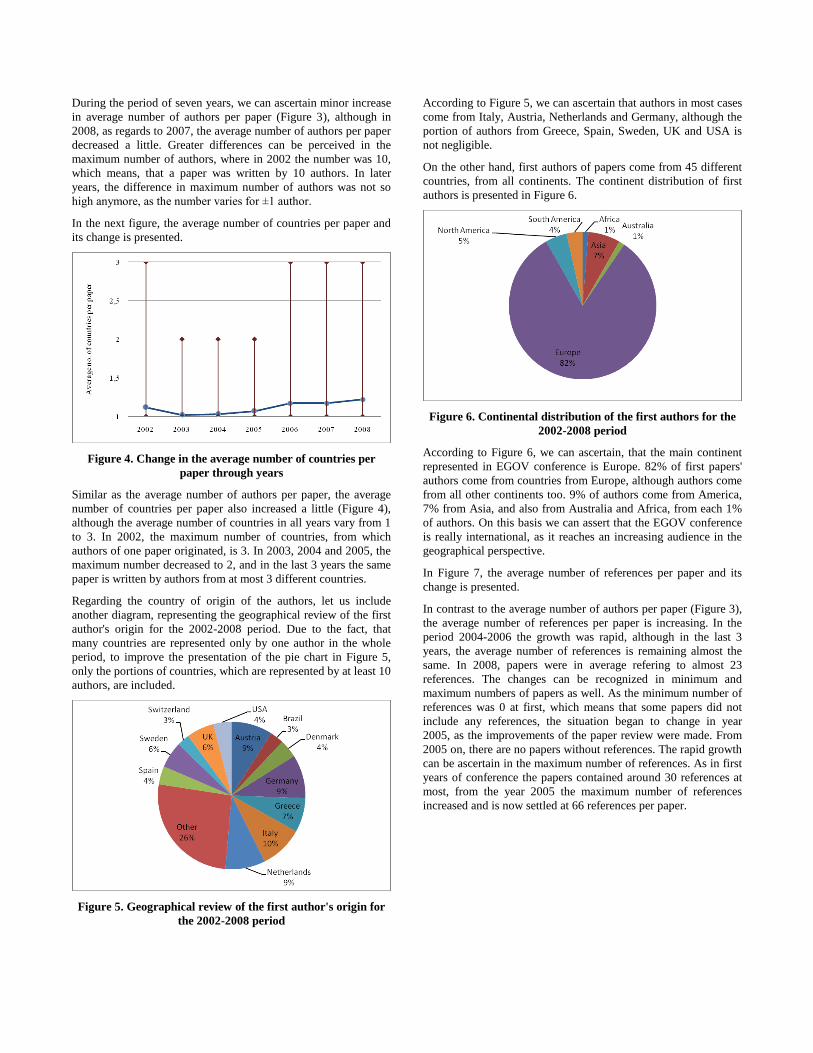
Regarding the country of origin of the authors, let us include
another diagram, representing the geographical review of the first
author's origin for the 2002-2008 period. Due to the fact, that
many countries are represented only by one author in the whole
period, to improve the presentation of the pie chart in Figure 5,
only the portions of countries, which are represented by at least 10
authors, are included.
Figure 5. Geographical review of the first author's origin for
the 2002-2008 period
According to Figure 5, we can ascertain that authors in most cases
come from Italy, Austria, Netherlands and Germany, although the
portion of authors from Greece, Spain, Sweden, UK and USA is
not negligible.
On the other hand, first authors of papers come from 45 different
countries, from all continents. The continent distribution of first
authors is presented in Figure 6.
Figure 6. Continental distribution of the first authors for the
2002-2008 period
According to Figure 6, we can ascertain, that the main continent
represented in EGOV conference is Europe. 82% of first papers'
authors come from countries from Europe, although authors come
from all other continents too. 9% of authors come from America,
7% from Asia, and also from Australia and Africa, from each 1%
of authors. On this basis we can assert that the EGOV conference
is really international, as it reaches an increasing audience in the
geographical perspective.
In Figure 7, the average number of references per paper and its
change is presented.
In contrast to the average number of authors per paper (Figure 3),
the average number of references per paper is increasing. In the
period 2004-2006 the growth was rapid, although in the last 3
years, the average number of references is remaining almost the
same. In 2008, papers were in average refering to almost 23
references. The changes can be recognized in minimum and
maximum numbers of papers as well. As the minimum number of
references was 0 at first, which means that some papers did not
include any references, the situation began to change in year
2005, as the improvements of the paper review were made. From
2005 on, there are no papers without references. The rapid growth
can be ascertain in the maximum number of references. As in first
years of conference the papers contained around 30 references at
most, from the year 2005 the maximum number of references
increased and is now settled at 66 references per paper.
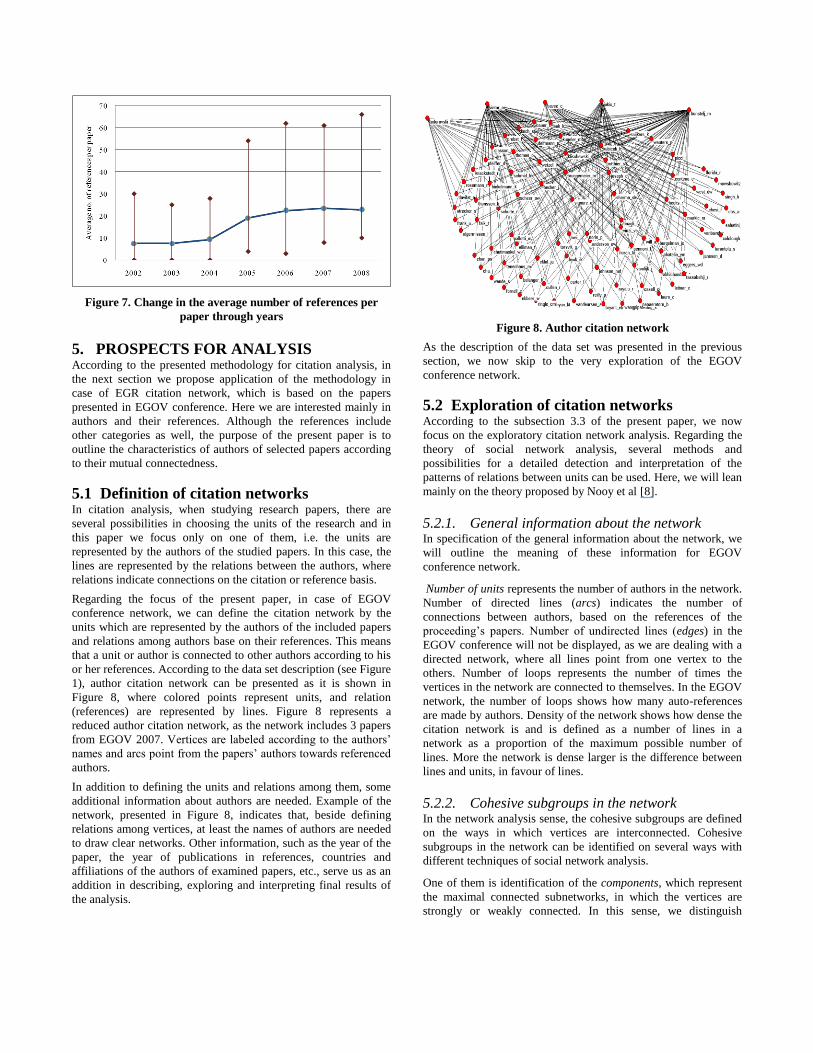
Figure 7. Change in the average number of references per
paper through years
5. PROSPECTS FOR ANALYSIS According to the presented methodology for citation analysis, in
the next section we propose application of the methodology in
case of EGR citation network, which is based on the papers
presented in EGOV conference. Here we are interested mainly in
authors and their references. Although the references include
other categories as well, the purpose of the present paper is to
outline the characteristics of authors of selected papers according
to their mutual connectedness.
5.1 Definition of citation networks In citation analysis, when studying research papers, there are
several possibilities in choosing the units of the research and in
this paper we focus only on one of them, i.e. the units are
represented by the authors of the studied papers. In this case, the
lines are represented by the relations between the authors, where
relations indicate connections on the citation or reference basis.
Regarding the focus of the present paper, in case of EGOV
conference network, we can define the citation network by the
units which are represented by the authors of the included papers
and relations among authors base on their references. This means
that a unit or author is connected to other authors according to his
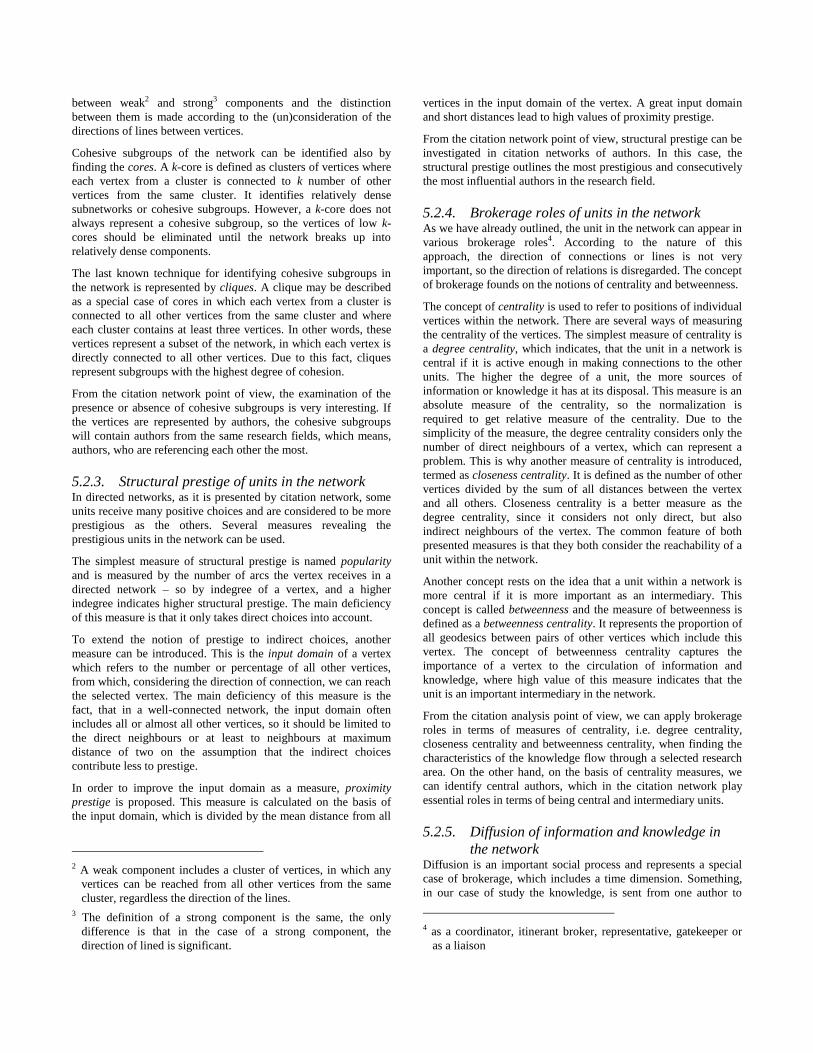
or her references. According to the data set description (see Figure
1), author citation network can be presented as it is shown in
Figure 8, where colored points represent units, and relation
(references) are represented by lines. Figure 8 represents a
reduced author citation network, as the network includes 3 papers
from EGOV 2007. Vertices are labeled according to the authors’
names and arcs point from the papers’ authors towards referenced
authors.
In addition to defining the units and relations among them, some
additional information about authors are needed. Example of the
network, presented in Figure 8, indicates that, beside defining
relations among vertices, at least the names of authors are needed
to draw clear networks. Other information, such as the year of the
paper, the year of publications in references, countries and
affiliations of the authors of examined papers, etc., serve us as an
addition in describing, exploring and interpreting final results of
the analysis.
Figure 8. Author citation network
As the description of the data set was presented in the previous
section, we now skip to the very exploration of the EGOV
conference network.
5.2 Exploration of citation networks According to the subsection 3.3 of the present paper, we now
focus on the exploratory citation network analysis. Regarding the
theory of social network analysis, several methods and
possibilities for a detailed detection and interpretation of the
patterns of relations between units can be used. Here, we will lean
mainly on the theory proposed by Nooy et al [8].
5.2.1. General information about the network In specification of the general information about the network, we
will outline the meaning of these information for EGOV
conference network.
Number of units represents the number of authors in the network.
Number of directed lines (arcs) indicates the number of
connections between authors, based on the references of the
proceeding’s papers. Number of undirected lines (edges) in the
EGOV conference will not be displayed, as we are dealing with a
directed network, where all lines point from one vertex to the
others. Number of loops represents the number of times the
vertices in the network are connected to themselves. In the EGOV
network, the number of loops shows how many auto-references
are made by authors. Density of the network shows how dense the
citation network is and is defined as a number of lines in a
network as a proportion of the maximum possible number of
lines. More the network is dense larger is the difference between
lines and units, in favour of lines.
5.2.2. Cohesive subgroups in the network In the network analysis sense, the cohesive subgroups are defined
on the ways in which vertices are interconnected. Cohesive
subgroups in the network can be identified on several ways with
different techniques of social network analysis.
One of them is identification of the components, which represent
the maximal connected subnetworks, in which the vertices are
strongly or weakly connected. In this sense, we distinguish
between weak2 and strong3 components and the distinction
between them is made according to the (un)consideration of the
directions of lines between vertices.
Cohesive subgroups of the network can be identified also by
finding the cores. A k-core is defined as clusters of vertices where
each vertex from a cluster is connected to k number of other
vertices from the same cluster. It identifies relatively dense
subnetworks or cohesive subgroups. However, a k-core does not
always represent a cohesive subgroup, so the vertices of low k-
cores should be eliminated until the network breaks up into
relatively dense components.
The last known technique for identifying cohesive subgroups in
the network is represented by cliques. A clique may be described
as a special case of cores in which each vertex from a cluster is
connected to all other vertices from the same cluster and where
each cluster contains at least three vertices. In other words, these
vertices represent a subset of the network, in which each vertex is
directly connected to all other vertices. Due to this fact, cliques
represent subgroups with the highest degree of cohesion.
From the citation network point of view, the examination of the
presence or absence of cohesive subgroups is very interesting. If
the vertices are represented by authors, the cohesive subgroups
will contain authors from the same research fields, which means,
authors, who are referencing each other the most.
5.2.3. Structural prestige of units in the network In directed networks, as it is presented by citation network, some
units receive many positive choices and are considered to be more
prestigious as the others. Several measures revealing the
prestigious units in the network can be used.
The simplest measure of structural prestige is named popularity
and is measured by the number of arcs the vertex receives in a
directed network – so by indegree of a vertex, and a higher
indegree indicates higher structural prestige. The main deficiency
of this measure is that it only takes direct choices into account.
To extend the notion of prestige to indirect choices, another
measure can be introduced. This is the input domain of a vertex
which refers to the number or percentage of all other vertices,
from which, considering the direction of connection, we can reach
the selected vertex. The main deficiency of this measure is the
fact, that in a well-connected network, the input domain often
includes all or almost all other vertices, so it should be limited to
the direct neighbours or at least to neighbours at maximum
distance of two on the assumption that the indirect choices
contribute less to prestige.
In order to improve the input domain as a measure, proximity
prestige is proposed. This measure is calculated on the basis of
the input domain, which is divided by the mean distance from all
2 A weak component includes a cluster of vertices, in which any
vertices can be reached from all other vertices from the same
cluster, regardless the direction of the lines.
3 The definition of a strong component is the same, the only
difference is that in the case of a strong component, the
direction of lined is significant.
vertices in the input domain of the vertex. A great input domain
and short distances lead to high values of proximity prestige.
From the citation network point of view, structural prestige can be
investigated in citation networks of authors. In this case, the
structural prestige outlines the most prestigious and consecutively
the most influential authors in the research field.
5.2.4. Brokerage roles of units in the network As we have already outlined, the unit in the network can appear in
various brokerage roles4. According to the nature of this
approach, the direction of connections or lines is not very
important, so the direction of relations is disregarded. The concept
of brokerage founds on the notions of centrality and betweenness.
The concept of centrality is used to refer to positions of individual
vertices within the network. There are several ways of measuring
the centrality of the vertices. The simplest measure of centrality is
a degree centrality, which indicates, that the unit in a network is
central if it is active enough in making connections to the other
units. The higher the degree of a unit, the more sources of
information or knowledge it has at its disposal. This measure is an
absolute measure of the centrality, so the normalization is
required to get relative measure of the centrality. Due to the
simplicity of the measure, the degree centrality considers only the
number of direct neighbours of a vertex, which can represent a
problem. This is why another measure of centrality is introduced,
termed as closeness centrality. It is defined as the number of other
vertices divided by the sum of all distances between the vertex
and all others. Closeness centrality is a better measure as the
degree centrality, since it considers not only direct, but also
indirect neighbours of the vertex. The common feature of both
presented measures is that they both consider the reachability of a
unit within the network.
Another concept rests on the idea that a unit within a network is
more central if it is more important as an intermediary. This
concept is called betweenness and the measure of betweenness is
defined as a betweenness centrality. It represents the proportion of
all geodesics between pairs of other vertices which include this
vertex. The concept of betweenness centrality captures the
importance of a vertex to the circulation of information and
knowledge, where high value of this measure indicates that the
unit is an important intermediary in the network.
From the citation analysis point of view, we can apply brokerage
roles in terms of measures of centrality, i.e. degree centrality,
closeness centrality and betweenness centrality, when finding the
characteristics of the knowledge flow through a selected research
area. On the other hand, on the basis of centrality measures, we
can identify central authors, which in the citation network play
essential roles in terms of being central and intermediary units.
5.2.5. Diffusion of information and knowledge in
the network Diffusion is an important social process and represents a special
case of brokerage, which includes a time dimension. Something,
in our case of study the knowledge, is sent from one author to
4 as a coordinator, itinerant broker, representative, gatekeeper or
as a liaison
another in the course of time. It is generally known, that the
diffusion of the definite phenomena is represented by the typical
S-shape of the diffusion curve. This means, that at first few
authors adopt the innovation but the adoption rate accelerates,
then when 10 to 20 percent of the authors have adopted
innovation, the absolute number of new adopters is still
increasing, causing a sharp raise of the adopters and finally, the
number of new adopters decreases, which means that the diffusion
process slowly reaches its end.
In citation analysis, the examination of the diffusion processes is
important from the information or knowledge spreading point of
view. In this case, the adoption rate represents the percentage of
new adopters of the specific knowledge at a particular moment.
Contagion refers to the spreading new knowledge from the author,
who started the innovation, to his or her closest colleagues, which
are exposed to this innovation. After a time, hopefully, adoption
rate accelerates, reaches the critical mass, then still increases and
at the end of the diffusion process decreases.
5.2.6. Ranking clusters of the units in the network In the case of directed networks, as the citation network actually
is, ranking is associated with asymmetry or hierarchy, meaning
that the arcs represent “point-up” relations and not down. In this
respect, the network can be presented as a set of ranks where each
rank contains one or more clusters. The ranked clusters model
represents a simple hierarchy. In the case of ranking, we have to
deal with acyclic networks, which certainly do not hold for the
citation networks. Based on the papers’ references, citation
networks have cyclic structure. Fortunately, it is relatively easy to
detect cyclic parts of the networks, as they are represented by
strong components. If we identify strong components in the
network, we can shrink them and the network becomes acyclic.
However, the notion of strong components seems not to be
sufficiently strict to identify cluster within a rank. Furthermore,
strong components as cyclic subnetworks represent clusters of
equals, where acyclic subnetworks reflect hierarchy perfectly.
That is why acyclic decomposition is usually used to determine
hierarchy in the network.
Acyclic decomposition determines the hierarchy in the network
according to several steps of procedure. In the simplest way, it is
necessary first to find strong components in the network, i.e.
cyclic subnetworks. Then each strong component is shrunk into a
vertex, so we get a new network with so many units as the number
of strong components is. Finally, we compute the depth for each
vertex in the new network, so we get the hierarchy. Then we can
remove arcs, which are interconnecting the strong components,
and convert all bi-directed arcs into edges. On the basis of the
presented procedure, we get a diagram, which represents clusters
of vertices which are interconnected.
6. PRELIMINARY RESULTS In the previous section, the prospects for analysis were
represented. Considering the data set, presented in section 4.2, we
can apply methods and techniques of citation analysis to outline
some of the characteristics of authors’ citation network. In the
continuation, some preliminary results of citation analysis
following sections 5.2.1, 5.2.2., and 5.2.3 are represented. Here
we focus on the citation network among authors of selected papers
for the whole 2005-2008 period, for which all data are clean.
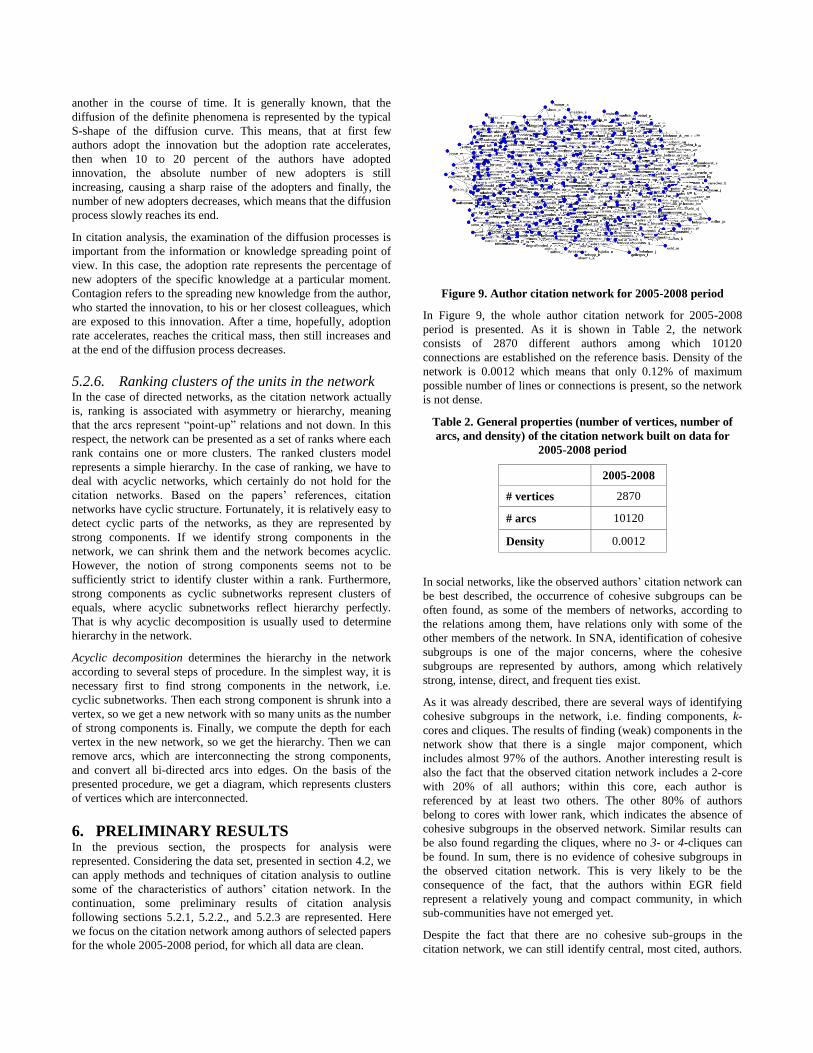
Figure 9. Author citation network for 2005-2008 period
In Figure 9, the whole author citation network for 2005-2008
period is presented. As it is shown in Table 2, the network
consists of 2870 different authors among which 10120
connections are established on the reference basis. Density of the
network is 0.0012 which means that only 0.12% of maximum
possible number of lines or connections is present, so the network
is not dense.
Table 2. General properties (number of vertices, number of
arcs, and density) of the citation network built on data for
2005-2008 period
2005-2008
# vertices 2870
# arcs 10120
Density 0.0012
In social networks, like the observed authors’ citation network can
be best described, the occurrence of cohesive subgroups can be
often found, as some of the members of networks, according to
the relations among them, have relations only with some of the
other members of the network. In SNA, identification of cohesive
subgroups is one of the major concerns, where the cohesive
subgroups are represented by authors, among which relatively
strong, intense, direct, and frequent ties exist.
As it was already described, there are several ways of identifying
cohesive subgroups in the network, i.e. finding components, k-
cores and cliques. The results of finding (weak) components in the
network show that there is a single major component, which
includes almost 97% of the authors. Another interesting result is
also the fact that the observed citation network includes a 2-core
with 20% of all authors; within this core, each author is
referenced by at least two others. The other 80% of authors
belong to cores with lower rank, which indicates the absence of
cohesive subgroups in the observed network. Similar results can
be also found regarding the cliques, where no 3- or 4-cliques can
be found. In sum, there is no evidence of cohesive subgroups in
the observed citation network. This is very likely to be the
consequence of the fact, that the authors within EGR field
represent a relatively young and compact community, in which
sub-communities have not emerged yet.
Despite the fact that there are no cohesive sub-groups in the
citation network, we can still identify central, most cited, authors.
An author is considered to be more popular or prestigious then
others, if he/she receives many positive choices. In Table 3, we
present the results of the three measures of structural prestige –
input degree, input domain, and proximity prestige. For each
measure, the minimum and maximum value is shown, as well as
its average, and in the last column the first 10 authors with the
highest values of prestige are presented.
Table 3. Structural prestige measures (input degree, input
domain, and proximity prestige) for authors in the citation
network built on data for 2005-2008 period
Min. Max. Mean 2005-2008
Input
degree 0.000 0.0195 0.0012
Wimmer,
Grönlund, van
Dijk, Ebbers, Lee
J.W., Heeks,
Layne, Hargittai,
Tambouris,
Peristeras
Input
domain 0.000 0.0537 0.0249
Orlikowski, Lee
S.M., Keen,
Holzer, Drucker,
Thompson,
Morton, Pollitt,
Delancer,
Newcomber
Proximity
Prestige 0.000 0.0250 0.0067
Grönlund, Heeks,
Hood, Wimmer,
Lee J.W., Webster,
van Dijk, Layne,
Margetts,
Hargittai
As it is shown in the table above, input degree and proximity
prestige produce similar results in a sense of the most prestigious
authors, whereas the results of input domain show deviation from
other two measures. In Table 3, the names of authors, which
emerge as the prestigious ones in at least two different measures
of prestige, are marked bold. We can ascertain that regarding the
input degree and proximity prestige Grönlund, Heeks, Wimmer,
Lee, Layne, and Hargittai are the most prestigious authors in the
whole citation network, which means that these authors were
referenced from others the most.
Regarding the results of structural prestige measures, in Table 4
the main topics as well as the number of citations for each of the
most prestigious authors are represented.
Now, in the final stage of our analysis, we can draw some content
conclusions about the most prestigious authors in the observed
network. In this way, we can also delineate the thematic topics
which influenced the work in EGR field the most.
Most of the references are made to the papers, which consider the
state-of-the-art of e-government research, written by Grönlund
and in minor extend also by Heeks. In their papers, they provide
the analysis of EGR field and offer the overview of the current
stage of the field. The second most influential thematic topic is
one of integrating e-services in public administration The papers
here are mainly written by Wimmer and her colleagues, where
they introduce and analyze different frameworks and approaches
to integration and interoperability of e-government services. The
third most influential thematic topic regards to digital divide with
Hargittai as the authors of these papers. In her papers, she goes
beyond the digital divide introducing digital inequality and
exposing the significant differences among Web users. Another
influential topic is one regarding the unification of e-government
theories and models, which was proposed by Lee and Layne.
Although one would expect that with maturation of the EGR field
this topic would become the most important issue, in the EGOV
proceedings this is not the case.
Table 4. Structural prestige measures (input degree, input
domain, and proximity prestige) for authors in the citation
network built on data for 2005-2008 period
Author Topic Published
in # Cit.
1 Grönlund,
A.
state-of-the-art e-
government research
EGOV
IJEGR 13
2 Heeks, R.
success and failure of e-
government projects book 6
state-of-the-art e-
government research GIQ 6
3 Wimmer,
M.A.
integration of e-services
in public administration
HICSS
EM
IFIP
11
roadmaps for future e-
government research EGOV 5
4 Lee, JW
Layne, K.
unifying e-government
theories and models GIQ 7
5 van Dijk, J.
user profiling and
services personalization
in public administration
EGOV
GIQ 6
6 Hargittai, E. digital divide
FM
JASIST
ITS
8
Finally, there are some other thematic topics being almost equally
influential, but are cited less frequently as the four topics
described before. These are: success and failure of e-government
projects, authored by Heeks), roadmaps for future e-government
research, authored by Wimmer, and user profiling and services
personalization in public administration, authored by van Dijk.
7. CONCLUSION In the previous sections we have outlined the stage of the EGR
field and emphasized the interests of the researchers for analysis
of its development. We proposed a methodology for scientific
field research in terms of citation analysis and described the
citation network data set for the papers published at the
International Conference on e-Government. The presented data set
represent the first necessary step in our planned analysis of the
development of EGR. Finally, we outlined the prospects for
analysis in the data set and performed some points of the analysis
which gave us some preliminary results.
We made the first step towards more elaborative analysis of EGR
by proposing the methodology for citation analysis in this paper.
On the basis of the content of the present paper we are continuing
with our research, as the actual exploratory citation network
analysis for papers presented at EGOV conference is going to be
executed. The main aim of our research in progress is to delineate
the history and the growth patterns in the EGR field, the inside
connectedness of the EGR area and the connections of the field
with other research fields. The crucial point is also to investigate
the connections between the EGOV conference and other e-
government conferences worldwide.
But the continuation of our research will include some other
prospects as well. Although the present paper focuses merely on
the citation network among authors of the selected papers, other
possibilities in choosing the units of the research are possible. On
one hand, there is a possibility that the units are represented by
papers/articles themselves, where relations are expressed by the
references made between the papers. In this sense, the relations
among papers can be evaluated, as well as the connectedness of
the EGR field with other research fields. On the other hand, the
units can also be presented by authors and papers, where we can
form a two-mode network and relations are made from papers to
authors, according to the references made. The third possibility is
to employ conferences and/or journals as units, where the
relations are made between conferences and journals regarding the
references. In this case, the exploration of relations among EGR
field and other fields is possible, since every conference or journal
is significant for specific research field.
There are also other possibilities for analysis in the authors’
citation network sense. In the present paper we focused on authors
and relations between them based on the references made. But in
the future we are also planning to form a co-authorship network
and analyze the authors in EGR field from this perspective. In all
these possibilities for analysis, the central point will stay the same,
since the methods of SNA, described in this paper, will be applied
to citation analysis of various networks.
We know that the collected data set has a narrow focus since there
exist other conferences on e-government or digital government
(e.g., this conference, i.e., the National Conference on Digital
Government Research, dg.o). Focusing on the papers from EGOV
conference, the interesting viewpoint is certainly the
connectedness of these two international conferences, which
should contain common research sights and share the knowledge.
The connection can be identified by references, where the papers
of each conference, in our case of EGOV conference, should be
referring to papers of the other conference, in our case to the
papers of dg.o conference.
In the future, the tendency towards expanding our data set and
consequently our research is present. We are planning to examine
also other conferences and, more importantly, journals in the e-
government field. Efforts can be extended to literature from
neighboring research fields that are closely related to the e-
government research. On this basis, we could outline the EGR
field as a whole which will enable the full insight into the field.
Although the realization of this idea is still relatively far away,
once it is implemented, the complete map of the EGR field will be
fully discovered and explored.
8. REFERENCES [1] Clausen, M. and Wormell, I. 2001. A bibliometric analysis of
IOLIM conferences 1977-1999. Journal of Information
Science 27 (3), 157-169.
[2] Cotterill, S. and King, S. 2007. Public Sector Partnerships to
Deliver Local E-Government: A Social Network Study. In
Wimmer, M.A., Scholl, H.J. and Grönlund, A. (Eds). EGOV
2007, LNCS 4656, 240-251. Springer-Verlag, Berlin,
Heidelberg.
[3] Flak, L.S., Sein, M.K. and Sæbo, Ø. 2007. Towards y
Cumulative Tradition in E-Government Research: Going
Beyond the Gs and Cs. In Wimmer, M.A., Scholl, H.J. and
Grönlund, A. (Eds). EGOV 2007, LNCS 4656, 13-22.
Springer-Verlag, Berlin, Heidelberg.
[4] Grönlund, A. 2004. State of the Art in e-Gov Research – A
Survey. In Traunmüller, R. (Ed.). EGOV 2004, LNCS 3183,
178-185. Springer-Verlag, Berling, Heidelberg.
[5] Grönlund, A. 2006. e-Gov Research Quality . In Wimmer,
M.A. et al. (Eds.): EGOV 2006, LNCS 4084, 1-12. Springer-
Verlag, Berling, Heidelberg.
[6] Liu, Z. and Wang, C. 2005. Mapping interdisciplinarity in
demography: a journal network analysis. Journal of
Information Science, 31 (4), 308-316.
[7] Meho, L.I. 2007. The rise and rise of citation analysis.
Physics World, 20 (1), 32-36.
[8] Nooy, W.d., Mrvar, A. and Batagelj, V. 2005. Exploratory
social network analysis with Pajek. Cambridge University
Press, New York.
[9] Rahm, E. and Thor A. 2005. Citation analysis of database
publications. SIGMOD Record, 34 (4), 48-53.
[10] Sabo, S., Grčar, M., Fabjan, D.A., Ljubič, P. and Lavrač, N.
2007. Exploratory analysis of the ILPnet2 social network.
http://kt.ijs.si/Dunja/SiKDD2007/Papers/Sabo_PajekILPNet.
[11] Scholl, H.J. 2006. Is E-Government Research a Flash in the
Pan or Here for the Long Shot? In Wimmer, M.A. et al.
(Eds.): EGOV 2006, LNCS 4084, 13-24. Springer-Verlag,
Berling, Heidelberg.
[12] Wasserman, S. and Faust, K. 1994. Social network analysis:
methods and applications. Cambridge University Press,
Cambridge, New York, Melbourne.