Computers: Information Technology in Perspective, 2001, 495 ...
Upload
khangminh22Category
view
3download
0
�����������������
Citation: Zhirnova, D.F.;
Belokopytova, L.V.; Upadhyay, K.K.;
Tripathi, S.K.; Babushkina, E.A.;
Vaganov, E.A. 495-Year Wood
Anatomical Record of Siberian Stone
Pine (Pinus sibirica Du Tour) as
Climatic Proxy on the Timberline.
Forests 2022, 13, 247. https://
doi.org/10.3390/f13020247
Academic Editor: Ignacio
García-González
Received: 12 January 2022
Accepted: 4 February 2022
Published: 6 February 2022
Publisher’s Note: MDPI stays neutral
with regard to jurisdictional claims in
published maps and institutional affil-
iations.
Copyright: © 2022 by the authors.
Licensee MDPI, Basel, Switzerland.
This article is an open access article
distributed under the terms and
conditions of the Creative Commons
Attribution (CC BY) license (https://
creativecommons.org/licenses/by/
4.0/).
Article
495-Year Wood Anatomical Record of Siberian Stone Pine(Pinus sibirica Du Tour) as Climatic Proxy on the TimberlineDina F. Zhirnova 1,*, Liliana V. Belokopytova 1 , Keshav K. Upadhyay 2 , Shri K. Tripathi 2,Elena A. Babushkina 1 and Eugene A. Vaganov 3,4
1 Khakass Technical Institute, Siberian Federal University, 655017 Abakan, Russia; [email protected] (L.V.B.);[email protected] (E.A.B.)
2 Department of Forestry, Mizoram University, Aizwal 796004, India; [email protected] (K.K.U.);[email protected] (S.K.T.)
3 Institute of Ecology and Geography, Siberian Federal University, 660041 Krasnoyarsk, Russia;[email protected]
4 Department of Dendroecology, V.N. Sukachev Institute of Forest, Siberian Branch of the Russian Academy ofScience, 660036 Krasnoyarsk, Russia
* Correspondence: [email protected]
Abstract: The application of quantitative wood anatomy (QWA) in dendroclimatic analysis offersdeep insight into the climatic effect on tree-ring formation, which is crucial in understanding theforests’ response to climate change. However, interrelations between tree-ring traits should beaccounted to separate climatic signals recorded during subsequent stages of cell differentiation. Thestudy was conducted in the South Siberian alpine timberline on Pinus sibirica Du Tour, a speciesconsidered unpromising in dendroclimatology. Relationships between tree-ring width, cell numberN, mean and maximum values of radial diameter D, and cell wall thickness (CWT) were quantifiedto obtain indexed anatomical chronologies. Exponential functions with saturation D(N) and CWT(N)were proposed, which explained 14–69% and 3–61% of their variability, respectively. Indexationunabated significance of the climatic signals but separated them within a season. Analysis ofpointer years and climatic extremes revealed predominantly long-term climatogenic changes ofP. sibirica radial growth and QWA and allowed to obtain QWA-based 11-year filtered reconstructionsof vegetative season climatic characteristics (R2
adj = 0.32–0.66). The revealed prevalence of low-frequency climatic reactions is probably explained by a strategy of slow accumulation and utilizationof resources implemented by P. sibirica. It makes this species’ QWA a promising proxy for decadalclimatic variations in various intra-seasonal timeframes.
Keywords: quantitative wood anatomy (QWA); Pinus sibirica Du Tour; alpine timberline; climaticresponse; low-frequency climatic reconstruction
1. Introduction
In past decades, noticeable changes in the global climate marked by rising temperatureand altering precipitation patterns have been crucial in affecting the ecosystems’ structureand functioning (i.e., the spatial distribution of species and their phenological patterns)and their abilities to provide goods and services to mankind [1–7]. Such climatic changesare important to dramatically affect the ecosystems in the areas where either of thesefactors are limiting the growth of trees, e.g., the temperature in the timberline. However,our abilities to detect such changes on a long-term basis are limited by the length ofinstrumental climatic records. Tree rings have been reported as one of the promisingindicators for ecological and environmental changes due to their sensitivity to climate,annual resolution, and large spatial coverage [8–10]. Mountain conifer forests found attimberlines are expected to experience the impact of climate change at an early stage andare considered harbingers of future ecosystem shifts [11]. Therefore, studying the response
Forests 2022, 13, 247. https://doi.org/10.3390/f13020247 https://www.mdpi.com/journal/forests
Forests 2022, 13, 247 2 of 22
of such forests to climate change will be of great practical significance, as they are growingunder severe environmental stress conditions and often experiencing the border limit ofphysiological endurance [12]. However, the scope of dendrochronological analysis evenunder such conditions depends on the degree of sensitivity of tree-ring chronologies todynamic environmental factors and the content of a common external signal [13]. This hasled to consider many tree species as unpromising from a dendrochronological point of viewand kept them outside the scope of scientific interest [8,14–18].
Due to the species-specific characteristics of needles, sensitivity to moisture deficit,etc., the response of Siberian stone pine (Pinus sibirica Du Tour) to warming phenomenais inconsistent and complex [17]. Therefore, this species is relatively lesser studied incomparison to other, more drought-resistant, and light-demanding fellow conifers likeScots pine and Siberian larch. A similar issue of climatic response has been recorded inother related species like P. cembra growing in Western Europe and P. koraiensis in thefar east of Russia, northern China, and Korea [19–21]. In dendroclimatological analysis,chronologies with sensitivity (year-to-year variability) of 30% and more are consideredsensitive to climatic fluctuations, whereas the radial growth of these Strobus pines is highlystable in the high-frequency domain with sensitivity rarely exceeding 10% [9]. However,other species which often share habitat with Siberian stone pine (e.g., Siberian larch) canexhibit a sensitivity of 50% and higher under extreme conditions [22,23]. In addition, treerings of these pines make a smaller proportion of latewood as compared to other conifers,and their latewood only slightly differs from earlywood due to the very mild thickening ofthe tracheid cell walls [24]. As a result, the earlywood and latewood width or densitometrictraits for these species are also difficult to analyze. Nevertheless, P. sibirica has been reportedto have great significance to forestry, economy, and ecology over vast territories from theUrals to Eastern Siberia [25–28].
Mountain populations in southern Siberia are of particular interest in analyzing theclimatic reactions of forest ecosystems. In these areas, heterogeneity and pronouncedmosaics of terrain significantly influence the microclimate even at short distances, andlargely affect the growth and development of vegetation [12,29–31]. The Western Sayan isa convenient testing polygon to address this issue due to rapid rates of regional temperatureincrease significantly exceeding global trends, which are being further multiplied locallynear the massive Sayano-Shushenskoe Reservoir [32,33].
The weak and unstable response of radial growth of P. sibirica to climatic variablesunder traditional dendrochronology even at the upper timberline [15,16,32] has led toconsidering other possible approaches for recovering detailed climate information fromtree rings [34]. Long-term chronologies of wood anatomical parameters are particularlyone of the new methods in this area [35]. The environmental signals encoded in individualcells reflect changes in external factors that occurred over a short interval and thereforediffer from the integral signal of tree-ring width at both intensity and seasonality [18,24,36].Hence, long-term chronologies of wood anatomical parameters in comparison with radialgrowth can provide a more detailed and equally reliable pattern of climatic factors whichare affecting tree growth [36–38]. Although the key to the success of this approach hasalready been developed, the dendroclimatic reconstructions based on the conifer woodanatomical parameters are still of limited length (for example, P longaeva [39], P. cembra [18],and Pseudotsuga menziesii [40]). Due to the observed predominance of low-frequencyfluctuations in the growth of Siberian stone pine [15], it will be promising to identifythe effect of decadal climatic changes on its wood structure as well. Dendroclimaticanalysis of anatomical parameters can also help in studying the tree response to short-termextreme events impacting many forest ecosystems [41,42]. This study will provide ampleopportunities for assessing the responses of these forest ecosystems with managementimplications over a vast territory at present and in the future.
Dendroclimatic analysis based on long-term wood anatomical chronology shouldbe performed considering relationships between various anatomical parameters. Cellproduction in the season can affect the morphometric tracheid parameters that characterize

Forests 2022, 13, 247 3 of 22
the subsequent stages of cell differentiation, i.e., growth by expansion and secondary walldeposition (cell radial size and wall thickness, respectively [43,44]). This study hypothesizesthat the removal of this influence will allow obtaining indexed chronologies of anatomicalparameters containing a “separate” climatic signal perceived by the developing tracheidsduring specific stages of their differentiation. We assumed that the anatomical chronologiesand cell production of P. sibirica indexed in this way will have independent responses toannual and/or long-term climatic fluctuations (dendroclimatic correlations) and extremeevents (analysis of pointer years).
2. Materials and Methods
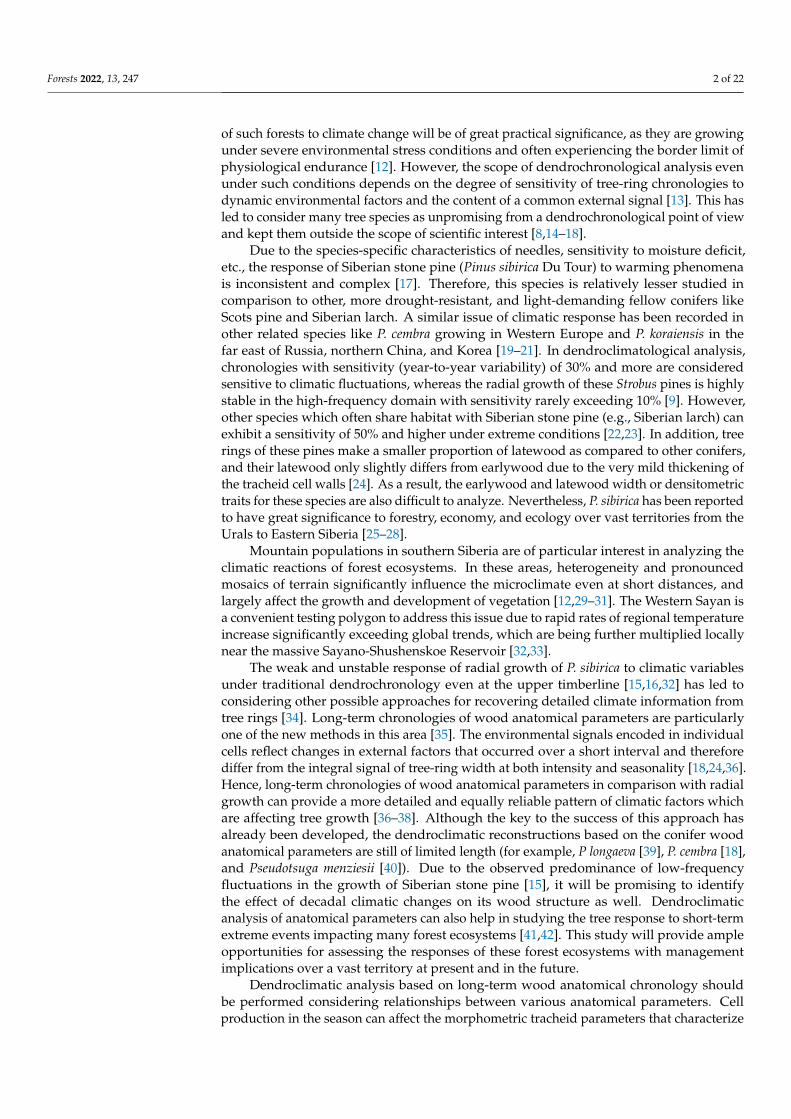
The study was carried out on the Khem-Taiga Ridge (up to 2715 m a.s.l.) of WesternSayan Mountains in Southern Siberia, near the border of the Republic of Khakassia andthe Republic of Tyva (Figure 1). The regional landscape encompasses wide variations innatural conditions, where steppes are found in foothills (~400 m a.s.l.), mixed and conifertaiga forests in mountains (up to 1800–2100 m a.s.l.), and tundra vegetation or bare rockson mountaintops.
Forests 2021, 12, x FOR PEER REVIEW 4 of 23
Figure 1. The location map of the study area: (a) satellite imagery of the area; (b) location of the
study area (dot), Khakassia (red area), and Tyva (orange area) within the Asian part of Russia; (c)
topographic map of the study area. Marked objects are the boundary between Khakassia and Tyva
along the ridge crest (dotted line), the Sayansky Pass (asterisk), and the sampling site along the
road (dashed line).
Tree cores were sampled using increment borer at chest height (~1.3 m) in the direc-
tion perpendicular to slope aspect, i.e., parallel to elevation isolines. The standard pro-
tocols have been followed in the transportation of cores, their processing, measurement
of tree-ring width (TRW), cross-dating, and in obtaining chronologies for dendrochron-
ological research [9] using a LINTAB 5 measuring device with an accuracy of 0.01 mm,
and computer software platforms TSAPwin, COFECHA and ARSTAN [48–50]. During
TRW standardization, the age-related trends of individual series have been removed
using cubic smoothing splines with a 50% frequency response at 67% of the series length,
and normalized local standard chronology (i.e., TRW_std) was obtained as bi-weighted
average. A total of seven old trees with tree-ring series lengths of 234–495 years (ex-
tending from 1524–1785) were selected for the measurement of parameters related to
wood anatomical structure (Table 1). The actual cambial age of these trees considerably
exceeds the given values, as most of the old pine trees have a rotten trunk with hollow
inside due to prevailing conditions in the study area, and thus, their cores did not reach
the pith. Before sectioning, cores were cut into pieces of 3–3.5 cm length (diagonally to
ensure overlap of tree rings between pieces and cross-dating without gaps), softened by
soaking in the warm water for a day, and then mounted in the specialized sample holder
for the microtome. Cross-sections of ~14 μm thickness were obtained from the sampled
cores using a rotary microtome (HM 340E, Microm GmbH). Each cross-section was
stained with safranin, dehydrated with alcohols of increasing concentration, embedded
between the glass slide and cover glass in Canada balsam and dried, then photographed
at ×400 magnification with a digital camera (ProgRes Gryphax Subra, Jenoptik GmbH)
mounted on a biological microscope (BX43, Olympus).
Figure 1. The location map of the study area: (a) satellite imagery of the area; (b) location of thestudy area (dot), Khakassia (red area), and Tyva (orange area) within the Asian part of Russia;(c) topographic map of the study area. Marked objects are the boundary between Khakassia and Tyvaalong the ridge crest (dotted line), the Sayansky Pass (asterisk), and the sampling site along the road(dashed line).
In the absence of a state meteorological station within 100 km periphery of the sam-pling site, the dendroclimatic analysis has been performed using spatially distributeddaily series of precipitation (P) and temperature (T) obtained from the ERA-20C cli-mate reanalysis database (1900–2010, [45]) from KNMI Climate Explorer service (http://climexp.knmi.nl/selectdailyfield2.cgi; accessed on 2 February 2022). The re-analysisdata obtained for the region 49.7–52.5◦ N 89.3–90.7◦ E exhibit characteristics of continentalclimate with average annual temperatures of −2.2 ◦C and total annual precipitation of

Forests 2022, 13, 247 4 of 22
710 mm (Supplementary materials, Figure S1). The maximum and minimum monthly val-ues of T and P have been observed in July (14.0 ◦C and 157 mm) and January (−19.5 ◦C and13 mm), respectively. About 74% of the total annual precipitation has been received duringthe warmer months from May to September. However, as per available literature records,a drop in air temperature (0.4–0.65 ◦C) and rise in annual precipitation (100–200 mm) per100 m increase in elevation are typical for the Western Sayan Mountains, depending uponthe season (stronger in summer than in winter) and local orographic conditions [46,47].This can be observed from a comparison between average annual climatic characteristicsof two weather stations of different elevations located within the Western Sayan Moun-tains (52.8–52.9◦ N latitude): Cheryomushki at 330 m a.s.l. (+3.3 ◦C; 530 mm) and OlenyaRechka at 1400 m a.s.l. (−2.7 ◦C; 1250 mm). Therefore, a colder and wetter climate isexpected in high-mountain conditions at the upper timberline as compared to the averagedregional characteristics.
In the present study, wood samples (5 mm diameter cores) from 54 dominant maturetrees (~10–12 m height) of P. sibirica have been collected in 2018 alongside the Abakan–Ak-Dovurak highway road, about 2.8 km (1.5 km in a straight line) away from the SayanskyPass located on the border of the two regions (Figure 1). The stand is represented byP. sibirica with an admixture of Larix sibirica Ledeb. Continuous moss cover is comprised ofspecies of Hylocomium, Pleurozium, Plytrichum, and Cladonia. Undergrowth is formed by anabundant growth of species like Vaccinium vitis-idaea L., Bergenia crassifolia (L.) Fritsch, Betularotundifolia Spach, and Salix sp. The age of trees gradually decreases with the elevation andonly sparse saplings (mainly larch) are found above 2050 m a.s.l. The sampling site with oldpine trees is located on a gentle slope (10–15◦) facing southwestern direction (51◦42.8′ N89◦51.9′ E, 1970–2020 m a.s.l.).
Tree cores were sampled using increment borer at chest height (~1.3 m) in the di-rection perpendicular to slope aspect, i.e., parallel to elevation isolines. The standardprotocols have been followed in the transportation of cores, their processing, measurementof tree-ring width (TRW), cross-dating, and in obtaining chronologies for dendrochrono-logical research [9] using a LINTAB 5 measuring device with an accuracy of 0.01 mm,and computer software platforms TSAPwin, COFECHA and ARSTAN [48–50]. DuringTRW standardization, the age-related trends of individual series have been removed usingcubic smoothing splines with a 50% frequency response at 67% of the series length, andnormalized local standard chronology (i.e., TRW_std) was obtained as bi-weighted average.A total of seven old trees with tree-ring series lengths of 234–495 years (extending from1524–1785) were selected for the measurement of parameters related to wood anatomicalstructure (Table 1). The actual cambial age of these trees considerably exceeds the givenvalues, as most of the old pine trees have a rotten trunk with hollow inside due to prevailingconditions in the study area, and thus, their cores did not reach the pith. Before sectioning,cores were cut into pieces of 3–3.5 cm length (diagonally to ensure overlap of tree ringsbetween pieces and cross-dating without gaps), softened by soaking in the warm water fora day, and then mounted in the specialized sample holder for the microtome. Cross-sectionsof ~14 µm thickness were obtained from the sampled cores using a rotary microtome (HM340E, Microm GmbH). Each cross-section was stained with safranin, dehydrated withalcohols of increasing concentration, embedded between the glass slide and cover glassin Canada balsam and dried, then photographed at ×400 magnification with a digitalcamera (ProgRes Gryphax Subra, Jenoptik GmbH) mounted on a biological microscope(BX43, Olympus).
These microphotographs were analyzed using the Lineyka program [51]. This programhelped in taking consecutive radial measurements of lumen diameter and thickness ofdouble cell walls in five radial rows of tracheids in each tree ring [52] and automaticallytransforming the measurements into the cell radial diameter D and the cell wall thicknessCWT. The averaged tracheidograms were calculated from individual intra-seasonal seriesof D and CWT measurements (tracheidograms) normalized by enlarging/shrinking thecell numbers per radial row (N) to the N averaged over all five measured rows in each
Forests 2022, 13, 247 5 of 22
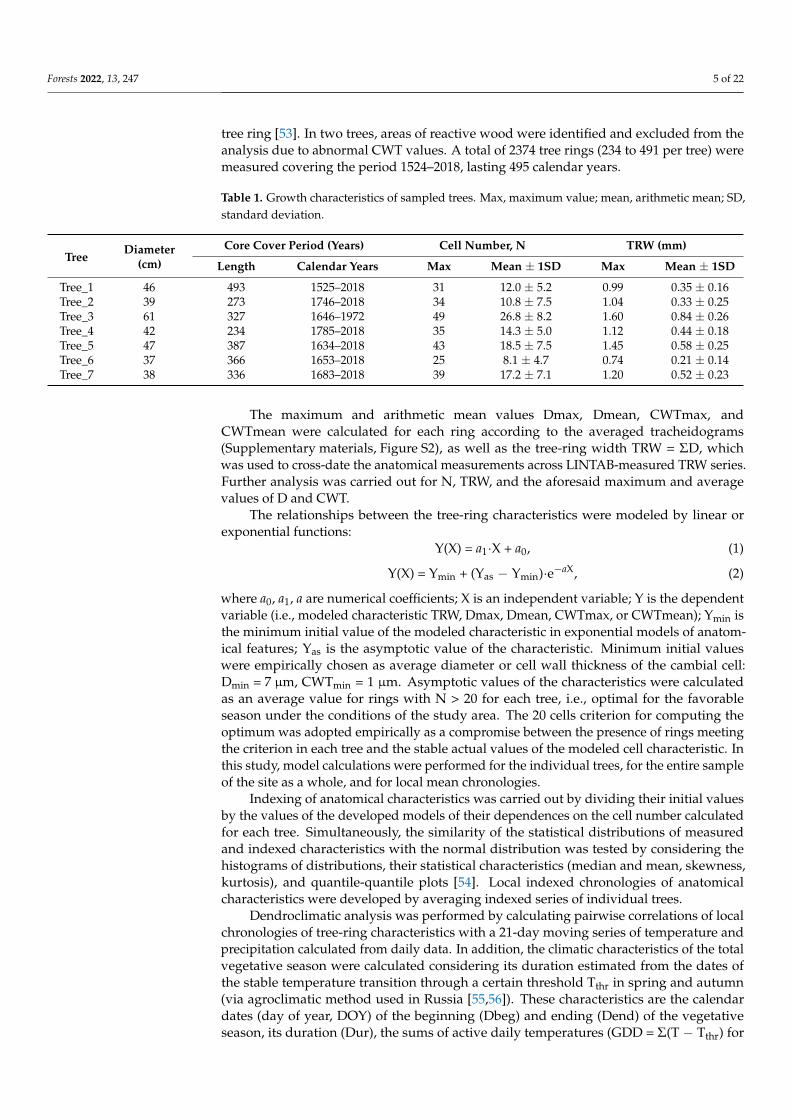
tree ring [53]. In two trees, areas of reactive wood were identified and excluded from theanalysis due to abnormal CWT values. A total of 2374 tree rings (234 to 491 per tree) weremeasured covering the period 1524–2018, lasting 495 calendar years.
Table 1. Growth characteristics of sampled trees. Max, maximum value; mean, arithmetic mean; SD,standard deviation.
TreeDiameter
(cm)
Core Cover Period (Years) Cell Number, N TRW (mm)
Length Calendar Years Max Mean ± 1SD Max Mean ± 1SD
Tree_1 46 493 1525–2018 31 12.0 ± 5.2 0.99 0.35 ± 0.16Tree_2 39 273 1746–2018 34 10.8 ± 7.5 1.04 0.33 ± 0.25Tree_3 61 327 1646–1972 49 26.8 ± 8.2 1.60 0.84 ± 0.26Tree_4 42 234 1785–2018 35 14.3 ± 5.0 1.12 0.44 ± 0.18Tree_5 47 387 1634–2018 43 18.5 ± 7.5 1.45 0.58 ± 0.25Tree_6 37 366 1653–2018 25 8.1 ± 4.7 0.74 0.21 ± 0.14Tree_7 38 336 1683–2018 39 17.2 ± 7.1 1.20 0.52 ± 0.23
The maximum and arithmetic mean values Dmax, Dmean, CWTmax, andCWTmean were calculated for each ring according to the averaged tracheidograms(Supplementary materials, Figure S2), as well as the tree-ring width TRW = ΣD, whichwas used to cross-date the anatomical measurements across LINTAB-measured TRW series.Further analysis was carried out for N, TRW, and the aforesaid maximum and averagevalues of D and CWT.
The relationships between the tree-ring characteristics were modeled by linear orexponential functions:
Y(X) = a1·X + a0, (1)
Y(X) = Ymin + (Yas − Ymin)·e−aX, (2)
where a0, a1, a are numerical coefficients; X is an independent variable; Y is the dependentvariable (i.e., modeled characteristic TRW, Dmax, Dmean, CWTmax, or CWTmean); Ymin isthe minimum initial value of the modeled characteristic in exponential models of anatom-ical features; Yas is the asymptotic value of the characteristic. Minimum initial valueswere empirically chosen as average diameter or cell wall thickness of the cambial cell:Dmin = 7 µm, CWTmin = 1 µm. Asymptotic values of the characteristics were calculatedas an average value for rings with N > 20 for each tree, i.e., optimal for the favorableseason under the conditions of the study area. The 20 cells criterion for computing theoptimum was adopted empirically as a compromise between the presence of rings meetingthe criterion in each tree and the stable actual values of the modeled cell characteristic. Inthis study, model calculations were performed for the individual trees, for the entire sampleof the site as a whole, and for local mean chronologies.
Indexing of anatomical characteristics was carried out by dividing their initial valuesby the values of the developed models of their dependences on the cell number calculatedfor each tree. Simultaneously, the similarity of the statistical distributions of measuredand indexed characteristics with the normal distribution was tested by considering thehistograms of distributions, their statistical characteristics (median and mean, skewness,kurtosis), and quantile-quantile plots [54]. Local indexed chronologies of anatomicalcharacteristics were developed by averaging indexed series of individual trees.
Dendroclimatic analysis was performed by calculating pairwise correlations of localchronologies of tree-ring characteristics with a 21-day moving series of temperature andprecipitation calculated from daily data. In addition, the climatic characteristics of the totalvegetative season were calculated considering its duration estimated from the dates ofthe stable temperature transition through a certain threshold Tthr in spring and autumn(via agroclimatic method used in Russia [55,56]). These characteristics are the calendardates (day of year, DOY) of the beginning (Dbeg) and ending (Dend) of the vegetativeseason, its duration (Dur), the sums of active daily temperatures (GDD = Σ(T − Tthr) for

Forests 2022, 13, 247 6 of 22
days of T > Tthr) and of precipitation (Pveg) during the vegetative season. The criticalthreshold value Tthr for growth and wood structure of Siberian stone pine was determinedby examining a range of values from +7 to +11.5 ◦C with a step of 0.5 ◦C and by select-ing the value at which the characteristics of the current and previous vegetative seasonhave the strongest pairwise correlations with tree-ring chronologies. We also calculatedprecipitation sum for the period T < 0 ◦C (winter before the current vegetative season), andpair correlations of this series with tree-ring chronologies were used to indirectly assess theeffect of snow cover depth on the formation of pine tree rings. This study used a regionalestimate of temperature averaged over a large territory with a wide elevational range, andtherefore, the local temperature near mountaintops is lower than the average for the region.This means that the Tthr estimation based on the ERA-20C series is higher than the actualthreshold temperatures at the sampling site.
The pointer years in tree-ring chronologies were determined by choosing the 5%highest and 5% lowest values of each chronology [57] for the cover period of climatic series1900–2010. The intra-seasonal dynamics of temperature in these years were compared withthe long-term average. Pointer years’ history was also compared with that of extreme yearsdefined for climatic characteristics of the vegetative season as their departure from themean value by more than 1.5 standard deviations [57].
The low-frequency component (decadal and longer variation) of the climatic seriesand tree-ring chronologies was estimated with simple smoothing using an 11-year movingaverage. The tree-ring-based reconstruction models of the smoothed vegetative characteris-tics were obtained using the best-fit (determined by comparison of explained variance, i.e.,adjusted coefficient of determination R2
adj) two-factor linear regressions [54].
3. Results3.1. Relationships between Tree-Ring Traits
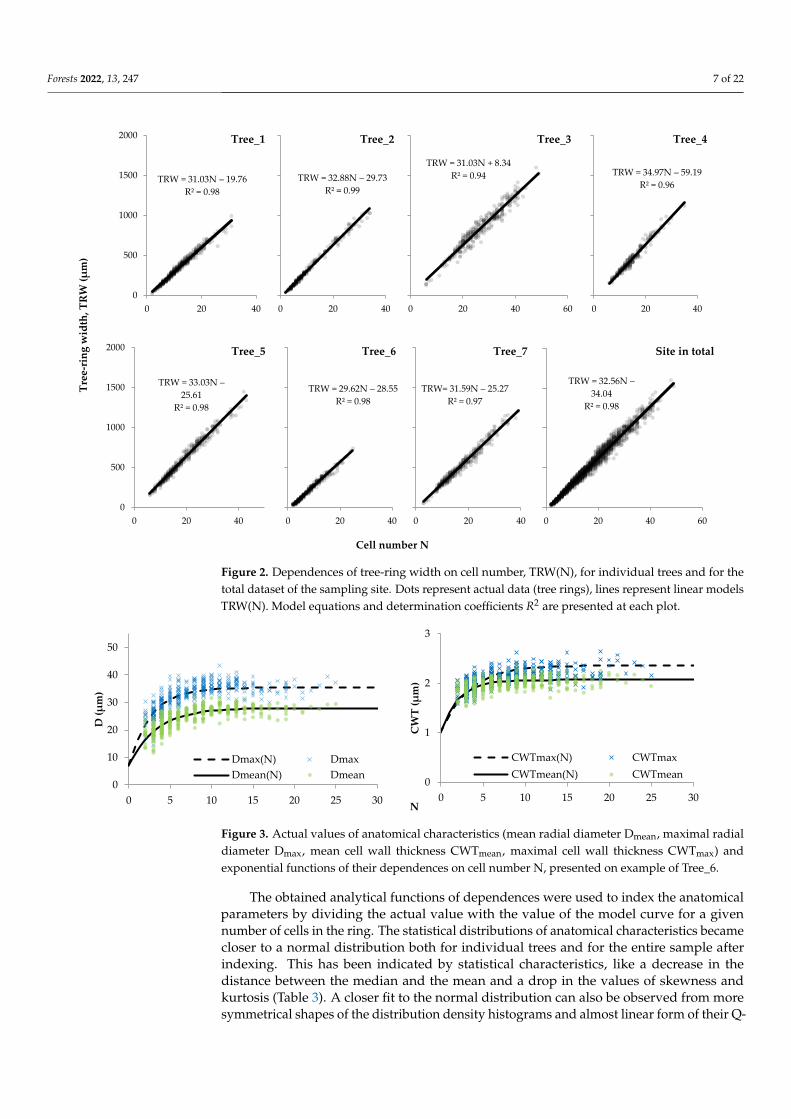
Tree-ring width was naturally related to their number as it is the sum of the radialdiameters of all cells along the radial row. This relationship is very close to linear forboth individual trees and the sampling site scale (Figure 2). The linear regression modelsTRW(N) obtained at the individual tree scale exhibited the coefficient of independentvariable N in the range of 29.6–35.0 µm. The constant term for obtained models variedfrom –60 to +8 µm, but with a difference from zero insignificant at the level of p < 0.05.The coefficient of determination was very high, 0.94–0.99 for all obtained models. Thehabitat-scale model has also displayed the agreement with aforesaid ranges. No statisticallysignificant relationship has been found between differences in individual tree models andtree characteristics associated with age, mean or maximum TRW (Table 1).
The morphometric characteristics of tracheids have a non-linear dependence on cellproduction (Figure 3). For narrow rings, the cell size and cell wall thickness changedsynchronously with the cell number in the ring, whereas the anatomical structure of widerings (more than 20–25 cells) did not depend on N. This allowed considering curves withsaturation for a mathematical description of D(N) and CWT(N) dependences, particularlya negative exponential function. The asymptotic (optimal) values to which the maximumand mean values of D and CWT inclined, and the numerical coefficient a regulating thecurvature of the transition from a positive connection to stable values were estimatedseparately for each tree and for the total site sample (Table 2). The optimal values ofthe morphometric parameters varied between 28–33 and 35–43 µm for the average andmaximum radial cell size, and 2.0–3.0 and 2.2–3.6 µm for the average and maximum cellwall thickness, respectively. Models for the total dataset had numerical terms within thesame ranges. Numerical coefficients a were more variable for CWT (0.09–0.49) than D(0.19–0.38). Models were closer-fitted and more uniform for Dmax (R2 = 0.14–0.65 forindividual trees and 0.76 for total site sample) and Dmean (0.21–0.69 and 0.79), than forCWTmax (0.04–0.61 and 0.37) and CWTmean (0.03–0.49 and 0.26).
Forests 2022, 13, 247 7 of 22Forests 2021, 12, x FOR PEER REVIEW 7 of 23
Tre
e-ri
ng
wid
th, T
RW
(μ
m)
Cell number N
Figure 2. Dependences of tree-ring width on cell number, TRW(N), for individual trees and for the
total dataset of the sampling site. Dots represent actual data (tree rings), lines represent linear
models TRW(N). Model equations and determination coefficients R2 are presented at each plot.
The morphometric characteristics of tracheids have a non-linear dependence on cell
production (Figure 3). For narrow rings, the cell size and cell wall thickness changed
synchronously with the cell number in the ring, whereas the anatomical structure of wide
rings (more than 20–25 cells) did not depend on N. This allowed considering curves with
saturation for a mathematical description of D(N) and CWT(N) dependences, particu-
larly a negative exponential function. The asymptotic (optimal) values to which the
maximum and mean values of D and CWT inclined, and the numerical coefficient a reg-
ulating the curvature of the transition from a positive connection to stable values were
estimated separately for each tree and for the total site sample (Table 2). The optimal
values of the morphometric parameters varied between 28–33 and 35–43 μm for the av-
erage and maximum radial cell size, and 2.0–3.0 and 2.2–3.6 μm for the average and
maximum cell wall thickness, respectively. Models for the total dataset had numerical
terms within the same ranges. Numerical coefficients a were more variable for CWT
(0.09–0.49) than D (0.19–0.38). Models were closer-fitted and more uniform for Dmax (R2
= 0.14–0.65 for individual trees and 0.76 for total site sample) and Dmean (0.21–0.69 and
0.79), than for CWTmax (0.04–0.61 and 0.37) and CWTmean (0.03–0.49 and 0.26).
TRW = 31.03N – 19.76
R² = 0.98
0
500
1000
1500
2000
0 20 40
Tree_1
TRW = 32.88N – 29.73
R² = 0.99
0 20 40
Tree_2
TRW = 31.03N + 8.34
R² = 0.94
0 20 40 60
Tree_3
TRW = 34.97N – 59.19
R² = 0.96
0 20 40
Tree_4
TRW = 33.03N –
25.61
R² = 0.98
0
500
1000
1500
2000
0 20 40
Tree_5
TRW = 29.62N – 28.55
R² = 0.98
0 20 40
Tree_6
TRW= 31.59N – 25.27
R² = 0.97
0 20 40
Tree_7
TRW = 32.56N –
34.04
R² = 0.98
0 20 40 60
Site in total
Figure 2. Dependences of tree-ring width on cell number, TRW(N), for individual trees and for thetotal dataset of the sampling site. Dots represent actual data (tree rings), lines represent linear modelsTRW(N). Model equations and determination coefficients R2 are presented at each plot.
Forests 2021, 12, x FOR PEER REVIEW 8 of 23
Figure 3. Actual values of anatomical characteristics (mean radial diameter Dmean, maximal radial
diameter Dmax, mean cell wall thickness CWTmean, maximal cell wall thickness CWTmax) and expo-
nential functions of their dependences on cell number N, presented on example of Tree_6.
Table 2. Numerical terms of exponential functions D(N) = Dmin + (Das − Dmin)·e−aN, CWT(N) = CWTmin
+ (CWTas − CWTmin)·e−aN fitted for relationships of mean and maximal tracheid dimensions with cell
number.
Tree
Dmax Dmean CWTmax CWTmean
Das
(μm) a
Das
(μm) a
CWTas
(μm) a
CWTas
(μm) a
Tree_1 39.3 0.34 29.8 0.34 2.79 0.13 2.48 0.14
Tree_2 41.8 0.34 31.7 0.29 3.55 0.09 2.92 0.11
Tree_3 40.7 0.23 31.9 0.21 2.83 0.09 2.41 0.09
Tree_4 42.5 0.20 33.0 0.19 2.24 0.33 2.00 0.44
Tree_5 41.0 0.24 32.2 0.24 2.84 0.20 2.50 0.24
Tree_6 35.4 0.38 28.0 0.30 2.36 0.30 2.07 0.49
Tree_7 39.6 0.28 30.4 0.29 2.76 0.15 2.41 0.16
Total sample 40.0 0.30 31.0 0.26 2.77 0.14 2.40 0.18
The obtained analytical functions of dependences were used to index the anatomical
parameters by dividing the actual value with the value of the model curve for a given
number of cells in the ring. The statistical distributions of anatomical characteristics be-
came closer to a normal distribution both for individual trees and for the entire sample
after indexing. This has been indicated by statistical characteristics, like a decrease in the
distance between the median and the mean and a drop in the values of skewness and
kurtosis (Table 3). A closer fit to the normal distribution can also be observed from more
symmetrical shapes of the distribution density histograms and almost linear form of their
Q-Q plots except for a small number of outliers (Supplementary materials, Figures S3 and
S4).
Table 3. Statistics of anatomical characteristics data before and after indexation: ranges from
minimal to maximal values of each statistic for individual trees (indiv.), statistics of averaged site
chronology (chron.), and statistics for total site sample of 2374 tree rings (total). Min, minimal val-
ue; Max, maximal value; SD, standard deviation.
Statistics
Dmax Dmean CWTmax CWTmean
Indiv. Chron
. Total Indiv.
Chron
. Total Indiv.
Chron
. Total Indiv.
Chron
. Total
Measurements
Min (μm) 11.3−29.7 27.4 11.3 10.8−24.0 21.5 10.8 1.51−1.90 1.90 1.51 0.49−1.76 1.76 1.45
Max (μm) 43.4−52.0 44.6 52.0 31.8−37.9 33.6 37.9 2.64−4.45 3.28 4.45 1.24−3.65 2.92 3.65
0
10
20
30
40
50
0 5 10 15 20 25 30
D (
μm
)
Dmax(N) Dmax
Dmean(N) Dmean0
1
2
3
0 5 10 15 20 25 30
CW
T (
μm
)
N
CWTmax(N) CWTmax
CWTmean(N) CWTmean
Figure 3. Actual values of anatomical characteristics (mean radial diameter Dmean, maximal radialdiameter Dmax, mean cell wall thickness CWTmean, maximal cell wall thickness CWTmax) andexponential functions of their dependences on cell number N, presented on example of Tree_6.
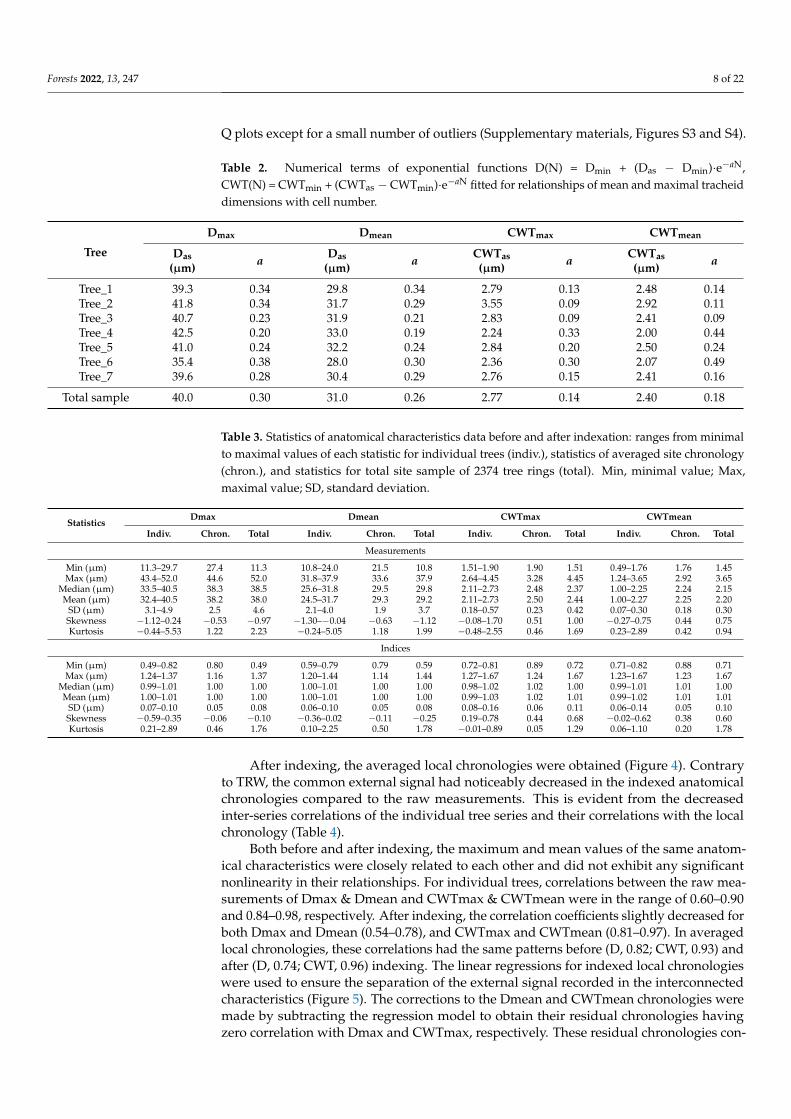
The obtained analytical functions of dependences were used to index the anatomicalparameters by dividing the actual value with the value of the model curve for a givennumber of cells in the ring. The statistical distributions of anatomical characteristics becamecloser to a normal distribution both for individual trees and for the entire sample afterindexing. This has been indicated by statistical characteristics, like a decrease in thedistance between the median and the mean and a drop in the values of skewness andkurtosis (Table 3). A closer fit to the normal distribution can also be observed from moresymmetrical shapes of the distribution density histograms and almost linear form of their Q-
Forests 2022, 13, 247 8 of 22
Q plots except for a small number of outliers (Supplementary materials, Figures S3 and S4).
Table 2. Numerical terms of exponential functions D(N) = Dmin + (Das − Dmin)·e−aN,CWT(N) = CWTmin + (CWTas − CWTmin)·e−aN fitted for relationships of mean and maximal tracheiddimensions with cell number.
Tree
Dmax Dmean CWTmax CWTmean
Das(µm) a Das
(µm) a CWTas(µm) a CWTas
(µm) a
Tree_1 39.3 0.34 29.8 0.34 2.79 0.13 2.48 0.14Tree_2 41.8 0.34 31.7 0.29 3.55 0.09 2.92 0.11Tree_3 40.7 0.23 31.9 0.21 2.83 0.09 2.41 0.09Tree_4 42.5 0.20 33.0 0.19 2.24 0.33 2.00 0.44Tree_5 41.0 0.24 32.2 0.24 2.84 0.20 2.50 0.24Tree_6 35.4 0.38 28.0 0.30 2.36 0.30 2.07 0.49Tree_7 39.6 0.28 30.4 0.29 2.76 0.15 2.41 0.16
Total sample 40.0 0.30 31.0 0.26 2.77 0.14 2.40 0.18
Table 3. Statistics of anatomical characteristics data before and after indexation: ranges from minimalto maximal values of each statistic for individual trees (indiv.), statistics of averaged site chronology(chron.), and statistics for total site sample of 2374 tree rings (total). Min, minimal value; Max,maximal value; SD, standard deviation.
StatisticsDmax Dmean CWTmax CWTmean
Indiv. Chron. Total Indiv. Chron. Total Indiv. Chron. Total Indiv. Chron. Total
Measurements
Min (µm) 11.3–29.7 27.4 11.3 10.8–24.0 21.5 10.8 1.51–1.90 1.90 1.51 0.49–1.76 1.76 1.45Max (µm) 43.4–52.0 44.6 52.0 31.8–37.9 33.6 37.9 2.64–4.45 3.28 4.45 1.24–3.65 2.92 3.65
Median (µm) 33.5–40.5 38.3 38.5 25.6–31.8 29.5 29.8 2.11–2.73 2.48 2.37 1.00–2.25 2.24 2.15Mean (µm) 32.4–40.5 38.2 38.0 24.5–31.7 29.3 29.2 2.11–2.73 2.50 2.44 1.00–2.27 2.25 2.20
SD (µm) 3.1–4.9 2.5 4.6 2.1–4.0 1.9 3.7 0.18–0.57 0.23 0.42 0.07–0.30 0.18 0.30Skewness −1.12–0.24 −0.53 −0.97 −1.30–−0.04 −0.63 −1.12 −0.08–1.70 0.51 1.00 −0.27–0.75 0.44 0.75Kurtosis −0.44–5.53 1.22 2.23 −0.24–5.05 1.18 1.99 −0.48–2.55 0.46 1.69 0.23–2.89 0.42 0.94
Indices
Min (µm) 0.49–0.82 0.80 0.49 0.59–0.79 0.79 0.59 0.72–0.81 0.89 0.72 0.71–0.82 0.88 0.71Max (µm) 1.24–1.37 1.16 1.37 1.20–1.44 1.14 1.44 1.27–1.67 1.24 1.67 1.23–1.67 1.23 1.67
Median (µm) 0.99–1.01 1.00 1.00 1.00–1.01 1.00 1.00 0.98–1.02 1.02 1.00 0.99–1.01 1.01 1.00Mean (µm) 1.00–1.01 1.00 1.00 1.00–1.01 1.00 1.00 0.99–1.03 1.02 1.01 0.99–1.02 1.01 1.01
SD (µm) 0.07–0.10 0.05 0.08 0.06–0.10 0.05 0.08 0.08–0.16 0.06 0.11 0.06–0.14 0.05 0.10Skewness −0.59–0.35 −0.06 −0.10 −0.36–0.02 −0.11 −0.25 0.19–0.78 0.44 0.68 −0.02–0.62 0.38 0.60Kurtosis 0.21–2.89 0.46 1.76 0.10–2.25 0.50 1.78 −0.01–0.89 0.05 1.29 0.06–1.10 0.20 1.78
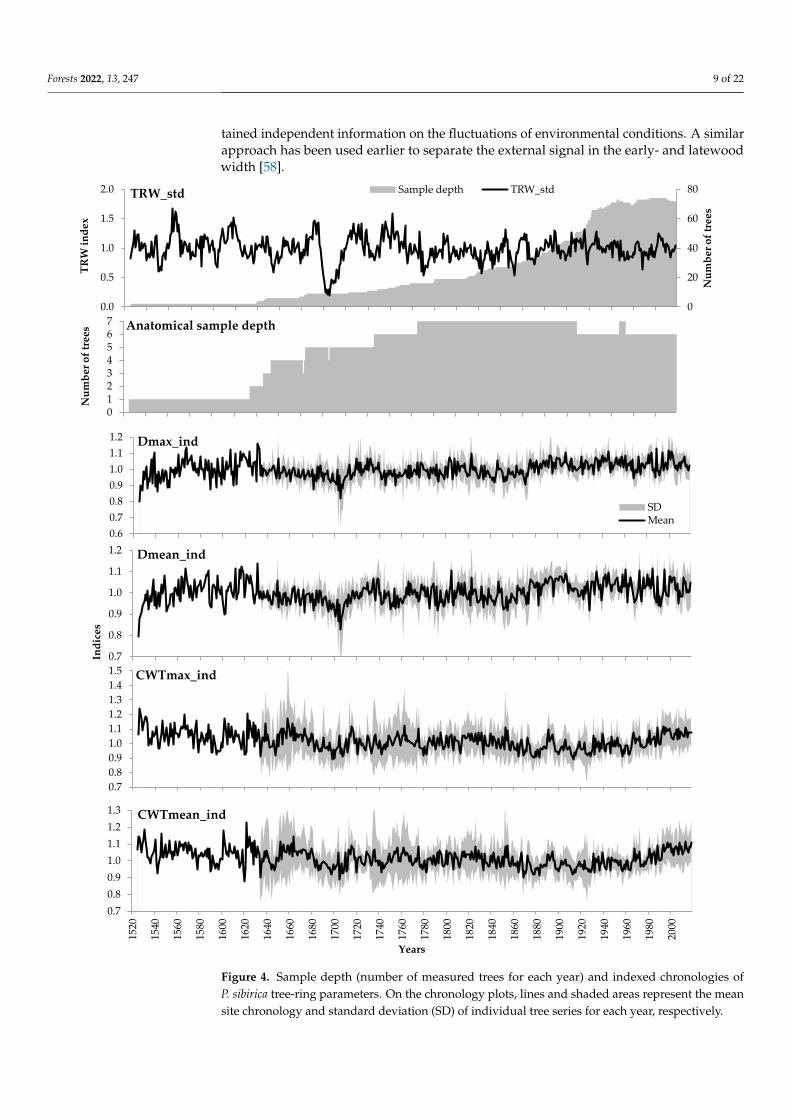
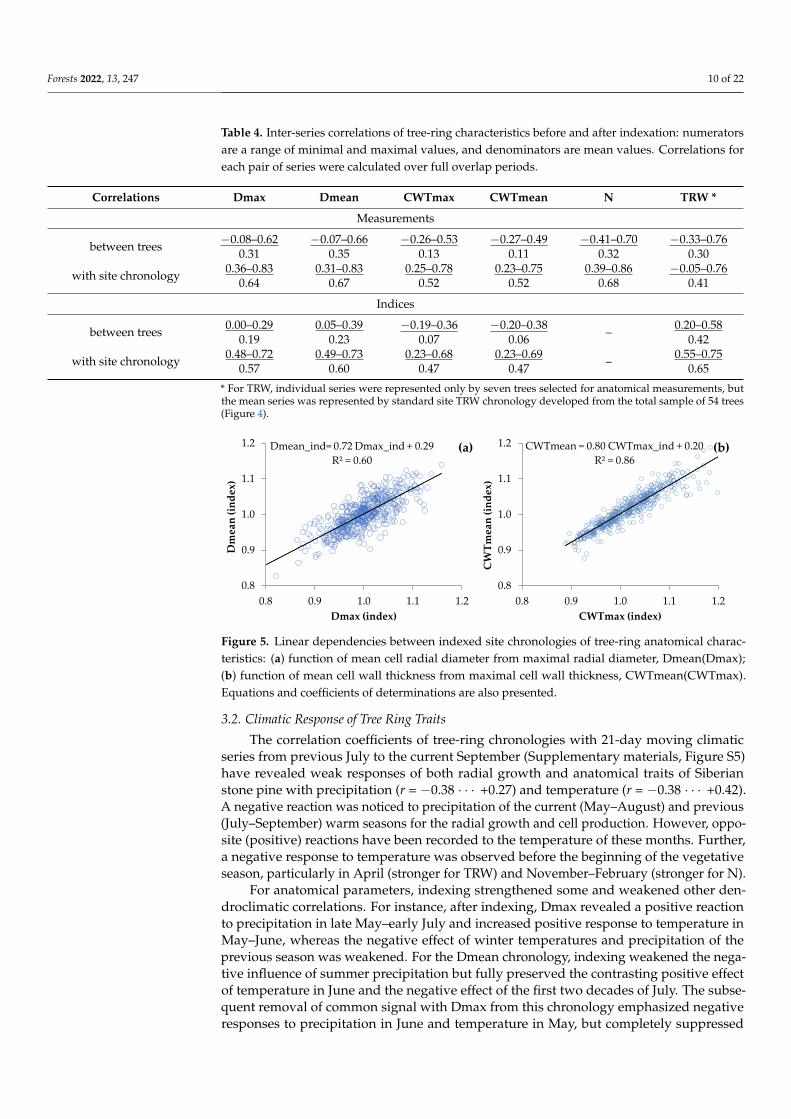
After indexing, the averaged local chronologies were obtained (Figure 4). Contraryto TRW, the common external signal had noticeably decreased in the indexed anatomicalchronologies compared to the raw measurements. This is evident from the decreasedinter-series correlations of the individual tree series and their correlations with the localchronology (Table 4).
Both before and after indexing, the maximum and mean values of the same anatom-ical characteristics were closely related to each other and did not exhibit any significantnonlinearity in their relationships. For individual trees, correlations between the raw mea-surements of Dmax & Dmean and CWTmax & CWTmean were in the range of 0.60–0.90and 0.84–0.98, respectively. After indexing, the correlation coefficients slightly decreased forboth Dmax and Dmean (0.54–0.78), and CWTmax and CWTmean (0.81–0.97). In averagedlocal chronologies, these correlations had the same patterns before (D, 0.82; CWT, 0.93) andafter (D, 0.74; CWT, 0.96) indexing. The linear regressions for indexed local chronologieswere used to ensure the separation of the external signal recorded in the interconnectedcharacteristics (Figure 5). The corrections to the Dmean and CWTmean chronologies weremade by subtracting the regression model to obtain their residual chronologies havingzero correlation with Dmax and CWTmax, respectively. These residual chronologies con-
Forests 2022, 13, 247 9 of 22
tained independent information on the fluctuations of environmental conditions. A similarapproach has been used earlier to separate the external signal in the early- and latewoodwidth [58].
Forests 2021, 12, x FOR PEER REVIEW 9 of 23
Median (μm) 33.5−40.5 38.3 38.5 25.6−31.8 29.5 29.8 2.11−2.73 2.48 2.37 1.00−2.25 2.24 2.15
Mean (μm) 32.4−40.5 38.2 38.0 24.5−31.7 29.3 29.2 2.11−2.73 2.50 2.44 1.00−2.27 2.25 2.20
SD (μm) 3.1−4.9 2.5 4.6 2.1−4.0 1.9 3.7 0.18−0.57 0.23 0.42 0.07−0.30 0.18 0.30
Skewness -1.12−0.24 -0.53 -0.97 -1.30−-0.04 -0.63 -1.12 -0.08−1.70 0.51 1.00 -0.27−0.75 0.44 0.75
Kurtosis -0.44−5.53 1.22 2.23 -0.24−5.05 1.18 1.99 -0.48−2.55 0.46 1.69 0.23−2.89 0.42 0.94
Indices
Min (μm) 0.49−0.82 0.80 0.49 0.59−0.79 0.79 0.59 0.72−0.81 0.89 0.72 0.71−0.82 0.88 0.71
Max (μm) 1.24−1.37 1.16 1.37 1.20−1.44 1.14 1.44 1.27−1.67 1.24 1.67 1.23−1.67 1.23 1.67
Median (μm) 0.99−1.01 1.00 1.00 1.00−1.01 1.00 1.00 0.98−1.02 1.02 1.00 0.99−1.01 1.01 1.00
Mean (μm) 1.00−1.01 1.00 1.00 1.00−1.01 1.00 1.00 0.99−1.03 1.02 1.01 0.99−1.02 1.01 1.01
SD (μm) 0.07−0.10 0.05 0.08 0.06−0.10 0.05 0.08 0.08−0.16 0.06 0.11 0.06−0.14 0.05 0.10
Skewness -0.59−0.35 -0.06 -0.10 -0.36−0.02 -0.11 -0.25 0.19−0.78 0.44 0.68 -0.02−0.62 0.38 0.60
Kurtosis 0.21−2.89 0.46 1.76 0.10−2.25 0.50 1.78 -0.01−0.89 0.05 1.29 0.06−1.10 0.20 1.78
After indexing, the averaged local chronologies were obtained (Figure 4). Contrary
to TRW, the common external signal had noticeably decreased in the indexed anatomical
chronologies compared to the raw measurements. This is evident from the decreased in-
ter-series correlations of the individual tree series and their correlations with the local
chronology (Table 4).
Table 4. Inter-series correlations of tree-ring characteristics before and after indexation: numerators
are a range of minimal and maximal values, and denominators are mean values. Correlations for
each pair of series were calculated over full overlap periods.
Correlations Dmax Dmean CWTmax CWTmean N TRW *
Measurements
between trees -0.08−0.62
0.31
-0.07−0.66
0.35
-0.26−0.53
0.13
-0.27−0.49
0.11
-0.41–0.70
0.32
-0.33–0.76
0.30
with site chronology 0.36−0.83
0.64
0.31−0.83
0.67
0.25−0.78
0.52
0.23−0.75
0.52
0.39–0.86
0.68
-0.05–0.76
0.41
Indices
between trees 0.00−0.29
0.19
0.05−0.39
0.23
-0.19−0.36
0.07
-0.20−0.38
0.06 –
0.20–0.58
0.42
with site chronology 0.48−0.72
0.57
0.49−0.73
0.60
0.23−0.68
0.47
0.23−0.69
0.47 –
0.55–0.75
0.65
* For TRW, individual series were represented only by seven trees selected for anatomical meas-
urements, but the mean series was represented by standard site TRW chronology developed from
the total sample of 54 trees (Figure 4).
0
20
40
60
80
0.0
0.5
1.0
1.5
2.0
Nu
mb
er o
f tr
ees
TR
W i
nd
ex
TRW_std Sample depth TRW_std
01234567
Nu
mb
er o
f tr
ees Anatomical sample depth
Forests 2021, 12, x FOR PEER REVIEW 10 of 23
Figure 4. Sample depth (number of measured trees for each year) and indexed chronologies of P.
sibirica tree-ring parameters. On the chronology plots, lines and shaded areas represent the mean
site chronology and standard deviation (SD) of individual tree series for each year, respectively.
Both before and after indexing, the maximum and mean values of the same ana-
tomical characteristics were closely related to each other and did not exhibit any signifi-
cant nonlinearity in their relationships. For individual trees, correlations between the raw
measurements of Dmax & Dmean and CWTmax & CWTmean were in the range of
0.60–0.90 and 0.84–0.98, respectively. After indexing, the correlation coefficients slightly
decreased for both Dmax and Dmean (0.54–0.78), and CWTmax and CWTmean
(0.81–0.97). In averaged local chronologies, these correlations had the same patterns be-
fore (D, 0.82; CWT, 0.93) and after (D, 0.74; CWT, 0.96) indexing. The linear regressions
for indexed local chronologies were used to ensure the separation of the external signal
recorded in the interconnected characteristics (Figure 5). The corrections to the Dmean
and CWTmean chronologies were made by subtracting the regression model to obtain
their residual chronologies having zero correlation with Dmax and CWTmax, respec-
tively. These residual chronologies contained independent information on the fluctua-
tions of environmental conditions. A similar approach has been used earlier to separate
the external signal in the early- and latewood width [58].
0.6
0.7
0.8
0.9
1.0
1.1
1.2 Dmax_ind
SDMean
0.7
0.8
0.9
1.0
1.1
1.2
Ind
ices
Dmean_ind
0.7
0.8
0.9
1.0
1.1
1.2
1.3
1.4
1.5 CWTmax_ind
0.7
0.8
0.9
1.0
1.1
1.2
1.3
1520
1540
1560
1580
1600
1620
1640
1660
1680
1700
1720
1740
1760
1780
1800
1820
1840
1860
1880
1900
1920
1940
1960
1980
2000
Years
CWTmean_ind
Figure 4. Sample depth (number of measured trees for each year) and indexed chronologies ofP. sibirica tree-ring parameters. On the chronology plots, lines and shaded areas represent the meansite chronology and standard deviation (SD) of individual tree series for each year, respectively.
Forests 2022, 13, 247 10 of 22
Table 4. Inter-series correlations of tree-ring characteristics before and after indexation: numeratorsare a range of minimal and maximal values, and denominators are mean values. Correlations foreach pair of series were calculated over full overlap periods.
Correlations Dmax Dmean CWTmax CWTmean N TRW *
Measurements
between trees −0.08–0.620.31
−0.07–0.660.35
−0.26–0.530.13
−0.27–0.490.11
−0.41–0.700.32
−0.33–0.760.30
with site chronology 0.36–0.830.64
0.31–0.830.67
0.25–0.780.52
0.23–0.750.52
0.39–0.860.68
−0.05–0.760.41
Indices
between trees 0.00–0.290.19
0.05–0.390.23
−0.19–0.360.07
−0.20–0.380.06 – 0.20–0.58
0.42
with site chronology 0.48–0.720.57
0.49–0.730.60
0.23–0.680.47
0.23–0.690.47 – 0.55–0.75
0.65
* For TRW, individual series were represented only by seven trees selected for anatomical measurements, butthe mean series was represented by standard site TRW chronology developed from the total sample of 54 trees(Figure 4).
Forests 2021, 12, x FOR PEER REVIEW 11 of 23
Figure 5. Linear dependencies between indexed site chronologies of tree-ring anatomical charac-
teristics: (a) function of mean cell radial diameter from maximal radial diameter, Dmean(Dmax);
(b) function of mean cell wall thickness from maximal cell wall thickness, CWTmean(CWTmax).
Equations and coefficients of determinations are also presented.
3.2. Climatic Response of Tree Ring Traits
The correlation coefficients of tree-ring chronologies with 21-day moving climatic
series from previous July to the current September (Supplementary materials, Figure S5)
have revealed weak responses of both radial growth and anatomical traits of Siberian
stone pine with precipitation (r = −0.38... +0.27) and temperature (r = −0.38... +0.42). A
negative reaction was noticed to precipitation of the current (May–August) and previous
(July–September) warm seasons for the radial growth and cell production. However,
opposite (positive) reactions have been recorded to the temperature of these months.
Further, a negative response to temperature was observed before the beginning of the
vegetative season, particularly in April (stronger for TRW) and November–February
(stronger for N).
For anatomical parameters, indexing strengthened some and weakened other den-
droclimatic correlations. For instance, after indexing, Dmax revealed a positive reaction
to precipitation in late May–early July and increased positive response to temperature in
May–June, whereas the negative effect of winter temperatures and precipitation of the
previous season was weakened. For the Dmean chronology, indexing weakened the
negative influence of summer precipitation but fully preserved the contrasting positive
effect of temperature in June and the negative effect of the first two decades of July. The
subsequent removal of common signal with Dmax from this chronology emphasized
negative responses to precipitation in June and temperature in May, but completely
suppressed the positive response to the temperature of the previous August–September.
In the case of CWTmax, indexing has led to the appearance of a positive response to
precipitation from mid-June to early August and a negative response to the temperature
of the previous September. The positive response to temperature persisted during the
first two decades of July but weakened from the end of July to August. The indexing
caused similar changes in climatic responses of the CWTmean, where the transformation
of series by removing the relationship with CWTmax resulted in significant positive re-
sponses to temperatures, which persisted from the end of the previous year August to the
first half of September, current year January–February, and May, but were suppressed
for other time intervals.
The climatic characteristics of the vegetative season were determined through the
dates of steady transition of regional temperature through a certain threshold value Tthr
in spring and autumn. They correlate well with some of the chronologies of tree-ring
traits (Supplementary materials, Table S1). This response differs depending on the con-
sidered trait and the method of its mathematical processing. Their intensity and signifi-
cance vary for the considered range of Tthr = 7...11.5 °C, in most cases reaching a maxi-
mum at a threshold value of ca. 9 °C (Table 5). Radial growth and cell number have
Dmean_ind= 0.72 Dmax_ind + 0.29
R² = 0.60
0.8
0.9
1.0
1.1
1.2
0.8 0.9 1.0 1.1 1.2
Dm
ean
(in
de
x)
Dmax (index)
(a) CWTmean = 0.80 CWTmax_ind + 0.20
R² = 0.86
0.8
0.9
1.0
1.1
1.2
0.8 0.9 1.0 1.1 1.2
CW
Tm
ean
(in
de
x)
CWTmax (index)
(b)
Figure 5. Linear dependencies between indexed site chronologies of tree-ring anatomical charac-teristics: (a) function of mean cell radial diameter from maximal radial diameter, Dmean(Dmax);(b) function of mean cell wall thickness from maximal cell wall thickness, CWTmean(CWTmax).Equations and coefficients of determinations are also presented.
3.2. Climatic Response of Tree Ring Traits
The correlation coefficients of tree-ring chronologies with 21-day moving climaticseries from previous July to the current September (Supplementary materials, Figure S5)have revealed weak responses of both radial growth and anatomical traits of Siberianstone pine with precipitation (r = −0.38 · · · +0.27) and temperature (r = −0.38 · · · +0.42).A negative reaction was noticed to precipitation of the current (May–August) and previous(July–September) warm seasons for the radial growth and cell production. However, oppo-site (positive) reactions have been recorded to the temperature of these months. Further,a negative response to temperature was observed before the beginning of the vegetativeseason, particularly in April (stronger for TRW) and November–February (stronger for N).
For anatomical parameters, indexing strengthened some and weakened other den-droclimatic correlations. For instance, after indexing, Dmax revealed a positive reactionto precipitation in late May–early July and increased positive response to temperature inMay–June, whereas the negative effect of winter temperatures and precipitation of theprevious season was weakened. For the Dmean chronology, indexing weakened the nega-tive influence of summer precipitation but fully preserved the contrasting positive effectof temperature in June and the negative effect of the first two decades of July. The subse-quent removal of common signal with Dmax from this chronology emphasized negativeresponses to precipitation in June and temperature in May, but completely suppressed
Forests 2022, 13, 247 11 of 22
the positive response to the temperature of the previous August–September. In the caseof CWTmax, indexing has led to the appearance of a positive response to precipitationfrom mid-June to early August and a negative response to the temperature of the previousSeptember. The positive response to temperature persisted during the first two decades ofJuly but weakened from the end of July to August. The indexing caused similar changesin climatic responses of the CWTmean, where the transformation of series by removingthe relationship with CWTmax resulted in significant positive responses to temperatures,which persisted from the end of the previous year August to the first half of September,current year January–February, and May, but were suppressed for other time intervals.
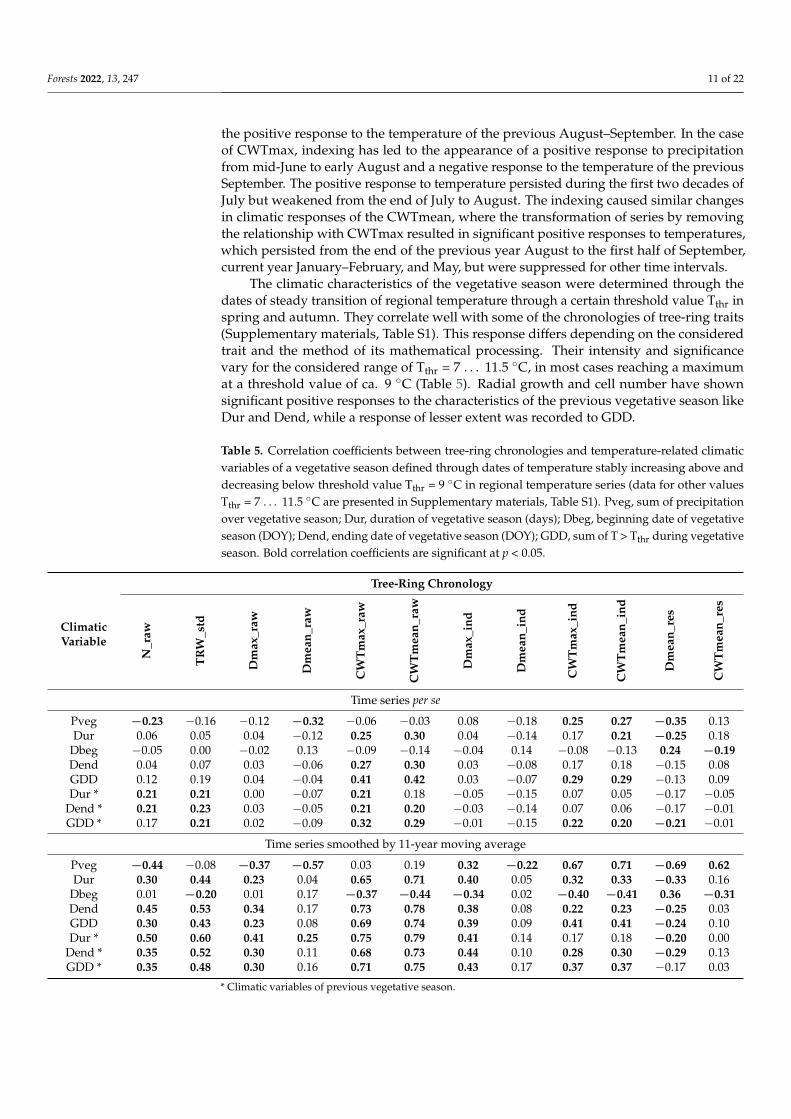
The climatic characteristics of the vegetative season were determined through thedates of steady transition of regional temperature through a certain threshold value Tthr inspring and autumn. They correlate well with some of the chronologies of tree-ring traits(Supplementary materials, Table S1). This response differs depending on the consideredtrait and the method of its mathematical processing. Their intensity and significancevary for the considered range of Tthr = 7 . . . 11.5 ◦C, in most cases reaching a maximumat a threshold value of ca. 9 ◦C (Table 5). Radial growth and cell number have shownsignificant positive responses to the characteristics of the previous vegetative season likeDur and Dend, while a response of lesser extent was recorded to GDD.
Table 5. Correlation coefficients between tree-ring chronologies and temperature-related climaticvariables of a vegetative season defined through dates of temperature stably increasing above anddecreasing below threshold value Tthr = 9 ◦C in regional temperature series (data for other valuesTthr = 7 . . . 11.5 ◦C are presented in Supplementary materials, Table S1). Pveg, sum of precipitationover vegetative season; Dur, duration of vegetative season (days); Dbeg, beginning date of vegetativeseason (DOY); Dend, ending date of vegetative season (DOY); GDD, sum of T > Tthr during vegetativeseason. Bold correlation coefficients are significant at p < 0.05.
ClimaticVariable
Tree-Ring Chronology
N_r
aw
TR
W_s
td
Dm
ax_r
aw
Dm
ean_
raw
CW
Tm
ax_r
aw
CW
Tm
ean_
raw
Dm
ax_i
nd
Dm
ean_
ind
CW
Tm
ax_i
nd
CW
Tm
ean_
ind
Dm
ean_
res
CW
Tm
ean_
res
Time series per se
Pveg −0.23 −0.16 −0.12 −0.32 −0.06 −0.03 0.08 −0.18 0.25 0.27 −0.35 0.13Dur 0.06 0.05 0.04 −0.12 0.25 0.30 0.04 −0.14 0.17 0.21 −0.25 0.18
Dbeg −0.05 0.00 −0.02 0.13 −0.09 −0.14 −0.04 0.14 −0.08 −0.13 0.24 −0.19Dend 0.04 0.07 0.03 −0.06 0.27 0.30 0.03 −0.08 0.17 0.18 −0.15 0.08GDD 0.12 0.19 0.04 −0.04 0.41 0.42 0.03 −0.07 0.29 0.29 −0.13 0.09Dur * 0.21 0.21 0.00 −0.07 0.21 0.18 −0.05 −0.15 0.07 0.05 −0.17 −0.05
Dend * 0.21 0.23 0.03 −0.05 0.21 0.20 −0.03 −0.14 0.07 0.06 −0.17 −0.01GDD * 0.17 0.21 0.02 −0.09 0.32 0.29 −0.01 −0.15 0.22 0.20 −0.21 −0.01
Time series smoothed by 11-year moving average
Pveg −0.44 −0.08 −0.37 −0.57 0.03 0.19 0.32 −0.22 0.67 0.71 −0.69 0.62Dur 0.30 0.44 0.23 0.04 0.65 0.71 0.40 0.05 0.32 0.33 −0.33 0.16
Dbeg 0.01 −0.20 0.01 0.17 −0.37 −0.44 −0.34 0.02 −0.40 −0.41 0.36 −0.31Dend 0.45 0.53 0.34 0.17 0.73 0.78 0.38 0.08 0.22 0.23 −0.25 0.03GDD 0.30 0.43 0.23 0.08 0.69 0.74 0.39 0.09 0.41 0.41 −0.24 0.10Dur * 0.50 0.60 0.41 0.25 0.75 0.79 0.41 0.14 0.17 0.18 −0.20 0.00
Dend * 0.35 0.52 0.30 0.11 0.68 0.73 0.44 0.10 0.28 0.30 −0.29 0.13GDD * 0.35 0.48 0.30 0.16 0.71 0.75 0.43 0.17 0.37 0.37 −0.17 0.03
* Climatic variables of previous vegetative season.
Forests 2022, 13, 247 12 of 22
The initial raw chronologies of cell diameter did not show any response to indi-cators of the vegetative season, but a positive response of Dmean was recorded withDbeg of the current vegetative season after indexing (ind), albeit it is weak and unstable(Supplementary materials, Table S1). The residual chronology (res) of mean cell diametershowed more consistent positive dependence on the current Dbeg and a negative relianceon Dur of both current and previous seasons. The raw chronologies of cell wall thicknesswere positively related to Dur, Dend, and particularly the GDD of both current and previousseasons. After indexing, a significant positive response persisted only for GDD and Dur ofthe current season. The Dbeg had a weak negative correlation to the measured and indexedCWT chronologies, significant only for high values of regional threshold temperaturesTthr. The residual chronology of CWTmean has revealed a weak opposite response to thecharacteristics of the current season compared with the residual chronology of Dmean. Theprecipitation of the vegetative season negatively influenced the cell production, raw andresidual chronologies of Dmean, and positively affected indexed chronologies of CWTmaxand CWTmean (Table 5). We also assessed the impact of the amount of precipitation overwinter preceding tree-ring formation (period of regional temperatures T < 0 ◦C), but thecorrelations of this factor with all tree-ring chronologies were insignificant (from −0.15to 0.19).
Interestingly, in the study area, some of the considered climatic characteristics of thevegetative season were significantly correlated with each other. For instance, the seriesof duration, Dend, and GDD had close positive correlations (r = 0.76–0.79 at Tthr = 9 ◦C)with each other. The beginning date of the vegetative season was negatively correlatedwith Dur (r = −0.68), GDD (r = −0.33), and Dend (r = −0.24). The amount of precipitationhad moderate positive correlation with Dur (r = 0.41) and Dend (r = 0.24) and negativeassociation with Dbeg (r = −0.41), but it did not show a significant correlation with GDD(r = 0.09).
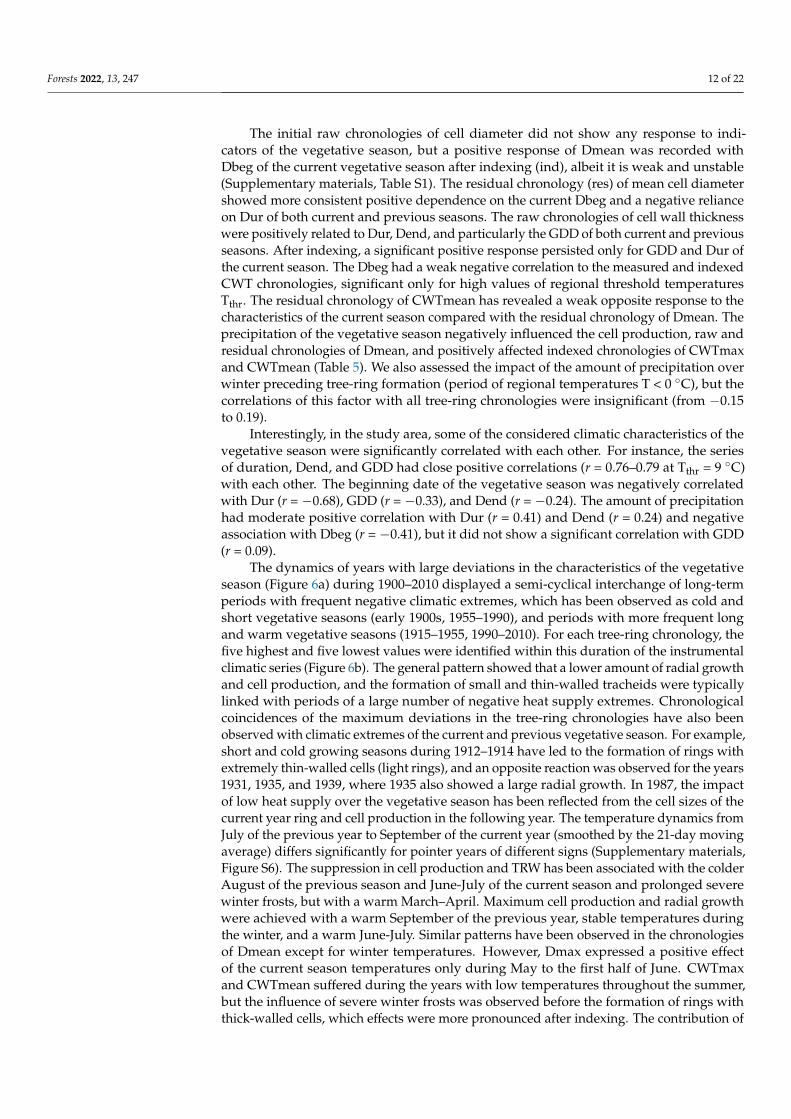
The dynamics of years with large deviations in the characteristics of the vegetativeseason (Figure 6a) during 1900–2010 displayed a semi-cyclical interchange of long-termperiods with frequent negative climatic extremes, which has been observed as cold andshort vegetative seasons (early 1900s, 1955–1990), and periods with more frequent longand warm vegetative seasons (1915–1955, 1990–2010). For each tree-ring chronology, thefive highest and five lowest values were identified within this duration of the instrumentalclimatic series (Figure 6b). The general pattern showed that a lower amount of radial growthand cell production, and the formation of small and thin-walled tracheids were typicallylinked with periods of a large number of negative heat supply extremes. Chronologicalcoincidences of the maximum deviations in the tree-ring chronologies have also beenobserved with climatic extremes of the current and previous vegetative season. For example,short and cold growing seasons during 1912–1914 have led to the formation of rings withextremely thin-walled cells (light rings), and an opposite reaction was observed for the years1931, 1935, and 1939, where 1935 also showed a large radial growth. In 1987, the impactof low heat supply over the vegetative season has been reflected from the cell sizes of thecurrent year ring and cell production in the following year. The temperature dynamics fromJuly of the previous year to September of the current year (smoothed by the 21-day movingaverage) differs significantly for pointer years of different signs (Supplementary materials,Figure S6). The suppression in cell production and TRW has been associated with the colderAugust of the previous season and June-July of the current season and prolonged severewinter frosts, but with a warm March–April. Maximum cell production and radial growthwere achieved with a warm September of the previous year, stable temperatures duringthe winter, and a warm June-July. Similar patterns have been observed in the chronologiesof Dmean except for winter temperatures. However, Dmax expressed a positive effectof the current season temperatures only during May to the first half of June. CWTmaxand CWTmean suffered during the years with low temperatures throughout the summer,but the influence of severe winter frosts was observed before the formation of rings withthick-walled cells, which effects were more pronounced after indexing. The contribution of
Forests 2022, 13, 247 13 of 22
temperatures after the summer solstice became noticeable in the extremes of the residualDmean chronology. Whereas the formation of thick walls after the warm end-of-winterperiod and spring were demonstrated in CWTmean_res chronology.
Forests 2021, 12, x FOR PEER REVIEW 14 of 23
Figure 6. Extreme and pointer years: (a) departures up (○) and down (●) beyond the range of
(mean ± 1.5SD) for climatic characteristics of a vegetative season defined through the threshold
value Tthr = 9 °C in regional temperature series: sum of precipitation (Pveg), duration of season in
current (Dur) and previous year (Dur*), its beginning date (Dbeg), its ending date in current (Dend)
and previous year (Dend*), sum of temperatures T > Tthr in current (GDD) and previous year
(GDD*); (b) 5% of the highest (○) and the lowest (●) values for each tree-ring chronology over
1900–2010 (period of climatic series).
Smoothing the time series by the 11-year moving average (filtering low-frequency
variations) has helped in obtaining higher dendroclimatic correlations reaching 0.5–0.8
for some tree-ring chronologies and climatic variables of the vegetative season (Table 5).
As a result of linear regression analysis, two-factor reconstruction models have been se-
lected based on anatomical chronologies (both initial and processed) which explain 32%
of the variation in long-term fluctuations for Dbeg and above 61% of the variation in
long-term fluctuations for the other considered climatic variables (Table 6). Comparison
of the plots of reconstruction models and instrumental series (Figure 7) demonstrated
that the obtained models capture the frequency as well as the curve shapes of long-term
climatic fluctuations (e.g., more abrupt or more gradual changes). The patterns of recon-
structed long-term fluctuations have also been confirmed by the comparison between the
GDD reconstruction model and the reconstructed June-July temperature TJJ obtained for
western Mongolia (49.95° N 91.28° E, ~220 km southeast of the study area) based on the
blue intensity chronology of Siberian larch, which was developed by Davi et al. [59]. A
weak positive correlation (r = 0.20, p < 0.05) has been found between these two recon-
structed smoothed series of the summer climate characteristics. However, these recon-
structions were carried out for different, albeit related variables (e.g., the actual GDD se-
ries has a correlation r = 0.38 with the TJJ model per se and r = 0.40 when comparing
smoothed series). It has been worth noting that the general patterns of long-term fluctu-
ation of the reconstructed GDD and Mongolian TJJ were still observed during 1524–1648
when the sample depth for wood anatomical chronologies of Siberian stone pine was less
than three trees.
Table 6. Wood-anatomy based linear regression reconstruction models for temperature-related
climatic variables of a vegetative season defined through dates of temperature crossing threshold
Tthr = 9 °C in regional temperature series. Pveg, sum of precipitation over vegetative season; Dur,
1900 1910 1920 1930 1940 1950 1960 1970 1980 1990 2000 2010
(a) PvegDurDbegDendGDDDur*Dend*
1900 1910 1920 1930 1940 1950 1960 1970 1980 1990 2000 2010
(b)N_rawTRW_stdDmax_rawDmean_rawDmax_indDmean_indDmean_resCWTmax_rawCWTmean_rawCWTmax_indCWTmean_ind
Figure 6. Extreme and pointer years: (a) departures up (#) and down (•) beyond the range of(mean ± 1.5 SD) for climatic characteristics of a vegetative season defined through the thresholdvalue Tthr = 9 ◦C in regional temperature series: sum of precipitation (Pveg), duration of season incurrent (Dur) and previous year (Dur*), its beginning date (Dbeg), its ending date in current (Dend)and previous year (Dend*), sum of temperatures T > Tthr in current (GDD) and previous year (GDD*);(b) 5% of the highest (#) and the lowest (•) values for each tree-ring chronology over 1900–2010(period of climatic series).
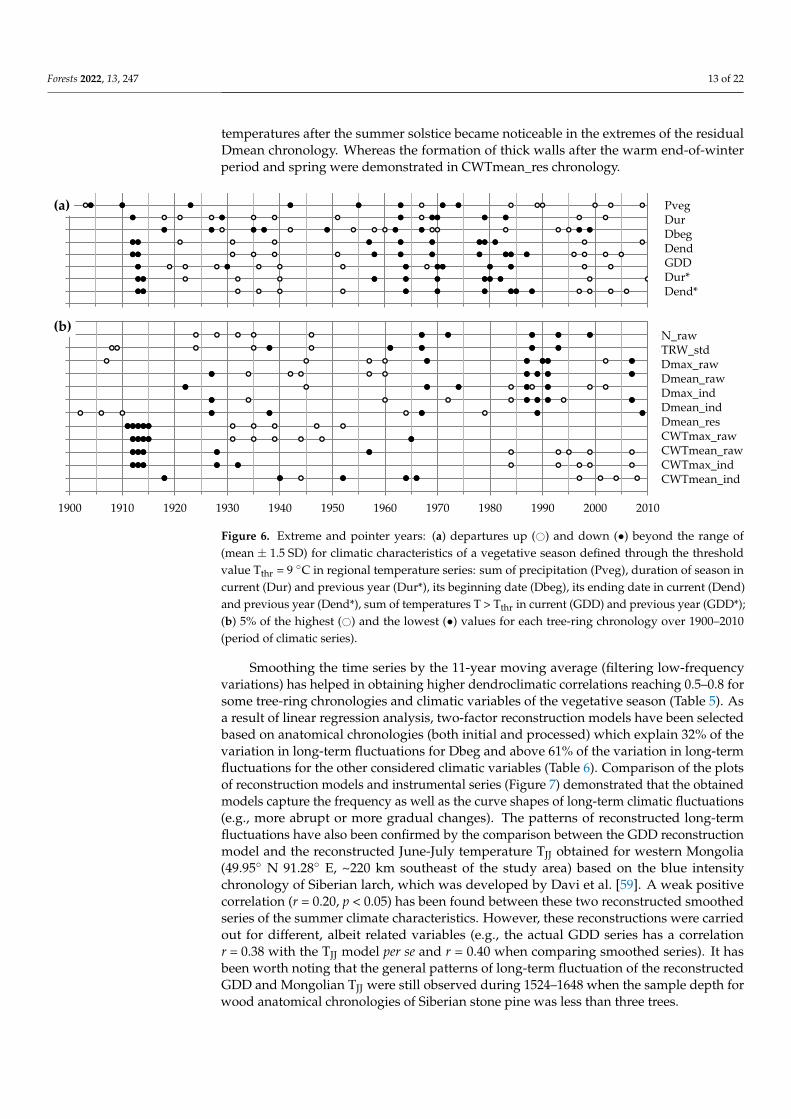
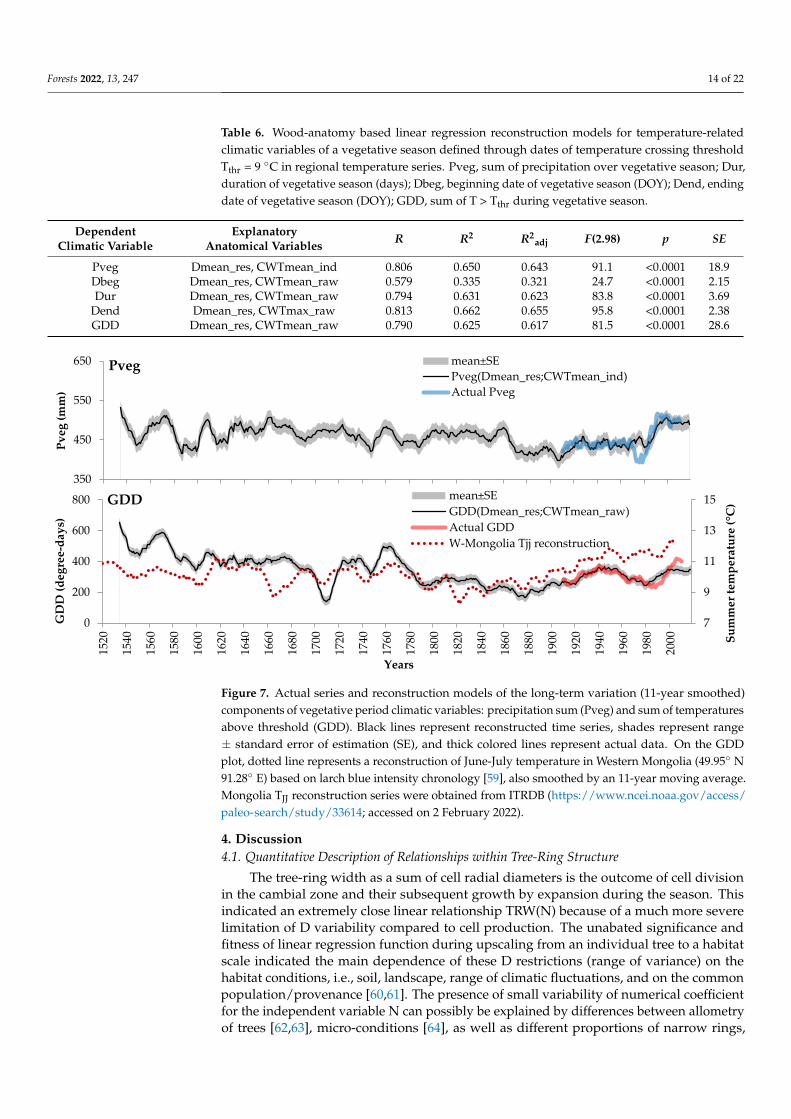
Smoothing the time series by the 11-year moving average (filtering low-frequencyvariations) has helped in obtaining higher dendroclimatic correlations reaching 0.5–0.8 forsome tree-ring chronologies and climatic variables of the vegetative season (Table 5). Asa result of linear regression analysis, two-factor reconstruction models have been selectedbased on anatomical chronologies (both initial and processed) which explain 32% of thevariation in long-term fluctuations for Dbeg and above 61% of the variation in long-termfluctuations for the other considered climatic variables (Table 6). Comparison of the plotsof reconstruction models and instrumental series (Figure 7) demonstrated that the obtainedmodels capture the frequency as well as the curve shapes of long-term climatic fluctuations(e.g., more abrupt or more gradual changes). The patterns of reconstructed long-termfluctuations have also been confirmed by the comparison between the GDD reconstructionmodel and the reconstructed June-July temperature TJJ obtained for western Mongolia(49.95◦ N 91.28◦ E, ~220 km southeast of the study area) based on the blue intensitychronology of Siberian larch, which was developed by Davi et al. [59]. A weak positivecorrelation (r = 0.20, p < 0.05) has been found between these two reconstructed smoothedseries of the summer climate characteristics. However, these reconstructions were carriedout for different, albeit related variables (e.g., the actual GDD series has a correlationr = 0.38 with the TJJ model per se and r = 0.40 when comparing smoothed series). It hasbeen worth noting that the general patterns of long-term fluctuation of the reconstructedGDD and Mongolian TJJ were still observed during 1524–1648 when the sample depth forwood anatomical chronologies of Siberian stone pine was less than three trees.
Forests 2022, 13, 247 14 of 22
Table 6. Wood-anatomy based linear regression reconstruction models for temperature-relatedclimatic variables of a vegetative season defined through dates of temperature crossing thresholdTthr = 9 ◦C in regional temperature series. Pveg, sum of precipitation over vegetative season; Dur,duration of vegetative season (days); Dbeg, beginning date of vegetative season (DOY); Dend, endingdate of vegetative season (DOY); GDD, sum of T > Tthr during vegetative season.
DependentClimatic Variable
ExplanatoryAnatomical Variables R R2 R2
adj F(2.98) p SE
Pveg Dmean_res, CWTmean_ind 0.806 0.650 0.643 91.1 <0.0001 18.9Dbeg Dmean_res, CWTmean_raw 0.579 0.335 0.321 24.7 <0.0001 2.15Dur Dmean_res, CWTmean_raw 0.794 0.631 0.623 83.8 <0.0001 3.69
Dend Dmean_res, CWTmax_raw 0.813 0.662 0.655 95.8 <0.0001 2.38GDD Dmean_res, CWTmean_raw 0.790 0.625 0.617 81.5 <0.0001 28.6
Forests 2021, 12, x FOR PEER REVIEW 15 of 23
duration of vegetative season (days); Dbeg, beginning date of vegetative season (DOY); Dend,
ending date of vegetative season (DOY); GDD, sum of T > Tthr during vegetative season.
Dependent
Climatic Variable
Explanatory
Anatomical Variables R R2 R2adj F(2.98) p SE
Pveg Dmean_res, CWTmean_ind 0.806 0.650 0.643 91.1 <0.0001 18.9
Dbeg Dmean_res, CWTmean_raw 0.579 0.335 0.321 24.7 <0.0001 2.15
Dur Dmean_res, CWTmean_raw 0.794 0.631 0.623 83.8 <0.0001 3.69
Dend Dmean_res, CWTmax_raw 0.813 0.662 0.655 95.8 <0.0001 2.38
GDD Dmean_res, CWTmean_raw 0.790 0.625 0.617 81.5 <0.0001 28.6
Figure 7. Actual series and reconstruction models of the long-term variation (11-year smoothed)
components of vegetative period climatic variables: precipitation sum (Pveg) and sum of temper-
atures above threshold (GDD). Black lines represent reconstructed time series, shades represent
range ± standard error of estimation (SE), and thick colored lines represent actual data. On the
GDD plot, dotted line represents a reconstruction of June-July temperature in Western Mongolia
(49.95° N 91.28° E) based on larch blue intensity chronology [59], also smoothed by an 11-year
moving average. Mongolia TJJ reconstruction series were obtained from ITRDB
(https://www.ncei.noaa.gov/access/paleo-search/study/33614; accessed 02 February 2022)
4. Discussion
4.1. Quantitative Description of Relationships within Tree-Ring Structure
The tree-ring width as a sum of cell radial diameters is the outcome of cell division
in the cambial zone and their subsequent growth by expansion during the season. This
indicated an extremely close linear relationship TRW(N) because of a much more severe
limitation of D variability compared to cell production. The unabated significance and
fitness of linear regression function during upscaling from an individual tree to a habitat
scale indicated the main dependence of these D restrictions (range of variance) on the
habitat conditions, i.e., soil, landscape, range of climatic fluctuations, and on the common
population/provenance [60,61]. The presence of small variability of numerical coefficient
for the independent variable N can possibly be explained by differences between allom-
etry of trees [62,63], micro-conditions [64], as well as different proportions of narrow
rings, where a significant dependence D(N) leads to a deviation of TRW(N) from the
purely linear function. Apparently, in wide rings, the average and maximum values of
investigated cellular parameters D and CWT fluctuate around values reflecting the op-
350
450
550
650
Pv
eg (
mm
)
Pveg mean±SE
Pveg(Dmean_res;CWTmean_ind)
Actual Pveg
7
9
11
13
15
0
200
400
600
800
1520
1540
1560
1580
1600
1620
1640
1660
1680
1700
1720
1740
1760
1780
1800
1820
1840
1860
1880
1900
1920
1940
1960
1980
2000 S
um
mer
tem
per
atu
re (
°C)
GD
D (
deg
ree
-day
s)
Years
GDD mean±SE
GDD(Dmean_res;CWTmean_raw)
Actual GDD
W-Mongolia Tjj reconstruction
Figure 7. Actual series and reconstruction models of the long-term variation (11-year smoothed)components of vegetative period climatic variables: precipitation sum (Pveg) and sum of temperaturesabove threshold (GDD). Black lines represent reconstructed time series, shades represent range± standard error of estimation (SE), and thick colored lines represent actual data. On the GDDplot, dotted line represents a reconstruction of June-July temperature in Western Mongolia (49.95◦ N91.28◦ E) based on larch blue intensity chronology [59], also smoothed by an 11-year moving average.Mongolia TJJ reconstruction series were obtained from ITRDB (https://www.ncei.noaa.gov/access/paleo-search/study/33614; accessed on 2 February 2022).
4. Discussion4.1. Quantitative Description of Relationships within Tree-Ring Structure
The tree-ring width as a sum of cell radial diameters is the outcome of cell divisionin the cambial zone and their subsequent growth by expansion during the season. Thisindicated an extremely close linear relationship TRW(N) because of a much more severelimitation of D variability compared to cell production. The unabated significance andfitness of linear regression function during upscaling from an individual tree to a habitatscale indicated the main dependence of these D restrictions (range of variance) on thehabitat conditions, i.e., soil, landscape, range of climatic fluctuations, and on the commonpopulation/provenance [60,61]. The presence of small variability of numerical coefficientfor the independent variable N can possibly be explained by differences between allometryof trees [62,63], micro-conditions [64], as well as different proportions of narrow rings,
Forests 2022, 13, 247 15 of 22
where a significant dependence D(N) leads to a deviation of TRW(N) from the purelylinear function. Apparently, in wide rings, the average and maximum values of inves-tigated cellular parameters D and CWT fluctuate around values reflecting the optimalfunctionality of the xylem for each tree due to the above factors. Stress conditions leadto the inhibition of all growth processes and result in the formation of a few small andthin-walled cells [44], which was indirectly supported by positive correlations betweenanatomical parameters [65]. An increase of interrelations in the narrow rings led to expo-nential patterns of D(N) and CWT(N). The uniform shape of the curves for the mean andmaximum values of D and CWT presumably indicated this pattern to be a common rulefor considering individual zones (earlywood, transition wood, latewood) or even narrowersectors of the tree ring as well as for other morphometric parameters of tracheids, whichare functionally related to cell size and wall thickness. This assumption is supported bythe exponential dependence of the maximum wood density on TRW as demonstratedby Kirdyanov et al. [66] as wood density is determined mainly by the cell morphometricparameters [67,68]. We assume that the principle of this relationship does not depend atall on the tree species and the nature of stress factor, as entirely the same function curveswere obtained for Scots pine wood under the semiarid conditions of the forest-steppe withdrought as the main stressor [69]. Different from this previous study, the numerical termsof the exponential models have been selected here with utmost care: Das and CWTas valueswere calculated mathematically according to their interpretation as optimal values (averagefor the widest rings).
Indexing of TRW chronologies removes or suppresses long-term trends associatedwith the dynamics of tree age, size, and intensity of competition. These trends largelyvary between trees [9], therefore, the common external signal in the TRW series naturallyincreases after indexing. Simultaneously, in the proposed indexing of cell anatomicalcharacteristics the suppressed component enclosed the information on the intensity ofxylem cell production, which is partially common to all trees, and records environmentalconditions before and during the period of cambial activity. Since the nonlinear model hasa high dependence on the narrowest rings, the removal of this component suppressed theresponse to the extremes most crucial for cambial activity. As a result, the indexed anatom-ical chronologies have mostly preserved the climatic signal recorded during the furtherstages of xylem cell differentiation, which was just part of the common signal present in theraw series. This has led to a decrease in inter-series correlations after indexing. Remarkably,despite this decrease, the intensity of the climatic signal in anatomical chronologies hasbeen unabated after the indexation. Since the annual variation of climatic factors, as a rule,has a distribution of values close to normal, near-normal distribution of indexed anatomicaltraits also contributes to the preservation of the significance of the Pearson correlations andthe adequacy of their use as an estimate of the climatic response.
The P. sibrica wood has difficulty in separation of early- and latewood zones usingany unequivocal quantitative anatomical criterion (for example, Mork’s criterion [70,71])because of the low ratio of latewood, a relatively small morphometric difference betweenearlywood and latewood cells, and frequent occurrence of light rings (absence of CWTincrement in latewood) due to cold conditions. Therefore, the anatomical characteristicsof these zones were assessed in this study indirectly using Dmax and CWTmean_res forearlywood and CWTmax and Dmean_res for latewood.
4.2. Climatic Response Patterns and Separation
There has been a widespread idea that spring-summer temperatures closely regulatethe tree growth in the upper boundaries of the growth range, which is a simplistic statementas it does not consider the possibility of a significant influence of other climatic factorsand events [12,72–74]. However, a deficit in heat supply was the prevailing stressorunder the cold-humid conditions of the timberline [74,75], and most of the observedclimatic responses from this study during the vegetative season should be interpreted withthis viewpoint. Positive correlations of tree-ring parameters with temperatures during

Forests 2022, 13, 247 16 of 22
the corresponding stage of cell differentiation are provided by a direct effect, namelythermal regulation of the rates of biochemical reactions and increasing the duration ofcambial activity by the early start of the vegetative season [44,76–78]. Therefore, the sumof active temperatures also turns out to be a very significant factor for tree growth inthis ecotone [79,80]. At the end of the season, heat supply affects both the CWT of thelatewood cells of the current ring and the synthesis of nonstructural nutrients stored for thenext season [81,82]. Therefore N, TRW, and D reflect the climate at the end of the previousvegetative season. Precipitation indirectly serves as a cooling factor, is associated with lesserinsolation through cloudiness, and also causes a reduction in soil oxygen concentration andthe root activity through waterlogging [83,84]. The positive correlation between the amountof precipitation over the vegetative season and the cell wall thickness, in our opinion, canbe an artifact from the positive correlation of this variable with the duration and end date ofthe season. Temperature fluctuations during the cold season are an additional stress factorthat damages tree tissues, which decreases the availability of the resources for secondarygrowth later [85,86]. Before the beginning of the vegetative season, a combination ofpositive air temperatures with frozen soil under snow cover leads to physiological drought,which damages the tissues too ([87], see also study of Zhirnova et al. [32] and the effectsof winter thawing [88]). The predominantly coinciding directions of pointer years withyears of climatic extremes (except for the beginning date of the vegetative season, wherethe picture is opposite) also indicate a positive effect of high heat supply and the longerduration of the season over cell production, their size, and wall thickness.
The maximum values of cell measurements naturally refer to particular tracheids,located in the first half of earlywood for Dmax and in the middle of latewood for CWTmax.However, these maximum values should generally correspond to larger durations of therespective cell differentiation stage compared to cells of different tree-ring zone, e.g., forconifers in boreal and alpine forests, the literature suggests an estimated time of ~20 days(more than half of the month) for earlywood cell expansion and >30 days for latewoodcell wall deposition [89–91]. Additionally, there are variations associated with (1) locationof the largest (most thick-walled) cell within earlywood (latewood), and (2) year-to-yearphenological shifts of the onset and cessation of xylogenesis (observed, e.g., in [77]). Thisintroduces temporal uncertainty about the calendar intervals in the development of Dmaxand CWTmax and expands the intra-seasonal window of actual climatic records in theirlong-term chronologies. Thus, significant dendroclimatic correlations are expected ona monthly scale if actual climate–growth relationships exist for these anatomical parameters.
After separating the climatic signal by indexing the anatomical chronologies, theobtained signal was accentuated during the parts of the season corresponding with theseasonality of the processes of cell expansion (D) and the deposition of the secondary cellwall (CWT) and commonly weakened for a period of cambial activity (N). It means thatin a dendroclimatic analysis (including reconstructions) of quantitative wood anatomicaltraits, the intra-seasonal framework of the modeled climatic proxy can be adjusted not onlyby choosing certain zones of the tree ring and particular anatomical parameters but also bychoice of raw and/or indexed anatomical chronologies.
4.3. Reconstruction of the Climatic Characteristics of the Vegetative Season
The reconstruction models obtained under this study used quite integral climaticvariables. It has led to the inclusion of non-indexed anatomical chronologies in the models,which to a certain extent integrates the climatic response from the previous stages oftracheid differentiation in addition to their own. Interestingly, both radial growth andanatomical chronologies have a pronounced similarity in the dynamics and pointer yearsnot only with the high-frequency climatic fluctuations but to a much greater extent withthe low-frequency changes in the characteristics of the vegetative season. The observationof Kharuk et al. [30] indirectly supported the reaction of P. sibirica with long-term climaticfluctuations rather than year-to-year climatic variations. according to that study, thecorrelations of its TRW were significant during the period of rapid warming (and were
Forests 2022, 13, 247 17 of 22
even more definite than for larch, a species known for its climate sensitivity), but wereabsent for the period of stable temperatures before it. However, our observations showthat morphometric traits of P. sibirica tracheids have even more pronounced climatogeniclong-term fluctuations as compared to cell production and TRW.
As shown in the study of Nikolaeva et al. [17], the radial growth of Siberian stone pinein high mountains is characterized by significant long-term changes caused by geomor-phological processes and stand dynamics. As obvious, such impacts, especially related tochanges in stand density, can vary for individual trees depending on their spatial locationand competitive position in the stand. For example, the death of a large dominant treecan sharply intensify the growth of the surrounding oppressed trees due to an increase inavailable resources and living space [92,93], which can significantly distort the picture oflong-term climatogenic fluctuations in radial growth [94]. On the other hand, the hydraulicarchitecture and thus the anatomical structure of the xylem have functional limitationswithin one population and habitat tightly linked to the environmental temperature andmoisture availability [95,96], and therefore to climatic conditions. In addition, we canassume that water supply through a high percentage of sapwood area (i.e., a lesser pro-nounced lumen limitation in latewood) and a high proportion of sapwood within trunkcross-section (e.g., ~55% in [97]) caused long-term autocorrelation in the water supplycapacity of stem xylem of Siberian stone pine. The colder areas like the upper timberlinetypically witness slow growth of trees [98] and therefore observed lesser changes in treewater demands except in cases of partial die-off. This effect was enhanced by the factthat stone pines implement a common strategy of slow accumulation and utilization ofresources [99], which has been demonstrated by Ning et al. [100] in a comparative studyof P. coraensis and larch. Further, stone pines of the study area are reaching a massivesize (in diameter, height, and area of the photosynthetic apparatus) in their long lifespan,which indicates their relatively large capacity of accumulating non-structural assimilates instorage tissues. We believe that all of the aforementioned factors caused the synchronicityof long-term climatic fluctuations with corresponding, albeit more subtle, slow changes inthe wood anatomical structure of P. sibirica. Thus, this same combination of the ecophysio-logical features might have been the reason behind its well-known low sensitivity of radialgrowth to high-frequency climatic fluctuations due to which this species and its closestrelatives are still being underestimated by dendrochronologists.
Comparison between the obtained model of the vegetative season GDD and one ofthe nearest territorially reconstructions of summer temperatures [59] exhibited similarfluctuation in heat supply even in the period of insufficient sample depth, which hassupported the revealed dendroclimatic relationships. However, in addition to the obviousstochastic uncertainties, the differences observed in the models might be related to severalreasons. Firstly, the reconstruction models are of two different climatic variables, albeitrelated to each other, but differing in seasonality and calculation method. Secondly, thedesynchronization could be provided by a distance of above 200 km between the respectivestudy areas and their location on different macro-slopes of the large mountain system.Thirdly, the contribution of different intensity and seasonality of the temperature responseof the used proxies is possible (differences between stone pine and larch species and theuse of different tree-ring parameters). A discrepancy in the longest centennial fluctuationsis also possible, which has been recorded for long-term temperature reconstructions evenon the global scale [101]. These considerations require further analysis and continuedresearch into the possibilities of obtaining long-term climatic reconstructions based onanatomical chronologies.
5. Conclusions
This study demonstrates quantitative wood anatomy as the best alternative measureof traditional dendroclimatology of P. sibirica for climatic fluctuations which cannot bedetected in TRW. Additionally, the morphometric parameters free from the influence of cellproduction offers better climatic signal recorded at corresponding stages of cell differen-
Forests 2022, 13, 247 18 of 22
tiation. Further, the dendroclimatic analysis revealed the prevailing growth dependenceof P. sibirica tree on heat supply due to cold-humid conditions of timberline in the studyarea. Climatic signal in anatomical chronologies was separated from the signal in cellproduction after their indexation. This indicates that the intra-seasonal framework of den-droclimatic reconstructions based on quantitative wood anatomical traits can be adjustedthrough selecting specific zones/traits of the tree rings and including raw and/or indexedchronologies. The radial and especially anatomical chronologies of P. sibirica revealedpronounced similarities in the dynamics and pointer years to a greater extent with low-frequency climatic fluctuations. The synchronicity of long-term climatic fluctuations withcorresponding, albeit more subtle, changes in the wood anatomical structure, is thoughtto be part of the physiological adaptation strategy of P. sibirica. Comparison between theobtained model of the vegetative season GDD and one of the nearest territorially recon-structions of summer temperatures from Mongolia exhibited similar fluctuation in heatsupply even in the period of insufficient sample depth, which has supported the revealeddendroclimatic relationships.
Supplementary Materials: The following supporting information can be downloaded at: https://www.mdpi.com/article/10.3390/f13020247/s1, Figure S1: Average monthly climatic diagram ofthe study region; Figure S2: Calculation of tree-ring characteristics from tracheidograms of cell radialdiameter D and cell wall thickness CWT; Figure S3: Distribution density of measured (a) and indexed(b) tree-ring anatomical characteristics for seven individual trees and total sample; Figure S4: Quantile-quantile plots of measured (a) and indexed (b) tree-ring anatomical characteristics standardized toz-scores (mean 0, standard deviation 1) against standard normal distribution; Figure S5: localchronologies of tree-ring traits and moving average series of precipitation and temperature; Figure S6:Temperature anomalies smoothed by 21-day moving average for positive and negative pointeryears in chronologies of tree-ring parameters; Table S1: Correlation coefficients between tree-ringchronologies and temperature-related characteristics of vegetative season defined through thresholdvalue Tthr in regional temperature series.
Author Contributions: Conceptualization, D.F.Z. and L.V.B.; methodology, E.A.V.; validation, S.K.T.and E.A.B.; formal analysis, L.V.B.; investigation, D.F.Z. and L.V.B.; resources, D.F.Z.; data curation,L.V.B.; writing—original draft preparation, D.F.Z., L.V.B. and K.K.U.; writing—review and editing, allauthors; visualization, L.V.B.; supervision, E.A.B.; project administration, D.F.Z.; funding acquisition,E.A.V. All authors have read and agreed to the published version of the manuscript.
Funding: This research was funded by the Russian Federation represented by the Ministry of Scienceand Higher Education of Russia in the framework of a large-scale research project «Socio-EconomicDevelopment of Asian Russia on the Basis of Synergy of Transport Accessibility, System Knowledgeof the Natural Resource Potential, Expanding Space of Inter-Regional Interactions», Agreement no.075-15-2020-804 dated 2 October 2020 [grant No. 13.1902.21.0016].
Data Availability Statement: The data presented in this study are available on request from thecorresponding author.
Conflicts of Interest: The authors declare no conflict of interest. The funder had no role in the designof the study; in the collection, analyses, or interpretation of data; in the writing of the manuscript, orin the decision to publish the results.
References1. White, A.; Cannell, M.G.; Friend, A.D. CO2 stabilization, climate change and the terrestrial carbon sink. Glob. Chang. Biol. 2000, 6,
817–833. [CrossRef]2. Parks, C.G.; Bernier, P. Adaptation of forests and forest management to changing climate with emphasis on forest health: A review
of science, policies and practices. For. Ecol. Manag. 2010, 259, 657–659. [CrossRef]3. Pugh, T.A.; Lindeskog, M.; Smith, B.; Poulter, B.; Arneth, A.; Haverd, V.; Calle, L. Role of forest regrowth in global carbon sink
dynamics. Proc. Natl. Acad. Sci. USA 2019, 116, 4382–4387. [CrossRef] [PubMed]4. Mérian, P.; Bontemps, J.D.; Bergés, L.; Lebourgeois, F. Spatial variation and temporal instability in climate-growth relationships of
sessile oak (Quercus petraea [Matt.] Liebl.) under temperate conditions. Plant Ecol. 2011, 212, 1855–1871. [CrossRef]5. Crimmins, S.M.; Dobrowski, S.Z.; Greenberg, J.A.; Abatzoglou, J.T.; Mynsberge, A.R. Changes in climatic water balance drive
downhill shifts in plant species’ optimum elevations. Science 2011, 331, 324–327. [CrossRef] [PubMed]
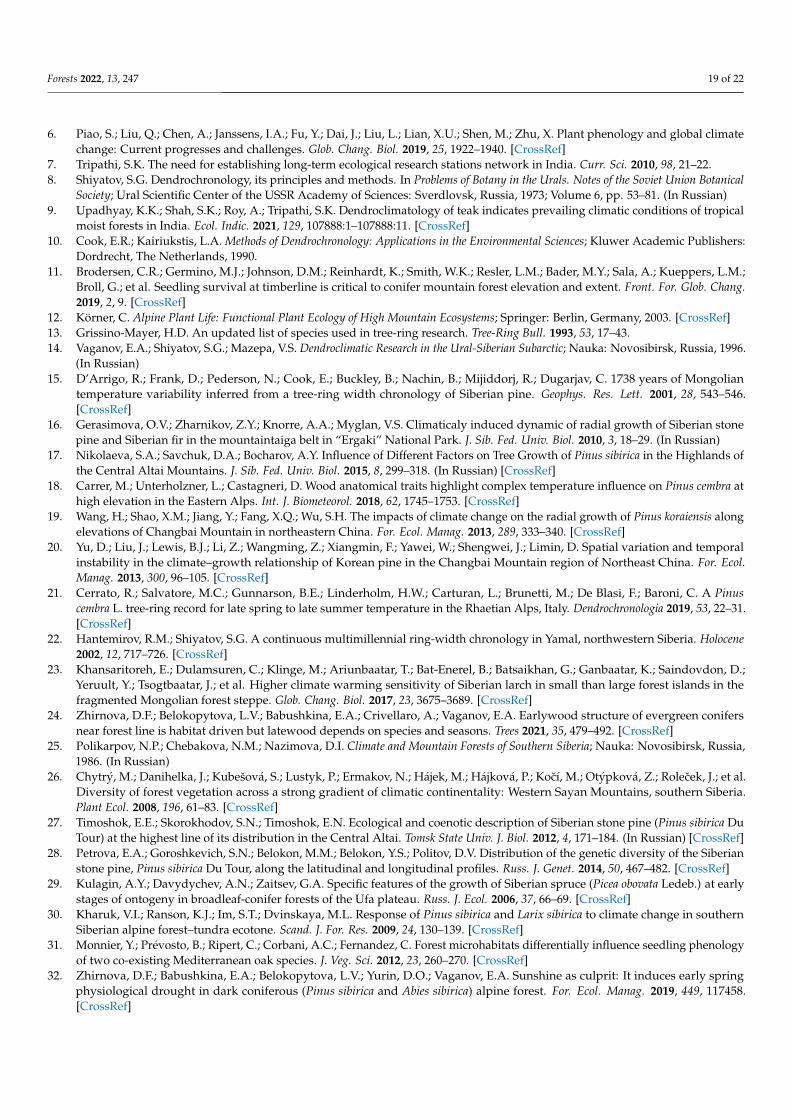
Forests 2022, 13, 247 19 of 22
6. Piao, S.; Liu, Q.; Chen, A.; Janssens, I.A.; Fu, Y.; Dai, J.; Liu, L.; Lian, X.U.; Shen, M.; Zhu, X. Plant phenology and global climatechange: Current progresses and challenges. Glob. Chang. Biol. 2019, 25, 1922–1940. [CrossRef]
7. Tripathi, S.K. The need for establishing long-term ecological research stations network in India. Curr. Sci. 2010, 98, 21–22.8. Shiyatov, S.G. Dendrochronology, its principles and methods. In Problems of Botany in the Urals. Notes of the Soviet Union Botanical
Society; Ural Scientific Center of the USSR Academy of Sciences: Sverdlovsk, Russia, 1973; Volume 6, pp. 53–81. (In Russian)9. Upadhyay, K.K.; Shah, S.K.; Roy, A.; Tripathi, S.K. Dendroclimatology of teak indicates prevailing climatic conditions of tropical
moist forests in India. Ecol. Indic. 2021, 129, 107888:1–107888:11. [CrossRef]10. Cook, E.R.; Kairiukstis, L.A. Methods of Dendrochronology: Applications in the Environmental Sciences; Kluwer Academic Publishers:
Dordrecht, The Netherlands, 1990.11. Brodersen, C.R.; Germino, M.J.; Johnson, D.M.; Reinhardt, K.; Smith, W.K.; Resler, L.M.; Bader, M.Y.; Sala, A.; Kueppers, L.M.;
Broll, G.; et al. Seedling survival at timberline is critical to conifer mountain forest elevation and extent. Front. For. Glob. Chang.2019, 2, 9. [CrossRef]
12. Körner, C. Alpine Plant Life: Functional Plant Ecology of High Mountain Ecosystems; Springer: Berlin, Germany, 2003. [CrossRef]13. Grissino-Mayer, H.D. An updated list of species used in tree-ring research. Tree-Ring Bull. 1993, 53, 17–43.14. Vaganov, E.A.; Shiyatov, S.G.; Mazepa, V.S. Dendroclimatic Research in the Ural-Siberian Subarctic; Nauka: Novosibirsk, Russia, 1996.
(In Russian)15. D’Arrigo, R.; Frank, D.; Pederson, N.; Cook, E.; Buckley, B.; Nachin, B.; Mijiddorj, R.; Dugarjav, C. 1738 years of Mongolian
temperature variability inferred from a tree-ring width chronology of Siberian pine. Geophys. Res. Lett. 2001, 28, 543–546.[CrossRef]
16. Gerasimova, O.V.; Zharnikov, Z.Y.; Knorre, A.A.; Myglan, V.S. Climaticaly induced dynamic of radial growth of Siberian stonepine and Siberian fir in the mountaintaiga belt in “Ergaki” National Park. J. Sib. Fed. Univ. Biol. 2010, 3, 18–29. (In Russian)
17. Nikolaeva, S.A.; Savchuk, D.A.; Bocharov, A.Y. Influence of Different Factors on Tree Growth of Pinus sibirica in the Highlands ofthe Central Altai Mountains. J. Sib. Fed. Univ. Biol. 2015, 8, 299–318. (In Russian) [CrossRef]
18. Carrer, M.; Unterholzner, L.; Castagneri, D. Wood anatomical traits highlight complex temperature influence on Pinus cembra athigh elevation in the Eastern Alps. Int. J. Biometeorol. 2018, 62, 1745–1753. [CrossRef]
19. Wang, H.; Shao, X.M.; Jiang, Y.; Fang, X.Q.; Wu, S.H. The impacts of climate change on the radial growth of Pinus koraiensis alongelevations of Changbai Mountain in northeastern China. For. Ecol. Manag. 2013, 289, 333–340. [CrossRef]
20. Yu, D.; Liu, J.; Lewis, B.J.; Li, Z.; Wangming, Z.; Xiangmin, F.; Yawei, W.; Shengwei, J.; Limin, D. Spatial variation and temporalinstability in the climate–growth relationship of Korean pine in the Changbai Mountain region of Northeast China. For. Ecol.Manag. 2013, 300, 96–105. [CrossRef]
21. Cerrato, R.; Salvatore, M.C.; Gunnarson, B.E.; Linderholm, H.W.; Carturan, L.; Brunetti, M.; De Blasi, F.; Baroni, C. A Pinuscembra L. tree-ring record for late spring to late summer temperature in the Rhaetian Alps, Italy. Dendrochronologia 2019, 53, 22–31.[CrossRef]
22. Hantemirov, R.M.; Shiyatov, S.G. A continuous multimillennial ring-width chronology in Yamal, northwestern Siberia. Holocene2002, 12, 717–726. [CrossRef]
23. Khansaritoreh, E.; Dulamsuren, C.; Klinge, M.; Ariunbaatar, T.; Bat-Enerel, B.; Batsaikhan, G.; Ganbaatar, K.; Saindovdon, D.;Yeruult, Y.; Tsogtbaatar, J.; et al. Higher climate warming sensitivity of Siberian larch in small than large forest islands in thefragmented Mongolian forest steppe. Glob. Chang. Biol. 2017, 23, 3675–3689. [CrossRef]
24. Zhirnova, D.F.; Belokopytova, L.V.; Babushkina, E.A.; Crivellaro, A.; Vaganov, E.A. Earlywood structure of evergreen conifersnear forest line is habitat driven but latewood depends on species and seasons. Trees 2021, 35, 479–492. [CrossRef]
25. Polikarpov, N.P.; Chebakova, N.M.; Nazimova, D.I. Climate and Mountain Forests of Southern Siberia; Nauka: Novosibirsk, Russia,1986. (In Russian)
26. Chytrý, M.; Danihelka, J.; Kubešová, S.; Lustyk, P.; Ermakov, N.; Hájek, M.; Hájková, P.; Kocí, M.; Otýpková, Z.; Rolecek, J.; et al.Diversity of forest vegetation across a strong gradient of climatic continentality: Western Sayan Mountains, southern Siberia.Plant Ecol. 2008, 196, 61–83. [CrossRef]
27. Timoshok, E.E.; Skorokhodov, S.N.; Timoshok, E.N. Ecological and coenotic description of Siberian stone pine (Pinus sibirica DuTour) at the highest line of its distribution in the Central Altai. Tomsk State Univ. J. Biol. 2012, 4, 171–184. (In Russian) [CrossRef]
28. Petrova, E.A.; Goroshkevich, S.N.; Belokon, M.M.; Belokon, Y.S.; Politov, D.V. Distribution of the genetic diversity of the Siberianstone pine, Pinus sibirica Du Tour, along the latitudinal and longitudinal profiles. Russ. J. Genet. 2014, 50, 467–482. [CrossRef]
29. Kulagin, A.Y.; Davydychev, A.N.; Zaitsev, G.A. Specific features of the growth of Siberian spruce (Picea obovata Ledeb.) at earlystages of ontogeny in broadleaf-conifer forests of the Ufa plateau. Russ. J. Ecol. 2006, 37, 66–69. [CrossRef]
30. Kharuk, V.I.; Ranson, K.J.; Im, S.T.; Dvinskaya, M.L. Response of Pinus sibirica and Larix sibirica to climate change in southernSiberian alpine forest–tundra ecotone. Scand. J. For. Res. 2009, 24, 130–139. [CrossRef]
31. Monnier, Y.; Prévosto, B.; Ripert, C.; Corbani, A.C.; Fernandez, C. Forest microhabitats differentially influence seedling phenologyof two co-existing Mediterranean oak species. J. Veg. Sci. 2012, 23, 260–270. [CrossRef]
32. Zhirnova, D.F.; Babushkina, E.A.; Belokopytova, L.V.; Yurin, D.O.; Vaganov, E.A. Sunshine as culprit: It induces early springphysiological drought in dark coniferous (Pinus sibirica and Abies sibirica) alpine forest. For. Ecol. Manag. 2019, 449, 117458.[CrossRef]
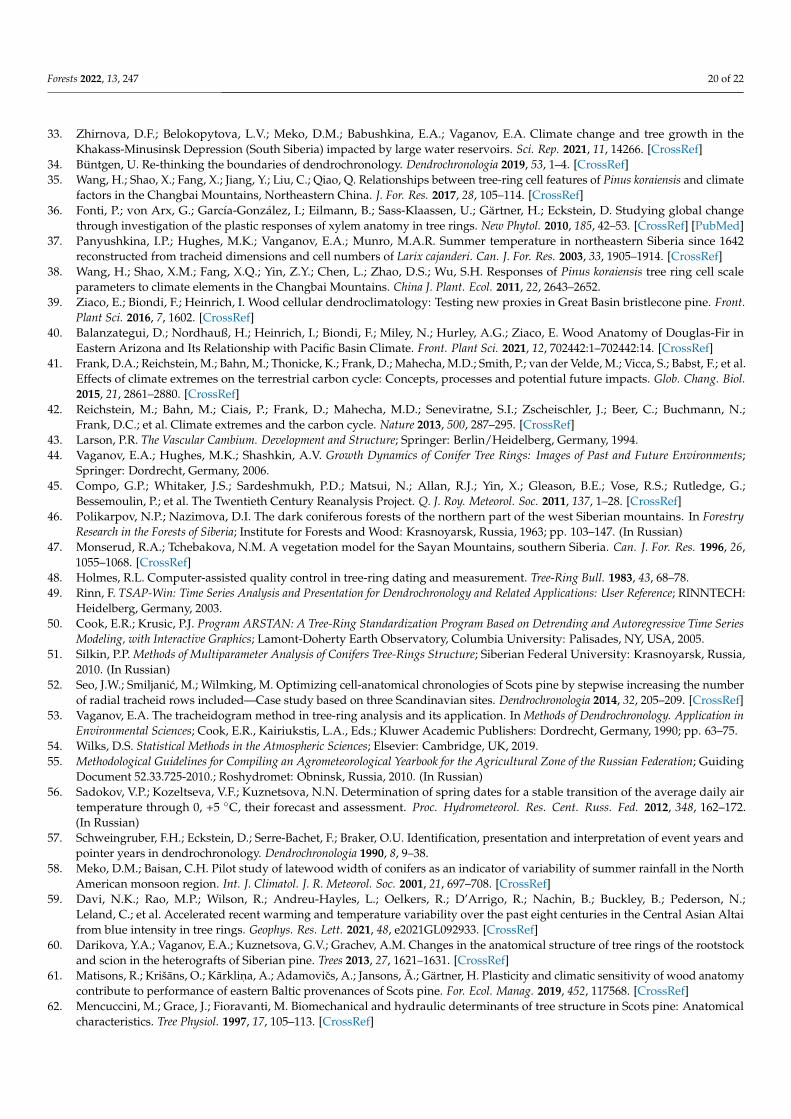
Forests 2022, 13, 247 20 of 22
33. Zhirnova, D.F.; Belokopytova, L.V.; Meko, D.M.; Babushkina, E.A.; Vaganov, E.A. Climate change and tree growth in theKhakass-Minusinsk Depression (South Siberia) impacted by large water reservoirs. Sci. Rep. 2021, 11, 14266. [CrossRef]
34. Büntgen, U. Re-thinking the boundaries of dendrochronology. Dendrochronologia 2019, 53, 1–4. [CrossRef]35. Wang, H.; Shao, X.; Fang, X.; Jiang, Y.; Liu, C.; Qiao, Q. Relationships between tree-ring cell features of Pinus koraiensis and climate
factors in the Changbai Mountains, Northeastern China. J. For. Res. 2017, 28, 105–114. [CrossRef]36. Fonti, P.; von Arx, G.; García-González, I.; Eilmann, B.; Sass-Klaassen, U.; Gärtner, H.; Eckstein, D. Studying global change
through investigation of the plastic responses of xylem anatomy in tree rings. New Phytol. 2010, 185, 42–53. [CrossRef] [PubMed]37. Panyushkina, I.P.; Hughes, M.K.; Vanganov, E.A.; Munro, M.A.R. Summer temperature in northeastern Siberia since 1642
reconstructed from tracheid dimensions and cell numbers of Larix cajanderi. Can. J. For. Res. 2003, 33, 1905–1914. [CrossRef]38. Wang, H.; Shao, X.M.; Fang, X.Q.; Yin, Z.Y.; Chen, L.; Zhao, D.S.; Wu, S.H. Responses of Pinus koraiensis tree ring cell scale
parameters to climate elements in the Changbai Mountains. China J. Plant. Ecol. 2011, 22, 2643–2652.39. Ziaco, E.; Biondi, F.; Heinrich, I. Wood cellular dendroclimatology: Testing new proxies in Great Basin bristlecone pine. Front.
Plant Sci. 2016, 7, 1602. [CrossRef]40. Balanzategui, D.; Nordhauß, H.; Heinrich, I.; Biondi, F.; Miley, N.; Hurley, A.G.; Ziaco, E. Wood Anatomy of Douglas-Fir in
Eastern Arizona and Its Relationship with Pacific Basin Climate. Front. Plant Sci. 2021, 12, 702442:1–702442:14. [CrossRef]41. Frank, D.A.; Reichstein, M.; Bahn, M.; Thonicke, K.; Frank, D.; Mahecha, M.D.; Smith, P.; van der Velde, M.; Vicca, S.; Babst, F.; et al.
Effects of climate extremes on the terrestrial carbon cycle: Concepts, processes and potential future impacts. Glob. Chang. Biol.2015, 21, 2861–2880. [CrossRef]
42. Reichstein, M.; Bahn, M.; Ciais, P.; Frank, D.; Mahecha, M.D.; Seneviratne, S.I.; Zscheischler, J.; Beer, C.; Buchmann, N.;Frank, D.C.; et al. Climate extremes and the carbon cycle. Nature 2013, 500, 287–295. [CrossRef]
43. Larson, P.R. The Vascular Cambium. Development and Structure; Springer: Berlin/Heidelberg, Germany, 1994.44. Vaganov, E.A.; Hughes, M.K.; Shashkin, A.V. Growth Dynamics of Conifer Tree Rings: Images of Past and Future Environments;
Springer: Dordrecht, Germany, 2006.45. Compo, G.P.; Whitaker, J.S.; Sardeshmukh, P.D.; Matsui, N.; Allan, R.J.; Yin, X.; Gleason, B.E.; Vose, R.S.; Rutledge, G.;
Bessemoulin, P.; et al. The Twentieth Century Reanalysis Project. Q. J. Roy. Meteorol. Soc. 2011, 137, 1–28. [CrossRef]46. Polikarpov, N.P.; Nazimova, D.I. The dark coniferous forests of the northern part of the west Siberian mountains. In Forestry
Research in the Forests of Siberia; Institute for Forests and Wood: Krasnoyarsk, Russia, 1963; pp. 103–147. (In Russian)47. Monserud, R.A.; Tchebakova, N.M. A vegetation model for the Sayan Mountains, southern Siberia. Can. J. For. Res. 1996, 26,
1055–1068. [CrossRef]48. Holmes, R.L. Computer-assisted quality control in tree-ring dating and measurement. Tree-Ring Bull. 1983, 43, 68–78.49. Rinn, F. TSAP-Win: Time Series Analysis and Presentation for Dendrochronology and Related Applications: User Reference; RINNTECH:
Heidelberg, Germany, 2003.50. Cook, E.R.; Krusic, P.J. Program ARSTAN: A Tree-Ring Standardization Program Based on Detrending and Autoregressive Time Series
Modeling, with Interactive Graphics; Lamont-Doherty Earth Observatory, Columbia University: Palisades, NY, USA, 2005.51. Silkin, P.P. Methods of Multiparameter Analysis of Conifers Tree-Rings Structure; Siberian Federal University: Krasnoyarsk, Russia,
2010. (In Russian)52. Seo, J.W.; Smiljanic, M.; Wilmking, M. Optimizing cell-anatomical chronologies of Scots pine by stepwise increasing the number
of radial tracheid rows included—Case study based on three Scandinavian sites. Dendrochronologia 2014, 32, 205–209. [CrossRef]53. Vaganov, E.A. The tracheidogram method in tree-ring analysis and its application. In Methods of Dendrochronology. Application in
Environmental Sciences; Cook, E.R., Kairiukstis, L.A., Eds.; Kluwer Academic Publishers: Dordrecht, Germany, 1990; pp. 63–75.54. Wilks, D.S. Statistical Methods in the Atmospheric Sciences; Elsevier: Cambridge, UK, 2019.55. Methodological Guidelines for Compiling an Agrometeorological Yearbook for the Agricultural Zone of the Russian Federation; Guiding
Document 52.33.725-2010.; Roshydromet: Obninsk, Russia, 2010. (In Russian)56. Sadokov, V.P.; Kozeltseva, V.F.; Kuznetsova, N.N. Determination of spring dates for a stable transition of the average daily air
temperature through 0, +5 ◦C, their forecast and assessment. Proc. Hydrometeorol. Res. Cent. Russ. Fed. 2012, 348, 162–172.(In Russian)
57. Schweingruber, F.H.; Eckstein, D.; Serre-Bachet, F.; Braker, O.U. Identification, presentation and interpretation of event years andpointer years in dendrochronology. Dendrochronologia 1990, 8, 9–38.
58. Meko, D.M.; Baisan, C.H. Pilot study of latewood width of conifers as an indicator of variability of summer rainfall in the NorthAmerican monsoon region. Int. J. Climatol. J. R. Meteorol. Soc. 2001, 21, 697–708. [CrossRef]
59. Davi, N.K.; Rao, M.P.; Wilson, R.; Andreu-Hayles, L.; Oelkers, R.; D’Arrigo, R.; Nachin, B.; Buckley, B.; Pederson, N.;Leland, C.; et al. Accelerated recent warming and temperature variability over the past eight centuries in the Central Asian Altaifrom blue intensity in tree rings. Geophys. Res. Lett. 2021, 48, e2021GL092933. [CrossRef]
60. Darikova, Y.A.; Vaganov, E.A.; Kuznetsova, G.V.; Grachev, A.M. Changes in the anatomical structure of tree rings of the rootstockand scion in the heterografts of Siberian pine. Trees 2013, 27, 1621–1631. [CrossRef]
61. Matisons, R.; Krišans, O.; Karklin, a, A.; Adamovics, A.; Jansons, A.; Gärtner, H. Plasticity and climatic sensitivity of wood anatomycontribute to performance of eastern Baltic provenances of Scots pine. For. Ecol. Manag. 2019, 452, 117568. [CrossRef]
62. Mencuccini, M.; Grace, J.; Fioravanti, M. Biomechanical and hydraulic determinants of tree structure in Scots pine: Anatomicalcharacteristics. Tree Physiol. 1997, 17, 105–113. [CrossRef]
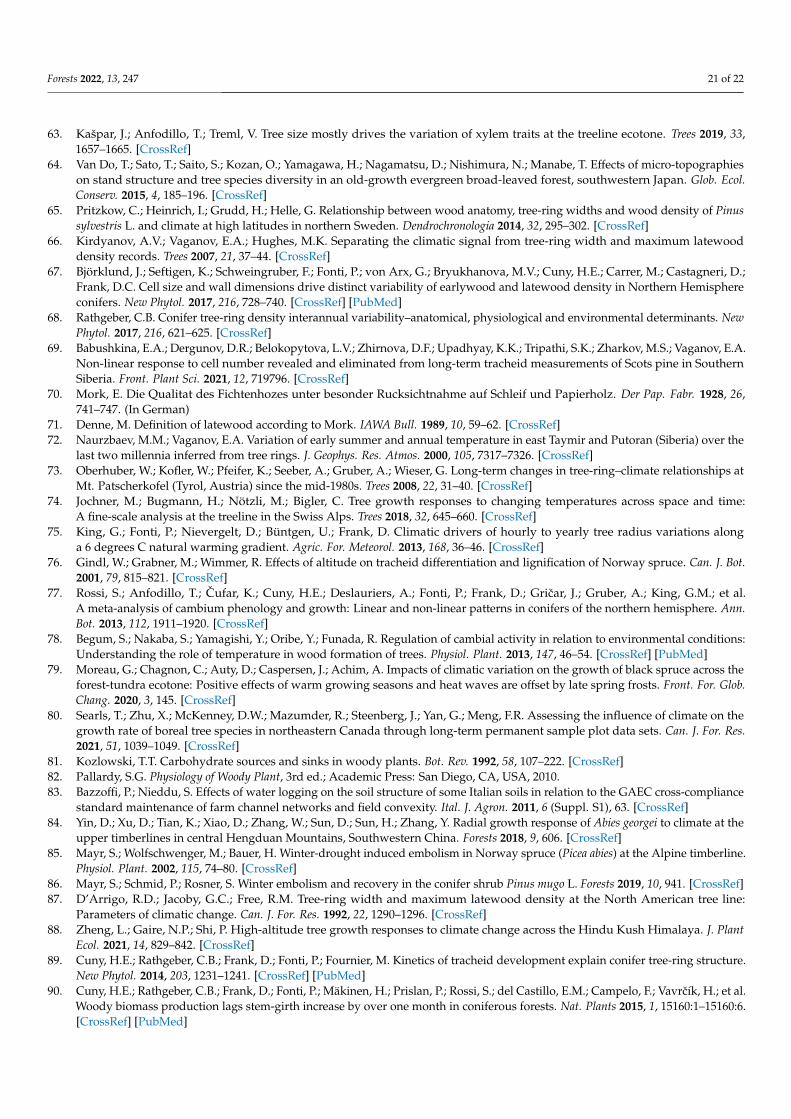
Forests 2022, 13, 247 21 of 22
63. Kašpar, J.; Anfodillo, T.; Treml, V. Tree size mostly drives the variation of xylem traits at the treeline ecotone. Trees 2019, 33,1657–1665. [CrossRef]
64. Van Do, T.; Sato, T.; Saito, S.; Kozan, O.; Yamagawa, H.; Nagamatsu, D.; Nishimura, N.; Manabe, T. Effects of micro-topographieson stand structure and tree species diversity in an old-growth evergreen broad-leaved forest, southwestern Japan. Glob. Ecol.Conserv. 2015, 4, 185–196. [CrossRef]
65. Pritzkow, C.; Heinrich, I.; Grudd, H.; Helle, G. Relationship between wood anatomy, tree-ring widths and wood density of Pinussylvestris L. and climate at high latitudes in northern Sweden. Dendrochronologia 2014, 32, 295–302. [CrossRef]
66. Kirdyanov, A.V.; Vaganov, E.A.; Hughes, M.K. Separating the climatic signal from tree-ring width and maximum latewooddensity records. Trees 2007, 21, 37–44. [CrossRef]
67. Björklund, J.; Seftigen, K.; Schweingruber, F.; Fonti, P.; von Arx, G.; Bryukhanova, M.V.; Cuny, H.E.; Carrer, M.; Castagneri, D.;Frank, D.C. Cell size and wall dimensions drive distinct variability of earlywood and latewood density in Northern Hemisphereconifers. New Phytol. 2017, 216, 728–740. [CrossRef] [PubMed]
68. Rathgeber, C.B. Conifer tree-ring density interannual variability–anatomical, physiological and environmental determinants. NewPhytol. 2017, 216, 621–625. [CrossRef]
69. Babushkina, E.A.; Dergunov, D.R.; Belokopytova, L.V.; Zhirnova, D.F.; Upadhyay, K.K.; Tripathi, S.K.; Zharkov, M.S.; Vaganov, E.A.Non-linear response to cell number revealed and eliminated from long-term tracheid measurements of Scots pine in SouthernSiberia. Front. Plant Sci. 2021, 12, 719796. [CrossRef]
70. Mork, E. Die Qualitat des Fichtenhozes unter besonder Rucksichtnahme auf Schleif und Papierholz. Der Pap. Fabr. 1928, 26,741–747. (In German)
71. Denne, M. Definition of latewood according to Mork. IAWA Bull. 1989, 10, 59–62. [CrossRef]72. Naurzbaev, M.M.; Vaganov, E.A. Variation of early summer and annual temperature in east Taymir and Putoran (Siberia) over the
last two millennia inferred from tree rings. J. Geophys. Res. Atmos. 2000, 105, 7317–7326. [CrossRef]73. Oberhuber, W.; Kofler, W.; Pfeifer, K.; Seeber, A.; Gruber, A.; Wieser, G. Long-term changes in tree-ring–climate relationships at
Mt. Patscherkofel (Tyrol, Austria) since the mid-1980s. Trees 2008, 22, 31–40. [CrossRef]74. Jochner, M.; Bugmann, H.; Nötzli, M.; Bigler, C. Tree growth responses to changing temperatures across space and time:
A fine-scale analysis at the treeline in the Swiss Alps. Trees 2018, 32, 645–660. [CrossRef]75. King, G.; Fonti, P.; Nievergelt, D.; Büntgen, U.; Frank, D. Climatic drivers of hourly to yearly tree radius variations along
a 6 degrees C natural warming gradient. Agric. For. Meteorol. 2013, 168, 36–46. [CrossRef]76. Gindl, W.; Grabner, M.; Wimmer, R. Effects of altitude on tracheid differentiation and lignification of Norway spruce. Can. J. Bot.
2001, 79, 815–821. [CrossRef]77. Rossi, S.; Anfodillo, T.; Cufar, K.; Cuny, H.E.; Deslauriers, A.; Fonti, P.; Frank, D.; Gricar, J.; Gruber, A.; King, G.M.; et al.
A meta-analysis of cambium phenology and growth: Linear and non-linear patterns in conifers of the northern hemisphere. Ann.Bot. 2013, 112, 1911–1920. [CrossRef]
78. Begum, S.; Nakaba, S.; Yamagishi, Y.; Oribe, Y.; Funada, R. Regulation of cambial activity in relation to environmental conditions:Understanding the role of temperature in wood formation of trees. Physiol. Plant. 2013, 147, 46–54. [CrossRef] [PubMed]
79. Moreau, G.; Chagnon, C.; Auty, D.; Caspersen, J.; Achim, A. Impacts of climatic variation on the growth of black spruce across theforest-tundra ecotone: Positive effects of warm growing seasons and heat waves are offset by late spring frosts. Front. For. Glob.Chang. 2020, 3, 145. [CrossRef]
80. Searls, T.; Zhu, X.; McKenney, D.W.; Mazumder, R.; Steenberg, J.; Yan, G.; Meng, F.R. Assessing the influence of climate on thegrowth rate of boreal tree species in northeastern Canada through long-term permanent sample plot data sets. Can. J. For. Res.2021, 51, 1039–1049. [CrossRef]
81. Kozlowski, T.T. Carbohydrate sources and sinks in woody plants. Bot. Rev. 1992, 58, 107–222. [CrossRef]82. Pallardy, S.G. Physiology of Woody Plant, 3rd ed.; Academic Press: San Diego, CA, USA, 2010.83. Bazzoffi, P.; Nieddu, S. Effects of water logging on the soil structure of some Italian soils in relation to the GAEC cross-compliance
standard maintenance of farm channel networks and field convexity. Ital. J. Agron. 2011, 6 (Suppl. S1), 63. [CrossRef]84. Yin, D.; Xu, D.; Tian, K.; Xiao, D.; Zhang, W.; Sun, D.; Sun, H.; Zhang, Y. Radial growth response of Abies georgei to climate at the
upper timberlines in central Hengduan Mountains, Southwestern China. Forests 2018, 9, 606. [CrossRef]85. Mayr, S.; Wolfschwenger, M.; Bauer, H. Winter-drought induced embolism in Norway spruce (Picea abies) at the Alpine timberline.
Physiol. Plant. 2002, 115, 74–80. [CrossRef]86. Mayr, S.; Schmid, P.; Rosner, S. Winter embolism and recovery in the conifer shrub Pinus mugo L. Forests 2019, 10, 941. [CrossRef]87. D’Arrigo, R.D.; Jacoby, G.C.; Free, R.M. Tree-ring width and maximum latewood density at the North American tree line:
Parameters of climatic change. Can. J. For. Res. 1992, 22, 1290–1296. [CrossRef]88. Zheng, L.; Gaire, N.P.; Shi, P. High-altitude tree growth responses to climate change across the Hindu Kush Himalaya. J. Plant
Ecol. 2021, 14, 829–842. [CrossRef]89. Cuny, H.E.; Rathgeber, C.B.; Frank, D.; Fonti, P.; Fournier, M. Kinetics of tracheid development explain conifer tree-ring structure.
New Phytol. 2014, 203, 1231–1241. [CrossRef] [PubMed]90. Cuny, H.E.; Rathgeber, C.B.; Frank, D.; Fonti, P.; Mäkinen, H.; Prislan, P.; Rossi, S.; del Castillo, E.M.; Campelo, F.; Vavrcík, H.; et al.
Woody biomass production lags stem-girth increase by over one month in coniferous forests. Nat. Plants 2015, 1, 15160:1–15160:6.[CrossRef] [PubMed]
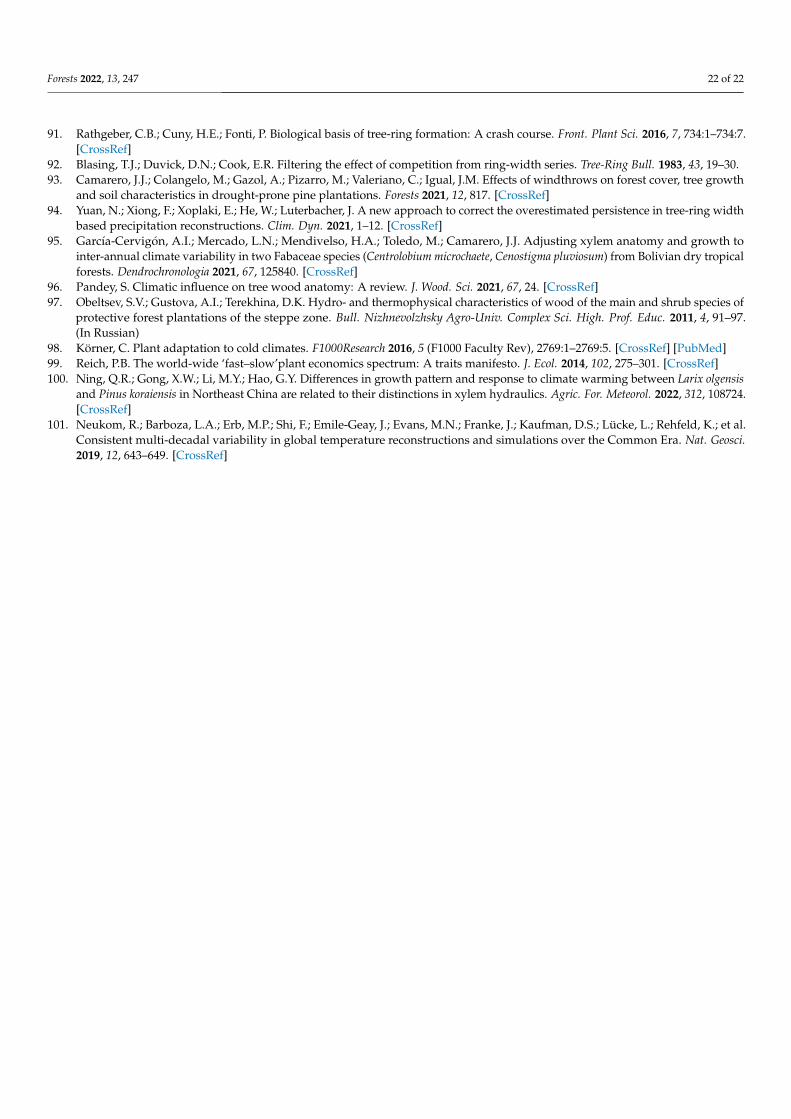
Forests 2022, 13, 247 22 of 22
91. Rathgeber, C.B.; Cuny, H.E.; Fonti, P. Biological basis of tree-ring formation: A crash course. Front. Plant Sci. 2016, 7, 734:1–734:7.[CrossRef]
92. Blasing, T.J.; Duvick, D.N.; Cook, E.R. Filtering the effect of competition from ring-width series. Tree-Ring Bull. 1983, 43, 19–30.93. Camarero, J.J.; Colangelo, M.; Gazol, A.; Pizarro, M.; Valeriano, C.; Igual, J.M. Effects of windthrows on forest cover, tree growth
and soil characteristics in drought-prone pine plantations. Forests 2021, 12, 817. [CrossRef]94. Yuan, N.; Xiong, F.; Xoplaki, E.; He, W.; Luterbacher, J. A new approach to correct the overestimated persistence in tree-ring width
based precipitation reconstructions. Clim. Dyn. 2021, 1–12. [CrossRef]95. García-Cervigón, A.I.; Mercado, L.N.; Mendivelso, H.A.; Toledo, M.; Camarero, J.J. Adjusting xylem anatomy and growth to
inter-annual climate variability in two Fabaceae species (Centrolobium microchaete, Cenostigma pluviosum) from Bolivian dry tropicalforests. Dendrochronologia 2021, 67, 125840. [CrossRef]
96. Pandey, S. Climatic influence on tree wood anatomy: A review. J. Wood. Sci. 2021, 67, 24. [CrossRef]97. Obeltsev, S.V.; Gustova, A.I.; Terekhina, D.K. Hydro- and thermophysical characteristics of wood of the main and shrub species of
protective forest plantations of the steppe zone. Bull. Nizhnevolzhsky Agro-Univ. Complex Sci. High. Prof. Educ. 2011, 4, 91–97.(In Russian)
98. Körner, C. Plant adaptation to cold climates. F1000Research 2016, 5 (F1000 Faculty Rev), 2769:1–2769:5. [CrossRef] [PubMed]99. Reich, P.B. The world-wide ‘fast–slow’plant economics spectrum: A traits manifesto. J. Ecol. 2014, 102, 275–301. [CrossRef]100. Ning, Q.R.; Gong, X.W.; Li, M.Y.; Hao, G.Y. Differences in growth pattern and response to climate warming between Larix olgensis
and Pinus koraiensis in Northeast China are related to their distinctions in xylem hydraulics. Agric. For. Meteorol. 2022, 312, 108724.[CrossRef]
101. Neukom, R.; Barboza, L.A.; Erb, M.P.; Shi, F.; Emile-Geay, J.; Evans, M.N.; Franke, J.; Kaufman, D.S.; Lücke, L.; Rehfeld, K.; et al.Consistent multi-decadal variability in global temperature reconstructions and simulations over the Common Era. Nat. Geosci.2019, 12, 643–649. [CrossRef]
Copyright © 2022 FDOKUMEN