Metabolic, physiological and anatomical responses of ...
27
Page 1/27 Metabolic, physiological and anatomical responses of soybean plants under water decit and high temperature condition Roberto Gomes Vital Federal Institute of Science and Technology Goiano – Campus Rio Verde Caroline Müller Federal Institute of Science and Technology Goiano – Campus Rio Verde Francisco Bruno Silva Freire Federal University of Ceará Fábia Barbosa Silva Federal Institute of Science and Technology Goiano – Campus Rio Verde Priscila Ferreira Batista Federal Institute of Science and Technology Goiano – Campus Rio Verde David Fuentes The University of Sydney Arthur Almeida Rodrigues Federal Institute of Science and Technology Goiano – Campus Rio Verde Luciana Minervina Freitas Moura Federal Institute of Science and Technology Goiano – Campus Rio Verde Danilo Menezes Daloso Federal University of Ceará Adinan Alves Silva Federal Institute of Science and Technology Goiano – Campus Rio Verde Andrew Merchant The University of Sydney Alan Carlos Costa ( [email protected] ) Federal Institute of Science and Technology Goiano – Campus Rio Verde Research Article Keywords: Gas exchange, Glycine max, heat stress, metabolic networks, plant systems biology Posted Date: February 11th, 2022 DOI: https://doi.org/10.21203/rs.3.rs-1317816/v1
-
Upload
khangminh22 -
Category
Documents
-
view
0 -
download
0
Transcript of Metabolic, physiological and anatomical responses of ...

Page 1/27
Metabolic, physiological and anatomical responsesof soybean plants under water de�cit and hightemperature conditionRoberto Gomes Vital
Federal Institute of Science and Technology Goiano – Campus Rio VerdeCaroline Müller
Federal Institute of Science and Technology Goiano – Campus Rio VerdeFrancisco Bruno Silva Freire
Federal University of CearáFábia Barbosa Silva
Federal Institute of Science and Technology Goiano – Campus Rio VerdePriscila Ferreira Batista
Federal Institute of Science and Technology Goiano – Campus Rio VerdeDavid Fuentes
The University of SydneyArthur Almeida Rodrigues
Federal Institute of Science and Technology Goiano – Campus Rio VerdeLuciana Minervina Freitas Moura
Federal Institute of Science and Technology Goiano – Campus Rio VerdeDanilo Menezes Daloso
Federal University of CearáAdinan Alves Silva
Federal Institute of Science and Technology Goiano – Campus Rio VerdeAndrew Merchant
The University of SydneyAlan Carlos Costa ( [email protected] )
Federal Institute of Science and Technology Goiano – Campus Rio Verde
Research Article
Keywords: Gas exchange, Glycine max, heat stress, metabolic networks, plant systems biology
Posted Date: February 11th, 2022
DOI: https://doi.org/10.21203/rs.3.rs-1317816/v1

Page 2/27
License: This work is licensed under a Creative Commons Attribution 4.0 International License. Read Full License

Page 3/27
AbstractWater de�cit (WD) combined with high temperature (HT) is the major factor limiting agriculturalworldwide, and it is predicted to become worse according to current climate change scenario. It is thusimportant to understand how current cultivated crops respond to these stress conditions. Here weinvestigated how four soybean cultivars respond to WD and HT isolated or in combination at metabolic,physiological, and anatomical levels. The WD+HT increased the level of stress in soybean plants, whencompared to plants under well-watered (WW), WD or HT conditions. WD+HT exacerbate the increases inascorbate peroxidase activity, which was associated with greater photosynthetic rate in two cultivarsunder WD+HT. The metabolic responses to WD+HT diverge substantially from plants under WW, WD orHT conditions. Myo-inositol and maltose were identi�ed as WD+HT biomarkers and were connected tosubnetworks composed by catalase, amino acids and both root and leaf osmotic potentials. Correlation-based network analyses highlight that the network heterogeneity increased and a higher integrationamong metabolic, physiological and morphological nodes is observed under stress conditions. Beyondunveiling biochemical and metabolic WD+HT biomarkers, our results collectively highlight that themechanisms behind the acclimation to WD+HT cannot be understood by investigating WD or HT stressseparately.
IntroductionSoybean (Glycine max (L.) Merr.) is an economically important crop worldwide. Breeding programs overthe last century have resulted in highly productive soybean cultivars that are adapted to distinctenvironmental conditions. However, increasing climate instability, which is predicted to directly alter bothrainfall and environmental temperature, have raised concern regarding the maintenance of soybean cropyield 1–3. Periodic temperature increases at critical stages of soybean development associated with lowerrainfall have been reported in various continents. In Brazil, one of the major soybean productors, thereduced yield of soybean cultivated in the Central-West region in 2018/2019 was associated with anincrease of up to 3 ºC above of the average temperature normally found in this area 4,5. This highlightshow climate change may affect soybean production in tropical areas, which has clear impacts worldwide.Thus, understanding the mechanisms by which plants acclimate to water de�cit (WD) combined withhigh temperature (HT) is crucial for identifying stress tolerant cultivars and to pave the way for obtainingsoybean cultivars with higher productivity under combined WD and HT stress conditions.
Plant stress responses involve the modulation of a complex network that leads to molecular,physiological and/or morphological alterations in the plant according to the intensity of the stress level6,7. In general, plant acclimation to WD initially includes the activation of mechanisms such as abscisicacid-mediated stomatal closure and osmotic adjustment through the accumulation of severalosmoprotective compounds, such as sugars, sugar-alcohols and amino acids 8–12. The combination ofthese and several other hormonals, hydraulic, signaling and antioxidant mechanisms triggered by WD areimportant to minimize deleterious effects caused by the stress and to maintain cell turgor and plant

Page 4/27
growth 13–15. Under HT conditions, sucrose accumulation has also been described as importantcomponent of osmotic adjustment 16. Furthermore, it has been shown that amphiphilic molecules suchas proline and sugar alcohols act in the stabilization of cellular structures protecting cell membranesaffected by heat stress 17. It seems likely therefore that plant responses to heat stress have certainsimilarities with drought. However, drought is commonly associated to HT under �eld condition andevidence highlights that the metabolic responses to the combination of both stresses is substantiallydifferent from drought or heat stress separately 18. It is thus important to investigate both stressescombined to unveil which mechanisms confer higher plasticity or higher tolerance to the combination ofWD and HT stresses.
Soil water availability is generally reduced as temperature increases. Under these conditions, stomatalclosure is an important response to avoid excessive water loss, but as consequence this reduces CO2
�xation mediated by ribulose-1,5-bisphosphate carboxylase/oxygenase activity 19. Additionally, thermalstress reduces CO2 solubility and increase the permeability of the thylakoid membranes, favoring O2
�xation and thus photorespiration and destabilizing the photosynthetic electron transport chain 20. Thisleads to an energy imbalance promoted by excessive light absorption, which increase the production ofoxidizing compounds such as reactive oxygen species (ROS), causing oxidative damage to lipids andmembrane proteins 21. As a defense mechanism, plants acclimate to combined WD and HT activatingenzymatic mechanisms of the antioxidant defense system to remove excess of ROS. This includesincrease in the activity of superoxide dismutase (SOD), catalase (CAT), ascorbate peroxidase (APX) andperoxidase (POD) 22 as well as the activation of non-enzymatic ROS scavenging mechanisms such asthe synthesis of ascorbate 23 and �avonoids/anthocyanins 24. These mechanisms have been highlightedas important to the tolerance of HT and WD by plants 25. For instance, increased antioxidant enzymeactivity was observed in the WD tolerant canola variety 26 and in heat stress-tolerant chicken grass plants27. However, it is still unclear whether the antioxidant system is an active response or passiveconsequence of soybean acclimation to WD+HT.
Several examples in the literature highlight that identifying drought stress tolerant genotypes iscommonly achieved at the expense of photosynthetic rate, growth and/or yield under non-adverse and/orstress conditions 28–30. However, given current and projected demand for food production, genotypes thatmaintain high photosynthetic performance under the combination of WD and HT without severe penaltiesin yield under both non-adverse and stressed conditions are desirable 31. The major challenge for plantscientists is thus to fully comprehend the trade-off among yield and (a)biotic stress tolerance in order tosuccessfully manipulate plant metabolism toward simultaneous plant growth and stress toleranceimprovements 32,33. This challenge is higher when the combination of WD and HT are considered, giventhat the effects of these stresses combined can exacerbate damage to metabolism, reducing crop growthand yield 34,35. Furthermore, studies integrating physiological, morphoanatomical and metabolicresponses of plants exposed to combined stress are scarce, which hampers our understandingconcerning the modulation of the entire plant network under WD+HT. In order to address this gap, we

Page 5/27
used an integrative approach to investigate physiological, morphoanatomical and metabolic responsesof four soybean cultivars subjected to WD and HT in isolated or combined conditions. The results arediscussed in the context on the importance in considering investigating WD and HT combined to unveilthe mechanisms by which plants acclimate under these stress conditions.
MethodsExperimental conditions and experimental design. Soybean cultivars NS7209 IPRO (Nidera Seeds, SãoPaulo, Brazil), NS7011 IPRO (Nidera Seeds, São Paulo, Brazil), Desa�o 8473 RSF (Brasmax Seeds, PassoFundo, Brazil) and 7739 M IPRO (Monsoy Seeds, São Paulo, Brazil) were grown in growth chambers(Instalafrio, Pinhais, PR, Brazil) with controlled conditions of relative humidity (~65%), irradiance (~650µmol m−2 s−1) and temperature (25/20°C, day/night). The four soybean cultivars were selected due totheir characteristics of high productivity, and wide cultivation in Brazil.
Plants were grown in polyethylene pots containing 8 Kg of substrate prepared from Red Latosol (LVdf)soil and sand (2:1). The subtrate used had the following composition: pH CaCl2 – 5.6; P – 0.7 mg dm−3; K
– 13.0 mg dm−3; Ca – 1.54 cmolc dm−3; Mg – 0.22 cmolc dm−3; Al – 0.05 cmolc dm−3; H+ Al – 1.3 cmolcdm−3; S – 3.5 mg dm−3; B – 0.8 mg dm−3; Cu – 1.0 mg dm−3; Fe – 37.8 mg dm−3; Mn – 13.2 mg dm−3; Zn– 0.1 mg dm−3; Na – 6.0 mg dm−3; SB – 58%; CTC – 3.1 cmolc dm−3; organic matter – 109%. Based onthese characteristics, liming was performed using dolomitic limestone, increasing the base saturation to60%. The plants were fertilized with 0.2 g dm−3 of mono-ammonium phosphate (MAP), 0.16 g dm−3 ofpotassium chloride (KCl), 0.18 g dm−3 of potassium sulphate (K2SO4), 0.2 g dm−3 of urea (CH4N2O) and
0.026 g dm−3 of zinc sulfate (ZnSO4), according to the recommendation for Cerrado soils in which
soybean are cultivated 86. Two plants were grown per pot, representing one experimental unit.
Treatments consisted of a combination of two water replacements (100 and 40% of soil holding watercapacity, HWC) and two temperatures (25/20°C or 40/25°C, day/night) imposed at the V3 developmentstage. The control of soil moisture in the pots was done using the gravimetric method, by replacing thewater lost by evapotranspiration in a daily basis. The high temperature (HT) was imposed when theplants reached the water de�cit by gradually increasing from 25 ºC at 10 h until reaching 40 ºC ± 0.5 ºCat 11:30 h, maintained for �ve hours. After this period, the temperature gradually decreased until itreturned to 25 ºC at 18:30 h, repeating this cycle in the following day. Thermal treatments were imposedfor an 8-day period, during which time physiological, biochemical, metabolic and morphoanatomicalevaluations were made.
The experimental design was arranged in randomized blocks, in a factorial design with two waterreplacements (100% and 40% HWC) and two temperatures (25 ºC and 40 ºC), with �ve replicates.
Water relations and leaf temperature. Leaf water potential (Ѱw(am)) was measured using a Scholanderpressure chamber (Model 3005-1412, Soilmoisture Equipment Corp., Goleta, CA, USA). Osmotic leaf

Page 6/27
(Ѱs(leaf)) and root (Ψs(root)) potentials were determined using a vapor pressure osmometer (VAPRO 5600,ELITech, Puteaux, France) and calculated using the Van't Hoff equation, expressed as MPa. Leaftemperature was measured using a digital infrared thermometer (Model TI-920, Instrutherm Ltda, SãoPaulo, SP, Brazil), approximately 15 cm from the leaf limb. The measurements were performed at 09:00 h,with the chamber at 25°C.
Gas exchange and chlorophyll a �uorescence analysis. Gas exchange was measured in fully expandedleaves to determine the photosynthetic rate (A, µmol CO2 m− 2 s− 1), stomatal conductance (gs, mol H2O
m− 2 s− 1), transpiration rate (E, mmol H2O m− 2 s− 1), and the ratio of internal and external CO2
concentration (Ci/Ca). We further estimate intrinsic water-use e�ciency (A/gs) and instantaneouscarboxylation e�ciency (A/Ci,). The measurements were performed using an infrared gas analyzer (IRGA,LI-6400xrt, Licor®, Nebraska, USA), under constant photosynthetically active radiation (PAR, 1000 µmolm− 2 s− 1) at the environmental CO2 concentration (~430 µmol mol− 1), temperature (~25 ºC), and relativehumidity (~65%). Chlorophyll a �uorescence was measured using the IRGA coupled to a leaf chamber�uorometer (6400xt, Licor®, Nebraska, USA). The minimal chlorophyll �uorescence (F0) and maximumquantum yield of photosystem II (PSII) (Fv/Fm) was measured after 30 minutes of dark adaptation. Inlight-adapted leaves, the apparent electron transport rate (ETR), the fraction of opened PSII reactioncenters (qL), the effective quantum yield of PSII (YII), and the yield of non-photochemical quenching(YNPQ) were obtained.
Determination of antioxidant enzyme activities. To determine the activities of superoxide dismutase(SOD), catalase (CAT), ascorbate peroxidase (APX), and total peroxidase (POX), fresh leaf tissue washomogenized in potassium phosphate buffer solution (pH 6.8). SOD activity was determined bymeasuring the ability to photochemically reduce p-nitrotetrazolium blue (NBT), at 560 nm in aspectrophotometer (Evolution 60S, Thermo Fisher Scienti�c Inc., MA, USA), according to (Del Longo et al.,1993), considering that one SOD unit was de�ned as the amount of enzyme required to inhibit NBTphotoreduction by 50%. CAT activity was assayed according to the method described byHavir andMcHale 88 and calculated as the rate of hydrogen peroxide (H2O2) decomposition at 240 nm for 3 min at
25 ºC, using a molar extinction coe�cient of 36 M−1 cm−1. APX activity was determined accordingtoNakano and Asada 89 and was measured as the rate of ascorbate oxidation at 290 nm within 1 min at25°C, using a molar extinction coe�cient of 0.0028 M−1 cm−1. POX activity was measured following themethod described by Kar and Mishra 90. Purpurogallin production was determined by increasing theabsorbance of reaction at 420 nm for 1 min at 25°C, using the extinction coe�cient of 2.47 mM−1 cm−1
91. Enzyme activity was expressed based on protein, the concentration of which was determinedaccording to the Bradford method.
Leaf morphoanatomical characterization. Samples (~3 cm2) from the middle region of the last fullyexpanded leaf were collected and �xed in Karnovsky solution. After 24 h, the material was pre-washed inphosphate buffer and dehydrated in a gradual ethyl alcohol series, pre-in�ltered and in�ltered in

Page 7/27
historesin (Leica, Germany), according to the manufacturer’s recommendation. Samples were thentransversely sectioned to 5-µm thickness in a rotating microtome (1508R model, Logen Scienti�c, China).Sections were stained with toluidine blue (0.05% in 0.1 M phosphate buffer, pH 6.8) and anatomicalobservations of adaxial and abaxial epidermis, palisade and spongy parenchyma and mesophyll weremade using images photographed with an Olympus microscope (BX61, Olympus, Tokyo, Japan) coupledto a DP-72 camera using the light-�eld option. The micromorphometry measurements were obtained fromthe previous images using ImageJ software (Image Processing and Analysis in Java, v.147, USA). Tenobservations per replicate were measured for each structure evaluated.
Growth analysis. Growth parameters such as plant height (PH, cm), stem diameter (SD, mm), and leafarea (LA) were determined. Shoot (leaves and stem) and roots were separated and dried at 65 ºC for 72 hto obtain the shoot dry matter (SDM, g) and root dry matter (RDM, g). The ration RDM/SDM were alsocalculated.
Metabolic extraction and analysis. Leaf samples were collected and immediately immersed in liquidnitrogen, and later homogenized and lyophilized. For metabolites extraction, the samples were microwavedried to prevent metabolic turnover92 and then approximately 40 mg of dry leaf samples was extracted inmethanol/chloroform/water (12:5:3, v/v/v) at 75 ºC for 30 min. The water fraction of the extractionmixture consisted of a 0.1% solution of internal standard. Samples were centrifuged and thesupernatants were collected and mixed to chloroform and Milli-Q water to facilitate phase separation.The water–methanol soluble fractions were collected and stored at -20 ºC for further analysis.
Analysis of soluble carbohydrates, sugars and organic acids were performed using gas chromatography(Agilent 7890A) coupled to triple quadrupole mass spectrometer (7000 Agilent Technologies Inc, SantaClara, CA, USA). A HP5 column (0.25-mm internal diameter, 30-m long, 0.25-µm �lm thickness) was usedfor chromatographic separation. Extracts were dried down in a SpeedVac and resuspended in 400ul ofanhydrous pyridine. Samples were then derivatised using a 1:10 mixture of N,O-Bis(trimethylsilyl)tri�uoroacetamide (BSTFA): trimethylcholorsilane (TMCS). Samples were incubated for35 min at 75 ºC and were analysed using GC-MS within 24 h. A 20:1 split injection was made at 300 ºCinitial oven temperature program of 60 ºC for 2 min, ramping to 220 ºC at 10 ºC min−1 (hold for 5 min)then ramping at 10 ºC min−1 to 300 ºC (hold for 5 min). Peak integration was made using AgilentMassHunter software (Agilent). A mixed standard was made from a stock solution containing 500 µgmL−1 of each analyte. Appropriate aliquots were taken to make standard concentrations between 0.5 and50 µg mL−1. The results were expressed based on dry weight.
Analysis of amino acids was performed using the underivatized extracts on a 1290 In�nity liquidchromatography (LC)-MS system (6520 QTOF, Agilent Technologies Inc, Santa Clara, CA, USA). A 3.5 µLsample was injected into a Zorbax SB-C18 column (2.1 x 150 mm, 3.5 µm) and separation was achievedby gradient elution with water and methanol. The QTOF was tuned to operate at low-mass range (<1700AMU). Data acquisition was performed in scan mode (60–1700 m/z) and ionization performed inpositive ion mode. LC-MS results were identi�ed based on their retention times relative to standards as

Page 8/27
well as their formula mass. Peaks were integrated and their relative quantities were calculated usingMassHunter software (Agilent®). A mixed standard was made from a stock solution containing 500 µgmL− 1 of each analyte. The solutions were kept frozen at -20 ºC. Appropriate aliquots are taken to makeresulting standard concentrations between 0.1 to 20 µg mL− 1. The results were expressed based on dryweight.
Metabolic network analysis. Metabolomics and physiological parameters data were used to createcorrelation-based networks, in which the nodes are the metabolites and the links are the strength ofdebiased sparse partial correlation (DSPC) coe�cient (r) 93. The correlation-based networks were createdby using Metscape on CYTOSCAPE94,95 and limiting the signi�cance of correlation between nodes to P <0.05 or by restricting r values to -0.5 < r > 0.5 96. The parameters network density, network heterogeneityand network centralization were obtained using the java plugin NetworkAnalyzer on CYTOSCAPEsoftware 97.
Statistical analysis. The data were subjected to factorial analysis of variance and the means werecompared using the Tukey test (p < 0.05), using Analysis System Program Variance (SISVAR, version 5.4).The metabolomics data were analysed by multivariate analysis such as partial least square-discriminantanalysis (PLS-DA) and biomarker analysis based on receiver operating characteristic (ROC) curves usingthe MetaboAnalyst platform 98. These metabolic analyses were normalized by using Log and Auto-scaling transformations on MetaboAnalyst.
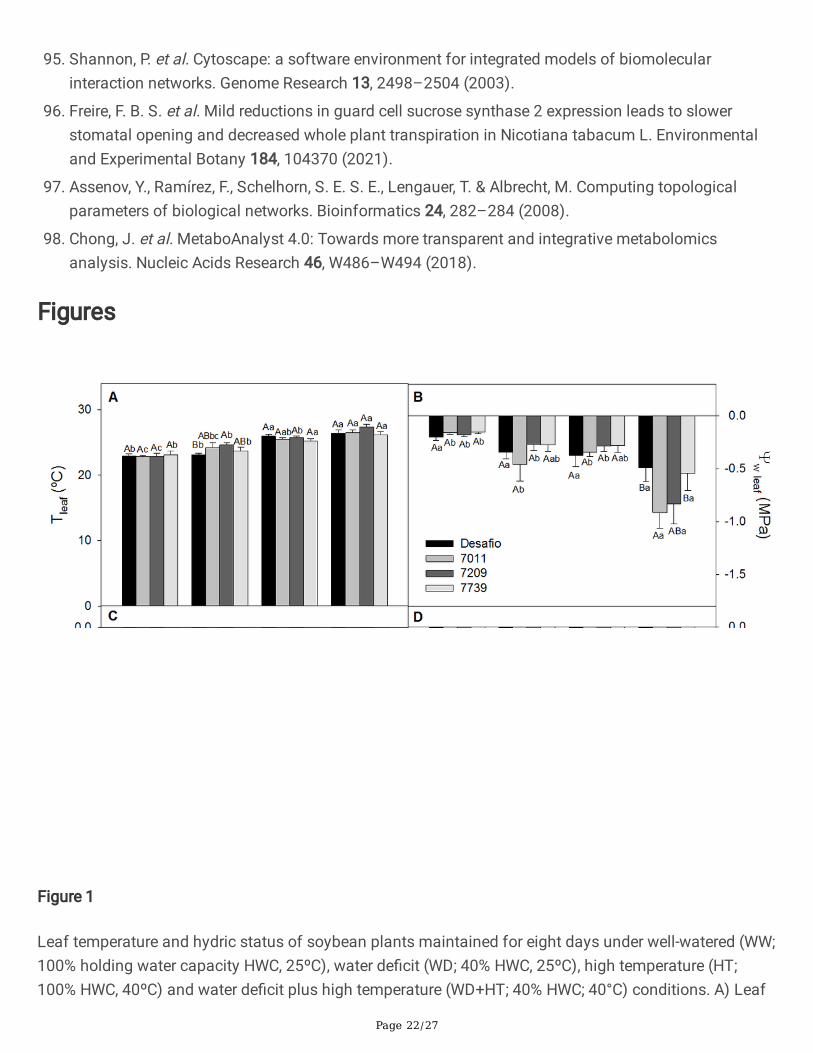
ResultsThe combination of water de�cit and high temperature exacerbate stress-induced physiological changes.Increases in leaf temperature were recorded under all stress treatments, with increments up to 3.71°C inWD+HT-treated plants compared to WW plants (Figure 1A). Lower values of Ψw(am), Ѱs(leaf) and Ѱs(root)
was observed in plants under WD+HT compared to the WW condition, with no major difference amongthe cultivars under this condition (Figure 1B-D). WD and WD+HT reduced A, gs and E in all soybeancultivars when compared to their respective controls, but this was not re�ected in Ci/Ca ratio (Figure 2A-D). The 7011 and 7209 cultivars showed the lowest values of A, gs and E under WD+HT when comparedto the others cultivars and treatments. (Figure 2A-C). The intrinsic water-use e�ciency (iWUE - A/gs)increased in WD and WD+HT treatments, but no major differences among the cultivars was observed(Figure 2E). The A/Ci ratio decreased mainly in 7011 and 7209 cultivars under WD+HT (Figure 2F). Theimpact of the stress on gas exchange parameters did not resemble those related to leaf temperature andhydric status. It appears that the reductions in gas exchange parameters observed under WD+HT aremost associated to WD rather than the HT effect.
The minimum �uorescence (F0) and the maximum quantum yield of PSII (Fv/Fm) presented higher andlower values in response to WD+HT, compared to other treatments (Figures 3A-B). The effective quantumyield of PSII (YII), coe�cient quenching (qL), electron transport rate (ETR) and the yield of non-

Page 9/27
photochemical quenching (YNPQ) showed signi�cant interaction between cultivation conditions andcultivars (Figure 3). YII and ETR values were reduced due to combined stress for cultivars 7011 and 7209(Figure 3C, 3E). YNPQ increased for Desa�o, 7011 and 7739 cultivars in response to HT treatment (Figure3F). Under WD+AT, all cultivars increased YNPQ, but more pronounced for 7209 and 7011 (Figure 3F).
Antioxidant enzyme activity under stress conditions. SOD activity was higher in cultivar 7011 under WD,cultivar 7739 under HT, and cultivar 7209 exposed to WD+HT (Figure 4A). Under WD, the Desa�o, 7209and 7739 cultivars presented higher APX activities, while in the WD+HT treatment the Desa�o and 7739cultivars had higher values of APX activity (Figure 4B). Lower APX activity was observed in the cultivar7011 under WD and WD+HT conditions. POX activity increased in all treatments, especially in WD+HT(Figure 4C). Greater CAT activities were observed in plants exposed to WD, followed by WD+HT treatment(Figure 4D). In summary, the activity of antioxidant enzymes differs among the stress conditions, inwhich CAT and APX activities increased mainly under WD and WD+HT, respectively.
Impact of water de�cit combined with high temperature on leaf anatomy and plant growth. HT increasedthe thickness of both palisade and spongy parenchymas in Desa�o and 7011 cultivars, which leads to anincrease in mesophyll cells and leaf thickness, mainly in 7011 (Supplementary Figure S1 online). WD+HTtreatment reduced mesophyll, and palisade and spongy parenchymas thickness in the cultivar 7011(Supplementary Figure S1A-C online), and resulted in smaller leaf thickness compared to the othercultivars (Supplementary Figure S1D online). Higher adaxial and abaxial epidermis thickness wereobserved for the cultivar 7011 and lower values for 7209, both exposed to WD treatment (SupplementaryFigure S1E-F online).
Plant height (PH) showed lower values when exposed to WD and WD+HT (Supplementary Figure S2Aonline), being more pronounced in Desa�o and 7739 cultivars. HT treatment promoted an increase instem diameter (SD, Supplementary Figure S2B online) in 7011 and 7739. Cultivars 7011 and 7739presented larger leaf areas (LA) when subjected to HT (Supplementary Figure S2C online), while LA wasreduced in cultivar 7011 exposed to WD. Shoot dry matter (SDM) was increased in cultivars 7011 and7739 in HT condition, and reduced in cultivar 7011 under WD+HT (Supplementary Figure S2D online).Reductions in root dry mass (RDM) were observed in all treatments (Supplementary Figure S2E online),while for RDM/SDM was reduced only in HT- and WD+HT-treated plants (Supplementary Figure S2Fonline).
Soybean metabolic responses to water de�cit, high temperature and the combination of both stresses.Thirty metabolites pertaining to the classes of sugars, amino acids, organic acids and others wereidenti�ed in all treatments (Figure 5A) and used for multivariate and correlation-based network analyses.The partial least square discriminant analysis (PLS-DA) combining the data of each treatment from allcultivars revealed that WD and HT treatments were slightly separated from WW, whilst WD+HT is clearlythe most different treatment at metabolic level. This is evidenced by the separation of WD+HT from theother treatments by the �rst component, that represents 45.8% of the variability of the model (Figure 5B).Fifteen metabolites were found with VIP score higher than 1, meaning that they greatly contribute to the

Page 10/27
discrimination found in the PLS-DA model. Most of them are amino acids and have higher accumulationin WD+HT compared to WW, WD and HT treatments (Figure 5C). Surprisingly, very few signi�cantcorrelations were observed among the metabolites in each treatment, leading to correlation-basednetworks that were poorly connected (Supplementary Figure S4 online). However, WD and WD+HT havemetabolic networks with higher density, as compared to WW (Supplementary Table S1 online).Additionally, increased network heterogeneity and decreased network centralization was observed in allstress treatments compared to WW (Supplementary Table S1 online).
We next investigated which metabolites are biomarkers of each stress condition. A total of 21, 23, and 27metabolites were identi�ed as biomarkers of WD, HT and WD+HT stress conditions, respectively (Figure 6;Supplementary Figures S5-S6 online). Among them, only ribose was identi�ed as biomarker withdecreased content in all stress conditions (Supplementary Figure S7 online), whilst several amino acidsplus pinitol and D-chiro-inositol were identi�ed as biomarkers and with increased content in all stressconditions (Supplementary Figure S7 online). Interestingly, myo-inositol was found as WD and WD+HTbiomarker, but with increased and decreased content in WD and WD+HT, respectively, compared to WWconditions (Supplementary Figure S7 online). Similarly, GABA (gamma-aminobutyric acid) wassimultaneously found as biomarker of both HT and WD, but with increased and decreased content underHT and WD, respectively (Supplementary Figure S7 online). Sucrose and proline, two importantosmoprotective compounds, were found as biomarkers with increased content under both HT andWD+HT, compared to WW condition (Supplementary Figure S7 online).
Cultivar-speci�c stress metabolic responses. We next analysed the effect of the stress treatments in eachcultivar at metabolic level. The PLS-DA results resemble the general ones described above, in whichWD+HT treatment is clearly separated from the other treatments in each cultivar (Figures 6A-D).Regarding the VIP scores of this analysis, 15, 16, 16 and 14 metabolites have VIP scores higher than 1 in7011, 7209, 7739 and Desa�o cultivars, respectively (Figure 6E-H). Ten of these metabolites are commonamong all cultivars, including seven amino acids (His, Leu, Ile, Val, Trp, Asn and Gln) plus pinitol, sucroseand glucose (Supplementary Figure S8 online).
Integrating metabolomics with physiological parameters. We next integrated all data and compared thetreatments by multivariate and correlation-based network analyses. PLS-DA analysis using all datarevealed the same pattern previously observed using the metabolic data, in which WD+HT is separatedfrom all other conditions by the �rst component, whilst HT was separated from WW and WD by thesecond component (Figure 7). Network analysis revealed that the nodes are displaced into severalsubnetworks in all conditions. The subnetworks are mostly composed by nodes of the same scale ofobservation. For instance, nodes related to photochemical reactions (e.g. Fv/Fm, qL and F0) are connectedto each other but not to any other parameter of the network. This is also observed for growth and gasexchange parameters, especially under WW conditions (Figure 8A). However, certain metabolites areconnected to important physiological parameters. For example, malate is negatively correlated to leaftemperature and Tyr and Gln are positively correlated with number of nodes and leaf area, respectively,under WW condition (Figure 8A). By contrast, Gln is connected in a subnetwork that contains root Ψs and

Page 11/27
the DW ratios of root/shoots and shoots/roots under WD (Figure 8B). Furthermore, whilst A/E was solelyconnected to E under WW and HT conditions (Figure 8A,C), A/E was positively correlated to Ψp under WDcondition (Figure 8B).
Under WD+HT condition, A/E is part of a subnetwork composed by iWUE, Ci, Ci/Ca, APX and themetabolites sucrose, fructose and histidine (Figure 8D). Interestingly, A was not correlated to anyparameter under WW condition, but it was negatively correlated to YNPQ under WD and HT conditions andstrongly and positively correlated to gs under WD+HT condition (Figure 8A-D). Lys was found to be a hubconnecting physiological (Ψw(am), root Ψs, leaf Ψs, plant height and number of nodes) with maltose andamino acids (Val, Leu, Tyr and Thr) under WD+HT condition (Figure 8D). The analysis of the networkparameters revealed slight decreases and increases in network density and centralization under stressconditions, whilst the increase in network heterogeneity was more prominent under all stress treatments(Supplementary Table S1 online).
DiscussionIdentifying the mechanisms that contribute to the acclimation of soybean plants under abiotic stressconditions is pivotal for the selection of tolerant cultivars and to pave the way to obtain new tolerantcultivars through genetic engineering of plant metabolism 36. Here, soybean cultivars showed differentialresponses to WD, HT and the combination of both stress conditions. Lower water potential has beendescribed as a WD tolerance strategy, given that it entails the activation of osmotically compatible solutesynthesis 37, as observed here by the increases in sucrose, proline and sugar alcohols in soybean plantsunder WD and WD+HT. Osmotic adjustment induces increased turgidity of plant cells, maintaining or atleast minimizing the reduction in both plant growth and transpiration38, which, in turn, facilitate soil wateruptake and leaf cooling, crucial for plants under WD and HT conditions. However, stomata, the masterregulator of transpiration and photosynthesis, respond to a wide range of stimulus, not only plant waterstatus 39,40. Thus, despite negatively affecting photosynthetic performance 41, reduced gs, which is
closely associated to lower water potential, can represent a stress-avoidance mechanism 42. Here,stomatal closure limited the transpiration rate of soybean plants, leading to an increase of 3.7 ºC inaverage in leaf temperature under WD+HT conditions. The heat stress per se did not affect thephotosynthetic rate of soybean cultivars, suggesting that drought is a major stress factor forphotosynthetic e�ciency under WD+HT conditions. This idea is supported by the maintenance of A, gs, E,A/Ci, and YII values under HT conditions. Maintaining leaf temperature is further important to avoid
protein denaturation and loss of membrane integrity 43. However, plants need to balance the maintenanceof photosynthesis with lower water loss through transpiration toward iWUE improvement, which wasindeed observed here in soybean plants exposed to WD and WD+HT conditions.
Soybean plants under WD+HT had increased minimum �uorescence (F0) of dark-adapted leaves and
reduced YII values, indicating damage to the antenna complex of the PSII 44. To avoid excess energy-associated oxidative stress, plants generally activate protective mechanisms such as carotenoid

Page 12/27
accumulation 45 and increased NPQ-mediated dissipation 46. Nevertheless, these mechanisms were noteffective in avoiding the reductions observed in YII and ETR, mainly in cultivars 7011 and 7209, inresponse to WD+HT. By contrast, no substantial differences were found in photochemical-relatedparameters in plants under HT conditions. High temperatures are related to an increase membrane�uidity, promoting changes in the assembling of membrane-inserted proteins 47. Maintaining membranestability is an important factor in stress tolerance. Indeed, thermal stress tolerance of Arabidopsis plantshas been attributed by their ability to maintain chloroplast membrane integrity 48.
To avoid stress-induced oxidative imbalances, plants generally increase both the activity of antioxidantenzymes and the thermal dissipation of excess light absorbed via YNPQ. The activation of YNPQ iscompetitive with photochemical processes, meaning that increased YNPQ may be followed by reductions
in photochemical e�ciency 49. For instance, the increase in YNPQ in corn plants exposed to WD was
accompanied by decreases in photosynthesis and plant growth 50. Here, the increase in YNPQ was mainlyobserved in the genotypes 7011 and 7209 under WD+HT. Interestingly, these genotypes have the lowest Aand APX activity under WD+HT. This suggests that they are the most WD+HT-sensitive cultivars, ascompared to Desa�o and 7739. However, no substantial differences in plant growth and plant anatomyparameters were observed between the genotypes. These results indicate that the stress responsesobserved in 7011 and 7209 cultivars were su�cient to avoid deleterious effects on growth during theperiod analysed here. However, higher A and APX activity may confer great advantage for Desa�o and7739 cultivars in longer periods of WD+HT, suggesting that total APX activity is a potential marker forbreeding programs to obtain plants more tolerant to combined stresses. However, given that APX familyis composed by several isoforms that are located in different subcellular localizations and play differentroles under stress conditions 51–53, further studies aiming to unveil the contribution of soybean APXisoforms to WD+HT tolerance are now required to fully comprehend the role of APXs in plantacclimation/tolerance to WD+HT.
Abiotic stresses induce a wide range of metabolic changes in plants, which vary according to the speciesand the level of stress12,54,55. The availability of free amino acids generally increases stress tolerance inplants due to their participation in physiological mechanisms such as osmotic adjustment, ROSdetoxi�cation, intracellular pH regulation and by sustaining alternative mitochondrial respiratorypathways 56–59. Here, PLS-DA and biomarker analyses revealed that several amino acids are implicatedin the soybean responses to WD and HT, in which several of them have increased content in all stressconditions. Among these amino acids, arginine has structural importance for proteins, participates innitrogen re-distribution and is a precursor to the synthesis of polyamines and proline 60. Proline wasfound in the VIP score list of PLS-DA, with a more prominent accumulation under WD+HT followed by WDcondition. Proline accumulation contributes to maintaining the NADP+/NADPH ratio at levels adequatefor cell metabolism 61 and has been shown to be an important osmoregulatory mechanism for soybeanacclimation to WD periods 62. Indeed, proline was directly linked to root osmotic potential in the WDnetwork, highlighting its role as osmo-protectant.

Page 13/27
Glycine is also known to be accumulated in response to WD in plants 29. The level of glycine has beenshown to increase in Solanum lycopersicum exposed to combined heat and salinity stress, acting asosmo-protectant 63. Similarly, increases in levels of aromatic amino acid (tyrosine and tryptophan), asobserved here in soybean plants, were also reported in wheat 64, soybean 29 and chickpea 65 underdrought conditions. These amino acids may act as alternative sources of metabolic energy 65, and playimportant roles in ion transport, maintenance of water balance and elimination of ROS 64. Theantioxidant effect of aromatic amino acids such as histidine prevent the intensi�cation of damage fromstress, as observed in drought-tolerant chickpeas 65. The increase in isoleucine and leucine branchedchain amino acid levels in soybean plants may be a mechanism to provide carbon skeletons forrespiration during stress, as was observed in several other species under different stress conditions,including WD 57,59,66. In addition, increased asparagine content was observed here, which is important formaintaining osmotic pressure and translocating nitrogen 67.
Our results also highlight that glutamine accumulation is important to plants under WD+HT. This aminoacid was found in the PLS-DA VIP score list of all genotypes and identi�ed as a WD+HT biomarker.Glutamine, in addition to its role in nitrogen metabolism, is an e�cient signaling molecule related tometabolic regulation, stimulating defense responses in plants under stress conditions 68. For instance,increased glutamine levels rapidly induced the expression of genes involved in the regulation of stressdefense responses in rice plants 69. Furthermore, glutamine metabolism is closely associated to theproduction of nitric oxide, proline and GABA, that have been described as important components of plantstress responses 15,70. Taken together, our results highlight the important role of amino acid metabolismfor plant stress responses.
Beyond the changes in amino acids, the metabolism of sugars and polyols was altered under stress.Sugars and polyols are important for energy supply and acting as osmoprotectors in plants 64,71. Here, weobserved that soybean cultivars under WD+HT resulted in increased levels mainly of sucrose and pinitol.Sucrose is the main product used in carbon distribution for non-photosynthetic tissues 72, and, as polyols(pinitol and myo-inositol), act in the process of osmotic adjustment and the prevention of oxidativedamage 58,73,74. It´s important to note that we also observed an increase in myo-inositol in WD treatmentbut a decrease under WD+HT in soybean plants. The methylation of pinitol is linked to the S-adenosylmethionine (SAM) cycle 17; thus, the synthesis of pinitol is linked to HT via photorespiration andwould exhibit a demand for myo-inositol to be converted to pinitol in soybean plants. Furthermore,decrease maltose content was identi�ed as WD+HT biomarker and was connected to a subnetworkcomposed by amino acids and both root and leaf osmotic potentials. This suggests that the metabolismof maltose, which is closely associated to hexose and starch, is also important for soybean stressacclimation. This idea is supported by the fact that starch degradation is an important mechanism toprovide substrates for the synthesis of osmo-protectants such as sugars, polyols and proline under WD75,76. Therefore, decreased maltose content may be associated with a redirection of carbon �ux fromstarch synthesis to starch degradation. In turn, starch-derived carbons could be used to sustain the

Page 14/27
synthesis of sugars, polyols and amino acids in a source-limited conditions, i.e., in a period in which thephotosynthetic rate is reduced, as observed in WD+HT conditions.
Stress responses involve changes at different levels, from epigenetic and gene expression to ultimatelyphysiological and anatomical changes. Thus, in order to fully understand plant stress responses, isnecessary to adopt non-reductionist approaches 77,78. Systems biology analysis have the greatadvantage to overcome the barrier imposed by the reductionism perspective that simplify complexmechanisms such as plant stress responses 79,80. This is especially important considering that complexbiological systems are de�ned by non-linear relationships and cannot be interpreted by the sum of theircomponents 81,82. Furthermore, emergent properties, which raise from the interaction among thecomponents of the system, are not visualized by reductionism approaches 83. Taking this into account,we have integrated metabolic, photosynthetic and morpho-anatomical data by multivariate andcorrelation-based network analyses 84. Interestingly, PLS-DA clearly separated the plants under WD+HTfrom plants under WW, WD and HT. This strongly suggests that the combination of both stress factors isan emergent property of the system, in which the metabolic responses to the combination of WD+HTcannot be interpreted by solely summing the responses observed in these stresses separately.
The metabolic network analysis further corroborates this idea, given that the density, centralization andheterogeneity of the metabolic network under WD+HT did not resemble the values observed under thesestresses separately. Interestingly, substantial increases in network heterogeneity were observed in bothmetabolic and global networks under all stress conditions, when compared to WW plants. Additionally,plants under stress have a higher connection among components of different biological levels. Forinstance, whilst the subnetworks were mostly composed by nodes of the same level of organization (i.e.morphological, physiological and metabolic) under WW conditions, the imposition of stress increased theconnectivity of nodes from different levels. This is evidenced by the connections observed betweendifferent amino acids such as Ser, Asp, Leu, Glu, Gln, Arg and Lys that belongs to sub-networks composedby physiological and biochemical parameters under stress. Taken together, these results highlight that thestress conditions used here substantially alter the topology of both metabolic and the global network, inwhich the appearance of hub-like nodes, measured here through network heterogeneity, seem to be aresponse to stress. Higher network heterogeneity highlights the predominance of hubs in the network, i.e.the presence of nodes with high degree of connection 85. Hubs are important not only to change networktopology but also to integrate different levels of the system, probably conferring a higher degree ofstability to the system 83.
ConclusionsWater de�cit negatively affected the metabolism of soybean plants, with an exacerbated effect whencombined with high temperature. Metabolomics analysis highlight that the metabolic responses of plantsunder WD+HT differ substantially from both stresses isolated, which has several implications formolecular breeding toward WD+HT stress tolerance improvement in the current climate change scenario.
Page 15/27
Our results suggest that osmotic adjustment mainly from proline and pinitol accumulation associatedwith increased APX activity were important factors in the acclimation of soybean plants. We furtherdemonstrate that increased amino acid content and decreased content of both maltose and myo-inositolwere found as WD+HT biomarkers, highlighting the importance of amino acids and carbohydratemetabolisms for soybean stress acclimation. The discussion must not contain subheadings.
DeclarationsCon�ict of Interest
The authors declare that they have no con�ict of interest.
Data availability
All data generated or analysed during this study are included in this published article (and itsSupplementary Information �les).
Research involving plants statement
This study was developed with commercial seeds, therefore non-exotic or at risk of extinction, undercontrolled conditions, meeting all institutional, national and international guidelines and legislation forcultivated plants.
Acknowledgements
This work was supported by the National Council for Scienti�c and Technological Development (CNPq,grant nos. 551456/2010-8 and 552689/2011-4), the Goiano Federal Institute of Education, Science andTechnology (IFGoiano-RV, grants no. DPPG 045/2014), Rio Verde campus, and the Foundation forResearch Support of the State of Goiás (FAPEG, grant no. DCR 14/2013). C.M., P.F.B. and A.A.S. aregrateful to Coordination for the Improvement of Higher Education Personnel (CAPES), and F.B.F.S. andA.A.R. to CNPq, for fellowships. D.M.D. (301178/2017-8) and A.C.C. (312917/2017-1) also thank CNPqfor productivity fellowship. A.M. acknowledges the Australian Research Council Future FellowshipScheme (FT120100200).
Author contributions
R.G.V., C.M., and A.C.C. design the research. R.G.V., C.M., F.B., and L.M.F.M. conducted the experimentsand performed physiological measurements. P.F.B., D.F., and A.M. performed metabolites analysis. A.A.R.performed anatomical analysis. F.B.S.F. performed the multivariate analysis. R.G.V., C.M., F.B.S., D.M.D.,A.A.S., A.M., and A.C.C. analysed the data. R.G.V., C.M., F.B.S., A.A.S., and D.M.D. wrote the manuscriptwith contributions from A.M. and A.C.C. All authors read and approved the �nal version of themanuscript.

Page 16/27
References1. Schauberger, B., Rolinski, S., Schaphoff, S. & Müller, C. Global historical soybean and wheat yield loss
estimates from ozone pollution considering water and temperature as modifying effects. Agriculturaland Forest Meteorology 265, 1–15 (2019).
2. Peña-Gallardo, M. et al. Article (refereed) - postprint. Agricultural and Forest Meteorology 264, 40–55(2019).
3. Djanaguiraman, M., Schapaugh, W., Fritschi, F., Nguyen, H. & Prasad, P. V. V. Reproductive success ofsoybean (Glycine max L. Merril) cultivars and exotic lines under high daytime temperature. Plant Celland Environment 42, 321–336 (2019).
4. CONAB. Acompanhamento da Safra brasileira. Grãos - Safra 2018/19. Companhia Nacional deAbastecimento: Brasília (2019).
5. INMPE. Dados históricos. Instituto Nacional de Meteorologia,https://portal.inmet.gov.br/dadoshistoricos. (2020).
�. Gago, J. et al. Integrative �eld scale phenotyping for investigating metabolic components of waterstress within a vineyard. Plant Methods 13, 1–14 (2017).
7. Kuromori, T., Seo, M. & Shinozaki, K. ABA Transport and plant water stress responses. Trends in PlantScience 23, 513–522 (2018).
�. Hatzig, S. et al. Early osmotic adjustment responses in drought-resistant and drought-sensitiveoilseed rape. Journal of Integrative Plant Biology 56, 797–809 (2014).
9. Harsh, A. et al. Effect of short-term heat stress on total sugars, proline and some antioxidantenzymes in moth bean (Vigna aconitifolia). Annals of Agricultural Sciences 61, 57–64 (2016).
10. Dumschott, K., Richter, A., loescher, W. & Merchant, A. Post photosynthetic carbon partitioning tosugar alcohols and consequences for plant growth. Phytochemistry 144, 243–252 (2017).
11. Dumschott, K., Dechorgnat, J. & Merchant, A. Water de�cit elicits a transcriptional response of genesgoverning d-pinitol biosynthesis in soybean (Glycine max). International Journal of MolecularSciences 20, 1–11 (2019).
12. Fàbregas, N. & Fernie, A. R. The metabolic response to drought. Journal of Experimental Botany 70,1077–1085 (2019).
13. Cardoso, A. A., Randall, J. M. & McAdam, S. A. M. Hydraulics regulate stomatal responses to changesin leaf water status in the fern Athyrium �lix-femina 1. Plant Physiology 179, 533–543 (2019).
14. Da Fonseca-Pereira, P., Daloso, D. M., Gago, J., Nunes-Nesi, A. & Araújo, W. L. On the role of the plantmitochondrial thioredoxin system during abiotic stress. Plant Signaling and Behavior 14, 1–5 (2019).
15. de Sousa, L. F. et al. Improving water use e�ciency by changing hydraulic and stomatalcharacteristics in soybean exposed to drought: the involvement of nitric oxide. PhysiologiaPlantarum 168, 576–589 (2020).
1�. Rizhsky, L. et al. When defense pathways collide. The response of arabidopsis to a combination ofdrought and heat stress. Plant Physiology 134, 1683–1696 (2004).

Page 17/27
17. Hare, P. D., Cress, W. A. & Van Staden, J. Dissecting the roles of osmolyte accumulation during stress.Plant, Cell and Environment 21, 535–553 (1998).
1�. Obata, T. et al. Metabolite pro�les of maize leaves in drought, heat, and combined stress �eld trialsreveal the relationship between metabolism and grain yield. Plant Physiology 169, 2665–2683(2015).
19. Siddiqui, M. H. et al. Response of different genotypes of faba bean plant to drought stress.International Journal of Molecular Sciences 16, 10214–10227 (2015).
20. Sicher, R. C. Temperature shift experiments suggest that metabolic impairment and enhanced ratesof photorespiration decrease organic acid levels in soybean lea�ets exposed to supra-optimal growthtemperatures. Metabolites 5, 443–454 (2015).
21. Niu, Y. & Xiang, Y. An overview of biomembrane functions in plant responses to high-temperaturestress. Frontiers in Plant Science 9, 1–18 (2018).
22. Hasanuzzaman, M., Nahar, K., Alam, M. M., Roychowdhury, R. & Fujita, M. Physiological, biochemical,and molecular mechanisms of heat stress tolerance in plants. International Journal of MolecularSciences 14, 9643–9684 (2013).
23. Chen, K. et al. Ascorbic acid alleviates damage from heat stress in the photosystem II of tall fescue inboth the photochemical and thermal phases. Frontiers in Plant Science 8, 1–9 (2017).
24. Tohge, T., De Souza, L. P. & Fernie, A. R. Current understanding of the pathways of �avonoidbiosynthesis in model and crop plants. Journal of Experimental Botany 68, 4013–4028 (2017).
25. Nahar, K., Hasanuzzaman, M., Alam, M. M. & Fujita, M. Glutathione-induced drought stress tolerancein mung bean: Coordinated roles of the antioxidant defence and methylglyoxal detoxi�cationsystems. AoB PLANTS 7, 1–18 (2015).
2�. Mirzaee, M., Moieni, A. & Ghanati, F. Effects of drought stress on the lipid peroxidation andantioxidant enzyme activities in two canola (Brassica napus L.) cultivars. Journal of AgriculturalScience and Technology 15, 593–602 (2013).
27. Zhao, X. X., Huang, L. K., Zhang, X. Q., Li, Z. & Peng, Y. Effects of heat acclimation on photosynthesis,antioxidant enzyme activities, and gene expression in orchardgrass under heat stress. Molecules 19,13564–13576 (2014).
2�. Flexas, J. et al. Mesophyll conductance to CO2 and Rubisco as targets for improving intrinsic wateruse e�ciency in C3 plants. Plant Cell and Environment 39, 965–982 (2016).
29. Das, A., Rushton, P. J. & Rohila, J. S. Metabolomic pro�ling of soybeans (Glycine max L.) reveals theimportance of sugar and nitrogen metabolism under drought and heat stress. Plants 6, 199–208(2017).
30. Mesquita, R. O. et al. Physiological approach to decipher the drought tolerance of a soybeangenotype from Brazilian savana. Plant Physiology and Biochemistry 151, 132–143 (2020).
31. Evans, J. R. & Lawson, T. From green to gold: Agricultural revolution for food security. Journal ofExperimental Botany 71, 2211–2215 (2020).
Page 18/27
32. Nielsen, J. & Keasling, J. D. Engineering cellular metabolism. Cell 164, 1185–1197 (2016).
33. Sweetlove, L. J., Nielsen, J. & Fernie, A. R. Engineering central metabolism – a grand challenge forplant biologists. Plant Journal 90, 749–763 (2017).
34. Gerganova, M., Popova, A. V., Stanoeva, D. & Velitchkova, M. Tomato plants acclimate better toelevated temperature and high light than to treatment with each factor separately. Plant Physiologyand Biochemistry 104, 234–241 (2016).
35. Birami, B. et al. Hot drought reduces the effects of elevated CO2 on tree water-use e�ciency andcarbon metabolism. New Phytologist 226, 1607–1621 (2020).
3�. Rampino, P., Pataleo, S., Gerardi, C., Mita, G. & Perrotta, C. Drought stress response in wheat:Physiological and molecular analysis of resistant and sensitive genotypes. Plant, Cell andEnvironment 29, 2143–2152 (2006).
37. Maréchaux, I. et al. Drought tolerance as predicted by leaf water potential at turgor loss point variesstrongly across species within an Amazonian forest. Functional Ecology 29, 1268–1277 (2015).
3�. Turner, N. C. Turgor maintenance by osmotic adjustment: 40 years of progress. Journal ofExperimental Botany 69, 3223–3233 (2018).
39. Buckley, T. N. How do stomata respond to water status? New Phytologist 224, 21–36 (2019).
40. Brodribb, T. J., Sussmilch, F. & McAdam, S. A. M. From reproduction to production, stomata are themaster regulators. Plant Journal 101, 756–767 (2020).
41. Zandalinas, S. I., Balfagón, D., Arbona, V. & Gómez-Cadenas, A. Modulation of antioxidant defensesystem is associated with combined drought and heat stress tolerance in citrus. Frontiers in PlantScience 8, 1–10 (2017).
42. Goufo, P. et al. Cowpea (Vigna unguiculata L. Walp.) metabolomics: Osmoprotection as aphysiological strategy for drought stress resistance and improved yield. Frontiers in Plant Science 8,1–22 (2017).
43. Chaves, M. M. et al. Controlling stomatal aperture in semi-arid regions—The dilemma of saving wateror being cool? Plant Science 251, 54–64 (2016).
44. Kumar, K. S. et al. Algal photosynthetic responses to toxic metals and herbicides assessed bychlorophyll a �uorescence. Ecotoxicology and Environmental Safety 104, 51–71 (2014).
45. Yüzbaşıoğlu, E., Dalyan, E. & Akpınar, I. Changes in photosynthetic pigments, anthocyanin contentand antioxidant enzyme activities of maize (Zea mays L.) seedlings under high temperature stressconditions. Trakya University Journal of Natural Sciences 18, 97–104 (2017).
4�. Djanaguiraman, M., Boyle, D. L., Welti, R., Jagadish, S. V. K. & Prasad, P. V. V. Decreasedphotosynthetic rate under high temperature in wheat is due to lipid desaturation, oxidation, acylation,and damage of organelles. BMC Plant Biology 18, 1–17 (2018).
47. Ruelland, E. & Zachowski, A. How plants sense temperature. Environmental and Experimental Botany69, 225–232 (2010).

Page 19/27
4�. Zhang, L., Kondo, H., Kamikubo, H., Kataoka, M. & Sakamoto, W. VIPP1 has a disordered C-terminaltail necessary for protecting photosynthetic membranes against stress. Plant Physiology 171, 1983–1995 (2016).
49. Roach, T. & Krieger-Liszkay, A. Regulation of Photosynthetic Electron Transport and Photoinhibition.Current Protein & Peptide Science 15, 351–362 (2014).
50. Li, Y., Song, H., Zhou, L., Xu, Z. & Zhou, G. Tracking chlorophyll �uorescence as an indicator ofdrought and rewatering across the entire leaf lifespan in a maize �eld. Agricultural WaterManagement 211, 190–201 (2019).
51. Bonifacio, A. et al. Silenced rice in both cytosolic ascorbate peroxidases displays pre-acclimation tocope with oxidative stress induced by 3-aminotriazole-inhibited catalase. Journal of Plant Physiology201, 17–27 (2016).
52. Sousa, R. H. V. et al. Impairment of peroxisomal APX and CAT activities increases protection ofphotosynthesis under oxidative stress. Journal of Experimental Botany 70, 627–639 (2019).
53. Souza, P. V. L. et al. Function and compensatory mechanisms among the components of thechloroplastic redox network. Critical Reviews in Plant Sciences 38, 1–28 (2019).
54. Batista, V. C. V. et al. Salicylic acid modulates primary and volatile metabolites to alleviate salt stress-induced photosynthesis impairment on medicinal plant Egletes viscosa. Environmental andExperimental Botany 167, 103870 (2019).
55. Obata, T. & Fernie, A. R. The use of metabolomics to dissect plant responses to abiotic stresses.Cellular and Molecular Life Sciences 69, 3225–3243 (2012).
5�. Araújo, W. L., Tohge, T., Ishizaki, K., Leaver, C. J. & Fernie, A. R. Protein degradation - an alternativerespiratory substrate for stressed plants. Trends in Plant Science 16, 489–498 (2011).
57. Araújo, W. L. et al. Identi�cation of the 2-hydroxyglutarate and isovaleryl-CoA dehydrogenases asalternative electron donors linking lysine catabolism to the electron transport chain of Arabidopsismitochondria. Plant Cell 22, 1549–1563 (2010).
5�. Krasensky, J. & Jonak, C. Drought, salt, and temperature stress-induced metabolic rearrangementsand regulatory networks. Journal of Experimental Botany 63, 1593–1608 (2012).
59. Pires, M. V. et al. The in�uence of alternative pathways of respiration that utilize branched-chainamino acids following water shortage in Arabidopsis. Plant Cell and Environment 39, 1304–1319(2016).
�0. De Oliveira, L. F. et al. Polyamine- and amino acid-related metabolism: The roles of arginine andornithine are associated with the embryogenic potential. Plant and Cell Physiology 59, 1084–1098(2018).
�1. Liang, X., Dickman, M. B. & Becker, D. F. Proline biosynthesis is required for endoplasmic reticulumstress tolerance in Saccharomyces cerevisiae. Journal of Biological Chemistry 289, 27794–27806(2014).
�2. Reis, R. R. et al. Differential gene expression in response to water de�cit in leaf and root tissues ofsoybean genotypes with contrasting tolerance pro�les. Genetics and Molecular Biology 43, 1–17
Page 20/27
(2020).
�3. Rivero, R. M. et al. The combined effect of salinity and heat reveals a speci�c physiological,biochemical and molecular response in tomato plants. Plant, Cell and Environment 37, 1059–1073(2014).
�4. Bowne, J. B. et al. Drought responses of leaf tissues from wheat cultivars of differing droughttolerance at the metabolite level. Molecular Plant 5, 418–429 (2012).
�5. Khan, N., Bano, A., Rahman, M. A., Rathinasabapathi, B. & Babar, M. A. UPLC-HRMS-based untargetedmetabolic pro�ling reveals changes in chickpea (Cicer arietinum) metabolome following long-termdrought stress. Plant Cell and Environment 42, 115–132 (2019).
��. Barros, J. A. S. et al. Autophagy de�ciency compromises alternative pathways of respirationfollowing energy deprivation in Arabidopsis thaliana. Plant Physiology 175, 62–76 (2017).
�7. Yadav, B. S., Lahav, T., Reuveni, E., Chamovitz, D. A. & Freilich, S. Multidimensional patterns ofmetabolic response in abiotic stress-induced growth of Arabidopsis thaliana. Plant MolecularBiology 92, 689–699 (2016).
��. Forchhammer, K. Glutamine signalling in bacteria. Frontiers in Bioscience 12, 358–370 (2007).
�9. Kan, C. C., Chung, T. Y., Juo, Y. A. & Hsieh, M. H. Glutamine rapidly induces the expression of keytranscription factor genes involved in nitrogen and stress responses in rice roots. BMC Genomics 16,1–15 (2015).
70. Xu, B. et al. GABA signalling modulates stomatal opening to enhance plant water use e�ciency anddrought resilience. Nature Communications 12, (2021).
71. Keunen, E., Peshev, D., Vangronsveld, J., Van Den Ende, W. & Cuypers, A. Plant sugars are crucialplayers in the oxidative challenge during abiotic stress: Extending the traditional concept. Plant, Celland Environment 36, 1242–1255 (2013).
72. Ma, L., Xue, N., Fu, X., Zhang, H. & Li, G. Arabidopsis thaliana FAR-RED ELONGATED HYPOCOTYLS3(FHY3) and FAR-RED-IMPAIRED RESPONSE1 (FAR1) modulate starch synthesis in response to lightand sugar. New Phytologist 213, 1682–1696 (2017).
73. Merchant, A., Richter, A., Popp, M. & Adams, M. Targeted metabolite pro�ling provides a functionallink among eucalypt taxonomy, physiology and evolution. Phytochemistry 67, 402–408 (2006).
74. Ahn, C. H., Hossain, M. A., Lee, E., Kanth, B. K. & Park, P. B. Increased salt and drought tolerance by D-pinitol production in transgenic Arabidopsis thaliana. Biochemical and Biophysical ResearchCommunications 504, 315–320 (2018).
75. Thalmann, M. et al. Regulation of leaf starch degradation by abscisic acid is important for osmoticstress tolerance in plants. Plant Cell 28, 1860–1878 (2016).
7�. Zanella, M. et al. β-amylase 1 (BAM1) degrades transitory starch to sustain proline biosynthesisduring drought stress. Journal of Experimental Botany 67, 1819–1826 (2016).
77. do Amaral, M. N. & Souza, G. M. The challenge to translate omics data to whole plant physiology:The context matters. Frontiers in Plant Science 8, 8–11 (2017).

Page 21/27
7�. Neto, M. C. L., Carvalho, F. E. L., Souza, G. M. & Silveira, J. A. G. Understanding photosynthesis in aspatial–temporal multiscale: The need for a systemic view. Theoretical and Experimental PlantPhysiology 33, 113–124 (2021).
79. Bertolli, S. C., Mazzafera, P. & Souza, G. M. Why is it so di�cult to identify a single indicator of waterstress in plants? A proposal for a multivariate analysis to assess emergent properties. Plant Biology16, 578–585 (2014).
�0. Mitchell, M. Complex systems: Network thinking. Arti�cial Intelligence 170, 1194–1212 (2006).
�1. Vialet-Chabrand, S. et al. Global sensitivity analysis of onguard models identi�es key hubs fortransport interaction in stomatal dynamics. Plant Physiology 174, 680–688 (2017).
�2. Albert, R. & Barabási, A. L. Statistical mechanics of complex networks. Reviews of Modern Physics74, 47–97 (2002).
�3. Souza, G. M. & Lüttge, U. Stability as a phenomenon emergent from plasticity–complexity–diversityin eco-physiology in Progress in Botany (eds. Lüttge U., Beyschlag W.), 211–239 (2015)doi:10.1007/978-3-319-08807-5_9.
�4. Guimarães, P. R. The Structure of Ecological Networks across Levels of Organization. Annual Reviewof Ecology, Evolution, and Systematics 51, 433–460 (2020).
�5. Pinheiro, F. L. & Hartmann, D. Intermediate Levels of Network Heterogeneity Provide the BestEvolutionary Outcomes. Scienti�c Reports 7, 1–9 (2017).
��. Sousa, D. M. G. & Lobato, E. Correção do solo e adubação da cultura da soja. (Embrapa - CPAC,1996).
�7. Del Longo, O. T., González, C. A., Pastori, G. M. & Trippi, V. S. Antioxidant defences underhyperoxygenic and hyperosmotic conditions in leaves of two lines of maize with differentialsensitivity to drought. Plant and Cell Physiology 34, 1023–1028 (1993).
��. Havir, E. A. & McHale, N. A. Biochemical and Developmental Characterization of Multiple Forms ofCatalase in Tobacco Leaves. Plant Physiology 84, 450–455 (1987).
�9. Nakano, Y. & Asada, K. Hydrogen peroxide is scavenged by ascorbate-speci�c peroxidase in spinachchloroplasts. Plant and Cell Physiology 22, 867–880 (1981).
90. Kar, M. & Mishra, D. Catalase, peroxidase, and polyphenoloxidase activities during rice leafsenescence. Plant Physiology 57, 315–319 (1976).
91. Maehly, A. C. & Chance, B. The assay of catalases and peroxidases. in Methods of BiochemicalAnalysis vol. 1, 357–424 (1954).
92. Popp, M. et al. Sample preservation for determination of organic compounds: Microwave versusfreeze-drying. Journal of Experimental Botany 47, 1469–1473 (1996).
93. Basu, S. et al. Sparse network modeling and metscape-based visualization methods for the analysisof large-scale metabolomics data. Bioinformatics 33, 1545–1553 (2017).
94. Karnovsky, A. et al. Metscape 2 bioinformatics tool for the analysis and visualization ofmetabolomics and gene expression data. Bioinformatics 28, 373–380 (2012).
Page 22/27
95. Shannon, P. et al. Cytoscape: a software environment for integrated models of biomolecularinteraction networks. Genome Research 13, 2498–2504 (2003).
9�. Freire, F. B. S. et al. Mild reductions in guard cell sucrose synthase 2 expression leads to slowerstomatal opening and decreased whole plant transpiration in Nicotiana tabacum L. Environmentaland Experimental Botany 184, 104370 (2021).
97. Assenov, Y., Ramírez, F., Schelhorn, S. E. S. E., Lengauer, T. & Albrecht, M. Computing topologicalparameters of biological networks. Bioinformatics 24, 282–284 (2008).
9�. Chong, J. et al. MetaboAnalyst 4.0: Towards more transparent and integrative metabolomicsanalysis. Nucleic Acids Research 46, W486–W494 (2018).
Figures
Figure 1
Leaf temperature and hydric status of soybean plants maintained for eight days under well-watered (WW;100% holding water capacity HWC, 25ºC), water de�cit (WD; 40% HWC, 25ºC), high temperature (HT;100% HWC, 40ºC) and water de�cit plus high temperature (WD+HT; 40% HWC; 40°C) conditions. A) Leaf
Page 23/27
temperature ( C). B) Leaf water potential (Ѱw(am)). C) Leaf osmotic potential (Ѱs(leaf)). D) Root osmoticpotential (Ψs(root)). Bars represent mean ± SE (n = 5). Means followed by the same uppercase letterscompare cultivars within the same water and temperature treatment. Means followed by the samelowercase letters compare water and temperature treatments within the same cultivar, as determined byTukey test at 5% of probability.
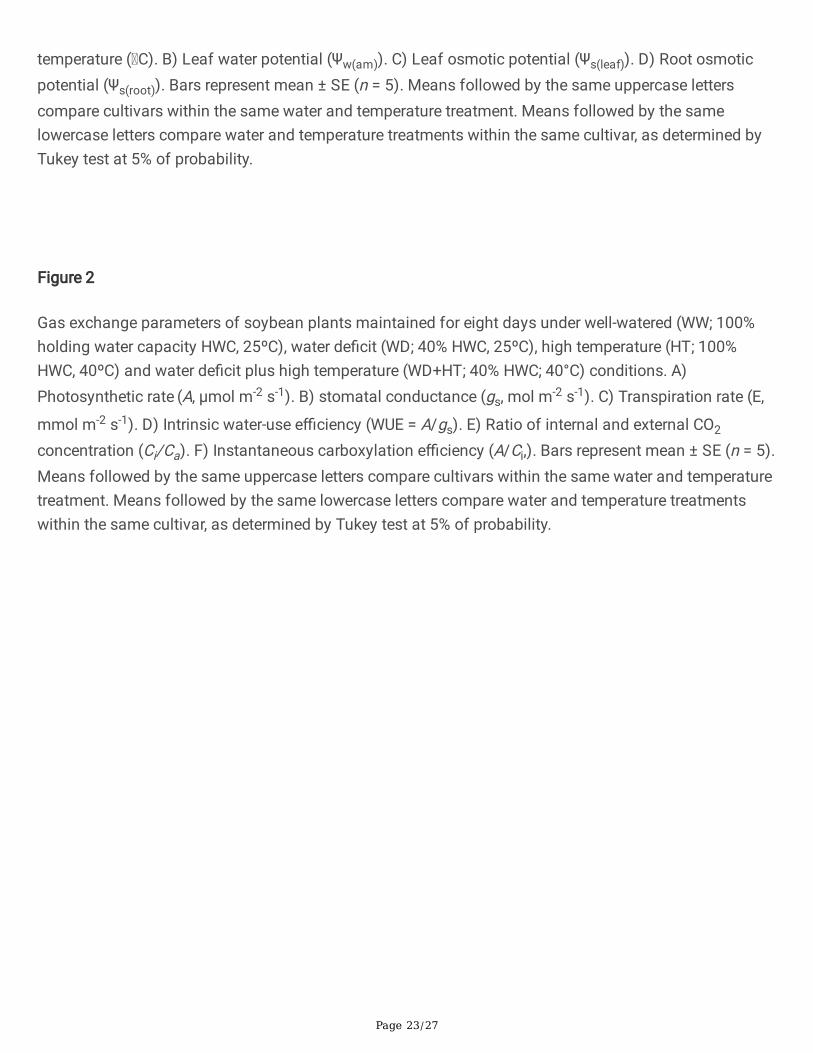
Figure 2
Gas exchange parameters of soybean plants maintained for eight days under well-watered (WW; 100%holding water capacity HWC, 25ºC), water de�cit (WD; 40% HWC, 25ºC), high temperature (HT; 100%HWC, 40ºC) and water de�cit plus high temperature (WD+HT; 40% HWC; 40°C) conditions. A)Photosynthetic rate (A, µmol m-2 s-1). B) stomatal conductance (gs, mol m-2 s-1). C) Transpiration rate (E,
mmol m-2 s-1). D) Intrinsic water-use e�ciency (WUE = A/gs). E) Ratio of internal and external CO2
concentration (Ci/Ca). F) Instantaneous carboxylation e�ciency (A/Ci,). Bars represent mean ± SE (n = 5).Means followed by the same uppercase letters compare cultivars within the same water and temperaturetreatment. Means followed by the same lowercase letters compare water and temperature treatmentswithin the same cultivar, as determined by Tukey test at 5% of probability.

Page 24/27
Figure 3
Photochemical parameters of soybean plants maintained for eight days under well-watered (WW; 100%holding water capacity HWC, 25ºC), water de�cit (WD; 40% HWC, 25ºC), high temperature (HT; 100%HWC, 40ºC) and water de�cit plus high temperature (WD+HT; 40% HWC; 40°C) conditions. A) Minimalchlorophyll �uorescence (F0). B) Maximum quantum yield of photosystem II (PSII) (Fv/Fm). C) Electrontransport rate (ETR). D) Fraction of opened PSII reaction centers (qL). E) Effective quantum yield of PSII(YII). F) Yield of non-photochemical quenching (YNPQ). Bars represent mean ± SE (n = 5). Means followed

Page 25/27
by the same uppercase letters compare cultivars within the same water and temperature treatment.Means followed by the same lowercase letters compare water and temperature treatments within thesame cultivar, as determined by Tukey test at 5% of probability.
Figure 4
Activity of antioxidant enzymes of soybean plants maintained for eight days under well-watered (WW;100% holding water capacity HWC, 25ºC), water de�cit (WD; 40% HWC, 25ºC), high temperature (HT;100% HWC, 40ºC) and water de�cit plus high temperature (WD+HT; 40% HWC; 40°C) conditions. A)Superoxide dismutase (SOD). B) Ascorbate peroxidase (APX). C) Total peroxidase (POX). D) CatalaseBars represent mean ± SE (n = 5). Means followed by the same uppercase letters compare cultivarswithin the same water and temperature treatment. Means followed by the same lowercase letterscompare water and temperature treatments within the same cultivar, as determined by Tukey test at 5% ofprobability.
Figure 5
Metabolic characterization of soybean plants maintained for eight days under well-watered (WW; 100%holding water capacity HWC, 25ºC), water de�cit (WD; 40% HWC, 25ºC), high temperature (HT; 100%HWC, 40ºC) and water de�cit plus high temperature (WD+HT; 40% HWC; 40°C) conditions. A) Heat maprepresentation of the content of the metabolites identi�ed in this study. B) Partial least square-discriminant analysis (PLS-DA). C) Variable importance in projection (VIP) scores of the PLS-DA model.Metabolites included in this VIP score list have VIP score higher than 1, which indicates those that mostlycontributed to the separation observed at the PLS-DA model. PLS-DA was carried out combining datafrom all genotypes. The data was normalized by using Log and Auto-scaling transformations on theMetaboAnalyst platform 99 (n = 5).
Figure 6
Box plots of metabolites identi�ed as water de�cit combined with high temperature (WD+HT) biomarkers.Green and red box plots indicate the relative content of metabolites found in soybean plants under well-

Page 26/27
watered (WW) and WD+HT conditions, respectively. Biomarkers were identi�ed based in receiveroperating characteristic (ROC) curves using Log and Auto-scaling normalized data on the MetaboAnalystplatform 99. Metabolites in black and red indicate statiscal difference at P < 0.001 and P < 0.05,respectively.
Figure 7
Multivariate analysis combining all data of soybean plants maintained for eight days under well-watered(WW; 100% holding water capacity HWC, 25ºC), water de�cit (WD; 40% HWC, 25ºC), high temperature (HT;100% HWC, 40ºC) and water de�cit plus high temperature (WD+HT; 40% HWC; 40°C) conditions. A)Partial least square-discriminant analysis (PLS-DA). B) Variable importance in projection (VIP) scores ofthe PLS-DA model. Metabolites included in the VIP score lists have VIP score higher than 1, whichindicates those that mostly contributed to the separation observed at the PLS-DA model of the respectivecultivar. PLS-DA was carried out combining data from all genotypes. The data was normalized by usingLog and Auto-scaling transformations on the MetaboAnalyst platform 99 (n = 5).
Figure 8
Correlation-based networks of soybean plants maintained for eight days under A) well-watered (WW;100% holding water capacity HWC, 25ºC), B) water de�cit (WD; 40% HWC, 25ºC), C) high temperature (HT;100% HWC, 40ºC) and D) water de�cit plus high temperature (WD+HT; 40% HWC; 40°C) conditions. Thenetworks were created combining data from anatomical, metabolic and physiological levels. The nodesare the parameters and the link is the debiased sparse partial correlation coe�cient (DSPC) among then,whenever is signi�cant (P < 0.05). Red and blue links correspond to positive and negative correlationamong the nodes. The thickness and the intensity of the colour of the links indicate higher DSPCcoe�cient, in module. Bigger nodes indicate higher degree of connection. This analysis was performedusing CorrelationCalculator software and the networks designed by using MetScape on CYTOSCAPEsoftware (n = 5).
Supplementary Files
This is a list of supplementary �les associated with this preprint. Click to download.

Page 27/27
SupplementaryMaterial.docx