Repeatable anatomical calibration in in vivo movement analysis
7
SIAMOC Best Methodological Paper Award 2006 Enhanced anatomical calibration in human movement analysis Marco Donati, Valentina Camomilla * , Giuseppe Vannozzi, Aurelio Cappozzo Department of Human Movement and Sport Sciences, Istituto Universitario di Scienze Motorie, Piazza Lauro de Bosis 15, 00194 Roma, Italy Received 8 March 2007; accepted 15 April 2007 Abstract The representation of human movement requires knowledge of both movement and morphology of bony segments. The determination of subject-specific morphology data and their registration with movement data is accomplished through an anatomical calibration procedure (calibrated anatomical systems technique: CAST). This paper describes a novel approach to this calibration (UP-CAST) which, as compared with normally used techniques, achieves better repeatability, a shorter application time, and can be effectively performed by non-skilled examiners. Instead of the manual location of prominent bony anatomical landmarks, the description of which is affected by subjective interpretation, a large number of unlabelled points is acquired over prominent parts of the subject’s bone, using a wand fitted with markers. A digital model of a template-bone is then submitted to isomorphic deformation and re-orientation to optimally match the above-mentioned points. The locations of anatomical landmarks are automatically made available. The UP-CAST was validated considering the femur as a paradigmatic case. Intra- and inter-examiner repeatability of the identification of anatomical landmarks was assessed both in vivo, using average weight subjects, and on bare bones. Accuracy of the identification was assessed using the anatomical landmark locations manually located on bare bones as reference. The repeatability of this method was markedly higher than that reported in the literature and obtained using the conventional palpation (ranges: 0.9–7.6 mm and 13.4–17.9, respectively). Accuracy resulted, on average, in a maximal error of 11 mm. Results suggest that the principal source of variability resides in the discrepancy between subject’s and template bone morphology and not in the inter-examiner differences. The UP-CAST anatomical calibration could be considered a promising alternative to conventional calibration contributing to a more repeatable 3D human movement analysis. # 2007 Elsevier B.V. All rights reserved. Keywords: Anatomical calibration; Anatomical landmarks; Biomechanics; Human movement analysis; Stereophotogrammetry 1. Introduction The analysis of human movement requires collection of data that allows to reconstruct the movement of subject- specific bone shapes in a three-dimensional (3D) virtual space and in each sampled instant of time. For this purpose, local frames are used which are normally constructed using the instantaneous global position of superficial markers tracked by a photogrammetric system. They are referred to as marker cluster frames (CFs) and their pose is described using 4 4 transformation matrices ( g T c ) [1]. This pose is generally arbitrary with respect to the underlying bone. Repeatability of a local frame is obtained by relying on specific anatomical features of the bone. An adequate number of distinct anatomical landmarks (ALs) is selected and their position relative to the CF is determined ( c a[a], a = 1, ..., A). Using the positional information and a deterministic or statistical geometric rule, a local anatomical frame (AF) is defined, and the transformation matrix c T a is calculated which, in turn, allows for the estimation of the global pose matrix g T a [2,3]. In principle, AFs are repeatable both within and across subjects and represent a fundamental prerequisite for the quantitative analysis of movement. This approach to movement analysis is often referred to as the calibrated anatomical system technique, CAST [4] (Fig. 1). In most movement analysis laboratories, external ALs that correspond to bony prominences are identified through manual palpation. Their location relative to the CF (vectors c a) is then determined through photogrammetry, either by placing temporary markers on them or pointing to the ALs with a wand fitted with two or more markers [4]. www.elsevier.com/locate/gaitpost Gait & Posture 26 (2007) 179–185 * Corresponding author. Tel.: +39 06 36733522; fax: +39 06 36733517. E-mail address: [email protected] (V. Camomilla). 0966-6362/$ – see front matter # 2007 Elsevier B.V. All rights reserved. doi:10.1016/j.gaitpost.2007.04.009
-
Upload
independent -
Category
Documents
-
view
1 -
download
0
Transcript of Repeatable anatomical calibration in in vivo movement analysis

www.elsevier.com/locate/gaitpost
Gait & Posture 26 (2007) 179–185
SIAMOC Best Methodological Paper Award 2006
Enhanced anatomical calibration in human movement analysis
Marco Donati, Valentina Camomilla *, Giuseppe Vannozzi, Aurelio Cappozzo
Department of Human Movement and Sport Sciences, Istituto Universitario di Scienze Motorie, Piazza Lauro de Bosis 15, 00194 Roma, Italy
Received 8 March 2007; accepted 15 April 2007
Abstract
The representation of human movement requires knowledge of both movement and morphology of bony segments. The determination of
subject-specific morphology data and their registration with movement data is accomplished through an anatomical calibration procedure
(calibrated anatomical systems technique: CAST). This paper describes a novel approach to this calibration (UP-CAST) which, as compared
with normally used techniques, achieves better repeatability, a shorter application time, and can be effectively performed by non-skilled
examiners. Instead of the manual location of prominent bony anatomical landmarks, the description of which is affected by subjective
interpretation, a large number of unlabelled points is acquired over prominent parts of the subject’s bone, using a wand fitted with markers. A
digital model of a template-bone is then submitted to isomorphic deformation and re-orientation to optimally match the above-mentioned
points. The locations of anatomical landmarks are automatically made available. The UP-CAST was validated considering the femur as a
paradigmatic case. Intra- and inter-examiner repeatability of the identification of anatomical landmarks was assessed both in vivo, using
average weight subjects, and on bare bones. Accuracy of the identification was assessed using the anatomical landmark locations manually
located on bare bones as reference. The repeatability of this method was markedly higher than that reported in the literature and obtained using
the conventional palpation (ranges: 0.9–7.6 mm and 13.4–17.9, respectively). Accuracy resulted, on average, in a maximal error of 11 mm.
Results suggest that the principal source of variability resides in the discrepancy between subject’s and template bone morphology and not in
the inter-examiner differences. The UP-CAST anatomical calibration could be considered a promising alternative to conventional calibration
contributing to a more repeatable 3D human movement analysis.
# 2007 Elsevier B.V. All rights reserved.
Keywords: Anatomical calibration; Anatomical landmarks; Biomechanics; Human movement analysis; Stereophotogrammetry
1. Introduction
The analysis of human movement requires collection of
data that allows to reconstruct the movement of subject-
specific bone shapes in a three-dimensional (3D) virtual
space and in each sampled instant of time. For this purpose,
local frames are used which are normally constructed using
the instantaneous global position of superficial markers
tracked by a photogrammetric system. They are referred to
as marker cluster frames (CFs) and their pose is described
using 4 � 4 transformation matrices (gTc) [1]. This pose is
generally arbitrary with respect to the underlying bone.
Repeatability of a local frame is obtained by relying on
specific anatomical features of the bone. An adequate
* Corresponding author. Tel.: +39 06 36733522; fax: +39 06 36733517.
E-mail address: [email protected] (V. Camomilla).
0966-6362/$ – see front matter # 2007 Elsevier B.V. All rights reserved.
doi:10.1016/j.gaitpost.2007.04.009
number of distinct anatomical landmarks (ALs) is selected
and their position relative to the CF is determined (ca[a],
a = 1, . . ., A). Using the positional information and a
deterministic or statistical geometric rule, a local anatomical
frame (AF) is defined, and the transformation matrix cTa is
calculated which, in turn, allows for the estimation of the
global pose matrix gTa [2,3]. In principle, AFs are repeatable
both within and across subjects and represent a fundamental
prerequisite for the quantitative analysis of movement. This
approach to movement analysis is often referred to as the
calibrated anatomical system technique, CAST [4] (Fig. 1).
In most movement analysis laboratories, external ALs
that correspond to bony prominences are identified through
manual palpation. Their location relative to the CF (vectorsca) is then determined through photogrammetry, either by
placing temporary markers on them or pointing to the ALs
with a wand fitted with two or more markers [4].
M. Donati et al. / Gait & Posture 26 (2007) 179–185180
Nomenclature
Frames
AF anatomical frame
CF marker cluster frame
GF global frame
MF morphology frame
Points
AL anatomical landmark
GT greater trochanter
MC, LC most distal point of the medial and lateral
condyles
ME, LE medial and lateral epicondyles
MP, LP antero-medial and antero-lateral ridge of the
patellar surface groove
UP unlabelled point
Transformation matrixyTx transformation matrix from frame x to frame y.
Vectorsxv[i] position vector in frame x indexed by i¯aua orientation vector of each trial AF in the
mean AF
When, in addition to an AF and a few ALs, the analysis
requires a high resolution subject-specific bone morphology,
a bone digital model, obtained through imaging methods,
is provided relative to a morphology frame (MF),
normally different from the CF. The model consists of the
position of unlabelled bone superficial points (mb[b], b = 1,
. . ., B), accompanied with relevant AL locations, defined in
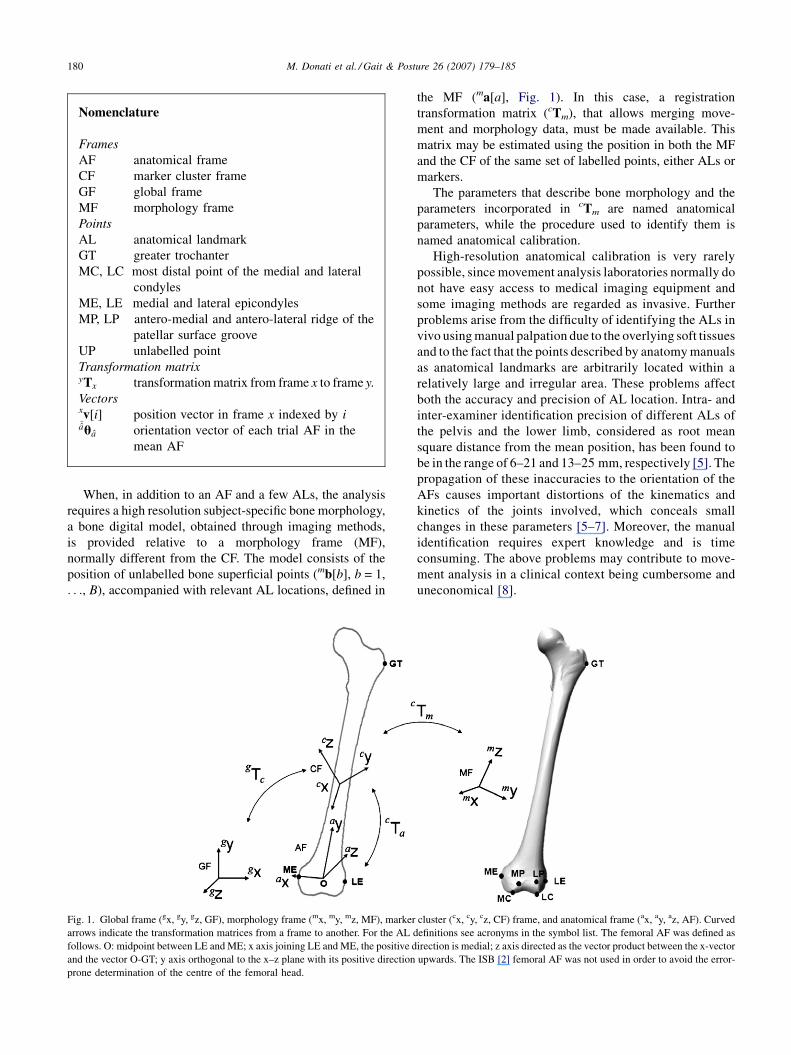
Fig. 1. Global frame (gx, gy, gz, GF), morphology frame (mx, my, mz, MF), marker
arrows indicate the transformation matrices from a frame to another. For the AL d
follows. O: midpoint between LE and ME; x axis joining LE and ME, the positive d
and the vector O-GT; y axis orthogonal to the x–z plane with its positive direction
prone determination of the centre of the femoral head.
the MF (ma[a], Fig. 1). In this case, a registration
transformation matrix (cTm), that allows merging move-
ment and morphology data, must be made available. This
matrix may be estimated using the position in both the MF
and the CF of the same set of labelled points, either ALs or
markers.
The parameters that describe bone morphology and the
parameters incorporated in cTm are named anatomical
parameters, while the procedure used to identify them is
named anatomical calibration.
High-resolution anatomical calibration is very rarely
possible, since movement analysis laboratories normally do
not have easy access to medical imaging equipment and
some imaging methods are regarded as invasive. Further
problems arise from the difficulty of identifying the ALs in
vivo using manual palpation due to the overlying soft tissues
and to the fact that the points described by anatomy manuals
as anatomical landmarks are arbitrarily located within a
relatively large and irregular area. These problems affect
both the accuracy and precision of AL location. Intra- and
inter-examiner identification precision of different ALs of
the pelvis and the lower limb, considered as root mean
square distance from the mean position, has been found to
be in the range of 6–21 and 13–25 mm, respectively [5]. The
propagation of these inaccuracies to the orientation of the
AFs causes important distortions of the kinematics and
kinetics of the joints involved, which conceals small
changes in these parameters [5–7]. Moreover, the manual
identification requires expert knowledge and is time
consuming. The above problems may contribute to move-
ment analysis in a clinical context being cumbersome and
uneconomical [8].
cluster (cx, cy, cz, CF) frame, and anatomical frame (ax, ay, az, AF). Curved
efinitions see acronyms in the symbol list. The femoral AF was defined as
irection is medial; z axis directed as the vector product between the x-vector
upwards. The ISB [2] femoral AF was not used in order to avoid the error-

M. Donati et al. / Gait & Posture 26 (2007) 179–185 181
The problems illustrated above, with reference to the
conventional anatomical calibration procedure, require the
following actions:
1. to
Fig
sph
devise a procedure to estimate a subject-specific digital
model of the bone;
2. to
improve the precision of AL identification procedures;3. to
minimize the time required to perform anatomicalcalibration;
4. to
allow for the entire procedure to be performed byancillary health technicians in place of highly skilled
professionals without compromising the outcome;
5. to
exploit redundancy of information by increasing thenumber of ALs used to define an AF, and to design the
rule that constructs it so that AL inaccuracy propagation
is minimised.
Issue number 5 has been partially addressed in a previous
study by this group [3].
This paper aims at contributing to the solution of the
problems described in the first four issues. For this purpose,
an alternative anatomical calibration procedure was devel-
oped, based on the estimation of a subject-specific bone or
portion of bone. This estimation is implemented by
determining the position of a large number of unlabelled
points (UPs) located over all prominent parts of the bone
surface and matching a digital model of a template-bone to
them. For this reason, the technique will be referred to as
UP-CAST. The estimated subject-specific bone contains all
relevant AL locations. The feasibility of the UP-CAST
procedure was evaluated, in terms of repeatability and
accuracy, on average weight subjects and bare bones, using
the femur as a paradigmatic case.
2. Materials and methods
2.1. The UP-CAST method
Markers placed above the diaphysis of the femur, according to
the guidelines outlined in Ref. [9], are used to construct a CF [10].
The determination of the UP position vectors in the CF is carried
out using a wand fitted with a cluster of at least three markers and a
sphere on the tip that rolls over the surface to be digitized (Fig. 2).
In order to associate the digitized surface with the bone, the UP
. 2. Wand fitted with a cluster of three retroreflective markers and a
ere (radius = 5 mm) on the tip.
determination is performed in the body segment areas where the
soft tissue layer over the bone is sufficiently thin. With reference to
the femur, the relevant acquisition provides the UPs over the
epiphysis (cup[n], n = 1, . . ., N) as shown in Fig. 3a. Since the
tissue overlying the greater trochanter (GT) landmark is usually
thicker than that over the epicondyles, the GT location was
digitized using the conventional CAST calibration protocol. For
reasons that will become evident later, a first approximation
location of three labelled points must also be made available.
Two of these points are located on the medial and lateral aspects
of the femoral epiphysis such that they approximate the medial and
lateral epicondyles, respectively, and the third corresponds to GT.
A template-bone is selected and its surface points are given
relative to a MF (mb; Fig. 3b). This template may be selected from a
database using the available information about the subject’s bone
and a similarity criterion. The template ALs are identified and
labelled using a virtual palpation technique (ma[a]). The same
portion, or portions, of the bone digitized in vivo are then selected
(template epiphysis: me[e], e = 1, . . ., E; Fig. 3b).
Having carried out the preliminary procedures illustrated above,
the subject-specific bone model, cb, and the AL position vector
estimates, ca, are determined as follows. An isomorphic deforma-
tion and a re-orientation of the me vectors, aimed at matching the
relevant points with the measured UPs, are carried out. The super-
ficial points of the subject-specific epiphysis are represented as
ce½e� ¼ d cTmme½e�; (1)
where d is the isomorphic deformation scale factor and cTm is the
transformation matrix which actuates the re-orientation. These
parameters are estimated (d and cTm) through the minimization
of the mean direct Hausdorff distance between the template
epiphysis points and the UPs, and also by using the information
from the respective GT locations.
Fig. 3. (a) Experimental UPs (cup[n], n = 1, . . ., N) and a sphere centred in
the GT. (b) Digital template points before (mb[b], b = 1, . . ., B; light grey)
and after (me[e], e = 1, . . ., E; dark grey) the selection of the distal portion.

M. Donati et al. / Gait & Posture 26 (2007) 179–185182
The optimization problem cost function is:
f ðd; cTmÞ ¼ð1=EÞ
Pe¼1...E
�minn¼1...N
����d cTmme½e� � cup½n�
�����
flag
(2)
The flag variable is designed to abruptly increase the cost
function value when the experimental GT area is far from that
of the template. A line, defined by the midpoint of the epicon-
dyles and the GT, is associated with the me vectors (Fig. 3b). A
sphere, centred in the GT of the analysed bone (Fig. 3a), is
associated with the cup vectors; this sphere has a radius equal to
20 mm (identification inaccuracy as provided in [5]). The flag
switches from 10�3 to 1 when this line intersects the sphere.
Despite the fact that the in vivo identification of the GT suffers
from a large uncertainty, given its relatively large distance from
the epiphysis, it helps the accuracy of the re-orientation exercise
in the sagittal plane. This is particularly critical in consideration
of the cylindrical symmetry of the femoral condyle. Other bones
may not require the identification of ALs and may rely on UPs
only.
The subject-specific bone model and AL estimates in the CF are
given by
cb½b� ¼ d cTmmb½b� (3)
and
ca½a� ¼ d cTmma½a�: (4)
In order to minimize the computation time, both the search
space and the number of sample points may be reduced. The
search space is limited by performing a preliminary re-orienta-
tion of the MF. This registration may be performed through a
singular value decomposition procedure [11] using labelled
points available in both the CF and MF. This is the case for
the first approximation ME and LE, and for the GT as measured
in vivo which are made to optimally match the same ALs of the
template-bone. This operation provides a first approximation
registration matrix cTm. After this first approximation registra-
tion is carried out, a subset of points of the two clouds (E0 < E
and N0 < N) is selected by dividing the CF space into 3 mm side
voxels and randomly selecting only one UP and one epiphysis
template point for each voxel. The cost function in Eq. (2) can
now be substituted with:
f ðd; TÞ ¼ð1=E0Þ
Pe¼1...E0
�minn¼1...N0
����d T cTmme½e� � cup½n�
�����
flag;
(5)
Table 1
Characteristics of the bone, palpation, AL evaluation procedure and relevant vec
Bones (n) Palpation ALs Examine
Template bone (1) Virtual AL palpation Measured, mta –
Bare bones (2) Manual AL palpation Measured, aba Skilled (
Bare bones (2) Manual UPs palpation Estimated, aa Untraine
Subject bones (2) Manual UPs palpation Estimated, aa Untraine
The number of bones, examiners, and trials are also quoted.
where cTm ¼ T cTm, and T is close to an identity matrix. For the
purpose of the flag value determination, the position vector of the
GT in the MF is also transformed using the matrix cTm.
2.2. Experimental evaluation of the UP-CAST method
The performance of the UP-CAST method was assessed for
accuracy using two bare femoral bones, and, for precision, using
both the bare bones and two able-bodied, average weight subjects
(one male, one female with body mass index of 19.5 and
22.7 kg m�2, respectively). An informed consent was signed by
the two volunteers.
Four markers were applied onto the thigh of the volunteers and
on the diaphysis of the bare bones. The position of the tip of the
wand relative to the wand markers was determined through a
stereophotogrammetric calibration procedure. The accuracy of this
calibration was assessed by rolling the tip over a metal sphere of
known radius and was found to be within 1 mm. During the
experiments, the tip of the wand was kept approximately ortho-
gonal to, and always in contact with, the surface to be digitized and
was kept as close as possible to the volunteers’ bone by slightly
compressing the soft tissues. All the accessible areas of the distal
femur were explored with the wand. The exploration started from
the lateral epiphysis, close to the LE, and ended at the medial
epiphysis, close to the ME (Fig. 1) so that a first approximation
location of these ALs was available. During this exercise, care was
taken not to cause movements of the skin markers relative to the
underlying bone. The GT location was also digitized using the
conventional CAST protocol. The instantaneous global position of
all markers was acquired at 120 samples per second using a 9
camera Vicon1 612 stereophotogrammetric system and the data
set, illustrated in Fig. 3a, was produced.
For each of the four femora involved in the analysis, six
experimental sessions were carried out. In each session a different
examiner, with no specific anatomy training, performed six anato-
mical calibrations (repetitions) (Table 1).
As far as the two bare bones were concerned, the six epiphysis
ALs depicted in Fig. 1 were identified and their location in the CF
digitized twice by two examiners who had a specific training in
bone landmark identification (Table 1). The resulting position
vectors were thereafter averaged and determined in the nominal
AF through rigid transformation (aba). This vector was considered
as a reference for the purpose of accuracy assessment. The same
ALs were identified in the selected template-bone using an auto-
matic virtual palpation software [12] based on the pictorial instruc-
tions delivered in the Vakhum EU project [13].
The minimization of the cost function, Eq. (5), was accom-
plished using the genetic algorithm described in Ref. [14] with an
initial population of 2500 ‘‘individuals’’ (each individual is a
tor output, examiner, and procedure for precision and accuracy assessment
rs (n) Trials per
examiner
Precision Accuracy
– According to
literature [17]
Theoretically not assessable
2) 2 – Theoretically not assessable
d (6) 6 See Section 2 Comparison with abad (6) 6 See Section 2 Practically not assessable

M. Donati et al. / Gait & Posture 26 (2007) 179–185 183
Table 2
Precision with which the local position of anatomical landmarks was determined
LE ME LP MP LC MC
ML V AP 3D ML V AP 3D ML V AP 3D ML V AP 3D ML V AP 3D ML V AP 3D
Bone 1 0.9 1.1 2.4 2.8 1.2 0.9 3 3.4 2 1.3 0.9 2.5 2.1 1 1.2 2.6 0.9 1 2.1 2.5 0.9 0.9 2 2.4
Bone 2 1.4 2.2 3.6 4.4 2 1.6 3.6 4.4 3.5 2.8 1.2 4.6 3.3 2.4 1.4 4.3 1.6 1.8 2.9 3.8 2 1.4 1.8 3
Subject 1 3.4 2.5 5 6.5 3.3 3.2 4.6 6.5 2.7 3.3 3.2 5.3 2.7 3.1 3 5.1 3.5 1.9 4.4 5.9 3.4 2.4 3.3 5.3
Subject 2 2 2.3 5.5 6.3 2.5 2.6 6.7 7.6 4.9 2.7 2.8 6.3 4.3 2.4 3.9 6.3 2.2 2 4.5 5.4 2.5 2.1 4 5.2
Standard deviation of landmark positions (see Fig. 1 and list of symbols for acronyms) calculated over all examiners and trials along the anatomical axes (medio-
lateral, vertical, and antero-posterior) and 3D. Measures in millimetres.
Table 3
Precision with which anatomical frames were determined
ML V AP
Bone 1 0.4 3.6 0.9
Bone 2 0.6 4.9 0.9
Subject 1 0.9 7.0 1.3
Subject 2 0.8 5.0 1.0
Standard deviation of the orientation vectors of the anatomical frames was
calculated for all examiners and trials and was projected onto the average
anatomical axes (medio-lateral, vertical, and antero-posterior). Measures in
degrees.
seven-element vector: three rotations, three translations, and one
scale factor) and 200 iterations.
Each experimental session provided six data sets each made of
the vectors ca½a� ða ¼ 1; . . . ; 6Þ and a GT vector. For the purpose of
result interpretation, these vectors were represented in an AF
associated with the relevant bone. A mean AF was determined
using the means of all the relevant ca vectors. Thereafter, vector
transformations were applied to obtain the vectors¯aa and the
orientation vectors¯aua of each trial AF, all relative to the mean
AF. The orientation vector is a unit vector multiplied by an angle,
where the angle is the amount to rotate by and the vector is the axis
to rotate about the trial AF relative to the mean AF [15].
Internal consistency of the UP-CAST method was evaluated
using the Cronbach’s alpha coefficient [16] on the¯aa vectors of the
bare bones and of the two subjects.
To demonstrate that changing the examiner does not signifi-
cantly influence the measures obtained with UP-CAST, a repeated
measures analysis of variance (ANOVA) was used with a between
group factor (examiner: six levels, one for each examiner), and two
within group factors (trial: six levels, one for each trial performed
by the examiner, and AL: six levels, one for each AL). Four
separate ANOVAs were performed for each of the bones and
subjects. Significance level was set at ( p < 0.05).
When no significant interaction between trials and examiner
was observed, the precision of the method was evaluated in terms of
standard deviation of all¯aa and
¯aua vectors for each bone and
subject. To assess the accuracy, the distance between aba and all the¯aa was calculated. Mean and standard deviation of the accuracies
were calculated for each landmark.
3. Results
UP-CAST was shown to have a very high internal
consistency, with Cronbach’s alpha values larger than 0.997
for both bare bones and subjects. The repeated measures
ANOVA, for both the bones and the subjects, showed that,
firstly, there was no difference between examiners for any of
the measures and, secondly, there were no within trial
differences and no within ALs differences.
As there was no between examiner effect, the precision of
the method was evaluated in terms of standard deviation of all¯aa (Table 2) and
¯aua (Table 3). The standard deviations ranged
from 0.9 to 7.6 mm and from 0.48 to 7.08, respectively. On all
bones, the epicondylar landmarks appeared to have higher
errors in the antero-posterior direction, while the patellar
groove landmarks appeared, in general, to be more dispersed
along the medio-lateral axis. The most distal landmarks
tended to be more scattered on the transverse plane than
vertically. While in general the precision range on subject
bones (1.9–7.6 mm and 0.8–7.08) appeared higher than on
bare bones (0.9–4.6 mm and 0.4–4.98), in many cases the
precision values were comparable between the bones and the
subjects. This indicates that the error associated with the
discrepancy between the template morphology and the
analysed bone morphology prevails on trial specific error
sources, such as the presence of soft tissue.
The accuracy was dependent on the bone and the landmark
analysed (Table 4). The variability of the accuracy over the
trials was different between bones, but similar for landmarks
of the same bone. This confirms that bone morphology is a
main source of low identification precision.
4. Discussion
The precision of the proposed anatomical calibration
procedure, based on the determination of UPs, has been
described and compared with those of the AL palpation
approach. The absence of significant interactions both
between and within factors confirmed that a change in the
examiner did not influence the performance of UP-CAST,
both in terms of the trials and of the AL locations. Moreover,
as there was no within trial effect, there was no evidence of a
learning effect. Thus, the UP-CAST calibration can be
carried out by ancillary health technicians instead of skilled
professionals. This allows the changeover of laboratory
technicians to occur without losing precision. In addition,
the time required for landmark identification is drastically
reduced. For the distal femur the identification of six
landmarks via conventional calibration could require

M. Donati et al. / Gait & Posture 26 (2007) 179–185184
Table 4
Accuracy with which the position of the anatomical landmarks was determined
LE ME LP MP LC MC
Bone 1 2.8 (1.0) 3.2 (1.6) 7.5 (0.8) 9.3 (1.8) 2.7 (1.1) 3.3 (1.4)
Bone 2 6.8 (1.9) 6.9 (2.2) 11.3 (3.2) 8.1 (1.4) 5.9 (1.8) 6.5 (1.5)
Mean (standard deviation) of the accuracy over six examiners. Measures in millimetres.
5–10 min, while only 40–60 s are required to calibrate the
selected area using the UP procedure.
As previously shown using a calibration based on the
manual identification of landmarks [5], the most distal
landmarks were characterized by a lower precision in the
antero-posterior direction while the patellar groove land-
marks were more dispersed along the medio-lateral axis.
Conversely, the epicondyles had the lowest precision along
the antero-posterior direction and not along the medio-
lateral direction shown in the conventional calibration. The
anatomical frame orientation was confirmed to have a larger
variability around the vertical axis (Table 3). This is due
to the femoral shape characterized by a predominant
longitudinal dimension relative to the other two dimensions.
The UP-CAST precision along the anatomical axes
(range: 1.9–6.7 mm) was remarkably higher than that
exhibited by the conventional calibration (inter-examiner:
13.4–17.9 mm; intra-examiner: 1.4–10.8 mm) [5]. Since AL
identification is carried out on the template, and therefore
does not contribute to variability, the UPs acquisition
procedure and the related template registration and
isomorphic deformation exercise are highly precise.
Identification precision obtained on subjects was only
slightly worse than that obtained on bare bones. Moreover,
results relative to the subjects were comparable despite
different anthropometry and soft tissue thickness around the
knees. These results, even if obtained on the low number of
subjects and bones available, suggest that soft tissues do not
significantly interfere with the proposed method. As the
method used in the present study assumes that the thin layer
of tissue typical of the areas where the digitization is
performed is part of the bone morphology, it is not surprising
that soft tissues can cause errors similar to those obtained
when comparing different bones.
The accuracy, assessed on bare bones, was up to three
times worse than precision (for the ME landmark, for
example, the accuracy for the first and second bone was of
3.2 and 6.9 mm while the precision was 3.4 and 4.4 mm,
respectively). This is mostly due to the differences between
the template and the morphology of the other tested bones.
Moreover, virtual palpation is prone to errors itself: for the
considered distal femur landmarks a 3D standard deviation
was assessed within 1.8 and 2.9 mm [17].
An inevitable source of error for the method resides in the
morphological difference between the template and the bone
under analysis. Usually, a digital bone specific of the subject is
not available and any other template carries an intrinsic error
associated with inter-subject variability of bone morphology.
In order to reduce this error, it is highly desirable to rely on a
large database of templates representative of different
populations. In addition, an improvement of the subject-
specific bone estimation could be attained if more accurate
UPs were available. This could be accomplished using
suitable imaging equipment, such as ultrasound, to be
integrated in the movement analysis practice.
While the validation of the procedure was practically
limited to a single bone, the femur, at least in principle, its
application can be extended to other bones, provided that a
sufficient portion of their surface is covered with a thin layer
of soft tissue. Extending the present results to overweight
subjects would require further investigations. It should be kept
in mind, however, that when applying stereophotogrammetry
to these subjects, there may be more disruptive error sources
than those associated with anatomical calibration. Extending
the application of the procedure to the whole lower limb
would allow for the evaluation of its effects on 3D kinematics
and kinetics, supporting its clinical applicability. Never-
theless, the UP-CAST anatomical calibration can already be
considered a promising alternative to conventional calibration
in the clinical context, since it improves repeatability, reduces
the required execution time, and can effectively be performed
by non-skilled examiners.
Conflict of interest statement
No party having a direct interest in the results of the
research supporting this article has or will confer a benefit on
the author(s) or on any organization with which the author(s)
is/are associated.
Acknowledgments
This work was supported by the Italian MIUR and by the
University Institute for Movement Science, Roma. Thevirtual
bone was kindly provided by the Laboratory of Biomedical
Technologies, at Istituti Ortopedici Rizzoli, Bologna (http://
www.tecno.ior.it/VRLAB/researchers/repository/BEL_repo-
sitory.html). The advise of Prof. Arnaldo Zelli in the statistical
data processing is gratefully acknowledged.
References
[1] Cappozzo A, Della Croce U, Leardini A, Chiari L. Human movement
analysis using stereophotogrammetry. Part 1. Theoretical background.
Gait Posture 2005;21:186–96.

M. Donati et al. / Gait & Posture 26 (2007) 179–185 185
[2] Wu G, Siegler S, Allard P, Kirtley C, Leardini A, Rosenbaum D, et al.
ISB recommendation on definitions of joint coordinate system of
various joints for the reporting of human joint motion. Part I. Ankle,
hip, and spine. J Biomech 2002;35:543–8.
[3] Della Croce U, Camomilla V, Leardini A, Cappozzo A. Femoral
anatomical frame: assessment of various definitions. Med Eng Phys
2003;25:425–31.
[4] Cappozzo A, Catani F, Della Croce U, Leardini A. Position and
orientation of bones during movement: anatomical frame definition
and determination. Clin Biomech 1995;10:171–8.
[5] Della Croce U, Cappozzo A, Kerrigan DC. Pelvis and lower limb
anatomical landmark calibration precision and its propagation to bone
geometry and joint angles. Med Biol Eng Comput 1999;37:155–61.
[6] Ramakrishnan HK, Kadaba MP. On the estimation of joint kinematics
during gait. J Biomech 1991;24:969–77.
[7] Stagni R, Leardini A, Cappozzo A, Benedetti MG, Cappello A. Effects
of hip joint centre mislocation on gait analysis results. J Biomech
2000;33:1479–87.
[8] Simon SR. Quantification of human motion: gait analysis—benefits
and limitations to its application to clinical problems. J Biomech
2004;37:1869–80.
[9] Cappozzo A, Cappello A, Della Croce U, Pensalfini F. Surface marker
cluster design criteria for 3-D bone movement reconstruction. IEEE
Trans Biomed Eng 1997;44:1165–74.
[10] Hanson R, Norris M. Analysis of measurements based on singular
value decomposition. SIAM J Sci Statist Comp 1981;2:
363–73.
[11] Soderkvist I, Wedin PA. Determining the movements of the skeleton
using well configured markers. J Biomech 1993;26:1473–7.
[12] Donati M, Camomilla V, Cappozzo A. Automatic virtual palpation of
bone landmarks. In: Proceedings of the X Clinical Gait Movement
Analysis Society; 2005.
[13] Van Sint Jan S, Feipel V, Ciaravella C, Martin S. Lower limb
anatomical landmark definition and identification within different
experimental contexts. Tech. Rep. of the IST Vakhum Project (IST-
1999-10954); 2002 [Available: http://www.ulb.ac.be/project/vakhum/
public_report/public_report.htm].
[14] Michalewicz Z. Genetic algorithm + data structures = evolution pro-
grams. New York: Springer-Verlag; 1996.
[15] Spoor CW, Veldpaus FE. Rigid body motion calculated from spatial
co-ordinates of markers. J Biomech 1980;13:391–3.
[16] Cronbach LJ. Coefficient alpha and the internal structure of tests.
Psychometrika 1951;16:297–333.
[17] Van Sint Jan S, Della Croce U. Letter to the Editor: identifying the
location of human skeletal landmarks: Why standardized definitions
are necessary—a proposal. Clin Biomech 2005;20:659–60.