Anatomical Distribution, P - Frontiers
10
ORIGINAL RESEARCH published: 20 December 2021 doi: 10.3389/fcvm.2021.778866 Frontiers in Cardiovascular Medicine | www.frontiersin.org 1 December 2021 | Volume 8 | Article 778866 Edited by: Feifan Ouyang, University Medical Center Hamburg-Eppendorf, Germany Reviewed by: Yangjing Xue, Wenzhou Medical University, China Ardan Muammer Saguner, University Hospital Zürich, Switzerland *Correspondence: Min Tang [email protected] † These authors have contributed equally to this work Specialty section: This article was submitted to Cardiac Rhythmology, a section of the journal Frontiers in Cardiovascular Medicine Received: 17 September 2021 Accepted: 22 November 2021 Published: 20 December 2021 Citation: Weng S, Zhai Z, Tang M, Zhou B, Ding L, Yu F, Qi Y, Zhang H, Feng T and Zhang S (2021) Idiopathic Ventricular Arrhythmias Ablated in Different Subregions of the Aortic Sinuses of Valsalva: Anatomical Distribution, Precordial Electrocardiographic Notch Patterns, and Bipolar Electrographic Characteristics. Front. Cardiovasc. Med. 8:778866. doi: 10.3389/fcvm.2021.778866 Idiopathic Ventricular Arrhythmias Ablated in Different Subregions of the Aortic Sinuses of Valsalva: Anatomical Distribution, Precordial Electrocardiographic Notch Patterns, and Bipolar Electrographic Characteristics Sixian Weng 1† , Zhengqin Zhai 1,2† , Min Tang 1 *, Bin Zhou 1 , Lei Ding 1 , Fengyuan Yu 1 , Yingjie Qi 1 , Hongda Zhang 1 , Tianjie Feng 1 and Shu Zhang 1 1 State Key Laboratory of Cardiovascular Disease, Department of Cardiology, Cardiovascular Institute, Fuwai Hospital, National Center for Cardiovascular Diseases, Chinese Academy of Medical Sciences and Peking Union Medical College, Beijing, China, 2 China-Japan Friendship Hospital, Beijing, China Background: Little is known about the differences among ventricular arrhythmias (VAs) ablated in different subregions of the aortic sinuses of Valsalva (ASVs). We aim to investigate the distribution, precordial electrocardiographic patterns, and bipolar electrogram characteristics of VAs ablated in different subregions of the ASVs. Methods: We divided the right ASV and the left ASV into a total of 6 subregions and studied 51 idiopathic VAs ablated first time successfully in the ASVs. Results: These 51 VAs were inhomogeneously distributed among the 6 subregions, which comprised the right-lateral ASV (1/51), the right-anterior ASV (11/51), the regions along the right (13/51) and left (9/51) sides of the ASV junction, the left-anterior ASV (5/51), and the left-lateral ASV (12/51). Fractionated potentials were dominant (39/51, 76%) among the 3 types of target electrograms. From the right-lateral ASV to the left-lateral ASV, the percentage of fractionated potentials gradually decreased from 100 to 59%. A precordial rebound notch in V3-V4 or V4-V5 had sensitivity of 90.9%, specificity of 85.0%, and negative predictive value (NPV) of 97.1% to predict VAs ablated in the right-anterior ASV. A precordial rebound notch in V2-V3 had sensitivity of 50.0%, specificity of 94.9%, and NPV of 86.0% to predict VAs ablated in the left-lateral ASV. Conclusion: VA targets were mainly distributed in the anterior and the left-lateral ASVs. Fractionated potentials were common among target electrograms, especially in theright-anterolateral ASV. Precordial electrocardiographic rebound notch has high predictive accuracy in identifying different subregions of the ASVs as target ablation sites. Keywords: ventricular arrhythmias, aortic sinuses of Valsalva, bipolar electrogram, target distribution, precordial notch, radiofrequency catheter ablation
-
Upload
khangminh22 -
Category
Documents
-
view
0 -
download
0
Transcript of Anatomical Distribution, P - Frontiers

ORIGINAL RESEARCHpublished: 20 December 2021
doi: 10.3389/fcvm.2021.778866
Frontiers in Cardiovascular Medicine | www.frontiersin.org 1 December 2021 | Volume 8 | Article 778866
Edited by:
Feifan Ouyang,
University Medical Center
Hamburg-Eppendorf, Germany
Reviewed by:
Yangjing Xue,
Wenzhou Medical University, China
Ardan Muammer Saguner,
University Hospital Zürich, Switzerland
*Correspondence:
Min Tang
†These authors have contributed
equally to this work
Specialty section:
This article was submitted to
Cardiac Rhythmology,
a section of the journal
Frontiers in Cardiovascular Medicine
Received: 17 September 2021
Accepted: 22 November 2021
Published: 20 December 2021
Citation:
Weng S, Zhai Z, Tang M, Zhou B,
Ding L, Yu F, Qi Y, Zhang H, Feng T
and Zhang S (2021) Idiopathic
Ventricular Arrhythmias Ablated in
Different Subregions of the Aortic
Sinuses of Valsalva: Anatomical
Distribution, Precordial
Electrocardiographic Notch Patterns,
and Bipolar Electrographic
Characteristics.
Front. Cardiovasc. Med. 8:778866.
doi: 10.3389/fcvm.2021.778866
Idiopathic Ventricular ArrhythmiasAblated in Different Subregions of theAortic Sinuses of Valsalva:Anatomical Distribution, PrecordialElectrocardiographic Notch Patterns,and Bipolar ElectrographicCharacteristicsSixian Weng 1†, Zhengqin Zhai 1,2†, Min Tang 1*, Bin Zhou 1, Lei Ding 1, Fengyuan Yu 1,
Yingjie Qi 1, Hongda Zhang 1, Tianjie Feng 1 and Shu Zhang 1
1 State Key Laboratory of Cardiovascular Disease, Department of Cardiology, Cardiovascular Institute, Fuwai Hospital,
National Center for Cardiovascular Diseases, Chinese Academy of Medical Sciences and Peking Union Medical College,
Beijing, China, 2China-Japan Friendship Hospital, Beijing, China
Background: Little is known about the differences among ventricular arrhythmias
(VAs) ablated in different subregions of the aortic sinuses of Valsalva (ASVs). We aim
to investigate the distribution, precordial electrocardiographic patterns, and bipolar
electrogram characteristics of VAs ablated in different subregions of the ASVs.
Methods: We divided the right ASV and the left ASV into a total of 6 subregions and
studied 51 idiopathic VAs ablated first time successfully in the ASVs.
Results: These 51 VAs were inhomogeneously distributed among the 6 subregions,
which comprised the right-lateral ASV (1/51), the right-anterior ASV (11/51), the regions
along the right (13/51) and left (9/51) sides of the ASV junction, the left-anterior ASV
(5/51), and the left-lateral ASV (12/51). Fractionated potentials were dominant (39/51,
76%) among the 3 types of target electrograms. From the right-lateral ASV to the
left-lateral ASV, the percentage of fractionated potentials gradually decreased from 100 to
59%. A precordial rebound notch in V3-V4 or V4-V5 had sensitivity of 90.9%, specificity
of 85.0%, and negative predictive value (NPV) of 97.1% to predict VAs ablated in
the right-anterior ASV. A precordial rebound notch in V2-V3 had sensitivity of 50.0%,
specificity of 94.9%, and NPV of 86.0% to predict VAs ablated in the left-lateral ASV.
Conclusion: VA targets were mainly distributed in the anterior and the left-lateral
ASVs. Fractionated potentials were common among target electrograms, especially
in theright-anterolateral ASV. Precordial electrocardiographic rebound notch has high
predictive accuracy in identifying different subregions of the ASVs as target ablation sites.
Keywords: ventricular arrhythmias, aortic sinuses of Valsalva, bipolar electrogram, target distribution, precordial
notch, radiofrequency catheter ablation

Weng et al. VAs Ablated in the ASV-Subregions
INTRODUCTION
Idiopathic ventricular arrhythmias (VAs) with theelectrocardiographic inferior axis frequently originate fromthe aortic sinuses of Valsalva (ASVs) (1, 2). Compared to VAsoriginating from the right ventricular outflow tract (RVOT),mapping and ablation are usually challenging for VAs from theASV (ASV-VAs) due to the complicated anatomical constructionof the ASVs, confusion of ECG locations, and the difficulty ofconfirming target electrograms. Thus, a lower radiofrequencycatheter ablation (RFCA) success rate was observed for ASV-VAsthan for VAs originating from the RVOT. Previous studieshave described the electrocardiographic or electrophysiologicalcharacteristics of VAs from the left ASV (3), the right ASV(4), and the left-right commissure (5, 6), while little is knownabout the distributions of VAs in the subregions of the ASVs.In this study, we further divided the left and right ASVs into 6subregions, with the aim of investigating the target distribution,the specific precordial electrocardiographic patterns, andthe bipolar electrographic characteristics of VAs ablated indifferent subregions.
METHODS
Study PopulationThis single-center retrospective study enrolled 65 consecutivepatients with inferior axis deviation and monomorphic VAs whohad no RFCA history and were referred for a first acute successfulRFCA in the ASVs from September 2016 to September 2020 inthe Department of Cardiology, Fuwai Hospital. The exclusioncriteria were as follows: (1) structural heart disease was diagnosedbefore RFCA and (2) VAs with the same ECG morphology thathad been ablated in the 1st procedure recurred during a follow-period of at least 6 months. The clinical data that were analyzedin the study included baseline characteristics, standard 12-leadECGs, intracardiac electrograms, 3-dimensional electroanatomicmapping data, imaging information, and follow-up outcomes.This study was approved by the Ethics Committee of FuwaiHospital (approval no. 2021-1523), Chinese Academy of MedicalSciences, and followed the Declaration of Helsinki. A writteninformed consent was obtained from all the patients.
Three-Dimensional Mapping and RFCAAfter discontinuing antiarrhythmic drugs for at least 5 half-lives and completing preoperative examinations, patientsunderwent mapping and RFCA procedures. We obtained the12-lead ECGs (bandpass filter: 0.05–100Hz) and intracardiacelectrograms (bandpass filter: bipolar 30–500Hz; unipolar 0.1–500Hz) from a multichannel electrophysiology recorder (BardElectrophysiology, Lowell, Massachusetts, USA). Activationmapping was performed using a 3-dimensional electroanatomicmapping system (CARTO3, Biosense Webster Incorporation,Diamond Bar, California, USA) with an irrigated catheter(NaviStar ThermoCool, Biosense Webster Incorporation,Diamond Bar, California, USA) or contact force catheter(Thermocool SmartTouch, Biosense Webster Incorporation,Diamond Bar, California, USA). The mapping catheter was
advanced via an SL1 or SR0 long sheath, if necessary. Heparinwas administered after accessing the femoral artery and was usedto maintain an activated clotting time of 200–250 s. For patientswith a transitional zone index (7) ≥ −0.5, we performed 3-dimensional mapping in the RVOT first; those with a transitionalzone index < −0.5 underwent direct mapping in the ASVs by atransaortic approach. Electroanatomic maps were constructedvia fast anatomic mapping, point-by-point mapping, orintracardiac echocardiography (ICE) reconstruction (Soundstar,Biosense Webster Incorporation, Diamond Bar, California,USA). An ideal target for ablation was based on 3 criteria: (1)the earliest activated site during mapping (≥20ms earlier thanthe QRS onset of VAs); (2) a synchronized onset of distal bipolarand unipolar (QS shape) electrogram; and (3) if possible, apace mapping (match ≥ 95%) was performed to confirm thefinal target if the earliest activated site was unclear or showedlittle difference (<5ms) from other sites. Before ablation, weused selective coronary angiography (using a pigtail catheter orirrigated catheter) or an ICE image to confirm that the distancebetween the target and the coronary ostia was greater than 5mm.RFCA was delivered with a maximum power of 35W and amaximum temperature of 55◦C (irrigated flow rate: 2 ml/min)for up to 60–90 s. An effective RFCA was defined as reduction,disappearance, or acceleration with the same ECG morphologyof VAs within the 1st 10 s. If RFCA did not influence VAs, it wasdiscontinued and the catheter was repositioned. The endpointfor RFCA consisted of the disappearance of VAs for at least20min and the non-inducibility of VAs during isoproterenolinfusion and/or programmed stimulation.
Subregions of the ASVTo determine the differences of VAs inelectrocardiographic/electrophysiological characteristics fromdifferent regions in the ASVs, we further divided the right andleft ASVs into 6 subregions (Figure 1): (1) Right-lateral ASV:the lateral and posterior portions of the right ASV, usuallylocated behind the right coronary ostium; (2) Right-anteriorASV: the anterior portion (center section) of the right ASV,which contained the nadir of the semilunar hinges, usuallylocated between the right coronary ostium and the adjacentleft-right commissure; (3) Right side adjacent to the left-rightcommissure; (4) Left side adjacent to the left-right commissure;(5) Left-anterior ASV: the anterior portion (center section) ofthe left ASV, which contained the nadir of the semilunar hinges,usually located between the left coronary ostium and the adjacentleft-right commissure; and (6) Left-lateral ASV: the lateral andposterior portions of the left ASV, usually located behind theleft coronary ostium. The location of different subregions wasbased on 3-dimensional maps and imaging confirmation (ICEand/or angiography).
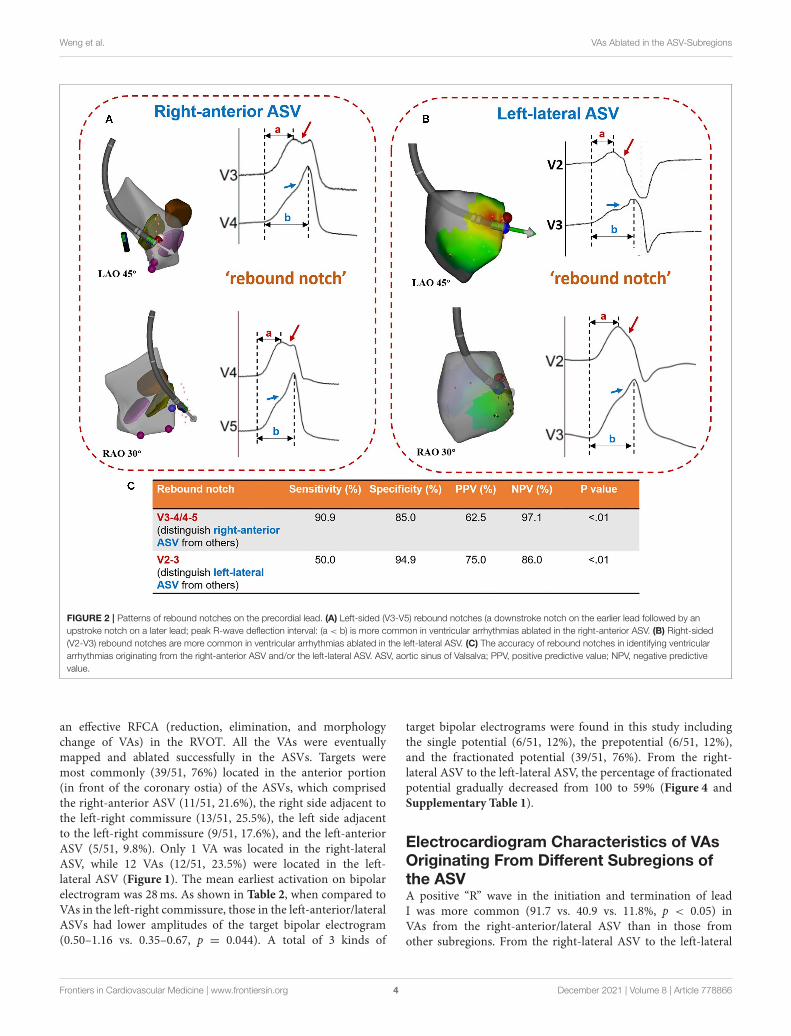
Analysis of ECG and IntracardiacElectrogramsA notch was defined as an extra deflection (not in initiationand termination) in downstroke or upstroke. A precordialelectrocardiographic rebound notch of VAs was defined as adownstroke notch on the earlier lead followed by an upstroke
Frontiers in Cardiovascular Medicine | www.frontiersin.org 2 December 2021 | Volume 8 | Article 778866

Weng et al. VAs Ablated in the ASV-Subregions
FIGURE 1 | Anatomic distributions of ventricular arrhythmias ablated in the ASVs. ASV, aortic sinus of Valsalva; N, non-coronary ASV; L, left ASV; R, right ASV; RCA,
right coronary artery; LCA, left coronary artery; R-Lat., right-lateral ASV; R-Ant., right-anterior ASV; R-Comm., right side adjacent to the left-right commissure;
L-Comm., left side adjacent to the left-right commissure; L-Ant., left-anterior ASV; L-Lat., left-lateral ASV.
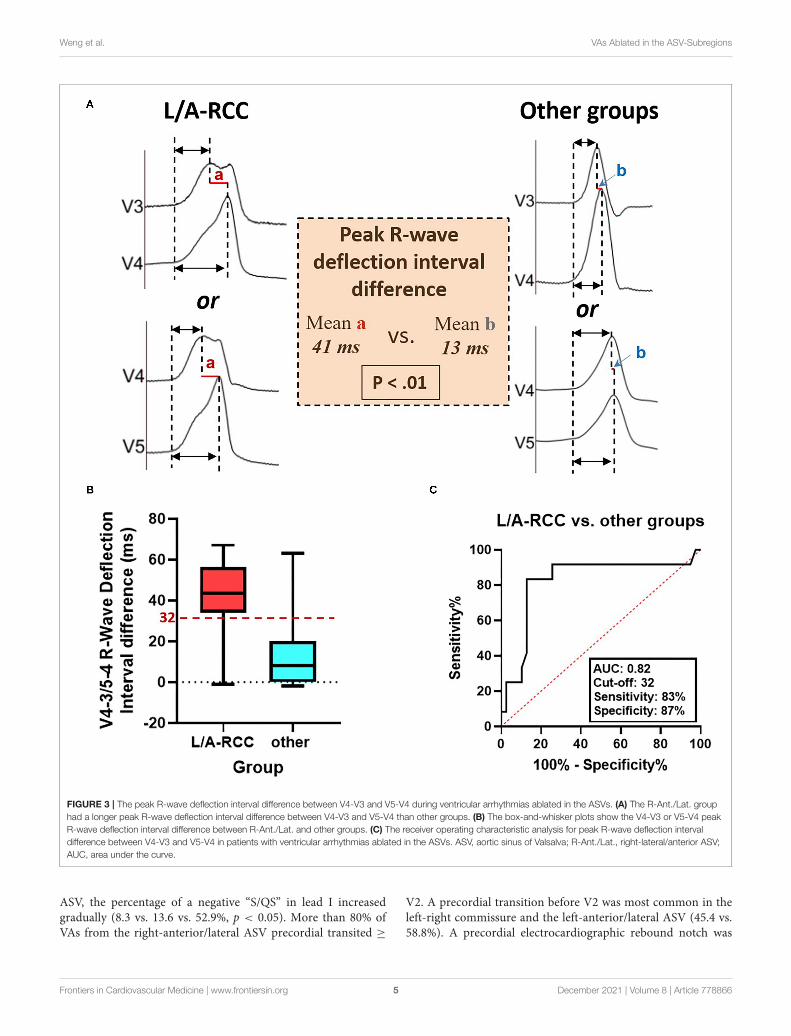
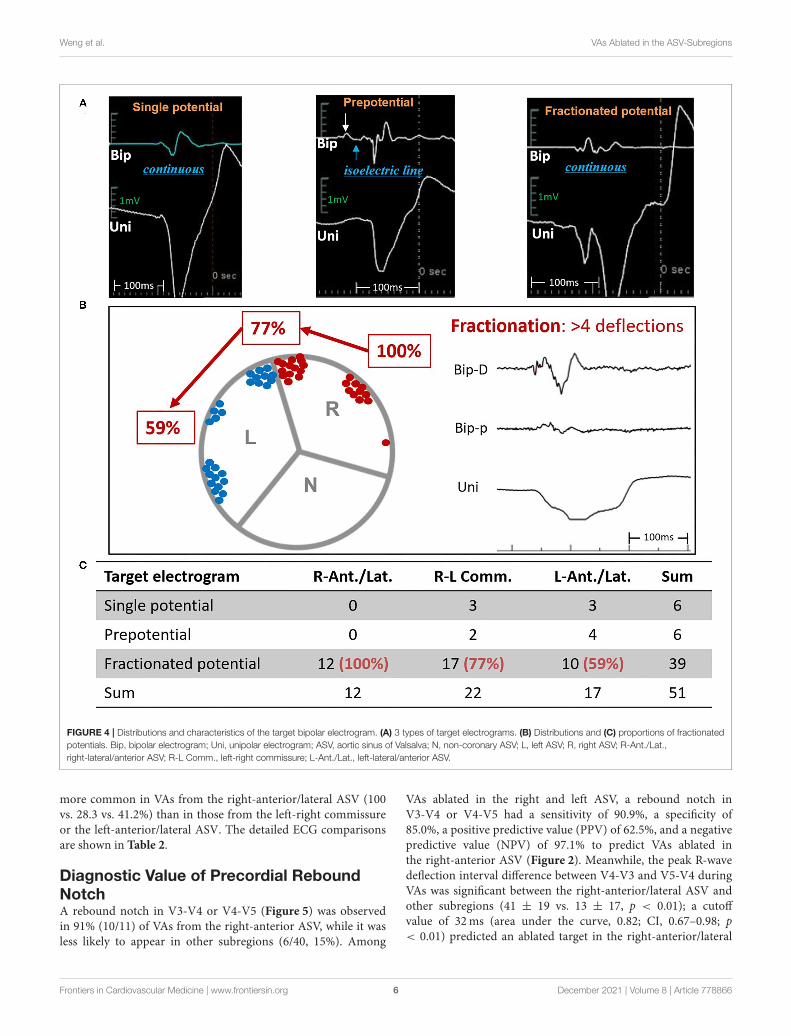
notch on a later lead (Figure 2); this feature can also be quantifiedas the difference of peak R-wave deflection interval (from theearliest QRS onset to the peak R-wave deflection) (8) betweenthe adjacent precordial leads (Figure 3). Data from the bipolarelectrograms of the target in different ASV subregions werefocused on amplitude, duration, and earliest activation. Thebipolar electrogram characteristics of the target were reflected inthe deflection and potential elements (Figure 4).
Follow-UpAll the patients underwent a 12-lead ECG and 24-h Holtermonitoring on the same day, 1 month, 3 months, 6 months,and 12 months after the procedure. Meanwhile, outpatientor telehealth visits were performed when patients experiencedclinical symptoms such as palpitation. Recurrence was definedas a clinical VA (same ECG morphology) burden ≥ 2% in 24-hHolter monitoring.
Statistical AnalysisContinuous variables are expressed as the mean ± SD(normal distribution) or median with interquartile range (non-normal distribution), while categorical variables are described asnumbers or percentages. Continuous variables were comparedusing the one-way ANOVA (normal distribution) or the Mann–Whitney U test (abnormal distribution). Categorical variableswere compared using the chi-squared test. The Bonferroni
correction was applied to multiple comparisons among thedifferent subregions. A box-and-whisker graph and the receiveroperating characteristic curve were used to obtain the bestdiagnostic values. A two-sided p-value < 0.05 was consideredas statistically significant. Data analysis was performed using theSPSS version 21 (IBM Corporation, Armonk, New York, USA).Graphs were obtained using the Prism version 8.0 (GraphPadSoftware Incorporation, La Jolla, California, USA).
RESULTS
Characteristics of the PatientAfter excluding 14 patients (4 patients with structural heartdisease and 10 patients with VA recurrence), a total of 51 patientswith successfully ablated VAs in the ASVs were enrolled inthis study. More than half of the patients were male. Most ofthem were middle aged (Q1–Q3, 39–59 years). All the patientspresented with normal cardiac structure and function withthe clinical symptoms of palpitation and/or presyncope beforeablation. The details of the baseline characteristics are shown inTable 1.
Characteristics of Distribution and BipolarElectrograms in Ablation TargetA total of 20 patients underwent remapping and reablation in theASVs after failed attempts to find an ideal target and/or achieved
Frontiers in Cardiovascular Medicine | www.frontiersin.org 3 December 2021 | Volume 8 | Article 778866
Weng et al. VAs Ablated in the ASV-Subregions
FIGURE 2 | Patterns of rebound notches on the precordial lead. (A) Left-sided (V3-V5) rebound notches (a downstroke notch on the earlier lead followed by an
upstroke notch on a later lead; peak R-wave deflection interval: (a < b) is more common in ventricular arrhythmias ablated in the right-anterior ASV. (B) Right-sided
(V2-V3) rebound notches are more common in ventricular arrhythmias ablated in the left-lateral ASV. (C) The accuracy of rebound notches in identifying ventricular
arrhythmias originating from the right-anterior ASV and/or the left-lateral ASV. ASV, aortic sinus of Valsalva; PPV, positive predictive value; NPV, negative predictive
value.
an effective RFCA (reduction, elimination, and morphologychange of VAs) in the RVOT. All the VAs were eventuallymapped and ablated successfully in the ASVs. Targets weremost commonly (39/51, 76%) located in the anterior portion(in front of the coronary ostia) of the ASVs, which comprisedthe right-anterior ASV (11/51, 21.6%), the right side adjacent tothe left-right commissure (13/51, 25.5%), the left side adjacentto the left-right commissure (9/51, 17.6%), and the left-anteriorASV (5/51, 9.8%). Only 1 VA was located in the right-lateralASV, while 12 VAs (12/51, 23.5%) were located in the left-lateral ASV (Figure 1). The mean earliest activation on bipolarelectrogram was 28ms. As shown in Table 2, when compared toVAs in the left-right commissure, those in the left-anterior/lateralASVs had lower amplitudes of the target bipolar electrogram(0.50–1.16 vs. 0.35–0.67, p = 0.044). A total of 3 kinds of
target bipolar electrograms were found in this study includingthe single potential (6/51, 12%), the prepotential (6/51, 12%),and the fractionated potential (39/51, 76%). From the right-lateral ASV to the left-lateral ASV, the percentage of fractionatedpotential gradually decreased from 100 to 59% (Figure 4 andSupplementary Table 1).
Electrocardiogram Characteristics of VAsOriginating From Different Subregions ofthe ASVA positive “R” wave in the initiation and termination of leadI was more common (91.7 vs. 40.9 vs. 11.8%, p < 0.05) inVAs from the right-anterior/lateral ASV than in those fromother subregions. From the right-lateral ASV to the left-lateral
Frontiers in Cardiovascular Medicine | www.frontiersin.org 4 December 2021 | Volume 8 | Article 778866
Weng et al. VAs Ablated in the ASV-Subregions
FIGURE 3 | The peak R-wave deflection interval difference between V4-V3 and V5-V4 during ventricular arrhythmias ablated in the ASVs. (A) The R-Ant./Lat. group
had a longer peak R-wave deflection interval difference between V4-V3 and V5-V4 than other groups. (B) The box-and-whisker plots show the V4-V3 or V5-V4 peak
R-wave deflection interval difference between R-Ant./Lat. and other groups. (C) The receiver operating characteristic analysis for peak R-wave deflection interval
difference between V4-V3 and V5-V4 in patients with ventricular arrhythmias ablated in the ASVs. ASV, aortic sinus of Valsalva; R-Ant./Lat., right-lateral/anterior ASV;
AUC, area under the curve.
ASV, the percentage of a negative “S/QS” in lead I increasedgradually (8.3 vs. 13.6 vs. 52.9%, p < 0.05). More than 80% ofVAs from the right-anterior/lateral ASV precordial transited ≥
V2. A precordial transition before V2 was most common in theleft-right commissure and the left-anterior/lateral ASV (45.4 vs.58.8%). A precordial electrocardiographic rebound notch was
Frontiers in Cardiovascular Medicine | www.frontiersin.org 5 December 2021 | Volume 8 | Article 778866
Weng et al. VAs Ablated in the ASV-Subregions
FIGURE 4 | Distributions and characteristics of the target bipolar electrogram. (A) 3 types of target electrograms. (B) Distributions and (C) proportions of fractionated
potentials. Bip, bipolar electrogram; Uni, unipolar electrogram; ASV, aortic sinus of Valsalva; N, non-coronary ASV; L, left ASV; R, right ASV; R-Ant./Lat.,
right-lateral/anterior ASV; R-L Comm., left-right commissure; L-Ant./Lat., left-lateral/anterior ASV.
more common in VAs from the right-anterior/lateral ASV (100vs. 28.3 vs. 41.2%) than in those from the left-right commissureor the left-anterior/lateral ASV. The detailed ECG comparisonsare shown in Table 2.
Diagnostic Value of Precordial ReboundNotchA rebound notch in V3-V4 or V4-V5 (Figure 5) was observedin 91% (10/11) of VAs from the right-anterior ASV, while it wasless likely to appear in other subregions (6/40, 15%). Among
VAs ablated in the right and left ASV, a rebound notch inV3-V4 or V4-V5 had a sensitivity of 90.9%, a specificity of85.0%, a positive predictive value (PPV) of 62.5%, and a negativepredictive value (NPV) of 97.1% to predict VAs ablated inthe right-anterior ASV (Figure 2). Meanwhile, the peak R-wavedeflection interval difference between V4-V3 and V5-V4 duringVAs was significant between the right-anterior/lateral ASV andother subregions (41 ± 19 vs. 13 ± 17, p < 0.01); a cutoffvalue of 32ms (area under the curve, 0.82; CI, 0.67–0.98; p< 0.01) predicted an ablated target in the right-anterior/lateral
Frontiers in Cardiovascular Medicine | www.frontiersin.org 6 December 2021 | Volume 8 | Article 778866
Weng et al. VAs Ablated in the ASV-Subregions
ASV with a sensitivity of 83.0% and a specificity of 87.0%(Figure 3).
A rebound notch in V2-V3 during VAs was more commonin the left-lateral ASV (6/12; 50 vs. 5%, p < 0.05). Among VAsablated in the right and left ASV, a rebound notch in V2-V3 hada sensitivity of 50.0%, a specificity of 94.9%, a PPV of 75.0%,
TABLE 1 | Baseline characteristics.
Patient characteristics (N = 51)
Age, y 53 (39–59)
Male, n (%) 31 (61)
Clinical symptoms, n (%)
Palpitations 51 (100)
Presyncope 1 (2)
Syncope 0
Clinical VAs, n (%)
Only PVCs 41 (80)
PVCs, non-sustained VT 8 (16)
PVCs, sustained VT 2 (4)
LVEDD (mm) before ablation 49 (45–54)
LVEF (%) before ablation 64 (60–65)
No. of patients LVEF < 50% 0
VA burden before ablation, beats/24 h 24445 (15000–36000)
Values are presented as the median (Q1–Q3) or n (%). VA, ventricular arrhythmia; PVC,
premature ventricular contraction; LVEDD, left ventricular end-diastolic dimension; LVEF,
left ventricular ejection fraction.
and a NPV of 86.0% to predict VAs ablated in the left-lateralASV (Figure 2). Meanwhile, the peak R-wave deflection intervaldifference between V3 and V2 during VAs seemed greater in theleft-lateral ASV, but showed no significance when compared withother subregions (19 ± 16 vs. 12 ± 11, p > 0.05). A cutoff valueof 31ms had a sensitivity of 33.3% and a specificity of 92.3% topredict VAs ablated in the left-lateral ASV.
The details of different peak R-wave deflection intervals andprecordial rebound notches are given in Supplementary Table 2.
DISCUSSION
Major FindingsThis study revealed the distribution andelectrocardiographic/electrophysiological characteristics ofVAs ablated in different subregions of the ASVs. The mainfindings are as follows:
1. Ventricular arrhythmias from the ASVs aremainly distributedin the anterior and the left lateral portions.
2. Among the 3 kinds of VAs targeting bipolar electrograms inthe ASVs, the fractionated potential was in the majority, butits percentage decreased gradually from the right-lateral to theleft-lateral ASV.
3. Precordial electrocardiographic rebound notch is a simpleand distinct ECG pattern that has a high predictive accuracyfor identifying VA origins in the right-anterior ASV or theleft-lateral ASV.
TABLE 2 | Bipolar electrogram and ECG characteristics during ventricular arrhythmias.
R-Ant./Lat. (N = 12) R-L comm.(N = 22) L-Ant./Lat. (N = 17) P value
Target amplitude, mV 0.56 (0.33–0.99)a,b 0.76 (0.50–1.16)a 0.41 (0.35–0.67)b 0.044*
Target duration, ms 138.9 ± 14.5 139.1 ± 42.6 124.9 ± 35.4 0.416
Earliest activation, ms 25.8 ± 6.0 27.4 ± 7.4 29.5 ± 8.3 0.469
Lead I morphology, n (%)
R/RR’/RSR’ 11 (91.7)a 9 (40.9)b 2 (11.8)b <0.05*
Rs (R/S ≥ 1) 0 6 (27.3) 3 (17.6) >0.05
rS (R/S <1) 0 4 (18.2) 3 (17.6) >0.05
QS, QRS 1 (8.3)a 3 (13.6)a 9 (52.9)b <0.05*
Precordial transition, n (%)
V1 1 (8.3)a 7 (31.8)a,b 9 (52.9)b <0.05*
V1-2 1 (8.3) 3 (13.6) 1 (5.9) >0.05
V2 1 (8.3) 2 (9.1) 0 >0.05
V2-3 4 (33.3) 5 (22.7) 7 (41.2) >0.05
≥V3 5 (41.7) a 5 (22.7) a,b 0b <0.05*
Precordial rebound notch, n (%)
None 0a 16 (72.7)b 10 (58.8)b <0.05*
V1-2 1 (8.3) 0 0 >0.05
V2-3 0 2 (9.1) 6 (35.3) >0.05
V3-4 9 (75) a 2 (9.1) b 1 (5.9) b <0.05*
V4-5 2 (16.7) 2 (9.1) 0 >0.05
Values are presented as the mean ± SD, median (Q1–Q3), or n (%). ASV, aortic sinus of Valsalva; R-Ant./Lat., right-lateral/anterior ASV; R-L Comm., left-right commissure; L-Ant./Lat.,
left-lateral/anterior ASV. a or bDifferent letters indicate intergroup significance; e.g., for the “target amplitude,” significance is shown between R-L Comm. and L-Ant./Lat.
The Bold values and the symbol * highlight the P value < 0.05.
Frontiers in Cardiovascular Medicine | www.frontiersin.org 7 December 2021 | Volume 8 | Article 778866
Weng et al. VAs Ablated in the ASV-Subregions
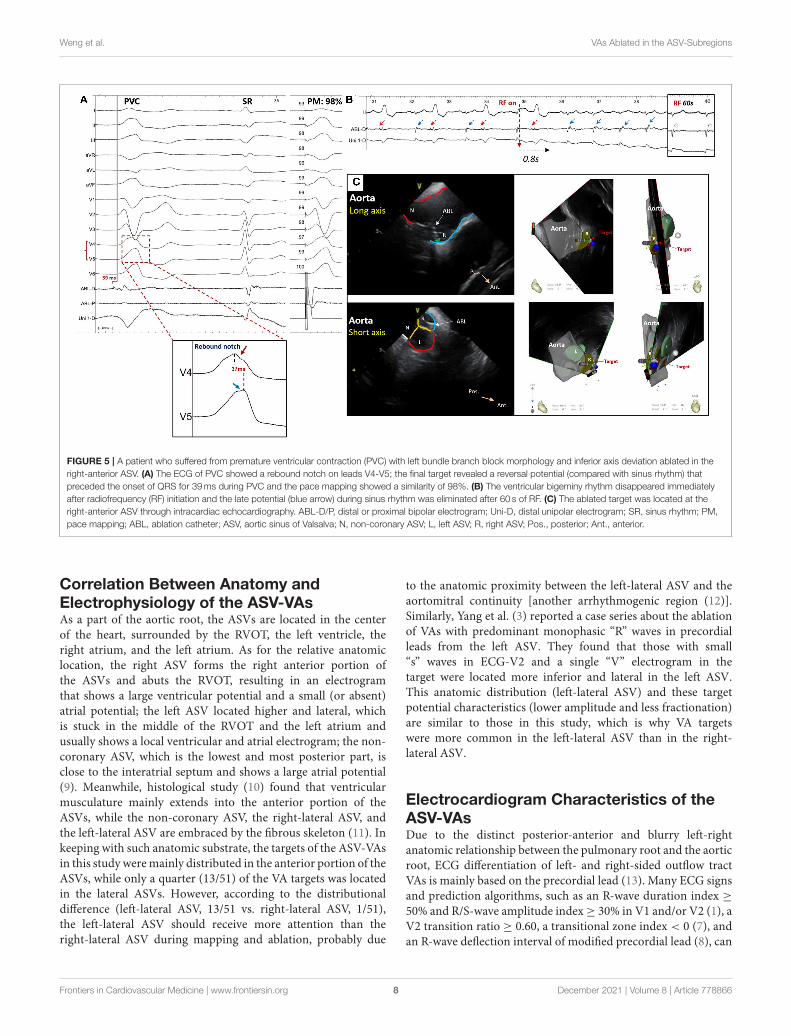
FIGURE 5 | A patient who suffered from premature ventricular contraction (PVC) with left bundle branch block morphology and inferior axis deviation ablated in the
right-anterior ASV. (A) The ECG of PVC showed a rebound notch on leads V4-V5; the final target revealed a reversal potential (compared with sinus rhythm) that
preceded the onset of QRS for 39ms during PVC and the pace mapping showed a similarity of 98%. (B) The ventricular bigeminy rhythm disappeared immediately
after radiofrequency (RF) initiation and the late potential (blue arrow) during sinus rhythm was eliminated after 60 s of RF. (C) The ablated target was located at the
right-anterior ASV through intracardiac echocardiography. ABL-D/P, distal or proximal bipolar electrogram; Uni-D, distal unipolar electrogram; SR, sinus rhythm; PM,
pace mapping; ABL, ablation catheter; ASV, aortic sinus of Valsalva; N, non-coronary ASV; L, left ASV; R, right ASV; Pos., posterior; Ant., anterior.
Correlation Between Anatomy andElectrophysiology of the ASV-VAsAs a part of the aortic root, the ASVs are located in the centerof the heart, surrounded by the RVOT, the left ventricle, theright atrium, and the left atrium. As for the relative anatomiclocation, the right ASV forms the right anterior portion ofthe ASVs and abuts the RVOT, resulting in an electrogramthat shows a large ventricular potential and a small (or absent)atrial potential; the left ASV located higher and lateral, whichis stuck in the middle of the RVOT and the left atrium andusually shows a local ventricular and atrial electrogram; the non-coronary ASV, which is the lowest and most posterior part, isclose to the interatrial septum and shows a large atrial potential(9). Meanwhile, histological study (10) found that ventricularmusculature mainly extends into the anterior portion of theASVs, while the non-coronary ASV, the right-lateral ASV, andthe left-lateral ASV are embraced by the fibrous skeleton (11). Inkeeping with such anatomic substrate, the targets of the ASV-VAsin this study weremainly distributed in the anterior portion of theASVs, while only a quarter (13/51) of the VA targets was locatedin the lateral ASVs. However, according to the distributionaldifference (left-lateral ASV, 13/51 vs. right-lateral ASV, 1/51),the left-lateral ASV should receive more attention than theright-lateral ASV during mapping and ablation, probably due
to the anatomic proximity between the left-lateral ASV and theaortomitral continuity [another arrhythmogenic region (12)].Similarly, Yang et al. (3) reported a case series about the ablationof VAs with predominant monophasic “R” waves in precordialleads from the left ASV. They found that those with small“s” waves in ECG-V2 and a single “V” electrogram in thetarget were located more inferior and lateral in the left ASV.This anatomic distribution (left-lateral ASV) and these targetpotential characteristics (lower amplitude and less fractionation)are similar to those in this study, which is why VA targetswere more common in the left-lateral ASV than in the right-lateral ASV.
Electrocardiogram Characteristics of theASV-VAsDue to the distinct posterior-anterior and blurry left-rightanatomic relationship between the pulmonary root and the aorticroot, ECG differentiation of left- and right-sided outflow tractVAs is mainly based on the precordial lead (13). Many ECG signsand prediction algorithms, such as an R-wave duration index ≥
50% and R/S-wave amplitude index≥ 30% in V1 and/or V2 (1), aV2 transition ratio ≥ 0.60, a transitional zone index < 0 (7), andan R-wave deflection interval of modified precordial lead (8), can
Frontiers in Cardiovascular Medicine | www.frontiersin.org 8 December 2021 | Volume 8 | Article 778866
Weng et al. VAs Ablated in the ASV-Subregions
predict an origin of the left ventricular outflow tract VAs. Withinthe ASVs, different sinuses have different VA ECG characteristics.The right ASV is located inferior, anterior, and to the right ofthe left ASV, which usually presents as a lower amplitude in theinferior lead, a greater positive portion in lead I, and a latertransition in the precordial lead (V2-V3) during VAs recordedin ECG. In contrast to VAs from the right ASV, VAs from the leftASV usually show a larger amplitude in the inferior lead, a greaternegative portion in lead I, and an early transition in the precordiallead (before V2) (2).Moreover, someVAs from the left ASV couldshow predominant monophasic “R” waves in precordial leadswith an “s” wave in lead V2 (3). In addition, a “QRS” pattern(5) in leads V1-V3 and/or a “QS” pattern plus a downstrokenotch (6) in lead V1 with a precordial transition at lead V3might suggest a site of VA origin in the left-right commissure.Occasionally, an ECG pattern of narrower QRS duration, “s”wave in lead III, and smaller III/II ratio indicate an ablation inthe non-coronary ASV, which might be of a para-Hisian origin.However, none of those studies focused on subregions of theASV. This study further divided the right and the left ASVsinto 6 subregions according to the anatomic marks revealed byICE or coronary angiography. In addition to the typical ECGcharacteristics of the ASV-VAs, such as a positive “R” wave inthe initiation and termination of lead I being more common inthe VAs from the right ASV, we also found that the contiguousprecordial electrocardiographic notch patterns could be a novelECG signature for locating different subregions of the ASV. A leftprecordial rebound notch (V3-V4/V4-V5) during VAs indicates aright-anterior subregion, while a right precordial rebound notch(V2-V3) during VAs indicates a left-lateral subregion. Aboveall, this novel precordial ECG sign could provide supplementalevidence for the localization of the ASV-VAs, thus improving theprecision and efficiency of mapping in the ASVs.
Underlying Mechanism of the PrecordialElectrocardiographic Rebound NotchAn electrocardiographic notch in VAs might be related to slowor prolonged conduction. Marchlinski et al. first reported that anR wave notch of the inferior lead was more common in the freewall than in the septum during RVOT pacing, which could beexplained by the sequential activation of the right ventricle andthe left ventricle during pacing from free-wall sites leading toprolonged activation time and causing the electrocardiographicinferior notch (14). Yamada et al. found that VAs originatingfrom the parietal band always presented with a notch in themiddle of any QRS in all the cases, which suggested prolongedtime conduct from the VA origin to the Purkinje system (15).In addition, the “notch” could be a sign of epicardial VAs. Aprecordial pseudodelta wave (upstroke notch) ≥ 34ms has asensitivity of 83% and a specificity of 95% to predict an epicardialorigin (16). Both the upstroke and downstroke notches of theR wave in lead III have a sensitivity of 40.6% and a specificityof 97.5% to predict VAs arising from the distal great cardiacvein (17). Similarly, this study showed that VAs located in theright-anterior ASV, which always show a fractionated potential(slow conduction) in the target bipolar electrogram, are coveredby different kinds of precordial rebound notches (V1-V2, 8.3%;V3-V4, 75%; and V4-V5, 16.7%).
A precordial electrocardiographic rebound notch is defined asa downstroke notch on the earlier lead followed by an upstrokenotch on the later lead, indicating that the adjacent precordialleads have shorter and longer peak R-wave deflection intervals,respectively. Thus, a precordial electrocardiographic reboundnotch is always followed by a larger difference in the peak R-wave deflection interval between the adjacent precordial leads,which may reflect a difference in the local depolarized time. Insummary, activations from different subregions of the ASVs areconducted by different vectors, resulting in different patterns ofthe precordial electrocardiographic rebound notch. Interestingly,we never found a precordial sequential notch (an upstroke notchon the earlier lead followed by a downstroke notch on the laterlead) in the study population.
LIMITATIONS
This retrospective study is limited by the small sample size andsingle center, which prevented us from testing the diagnosticvalue of precordial electrocardiographic rebound notches inpatients with the ASV-VAs in an external validation cohort.Meanwhile, the mechanism of the rebound notch remainsspeculative and unclear. High-density epicardial and endocardialelectroanatomic mapping can reveal the activation patternof the ASV-VAs and may explain this specific precordialelectrocardiographic notch change. Moreover, any target thatwas confirmed by local activation mapping [28ms (22–33ms)]and matching pace mapping could not be definitively recognizedas an origin site because we did not perform high-densityepicardial and endocardial ventricular outflow tract mapping inall the patients. Thus, we used the verb “originate” prudently.In addition, ICE, considered the gold standard for the locationof VAs, was used in only approximately 40% of the populationdue to the retrospective nature of this study. For the rest ofthe patients, detailed coronary angiography plus 3-dimensionalmaps can be an alternative solution. Finally, this study did notenroll patients with VAs originating from the non-coronary ASVbecause of their low incidence rate and uncertain origin (possiblypara-Hisian origin).
CONCLUSION
The targets of the ASV-VAs were distributed mainly in theanterior and the left-lateral ASVs. The fractionated potentialwas dominant in the 3 types of target electrograms, whilethe percentage of target fractionation gradually decreasedfrom the right-lateral to the left-lateral ASVs. A precordialelectrocardiographic rebound notch has high predictive accuracyfor the localization of VAs in the right-anterior or left-lateral ASVs.
DATA AVAILABILITY STATEMENT
The original contributions presented in the study are includedin the article/Supplementary Material, further inquiries can bedirected to the corresponding author/s.
Frontiers in Cardiovascular Medicine | www.frontiersin.org 9 December 2021 | Volume 8 | Article 778866
Weng et al. VAs Ablated in the ASV-Subregions
ETHICS STATEMENT
The studies involving human participants were reviewed andapproved by Ethics Committee of Fuwai Hospital. Writteninformed consent to participate in this study was provided bythe participants’ legal guardian/next of kin. Written informedconsent was obtained from the individual(s) for the publicationof any potentially identifiable images or data included inthis article.
AUTHOR CONTRIBUTIONS
All the authors contributed to the study conception anddesign. Material preparation, data collection, and analysiswere performed by SW, MT, and ZZ. The first draft of
the manuscript was written by SW and all the authorscommented on previous versions of the manuscript.All the authors read and approved the final version ofthe manuscript.
FUNDING
This work was supported by the National Natural ScienceFoundation of China (Grant No. 61527811).
SUPPLEMENTARY MATERIAL
The Supplementary Material for this article can be foundonline at: https://www.frontiersin.org/articles/10.3389/fcvm.2021.778866/full#supplementary-material
REFERENCES
1. Ouyang F, Fotuhi P, Ho SY, Hebe J, Volkmer M, Goya M, et al. Repetitive
monomorphic ventricular tachycardia originating from the aortic sinus cusp:
electrocardiographic characterization for guiding catheter ablation. J Am Coll
Cardiol. (2002) 39:500–8. doi: 10.1016/S0735-1097(01)01767-3
2. Yamada T, McElderry HT, Doppalapudi H, Murakami Y, Yoshida Y, Yoshida
N, et al. Idiopathic ventricular arrhythmias originating from the aortic root
prevalence, electrocardiographic and electrophysiologic characteristics, and
results of radiofrequency catheter ablation. J Am Coll Cardiol. (2008) 52:139–
47. doi: 10.1016/j.jacc.2008.03.040
3. Yang JD, Sun Q, Guo XG, Zhou GB, Liu X, Luo B, et al. Ablation
of ventricular arrhythmias with predominant monophasic “R” waves in
precordial leads from the left sinus of Valsalva: Electrocardiographic and
electrophysiologic characteristics. J Cardiovasc Electrophysiol. (2019) 30:541–
9. doi: 10.1111/jce.13845
4. Wang Y, Liang Z, Wu S, Han Z, Ren X. Idiopathic ventricular arrhythmias
originating from the right coronary sinus: Prevalence, electrocardiographic
and electrophysiological characteristics, and catheter ablation. Heart Rhythm.
(2018) 15:81–9. doi: 10.1016/j.hrthm.2017.09.008
5. Yamada T, Yoshida N, Murakami Y, Okada T, Muto M, Murohara
T, et al. Electrocardiographic characteristics of ventricular arrhythmias
originating from the junction of the left and right coronary sinuses
of Valsalva in the aorta: the activation pattern as a rationale for
the electrocardiographic characteristics. Heart Rhythm. (2008) 5:184–
92. doi: 10.1016/j.hrthm.2007.09.029
6. Bala R, Garcia FC, Hutchinson MD, Gerstenfeld EP, Dhruvakumar S, Dixit
S, et al. Electrocardiographic and electrophysiologic features of ventricular
arrhythmias originating from the right/left coronary cusp commissure. Heart
Rhythm. (2010) 7:312–22. doi: 10.1016/j.hrthm.2009.11.017
7. Yoshida N, Inden Y, Uchikawa T, Kamiya H, Kitamura K, Shimano
M, et al. Novel transitional zone index allows more accurate
differentiation between idiopathic right ventricular outflow tract
and aortic sinus cusp ventricular arrhythmias. Heart Rhythm. (2011)
8:349–56. doi: 10.1016/j.hrthm.2010.11.023
8. Anderson RD, Kumar S, Binny S, Prabhu M, Al-Kaisey A, Parameswaran
R, et al. Modified precordial lead R-wave deflection interval predicts left-
and right-sided idiopathic outflow tract ventricular arrhythmias. JACC Clin
Electrophysiol. (2020) 6:1405–19. doi: 10.1016/j.jacep.2020.07.011
9. Sasaki T, Hachiya H, Hirao K, Higuchi K, Hayashi T, Furukawa T, et al. Utility
of distinctive local electrogram pattern and aortographic anatomical position
in catheter manipulation at coronary cusps. J Cardiovasc Electrophysiol. (2011)
22:521–9. doi: 10.1111/j.1540-8167.2010.01957.x
10. Hasdemir C, Aktas S, Govsa F, Aktas EO, Kocak A, Bozkaya YT, et al.
Demonstration of ventricular myocardial extensions into the pulmonary
artery and aorta beyond the ventriculo-arterial junction. Pacing Clin
Electrophysiol PACE. (2007) 30:534–9. doi: 10.1111/j.1540-8159.2007.00704.x
11. Saremi F, Sánchez-Quintana D, Mori S, Muresian H, Spicer DE, Hassani
C, et al. Fibrous skeleton of the heart: anatomic overview and evaluation
of pathologic conditions with CT and MR imaging. Radiographics. (2017)
37:1330–51. doi: 10.1148/rg.2017170004
12. Chen J, Hoff PI, Rossvoll O, De Bortoli A, Solheim E, Sun L, et al. Ventricular
arrhythmias originating from the aortomitral continuity: an uncommon
variant of left ventricular outflow tract tachycardia. Europace. (2012) 14:388–
95. doi: 10.1093/europace/eur318
13. Anderson RD, Kumar S, Parameswaran R, Wong G, Voskoboinik
A, Sugumar H, et al. Differentiating right- and left-sided outflow
tract ventricular arrhythmias. Circul Arrhythmia Electrophysiol. (2019)
12:e007392. doi: 10.1161/CIRCEP.119.007392
14. Dixit S, Gerstenfeld EP, Callans DJ, Marchlinski FE. Electrocardiographic
patterns of superior right ventricular outflow tract tachycardias:
distinguishing septal and free-wall sites of origin. J Cardiovasc Electrophysiol.
(2003) 14:1–7. doi: 10.1046/j.1540-8167.2003.02404.x
15. Yamada T, Yoshida N, Itoh T, Litovsky SH, Doppalapudi H, McElderry
HT, et al. Idiopathic ventricular arrhythmias originating from the parietal
band: electrocardiographic and electrophysiological characteristics and
outcome of catheter ablation. Circul Arrhythmia Electrophysiol. (2017)
10:e005099. doi: 10.1161/CIRCEP.117.005099
16. Berruezo A, Mont L, Nava S, Chueca E, Bartholomay E,
Brugada J. Electrocardiographic recognition of the epicardial
origin of ventricular tachycardias. Circulation. (2004) 109:1842–
7. doi: 10.1161/01.CIR.0000125525.04081.4B
17. Lin YN, Xu J, Pan YQ, Zheng C, Lin JX Li J, et al. An electrocardiographic sign
of idiopathic ventricular tachycardia ablatable from the distal great cardiac
vein. Heart rhythm. (2020) 17:905–14. doi: 10.1016/j.hrthm.2020.01.027
Conflict of Interest: The authors declare that the research was conducted in the
absence of any commercial or financial relationships that could be construed as a
potential conflict of interest.
Publisher’s Note: All claims expressed in this article are solely those of the authors
and do not necessarily represent those of their affiliated organizations, or those of
the publisher, the editors and the reviewers. Any product that may be evaluated in
this article, or claim that may be made by its manufacturer, is not guaranteed or
endorsed by the publisher.
Copyright © 2021 Weng, Zhai, Tang, Zhou, Ding, Yu, Qi, Zhang, Feng and Zhang.
This is an open-access article distributed under the terms of the Creative Commons
Attribution License (CC BY). The use, distribution or reproduction in other forums
is permitted, provided the original author(s) and the copyright owner(s) are credited
and that the original publication in this journal is cited, in accordance with accepted
academic practice. No use, distribution or reproduction is permitted which does not
comply with these terms.
Frontiers in Cardiovascular Medicine | www.frontiersin.org 10 December 2021 | Volume 8 | Article 778866