Barings ASEAN Frontiers Equity Strategy
75
Barings ASEAN Frontiers Equity Strategy 1Q 2022 For Investment Professionals only (HK: 22/2186947)
-
Upload
khangminh22 -
Category
Documents
-
view
9 -
download
0
Transcript of Barings ASEAN Frontiers Equity Strategy

Barings ASEAN Frontiers Equity Strategy
1Q 2022
For Investment Professionals only
(HK: 22/2186947)

For investment professionals only 2
Barings Overview
1. Includes third party, external AUM only.
All figures are as of March 31, 2022 unless otherwise indicated. Assets shown are denominated in USD. Percentages may not equal 100 due to
rounding.
Investment Offices Global Headquarters Other Locations
• Barings is a GLOBAL INVESTMENT MANAGER sourcing differentiated
opportunities and building portfolios across public and private fixed income,
real estate and specialist equity markets
• A subsidiary of MASSMUTUAL, we have the financial stability and flexibility to
take a long-term approach
• Our GLOBAL FOOTPRINT gives us a broad perspective and the ability to truly
partner with our clients to invest across North America, Europe and Asia Pacific
• We are committed to SUSTAINABLE PRACTICES AND RESPONSIBLE
INVESTMENT as we aim to serve our clients, communities and employees
ASSETS UNDER MANAGEMENT
1,200+EXTERNAL CLIENTS
1,800+PROFESSIONALS GLOBALLY
EXTERNAL AUM BY REGION1
38%
31%
31%
Americas Asia Pacific EMEA
B$371+

For investment professionals only 3
PUBLIC EQUITIES & MULTI ASSET2
Aims to deliver superior risk-adjusted returns through fundamental
analysis and high-conviction, high-active share solutions
GLOBAL & INTERNATIONAL EQUITIES
$3.3 B AUM
EMERGING MARKET EQUITIES
$7.4 B AUM
SMALL CAP EQUITIES
$3.3 B AUM
MULTI ASSET
$2.6 B AUM
Global Investment Capabilities
1. Excludes the Korean fixed income strategy totaling $1.6 billion in AUM.
2. Excludes the Korean domestic equities strategy, which has $9.5 billion in AUM and other equities of $0.1 billion.
3. Includes the EM Corporate Debt strategy, which has $5.9 billion in AUM.
4. Represents dedicated capital solutions accounts and does not include assets managed in other cross-platform portfolios.
5. Projected AUM figures.
6. Includes real estate debt assets that are managed as part of affiliated fixed income portfolios.
All figures are as of March 31, 2022 unless otherwise indicated. Assets shown are denominated in USD.
Barings leverages its DEPTH AND BREADTH OF EXPERTISE across public
and private markets to help meet our clients’ evolving investment needs
PUBLIC FIXED INCOME1
Provides access to strategies ranging from investment grade
to high yield across developed and emerging markets
INVESTMENT GRADE
$110.5 B AUM
HIGH YIELD BONDS & LOANS3
$61.0 B AUM
STRUCTURED CREDIT
$22.7 B AUM
GLOBAL SOVEREIGN DEBT & CURRENCIES
$15.8 B AUM
PRIVATE CREDIT
Offers a diverse range of private debt financing
solutions by partnering with our broad industry network
GLOBAL PRIVATE FINANCE
$35.9 B AUM
INFRASTRUCTURE & PRIVATE PLACEMENTS
$42.6 B AUM
REAL ESTATE5
Provides a broad spectrum of solutions across
private real estate debt and equity
REAL ESTATE DEBT6
$29.2 B AUM
REAL ESTATE EQUITY
$17.4 B AUM
PRIVATE EQUITY5
Leverages our global presence in an effort to identify
unique risk-adjusted return opportunities
DIRECT PRIVATE EQUITY
$2.6 B AUM
FUNDS & CO-INVESTMENTS
$5.3 B AUM
MULTI STRATEGY
Utilize our expansive asset market coverage to offer solutions such as income, target return and absolute return
PUBLIC
PRIVATE
CAPITAL SOLUTIONS4
$0.8 B AUM

For investment professionals only 4
Barings achieved a LEED GOLD CERTIFICATION for our global Charlotte headquarters, a BREEAM
EXCELLENT RATING for our London office, and a LEED GOLD CERTIFICATION for our Shanghai office.
Our dedicated resources help develop and
deliver our sustainability and ESG strategy, policy,
partnerships, research, training and reporting.
We are a signatory to the Principles
for Responsible Investment, a member of the
United Nations Global Compact and Climate
Action 100+, and public supporters of the Task
Force on Climate-related Financial Disclosures.
We work to advance the missions of these
industry partnerships.
Our Sustainability Committee consists of senior
business leaders and is tasked with supporting
sustainability strategy execution.
Our Sustainability Working Groups focus on long-
term strategic projects and regularly meet and
report to the Sustainability Committee.
FORMAL GOVERNANCE DEDICATED RESOURCES INDUSTRY PARTNERS
WE ARE DELIBERATE IN OUR DIRECTION, PARTNERSHIPS AND
DECISION MAKING TO ACHIEVE LONG-TERM, LASTING CHANGE
We integrate environmental, social
and governance information into our analysis
and decision-making across our investment
teams and business lines.
We are active stewards of the entities in which
we invest; this goes hand-in-hand with our active
investment approach. We believe the best way to
advance change is by rewarding progress.
ESG is ingrained in our business activities
through our corporate responsibility program. This
includes our Barings Social Impact philanthropic
program, as well as our focus on diversity, equity
and inclusion across our business.
ESG INTEGRATION STEWARDSHIP CORPORATE RESPONSIBILITY
OUR SUSTAINABILITY GOVERNANCE, RESOURCES AND PARTNERSHIPS
Investing in Lasting Change, Together

For investment professionals only 5
Our Commitment To Diversity, Equity & Inclusion
To foster an EQUITABLE AND INCLUSIVE environment where everyone can succeed
PHILOSOPHY OUR APPROACH CULTURE
The varying backgrounds, life experiences and
perspectives of our people influence our
approach to investing and creating culture.
Outcome and impact-centered global strategy
tailored to regional needs. Leaders first.
Managers model. Everyone’s responsible.
Maintain a culture of respect and integrity that
prioritizes genuine interactions and courageous
conversations to encourage authenticity,
belonging and psychological safety.
PEOPLE FOCUS COMMUNITY IMPACT PARTNERSHIPS
Six Employee Resource Groups (ERG) support
overall strategy and help build community,
utilizing culture surveys and focus groups to
collect qualitative data and regularly assess
impact.
Cross-collaboration with Barings Social Impact
and other teams to effectuate broader impact for
diverse communities.
Evaluate talent opportunities and gaps,
and actively partner with organizations to
broaden access to entry, mid- and
senior-level diverse talent.
MISSION

For investment professionals only 6
Equity Platform with Research at its CentreEquity Platform with Research at its Centre
Research57 Investment
Professionals
Globally
Source: Barings, March 31, 2022.
Number in brackets indicates years of industry experience as at March 31, 2022.
*AUM in USD as at March 31, 2022. AUM excludes BAMK, Active Passive and Active Quant.
Three groups served by a central research hub supporting an active investment platform
• Manage $14.2bn* of equity strategies across Developed and Emerging
markets.
• Investment approach characterized by:
– Active management and active ownership
– Differentiated fundamental research;
– Portfolio construction informed by asset class characteristics
• Ability to tailor strategies to meet client requirements.
PLATFORM OVERVIEW
• Centralized research team, with continuous interaction across groups.
• Regional expertise and global sector-focused teams for Resources,
Healthcare, and Technology.
• Specialist investment teams draw on the broader research platform in
addition to dedicated resources.
• Supported by 5 Dealers, 6 Client Portfolio Managers and Investment
Specialists.
RESEARCH AND PORTFOLIO TEAM
CORE PRODUCT OFFERING
EmergingWilliam Palmer (28)
Michael Levy (26)
$7.5bn*
Small and Mid CapNicholas Williams (31)
$3.3bn*
Global & InternationalDavid Bertocchi (23)
$3.4bn*
Research45+ Investment
Professionals
Globally

For investment professionals only 7
Barings ASEAN Frontiers Equity Strategy
Source: Barings, March 31, 2022.
*Relative to the MSCI AC ASEAN (Total Net Return) Index. Investors should bear in mind that these are return targets, rather than actual returns, and the fund may
experience substantial loss. There can be no assurance that such return targets will be achieved. AUM rounded to the nearest US$10m, gross assets. ** Barings
ASEAN Frontiers Fund was endorsed by RSMR as a Rated fund in 2021. Barings ASEAN Frontiers Fund was awarded BENCHMARK Fund of the Year Awards 2020
ASEAN Equity—Best-in-Class in Hong Kong, based on its performance between October 1, 2019 and September 30, 2020. Barings ASEAN Frontiers Fund was
awarded BENCHMARK Fund of the Year Awards 2019 ASEAN Equity—Best-in-Class in Hong Kong, based on its performance between October 1, 2018 and
September 30, 2019. The Fund was awarded Bloomberg Businessweek (Chinese Edition) Top Fund Awards 2019 ASEAN Equity—Best Performer, based on its
performance between October 2, 2014 to September 30, 2019. . Please note that Barings ASEAN Frontiers Fund is not available to US investors.
Barings Global Emerging Markets Equity
AUM $570 million
Benchmark MSCI AC ASEAN (Total Net Return) Index
Objective 3% gross outperformance of benchmark*
Team Location Singapore, Hong Kong
Vehicles UCITS, Separate accounts
ESG Integrated ESG and Active Engagement (SFDR: Article 8)
Awards**
BARINGS ASEAN FRONTIERS EQUITY STRATEGY
Investment Process

For investment professionals only 9
Barings’ ASEAN Frontiers Equity Strategy Overview
Philosophy, Style and Process
Investment Philosophy
Investment Style
Investment Process
• We believe that Equity markets are both inefficient and risky
• Attractive risk-adjusted returns can be achieved through fundamental bottom-up stock selection and a
disciplined portfolio construction process
• Growth at a Reasonable Price (GARP)
• Our Key Differentiators:
• Extensive primary research supported by a large team of experienced EM professionals
• Proprietary fundamental analysis evaluating companies over a 5 year research horizon
• Fully integrated dynamic ESG assessment and active engagement
• Macro considerations incorporated through our Cost of Equity approach
• Proprietary risk management tools support portfolio construction

For investment professionals only 10
Barings ASEAN Frontiers Equity Strategy
Source: Barings, March 31, 2022.
SooHai Lim and Tiebin Liu are the co-managers of the Barings ASEAN Frontiers Equity Strategy,
and are essentially the strategy’s ultimate decision makers
Investment Experience: 24 Years
Firm Tenure: 16 Years
Investment Experience: 12 Years
Firm Tenure: <1 Year
SooHai LimHEAD OF ASIA EX-CHINA EQUITIES
Tiebin LiuINVESTMENT MANAGER

For investment professionals only 11
Asia Equity Investment Team
Barings Asian Equity Investment Team also leverages the expertise of dedicated HK China Equity investment
professionals for portfolio management
*Based in Shanghai. **Shared Resources
Source: Barings, April 2022. Years of investment experience as at March 31, 2022.
Manager/Analyst
Investment
Experience
(Years)
Hong Kong China equities
William Fong 21
Nicola Lai 15
Baiding Rong 13
Nathan Jiang* 12
Alick Lu 12
Alan Lee 9
Freya Liu* 6
Stephen Yin 4
Salinas Zhang 3
Resources (Asia)
Maggie Sheng** 7
SooHai LimHead of Asia ex-China Equities
24 years of investment experience
Based in Singapore
Eunice HongInvestment Manager
15 years of investment experience
Based in Singapore
Barings Hong Kong China Equity Investment Team
Kuldeep KhanapurkarInvestment Manager
15 years of investment experience
Based in Hong Kong
Julie LeeInvestment Analyst
14 years of investment experience
Based in Singapore
Tiebin LiuInvestment Manager
12 years of investment experience
Based in Hong Kong
Yvonne TsaiInvestment Analyst
13 years of investment experience
Based in Taiwan
Zachary OngInvestment Analyst
6 years of investment experience
Based in Singapore

For investment professionals only 12
Global Emerging Markets Equity Team Research Capabilities
The Global Emerging Markets equity team leverages the expertise of 29 dedicated investment professionals:
• 14 years average investment experience
• Diversity across regional teams with 15+ different nationalities represented
• Providing in-depth research coverage of 500 emerging market companies
Source: Barings: Team Snapshot as of April 2022; number in brackets indicates years of industry experience as of March 31, 2022.
*Global Head of Equities; **Dual role as Equity Business Analyst
Global Emerging Markets Equity Leadership
William Palmer (28) – Asia Pacific (ex-Japan)
Co-Head of Global Emerging Markets Equity
Michael Levy (26) – EM (ex-Asia)
Co-Head of Global Emerging Markets Equity
Asia Pacific
Soo-Hai Lim (24)
Eunice Hong (15)
Kuldeep Khanapurkar (15)
Tiebin Liu (12)
Julie Lee (14)
Yvonne Tsai (13)
Zachary Ong (6)
China
William Fong (21)
Nicola Lai (15)
Baiding Rong (13)
Nathan Jiang (12)
Alick Lu (12)
Alan Lee (9)
Maggie Sheng (7)
Freya Liu (6)
Stephen Yin (4)
Salinas Zhang (3)
EMEA
Matthias Siller (24)
Ghadir Cooper (26)*
Maria Szczesna (15)
Adnan El-Araby (12)
Timothy Eklund (11)
Alay Patel (10)
LATAM
Mike Simpson (23)
Luis Alves De Lima (16)
Isabelle Irish (16)
ESG Equity Coordinator
Marios Halloumis (5)**

For investment professionals only 13
Refining the Investment Universe
From the unconstrained universe to portfolio candidates
Liquidity assessment
– Exclude companies with insufficient liquidity
Identifying GARP investible universe
– Growth at a reasonable price characteristics
– Commitment and competence of the management
– Accounting practices and transparency (ESG factors)
In-depth fundamental research
– Company meetings and fundamental analysis with all research
centrally stored and accessible to all investment professionals
Portfolio candidates
– Presented and debated with the investment team during various
collaborative interactions
Unconstrained
Equity
Universe
Liquidity
Evaluation
GARP
Universe
In-depth
fundamental
research
Portfolio
candidates

For investment professionals only 14
Fundamental Research – Consistent Company Scorecard
A consistent research approach helps evaluate companies and determine attractiveness by country and sector
Each company is rated on a scale of 1-5, with a 1 score being the most favourable and a 5 score, the least attractive.
Source: Barings, March 2022.
Growth Quality Valuation
- Historical – last 3-years’ earnings growth
- Near-term – next 12-months’ earnings growth
- Long-term – next 5-years’ forecast earnings
growth
- Franchise – competitive advantage,
efficiency, stability
- Management – competence, commitment
and alignment with shareholder Interest
- Balance sheet – cash flow, working capital,
capital structure analysis
- Barings valuation Approach – 5-years
discounted by our Cost of Equity to set price
target and determine upside
Company Score [1-5]
Sector / Industry / Macro Dynamics
5 Year Proprietary Financial Forecasts
ESG considerationsKey I
np
uts
Company Meetings

For investment professionals only 15
Fundamental Research – Company Meetings
Our EM Equity platform completed approximately 2500 company interactions in 2021
Source: Barings.
*Data representative of typical format split, based on 2019 data.
5 Year Proprietary Financial Forecasts
Sector / Industry / Macro Dynamics
ESG Considerations
Company Meetings
Is your market share sustainable?
What is the trend in profit margins?
How will the product mix change?
What is the industry likely to grow at?
What will be your effective tax rate?
40%
37%
23%
Meeting Format*
One to One Meeting Group Meeting Management Call
For investment professionals only 16
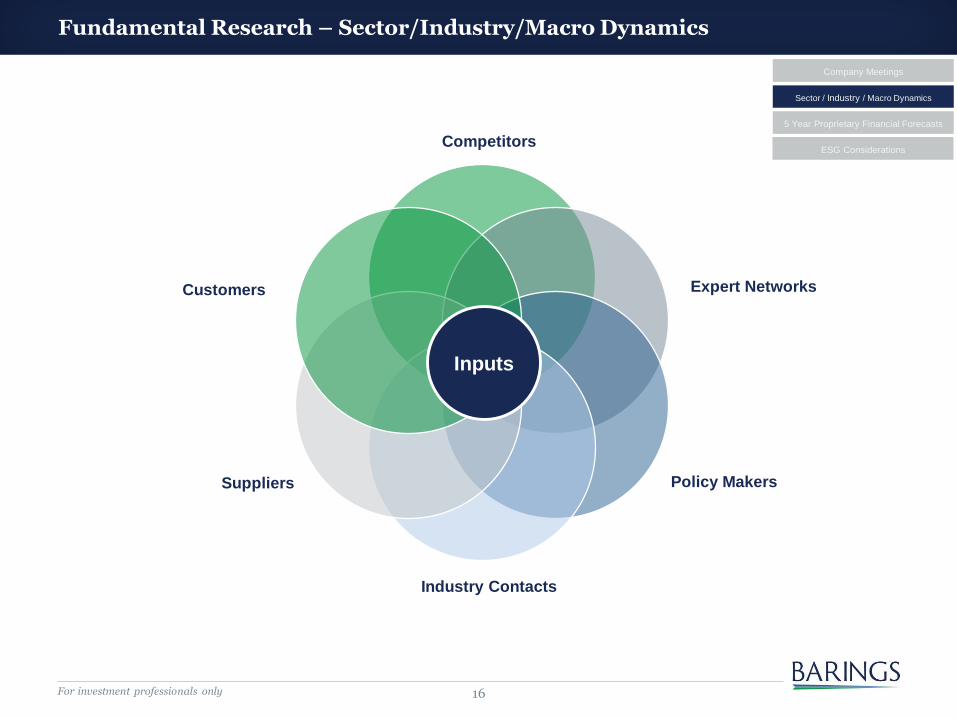
Competitors
Expert Networks
Policy Makers
Industry Contacts
Suppliers
Customers
Inputs
Fundamental Research – Sector/Industry/Macro Dynamics
5 Year Proprietary Financial Forecasts
Sector / Industry / Macro Dynamics
ESG Considerations
Company Meetings

For investment professionals only 17
Fundamental Research – 5 Year Proprietary Financial Forecasts
We produce financial models and earnings forecasts over a five-year research horizon
For illustrative purposes only.
Source, Barings, Factset, March 2022. *Estimates based on weighted average constituents of MSCI AC ASEAN index.
5 Year Proprietary Financial Forecasts
Sector / Industry / Macro Dynamics
ESG Considerations
Company Meetings
Cash Flow Statement
($ Mn) 2021 2022e 2023e 2024e 2025e 2026e
Depreciation & Amortization 1,420 1,557 1,694 1,824 1,970 2,126
Capital expenditures 3,175 3,407 3,654 3,917 4,197 3,175Balance Sheet
($ Mn) 2021 2022e 2023e 2024e 2025e 2026e
Assets
Total current assets 20,289 21,163 22,100 23,219 24,561 26,146
Total non-current assets 20,541 22,222 24,003 25,905 27,928 30,080
Liabilities
Total liabilities 27,727 29,785 31,991 34,323 36,814 39,467
Equity 13,103 13,600 14,112 14,801 15,675 16,759
Income Statement
($ Mn) 2021 2022e 2023e 2024e 2025e 2026e
Revenues 141,576 151,992 163,091 174,910 187,494 200,892
Cost of sales 123,152 132,213 141,867 152,148 163,095 174,749
Gross profit 18,424 19,780 21,224 22,762 24,400 26,143
EBIT 4,480 4,811 5,168 5,548 5,952 6,382
Pre-tax profit 4,442 4,744 5,161 5,520 5,911 6,366
Net profit 3,134 3,634 3,716 3,974 4,256 4,584
DPS 1.47 1.79 2.05 2.35 2.69 3.09
EPS 7.09 8.35 8.67 9.40 10.21 11.14
Limited Sell Side Forecast
0
2
4
6
8
10
12
14
16
18
2022e 2023e 2024e 2025e 2026e
SELL SIDE ANALYST ESTIMATES PER COMPANY*

For investment professionals only 18
For illustrative purposes only. We will not directly invest in companies that violate International Conventions – please refer to our Active Engagement policy
for further details. Source: Barings, March 2022.
Unfavorable Not improving Improving Exemplary
Fundamental Research – ESG Integration
How ESG adds value
• Uncover risks not apparent from traditional fundamental analysis
• Highlights more sustainable business practices and investment opportunities
Our dynamic approach
• We look for signs of improving or deteriorating ESG standards
Proprietary assessment
• ESG due diligence is based on our company knowledge and regular management interaction
• Each company is evaluated on 9 key ESG topics scored from “Unfavorable” to “Exemplary”
• Overall assessment score impacts the Barings Cost of Equity (COE), valuation and Company Scorecard
• We engage with companies on material ESG issues
-1% to COE+2% to COE
Part of our fundamental research due diligence
5 Year Proprietary Financial Forecasts
Sector / Industry / Macro Dynamics
ESG Considerations
Company Meetings
2020 UNPRI
SCORE
BARINGS
SCORE
MEDIAN
SCORE
Incorporation A+ A
Active
EngagementA B

For investment professionals only 19
Change to Cost of Equity: +0.67%
9 key topicsScore /
Rationale
Data / Issues to
consider
Sustainability
Of The
Business Model
(Franchise)
1 Employee Satisfaction Improving
Astra provides a comprehensive, structured and tiered competence and leadership development
program. Employees remuneration policies are tied by the consideration of internal fairness and
external competitiveness, which are reviewed annually. Safety training is provided to all manufacturing
employees. Its plants are ISO45001 (Occupational health and safety), OHSAS 180010, SMK3 certified.
2 Resource Intensity UnfavorableThe mining segment is one of the major emitters of greenhouse gases and it produces fossil energy
resources that also significantly contributes to global CO2 emissions.
3Traceability / Security In
Supply ChainUnfavorable
Its commodity businesses (mainly CPO and mining) are subjected to environmental related risks. Its
CPO business is subject to deforestation and wild fire risks, while mining is subjected to mining
accident risks. Based on our conservation with management, we concluded that Astra and its
subsidiaries have strict environmental and safety protocols, detailed policies and processes for each
commodity business to mitigate such risks but do not fully eliminate them.
Corporate
Governance
Credibility
(Management)
4Effectiveness Of Supervisory
/ Management BoardNot improving
Only 3 independent commissioners out of 10. Only 1 female director in its Board of Directors.
Management is working on improving board diversity and independence.
5Credibility Of Auditing
ArrangementsImproving
Audit Committee comprises 4 members, Chairman of the Committee, 2 independent members, and 1
special member with no voting rights. The Chairman of the Audit Committee is an Independent
Commissioner and appointed by the Board of Commissioners.
6Transparency & Accountability
Of ManagementNot improving
Board of Directors (BoD) remuneration structure comprises salary, bonus and fixed or variable
allowances. However, BoD salary amount were not disclosed. IR team is accessible.
Hidden Risks
On The
Balance Sheet
(Balance Sheet)
7 Environmental Footprint Not improving
Although Astra has shown positive progression on carbon emission reduction with an average GHG
Emission Reduction Intensities/year of 5%, there is no set long-term targets. It implements Astra Green
Energy in its energy conservation program such as energy efficiency program and adoption of energy-
saving technologies. PHEV / EV, clean tech auto sales remain insignificant due to affordability and lack
of supporting infrastructure. It is working closely with Toyota and the government on initiatives to
promote and increase adoption; eg. partnering with Ministry of Industry to implement pilot projects
studies on the use of EV vehicles in a number of regions in Indonesia.
8Societal Impact of Products
/ ServicesExemplary
Social contribution is carried out by all organizations through CSR programs that focus on 4 main
pillars: Health, Education, Environment and Entrepreneurship. Examples in the area of health include
the provision of assistance to 1,698 community clinics, support in the provision of free healthcare
service to 132,180 patients and donation of eyeglasses, mostly for children living in the outermost,
remote and rural regions.
9 Business Ethics Improving The company has whistle blowing program that reports to the internal Audit Group.
PT Astra International – ESG Analysis
Source: Barings, December 2021.
Stock sample is for illustrative purpose and for reference only and must not be used, or relied upon, for the purposes of any investment decisions. Any
prediction, projection or forecast is not necessarily indicative of the future or likely performance.

For investment professionals only 20
Our Approach to Active Engagement
Driving positive change through engagement over blanket exclusions of entire sectors
Policy available here: https://barings-web.azureedge.net/assets/user/media/Barings-Public-Equities-ESG-Integration-Active-Engagement-Policy.pdf
DESIGN
ENGAGEMENT
PLAN AND
MEASURE
EFFECTIVENESS
ENGAGEMENT FRAMEWORK
BARINGS ESG
ANALYSIS
IDENTIFIES
NEED FOR
ENGAGEMENT
WHAT DO WE AIM TO ACHIEVE?
• To influence (or identify the need to influence) ESG practices
• To improve disclosure
• Improve investment returns
HOW DO WE DECIDE WHERE TO ENGAGE?
The prioritization of engagement activities is driven by:
• In-depth company knowledge of the company and regular interactions
• Commitments to the UN PRI, UN Global Compact and Barings values
• Sustainability Accounting Standard Board’s (SASB) material issues
IMPACT ON THE INVESTMENT RATIONALE
Successful Engagement
• Upgrade of quality score, Reduction in COE
• Unlock shareholder value
Unsuccessful Engagement
• Downgrade of quality score, Increase in COE
• Deterioration in investment rationale - Potential Divestment
ENGAGEMENT
SUCCESSFUL
OR ONGOING
=
RETAIN
INVESTMENT
ENGAGEMENT
UNSUCCESSFUL
=
POTENTIAL
DIVESTMENT
MONITOR
ESCALATE

For investment professionals only 21
Integrating Macro – Barings Cost of Equity Used in Company Valuation
A discount rate is used to determine a target price
Enables price target comparisons across sectors and geographies
Cost of
Equity
(Discount
rate)
Risk
Free Rate
Equity Risk
Premium
Stock
Specific
Risk
ESG= + + +
Systematic Idiosyncratic
Base Assumptions
4% - Developed Markets
5% - Emerging Markets
6% - Frontier Markets
2.25% + 5Y IMF CPI
forecast
Can add (0 to 2%) Can add ( -1% to 2%)

For investment professionals only 22
•Research recommendations are presented to the investment teams for debate through a series of formal and informal meetings
• Investment team review and challenge assumptions of the investment thesis and underlying financial model
•This process continues until investment case is validated or rejected
Validating the investment thesis
Valuation Output – Is There Unrecognised Growth?
For illustrative purposes only.
5 Year Proprietary Financial Forecasts
2021 2022e 2023e 2024e 2025e 2026e
EPS 38.4 51.2 66.0 85.8 99.5 113.1
- Growth 16.9% 33.2% 29.1% 29.9% 15.9% 13.7%
DPS 0.0 2.1 3.4 4.3 5.0 5.7
Discounted by Barings Cost of Equity
Systematic
Inflation 5Y CPI + 2.25% 4.8%
Market risk premium 5.0%
Idiosyncratic
Company specific risk addition [0,2%] 0.3%
ESG impact [-1,2%] -0.1%
Barings discount rate 10.0%
0
50
100
150
200
250
300
CurrentShare Price
12M Price Target
US ($)
Unrecognised
Growth?
Output from Barings valuation methodology
Fully Valued /
Overvalued?
For investment professionals only 23
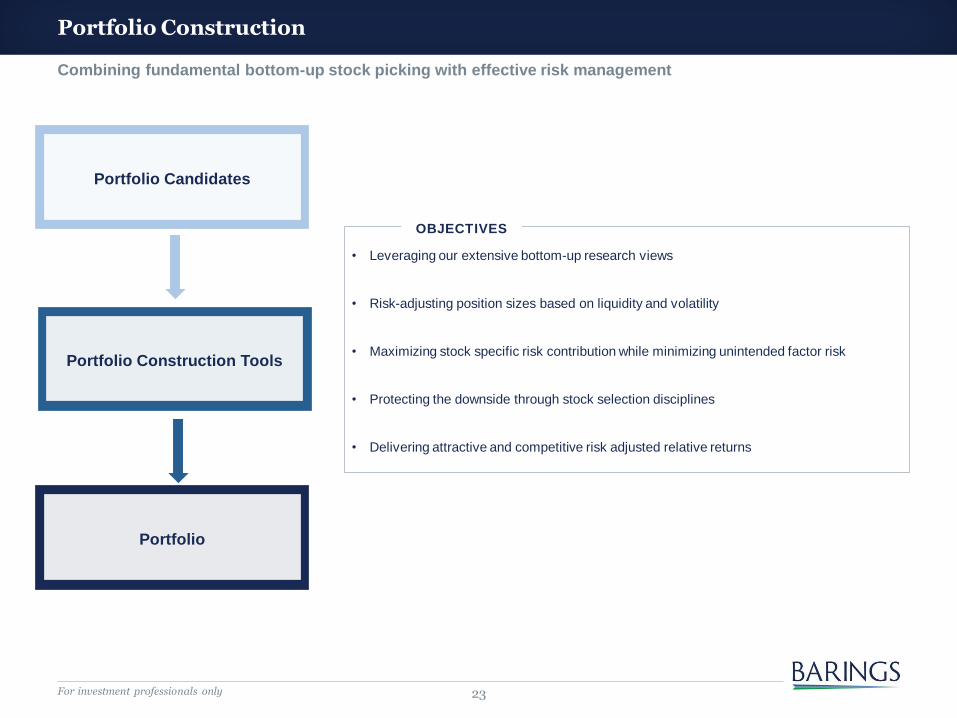
Portfolio Construction
Combining fundamental bottom-up stock picking with effective risk management
• Leveraging our extensive bottom-up research views
• Risk-adjusting position sizes based on liquidity and volatility
• Maximizing stock specific risk contribution while minimizing unintended factor risk
• Protecting the downside through stock selection disciplines
• Delivering attractive and competitive risk adjusted relative returns
Portfolio Candidates
Portfolio Construction Tools
Portfolio
OBJECTIVES

For investment professionals only 24
Proprietary Portfolio Construction Tools
Source: Barings, as of March 31, 2022. Data relates to the representative account of Barings ASEAN Frontiers Equity strategy.
Holdings are subject to change.
Style Horizon Analysis – Portfolio characteristics reflect GARP style
Macro Sensitivity Analysis
Minimal sensitivity to movements in macro events help avoid performance drawdown
-0.30 -0.21-0.07 -0.05
-0.23
0.22 0.300.10
0.29 0.28 0.20 0.290.07
0.29 0.39
-0.48
0.100.24 0.14
-1.00
-0.50
0.00
0.50
1.00
1.50
2.00
2.50P
rice
to
Boo
k
Div
ide
nd
Yie
ld
Pri
ce
to
Earn
ings
Pri
ce
to
Earn
ings N
TM
Va
lue C
om
po
site
Re
turn
on E
qu
ity
Re
turn
on I
nve
ste
d C
apital
Ea
rnin
gs V
ola
tilit
y
De
bt
to E
quity
Qua
lity C
om
posite
Ea
rnin
gs G
row
th 3
Y H
IST
Sa
les G
row
th 1
Y H
IST
Ea
rnin
gs G
row
th N
TM
Su
sta
ina
ble
Gro
wth
Gro
wth
Com
posite
Mark
et C
ap
Mom
entu
m 6
Mth
Mom
entu
m 1
2 M
th
Mom
entu
m C
om
posite
Exp
osu
re (
Z s
co
re)
Exposures
5-year max
5-year avg
5-year min
-0.10
0.07 0.17
-0.03 -0.10
-5.0
-4.0
-3.0
-2.0
-1.0
0.0
1.0
2.0
3.0
4.0
5.0
10Y USD Treasury+ 70bps
Asia ex. JapanEquities + 10%
Gold +10% USDJPY -8% Oil +25%
Acti
ve R
etu
rn (
%)

For investment professionals only 25
Portfolio Monitoring and Oversight
Investment
Team
Independent
Risk Team
Independent
Compliance
Team•The Risk Management department is organisationally and hierarchically independent from the portfolio management departments.
•Responsible for delivering the oversight and the tools, systems and advice necessary in identifying, managing and monitoring risks.
Independent Risk Team
•The Compliance department is organisationally and hierarchically independent from the portfolio management departments.
•Responsible for assessing and maintaining compliance with investment adviser policies, procedures, applicable regulations and monitoring client guidelines.
Independent Compliance Team
• Investment analysts monitor each investment thesis, continually integrating new information into their analysis.
•Our portfolio managers continually review and monitor the portfolio.
Investment Team
Portfolio managers continually review and monitor client portfolios supported by independent risk and
compliance functions
For investment professionals only 26
Sell Discipline
We consider selling when
The original mispricing has closed
The investment case has changed
There is a significantly more attractive idea

Characteristics & Performance

For investment professionals only 28
Portfolio Characteristics
Source: Barings, March 31, 2022. Data relates to the representative account of Barings ASEAN Frontiers Equity strategy.
Holdings and characteristics are subject to change.
*Ex-ante **Excludes cash and commitment
Barings ASEAN Frontiers
Equity StrategyMSCI AC ASEAN Index
Return on Equity (LTM) 14.1% 9.8%
EPS Growth (12 Month Forward) 15.9% 13.6%
Three Year EPS growth (Trailing) 3.1% -4.3%
Price to Book (Trailing) 2.4x 1.8x
P/E (NTM) 17.7x 17.2x
Number of Holdings 62 139
Active Share 55.0% --
Off Benchmark 27.2% --
Tracking Error* 4.1% --
Standard Deviation* 19.0% 18.3%
Beta* 1.01 --
Av. Market Cap (US$ Billion) 25.2 26.5
Small/ Mid Weight (<US$5Bn)** 28.6% 12.5%

For investment professionals only 29
Breakdown of Portfolio
Country and Sector Allocations as at March 31, 2022
Source: Barings. Allocations are subject to change. Figures may not add to 100% due to rounding.
Data relates to the representative account of Barings ASEAN Frontiers Equity strategy.
Country and sector breakdown are a by product of bottom-up stock selection
Country/Region Positions (%) Sector Positions (%)
Overweight Underweight
FundMSCI AC
ASEANRelative Weight
Information Technology 7.5 1.4
Materials 9.9 5.7
Cash 4.2 0.0
Industrials 11.7 9.2
Consumer Discretionary 6.9 4.6
Consumer Staples 8.1 7.8
Health Care 2.5 2.9
Utilities 2.9 3.7
Energy 1.0 4.4
Communication Services 10.7 14.9
Financials 32.6 37.3
Real Estate 2.0 8.1
Total 100.0 100.0
FundMSCI AC
ASEANRelative Weight
Indonesia 24.9 19.2
Cash 4.2 0.0
Vietnam 1.8 0.0
China 1.8 0.0
Philippines 6.0 8.5
Thailand 17.5 20.4
Malaysia 13.3 16.4
Singapore 30.5 35.6
Total 100.0 100.0
6.1
4.2
4.2
2.5
2.3
0.3
-0.4
-0.8
-3.4
-4.2
-4.7
-6.1
5.7
4.2
1.8
1.8
-2.5
-2.9
-3.1
-5.0

For investment professionals only 30
High Conviction Portfolio
Top Ten Active Holdings
Source: Barings, March 31, 2022. Holdings are subject to change. Figures may not add up due to rounding.
Data relates to the representative account of Barings ASEAN Frontiers Equity strategy.
Name % of active
weightCountry/Region Sector
PT Vale Indonesia 2.4 Indonesia Materials
PT Astra International 2.3 Indonesia Consumer Discretionary
International Container Terminal Services 1.9 Philippines Industrials
PT Bank Central Asia 1.7 Indonesia Financials
Vitrox 1.6 Malaysia Information Technology
PT Merdeka Copper Gold 1.6 Indonesia Materials
JMT Network Services 1.5 Thailand Financials
Press Metal Aluminium 1.5 Malaysia Materials
Frontken 1.5 Malaysia Industrials
Metropolitan Bank & Trust 1.5 Philippines Financials
Total 17.5

For investment professionals only 31
High Conviction Portfolio
Top Ten Largest Holdings
Source: Barings, March 31, 2022. Holdings are subject to change. Figures may not add up due to rounding .
Data relates to the representative account of Barings ASEAN Frontiers Equity strategy.
Name % of Strategy Country/Region Sector
DBS 7.3 Singapore Financials
PT Bank Central Asia 6.3 Indonesia Financials
United Overseas Bank 5.6 Singapore Financials
Sea 5.2 Singapore Communication Services
PT Bank Rakyat Indonesia 4.2 Indonesia Financials
PT Astra International 3.7 Indonesia Consumer Discretionary
Bangkok Dusit Medical Services 2.5 Thailand Health Care
International Container Terminal Services 2.5 Philippines Industrials
Oversea-Chinese Banking 2.4 Singapore Financials
PT Vale Indonesia 2.4 Indonesia Materials
Total 42.2

For investment professionals only 32
Relative Contributors and Detractors to Performance
12 months to March 31, 2022
Source: Barings, March 31, 2022. Holdings are subject to change.
Data relates to the representative account of Barings ASEAN Frontiers Equity strategy.
Contributors Detractors
CompanyContribution to
Portfolio (%)
Sea 2.4
International Container Terminal Services 1.1
PT Merdeka Copper Gold 1.0
PT Vale Indonesia 1.0
JMT Network Services 1.0
CompanyDetraction from
Portfolio (%)
Grab -1.5
Nanofilm Technologies -0.9
Pentamaster -0.5
PT Bukalapak.com -0.5
R. S. -0.5

For investment professionals only 33
Historical Performance
Past performance is no indication of current or future performance. For periods greater than one year, returns are annualized.
Source: Barings, Morningstar, March 31, 2022. Performance is based on the Barings ASEAN Frontiers Equity composite in USD. The benchmark is MSCI
All Country ASEAN (Total Net Return) Index. *Inception date of the strategy and the composite under GIPS rules is August 1, 2008.
** Quartile ranking based on the representative account of Barings ASEAN Frontiers Equity strategy. Ranking is based on Morningstar Category –
ASEAN Equity, Morningstar fractional weighting methodology applied. © 2022 Morningstar, Inc. All Rights Reserved.
A Global Investment Performance Standards (GIPS®) Report for the Composites contained in this presentation can be found on page 70 and 71.
-4.6
3.3
10.510.0
8.4
2.6 2.7
-0.3
2.5
4.2
-7.1
0.6
10.8
7.3
4.0
-12.0
-9.0
-6.0
-3.0
0.0
3.0
6.0
9.0
12.0
3 months 1 year 3 years (ann.) 5 years (ann.) Since inception* (ann.)
Barings ASEAN Frontiers Equity Strategy
MSCI AC ASEAN Index
Relative Performance
GROSS PERFORM ANC E (%)
Morningstar Peer Group Ranking**
Quartile 4th 3rd 1st 1st --

For investment professionals only 34
Performance – Barings ASEAN Frontiers Equity Strategy
Past performance is no indication of current or future performance. The portfolio holdings are subject to change.
Source: Morningstar, Barings, as of March 31, 2022. Batting average, Sharpe and information ratio performance based on the representative account of
Barings ASEAN Frontiers Equity strategy, and ranked against Morningstar Category – ASEAN Equity, Morningstar fractional weighting methodology
applied. Calculation benchmark used is MSCI AC ASEAN (Total Net Return) Index. Batting average is a Morningstar measure of a manager's ability to
consistently beat the market. It is calculated by dividing the number of months in which the manager beat or matched the fund's primary benchmark
index by the total number of months in the period. The top and bottom 5 percentiles are removed from the presentation as outliers.
Peer Group Rankings: Risk-Adjusted Return
0.00
10.00
20.00
30.00
40.00
50.00
60.00
70.00
80.00
90.00
100.00
0%
25%
50%
75%
100%
Sharpe Ratio Information Ratio Sharpe Ratio Information Ratio
3 Years (Ann.) 5 Years (Ann.)
Barings ASEAN Frontiers Equity Strategy
0.0
10.0
20.0
30.0
40.0
50.0
60.0
70.0
80.0
0
10
20
30
40
50
60
70
80
3 Years 5 Years
Barings ASEAN Frontiers Equity Strategy
%
Batting Average Quartiles
3 Years (Ann., %) 5 Years (Ann., %)
Sharpe
Ratio
Information
Ratio
Sharpe
Ratio
Information
Ratio
Barings ASEAN
Frontiers Equity
Strategy
0.40 1.00 0.42 0.79
Morningstar Peer
Group Median0.13 0.38 0.16 0.20

For investment professionals only 35
Downside Protection along with Upside Participation
Strong performance in both down- and up-markets driven by stock selection
72 and 56 observations in the peer group for 3 and 5 years respectively. Down Capture ratio is inversely ranked.
Source: Morningstar as of March 31, 2022. All data shown in USD, total return net of fees. Strategy returns based on the representative account of
Barings ASEAN Frontiers Equity strategy. Ranked against the Morningstar Category – ASEAN Equity and currency hedged = NA. Group calculation
benchmark used is MSCI AC ASEAN NR USD. Morningstar Methodology for peer group ranking applied.
PAST PERFORMANCE IS NOT NECESSARILY INDICATIVE OF FUTURE RESULTS.
3 Years (%) 5 Years (%)
Up
Capture
Down
Capture
Up
Capture
Down
Capture
Barings ASEAN Frontiers Equity Strategy 126.66 85.17 119.22 88.07
Morningstar Peer Group Median 106.85 91.22 100.43 94.68
0.00
10.00
20.00
30.00
40.00
50.00
60.00
70.00
80.00
90.00
100.00
0%
25%
50%
75%
100%
Up Capture Down Capture Up Capture Down Capture
Barings ASEAN Frontiers Equity Strategy
Median
3 Years 5 Years

For investment professionals only 36
Active Management is Key to Address ASEAN Markets Inefficiencies
Source: MSCI, FactSet, January 2022. Note: Dec-15 is around 2 years before MIFID II (Markets in Financial Instruments Directive II) became effective
in January 2018.
Analyst Coverage for Stocks within MSCI Indices
ASEAN already an under researched region, more so after MIFID II
0
5
10
15
20
25
30
ASEAN Asia ex-Japan US
Average Number of Analysts for Stocks with Index Weight >0.2%
Dec-15 Dec-21

For investment professionals only 37
ASEAN – Relative Inefficiency Allows Alpha Generation through Stock Selection
Proven track record of identifying successful growth companies way ahead of index inclusion
*Stock Cumulative Return: total return over the period from first bought until index inclusion announcement, monthly returns in local currency terms.
Source: Bloomberg, Barings, data as of July 2021. Data relates to the representative account of Barings ASEAN Frontiers Equity strategy. Index: MSCI
AC ASEAN (Total Net Return) Index. Reference to the performance comparator index is for comparative purpose only.
Stock samples are for illustrative purpose and for reference only and must not be used, or relied upon, for the purposes of any investment decisions.
Any prediction, projection or forecast is not necessarily indicative of the future or likely performance.
Stock Name Position Initiation in the Strategy Stock Cumulative Return* Index Return
Vietnam Dairy Product June 2009 1696% 159%
My E.G. Services January 2014 526% 50%
Srisawad February 2015 117% 2%
ACE Hardware Indonesia June 2017 73% 17%
Osotspa October 2018 54% -4%
SEA October 2017 1579% 1%
-200
0
200
400
600
800
1000
1200
1400
1600
1800
-20
0
20
40
60
80
100
120
140
160
180
Total Cumulative Returns:from First Investment in Barings ASEAN Frontiers Equity Strategy to Index Inclusion
SAWAD ACES OSP VNM (RHS) MYEG (RHS) SEA (RHS)
% %

For investment professionals only 38
FUND AWARDS – BARINGS ASEAN FRONTIERS FUND
Barings ASEAN Frontiers Equity Strategy
Long established fund with proven track record
Source: Barings. Strategy size data as of March 31, 2022, rounded to the nearest US$10m, gross assets. Please note that Barings ASEAN Frontiers
Fund is not available to US investors.
• Awarded BENCHMARK Fund of the Year Awards 2020 – Best-in-Class across Hong Kong
and Singapore in ASEAN Equity Category, Retail Class
2020
2021
• Awarded Bloomberg Businessweek – Top Fund Awards 2021 – Best Performer in ASEAN Equity category on strong
risk-adjusted performance relative to peers over 1 year and 5 years
• Won 2021 Best of the Best Awards by Asia Asset Management for delivering consistent, strong risk-adjusted returns
relative to its peers over 10 years
• Won 2021 REFINITIV Lipper Fund Awards for consistently strong, risk-adjusted returns relative to
its peers for 3-year and 5-year performance
STRATEGY DETAILS
Inception Date of Strategy August 1, 2008
Strategy Size US$570 Million
Base Currency USD
Portfolio Managers SooHai Lim / Tiebin Liu
2022
• Won REFINITIV Lipper Fund Awards 2022 Taiwan for consistently strong, risk-adjusted returns relative to its peers for
3-year and 5-year performance

For investment professionals only 39
Our Key Differentiators
Our Key Differentiators:
• Extensive primary research supported by a large team of experienced EM professionals
• Proprietary fundamental analysis evaluating companies over a 5 year research horizon
• Fully integrated dynamic ESG assessment and active engagement
• Macro considerations incorporated through our Cost of Equity approach
• Proprietary risk management tools support portfolio construction

Investment Vehicles

For investment professionals only 41
Key Terms – Barings ASEAN Frontiers Fund
Source: Barings, March 31, 2022.
1. Further details regarding the subscription and redemption process is available in the Fund Prospectus.
2. The ongoing charges figure is based on the ongoing expenses chargeable to the respective unit class for the 12-month period ended October 31,
2021 expressed as a percentage of the average net asset value of the respective unit class for the same period. This figure may vary from year to
year.
Such terms and conditions are qualified in their entirety by the provisions of the final Fund documents which should be reviewed carefully before a
decision to invest in the fund is made. Please note that Barings ASEAN Frontiers Fund is not available to US investors.
Barings ASEAN Frontiers Fund
Domiciliation Ireland, UCITS Fund
Umbrella Barings International Umbrella Fund
Investment Manager Baring Asset Management Limited
Base Currency USD
Dealing Frequency Daily1
Fee Schedule
Management FeesClass A –1.25% per annum
Class I – 0.75% per annum
Ongoing Charges to
Fund (OCF)2
Class A – 1.70%
Class I – 1.00%

For investment professionals only 42
Identifiers – Barings ASEAN Frontiers Fund
Share Class ISIN Bloomberg ID
Barings ASEAN Frontiers Fund - Class A USD Inc IE0000830236 BRGPACI ID
Barings ASEAN Frontiers Fund - Class A EUR Inc IE0004868828 BRGPACE ID
Barings ASEAN Frontiers Fund - Class A GBP Inc IE00B3BC5T90 BASEANG ID
Barings ASEAN Frontiers Fund - Class A EUR Acc IE00B4MTNB49 BABAFAE ID
Barings ASEAN Frontiers Fund - Class A USD Acc IE00B59JG481 BAFRAUA ID
Barings ASEAN Frontiers Fund - Class I EUR Acc IE00B3BC5X37 BASEIEA ID
Barings ASEAN Frontiers Fund - Class I GBP Acc IE00B3BC5W20 BARAFIG ID
Barings ASEAN Frontiers Fund - Class I USD Acc IE00B3BC5V13 BARFIUA ID
Barings ASEAN Frontiers Fund - Class I USD Inc IE00BKQMYD06 BABAFIU ID
Please note that Barings ASEAN Frontiers Fund is not available to US investors.

Stock Examples

For investment professionals only 44
SEA Ltd. – ASEAN’s Alibaba & Tencent in One
1. Source: Goldman Sachs Global Investment Research, Barings, December 2021.
2. Source: Company data, Barings, December 2021.
3. Source: Company data, Barings, Morgan Stanley Research, Credit Suisse Research, April 2022.
Stock sample is for illustrative purpose and for reference only and must not be used, or relied upon, for the purposes of any investment decisions. Any
prediction, projection or forecast is not necessarily indicative of the future or likely performance.
Growth Upside / Valuation Quality
• The company has delivered superior growth in
terms of MAU, DAU, GMV and revenue
• Strong potential for take rate to increase as the
scale of the e-commerce business continues
to grow. Higher take rate will drive profitability
up
• Opportunities for Free Fire and Free Fire Max,
Garena’s highly successful self developed
games, to expand into new markets and
increase in-game monetization in existing
markets
• SEA has great potential given its experienced
management team and the growing presence
in many underpenetrated markets
• Among all its ecommerce markets, Taiwan and
Malaysia are the most prominent right now in
terms of profitability. We continue to see
strong potential for the other markets to
gravitate towards higher profitability
• SEA’s game business, Garena, is one of the
best game developers/operators in south east
Asia. They have come up with super games
and host the e-sports activities in the region
• Shopee, the company’s e-commerce platform,
has had good presence in some ASEAN
countries, plus Taiwan
• Although e-commerce is still in the investment
phase, strong cash flow generated from the
game business will give strong support for the
longer term growth
Score: 1.0 Score: 2.3 Score: 1.0
Strong Growth Driven by User Base Expansion1
Riding on the E-Commerce Trend2 Room for Take Rate to increase3
0.0%
2.0%
4.0%
6.0%
8.0%
10.0%
12.0%
14.0%
0
100
200
300
400
500
600
700
QAU (mn) QPU (mn) Paying Ratio
USD, bn
0.0%
8.5%
4.1% 3.6%
14.1%
16.4%
0.0%
2.0%
4.0%
6.0%
8.0%
10.0%
12.0%
14.0%
16.0%
18.0%
Shopee(FY16)
Shopee(4Q21)
Alibaba(FY21)
PDD(FY21)
Momo(4Q21)
MecardoLibre
(FY21)
Take Rate18.2
0.0
2.0
4.0
6.0
8.0
10.0
12.0
14.0
16.0
18.0
20.0
GMV (Gross Merchandise Volume)
For investment professionals only 45
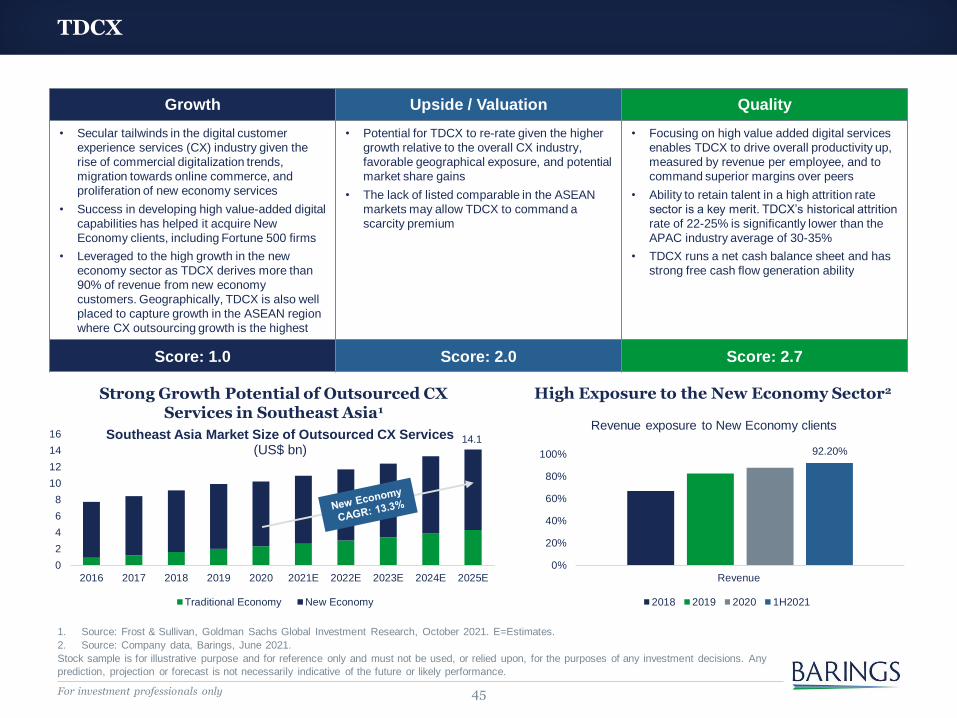
6.8 7.2 7.5 7.9 7.9 8.38.7 9
9.4 9.8
0
2
4
6
8
10
12
14
16
2016 2017 2018 2019 2020 2021E 2022E 2023E 2024E 2025E
Southeast Asia Market Size of Outsourced CX Services (US$ bn)
Traditional Economy New Economy
TDCX
1. Source: Frost & Sullivan, Goldman Sachs Global Investment Research, October 2021. E=Estimates.
2. Source: Company data, Barings, June 2021.
Stock sample is for illustrative purpose and for reference only and must not be used, or relied upon, for the purposes of any investment decisions. Any
prediction, projection or forecast is not necessarily indicative of the future or likely performance.
Strong Growth Potential of Outsourced CX Services in Southeast Asia1
High Exposure to the New Economy Sector2
Growth Upside / Valuation Quality
• Secular tailwinds in the digital customer
experience services (CX) industry given the
rise of commercial digitalization trends,
migration towards online commerce, and
proliferation of new economy services
• Success in developing high value-added digital
capabilities has helped it acquire New
Economy clients, including Fortune 500 firms
• Leveraged to the high growth in the new
economy sector as TDCX derives more than
90% of revenue from new economy
customers. Geographically, TDCX is also well
placed to capture growth in the ASEAN region
where CX outsourcing growth is the highest
• Potential for TDCX to re-rate given the higher
growth relative to the overall CX industry,
favorable geographical exposure, and potential
market share gains
• The lack of listed comparable in the ASEAN
markets may allow TDCX to command a
scarcity premium
• Focusing on high value added digital services
enables TDCX to drive overall productivity up,
measured by revenue per employee, and to
command superior margins over peers
• Ability to retain talent in a high attrition rate
sector is a key merit. TDCX’s historical attrition
rate of 22-25% is significantly lower than the
APAC industry average of 30-35%
• TDCX runs a net cash balance sheet and has
strong free cash flow generation ability
Score: 1.0 Score: 2.0 Score: 2.7
92.20%
0%
20%
40%
60%
80%
100%
Revenue
Revenue exposure to New Economy clients
2018 2019 2020 1H2021
14.1
For investment professionals only 46
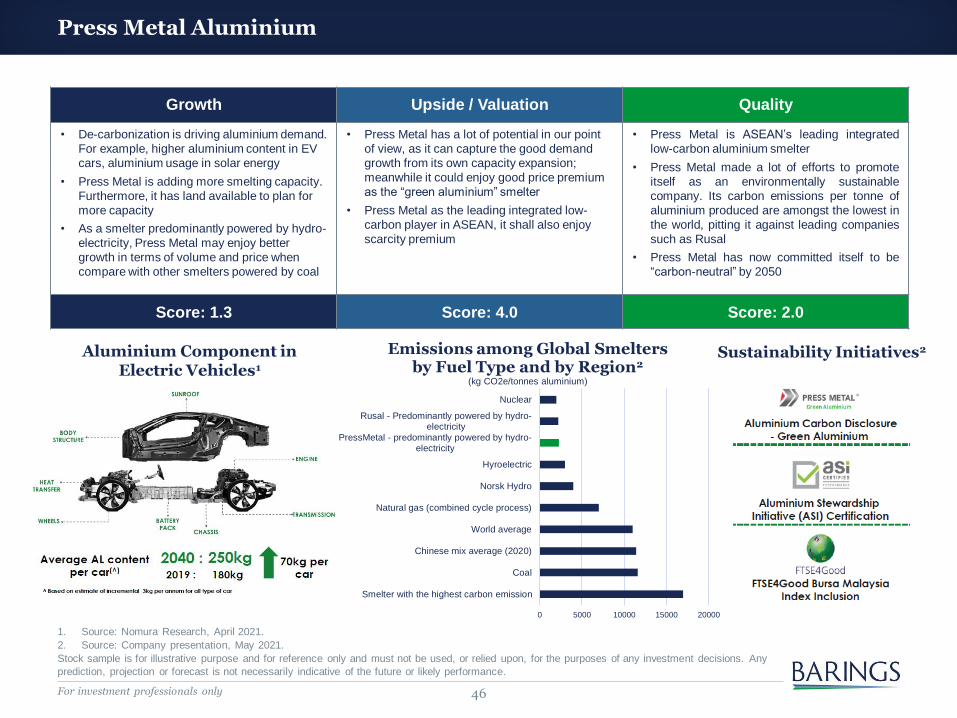
Press Metal Aluminium
1. Source: Nomura Research, April 2021.
2. Source: Company presentation, May 2021.
Stock sample is for illustrative purpose and for reference only and must not be used, or relied upon, for the purposes of any investment decisions. Any
prediction, projection or forecast is not necessarily indicative of the future or likely performance.
Growth Upside / Valuation Quality
• De-carbonization is driving aluminium demand.
For example, higher aluminium content in EV
cars, aluminium usage in solar energy
• Press Metal is adding more smelting capacity.
Furthermore, it has land available to plan for
more capacity
• As a smelter predominantly powered by hydro-
electricity, Press Metal may enjoy better
growth in terms of volume and price when
compare with other smelters powered by coal
• Press Metal has a lot of potential in our point
of view, as it can capture the good demand
growth from its own capacity expansion;
meanwhile it could enjoy good price premium
as the “green aluminium” smelter
• Press Metal as the leading integrated low-
carbon player in ASEAN, it shall also enjoy
scarcity premium
• Press Metal is ASEAN’s leading integrated
low-carbon aluminium smelter
• Press Metal made a lot of efforts to promote
itself as an environmentally sustainable
company. Its carbon emissions per tonne of
aluminium produced are amongst the lowest in
the world, pitting it against leading companies
such as Rusal
• Press Metal has now committed itself to be
“carbon-neutral” by 2050
Score: 1.3 Score: 4.0 Score: 2.0
0 5000 10000 15000 20000
Smelter with the highest carbon emission
Coal
Chinese mix average (2020)
World average
Natural gas (combined cycle process)
Norsk Hydro
Hyroelectric
PressMetal - predominantly powered by hydro-electricity
Rusal - Predominantly powered by hydro-electricity
Nuclear
Emissions among Global Smelters by Fuel Type and by Region2
(kg CO2e/tonnes aluminium)
Aluminium Component in Electric Vehicles1
Sustainability Initiatives2

For investment professionals only 47
ViTrox
1. Source: Company Report, December 2021. E=Estimates.
2. Source: Macquarie Research, March 2022.
Stock sample is for illustrative purpose and for reference only and must not be used, or relied upon, for the purposes of any investment decisions. Any
prediction, projection or forecast is not necessarily indicative of the future or likely performance.
Growth Upside / Valuation Quality
• The company has delivered remarkable
growth in revenue and profit, led by its
competitive products
• It will continue to benefit from the growing
needs for automation and semiconductor
presence across devices, such as EV
• Benefitting from tech companies looking for
alternative sources of equipment amid de-
globalization
• There is a great potential upside from the
company by capturing the IT capex spending
in the region
• EV segment, contributing 22% of the group
revenue, is one of the most promising end-
demand areas for the company in the medium
to long term
• ViTrox is an equipment design and
manufacturer that provides automated board
inspections and machine vision solutions
• One of the few ASEAN tech companies that
owns IP as a result of R&D focus, rather than
providing labor intensive assembly and testing
services
• Diversified customer base and applications,
with over 300 customers in automotive,
telecom, consumer, medical and
semiconductor industries
Score: 2.0 Score: 4.7 Score: 2.7
Key EndCustomersKey Top
Customers
ViTrox
Celestica
Cisco
Juniper
IBM
Jabil
Cisco
Apple
HP
Flex
Apple
Nike
Ford
ASE
Renesas
STMicro
Infineon
A Diversified Client Base2
0%
2%
4%
6%
8%
10%
12%
14%
16%
18%
0
100
200
300
400
500
600
700
800
2012 2013 2014 2015 2016 2017 2018 2019 2020 2021E
Revenue and R&D Spending1
Revenue R&D R&D as % of Rev
(MYR mn)

Market Outlook and Investment Themes

For investment professionals only 49
-80
-60
-40
-20
0
20
40
'21/01 '21/03 '21/05 '21/07 '21/09 '21/11 '22/01 '22/03
Google Mobility Index: Retail & Recreation Venues% from baseline, 7DMA
Indonesia Malaysia Philippines Singapore
Thailand Vietnam Korea India
63%
71%71%
80%
84%88%88%
92%
11%8%
2%
34%
48%
64%
46%
71%
PHIDINTHMYKRCNSG
Vaccination Progress in Asia
Vaccinated Partially vaccinated Booster Shot
Reopening Across Asia Expected to Continue with Rising Vaccination
1. Source: Our World in Data, latest available as of March 31, 2022.
2. Source: Google, Barings, March 31, 2022. 7DMA = 7-day moving average.
Most of the Asian Economies Have More than 50% of the Population Vaccinated1
Retail & Recreation Activities in Asia ex-China Are Recovering to Pre-COVID Levels2
Living with COVID, not zero-COVID
For investment professionals only 50
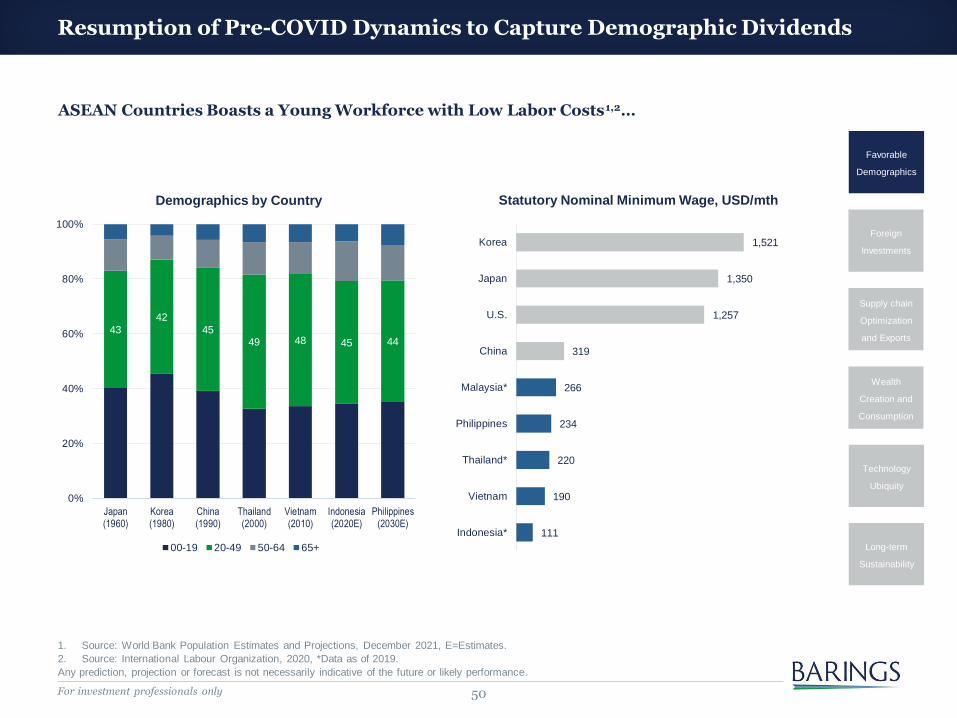
Resumption of Pre-COVID Dynamics to Capture Demographic Dividends
1. Source: World Bank Population Estimates and Projections, December 2021, E=Estimates.
2. Source: International Labour Organization, 2020, *Data as of 2019.
Any prediction, projection or forecast is not necessarily indicative of the future or likely performance.
1,521
1,350
1,257
319
266
234
220
190
111
Korea
Japan
U.S.
China
Malaysia*
Philippines
Thailand*
Vietnam
Indonesia*
Statutory Nominal Minimum Wage, USD/mth
ASEAN Countries Boasts a Young Workforce with Low Labor Costs1,2…
43
42
4549 48 45 44
0%
20%
40%
60%
80%
100%
Japan(1960)
Korea(1980)
China(1990)
Thailand(2000)
Vietnam(2010)
Indonesia(2020E)
Philippines(2030E)
Demographics by Country
00-19 20-49 50-64 65+
Favorable
Demographics
Foreign
Investments
Supply chain
Optimization
and Exports
Wealth
Creation and
Consumption
Technology
Ubiquity
Long-term
Sustainability

For investment professionals only 51
15%
20%
25%
30%
35%
2011 2012 2013 2014 2015 2016 2017 2018 2019 2020 2021
Corporate Tax Rates, %3
Indonesia Malaysia Philippines
Singapore Thailand Vietnam
0
50
100
150
200
2009 2010 2011 2012 2013 2014 2015 2016 2017 2018 2019
FDI into ASEAN, USD bn1
Indonesia Malaysia Philippines Singapore Thailand Vietnam
Foreign Investments at Historical Highs
1. Source: World Bank, data available as of December 2021. FDI = Foreign Direct Investments.
2. Source: CS Survey, Credit Suisse Research, October 2019.
3. Source: KPMG, data available as of December 2021.
Global Players Are Investing in ASEAN, Supported by Favorable Policies and Tax Regimes…
Favorable
Demographics
Foreign
Investments
Supply chain
Optimization
and Exports
Wealth
Creation and
Consumption
Technology
Ubiquity
Long-term
Sustainability
0% 20% 40% 60% 80% 100%
Tech. Hardware
Consumer Durables/Apparel
Capital Goods
Retailing
Countries/Regions Considered For Manufacturing2
ASEAN Other Asia Mexico EU US

For investment professionals only 52
ASEAN Is Becoming A Major Manufacturing Hub
Source: IMF, Bloomberg, Barings, data available as of March 31, 2022. ASEAN6 = Indonesia, Malaysia, Philippines, Singapore, Thailand and Vietnam.
Favorable
Demographics
Foreign
Investments
Supply chain
Optimization
and Exports
Wealth
Creation and
Consumption
Technology
Ubiquity
Long-term
Sustainability
5.0%
5.5%
6.0%
6.5%
7.0%
7.5%
8.0%
8.5%
9.0%
600,000
800,000
1,000,000
1,200,000
1,400,000
1,600,000
1,800,000
2,000,000
'08/12 '10/12 '12/12 '14/12 '16/12 '18/12 '20/12
ASEAN Exports to World
Exports, USD mn (Ls) % of World, 12MMA (Rs)
10%
18%
0%
5%
10%
15%
20%
25%
'02 '04 '06 '08 '10 '12 '14 '16 '18 '20
ASEAN Exports to U.S., % Total
ASEAN6 China

For investment professionals only 53
RCEP Could Further Reduce Trade Barriers
About 91% of the trade tariffs among members will be eliminated
Note: RCEP= Regional Comprehensive Economic Partnership.
1. Source: FactSet, IMF, December 2020. FTA= free trade agreement.
2. Source: ADB Estimates, December 2021.
3. Source: J.P. Morgan Estimates, December 2021.
Any prediction, projection or forecast is not necessarily indicative of the future or likely performance.
RCEP Member Countries
CHINA
AUSTRALIA
NEW
ZEALAND
INDONESIA
PHILIPPINES
JAPANSOUTH
KOREA
MYANMAR
THAILAND
LAOS
VIETNAM
CAMBODIA
BRUNEIMALAYSIA
SINGAPORE
0
10
20
30
0.0
0.5
1.0
1.5
2.0
2.5
RCEP NAFTA CPTPP EU
GDP, USD tn (Ls) Population, bn (Rs)
Largest FTA by Population and GDP1
45%
50%
55%
60%
65%
Philippines Indonesia Malaysia Thailand Singapore Vietnam
ASEAN trade with RCEP countries (% total trade)
0.0
0.2
0.40.6
0.8
1.0
SouthKorea
Malaysia Thailand Vietnam China Philippines Indonesia
Estimated Net Impact of RCEP on GDP by 2030, %
Inter-Regional Trade Stands to Benefit2
Catalyst for Long-term Economic Growth3
Favorable
Demographics
Foreign
Investments
Supply chain
Optimization
and Exports
Wealth
Creation and
Consumption
Technology
Ubiquity
Long-term
Sustainability

For investment professionals only 54
Wealth Creation Translates into Growth in Consumption and Investments
1. Source: World Bank, data available as of December 2021.
2. Source: IMF, data available as of December 2021.
3. Source: Bloomberg, data available as of December 2021.
324
545
1,715
2,839
0
500
1,000
1,500
2,000
2,500
3,000
1990 2000 2010 2020
Gross National Income, USD bn1
Indonesia Malaysia Philippines Singapore Thailand Vietnam
-
500
1,000
1,500
2,000
'99 '01 '03 '05 '07 '09 '11 '13 '15 '17 '19
Household Final Consumption, USD bn2
0
500
1,000
1,500
2,000
2,500
3,000
'08 '09 '10 '11 '12 '13 '14 '15 '16 '17 '18 '19 '20 '21
Stock Market Capitalization, USD bn3
Favorable
Demographics
Foreign
Investments
Supply chain
Optimization
and Exports
Wealth
Creation and
Consumption
Technology
Ubiquity
Long-term
Sustainability

For investment professionals only 55
Southeast Asia Is Entering the ‘Golden Age’ of Disposable Income
1. Source: Asia Partners Analysis, IMF, World Bank, Bloomberg, Angus Maddison Project Database 2018 (exclude telcos), September 2020.
2. Source: IMF, World Bank, Asia Partners Analysis, September 2020.
Stock examples are for illustrative purpose and for reference only and must not be used, or relied upon, for the purposes of any investment decisions.
Any prediction, projection or forecast is not necessarily indicative of the future or likely performance.
Southeast Asia: GDP Per Capita in Real, Inflation-Adjusted Terms2
Three Powerful Precedents: A Consistent Pattern of Value Creation across 75 Years of Rising Middle Classes1
% of Current Tech Market Cap, by IPO Year (Cumulative)
Current Tech Market Cap (USD)
Real GDP Per Capita
Inflation Adjusted in 2018 USD (Log Scale)
Favorable
Demographics
Foreign
Investments
Supply chain
Optimization
and Exports
Wealth
Creation and
Consumption
Technology
Ubiquity
Long-term
Sustainability
USA
Japan
S.Korea
China
India
SEAsia
Expressed in Constant 2018 US Dollars
Bn $ Companies
$US Billions
$20-2,000bnAmazon, Apple,
Microsoft, Google, Meta,
Rakuten, Yahoo Japan, Netflix, Uber
$30-700bnAlibaba, Tencent, JD.com, Baidu, Xiaomi, Meituan
$2-100bnSea, Grab, GoTo,
Lazada, Tokopedia, Bukalapak.com
$0-1bnMpesa
$0.5-25bnZomato,
Paytm, Oyo

For investment professionals only 56
Digital Wallet Payments Volume (US$)Online Food Delivery GMV* (US$) Ride-Hailing GMV* (US$)
Southeast Asia Is Still in the Early Innings of Online Disruption
Source: Euromonitor, Grab, Credit Suisse Research, April 2021.
1. Based on % of total consumer foodservice that is ordered online (including online ordering for dine-in and takeaway). 2. Based on % of total consumer
expenditure on ride-hailing out of consumer expenditure on buses, coaches and taxis, and operation of personal transport equipment.
Note: Southeast Asia statistics on this page refer to Indonesia, Malaysia, Philippines, Singapore, Thailand and Vietnam. E= Estimates. *GMV = Gross
Merchandise Volume.
Any prediction, projection or forecast is not necessarily indicative of the future or likely performance.
Large Addressable Southeast Asia Market Opportunity
2025E
$171bn Consumer Foodservice
Value
2025E
$28bn
2020
$9bn
2025E
$1,356bn Cash Transaction Value
2025E
$138bn
2020
$39bn
2025E
$235bn Consumer Expenditure
on Land Mobility
2025E
$19bn
2020
$4bn
21%
21%
11%
0% 5% 10% 15% 20% 25%
US
China
Southeast Asia
% 2020 online penetration
5%
15%
3%
0% 5% 10% 15% 20%
US
China
Southeast Asia
% 2020 online penetration
94%
95%
60%
82%
43%
17%
0% 50% 100%
US
China
Southeast Asia
% 2020 electronic transactions (volume)
% 2020 banked population (age >15)
ONLINE FOOD DELIVERY ON-DEMAND MOBILITY DIGITAL FINANCIAL SERVICES
1 2
Favorable
Demographics
Foreign
Investments
Supply chain
Optimization
and Exports
Wealth
Creation and
Consumption
Technology
Ubiquity
Long-term
Sustainability

For investment professionals only 57
Tech Adoption – Accelerating in ASEAN, Plateauing in China
1. Source: CEIC, Maybank Research, October 2021.
2. Source: Euromonitor, Maybank Research, October 2021.
China’s E-Commerce Penetration Rate at ~30%, Among the Highest Globally1
E-Commerce Penetration Rate in Malaysia, Philippines and Thailand Remain Below 10%2
Favorable
Demographics
Foreign
Investments
Supply chain
Optimization
and Exports
Wealth
Creation and
Consumption
Technology
Ubiquity
Long-term
Sustainability

For investment professionals only 58
0%
20%
40%
60%
80%
100%
120%
140%
160%
Singapore Thailand China Malaysia Philippines Indonesia
Smartphone penetration 4G Penetration
High Levels of Mobile Phone Penetration Rate Is Foundational to Digital Transformation in ASEAN
Source: Company data, World Bank, MCMC, IMDA, Credit Suisse estimates, October 2021.
Smartphone and 4G Penetration (2020) Remains High for ASEAN Nations Supporting the Digital Economy
COVID Has Accelerated Consumption of Mobile Data in ASEAN
0
2
4
6
8
10
12
14
16
18
20
Philippines Singapore Indonesia Thailand Malaysia
2015 2016 2017 2018 2019 2020
Favorable
Demographics
Foreign
Investments
Supply chain
Optimization
and Exports
Wealth
Creation and
Consumption
Technology
Ubiquity
Long-term
Sustainability
Average Data Use per Smartphone
Subscriber (GB/Month)
For investment professionals only 59
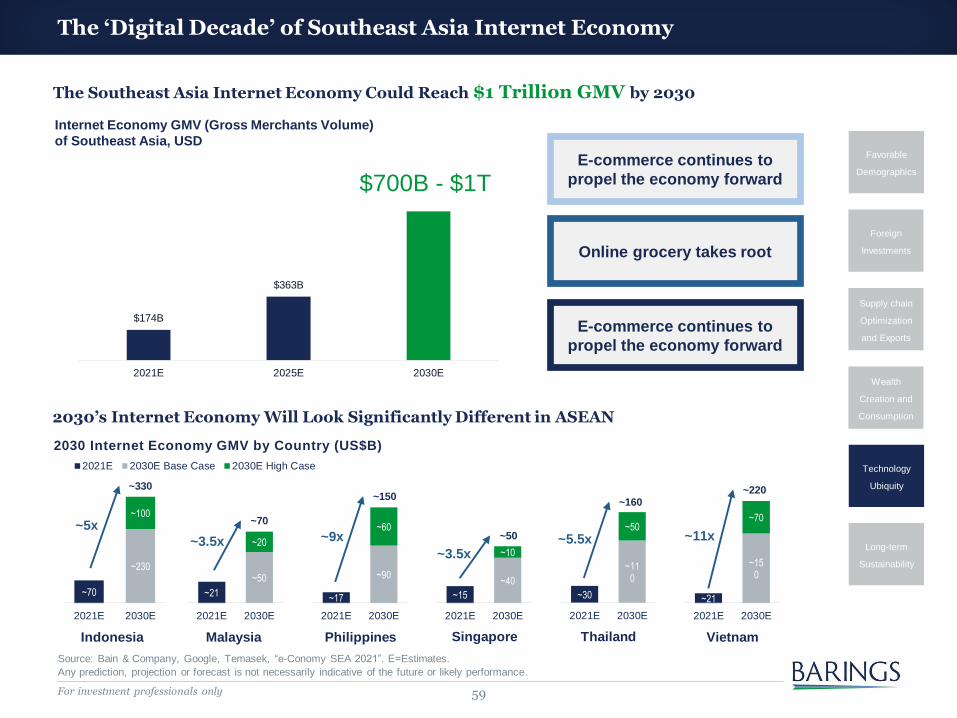
The ‘Digital Decade’ of Southeast Asia Internet Economy
Source: Bain & Company, Google, Temasek, “e-Conomy SEA 2021”. E=Estimates.
Any prediction, projection or forecast is not necessarily indicative of the future or likely performance.
The Southeast Asia Internet Economy Could Reach $1 Trillion GMV by 2030
2030’s Internet Economy Will Look Significantly Different in ASEAN
$174B
$363B
2021E 2025E 2030E
Internet Economy GMV (Gross Merchants Volume)
of Southeast Asia, USD
$700B - $1T
2030 Internet Economy GMV by Country (US$B)
~70
~230
~100
2021E 2030E
2021E 2030E Base Case 2030E High Case
Indonesia
~330
~5x
~21
~50
~20
2021E 2030E
~70
~3.5x
Malaysia
~17
~90
~60
2021E 2030E
~15
~40
~10
2021E 2030E
~30
~110
~50
2021E 2030E
~21
~150
~70
2021E 2030E
Philippines Singapore Thailand Vietnam
~150
~9x ~50
~3.5x
~160
~5.5x
~220
~11x
E-commerce continues to
propel the economy forward
Online grocery takes root
E-commerce continues to
propel the economy forward
Favorable
Demographics
Foreign
Investments
Supply chain
Optimization
and Exports
Wealth
Creation and
Consumption
Technology
Ubiquity
Long-term
Sustainability

For investment professionals only 60
2.4
5.56.4
7.8
3.34.5
5.9
7.1
8.65.6
3.8
3.0 0.8
5.6
0
2
4
6
8
10
12
14
16
2017 2018 2019 2020 H1 2020 H2 2020 H1 2021
Deal Value, USD bn
Other Unicorn
0%
10%
20%
30%
40%
50%
60%
70%
80%
90%
100%
2020 2021 2022E 2023E
Internet Sector Weight of MSCI ASEAN, %
Internet Unicorn Others
Healthy Pipeline of Unicorns to Transform ASEAN Markets
1. Source: Industry reports; VC partners; Bain analysis. Bain & Company, Google, Temasek, “e-Conomy SEA 2021”. E=Estimates. Note: Deals
include investments by venture capital, private equity and strategic investors.
2. Source: J.P. Morgan estimates, December 2021.
Southeast Asia’s Deal Landscape Is Thriving, with Global Capital Filtering into the Region in A Meaningful Manner1
Favorable
Demographics
Foreign
Investments
Supply chain
Optimization
and Exports
Wealth
Creation and
Consumption
Technology
Ubiquity
Long-term
Sustainability
Internet Sector Could be More Than 20% of MSCI ASEAN by 20232

For investment professionals only 61
0
2,000
4,000
6,000
8,000
10,000
12,000
14,000
16,000
18,000
2011 2013 2015 2017 2019 2021E 2023E 2025E 2027E 2029E
Aluminium demand, per year, by green sector
Total Solar Demand Total Wind Demand Total EV Demand
Sustainability in Focus, But Green Transition Isn’t Only About Technology
1. Source: IEA, IRENA, Woodmac, CRU, Goldman Sachs Global Investment Research, October 2021. E= Estimates.
2. Source: Press Metal Company Presentation.
3. Source: Coordinating ministry for maritime and investment affairs of Indonesia, March 2021.
Any prediction, projection or forecast is not necessarily indicative of the future or likely performance.
Climate Policies Driving Metal Deficits: Green Aluminium Demand Is Expected to Rise to 18% of Global Demand by 20301
Emissions among Global Smelters by Fuel Type and by Region2
28
87
87
200
Indonesia
Australia
Peru
Chile
Copper
7
16
20
21
Russia
Brazil
Australia
Indonesia
Nickel
7
111
4
5
7
Indonesia
Vietnam
Australia
Guinea
Bauxite
0.4
0.4
0.8
1.1
Brazil
Australia
Indonesia
China
Tin
0 5,000 10,000 15,000 20,000
Smelter with the highest carbonemission
Coal
Chinese mix average (2020)
World average
Natural gas (combined cycleprocess)
Norsk Hydro
Hyroelectric
PressMetal - predominantlypowered by hydro-electricity
Rusal - Predominantly poweredby hydro-electricity
Nuclear
(kg CO2e/tonnes aluminium)
Commodity Reserves by Country3 (Million Tons of Metal Compounds in 2019)
1
1
6
6
2
2
Indonesia’s Global Reserve Ranking
Indonesia’s Global Production Ranking
Favorable
Demographics
Foreign
Investments
Supply chain
Optimization
and Exports
Wealth
Creation and
Consumption
Technology
Ubiquity
Long-term
Sustainability

For investment professionals only 62
Economic and Earnings Momentum Shifts in Favor of ASEAN in 2022
1. Source: FactSet, I/B/E/S, MSCI, Haver, Goldman Sachs Global Investment Research, April 2022. GS = Goldman Sachs.
2. Source: Bloomberg Finance L.P., Ho Chi Minh City Securities Trading Center, TSE, Bursa Malaysia Berhad, JSE, PSE, April 2022. ASEAN
includes Singapore, Vietnam, Thailand, Malaysia, Indonesia and Philippines. Data for Singapore is till 28 Feb 2022 from EPFR Global. For
Malaysia – data starts at October 2009 and for Vietnam – data starts at January 2009.
3. Source: FactSet, Barings, April 22, 2022. E=Estimates.
Any prediction, projection or forecast is not necessarily indicative of the future or likely performance.
EPS Growth and Macro Forecasts1 Strong Rebound of Monthly Cumulative Flows of ASEAN YTD2
ASEAN Earnings May Rebound More Than Other Markets As They Have Not Yet Recovered to Pre-COVID Levels3
0.0
0.5
1.0
1.5
2.0
2.5
Ko
rea
Ta
iwa
n
India
EM
AxJ
Indo
ne
sia
Mala
ysia
Ho
ng
Ko
ng
Ch
ina
Th
aila
nd
Ph
ilip
pin
es
AS
EA
N
Sin
gap
ore
EPS Level vs. 2019, MSCI Indices
2021 2022E

For investment professionals only 63
Asia ex-Japan Portfolios Are Now Largely Greater China, ASEAN Neglected…
Source: FactSet, MSCI, Barings, March 31, 2022.
Greater China: MSCI Countries/Regions of China, Hong Kong, and Taiwan.
ASEAN5: MSCI Countries/Regions of Indonesia, Malaysia, Philippines, Singapore, Thailand.
Greater China Consists of Around 60% of Asia ex-Japan, while ASEAN Is Around 10%.
0%
10%
20%
30%
40%
50%
60%
70%
'02/02 '03/02 '04/02 '05/02 '06/02 '07/02 '08/02 '09/02 '10/02 '11/02 '12/02 '13/02 '14/02 '15/02 '16/02 '17/02 '18/02 '19/02 '20/02 '21/02 '22/02
Weighting Comparison in MSCI Asia ex-Japan Index – ASEAN vs. Greater China
Greater China ASEAN5

For investment professionals only 64
10
12
14
16
18
20
22
'11 '12 '13 '14 '15 '16 '17 '18 '19 '20 '21
MSCI AC ASEAN CAPE Ratio
CAPE Avg +1SD -1SD
30
35
40
45
50
55
60
65
70
'12 '13 '14 '15 '16 '17 '18 '19 '20 '21 '22
MSCI AC ASEAN NTM EPS, USD
Earnings Have Yet to Reflect, Valuation Remains Attractive
Medium/Long-Term Growth Potential Underappreciated
1. Source: MSCI, FactSet, March 31, 2022. NTM=Next twelve months.
2. Source: MSCI, Refinitiv, J.P. Morgan, March 31, 2022. CAPE Ratio = Cyclically Adjusted P/E Ratio.
ASEAN Earnings Has Yet to Return to Pre-COVID Levels1
ASEAN Remains Attractive on CAPE Basis2

For investment professionals only 65
Barings ASEAN Frontiers Equity Strategy
Rising Middle Class
Middle Class Consumption
Astra International, Home Product Center
Health & Well-Being
Bangkok Dusit Medical Services, Asian Sea
Local Champions
Vietnam Dairy Products, CP All
Supply Chain Diversification
Automation
Pentamaster, ViTrox
Non-China Suppliers
Hana Microelectronics, Fabrinet
Technological Ubiquity
Digital Economy
SEA, Grab
Hardware & New Infrastructure
Frontken, KCE Electronics
Key Investment Themes
Sustainability & Inclusion
Financial Inclusion & Empowerment
BTPS, Bank Rakyat Indonesia
Green Technology
Press Metal Aluminium, Flat Glass,
Vale Indonesia
Stock samples are for illustrative purpose and for reference only and must not be used, or relied upon, for the purposes of any investment decisions.
References to specific securities are not intended and should not be interpreted as recommendations to purchase, sell or hold securities of those
issuers. Barings products and strategies may or may not include the securities referenced and, if such securities are included, no representation is
being made that such securities will continue to be included.

Appendix

For investment professionals only 67
EMERGING EQUITY TEAM William Palmer (28) Michael Levy (26)
GEMS
William Palmer (28)
Michael Levy (26)
Isabelle Irish (16)
EMEA
Matthias Siller* (24)
Maria Szczesna (15)
Adnan El-Araby (12)
Timothy Eklund (10)
Alay Patel (10)
Marios Halloumis (5)
LATAM
Mike Simpson* (23)
Luis Alves De Lima (16)
CHINA
William Fong* (21)
Nicola Lai (15)
Baiding Rong (13)
Nathan Jiang (12)**
Alick Lu (12)
Alan Lee (9)
Maggie Sheng (7)
Freya Liu (6)****
Stephen Yin (4)
Salinas Zhang (3)
ASIA EX-CHINA
Soo-Hai Lim* (24)
Eunice Hong (15)
Kuldeep Khanapurkar (15)
Tiebin Liu (12)
Julie Lee (14)
Yvonne Tsai (13)***
Zachary Ong (6)
DEVELOPED EQUITY TEAM David Bertocchi (23) Nicholas Williams (31)
GLOBAL & INTERNATIONAL RESOURCES
Clive Burstow* (17)
James Govan (19)
Piers Aldred (17)
Tracy Dinh (3)
TECHNOLOGY
Matthew Ward* (16)
Colin Moar (23)
HEALTHCARE
Alexandra Hillier* (32)
SMALL & MID CAP
Nicholas Williams (31)
Colin Riddles (27)
Rosemary Simmonds (14)
William Cuss (7)
Zoe Deady (3)
David Bertocchi (23)
Jon Greenhill* (27)
Paul Morgan (26)
Robert Smith (22)
Yon Chong (15)
Wendy Herringer (14)
Richard Holroyd (7)
Norbert Kim (5)
Ashley Chen Cooper (4)
Equity Team Research Capabilities
GLOBAL & INTERNATIONAL
STRATEGIES
SMALL & MID CAP
STRATEGIES
EMERGING
STRATEGIES
CENTRALIZED INVESTMENT AND
RESEARCH PLATFORM
DR. GHADIR COOPER (26)GLOBAL HEAD OF EQUITIES
Team snapshot as at April 2022. Number in brackets indicates years of industry experience March 31, 2022.
Platform Heads in bold. *Heads of Specialist Investment Teams. **Based in Shanghai ***Based in Taipei

For investment professionals only 68
Culture – Collaborative Investing
Source: Barings as at April 2021. *Investment professionals contributing to International (focused EAFE plus strategy), International Small Cap
strategy, Global Emerging Markets strategy.
OUR COLLABORATIVE APPROACH – INCENTIVISING ALPHA
The Barings equity platform is fully integrated with continuous collaboration across our Developed, Emerging and Sector specialist
teams. By centring our platform around research, our investment professionals support the cross fertilisation of ideas through the
sharing of information, and leveraging of knowledge and expertise.
We look to formalise this collaboration through:
Topic Research Specialism Date
Nintendo Japan Team February 11th, 2021
ESG in Asia – Accelerating Asia ex Japan Team February 18th, 2021
Healthcare/Vaccines Update Healthcare Team February 26th 2021
Quarterly Global Resources Update Resources Team April 23rd, 2021
Quarterly Global Technology Update Technology Team April 30th, 2021
Corporate Governance in Japan Japan Team May 7th , 2021
RECENT FIRM-WIDE RESEARCH FORUMS CONTRIBUTION IN NUMBERS*
23
16
22
InternationalLarge Cap
InternationalSmallCap
GlobalEmergingMarkets
Weekly Meetings Team Approach
• Open door global and regionally focused team meetings
• Twice weekly Firm-wide research forums
– Analysts rotate responsibility for presenting topics
– New ideas are discussed, irrelevant of capitalisation
• Scheduling all company meetings on a platform wide
meeting diary.
• Implementation of a common research framework, applied
across all geographies, sectors and capitalisations
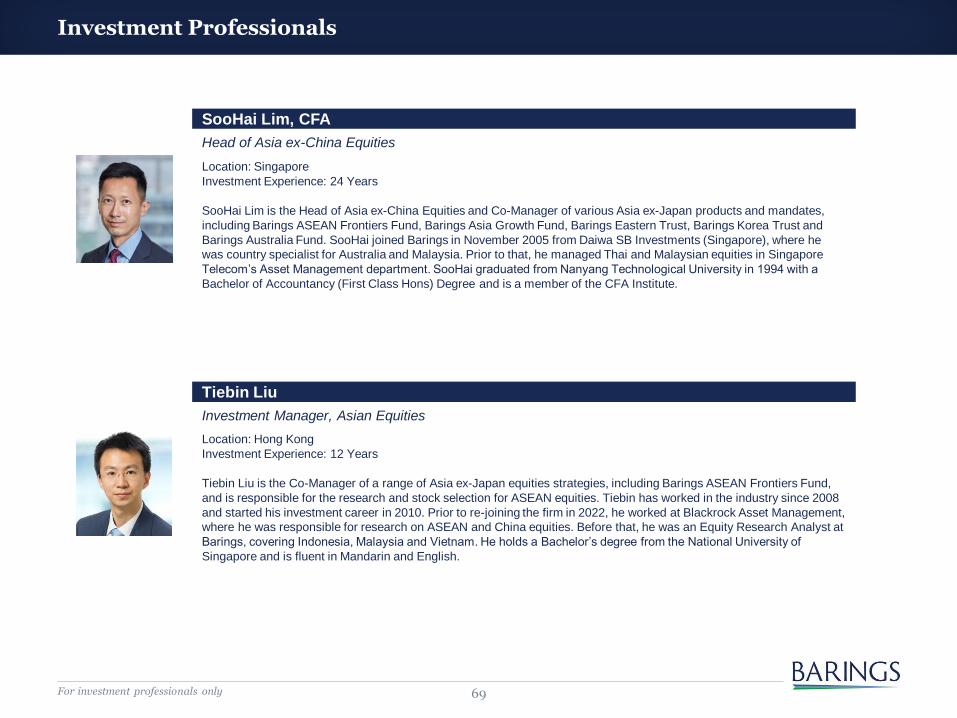
For investment professionals only 69
Investment Professionals
SooHai Lim, CFA
Head of Asia ex-China Equities
Location: Singapore
Investment Experience: 24 Years
SooHai Lim is the Head of Asia ex-China Equities and Co-Manager of various Asia ex-Japan products and mandates,
including Barings ASEAN Frontiers Fund, Barings Asia Growth Fund, Barings Eastern Trust, Barings Korea Trust and
Barings Australia Fund. SooHai joined Barings in November 2005 from Daiwa SB Investments (Singapore), where he
was country specialist for Australia and Malaysia. Prior to that, he managed Thai and Malaysian equities in Singapore
Telecom’s Asset Management department. SooHai graduated from Nanyang Technological University in 1994 with a
Bachelor of Accountancy (First Class Hons) Degree and is a member of the CFA Institute.
Tiebin Liu
Investment Manager, Asian Equities
Location: Hong Kong
Investment Experience: 12 Years
Tiebin Liu is the Co-Manager of a range of Asia ex-Japan equities strategies, including Barings ASEAN Frontiers Fund,
and is responsible for the research and stock selection for ASEAN equities. Tiebin has worked in the industry since 2008
and started his investment career in 2010. Prior to re-joining the firm in 2022, he worked at Blackrock Asset Management,
where he was responsible for research on ASEAN and China equities. Before that, he was an Equity Research Analyst at
Barings, covering Indonesia, Malaysia and Vietnam. He holds a Bachelor’s degree from the National University of
Singapore and is fluent in Mandarin and English.

For investment professionals only 70
ASEAN – Related Composite Performance

For investment professionals only 71
ASEAN – Related Composite Performance

For investment professionals only 72
Important Information
As of March 31, 2022.
For Professional Investors / Institutional Investors only. This document should not be distributed to or
relied on by Retail / Individual Investors.
Barings LLC, Barings Securities LLC, Barings (U.K.) Limited, Barings Global Advisers Limited, Barings
Australia Pty Ltd, Barings Japan Limited, Baring Asset Management Limited, Baring International
Investment Limited, Baring Fund Managers Limited, Baring International Fund Managers (Ireland) Limited,
Baring Asset Management (Asia) Limited, Baring SICE (Taiwan) Limited, Baring Asset Management
Switzerland Sàrl, and Baring Asset Management Korea Limited each are affiliated financial service
companies owned by Barings LLC (each, individually, an "Affiliate"), together known as "Barings." Some
Affiliates may act as an introducer or distributor of the products and services of some others and may be
paid a fee for doing so.
NO OFFER:
The document is for informational purposes only and is not an offer or solicitation for the purchase or sale
of any financial instrument or service in any jurisdiction. The material herein was prepared without any
consideration of the investment objectives, financial situation or particular needs of anyone who may
receive it. This document is not, and must not be treated as, investment advice, an investment
recommendation, investment research, or a recommendation about the suitability or appropriateness of
any security, commodity, investment, or particular investment strategy, and must not be construed as a
projection or prediction.
In making an investment decision, prospective investors must rely on their own examination of the merits
and risks involved and before making any investment decision, it is recommended that prospective
investors seek independent investment, legal, tax, accounting or other professional advice as appropriate.
Unless otherwise mentioned, the views contained in this document are those of Barings. These views are
made in good faith in relation to the facts known at the time of preparation and are subject to change
without notice. Individual portfolio management teams may hold different views than the views expressed
herein and may make different investment decisions for different clients. Parts of this document may be
based on information received from sources we believe to be reliable. Although every effort is taken to
ensure that the information contained in this document is accurate, Barings makes no representation or
warranty, express or implied, regarding the accuracy, completeness or adequacy of the information.
These materials are being provided on the express basis that they and any related communications
(whether written or oral) will not cause Barings to become an investment advice fiduciary under ERISA or
the Internal Revenue Code with respect to any retirement plan, IRA investor, individual retirement account
or individual retirement annuity as the recipients are fully aware that Barings (i) is not undertaking to
provide impartial investment advice, make a recommendation regarding the acquisition, holding or
disposal of an investment, act as an impartial adviser, or give advice in a fiduciary capacity, and (ii) has a
financial interest in the offering and sale of one or more products and services, which may depend on a
number of factors relating to Barings’ business objectives, and which has been disclosed to the recipient.
Any forecasts in this document are based upon Barings opinion of the market at the date of preparation and are subject to change without notice, dependent upon
many factors. Any prediction, projection or forecast is not necessarily indicative of the future or likely performance. Investment involves risk. The value of any
investments and any income generated may go down as well as up and is not guaranteed. Past performance is no indication of current or future performance. PAST
PERFORMANCE IS NOT NECESSARILY INDICATIVE OF FUTURE RESULTS. Any investment results, portfolio compositions and or examples set forth in this
document are provided for illustrative purposes only and are not indicative of any future investment results, future portfolio composition or investments. The
composition, size of, and risks associated with an investment may differ substantially from any examples set forth in this document. No representation is made that an
investment will be profitable or will not incur losses. Where appropriate, changes in the currency exchange rates may affect the value of investments. Prospective
investors should read the offering documents, if applicable, for the details and specific risk factors of any Fund/Strategy discussed in this document.
OTHER RESTRICTIONS:
The distribution of this document is restricted by law. No action has been or will be taken by Barings to
permit the possession or distribution of the document in any jurisdiction, where action for that purpose
may be required. Accordingly, the document may not be used in any jurisdiction except under
circumstances that will result in compliance with all applicable laws and regulations.
Any service, security, investment or product outlined in this document may not be suitable for a
prospective investor or available in their jurisdiction.
Any information with respect to UCITS Funds is not intended for U.S. Persons, as defined in Regulation S
under the U.S. Securities Act of 1933, or persons in any other jurisdictions where such use or distribution
would be contrary to law or local regulation.
INFORMATION:
Barings is the brand name for the worldwide asset management or associated businesses of Barings. This
document is issued by one or more of the following entities:
Barings LLC, which is a registered investment adviser with the Securities and Exchange Commission
(SEC) under the Investment Advisers Act of 1940, as amended (Barings LLC also relies on section 8.26 of
NI 31-103 (international adviser exemption) and has filed the Form 31-103F2 in Ontario, Quebec, British
Columbia, Alberta, Nova Scotia, Manitoba, New Brunswick, Newfoundland and Labrador, Prince Edward
Island and Saskatchewan);
Barings Securities LLC, which is a registered limited purpose broker-dealer with the Financial Industry
Regulatory Authority (Baring Securities LLC also relies on section 8.18 of NI 31-103 (international dealer
exemption) and has filed the Form 31-103F2 in Ontario, Quebec, British Columbia, Alberta, Nova Scotia,
Manitoba, New Brunswick, Newfoundland and Labrador, Prince Edward Island and Saskatchewan);
Barings (U.K.) Limited, which is authorized and regulated by the Financial Conduct Authority in the United
Kingdom (Ref No. 194662) and is a Company registered in England and Wales (No. 03005774) whose
registered address is 20 Old Bailey, London, EC4M 7BF.
Barings Global Advisers Limited, which is authorized and regulated by the Financial Conduct Authority in
the United Kingdom (Ref No. 552931) and is a Company registered in England and Wales (No. 07622519)
whose registered address is 20 Old Bailey, London, EC4M 7BF and is a registered investment adviser
with the SEC; Baring Asset Management Limited, which is authorized and regulated by the Financial
Conduct Authority in the United Kingdom (Ref No. 170601) and is a Company registered in England and
Wales (No. 02915887) whose registered address is 20 Old Bailey, London, EC4M 7BF; Baring
International Investment Limited, which is authorized and regulated by the Financial Conduct Authority in
the United Kingdom (Ref No. 122628), and is a Company registered in England and Wales (No.
01426546) whose registered address is 20 Old Bailey, London, EC4M 7BF, is a registered investment

For investment professionals only 73
Important Information
As of March 31, 2022.
adviser with the SEC (Baring International Investment Limited also relies on section 8.26 of NI 31-103
(international adviser exemption) and has filed the Form 31-103F2 in Quebec and Manitoba;
Baring Fund Managers Limited, which is authorized as a manager of collective investment schemes with
the Financial Conduct Authority in the United Kingdom and is authorized as an Alternative Investment
Fund Manager in several European Union jurisdictions under the Alternative Investment Fund Managers
Directive (AIFMD) passport regime;
Baring International Fund Managers (Ireland) Limited), which is authorized as an Alternative Investment
Fund Manager in several European Union jurisdictions under the Alternative Investment Fund Managers
Directive (AIFMD) passport regime and, since April 28, 2006, as a UCITS management company with the
Central Bank of Ireland;
Baring Asset Management Switzerland Sàrl, which is authorized by the Switzerland Financial Market
Supervisory Authority to offer and/or distribute collective capital investments;
Barings Australia Pty Ltd (ACN 140 045 656), which is authorized to offer financial services in Australia
under its Australian Financial Services License (No: 342787) issued by the Australian Securities and
Investments Commission;
Baring Asset Management (Asia) Limited, which is licensed by the Securities and Futures Commission of
Hong Kong to carry on regulated activities Type 1 (dealing in securities), Type 2 (dealing in futures
contracts), Type 4 (advising on securities), Type 5 (advising on futures contracts) and Type 9 (asset
management) in Hong Kong in accordance with the requirements set out in the Securities and Futures
Ordinance (Cap 571);
Barings Japan Limited, which is registered as a Financial Business Operator (Registration No. 396-KLFB)
for Type II Financial Instruments Business, Investment Advisory and Agency Business, and Investment
Management Business with the Financial Services Agency in Japan under the Financial Instruments and
Exchange Act (Act No. 25 of 1948);
Baring SICE (Taiwan) Limited, an independently operated business (Business license number: 2017 FSC-
SICE- Xin- 002; Address: 21 F, No.333, Sec. 1 Keelung Road, Taipei 11012; Taiwan Contact telephone
number: 0800 062 068); or
Baring Asset Management Korea Limited, which is authorized by the Korean Financial Services
Commission to engage in collective investment business and is registered with the Korean Financial
Services Commission to engage in privately placed collective investment business for professional
investors, discretionary investment business and advisory business.
Barings Singapore Pte. Ltd. (“BSG”), a private company incorporated in Singapore, is an indirect, wholly-
owned subsidiary of Barings. BSG is licensed by the Monetary Authority of Singapore on the 26 June
2021, for Capital Markets Service License under the Securities and Futures Act to conduct fund
management activities.
Copyright and Trademark
Copyright © 2021 Barings. Information in this document may be used for your own personal use, but may
not be altered, reproduced or distributed without Barings’ consent.
The BARINGS name and logo design are trademarks of Barings and are registered in U.S. Patent and
Trademark Office and in other countries around the world. All rights are reserved.
Performance Data
Source - © 2021 Morningstar, Inc. All Rights Reserved. The information contained herein: (1) is
proprietary to Morningstar; (2) may not be copied or distributed; and (3) is not warranted to be accurate,
complete or timely. Neither Morningstar nor its content providers are responsible for any damages or
losses arising from any use of this information. Past performance is no guarantee of future results.
Research Material
Barings only produces research for its own internal use. Where details of research are provided in this
document it is provided as an example of research undertaken by Barings and must not be used, or relied
upon, for the purposes of any investment decisions. The information and opinions expressed herein may
change at anytime.
FOR PERSONS DOMICILED IN THE US:
This document is not an offer to sell, nor a solicitation of an offer to buy, limited partnership interests,
shares or any other security, nor does it purport to be a description of the terms of or the risks inherent in
an investment in any private investment fund (“Fund”) described therein. The offer and sale of interests in
any such Fund is restricted by law, and is not intended to be conducted except in accordance with those
restrictions. In particular, no interest in or security of any of the Fund has been or will be registered under
the Securities Act of 1933 (the “Act”). All offers and sales thereof are intended to be non-public, such that
interests in and securities of any such Fund will be and remain exempt from having to be so registered. By
accepting delivery of this document, the person to whom it is delivered (a) agrees to keep the information
contained in the attached document confidential and (b) represents that they are an “accredited investor”
as defined in Regulation D promulgated by the Securities and Exchange Commission under the Securities
Act of 1933.
FOR PERSONS DOMICILED IN THE EUROPEAN UNION and the EUROPEAN ECONOMIC AREA
(EEA):
This information is only made available to Professional Investors, as defined by the Markets in Financial
Instruments Directive.
FOR PERSONS DOMICILED IN AUSTRALIA:
This publication is only made available to persons who are wholesale clients within the meaning of section
761G of the Corporations Act 2001. This publication is supplied on the condition that it is not passed on to
any person who is a retail client within the meaning of section 761G of the Corporations Act 2001.
FOR PERSONS DOMICILED IN CANADA:
This confidential marketing brochure pertains to the offering of a product only in those jurisdictions and to
those persons in Canada where and to whom they may be lawfully offered for sale, and only by persons
permitted to sell such interests. This material is not, and under no circumstances is to be construed as, an
advertisement or a public offering of a product. No securities commission or similar authority in Canada
has reviewed or in any way passed upon this document or the merits of the product or its marketing
materials, and any representation to the contrary is an offence.

For investment professionals only 74
Important Information
As of March 31, 2022.
FOR PERSONS DOMICILED IN SWITZERLAND:
This is an advertising document.
This material is aimed at Qualified Investors, as defined in article 10, paragraph 3 of the Collective
Investment Schemes Act, based in Switzerland. This material is not aimed at any other persons. The legal
documents of the funds (prospectus, key investor information document and semi-annual or annual
reports) can be obtained free of charge from the representatives named below. For UCITS – The Swiss
representative and paying agent for the Funds where the investment manager is Barings (U.K.) Limited is
UBS Fund Management (Switzerland) AG, Aeschenplatz 6, CH-4052 Basel. For QIFs – The Swiss
representative and paying agent for the Funds where the investment manager is Barings Global Advisers
Limited is UBS Fund Management (Switzerland) AG, Aeschenplatz 6, CH-4052 Basel. The Swiss
representative and paying agent for Funds where the investment manager is Baring Asset Management
Limited is BNP Paribas Securities Services, Paris, succursdale de Zurich, Selnaustrasse16, 8002 Zurich,
Switzerland.
FOR PERSONS DOMICILED IN HONG KONG:
Distribution of this document, and placement of shares in Hong Kong, are restricted for funds not
authorized under Section 104 of the Securities and Futures Ordinance of Hong Kong by the Securities and
Futures Commission of Hong Kong. This document may only be distributed, circulated or issued to
persons who are professional investors under the Securities and Futures Ordinance and any rules made
under that Ordinance or as otherwise permitted by the Securities and Futures Ordinance. The contents of
this document have not been reviewed by any regulatory authority in Hong Kong. You are advised to
exercise caution in relation to the offer. If you are in any doubt about any of the contents of this document,
you should obtain independent professional advice.
FOR PERSONS DOMICILED IN SOUTH KOREA:
Neither this document nor Barings is making any representation with respect to the eligibility of any
recipients of this document to acquire interests in the Fund under the laws of Korea, including but without
limitation the Foreign Exchange Transaction Act and Regulations thereunder. The Fund may only be
offered to Qualified Professional Investors, as such term is defined under the Financial Investment
Services and Capital Markets Act, and this Fund may not be offered, sold or delivered, or offered or sold
to any person for re-offering or resale, directly or indirectly, in Korea or to any resident of Korea except
pursuant to applicable laws and regulations of Korea.
FOR PERSONS DOMICILED IN SINGAPORE:
This document has been prepared for informational purposes only, and should not be considered to be an
advertisement or an offer for the sale or purchase or invitation for subscription or purchase of interests in
the Fund. This document has not been registered as a prospectus with the Monetary Authority of
Singapore. Accordingly, statutory liability under the SFA in relation to the content of prospectuses would
not apply. This document or any other material in connection with the offer or sale, or invitation for
subscription or purchase of interests in the Fund, may not be circulated or distributed to persons in
Singapore other than (i) to an institutional investor pursuant to Section 304 of the Securities and Futures Act,
Chapter 289 of Singapore (the "SFA"), (ii) to a relevant person pursuant to Section 305 of the SFA, or (iii)
otherwise pursuant to, and in accordance with the conditions of, any other applicable provision of the SFA.
FOR PERSONS DOMICILED IN TAIWAN:
The Shares of in the nature of securities investment trust funds are being made available in Taiwan only to
banks, bills houses, trust enterprises, financial holding companies and other qualified entities or
institutions (collectively, “Qualified Institutions”) pursuant to the relevant provisions of the Taiwan Rules
Governing Offshore Funds (the “Rules”) or as otherwise permitted by the Rules. No other offer or sale of
the Shares in Taiwan is permitted. Taiwan’s qualified Institutions which purchase the Shares may not sell
or otherwise dispose of their holdings except by redemption, transfer to a Qualified Institution, transfer by
operation of law or other means approved by Taiwan Financial Supervisory Commission. Investors should
note that if the Shares are not in the nature of securities investment trust funds, they are not approved or
reported for effectiveness for offering, sales, issuance or consultation by Taiwan Financial Supervisory
Commission. The information relating to the shares in this document is for information only and does not
constitute an offer, recommendation or solicitation in Taiwan.
FOR PERSONS DOMICILED IN JAPAN:
This material is being provided for information purposes only. It is not an offer to buy or sell any Fund
interest or any other security. The Fund has not been and will not be registered pursuant to Article 4,
Paragraph 1 of the Financial Instruments and Exchange Act of Japan (Act No. 25 of 1948) and,
accordingly, it may not be offered or sold, directly or indirectly, in Japan or to, or for the benefit, of any
Japanese person or to others for re-offering or resale, directly or indirectly, in Japan or to any Japanese
person except under circumstances which will result in compliance with all applicable laws, regulations
and guidelines promulgated by the relevant Japanese governmental and regulatory authorities and in
effect at the relevant time. For this purpose, a “Japanese person” means any person resident in Japan,
including any corporation or other entity organized under the laws of Japan.
FOR PERSONS DOMICILED IN THAILAND:
This document is only made available to qualified institutional investors/high-net-worth individuals
according to Notification of the Capital Market Supervisory Board No. Tor Thor. 1/2560. It is for
information only and is not an advertisement, investment recommendation, research or advice. It does not
have regard to the specific investment objectives, financial situation or needs of any specific person. You
should seek advice from a financial adviser if you are in any doubt about any of the content of this
document. None of the funds has been registered with the Office of the Securities and Exchange
Commission. Barings is not licensed to carry out fund management activities in Thailand and has no
intention to solicit your investment or subscription in the fund directly in Thailand.
FOR PERSONS DOMICILED IN PERU:
The Fund is not registered before the Superintendencia del Mercado de Valores (SMV) and it is placed by
means of a private offer. SMV has not reviewed the information provided to the investor. This document is
only for the exclusive use of institutional investors in Peru and is not for public distribution.
FOR PERSONS DOMICILED IN CHILE:
Esta oferta privada se acoge a las disposiciones de la norma de carácter general nº 336 de la
superintendencia de valores y seguros, hoy comisión para el mercado financiero. Esta oferta versa sobre
valores no inscritos en el registro de valores o en el registro de valores extranjeros que lleva la comisión
para el mercado financiero, por lo que tales valores no están sujetos a la fiscalización de ésta; Por tratar
de valores no inscritos no existe la obligación por parte del emisor de entregar en chile información
pública respecto de los valores sobre los que versa esta oferta; Estos valores no podrán ser objeto de
oferta pública mientras no sean inscritos en el registro de valores correspondiente.

For investment professionals only 75
Important Information
As of March 31, 2022.
FOR PERSONS DOMICILED IN ARGENTINA:
This document includes a private invitation to invest in securities. It is addressed only to you on an
individual, exclusive, and confidential basis, and its unauthorized copying, disclosure, or transfer by any
means whatsoever is absolutely and strictly forbidden. Barings will not provide copies of this document
or provide any kind of advice or clarification, or accept any offer or commitment to purchase the
securities herein referred to from persons other than the intended recipient. The offer herein contained
is not a public offering, and as such it is not and will not be registered with, or authorized by, the
applicable enforcement authority. The information contained herein has been compiled by Barings, who
assumes the sole responsibility for the accuracy of the data herein disclosed.
FOR PERSONS DOMICILED IN BRAZIL:
The fund may not be offered or sold to the public in Brazil. Accordingly, the fund has not been nor will
be registered with the Brazilian Securities Commission – CVM nor have they been submitted to the
foregoing agency for approval. Documents relating to the fund, as well as the information contained
therein, may not be supplied to the public in Brazil, as the offering of fund is not a public offering of
securities in Brazil, nor used in connection with any offer for subscription or sale of securities to the
public in Brazil.
FOR PERSONS DOMICILED IN COLOMBIA:
The material herein does not constitute a public offer in the Republic of Colombia. This document does
not constitute a public offer in the Republic of Colombia. The offer of the fund is addressed to less than
one hundred specifically identified investors. The fund may not be promoted or marketed in Colombia
or to Colombian residents, unless such promotion and marketing is made in compliance with Decree
2555 of 2010 and other applicable rules and regulations related to the promotion of foreign funds in
Colombia. The distribution of this document and the offering of shares may be restricted in certain
jurisdictions. The information contained in this document is for general guidance only, and it is the
responsibility of any person or persons in possession of this document and wishing to make application
for shares to inform themselves of, and to observe, all applicable laws and regulations of any relevant
jurisdiction. Prospective applicants for shares should inform themselves of any applicable legal
requirements, exchange control regulations and applicable taxes in the countries of their respective
citizenship, residence or domicile.
FOR PERSONS DOMICILED IN MEXICO:
The securities offered hereby are not and will not be registered in the national securities registry
(Registro Nacional De Valores) maintained by the Mexican Banking and Securities Commission
(Comision Nacional Bancaria y De Valores “CNBV”). These securities may not be publicly offered or
sold in Mexico without the applicability of an exemption for the private placement of securities pursuant
to the Mexican Securities law. In making an investment decision, you should rely on your own review
and examination of the fund / security. These securities are not being offered and may not be offered
nor acquired within the territory of the United Mexican States. The information contained herein has not
been reviewed or authorized by the CNBV. Any Mexican investor who acquires the securities does so
at his or her own risk.
FOR PERSONS DOMICILED IN PANAMA:
This is not a public offering. This document is only for the exclusive use of institutional investors. The
securities mentioned in this document have not been registered with nor fall under the supervision of the
Superintendence of the Securities Market of Panama. The distribution of this document and the offering of
shares may be restricted in certain jurisdictions. The above information is for general guidance only, and it
is the responsibility of any person or persons in possession of this document and wishing to make
application for shares to inform themselves of, and to observe, all applicable laws and regulations of any
relevant jurisdiction. Prospective applicants for shares should inform themselves as to legal requirements
also applying and any applicable exchange control regulations and applicable taxes in the countries of
their respective citizenship, residence or domicile. This document does not constitute an offer or
solicitation to any person in any jurisdiction in which such offer, or solicitation is not authorized or to any
person to whom it would be unlawful to make such offer or solicitation.
FOR PERSONS DOMICILED IN URUGUAY:
The sale of the product qualifies as a private placement pursuant to section 2 of Uruguayan law 18,627.
The product must not be offered or sold to the public in Uruguay, except in circumstances which do not
constitute a public offering or distribution under Uruguayan laws and regulations. The product is not and
will not be registered with the Financial Services Superintendency of the Central Bank of Uruguay. The
product corresponds to investment funds that are not investment funds regulated by Uruguayan law
16,774 dated September 27, 1996, as amended.