Frontiers of molecular gas sensing - Inspire HEP
63
DOI 10.1393/ncr/i2017-10133-9 RIVISTA DEL NUOVO CIMENTO Vol. 40, N. 3 2017 Frontiers of molecular gas sensing P. Maddaloni( 1 )( 2 ), S. Bartalini( 3 ), P. Cancio( 3 ), M. De Rosa( 1 ), D. Mazzotti( 3 ) and P. De Natale( 3 ) ( 1 ) CNR-INO, Istituto Nazionale di Ottica - Via Campi Flegrei 34 80078 Pozzuoli (NA), Italy ( 2 ) INFN, Istituto Nazionale di Fisica Nucleare, Sezione di Napoli Complesso Universitario di M.S. Angelo - Via Cintia, 80126 Napoli, Italy ( 3 ) CNR-INO, Istituto Nazionale di Ottica - Via N. Carrara 1 50019 Sesto Fiorentino (FI), Italy received 14 November 2016 137 1. Introduction: developing a photonic toolkit for detecting and manipulating molecules 138 2. Laser sources based on nonlinear optical processes 138 2 . 1. Difference frequency generators 140 2 . 1.1. OFC referenced OCE-DFG infrared source 143 2 . 2. Optical parametric oscillators 145 2 . 2.1. Signal frequency stabilization 146 2 . 2.2. OFC-referenced OPO 148 2 . 2.3. χ (2) Optical Frequency Combs 151 3. Quantum cascade lasers 152 3 . 1. Intrinsic linewidth and broadening mechanisms 153 3 . 2. Locking techniques for metrological-grade QCLs 156 4. Precision spectroscopic techniques for molecular detection 156 4 . 1. High-resolution spectroscopy with OPOs 157 4 . 2. High-resolution spectroscopy with QCLs 160 4 . 3. Pushing the sensitivity limits of molecular detection 163 4 . 3.1. Saturated-absorption cavity ring-down (SCAR): theory and ex- periments 164 4 . 3.2. SCAR1 setup: first technique demonstration 167 4 . 3.3. SCAR1 power-boosted setup: proof-of-principle optical detection of radiocarbon 167 4 . 3.4. Accurate frequency measurements of 14 C 16 O2 transitions 168 4 . 3.5. Extended linearity range and intercomparison with AMS 169 4 . 3.6. Refined theoretical model for SCAR spectroscopy 169 4 . 3.7. SCAR2 setup: challenging AMS performance 172 4 . 3.8. Perspectives of ultrahigh-sensitivity molecular detection 172 5. Cooling stable molecules for pushing frequency measurement precision: spec- troscopy of buffer-gas-cooled beams 174 5 . 1. Laser absorption spectroscopy inside the BGC cell: characterizing the col- lisional cooling process 174 5 . 1.1. Translational temperature 175 5 . 1.2. Rotational temperature 176 5 . 1.3. Cross section 176 5 . 2. CRDS on the cold molecular beam 180 6. Conclusions and perspectives c Societ` a Italiana di Fisica 135
-
Upload
khangminh22 -
Category
Documents
-
view
0 -
download
0
Transcript of Frontiers of molecular gas sensing - Inspire HEP

DOI 10.1393/ncr/i2017-10133-9
RIVISTA DEL NUOVO CIMENTO Vol. 40, N. 3 2017
Frontiers of molecular gas sensing
P. Maddaloni(1)(2), S. Bartalini(3), P. Cancio(3), M. De Rosa(1),D. Mazzotti(3) and P. De Natale(3)(1) CNR-INO, Istituto Nazionale di Ottica - Via Campi Flegrei 34
80078 Pozzuoli (NA), Italy(2) INFN, Istituto Nazionale di Fisica Nucleare, Sezione di Napoli
Complesso Universitario di M.S. Angelo - Via Cintia, 80126 Napoli, Italy(3) CNR-INO, Istituto Nazionale di Ottica - Via N. Carrara 1
50019 Sesto Fiorentino (FI), Italy
received 14 November 2016
137 1. Introduction: developing a photonic toolkit for detecting and manipulatingmolecules
138 2. Laser sources based on nonlinear optical processes138 2
.1. Difference frequency generators
140 2.1.1. OFC referenced OCE-DFG infrared source
143 2.2. Optical parametric oscillators
145 2.2.1. Signal frequency stabilization
146 2.2.2. OFC-referenced OPO
148 2.2.3. χ(2) Optical Frequency Combs
151 3. Quantum cascade lasers152 3
.1. Intrinsic linewidth and broadening mechanisms
153 3.2. Locking techniques for metrological-grade QCLs
156 4. Precision spectroscopic techniques for molecular detection156 4
.1. High-resolution spectroscopy with OPOs
157 4.2. High-resolution spectroscopy with QCLs
160 4.3. Pushing the sensitivity limits of molecular detection
163 4.3.1. Saturated-absorption cavity ring-down (SCAR): theory and ex-
periments164 4
.3.2. SCAR1 setup: first technique demonstration
167 4.3.3. SCAR1 power-boosted setup: proof-of-principle optical detection
of radiocarbon167 4
.3.4. Accurate frequency measurements of 14C16O2 transitions
168 4.3.5. Extended linearity range and intercomparison with AMS
169 4.3.6. Refined theoretical model for SCAR spectroscopy
169 4.3.7. SCAR2 setup: challenging AMS performance
172 4.3.8. Perspectives of ultrahigh-sensitivity molecular detection
172 5. Cooling stable molecules for pushing frequency measurement precision: spec-troscopy of buffer-gas-cooled beams
174 5.1. Laser absorption spectroscopy inside the BGC cell: characterizing the col-
lisional cooling process174 5
.1.1. Translational temperature
175 5.1.2. Rotational temperature
176 5.1.3. Cross section
176 5.2. CRDS on the cold molecular beam
180 6. Conclusions and perspectives
c© Societa Italiana di Fisica 135

136 P. MADDALONI, S. BARTALINI, P. CANCIO, M. DE ROSA, D. MAZZOTTI and P. DE NATALE
Summary. — Mainly driven by the recent dramatic progress of infrared technolo-gies, as well as by the emerging methods for cooling of ground-state molecules, thefield of precision molecular spectroscopy is experiencing a new youth, as it promisesto lead major advances both in fundamental and applied science. The present re-view will encompass the main results obtained in the last two decades, by our group,in this scope, particularly in the mid infrared and THz spectral regions. Startingfrom the development of novel, metrological-grade coherent radiation sources, ei-ther in continuous-wave or in pulsed-emission regime, we will go through the real-ization of more an more sophisticated spectroscopic interrogation techniques. Wewill then conclude with the first demonstration of cavity-enhanced ro-vibrationalspectroscopy on a buffer-gas-cooled molecular beam. From this brief overview itemerges that high-precision physical fundamental measurements can be done, atpresent, at an energy scale as low as the photons used for harnessing the molecularsamples.
1. – Introduction: developing a photonic toolkit for detecting and manipu-lating molecules
Nowadays, precision molecular spectroscopy plays an increasingly important role in atwofold perspective [1]. From a fundamental point of view, next to the position held byatoms, it has always been one of the preferred tools to test Quantum Electrodynamicsand to improve the precision of fundamental physical constants [2]; to address symmetryviolation tests, like the search for the electron’s electric dipole moment (EDM) [3,4] andthe measurement of energy differences in enantiomers of chiral species [5]; to test timeand space variations of fundamental constants [6-9] with immediate repercussions on thedictates of General Relativity; to try solving specific puzzles of the Standard Model,such as the strong charge-parity (CP) problem, with the investigation of axion darkmatter [10]; and, more generally, to explore new Physics beyond the Standard Modeland Einsteins Cosmology, like the quest for Dark Energy, particularly in the form ofQuintessence (a fifth fundamental force) [11]. On the application side, gas monitoring inthe most diverse measurement conditions is becoming of utmost importance to get ac-curate and time-resolved information of the systems under study: global climate changemodelling, pollution control, biomedical applications, development of low-emission en-gines, and field-deployable instrumentation for geophysical or homeland-security applica-tions, will increasingly need sensitive, accurate, highly selective molecular gas sensors [12].
Whereas advances in manufacturing of semiconductor lasers and devices, mainlydriven by telecommunication applications, had a ground-breaking impact on atomphysics, they did not result in a comparable progress for sensing of molecular species. In-deed, though near infrared (NIR) detection can rely on the most advanced spectroscopictechniques and on the widest choice of optical components, only overtone moleculartransitions can be accessed. These are typically several orders of magnitude weaker thanfundamental ro-vibrational transitions, thus degrading the achievable detection sensitiv-ity. Moreover, since Doppler-limited molecular linewidths scale linearly with frequency,at low-pressure gas detection, spectral resolution is lower when using overtone rather thanfundamental bands. Although interrogation of fundamental bands is certainly highly re-warding, extension of well-established spectroscopic techniques developed in the NIR has

FRONTIERS OF MOLECULAR GAS SENSING 137
been, until recently, a formidable challenge. The main issue was the lack of widely tun-able mid infrared (MIR) sources and optical components of sufficiently high quality. Inthe last 15 years, the situation has dramatically changed, partly due to the experimentaldemonstration of quasi–phase-matching (QPM) in periodically-poled nonlinear crystals.This paved the way to highly efficient coherent radiation sources based on frequencymixing processes, like optical parametric oscillation (OPO) and difference frequency gen-eration (DFG). In parallel, quantum-well engineering of semiconductor structures madepossible the advent of quantum cascade lasers (QCLs). Since then, perspectives forMIR molecular detection have completely changed. Similar technological achievementshave been recorded, although more recently, in the far infrared (FIR) region, providingadditional opportunities in the field of rotational molecular spectroscopy.
This review describes precisely the most significant steps taken in this direction byour group over the past two decades. Indeed, we have demonstrated several effectivemethodologies intended to establish innovative, metrological-grade MIR-FIR coherentradiation sources, either in continuous-wave (CW) or in pulsed-emission regime. Thishas allowed to make dramatic progress in precision molecular spectroscopy, with animprovement of several orders of magnitude in measurement resolution, accuracy andsensitivity. Given the enormous progress in sources and techniques, we are now activelymanipulating the properties of molecular samples in order to get access to the tiniestphysical phenomena, thus opening a low-energy window (eV scale) on our Universe.The paper is organized as follows: sects. 2, 3 describe the highest-performance infraredcoherent radiation sources so far developed for precision molecular spectroscopy, basedeither on χ2 nonlinear generation processes, such as DFG and OPO, or on direct laseremission like in QCLs. Hinging upon these types of probe source, sect. 4 reports onthe sophisticated combination of more or less traditional high-resolution and -sensitivityspectroscopic techniques with the recent schemes of absolute frequency metrology basedon optical frequency comb synthesizers (OFCSs). Section 5 deals with the emergingmethods to produce cold stable molecules and the first steps towards application of theabove state-of-the-art spectroscopic interrogation sources and schemes to these novelsamples. In sect. 6, conclusions and perspectives are drawn.
2. – Laser sources based on nonlinear optical processes
Historically, the main drawback of direct laser radiation devices, particularly in theinfrared (IR) window, was represented by the incomplete spectral coverage or limitedmode-hop free tuning range. In this respect, a key role was played by the discovery, inthe early sixties, of frequency-mixing phenomena occurring in suitable optical crystalsas a result of intense light excitation. Indeed, laser sources can provide sufficiently highlight intensities to modify the optical properties of materials; in this case, light wavescan interact with each other, exchanging momentum and energy, and the superpositionprinciple is no longer valid. Such a nonlinear interaction can result in the generation ofoptical fields at new frequencies, basically via three processes (optical parametric oscil-lation, sum- and difference-frequency generation), which are tunable over large spectralintervals.
2.1. Difference frequency generators. – Among all the recently developed IR coherentradiation sources, those based on DFG in nonlinear optical media have proved to be themost reliable ones for spectroscopic applications [13]. Indeed, due to the deterministic and

138 P. MADDALONI, S. BARTALINI, P. CANCIO, M. DE ROSA, D. MAZZOTTI and P. DE NATALE
coherent character of the DFG process, frequency stability and spectral purity properties,attainable for the visible/NIR pumping lasers through well-established techniques, areautomatically transferred to the MIR radiation [14-25]. A typical DFG setup consistsof two seed visible/NIR lasers, namely a signal (s) and a pump (p), which are focussedand mixed into a nonlinear optical crystal of length L (having a non-null second-ordersusceptibility, χ(2)) to generate an idler (i) beam at the difference frequency, νi = c/λi =νp − νs = c/λp − c/λs. Considering two collinear pumping laser beams with powersPs and Pp, and assuming Gaussian beam coupling with identical confocal parameters(b ≡ bs = bp), the DFG output power Pi at νi can be written as [26]
Pi =1024π4
c3ν2
i
d2eff
ninsnp
h(μ, ξ, α)L
k−1s + k−1
p
PpPs e−αL,(1)
where c is the speed of light in vacuum; ni,s,p denotes the refractive index of the non-linear crystal at the idler, signal and pump frequency; ks,p is the wave number of thesignal and pump laser field; deff represents the effective nonlinear coefficient; α indi-cates the absorption coefficient of the nonlinear medium at the generated frequency; andh(μ = kp/ks, ξ = L/b, α) is the so-called focusing function which contains walk-off andfocused beam effects in the crystal (the units in eq. (1) are CGS and ε0 is not factored outof deff). A first consideration from eq. (1) is that the generated IR power varies linearlywith the product of the input signal/pump powers; however, a limit to the use of higherand higher input powers is imposed by the optical damage threshold of the nonlinearmedium. Secondly, the DFG efficiency increases linearly with the product h(μ, ξ, α)L,reaching a maximum value for ξ = L/b ∼ 1.3; the h-function reduces to h ∼ ξ when usingloose focusing parameter ξ � 1, which makes the DFG power proportional to L2, as inthe case of the plane-wave approximation. Finally, Pi is proportional to the nonlinearoptical figure of merit, d2
eff/ninsnp, mainly determined by the χ(2) tensor of the crystaland the propagation configuration of the p, s, i beams, taking into account that thewave-vector momentum must be conserved (phase-matching condition). Formerly devel-oped CW DFG sources mainly relied on birefringent phase-matching (BPM) in uniaxialcrystals; unfortunately, this approach uses off-diagonal elements of the χ(2) tensor, whichhave smaller values than diagonal ones. In the nineties, this limitation was overcome bythe introduction of periodically poled (PP) crystals. In this case, several slices of theselected nonlinear material are placed end-to-end, each slice being of length Λ, but withthe sign of the second-order susceptibility alternating from one piece to the next. Then,momentum is conserved through an additional contribution corresponding to the wavevector K = 2π/Λ of the periodic structure. In contrast to BPM, by appropriate selectionof Λ, QPM materials can be engineered for phase matching at any wavelengths withinthe transparency range of the crystal. This method enables a free choice of polarizationof the interacting waves and hence the exploitation of the largest nonlinear susceptibilitycomponents (diagonal elements of the χ(2) tensor). Moreover, since QPM does not rely onbirefringence, it can be used in isotropic materials with a high optical nonlinearity. Themost popular technique for generating QPM nonlinear crystals is based on ferroelectricdomain engineering of ferroelectric materials such as lithium niobate (LiNbO3), lithiumtantalate (LiTaO3), and potassium titanyl phosphate (KTP, KTiOPO4). Among these,LiNbO3 (LN) is one of the most used, due to its high deff coefficient for DFG processesand its large transparency from 350 to 5200 nm. Typical poling periods range between5 and 50 μm. For idler wavelengths below 5μm, apart from some demonstrations withPP KTiOPO4 [27] and PP RbTiOAsO4 [28], the vast majority of CW DFG sources has

FRONTIERS OF MOLECULAR GAS SENSING 139
been realized with PPLN crystals, almost always in single-pass configuration where thepumping laser beams pass once through the nonlinear crystal [16, 17, 19, 20, 24, 29-35].The drawback of this simple and robust solution is the lower level of generated IR powerwhich can only be boosted by using powerful pumping sources like NIR fiber lasers. Al-ternatively, optical cavity enhanced (OCE) DFG sources have been developed to enhancethe generation efficiency at the expense of an increased technological complexity [32-34].Here, pump and/or signal lasers are resonant in an optical enhancement cavity where thePPLN crystal is placed, increasing the effective interaction length of the DFG process,and consequently the output IR power. In both cases, pumping powers of the order of afew W and higher are reached within the PPLN crystal, and MgO or Zn doping is usedto raise the damage threshold of the nonlinear medium. Another option to increase thegeneration efficiency is based on the use of longer crystals. However, due to its longerwavelength, the generated idler beam diverges much faster than the pump and signalbeams, and hence it may clip causing diffraction and scattering noise if the crystal thick-ness is too thin or the crystal length too long. Eventually, the most useful length of thecrystal is determined by the combination of idler wavelength, PPLN crystal thickness,and focussing condition. To overcome this limitation, in recent years, an alternative DFGcrystal design utilizing a ridge-type waveguide PPLN has been demonstrated [36,37]. Ina waveguide, the cross section of the nonlinear conversion is kept to the smallest possibleguiding size over the length of the crystal, and thus is proportional to L2. WaveguidePPLN crystals demonstrated conversion efficiencies of 100 times higher than bulk PPLNcrystals, resulting in tens of mWs of DFG power. In particular, thanks to its resistance tophoto-refractive damage, a QPM Zn:LiNbO3 waveguide was recently used in conjunctionwith a high-power fiber amplifier as a pump source to realize a 3.4μm DFG source witha tunability range of 10 nm and a maximum output power of 65 mW [36].
The scaling of the generation efficiency with the square of the idler frequency, togetherwith the strong absorption effects in ferroelectric DFG crystals at long wavelengths,pushes for searching alternative nonlinear materials for DFG in the MIR (5–30μm re-gion) and FIR region (THz window). Apart from some attempts with LiInSe2 [38] andLiINS2 [39] biaxial crystals for wavelengths between 4 and 10μm, semiconductors withoptical birefringence are good candidates for this purpose [40]. In this frame, single-pass DFG systems based on AgGaS2 [41-44] and AgGaSe2 [45] were first realized. Morerecently, our group reported on the generation of coherent radiation (� 100 μW power)around 5.85μm by DFG between a CW Nd:YAG laser at 1064 nm and a diode-laser at1301 nm in an orientation-patterned gallium phosphide (OP-GaP) crystal. Here, the firstcharacterization of the linear, thermo-optic and nonlinear properties of OP-GaP was pro-vided, together with a derivation of the effective nonlinear coefficient deff = 17±3 pm/V.Semiconductor materials lacking of second-order susceptibility have also been addressed;for example, by suitable optical tailoring of GaAs [46-48] and Si [49], waveguide configu-rations exhibiting second-order nonlinearity effects have been created to accomplish DFGin the mid and far IR. DFG THz generation, either with LN [50-52] or GaAs [53, 54], isat present the most promising route to get far IR coherent radiation sources operating atroom temperature. In a different approach, a dual emitting, room-temperature QCL hasbeen used as a medium for an intra-cavity DFG process to produce THz radiation [55,56].
2.1.1. OFC referenced OCE-DFG infrared source. So far, the most sophisticated DFGsource in terms of combined output-power and spectral characteristics was developedat Istituto Nazionale di Ottica. It is an OCE-DFG source, based on a special intra-cavity design [34] where the pumping sources are referenced to a Ti:sapphire OFCS via

140 P. MADDALONI, S. BARTALINI, P. CANCIO, M. DE ROSA, D. MAZZOTTI and P. DE NATALE
Fig. 1. – Layout of the intracavity DFG source. FA, fiber amplifier; OI, optical isolator; OFC,optical frequency comb; L, lens; M, dielectric mirror; DM, dichroic mirror; GM, gold mirror;OC, output coupler; λ/2, half-wave plate; λ/4, quarter-wave plate; DG, diffraction grating;PBS, polarizing beam splitter; PH, pinhole; PD, photodiode; BS, beam stopper; SM, sphericalmirror. Reproduced from ref. [34] with permission from the Optical Society of America.
a direct digital synthesis (DDS) scheme [31]. In essence, the intra-cavity setup enhancesthe idler output power up to 30 mW (at 4510 nm, the edge of the PPLN transparency),while the DDS approach provides an intrinsic linewidth as low as 10 Hz. In this source,shown in fig. 1, the DFG crystal (a 2 cm length periodically poled MgO:LiNbO3) isplaced at the secondary waist position of a compact ring Ti:sapphire laser. The highintra-cavity power (up to 50 W) of the Ti:sapphire emission around 800 nm is the pumpof the DFG process, whereas the DFG signal beam (10 W), coming from a Nd:YAGlaser at 1064 nm, is injected into the cavity after passing through an Yb-doped fiberamplifier. The Ti:sapphire laser is injection-locked by a fiber-coupled external cavitydiode laser (ECDL) with a 838–863 nm tuning range, thus permitting tuning of the idlerwithin the 3850–4540 nm range. The Ti:sapphire cavity is kept resonant with the ECDLfrequency by controlling the cavity length with a polarization-based Hansch-Couillaudlock technique. Thanks to the different dispersion angle of the p, s, i beams at the outputfacet of the PPLN crystal (which is Brewster cut for λp to minimize intra-cavity lossesof the Ti:sapphire laser), the IR generated beam can be easily extracted from the cavitywithout interfering with the Ti:sapphire oscillating condition. Now, let us discuss theabsolute frequency control of the generated IR radiation by means of the DDS technique(see fig. 2). Both pump and signal frequencies are beaten with the closest tooth ofthe OFCS (the corresponding integer orders Np and Ns are measured by a wavemeter)and the respective radio frequency (RF) beat notes Δνpc and Δνsc satisfy the followingequations:

FRONTIERS OF MOLECULAR GAS SENSING 141
Fig. 2. – OFCS-referenced DFG infrared source. OFCS is used as a transfer oscillator to phase-lock the ECDL directly to the Nd:YAG laser. DM, dichroic mirror; Ge, germanium filter.Reproduced from ref. [31] with permission from the Optical Society of America.
Δνpc = νp − Npνr − ν0,(2)
Δνsc = νs − Nsνr − ν0,(3)
where νr � 1 GHz and ν0 are the comb repetition rate and carrier-envelope-offset (CEO),respectively. First, the ν0 frequency is removed from these beat notes by standard RFmixing, thus yielding Δνpc +ν0 and Δνsc +ν0. A low bandwidth (� 10 Hz) phase-locked-loop (PLL) is used to remove the frequency drift of the Nd:YAG laser. After this, a DDScircuit multiplies the Δνsc + ν0 frequency by a factor Np/Ns. A second PLL circuitwith a wide bandwidth (� 2 MHz) locks the Δνpc + ν0 frequency to the DDS output bysending feedback corrections to the ECDL current and to the piezoelectric transducer(PZT) voltage. The pump frequency is then νp = (Np/Ns)νs, without any contributionfrom the OFC parameters νr and ν0 (at least for frequencies > 10 Hz). As a result, theabsolute frequency νi of the generated idler radiation is given by the following equation:
νi = νp − νs =(
Np
Ns− 1
)νs.(4)
Therefore, the idler linewidth δνi can be expressed in terms of the signal linewidth δνs
as follows:
δνi =(
Np
Ns− 1
)δνs,(5)
where, for all frequencies below 10 Hz, δνs traces the linewidth of the comb tootharound 1064 nm while, for all frequencies above 10 Hz, δνs coincides with the free-runningNd:YAG laser fluctuations. The accuracy of νi is only limited by the reference oscillatorof the OFCS. In the original experiment this was a Rb/GPS-disciplined 10 MHz quartz
142 P. MADDALONI, S. BARTALINI, P. CANCIO, M. DE ROSA, D. MAZZOTTI and P. DE NATALE
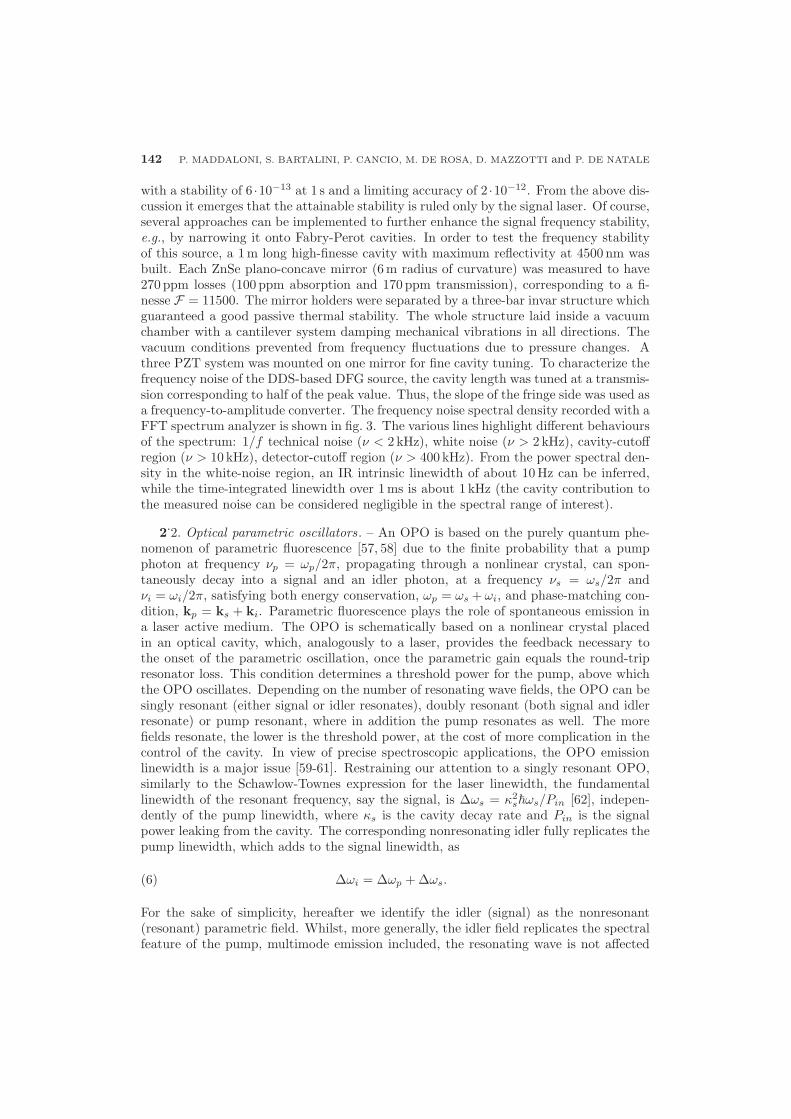
with a stability of 6 ·10−13 at 1 s and a limiting accuracy of 2 ·10−12. From the above dis-cussion it emerges that the attainable stability is ruled only by the signal laser. Of course,several approaches can be implemented to further enhance the signal frequency stability,e.g., by narrowing it onto Fabry-Perot cavities. In order to test the frequency stabilityof this source, a 1 m long high-finesse cavity with maximum reflectivity at 4500 nm wasbuilt. Each ZnSe plano-concave mirror (6 m radius of curvature) was measured to have270 ppm losses (100 ppm absorption and 170 ppm transmission), corresponding to a fi-nesse F = 11500. The mirror holders were separated by a three-bar invar structure whichguaranteed a good passive thermal stability. The whole structure laid inside a vacuumchamber with a cantilever system damping mechanical vibrations in all directions. Thevacuum conditions prevented from frequency fluctuations due to pressure changes. Athree PZT system was mounted on one mirror for fine cavity tuning. To characterize thefrequency noise of the DDS-based DFG source, the cavity length was tuned at a transmis-sion corresponding to half of the peak value. Thus, the slope of the fringe side was used asa frequency-to-amplitude converter. The frequency noise spectral density recorded with aFFT spectrum analyzer is shown in fig. 3. The various lines highlight different behavioursof the spectrum: 1/f technical noise (ν < 2 kHz), white noise (ν > 2 kHz), cavity-cutoffregion (ν > 10 kHz), detector-cutoff region (ν > 400 kHz). From the power spectral den-sity in the white-noise region, an IR intrinsic linewidth of about 10 Hz can be inferred,while the time-integrated linewidth over 1 ms is about 1 kHz (the cavity contribution tothe measured noise can be considered negligible in the spectral range of interest).
2.2. Optical parametric oscillators. – An OPO is based on the purely quantum phe-nomenon of parametric fluorescence [57, 58] due to the finite probability that a pumpphoton at frequency νp = ωp/2π, propagating through a nonlinear crystal, can spon-taneously decay into a signal and an idler photon, at a frequency νs = ωs/2π andνi = ωi/2π, satisfying both energy conservation, ωp = ωs + ωi, and phase-matching con-dition, kp = ks + ki. Parametric fluorescence plays the role of spontaneous emission ina laser active medium. The OPO is schematically based on a nonlinear crystal placedin an optical cavity, which, analogously to a laser, provides the feedback necessary tothe onset of the parametric oscillation, once the parametric gain equals the round-tripresonator loss. This condition determines a threshold power for the pump, above whichthe OPO oscillates. Depending on the number of resonating wave fields, the OPO can besingly resonant (either signal or idler resonates), doubly resonant (both signal and idlerresonate) or pump resonant, where in addition the pump resonates as well. The morefields resonate, the lower is the threshold power, at the cost of more complication in thecontrol of the cavity. In view of precise spectroscopic applications, the OPO emissionlinewidth is a major issue [59-61]. Restraining our attention to a singly resonant OPO,similarly to the Schawlow-Townes expression for the laser linewidth, the fundamentallinewidth of the resonant frequency, say the signal, is Δωs = κ2
s�ωs/Pin [62], indepen-dently of the pump linewidth, where κs is the cavity decay rate and Pin is the signalpower leaking from the cavity. The corresponding nonresonating idler fully replicates thepump linewidth, which adds to the signal linewidth, as
Δωi = Δωp + Δωs.(6)
For the sake of simplicity, hereafter we identify the idler (signal) as the nonresonant(resonant) parametric field. Whilst, more generally, the idler field replicates the spectralfeature of the pump, multimode emission included, the resonating wave is not affected
FRONTIERS OF MOLECULAR GAS SENSING 143
Fig. 3. – Frequency-noise spectral density for the DDS-based DFG source. Three spectra withdifferent frequency spans (2 kHz, 10 kHz, 1 MHz) are stuck together and plotted in the samegraph (RBW = 3 · 10−3 × span). Reproduced from ref. [31] with permission from the OpticalSociety of America.
by the pump, thus releasing the requirements on the pump spectrum if one is interestedin using the resonant mode emission transmitted through a cavity mirror. As a matterof fact, technical noise usually dominates the spectral fluctuations of the resonant modeand active stabilization to a reference frequency is needed to reduce them. According toeq. (6), to frequency stabilize the idler one needs to separately stabilize the pump laserand the signal frequency, typically controlling the OPO cavity length. Alternatively, theidler can be compared to a frequency reference, possibly through an auxiliary nonlin-ear frequency conversion [63-65]. Singly resonant OPOs have been frequency stabilizedwith respect to Fabry-Perot cavities, [66-68], or to sub-Doppler atomic and molecularabsorptions, with frequency stability of the order of 1 MHz over 1 s [69, 70]. Besides,visible and NIR frequency comb synthesizers have been used as frequency references,providing OPOs with high-precision and absolute frequency determination outside of the

144 P. MADDALONI, S. BARTALINI, P. CANCIO, M. DE ROSA, D. MAZZOTTI and P. DE NATALE
specific OFCS covered range [70-74]. Here we review some recent results obtained witha singly resonant OPO emitting in the MIR range between 2.7 and 4.2μm [74,75]. In afirst layout, the OPO signal has been frequency stabilized with respect to a stable refer-ence cavity, in order to narrow the final idler linewidth [75]. In a second configuration,the OPO pump and signal have been simultaneously locked to an absolutely referencedoptical frequency comb, in order to improve the long term stability and achieve abso-lute calibration of the frequency scale [74]. Eventually, this configuration has been usedfor sub-Doppler spectroscopy of ro-vibrational transitions of CH3I vapor. Finally, theidler frequency has been stabilized against a Fabry-Perot cavity by controlling eitherthe pump frequency or the OPO cavity length [65]. The OPO is based on a 50 mmlong multigrating sample of periodically-poled 5%-MgO-doped congruent lithium nio-bate, placed in a four-mirror bow-tie ring cavity. The crystal has seven gratings withpoling periods from 28.5 to 31.5μm and anti-reflection coated facets. The cavity has twocurved (ROC = 100 mm) and two plane mirrors, for an effective length of 695 mm, cor-responding to a longitudinal mode spacing of 430 MHz. All mirrors exhibit a reflectivityhigher than 99.9% for the signal wavelength between 1410 and 1800 nm, whereas, curvedmirrors have high-transmission coating for pump and idler wavelengths. The crystal istemperature-stabilized within 0.1 ◦C and placed between the two curved mirrors, in thesmallest cavity waist. An uncoated YAG etalon, 400μm thick, is placed between the twoflat mirrors, in order to reduce mode-hops. Initially, a narrow-linewidth (40 kHz at 1 ms)CW Yb-doped fibre laser was used as pump source, delivering up to 10 W at 1064 nmafter amplification though a Yb-doped fibre amplifier. It was then replaced with a nar-rower Nd:YAG laser (1 kHz at 100 ms) followed by the same amplification stage. Boththe laser were finely tunable over a few GHz. The OPO can be continuously tuned overthe whole range (between 2.7 and 4.2μm) by changing both the crystal grating and tem-perature, emitting about 1 W of MIR power with 10 W of pump power, with a thresholdlower than 3 W.
2.2.1. Signal frequency stabilization. In a first experiment the signal frequency waslocked to a high-finesse (� 4000) reference cavity, made by two curved mirrors glued onan invar spacer. The mirrors reflectivity spanned the same range of the OPO mirrors.The spacer was suspended in a vacuum chamber for seismic and acoustic isolation. Thechamber temperature was actively stabilized (< 0.1 ◦C), thus reducing cavity lengthdrifts. One of the cavity mirrors was mounted on a piezo actuator for cavity lengthadjustments. The signal frequency was stabilized against a resonance of the referencecavity by means of the Pound-Drever-Hall (PDH) locking scheme [76]. Figure 4 shows thepower spectral density (PSD) of both the error and the correction signals, acquired by anoscilloscope and Fourier transformed by an on-board FFT routine. The correction signalspectrum, within the servo bandwidth, represents the frequency noise of the free-runningOPO, while the in-loop residual frequency noise is provided by the error signal PSD.At low frequencies (∼ 100 Hz), noise was reduced at the detection limit, set by the off-resonance PDH spectral noise, while the structures due to mechanical resonances of theOPO cavity were visible up to 2 kHz. The servo-loop bandwidth was technically limitedto 4 kHz by the presence of piezo resonances. The full linewidth was calculated from thein-loop PSD [77,78] as ∼ 70 kHz at 1 ms. This linewidth, combined with the uncorrelatedlaser linewidth of 40 kHz, led to an idler linewidth, eq. (6), of about 110 kHz. As a matterof fact, the long-term stability of the signal frequency was limited by uncontrolled residualdrifts of the reference cavity, which prevented from maintaining a high spectral resolutionduring frequency scans across spectral lines. As a consequence, the in-loop PSD only set

FRONTIERS OF MOLECULAR GAS SENSING 145
Fig. 4. – Frequency stabilization of signal emission to the reference cavity. (a) PSD of thecorrection signal fed to the OPO piezo, corresponding to the free-running signal noise; (b) PSDof the PDH signal, corresponding to the in-loop residual frequency noise; (c) PSD of off-resonancePDH signal detection limit. Reproduced from ref. [75] with permission from Taylor & FrancisGroup.
a lower limit to the signal frequency noise, at least on a time scale longer than few ms,while for shorter times it could be reasonably assumed to be the actual frequency noiseof the signal. It is worth remarking that the free-running long-term laser stability wasmore than one order of magnitude better than the locked signal.
2.2.2. OFC-referenced OPO. To improve the OPO long-term frequency stability, asecond scheme was implemented by locking both the signal and pump frequency to aself-referenced OFCS based on an mode-locked Er:doped fibre laser and a nonlinearphotonic crystal fibre [74] (see fig. 5).
Here, the OFCS generates an octave-spanning frequency comb, between 1–2 μm, withmodes spaced by the repetition rate fr = 250 MHz. An f -2f interferometer allowscontinuous monitoring of the carrier-envelope offset frequency fCEO. Then, the frequencyof each comb mode N can be written as νN = Nνr + ν0. Repetition rate and offsetfrequency are stabilized against a 10 MHz BVA quartz, locked to a Rb-clock, referencedto the Cs primary standard via the global positioning system, thus supplying an absolutescale for frequency measurement. A small part of the laser beam is passed through a fibre-coupled electro-optic modulator (EOM) which adds a pair of sidebands at frequencies±νEOM with respect to the laser carrier frequency νp. Phase-locking is achieved byseparately combining few milliwatts of the modulated pump and signal light leakingfrom the OPO cavity with the respective portions of the dispersed comb radiation. Theresulting beat note νb1 between a pump sideband and its nearest comb tooth is detectedby a PIN-InGaAs fast photodiode and mixed with a local oscillator at frequency νLO1 =

146 P. MADDALONI, S. BARTALINI, P. CANCIO, M. DE ROSA, D. MAZZOTTI and P. DE NATALE
Fig. 5. – Upper frame: Simplified scheme of the OPO phase-locking to the OFCS. Lower frame(reproduced from ref. [74] with permission from the Optical Society of America): Allan deviationof the three relevant contributions to the idler frequency (see eq. (7)).
12 MHz; the down-converted intermediate-frequency (IF) output signal is eventually sentto an electronic servo feeding correction to the laser piezo actuator. A similar procedureis adopted for the signal field, whose beat note νb2 is demodulated at νLO2 = 12 MHz andsent to the OPO piezo actuator through a second servo loop controlling the OPO cavitylength. Thus, while the OPO is pumped at νp, one of the laser sidebands, say νp−νEOM,is phase-locked to a comb tooth. In this way, by changing the EOM frequency νEOM, theidler frequency can be scanned over ∼ 100 MHz, while keeping the pump phase-locked tothe OFCS. Pump and signal frequencies can be written as νp = νCEO+Npνr +νb1+νEOM
and νs = νCEO + Nsνr + νb2, respectively. The idler frequency is thus given as
νi = νp − νs = (Np − Ns)νr + νb1 − νb2 + νEOM,(7)

FRONTIERS OF MOLECULAR GAS SENSING 147
Fig. 6. – Upper frame: Diagram of the implementation of the transfer oscillator scheme. Lowerframe: Power spectral density of the signal frequency noise.
where the integer numbers Np and Ns can be retrieved, under active frequency lockingby measuring pump and signal wavelengths. It is worthwhile noting that the knowledgeof the offset frequency is not needed for absolute determination of the idler frequency,therefore it is not necessary to stabilize it. Figure 5 (lower frame) shows the Allanvariance for the frequencies νb1, νb2, and (Np −Ns) νr which concur to establish the finalstability of the idler frequency to be < 3 × 10⁻¹² τ−1/2, for τ between 1 and 200 s.
Also in the OPO case, as shown in fig. 6 (upper frame), a leap forward in the narrowingof the idler linewidth was achieved with the adoption of the same DDS locking scheme [79]previously described for the DFG source. Figure 6 (lower frame) shows the out-of-loopfrequency noise spectrum of the signal when compared to the same invar-spaced reference

148 P. MADDALONI, S. BARTALINI, P. CANCIO, M. DE ROSA, D. MAZZOTTI and P. DE NATALE
Fig. 7. – (a) Frequency noise PSD of: (A) the free-running OPO; (B) in-loop frequency noisePSD for the idler mode in the PF stabilization scheme; (C) in-loop frequency noise PSD forthe idler mode in the OF stabilization scheme. (b) Idler line shapes of the frequency stabilizedOPO calculated on a 100 ms time scale: PF scheme (0.92 kHz linewidth), OF scheme (4.6 kHzlinewidth). Reproduced from ref. [65] with permission from the Optical Society of America.
Fabry-Perot cavity described above. The invar cavity is loosely locked (10 Hz bandwidth)to the signal frequency by a PDH scheme. Thus, for spectral frequencies greater than thelocking bandwidth, the PSD of the PDH signal gives the free-running relative frequencynoise between the signal and the invar cavity. For times shorter than 1 ms, the integratedPSD gives a linewidth below 1 kHz, which added to the linewidth of the pump (herestabilized against the resonance of an ultralow-expansion reference cavity), around 1 Hz,results in a sub-kHz idler linewidth.
Finally, the idler frequency of the singly resonant OPO has been stabilized by directcomparison of the idler output with the resonance of a MIR Fabry-Perot reference cavity,according to the PDH locking technique. Here, the reference cavity has two, 99.7%reflectivity, 1 m ROC concave mirrors mounted on a 380 mm long stainless-steel spacerinside a vacuum cell. The high-reflectivity coating of the mirrors covers the range 3–3.5 μm and results in a cavity linewidth (full width at half maximum, FWHM) of 395 kHz(finesse, ∼ 1000). The PDH signal is fed to an electronic servo which acts either on thepump frequency (pump-fed locking scheme, PF) or on the OPO cavity PZT (OPO-fedlocking scheme, OF) in order to minimize the relative frequency noise. Figure 7 shows thefrequency noise PSD of the free-running idler mode and the in-loop residual noise whenthe servo loop is closed on the laser, trace (a), or on the OPO cavity, trace (b), actuators.From each PSD, the corresponding idler line shape can be calculated [77], resulting inGaussian with linewidth of 4.6 kHz and 0.92 kHz for the OPO-fed and pump-fed lockingscheme, respectively, whereas the free-running linewidth is 2.7 MHz.
2.2.3. χ(2) Optical Frequency Combs. As discussed above, since their appearance, op-tical frequency combs have immediately emerged as a revolutionary tool for frequencymetrology and high precision spectroscopy. They were originally based on mode-lockedfemtosecond lasers and essentially limited to the visible-NIR. Materials with second-ordersusceptibility are currently used for indirectly replicate or extend an existing frequencycomb, otherwise generated, to different spectral regions, exploiting different χ(2) pro-cesses, like DFG [80-87], parametric generation in synchronously pumped OPOs [88-91],and harmonic up-conversion [92-94]. Recent experiments have shown that χ(2) effects

FRONTIERS OF MOLECULAR GAS SENSING 149
Fig. 8. – (a) Calibrated optical spectrum of the IR comb emission around the fundamentalpump frequency. The scale on the right represents the emitted power per mode. The unresolvedmode spacing is 1 FSR, confirmed by the beat notes around 493 MHz detected in the (b) IRand (c) visible region. Reproduced from ref. [96] with permission from the American PhysicalSociety.
create entirely new frequency combs starting from a single-frequency pump [95-97]. Inparticular, comb generation has been demonstrated in a nonlinear cavity that encloses aperiodically poled χ(2) crystal (LiNbO3 or LiTaO3) designed for QPM second-harmonicgeneration (SHG) [96, 97], pumped at 1064 nm. Combs around both the fundamen-tal and its second-harmonic appear within different regimes, depending on the SHGphase-matching wave vector Δk = k2 − 2k1 − Kc, where k1 and k2 are the pump andsecond-harmonic wave vectors, and Kc is the crystal periodic-grating wave vector. Whenthe crystal is quasi–phase–matched for the original SHG (Δk = 0), a widely spaced comb(∼ 300 GHz) appears; as the crystal temperature is increased, the phase-matching wavevector becomes finite (Δk > 0) and frequency combs emerge regularly spaced by the freespectral range (FSR) of the nonlinear cavity as testified by the intermodal beat notes,fig. 8. Comb formation in a SHG nonlinear cavity is triggered by an internally-pumpedOPO, which gives rise to a series of cascaded χ(2) processes mimicking an effective four-wave mixing dynamics, similarly to Kerr microresonators, with the advantage of anintrinsic higher efficiency and the simultaneous appearance of combs in different spec-tral regions. The dynamics of these new quadratic combs has been modelled both inthe frequency and time domains [96-98] and successively extended to doubly resonantcavity SHG or OPO, predicting a multi-octave comb emission of prominent interest formetrological and spectroscopic applications [99,100].
3. – Quantum cascade lasers
Parallel to the development of more and more refined laser sources based on para-metric down-conversion, the long-standing search for the equivalent (in terms of highperformance in a compact design as well as of engineerable gain media) of semiconductordiode lasers in the mid and far infrared range obtained equally successful results. In fact,in recent years, QCLs [101, 102] have emerged as the main sources of coherent light in

150 P. MADDALONI, S. BARTALINI, P. CANCIO, M. DE ROSA, D. MAZZOTTI and P. DE NATALE
the MIR (3–15 μm) and, with some constraints, also in the THz. While in a conventionalbipolar semiconductor laser, the emitted wavelength is mostly determined by the mate-rial bandgap (although some flexibility can be obtained by using either quantum wells orstrained layers), inter-subband transitions are indeed used in QCLs for radiation ampli-fication, as proposed in 1971 by Kazarinov and Suris [103] in a superlattice structure. Inthis respect, since the early ’70s, the birth and development of growth techniques withunprecedented control on layer thickness (down to a single atomic monolayer), such asmolecular beam epitaxy (MBE) [104], has enabled the design of new heterostructures byengineering of the semiconductor bandgap [105]. A direct consequence of the unipolar na-ture of QCLs is that, in contrast with conventional inter-band lasers, their gain linewidthdepends on the temperature only indirectly, and the optical gain is not limited by thejoint density of states. This leads to the lack of saturation of gain when electron and holequasi-Fermi levels are well within conduction and valence band. The gain is thereforeonly limited by the amount of current that can be driven in the structure to sustain thepopulation in the upper state. In addition, the multi-stage cascaded geometry allows forelectron recycling, so that each electron injected above threshold may generate a numberof photons equal to the number of stages. To date, the best QCL performances havebeen obtained by four semiconductor material combinations: GaInAs/AlInAs grown onInP substrates, GaAs/AlGaAs grown on GaAs substrates, AlSb/InAs grown on InAsand more recently III-V Sb-based heterostructures [106-108]. After almost two decadesfrom their invention, QCLs operating in the MIR have reached high performance levels.In pulsed mode, the maximum operating temperature exceeds room temperature in awide range of wavelengths (5–12 μm). Significantly, room-temperature CW single-modeoperation around 9μm has been demonstrated [109]. Multi-watt output power, CW,room-temperature devices operating across the MIR, with wall-plug efficiencies largerthan 50%, have been recently reported [110,111], with impressive performances in termsof spectral coverage (3–25 μm) and tunability range [112]. QCLs with new promisingmaterial systems have been recently demonstrated to work up to 400 K at wavelengthsbelonging to the first atmospheric window (3–5μm) [113].
In 2002, the spectral coverage of quantum cascade sources was extended to the FIRwindow [102], now better known as the THz region, which conventionally spans the fre-quency range from 0.1 to 10 THz, corresponding to the wavelength interval from 30 to3000 μm wavelength. At this time, three active-region types have successfully been usedin THz QCLs: chirped superlattice, bound-to-continuum, and resonant-phonon types.The chirped-superlattice design yields a large inter-miniband dipole matrix element forthe radiative transition, while depopulation occurrs via electron-electron scattering andresonant tunneling inside a wide miniband. In the bound-to-continuum scheme [114]the problem of the non-radiative scattering of the upper state into the miniband hasbeen solved by localizing the upper radiative state in the middle of a minigap, thusincreasing the diagonal nature of the radiative transition and slightly reducing the os-cillator strength. Finally, the advantage of exploiting the optical phonon emission forthe depopulation of the lower lasing level has been demonstrated in the resonant-phonondesign [115]. At present, GaAs/AlGaAs heterostructures grown by MBE have been themost successful choice for THz QCLs. This is mainly due to the lower conduction bandoffset values that assure accurate tailoring of the radiative transitions. More recently,InGaAs/AlGaAs//InP- and InGaAs/GaAsSb/InP-based QCLs with performances stillbelow the state-of-the-art have been developed [116,117]. In parallel, the critical problemof designing an optical waveguide suitable for very long wavelengths has been solved in-troducing two novel designs. In the first case, the mode is composed of surface plasmons

FRONTIERS OF MOLECULAR GAS SENSING 151
bound to the upper metallic contact and a thin n+ contact layer grown between theactive region and a semi-insulating GaAs substrate; optical confinement is then providedby the interplay between a metallic reflection at the top metallization and the quasi-metallic confinement provided by the thin, heavily doped buried contact. Although themode extends substantially into the substrate, the overlap with heavily doped regions issmall, so that the free-carrier loss is minimized. However, the mode confinement factorΓ is far below unity (Γ ≤ 0.5). In the second case, the surface-plasmon mode has beendesigned essentially as two-dimensional, when bound to a metal strip of a finite width.This leads to the possibility to obtain a complete optical confinement by simple deposi-tion of a metal strip having a width of the order of the wavelength, on the surface of thesemiconductor, without the need to define an etched ridge for lateral confinement (totallyburied two-dimensional surface-plasmon waveguide): the metal-like behaviour of a highlydoped buffer layer is used to almost completely confine radiation in the active layer. Thelatter approach produces strongly divergent beam profiles. Nevertheless, high power, lowdivergence, double-metal devices have been practically realized in the last years, by us-ing horn antennas [118,119], hyperhemispherical silicon lenses [120], 2nd-order [121-123]or 3rd-order distributed feedback gratings [124], plasmonic collimators [125] or novelresonator designs for vertical emission, employing circular geometries [126-128] or pho-tonic crystals [129]. More recently, a new approach to QCL-based THz generation hasbeen demonstrated: intracavity DFG in dual-wavelength mid-infrared QCLs. This idea,firstly proposed in 2007 [130], is based on the fabrication, in the same active region ofa MIR QCL, of two different sections emitting at two different wavelengths, and on theexploitation of the giant optical nonlinearity of the properly designed active region for adramatic enhancement of the DFG process. Starting from 2013 [131], this approach hasbeen extensively studied and developed, leading to interesting progresses in particularregarding the generation at room-temperature [132-135], albeit the generated THz poweris still in the range on tens of μW in CW operation. A second interesting feature of thiskind of sources is the wide tunability, more than 2 THz in the best case [135]. While stillsuffering from a strong technological delay compared to MIR QCLs, particularly in termsof operating temperature and output power, THz QCLs are rapidly progressing [136-140].
3.1. Intrinsic linewidth and broadening mechanisms. – Besides their unique spectralcoverage and high output power, a key of the spread of QCLs as versatile tools forboth scientific research and industrial applications is their inherent spectral purity, thatallows to boost the sensitivity and resolution of a variety of spectroscopic and imag-ing setups. This peculiarity was first suggested, for MIR QCLs, by the observation ofa small linewidth enhancement factor [141-143], that is responsible for an additionalbroadening with respect to the intrinsic linewidth set by the Schawlow-Townes (ST)formula [144]. More recently, a theoretical model [145] tailored on QCLs, predictedintrinsic linewidths values of a few hundred Hz. Experimental confirmations of this pre-diction were subsequently provided for a cryogenic mid-infrared QCL with a measuredlinewidth of ∼ 500 Hz [146], two cryogenic THz QCLs [147, 148] giving values of 90 Hzand 230 Hz, respectively, and, finally, for a room-temperature mid-infrared QCL witha retrieved value of 260 Hz [149]. Two different approaches can be used to measurethe QCL linewidth: one involves direct observation of the spectrum of the laser opticalfield, after having down-converted it to a radio-frequency via heterodyne beating witha second, more stable, laser [150]. The other is based on the conversion of frequencyfluctuations into amplitude fluctuations of the detected signal, that is further processedby a spectrum analyzer, yielding the laser frequency-noise power spectrum [151]. While

152 P. MADDALONI, S. BARTALINI, P. CANCIO, M. DE ROSA, D. MAZZOTTI and P. DE NATALE
in the first case direct information on the laser linewidth for specific time scales cannot be retrieved, the second one is more general, since it also contains information onthe spectral distribution of the laser’s frequency fluctuations. For this reason, the lat-ter approach has been extensively used to measure the intrinsic linewidth of MIR andTHz QCLs [146, 147] and to fully characterize their frequency noise [149, 152-155]. Thelinewidth of a QCL can be expressed [145] by a slightly modified version of the ST for-mula [156], including the linewidth enhancement factor (αe), which takes into accountthe refractive index variations with gain, caused by electron density fluctuations [157]
δν =14π
γ2 αm hω
2α Poutnsp (1 + α2
e),(8)
where γ = vg α is the cold cavity linewidth, α represents the total cavity losses, αm themirror losses, vg = c/neff the group velocity, c the speed of light in vacuum, neff theeffective refractive index, nsp the population inversion, Pout the output power, and ω theemission frequency. The above equation well predicts the experimental results obtainedfor MIR and THz QCLs, and explains, for example, why the intrinsic linewidth decreasesby increasing the emission wavelength or temperature. Moreover, it can be further refinedby including the contribution of thermal (black-body) radiation, that plays a key rolein the THz range [158, 159], to take into account the effect of thermal photons. Todate, many works have studied frequency-noise in MIR QCLs and its dependence onoperating conditions, opening new perspectives in the active-region design and fabricationprocesses. In particular, a flicker (1/f) contribution to the frequency noise has beensingled out [149,152,153,160]. The presence of this noise broadens the real-life linewidthof QCLs (the so-called free running linewidth) up to a few MHz, and even larger valuescan be measured if no precautions on the driving current noise are taken [154]. Indeed,a huge step forward in the quest for narrower-linewidth QCLs was represented by thedevelopment of ultra-low-noise current drivers able to deliver currents of more than 1 A(and compliance voltages up to 15 V) with current-noise densities lower than 1 nA/Hz1/2.
3.2. Locking techniques for metrological-grade QCLs. – The achievement of metrolog-ical-grade QCLs is based on the capability of counting and/or controlling their absolutefrequency, possibly with the effect of narrowing their emission linewidth. The first mea-surement of the absolute frequency of a QCL was reported only in 2007, by referencingto an OFCS [161]. The QCL radiation was, first, down-converted from the mid to theNIR by a sum-frequency generation with a Nd:YAG source in a PPLN crystal and, then,beaten with a diode laser at 858 nm. Being both the NIR lasers referenced to the OFCS,the frequency of the detected beat note allowed to retrieve the QCL absolute frequency.However, it was soon evident that a free-running QCL was not stable enough to fully ex-ploit the potential offered by the link to the OFCS: a narrowing of its emission spectrumturned out to be necessary. To actively stabilize the frequency of a QCL, the naturalparameter on which to act is the driving current, even if also the temperature can beused to a certain extent. All the works performed on this topic [152-155] have pointedout that, while the amplitude modulation response is really efficient over a GHz-rangebandwidth, the frequency modulation presents a typical cut-off for frequencies larger thata few hundred kHz. This behaviour is explained by the fact that the main mechanismresponsible for the QCL frequency tuning is of thermal origin, and thus inherently slow.This puts a intrinsic limitation to the bandwidth of an active loop on the QCL frequencyinvolving the driving current. Nevertheless, since most of the free-running noise of QCLs

FRONTIERS OF MOLECULAR GAS SENSING 153
falls in the low-frequency range, a 100 kHz bandwidth is usually more than enough for anefficient narrowing of their emission. In this respect, stabilization against a reference cav-ity [162] and phase-locking to a CO2 laser [163] have been the first achievements towardsthe active control of the frequency/phase of a MIR QCL. Subsequently, stabilization ofthe QCL frequency to a molecular transition was demonstrated in the MIR based onsub-Doppler nonlinear spectroscopy [164]. In particular, the sub-Doppler polarizationspectroscopy technique [165] proved to be very effective for the emission narrowing, sinceit provides a dispersive signal centred on the Lamb-Dip that does not require any externalmodulation, and thus with no a priori limitation on the maximum bandwidth exploitableby the locking-loop. This approach led not only to the referencing of the QCL to a stablemolecular reference, but also to a significant narrowing of its emission, down to the sub-kHz level [166]. In order to characterize the reproducibility of the lock point, with such aset-up, its absolute frequency was repeatedly measured against a DFG radiation linked toan OFCS. The resulting overall uncertainty resulted to be 25 kHz, mainly limited by thereproducibility of the polarization spectroscopy signal. Nevertheless, the improvement ofmore than 2 orders of magnitude, as compared to the 3–30 MHz error given for the sametransition by the HITRAN database [167], provides evidence of the successful applica-tion of QCLs to MIR frequency metrology. Further improvements were then obtained byexploiting an OFCS as a reference for the MIR QCL. A first work, in this direction, wasbased on direct optical injection, that proved to be well suited to transfer the metrologi-cal qualities of an OFCS to a QCL via an intermediate source [168]. Afterwards, efficientQCL locking to a OFCS-referenced DFG source was achieved (about 94% of the outputradiation was within the bandwidth of the injecting optical field), thus not only narrow-ing the QCL emission down to 20 kHz, but also allowing to tune its absolute frequencyby controlling the NIR DFG pumping sources. Then, the refinement of this techniqueled to a sub-kHz linewidth (more than a factor 20 better compared to a similar experi-ment [169]), tunable QCL with a fractional absolute traceability of 2 · 10−12 [170]; sucha source was used for sub-Doppler spectroscopy at 4.3 μm wavelength of several 12C16O2
molecular transitions, yielding uncertainties of about 1 kHz on the determination of theirabsolute frequency [171].
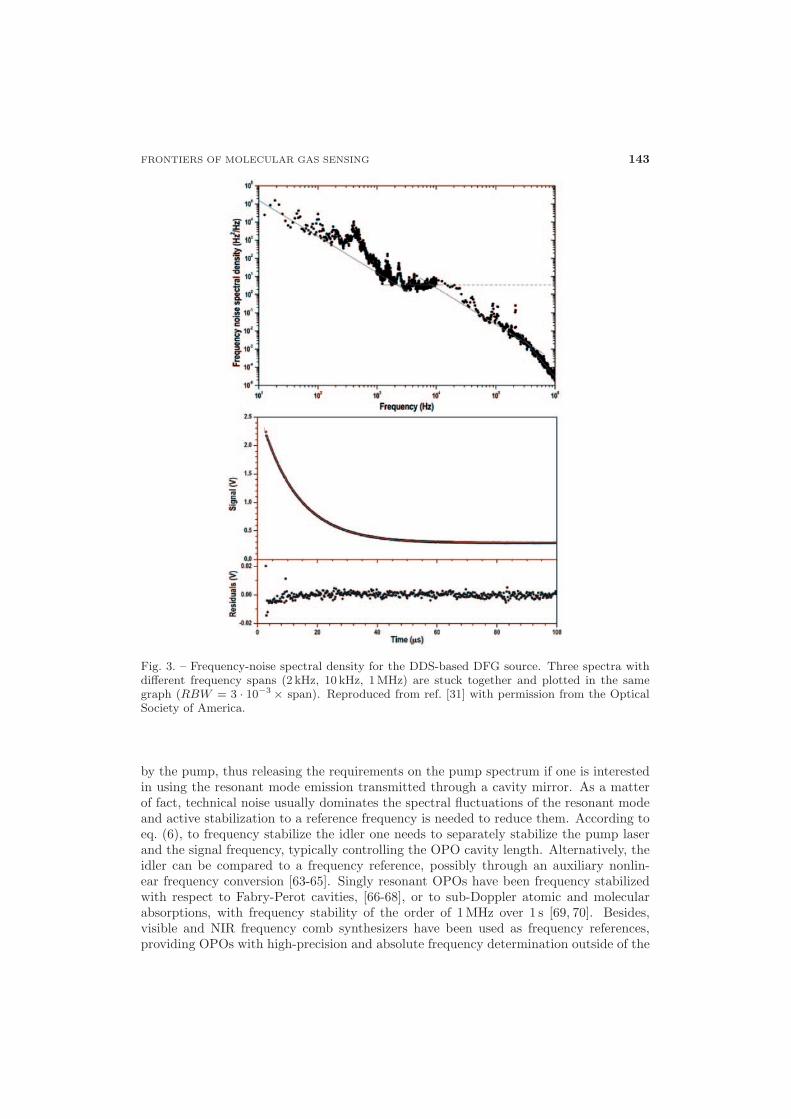
Among the innovative solutions aimed at answering the need for stable MIR referencesare CaF2 crystalline microresonators, which have recently shown excellent capabilitiesfor frequency stabilization with compact setups. In this respect, as shown in fig. 9, ourgroup has recently reported on the first apparatus for sub-Doppler spectroscopy basedon a 4.3 μm QCL locked to a high-Q CaF2 toroidal whispering-gallery mode resonator(WGMR) (3.6 mm diameter, FSR = 18.9 GHz at the operating wavelength) [172]. Elec-tronic locking narrows the laser linewidth by one order of magnitude and guarantees goodstability over long timescales, allowing, at the same time, an easy way for finely tuningthe laser frequency over the molecular absorption line. Indeed, laser fine tuning in lock-ing condition up to 1.5 GHz was obtained by acting only on the resonator temperature,without any other active correction on the laser current and temperature.
In THz QCLs, the longer wavelength is in part responsible for the lower emissionlinewidths, falling in the sub-MHz range, as measured by several independent experi-ments [52, 147, 148, 173, 174]. In 2005, phase-lock of a 3 THz QCL to the 3.1059368 THzline of a methanol gas laser was demonstrated [175] and, in 2009, frequency stabilizationof a single-mode THz QCL against the 2.409293 THz line of a CH2DOH gas laser was ob-tained [176]; in both cases, a narrowing of the beat signal was observed (65 kHz and 3 kHz,respectively). In the same year, the first phase-locks of THz QCLs to microwave-drivenharmonically generated THz sources were obtained at 1.5 THz [177] and at 2.7 THz [174].
154 P. MADDALONI, S. BARTALINI, P. CANCIO, M. DE ROSA, D. MAZZOTTI and P. DE NATALE
Fig. 9. – Schematic of the experimental setup used for electronic frequency stabilization. BS1,BS2: beam splitters. D1 and D2: InSb photodiodes; D3: HgCdTe photodiode; D4: PbSephotodiode. Reproduced from ref. [172] with permission from MDPI.
Shortly after, frequency locking of a THz QCL to a molecular reference was demonstratedin a first-derivative direct-absorption spectroscopy configuration, without any significantnarrowing of the QCL emission [178,179]. Phase-locking to an OFCS was achieved onlyrecently [180] by locking a 2.5 THz QCL to the n-th harmonic of the repetition rate ofa mode-locked erbium-doped fiber laser. By implementing a technique first reported byLoffler et al. [181], the comb generated by the mode-locked laser was mixed in a nonlinearcrystal with a CW THz QCL, thus generating THz sidebands around the NIR carrier; inthis configuration, the beating between the original comb and its shifted replicas providethe signal for closing the phase-locked loop. A similar scheme, but using a photocon-ductive antenna instead of an electro-optic detection, was presented one year later [182].Despite the clear advantage of a room temperature detection of the beat-note, the lat-ter approaches are based on low-efficiency up-conversion processes, and they inherentlyrequire a CW THz power in the mW range. This can be a limitation in some cases, forexample when high-temperature CW THz QCLs are used, having output powers typicallywell below 1 mW. One possible solution consists of moving to a THz detection, where thebeat-note can be acquired by a square-law THz detector with high efficiency, thereforeinvolving only a small fraction of the overall emitted QCL power. In this case, a real air-propagating THz comb is of course needed. Although the intrinsic comb nature of pulsedTHz sources used in time domain spectroscopy has been recently demonstrated [183,184],no direct use of such sources as frequency rulers for a THz QCL has ever been reportedfor a long time. A further strong motivation for the generation of a real THz frequencycomb is its possible use as a direct source for sensing, imaging or hyper-spectral imaging.Of course, in order to achieve this goal, the generation of THz combs with a sufficientpower for each tooth, to permit phase-locking of other coherent sources, is mandatory.Our group has succeeded in this, by demonstrating the phase locking of a single-frequencyCW QCL emitting at 2.5 THz against a single tooth of an air-propagating THz comb [52].The combination of an OFCS able to cover a broad spectrum (up to 56 THz) with QCL

FRONTIERS OF MOLECULAR GAS SENSING 155
sources that can cover, point by point, most of the same range with unprecedented powerlevels is a very promising perspective for a metrological-grade investigation of the THzregion. Among the many possible applications, it is worth mentioning the developmentof comb-assisted THz sub-Doppler spectrometers and of absolutely-referenced local os-cillators for heterodyne THz spectrometers. Concerning the latter topic, in particular,not only the narrow linewidth of the local oscillator but also, and above all, the stabil-ity over long time periods of its absolute frequency can represent a real breakthrough.Moreover, the development of new high-bandwidth, low-NEP THz detectors, such asnanowire [185, 186] and graphene [187] field-effect transistors, can make, in the future,room-temperature detection of the beat-note signal possible.
4. – Precision spectroscopic techniques for molecular detection
In this section, we shall discuss some emblematic experiments performed in the scopeof high-resolution and high-sensitivity molecular spectroscopy by using the laser sourcesdescribed till now. It will soon be clear to the reader, however, that the distinction be-tween these two categories is only a matter of convenience and, in fact, a number of spec-troscopic interrogation methods inherently possess the potential for both high-resolutionand high-sensitivity detection. Therefore, rather, we shall talk about precision spec-troscopy techniques meaning all those spectroscopic approaches that are able to combinethe ultimate performance in terms of sensitivity, resolution, and (absolute) frequency ac-curacy. While presenting complexities and challenges for experimental control, the extradegrees of freedom (vibrations and rotations) available in molecules offer unique oppor-tunities for the exploration and exploitation of new physical phenomena, in analogy withwhat has been done with atoms and that has culminated, inter alia, in the present opticallattice clocks. As discussed below, to bridge the gap with precision atomic spectroscopy,accumulated by the long absence of high-performance sources and detectors, a numberof effective high-resolution and -sensitivity techniques has been developed.
4.1. High-resolution spectroscopy with OPOs. – In the last years several CW OPOshave been developed, demonstrating their reliability as sources for trace gas detec-tion, high-resolution spectroscopy and absolute frequency stabilization [74, 75, 188-206].They are mostly addressed to generate coherent radiation in the mid-infrared spec-tral region between 2 and 5μm, typically pumped at ∼ 1 μm (Nd:YAG, Yb-dopedfiber, or distributed-Bragg-reflector semiconductor lasers) and based on periodicallypoled crystals in singly-resonant or pump-enhanced cavities. They have been combinedwith different detection schemes, by the use of photoacoustic cells [191, 193, 198, 207],cavity-enhanced techniques [190, 195, 201], wavelength modulation techniques [202], sat-uration techniques [74, 75, 189, 204], with record sensitivities down to part-per-trillionfor ethane (C2H6), methane (CH4), and carbon dioxide (CO2) [194, 197, 200]. In par-ticular, by cavity leak-out spectroscopy, a minimum detectable absorption coefficient of1.6×10−10 cm−1/
√Hz has been achieved for ethane, corresponding to a detection limit of
6 parts per trillion/√
Hz [194]. OPOs emitting in the NIR range have been used for sub-Doppler probing of atomic transitions as well [69, 199, 208-210]. Sub-Doppler resolutionhas been demonstrated also for ro-vibrational molecular transitions [70,74,189,204,211].Finally, MIR OPOs, combined with visible and NIR OFCSs, have proven reliable CWsources for high-resolution spectroscopy [70, 72]. In this frame, our group was able toremarkably resolve the hyperfine structure of CH3I transitions [74]. Ro-vibrational lev-els of CH3I are identified by the two rotational quantum numbers J and K, and are

156 P. MADDALONI, S. BARTALINI, P. CANCIO, M. DE ROSA, D. MAZZOTTI and P. DE NATALE
Fig. 10. – Left frame (reproduced from ref. [75] with permission from the Taylor & FrancisGroup): Doppler-broadened absorption profile of two transitions of the CH3I ν1 ro-vibrationalband, fitted by two Voigt lineshapes plus a parabolic background; in the inset, also plottedis the integrated absorbance of line P(19, 0) vs. the gas pressure, fitted by a linear function.Right frame (reproduced from ref. [74] with permission from the Optical Society of America):Sub-Doppler-resolved hyperfine structure of the ν1 P(18, 3) ro-vibrational transition of CH3I, at30 mTorr pressure and with 630 mW of saturating power; the solid line is the best-fit curve withsix Lorentzian derivatives.
splitted by electric quadrupole interaction of the iodine nucleus into hyperfine sub-levels, labelled by total angular moment F = J + I, with F = |J − I|, . . . , J + I,giving rise to transitions satisfying the selection rule ΔF = ΔJ [212]. Figure 10 (left)shows an example of a Doppler-broadened absorption of the P(19, 0) and P(19, 1) tran-sition lines, belonging to the ν1 band of CH3I. The absorption profiles have been fittedby Voigt lineshapes plus a parabolic background. A linear fit of the absorbance dataallowed to estimate the line intensities SP(19,0) = (2.74 ± 0.04) × 10−21 cm/mol andSP(19,1) = (2.76 ± 0.04) × 10−21 cm/mol. In a second stage, the OPO radiation wasused for sub-Doppler spectroscopy. For this purpose, the idler beam passed a first timethrough the gas cell, acting as the pump saturation beam; then, a small fraction of theimpinging beam was reflected back, probing the saturation absorption, and eventuallycollected by a thermoelectric-cooled HgCdTe photodetector. For small saturation dips, alock-in amplifier was also used to increase the sensitivity through first-derivative phase-sensitive detection. As an example, fig. 10 (right) shows a lock-in signal of the resolvedhyperfine structure of the saturated ν1 P(18, 3) ro-vibrational transition and its bestfit with a linear background plus six Lorentzian profile derivatives with equal widthsand amplitudes. The OFCS locking scheme allowed absolute measurement of the centerfrequency of the six components, with a multiplet centroid of 88 791 204.19 ± 0.05 MHz,where the 50 kHz uncertainty is given by the standard deviation of the fit results, in goodagreement with the value of 88 791 230 ± 120 MHz calculated on the basis of ref. [213].The relative positions of the six components are in good agreement with the predictedvalues, too.
4.2. High-resolution spectroscopy with QCLs. – As mentioned above, if properly con-trolled and narrowed, QCLs can be used for high-precision molecular spectroscopy. IfMIR QCLs address the strong ro-vibrational bands of several molecules, THz QCLs canbe employed to investigate pure rotational molecular transitions. In the following a brief
FRONTIERS OF MOLECULAR GAS SENSING 157
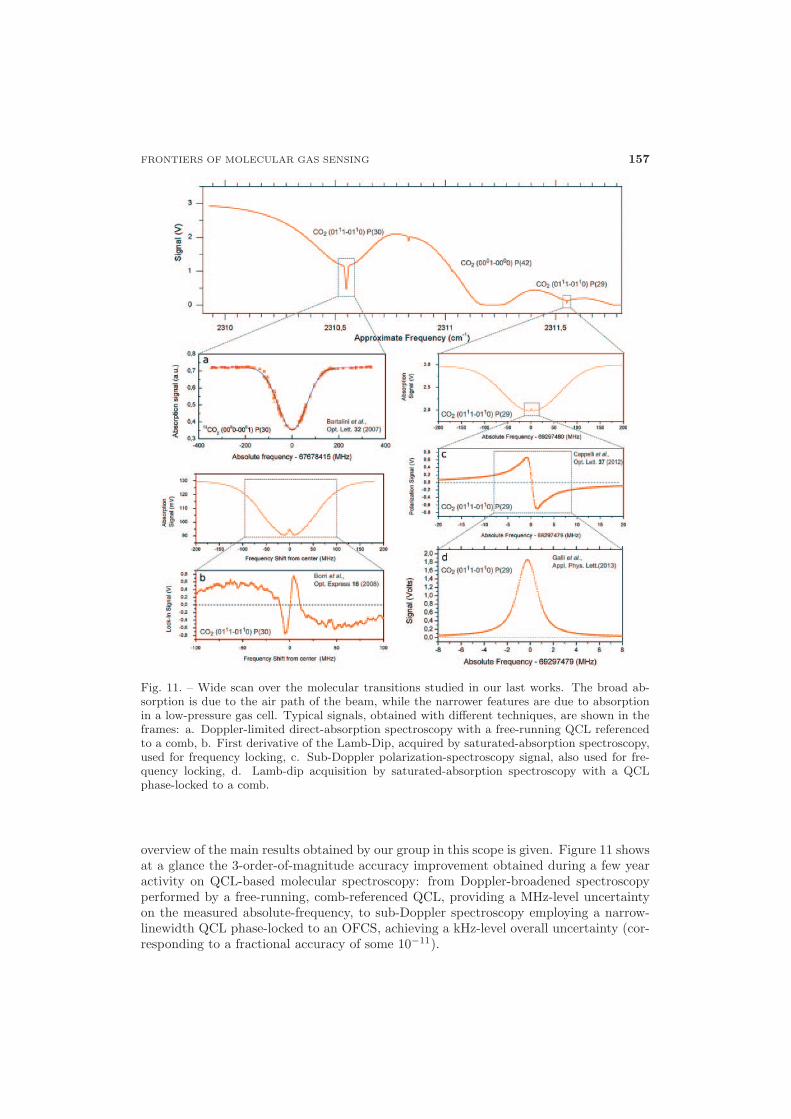
Fig. 11. – Wide scan over the molecular transitions studied in our last works. The broad ab-sorption is due to the air path of the beam, while the narrower features are due to absorptionin a low-pressure gas cell. Typical signals, obtained with different techniques, are shown in theframes: a. Doppler-limited direct-absorption spectroscopy with a free-running QCL referencedto a comb, b. First derivative of the Lamb-Dip, acquired by saturated-absorption spectroscopy,used for frequency locking, c. Sub-Doppler polarization-spectroscopy signal, also used for fre-quency locking, d. Lamb-dip acquisition by saturated-absorption spectroscopy with a QCLphase-locked to a comb.
overview of the main results obtained by our group in this scope is given. Figure 11 showsat a glance the 3-order-of-magnitude accuracy improvement obtained during a few yearactivity on QCL-based molecular spectroscopy: from Doppler-broadened spectroscopyperformed by a free-running, comb-referenced QCL, providing a MHz-level uncertaintyon the measured absolute-frequency, to sub-Doppler spectroscopy employing a narrow-linewidth QCL phase-locked to an OFCS, achieving a kHz-level overall uncertainty (cor-responding to a fractional accuracy of some 10−11).

158 P. MADDALONI, S. BARTALINI, P. CANCIO, M. DE ROSA, D. MAZZOTTI and P. DE NATALE
Fig. 12. – The diagram of the experimental setup describes how the traceability of the primaryCs frequency standard is transferred to the THz-QCL-based spectroscopy. The mechanism fortuning the QCL frequency (νQCL) is also sketched: the beat-note frequency (fb) is kept constantby the PLL, while the tuning of frep produces a proportional shift of the THz comb tooth, andthus of the QCL absolute frequency. Reproduced from ref. [214] with permission from theAmerican Physical Society.
A similar approach has been pursued with THz QCLs. To this aim, as shown infig. 12, a spectrometer based on a 2.5 THz QCL phase-locked to a THz frequency combwas developed [214]. The principle of the THz comb generation is the following: anoptical rectification, in Cherenkov configuration [215], of a femtosecond mode-lockedTi:sapphire laser occurs in a single-mode waveguide fabricated on a MgO-doped LNcrystal plate [216]. The generated radiation is a train of THz pulses, each consisting ofa single electric field cycle carrying a very large spectral content (from 100 GHz up to6 THz, centered at 1.6 THz). The femtosecond mode-locked Ti:sapphire laser is activelystabilized against a Rb-GPS-disciplined 10 MHz quartz oscillator (stability of 6 · 10−13
in 1 s and absolute accuracy of 2 · 10−12). In this way, the traceability of the Cs primaryfrequency standard is transferred to the Ti:sapphire repetition-rate (frep = 77.5 MHz);the measured frep Allan variance is about 4 mHz at 1 s and 1 mHz at 100 s, correspondingto a relative stability always better than 5 ·10−11. Given the generation mechanism, thatcan be interpreted as a DFG between teeth pairs of the pump laser, the created THzcomb has a zero offset. In other words, the frequency of each comb tooth is N timesthe frep, being N the order of the tooth. As a consequence, any common-mode (offset-type) instability of the fs-laser is not propagated to the teeth of the THz comb: the
FRONTIERS OF MOLECULAR GAS SENSING 159
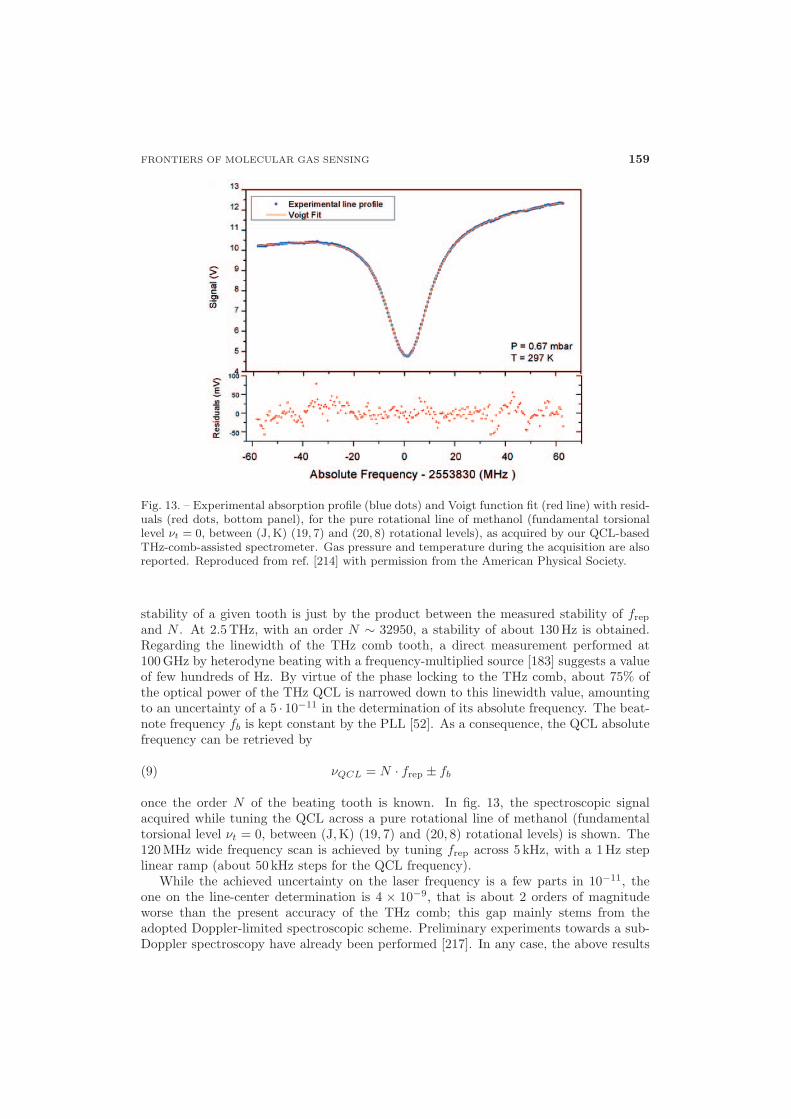
Fig. 13. – Experimental absorption profile (blue dots) and Voigt function fit (red line) with resid-uals (red dots, bottom panel), for the pure rotational line of methanol (fundamental torsionallevel νt = 0, between (J, K) (19, 7) and (20, 8) rotational levels), as acquired by our QCL-basedTHz-comb-assisted spectrometer. Gas pressure and temperature during the acquisition are alsoreported. Reproduced from ref. [214] with permission from the American Physical Society.
stability of a given tooth is just by the product between the measured stability of frep
and N . At 2.5 THz, with an order N ∼ 32950, a stability of about 130 Hz is obtained.Regarding the linewidth of the THz comb tooth, a direct measurement performed at100 GHz by heterodyne beating with a frequency-multiplied source [183] suggests a valueof few hundreds of Hz. By virtue of the phase locking to the THz comb, about 75% ofthe optical power of the THz QCL is narrowed down to this linewidth value, amountingto an uncertainty of a 5 · 10−11 in the determination of its absolute frequency. The beat-note frequency fb is kept constant by the PLL [52]. As a consequence, the QCL absolutefrequency can be retrieved by
νQCL = N · frep ± fb(9)
once the order N of the beating tooth is known. In fig. 13, the spectroscopic signalacquired while tuning the QCL across a pure rotational line of methanol (fundamentaltorsional level νt = 0, between (J,K) (19, 7) and (20, 8) rotational levels) is shown. The120 MHz wide frequency scan is achieved by tuning frep across 5 kHz, with a 1 Hz steplinear ramp (about 50 kHz steps for the QCL frequency).
While the achieved uncertainty on the laser frequency is a few parts in 10−11, theone on the line-center determination is 4 × 10⁻⁹, that is about 2 orders of magnitudeworse than the present accuracy of the THz comb; this gap mainly stems from theadopted Doppler-limited spectroscopic scheme. Preliminary experiments towards a sub-Doppler spectroscopy have already been performed [217]. In any case, the above results

160 P. MADDALONI, S. BARTALINI, P. CANCIO, M. DE ROSA, D. MAZZOTTI and P. DE NATALE
Fig. 14. – Comparison between the existing measurements of the absolute frequency on the samepure rotational line of methanol. Besides our result (red), two other results are available, basingon two different techniques: FTIR spectroscopy (grey) and microwave spectroscopy (blue).These numbers are also compared with the most recent prediction of a molecular model (green).In particular, the table summarizes the three consistent results zoomed on the right, evidencingthe tenfold improvement of the measurement uncertainty provided by our system. Reproducedfrom ref. [214] with permission from the American Physical Society.
mark a significant step forward towards high-resolution THz spectroscopy with absolutefrequency scale, ranking this technique among the most precise ever developed in theTHz range, as shown in fig. 14.
4.3. Pushing the sensitivity limits of molecular detection. – The most sensitive tech-niques developed so far for trace-gas detection are mainly based on measurements ofabsorbed electromagnetic radiation at MIR wavelengths, resonant with the strongestro-vibrational bands of many molecular species of atmospheric interest. Table I is acollection from the literature of the best-known detection sensitivity achieved for dif-ferent molecules at standard room temperature (except for ref. [218], at T = 170 K).All references cited in the table report experimental values for the minimum detectableabsorption coefficients per unitary detection bandwidth, αmin. Being the trace gas pres-sure very low, a Doppler-broadened lineshape gD must be considered for the absorbingtransition, which can be expressed as
gD(ν;T ) ≡√
ln 2π
1wD(T )
e− ln 2[
ν−ν0wD(T ) ]
2
,(10a)
wD(T ) =√
2 ln 2
√kT
mc2ν0,(10b)
where ν is the radiation frequency, ν0 the transition frequency, wD the Doppler FWHM,T the gas temperature and m its molecular mass. The absorption coefficient α can beexpressed as
α(ν; p, T ) = nsp
ps
Ts
TS(T )gD(ν;T ),(11a)
ns ≡ ps
kTs,(11b)

FRONTIERS OF MOLECULAR GAS SENSING 161
where ns is the Loschmidt density, ps is the standard pressure, Ts is the standard temper-ature. The value for the minimum detectable pressure of the absorbing gas per unitary de-tection bandwidth, pmin, can be retrieved from eq. (11) taking αmin = α(ν0; pmin(T ), T ),yielding
pmin(T )ps
=√
π
ln 2T
Ts
wD(T )αmin
S(T )ns.(12)
Observing table I, at least two common features stand out, joining almost all rows.The radiation wavelength fall within the MIR region, except for C2H2 [223]. Thetechnique always involves the use of an optical cavity, except for experiments combiningdirect-absorption spectroscopy with the use of multipass cells [224,229,230]. The reasonfor the former common feature has already been explained at the beginning of thissection, while the latter arises from the fact that the achievable sensitivity is proportionalto the effective pathlength of interaction between radiation and molecules. As a finalremark, working with MIR radiation is more difficult than in the visible/NIR region, dueto poor (and often expensive) availability of good coherent sources, optics and detectorsbut, as witnessed by table I, it is worth this additional effort for such a big reward.
Table I. – Sensitivity records for trace gas detection of molecules. Legend: SCAR, saturated-absorption cavity ring-down; CRDS, cavity ring-down spectroscopy; NICE-OHMS, noise-immune cavity-enhanced optical heterodyne molecular spectroscopy; DA, direct absorption, OA-ICOS, off-axis integrated-cavity-output spectroscopy; OF-CEAS, optical-feedback cavity-enhancedabsorption spectroscopy; QEPAS, quartz-enhanced photo-acoustic spectroscopy; S, line intensity(in HITRAN units [167, 219-221]); αmin, minimum detectable absorption coefficient per uni-tary detection bandwidth; pmin, minimum detectable pressure of the absorbing gas per unitarydetection bandwidth.
Molecule Technique λ S αmin pmin(T ) Ref.
(nm) (10−20 cm) (cm−1/√
Hz) (fbar/√
Hz)
CO2 SCAR 4527 300 7.6 × 10⁻¹¹ 3.4 [218]
N2O CRDS 4530 91 2.6 × 10⁻¹¹ 5.1 [222]
C2H2 NICE-OHMS 1532 1.2 4.0 × 10⁻¹³ 23 [223]
NO2 DA 6232 40 1.9 × 10⁻¹⁰ 60 [224]
OCS CRDS 4904 37 1.6 × 10⁻¹⁰ 61 [225]
H2O OA-ICOS 6734 5.1 2.4 × 10⁻¹¹ 84 [226]
H2CO OF-CEAS 5651 5.0 5.0 × 10⁻¹¹ 170 [227]
CO CRDS 4970 2.6 7.0 × 10⁻¹¹ 540 [228]
HF DA 2476 240 4.0 × 10⁻⁹ 540 [229]
NH3 DA 10338 56 2.5 × 10⁻⁹ 560 [230]
C2H6 OA-ICOS 3337 2.2 4.8 × 10⁻¹¹ 640 [231]
NO CRDS 5333 6.5 5.0 × 10⁻¹⁰ 1 400 [232]
CH4 OF-CEAS 7390 8.6 3.6 × 10⁻⁹ 7 600 [233]
SF6 QEPAS 10542 5.8 1.5 × 10⁻⁸ 11 000 [234]
C2H4 PAS 10532 3.0 1.5 × 10⁻⁸ 48 000 [235]

162 P. MADDALONI, S. BARTALINI, P. CANCIO, M. DE ROSA, D. MAZZOTTI and P. DE NATALE
4.3.1. Saturated-absorption cavity ring-down (SCAR): theory and experiments. Among allhigh-sensitivity spectroscopic techniques, cavity ring-down spectroscopy (CRDS) can beconsidered a good trade-off between experimental simplicity, on the one hand, and preciseand accurate measurement of very low absorption coefficients of sample molecular gases,on the other hand. The basic idea of this technique relies on a time domain measurementof the losses inside a high-finesse optical cavity. At a given threshold the light coupled tothe cavity is switched off very fast and the exponential cavity ring-down signal, due tolight leaking out of the cavity mirrors, is recorded by a photodetector. The absorptioncoefficient (and thus concentrations) of the sample gas can be retrieved from the followingequation:
α =1c
(1τ− 1
τ0
).(13)
Since its first proposal [236], the use of this technique has been evolving from pulsed-lasersources [237-241] to CW lasers, either with the phase-shift method [242-244] or with theconventional time-domain method [245-249]. As a main advantage, CRDS is not limitedby amplitude noise of the laser source, but only by detection shot noise. However, vari-ations of the empty-cavity decay rate always prevent from achieving this ultimate limitand from averaging measurements over long times. The empty-cavity background couldbe subtracted by quickly switching the radiation frequency between nearby longitudinalcavity modes. Nevertheless, this method cannot be effective, since decay times of differentcavity modes are affected by uncorrelated fluctuations. Other techniques can be used toovercome these limitations (e.g., cavity ring-down heterodyne spectroscopy [248,250,251]and NICE-OHMS [252, 253]). These techniques have proven to be more sensitive thanstandard CRDS, but they are more complex, too, and require fast and sensitive detec-tors, generally unavailable in the MIR. Until recently, experimentalists using CRDS fortheir measurements have been working in the linear absorption regime. Nevertheless,some exceptions, such as CRDS performed in a nonlinear absorption regime, must bementioned. In those cases, either optical saturation was considered as a disadvantageto be avoided [254, 255], or it was used only to get Lamb dips as frequency markersfor line centers, without a detailed treatment of intracavity saturation effects [256]. Insome CW CRDS experiments, nonlinear effects were observed and discussed in two spe-cific regimes. When the ring-down time is much shorter than the population relaxationtime, absorption losses keep constant at the saturated value existing at the cavity ring-down start time, and the decay will be simply exponential [257]. In the opposite regime(the so-called adiabatic approximation), the saturation level of the optical transitionsreaches the steady state at each point of the ring-down profile [258]. The cavity decaycurves no longer follow the simple exponential behaviour as in linear absorption regime,and a complex theoretical model is needed. Theoretical mean-field analyses on dynamicabsorption saturation in pulsed CRDS were performed a few years ago, either consideringinhomogeneous broadening [259] or not [260].
Only recently a novel technique named saturated-absorption cavity ring-down(SCAR) [12,21] has exploited the many spectroscopic benefits of nonlinear absorption ef-fects occurring in CRDS. SCAR gets rid of fluctuations in the ring-down decay rate, onlybecause of cavity losses. The basic idea is the exploitation of the decreasing saturationlevel of the absorbing gas during each SCAR event to identify and decouple any variationof the empty-cavity decay rate. The working principle is shown in fig. 15. During thefirst part of the SCAR decay empty-cavity losses are measured, since the high saturation

FRONTIERS OF MOLECULAR GAS SENSING 163
Fig. 15. – Working principle of the SCAR technique. Experimental data are plotted with blackdots and decay rates are highlighted for both the saturated-absorption (red line) and the linear-absorption (green line) regime.
level of the gas makes it transparent to radiation. As soon as the intra-cavity radiationintensity decreases and saturation level falls below 1, the gas becomes absorbing againand these additional losses can be measured. Indeed, this translates in an increased de-cay rate, as it appears from the slopes of the red and green lines in the semi-logarithmicscale of the plot. The SCAR working principle enables long-time averaging of spectraand a significant improvement of the S/N ratio and, hence, of sensitivity. Moreover, theuse of saturated-absorption spectroscopy allows recording of sub-Doppler line shapes.
The SCAR technique has made possible new experiments in molecular physics, bothfor high-resolution spectroscopy of isotopologues owning a hyperfine structure, such as17O12C16O [21], and for high-sensitivity measurements of very rare isotopologues, suchas 14C16O2, both well below its present natural abundance [23, 218, 261-265] and wellabove it [22,266].
4.3.2. SCAR1 setup: first technique demonstration. The first measurements performedby using SCAR spectroscopy demonstrated for the first time the effectiveness of thetechnique in decoupling and simultaneously retrieving the empty-cavity background andabsorption signal, by means of a simplified theoretical model that was developed andtested for the Doppler-broadening regime only [21]. The high sensitivity and frequencyprecision for spectroscopic applications were exploited to measure, for the first time, thehyperfine structure of an excited vibrational state of 17O12C16O at natural abundancewith an accuracy of a few parts in 1011. The SCAR1 optical setup shown in fig. 2 [31]was based on a DFG CW coherent source widely tunable in the MIR, with the NIRpump-signal lasers phase-locked to one another through a fs Ti:sapphire OFCS [84].
The 1 m long cavity was formed by two high-reflectivity mirrors with radius of cur-vature of 6 m and optical losses of 440 ppm around 2340 cm−1. With this setup severalspectroscopic measurements were performed to test both sensitivity and resolution usingthe newly developed model. Each spectrum was recorded by stepwise scanning the ab-

164 P. MADDALONI, S. BARTALINI, P. CANCIO, M. DE ROSA, D. MAZZOTTI and P. DE NATALE
Fig. 16. – SCAR1 measurements of 17O12C16O. Left: Doppler-limited spectrum; right: sub-Doppler spectrum. Reproduced from ref. [21] with permission from the American PhysicalSociety.
solute frequency of the NIR signal (and hence of the MIR idler). At each IR frequencythe cavity length was dithered at about 1 kHz rate across the resonance condition. Whena fixed threshold level was reached during each cavity buildup, the IR frequency wasrapidly switched off-resonance. Several CRDS events were detected by a liquid-N2-cooledInSb photodiode aligned with the cavity-transmitted light, acquired by a 18 bit digitiz-ing oscilloscope with a sampling rate of 10 MS/s, averaged by a LABVIEW acquisitionprogram and processed online by a FORTRAN fitting routine. The experimental resultsare shown in fig. 16, both in the Doppler-limited and sub-Doppler case. In the formercase, when comparing Gaussian fit residuals of γg (gas-induced decay rate) in the leftpanel of fig. 16 with the measured γc (empty-cavity decay rate), it is evident that theSCAR technique effectively makes the measured gas absorption almost unaffected by anyvariations of the empty-cavity decay rate. Indeed, the fluctuations of the former curveare about a factor of 20 lower than the latter one and only a slight residual correlation isobserved. This factor also quantifies the sensitivity improvement over standard CRDS,that can only measure an overall decay rate γ = γg + γc and is inevitably limited by anybackground fluctuation contained in γc. In the latter case, sub-Doppler measurementson low-pressure 17O12C16O at natural abundance were performed to test the resolutionachievable with SCAR. The right panel of fig. 16 shows the resolved hyperfine structureof the (0001–0000) R(0) transition of 17O12C16O, due to interaction between the 17Oelectric quadrupole and the electric field gradient at the nucleus position. This spectrumwas recorded in about 3 h with 11 forward-backward frequency scans in 20 kHz steps.The fitted FWHM of each Lorentzian feature (3 Lamb dips and 3 crossovers) was about220 kHz. The main contribution to the FWHM came from interaction time broadening,due both to the transit time of molecules through the beam (55 kHz) and to the meanlifetime of photons during a cavity ring-down event (21 kHz). The discrepancy with thelarger measured FWHM value was ascribed to power broadening effects, due to the highsaturation level during the SCAR decay process. Thanks both to the high accuracy ofthe OFC reference and to sub-Doppler resolution, the uncertainty of the line-center fre-quency was improved by more than 3 orders of magnitude with respect to the HITRANvalue, while the electric-quadrupole coupling constant in the excited vibrational statewas retrieved from data fitting with an uncertainty about 3 times better than a muchearlier direct microwave measurement in the ground vibrational state.

FRONTIERS OF MOLECULAR GAS SENSING 165
Fig. 17. – SCAR1 power-boosted setup. Reproduced from ref. [23] with permission from theAmerican Physical Society.
4.3.3. SCAR1 power-boosted setup: proof-of-principle optical detection of radiocarbon.First results achieved with the SCAR1 setup were followed up with a proof-of-principleexperiment aimed at first optical detection of radiocarbon well below natural abundance,by exploiting the same technique, in combination with an OFC-referenced power-boostedMIR coherent source [34], schematically shown in fig. 17. The (0001–0000) P(20) ro-vibrational transition of 14C16O2 around 4.5μm was targeted for SCAR spectroscopy.CO2 gas inside a high-finesse Fabry-Perot cavity absorbed resonant IR radiation, deliv-ered by a DFG process inside a Ti:Sapphire laser cavity. When the cavity was filled upto a threshold level, the IR light was quickly switched off-resonance and photons leakingout of the cavity were detected. Saturated absorption for intracavity light intensitiesmuch larger than the saturation intensity of the targeted molecular transition allowedto decouple the linear gas absorption rate from other cavity losses and to independently
Fig. 18. – SCAR1 measurements of 14C16O2. Left: Voigt spectra; right: sensitivity plot. Re-produced from ref. [23] with permission from the American Physical Society.

166 P. MADDALONI, S. BARTALINI, P. CANCIO, M. DE ROSA, D. MAZZOTTI and P. DE NATALE
Fig. 19. – Overview of the infrared spectrum of 14C16O2 molecule in the ν3 band region. P(40)-P(32) lines were recorded by SCAR spectroscopy, while P(30)-R(30) lines were recorded byCRDS. Reproduced from ref. [22] with permission from the Taylor & Francis Group.
measure them for each SCAR event. The higher power of the intra-cavity DFG source(up to 30 mW) used for the SCAR1 power-boosted setup allowed to saturate the targettransition even at a CO2 pressures of about 12 mbar, corresponding to an optimal Voigtregime with Doppler and pressure broadening contributing with near the same FWHMs.Cooling of the gas cell down to dry-ice temperature (195 K) was also necessary, in or-der to reduce the amplitude of a nearby interfering 13C16O2 line by about 3 orders ofmagnitude. The experimental results are shown in fig. 18. An ultimate sensitivity corre-sponding to 43 ppq (parts per quadrillion) minimum detectable concentration of 14C16O2
in a pure CO2 gas sample opened new scenarios for dating and other radiocarbon-basedapplications with a compact and relatively low-cost setup.
4.3.4. Accurate frequency measurements of 14C16O2 transitions. Aiming at a betterknowledge of the 14C16O2 molecular species, its infrared spectrum was thoroughly inves-tigated with the OFCS-referenced SCAR1 spectrometer in a wide spectral range (2190–2250 cm−1) [22]. Thanks to the availability of a highly 14C-enriched CO2 sample (about2200 times the natural abundance), measurements were performed by using both con-ventional CRDS and the SCAR technique. Thirty-three ro-vibrational transitions ofthe ν3 fundamental band were detected and their absolute frequencies were measuredwith a relative uncertainty ranging from 7.1 × 10⁻⁸ to 1.1 × 10⁻⁸. The experimentalfrequencies were fitted to the conventional Hamiltonian of a linear molecule and theset of spectroscopic parameters for the fundamental vibrational state of this extremelyrare isotopologue was significantly improved. In particular, the band origin ν0 and theground-state parameters B0 and D0 were determined with accuracy improved by aboutone order of magnitude. The experimental results are shown in fig. 19. The fit of allmeasured transitions to a Voigt profile, that takes into account also the background fromother CO2 lines, is also shown. The spectra are plotted in a relative horizontal frequencyscale, and frequency gaps between transitions are not shown for the sake of clarity. The

FRONTIERS OF MOLECULAR GAS SENSING 167
Fig. 20. – Detection linearity for enriched samples, over more than 3 orders of magnitude.Reproduced from ref. [266] with permission from the Cambridge University Press.
right-side vertical scale applies to cavity ring-down spectra and the left-side vertical scaleto SCAR spectra. An empty cavity loss rate of αc = 2.87×10⁻⁶ cm−1 was removed fromthe measured rates in the case of cavity ring-down spectra to get a comparable scalewith the SCAR ones. The CO2 pressure and temperature are 18 mbar and 296 K for theSCAR spectra, 12 mbar and 195 K for the CRD ones.
4.3.5. Extended linearity range and intercomparison with AMS. An important issue to bechecked for any measuring technique is its linearity range. In the case of SCAR, after thelinearity of the measured spectral area vs. radiocarbon concentration had already beendemonstrated in the range below natural abundance, a run of measurements was alsoperformed to test such linearity with highly enriched samples [266]. The experimentalresults are plotted in fig. 20. The CO2 sample had an initial radiocarbon enrichment ofabout 6400 modern fraction. The 8 spectra were recorded each time diluting the initialsample by a factor very close to 3 (the real value is shown in the linear fit, as a freeparameter). As can be seen by inspection of fig. 20, the spectral area (and hence themeasured radiocarbon concentration) is strictly proportional to the dilution factor (andhence to the real radiocarbon concentration).
Table II. – AMS-SCAR intercomparison.
AMS SCAR
pMC ppq (10−15) ms−1MHz ppq (10−15)
Modern CO2 106.68 ± 0.37 1253.3 ± 7.8 1.491 ± 0.026 1248 ± 22
Fossil CO2 0.26 ± 0.05 3.1 ± 0.6 −0.004 ± 0.036 −4 ± 30

168 P. MADDALONI, S. BARTALINI, P. CANCIO, M. DE ROSA, D. MAZZOTTI and P. DE NATALE
Fig. 21. – Schematic of the SCAR2 setup. Reproduced from ref. [218] with permission from theOptical Society of America.
Furthermore, 14C16O2 concentration measurements were performed for 2 particularCO2 gas samples: one from a high-purity industrial gas cylinder, and another one pro-duced by fermentation of brown cane sugar (purchased in year 2010) dissolved in water(in a bottle with no air content) with yeast. The former was equivalent to a 14C-deadsample, being the gas of fossil origin, while the latter one was a near modern 14C sam-ple. An intercomparison was performed between the SCAR and AMS techniques, bymeasuring both samples with both techniques and the achieved results are summarizedin table II. Radiocarbon content is expressed in percent modern carbon (pMC) unitsfor AMS measurements, while natural units for SCAR are ms−1 ·MHz, representing thespectral area of the 14C16O2 targeted line. We can observe a perfect agreement, withintheir respective uncertainties, between the radiocarbon concentration values measuredby the two techniques for both samples.
4.3.6. Refined theoretical model for SCAR spectroscopy. Retrieving the linear absorptioncoefficient of the sample gas from the non-exponential behaviour of the SCAR experi-mental decay curves is a challenging task. Early works on SCAR only reported somekey aspects of the overall procedure for analyzing experimental data, both in the in-homogeneous [21] and in the homogeneous broadening regimes [23]. Since a detailedand exhaustive theoretical analysis was needed to retrieve correct and reliable param-eters in different experimental situations, also a thorough theoretical treatment of theSCAR method was recently carried out [267], starting from ab initio calculations in theframework of the density matrix formalism, within the adiabatic approximation regime.A specific and detailed description was reported both for the homogeneous broadeningregime, which is the most relevant for trace gas sensing, and for the inhomogeneousbroadening regime.
4.3.7. SCAR2 setup: challenging AMS performance. Very recently, radiocarbon dioxideconcentration has been measured down to few ppq by using an improved SCAR2 setupwhich is more performing, despite being much simplified and less expensive [218,265]. Ascheme of that experimental setup is shown in fig. 21.
With respect to the previous SCAR1 system described in sects. 4.3.2 and 4.3.3, thenew setup relies on significant changes aimed, on the one hand, to improve the perfor-mance in terms of sensitivity, acquisition time and amount of carbon sample needed,

FRONTIERS OF MOLECULAR GAS SENSING 169
and, on the other hand, to drastically reduce costs, power consumption and size of thefinal instrument, thus envisaging a future portability. As for the ring-down cavity, it canbe cooled down to 170 K by means of a cryogen-free Stirling-acoustic cryocooler. Thecavity is housed inside a vacuum chamber and wrapped in a multilayer aluminized-mylarsuper-insulation coat, thus strongly suppressing any convective and radiative heat trans-fer. The colder temperature allows to further reduce the effects of interfering hot-bandlines from all other CO2 isotopologues, especially the (0551–0550) P(19)e transition of13C16O2 at 2209.1159 cm−1. Its volume has been reduced by about one order of magni-tude, consequently lowering the amount of sample gas which is needed for the measure-ment (corresponding to about 6 mg carbon content). Thanks to the improvement of themirrors reflectivity, with an unchanged 1 m cavity length, the effective interaction path isabout 40% longer than in SCAR1. A more efficient management of the acquisition pro-cess, enabled by the new lock chain between the lasers and the cavity, allows to achievean acquisition rate of about 2500 decays/s, more than double that of SCAR1. As for thelaser sources, SCAR2 employs two QCLs, both emitting in the range 2208–2212 cm−1,with output powers as large as 100 mW. QCL1 is used as probe laser for the SCARspectroscopy of the (0001–0000) P(20) transition of 14C16O2, thus replacing the bulkyintra-cavity DFG source. QCL2 is frequency-locked to the (0201–0200) R(16)e transitionof N2O at 2209.0854 cm−1. The first derivative of the absorption profile of this N2O lineis detected with the wavelength modulation spectroscopy technique, at a 5 mbar pressureand 12 cm absorption path-length. Hence, QCL2 plays a role which is analogous to theOFCS in SCAR1, providing a stable frequency reference around the targeted radiocarbondioxide transition. The new laser system employs a frequency stabilization chain withtwo locking loops for efficiently narrowing and controlling the QCL1 frequency. Firstly,QCL1 is frequency-locked to the high-finesse cavity by PDH technique. In this way,the QCL1 linewidth is made narrower than the cavity resonance width (which is about9 kHz), and its drift/jitter frequency fluctuations follow those of the cavity. Secondly, toachieve a long-term stability of the QCL1 frequency, the cavity length is controlled bylocking it to a stable reference, in particular the N2O-locked QCL1. Hence, thanks to thislocking chain, the cavity-narrowed QCL1 absolute frequency is traceable to a moleculartransition and can be scanned on demand across the 14C16O2 target line profile.
As for the signal detection and acquisition, the ring-down signal, detected by an InSbphotodiode, is digitized by a 18 bit, 10 MS/s analog-to-digital converter (ADC), and pro-cessed by a real-time fitting software. An acousto-optic modulator (AOM), triggered bythe ADC signal, is used to switch the light off at a given cavity filling threshold, thusstarting the cavity ring-down events. A LabVIEW program controls all the experimentalparameters and the acquisition routine, that has been optimized as the best trade-off be-tween speed and sensitivity. A single acquisition consists of three back-and-forth stepwisescans of the QCL1 frequency across the target transition. For each frequency step, 3350SCAR signals are acquired and averaged. A typical back-and-forth scan spans 600 MHz,with 61 points spaced by 10 MHz, and takes about 3.5 minutes. The acquired SCARdecays for each scanned frequency are analyzed with the effective saturation parameter,a procedure thoroughly described in ref. [267].
The left panel of fig. 22 shows the SCAR spectrum for a modern CO2 sample averagedover a single measurement run made of three scans. The whole acquisition time for thisspectrum is about 11 minutes. As expected at this temperature, the (0551-0550) P(19)etransition of 13C16O2 at 2209.1159 cm−1, which was the strongest interference absorptionin previous experiments, is almost totally suppressed. On the contrary, a weaker absorp-tion from the N2O molecule at almost the same frequency (i.e. the (0111–0110) Q(12)e

170 P. MADDALONI, S. BARTALINI, P. CANCIO, M. DE ROSA, D. MAZZOTTI and P. DE NATALE
Fig. 22. – SCAR2 spectrum measurements. Left: spectrum of the (0001–0000) P(20) transitionof 14C16O2 at 2209.1077 cm−1, recorded over a 11 minutes averaging time and fitted togetherwith the (0111–0110) Q(12)e interfering transition of 14N16
2 O at 2209.1144 cm−1. Right: averagespectral area measured over 10 runs. Reproduced from ref. [218] with permission from theOptical Society of America.
transition of 14N162 O at 2209.1144 cm−1) remains as the strongest interference within the
scanned frequency range. A comparable, or even better, S/N ratio for the detected spec-trum can be noted with respect to previous results, but in a much shorter acquisitiontime, thus highlighting the improved performance of the present SCAR2 apparatus forreal radiocarbon detection applications.
In SCAR, radiocarbon dioxide concentrations are determined by measuring the spec-tral area of the absorption coefficient from the target P(20) transition of this molecule.To this aim, we fitted the measured SCAR spectrum to the expected absorption profile,as shown in the left panel of fig. 22. The fitting function takes into account, in an ad-ditive way, all absorbing molecular transitions lying within the scanned range. At thepresent sample temperature and pressure, a Voigt line shape is expected for both theP(20) and Q(12)e transitions of 14C16O2 and 14N16
2 O, respectively. A good agreementbetween experiment and fit can be noted. The spectral area of the P(20) line is deter-mined with an uncertainty of about 3%, mainly limited by the S/N ratio and by theuncertainty in the spectral area of the interfering Q(12)e line. From this latter spectralarea, we can estimate that the sample N2O content was about 5 ppb, and we can con-clude that a sample with even lower N2O content is required to minimize any increase ofthe uncertainty budget for radiocarbon dioxide concentration measurements. It is worthnoticing that spectral area determinations with a lower uncertainty can be calculatedby using a global line profile fitting procedure to analyse the recorded SCAR decays,as described in ref. [267]. However, some molecular parameters, such as homogeneousand inhomogeneous linewidths and saturation parameter at resonance, that are set inthis fitting procedure as fixed constraints, must be well calibrated for both transitions,considering the specific apparatus and the actual sample thermodynamic conditions toproduce accurate results.
The repeatability and precision of the measured spectral areas were analysed andtheir contribution to the final uncertainty in the radiocarbon dioxide concentration wereassessed. Several 11 minutes long runs were recorded by resetting for each run theexperimental conditions, and by measuring the P(20) spectral area for each recordingfollowing the procedure described above. The result is shown in the right panel offig. 22 for ten runs. A repeatability comparable to the single-run uncertainty alloweda further precision improvement for the area determination, achieving a value of about

FRONTIERS OF MOLECULAR GAS SENSING 171
0.4% by weighted averaging of ten consecutive runs, acquired in about 2 hours. From theuncertainty quoted for the average area of the right panel of fig. 22, a precision of about5 ppq in 2 hours can be estimated for radiocarbon dioxide concentration determinationsby using the SCAR2 setup. The measured concentration also depends on the pressureand temperature of the sample gas, but their uncertainties, each amounting to less than0.1%, are negligible at this level of precision. Likewise, the uncertainty due to a possiblecalibration factor needed to get accurate values for the measured spectral area can bealso considered negligible, as was demonstrated for the SCAR1 apparatus. Otherwise,the estimated uncertainty for the line intensity at this temperature (0.5–1%) [268, 269]cannot be considered completely negligible and would require either an improvement ofthe theoretical estimations or a direct measurement on a reference standard sample (likefor AMS).
4.3.8. Perspectives of ultrahigh-sensitivity molecular detection. Most of the techniqueslisted in table I, including SCAR, relying on high-finesse optical cavities (all exceptDA and PAS) would benefit from a technological improvement in manufacturing high-refectivity dielectric mirrors for the MIR spectral region. To date, the technology boast-ing the best results in terms of reflectivity R is ion beam sputtering (IBS). The lowestmeasured losses of MIR IBS-coated mirrors are 1 − R = T + A ∼ 100 ppm [222, 270],being T the transmission and A the absorption+scattering loss of the coating. Novelground-breaking technologies are recently emerging, based on substrate-transferred crys-talline coatings with semiconductor materials (GaAs/AlxGa1−xAs multilayers) [271,272],promising to challenge very soon the performance of IBS. Further progress in designand manufacturing of non-cryogenic MIR detectors would enable a more reliable fielddeployment of many trace-gas detection techniques often confined within laboratorywalls. Finally, compact, current driven, narrow-linewidth, powerful and tunable MIRlaser sources, such as distributed feedback (DFB) QCLs or interband cascade lasers(ICLs) with still improved performances would contribute to push ultra-high detectionsensitivities already achieved to go even beyond the current state-of-the-art.
5. – Cooling stable molecules for pushing frequency measurement precision:spectroscopy of buffer-gas-cooled beams
From a spectroscopic point of view, the main motivation for producing cold molecularsamples is the dream to approach the natural linewidth of transitions as determined bythe lifetime of the excited state (Heisenberg’s uncertainty principle). In this respect, afterrealizing the probe laser sources with the best performance (in terms of both spectralpurity and stability as well as of absolute frequency calibration), and after bringing intoplay the most sophisticated interrogation techniques, one still has much work to do on thesample in order to overcome the last obstacle that is transit-time broadening, due to thefinite interaction time between the particle under investigation with the radiation field.In other words, to greatly enhance the spectroscopic interrogation time, one must usecold and slow molecular samples, prepared either in beams, or in fountains, or in traps [1].
Cold molecular beams, traditionally produced by supersonic jet expansion, have beenemployed since the early days of spectroscopy in order to suppress Doppler broadeningand concentrate the particles in the lowest vibration-rotation levels, thus greatly improv-ing the quality of the absorption spectrum [273-275]. A new impetus to this research fieldis coming from the recent technologies for generating and manipulating beams of cold sta-

172 P. MADDALONI, S. BARTALINI, P. CANCIO, M. DE ROSA, D. MAZZOTTI and P. DE NATALE
ble molecules, buffer-gas cooling (BGC) [276-279], Stark [280-282] and Zeeman [283-285]deceleration above all. Besides having already the strength to dramatically influence thestudy of new dynamics in low-energy collisions [286] and the accurate control of chemicalreactions [287, 288], these novel beam sources also serve as the starting point for fur-ther cooling and trapping stages. In this respect, opto-electrical cooling [289, 290], laserchilling [291, 292], and magneto-optical trapping [293, 294] represent the most promis-ing candidates to approach the quantum degeneracy regime for the exploration of newBose-Einstein condensation features or quantum computing issues [295]. In parallel,thanks to the tremendous progress recently experienced in the field of high-resolutionspectroscopy and absolute frequency metrology [1], equally disruptive searches, like thatof the electron’s EDM [3, 4], the time variation of fundamental constants [6, 9] or theparity violation in chiral molecules [296], can be pursued exploiting the new potential ofmolecular beams. Particularly, by virtue of its applicability to nearly all species and itsefficiency in producing very dense samples, the BGC method offers unique perspectivesfor low-temperature precision molecular spectroscopy. However, so far, only electronicmolecular transitions have been addressed on BGC beams, either by laser-induced fluores-cence (LIF) [276,297-299] or resonance-enhanced multi-photon ionization (REMPI) [300],whereas spectroscopy of the weaker but much narrower ro-vibrational transitions is stillrestricted to samples within the BGC cell [301].
Our group has recently filled this gap by demonstrating the applicability of a high-resolution and high-sensitivity detection technique, like CRDS, on a BGC molecularbeam. By virtue of its key role in different research areas [302], encompassing fundamen-tal quantum chemistry, atmospheric chemistry, astrophysics, as well as absolute frequencymetrology, acetylene was chosen as the test molecule. Specifically, the performance ofour scheme was evaluated for a 10 K C2H2 beam on the g → (ν1 +ν3) R(1) component at1.5 μm wavelength [303,304]; in particular, due to the frequency-comb-synthesizer refer-encing of the probe laser, an uncertainty as low as 330 kHz was achieved in the absolutedetermination of the line center. Being applicable nearly to all kinds of molecules ina variety of wavelength regions, this approach overcomes two major drawbacks of theREMPI technique, namely the applicability to a restricted class of molecular species andthe relatively low spectral resolution. Also, in contrast to LIF spectroscopy, typicallyconfined to ultraviolet or visible transitions, the access to vibrational spectra is gained.
In a preliminary experiment, intended to characterize the collisional cooling process,laser absorption spectroscopy was performed inside the BGC cell [305]. Subsequently,CW CRDS was demonstrated on the partially-hydrodynamic-regime beam emerging fromthe BGC source [306].
5.1. Laser absorption spectroscopy inside the BGC cell: characterizing the collisionalcooling process. – In a BGC source, a noble gas, typically helium, is cooled in a cryo-genic cell just above its boiling point and acts as a thermal bath (buffer) that, throughcollisions, brings in turn both the translational and rotational degrees of freedom of theinjected molecular gas to a few K. Then, a beam is formed by allowing both the He atomsand the molecules to escape into a high-vacuum environment via a small orifice in theside of the cell.
The heart of our BGC machine is represented by a two-stage pulse tube (PT) cry-ocooler (Cryomech, PT415) housed in a stainless-steel vacuum chamber and fed withliquid helium by a compressor. The first (second) PT stage yields a temperature of 45 K(4.2 K) provided that its heat load is kept below 40 W (1.5 W); to guarantee this, eachplate is enclosed in a gold-plated copper shield (equipped with optical accesses to allow

FRONTIERS OF MOLECULAR GAS SENSING 173
the laser beam propagation). Capillary filling, regulated upstream by two flow controllerswith an accuracy of 0.05 SCCM (1 SCCM = 4.5 · 1017 molec/s), is used to convey fromroom-temperature bottles both the acetylene and helium flux, fC2H2 and fHe, respec-tively, into the BGC cell. This latter consists of a copper cube of side length l = 3 cm, inthermal contact with the 4.2 K plate and with a circular exit hole (rh = 1 mm radius).To keep the pressure within the radiation shields below 10−7 mbar, as required for theformation of the molecular beam, the internal surface of the inner shield is covered with alayer of activated charcoal that, below 15 K, acts as a pump (with a speed of a few thou-sands dm3 · s−1) for helium and non-guided molecules (the gas adsorbed by the charcoalis released during warm up of the cryogenic system and then pumped out of the vessel bya turbo-molecular pump). Both the vacuum chamber, the shields and the buffer cell haveoptical accesses for spectroscopic interrogation. Here, the probe radiation source was anexternal-cavity (Littman-Metcalf configuration) diode laser emitting several milliwatts ofpower between 1520 and 1570 nm with a linewidth below 1 MHz (New Focus, TLB-6300Velocity). The molecular absorption profile, δ(ν) ≡ [I0 − I(ν)]/I0, was recovered byscanning the laser frequency ν through the application of a linear-ramp voltage to thepiezoelectric transducer attached to the external-cavity tuning element.
5.1.1. Translational temperature. As a first step, the absorption spectrum of the R(5)ro-vibrational transition in the (υ1+υ3) band (henceforth referred to as transition a) wasacquired under different experimental conditions, by varying the buffer-cell temperature,Tcell, and the two gas flows, fHe and fC2H2 . Since the translational temperature, Ttrans,in a gas is related to the mean square velocity of its molecules, each observed absorptionprofile was fitted by a Gaussian distribution
G(ν) = G0 exp[−4 ln 2 (ν − ν0)2
σ2D
],(14)
where the amplitude G0, the transition center frequency ν0, and the Doppler widthσD = (ν0/c)(8 ln 2 kBTtrans/m)1/2 represent the fitting parameters (here, m is the molec-ular mass, c the light speed, and kB the Boltzmann constant). Thus, the translationaltemperature of the acetylene sample was retrieved by the extracted σD value. As anexample, three absorption spectra are shown in fig. 23, corresponding to the followingTcell values: 294, 115 and 10 K; for Tcell = 294 K, only 1 SCCM of acetylene was let intothe cell and no helium; for Tcell = 115 K, fHe = 20 SCCM and fC2H2 = 5 SCCM wereused; for Tcell = 10 K, fHe = fC2H2 = 2 SCCM was found to be the optimal choice toreach the translationally coldest sample with our setup: Ttrans = 15±3 K. Supported bya temperature reading of 15 K recorded on the He pipe just before the entrance into thebuffer cell, the discrepancy at the lowest temperature was attributed to a non-perfectthermal exchange between the copper pipe and the two PT plates; to bridge this gap, animproved setup for better cooling of the He line is already under construction. It shouldbe noted that equal flows of the two gases do not correspond to equal densities in thebuffer cell. In fact, many of the acetylene molecules freeze upon impact on the walls (aswell as on the optical windows), hence generating a layer of solid acetylene whose thick-ness increases with time. This is not the case for the helium. Nonetheless, after a shorttransient (less than 10 ms in the worst case), stationary gas densities, nHe and nC2H2 ,namely gas pressures, will be established inside the buffer cell, leading to steady-statespectroscopic absorption profiles; these will eventually disappear as soon as the opticalwindows fog up.
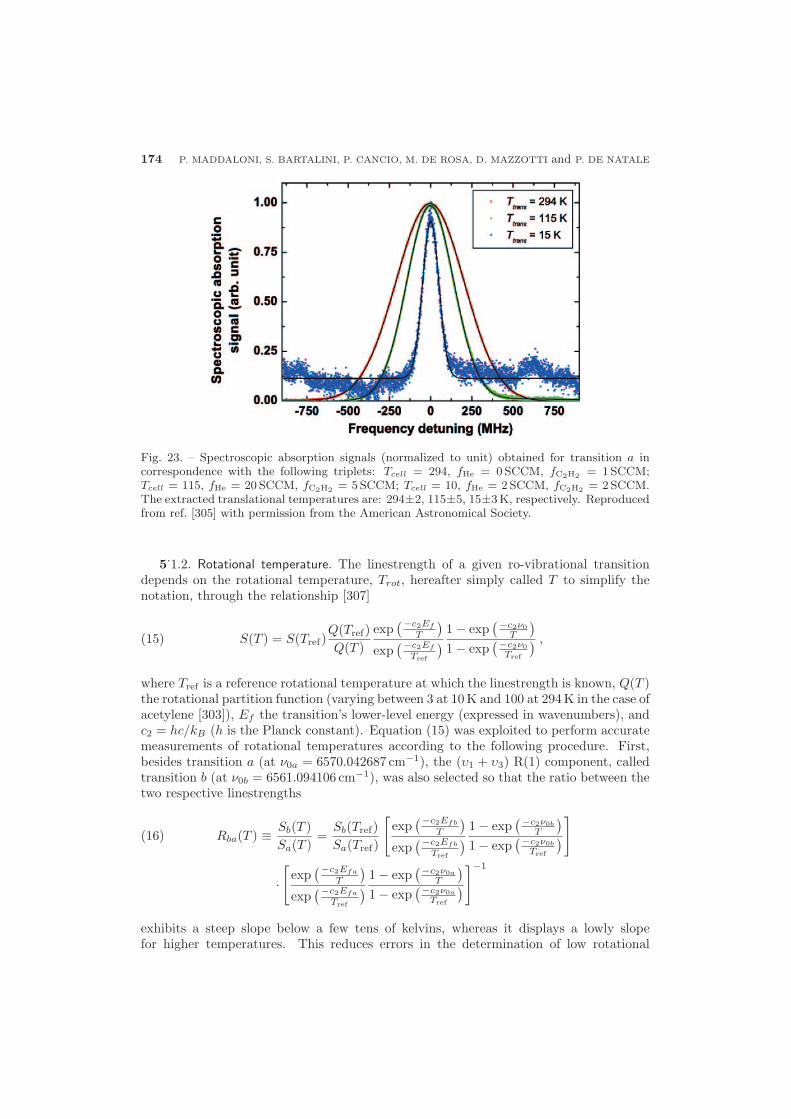
174 P. MADDALONI, S. BARTALINI, P. CANCIO, M. DE ROSA, D. MAZZOTTI and P. DE NATALE
Fig. 23. – Spectroscopic absorption signals (normalized to unit) obtained for transition a incorrespondence with the following triplets: Tcell = 294, fHe = 0 SCCM, fC2H2 = 1 SCCM;Tcell = 115, fHe = 20 SCCM, fC2H2 = 5 SCCM; Tcell = 10, fHe = 2 SCCM, fC2H2 = 2 SCCM.The extracted translational temperatures are: 294±2, 115±5, 15±3 K, respectively. Reproducedfrom ref. [305] with permission from the American Astronomical Society.
5.1.2. Rotational temperature. The linestrength of a given ro-vibrational transitiondepends on the rotational temperature, Trot, hereafter simply called T to simplify thenotation, through the relationship [307]
S(T ) = S(Tref)Q(Tref)Q(T )
exp(−c2Ef
T
)exp
(−c2Ef
Tref
) 1 − exp(−c2ν0
T
)1 − exp
(−c2ν0Tref
) ,(15)
where Tref is a reference rotational temperature at which the linestrength is known, Q(T )the rotational partition function (varying between 3 at 10 K and 100 at 294 K in the case ofacetylene [303]), Ef the transition’s lower-level energy (expressed in wavenumbers), andc2 = hc/kB (h is the Planck constant). Equation (15) was exploited to perform accuratemeasurements of rotational temperatures according to the following procedure. First,besides transition a (at ν0a = 6570.042687 cm−1), the (υ1 + υ3) R(1) component, calledtransition b (at ν0b = 6561.094106 cm−1), was also selected so that the ratio between thetwo respective linestrengths
Rba(T ) ≡ Sb(T )Sa(T )
=Sb(Tref)Sa(Tref)
[exp
(−c2Efb
T
)exp
(−c2Efb
Tref
) 1 − exp(−c2ν0b
T
)1 − exp
(−c2ν0b
Tref
)]
(16)
·[
exp(−c2Efa
T
)exp
(−c2Efa
Tref
) 1 − exp(−c2ν0a
T
)1 − exp
(−c2ν0a
Tref
)]−1
exhibits a steep slope below a few tens of kelvins, whereas it displays a lowly slopefor higher temperatures. This reduces errors in the determination of low rotational

FRONTIERS OF MOLECULAR GAS SENSING 175
Fig. 24. – Experimental rotational temperatures measured at different Ttrans values according tothe procedure described in the text. The line T = Ttrans is also plotted for reference. It shouldbe noted that each data point corresponds to a different choice of the two gas flows, essentiallyintended to maximize the signal-to-noise ratio of every absorption spectrum while reaching thelowest possible rotational temperature. Reproduced from ref. [305] with permission from theAmerican Astronomical Society.
temperatures. Second, for different Ttrans values, the experimental value of Rba(T ) =∫δb(ν) dν/
∫δa(ν) dν was determined. This value, along with the Ef ’s and ν0’s param-
eters provided by the Hitran database [167], was replaced in eq. (16) which was finallysolved for T (see fig. 24). In conclusion, the minimum observed rotational temperaturewas T = (20± 1) K for a measured translational temperature of Ttrans = (15± 3) K; sucha difference is compatible with the fact that cooling is more efficient for the translationaldegrees of freedom than for rotational ones, albeit the two measured temperature valuesare consistent within 2 standard deviations.
5.1.3. Cross section. Finally, by comparing the measured diffusion time (τdiff ) of12C2H2 in the BGC cell with that predicted by a Monte Carlo simulation, we provided anestimate for the elastic cross section relevant to the translational cooling mechanism [305].In particular, two sets of τdiff vs. nHe were recorded, corresponding to translationaltemperatures of 100 and 25 K, respectively. The results are shown in fig. 25. Theelastic cross sections were estimated to be σel(Ttrans = 100K) = (4 ± 1) · 10−20 m2 andσel(Ttrans = 25K) = (7 ± 2) · 10−20 m2.
5.2. CRDS on the cold molecular beam. – As a result of the BGC process followed bythe expansion through the cell orifice, an acetylene beam at temperature T is createdalong the z direction with a mean longitudinal speed governed by the Reynolds number,Rey. In our case, this can be expressed as [278]
Rey � 4 fHe σHe-He
ax
√π mHe
kB T,(17)
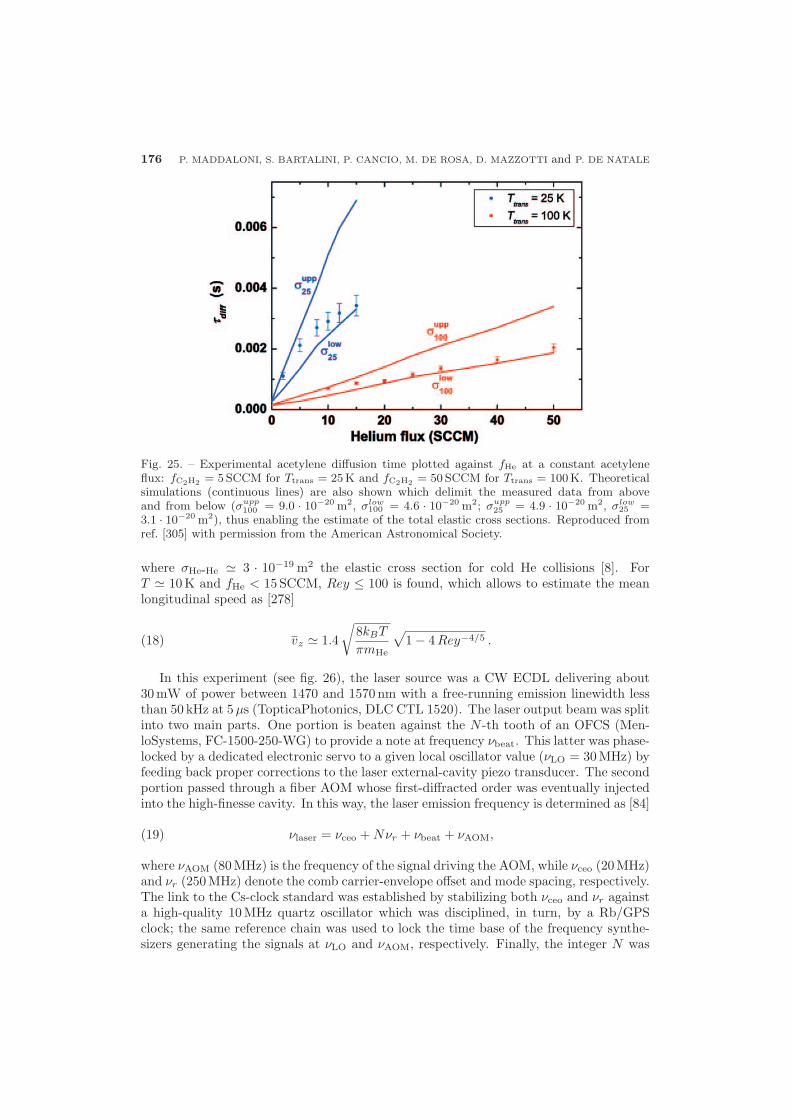
176 P. MADDALONI, S. BARTALINI, P. CANCIO, M. DE ROSA, D. MAZZOTTI and P. DE NATALE
Fig. 25. – Experimental acetylene diffusion time plotted against fHe at a constant acetyleneflux: fC2H2 = 5 SCCM for Ttrans = 25 K and fC2H2 = 50 SCCM for Ttrans = 100 K. Theoreticalsimulations (continuous lines) are also shown which delimit the measured data from aboveand from below (σupp
100 = 9.0 · 10−20 m2, σlow100 = 4.6 · 10−20 m2; σupp
25 = 4.9 · 10−20 m2, σlow25 =
3.1 · 10−20 m2), thus enabling the estimate of the total elastic cross sections. Reproduced fromref. [305] with permission from the American Astronomical Society.
where σHe-He � 3 · 10−19 m2 the elastic cross section for cold He collisions [8]. ForT � 10 K and fHe < 15 SCCM, Rey ≤ 100 is found, which allows to estimate the meanlongitudinal speed as [278]
vz � 1.4√
8kBT
πmHe
√1 − 4Rey−4/5 .(18)
In this experiment (see fig. 26), the laser source was a CW ECDL delivering about30 mW of power between 1470 and 1570 nm with a free-running emission linewidth lessthan 50 kHz at 5μs (TopticaPhotonics, DLC CTL 1520). The laser output beam was splitinto two main parts. One portion is beaten against the N -th tooth of an OFCS (Men-loSystems, FC-1500-250-WG) to provide a note at frequency νbeat. This latter was phase-locked by a dedicated electronic servo to a given local oscillator value (νLO = 30 MHz) byfeeding back proper corrections to the laser external-cavity piezo transducer. The secondportion passed through a fiber AOM whose first-diffracted order was eventually injectedinto the high-finesse cavity. In this way, the laser emission frequency is determined as [84]
νlaser = νceo + Nνr + νbeat + νAOM,(19)
where νAOM (80 MHz) is the frequency of the signal driving the AOM, while νceo (20 MHz)and νr (250 MHz) denote the comb carrier-envelope offset and mode spacing, respectively.The link to the Cs-clock standard was established by stabilizing both νceo and νr againsta high-quality 10 MHz quartz oscillator which was disciplined, in turn, by a Rb/GPSclock; the same reference chain was used to lock the time base of the frequency synthe-sizers generating the signals at νLO and νAOM, respectively. Finally, the integer N was

FRONTIERS OF MOLECULAR GAS SENSING 177
Fig. 26. – Layout of the experimental setup consisting of two main blocks: the buffer-gas-cooling source and the comb-referenced laser spectrometer. The following legend holds: HRM =high-reflectivity mirror, TD = threshold detector, PD = photodetector, BS = beam splitter.Reproduced from ref. [306] with permission from the Royal Society of Chemistry.
determined, through eq. (19), by measuring the laser frequency with a 0.2 ppm accu-racy wavelength meter. In this way, the absolute frequency of the laser radiation couldbe monitored by simultaneously counting the frequencies νceo, νr and νbeat in eq. (19).Then, tuning of νlaser across the molecular resonance was accomplished by varying νr indiscrete steps (at a given N). For each νlaser value, the acetylene absorption was recordedaccording to a CW CRDS scheme [308,309]. For this purpose, the laser beam was coupledto an enhancement optical resonator consisting of two facing high-reflectivity sphericalmirrors (3 m radius of curvature, 1 inch diameter) at a distance of D = 65 cm along thex-axis. Each mirror was held within the mount against a large-diameter o-ring, whichpermitted angular adjustment of the mirror while maintaining a gas seal; a brass backingring fitted onto the back surface of the mirror, providing a contact point for the ball tipsof the alignment screws. The resonator length was continuously dithered by an annularpiezoelectric actuator mounted on the input mirror. As a resonance built up, a thresholddetector switched the AOM off; the subsequent ring-down decay was detected by a tran-simpedence amplified InGaAs photodetector (5 MHz electrical bandwidth). The averageof 50 acquisitions, recorded by the oscilloscope, was then used to extract τ by means ofleast-squares fitting routine. In the presence of a molecular resonance, the absorptioncoefficient α(ν) was then recovered through the relation [310]
α(ν, z) =1c
[1
τ(ν)− 1
τe
]D
dx(z)≡ α′(ν)
D
dx(z),(20)
where dx(z) is the molecular beam diameter along the x axis (i.e. the laser propagationdirection) at the z-coordinate, c the speed of light, and τe � 10 μs the empty-cavity decayconstant corresponding to a finesse F = (π c τe)/D � 14000. The observed absorptionprofile, α′(ν), was then fitted by a Gaussian distribution to extract the temperatureof the molecular beam, T , as explained above. Figure 27 shows the CRDS absorptionsignal at a distance z1 = 1 cm from the BGC cell exit, obtained for fC2H2 = 5 SCCMand fHe = 10 SCCM. In these conditions, the temperature measured for the C2H2
beam was T = (13.2 ± 0.5) K, corresponding to Rey � 60 and hence to vz � 340 m/s.The center frequency of the (ν1 + ν3) R(1) ro-vibrational line was measured as ν0 =(196 696 652.0 ± 0.8) MHz. From this signal, the angular divergence of the molecularbeam could also be estimated as follows. The starting point is to simulate the trajectoriesof the molecules escaping from the BGC cell, in order to reconstruct the beam shape at

178 P. MADDALONI, S. BARTALINI, P. CANCIO, M. DE ROSA, D. MAZZOTTI and P. DE NATALE
Fig. 27. – CRDS signal measured on the acetylene beam for fC2H2 = 4 SCCM and fHe = 8 SCCMat a distance of z1 = 1 cm from the BGC cell exit. Here, the escape hole is circular witha diameter of 2 mm. Thanks to the enhanced signal-to-noise ratio (SNR � 250), the centerfrequency of the (ν1 + ν3) R(1) ro-vibrational line is now measured with a fractional accuracyof 1.5 · 10−9. Reproduced from ref. [306] with permission from the Royal Society of Chemistry.
z1. To this aim, a biased Maxwell-Boltzmann velocity distribution with uniform spatialdensity is first assumed on the exit slit (z = 0),
nMB(vx, vy, vz) ∝ exp[− mv2
x
2kBT
]· exp
[−
mv2y
2kBT
]· exp
[−m (vz − vz)2
2kBT
].(21)
Afterwards, a single molecule is extracted with random velocity (within nMB) and po-sition, (within the exit slit rectangle) and made to follow a rectilinear trajectory withthese initial conditions; its position is then calculated as a function of the z-coordinate.This procedure is repeated for a huge number (∼ 105) of particles, which allows toretrieve the transverse profile of the molecular beam along z. This yields, in particu-lar, dx(z1) � 0.2 cm (root mean square), corresponding to a full angular divergence ofΔφ = 2 · arctan[dx(z1)/z1] � 23◦. Then, we can calculate the average molecular density(along x) at z1, n(z1), using the following formula:
n(z1)S
w� α(ν0, z1) = α′(ν0)
D
dx(z1),(22)
where S � 0.9·10−19 cm/molec is the linestrength of the (ν1+ν3) R(1) ro-vibrational lineat T � 13.2 K [305] and w � 100 MHz is the Doppler width extracted by the fit. Finally,from n(z1) � 1.6 · 1012 molec/cm3 and denoting with ρ � 670 μm the laser beam waist inthe high-finesse cavity, we estimate the molecular beam flux as Z � n(z1) vz ρ dx(z1) �7.1 · 1014 molec/s.

FRONTIERS OF MOLECULAR GAS SENSING 179
The accuracy in the absolute frequency measurement demonstrated here can be farimproved after a realistic refinement of both the molecular beam figures and the laserspectrometer performance. Indeed, much room for progress can come from optimizationof the injection of fC2H2 and fHe as well as of the geometrical parameters of the BGC cell,in order to increase the output beam flux, while reducing its temperature and divergence.On the other side, we can work towards a more robust cavity design (also including top-quality mirrors) to be employed within an interrogation scheme with superior spectralresolution, such as SCAR.
6. – Conclusions and perspectives
Thanks to the tremendous progress experienced during the last decades in the field ofatomic, molecular and optical (AMO) physics, the common paradigm according to whichhigher and higher energies are essential to discover new Physics beyond the StandardModel is being overcome in an increasing number of laboratories around the world [311].As an example, with their astonishing fractional precision level (10−18), state-of-the-artoptical atomic clocks are already protagonists of extremely challenging experiments inthe field of many-body quantum systems, General Relativity and geodesy, and variationof fundamental constants for dark matter and energy issues [312]. In this framework, asreviewed throughout this paper, our group has developed a number of ground-breakingcoherent radiation sources and spectroscopic techniques in order to effectively extendsuch a new paradigm of fundamental research to the world of molecules. As an example,a state-of-the-art optical frequency standard, as delivered by an actively stabilized fiberlink [313], is being finalized; its combination with the present BGC setup together withan ultrahigh-resolution spectroscopic interrogation technique, like two-photon excitationin the optical domain [6], may produce new sets of ultraprecise frequency measurementson cold molecules at the electron volt energy scale, particularly intended to constrain,over a-few-year timescale, the fractional temporal variation of the proton-to-electronmass ratio at a level of 10−15/yr. As shown in the preceding sections, all this amount ofwork has resulted in an improvement of several orders of magnitude in terms of spectralresolution, measurement precision and accuracy, as well as in terms of ultimate detectionsensitivity. Then, the great potential of what can be called an infrared revolution willbe exploited not only to test the foundations of Physics, but also to sense the smallestever quantities of gases, in order to tackle some of the biggest today challenges, such asclimate change and its control, nuclear decommissioning and waste management, as wellas safety and security.
REFERENCES
[1] Maddaloni P., Bellini M. and De Natale P., Laser-based measurements for time andfrequency applications. A handbook (Taylor & Francis Group) 2013.
[2] Biesheuvel J., Karr J.-P., Hilico L., Eikema K. S. E., Ubachs W. and Koelemeij
J. C. J., “Probing QED and fundamental constants through laser spectroscopy ofvibrational transitions in HD+”, Nat. Commun., 7 (2016) 10385.
[3] Hudson J. J., Kara D. M., Smallman I. J., Sauer B. E., Tarbutt M. R. and Hinds
E. A., “Improved measurement of the shape of the electron”, Nature, 473 (2011) 493.[4] Baron J., Campbell W. C., DeMille D., Doyle J. M., Gabrielse G., Gurevich
Y. V., Hess P. W., Hutzler N. R., Kirilov E., Kozyryev I., O’Leary B. R.,
Panda C. D., Parsons M. F., Petrik E. S., Spaun B., Vutha A. C. and West

180 P. MADDALONI, S. BARTALINI, P. CANCIO, M. DE ROSA, D. MAZZOTTI and P. DE NATALE
A. D., “Order of magnitude smaller limit on the electric dipole moment of the electron”,Science, 343 (2014) 269.
[5] Darquie B., Stoeffler C., Shelkovnikov A., Daussy C., Amy-Klein A.,
Chardonnet C., Zrig S., Guy L., Crassous J., Soulard P., Asselin P., Huet
T. R., Schwerdtfeger P., Bast R. and Saue T., “Progress toward the firstobservation of parity violation in chiral molecules by high-resolution laser spectroscopy”,Chirality, 22 (2010) 870.
[6] Shelkovnikov A., Butcher R. J., Chardonnet Ch. and Amy-Klein A., “Stabilityof the proton-to-electron mass ratio”, Phys. Rev. Lett., 100 (2008) 150801.
[7] Bagdonaite J., Jansen P., Henkel C., Bethlem H. L., Menten K. M. and Ubachs
W., “A stringent limit on a drifting proton-to-electron mass ratio from alcohol in the earlyuniverse”, Science, 339 (2013) 46.
[8] Santamaria L., Di Sarno V., Ricciardi I., Mosca S., De Rosa M., Santambrogio
G., Maddaloni P. and De Natale P., “Assessing the time constancy of the proton-to-electron mass ratio by precision ro-vibrational spectroscopy of a cold molecular beam”,J. Mol. Spectros., 300 (2015) 116.
[9] Ubachs W., Bagdonaite J., Salumbides E. J., Murphy M. T. and Kaper L.,“Search for a drifting proton-electron mass ratio from H2”, Rev. Mod. Phys., 88 (2016)021003.
[10] Santamaria L., Braggio C., Carugno G., Di Sarno V., Maddaloni P. and Ruoso
G., “Axion dark matter detection by laser spectroscopy of ultracold molecular oxygen: aproposal”, New J. Phys., 17 (2015) 113025.
[11] Ubachs W, Koelemeij J. C. J., Eikema K. S. E. and Salumbides E. J., “Physicsbeyond the Standard Model from hydrogen spectroscopy”, J. Mol. Spectrosc., 320 (2016)1.
[12] Cancio P., Bartalini S., Borri S., Galli I., Gagliardi G., Giusfredi G.,
Maddaloni P., Malara P., Mazzotti D. and De Natale P., “Frequency-comb-referenced mid-IR sources for next-generation environmental sensors”, Appl. Phys. B,102 (2011) 255.
[13] Pine A. S., “Doppler-limited molecular spectroscopy by difference-frequency mixing”, J.Opt. Soc. Am., 64 (1974) 1683.
[14] Mazzotti D., De Natale P., Giusfredi G., Fort C., Mitchell J. A. and Hollberg
L., “Saturated-absorption spectroscopy with low-power difference-frequency radiation”,Opt. Lett., 25 (2000) 350.
[15] Mazzotti D., Cancio P., Giusfredi G., Inguscio M. and De Natale P., “Search forexchange-antisymmetric states for spin-0 particles at the 10−11 level”, Phys. Rev. Lett.,86 (2001) 1919.
[16] Mazzotti D., Borri S., Cancio P., Giusfredi G. and De Natale P., “Low-powerLamb-dip spectroscopy of very weak CO2 transitions around 4.25 μm Opt. Lett., 27 (2002)1256.
[17] Mazzotti Davide, Cancio Pablo and Giusfredi Giovanni, “Frequency-comb-based absolute frequency measurements in the mid-infrared with a difference-frequencyspectrometer”, Opt. Lett., 30 (2005) 997.
[18] Maddaloni P., Malara P., Gagliardi G. and De Natale P., “Two-tone frequencymodulation spectroscopy for in-situ trace gas detection using a portable difference-frequency source”, Appl. Phys. B, 85 (2006) 219.
[19] Cousin J., Chen W., Bigourd D., Fourmentin M. and Kassi S., “Telecom-grade fiberlaser-based difference-frequency generation and ppb-level detection of benzene vapor inair around 3 μm”, Appl. Phys. B, 97 (2009) 919.
[20] Weibring P., Richter D., Walega J. G., Rippe L. and Fried A., “Differencefrequency generation spectrometer for simultaneous multispecies detection”, Opt. Express,18 (2010) 27670.
[21] Giusfredi Giovanni, Bartalini Saverio, Borri Simone, Cancio Pablo, Galli
Iacopo, Mazzotti Davide and De Natale Paolo, “Saturated-absorption cavity ring-down spectroscopy”, Phys. Rev. Lett., 104 (2010) 110801.

FRONTIERS OF MOLECULAR GAS SENSING 181
[22] Galli I., Cancio P., Di Lonardo G., Fusina L., Giusfredi G., Mazzotti D.,
Tamassia F. and De Natale P., “The ν3 band of 14C16O2 molecule measured by optical-frequency-comb-assisted cavity ring-down spectroscopy [Invited article]”, Mol. Phys., 109(2011) 2267.
[23] Galli Iacopo, Bartalini Saverio, Borri Simone, Cancio Pablo, Mazzotti
Davide, De Natale Paolo and Giusfredi Giovanni, “Molecular gas sensing belowparts per trillion: radiocarbon-dioxide optical detection”, Phys. Rev. Lett., 107 (2011)270802.
[24] Kuma S., Miyamoto Y., Tsutsumi K., Sasao N. and Uetake S., “4.8 μm difference-frequency generation using a waveguide-PPLN crystal and its application to mid-infraredLamb-dip spectroscopy”, Opt. Lett., 38 (2013) 2825.
[25] Cancio Pastor P., Galli I., Giusfredi G., Mazzotti D. and De Natale P., “Testingthe validity of Bose-Einstein statistics in molecules”, Phys. Rev. A, 92 (2015) 063820.
[26] Richter D., Fried A. and Weibring P., “Difference frequency generation laser basedspectrometers”, Laser Photon. Rev., 3 (2009) 343.
[27] Fradkin K., Arie A., Skliar A. and Rosenman G., “Tunable mid-infrared source bydifference frequency generation in bulk periodically poled KTiOPO4”, Appl. Phys. Lett.,74 (1999) 914.
[28] Chen W., Mouret G., Boucher D. and Tittel F. K., “Mid-infrared trace gasdetection using continuous-wave difference frequency generation in periodically poledrbtioaso4”, Appl. Phys. B, 72 (2001) 873.
[29] Maddaloni Pasquale, Gagliardi Gianluca, Malara Pietro and De Natale
Paolo, “A 3.5 mW continuous-wave difference-frequency source around 3 μm for sub-Doppler molecular spectroscopy”, Appl. Phys. B, 80 (2005) 141.
[30] Richter D., Weibring P., Fried A., Tadanaga O., Nishida Y., Asobe M. andSuzuki H., “High-power, tunable difference-frequency-generation source for absorptionspectroscopy based on a ridge-waveguide periodically-poled lithium niobate crystal”, Opt.Express, 15 (2007) 564.
[31] Galli I., Bartalini S., Cancio P., Giusfredi G., Mazzotti D. and De Natale
P., “Ultra-stable, widely tunable and absolutely linked mid-IR coherent source”, Opt.Express, 17 (2009) 9582.
[32] Chen D.-W., “Continuous-wave tunable midwave infrared generation near 4.5 ∼μm withan intracavity optical parametric oscillator and difference frequency generation”, J. Opt.Soc. Am. B, 20 (2003) 1527.
[33] Witinski M. F., Paul J. B. and Anderson J. G., “Pump-enhanced difference-frequencygeneration at 3.3 μm”, Appl. Opt., 48 (2009) 2600.
[34] Galli Iacopo, Bartalini Saverio, Borri Simone, Cancio Pablo, Giusfredi
Giovanni, Mazzotti Davide and De Natale Paolo, “Ti:sapphire laser intracavitydifference-frequency generation of 30 mW cw radiation around 4.5 μm”, Opt. Lett., 35(2010) 3616.
[35] Krzempek K., Sobon G. and Abramski K. M., “DFG-based mid-IR generation usinga compact dual-wavelength all-fiber amplifier for laser spectroscopy applications”, Opt.Express, 21 (2013) 20023.
[36] Asobe M., Tadanaga O., Yanagawa T., Umeki T., Nishida Y. and Suzuki H.,“High-power mid-infrared wavelength generation using difference frequency generation indamage-resistant Zn:LiNb03 waveguide”, Electron. Lett., 44 (2008) 288.
[37] Grilli R., Ciaffoni L., Hancock G., Peverall R., Ritchie G. A. D. and Orr-
Ewing E. J., “Mid-infrared ethene detection using difference frequency generation in aquasi-phase-matched LiNbO3 waveguide”, Appl. Opt., 48 (2009) 5696.
[38] Chen W., Sigrist M. W., Zondy J.-J., Tinturier S., Borel F., Bocquet R., Burie
J., Boucher D., Isaenko L., Yelisseyev A. and Lobanov S., “Continuous-wavemid-infrared difference-frequency generation in lithium-based semiconductors (liins2 andliinse2)”, In Conference on Lasers and Electro-Optics/International Quantum ElectronicsConference and Photonic Applications Systems Technologies (Optical Society of America)2004, page CFI2.
182 P. MADDALONI, S. BARTALINI, P. CANCIO, M. DE ROSA, D. MAZZOTTI and P. DE NATALE
[39] Chen Weidong, Poullet Emmanuelle, Burie Jean, Boucher Daniel, Sigrist
Markus W., Zondy Jean-Jacques, Isaenko Ludmila, Yelisseyev Alexander andLobanov Sergei, “Widely tunable continuous-wave mid-infrared radiation (5.5–11 μm)by difference-frequency generation in liins2 crystal”, Appl. Opt., 44 (2005) 4123.
[40] Haıdar R., Mustelier A., Kupecek Ph., Rosencher E., Triboulet R., Lemasson
Ph. and Mennerat G., “Largely tunable midinfrared (8–12 μm) difference frequencygeneration in isotropic semiconductors”, J. Appl. Phys., 91 (2002) 2550.
[41] Canarelli P., Benko Z., Curl R. F. and Tittel F. K., “Continuous-wave infraredlaser spectrometer based on difference frequency generation in AgGaS for high-resolutionspectroscopy”, J. Opt. Soc. Am. B, 9 (1992) 197.
[42] Hielscher A. H., Miller C. E., Bayard D. C., Simon U., Smolka K. P., Curl R. F.
and Tittel F. K., “Optimization of a midinfrared high-resolution difference-frequencylaser spectrometer”, J. Opt. Soc. Am. B, 9 (1992) 1962.
[43] Lee D., Kaing T. and Zondy J.-J., “An all-diode-laser-based, dual-cavity aggas2 cwdifference-frequency source for the 9–11 μm range”, Appl. Phys. B, 67 (1998) 363.
[44] Khorsandi A., Willer U., Geiser P. and Schade W., “External short-cavity diode-laser for mir difference-frequency generation”, Appl. Phys. B, 77 (2003) 509.
[45] Petrov K. P., Curl R. F., Tittel F. K. and Goldberg L., “Continuous-wave tunable8.7 μm spectroscopic source pumped by fiber-coupled communications lasers”, Opt. Lett.,21 (1996) 1451.
[46] Fiore A., Berger V., Rosencher E., Bravetti P., Laurent N. and Nagle J.,“Phase-matched mid-infrared difference frequency generation in gaas-based waveguides”,Appl. Phys. Lett., 71 (1997) 3622.
[47] Logan D. F., Giguere M., Villeneuve A. and Helmy A. S., “Widely tunable mid-infrared generation via frequency conversion in semiconductor waveguides”, Opt. Lett.,38 (2013) 4457.
[48] Stievater T. H., Mahon R., Park D., Rabinovich W. S., Pruessner M. W.,
Khurgin J. B. and Richardson C. J. K., “Mid-infrared difference-frequency generationin suspended GaAs waveguides”, Opt. Lett., 39 (2014) 945.
[49] Nesic Aleksandar, Palmer Robert, Koeber Sebastian, Korn Dietmar, Koenig
Swen, Elder Delwin L., Dalton Larry R., Freude Wolfgang and Koos
Christian G., “Demonstration of difference frequency generation in a silicon slotwaveguide”, in CLEO: 2014 (Optical Society of America) 2014, page STh1I.2.
[50] Sasaki Yuzo, Yuri Avetisyan, Kawase Kodo and Ito Hiromasa, “Terahertz-wavesurface-emitted difference frequency generation in slant-stripe-type periodically poledlinbo3 crystal”, Appl. Phys. Lett., 81 (2002) 3323.
[51] Ding Y. and Shi W., “Widely tunable monochromatic THz sources based on phase-matched difference-frequency generation in nonlinear-optical crystals: a novel approach”,Laser Phys., 16 (2006) 562.
[52] Consolino Luigi, Taschin Andrea, Bartolini Paolo, Bartalini Saverio, Cancio
Pablo, Tredicucci Alessandro, Beere Harvey E., Ritchie David A., Torre
Renato, Vitiello Miriam Serena and De Natale Paolo, “Phase-locking to a free-space terahertz comb for metrological-grade terahertz lasers”, Nat. Commun., 3 (2012)1040.
[53] Vodopyanov K. L., Fejer M. M., Yu X., Harris J. S., Lee Y.-S., Hurlbut W. C.,
Kozlov V. G., Bliss D. and Lynch C., “Terahertz-wave generation in quasi-phase-matched gaas”, Appl. Phys. Lett., 89 (2006) 141119.
[54] Liu Pengxiang, Shi Wei, Xu Degang, Zhang Xinzheng, Zhang Guizhong and Yao
Jianquan, “Efficient phase-matching for difference frequency generation with pump ofbessel laser beams”, Opt. Express, 24 (2016) 901.
[55] Belkin Mikhail a., Capasso Federico, Belyanin Alexey, Sivco Deborah L., Cho
Alfred Y., Oakley Douglas C., Vineis Christopher J. and Turner George
W., “Terahertz quantum-cascade-laser source based on intracavity difference-frequencygeneration”, Nat. Photon., 1 (2007) 288.
FRONTIERS OF MOLECULAR GAS SENSING 183
[56] Belkin M. A., Capasso F., Xie F., Belyanin A., Fischer M., Wittmann A.
and Faist J., “Room temperature terahertz quantum cascade laser source based onintracavity difference-frequency generation”, Appl. Phys. Lett., 92 (2008) 201101.
[57] Amnon Yariv, Quantum Electronics, 3rd edition (John Wiley and Sons, New York) 1989.
[58] Boyd Robert W., Nonlinear Optics, 3rd edition (Academic Press) 2008.
[59] De Rosa Maurizio, De Tommasi E., Maddaloni P., Mosca S., Ricciardi Iolanda,
Rocco Alessandra, Zondy Jean-Jacques and De Natale Paolo, “Periodically-Poled Ferroelectric Crystals Based OPO—A Powerful Source for Precision Spectroscopy”,in Ferroelectric Crystals for Photonic Applications, (Springer, Berlin, Heidelberg) 2014,pp. 453–473.
[60] Graham R. and Haken H., “The quantum-fluctuations of the optical parametricoscillator. I”, Z. Phys., 210 (1968) 276.
[61] Graham R., “The quantum-fluctuations of the optical parametric oscillator. II”, Z. Phys.,210 (1968) 319.
[62] Yamamoto Y. and Haus H. A., “Commutation relations and laser linewidth”, Phys.Rev. A, 41 (1990) 5164.
[63] Peltola J., Vainio Markku, Fordell Thomas, Hieta Tuomas, Merimaa M. andHalonen Lauri L., “Frequency-comb-referenced mid-infrared source for high-precisionspectroscopy”, Opt. Express, 22 (2014) 32429.
[64] Ly Aliou, Szymanski Benjamin and Bretenaker Fabien, “Frequency stabilization ofthe non-resonant wave of a continuous-wave singly resonant optical parametric oscillator”,Appl. Phys. B, 120 (2015) 201.
[65] Ricciardi Iolanda, Mosca S., Parisi M., Maddaloni P., Santamaria Luigi, De
Natale Paolo and De Rosa Maurizio, “Sub-kilohertz linewidth narrowing of a mid-infrared optical parametric oscillator idler frequency by direct cavity stabilization”, Opt.Lett., 40 (2015) 4743.
[66] Andrieux E., Zanon T., Cadoret Malo., Rihan A. and Zondy J. J., “500 GHzmode-hop-free idler tuning range with a frequency-stabilized singly resonant opticalparametric oscillator”, Opt. Lett., 36 (2011) 1212.
[67] Mhibik Oussama, My Thu-Hien, Pabœuf David, Bretenaker Fabien and Drag
Cyril, “Frequency stabilization at the kilohertz level of a continuous intracavityfrequency-doubled singly resonant optical parametric oscillator”, Opt. Lett., 35 (2010)2364.
[68] Mhibik O., Pabœuf D., Drag C. and Bretenaker F., “Sub-kHz-level relativestabilization of an intracavity doubled continuous wave optical parametric oscillator usingPound-Drever-Hall scheme”, Opt. Express, 19 (2011) 18049.
[69] Zaske S., Lee D.-H. and Becher C., “Green-pumped cw singly resonant opticalparametric oscillator based on mgo:ppln with frequency stabilization to an atomicresonance”, Appl. Phys. B, 98 (2010) 729.
[70] Vainio Markku, Merimaa M. and Halonen Lauri, “Frequency-comb-referencedmolecular spectroscopy in the mid-infrared region”, Opt. Lett., 36 (2011) 4122.
[71] Inaba Hajime, Ikegami Takeshi, Hong Feng-Lei, Onae Atsushi, Koga Yasuky,
Schibli Thomas R., Minoshima Kaoru, Matsumoto Hirokazu, Yamadori Shinya,
Tohyama Osamu and Yamaguchi Syun-Ichiro, “Phase locking of a continuous-waveoptical parametric oscillator to an optical frequency comb for optical frequency synthesis”,IEEE J. Quantum Electron., 40 (2004) 929.
[72] Inaba Hajime, Ikegami Takeshi, Hong Feng-Lei, Bitou Youichi, Onae Atsushi,
Schibli Thomas R., Minoshima Kaoru and Matsumoto Hirokazu, “Doppler-freespectroscopy using a continuous-wave optical frequency synthesizer”, Appl. Opt., 45(2006) 4910.
[73] Kovalchuk E. V., Schuldt T. and Peters A., “Combination of a continuous-waveoptical parametric oscillator and a femtosecond frequency comb for optical frequencymetrology”, Opt. Lett., 30 (2005) 3141.

184 P. MADDALONI, S. BARTALINI, P. CANCIO, M. DE ROSA, D. MAZZOTTI and P. DE NATALE
[74] Ricciardi Iolanda, De Tommasi Edoardo, Maddaloni Pasquale, Mosca
Simona, Rocco Alessandra, Zondy Jean-Jacques, De Rosa Maurizio and De
Natale Paolo, “A frequency-comb-referenced singly-resonant OPO for sub-Dopplerspectroscopy”, Opt. Express, 20 (2012) 9178.
[75] Ricciardi Iolanda, De Tommasi E., Maddaloni P., Mosca S., Rocco Alessandra,
Zondy Jean-Jacques, De Rosa Maurizio and De Natale Paolo, “A narrow-linewidth optical parametric oscillator for mid-infrared high-resolution spectroscopy”,Mol. Phys., 110 (2012) 2103.
[76] Drever R. W. P., Hall John L., Kowalski F. V., Hough Jim, Ford G. W.,
Munley A. J. and Ward H., “Laser phase and frequency stabilization using an opticalresonator”, Appl. Phys. B, 31 (1983) 97.
[77] Elliott D. S., Roy R. and Smith S. J., “Extracavity laser band-shape and bandwidthmodification”, Phys. Rev. A, 26 (1982) 12.
[78] Di Domenico G., Schilt S. and Thomann P., “Simple approach to the relation betweenlaser frequency noise and laser line shape”, Appl. Opt., 49 (2010) 4801.
[79] Ricciardi Iolanda, Mosca Simona, Parisi Maria, Maddaloni Pasquale,
Santamaria Luigi, De Rosa Maurizio, Giusfredi Giovanni and De Natale Paolo,“Sub-khz-linewidth mid-infrared optical parametric oscillator”, in 2014 Conference onLasers and Electro-Optics (CLEO) - Laser Science to Photonic Applications (OpticalSocity of America) 2014, pp. 1–2.
[80] Maddaloni P., Malara P., Gagliardi G. and De Natale Paolo, “Mid-infraredfibre-based optical comb”, New J. Phys., 8 (2006) 262.
[81] Erny C., Moutzouris K., Biegert J., Kuhlke D., Adler Florian, Leitenstorfer
A. and Keller Ursula, “Mid-infrared difference-frequency generation of ultrashortpulses tunable between 3.2 and 4.8 μm from a compact fiber source”, Opt. Lett., 32(2007) 1138.
[82] Malara P., Maddaloni P., Gagliardi G. and De Natale P, “Absolute frequencymeasurement of molecular transitions by a direct link to a comb generated around 3 μm”,Opt. Express, 16 (2008) 8242.
[83] Gambetta Alessio, Ramponi R. and Marangoni Marco, “Mid-infrared opticalcombs from a compact amplified Er-doped fiber oscillator”, Opt. Lett., 33 (2008) 2671.
[84] Maddaloni P., Cancio P. and De Natale P., “Optical comb generators for laserfrequency measurement”, Meas. Sci. Technol., 20 (2009) 052001.
[85] Galli Iacopo, Cappelli F., Cancio P., Giusfredi Giovanni, Mazzotti D.,
Bartalini S. and De Natale Paolo, “High-coherence mid-infrared frequency comb”,Opt. Express, 21 (2013) 28877.
[86] Gambetta Alessio, Coluccelli Nicola, Cassinerio Marco, Gatti Davide,
Laporta Paolo, Galzerano Gianluca and Marangoni Marco, “Milliwatt-levelfrequency combs in the 8–14 μm range via difference frequency generation from an Er:fiberoscillator”, Opt. Lett., 38 (2013) 1155.
[87] Galli I., Bartalini Saverio, Cancio P., Cappelli F., Giusfredi G., Mazzotti
D., Akikusa N., Yamanishi Masamichi and De Natale P., “Mid-infrared frequencycomb for broadband high precision and sensitivity molecular spectroscopy”, Opt. Lett.,39 (2014) 5050.
[88] Sun J. H., Gale B. J. S. and Reid D. T., “Composite frequency comb spanning 0.4–2.4 μm from a phase-controlled femtosecond Ti:sapphire laser and synchronously pumpedoptical parametric oscillator”, Opt. Lett., 32 (2007) 1414.
[89] Wong Samuel T., Plettner Tomas, Vodopyanov Konstantin L., Urbanek
Karel, Digonnet Michel and Byer Robert L., “Self-phase-locked degeneratefemtosecond optical parametric oscillator”, Opt. Lett., 33 (2008) 1896.
[90] Wong Samuel T., Vodopyanov Konstantin L. and Byer Robert L., “Self-phase-locked divide-by-2 optical parametric oscillator as a broadband frequency comb source”,J. Opt. Soc. Am. B, 27 (2010) 876.

FRONTIERS OF MOLECULAR GAS SENSING 185
[91] Leindecker N. C., Marandi Alireza, Byer Robert L. and Vodopyanov
Konstantin L., “Broadband degenerate OPO for mid-infrared frequency combgeneration”, Opt. Express, 19 (2011) 6296.
[92] Peters E., Diddams S. A., Fendel P., Reinhardt S., Hansch T. W. and Udem
Th., “A deep-uv optical frequency comb at 205 nm”, Opt. Express, 17 (2009) 9183.[93] Kandula Dominik Z., Gohle Christoph, Pinkert Tjeerd J., Ubachs Wim and
Eikema Kjeld S. E., “Extreme ultraviolet frequency comb metrology”, Phys. Rev. Lett.,105 (2010) 063001.
[94] Bernhardt Birgitta, Ozawa Akira, Vernaleken Andreas, Pupeza Ioachim,
Kaster Jan, Kobayashi Yohei, Holzwarth Ronald, Fill Ernst, Krausz Ferenc,
Hansch Theodor W. and Udem Thomas, “Vacuum ultraviolet frequency combsgenerated by a femtosecond enhancement cavity in the visible”, Opt. Lett., 37 (2012)503.
[95] Ulvila Ville, Phillips C. R., Halonen Lauri L. and Vainio Markku, “Frequencycomb generation by a continuous-wave-pumped optical parametric oscillator based oncascading quadratic nonlinearities”, Opt. Lett., 38 (2013) 4281.
[96] Ricciardi Iolanda, Mosca Simona, Parisi Maria, Maddaloni Pasquale,
Santamaria Luigi, De Natale Paolo and De Rosa Maurizio, “Frequency combgeneration in quadratic nonlinear media”, Phys. Rev. A, 91 (2015) 063839.
[97] Mosca S., Ricciardi Iolanda, Parisi M., Maddaloni P., Santamaria Luigi, De
Natale Paolo and De Rosa Maurizio, “Direct generation of optical frequency combsin χ(2) nonlinear cavities”, Nanophotonics, 5 (2016) 316.
[98] Leo F., Hansson T., Ricciardi Iolanda, De Rosa Maurizio, Coen Stephane,
Wabnitz S. and Erkintalo M., “Walk-Off-Induced Modulation Instability, TemporalPattern Formation and Frequency Comb Generation in Cavity-Enhanced Second-Harmonic Generation”, Phys. Rev. Lett., 116 (2016) 033901.
[99] Leo F., Hansson T., Ricciardi Iolanda, De Rosa Maurizio, Coen Stephane,
Wabnitz S. and Erkintalo M., “Frequency-comb formation in doubly resonant second-harmonic generation”, Phys. Rev. A, 93 (2016) 043831.
[100] Hansson Tobias, Leo Francois, Erkintalo Miro, Anthony Jessienta, Coen
Stephane, Ricciardi Iolanda, De Rosa Maurizio and Wabnitz Stefan, “Singleenvelope equation modeling of multi-octave comb arrays in microresonators withquadratic and cubic nonlinearities”, J. Opt. Soc. Am. B, 33 (2016) 1207.
[101] Faist Jerome, Capasso Federico, Sivco Deborah L., Sirtori Carlo, Hutchinson
Albert L. and Cho Alfred Y., “Quantum Cascade Laser”, Science, 264 (1994) 553.[102] Kohler Rudeger, Tredicucci Alessandro, Beltram Fabio, Beere Harvey E.,
Linfield Edmund H., Davies A. Giles, Ritchie David A., Iotti Rita C. and Rossi
Fausto, “Terahertz semiconductor-heterostructure laser”, Nature, 417 (2002) 156.[103] Kazarinov Rudolf F. and Suris R. A., “Possibility of the amplification of
electromagnetic waves in a semiconductor with a superlattice”, Sov. Phys. Semicond.,5 (1971) 707.
[104] Cho Alfred Y., Molecular Beam Epitaxy (AIP Press, Woodbury, N.Y.) 1997.[105] Capasso Federico, “Band-gap engineering: from physics and materials to new
semiconductor devices”, Science, 235 (1987) 172.[106] Revin D. G., Wilson Luke R., Zibik E. A., Green Richard P., Cockburn J. W.,
Steer M. J., Airey R. J. and Hopkinson M., “InGaAsAlAsSb quantum cascadelasers”, Appl. Phys. Lett., 85 (2004) 3992.
[107] Yang Q., Manz C., Bronner Wolfgang, Mann Ch., Kirste L., Kohler K. andWagner J., “GaInAsAlAsSb quantum-cascade lasers operating up to 400 K”, Appl. Phys.Lett., 86 (2005) 131107.
[108] Laffaille Pierre, Moreno J. C., Teissier R., Bahriz Michael and Barat Robert,“High temperature operation of short wavelength InAs-based quantum cascade lasers”,AIP Adv., 2 (2012) 022119.
[109] Capasso Federico, “High-performance midinfrared quantum cascade lasers”, Opt. Eng.,49 (2010) 111102.

186 P. MADDALONI, S. BARTALINI, P. CANCIO, M. DE ROSA, D. MAZZOTTI and P. DE NATALE
[110] Bai Yanbo, Slivken Steven, Kuboya Shigeyuki, Darvish Shaban Ramezani andRazeghi Manijeh, “Quantum cascade lasers that emit more light than heat”, Nat.Photon., 4 (2010) 99.
[111] Liu Peter Q., Hoffman Anthony J., Escarra Matthew D., Franz Kale J.,
Khurgin Jacob B., Dikmelik Yamac, Wang Xiaojun, Fan Jen-Yu and Gmachl
Claire F., “Highly power-efficient quantum cascade lasers”, Nat. Photon., 4 (2010) 95.
[112] Yao Yu, Hoffman A. J. Anthony J. and Gmachl Claire F., “Mid-infrared quantumcascade lasers”, Nat. Photon., 6 (2012) 432.
[113] Bismuto Alfredo, Riedi S., Hinkov Borislav, Beck M. and Faist Jerome, “Sb-free quantum cascade lasers in the 3–4 μm spectral range”, Semicond. Sci. Technol., 27(2012) 045013.
[114] Scalari Giacomo, Ajili Lassaad, Faist Jerome, Beere Harvey E., Linfield
Edmund H., Ritchie David A. and Davies A. Giles, “Far-infrared (λ87 μm) bound-to-continuum quantum-cascade lasers operating up to 90 K”, Appl. Phys. Lett., 82 (2003)3165.
[115] Williams Benjamin S., Callebaut Hans, Kumar Sushil, Hu Qing and Reno John
L., “3.4 THz quantum cascade laser based on longitudinal-optical-phonon scattering fordepopulation”, Appl. Phys. Lett., 82 (2003) 1015.
[116] Deutsch Christoph, Krall M., Brandstetter M., Detz H., Andrews A. M.,
Klang P., Schrenk W., Strasser G. and Unterrainer K., “High performanceInGaAs/GaAsSb terahertz quantum cascade lasers operating up to 142 K”, Appl. Phys.Lett., 101 (2012) 211117.
[117] Tonouchi Masayoshi, “Cutting-edge terahertz technology”, Nat. Photon., 1 (2007) 97.
[118] Maineult Wilfried, Gellie Pierre, Andronico Alessio, Filloux Pascal, Leo
Giuseppe, Sirtori Carlo, Barbieri Stefano, Peytavit Emilien, Akalin Tahsin,
Lampin Jean-Francois, Beere Harvey E. and Ritchie David A., “Metal-metalterahertz quantum cascade laser with micro-transverse-electromagnetic-horn antenna”,Appl. Phys. Lett., 93 (2008) 183508.
[119] Wei Min Lee Alan, Qin Qi, Kumar Sushil, Williams Benjamin S., Hu Qing andReno John L., “High-power and high-temperature THz quantum-cascade lasers basedon lens-coupled metal-metal waveguides”, Opt. Lett., 32 (2007) 2840.
[120] Fan Jonathan A., Belkin Mikhail A., Capasso Federico, Khanna Suraj P.,
Lachab Mohamed, Davies A. Giles and Linfield Edmund H., “Surface emittingterahertz quantum cascade laser with a double-metal waveguide”, Opt. Express, 14 (2006)11672.
[121] Kumar Sushil, Williams Benjamin S., Qin Qi, Lee Alan W., Hu Qing and Reno
John L., “Surface-emitting distributed feedback terahertz quantum-cascade lasers inmetal-metal waveguides”, Opt. Express, 15 (2007) 113.
[122] Mahler Lukas, Tredicucci Alessandro, Beltram Fabio, Walther Christophe,
Faist Jerome, Beere Harvey E. and Ritchie David A., “High-power surface emissionfrom terahertz distributed feedback lasers with a dual-slit unit cell”, Appl. Phys. Lett.,96 (2010) 191109.
[123] Amanti Maria Ines, Fischer M., Scalari Giacomo, Beck Mattias and Faist
Jerome, “Low-divergence single-mode terahertz quantum cascade laser”, Nat. Photon.,3 (2009) 586.
[124] Yu Nanfang, Wang Qi Jie, Kats Mikhail A, Fan Jonathan A., Khanna Suraj P.,
Li Lianhe, Davies A. Giles, Linfield Edmund H. and Capasso Federico, “Designerspoof surface plasmon structures collimate terahertz laser beams”, Nat. Mater., 9 (2010)730.
[125] Mahler Lukas, Tredicucci Alessandro, Beltram Fabio, Walther Christophe,
Faist Jerome, Witzigmann Bernd, Beere Harvey E. and Ritchie David A.,“Vertically emitting microdisk lasers”, Nat. Photon., 3 (2009) 46.
[126] Mahler Lukas, Amanti Maria Ines, Walther Christophe, Tredicucci
Alessandro, Beltram Fabio, Faist Jerome, Beere Harvey E. and Ritchie David

FRONTIERS OF MOLECULAR GAS SENSING 187
A., “Distributed feedback ring resonators for vertically emitting terahertz quantumcascade lasers”, Opt. Express, 17 (2009) 13031.
[127] Mujagic Elvis, Deutsch Christoph, Detz Hermann, Klang Pavel, Nobile
Michele, Andrews Aaron Maxwell, Schrenk Werner, Unterrainer Karl andStrasser Gottfried, “Vertically emitting terahertz quantum cascade ring lasers” Appl.Phys. Lett., 95 (2009) 011120.
[128] Chassagneux Yannick, Colombelli R., Maineult Wilfried, Barbieri Stefano,
Beere Harvey E., Ritchie David A., Khanna Suraj P., Linfield Edmund H. andDavies A. Giles, “Electrically pumped photonic-crystal terahertz lasers controlled byboundary conditions”, Nature, 457 (2009) 174.
[129] Fathololoumi S., Dupont E., Chan C.W.I., Wasilewski Z.R., Laframboise S.R.,
Ban D., Matyas A., Jirauschek Christian, Hu Qing and Liu Hui Chun, “Terahertzquantum cascade lasers operating up to 200 K with optimized oscillator strength andimproved injection tunneling”, Opt. Express, 20 (2012) 3866.
[130] Belkin M. A., Loncar M., Lee B. G., Pflugl C., Audet R., Diehl L., Capasso
F., Bour D., Corzine S. and Hofler G., “Intra-cavity absorption spectroscopy withnarrow-ridge microfluidic quantum cascade lasers”, Opt. Express, 15 (2007) 11262.
[131] Vijayraghavan Karun, Jiang Yifan, Jang Min, Jiang Aiting, Choutagunta
Karthik, Vizbaras Augustinas, Demmerle Frederic, Boehm Gerhard, Amann
Markus C. and Belkin Mikhail A., “Broadly tunable terahertz generation in mid-infrared quantum cascade lasers”, Nat. Commun., 4 (2013) 2021.
[132] Jung Seungyong, Jiang Aiting, Jiang Yifan, Vijayraghavan Karun, Wang
Xiaojun, Troccoli Mariano and Belkin Mikhail A., “Broadly tunable monolithicroom-temperature terahertz quantum cascade laser sources”, Nat. Commun., 5 (2014)4267.
[133] Jiang Aiting, Jung Seungyong, Jiang Yifan, Vijayraghavan Karun, Kim Jae
Hyun and Belkin Mikhail A., “Widely tunable terahertz source based on intra-cavityfrequency mixing in quantum cascade laser arrays”, Appl. Phys. Lett., 106 (2015) 261107.
[134] Fujita Kazuue, Hitaka Masahiro, Ito Akio, Edamura Tadataka, Yamanishi
Masamichi, Jung Seungyong and Belkin Mikhail a., “Terahertz generation in mid-infrared quantum cascade lasers with a dual-upper-state active region”, Appl. Phys. Lett.,106 (2015) 251104.
[135] Lu Q., Wu D., Sengupta S., Slivken S. and Razeghi M., “Room temperaturecontinuous wave, monolithic tunable THz sources based on highly efficient mid-infraredquantum cascade lasers”, Sci. Rep., 6 (2016) 23595.
[136] Li J. S., Chen W. and Fischer H., “Quantum Cascade Laser Spectrometry Techniques:A New Trend in Atmospheric Chemistry”, Appl. Spectrosc. Rev., 48 (2013) 523.
[137] Amanti Maria Ines, Scalari Giacomo, Beck Mattias and Faist Jerome, “Stand-alone system for high-resolution, real-time terahertz imaging”, Opt. Express, 20 (2012)2772.
[138] Dean Paul, Lim Yah Leng, Valavanis Alexander, Kliese Russell, Nikolic
Milan, Khanna Suraj P., Lachab Mohammad, Indjin Dragan, Ikonic Zoran,
Harrison Paul, Rakic Aleksandar D., Linfield Edmund H. and Davies A. Giles,“Terahertz imaging through self-mixing in a quantum cascade laser”, Opt. Lett., 36 (2011)2587.
[139] Mahler Lukas, Tredicucci Alessandro and Vitiello Miriam Serena, “Quantumcascade laser: a compact, low cost, solid-state source for plasma diagnostics”, J. Instrum.,7 (2012) C02018.
[140] Reix J. M., Passvogel T., Crone G., Collaudin B., Rideau P., Roche Y.
and Vogel C., “The Herschel/Planck programme, technical challenges for two sciencemissions, successfully launched”, Acta Astron., 66 (2010) 130.
[141] Ren Y., Hovenier J. N., Higgins R., Gao J. R., Klapwijk T. M., Shi S. C., Klein
B., Kao T.-Y., Hu Qing and Reno J. L., “High-resolution heterodyne spectroscopyusing a tunable quantum cascade laser around 3.5 THz”, Appl. Phys. Lett., 98 (2011)231109.

188 P. MADDALONI, S. BARTALINI, P. CANCIO, M. DE ROSA, D. MAZZOTTI and P. DE NATALE
[142] Lerttamrab Maytee, Chuang S. L., Gmachl Claire F., Sivco Deborah L.,
Capasso Federico and Cho Alfred Y., “Linewidth enhancement factor of a type-I quantum-cascade laser”, J. Appl. Phys., 94 (2003) 5426.
[143] Aellen Thierry, Maulini Richard, Terazzi R., Hoyler N., Giovannini
Marcella, Faist Jerome, Blaser Stephane and Hvozdara L., “Direct measurementof the linewidth enhancement factor by optical heterodyning of an amplitude-modulatedquantum cascade laser”, Appl. Phys. Lett., 89 (2006) 91121.
[144] von Staden J., Gensty T., Elsaßer W., Giuliani G. and Mann C., “Measurementsof the α factor of a distributed-feedback quantum cascade laser by an optical feedbackself-mixing technique”, Opt. Lett., 31 (2006) 2574.
[145] Yamanishi Masamichi, Edamura T., Fujita Kazuue, Akikusa Naota and Kan
H., “Theory of the Intrinsic Linewidth of Quantum-Cascade Lasers: Hidden Reason forthe Narrow Linewidth and Line-Broadening by Thermal Photons”, IEEE J. QuantumElectron., 44 (2008) 12.
[146] Bartalini Saverio, Borri Simone, Cancio Pablo, Castrillo Antonio, Galli
Iacopo, Giusfredi Giovanni, Mazzotti Davide, Gianfrani Livio and De Natale
Paolo, “Observing the Intrinsic Linewidth of a Quantum-Cascade Laser: Beyond theSchawlow-Townes Limit”, Phys. Rev. Lett., 104 (2010) 1.
[147] Vitiello Miriam Serena, Consolino Luigi, Bartalini Saverio, Taschin Andrea,
Tredicucci Alessandro, Inguscio Massimo and De Natale Paolo, “Quantum-limited frequency fluctuations in a Terahertz laser”, Nat. Photon., 6 (2012) 525.
[148] Ravaro Marco, Barbieri Stefano, Santarelli Giorgio, Jagtap Vishal,
Manquest Christophe, Sirtori Carlo, Khanna Suraj P. and Linfield Edmund
H., “Measurement of the intrinsic linewidth of terahertz quantum cascade lasers using anear-infrared frequency comb”, Opt. Express, 20 (2012) 25654.
[149] Bartalini S., Borri S., Galli Iacopo, Giusfredi Giovanni, Mazzotti D.,
Edamura T., Akikusa N., Yamanishi M. and De Natale Paolo, “Measuringfrequency noise and intrinsic linewidth of a room-temperature DFB quantum cascadelaser”, Opt. Express, 19 (2011) 17996.
[150] Weidmann Damien, Joly L., Parpillon V., Courtois D., Bonetti Y.,
Aellen Thierry, Beck Mattias, Faist Jerome and Hofstetter Daniel, “Free-running 9.1 μm distributed-feedback quantum cascade laser linewidth measurement byheterodyning with a C18O2 laser”, Opt. Lett., 28 (2003) 704.
[151] Myers Tanya L., Williams Richard M., Taubman Matthew S., Gmachl Claire
F., Capasso Federico, Sivco Deborah L., Baillargeon James N. and Cho Alfred
Y., “Free-running frequency stability of mid-infrared quantum cascade lasers”, Opt. Lett.,27 (2002) 170.
[152] Tombez Lionel, Di Francesco Joab, Schilt Stephane, Di Domenico Gianni,
Faist Jerome, Thomann Pierre and Hofstetter Daniel, “Frequency noise of free-running 4.6 μm distributed feedback quantum cascade lasers near room temperature”,Opt. Lett., 36 (2011) 3109.
[153] Tombez Lionel, Schilt Stephane, Di Francesco Joab, Thomann Pierre andHofstetter Daniel, “Temperature dependence of the frequency noise in a mid-IRDFB quantum cascade laser from cryogenic to room temperature”, Opt. Express, 20(2012) 6851.
[154] Tombez Lionel, Schilt Stephane, Di Francesco Joab, Fuhrer T., Rein
B., Walther T., Di Domenico Gianni, Hofstetter Daniel and Thomann P.,“Linewidth of a quantum-cascade laser assessed from its frequency noise spectrum andimpact of the current driver”, Appl. Phys. B, 109 (2012) 407.
[155] Borri S., Bartalini S., Cancio Pablo, Galli Iacopo, Giusfredi Giovanni,
Mazzotti D. and De Natale Paolo, “Quantum cascade lasers for high-resolutionspectroscopy”, Opt. Eng., 49 (2010) 111122.
[156] Schawlow Arthur and Townes C. H., “Infrared and optical masers”, Phys. Rev., 112(1958) 1940.

FRONTIERS OF MOLECULAR GAS SENSING 189
[157] Henry C., Line broadening of semiconductor lasers (John-Wiley & Sons, New York)1991.
[158] Jirauschek Christian, “Monte Carlo study of intrinsic linewidths in terahertz quantumcascade lasers”, Opt. Express, 18 (2010) 25922.
[159] Yamanishi Masamichi, “Theory of intrinsic linewidth based on fluctuation-dissipationbalance for thermal photons in THz quantum-cascade lasers”, Opt. Express, 20 (2012)28465.
[160] Borri S., Bartalini S., Pastor Pablo Cancio, Galli Iacopo, Giusfredi Giovanni,
Mazzotti D., Yamanishi Masamichi and De Natale Paolo, “Frequency-NoiseDynamics of Mid-Infrared Quantum Cascade Lasers”, IEEE J. Quantum Electron., 47(2011) 984.
[161] Bartalini Saverio, Cancio Pablo, Giusfredi Giovanni, Mazzotti Davide, Borri
Simone, Galli Iacopo, Leveque T., Gianfrani Livio, De Natale P., De Natale
Paolo. and De Natale P, “Frequency-comb-referenced quantum-cascade laser at4.4 μm”, Opt. Lett., 32 (2007) 988.
[162] Taubman Matthew S., Myers Tanya L., Cannon B. D., Williams Richard M.,
Capasso Federico, Gmachl Claire F., Sivco Deborah L. and Cho Alfred Y.,“Frequency stabilization of quantum cascade lasers by use of optical cavities”, Opt. Lett.,27 (2002) 2164.
[163] Bielsa F., Douillet A., Valenzuela T., Karr J. and Hilicos L., “Narrow-linephase-locked quantum cascade laser in the 9.2 μm range”, Opt. Lett., 32 (2007) 1641.
[164] Borri S., Bartalini S., Galli Iacopo, Cancio P., Giusfredi Giovanni, Mazzotti
D., Castrillo A., Gianfrani L. and De Natale Paolo, “Lamb-dip-locked quantumcascade laser for comb-referenced IR absolute frequency measurements”, Opt. Express,16 (2008) 11637.
[165] Bartalini Saverio, Borri Simone and De Natale Paolo, “Doppler-free polarizationspectroscopy with a quantum cascade laser at 4.3 μm”, Opt. Express, 17 (2009) 7440.
[166] Cappelli F., Galli I., Borri S., Giusfredi G., Cancio P., Mazzotti D., Montori
a., Akikusa N., Yamanishi Masamichi, Bartalini Saverio and De Natale P.,“Subkilohertz linewidth room-temperature mid-infrared quantum cascade laser using amolecular sub-Doppler reference”, Opt. Lett., 37 (2012) 4811.
[167] Rothman L. S., Gordon I. E., Barbe A., Benner D. C., Bernath P. F., Birk
M., Boudon V., Brown L. R., Campargue A., Champion J. P., Chance K. V.,
Coudert L. H., Dana V., Devi V. M., Fally S., Flaud J. M., Gamache R. R.,
Goldman A., Jacquemart D., Kleiner I., Lacome N., Lafferty W. J., Mandin
J. Y., Massie S. T., Mikhailenko S. N., Miller C. E., Moazzen Ahmadi N.,
Naumenko O. V., Nikitin A. V., Orphal J., Perevalov V. I., Perrin A., Predoi
Cross A., Rinsland C. P., Rotger M., Simeckova M., Smith M. A. H., Sung K.,
Tashkun S. A., Tennyson J., Toth R. A., Vandaele A. C. and Vander Auwera
J., “The HITRAN 2008 molecular spectroscopic database”, J. Quant. Spectrosc. Radiat.Transfer, 110 (2009) 533.
[168] Borri Simone, Galli Iacopo, Cappelli Francesco, Bismuto Alfredo, Bartalini
Saverio, Cancio Pablo, Giusfredi Giovanni, Mazzotti Davide, Faist Jerome andDe Natale Paolo, “Direct link of a mid-infrared QCL to a frequency comb by opticalinjection”, Opt. Lett., 37 (2012) 1011.
[169] Mills Andrew A., Gatti Davide, Jiang Jie, Mohr Christian, Mefford Will,
Gianfrani Livio, Fermann Martin E., Hartl Ingmar and Marangoni Marco,“Coherent phase lock of a 9 μm quantum cascade laser to a 2 μm thulium optical frequencycomb”, Opt. Lett., 37 (2012) 4083.
[170] Galli Iacopo, Siciliani de Cumis M., Cappelli Francesco, Bartalini Saverio,
Mazzotti Davide, Borri Simone, Montori A., Akikusa Naota, Yamanishi
Masamichi, Giusfredi Giovanni, Cancio Pablo and De Natale Paolo, “Comb-assisted subkilohertz linewidth quantum cascade laser for high-precision mid-infraredspectroscopy”, Appl. Phys. Lett., 102 (2013) 121117.

190 P. MADDALONI, S. BARTALINI, P. CANCIO, M. DE ROSA, D. MAZZOTTI and P. DE NATALE
[171] Galli Iacopo, Bartalini Saverio, Cancio Pablo, Cappelli Francesco, Giusfredi
Giovanni, Mazzotti Davide, Akikusa Naota, Yamanishi Masamichi, De Natale
Paolo, Pastor Pablo Cancio, Cappelli Francesco, Giusfredi Giovanni,
Mazzotti Davide, Akikusa Naota, Yamanishi Masamichi and De Natale Paolo,“Absolute frequency measurements of CO 2 transitions at 4.3 μm with a comb-referencedquantum cascade laser”, Mol. Phys., 111 (2013) 2041.
[172] Borri Simone, Siciliani de Cumis Mario, Insero Giacomo, Bartalini Saverio,
Cancio Pastor Pablo, Mazzotti Davide, Galli Iacopo, Giusfredi Giovanni,
Santambrogio Gabriele, Savchenkov Anatoliy, Eliyahu Danny, Ilchenko
Vladimir, Akikusa Naota, Matsko Andrey, Maleki Lute and De Natale Paolo,“Tunable Microcavity-Stabilized Quantum Cascade Laser for Mid-IR High-ResolutionSpectroscopy and Sensing”, Sensors, 16 (2016) 238.
[173] Lee Mark, Wanke Michael C., Lerttamrab Maytee, Young Erik W., Grine
Albert D., Reno John L., Siegel Peter H. and Dengler Robert J., “HeterodyneMixing of Terahertz Quantum Cascade Lasers Using a Planar Schottky Diode”, IEEE J.Sel. Topics Quantum Electron., 14 (2008) 370.
[174] Khosropanah P., Baryshev A., Zhang W., Jellema W., Hovenier J. N., Gao
J. R., Klapwijk T. M., Paveliev D. G., Williams Benjamin S., Kumar Sushil, Hu
Qing, Reno J. L., Klein B., Hesler J. L., Pavelyev D. G., Williams Benjamin S.,
Kumar Sushil, Hu Qing, Reno J. L., Klein B. and Hesler J. L., “Phase locking ofa 2.7 THz quantum cascade laser to a microwave reference”, Opt. Lett., 34 (2009) 2958.
[175] Betz A. L., Boreiko R. T., Williams Benjamin S., Kumar Sushil, Hu Qing andReno J. L., “Frequency and phase-lock control of a 3 THz quantum cascade laser”, Opt.Lett., 30 (2005) 1837.
[176] Danylov Andriy A., Goyette Thomas M., Waldman Jerry, Coulombe Michael
J., Gatesman Andrew J., Giles Robert H., Goodhue William D, Qian Xifeng
and Nixon William E., “Frequency stabilization of a single mode terahertz quantumcascade laser to the kilohertz level”, Opt. Express, 17 (2009) 7525.
[177] Rabanus D., Graf U. U., Philipp M., Ricken O., Stutzki J., Vowinkel B.,
Wiedner M. C., Walther Christophe, Fischer M. and Faist Jerome, “Phaselocking of a 1.5 Terahertz quantum cascade laser and use as a local oscillator in aheterodyne HEB receiver”, Opt. Express, 17 (2009) 1159.
[178] Richter H., Pavlov S. G., Semenov A. D., Mahler Lukas, Tredicucci
Alessandro, Beere Harvey E., Ritchie David A. and Hubers Heinz-Wilhelm,“Submegahertz frequency stabilization of a terahertz quantum cascade laser to amolecular absorption line”, Appl. Phys. Lett., 96 (2010) 71112.
[179] Ren Y., Hovenier J. N., Cui M., Hayton D. J., Gao J. R., Klapwijk T. M., Shi
S. C., Kao T.-Y., Hu Qing and Reno J. L., “Frequency locking of single-mode 3.5 THzquantum cascade lasers using a gas cell”, Appl. Phys. Lett., 100 (2012) 041111.
[180] Barbieri Stefano, Gellie Pierre, Santarelli Giorgio, Ding Lu, Maineult
Wilfried, Sirtori Carlo, Colombelli Raffaele, Beere Harvey E. and Ritchie
David A., “Phase-locking of a 2.7 THz quantum cascade laser to a mode-locked erbium-doped fibre laser”, Nat. Photon., 4 (2010) 636.
[181] Loffler Torsten, May Thilo, am Weg Christian, Alcin Ali, Hils Bernd andRoskos Hartmut G., “Continuous-wave terahertz imaging with a hybrid system”, Appl.Phys. Lett., 90 (2007) 91111.
[182] Ravaro Marco, Manquest Christophe, Sirtori Carlo, Barbieri Stefano,
Santarelli Giorgio, Blary K., Lampin Jean-Francois, Khanna Suraj P. andLinfield Edmund H., “Phase-locking of a 2.5 THz quantum cascade laser to a frequencycomb using a GaAs photomixer”, Opt. Lett., 36 (2011) 3969.
[183] Yasui Takeshi, Yokoyama Shuko, Inaba Hajime, Minoshima Kaoru, Nagatsuma
Tadao and Araki Tsutomu, “Terahertz Frequency Metrology Based on FrequencyComb”, IEEE J. Sel. Topics Quantum Electron., 17 (2011) 191.
FRONTIERS OF MOLECULAR GAS SENSING 191
[184] Klatt G., Gebs R., Janke C., Dekorsy T. and Bartels A., “Rapid-scanningterahertz precision spectrometer with more than 6 THz spectral coverage”, Opt. Express,17 (2009) 22847.
[185] Vitiello Miriam Serena, Coquillat Dominique, Viti Leonardo, Ercolani
Daniele, Teppe Frederic, Pitanti Alessandro, Beltram Fabio, Sorba Lucia,
Knap Wojciech and Tredicucci Alessandro, “Room-temperature terahertz detectorsbased on semiconductor nanowire field-effect transistors”, Nano Lett., 12 (2012) 96.
[186] Vitiello Miriam Serena, Viti Leonardo, Romeo Lorenzo, Ercolani Daniele,
Scalari Giacomo, Faist Jerome, Beltram Fabio, Sorba Lucia and Tredicucci
Alessandro, “Semiconductor nanowires for highly sensitive, room-temperaturedetection of terahertz quantum cascade laser emission”, Appl. Phys. Lett., 100 (2012)241101.
[187] Vicarelli L., Vitiello Miriam Serena, Coquillat D., Lombardo A., Ferrari
a. C., Knap W., Polini M., Pellegrini V. and Tredicucci Alessandro, “Graphenefield-effect transistors as room-temperature terahertz detectors”, Nat. Mater., 11 (2012)865.
[188] Gibson G. M., Dunn M. H. and Padgett M. J., “Application of a continuously tunable,cw optical parametric oscillator for high-resolution spectroscopy”, Opt. Lett., 23 (1998)40.
[189] Kovalchuk E. V., Dekorsky D., Lvovsky Alexander, Braxmaier C., Mlynek J.,
Peters A. and Schiller S., “High-resolution Doppler-free molecular spectroscopy witha continuous-wave optical parametric oscillator”, Opt. Lett., 26 (2001) 1430.
[190] Popp A., Muller F., Kuhnemann F., Schiller Stephan, Von Basum Golo,
Dahnke H., Hering P. and Murtz M., “Ultra-sensitive mid-infrared cavity leak-outspectroscopy using a cw optical parametric oscillator”, Appl. Phys. B, 75 (2002) 751.
[191] van Herpen M., te Lintel Hekkert S., Bisson S. E. and Harren F. J. M., “Widesingle-mode tuning of a 3.0–3.8 μm, 700 mW, continuous-wave Nd:YAG-pumped opticalparametric oscillator based on periodically poled lithium niobate”, Opt. Lett., 27 (2002)640.
[192] van Herpen M. M. J. W., Bisson S. E. and Harren F. J. M., “Continuous-wave operation of a single-frequency optical parametric oscillator at 4–5 μm based onperiodically poled LiNbO3”, Opt. Lett., 28 (2003) 2497.
[193] Muller F., Popp A., Kuhnemann F. and Schiller Stephan, “Transportable, highlysensitive photoacoustic spectrometer based on a continuous-wave dual-cavity opticalparametric oscillator”, Opt. Express, 11 (2003) 2820.
[194] von Basum Golo, Halmer Daniel, Hering Peter, Murtz Manfred, Schiller
Stephan, Muller Frank, Popp Alexander and Kuhnemann Frank, “Parts pertrillion sensitivity for ethane in air with an optical parametric oscillator cavity leak-outspectrometer”, Opt. Lett., 29 (2004) 797.
[195] Muller F., Von Basum G., Popp A., Halmer D., Hering P., Murtz M.,
Kuhnemann F. and Schiller Stephan, “Long-term frequency stability and linewidthproperties of continuous-wave pump-resonant optical parametric oscillators”, Appl. Phys.B, 80 (2005) 307.
[196] Lindsay I. D., Adhimoolam B., Gross P., Klein M. E. and Boller Klaus-Jochen
J., “110 GHz rapid, continuous tuning from an optical parametric oscillator pumped bya fiber-amplified DBR diode laser”, Opt. Express, 13 (2005) 1234.
[197] Ngai A. K. Y., Persijn S. T., Von Basum G. and Harren F. J. M., “Automaticallytunable continuous-wave optical parametric oscillator for high-resolution spectroscopyand sensitive trace-gas detection”, Appl. Phys. B, 85 (2006) 173.
[198] Ngai A. K. Y., Persijn S. T., Lindsay I. D., Kosterev A. A., Gross P., Lee C. J.,
Cristescu S. M., Tittel F. K., Boller Klaus-Jochen J. and Harren F. J. M.,“Continuous wave optical parametric oscillator for quartz-enhanced photoacoustic tracegas sensing”, Appl. Phys. B, 89 (2007) 123.

192 P. MADDALONI, S. BARTALINI, P. CANCIO, M. DE ROSA, D. MAZZOTTI and P. DE NATALE
[199] Ikegami T. and Inaba H., “Atomic and molecular spectroscopy with a continuous-wave,doubly resonant, monolithic optical parametric oscillator”, Opt. Commun., 269 (2007)188.
[200] Arslanov Denis D., Cristescu Simona M. and Harren Frans J. M., “Opticalparametric oscillator based off-axis integrated cavity output spectroscopy for rapidchemical sensing”, Opt. Lett., 35 (2010) 3300.
[201] Persijn S., Harren F. and Veen A., “Quantitative gas measurements using aversatile OPO-based cavity ringdown spectrometer and the comparison with spectroscopicdatabases”, Appl. Phys. B, 100 (2010) 383.
[202] Arslanov D. D., Spunei M., Ngai A. K. Y., Cristescu S. M., Lindsay I. D.,
Persijn S. T., Boller Klaus-Jochen and Harren F. J. M., “Rapid and sensitivetrace gas detection with continuous wave Optical Parametric Oscillator-based WavelengthModulation Spectroscopy”, Appl. Phys. B, 103 (2011) 223.
[203] Krieg J., Klemann A., Gottbehut I., Thorwirth S., Giesen T. F. and Schlemmer
S., “A continuous-wave optical parametric oscillator around 5 μm wavelength for high-resolution spectroscopy”, Rev. Sci. Instrum., 82 (2011) 063105.
[204] Chen Hsuan-Chen, Hsiao Chung-Yun, Ting Wei-Jo, Lin Shou-Tai and Shy Jow-
Tsong, “Saturation spectroscopy of CO2 and frequency stabilization of an opticalparametric oscillator at 2.77 μm”, Opt. Lett., 37 (2012) 2409.
[205] Stothard D. J. M., Dunn M. H. and Rae C. F., “Hyperspectral imaging of gaseswith a continuous-wave pump-enhanced optical parametric oscillator”, Opt. Express, 12(2004) 947.
[206] Petelski T., Conroy R. S., Bencheikh K., Mlynek Jurgen and Schiller Stephan,“All-solid-state, tunable, single-frequency source of yellow light for high-resolutionspectroscopy”, Opt. Lett., 26 (2001) 1013.
[207] van Herpen M. M. J. W., Bisson S. E., Ngai A. K. Y. and Harren F. J. M.,“Combined wide pump tuning and high power of a continuous-wave, singly resonantoptical parametric oscillator”, Appl. Phys. B, 78 (2004) 281.
[208] Inaba Hajime, Daimon Yuta, Hong Feng-Lei, Onae Atsushi, Minoshima Kaoru,
Schibli Thomas R., Matsumoto Hirokazu, Hirano Masaaki, Okuno Toshiaki,
Onishi Masashi and Nakazawa Masataka, “Long-term measurement of opticalfrequencies using a simple, robust and low-noise fiber based frequency comb”, Opt.Express, 14 (2006) 5223.
[209] Hecker A., Havenith M., Braxmaier C., Stroßner U. and Peters A., “Highresolution Doppler-free spectroscopy of molecular iodine using a continuous wave opticalparametric oscillator”, Opt. Commun., 218 (2003) 131.
[210] Mickelson P. G., Martinez de Escobar Y. N., Anzel P., De Salvo B. J., Nagel
S. B., Traverso A. J., Yan M. and Killian T. C., “Repumping and spectroscopy oflaser-cooled Sr atoms using the (5s5p)3P2-(5s4d)3D2 transition”, J. Phys. B, 42 (2009)235001.
[211] Vainio Markku, Siltanen Mikael, Peltola Jari and Halonen L., “Grating-cavity continuous-wave optical parametric oscillators for high-resolution mid-infraredspectroscopy”, Appl. Opt., 50 (2011) A1.
[212] Townes Charles H. and Schawlow Arthur L., Microwave Spectroscopy (Dover, NewYork) 1975.
[213] Paso R., Horneman V. M. and Anttila R., “Analysis of the ν1 band of CH3I”, J.Mol. Spectrosc., 101 (1983) 193.
[214] Bartalini Saverio, Consolino Luigi, Cancio P., De Natale P., Bartolini P.,
Taschin A., De Pas M., Beere H., Ritchie D., Vitiello Miriam Serena and Torre
R., “Frequency-Comb-Assisted Terahertz Quantum Cascade Laser Spectroscopy”, Phys.Rev. X, 4 (2014) 21006.
[215] Askarian G. A., “Cherenkov and transition radiation from electromagnetic waves”, Sov.Phys. JETP, 42 (1962) 1360.

FRONTIERS OF MOLECULAR GAS SENSING 193
[216] Bodrov S. B., Stepanov A. N., Bakunov M. I., Shishkin B. V., Ilyakov I. E. andAkhmedzhanov R. A., “Highly efficient optical-to-terahertz conversion in a sandwichstructure with LiNbO 3 core”, Opt. Express, 17 (2009) 1871.
[217] Consolino Luigi, Campa Annamaria, Ravaro Marco, Mazzotti Davide, Vitiello
Miriam Serena, Bartalini Saverio, De Natale P. and De Natale P., “Saturatedabsorption in a rotational molecular transition at 2.5 THz using a quantum cascade laser”,Appl. Phys. Lett., 106 (2015) 021108.
[218] Galli Iacopo, Bartalini Saverio, Ballerini Riccardo, Barucci Marco, Cancio
Pablo, De Pas Marco, Giusfredi Giovanni, Mazzotti Davide, Akikusa Naota
and De Natale Paolo, “Spectroscopic detection of radiocarbon dioxide at parts-per-quadrillion sensitivity”, Optica, 3 (2016) 385.
[219] Rothman L. S., Gordon I. E., Babikov Y., Barbe A., Chris Benner D., Bernath
P. F., Birk M., Bizzocchi L., Boudon V., Brown L. R., Campargue A., Chance
K., Cohen E. A., Coudert L. H., Devi V. M., Drouin B. J., Fayt A., Flaud
J.-M., Gamache R. R., Harrison J. J., Hartmann J.-M., Hill C., Hodges J. T.,
Jacquemart D., Jolly A., Lamouroux J., Le Roy R. J., Li G., Long D. A., Lyulin
O. M., Mackie C. J., Massie S. T., Mikhailenko S., Muller H. S. P., Naumenko
O. V., Nikitin A. V., Orphal J., Perevalov V., Perrin A., Polovtseva E. R.,
Richard C., Smith M. A. H., Starikova E., Sung K., Tashkun S., Tennyson
J., Toon G. C., Tyuterev V. G. and Wagner G., “The HITRAN2012 molecularspectroscopic database”, J. Quantum Spectrosc. Radiat. Transf., 130 (2013) 4.
[220] Harvard-Smithsonian Center for Astrophysics (CfA), Zuev V. E. Insitute of AtmospericOptics (IAO). HITRAN on the Web, 2016.
[221] Hill C., Gordon I. E., Kochanov R. V., Barrett L., Wilzewski J. S. andRothman L. S., “HITRANonline: an online interface and the flexible representationof spectroscopic data in the HITRAN database”, J. Quantum Spectrosc. Radiat. Transf.,177 (2016) 4.
[222] Long D. A., Fleisher A. J., Liu Q. and Hodges J. T., “Ultra-sensitive cavity ring-down spectroscopy in the mid-infrared spectral region”, Opt. Lett., 41 (2016) 1612.
[223] Silander I., Hausmaninger T., Ma W., Ehlers P. and Axner O., “Doppler-broadened noise-immune cavity-enhanced optical heterodyne molecular spectrometrydown to 4 × 10⁻¹³ cm−1 Hz−1/2: implementation of a 50,000 finesse cavity”, Opt. Lett.,40 (2015) 2004.
[224] Lee B., Wood E., Zahniser M., McManus J., Nelson D., Herndon S., Santoni
G., Wofsy S. and Munger J., “Simultaneous measurements of atmospheric HONO andNO2 via absorption spectroscopy using tunable mid-infrared continuous-wave quantumcascade lasers”, Appl. Phys. B, 102 (2011) 417.
[225] Halmer D., von Basum G., Hering P. and Murtz M., “Mid-infrared cavity leak-outspectroscopy for ultrasensitive detection of carbonyl sulfide”, Opt. Lett., 30 (2005) 2314.
[226] Moyer E. J., Sayres D. S., Engel G. S., St. Clair J. M., Keutsch F. N., Allen
N. T., Kroll J. H. and Anderson J. G., “Design considerations in high-sensitivityoff-axis integrated cavity output spectroscopy”, Appl. Phys. B, 92 (2008) 467.
[227] Gorrotxategi-Carbajo P., Fasci E., Ventrillard I., Carras M., Maisons G.
and Romanini D., “Optical-feedback cavity-enhanced absorption spectroscopy with aquantum-cascade laser yields the lowest formaldehyde detection limit”, Appl. Phys. B,110 (2013) 309.
[228] Sowa M., Murtz M. and Hering P., “Mid-infrared laser spectroscopy for online analysisof exhaled CO”, J. Breath Res., 4 (2010) 047101.
[229] Craig I. M., Cannon B. D., Taubman M. S., Bernacki B. E., Stahl R. D.,
Schiffern J. T., Myers T. L. and Phillips M. C., “Sensing of gaseous HF at low part-per-trillion levels using a tunable 2.5 μm diode laser spectrometer operating at ambientpressure”, Appl. Phys. B, 120 (2015) 505.
[230] McManus J. B., Shorter J. H., Nelson D. D., Zahniser M. S., Glenn D. E. andMcGovern R. M., “Pulsed quantum cascade laser instrument with compact design forrapid, high sensitivity measurements of trace gases in air”, Appl. Phys. B, 92 (2008) 387.

194 P. MADDALONI, S. BARTALINI, P. CANCIO, M. DE ROSA, D. MAZZOTTI and P. DE NATALE
[231] Arslanov D. D., Cristescu S. M. and Harren F. J. M., “Optical parametric oscillatorbased off-axis integrated cavity output spectroscopy for rapid chemical sensing”, Opt.Lett., 35 (2010) 3300.
[232] Heinrich K., Fritsch T., Hering P. and Murtz M., “Infrared laser-spectroscopicanalysis of 14NO and 15NO in human breath”, Appl. Phys. B, 95 (2009) 281.
[233] Lang N., Macherius U., Wiese M., Zimmermann H., Ropcke J. and van Helden
J. H., “Sensitive CH4 detection applying quantum cascade laser based optical feedbackcavity-enhanced absorption spectroscopy”, Opt. Express, 24 (2016) A536.
[234] Spagnolo V., Patimisco P., Borri S., Scamarcio G., Bernacki B. E. andKriesel J., “Part-per-trillion level SF6 detection using a quartz enhanced photoacousticspectroscopy-based sensor with single-mode fiber-coupled quantum cascade laserexcitation”, Opt. Lett., 37 (2012) 4461.
[235] Nagele M. and Sigrist M. W., “Mobile laser spectrometer with novel resonantmultipass photoacoustic cell for trace-gas sensing”, Appl. Phys. B, 70 (2000) 895.
[236] O’Keefe A. and Deacon D. A. G., “Cavity ring-down optical spectrometer forabsorption measurements using pulsed laser sources”, Rev. Sci. Instrum., 59 (1988) 2544.
[237] Romanini D. and Lehmann K. K., “Ring-down cavity absorption spectroscopy of thevery weak HCN overtone bands with six, seven and eight stretching quanta”, J. Chem.Phys., 99 (1993) 6287.
[238] Zalicki P. and Zare R. N., “Cavity ring-down spectroscopy for quantitative absorptionmeasurements”, J. Chem. Phys., 102 (1995) 2708.
[239] Romanini Daniele and Lehmann Kevin K., “Cavity ring-down overtone spectroscopyof HCN, H13CN and HC15n”, J. Chem. Phys., 102 (1995) 633.
[240] Scherer J. J., Voelkel D., Rakestraw D. J., Paul J. B., Collier C. P., Saykally
R. J. and O’Keefe A., “Infrared cavity ringdown laser absorption spectroscopy (IR-CRLAS)”, Chem. Phys. Lett., 245 (1995) 273.
[241] van Zee R. D., Hodges J. T. and Looney J. P., “Pulsed, single-mode cavity ringdownspectroscopy”, Appl. Opt., 38 (1999) 3951.
[242] Engeln R., von Helden G., Berden G. and Meijer G., “Phase shift cavity ring downabsorption spectroscopy”, Chem. Phys. Lett., 262 (1996) 105.
[243] Tong Z., Wright A., McCormick T., Li R., Oleschuk R. D. and Loock H.-P.,“Phase-shift fiber-loop ring-down spectroscopy”, Anal. Chem., 76 (2004) 6594.
[244] Grilli R., Ciaffoni L. and Orr-Ewing A. J., “Phase-shift cavity ring-downspectroscopy using mid-IR light from a difference frequency generation PPLN waveguide”,Opt. Lett., 35 (2010) 1383.
[245] Romanini D., Kachanov A. A., Sadeghi N. and Stoeckel F., “CW cavity ring downspectroscopy”, Chem. Phys. Lett., 264 (1997) 316.
[246] Romanini D., Kachanov A. A. and Stoeckel F., “Diode laser cavity ring downspectroscopy”, Chem. Phys. Lett., 270 (1997) 538.
[247] Romanini D., Kachanov A. A. and Stoeckel F., “Cavity ringdown spectroscopy:broad band absolute absorption measurements”, Chem. Phys. Lett., 270 (1997) 546.
[248] Levenson M. D., Paldus B. A., Spence T. G., Harb C. C., Harris J. S., Jr. andZare R. N., “Optical heterodyne detection in cavity ring-down spectroscopy”, Chem.Phys. Lett., 290 (1998) 335.
[249] Paldus B. A., Harb C. C., Spence T. G., Wilke B., Xie J., Harris J. S. and Zare
R. N., “Cavity-locked ring-down spectroscopy”, J. Appl. Phys., 83 (1998) 3991.[250] Levenson M. D., Paldus B. A., Spence T. G., Harb C. C., Zare R. N., Lawrence
M. J. and Byer R. L., “Frequency-switched heterodyne cavity ring-down spectroscopy”,Opt. Lett., 25 (2000) 920.
[251] Ye J. and Hall J. L., “Cavity ring-down heterodyne spectroscopy: High sensitivity withmicrowatt light power”, Phys. Rev. A, 61 (2000) 061802.
[252] Ye J., Ma L.-S. and Hall J. L., “Ultrasensitive detections in atomic and molecularphysics: demonstration in molecular overtone spectroscopy”, J. Opt. Soc. Am. B, 15(1998) 6.

FRONTIERS OF MOLECULAR GAS SENSING 195
[253] Long-Sheng Ma, Jun Ye, Pierre Dube and John L. Hall, “Ultrasensitive frequency-modulation spectroscopy enhanced by a high-finesse optical cavity: theory and applicationto overtone transitions of C2H2 and C2HD”, J. Opt. Soc. Am. B, 16 (1999) 2255.
[254] Lehr L. and Hering P., “Quantitative nonlinear spectroscopy: a direct comparison ofdegenerate four-wave mixing with cavity ring-down spectroscopy applied to NaH”, IEEEJ. Quantum Electron., 33 (1997) 1465.
[255] Labazan I, Rudic S. and Milosevic S., “Nonlinear effects in pulsed cavity ringdownspectroscopy of lithium vapour”, Chem. Phys. Lett., 320 (2000) 613.
[256] Lisak D. and Hodges J. T., “High-resolution cavity ring-down spectroscopymeasurements of blended H2O transitions”, Appl. Phys. B, 88 (2007) 317.
[257] Bucher C. R., Lehmann K. K., Plusquellic D. F. and Fraser G. T., “Doppler-free nonlinear absorption in ethylene by use of continuous-wave cavity ringdownspectroscopy”, Appl. Opt., 39 (2000) 3154.
[258] Romanini D., Dupre P. and Jost R., “Non-linear effects by continuous wave cavityringdown spectroscopy in jet-cooled NO2”, Vib. Spectrosc., 19 (1999) 93.
[259] Lee J. Y. and Hahn J. W., “Theoretical analysis on the dynamic absorption saturationin pulsed cavity ringdown spectroscopy”, Appl. Phys. B, 79 (2004) 653.
[260] Brown S. S., Stark H. and Ravishankara A. R., “Cavity ring-down spectroscopy foratmospheric trace gas detection: application to the nitrate radical (NO3)”, Appl. Phys.B, 75 (2002) 173.
[261] Schirber M., “Focus: carbon dating with lasers”, Physics, 4 (2011) 111.[262] Zare R. N., “Analytical chemistry: ultrasensitive radiocarbon detection”, Nature, 482
(2012) 312.[263] Blau S. K., “A new suitor in the carbon-14 dating game”, Phys. Today, 65, N. 2 (2012)
20.[264] Mazzotti D., Bartalini S., Borri S., Cancio P., Galli I., Giusfredi G. and De
Natale P., “All-optical radiocarbon dating”, Opt. Photon. News, 23 (2012) 52.[265] Wilson R. M., “Smaller, faster, cheaper detection of radiocarbon”, Phys. Today, 69,
N. 6 (2016) 19.[266] Galli I., Bartalini S., Cancio P., De Natale P., Mazzotti D., Giusfredi G.,
Fedi M. E. and Mando P. A., “Optical detection of radiocarbon dioxide: first resultsand AMS intercomparison”, Radiocarbon, 55 (2013) 213.
[267] Giusfredi G., Galli I., Mazzotti D., Cancio P. and De Natale P., “Theory ofsaturated-absorption cavity ring-down: radiocarbon dioxide detection, a case study”, J.Opt. Soc. Am. B, 32 (2015) 2223.
[268] Polyansky O. L., Bielska K., Ghysels M., Lodi L., Zobov N. F., Hodges J. T.
and Tennyson J., “High-accuracy CO2 line intensities determined from theory andexperiment”, Phys. Rev. Lett., 114 (2015) 243001.
[269] Tennyson J., personal communication, 2015.[270] Fleisher A. J., Long D. A., Liu Q. and Hodges J. T., “Precision interferometric
measurements of mirror birefringence in high-finesse optical resonators”, Phys. Rev. A,93 (2016) 013833.
[271] Cole G. D., Zhang W., Martin M. J., Ye J. and Aspelmeyer M., “Tenfold reductionof Brownian noise in high-reflectivity optical coatings”, Nat. Photon., 7 (2013) 644.
[272] Cole G. D., Zhang W., Bjork B. J., Follman D., Heu P., Deutsch C.,
Sonderhouse L., Robinson J., Franz C., Alexandrovski A., Notcutt M., Heckl
O. H., Ye J. and Aspelmeyer M., “High-performance near- and mid-infrared crystallinecoatings”, Optica, 3 (2016) 647.
[273] Scoles G., Bassi D., Buck U. and Laine D. C. (Editors), Atomic and MolecularBeam Methods, Vol. 1 (Oxford University Press) 1988.
[274] Scoles G., Laine D. C. and Valbusa U. (Editors), Atomic and Molecular BeamMethods, Vol. 2 (Oxford University Press) 1992.
[275] Demtroder, Laser Spectroscopy, Volume 2, Experimental techniques, fourth edition(Springer) 2008.

196 P. MADDALONI, S. BARTALINI, P. CANCIO, M. DE ROSA, D. MAZZOTTI and P. DE NATALE
[276] Maxwell S. E., Brahms N., deCarvalho R., Glenn D. R., Helton J. S., Nguyen
S. V., Patterson D., Petricka J., DeMille D. and Doyle J. M., “High-flux beamsource for cold, slow atoms or molecules”, Phys. Rev. Lett., 95 (2005) 173201.
[277] Sommer C., van Buuren L. D., Motsch M., Pohle S., Bayerl J., Pinkse P. W. H.
and Rempe G., “Continuous guided beams of slow and internally cold polar molecules”,Faraday Discussions, 142 (2009) 203.
[278] Hutzler N. R., Lu H.-I. and Doyle J. M., “The buffer gas beam: an intense, cold andslow source for atoms and molecules”, Chem. Rev., 112 (2012) 4803.
[279] Bulleid N. E., Skoff S. M., Hendricks R. J., Sauer B. E., Hinds E. A. and Tarbut
M. R., “Characterization of a cryogenic beam source for atoms and molecules”, Phys.Chem. Chem. Phys., 15 (2013) 12299.
[280] Bethlem H. L., Berden G. and Meijer G., “Decelerating neutral dipolar molecules”,Phys. Rev. Lett., 83 (1999) 1558.
[281] van de Meerakker S. Y. T., Bethlem H. L. and Meijer G., “Taming molecularbeams”, Nat. Phys., 4 (2008) 595.
[282] van de Meerakker S. Y. T., Bethlem H. L., Vanhaecke N. and Meijer G.,“Manipulation and control of molecular beams”, Chem. Rev., 112 (2012) 4828.
[283] Wiederkehr A. W., Schmutz H., Motsch M. and Merkt F., “Velocity-tunable slowbeams of cold O2 in a single spin-rovibronic state with full angular-momentum orientationby multistage zeeman deceleration”, Mol. Phys., 110 (2012) 1807.
[284] Motsch M., Jansen P., Agner J. A., Schmutz H. and Merkt F., “Slow and velocity-tunable beams of metastable He2 by multistage zeeman deceleration”, Phys. Rev. A, 89(2014) 043420.
[285] Jansen P., Semeria L. and Merkt F., “High-resolution spectroscopy of He+2 using
rydberg-series extrapolation and zeeman-deceleration supersonic beams of metastableHe2”, J. Mol. Spectros., 322 (2016) 9.
[286] Stuhl B. K., Hummon M. T. and Ye J., “Cold state-selected molecular collisions andreactions”, Annu. Rev. Phys. Chem., 65 (2014) 501.
[287] Softley T. and Bell M., “Ultracold molecules and ultracold chemistry”, Mol. Phys.,107 (2009) 99.
[288] Sassmannshausen H., Merkt F. and Deiglmayr J., “Experimental characterizationof singlet scattering channels in long-range Rydberg molecules”, Phys. Rev. Lett., 114(2015) 133201.
[289] Zeppenfeld M., Englert B. G. U., Glockner R., Prehn A., Mielenz M., Sommer
C., van Buuren L. D., Motsch M. and Rempe G., “Sisyphus cooling of electricallytrapped polyatomic molecules”, Nature, 491 (2012) 570.
[290] Prehn A., Ibrugger M., Glockner R., Rempe G. and Zeppenfeld M.,“Optoelectrical cooling of polar molecules to submillikelvin temperatures”, Phys. Rev.Lett., 116 (2016) 063005.
[291] Shuman E. S., Barry J. F. and DeMille D., “Laser cooling of a diatomic molecule”,Nature, 467 (2010) 820.
[292] Isaev T. A. and Berger R., “Polyatomic candidates for cooling of molecules with lasersfrom simple theoretical concepts”, Phys. Rev. Lett., 116 (2016) 063006.
[293] Hummon M. T., Yeo M., Stuhl B. K., Collopy A. L., Xia Y. and Ye J., “2Dmagneto-optical trapping of diatomic molecules”, Phys. Rev. Lett., 110 (2013) 143001.
[294] Norrgard E. B., McCarron D. J., Steinecker M. H., Tarbutt M. R. andDeMille D., “Submillikelvin dipolar molecules in a radio-frequency magneto-opticaltrap”, Phys. Rev. Lett., 116 (2016) 063004.
[295] Carr L. D., DeMille D., Krems R. V. and Ye J., “Cold and ultracold molecules:science, technology and applications”, New J. Phys., 11 (2009) 055049.
[296] Tokunaga S. K., Stoeffler C., Auguste F., Shelkovnikov A., Daussy C., Amy-
Klein A., Chardonnet C. and Darquie B., “Probing weak force-induced parityviolation by high-resolution mid-infrared molecular spectroscopy”, Mol. Phys., 111 (2013)2363.

FRONTIERS OF MOLECULAR GAS SENSING 197
[297] Stoll M., Bakker J. M., Steimle T. C., Meijer G. and Peters A., “Cryogenicbuffer-gas loading and magnetic trapping of CrH and MnH molecules”, Phys. Rev. A, 78(2008) 032707.
[298] Yeo M., Hummon M. T., Collopy A. L., Yan B., Hemmerling B., Chae E.,
Doyle J. M. and Ye J., “Rotational state microwave mixing for laser cooling of complexdiatomic molecules”, Phys. Rev. Lett., 114 (2015) 223003.
[299] Barry J. F., Shuman E. S. and DeMille D., “A bright, slow cryogenic molecular beamsource for free radicals”, Phys. Chem. Chem. Phys., 13 (2011) 18936.
[300] Patterson D., Rasmussen J. and Doyle J. M., “Intense atomic and molecular beamsvia neon buffer-gas cooling”, New J. Phys., 11 (2009) 055018.
[301] Spaun B., Bryan Changala P., Patterson D., Bjork B. J., Heckl O. H., Doyle
J. M. and Ye J., “Continuous probe of cold complex molecules with infrared frequencycomb spectroscopy”, Nature, 533 (2016) 517.
[302] Herman M., “The acetylene ground state saga”, Mol. Phys., 105 (2007) 2217.[303] Amyay B., Herman M., Fayt A., Campargue A. and Kassi S., “Acetylene, 12C2H2:
refined analysis of crds spectra around 1.52 microns”, J. Mol. Spectros., 267 (2011) 116.[304] Amyay B., Fayt A., Herman M. and Vander Auwera J., “Vibration-rotation
spectroscopic database on acetylene, x1σ+g (12C2H2)”, J. Phys. Chem. Ref. Data, 45
(2016) 023103.[305] Santamaria L., Di Sarno V., Ricciardi I., De Rosa M., Mosca S., Santambrogio
G., Maddaloni P. and De Natale P., “Low-temperature spectroscopy of the 12C2H2
(ν1 + ν3) band in a helium buffer gas”, Astrophys. J., 801 (2015) 50.[306] Santamaria L., Di Sarno V., De Natale P., De Rosa M., Inguscio M., Mosca S.,
Ricciardi I., Calonico D., Levi F. and Maddaloni P., “Comb-assisted cavity ring-down spectroscopy of a buffer-gas-cooled molecular beam”, Phys. Chem. Chem. Phys.,300 (2016) 116.
[307] Rothman L. S., Rinsland C. P., Goldman A., Massie S. T., Edwards D. P.,
Flaud J.-M., Perrin A., Camy-Peyret C., Dana C., Mandin J.-Y., Schroeder
J., McCann A., Gamache R. R., Wattson R. B., Yoshino K., Chance K. V.,
Jucks K. W., Brown L. R., Nemtchinov V. and Varanasi P., “The HITRANmolecular spectroscopic database and HAWKS (HITRAN Atmospheric Workstation):1996 edition”, J. Quant. Spectrosc. Radiat. Transf., 60 (1998) 665.
[308] Romanini D., Ventrillard I., Mejean G. and Kerstel E., Cavity-EnhancedSpectroscopy and Sensing, Vol. 179 of Springer Series in Optical Sciences, chapterIntroduction to Cavity Enhanced Absorption Spectroscopy (Springer-Verlag BerlinHeidelberg) 2014.
[309] Maddaloni P., Malara P., De Tommasi E., De Rosa M., Ricciardi I., Gagliardi
G., Tamassia F., Di Lonardo G. and De Natale P., “Absolute measurement of theS(0) and S(1) lines in the electric quadrupole fundamental band of D2 around 3 μm”, J.Chem. Phys., 133 (2010) 154317.
[310] Berden G., Peeters R. and Meijer G., “Cavity ring-down spectroscopy: Experimentalschemes and applications”, Int. Rev. Phys. Chem., 19 (2000) 565.
[311] Orzel C., “Searching for new physics through atomic, molecular and optical precisionmeasurements”, Phys. Scr., 86 (2012) 068101.
[312] Ludlow A. L., Boyd M. M., Ye J., Peik E. and Schmidt P. O., “Optical atomicclocks”, Rev. Mod. Phys., 87 (2015) 637.
[313] Calonico D., Bertacco E. K., Calosso C. E., Clivati C., Costanzo G. A.,
Frittelli M., Godone A., Mura A., Poli N., Sutyrin D. V., Tino G. M., Zucco
M. E. and Levi F., “High-accuracy coherent optical frequency transfer over a doubled642 km fiber link”, Appl. Phys. B: Lasers and Optics, 117 (2014) 979.