
The PROMOTE UV Record: Toward a Global Satellite-Based Climatology of Surface Ultraviolet Irradiance
Upload
independentCategory
view
3download
0
Melanopsin Contributions to Irradiance Coding in theThalamo-Cortical Visual SystemTimothy M. Brown1, Carlos Gias2, Megumi Hatori3, Sheena R. Keding3, Ma’ayan Semo2, Peter J. Coffey2,
John Gigg1, Hugh D. Piggins1, Satchidananda Panda3*, Robert J. Lucas1*
1 Faculty of Life Sciences, University of Manchester, Manchester, United Kingdom, 2 Institute of Ophthalmology, University College London, London, United Kingdom,
3 The Salk Institute for Biological Studies, La Jolla, California, United States of America
Abstract
Photoreception in the mammalian retina is not restricted to rods and cones but extends to a subset of retinal ganglion cellsexpressing the photopigment melanopsin (mRGCs). These mRGCs are known to drive such reflex light responses ascircadian photoentrainment and pupillomotor movements. By contrast, until now there has been no direct assessment oftheir contribution to conventional visual pathways. Here, we address this deficit. Using new reporter lines, we show thatmRGC projections are much more extensive than previously thought and extend across the dorsal lateral geniculate nucleus(dLGN), origin of thalamo-cortical projection neurons. We continue to show that this input supports extensive physiologicallight responses in the dLGN and visual cortex in mice lacking rods+cones (a model of advanced retinal degeneration).Moreover, using chromatic stimuli to isolate melanopsin-derived responses in mice with an intact visual system, we revealstrong melanopsin input to the ,40% of neurons in the LGN that show sustained activation to a light step. We demonstratethat this melanopsin input supports irradiance-dependent increases in the firing rate of these neurons. The implication thatmelanopsin is required to accurately encode stimulus irradiance is confirmed using melanopsin knockout mice. Our dataestablish melanopsin-based photoreception as a significant source of sensory input to the thalamo-cortical visual system,providing unique irradiance information and allowing visual responses to be retained even in the absence of rods+cones.These findings identify mRGCs as a potential origin for aspects of visual perception and indicate that they may supportvision in people suffering retinal degeneration.
Citation: Brown TM, Gias C, Hatori M, Keding SR, Semo M, et al. (2010) Melanopsin Contributions to Irradiance Coding in the Thalamo-Cortical Visual System. PLoSBiol 8(12): e1000558. doi:10.1371/journal.pbio.1000558
Academic Editor: Fred Rieke, University of Washington, United States of America
Received May 26, 2010; Accepted October 27, 2010; Published December 7, 2010
Copyright: � 2010 Brown et al. This is an open-access article distributed under the terms of the Creative Commons Attribution License, which permitsunrestricted use, distribution, and reproduction in any medium, provided the original author and source are credited.
Funding: This work was funded by grants from the Wellcome Trust (RJL and HDP), National Institutes of Health grant EY016807, Dana Foundation grant and PewScholar award to SP, JSPS Fellowship to MH, and was supported in part by the London Project to Cure Blindness. The funders had no role in study design, datacollection and analysis, decision to publish, or preparation of the manuscript.
Competing Interests: The authors have declared that no competing interests exist.
Abbreviations: AP, alkaline phosphatase; dLGN, dorsal lateral geniculate nuclei; IGL, Intergeniculate leaflet; mRGC, melanopsin-expressing retinal ganglion cell;OPN, Olivary pretectal nuclei; RSD, retrosplenial dysgranular cortex; SC, superior colliculus; SCN, suprachiasmatic nuclei.
* E-mail: [email protected] (SP); [email protected] (RJL)
Introduction
Until 10 years ago it was considered self-evident that all aspects
of mammalian vision originate with light detection by either rods
or cones. This view has changed with the discovery of a 3rd
photoreceptor class [1]—the so-called melanopsin retinal ganglion
cells (mRGCs). These mRGCs are able to respond to light even in
complete isolation thanks to the presence of melanopsin, an opsin-
based photopigment.
Until now, the discovery of mRGCs has had the most impact on
our understanding of such sub-cortical light responses as circadian
entrainment and the pupil light reflex. We now know that mRGCs
integrate input from the outer retina with their own intrinsic light
response to encode ambient light intensity (irradiance or
illuminance) for these and other reflex responses [2–11]. By
contrast, there has been little consideration of melanopsin’s
potential to contribute to the physiology or function of con-
ventional visual pathways and little effort to incorporate these
newly discovered photoreceptors into models of visual perception.
This omission has reflected the balance of published evidence that
mRGC axons are largely segregated from the thalamo-cortical visual
pathway. Thus, while Dacey et al. reported back-labeling mRGCs
from the primate visual thalamus [12], more extensive analysis of the
mRGC projection pattern in rodents [13–15] suggested that their
input to this part of the brain was almost exclusively restricted to the
ventral LGN and intergeniculate leaflet, rather than the dLGN which
is the site of thalamo-cortical projection neurons.
It has since become clear, however, that the Opn4tauLacZ
transgenic reporter line employed in the most comprehensive of
those rodent studies has incomplete penetrance and labels only
around 50% of melanopsin-expressing retinal ganglion cells
[11,13,16–17]. The successfully labeled neurons represent a
distinct anatomical subtype (called M1) whose dendrites are
restricted to the outer sub-lamina of the inner plexiform layer. The
projection pattern of the remaining mRGC classes (which have
dendrites in the inner sublamina) has only been very recently
addressed [18]. There is thus renewed uncertainty regarding the
degree to which mRGCs influence the dLGN and whether they
could make a direct contribution to aspects of conventional vision.
Here, we employ a Cre-recombinase based reporter line to trace
the projection pattern of the full mRGC population. This reveals a
substantial innervation of the dLGN. We continue to assess the
PLoS Biology | www.plosbiology.org 1 December 2010 | Volume 8 | Issue 12 | e1000558

physiological consequences of this anatomical organization using
multichannel extracellular electrophysiology and brain imaging in
the visual thalamus and cortex. These experiments reveal an
essential role for mRGCs in encoding irradiance for the central
pathways of conventional vision.
Results
mRGCs Innervate All Major Retinorecipient RegionsTo comprehensively label the mRGCs and their central
projections we crossed mice in which a Cre-recombinase transgene
was knocked into the melanopsin locus (Opn4Cre/Cre [11]) with
suitable reporter lines: Z/AP or Z/EG [19,20]. In this strategy,
appearance of the reporter protein (human alkaline phosphatase
(AP) or green fluorescent protein) is dependent on the expression
of Cre from the native melanopsin promoter. Importantly,
however, reporter gene expression is independent of heterogeneity
in activity of the native melanopsin promoter because it is driven
by a ubiquitous b-actin promoter. This approach therefore has the
potential to achieve a more complete coverage of the mRGC
population than possible with the established Opn4tauLacZ reporter
line [13]. We found that, indeed, .1,500 retinal ganglion cells per
retina were labeled in these Cre-recombinase-based lines
(Figure 1A,B). This is equivalent to the number of cells
immunopositive for melanopsin but around twice the number
detected in Opn4tauLacZ mice [13,16]. Indeed, the appearance of
reporter protein in both outer and inner sublaminae of the inner
plexiform layer indicated that not only M1 but also other mRGC
classes had been labeled (Figure 1C). Accordingly, 90% of GFP
expressing cells in our Z/EG reporter line retina were also labeled
by an antibody raised against the N-terminus of melanopsin,
confirming that these cells were mRGCs (Figure S1). The
remaining GFP-positive soma were restricted to the ganglion cell
layer and proximal zone of the inner nuclear layer and presumably
either reflect cells with very low melanopsin expression or cells that
transiently expressed melanopsin during development.
We then used the Opn4Cre;Z/AP mice to trace the axonal
projections of the labeled mRGCs (Figure 1D–F and Figure S2).
The observed projection pattern was similar to that reported very
recently using a similar strategy [18] and much more extensive
than originally described [13]. AP positive axons could be traced
along the optic nerve/tract and targeted not only nuclei
responsible for reflex light responses (the SCN, IGL, and OPN)
but also those implicated in pattern vision. Thus, significant
contralateral projections of the mRGCs were observed in both
ventral and dorsal aspects of the LGN and (to a lesser extent) in the
superior colliculus (SC).
Widespread Thalamo-Cortical Activation in Mice LackingRods and Cones
mRGCs survive rod and cone loss to drive reflex light responses
in advanced retinal degeneration. To determine whether they
could also activate the thalamo-cortical visual projection respon-
sible for visual perception under these circumstances, we set out to
record light responses in mice lacking all rods and cones (rd/rd cl).
These animals show complete rod and cone degeneration [21–23]
but intact melanopsin signaling and have retinal ganglion cells
with normal projection patterns (Figure S3). Using multichannel,
multiunit recordings we surveyed light responses to a stimulus
designed to activate melanopsin (60 s, 460 nm, 8.361014 pho-
tons/cm2/s) in the contralateral visual thalamus of this genotype
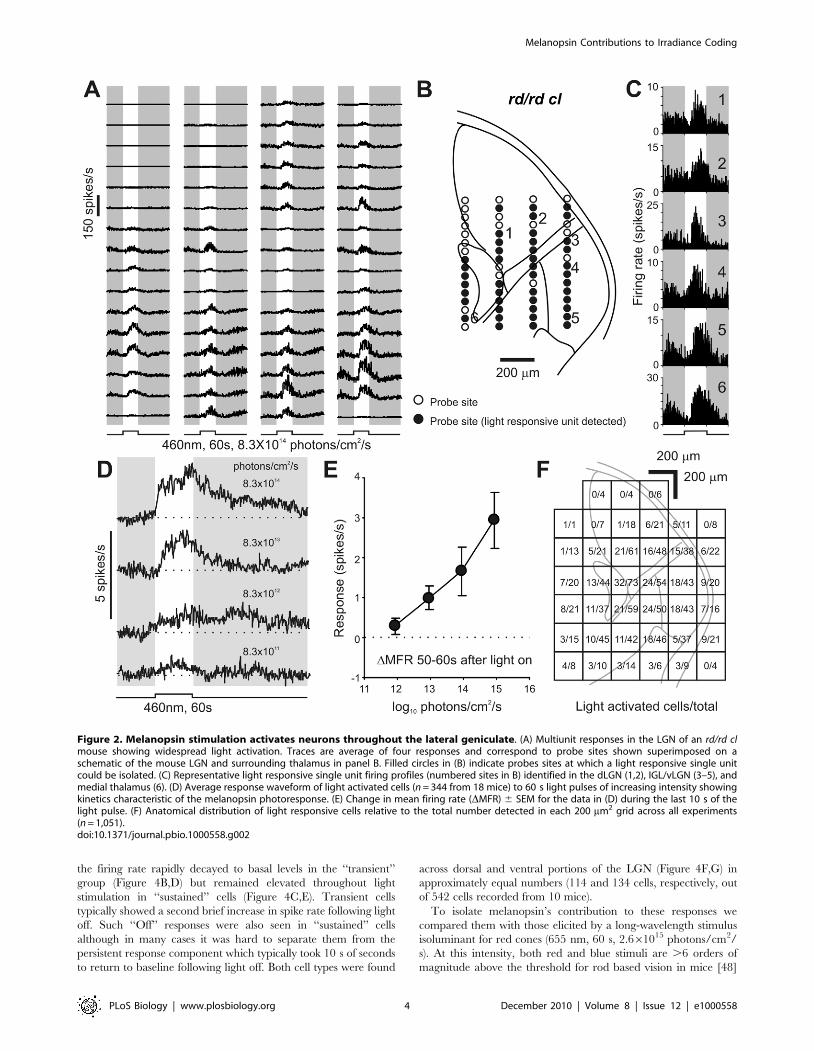
(Figure 2A,B). We found that widespread light responses across the
LGN (including both ventral and dorsal subdivisions) survived rod
and cone loss in these mice (Figure 2C,F).
Spike sorting of the multiunit activity resolved 1,051 single units
over the 18 rd/rd cl mice used for these experiments. A large
proportion of these (n = 344) were strongly excited by light
(Figure 2D), while a small minority were suppressed (n = 63, not
shown; presumably secondary to activation of inhibitory interneu-
rons). The predominant, light activated, response had relatively
low sensitivity (Figure 2D,E; threshold ,1012 photons/cm2/s) and
extremely sluggish kinetics (earliest response:1.5–2 s; time to peak:
34.260.7 s; duration at halfmax firing rate: 53.162.3 s), matching
the known characteristics of melanopsin phototransduction
[12,24–27]. Moreover, the anatomical distribution of these
responses (Figure 2F) was consistent with the newly described
mRGC input to the contralateral LGN (Figure 1E; [18]),
encompassing the ventral LGN/IGL and the medioventral half
of the dLGN. Across these regions there were no clear differences
in the sensitivity or kinetics of the responses (Figure S4) and within
each area the number of responding cells was surprisingly large,
with 30%–40% of resolved single units showing photoactivation.
The widespread activation of dLGN neurons by mRGCs in rd/
rd cl mice raises the question of whether these signals propagate to
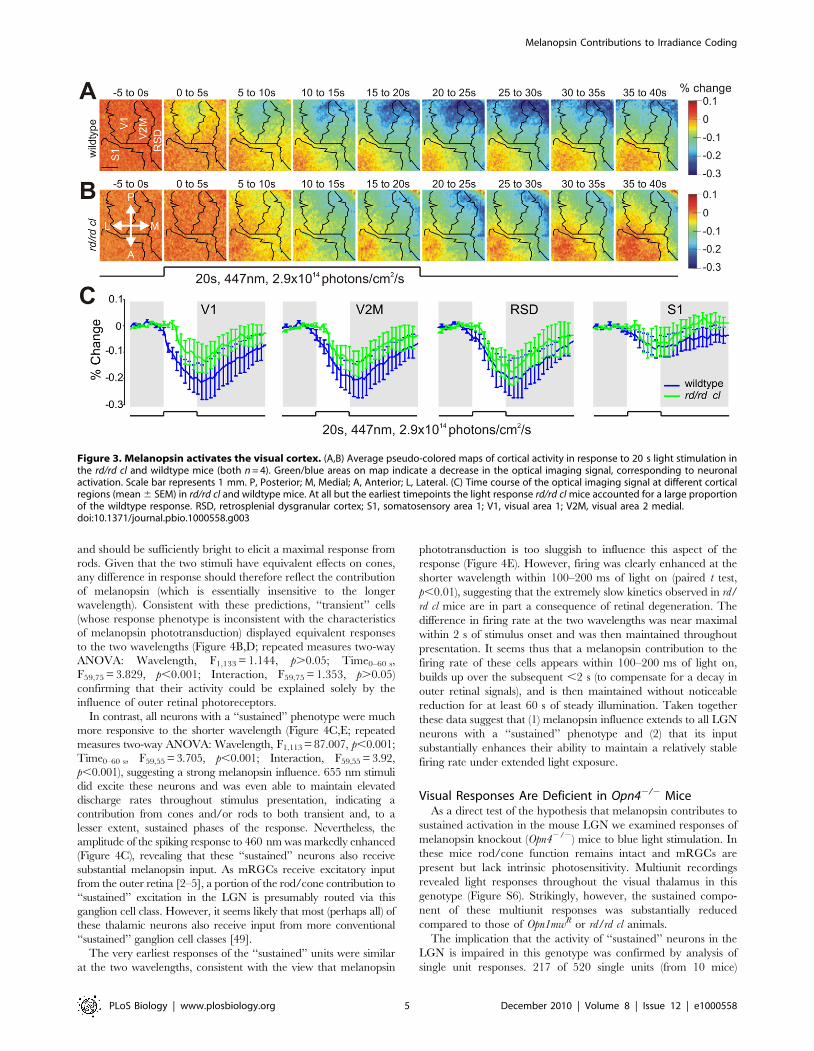
higher visual centers. To test this possibility, we assessed the
cortical response of rd/rd cl and wildtype mice to blue light
stimulation (447 nm, 20 s, 2.961014 photons/cm2/s) using
intrinsic optical imaging. This technique exploits changes in
reflected light induced by local neural activity to map cortical
space [28–31], with the amplitude of the signal inversely
correlated to the degree of local excitation. In wildtype mice, a
cortical response appeared within 5 s of stimulus onset in an
ellipsoidal region of the cortex corresponding to V1 (Figure 3A).
Subsequently, the response extended to surrounding cortical areas,
forming a band spanning the posterior aspect of V2M and
retrosplenial dysgranular cortex (RSD; an area which actively
processes visual information and is implicated in spatial navigation
[32,33]). The amplitude of these responses increased monotoni-
cally, peaking approximately ,20–25 s after stimulus onset in
each region, before returning slowly to baseline (Figure 3A,C).
With the exception of the earliest response (,5 s) in V1, this
strong light activation across V2M, RSD, and posterior/medial
aspects of V1 was retained in rd/rd cl mice (Figure 3B,C). The
Author Summary
The ability to convert light into electrical signals in themammalian retina has traditionally been thought to occurthrough only two types of photoreceptors, the rods andcones. However, this ability also extends to a small numberof neurons expressing the protein melanopsin. To datethese melanopsin retinal ganglion cells (mRGCs) havebeen thought to act as photoreceptors primarily for thosebrain regions regulating subconscious responses toambient light, such as pupil size. In this study, we provideevidence that mRGCs also contribute extensively toconventional visual pathways. We use a newly developedstrategy to characterize the brain regions to which thesecells project and then directly monitor visually evokedneural activity in these target regions. We find that mRGCsallow the mouse visual system to faithfully encodeambient illumination over at least a million-fold rangeand to continue to show light responses even in theabsence of all rods and cones. These data reveal a new rolefor mRGCs during normal vision and suggest that mRGCscould make a significant contribution to assessingbrightness and supporting vision even in people withadvanced retinal degeneration.
Melanopsin Contributions to Irradiance Coding
PLoS Biology | www.plosbiology.org 2 December 2010 | Volume 8 | Issue 12 | e1000558

implication that melanopsin signals reach these higher visual
centers is supported by the sluggish kinetics of this cortical
response and by a recent report of melanopsin-dependent c-fos
induction in the mouse visual cortex [18]. The appearance of the
rd/rd cl light response within a distinct spatial domain is interesting
but hard to interpret given the lack of a consensus regarding the
functional organization of the extrastriate mouse visual cortex
[30,34–36].
Melanopsin Signals in the Intact Visual SystemThe appearance of light responses in the thalamus and cortex of
rd/rd cl mice confirms that mRGCs can regulate primary visual
centers. We next turned our attention to the role of melanopsin in
animals with an intact visual system. In order to achieve this goal,
we first considered how to isolate the melanopsin component of
any visual response. The high threshold sensitivity of melanopsin
photoreception (Figure 2; [12,24–27]) provides a clear distinction
from rods, which saturate at moderate light intensities [37–40]. To
separate cone and putative melanopsin activity at higher
irradiances, we employed red cone knock-in mice (Opn1mwR;
[41]). These animals have a fully intact visual system and retinal
ganglion cells with normal projection patterns (Figure S3) but
exhibit a long-wavelength shift in cone spectral sensitivity that
allows the cone component of any response to be identified by its
enhanced sensitivity to red light [42].
Long duration, bright blue stimuli (460 nm, 60 s, 8.361014
photons/cm2/s) elicited robust and sustained increases in multiunit
firing across the dorsal and ventral LGN of Opn1mwR mice (Figure
S5). Spike sorting of these data revealed a reproducible light
response in 248/542 identifiable single units (from 10 mice). In
common with previous work in many mammalian species [43–47],
we found that these light responsive units fell into distinct
‘‘sustained’’ and ‘‘transient’’ response types (Figure 4). Both showed
an initial large increase in firing shortly after light on. Following this,
Figure 1. Genetic labeling of melanopsin RGCs and their projections. (A) Alkaline phosphatase (AP) stained mRGCs in Opn4Cre;Z/AP mice areuniformly distributed across the retina (1,556672; mean 6 SD, n = 4). (B) AP labels the soma, dendrites, and axons of mRGCs. (C) Labeled cell bodiesare restricted to the ganglion cell layer (GCL) and inner nuclear layer (INL), with dendrites in both sublaminae of the inner plexiform layer (IPL). (D–F)AP-stained coronal brain sections demonstrate dense mRGC innervation of the suprachiasmatic nuclei (SCN, D), intergeniculate leaflet (IGL, E), ventraland dorsal lateral geniculate nuclei (v/dLGN, E), and sparse innervation of the superior colliculus (F). 3V, third ventricle; ot, optic tract. Scale barsrepresent 50 mm (B, D–F) and 25 mm (C).doi:10.1371/journal.pbio.1000558.g001
Melanopsin Contributions to Irradiance Coding
PLoS Biology | www.plosbiology.org 3 December 2010 | Volume 8 | Issue 12 | e1000558
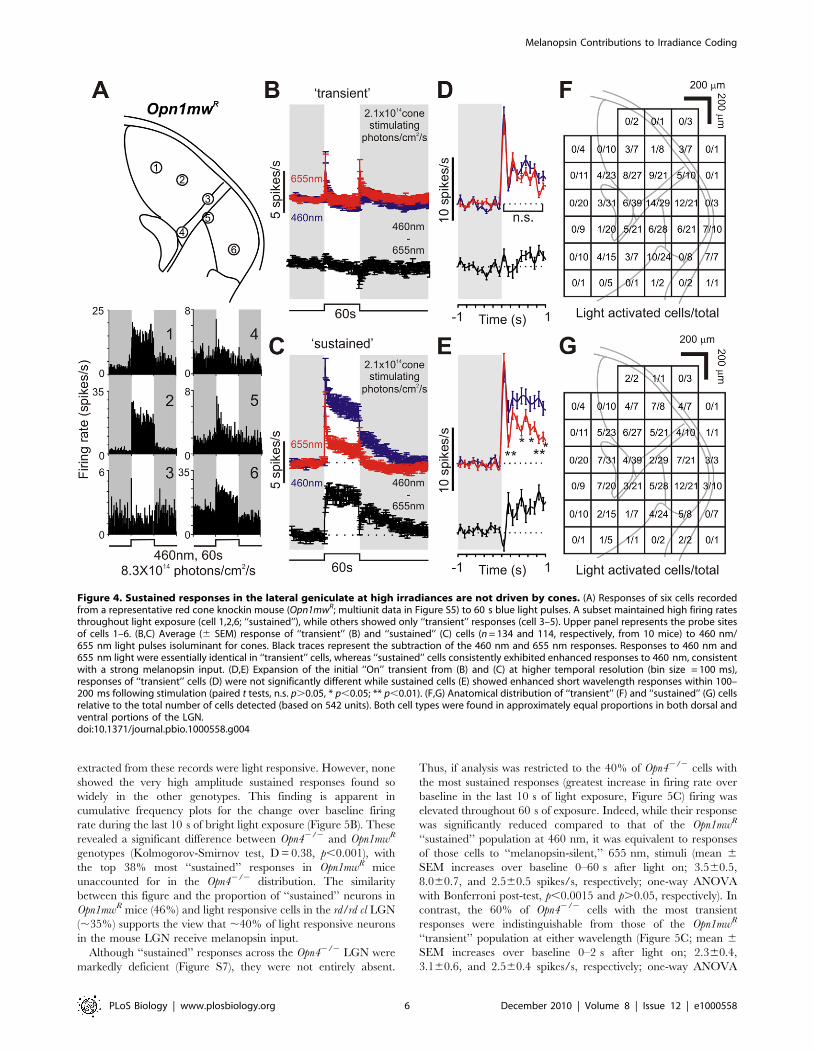
the firing rate rapidly decayed to basal levels in the ‘‘transient’’
group (Figure 4B,D) but remained elevated throughout light
stimulation in ‘‘sustained’’ cells (Figure 4C,E). Transient cells
typically showed a second brief increase in spike rate following light
off. Such ‘‘Off’’ responses were also seen in ‘‘sustained’’ cells
although in many cases it was hard to separate them from the
persistent response component which typically took 10 s of seconds
to return to baseline following light off. Both cell types were found
across dorsal and ventral portions of the LGN (Figure 4F,G) in
approximately equal numbers (114 and 134 cells, respectively, out
of 542 cells recorded from 10 mice).
To isolate melanopsin’s contribution to these responses we
compared them with those elicited by a long-wavelength stimulus
isoluminant for red cones (655 nm, 60 s, 2.661015 photons/cm2/
s). At this intensity, both red and blue stimuli are .6 orders of
magnitude above the threshold for rod based vision in mice [48]
Figure 2. Melanopsin stimulation activates neurons throughout the lateral geniculate. (A) Multiunit responses in the LGN of an rd/rd clmouse showing widespread light activation. Traces are average of four responses and correspond to probe sites shown superimposed on aschematic of the mouse LGN and surrounding thalamus in panel B. Filled circles in (B) indicate probes sites at which a light responsive single unitcould be isolated. (C) Representative light responsive single unit firing profiles (numbered sites in B) identified in the dLGN (1,2), IGL/vLGN (3–5), andmedial thalamus (6). (D) Average response waveform of light activated cells (n = 344 from 18 mice) to 60 s light pulses of increasing intensity showingkinetics characteristic of the melanopsin photoresponse. (E) Change in mean firing rate (DMFR) 6 SEM for the data in (D) during the last 10 s of thelight pulse. (F) Anatomical distribution of light responsive cells relative to the total number detected in each 200 mm2 grid across all experiments(n = 1,051).doi:10.1371/journal.pbio.1000558.g002
Melanopsin Contributions to Irradiance Coding
PLoS Biology | www.plosbiology.org 4 December 2010 | Volume 8 | Issue 12 | e1000558
and should be sufficiently bright to elicit a maximal response from
rods. Given that the two stimuli have equivalent effects on cones,
any difference in response should therefore reflect the contribution
of melanopsin (which is essentially insensitive to the longer
wavelength). Consistent with these predictions, ‘‘transient’’ cells
(whose response phenotype is inconsistent with the characteristics
of melanopsin phototransduction) displayed equivalent responses
to the two wavelengths (Figure 4B,D; repeated measures two-way
ANOVA: Wavelength, F1,133 = 1.144, p.0.05; Time0–60 s,
F59,75 = 3.829, p,0.001; Interaction, F59,75 = 1.353, p.0.05)
confirming that their activity could be explained solely by the
influence of outer retinal photoreceptors.
In contrast, all neurons with a ‘‘sustained’’ phenotype were much
more responsive to the shorter wavelength (Figure 4C,E; repeated
measures two-way ANOVA: Wavelength, F1,113 = 87.007, p,0.001;
Time0–60 s, F59,55 = 3.705, p,0.001; Interaction, F59,55 = 3.92,
p,0.001), suggesting a strong melanopsin influence. 655 nm stimuli
did excite these neurons and was even able to maintain elevated
discharge rates throughout stimulus presentation, indicating a
contribution from cones and/or rods to both transient and, to a
lesser extent, sustained phases of the response. Nevertheless, the
amplitude of the spiking response to 460 nm was markedly enhanced
(Figure 4C), revealing that these ‘‘sustained’’ neurons also receive
substantial melanopsin input. As mRGCs receive excitatory input
from the outer retina [2–5], a portion of the rod/cone contribution to
‘‘sustained’’ excitation in the LGN is presumably routed via this
ganglion cell class. However, it seems likely that most (perhaps all) of
these thalamic neurons also receive input from more conventional
‘‘sustained’’ ganglion cell classes [49].
The very earliest responses of the ‘‘sustained’’ units were similar
at the two wavelengths, consistent with the view that melanopsin
phototransduction is too sluggish to influence this aspect of the
response (Figure 4E). However, firing was clearly enhanced at the
shorter wavelength within 100–200 ms of light on (paired t test,
p,0.01), suggesting that the extremely slow kinetics observed in rd/
rd cl mice are in part a consequence of retinal degeneration. The
difference in firing rate at the two wavelengths was near maximal
within 2 s of stimulus onset and was then maintained throughout
presentation. It seems thus that a melanopsin contribution to the
firing rate of these cells appears within 100–200 ms of light on,
builds up over the subsequent ,2 s (to compensate for a decay in
outer retinal signals), and is then maintained without noticeable
reduction for at least 60 s of steady illumination. Taken together
these data suggest that (1) melanopsin influence extends to all LGN
neurons with a ‘‘sustained’’ phenotype and (2) that its input
substantially enhances their ability to maintain a relatively stable
firing rate under extended light exposure.
Visual Responses Are Deficient in Opn42/2 MiceAs a direct test of the hypothesis that melanopsin contributes to
sustained activation in the mouse LGN we examined responses of
melanopsin knockout (Opn42/2) mice to blue light stimulation. In
these mice rod/cone function remains intact and mRGCs are
present but lack intrinsic photosensitivity. Multiunit recordings
revealed light responses throughout the visual thalamus in this
genotype (Figure S6). Strikingly, however, the sustained compo-
nent of these multiunit responses was substantially reduced
compared to those of Opn1mwR or rd/rd cl animals.
The implication that the activity of ‘‘sustained’’ neurons in the
LGN is impaired in this genotype was confirmed by analysis of
single unit responses. 217 of 520 single units (from 10 mice)
Figure 3. Melanopsin activates the visual cortex. (A,B) Average pseudo-colored maps of cortical activity in response to 20 s light stimulation inthe rd/rd cl and wildtype mice (both n = 4). Green/blue areas on map indicate a decrease in the optical imaging signal, corresponding to neuronalactivation. Scale bar represents 1 mm. P, Posterior; M, Medial; A, Anterior; L, Lateral. (C) Time course of the optical imaging signal at different corticalregions (mean 6 SEM) in rd/rd cl and wildtype mice. At all but the earliest timepoints the light response rd/rd cl mice accounted for a large proportionof the wildtype response. RSD, retrosplenial dysgranular cortex; S1, somatosensory area 1; V1, visual area 1; V2M, visual area 2 medial.doi:10.1371/journal.pbio.1000558.g003
Melanopsin Contributions to Irradiance Coding
PLoS Biology | www.plosbiology.org 5 December 2010 | Volume 8 | Issue 12 | e1000558
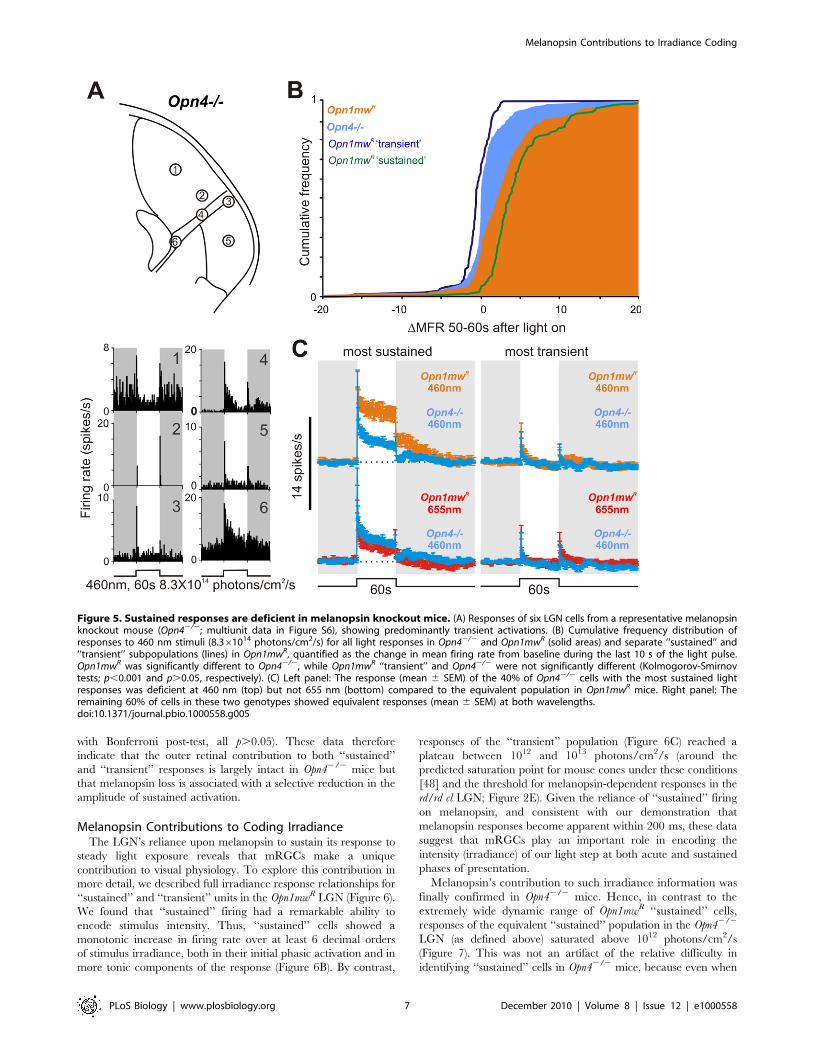
extracted from these records were light responsive. However, none
showed the very high amplitude sustained responses found so
widely in the other genotypes. This finding is apparent in
cumulative frequency plots for the change over baseline firing
rate during the last 10 s of bright light exposure (Figure 5B). These
revealed a significant difference between Opn42/2 and Opn1mwR
genotypes (Kolmogorov-Smirnov test, D = 0.38, p,0.001), with
the top 38% most ‘‘sustained’’ responses in Opn1mwR mice
unaccounted for in the Opn42/2 distribution. The similarity
between this figure and the proportion of ‘‘sustained’’ neurons in
Opn1mwR mice (46%) and light responsive cells in the rd/rd cl LGN
(,35%) supports the view that ,40% of light responsive neurons
in the mouse LGN receive melanopsin input.
Although ‘‘sustained’’ responses across the Opn42/2 LGN were
markedly deficient (Figure S7), they were not entirely absent.
Thus, if analysis was restricted to the 40% of Opn42/2 cells with
the most sustained responses (greatest increase in firing rate over
baseline in the last 10 s of light exposure, Figure 5C) firing was
elevated throughout 60 s of exposure. Indeed, while their response
was significantly reduced compared to that of the Opn1mwR
‘‘sustained’’ population at 460 nm, it was equivalent to responses
of those cells to ‘‘melanopsin-silent,’’ 655 nm, stimuli (mean 6
SEM increases over baseline 0–60 s after light on; 3.560.5,
8.060.7, and 2.560.5 spikes/s, respectively; one-way ANOVA
with Bonferroni post-test, p,0.0015 and p.0.05, respectively). In
contrast, the 60% of Opn42/2 cells with the most transient
responses were indistinguishable from those of the Opn1mwR
‘‘transient’’ population at either wavelength (Figure 5C; mean 6
SEM increases over baseline 0–2 s after light on; 2.360.4,
3.160.6, and 2.560.4 spikes/s, respectively; one-way ANOVA
Figure 4. Sustained responses in the lateral geniculate at high irradiances are not driven by cones. (A) Responses of six cells recordedfrom a representative red cone knockin mouse (Opn1mwR; multiunit data in Figure S5) to 60 s blue light pulses. A subset maintained high firing ratesthroughout light exposure (cell 1,2,6; ‘‘sustained’’), while others showed only ‘‘transient’’ responses (cell 3–5). Upper panel represents the probe sitesof cells 1–6. (B,C) Average (6 SEM) response of ‘‘transient’’ (B) and ‘‘sustained’’ (C) cells (n = 134 and 114, respectively, from 10 mice) to 460 nm/655 nm light pulses isoluminant for cones. Black traces represent the subtraction of the 460 nm and 655 nm responses. Responses to 460 nm and655 nm light were essentially identical in ‘‘transient’’ cells, whereas ‘‘sustained’’ cells consistently exhibited enhanced responses to 460 nm, consistentwith a strong melanopsin input. (D,E) Expansion of the initial ‘‘On’’ transient from (B) and (C) at higher temporal resolution (bin size = 100 ms),responses of ‘‘transient’’ cells (D) were not significantly different while sustained cells (E) showed enhanced short wavelength responses within 100–200 ms following stimulation (paired t tests, n.s. p.0.05, * p,0.05; ** p,0.01). (F,G) Anatomical distribution of ‘‘transient’’ (F) and ‘‘sustained’’ (G) cellsrelative to the total number of cells detected (based on 542 units). Both cell types were found in approximately equal proportions in both dorsal andventral portions of the LGN.doi:10.1371/journal.pbio.1000558.g004
Melanopsin Contributions to Irradiance Coding
PLoS Biology | www.plosbiology.org 6 December 2010 | Volume 8 | Issue 12 | e1000558
with Bonferroni post-test, all p.0.05). These data therefore
indicate that the outer retinal contribution to both ‘‘sustained’’
and ‘‘transient’’ responses is largely intact in Opn42/2 mice but
that melanopsin loss is associated with a selective reduction in the
amplitude of sustained activation.
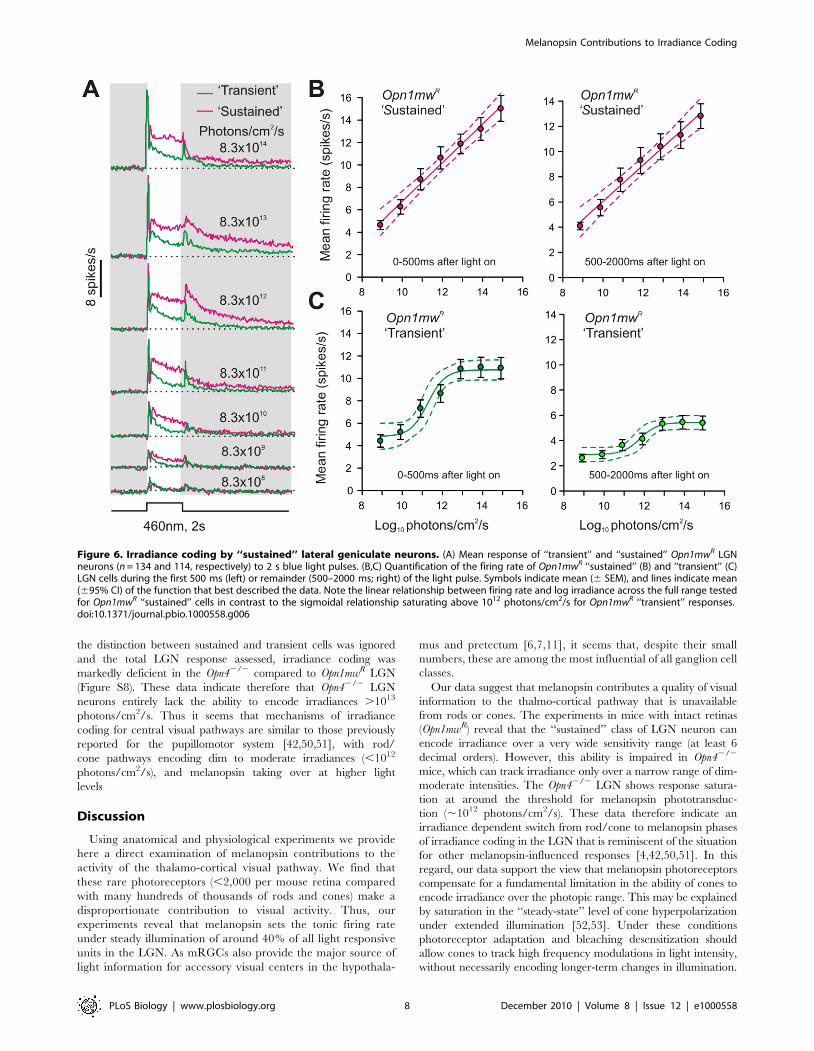
Melanopsin Contributions to Coding IrradianceThe LGN’s reliance upon melanopsin to sustain its response to
steady light exposure reveals that mRGCs make a unique
contribution to visual physiology. To explore this contribution in
more detail, we described full irradiance response relationships for
‘‘sustained’’ and ‘‘transient’’ units in the Opn1mwR LGN (Figure 6).
We found that ‘‘sustained’’ firing had a remarkable ability to
encode stimulus intensity. Thus, ‘‘sustained’’ cells showed a
monotonic increase in firing rate over at least 6 decimal orders
of stimulus irradiance, both in their initial phasic activation and in
more tonic components of the response (Figure 6B). By contrast,
responses of the ‘‘transient’’ population (Figure 6C) reached a
plateau between 1012 and 1013 photons/cm2/s (around the
predicted saturation point for mouse cones under these conditions
[48] and the threshold for melanopsin-dependent responses in the
rd/rd cl LGN; Figure 2E). Given the reliance of ‘‘sustained’’ firing
on melanopsin, and consistent with our demonstration that
melanopsin responses become apparent within 200 ms, these data
suggest that mRGCs play an important role in encoding the
intensity (irradiance) of our light step at both acute and sustained
phases of presentation.
Melanopsin’s contribution to such irradiance information was
finally confirmed in Opn42/2 mice. Hence, in contrast to the
extremely wide dynamic range of Opn1mwR ‘‘sustained’’ cells,
responses of the equivalent ‘‘sustained’’ population in the Opn42/2
LGN (as defined above) saturated above 1012 photons/cm2/s
(Figure 7). This was not an artifact of the relative difficulty in
identifying ‘‘sustained’’ cells in Opn42/2 mice, because even when
Figure 5. Sustained responses are deficient in melanopsin knockout mice. (A) Responses of six LGN cells from a representative melanopsinknockout mouse (Opn42/2; multiunit data in Figure S6), showing predominantly transient activations. (B) Cumulative frequency distribution ofresponses to 460 nm stimuli (8.361014 photons/cm2/s) for all light responses in Opn42/2 and Opn1mwR (solid areas) and separate ‘‘sustained’’ and‘‘transient’’ subpopulations (lines) in Opn1mwR, quantified as the change in mean firing rate from baseline during the last 10 s of the light pulse.Opn1mwR was significantly different to Opn42/2, while Opn1mwR ‘‘transient’’ and Opn42/2 were not significantly different (Kolmogorov-Smirnovtests; p,0.001 and p.0.05, respectively). (C) Left panel: The response (mean 6 SEM) of the 40% of Opn42/2 cells with the most sustained lightresponses was deficient at 460 nm (top) but not 655 nm (bottom) compared to the equivalent population in Opn1mwR mice. Right panel: Theremaining 60% of cells in these two genotypes showed equivalent responses (mean 6 SEM) at both wavelengths.doi:10.1371/journal.pbio.1000558.g005
Melanopsin Contributions to Irradiance Coding
PLoS Biology | www.plosbiology.org 7 December 2010 | Volume 8 | Issue 12 | e1000558
the distinction between sustained and transient cells was ignored
and the total LGN response assessed, irradiance coding was
markedly deficient in the Opn42/2 compared to Opn1mwR LGN
(Figure S8). These data indicate therefore that Opn42/2 LGN
neurons entirely lack the ability to encode irradiances .1013
photons/cm2/s. Thus it seems that mechanisms of irradiance
coding for central visual pathways are similar to those previously
reported for the pupillomotor system [42,50,51], with rod/
cone pathways encoding dim to moderate irradiances (,1012
photons/cm2/s), and melanopsin taking over at higher light
levels
Discussion
Using anatomical and physiological experiments we provide
here a direct examination of melanopsin contributions to the
activity of the thalamo-cortical visual pathway. We find that
these rare photoreceptors (,2,000 per mouse retina compared
with many hundreds of thousands of rods and cones) make a
disproportionate contribution to visual activity. Thus, our
experiments reveal that melanopsin sets the tonic firing rate
under steady illumination of around 40% of all light responsive
units in the LGN. As mRGCs also provide the major source of
light information for accessory visual centers in the hypothala-
mus and pretectum [6,7,11], it seems that, despite their small
numbers, these are among the most influential of all ganglion cell
classes.
Our data suggest that melanopsin contributes a quality of visual
information to the thalmo-cortical pathway that is unavailable
from rods or cones. The experiments in mice with intact retinas
(Opn1mwR) reveal that the ‘‘sustained’’ class of LGN neuron can
encode irradiance over a very wide sensitivity range (at least 6
decimal orders). However, this ability is impaired in Opn42/2
mice, which can track irradiance only over a narrow range of dim-
moderate intensities. The Opn42/2 LGN shows response satura-
tion at around the threshold for melanopsin phototransduc-
tion (,1012 photons/cm2/s). These data therefore indicate an
irradiance dependent switch from rod/cone to melanopsin phases
of irradiance coding in the LGN that is reminiscent of the situation
for other melanopsin-influenced responses [4,42,50,51]. In this
regard, our data support the view that melanopsin photoreceptors
compensate for a fundamental limitation in the ability of cones to
encode irradiance over the photopic range. This may be explained
by saturation in the ‘‘steady-state’’ level of cone hyperpolarization
under extended illumination [52,53]. Under these conditions
photoreceptor adaptation and bleaching desensitization should
allow cones to track high frequency modulations in light intensity,
without necessarily encoding longer-term changes in illumination.
Figure 6. Irradiance coding by ‘‘sustained’’ lateral geniculate neurons. (A) Mean response of ‘‘transient’’ and ‘‘sustained’’ Opn1mwR LGNneurons (n = 134 and 114, respectively) to 2 s blue light pulses. (B,C) Quantification of the firing rate of Opn1mwR ‘‘sustained’’ (B) and ‘‘transient’’ (C)LGN cells during the first 500 ms (left) or remainder (500–2000 ms; right) of the light pulse. Symbols indicate mean (6 SEM), and lines indicate mean(695% CI) of the function that best described the data. Note the linear relationship between firing rate and log irradiance across the full range testedfor Opn1mwR ‘‘sustained’’ cells in contrast to the sigmoidal relationship saturating above 1012 photons/cm2/s for Opn1mwR ‘‘transient’’ responses.doi:10.1371/journal.pbio.1000558.g006
Melanopsin Contributions to Irradiance Coding
PLoS Biology | www.plosbiology.org 8 December 2010 | Volume 8 | Issue 12 | e1000558

Our data suggest that the visual system relies upon melanopsin to
provide this latter information.
Insofar as melanopsin enhances the visual system’s ability to
measure light intensity, our data raise the possibility of an mRGC
contribution to any aspect of mammalian vision that requires an
accurate assessment of luminance/illuminance. Indeed, the
finding that melanopsin influences essentially all thalamic neurons
capable of luminance detection (the sustained population) in the
mouse represents strong evidence for such a wide-ranging role in
that species. If this were true also of humans, then mRGCs may
contribute to as yet poorly understood mechanisms of ‘‘brightness’’
and ‘‘lightness’’ perception [54,55]. For the moment, however, the
aspect of human vision most directly addressed by our mouse
experiments is spatial brightness perception. Just like our mouse
thalamic neurons, human subjects can accurately estimate full field
illumination over at least 8 decimal orders [56]. Based on our
findings, we predict that melanopsin is responsible for at least the
top 3–4 orders of this sensitivity range. In support of this possibility
are reports that other features of human brightness perception
seem inconsistent with cone physiology [57] and that high color
temperature (‘‘bluer’’) lights appear brighter to human observers
even when matched for photopic luminance [58–60].
An important unanswered question is whether mRGC input to
the dLGN adopts a retinotopic order allowing it to encode spatial
information. The resolution of any such mRGC-dependent spatial
map would be low. Thus, if we assume a 90u field of view in mice
with a fully constricted pupil and tiling of ,28628 for those
mRGCs projecting to the dLGN (at most half of the total
population of mRGCs), then acuity would be ,0.3 cycles/u at
best. Behavioral and electrophysiological experiments suggest that
mouse visual acuity is not much superior to this [44,61–63].
However, given their anatomy, and the kinetics of melanopsin
phototransduction, it is hard to imagine that the selective
advantage of retaining mRGC input to the dLGN lies in their
ability to provide fine spatial information. It seems much more
likely that if mRGCs do provide spatial information it takes the
form of a relatively crude map of ‘‘brightness’’ to be used alongside
higher acuity information in downstream visual processing.
The discovery of widespread melanopsin input to the thalamo-
cortical visual pathway could have special relevance for the blind.
Millions worldwide suffer varying degrees of blindness thanks to
rod/cone degeneration or dysfunction. mRGCs survive even
complete rod and cone loss and can support reflex light responses
under these conditions. Our demonstration of extensive light
Figure 7. Melanopsin is necessary for encoding high irradiances. (A) Mean response to 2 s blue light pulses from the 40% most ‘‘sustained’’and remainder 60% most ‘‘transient’’ Opn42/2 LGN neurons (as defined by their response to bright 60 s light steps; n = 87 and 130, respectively). (B,C)Quantification of the firing rate of Opn42/2 ‘‘sustained’’ (B) or ‘‘transient’’ (C) LGN cells during the first 500 ms (left) or remainder (500–2000 ms; right)of the light pulse. Symbols indicate mean 6 SEM, and lines indicate mean 695% CI of the function that best described the data. Note that, unlikeOpn1mwR ‘‘sustained’’ cells, both ‘‘sustained’’ and ‘‘transient’’ Opn42/2 populations display sigmoidal relationships between firing rate and irradiance,which saturate above 1012 photons/cm2/s. Data for ‘‘transient’’ Opn42/2 cells over 500–2,000 ms of the response were not well fit by either linear orsigmoidal functions.doi:10.1371/journal.pbio.1000558.g007
Melanopsin Contributions to Irradiance Coding
PLoS Biology | www.plosbiology.org 9 December 2010 | Volume 8 | Issue 12 | e1000558

driven activation in the LGN and cortex of rd/rd cl mice (an
animal model of advanced retinal degeneration) raises the
possibility that mRGCs also contribute to aspects of visual
perception in these individuals [64]. Crude light perception
typically survives in patients with retinal degeneration and there
has been a suggestion that this could originate with melanopsin
[10,65] (although note that not all subjects with circadian light
responses, and thus functional melanopsin photoreception, retain
conscious light perception [66]).
If surviving melanopsin photoreceptors might support simple
light perception in those with retinal degeneration, could they also
provide spatial information? Very recently, Ecker and coworkers
reported that Gnat12/2;Cnga32/2 mice can use visual gratings to
navigate a maze [18]. Insofar as these animals are considered to
lack critical components of rod and cone phototransduction
cascades (but have structurally intact retinae), that finding argues
that mRGCs alone can support pattern vision. However, our work
in rd/rd cl mice raises doubt over whether this could occur in
advanced retinal degeneration. Thus, while melanopsin drives
thalamic responses within 200 ms of a change in illumination in
mice with an intact retina, responses build up very gradually in rd/
rd cl animals, being first apparent at around 2 s after lights on,
increasing over subsequent 10 s of seconds, and decaying very
slowly at lights off. These kinetics seem incompatible with
timeframes of visual fixation and would therefore probably
preclude this melanopsin photoreception from providing useful
spatial information. In agreement with this prediction, the ability
to perceive light typically outlasts spatial discrimination in patients
with progressive retinal dystrophy.
The discovery of photoreceptive retinal ganglion cells has thus
far had little impact on our understanding of the processes of
pattern vision and perception. We show here that these mRGCs
are in fact influential regulators of electrophysiological activity in
the primary visual pathway. Our data suggest that they are
responsible for setting the tonic firing rate of 40% of thalamic
neurons according to the level of illumination. This unique
contribution implicates melanopsin in aspects of spatial brightness
perception that have been hard to reconcile with the known
capabilities of rods and cones [57]. The fact that these melanopsin
signals appear in essentially all LGN neurons with a ‘‘sustained’’
response phenotype further identifies this inner retinal photore-
ceptor as a potential player in any visual process employing
luminance information. These new functions add to the weight of
evidence that good practice in architectural lighting should be
revised to take account of the specific requirements of melanopsin
photoreception.
Methods
AnimalsAll animal care was in accordance with local requirements, with
studies in the United Kingdom conforming to the Animals,
Scientific Procedures Act of 1986, and those at the Salk Institute
approved by the Institutional Animal Care and Use Committee.
Animals were kept in a 12-h dark/light cycle environment at a
temperature of 22uC with food and water ad libitum.
Alkaline Phosphatase (AP) StainingThe generation and genotyping of Opn4Cre/+ mouse was
described previously [11]. Z/AP mouse strain was purchased from
Jackson Laboratory and was genotyped by X-gal staining on small
biopsy samples following standard protocol [19]. AP staining of
flatmount retina, retina sections, and of brain sections were done
following protocols outlined in [67] with some modifications
briefly described here. 8–12-wk-old Opn4Cre/+;Z/AP mice were
deeply anesthetized with ketamine (70 mg/kg) and xylazine
(10 mg/kg) and transcardially perfused with 4% paraformalde-
hyde. Retinas were postfixed for 15 min and washed twice in PBS
with 2 mM MgCl2. Four small cuts were made on the retina to
allow it to open for staining and imaging. Coronal brain sections
(150 mm thickness) were cut into PBS by a vibratome and collected
serially. Brain sections and retinas were heated at 65uC for 1 h in
PBS to inactivate the endogenous alkaline phosphatase. Tissues
were submerged in AP stain (0.1 M Tris-HCl, pH 9.5, 0.1 M
NaCl, 50 mM MgCl2, 340 mg/ml NBT [nitroblue tetrazolium
salt] and 175 mg/ml BCIP [5-bromo-4-chloro-3-indolyl phos-
phate, toluidinium salt] [NBT/BCIP kit, Cat# N-6547 from
Invitrogen Carlsbad, CA]). AP staining was carried out for 30 min
to overnight at room temperature with mild agitation. After
staining, tissues were washed three times for 20 min each in PBS
with 0.1% Tween 20. Brain sections and retinas were then
postfixed overnight and 30 min, respectively, in 4% paraformal-
dehyde with Sorenson’s Phosphate Buffer. Tissues were dehydrat-
ed through an ethanol series and cleared with 2:1 benzyl
benzoate:benzyl alcohol. Finally, tissues were mounted and
visualized under Leica DC500 or Zeiss Stemi SV11. The number
of cells per retina was counted with NIH Image J. A total of five
Opn4Cre/+;Z/AP adult mice were bilaterally (3 mice) or unilaterally
(2 mice) enucleated under ketamine/xylazine anesthesia. After
2 wk, tissues were subjected to AP staining procedure (see above).
ImmunostainingDouble staining for melanopsin and GFP in the retina
flatmounts of Opn4Cre/+;Z/EG mice was carried out as described
[11] with the following changes. Polyclonal rabbit anti-melanopsin
antibodies raised against a synthetic peptide containing the N-
terminus 15 amino acid of mouse melanopsin [68] was purified
using protein-A magnetic beads following standard protocol. This
purification step enhanced sensitivity and specificity of the
antibody beyond published results. The purified antibodies at
1:5000 dilution was used for immunostaining. For detection of
GFP, a polyclonal chicken anti-GFP antibody was used at 1:1000
dilution. FITC conjugated donkey anti-chicken IgG (1:250, 703-
095-155, Jackson ImmunoResearch) and Cy3 conjugated donkey
anti-rabbit IgG (1:500, 711-165-152, Jackson ImmunoResearch)
were used for visualization.
In Vivo NeurophysiologySurgical procedures. Adult male mice (80–160 d) were
anaesthetized by i.p. injection of 30% (w/v) urethane (1.7 g/kg;
Sigma, Dorset, UK) and placed in a stereotaxic apparatus (SR-
15M; Narishige International Ltd., London, UK). Additional top
up doses of anesthetic (0.2 g/kg) were applied as required.
Throughout the experiment the animal’s temperature was
maintained at 37uC with a homoeothermic blanket (Harvard
Apparatus, Kent, UK). The skull surface was exposed and a small
hole (,1 mm diam.) drilled 2.5 mm posterior and 2.3 mm lateral
to the bregma. The pupil, contralateral to the craniotomy, was
dilated with topical application of 1% (w/v) atropine sulphate
(Sigma) and the cornea kept moist with mineral oil. A recording
probe (A4X8-5 mm-50-200-413; Neuronexus, MI, USA)
consisting of four shanks (spaced 200 mm), each with eight
recordings sites (spaced 50 mm), was then positioned centrally on
the exposed skull surface, perpendicular to the midline, and
lowered to a depth of 2.4–3.4 mm using a fluid filled
micromanipulator (MO-10; Narishige). In most experiments,
after recording from one location for 4–5 h the probe was raised
or lowered 400 mm and a second set of responses recorded, such
Melanopsin Contributions to Irradiance Coding
PLoS Biology | www.plosbiology.org 10 December 2010 | Volume 8 | Issue 12 | e1000558

that overall the recording sites spanned a 4616 grid 600 mm on
the medial-lateral axis and 750 mm on the dorsal-ventral axis.
Recording methodology. Once the recording probe was in
position the recording chamber was covered with darkroom
blackout material (Nova Darkroom, Warwick, UK) and the room
lights dimmed. Under these conditions background photon flux
within the recording chamber was below the limit of our detectors.
Mice were dark adapted for 1 h, which also allowed neuronal
activity to stabilize after probe insertion/repositioning, after which
we began recording. Neural signals were acquired using a
Recorder64 system (Plexon, TX, USA). Signals were amplified
63,000, highpass filtered at 300 Hz, and digitized at 40 kHz.
Multiunit activity (spikes with amplitudes .50 mV) were saved as
time stamped waveforms and analyzed offline (see below). Light
stimuli were delivered by a custom built LED based light source
(Cairn Research Ltd, Kent, UK), which consisted of
independently controlled red and blue LEDs (lmax: 460 and
655 nm, respectively) with appropriate bandpass filters (half peak
width: 610 nm). The light passed through a filter wheel with
various neutral density filters and was focused onto a 5 mm
diameter piece of opal diffusing glass (Edmund Optics Inc., York,
UK) positioned 3 mm from the eye contralateral to the recording
probe. LED intensity and filter wheel position were controlled by a
PC running LabView 8.6 (National instruments). Blue/red light
stimulations were either applied for 60 s with an interstimulus
interval of 540 s or for 2 s with an interstimulus interval of 38 s. At
each intensity used (starting at the lowest) 3–5 trials (for 60 s
pulses) or 20 trials (for 2 s pulses) were conducted before increasing
the intensity. Mice were otherwise kept in complete darkness.
Light measurements were performed using a calibrated
spectrophotometer (Ocean Optics, FL, USA) and optical power
meter (Macam Photometrics, Livingston, UK). Effective photon
flux for each photoreceptor class was determined using the
calculated spectra and visual pigment templates described by
Govardovskii et al. [69].
Histological analysis. For each experiment the location of
the probe was verified histologically. In most experiments, the
electrode was immersed in fluorescent dye before recording (Cell
Tracker CM-DiI; Invitrogen Ltd. Paisley, UK). In some of these
experiments (and in all other experiments) at the end of recording
lesioning, current pulses (35 mA, 6 s) were applied using a constant
current stimulator (DS3, Digitimer Ltd., Herts., UK) to selected
recording sites. In all cases, at the end of the experiment the mouse
was perfused transcardially with 0.1 M phosphate buffered saline
followed by 4% paraformaldehyde. The brain was removed,
postfixed overnight, cryoprotected with 30% sucrose, then
sectioned at 100 mm on a freezing sledge microtome. For
detection of DiI fluorescence, sections were mounted with
Vectashield (Vectorlaboratories Ltd. Peterborough, UK),
coverslipped, and visualized using an Olympus BX51 with
appropriate filter sets. When the fluorescent marker was not
used, sections were Nissl stained. Sections were scaled to account
for shrinkage using the distance between lesion sites and electrode
tracks (for DiI fluorescence) and aligned with the corresponding
mouse atlas sections [70] to estimate the stereotaxic coordinates of
each recording site.
Data analysis. Multichannel, multiunit recordings were
analyzed in Offline Sorter (Plexon). After removing artifacts we
used principal component–based sorting to discriminate single
units, identifiable as a distinct cluster of spikes in principal
component space with a clear refractory period in their interspike
interval distribution (Figure S9). In most cases we identified a
single distinct unit at each recording site (total 2,113 units from
2,112 recording sites). Following spike sorting data were exported
to Neuroexplorer (Nex Technologies, MA, USA) and MATLAB
R2007a (The Mathworks Inc., MA, USA) for construction of
peristimulus histograms and further analysis. Light responsive
units were identified as those where the peristimulus average
showed a clear peak (or trough) that exceeded the 99% confidence
limits estimated from a Poisson distribution derived from the
prestimulus spike counts.
Retinal Tract TracingMale mice (80–160 d) were anaesthetized by i.p. injection of
ketamine (70 mg/kg) and xylazine (7 mg/kg). Topical anesthetic
(1% w/v amethocaine HCl; Chauvin Pharmaceuticals Ltd, Essex,
UK) was applied to one eye and 2 ml of 1% cholera toxin b subunit
conjugated to Alexa Fluor-488 (Invitrogen) was injected intravi-
treally using a glass needle (tip ,20 ml) attached to a Hamilton
syringe. Mice were allowed to recover for 3–4 d before perfusion
and histological processing as described above for DiI fluores-
cence.
Optical ImagingAnimal preparation. Adult (80–160 d) male rd/rd cl and
appropriate wildtype control mice (C3H/f, wild type for the rd1
mutation) were anaesthetized as for in vivo neurophysiological
recordings (above) and eye protection cream was applied to the left
cornea. A tracheotomy was performed to reduce the incidence of
breathing problems [71] and the skin above the skull retracted. A
black plastic cylindrical chamber was fixed over the cortex using
dental cement, filled with 37uC saline and a cover slip was placed
on top. The right eye was occluded using a plastic black mask fixed
using dental cement and the pupil of the left eye was dilated by
topical application of 1% atropine sulphate. Eye protection cream
was then reapplied and a mouse contact lens with no refractive
correction was placed on it to protect the cornea.
Visual stimulation. The visual stimulus was delivered using
a xenon-arc lamp and passed through a 447 nm broadband
(60 nm bandwidth) filter (Edmund Optics) and delivered onto a
25 mm diffuser placed 10 mm from the left eye giving an
irradiance of 2.961014 photons/cm2/s. The animal was dark
adapted for 30 min before starting visual stimulation. The
duration of the stimulus lasted for 20 s. For averaging purposes
the stimulus was repeated 15–20 times with an inter-stimulus
interval of 120 s. Subsequently, recordings were taken using a
‘‘blank stimulus’’ during which no visual stimulus was delivered; in
no case did we observe any cortical response under these ‘‘blank
stimulus’’ conditions.
Data collection. In order to perform single wavelength
optical imaging the cortex was illuminated using a halogen
lamp. Frames were taken from the cortex using a cooled 12 bit
SMD (1M60) digital camera mounted on top of a Leica MZ75
microscope using a magnification of 1.6. Custom-made software
was written using Visual Studio. NET to synchronize the camera
recordings with the visual stimulus by triggering the opening of an
electronic shutter (Melles-Griot, Cambridge, UK) placed in the
light stimulus pathway. The cortex was first illuminated using an
interference filter of 570 nm (Edmund Optics) to focus the camera
on the surface vascular pattern. The camera was then focused
700 mm below the surface and a near-infrared filter of 692 nm
(40 nm bandwidth) was used during data collection. A total of 80 s
were recorded per stimulus repetition starting 20 s before stimulus
onset. Frames were binned with a 464 spatial binning stored at
8 Hz and downsampled to 2 Hz before further analysis.
Data analysis. The data were averaged over stimulus
repetitions on a frame by frame basis. Frames were averaged in
5 s intervals and subtracted from those frames taken within the last
Melanopsin Contributions to Irradiance Coding
PLoS Biology | www.plosbiology.org 11 December 2010 | Volume 8 | Issue 12 | e1000558
second before stimulus onset. In this way, maps of activity are
produce by highlighting the spatial changes in the optical imaging
signal following stimulus presentation. In order to average maps of
activity across animals from each group, the cortical maps were
aligned with respect to the bregma coordinate and then averaged
for corresponding frames. An approximate location of the cortical
regions imaged was estimated from coronal sections of published
mouse stereotaxic coordinates [72].
Supporting Information
Figure S1 Genetic and immunohistochemical co-label-ing of melanopsin retinal ganglion cells. Representative
retinal sections from Opn4Cre/+;Z/EG mice co-labeled with a
purified rabbit polyclonal antibody raised against an N-terminus
epitope of mouse melanopsin [68]. (A) Anti-Opn4-immunofluore-
sence (red), (B) GFP expression (green), (C) merge. We found 110–
130 GFP positive cells/mm2, which amounts to ,1,500 cells in the
adult mouse retina (based on an area of 14 mm2). Of these cells
86.4% were double labeled (white arrows in A) and 10.2% were
GFP positive (green arrows) but lacked detectable melanopsin
immunostaining, presumably due to a very low level of melanopsin
expression undetectable by the antibody. These GFP positive
soma were all restricted to the ganglion cell layer and proximal
zone of the inner nuclear layer. There were also some sparse cells
(2–6/mm2; red arrows) staining only with anti-melanopsin
antibody. In these cells GFP is not expressed to a detectable level
owing to insufficient Cre function or GFP expression. The
dendrites of all GFP or melanopsin immunospositive cells stratified
almost equally in both proximal and distal zones of the inner
plexiform layer (IPL). Since the M1 type of melanopsin cells
primarily stratify in the distal zone of the IPL [11,13–15], the Cre
expressing retinal ganglion cells in mice mark both M1 and
additional cell types expressing melanopsin.
Found at: doi:10.1371/journal.pbio.1000558.s001 (2.12 MB TIF)
Figure S2 Anatomy of monocular projections of mela-nopsin ganglion cells. Representative sections (150 mm thick)
from unilaterally enucleated Opn4Cre/+;Z/AP mice stained with
chromogenic alkaline phosphatase substrate. mRGC innervations
to the (A,B) superior colliculus (SC), (C,D) olivery pretectal nuclei
(OPN), and (E,F) lateral geniculate nucleus (LGN) are predom-
inantly contralateral. As shown previously the (G) SCN receives
bilateral innervation of mRGC from each retina.
Found at: doi:10.1371/journal.pbio.1000558.s002 (3.64 MB TIF)
Figure S3 Comparative anatomy of monocular retinalprojections in rd/rd cl and Opn1mwR mice. Representa-
tive sections (100 mm thick) from rd/rd cl (left) and Opn1mwR (right)
mice showing cholera toxin b subunit-Alexa Fluor 488 fluores-
cence across all major retinal targets. The density and ration of
ipsilateral:contralateral retinal innervation was similar across all
retinorecipient target sites and consistent with previous reports
[13].
Found at: doi:10.1371/journal.pbio.1000558.s003 (0.99 MB TIF)
Figure S4 Light response waveforms in thalamic sub-regions of rd/rd cl mice. The average single unit response
waveforms following 60 s, 460 nm, illumination in rd/rd cl mice
were similar regardless of the projected anatomical location of the
cell. Data show the mean 6 SEM change in firing rate of light
responsive cells detected in the dorsal LGN (top; n = 84),
intergeniculate leaflet (IGL) and ventral LGN (middle; n = 221),
or medial areas of the thalamus bordering the LGN (bottom;
n = 39).
Found at: doi:10.1371/journal.pbio.1000558.s004 (0.31 MB TIF)
Figure S5 Cone-independent sustained activation oflateral geniculate (LGN) neurons by blue light pulses.(A,B) Multichannel, multiunit recordings from the LGN of a
representative red cone knockin mouse (Opn1mwR) showing
widespread and sustained neuronal activation in response to
460 nm light pulses (60 s; 8.361014 photons/cm2/s). (C) 655 nm
light pulses (60 s; 2.661015 photons/cm2/s) isoluminant to the
460 nm stimuli for cones evoked much more transient changes in
neuronal activity. Traces in (B) and (C) represent the change in
multiunit firing (average of four responses) at corresponding
recording sites (circles) in panel A; shaded areas represent
interstimulus periods of darkness.
Found at: doi:10.1371/journal.pbio.1000558.s005 (0.58 MB TIF)
Figure S6 The melanopsin knockout LGN lacks highamplitude sustained responses. (A,B) Multichannel, multi-
unit recordings from the lateral geniculate (LGN) of a represen-
tative melanopsin knockout mouse (Opn42/2) showing predomi-
nantly transient on and off activations in response to 60 s light
pulses (8.361014 photons/cm2/s at 460 nm). Traces in (B)
represent the change in multiunit firing (average of three
responses) at corresponding recording sites (circles) in panel A;
shaded areas represent darkness. (C) Anatomical distribution of
light responsive cells detected in all Opn42/2 mice investigated,
relative to the total number of cells found in each
200 mm6200 mm grid square (based on 520 units recorded in 10
mice).
Found at: doi:10.1371/journal.pbio.1000558.s006 (0.22 MB TIF)
Figure S7 Sustained responses are deficient in mela-nopsin knockout LGN neurons. Average (6 SEM) response
of all Opn42/2 cells (n = 217) to 460 nm light compared with
responses of all Opn1mwR neurons (i.e. ‘‘sustained’’ + ‘‘transient’’
subpopulations, n = 248) to 460 nm (top) and 655 nm (bottom).
Responses of Opn42/2 neurons were significantly smaller than
those of Opn1mwR cells at 460 nm but similar to those at 655 nm
(mean 6 SEM increases over baseline 0–60 s after light on;
1.360.3, 3.360.5, and 1.160.3 spikes/s, respectively; one-way
ANOVA with Bonferroni post-test, p,0.001 and p.0.05,
respectively).
Found at: doi:10.1371/journal.pbio.1000558.s007 (0.16 MB TIF)
Figure S8 Irradiance coding is deficient in the lateralgeniculate (LGN) of Opn42/2 mice. (A) Average response of
all light activated LGN neurons recorded in Opn42/2 (blue;
n = 217) and Opn1mwR mice (orange; including both ‘‘sustained’’
and ‘‘transient’’ populations; n = 248) to 2 s blue light pulses. (B,C)
Quantification of the firing rate of all light responsive LGN cells in
Opn42/2 (B) and Opn1mwR (C) mice during the first 500 ms (left) or
remainder (500–2000 ms; right) of the light pulse. Symbols
indicate mean (6 SEM), and lines indicate mean (695% CI) of
the function that best described the response. Note that even
though irradiance coding is a unique property of ‘‘sustained’’
neurons (Figure 6), a clear linear relationship between irradiance
and firing rate is apparent in the pooled responses of ‘‘sustained’’
and ‘‘transient’’ cells in Opn1mwR mice. Thus, the deficiency of this
activity in Opn42/2 mice (B and Figure 6) does not merely reflect
our inability to separate ‘‘sustained’’ and ‘‘transient’’ cell types in
this genotype.
Found at: doi:10.1371/journal.pbio.1000558.s008 (0.65 MB TIF)
Figure S9 Single unit spike discrimination. (A) Mean (6
SD) waveform of spikes assigned to three single units (correspond-
ing to units 1–3 in Figure 4). (B) Spike patterns of single units from
0.5 s before to 1.5 s after the start of a 460 nm light pulse
(8.361014 photons/cm2/s). (C) Expanded view of spike traces in
Melanopsin Contributions to Irradiance Coding
PLoS Biology | www.plosbiology.org 12 December 2010 | Volume 8 | Issue 12 | e1000558

(B) at the points marked *. (D) Log interspike interval (ISI)
histograms for units 1–3. Histograms show a sharp peak at ISIs
between 3 and 5 ms corresponding to spikes fired in bursts and
broader peaks at longer ISIs corresponding to epochs of tonic
firing.
Found at: doi:10.1371/journal.pbio.1000558.s009 (0.26 MB TIF)
Acknowledgments
Technical assistance was provided by S. Allender, J. Wynne, and H. Le.
Author Contributions
The author(s) have made the following declarations about their
contributions: Conceived and designed the experiments: TMB CG MH
SP RJL. Performed the experiments: TMB CG MH SRK MS. Analyzed
the data: TMB CG MH SP. Contributed reagents/materials/analysis
tools: PJC JG. Wrote the paper: TMB HDP RJL.
References
1. Bailes HJ, Lucas RJ (2010) Melanopsin and inner retinal photoreception. CellMol Life Sci 67: 99–111.
2. Belenky MA, Smeraski CA, Provencio I, Sollars PJ, Pickard GE (2003)Melanopsin retinal ganglion cells receive bipolar and amacrine cell synapses.
J Comp Neurol 460: 380–393.
3. Perez-Leon JA, Warren EJ, Allen CN, Robinson DW, Lane Brown R (2006)
Synaptic inputs to retinal ganglion cells that set the circadian clock.Eur J Neurosci 24: 1117–1123.
4. Wong KY, Dunn FA, Graham DM, Berson DM (2007) Synaptic influences onrat ganglion-cell photoreceptors. J Physiol 582: 279–296.
5. Viney TJ, Balint K, Hillier D, Siegert S, Boldogkoi Z, et al. (2007) Local retinal
circuits of melanopsin-containing ganglion cells identified by transsynaptic viral
tracing. Curr Biol 17: 981–988.
6. Guler AD, Ecker JL, Lall GS, Haq S, Altimus CM, et al. (2008) Melanopsin cellsare the principal conduits for rod-cone input to non-image-forming vision.
Nature 2008 453: 102–105.
7. Goz D, Studholme K, Lappi DA, Rollag MD, Provencio I, et al. (2008)
Targeted destruction of photosensitive retinal ganglion cells with a saporinconjugate alters the effects of light on mouse circadian rhythms. PLoS One 3:
e3153. doi:10.1371/journal.pone.0003153.
8. Altimus CM, Guler AD, Villa KL, McNeill DS, Legates TA, et al. (2008) Rods-
cones and melanopsin detect light and dark to modulate sleep independent of
image formation. Proc Natl Acad Sci U S A 105: 19998–20003.
9. Lupi D, Oster H, Thompson S, Foster RG (2008) The acute light-induction ofsleep is mediated by OPN4-based photoreception. Nat Neurosci 11: 1068–1073.
10. Noseda R, Kainz V, Jakubowski M, Gooley JJ, Saper CB, et al. (2010) A neuralmechanism for exacerbation of headache by light. Nat Neurosci 13: 239–245.
11. Hatori M, Le H, Vollmers C, Keding SR, Tanaka N, et al. (2008) Inducible
ablation of melanopsin-expressing retinal ganglion cells reveals their central role
in non-image forming visual responses. PLoS One 3: e2451. doi:10.1371/journal.pone.0002451.
12. Dacey DM, Liao HW, Peterson BB, Robinson FR, Smith VC, et al. (2005)Melanopsin-expressing ganglion cells in primate retina signal colour and
irradiance and project to the LGN. Nature 433: 749–754.
13. Hattar S, Kumar M, Park A, Tong P, Tung J, et al. (2006) Central projections of
melanopsin-expressing retinal ganglion cells in the mouse. J Comp Neurol 497:326–349.
14. Gooley JJ, Lu J, Fischer D, Saper CB (2003) A broad role for melanopsin in
nonvisual photoreception. J Neurosci 23: 7093–7106.
15. Hannibal J, Fahrenkrug J (2004) Target areas innervated by PACAP-
immunoreactive retinal ganglion cells. Cell Tissue Res 316: 99–113.
16. Baver SB, Pickard GE, Sollars PJ, Pickard GE (2008) Two types of melanopsin
retinal ganglion cell differentially innervate the hypothalamic suprachiasmaticnucleus and the olivary pretectal nucleus. Eur J Neurosci 27: 1763–1770.
17. Schmidt TM, Kofuji P (2009) Functional and morphological differences amongintrinsically photosensitive retinal ganglion cells. J Neurosci 29: 476–482.
18. Ecker JL, Dumitrescu ON, Wong KY, Alam NM, Chen SK, et al. (2010)
Melanopsin-expressing retinal ganglion-cell photoreceptors: cellular diversity
and role in pattern vision. Neuron 67: 49–60.
19. Lobe CG, Koop KE, Kreppner W, Lomeli H, Gertsenstein M, et al. (1999) Z/AP, a double reporter for cre-mediated recombination. Dev Biol 208: 281–292.
20. Novak A, Guo C, Yang W, Nagy A, Lobe CG (2001) Z/EG, a double reportermouse line that expresses enhanced green fluorescent protein upon Cre-
mediated excision. Genesis 28: 147–155.
21. Freedman MS, Lucas RJ, Soni B, von Schantz M, Munoz M, et al. (1999)
Regulation of mammalian circadian behavior by non-rod, non-cone, ocularphotoreceptors. Science 284: 502–504.
22. Lucas RJ, Freedman MS, Munoz M, Garcia-Fernandez JM, Foster RG (1999)Regulation of the mammalian pineal by non-rod, non-cone, ocular photore-
ceptors. Science 284: 505–507.
23. Lucas RJ, Douglas RH, Foster RG (2001) Characterization of an ocular
photopigment capable of driving pupillary constriction in mice. Nat Neurosci 4:621–626.
24. Berson DM, Dunn FA, Takao M (2002) Phototransduction by retinal ganglion
cells that set the circadian clock. Science 295: 1070–1073.
25. Warren EJ, Allen CN, Brown RL, Robinson DW (2003) The light-activated
signaling pathway in SCN-projecting rat retinal ganglion cells. Eur J Neurosci23: 2477–2487.
26. Tu DC, Zhang D, Demas J, Slutsky EB, Provencio I, et al. (2005) Physiologic
diversity and development of intrinsically photosensitive retinal ganglion cells.
Neuron 48: 987–999.
27. Do MT, Kang SH, Xue T, Zhong H, Liao HW, et al. (2009) Photon capture
and signalling by melanopsin retinal ganglion cells. Nature 457: 281–287.
28. Malonek D, Grinvald A (1996) Interactions between electrical activity and
cortical microcirculation revealed by imaging spectroscopy: implications for
functional brain mapping. Science 272: 551–554.
29. Mayhew J, Zheng Y, Hou Y, Vuksanovic B, Berwick J, et al. (1999)
Spectroscopic analysis of changes in remitted illumination: the response to
increased neural activity in brain. Neuroimage 10: 304–326.
30. Schuett S, Bonhoeffer T, Hubener M (2002) Mapping retinotopic structure in
mouse visual cortex with optical imaging. J Neurosci 22: 6549–6559.
31. Heimel JA, Hartman RJ, Hermans JM, Levelt CN (2007) Screening mouse
vision with intrinsic signal optical imaging. Eur J Neurosci 25: 795–804.
32. Harker KT, Whishaw IQ (2004) A reaffirmation of the retrosplenial
contribution to rodent navigation: reviewing the influences of lesion, strain,
and task. Neurosci Biobehav Rev 28: 485–496.
33. van Brussel L, Gerits A, Arckens L (2009) Identification and localization of
functional subdivisions in the visual cortex of the adult mouse. J Comp Neurol
514: 107–116.
34. Wagor E, Mangini NJ, Pearlman AL (1980) Retinotopic organization of striate
and extrastriate visual cortex in the mouse. J Comp Neurol 193: 187–202.
35. Olavarria J, Mignano LR, Van Sluyters RC (1982) Pattern of extrastriate visual
areas connecting reciprocally with striate cortex in the mouse. Exp Neurol 78:
775–779.
36. Van der Gucht E, Hof PR, Van Brussel L, Burnat K, Arckens L (2007)
Neurofilament protein and neuronal activity markers define regional architec-
tonic parcellation in the mouse visual cortex. Cereb Cortex 17: 2805–
2819.
37. Wu SM, Gao F, Pang JJ (2004) Synaptic circuitry mediating light-evoked signals
in dark-adapted mouse retina. Vision Res 44: 3277–3288.
38. Woodruff ML, Janisch KM, Peshenko IV, Dizhoor AM, Tsang SH, et al. (2008)
Modulation of phosphodiesterase6 turnoff during background illumination in
mouse rod photoreceptors. J Neurosci 28: 2064–2074.
39. Baylor DA, Nunn BJ, Schnapf JL (1984) The photocurrent, noise and spectral
sensitivity of rods of the monkey Macaca fascicularis. J Physiol 357: 575–607.
40. Tamura T, Nakatani K, Yau KW (1991) Calcium feedback and sensitivity
regulation in primate rods. J Gen Physiol 98: 95–130.
41. Smallwood PM, Olveczky BP, Williams GL, Jacobs GH, Reese BE, et al.
Genetically engineered mice with an additional class of cone photoreceptors:
implications for the evolution of color vision. Proc Natl Acad Sci U S A 100:
11706–11711.
42. Lall GS, Revell VL, Momiji H, Al Enezi J, Altimus CM, et al. (2010) Distinct
contributions of rod, cone, and melanopsin photoreceptors to encoding
irradiance. Neuron 66: 417–429.
43. Marrocco RT (1975) Possible neural basis of brightness magnitude estimations.
Brain Res 86: 128–133.
44. Grubb MS, Thompson ID (2003) Quantitative characterization of visual
response properties in the mouse dorsal lateral geniculate nucleus. J Neurophysiol
90: 3594–3607.
45. Van Hooser SD, Heimel JA, Nelson SB (2003) Receptive field properties and
laminar organization oflateral geniculate nucleus in the gray squirrel (Sciurus
carolinensis). J Neurophysiol 90: 3398–3418.
46. Harrington ME, Rusak B (1989) Photic responses of geniculo-hypothalamic tract
neurons in the Syrian hamster. Vis Neurosci 2: 367–375.
47. Cleland BG, Dubin MW, Levick WR (1971) Sustained and transient neurones in
the cat’s retina and lateral geniculate nucleus. J Physiol 217: 473–496.
48. Nathan J, Reh R, Ankoudinova I, Ankoudinova G, Chang B, et al. (2006)
Scotopic and photopic visual thresholds and spatial and temporal discrimination
evaluated by behavior of mice in a water maze. Photochem Photobiol 82:
1489–1494.
49. van Wyk M, Wassle H, Taylor WR (2009) Receptive field properties of ON- and
OFF-ganglion cells in the mouse retina. Vis Neurosci 26: 297–308.
50. Lucas RJ, Hattar S, Takao M, Berson DM, Foster RG, et al. (2003) Diminished
pupillary light reflex at high irradiances in melanopsin-knockout mice. Science
299: 245–247.
Melanopsin Contributions to Irradiance Coding
PLoS Biology | www.plosbiology.org 13 December 2010 | Volume 8 | Issue 12 | e1000558
51. Panda S, Provencio I, Tu DC, Pires SS, Rollag MD, et al. (2003) Melanopsin is
required for non-image-forming photic responses in blind mice. Science 301:525–527.
52. Nikonov SS, Kholodenko R, Lem J, Pugh EN, Jr. (2006) Physiological features
of the S- and M-cone photoreceptors of wild-type mice from single-cellrecordings. J Gen Physiol 127: 359–374.
53. Burkhardt DA (1994) Light adaptation and photopigment bleaching in conephotoreceptors in situ in the retina of the turtle. J Neurosci 14: 1091–1105.
54. Logvinenko AD (2005) Does luminance contrast determine lightness? Spat Vis
18: 337–345.55. Blakeslee B, Reetz D, McCourt ME (2008) Coming to terms with lightness and
brightness: effects of stimulus configuration and instructions on brightness andlightness judgments. J Vis 8: 1–14.
56. Barlow RB, Verrillo RT (1976) Brightness sensation in a ganzfeld. Vision Res16: 1291–1297.
57. Knau H (2000) Thresholds for detecting slowly changing Ganzfeld luminances.
J Opt Soc Am A Opt Image Sci Vis 17: 1382–1387.58. Harrington RE (1954) The effects of color temperature on apparent brightness.
J Opt Soc Am 44: 113–116.59. Berman SM, Jewett DL, Fein G, Saika G, Ashford F (1990) Photopic luminance
does not always predict perceived room brightness. Light Res Tech 22: 37–41.
60. Akashi Y, Boyce PR (2006) A field study of illuminance reduction. Energy Build28: 588–599.
61. Stone C, Pinto LH (1993) Response properties of ganglion cells in the isolatedmouse retina. Vis Neurosci 10: 31–39.
62. Rossi FM, Pizzorusso T, Porciatti V, Marubio LM, Maffei L, et al. (2001)Requirement of the nicotinic acetylcholine receptor beta 2 subunit for the
anatomical and functional development of the visual system. Proc Natl Acad
Sci U S A 98: 6453–6458.63. Prusky GT, West PW, Douglas RM (2000) Behavioral assessment of visual
acuity in mice and rats. Vision Res 40: 2201–2209.
64. Mrosovsky N, Salmon PA (2002) Learned arbitrary responses to light in micewithout rods or cones. Naturwissenschaften 89: 525–527.
65. Zaidi FH, Hull JT, Peirson SN, Wulff K, Aeschbach D, et al. (2007) Short-wavelength light sensitivity of circadian, pupillary, and visual awareness in
humans lacking an outer retina. Curr Biol 17: 2122–2128.
66. Czeisler CA, Shanahan TL, Klerman EB, Martens H, Brotman DJ, et al. (1995)Suppression of melatonin secretion in some blind patients by exposure to bright
light. N Engl J Med 332: 6–11.67. Rotolo T, Smallwood PM, Williams J, Nathans J (2008) Genetically-directed,
cell type-specific sparse labeling for the analysis of neuronal morphology. PLoSOne 3: e4099. doi:10.1371/journal.pone.0004099.
68. Pulivarthy SR, Tanaka N, Welsh DK, De Haro L, Verma IM, et al. (2007)
Reciprocity between phase shifts and amplitude changes in the mammaliancircadian clock. Proc Natl Acad Sci U S A 104: 20356–20361.
69. Govardovskii VI, Fyhrquist N, Reuter T, Kuzmin DG, Donner K (2000) Insearch of the visual pigment template. Vis Neurosci 17: 509–528.
70. Paxinos G, Franklin KBJ (2001) The mouse brain in stereotaxic coordinates:
Second Edition. San Diego: Academic Press.71. Moldestad O, Karlsen P, Molden S, Storm JF (2009) Tracheotomy improves
experiment success rate in mice during urethane anesthesia and stereotaxicsurgery. J Neurosci Methods 176: 57–62.
72. Franklin KBJ, Paxinos G (2008) The mouse brain in stereotaxic coordinates.Third Edition. San Diego: Academic Press.
Melanopsin Contributions to Irradiance Coding
PLoS Biology | www.plosbiology.org 14 December 2010 | Volume 8 | Issue 12 | e1000558
Copyright © 2022 FDOKUMEN