Assessment of the impact of salinity and irradiance on the combined carbon dioxide sequestration and...
20
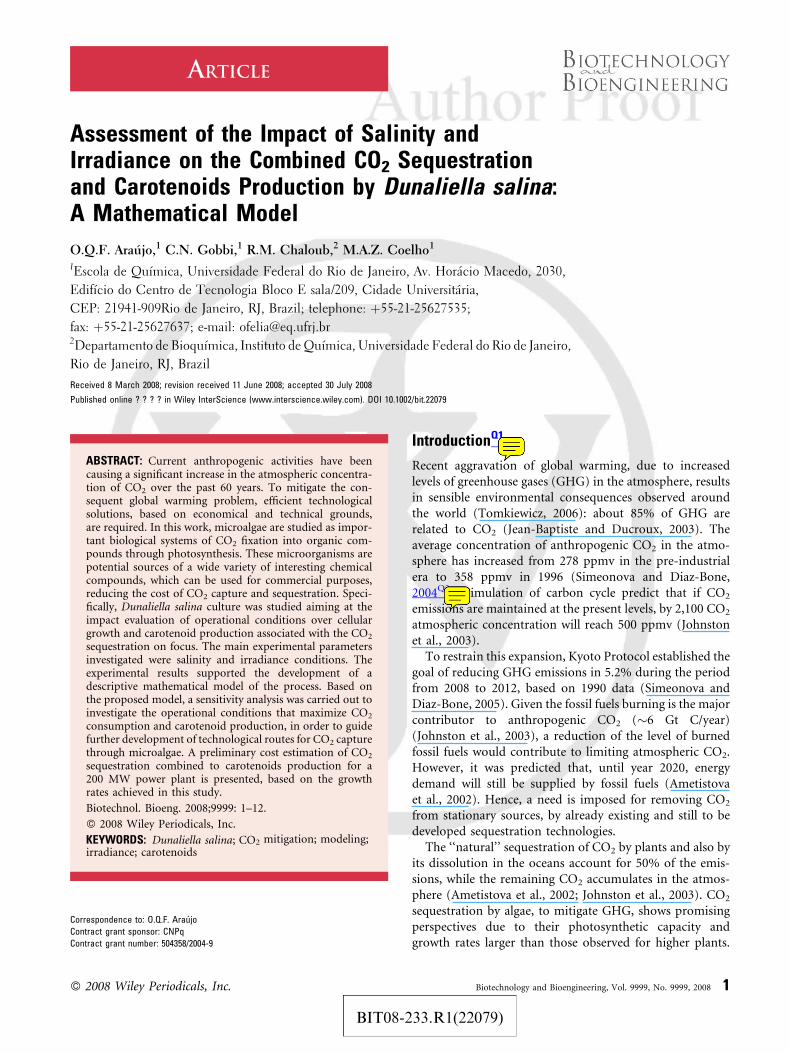
ARTICLE Assessment of the Impact of Salinity and Irradiance on the Combined CO 2 Sequestration and Carotenoids Production by Dunaliella salina: A Mathematical Model O.Q.F. Arau ´ jo, 1 C.N. Gobbi, 1 R.M. Chaloub, 2 M.A.Z. Coelho 1 1 Escola de Quı´mica, Universidade Federal do Rio de Janeiro, Av. Hora ´cio Macedo, 2030, Edifı´cio do Centro de Tecnologia Bloco E sala/209, Cidade Universita ´ria, CEP: 21941-909Rio de Janeiro, RJ, Brazil; telephone: þ55-21-25627535; fax: þ55-21-25627637; e-mail: [email protected] 2 Departamento de Bioquı´mica, Instituto de Quı´mica, Universidade Federal do Rio de Janeiro, Rio de Janeiro, RJ, Brazil Received 8 March 2008; revision received 11 June 2008; accepted 30 July 2008 Published online ? ? ? ? in Wiley InterScience (www.interscience.wiley.com). DOI 10.1002/bit.22079 ABSTRACT: Current anthropogenic activities have been causing a significant increase in the atmospheric concentra- tion of CO 2 over the past 60 years. To mitigate the con- sequent global warming problem, efficient technological solutions, based on economical and technical grounds, are required. In this work, microalgae are studied as impor- tant biological systems of CO 2 fixation into organic com- pounds through photosynthesis. These microorganisms are potential sources of a wide variety of interesting chemical compounds, which can be used for commercial purposes, reducing the cost of CO 2 capture and sequestration. Speci- fically, Dunaliella salina culture was studied aiming at the impact evaluation of operational conditions over cellular growth and carotenoid production associated with the CO 2 sequestration on focus. The main experimental parameters investigated were salinity and irradiance conditions. The experimental results supported the development of a descriptive mathematical model of the process. Based on the proposed model, a sensitivity analysis was carried out to investigate the operational conditions that maximize CO 2 consumption and carotenoid production, in order to guide further development of technological routes for CO 2 capture through microalgae. A preliminary cost estimation of CO 2 sequestration combined to carotenoids production for a 200 MW power plant is presented, based on the growth rates achieved in this study. Biotechnol. Bioeng. 2008;9999: 1–12. ß 2008 Wiley Periodicals, Inc. KEYWORDS: Dunaliella salina; CO2 mitigation; modeling; irradiance; carotenoids Introduction Q1 Recent aggravation of global warming, due to increased levels of greenhouse gases (GHG) in the atmosphere, results in sensible environmental consequences observed around the world (Tomkiewicz, 2006): about 85% of GHG are related to CO 2 (Jean-Baptiste and Ducroux, 2003). The average concentration of anthropogenic CO 2 in the atmo- sphere has increased from 278 ppmv in the pre-industrial era to 358 ppmv in 1996 (Simeonova and Diaz-Bone, 2004 Q2 ). Simulation of carbon cycle predict that if CO 2 emissions are maintained at the present levels, by 2,100 CO 2 atmospheric concentration will reach 500 ppmv (Johnston et al., 2003). To restrain this expansion, Kyoto Protocol established the goal of reducing GHG emissions in 5.2% during the period from 2008 to 2012, based on 1990 data (Simeonova and Diaz-Bone, 2005). Given the fossil fuels burning is the major contributor to anthropogenic CO 2 (6 Gt C/year) (Johnston et al., 2003), a reduction of the level of burned fossil fuels would contribute to limiting atmospheric CO 2 . However, it was predicted that, until year 2020, energy demand will still be supplied by fossil fuels (Ametistova et al., 2002). Hence, a need is imposed for removing CO 2 from stationary sources, by already existing and still to be developed sequestration technologies. The ‘‘natural’’ sequestration of CO 2 by plants and also by its dissolution in the oceans account for 50% of the emis- sions, while the remaining CO 2 accumulates in the atmos- phere (Ametistova et al., 2002; Johnston et al., 2003). CO 2 sequestration by algae, to mitigate GHG, shows promising perspectives due to their photosynthetic capacity and growth rates larger than those observed for higher plants. Correspondence to: O.Q.F. Arau ´jo Contract grant sponsor: CNPq Contract grant number: 504358/2004-9 ß 2008 Wiley Periodicals, Inc. Biotechnology and Bioengineering, Vol. 9999, No. 9999, 2008 1 BIT08-233.R1(22079)
Transcript of Assessment of the impact of salinity and irradiance on the combined carbon dioxide sequestration and...
ARTICLE
Assessment of the Impact of Salinity andIrradiance on the Combined CO2 Sequestrationand Carotenoids Production by Dunaliella salina:A Mathematical Model
O.Q.F. Araujo,1 C.N. Gobbi,1 R.M. Chaloub,2 M.A.Z. Coelho1
1Escola de Quımica, Universidade Federal do Rio de Janeiro, Av. Horacio Macedo, 2030,
Edifıcio do Centro de Tecnologia Bloco E sala/209, Cidade Universitaria,
CEP: 21941-909Rio de Janeiro, RJ, Brazil; telephone: þ55-21-25627535;
fax: þ55-21-25627637; e-mail: [email protected] de Bioquımica, Instituto de Quımica, Universidade Federal do Rio de Janeiro,
Rio de Janeiro, RJ, Brazil
Received 8 March 2008; revision received 11 June 2008; accepted 30 July 2008
Published online ? ? ? ? in Wiley InterScience (www.interscience.wiley.com). DOI 10
.1002/bit.22079ABSTRACT: Current anthropogenic activities have beencausing a significant increase in the atmospheric concentra-tion of CO2 over the past 60 years. To mitigate the con-sequent global warming problem, efficient technologicalsolutions, based on economical and technical grounds,are required. In this work, microalgae are studied as impor-tant biological systems of CO2 fixation into organic com-pounds through photosynthesis. These microorganisms arepotential sources of a wide variety of interesting chemicalcompounds, which can be used for commercial purposes,reducing the cost of CO2 capture and sequestration. Speci-fically, Dunaliella salina culture was studied aiming at theimpact evaluation of operational conditions over cellulargrowth and carotenoid production associated with the CO2
sequestration on focus. The main experimental parametersinvestigated were salinity and irradiance conditions. Theexperimental results supported the development of adescriptive mathematical model of the process. Based onthe proposed model, a sensitivity analysis was carried out toinvestigate the operational conditions that maximize CO2
consumption and carotenoid production, in order to guidefurther development of technological routes for CO2 capturethrough microalgae. A preliminary cost estimation of CO2
sequestration combined to carotenoids production for a200 MW power plant is presented, based on the growthrates achieved in this study.
Biotechnol. Bioeng. 2008;9999: 1–12.
� 2008 Wiley Periodicals, Inc.
KEYWORDS: Dunaliella salina; CO2 mitigation; modeling;irradiance; carotenoids
Correspondence to: O.Q.F. Araujo
Contract grant sponsor: CNPq
Contract grant number: 504358/2004-9
� 2008 Wiley Periodicals, Inc.
BIT08-2
IntroductionQ1
Recent aggravation of global warming, due to increasedlevels of greenhouse gases (GHG) in the atmosphere, resultsin sensible environmental consequences observed aroundthe world (Tomkiewicz, 2006): about 85% of GHG arerelated to CO2 (Jean-Baptiste and Ducroux, 2003). Theaverage concentration of anthropogenic CO2 in the atmo-sphere has increased from 278 ppmv in the pre-industrialera to 358 ppmv in 1996 (Simeonova and Diaz-Bone,2004Q2). Simulation of carbon cycle predict that if CO2
emissions are maintained at the present levels, by 2,100 CO2
atmospheric concentration will reach 500 ppmv (Johnstonet al., 2003).
To restrain this expansion, Kyoto Protocol established thegoal of reducing GHG emissions in 5.2% during the periodfrom 2008 to 2012, based on 1990 data (Simeonova andDiaz-Bone, 2005). Given the fossil fuels burning is the majorcontributor to anthropogenic CO2 (�6 Gt C/year)(Johnston et al., 2003), a reduction of the level of burnedfossil fuels would contribute to limiting atmospheric CO2.However, it was predicted that, until year 2020, energydemand will still be supplied by fossil fuels (Ametistovaet al., 2002). Hence, a need is imposed for removing CO2
from stationary sources, by already existing and still to bedeveloped sequestration technologies.
The ‘‘natural’’ sequestration of CO2 by plants and also byits dissolution in the oceans account for 50% of the emis-sions, while the remaining CO2 accumulates in the atmos-phere (Ametistova et al., 2002; Johnston et al., 2003). CO2
sequestration by algae, to mitigate GHG, shows promisingperspectives due to their photosynthetic capacity andgrowth rates larger than those observed for higher plants.
Biotechnology and Bioengineering, Vol. 9999, No. 9999, 2008 1
33.R1(22079)
Maria_Alice
Nota
The order of the section headings is ok.
Maria_Alice
Nota
please change the year: 2005
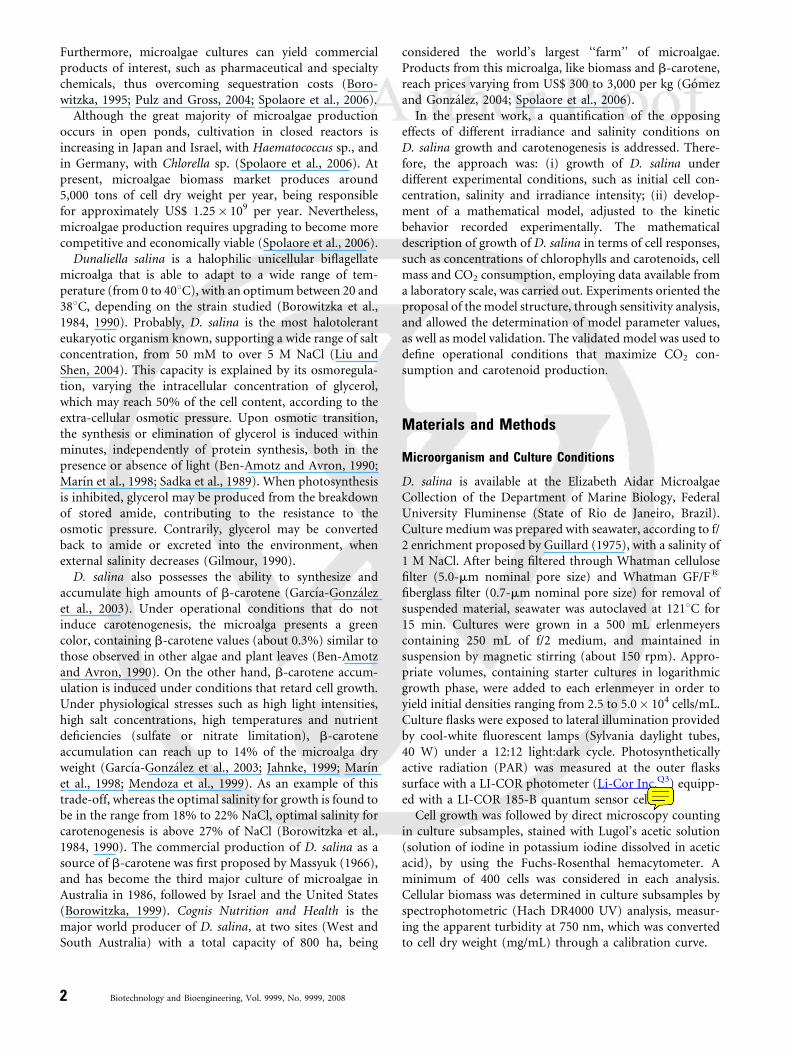
Furthermore, microalgae cultures can yield commercialproducts of interest, such as pharmaceutical and specialtychemicals, thus overcoming sequestration costs (Boro-witzka, 1995; Pulz and Gross, 2004; Spolaore et al., 2006).
Although the great majority of microalgae productionoccurs in open ponds, cultivation in closed reactors isincreasing in Japan and Israel, with Haematococcus sp., andin Germany, with Chlorella sp. (Spolaore et al., 2006). Atpresent, microalgae biomass market produces around5,000 tons of cell dry weight per year, being responsiblefor approximately US$ 1.25� 109 per year. Nevertheless,microalgae production requires upgrading to become morecompetitive and economically viable (Spolaore et al., 2006).
Dunaliella salina is a halophilic unicellular biflagellatemicroalga that is able to adapt to a wide range of tem-perature (from 0 to 408C), with an optimum between 20 and388C, depending on the strain studied (Borowitzka et al.,1984, 1990). Probably, D. salina is the most halotoleranteukaryotic organism known, supporting a wide range of saltconcentration, from 50 mM to over 5 M NaCl (Liu andShen, 2004). This capacity is explained by its osmoregula-tion, varying the intracellular concentration of glycerol,which may reach 50% of the cell content, according to theextra-cellular osmotic pressure. Upon osmotic transition,the synthesis or elimination of glycerol is induced withinminutes, independently of protein synthesis, both in thepresence or absence of light (Ben-Amotz and Avron, 1990;Marın et al., 1998; Sadka et al., 1989). When photosynthesisis inhibited, glycerol may be produced from the breakdownof stored amide, contributing to the resistance to theosmotic pressure. Contrarily, glycerol may be convertedback to amide or excreted into the environment, whenexternal salinity decreases (Gilmour, 1990).
D. salina also possesses the ability to synthesize andaccumulate high amounts of b-carotene (Garcıa-Gonzalezet al., 2003). Under operational conditions that do notinduce carotenogenesis, the microalga presents a greencolor, containing b-carotene values (about 0.3%) similar tothose observed in other algae and plant leaves (Ben-Amotzand Avron, 1990). On the other hand, b-carotene accum-ulation is induced under conditions that retard cell growth.Under physiological stresses such as high light intensities,high salt concentrations, high temperatures and nutrientdeficiencies (sulfate or nitrate limitation), b-caroteneaccumulation can reach up to 14% of the microalga dryweight (Garcıa-Gonzalez et al., 2003; Jahnke, 1999; Marınet al., 1998; Mendoza et al., 1999). As an example of thistrade-off, whereas the optimal salinity for growth is found tobe in the range from 18% to 22% NaCl, optimal salinity forcarotenogenesis is above 27% of NaCl (Borowitzka et al.,1984, 1990). The commercial production of D. salina as asource of b-carotene was first proposed by Massyuk (1966),and has become the third major culture of microalgae inAustralia in 1986, followed by Israel and the United States(Borowitzka, 1999). Cognis Nutrition and Health is themajor world producer of D. salina, at two sites (West andSouth Australia) with a total capacity of 800 ha, being
2 Biotechnology and Bioengineering, Vol. 9999, No. 9999, 2008
considered the world’s largest ‘‘farm’’ of microalgae.Products from this microalga, like biomass and b-carotene,reach prices varying from US$ 300 to 3,000 per kg (Gomezand Gonzalez, 2004; Spolaore et al., 2006).
In the present work, a quantification of the opposingeffects of different irradiance and salinity conditions onD. salina growth and carotenogenesis is addressed. There-fore, the approach was: (i) growth of D. salina underdifferent experimental conditions, such as initial cell con-centration, salinity and irradiance intensity; (ii) develop-ment of a mathematical model, adjusted to the kineticbehavior recorded experimentally. The mathematicaldescription of growth of D. salina in terms of cell responses,such as concentrations of chlorophylls and carotenoids, cellmass and CO2 consumption, employing data available froma laboratory scale, was carried out. Experiments oriented theproposal of the model structure, through sensitivity analysis,and allowed the determination of model parameter values,as well as model validation. The validated model was used todefine operational conditions that maximize CO2 con-sumption and carotenoid production.
Materials and Methods
Microorganism and Culture Conditions
D. salina is available at the Elizabeth Aidar MicroalgaeCollection of the Department of Marine Biology, FederalUniversity Fluminense (State of Rio de Janeiro, Brazil).Culture medium was prepared with seawater, according to f/2 enrichment proposed by Guillard (1975), with a salinity of1 M NaCl. After being filtered through Whatman cellulosefilter (5.0-mm nominal pore size) and Whatman GF/F1
fiberglass filter (0.7-mm nominal pore size) for removal ofsuspended material, seawater was autoclaved at 1218C for15 min. Cultures were grown in a 500 mL erlenmeyerscontaining 250 mL of f/2 medium, and maintained insuspension by magnetic stirring (about 150 rpm). Appro-priate volumes, containing starter cultures in logarithmicgrowth phase, were added to each erlenmeyer in order toyield initial densities ranging from 2.5 to 5.0� 104 cells/mL.Culture flasks were exposed to lateral illumination providedby cool-white fluorescent lamps (Sylvania daylight tubes,40 W) under a 12:12 light:dark cycle. Photosyntheticallyactive radiation (PAR) was measured at the outer flaskssurface with a LI-COR photometer (Li-Cor Inc.Q3) equipp-ed with a LI-COR 185-B quantum sensor cell.
Cell growth was followed by direct microscopy countingin culture subsamples, stained with Lugol’s acetic solution(solution of iodine in potassium iodine dissolved in aceticacid), by using the Fuchs-Rosenthal hemacytometer. Aminimum of 400 cells was considered in each analysis.Cellular biomass was determined in culture subsamples byspectrophotometric (Hach DR4000 UV) analysis, measur-ing the apparent turbidity at 750 nm, which was convertedto cell dry weight (mg/mL) through a calibration curve.
Maria_Alice
Nota
Lincoln, Nebraska, USA
Stock culture of D. salina was maintained in f/2 mediumat 218C. Culture was exposed to light intensity of 50 mE/m2/sunder 12:12 light:dark cycle, and submitted to manualshaking once a day.
Pigment Analysis
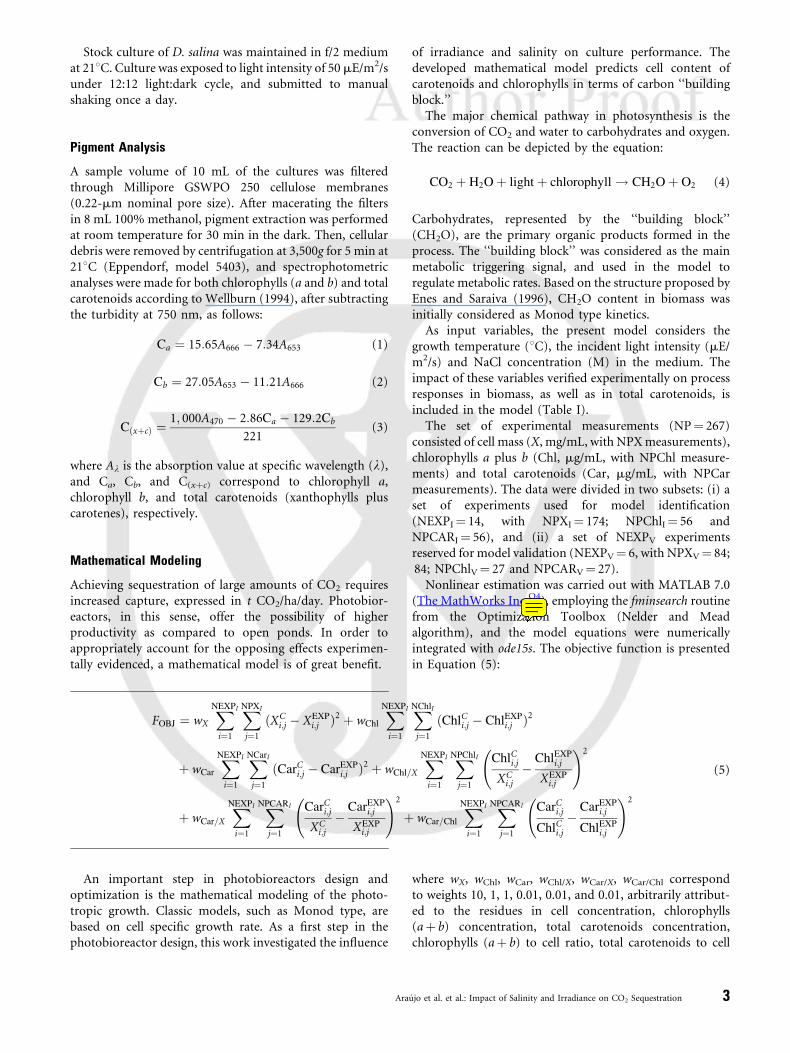
A sample volume of 10 mL of the cultures was filteredthrough Millipore GSWPO 250 cellulose membranes(0.22-mm nominal pore size). After macerating the filtersin 8 mL 100% methanol, pigment extraction was performedat room temperature for 30 min in the dark. Then, cellulardebris were removed by centrifugation at 3,500g for 5 min at218C (Eppendorf, model 5403), and spectrophotometricanalyses were made for both chlorophylls (a and b) and totalcarotenoids according to Wellburn (1994), after subtractingthe turbidity at 750 nm, as follows:
Ca ¼ 15:65A666 � 7:34A653 (1)
Cb ¼ 27:05A653 � 11:21A666 (2)
CðxþcÞ ¼1; 000A470 � 2:86Ca � 129:2Cb
221(3)
where Al is the absorption value at specific wavelength (l),and Ca, Cb, and C(xþc) correspond to chlorophyll a,chlorophyll b, and total carotenoids (xanthophylls pluscarotenes), respectively.
Mathematical Modeling
Achieving sequestration of large amounts of CO2 requiresincreased capture, expressed in t CO2/ha/day. Photobior-eactors, in this sense, offer the possibility of higherproductivity as compared to open ponds. In order toappropriately account for the opposing effects experimen-tally evidenced, a mathematical model is of great benefit.
FOBJ ¼ wX
XNEXPI
i¼1
XNPXI
j¼1
ðXCi;j � XEXP
i;j Þ2 þ wChl
XNEXPI
i¼1
XNChlI
j¼1
ðChlCi;j � ChlEXP
i;j Þ2
þ wCar
XNEXPI
i¼1
XNCarI
j¼1
ðCarCi;j � CarEXP
i;j Þ2 þ wChl=X
XNEXPI
i¼1
XNPChlI
j¼1
ChlCi;j
XCi;j
�ChlEXP
i;j
XEXPi;j
!2
þ wCar=X
XNEXPI
i¼1
XNPCARI
j¼1
CarCi;j
XCi;j
�CarEXP
i;j
XEXPi;j
!2
þ wCar=Chl
XNEXPI
i¼1
XNPCARI
j¼1
CarCi;j
ChlCi;j
�CarEXP
i;j
ChlEXPi;j
!2
(5)
An important step in photobioreactors design andoptimization is the mathematical modeling of the photo-tropic growth. Classic models, such as Monod type, arebased on cell specific growth rate. As a first step in thephotobioreactor design, this work investigated the influence
Ara
of irradiance and salinity on culture performance. Thedeveloped mathematical model predicts cell content ofcarotenoids and chlorophylls in terms of carbon ‘‘buildingblock.’’
The major chemical pathway in photosynthesis is theconversion of CO2 and water to carbohydrates and oxygen.The reaction can be depicted by the equation:
CO2 þ H2O þ light þ chlorophyll ! CH2O þ O2 (4)
Carbohydrates, represented by the ‘‘building block’’(CH2O), are the primary organic products formed in theprocess. The ‘‘building block’’ was considered as the mainmetabolic triggering signal, and used in the model toregulate metabolic rates. Based on the structure proposed byEnes and Saraiva (1996), CH2O content in biomass wasinitially considered as Monod type kinetics.
As input variables, the present model considers thegrowth temperature (8C), the incident light intensity (mE/m2/s) and NaCl concentration (M) in the medium. Theimpact of these variables verified experimentally on processresponses in biomass, as well as in total carotenoids, isincluded in the model (Table I).
The set of experimental measurements (NP¼ 267)consisted of cell mass (X, mg/mL, with NPX measurements),chlorophylls a plus b (Chl, mg/mL, with NPChl measure-ments) and total carotenoids (Car, mg/mL, with NPCarmeasurements). The data were divided in two subsets: (i) aset of experiments used for model identification(NEXPI¼ 14, with NPXI¼ 174; NPChlI¼ 56 andNPCARI ¼ 56), and (ii) a set of NEXPV experimentsreserved for model validation (NEXPV¼ 6, with NPXV¼ 84;84; NPChlV¼ 27 and NPCARV¼ 27).
Nonlinear estimation was carried out with MATLAB 7.0(The MathWorks Inc.Q4), employing the fminsearch routinefrom the Optimization Toolbox (Nelder and Meadalgorithm), and the model equations were numericallyintegrated with ode15s. The objective function is presentedin Equation (5):
where wX, wChl, wCar, wChl/X, wCar/X, wCar/Chl correspondto weights 10, 1, 1, 0.01, 0.01, and 0.01, arbitrarily attribut-ed to the residues in cell concentration, chlorophylls(aþ b) concentration, total carotenoids concentration,chlorophylls (aþ b) to cell ratio, total carotenoids to cell
ujo et al. et al.: Impact of Salinity and Irradiance on CO2 Sequestration 3
Maria_Alice
Nota
Natick, USA
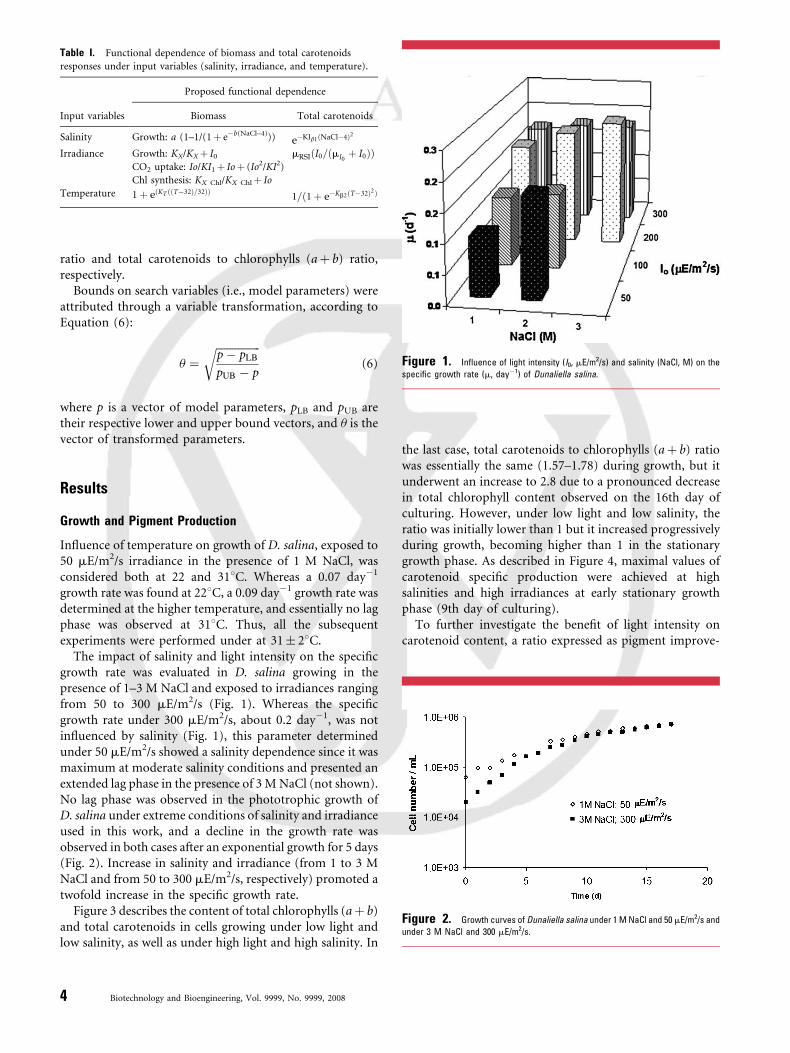
Table I. Functional dependence of biomass and total carotenoids
responses under input variables (salinity, irradiance, and temperature).
Input variables
Proposed functional dependence
Biomass Total carotenoids
Salinity Growth: a (1–1/(1þ e�b(NaCl–4))) e�KIb1ðNaCl�4Þ2
Irradiance Growth: KX/KXþ I0 mRSIðI0=ðmI0þ I0ÞÞ
CO2 uptake: Io/KI1þ Ioþ (Io2/KI2)
Chl synthesis: KX Chl/KX Chlþ Io
Temperature 1 þ eðKT ððT�32Þ=32ÞÞ1=ð1 þ e�Kb2ðT�32Þ2Þ
Figure 1. Influence of light intensity (I0, mE/m2/s) and salinity (NaCl, M) on the
specific growth rate (m, day�1) of Dunaliella salina.
ratio and total carotenoids to chlorophylls (aþ b) ratio,respectively.
Bounds on search variables (i.e., model parameters) wereattributed through a variable transformation, according toEquation (6):
u ¼ffiffiffiffiffiffiffiffiffiffiffiffiffiffiffiffip � pLB
pUB � p
r(6)
where p is a vector of model parameters, pLB and pUB aretheir respective lower and upper bound vectors, and u is thevector of transformed parameters.
Figure 2. Growth curves of Dunaliella salina under 1 M NaCl and 50 mE/m2/s and
under 3 M NaCl and 300 mE/m2/s.
Results
Growth and Pigment Production
Influence of temperature on growth of D. salina, exposed to50 mE/m2/s irradiance in the presence of 1 M NaCl, wasconsidered both at 22 and 318C. Whereas a 0.07 day�1
growth rate was found at 228C, a 0.09 day�1 growth rate wasdetermined at the higher temperature, and essentially no lagphase was observed at 318C. Thus, all the subsequentexperiments were performed under at 31 28C.
The impact of salinity and light intensity on the specificgrowth rate was evaluated in D. salina growing in thepresence of 1–3 M NaCl and exposed to irradiances rangingfrom 50 to 300 mE/m2/s (Fig. 1). Whereas the specificgrowth rate under 300 mE/m2/s, about 0.2 day�1, was notinfluenced by salinity (Fig. 1), this parameter determinedunder 50 mE/m2/s showed a salinity dependence since it wasmaximum at moderate salinity conditions and presented anextended lag phase in the presence of 3 M NaCl (not shown).No lag phase was observed in the phototrophic growth ofD. salina under extreme conditions of salinity and irradianceused in this work, and a decline in the growth rate wasobserved in both cases after an exponential growth for 5 days(Fig. 2). Increase in salinity and irradiance (from 1 to 3 MNaCl and from 50 to 300 mE/m2/s, respectively) promoted atwofold increase in the specific growth rate.
Figure 3 describes the content of total chlorophylls (aþ b)and total carotenoids in cells growing under low light andlow salinity, as well as under high light and high salinity. In
4 Biotechnology and Bioengineering, Vol. 9999, No. 9999, 2008
the last case, total carotenoids to chlorophylls (aþ b) ratiowas essentially the same (1.57–1.78) during growth, but itunderwent an increase to 2.8 due to a pronounced decreasein total chlorophyll content observed on the 16th day ofculturing. However, under low light and low salinity, theratio was initially lower than 1 but it increased progressivelyduring growth, becoming higher than 1 in the stationarygrowth phase. As described in Figure 4, maximal values ofcarotenoid specific production were achieved at highsalinities and high irradiances at early stationary growthphase (9th day of culturing).
To further investigate the benefit of light intensity oncarotenoid content, a ratio expressed as pigment improve-
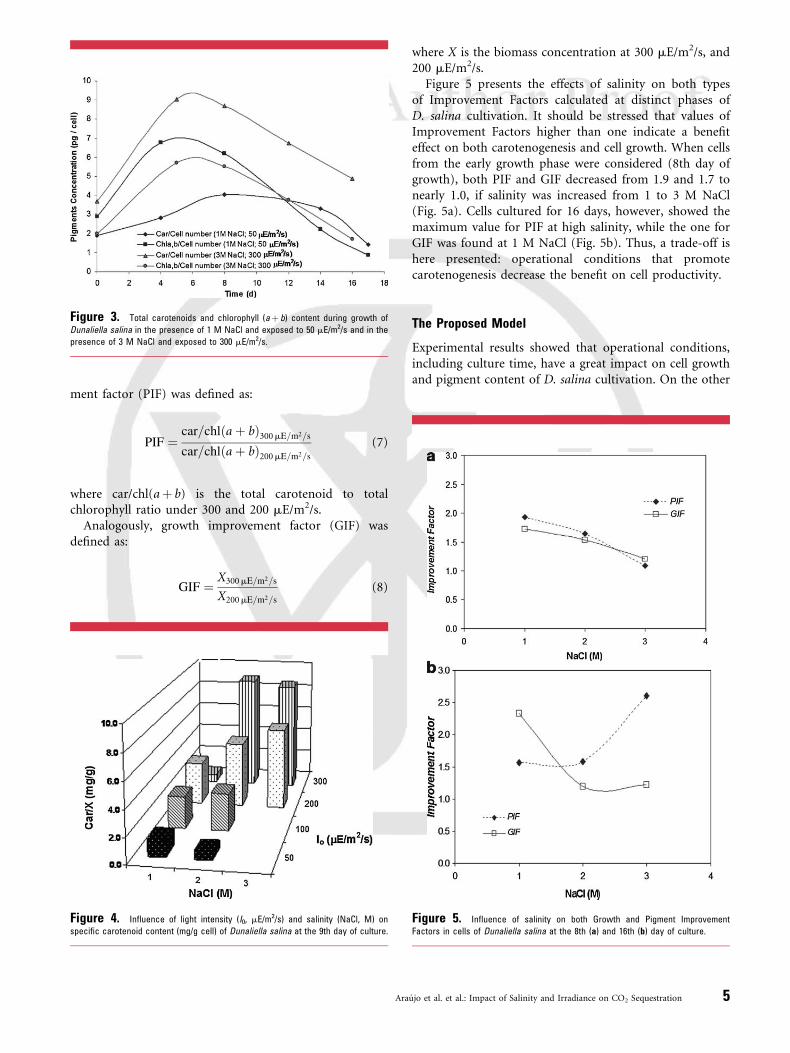
Figure 3. Total carotenoids and chlorophyll (aþ b) content during growth of
Dunaliella salina in the presence of 1 M NaCl and exposed to 50 mE/m2/s and in the
presence of 3 M NaCl and exposed to 300 mE/m2/s.
ment factor (PIF) was defined as:
PIF ¼car=chlða þ bÞ300mE=m2=s
car=chlða þ bÞ200mE=m2=s
(7)
where car/chl(aþ b) is the total carotenoid to totalchlorophyll ratio under 300 and 200 mE/m2/s.
Analogously, growth improvement factor (GIF) wasdefined as:
GIF ¼X300mE=m2=s
X200mE=m2=s
(8)
Figure 4. Influence of light intensity (I0, mE/m2/s) and salinity (NaCl, M) on
specific carotenoid content (mg/g cell) of Dunaliella salina at the 9th day of culture.
Ara
where X is the biomass concentration at 300 mE/m2/s, and200 mE/m2/s.
Figure 5 presents the effects of salinity on both typesof Improvement Factors calculated at distinct phases ofD. salina cultivation. It should be stressed that values ofImprovement Factors higher than one indicate a benefiteffect on both carotenogenesis and cell growth. When cellsfrom the early growth phase were considered (8th day ofgrowth), both PIF and GIF decreased from 1.9 and 1.7 tonearly 1.0, if salinity was increased from 1 to 3 M NaCl(Fig. 5a). Cells cultured for 16 days, however, showed themaximum value for PIF at high salinity, while the one forGIF was found at 1 M NaCl (Fig. 5b). Thus, a trade-off ishere presented: operational conditions that promotecarotenogenesis decrease the benefit on cell productivity.
The Proposed Model
Experimental results showed that operational conditions,including culture time, have a great impact on cell growthand pigment content of D. salina cultivation. On the other
Figure 5. Influence of salinity on both Growth and Pigment Improvement
Factors in cells of Dunaliella salina at the 8th (a) and 16th (b) day of culture.
ujo et al. et al.: Impact of Salinity and Irradiance on CO2 Sequestration 5
hand, in the context of CO2 sequestration, cultivation has tobe carried out balancing both cell yield and carotenoidproduction, the latter being considered to reduce themitigation costs of greenhouse gases.
For batch cultivation, the model is described by Equations(9) to (14). In the sequence, [X] is the biomass concen-tration (mg/mL), [Chl] stands for chlorophylls (a and b)concentration (mg/mL), [CH2O] is the intracellular ‘‘carbonblock’’ concentration (mg/mL), [Car] is the total carote-noids concentration (mg/mL) and ½SNO3 � is the nitrateconcentration (mg/L).
Mass Balance for biomass:
d½X�dt
¼ m½X� (9a)
where
m ¼ mmax
½CH2O�=½X�KCH2O;X þ ð½CH2O�=½X�Þ
� �KX
KX þ I0
� �
� KS
KS þ ½SNO3 �
� �(9b)
mmax ¼ a 1 � 1
1 þ e�bð½NaCl��4Þ
� �
�ð1 þ eðKT ððT�32Þ=32ÞÞÞ (9c)
In Equation (9b), the exponential hyperbolic dependence ofthe growth rate on irradiance was added to account for thefact that growth occurs in the photosynthetic reductioncarbon cycle (Vunjak-Novakovic et al., 2005).
Mass Balance for chlorophylls a and b:
d½Chl�dt
¼ C½CH2O�½X�
� �f SATChl=X (10a)
where
C ¼ Cmax
KChlð½CH2O�=½X�ÞKChl þ ð½CH2O�=½X�Þ
� �KIChl
KIChl þ I0
� �(10b)
f SATChl=X ¼ 1 � 1
1 þ e�32ð½Chl=X��500Þ
� �(10c)
f SAT½Chl=X� turns off the chlorophylls synthesis when [Chl/X]>500 mg/g.
Mass Balance for total carotenoids:
d½Car�dt
¼ mRS½X�f SAT½Car=X�
� mDC
KDC
KDC þ ð½CH2O�=½X�Þ
� �½Car�½X�
� �(11a)
6 Biotechnology and Bioengineering, Vol. 9999, No. 9999, 2008
where
mRS ¼ mRSI
½CH2O�=½X�KRSI þ ð½CH2O�=½X�Þ
� �I0
mIo þ I0
� �
�ðe�KIb1ð½NaCl��4Þ2
Þðe�KIb2ðT�32Þ2
Þ (11b)
f SAT½Car=X� ¼ 1 � 1
1 þ e�32ð½Car=X��100Þ
� �(11c)
f SAT½Car=X� turns off the carotenes synthesis when [Car/X]>100 mg/g.In Equations (9c) and (11b), 4 M was taken asthe upper limit of NaCl concentration, beyond whichD. salina productivity diminishes. Analogously, 328Crepresents in Equations (9c)–(12c) the optimal temperaturebeyond which the cell productivity lowered.
Mass Balance of intracellular ‘‘carbon block’’—CO2
Uptake:
d½CH2O�dt
¼ QChl � m1d½X�dt
� KRII
d½Car�dt
� �f SAT½CH2O=X�
(12a)
where
Q ¼ Qmax
KCH2O;I
KCH2O;I þ ð½CH2O�=½X�Þ
� �
� I0
KI1 þ I0 þ ðI20=KI2Þ
� �Kat
Kat þ ½X�
� �(12b)
f SAT½CH2O=X� ¼ 1 � 1
1 þ e�32ð½CH2O=X��0:6Þ
� �(12c)
and f SAT½CH2O=X� accounts for the saturation of the carbon
uptake process for [CH2O/X] >0.6 g/g.The amount of light able to penetrate a culture that has a
cross-section of several centimeters is determined as muchby cell density as by the intensity of light at the surface of theculture vessel (Golden, 1994). As cell density increases morerapidly when light intensity is increased and quickly reducesthe effective light intensity penetrating the culture, anattenuation of the incident light on photosynthesis due tocell density is added in Equation (10b) as a hyperbolicfunction (Acien Fernandez et al., 1997). On the other hand,exposure of photosynthetic organisms to high irradiancescan promote photodamage of the photosynthetic apparatus(Osmond, 1994), and Equation (12b) accounts for photo-inhibition of photosynthesis at high irradiances (AcienFernandez et al., 1997). Photoperiods of 12 h were employedon the input variable I0 (the average irradiance, being zero inthe dark period).
Mass Balance for NO�3
d SNO3½ �dt
¼ �Yd½X�dt
(13)
Mass Balance for CO2
d½CO2�dt
¼ 44
30Q½Chl� (14)
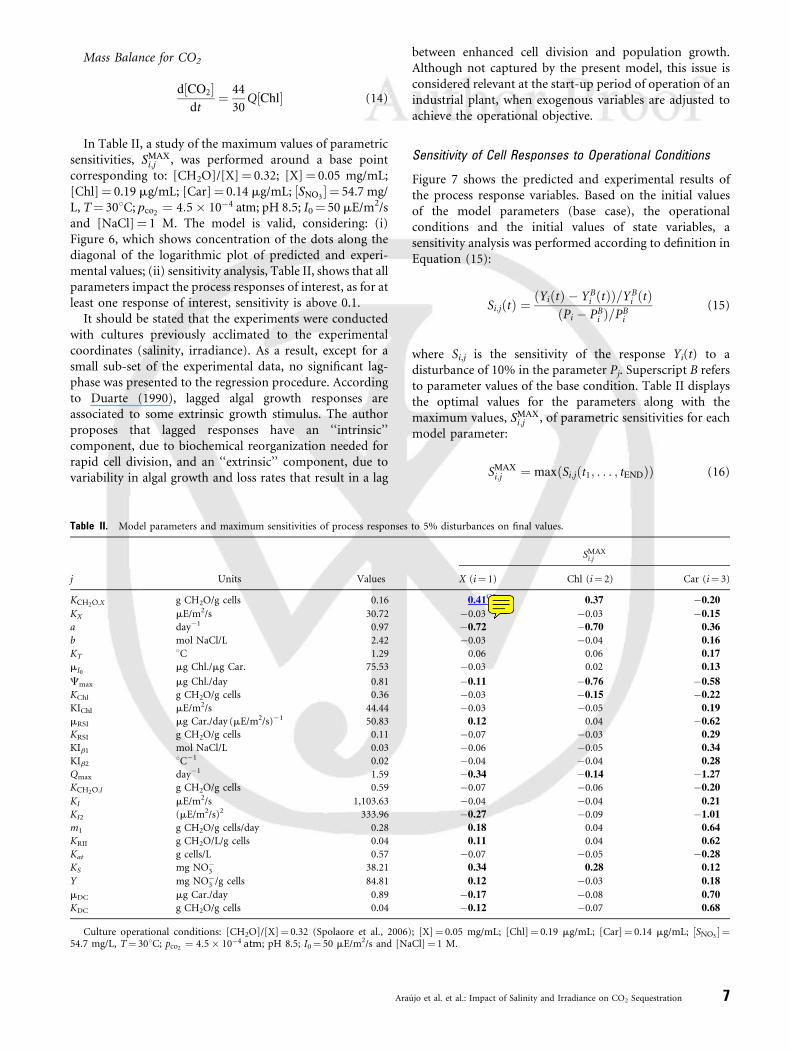
In Table II, a study of the maximum values of parametricsensitivities, SMAX
i;j , was performed around a base pointcorresponding to: [CH2O]/[X]¼ 0.32; [X]¼ 0.05 mg/mL;[Chl]¼ 0.19 mg/mL; [Car]¼ 0.14 mg/mL; ½SNO3 � ¼ 54.7 mg/L, T¼ 308C; pco2 ¼ 4:5 � 10�4 atm; pH 8.5; I0¼ 50 mE/m2/sand [NaCl]¼ 1 M. The model is valid, considering: (i)Figure 6, which shows concentration of the dots along thediagonal of the logarithmic plot of predicted and experi-mental values; (ii) sensitivity analysis, Table II, shows that allparameters impact the process responses of interest, as for atleast one response of interest, sensitivity is above 0.1.
It should be stated that the experiments were conductedwith cultures previously acclimated to the experimentalcoordinates (salinity, irradiance). As a result, except for asmall sub-set of the experimental data, no significant lag-phase was presented to the regression procedure. Accordingto Duarte (1990), lagged algal growth responses areassociated to some extrinsic growth stimulus. The authorproposes that lagged responses have an ‘‘intrinsic’’component, due to biochemical reorganization needed forrapid cell division, and an ‘‘extrinsic’’ component, due tovariability in algal growth and loss rates that result in a lag
Table II. Model parameters and maximum sensitivities of process responses
j Units Values
KCH2O;X g CH2O/g cells 0.16
KX mE/m2/s 30.72
a day�1 0.97
b mol NaCl/L 2.42
KT 8C 1.29
mI0mg Chl./mg Car. 75.53
Cmax mg Chl./day 0.81
KChl g CH2O/g cells 0.36
KIChl mE/m2/s 44.44
mRSI mg Car./day (mE/m2/s)�1 50.83
KRSI g CH2O/g cells 0.11
KIb1 mol NaCl/L 0.03
KIb2 8C�1 0.02
Qmax day�1 1.59
KCH2O;I g CH2O/g cells 0.59
KI mE/m2/s 1,103.63
KI2 (mE/m2/s)2 333.96
m1 g CH2O/g cells/day 0.28
KRII g CH2O/L/g cells 0.04
Kat g cells/L 0.57
KS mg NO�3 38.21
Y mg NO�3 /g cells 84.81
mDC mg Car./day 0.89
KDC g CH2O/g cells 0.04
Culture operational conditions: [CH2O]/[X]¼ 0.32 (Spolaore et al., 2006)54.7 mg/L, T¼ 308C; pco2 ¼ 4:5 � 10�4 atm; pH 8.5; I0¼ 50 mE/m2/s and [Na
Ara
between enhanced cell division and population growth.Although not captured by the present model, this issue isconsidered relevant at the start-up period of operation of anindustrial plant, when exogenous variables are adjusted toachieve the operational objective.
Sensitivity of Cell Responses to Operational Conditions
Figure 7 shows the predicted and experimental results ofthe process response variables. Based on the initial valuesof the model parameters (base case), the operationalconditions and the initial values of state variables, asensitivity analysis was performed according to definition inEquation (15):
Si;jðtÞ ¼ðYiðtÞ � YB
i ðtÞÞ=YBi ðtÞ
ðPi � PBi Þ=PB
i
(15)
where Si,j is the sensitivity of the response Yi(t) to adisturbance of 10% in the parameter Pj. Superscript B refersto parameter values of the base condition. Table II displaysthe optimal values for the parameters along with themaximum values, SMAX
i;j , of parametric sensitivities for eachmodel parameter:
SMAXi;j ¼ maxðSi;jðt1; . . . ; tENDÞÞ (16)
to 5% disturbances on final values.
SMAXi;j
X (i¼ 1) Chl (i¼ 2) Car (i¼ 3)
0.41Q5 0.37 �0.20
�0.03 �0.03 �0.15
�0.72 �0.70 0.36
�0.03 �0.04 0.16
0.06 0.06 0.17
�0.03 0.02 0.13
�0.11 �0.76 �0.58
�0.03 �0.15 �0.22
�0.03 �0.05 0.19
0.12 0.04 �0.62
�0.07 �0.03 0.29
�0.06 �0.05 0.34
�0.04 �0.04 0.28
�0.34 �0.14 �1.27
�0.07 �0.06 �0.20
�0.04 �0.04 0.21
�0.27 �0.09 �1.01
0.18 0.04 0.64
0.11 0.04 0.62
�0.07 �0.05 �0.28
0.34 0.28 0.12
0.12 �0.03 0.18
�0.17 �0.08 0.70
�0.12 �0.07 0.68
; [X]¼ 0.05 mg/mL; [Chl]¼ 0.19 mg/mL; [Car]¼ 0.14 mg/mL; ½SNO3 � ¼Cl]¼ 1 M.
ujo et al. et al.: Impact of Salinity and Irradiance on CO2 Sequestration 7
Maria_Alice
Nota
the significance of bold in the tables is explained along the text: sensitivities above 0.1 have higher impact on the process responses
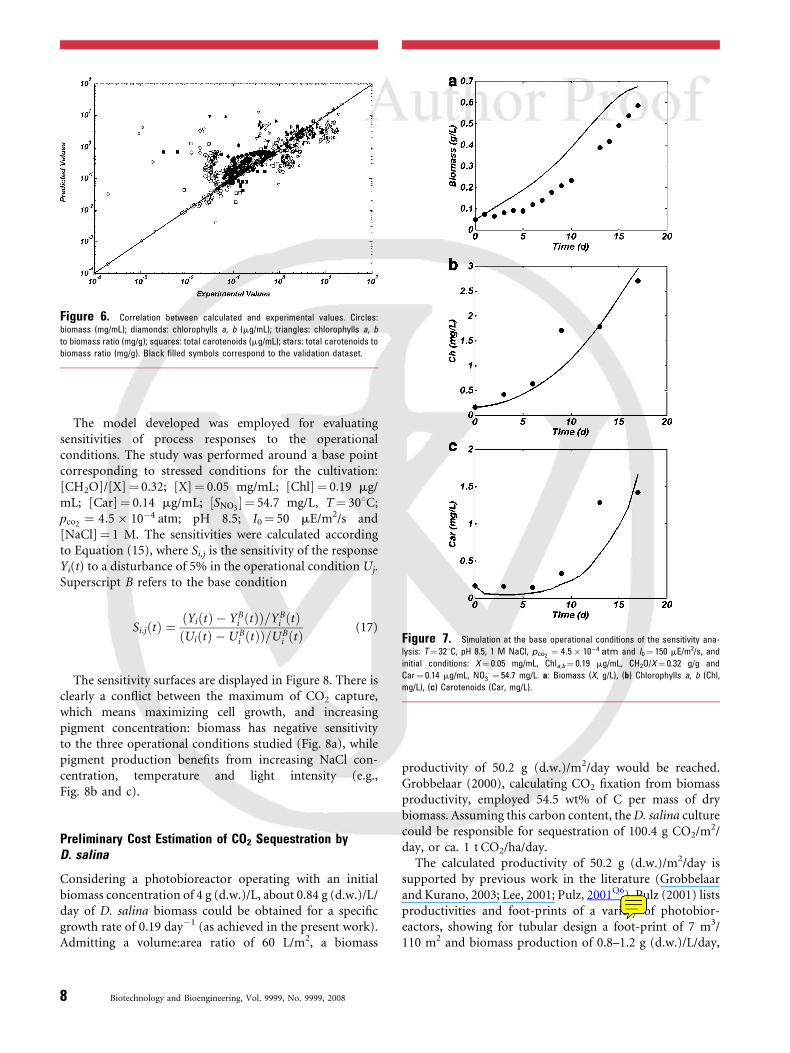
Figure 6. Correlation between calculated and experimental values. Circles:
biomass (mg/mL); diamonds: chlorophylls a, b (mg/mL); triangles: chlorophylls a, b
to biomass ratio (mg/g); squares: total carotenoids (mg/mL); stars: total carotenoids to
biomass ratio (mg/g). Black filled symbols correspond to the validation dataset.
Figure 7. Simulation at the base operational conditions of the sensitivity ana-
lysis: T¼ 328C, pH 8.5, 1 M NaCl, pco2¼ 4:5 � 10�4 atm and I0¼ 150 mE/m2/s, and
initial conditions: X¼ 0.05 mg/mL, Chla,b¼ 0.19 mg/mL, CH2O/X¼ 0.32 g/g and
Car¼ 0.14 mg/mL, NO�3 ¼ 54.7 mg/L. a: Biomass (X, g/L), (b) Chlorophylls a, b (Chl,
mg/L), (c) Carotenoids (Car, mg/L).
The model developed was employed for evaluatingsensitivities of process responses to the operationalconditions. The study was performed around a base pointcorresponding to stressed conditions for the cultivation:[CH2O]/[X]¼ 0.32; [X]¼ 0.05 mg/mL; [Chl]¼ 0.19 mg/mL; [Car]¼ 0.14 mg/mL; ½SNO3 � ¼ 54.7 mg/L, T¼ 308C;pco2 ¼ 4:5 � 10�4 atm; pH 8.5; I0¼ 50 mE/m2/s and[NaCl]¼ 1 M. The sensitivities were calculated accordingto Equation (15), where Si,j is the sensitivity of the responseYi(t) to a disturbance of 5% in the operational condition Uj.Superscript B refers to the base condition
Si;jðtÞ ¼ðYiðtÞ � YB
i ðtÞÞ=YBi ðtÞ
ðUiðtÞ � UBi ðtÞÞ=UB
i ðtÞ(17)
The sensitivity surfaces are displayed in Figure 8. There isclearly a conflict between the maximum of CO2 capture,which means maximizing cell growth, and increasingpigment concentration: biomass has negative sensitivityto the three operational conditions studied (Fig. 8a), whilepigment production benefits from increasing NaCl con-centration, temperature and light intensity (e.g.,Fig. 8b and c).
Preliminary Cost Estimation of CO2 Sequestration byD. salina
Considering a photobioreactor operating with an initialbiomass concentration of 4 g (d.w.)/L, about 0.84 g (d.w.)/L/day of D. salina biomass could be obtained for a specificgrowth rate of 0.19 day�1 (as achieved in the present work).Admitting a volume:area ratio of 60 L/m2, a biomass
8 Biotechnology and Bioengineering, Vol. 9999, No. 9999, 2008
productivity of 50.2 g (d.w.)/m2/day would be reached.Grobbelaar (2000), calculating CO2 fixation from biomassproductivity, employed 54.5 wt% of C per mass of drybiomass. Assuming this carbon content, the D. salina culturecould be responsible for sequestration of 100.4 g CO2/m2/day, or ca. 1 t CO2/ha/day.
The calculated productivity of 50.2 g (d.w.)/m2/day issupported by previous work in the literature (Grobbelaarand Kurano, 2003; Lee, 2001; Pulz, 2001Q6). Pulz (2001) listsproductivities and foot-prints of a variety of photobior-eactors, showing for tubular design a foot-print of 7 m3/110 m2 and biomass production of 0.8–1.2 g (d.w.)/L/day,
Maria_Alice
Nota
Pulz O. 2001. Photobioreactors: production systems for phototrophic microorganisms. Appl Microbiol Biotechnol 57:287-293
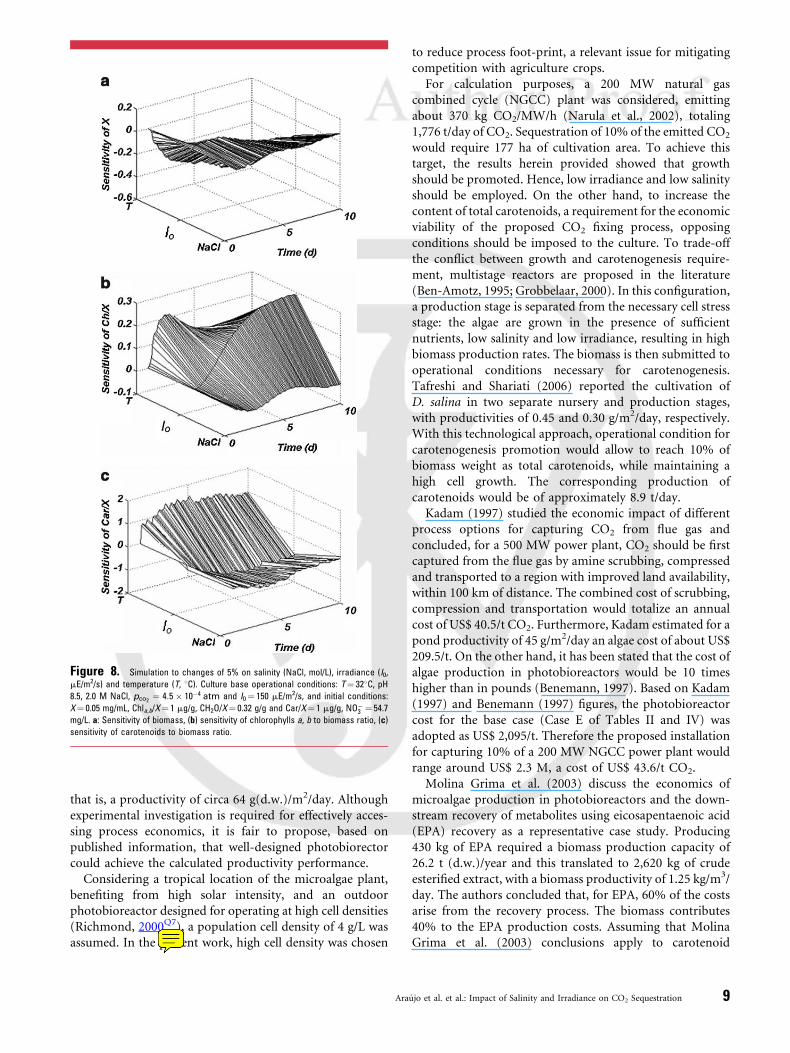
Figure 8. Simulation to changes of 5% on salinity (NaCl, mol/L), irradiance (I0,
mE/m2/s) and temperature (T, 8C). Culture base operational conditions: T¼ 328C, pH
8.5, 2.0 M NaCl, pco2¼ 4:5 � 10�4 atm and I0 ¼ 150 mE/m2/s, and initial conditions:
X¼ 0.05 mg/mL, Chla,b/X¼ 1 mg/g, CH2O/X¼ 0.32 g/g and Car/X¼ 1 mg/g, NO�3 ¼ 54.7
mg/L. a: Sensitivity of biomass, (b) sensitivity of chlorophylls a, b to biomass ratio, (c)
sensitivity of carotenoids to biomass ratio.
that is, a productivity of circa 64 g(d.w.)/m2/day. Althoughexperimental investigation is required for effectively acces-sing process economics, it is fair to propose, based onpublished information, that well-designed photobiorectorcould achieve the calculated productivity performance.
Considering a tropical location of the microalgae plant,benefiting from high solar intensity, and an outdoorphotobioreactor designed for operating at high cell densities(Richmond, 2000Q7), a population cell density of 4 g/L wasassumed. In the present work, high cell density was chosen
Ara
to reduce process foot-print, a relevant issue for mitigatingcompetition with agriculture crops.
For calculation purposes, a 200 MW natural gascombined cycle (NGCC) plant was considered, emittingabout 370 kg CO2/MW/h (Narula et al., 2002), totaling1,776 t/day of CO2. Sequestration of 10% of the emitted CO2
would require 177 ha of cultivation area. To achieve thistarget, the results herein provided showed that growthshould be promoted. Hence, low irradiance and low salinityshould be employed. On the other hand, to increase thecontent of total carotenoids, a requirement for the economicviability of the proposed CO2 fixing process, opposingconditions should be imposed to the culture. To trade-offthe conflict between growth and carotenogenesis require-ment, multistage reactors are proposed in the literature(Ben-Amotz, 1995; Grobbelaar, 2000). In this configuration,a production stage is separated from the necessary cell stressstage: the algae are grown in the presence of sufficientnutrients, low salinity and low irradiance, resulting in highbiomass production rates. The biomass is then submitted tooperational conditions necessary for carotenogenesis.Tafreshi and Shariati (2006) reported the cultivation ofD. salina in two separate nursery and production stages,with productivities of 0.45 and 0.30 g/m2/day, respectively.With this technological approach, operational condition forcarotenogenesis promotion would allow to reach 10% ofbiomass weight as total carotenoids, while maintaining ahigh cell growth. The corresponding production ofcarotenoids would be of approximately 8.9 t/day.
Kadam (1997) studied the economic impact of differentprocess options for capturing CO2 from flue gas andconcluded, for a 500 MW power plant, CO2 should be firstcaptured from the flue gas by amine scrubbing, compressedand transported to a region with improved land availability,within 100 km of distance. The combined cost of scrubbing,compression and transportation would totalize an annualcost of US$ 40.5/t CO2. Furthermore, Kadam estimated for apond productivity of 45 g/m2/day an algae cost of about US$209.5/t. On the other hand, it has been stated that the cost ofalgae production in photobioreactors would be 10 timeshigher than in pounds (Benemann, 1997). Based on Kadam(1997) and Benemann (1997) figures, the photobioreactorcost for the base case (Case E of Tables II and IV) wasadopted as US$ 2,095/t. Therefore the proposed installationfor capturing 10% of a 200 MW NGCC power plant wouldrange around US$ 2.3 M, a cost of US$ 43.6/t CO2.
Molina Grima et al. (2003) discuss the economics ofmicroalgae production in photobioreactors and the down-stream recovery of metabolites using eicosapentaenoic acid(EPA) recovery as a representative case study. Producing430 kg of EPA required a biomass production capacity of26.2 t (d.w.)/year and this translated to 2,620 kg of crudeesterified extract, with a biomass productivity of 1.25 kg/m3/day. The authors concluded that, for EPA, 60% of the costsarise from the recovery process. The biomass contributes40% to the EPA production costs. Assuming that MolinaGrima et al. (2003) conclusions apply to carotenoid
ujo et al. et al.: Impact of Salinity and Irradiance on CO2 Sequestration 9
Maria_Alice
Nota
Richmond A. 2000. Microalgal biotechnology at the turn of the millenium: A personal view. J. Appl. Phycol. 12: 441-451

Table III. Sensitivity analysis of productivity to design premises.
Variables Case A Case B Case C Case D Case E Case F Notes
Cell density (g/L) 0.5 1 2 3 4 5 X0
Specific growth rate (m, h�1) 0.19 0.19 0.19 0.19 0.19 0.19 Present work
Cell content of carotenes (mass fraction) 0.1 0.1 0.1 0.1 0.1 0.1
CO2 sequestration (t) 177.6 177.6 177.6 177.6 177.6 177.6
Production g(d.w.)/L/d 0.10 0.21 0.42 0.63 0.84 1.05 X0(emt� 1), t¼ 1 day
Reactor foot-print (L/m2) 60 60 60 60 60 60 Pulz (2001)
Productivity (g(d.w.)/m2/day) 6.3 12.6 25.1 37.7 50.2 62.8 Prod.� foot-print
Sequestration (t CO2/ha/day) 0.1 0.3 0.5 0.8 1.0 1.3 0.545 g C/g X, 44/12 g CO2/g C.
Area (ha) for CO2 sequestration 1415.8 707.9 353.9 236.0 177.0 141.6 200 MW NGCC power plant emits 1,776 t CO2 day�1
Biomass production (t(d.w.)/day) 88.9 88.9 88.9 88.9 88.9 88.9
b-Carotene production (t/day) 8.9 8.9 8.9 8.9 8.9 8.9
extraction from D. salina culture, extracting this pigmentwould raise the total cost to around US$ 7.8 M for a 200 MWNGCC power plant. For 300 days of operation per year, thecost of the combined sequestration and carotenoidproduction would be of US$ 146.9/t CO2.
Production costs are very sensitive to cell populationdensity and reactor foot-print. The design premises adoptedare that the process operates at high cell density in a well-designed photobioreactor, with foot-print compatible to thereactors reviewed by Pulz (2001): 4 g (d.w.)/L and 60 L/m2.A sensitivity analysis of algal productivity is presented inTable III, confirming a strong influence of these designpremises on the area occupied by the plant, a relevant issuefor algae processes, which could compete with agriculturecrops. In Table IV, the process profitability is analyzed facingscenarios of photobioreactor costs and carotene marketprices. The profitability is maintained for a worst casescenario of photobioreactor cost being 10 times higher thanthe base case and carotenes market price reduced to 1/10 ofits base case.
For all cases presented in Table IV, the sequestration costis far inferior to the estimated revenue associated to 8.9 t/dayproduction of carotenoids and carbon sequestration credits(CDM mechanism predicted in the Kyoto Protocol). Asdisplayed in Table IV, for the base case (CASE E2) a cost/benefit ratio of 0.030 $/1,000 $ is expected. Additional
Table IV. Sensitivity of cost/benefit ratio to photobiorea
Variables
CO2 capture costs ($/t CO2)
Reactor cost ($/t (d.w. per year))
Carotene price ($/kg)
Sequestration cost ($/t co2)
Carbon credits (1,000 $)
Carotene revenue (1,000 $)
Revenue associated to sequestration ($/t CO2)
Cost/benefit ratio ($ sequestration/$1,000 revenue)
10 Biotechnology and Bioengineering, Vol. 9999, No. 9999, 2008
credits due to other important biomass constituent (e.g.,glycerol) would contribute to increase the process revenue.
Concluding Remarks
This study presents an analysis based on experimental resultsand mathematical modeling of D. salina culture responses tooperational conditions. Specifically, the influence of NaClconcentration of the culture medium (studied in the rangeof 1–3 M) irradiance (50–300 mE/m2/s) and temperature(22–328C) were evaluated. The results confirmed previouslyreported analyses such as the results of Borowitzka et al.(1990): high salinities and irradiance promoted caroteno-genesis while inhibiting cell growth. This situation, facingthe context of mitigation of greenhouse gas effect causedby CO2, poses an interesting optimization problem. In thisdirection, a mathematical model was formulated, whichcaptured the main experimental observations.
A preliminary estimate of the cost for fixing 10% of theemissions of a 200 MW NGCC plant, by D. salina culture,with a combined production of carotenoids was presented,based on cell growth rates achieved experimentally. Aninitial biomass concentration of 4 g (d.w.)/L was assumed inan installed area of 177 ha. For 300 days of operationper year, the cost of sequestration would be of US$ 146.9/
ctor cost—Case E.
Case E1 Case E2 Case E3
40.0 40.0 40.0
20950.0 2095.0 2095.0
100.0 100.0 50.0
253.1 146.9 146.9
1065.6 1065.6 1065.6
266622.2 266622.2 26662.2
5024.17 5024.2 520.42
0.053 0.030 0.946
t CO2. This cost is far inferior to the estimated revenueassociated to 8.9 t/day production of carotenoids and carboncredit.
The mathematical tool can be used for experimentaldesign of further culture evaluation, as well as forphotobioreactors design.
The authors kindly acknowledge the financial aid of CNPq through
grant 504358/2004-9, and research scholarships given by CNPq,
FAPERJ and CAPES. We also thank to Mrs. R.E. Simoni for manu-
script revision.
References
Acien Fernandez FG, Garcıa Camacho F, Sanchez Perez JA, Fernandez
Sevilla JM, Molina Grima E. 1997. A model for light distribution and
average solar irradiance inside outdoor tubular photobioreactors for
the microalgal mass culture. Biotechnol Bioeng 55(5):701–714.
Ametistova L, Twidell J, Briden J. 2002. The sequestration switch: Removing
industrial CO2 by direct ocean absorption. Sci total Environ 289:213–
223.
Ben-Amotz A. 1995. New mode of Dunaliella biotechnology: Two-phase
growth for b-carotene production. J Appl Phycol 7:65–68.
Ben-Amotz A, Avron M. 1990. The biotechnology of cultivating the
halotolerant alga Dunaliella. Trends Biotechnol 8:121–126.
Benemann JR. 1997. Feasibility analysis of photobiological hydrogen pro-
duction. Int J Hydrogen Energy 22:979–987.
Borowitzka MA. 1995. Microalgae as sources of pharmaceuticals and other
biologically active compounds. J Appl Phycol 7:3–15.
Borowitzka MA. 1999. Commercial production of microalgae: Ponds,
tanks, tubes and fermenters. J Biotechnol 70:313–321.
Borowitzka LJ, Borowitzka MA, Moulton T. 1984. Mass culture of Duna-
liella: From laboratory to pilot plant. Hydrobiology 116:115–121.
Borowitzka MA, Borowitzka LJ, Kessly D. 1990. Effects of salinity increase
on carotenoid accumulation in the green alga Dunaliella salina. J Appl
Phycol 2:111–119.
Duarte CM. 1990. Time lags in algal growth: Generality, causes and
consequences. J Plankton Res 12(4):873–883.
Enes I, Saraiva P. 1996. Optimization of operating strategies in b-carotene
microalgae bioreactors. Comput Chem Eng 20:509–514.
Garcıa-Gonzalez M, Moreno J, Canavate JP, Anguis V, Prieto A, Manzano
C, Florencio FJ, Guerrero MG. 2003. Conditions for open-air outdoor
culture of Dunaliella salina in southern Spain. J Appl Phycol 15:177–
184.
Gilmour D. 1990. Halotolerant andQ8 halophilic microorganisms. In:
Edwards C, editor. Microbiology of extreme environments. McGraw-
Hill Publishing Company. p 147–175.
Golden SS. 1994. Light-responsive gene expression and the biochemistry
of the photosystem II reaction center. In: Bryant DA, editor. The
molecular biology of cyanobacteria. Dordrecht: Kluwer Academic
Publishers. p 693–714.
Gomez PI, Gonzalez MA. 2004. Genetic variation among seven strains of
Dunaliella salina (Chlorophyta) with industrial potential, based on
RAPD banding patterns and on nuclear ITS rDNA sequences. Aqua-
culture 233:149–162.
Grobbelaar JU. 2000. Physiological and technological considerations for
optimising mass algal cultures. J Appl Phycol 12:201–206.
Arauj
Grobbelaar JU, Kurano N. 2003. Use of photoacclimation in the design of a
novel photobioreactor to achieve high yields in algal mass cultivation.
J Appl Phycol 15:121–126.
Guillard RRL. 1975. Culture ofQ9 phytoplankton for feeding marine inver-
tebrates. In: Smith WL, Chanley MH, editors. Culture of marine
invertebrate animals. New York: p 29–60.
Jahnke LS. 1999. Massive carotenoid accumulation in Dunaliella bardawil
induced by ultraviolet-A radiation. J Photochem Photobiol B: Biol 48:
68–74.
Jean-Baptiste P, Ducroux R. 2003. Energy policy and climate change. Energy
Policy 31:155–166.
Johnston NAC, Blake DR, Rowland FS, Elliott S, Lackner KS, Ziock HJ,
Dubey MK, Hanson HP, Barr S. 2003. Chemical transport modeling of
potential atmospheric CO2 sinks. Energy Convers Mgmt 44:681–689.
Kadam K. 1997. Power plant flue gas as a source of CO2 for microalgae
cultivation: Economic impact of different process options. Energy
Convers Mgmt 38:505–510.
Lee YK. 2001. Microalgal mass culture systems and methods: Their limita-
tion and potential. J Appl Phycol 13:307–315.
Liu XD, Shen YG. 2004. NaCl-induced phosphorylation of light harvesting
chlorophyll a/b proteins in thylakoid membranes from the halotolerant
green alga, Dunaliella salina. FEBS Lett 569:337–340.
Marın N, Morales F, Lodeiros C, Tamigneaux E. 1998. Effect of nitrate
concentration on growth and pigment synthesis of Dunaliella salina
cultivated under low illumination and preadapted to different salinities.
J Appl Phycol 10:405–411.
Massyuk NP. 1966. Mass culture of the carotene containing alga Dunaliella
salina Teod. Ukr Bot Zh 23:12–19.
Mendoza H, Martel A, Jimenez del Rio M, Garcıa Reina G. 1999. Oleic acid
is the main fatty acid related with carotenogenesis in Dunaliella salina.
J Appl Phycol 11:15–19.
Molina Grima E, Belarbi EH, Acien Fernandez FG, Robles Medina A, Chisti
Y. 2003. Recovery of microalgal biomass and metabolites: Process
options and economics. Biotechnol Adv 20:491–515.
Narula RG, Wen H, Himer K. 2002. Incremental cost of CO2 reduction in
power plants. Proceedings of IGTI ASME TURBO EXPO 2002, Amster-
dam, The Netherlands GT-2002-30259.
Osmond CB. 1994. What is photoinhibition? Some insights from compar-
isons of shade and sun plants. In: Baker NR, Bowyer JR, editors.
Photoinhibition of photosynthesis. Oxford: BIOS Scientific Publishers
Ltd. p 1–24.
Pulz O, Gross W. 2004. Valuable products from biotechnology of micro-
algae. Appl Microbiol Biotechnol 65:635–648.
Sadka A, Lers A, Zamir A, Avron M. 1989. A critical examination of the role
of de novo protein synthesis in the osmotic adaptation of the hato-
tolerant alga Dunaliella. FEBS Lett 244:93–98.
Simeonova K, Diaz-Bone H. 2005. Integrated climate-change strategies of
industrialized countries. Energy 30:2537–2557.
Spolaore P, Joannis-Cassan C, Duran E, Isambert A. 2006. Commercial
applications of microalgae. J Biosci Bioeng 101:87–96.
Tafreshi AH, Shariati M. 2006. Pilot culture of three strains of Dunaliella
salina for b-carotene production in open pond in the central region of
Iran. World J Microbiol Biotechnol 22:1003–1006.
Tomkiewicz M. 2006. Global warming: Science, money and self-preserva-
tion. CR Chimie 9:172–179.
Vunjak-Novakovic G, Kim Y, Wu X, Berzin I, Merchuk JC. 2005. Air-lift
bioreactors for algal growth on flue gas: Mathematical modeling and
pilot-plant studies. Ind Eng Chem Res 44:6154–6163.
Wellburn AL. 1994. The spectral determination of Chlorophylls a and b, as
well as total Carotenoids, using various solvents with spectrophot-
ometers of different resolution. J Plant Physiol 144:307–313.
o et al. et al.: Impact of Salinity and Irradiance on CO2 Sequestration 11
Maria_Alice
Nota
Plenun Press
Maria_Alice
Nota
New York, USA

Q1: Author: Please check the order of section headings.
Q2: Author: Please add in the reference list.
Q3: Author: Please provide city and state name.
Q4: Author: Please provide complete location.
Q5: Author: Please explain the significance of bold used in Tables II and III.
Q6: Author: Please add in the reference list.
Q7: Author: Please add in the reference list.
Q8: Author: Please provide the publisher location.
Q9: Author: Please provide the publisher name.
12 Biotechnology and Bioengineering, Vol. 9999, No. 9999, 2008

111 RI V E R S T R E E T , H O B O K E N , NJ 07030
***IMMEDIATE RESPONSE REQUIRED*** Your article will be published online via Wiley's EarlyView® service (www.interscience.wiley.com) shortly after receipt of
corrections. EarlyView® is Wiley's online publication of individual articles in full text HTML and/or pdf format before release of the compiled print issue of the journal. Articles posted online in EarlyView® are peer-reviewed, copyedited, author corrected,
and fully citable via the article DOI (for further information, visit www.doi.org). EarlyView® means you benefit from the best of two worlds--fast online availability as well as traditional, issue-based archiving.
Please follow these instructions to avoid delay of publication.
READ PROOFS CAREFULLY
• This will be your only chance to review these proofs. Please note that once your corrected article is posted online, it is considered legally published, and cannot be removed from the Web site for further corrections.
• Please note that the volume and page numbers shown on the proofs are for position only.
ANSWER ALL QUERIES ON PROOFS (Queries for you to answer are attached as the last page of your proof.) • Mark all corrections directly on the proofs. Note that excessive author alterations may ultimately result in delay of
publication and extra costs may be charged to you.
CHECK FIGURES AND TABLES CAREFULLY (Color figure proofs will be sent under separate cover.) • Check size, numbering, and orientation of figures. • All images in the PDF are downsampled (reduced to lower resolution and file size) to facilitate Internet delivery.
These images will appear at higher resolution and sharpness in the printed article. • Review figure legends to ensure that they are complete. • Check all tables. Review layout, title, and footnotes.
COMPLETE REPRINT ORDER FORM
• Fill out the attached reprint order form. It is important to return the form even if you are not ordering reprints. You may, if you wish, pay for the reprints with a credit card. Reprints will be mailed only after your article appears in print. This is the most opportune time to order reprints. If you wait until after your article comes off press, the reprints will be considerably more expensive.
RETURN PROOFS REPRINT ORDER FORM CTA (If you have not already signed one) RETURN IMMEDIATELY AS YOUR ARTICLE WILL BE POSTED ONLINE SHORTLY AFTER RECEIPT; FAX PROOFS TO 201-748-6825 or 8852 QUESTIONS? Jeffrey Collins, Production Editor Phone: 201-748-8864 E-mail: [email protected] Refer to journal acronym and article production number
(i.e., BIT 00-001 for Biotechnology and Bioengineering ms 00-001).

Color figures were included with the final manuscript files that we received for your article. Because of the high cost of color printing, we can only print figures in color if authors cover the expense. Please indicate if you would like your figures to be printed in color or black and white. Color images will be reproduced online in Wiley InterScience at no charge, whether or not you opt for color printing. You will be invoiced for color charges once the article has been published in print.
Failure to return this form with your article proofs will delay the publication of your article. JOURNAL
BIOTECHNOLOGY AND BIOENGINEERING
MS. NO.
NO. OF COLOR PAGES
TITLE OF MANUSCRIPT
AUTHOR(S)
No. Color Pages Color Charges No. Color Pages Color Charges No. Color Pages Color Charges
1 500 5 2500 9 4500 2 1000 6 3000 10 5000 3 1500 7 3500 11 5500 4 2000 8 4000 12 6000
***Please contact the Production Editor for a quote if you have more than 12 pages of color***
Please print my figures in black and white
Please print my figures in color
Please print the following figures in color: BILLING ADDRESS:

111 River Street Hoboken, NJ 07030, USA
201-748-8864FAX: 201-748-6825
CCOOPPYYRRIIGGHHTT TTRRAANNSSFFEERR AAGGRREEEEMMEENNTT
Date:
To:
Production/ContributionID#______________Publisher/Editorial office use only
Re: Manuscript entitled _______________________________________________________________________________________________________________________________________________________________________ (the "Contribution")
for publication in _______________________________________________________________________ (the "Journal")published by Wiley-Liss, Inc., a subsidiary of John Wiley & Sons, Inc. ( "Wiley").
Dear Contributor(s):
Thank you for submitting your Contribution for publication. In order to expedite the publishing process and enable Wiley todisseminate your work to the fullest extent, we need to have this Copyright Transfer Agreement signed and returned to us as soon aspossible. If the Contribution is not accepted for publication this Agreement shall be null and void.
A. COPYRIGHT
1. The Contributor assigns to Wiley, during the full term of copyright and any extensions or renewals of that term, allcopyright in and to the Contribution, including but not limited to the right to publish, republish, transmit, sell, distributeand otherwise use the Contribution and the material contained therein in electronic and print editions of the Journal and inderivative works throughout the world, in all languages and in all media of expression now known or later developed, andto license or permit others to do so.
2. Reproduction, posting, transmission or other distribution or use of the Contribution or any material contained therein, inany medium as permitted hereunder, requires a citation to the Journal and an appropriate credit to Wiley as Publisher,suitable in form and content as follows: (Title of Article, Author, Journal Title and Volume/Issue Copyright [year]Wiley-Liss, Inc. or copyright owner as specified in the Journal.)
B. RETAINED RIGHTS
Notwithstanding the above, the Contributor or, if applicable, the Contributor's Employer, retains all proprietary rights otherthan copyright, such as patent rights, in any process, procedure or article of manufacture described in the Contribution, and theright to make oral presentations of material from the Contribution.
C. OTHER RIGHTS OF CONTRIBUTOR
Wiley grants back to the Contributor the following:
1. The right to share with colleagues print or electronic "preprints" of the unpublished Contribution, in form and content asaccepted by Wiley for publication in the Journal. Such preprints may be posted as electronic files on the Contributor'sown website for personal or professional use, or on the Contributor's internal university or corporate networks/intranet, orsecure external website at the Contributor’s institution, but not for commercial sale or for any systematic externaldistribution by a third party (e.g., a listserve or database connected to a public access server). Prior to publication, theContributor must include the following notice on the preprint: "This is a preprint of an article accepted for publication in[Journal title] copyright (year) (copyright owner as specified in the Journal)". After publication of the Contribution byWiley, the preprint notice should be amended to read as follows: "This is a preprint of an article published in [include thecomplete citation information for the final version of the Contribution as published in the print edition of the Journal]",and should provide an electronic link to the Journal's WWW site, located at the following Wiley URL:http://www.interscience.Wiley.com/. The Contributor agrees not to update the preprint or replace it with the publishedversion of the Contribution.

2. The right, without charge, to photocopy or to transmit online or to download, print out and distribute to a colleague a copyof the published Contribution in whole or in part, for the Contributor's personal or professional use, for the advancementof scholarly or scientific research or study, or for corporate informational purposes in accordance with Paragraph D.2below.
3. The right to republish, without charge, in print format, all or part of the material from the published Contribution in a book
written or edited by the Contributor.
4. The right to use selected figures and tables, and selected text (up to 250 words, exclusive of the abstract) from theContribution, for the Contributor's own teaching purposes, or for incorporation within another work by the Contributorthat is made part of an edited work published (in print or electronic format) by a third party, or for presentation inelectronic format on an internal computer network or external website of the Contributor or the Contributor's employer.
5. The right to include the Contribution in a compilation for classroom use (course packs) to be distributed to students at the
Contributor’s institution free of charge or to be stored in electronic format in datarooms for access by students at theContributor’s institution as part of their course work (sometimes called “electronic reserve rooms”) and for in-housetraining programs at the Contributor’s employer.
D. CONTRIBUTIONS OWNED BY EMPLOYER
1. If the Contribution was written by the Contributor in the course of the Contributor's employment (as a "work-made-for-hire" in the course of employment), the Contribution is owned by the company/employer which must sign this Agreement(in addition to the Contributor’s signature), in the space provided below. In such case, the company/employer herebyassigns to Wiley, during the full term of copyright, all copyright in and to the Contribution for the full term of copyrightthroughout the world as specified in paragraph A above.
2. In addition to the rights specified as retained in paragraph B above and the rights granted back to the Contributor pursuantto paragraph C above, Wiley hereby grants back, without charge, to such company/employer, its subsidiaries anddivisions, the right to make copies of and distribute the published Contribution internally in print format or electronicallyon the Company's internal network. Upon payment of the Publisher's reprint fee, the institution may distribute (but notresell) print copies of the published Contribution externally. Although copies so made shall not be available for individualre-sale, they may be included by the company/employer as part of an information package included with software or otherproducts offered for sale or license. Posting of the published Contribution by the institution on a public access websitemay only be done with Wiley's written permission, and payment of any applicable fee(s).
E. GOVERNMENT CONTRACTS
In the case of a Contribution prepared under U.S. Government contract or grant, the U.S. Government may reproduce, withoutcharge, all or portions of the Contribution and may authorize others to do so, for official U.S. Government purposes only, if theU.S. Government contract or grant so requires. (U.S. Government Employees: see note at end).
F. COPYRIGHT NOTICE
The Contributor and the company/employer agree that any and all copies of the Contribution or any part thereof distributed orposted by them in print or electronic format as permitted herein will include the notice of copyright as stipulated in the Journaland a full citation to the Journal as published by Wiley.
G. CONTRIBUTOR'S REPRESENTATIONS
The Contributor represents that the Contribution is the Contributor's original work. If the Contribution was prepared jointly,the Contributor agrees to inform the co-Contributors of the terms of this Agreement and to obtain their signature to thisAgreement or their written permission to sign on their behalf. The Contribution is submitted only to this Journal and has notbeen published before, except for "preprints" as permitted above. (If excerpts from copyrighted works owned by third partiesare included, the Contributor will obtain written permission from the copyright owners for all uses as set forth in Wiley'spermissions form or in the Journal's Instructions for Contributors, and show credit to the sources in the Contribution.) TheContributor also warrants that the Contribution contains no libelous or unlawful statements, does not infringe on the rights orprivacy of others, or contain material or instructions that might cause harm or injury.

CHECK ONE:_____________________________________ ______________________
[____]Contributor-owned work Contributor's signature Date
______________________________________________________________Type or print name and title
_____________________________________ ______________________Co-contributor's signature Date
______________________________________________________________Type or print name and title
ATTACH ADDITIONAL SIGNATURE PAGE AS NECESSARY
_____________________________________ ______________________[____]Company/Institution-owned work Company or Institution (Employer-for-Hire) Date
(made-for-hire in thecourse of employment) _____________________________________ ______________________
Authorized signature of Employer Date
[____]U.S. Government work
NNoottee ttoo UU..SS.. GGoovveerrnnmmeenntt EEmmppllooyyeeeess
A Contribution prepared by a U.S. federal government employee as part of the employee's official duties, or which is an officialU.S. Government publication is called a "U.S. Government work," and is in the public domain in the United States. In such case,the employee may cross out Paragraph A.1 but must sign and return this Agreement. If the Contribution was not prepared as part ofthe employee's duties or is not an official U.S. Government publication, it is not a U.S. Government work.
[____]U.K. Government work (Crown Copyright)
Note to U.K. Government Employees
The rights in a Contribution prepared by an employee of a U.K. government department, agency or other Crown body as part ofhis/her official duties, or which is an official government publication, belong to the Crown. In such case, the Publisher willforward the relevant form to the Employee for signature.

BIOTECHNOLOGY AND BIOENGINEERING
Telephone Number: • Facsimile Number:
To: Jeffrey Collins At FAX #: 201-748-6825
From: Dr.
Date:
Re: Biotechnology and Bioengineering, ms #
Dear Mr. Jeffrey
Attached please find corrections to ms# __________. Please contact me shouldyou have any difficulty reading this fax at the numbers listed below.
Office phone:Email:Fax:Lab phone:
I will return color figure proofs (if applicable) once I have checked them for accuracy.
Thank you,
Dr.
E-proofing feedback comments:

C1
REPRINT BILLING DEPARTMENT •• 111 RIVER STREET, HOBOKEN, NJ 07030PHONE: (201) 748-8789; FAX: (201) 748-6326
E-MAIL: [email protected] REPRINT ORDER FORM
Please complete this form even if you are not ordering reprints. This form MUST be returned with your corrected proofsand original manuscript. Your reprints will be shipped approximately 4 weeks after publication. Reprints ordered after printingwill be substantially more expensive. ** 25 Reprints will be supplied free of charge.
JOURNAL Biotechnology and Bioengineering VOLUME ISSUE
TITLE OF MANUSCRIPT
MS. NO. NO. OF PAGES AUTHOR(S)
No. of Pages 100 Reprints 200 Reprints 300 Reprints 400 Reprints 500 Reprints$ $ $ $ $
1-4 336 501 694 890 10525-8 469 703 987 1251 14779-12 594 923 1234 1565 185013-16 714 1156 1527 1901 227317-20 794 1340 1775 2212 264821-24 911 1529 2031 2536 303725-28 1004 1707 2267 2828 338829-32 1108 1894 2515 3135 375533-36 1219 2092 2773 3456 414337-40 1329 2290 3033 3776 4528
**REPRINTS ARE ONLY AVAILABLE IN LOTS OF 100. IF YOU WISH TO ORDER MORE THAN 500 REPRINTS, PLEASE CONTACT OUR REPRINTSDEPARTMENT AT (201) 748-8789 FOR A PRICE QUOTE.
Please send me _____________________ reprints of the above article at $
Please add appropriate State and Local Tax (Tax Exempt No.____________________) $for United States orders only.
Please add 5% Postage and Handling $
TOTAL AMOUNT OF ORDER** $**International orders must be paid in currency and drawn on a U.S. bankPlease check one: Check enclosed Bill me Credit CardIf credit card order, charge to: American Express Visa MasterCard
Credit Card No Signature Exp. Date
BILL TO: SHIP TO: (Please, no P.O. Box numbers)Name Name
Institution Institution
Address Address
Purchase Order No. Phone Fax

Softproofing for advanced Adobe Acrobat Users - NOTES toolNOTE: ACROBAT READER FROM THE INTERNET DOES NOT CONTAIN THE NOTES TOOL USED IN THIS PROCEDURE.
Acrobat annotation tools can be very useful for indicating changes to the PDF proof of your article.By using Acrobat annotation tools, a full digital pathway can be maintained for your page proofs.
The NOTES annotation tool can be used with either Adobe Acrobat 4.0, 5.0 or 6.0. Other annotation tools are also available in Acrobat 4.0, but this instruction sheet will concentrateon how to use the NOTES tool. Acrobat Reader, the free Internet download software from Adobe,DOES NOT contain the NOTES tool. In order to softproof using the NOTES tool you must havethe full software suite Adobe Acrobat 4.0, 5.0 or 6.0 installed on your computer.
Steps for Softproofing using Adobe Acrobat NOTES tool:
1. Open the PDF page proof of your article using either Adobe Acrobat 4.0, 5.0 or 6.0. Proofyour article on-screen or print a copy for markup of changes.
2. Go to File/Preferences/Annotations (in Acrobat 4.0) or Document/Add a Comment (in Acrobat6.0 and enter your name into the “default user” or “author” field. Also, set the font size at 9 or 10point.
3. When you have decided on the corrections to your article, select the NOTES tool from theAcrobat toolbox and click in the margin next to the text to be changed.
4. Enter your corrections into the NOTES text box window. Be sure to clearly indicate where thecorrection is to be placed and what text it will effect. If necessary to avoid confusion, you canuse your TEXT SELECTION tool to copy the text to be corrected and paste it into the NOTEStext box window. At this point, you can type the corrections directly into the NOTES textbox window. DO NOT correct the text by typing directly on the PDF page.
5. Go through your entire article using the NOTES tool as described in Step 4.
6. When you have completed the corrections to your article, go to File/Export/Annotations (inAcrobat 4.0) or Document/Add a Comment (in Acrobat 6.0).
7. When closing your article PDF be sure NOT to save changes to original file.
8. To make changes to a NOTES file you have exported, simply re-open the original PDFproof file, go to File/Import/Notes and import the NOTES file you saved. Make changes and re-export NOTES file keeping the same file name.
9. When complete, attach your NOTES file to a reply e-mail message. Be sure to include yourname, the date, and the title of the journal your article will be printed in.