Nutrient uptake, chlorophyll a and carbon fixation by Rhodomonas sp. (Cryptophyceae) cultured at...
10
Nutrient uptake, chlorophyll a and carbon fixation by Rhodomonas sp. (Cryptophyceae) cultured at different irradiance and nutrient concentrations Fabiola Lafarga-De la Cruz a , Enrique Valenzuela-Espinoza b , Roberto Milla ´n-Nu ´n ˜ez a, * , Charles C. Trees c , Eduardo Santamarı ´a-del-A ´ ngel a , Filiberto Nu ´n ˜ez-Cebrero b a Facultad de Ciencias Marinas, Universidad Auto ´noma de Baja California, Apartado Postal 453, Ensenada, Baja California, Me ´xico b Instituto de Investigaciones Oceanolo ´gicas, Universidad Auto ´noma de Baja California, Apartado Postal 453, Ensenada, Baja California, Me ´xico c Center of Hydro-Optics and Remote Sensing, SDSU, 6505 Alvarado Road, Suite 206, San Diego, CA 92120, USA Received 23 February 2005; accepted 9 August 2005 Abstract The goal of this research was to study biomass production, nitrate and phosphate uptake and carbon fixation in batch culture of the marine microalgae Rhodomonas sp., which is used in aquaculture as food for commercially reared invertebrates. Cultures were grown for 7 days under four irradiance levels (52, 68, 103 and 142 mmol photon m 2 s 1 ) and at three nitrate and phosphate concentrations (661–29, 882–39, 1323–58.5 mM of NaNO 3 and NaH 2 PO 4 , respectively) establishing 12 experimental treatments. During the exponential phase, growth was directly correlated with irradiance and the initial nitrate and phosphate concentrations. Significant differences were found in the low growth phase as a function of nutrient concentration, but not for irradiance. For the low nutrient concentration treatments, growth was limited after 2 days. Final cell density was influenced by the initial concentration of nutrients, independently of the irradiance level. The average maximum biomass production was reached in 7 days in cultures with high nutrients (1.53 Æ 0.07 10 6 cells mL 1 ). The total chlorophyll a content was directly related to cellular density and indirectly to irradiance level and concentration of nutrients. In conclusion, the optimal growing condition for Rhodomonas was up to the fourth day. However, after this time the cellular density, chlorophyll content and carbon uptake changed with the nutrient concentration and irradiance. Therefore we suggest that Rhodomonas culture could be used at the fourth day, either as inoculums for higher volume or as nourishment for invertebrate animals in marine aquaculture program. # 2005 Elsevier B.V. All rights reserved. Keywords: Growth rate; Nutrients uptake; Carbon fixation; Irradiance; Rhodomonas sp www.elsevier.com/locate/aqua-online Aquacultural Engineering 35 (2006) 51–60 * Corresponding author. Tel.: +52 646 1744570; fax: +52 646 1744103. E-mail address: [email protected] (R. Milla ´n-Nu ´n ˜ez). 0144-8609/$ – see front matter # 2005 Elsevier B.V. All rights reserved. doi:10.1016/j.aquaeng.2005.08.004
Transcript of Nutrient uptake, chlorophyll a and carbon fixation by Rhodomonas sp. (Cryptophyceae) cultured at...
Nutrient uptake, chlorophyll a and carbon fixation by
Rhodomonas sp. (Cryptophyceae) cultured at different
irradiance and nutrient concentrations
Fabiola Lafarga-De la Cruz a, Enrique Valenzuela-Espinoza b,Roberto Millan-Nunez a,*, Charles C. Trees c,
Eduardo Santamarıa-del-Angel a, Filiberto Nunez-Cebrero b
a Facultad de Ciencias Marinas, Universidad Autonoma de Baja California, Apartado Postal 453,
Ensenada, Baja California, Mexicob Instituto de Investigaciones Oceanologicas, Universidad Autonoma de Baja California, Apartado Postal 453,
Ensenada, Baja California, Mexicoc Center of Hydro-Optics and Remote Sensing, SDSU, 6505 Alvarado Road, Suite 206, San Diego, CA 92120, USA
Received 23 February 2005; accepted 9 August 2005
Abstract
The goal of this research was to study biomass production, nitrate and phosphate uptake and carbon fixation in batch culture
of the marine microalgae Rhodomonas sp., which is used in aquaculture as food for commercially reared invertebrates. Cultures
were grown for 7 days under four irradiance levels (52, 68, 103 and 142 mmol photon m�2 s�1) and at three nitrate and
phosphate concentrations (661–29, 882–39, 1323–58.5 mM of NaNO3 and NaH2PO4, respectively) establishing 12 experimental
treatments. During the exponential phase, growth was directly correlated with irradiance and the initial nitrate and phosphate
concentrations. Significant differences were found in the low growth phase as a function of nutrient concentration, but not for
irradiance. For the low nutrient concentration treatments, growth was limited after 2 days. Final cell density was influenced by
the initial concentration of nutrients, independently of the irradiance level. The average maximum biomass production was
reached in 7 days in cultures with high nutrients (1.53 � 0.07 � 106 cells mL�1). The total chlorophyll a content was directly
related to cellular density and indirectly to irradiance level and concentration of nutrients. In conclusion, the optimal growing
condition for Rhodomonas was up to the fourth day. However, after this time the cellular density, chlorophyll content and carbon
uptake changed with the nutrient concentration and irradiance. Therefore we suggest that Rhodomonas culture could be used at
the fourth day, either as inoculums for higher volume or as nourishment for invertebrate animals in marine aquaculture program.
# 2005 Elsevier B.V. All rights reserved.
Keywords: Growth rate; Nutrients uptake; Carbon fixation; Irradiance; Rhodomonas sp
www.elsevier.com/locate/aqua-online
Aquacultural Engineering 35 (2006) 51–60
* Corresponding author. Tel.: +52 646 1744570; fax: +52 646 1744103.
E-mail address: [email protected] (R. Millan-Nunez).
0144-8609/$ – see front matter # 2005 Elsevier B.V. All rights reserved.
doi:10.1016/j.aquaeng.2005.08.004
F. Lafarga-De la Cruz et al. / Aquacultural Engineering 35 (2006) 51–6052
1. Introduction
Rhodomonas sp. is a flagellate unicellular red alga
with a cell diameter between 9.2 and 9.9 mm. This
marine microalga has been used as food for marine
copepods (Jonasdottir, 1994), oyster larvae and spat
(Brown et al., 1998; McCausland et al., 1999; Muller-
Feuga et al., 2003) and Strombus gigas veliger larvae
(Aldana-Arana and Patino-Suarez, 1998). At present,
the increasing demand of sea urchin in Asian markets
has caused a serious decline in their biomass for a
variety of populations in coastal areas of Baja
California, Mexico (Palleiro-Nayar, 1994). To abate
this decline management efforts have been focused on
introducing laboratory raised sea urchins to these
depopulated areas. The success of the culturing effort
depends on the production of unicellular algae like
Rhodomonas sp. which is used as a food source for the
sea urchin larval stage (Rogers-Bennett et al., 1994), as
well as for the penaeid shrimp larvae (Muller-Feuga
et al., 2003). A better understanding of growth rates and
nutrient uptake by Rhodomonas sp. under different
environmental conditions is needed, including nutrients
concentration, light intensity and quality, temperature,
salinity and pH, among other factors (Richmond, 1986).
Nutrients or light variability affects microalgal phy-
siology include changing growth rates, cellular volume,
biochemical composition (Claustre and Gostan, 1987;
Lewitus and Caron, 1990), pigment concentration and
composition (Eriksen and Iversen, 1995; Sciandra et al.,
2000), photosynthesis, carbon metabolism (Turpin,
1991) and nutrient consumption (Cloern, 1977).
Although some of these authors pointed out the
importance of study the effect of two or more variables
in physiological algae, therefore, the objective of the
study was to study growth rates, nutrient uptake and
carbon fixation by Rhodomonas sp. in batch cultures
grown at different irradiances and nutrient concentra-
tions.
2. Materials and methods
The marine microalga Rhodomonas sp. was
obtained from the microalgae production laboratory
at the Instituto de Investigaciones Oceanologicas of the
Universidad Autonoma de Baja California. Non-axenic
cultures were maintained at 20 � 1 8C, a salinity of
32% and irradiance of 92 mmol photon m�2 s�1 in f/2
medium (Guillard, 1975). To evaluate the effect of the
irradiance and nutrients on growth, a factorial design of
4 � 3 (12 experimental treatments) was carried out
using four irradiance levels: 52, 68, 103 and
142 mmol photon m�2 s�1, and three nitrate and
phosphate concentrations on f/2 relatively low nutrients
with 661-29; medium with 882-39 and relatively high
nutrients with 1323-58.5 mM of NaNO3 and NaH2PO4,
respectively. The nitrate to phosphate ratio was
maintained at 22.61. All treatments were performed
in triplicate. Illumination was provided by four 8 ft
lamps at 75 W power (General Electric Day-light;
catalog number of F96T12-D-EX). The light intensity
was measured with an irradiometer (model QSL-100,
4p sensor, Biospherical Instruments) in the center at the
base of the culture containers. Cultures were growth for
7 days at 20 � 1 8C. The seawater used for the medium
was filtered through 1 and 0.65 mm porosity filter
cartridges, and subsequently irradiated with ultraviolet
lamps (25 W). We added Tris–buffer to the culture
medium to minimize the pH effect. Experimental
cultures were kept in Erlenmeyer flasks (190 mL of
media, n = 3), which were autoclaved at 121 8C and
1.05 kg cm�2 for 10 min. Each Erlenmeyer flask
received f/2 vitamins and 10 mL of Rhodomonas
culture (1.076 � 0.08 � 106 cells mL�1). To minimize
cell sedimentation, cultures were shaken by hand twice
daily.
Cell density was determined using a 0.1 mm deep
Neubauer chamber. The growth and doubling rates per
day were calculated according to Guillard (1975). The
pH was measured daily with a Chemcadet Jr
potentiometer, while temperature was taken with an
Ertco thermometer. Eight aliquots from each treatment
were filtered through glass microfiber filters GF/C
(1.2 mm nominal porosity) and stored at �60 8C for
spectrophotometer chlorophyll analysis (Parsons
et al., 1985). Pigment concentrations were calculated
using the equations of Millan-Nunez and Alvarez-
Borrego (1978). The filtered water was used to
determine nitrate and phosphate concentrations
(Parsons et al., 1985). For each treatment, two
additional replicates of 10 mL with a cellular density
of 9.3 � 104 cells mL�1 were used for incubation with
2 mCi NaH14CO3 to determine primary productivity.
A non-parametric Kruskal Wallis ANOVA (P < 0.05)
was used to determine differences among treatments.
F. Lafarga-De la Cruz et al. / Aquacultural Engineering 35 (2006) 51–60 53
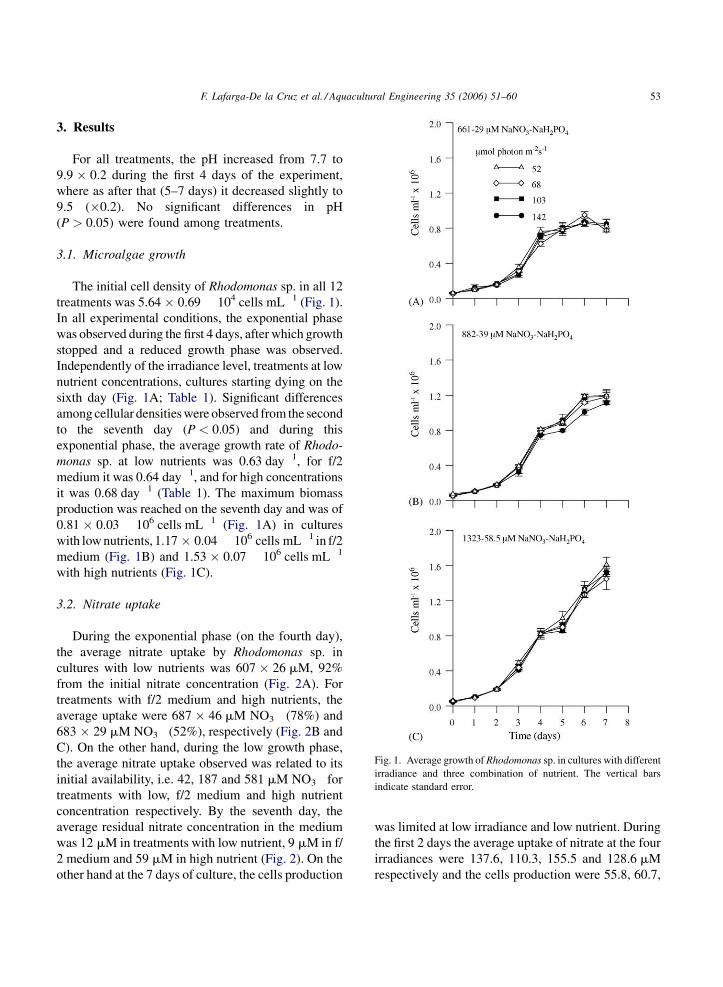
Fig. 1. Average growth of Rhodomonas sp. in cultures with different
irradiance and three combination of nutrient. The vertical bars
indicate standard error.
3. Results
For all treatments, the pH increased from 7.7 to
9.9 � 0.2 during the first 4 days of the experiment,
where as after that (5–7 days) it decreased slightly to
9.5 (�0.2). No significant differences in pH
(P > 0.05) were found among treatments.
3.1. Microalgae growth
The initial cell density of Rhodomonas sp. in all 12
treatments was 5.64 � 0.69 � 104 cells mL�1 (Fig. 1).
In all experimental conditions, the exponential phase
was observed during the first 4 days, after which growth
stopped and a reduced growth phase was observed.
Independently of the irradiance level, treatments at low
nutrient concentrations, cultures starting dying on the
sixth day (Fig. 1A; Table 1). Significant differences
among cellular densities were observed from the second
to the seventh day (P < 0.05) and during this
exponential phase, the average growth rate of Rhodo-
monas sp. at low nutrients was 0.63 day�1, for f/2
medium it was 0.64 day�1, and for high concentrations
it was 0.68 day�1 (Table 1). The maximum biomass
production was reached on the seventh day and was of
0.81 � 0.03 � 106 cells mL�1 (Fig. 1A) in cultures
with low nutrients, 1.17 � 0.04 � 106 cells mL�1 in f/2
medium (Fig. 1B) and 1.53 � 0.07 � 106 cells mL�1
with high nutrients (Fig. 1C).
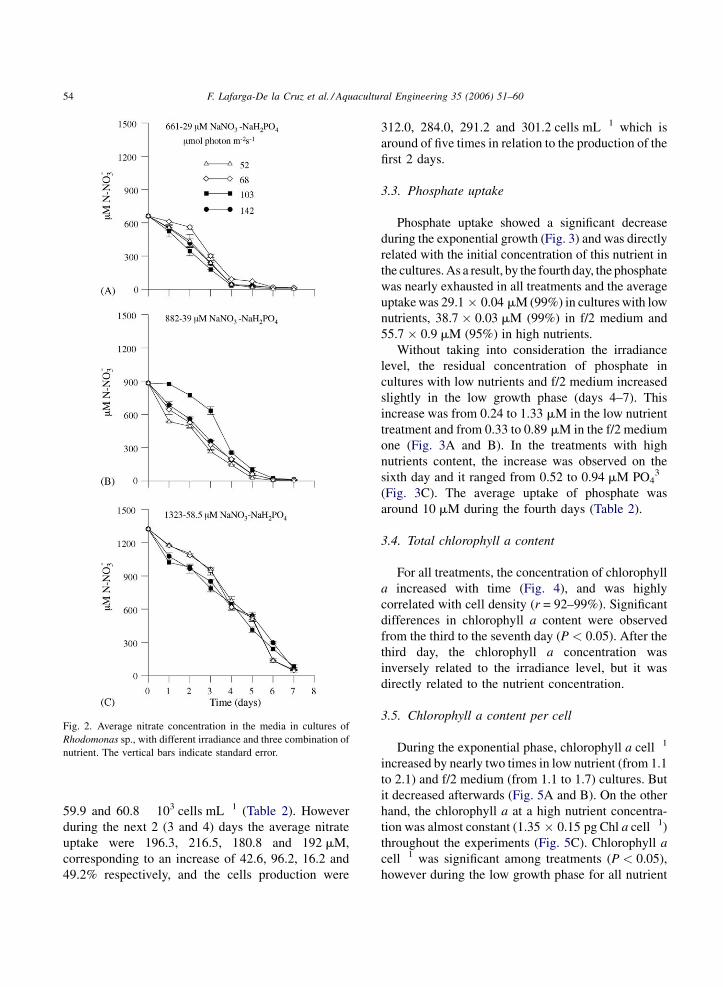
3.2. Nitrate uptake
During the exponential phase (on the fourth day),
the average nitrate uptake by Rhodomonas sp. in
cultures with low nutrients was 607 � 26 mM, 92%
from the initial nitrate concentration (Fig. 2A). For
treatments with f/2 medium and high nutrients, the
average uptake were 687 � 46 mM NO3� (78%) and
683 � 29 mM NO3� (52%), respectively (Fig. 2B and
C). On the other hand, during the low growth phase,
the average nitrate uptake observed was related to its
initial availability, i.e. 42, 187 and 581 mM NO3� for
treatments with low, f/2 medium and high nutrient
concentration respectively. By the seventh day, the
average residual nitrate concentration in the medium
was 12 mM in treatments with low nutrient, 9 mM in f/
2 medium and 59 mM in high nutrient (Fig. 2). On the
other hand at the 7 days of culture, the cells production
was limited at low irradiance and low nutrient. During
the first 2 days the average uptake of nitrate at the four
irradiances were 137.6, 110.3, 155.5 and 128.6 mM
respectively and the cells production were 55.8, 60.7,
F. Lafarga-De la Cruz et al. / Aquacultural Engineering 35 (2006) 51–6054
Fig. 2. Average nitrate concentration in the media in cultures of
Rhodomonas sp., with different irradiance and three combination of
nutrient. The vertical bars indicate standard error.
59.9 and 60.8 � 103 cells mL�1 (Table 2). However
during the next 2 (3 and 4) days the average nitrate
uptake were 196.3, 216.5, 180.8 and 192 mM,
corresponding to an increase of 42.6, 96.2, 16.2 and
49.2% respectively, and the cells production were
312.0, 284.0, 291.2 and 301.2 cells mL�1 which is
around of five times in relation to the production of the
first 2 days.
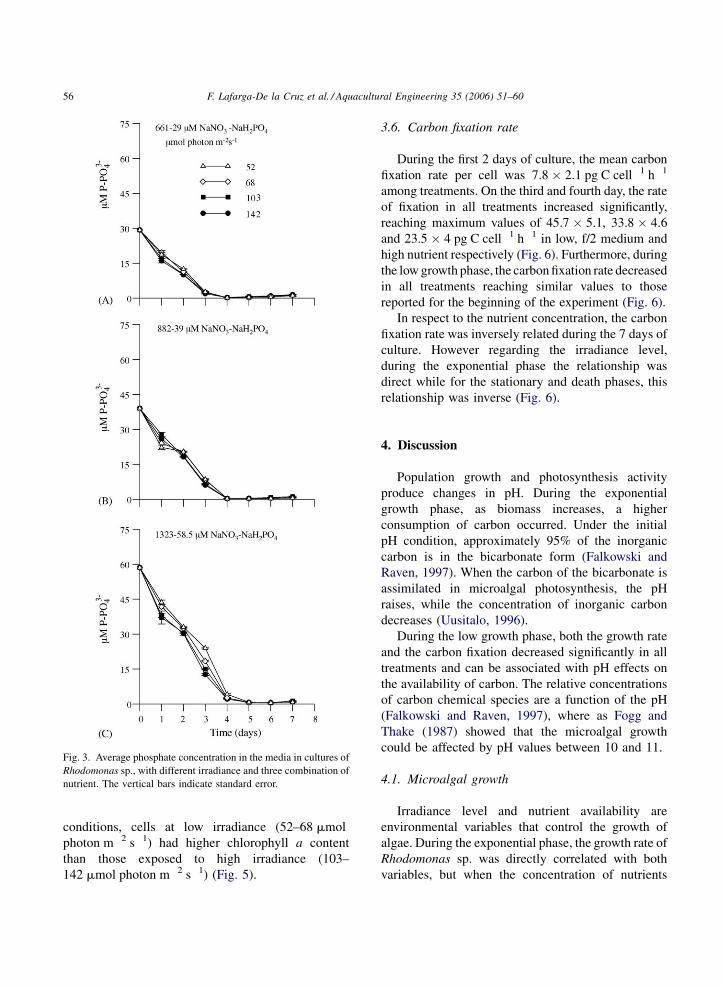
3.3. Phosphate uptake
Phosphate uptake showed a significant decrease
during the exponential growth (Fig. 3) and was directly
related with the initial concentration of this nutrient in
the cultures. As a result, by the fourth day, the phosphate
was nearly exhausted in all treatments and the average
uptake was 29.1 � 0.04 mM (99%) in cultures with low
nutrients, 38.7 � 0.03 mM (99%) in f/2 medium and
55.7 � 0.9 mM (95%) in high nutrients.
Without taking into consideration the irradiance
level, the residual concentration of phosphate in
cultures with low nutrients and f/2 medium increased
slightly in the low growth phase (days 4–7). This
increase was from 0.24 to 1.33 mM in the low nutrient
treatment and from 0.33 to 0.89 mM in the f/2 medium
one (Fig. 3A and B). In the treatments with high
nutrients content, the increase was observed on the
sixth day and it ranged from 0.52 to 0.94 mM PO43�
(Fig. 3C). The average uptake of phosphate was
around 10 mM during the fourth days (Table 2).
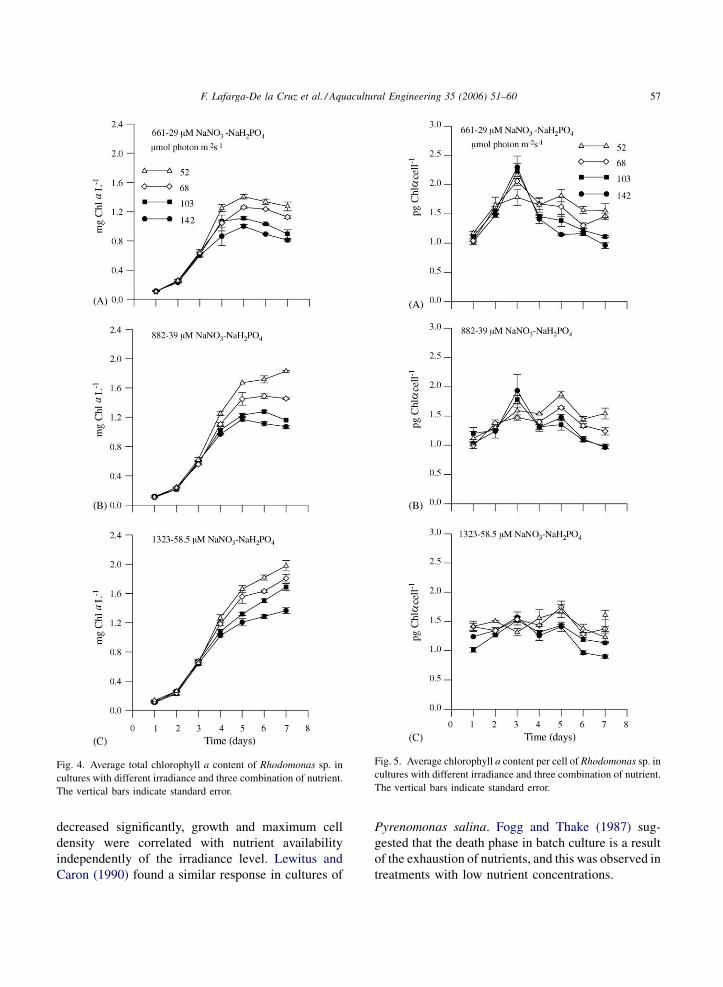
3.4. Total chlorophyll a content
For all treatments, the concentration of chlorophyll
a increased with time (Fig. 4), and was highly
correlated with cell density (r = 92–99%). Significant
differences in chlorophyll a content were observed
from the third to the seventh day (P < 0.05). After the
third day, the chlorophyll a concentration was
inversely related to the irradiance level, but it was
directly related to the nutrient concentration.
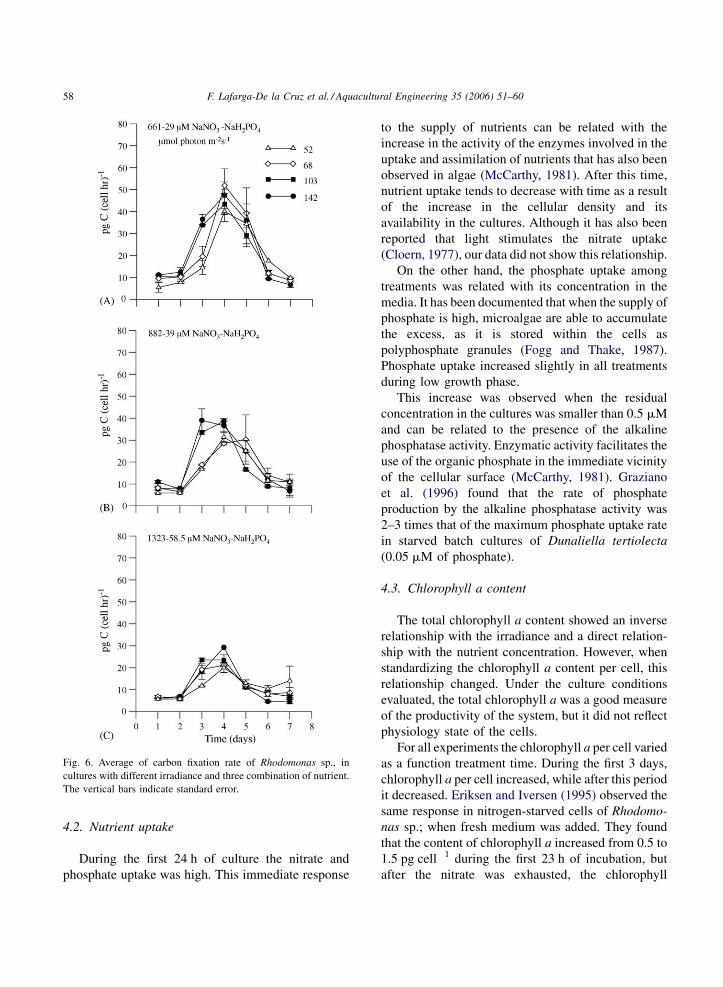
3.5. Chlorophyll a content per cell
During the exponential phase, chlorophyll a cell�1
increased by nearly two times in low nutrient (from 1.1
to 2.1) and f/2 medium (from 1.1 to 1.7) cultures. But
it decreased afterwards (Fig. 5A and B). On the other
hand, the chlorophyll a at a high nutrient concentra-
tion was almost constant (1.35 � 0.15 pg Chl a cell�1)
throughout the experiments (Fig. 5C). Chlorophyll a
cell�1 was significant among treatments (P < 0.05),
however during the low growth phase for all nutrient
F. Lafarga-De la Cruz et al. / Aquacultural Engineering 35 (2006) 51–60 55
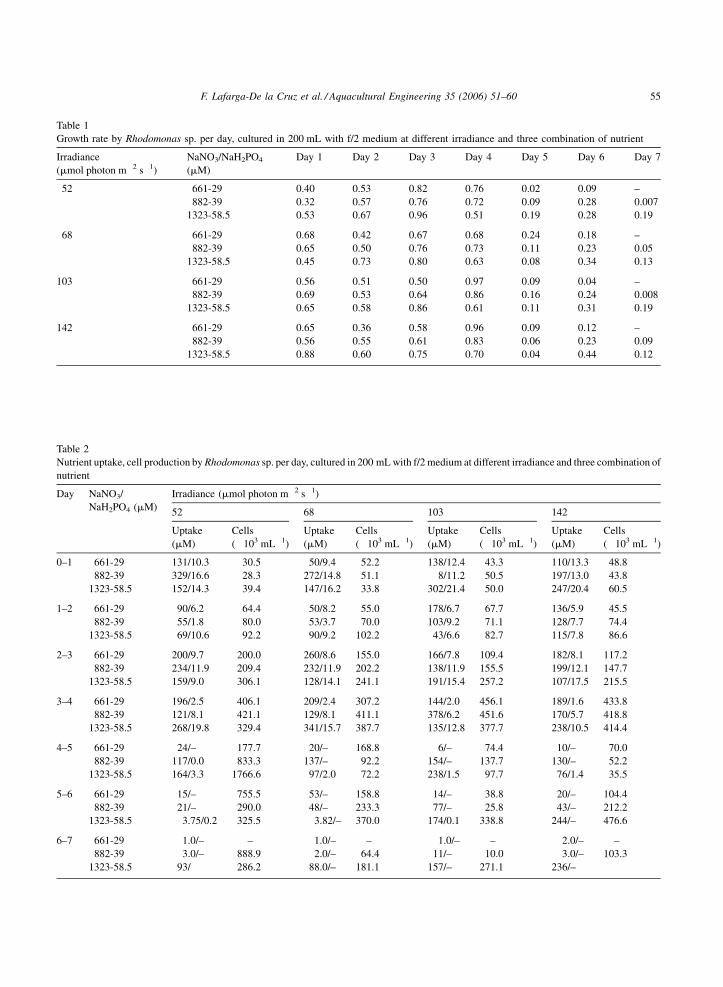
Table 1
Growth rate by Rhodomonas sp. per day, cultured in 200 mL with f/2 medium at different irradiance and three combination of nutrient
Irradiance
(mmol photon m�2 s�1)
NaNO3/NaH2PO4
(mM)
Day 1 Day 2 Day 3 Day 4 Day 5 Day 6 Day 7
52 661-29 0.40 0.53 0.82 0.76 0.02 0.09 –
882-39 0.32 0.57 0.76 0.72 0.09 0.28 0.007
1323-58.5 0.53 0.67 0.96 0.51 0.19 0.28 0.19
68 661-29 0.68 0.42 0.67 0.68 0.24 0.18 –
882-39 0.65 0.50 0.76 0.73 0.11 0.23 0.05
1323-58.5 0.45 0.73 0.80 0.63 0.08 0.34 0.13
103 661-29 0.56 0.51 0.50 0.97 0.09 0.04 –
882-39 0.69 0.53 0.64 0.86 0.16 0.24 0.008
1323-58.5 0.65 0.58 0.86 0.61 0.11 0.31 0.19
142 661-29 0.65 0.36 0.58 0.96 0.09 0.12 –
882-39 0.56 0.55 0.61 0.83 0.06 0.23 0.09
1323-58.5 0.88 0.60 0.75 0.70 0.04 0.44 0.12
Table 2
Nutrient uptake, cell production by Rhodomonas sp. per day, cultured in 200 mL with f/2 medium at different irradiance and three combination of
nutrient
Day NaNO3/
NaH2PO4 (mM)
Irradiance (mmol photon m�2 s�1)
52 68 103 142
Uptake
(mM)
Cells
(�103 mL�1)
Uptake
(mM)
Cells
(�103 mL�1)
Uptake
(mM)
Cells
(�103 mL�1)
Uptake
(mM)
Cells
(�103 mL�1)
0–1 661-29 131/10.3 30.5 50/9.4 52.2 138/12.4 43.3 110/13.3 48.8
882-39 329/16.6 28.3 272/14.8 51.1 8/11.2 50.5 197/13.0 43.8
1323-58.5 152/14.3 39.4 147/16.2 33.8 302/21.4 50.0 247/20.4 60.5
1–2 661-29 90/6.2 64.4 50/8.2 55.0 178/6.7 67.7 136/5.9 45.5
882-39 55/1.8 80.0 53/3.7 70.0 103/9.2 71.1 128/7.7 74.4
1323-58.5 69/10.6 92.2 90/9.2 102.2 43/6.6 82.7 115/7.8 86.6
2–3 661-29 200/9.7 200.0 260/8.6 155.0 166/7.8 109.4 182/8.1 117.2
882-39 234/11.9 209.4 232/11.9 202.2 138/11.9 155.5 199/12.1 147.7
1323-58.5 159/9.0 306.1 128/14.1 241.1 191/15.4 257.2 107/17.5 215.5
3–4 661-29 196/2.5 406.1 209/2.4 307.2 144/2.0 456.1 189/1.6 433.8
882-39 121/8.1 421.1 129/8.1 411.1 378/6.2 451.6 170/5.7 418.8
1323-58.5 268/19.8 329.4 341/15.7 387.7 135/12.8 377.7 238/10.5 414.4
4–5 661-29 24/– 177.7 20/– 168.8 6/– 74.4 10/– 70.0
882-39 117/0.0 833.3 137/– 92.2 154/– 137.7 130/– 52.2
1323-58.5 164/3.3 1766.6 97/2.0 72.2 238/1.5 97.7 76/1.4 35.5
5–6 661-29 15/– 755.5 53/– 158.8 14/– 38.8 20/– 104.4
882-39 21/– 290.0 48/– 233.3 77/– 25.8 43/– 212.2
1323-58.5 3.75/0.2 325.5 3.82/– 370.0 174/0.1 338.8 244/– 476.6
6–7 661-29 1.0/– – 1.0/– – 1.0/– – 2.0/– –
882-39 3.0/– 888.9 2.0/– 64.4 11/– 10.0 3.0/– 103.3
1323-58.5 93/� 286.2 88.0/– 181.1 157/– 271.1 236/–
F. Lafarga-De la Cruz et al. / Aquacultural Engineering 35 (2006) 51–6056
Fig. 3. Average phosphate concentration in the media in cultures of
Rhodomonas sp., with different irradiance and three combination of
nutrient. The vertical bars indicate standard error.
conditions, cells at low irradiance (52–68 mmol
photon m�2 s�1) had higher chlorophyll a content
than those exposed to high irradiance (103–
142 mmol photon m�2 s�1) (Fig. 5).
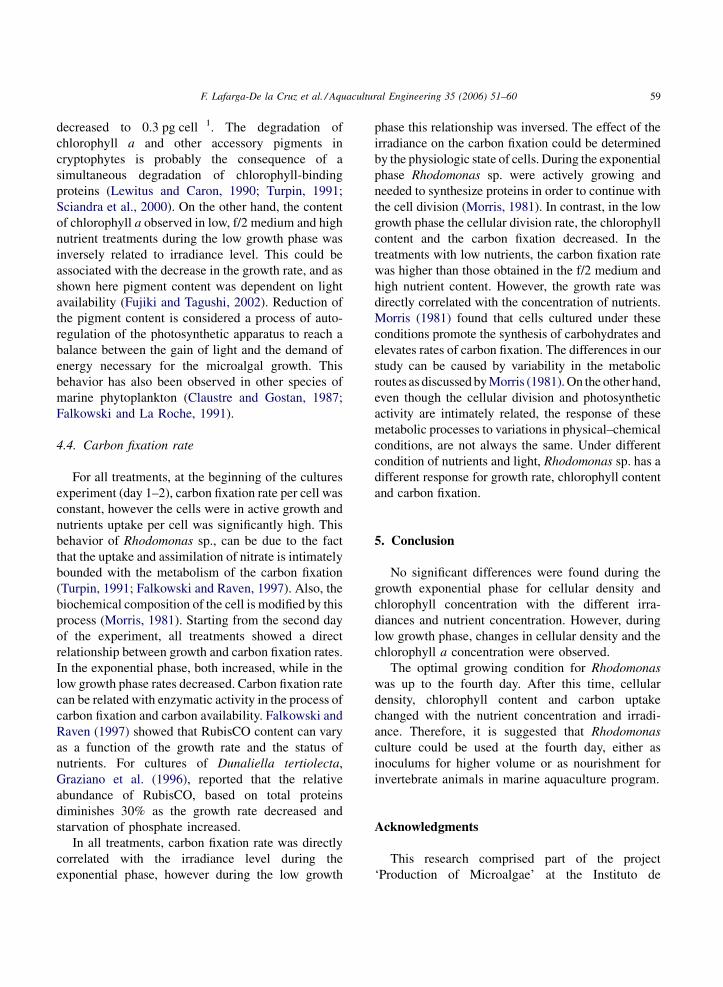
3.6. Carbon fixation rate
During the first 2 days of culture, the mean carbon
fixation rate per cell was 7.8� 2.1 pg C cell�1 h�1
among treatments. On the third and fourth day, the rate
of fixation in all treatments increased significantly,
reaching maximum values of 45.7 � 5.1, 33.8 � 4.6
and 23.5 � 4 pg C cell�1 h�1 in low, f/2 medium and
high nutrient respectively (Fig. 6). Furthermore, during
the low growth phase, the carbon fixation rate decreased
in all treatments reaching similar values to those
reported for the beginning of the experiment (Fig. 6).
In respect to the nutrient concentration, the carbon
fixation rate was inversely related during the 7 days of
culture. However regarding the irradiance level,
during the exponential phase the relationship was
direct while for the stationary and death phases, this
relationship was inverse (Fig. 6).
4. Discussion
Population growth and photosynthesis activity
produce changes in pH. During the exponential
growth phase, as biomass increases, a higher
consumption of carbon occurred. Under the initial
pH condition, approximately 95% of the inorganic
carbon is in the bicarbonate form (Falkowski and
Raven, 1997). When the carbon of the bicarbonate is
assimilated in microalgal photosynthesis, the pH
raises, while the concentration of inorganic carbon
decreases (Uusitalo, 1996).
During the low growth phase, both the growth rate
and the carbon fixation decreased significantly in all
treatments and can be associated with pH effects on
the availability of carbon. The relative concentrations
of carbon chemical species are a function of the pH
(Falkowski and Raven, 1997), where as Fogg and
Thake (1987) showed that the microalgal growth
could be affected by pH values between 10 and 11.
4.1. Microalgal growth
Irradiance level and nutrient availability are
environmental variables that control the growth of
algae. During the exponential phase, the growth rate of
Rhodomonas sp. was directly correlated with both
variables, but when the concentration of nutrients
F. Lafarga-De la Cruz et al. / Aquacultural Engineering 35 (2006) 51–60 57
Fig. 4. Average total chlorophyll a content of Rhodomonas sp. in
cultures with different irradiance and three combination of nutrient.
The vertical bars indicate standard error.
Fig. 5. Average chlorophyll a content per cell of Rhodomonas sp. in
cultures with different irradiance and three combination of nutrient.
The vertical bars indicate standard error.
decreased significantly, growth and maximum cell
density were correlated with nutrient availability
independently of the irradiance level. Lewitus and
Caron (1990) found a similar response in cultures of
Pyrenomonas salina. Fogg and Thake (1987) sug-
gested that the death phase in batch culture is a result
of the exhaustion of nutrients, and this was observed in
treatments with low nutrient concentrations.
F. Lafarga-De la Cruz et al. / Aquacultural Engineering 35 (2006) 51–6058
Fig. 6. Average of carbon fixation rate of Rhodomonas sp., in
cultures with different irradiance and three combination of nutrient.
The vertical bars indicate standard error.
4.2. Nutrient uptake
During the first 24 h of culture the nitrate and
phosphate uptake was high. This immediate response
to the supply of nutrients can be related with the
increase in the activity of the enzymes involved in the
uptake and assimilation of nutrients that has also been
observed in algae (McCarthy, 1981). After this time,
nutrient uptake tends to decrease with time as a result
of the increase in the cellular density and its
availability in the cultures. Although it has also been
reported that light stimulates the nitrate uptake
(Cloern, 1977), our data did not show this relationship.
On the other hand, the phosphate uptake among
treatments was related with its concentration in the
media. It has been documented that when the supply of
phosphate is high, microalgae are able to accumulate
the excess, as it is stored within the cells as
polyphosphate granules (Fogg and Thake, 1987).
Phosphate uptake increased slightly in all treatments
during low growth phase.
This increase was observed when the residual
concentration in the cultures was smaller than 0.5 mM
and can be related to the presence of the alkaline
phosphatase activity. Enzymatic activity facilitates the
use of the organic phosphate in the immediate vicinity
of the cellular surface (McCarthy, 1981). Graziano
et al. (1996) found that the rate of phosphate
production by the alkaline phosphatase activity was
2–3 times that of the maximum phosphate uptake rate
in starved batch cultures of Dunaliella tertiolecta
(0.05 mM of phosphate).
4.3. Chlorophyll a content
The total chlorophyll a content showed an inverse
relationship with the irradiance and a direct relation-
ship with the nutrient concentration. However, when
standardizing the chlorophyll a content per cell, this
relationship changed. Under the culture conditions
evaluated, the total chlorophyll a was a good measure
of the productivity of the system, but it did not reflect
physiology state of the cells.
For all experiments the chlorophyll a per cell varied
as a function treatment time. During the first 3 days,
chlorophyll a per cell increased, while after this period
it decreased. Eriksen and Iversen (1995) observed the
same response in nitrogen-starved cells of Rhodomo-
nas sp.; when fresh medium was added. They found
that the content of chlorophyll a increased from 0.5 to
1.5 pg cell�1 during the first 23 h of incubation, but
after the nitrate was exhausted, the chlorophyll
F. Lafarga-De la Cruz et al. / Aquacultural Engineering 35 (2006) 51–60 59
decreased to 0.3 pg cell�1. The degradation of
chlorophyll a and other accessory pigments in
cryptophytes is probably the consequence of a
simultaneous degradation of chlorophyll-binding
proteins (Lewitus and Caron, 1990; Turpin, 1991;
Sciandra et al., 2000). On the other hand, the content
of chlorophyll a observed in low, f/2 medium and high
nutrient treatments during the low growth phase was
inversely related to irradiance level. This could be
associated with the decrease in the growth rate, and as
shown here pigment content was dependent on light
availability (Fujiki and Tagushi, 2002). Reduction of
the pigment content is considered a process of auto-
regulation of the photosynthetic apparatus to reach a
balance between the gain of light and the demand of
energy necessary for the microalgal growth. This
behavior has also been observed in other species of
marine phytoplankton (Claustre and Gostan, 1987;
Falkowski and La Roche, 1991).
4.4. Carbon fixation rate
For all treatments, at the beginning of the cultures
experiment (day 1–2), carbon fixation rate per cell was
constant, however the cells were in active growth and
nutrients uptake per cell was significantly high. This
behavior of Rhodomonas sp., can be due to the fact
that the uptake and assimilation of nitrate is intimately
bounded with the metabolism of the carbon fixation
(Turpin, 1991; Falkowski and Raven, 1997). Also, the
biochemical composition of the cell is modified by this
process (Morris, 1981). Starting from the second day
of the experiment, all treatments showed a direct
relationship between growth and carbon fixation rates.
In the exponential phase, both increased, while in the
low growth phase rates decreased. Carbon fixation rate
can be related with enzymatic activity in the process of
carbon fixation and carbon availability. Falkowski and
Raven (1997) showed that RubisCO content can vary
as a function of the growth rate and the status of
nutrients. For cultures of Dunaliella tertiolecta,
Graziano et al. (1996), reported that the relative
abundance of RubisCO, based on total proteins
diminishes 30% as the growth rate decreased and
starvation of phosphate increased.
In all treatments, carbon fixation rate was directly
correlated with the irradiance level during the
exponential phase, however during the low growth
phase this relationship was inversed. The effect of the
irradiance on the carbon fixation could be determined
by the physiologic state of cells. During the exponential
phase Rhodomonas sp. were actively growing and
needed to synthesize proteins in order to continue with
the cell division (Morris, 1981). In contrast, in the low
growth phase the cellular division rate, the chlorophyll
content and the carbon fixation decreased. In the
treatments with low nutrients, the carbon fixation rate
was higher than those obtained in the f/2 medium and
high nutrient content. However, the growth rate was
directly correlated with the concentration of nutrients.
Morris (1981) found that cells cultured under these
conditions promote the synthesis of carbohydrates and
elevates rates of carbon fixation. The differences in our
study can be caused by variability in the metabolic
routes as discussed by Morris (1981). On the other hand,
even though the cellular division and photosynthetic
activity are intimately related, the response of these
metabolic processes to variations in physical–chemical
conditions, are not always the same. Under different
condition of nutrients and light, Rhodomonas sp. has a
different response for growth rate, chlorophyll content
and carbon fixation.
5. Conclusion
No significant differences were found during the
growth exponential phase for cellular density and
chlorophyll concentration with the different irra-
diances and nutrient concentration. However, during
low growth phase, changes in cellular density and the
chlorophyll a concentration were observed.
The optimal growing condition for Rhodomonas
was up to the fourth day. After this time, cellular
density, chlorophyll content and carbon uptake
changed with the nutrient concentration and irradi-
ance. Therefore, it is suggested that Rhodomonas
culture could be used at the fourth day, either as
inoculums for higher volume or as nourishment for
invertebrate animals in marine aquaculture program.
Acknowledgments
This research comprised part of the project
‘Production of Microalgae’ at the Instituto de
F. Lafarga-De la Cruz et al. / Aquacultural Engineering 35 (2006) 51–6060
Investigaciones Oceanologicas of the Universidad
Autonoma de Baja California, with support from
UABC. The authors are grateful to CONACYT for
support to the first author during her graduate studies.
References
Aldana-Arana, D., Patino-Suarez, V., 1998. Overview of diets used
in larviculture of three Caribbean Conchs: Queen Conch Strom-
bus gigas, Milk Conch Strombus costatus and Fighting Conch
Strombus pugilis. Aquaculture 167, 163–178.
Brown, M.R., McCausland, M.A., Kowalski, K., 1998. The nutri-
tional value of four Australian microalgae strains fed to Pacific
oyster Crassostrea gigas spat. Aquaculture 165, 281–293.
Claustre, H., Gostan, J., 1987. Adaptation of biochemical composi-
tion and cell size to irradiance in two microalgae: possible
ecological implications. Mar. Ecol. Prog. Ser. 40, 167–174.
Cloern, J.E., 1977. Effects of light intensity and temperature on
Cryptomonas ovata (Cryptophyceae) growth and nutrient uptake
rates. J. Phycol. 13, 389–395.
Eriksen, N.T., Iversen, L.J.J., 1995. Photosynthetic pigments as
nitrogen stores in the cryptophyte alga Rhodomonas sp. J.
Mar. Biotechnol. 3, 193–195.
Falkowski, P.G., La Roche, J., 1991. Acclimation to spectral irra-
diance in algae. J. Phycol. 27, 8–14.
Falkowski, P.G., Raven, J.A., 1997. Aquatic Photosynthesis. Black-
well Science, Inc., Malden, MA, 375 pp.
Fogg, G.E., Thake, B., 1987. Algal Cultures and Phytoplankton
Ecology. The University of Wisconsin Press, 259 pp.
Fujiki, T., Tagushi, S., 2002. Variability in chlorophyll a specific
absorption coefficient in marine phytoplankton as a function of
cell size and irradiance. J. Plankton Res. 24 (9), 859–874.
Graziano, L.M., La Roche, J., Geider, R.J., 1996. Physiological
responses to phosphorus limitation in batch and steady-state
cultures of Dunaliella tertiolecta (Chlorophyta): to unique stress
protein as an indicator of phosphate deficiency. J. Phycol. 32,
825–838.
Guillard, R.R.L., 1975. Culture of phytoplankton for feeding
marine invertebrates animals. In: Smith, W.L., Chanley,
M.H. (Eds.), Culture of Invertebrates Marine Animals. Plenum
Publishing Corp., New York, pp. 29–60.
Jonasdottir, S.H., 1994. Effects of food quality on the reproductive
success of Acartia tonsa and Acartia hudsonica: laboratory
observations. Marine Biol. 121, 67–81.
Lewitus, J.A., Caron, D.A., 1990. Relative effects of nitrogen
or phosphorus depletion and light intensity on the pigmenta-
tion, chemical composition and volume of Pyrenomonas salina
(Cryptophyceae). Mar. Ecol. Prog. Ser. 61, 171–
181.
McCarthy, J.J., 1981. The kinetics of nutrient utilization. In: Platt, T.
(Ed.), Bases of Phytoplankton Ecology. Can. Bull. Fish. Aquat.
Sci. 210, 211–233.
McCausland, M.A., Brown, M.R., Barrett, S.M., Diemar, J.A.,
Heasman, M.P., 1999. Evaluation of live microalgae and micro-
algal pastes as supplementary food for juvenile Pacific oyster
Crassostrea gigas. Aquaculture 174, 323–342.
Millan-Nunez, R., Alvarez-Borrego, S., 1978. Ecuaciones espec-
trofotometricas tricromaticas para la determinacion de clorofilas
a, b, y c y sus feofitinas. Ciencias Marinas 5, 47–55.
Morris, I., 1981. Photosynthetic products, physiological state and
phytoplankton growth. In: Platt, T. (Ed.), Base of Phytoplankton
Ecology. Can. Bull. Fish. Aquat. Sci. 210, 83–102.
Muller-Feuga, A., Moal, J., Kaas, R., 2003. The microalgae of
aquaculture. In: Støttrup, J.G., McEvoy, L.A. (Eds.), Live Feeds
in Marine Aquaculture. Iowa State Press/Blackwell Publishing
Company, pp. 206–243.
Palleiro-Nayar, J.S., 1994.In: Pesquerıa de erizo rojo en Baja
California temporada 92–93 en memorias del X Simposium
Internacional de Biologıa Marina, Junio 13–17, Ensenada, Baja
California.
Parsons, T.R., Maita, Y., Lalli, C.M., 1985. A Manual of Chemical
and Biological Methods for Seawater Analysis, 1st ed. Perga-
mon Press, p. 173.
Richmond, A., 1986. Cell response to environmental factors. In:
Richmond, A. (Ed.), Handbook of Microalgal Mass Culture.
CRC Press, Florida, pp. 69–99.
Rogers-Bennett, L., Fasteneau, H.C., Hibbard-Robbins, T.,
Cain, Z., Dewees, C.M., 1994. Culturing red sea urchin of
experimental outplanting in Northern California. Final
Report of Bodega Marine Laboratory, Santa Cruz University,
USA.
Sciandra, A., Lazzara, L., Claustre, H., Babin, M., 2000. Response
of growth rate, pigment composition and optical properties of
Cryptomonas sp. to light and nitrogen stress. Mar. Ecol. Prog.
Ser. 201, 107–120.
Turpin, D.H., 1991. Effects of inorganic N availability on algal
photosynthesis and carbon metabolism. J. Phycol. 27, 14–
20.
Uusitalo, J., 1996. Algal carbon uptake and the difference between
alkalinity and high pH (‘‘alkalization’’), exemplified with to pH
drift experiment. Sci. Mar. 60, 129–134.