Fertilizer inputs, nutrient balance and soil nutrient supplying power in intensive, irrigated rice...
15
Nutrient Cycling in Agroecosysrems 46: 111-125, 1996. @ 1996 Kluwer Academic Publishers. Printed in the Netherlands. 111 Fertilizer inputs, nutrient balance and soil nutrient supplying power in intensive, irrigated rice systems. III. Phosphorus A. Dobermann, K. G. Cassman, P C. Sta. Cruz, M.A.A. Adviento & M.F. Pampolino International Rice Research Institute, I? 0. Box 933, Manila 1099, Philippines Received 5 December 1995; accepted in revised form 20 August 1996 Key words: long-term experiments, phosphorus, rice, nutrient balance, phosphorus uptake, fertilizer P response, soil testing, ion-exchange resin, phosphorus supplying capacity Abstract Data from long-term experiments at 11 sites in Asia with a wide range of nutrient input treatments and yield levels were used to quantify crop P requirements of rice (Oryza sativa L.) and the P balance in intensive, irrigated rice systems. Uptake of 1.8-4.2 kg P was required to produce one ton of grain yield. Physiological P use efficiency varied between 220 to 900 kg grain kg P-l. Without added P, there was a net loss of 7 to 8 kg P ha-’ per crop; with added P there was a net gain of 4 to 5 kg P ha-’ per crop. Phosphorus adsorption kinetics on mixed-bed ion-exchange resin capsules provided an integrative measure of soil P status, P diffusion, and acid-induced P solubilization. The resin capsule was a sensitive tool to characterize buildup or depletion of soil P as a result of different P balances. Both Olsen-P and the resin capsule were suitable methods to predict P uptake of tropical lowland rice. It is hypothesized that both methods measure a similar soil P pool which is soluble under alkaline, aerobic conditions but transformed into acid-soluble P forms as a result of submergence and reduction. Present recommendations for P fertilizer use on rice of 20-25 kg P ha-’ are adequate to maintain yields of 5-6 t ha-‘, but sustaining higher yields of 7-8 t ha-’ will require farm-specific management strategies based on knowledge of the long-term P balance and soil P-supplying capacity. Introduction Response of modern rice (Oryza sativa L.) varieties to P may become significant after several years of inten- sive cropping, particularly when both N and K were applied or when the P-supplying capacity of the soil is low [9; 281. Many Asian countries lack indigenous sources of P and must rely on P imports [7], and effi- cient P management is of strategic importance. However, the approaches used for specifying fertil- izer P recommendations are frequently not appropriate. Blanket recommendations for an entire province are widely used and currently available soil maps in many developing countries do not provide a satisfactory basis for specifying soil type-specific fertilizer recommen- dations for rice, because management-induced varia- tion between farmers is much larger than differences among soil types [24]. Unbalanced P input/output may lead to either depletion or excessive enrichment of soil P in intensive irrigated rice systems. Based on a recent survey of farmers’ fields [23], 64% of a 20000-ha area of irrigated riceland in Central Luzon, Philippines, was classified as low in available soil P reserves. In con- trast, it has been estimated that 85% of the total lowland rice area in Java, Indonesia, now has a high soil P status so that yields no longer respond to applied P [30]. The classical empirical approach of specifying fer- tilizer P recommendations based on critical soil test levels and fertilizer P response curves requires a large number of site-specific field calibration studies. It is often not clearly related to crop P requirements based on a target yield and interactions with other nutrients are rarely considered. An alternative approach is based on estimates of the potential soil P supply (kg P ha-’ per crop) and crop P uptake [ 171. A practical mea- sure of potential P supply can be defined as the total P uptake by a rice crop from indigenous soil resources measured under field conditions, when all other nutri-
-
Upload
un-lincoln -
Category
Documents
-
view
0 -
download
0
Transcript of Fertilizer inputs, nutrient balance and soil nutrient supplying power in intensive, irrigated rice...

Nutrient Cycling in Agroecosysrems 46: 111-125, 1996. @ 1996 Kluwer Academic Publishers. Printed in the Netherlands.
111
Fertilizer inputs, nutrient balance and soil nutrient supplying power in intensive, irrigated rice systems. III. Phosphorus
A. Dobermann, K. G. Cassman, P C. Sta. Cruz, M.A.A. Adviento & M.F. Pampolino International Rice Research Institute, I? 0. Box 933, Manila 1099, Philippines
Received 5 December 1995; accepted in revised form 20 August 1996
Key words: long-term experiments, phosphorus, rice, nutrient balance, phosphorus uptake, fertilizer P response, soil testing, ion-exchange resin, phosphorus supplying capacity
Abstract
Data from long-term experiments at 11 sites in Asia with a wide range of nutrient input treatments and yield levels were used to quantify crop P requirements of rice (Oryza sativa L.) and the P balance in intensive, irrigated rice systems. Uptake of 1.8-4.2 kg P was required to produce one ton of grain yield. Physiological P use efficiency varied between 220 to 900 kg grain kg P-l. Without added P, there was a net loss of 7 to 8 kg P ha-’ per crop; with added P there was a net gain of 4 to 5 kg P ha-’ per crop. Phosphorus adsorption kinetics on mixed-bed ion-exchange resin capsules provided an integrative measure of soil P status, P diffusion, and acid-induced P solubilization. The resin capsule was a sensitive tool to characterize buildup or depletion of soil P as a result of different P balances. Both Olsen-P and the resin capsule were suitable methods to predict P uptake of tropical lowland rice. It is hypothesized that both methods measure a similar soil P pool which is soluble under alkaline, aerobic conditions but transformed into acid-soluble P forms as a result of submergence and reduction. Present recommendations for P fertilizer use on rice of 20-25 kg P ha-’ are adequate to maintain yields of 5-6 t ha-‘, but sustaining higher yields of 7-8 t ha-’ will require farm-specific management strategies based on knowledge of the long-term P balance and soil P-supplying capacity.
Introduction
Response of modern rice (Oryza sativa L.) varieties to P may become significant after several years of inten- sive cropping, particularly when both N and K were applied or when the P-supplying capacity of the soil is low [9; 281. Many Asian countries lack indigenous sources of P and must rely on P imports [7], and effi- cient P management is of strategic importance.
However, the approaches used for specifying fertil- izer P recommendations are frequently not appropriate. Blanket recommendations for an entire province are widely used and currently available soil maps in many developing countries do not provide a satisfactory basis for specifying soil type-specific fertilizer recommen- dations for rice, because management-induced varia- tion between farmers is much larger than differences among soil types [24]. Unbalanced P input/output may lead to either depletion or excessive enrichment of soil
P in intensive irrigated rice systems. Based on a recent survey of farmers’ fields [23], 64% of a 20000-ha area of irrigated riceland in Central Luzon, Philippines, was classified as low in available soil P reserves. In con- trast, it has been estimated that 85% of the total lowland rice area in Java, Indonesia, now has a high soil P status so that yields no longer respond to applied P [30].
The classical empirical approach of specifying fer- tilizer P recommendations based on critical soil test levels and fertilizer P response curves requires a large number of site-specific field calibration studies. It is often not clearly related to crop P requirements based on a target yield and interactions with other nutrients are rarely considered. An alternative approach is based on estimates of the potential soil P supply (kg P ha-’ per crop) and crop P uptake [ 171. A practical mea- sure of potential P supply can be defined as the total P uptake by a rice crop from indigenous soil resources measured under field conditions, when all other nutri-
112
ents (N, K, etc.) are amply supplied [ 171. At issue is which soil tests can be used to predict the potential P supply in lowland rice soils. Olsen-P [25] or, to a less- er extent, Bray-l-P [4], are recommended as indices of available soil P in flooded rice soils [6]. Howev- er, critical levels of Olsen-P reported for rice range from 4 to 29 mg P kg-’ [15; 261 and soil test values were frequently not correlated with yield response to P application in the field [6; 221. Phosphorus extraction by ion-exchange resin is often better related to plant P uptake or response to P fertilizers, but knowledge of the resin characteristics is important to assess the results [29].
The relevant questions to answer are: can the cur- rent P management strategies sustain average yields of 7-8 t ha-’ that have to be achieved on irrigated rice- land within the next 30 years [5]; and what are the key components of improved P management strategies in high-yielding, irrigated rice systems of the Tropics? Previous studies have provided information about par- ticular aspects of P management in irrigated rice, but quantitative field data across a wide range of envi- ronmental and crop management conditions are not available. In this paper we continue our analysis of 11 long-term fertility experiments in five countries [ 121. Our purpose is to quantify the relationship between grain yield and total P uptake as the basis for estima- ting the P requirement for specific yield targets; assess the P balance and long-term effects of different nutri- ent input regimes on soil P status and yield response to applied P; and evaluate soil tests for estimating soil P-supplying capacity in irrigated lowland rice.
Material and methods
Details about site characteristics, soils, experimental design, sampling, and analytical procedures are pro- vided elsewhere [ll; 121. In brief, in 1993, we mea- sured soil properties and nutrient uptake by irrigated rice in six fertilizer treatments (Control, N, NP, NK, PK, NPK) of long-term fertility experiments at 11 sites in the Philippines (IRRI, PhilRice, BRIARC), Indone- sia (Maros, Lanrang), Vietnam (Cuu Long), China (Shipai, Jinxian, Qingpu), and India (Pantnagar, Coim- batore). Soils at these sites represent a wide range of classes (Entisols, Inceptisols, Vertisols, Mollisols, and highly weathered soils), parent materials, and texture ranging from 25 to 57% clay content. The sites at Shipai, Jinxian, and Cuu Long had predominantly 1: 1 layer clay minerals (mostly kaolinite), whereas all oth-
er sites had a mixed composition of the clay fraction with dominating 2:l layer minerals (micas, chlorite, smectite, vermiculite). An annual double-crop rice sys- tem was practiced at eight sites, a rice-wheat system at two sites (Qingpu, Coimbatore), and a rice-mungbean- sesame system at Pantnagar. Fertilizer rates ranged from 80-200 kg N ha-‘, 17-25 kg P ha-‘, and 25- 100 K ha-‘.
In 1993, soil and plant samples were collected dur- ing the highest-yielding rice season. At physiological maturity, grain yields (adjusted to 14% moisture con- tent) were measured in a 5-m’ harvest area centered within each plot and concentrations of P in grain and straw were determined from a 6- or 12- hill sample. Plant samples were dried to constant weight at 70 “C and ground. Phosphorus concentrations in plant tissue were determined after dry-ashing (2 h at 200 “C plus 4 h at 490 “C) by the molybdenum-blue calorimetric method [21; 361.
At all sites, soil samples were taken from the O- 20 cm puddled soil layer in three replicate plots of each treatment before maximum tillering (20-30 d after transplanting). One subsample was air-dried and used to determine Olsen-P (0.5M NaHCOs, pH 8.5) and Bray 1-P (0.03M NH4F + 0.025M HCI) as well as other soil properties [ 121. A second subsample of fresh, reduced soil was used to determine the kinetics of soil P release in bulked samples for each treatment by a 2-wk anaerobic incubation of soil with a mixed-bed ion-exchange resin capsule in H+/OH- form [ 111. All results of the resin method are given as resin adsorp- tion quantity (RAQ) in pmol P cme2 capsule surface. Adsorption kinetics of P on the resin were described by the fractional power equation (two-constant rate model):
wQ(i,t) = atb a<0 O<b<l (1)
where RAQ(i,t) is the quantity (pm01 cme2) of nutrient i (here P) adsorbed by the resin at time t (d), a is the P sorbed by the resin at unit time (1 d), and b is the adsorption rate coefficient or the fall-off in the rate of uptake by the resin. We estimated ap and bp by fitting Eq. [l] to the RAQ values obtained for five incubation times.
Stepwise-forward multiple regression with a toler- ance value of 0.1 was used to derive equations describ- ing the relationships between soil properties, resin P adsorption, and P uptake. Fertilizer P in the NPK plots was applied 30-40 d before the soil samples were taken and a large proportion of fertilizer P adsorption in low-

113
land rice soils is usually completed within two weeks 181. Therefore, the samples taken from the NK and NPK treatments represented different indigenous soil P supply with varying contributions of readily available and fixed P to total plant P uptake and total P uptake served as an estimate of potential P supply. Maros (Indonesia) was excluded from this analysis because of the unusually high extractable P content in all ferti- lizer treatments at this site (37-57 mg Olsen-P kg-‘).
Results and Discussion
Yield response to applied P
Grain yield of rice ranged from 3.3 to 7.9 t ha-’ in the NK and from 3.8 to 8.1 t ha-’ in the NPK treatments (Table 1). The average yield increase from P applica- tion in 1993 was 22% when N and K were also applied (Table 2). Agronomic P use efficiency ranged from 0 to 114 kg grain per kg fertilizer P applied. Unlike K, substantial P inputs from sources other than fertilizer, such as irrigation water and rainfall, are not likely to occur and the observed P response reflects the fertilizer effect and the effective P supply from indigenous soil resources. Dynamic changes in soil fertility as a result of intensive cropping tend to increase the magnitude of the yield response from applied P and K. At many sites (PhilRice, BRIARC, Lanrang, Jinxian, Pantnagar, and Coimbatore), the yield increase from P application was larger in 1993 than the average of the previous 10 years. At PhilRice, for example, application of P fer- tilizer at 25 kg ha-’ increased rice yield by 2.8 t ha-’ in 1993, whereas there was no initial P response in the first years of this experiment which began in 1968 [9].
There was no significant response to applied P at the Qingpu, Maros, IRRI and Shipai sites. At Maros and Qingpu, soil P status was still relatively high after lo-16 years of intensive rice cropping without P addi- tion (Table 2). The mean yield level at Shipai was low in all fertilizer treatments due low soil nutrient status, particularly for Mg contents (exchangeable + solution Mg 0.2-0.4 cmol kg-‘). At IRRI, a high yield of 7.4 t ha-’ was obtained in the NK treatment, despite low Olsen-P content (2.4 mg kg-‘). Response to P at this site has always been small or negligible [9]. Apparent- ly, more P was available to the plant than indicated by the Olsen P-extraction method.
Phosphorus uptake, internal P use efJiciency, and P uptake requirements of rice
Across all treatments and sites, total aboveground P accumulation ranged from 4 to 34 kg ha-’ with a mean of 12.6 kg ha-’ at an average yield level of 4.9 t ha-’ (Fig. 1). Phosphorus concentrations ranged from 0.09-0.40% in grain and from 0.02-0.21% in straw and were lowest in the N and NK treatments(Table 3). On average, 70% of the total P uptake in above-ground biomass was contained in the grain. The physiological efficiency (PE) or internal use efficiency of P (kg grain yield per kg P taken up with the above ground biomass) ranged from 206-1056 kg grain kg P-‘, resulting in a widely scattered relationship between grain yield and total P uptake (Fig. 1). For most samples, the slope of the relationship between grain yield and P uptake var- ied from 220-900 kg grain kg-’ P absorbed (Figure 1) compared with 410-625 kg grain kg P-’ in a previous review [32].
In irrigated rice, water does not limit growth and PE of P (as defined above) mainly depends on the avail- ability of other nutrients [ 171, the harvest index (i.e. the ratio of grain yield to total plant biomass), and climatic factors. Variation among varieties in internal efficien- cy mechanisms may also contribute to the observed differences in PE [ 14; 181. Acquired P was used most efficiently in treatments that received no fertilizer P, with mean PE values of 455-610 kg grain per kg P, compared to a mean PE of 351-359 kg grain per kg P in the P treatments (Fig. 2). The grain/straw dry weight ratio affected P partitioning, as shown by the signifi- cant correlation between the P harvest index and the dry matter harvest index (Figure 3).
In the minus P treatments at most sites, intensive rice cropping depleted the Olsen-P content to a rela- tively low level (Table 1). Thus, with a limited supply of soil P, the crop utilizes the acquired P more efficient- ly in the formation of grain yield [ 171. At Cuulong, for example, PE of P was high in all treatments (500-930 kg grain per kg P) because the P supply was low regard- less of treatment (Table 1 and Table 2). In contrast, if P is available at adequate levels, other nutrients (N, K) become the limiting factors for internal P utilization and PE tends to be lower. This effect was particular- ly clear at Maros where extractable Olsen-P was high (Table l), PE of P was lowest among all sites and did not vary much between the fertilizer treatments (Table 2).
Between 16 and 33 kg P uptake ha-’ were need- ed to produce 8 t grain ha-’ (Fig. 1). These results
114
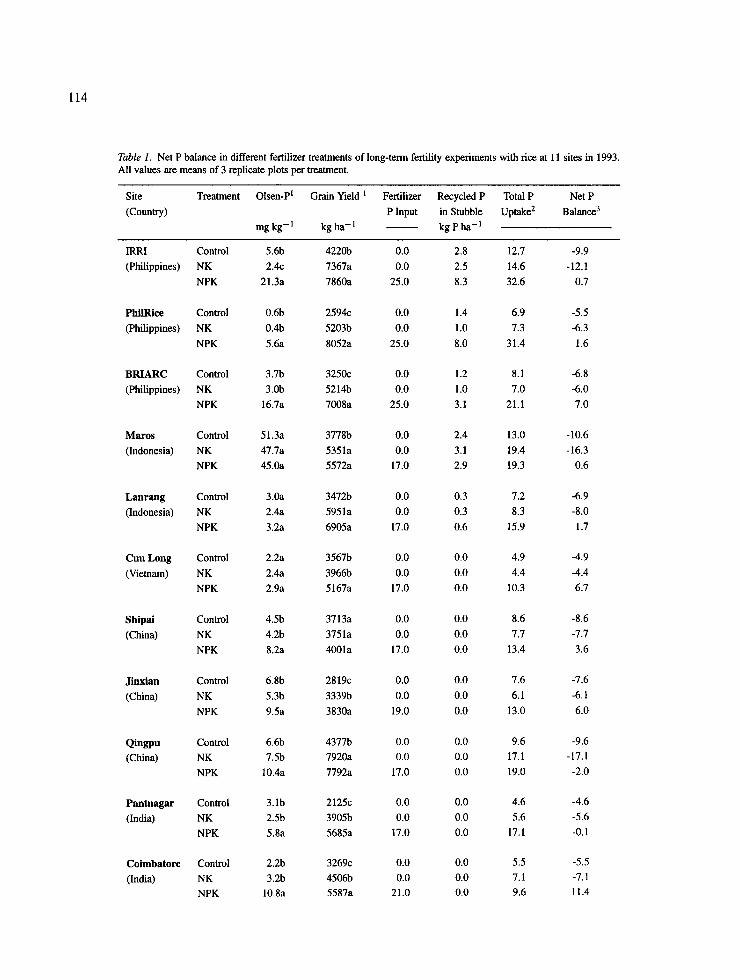
Table I. Net P balance in different fertilizer treatments of long-term fertility experiments with rice at 11 sites in 1993. All values are means of 3 replicate plots per treatment.
Site
(Country)
Treatment Olsen-P’ Grain Beld t Fertilizer Recycled P Total P Net P P Input in Stubble Uptake2 BalattCe3
mg kg- ’ kgha-’ - kgPha-t
IRRI (Philippines)
PhilRice (Philippines)
BRIARC (Philippines)
Mares (Indonesia)
Lanrang (Indonesia)
Cuu Long (Vietnam)
Shipai (China)
Jinxian (China)
Qingpu
(China)
Pantnagar (India)
Coimbatore (India)
Control 5.6b 4220b 0.0 2.8 12.7 -9.9 NK 2.4c 7367a 0.0 2.5 14.6 -12.1 NPK 21.3a 7860a 25.0 8.3 32.6 0.7
Control 0.6h 2594~ 0.0 1.4 6.9 -5.5 NK 0.4h 5203b 0.0 1.0 7.3 -6.3
NPK 5.6a 8052a 25.0 8.0 31.4 1.6
Control 3.lb 3250~ 0.0 1.2 8.1 -6.8 NK 3.Ob 52141, 0.0 1.0 7.0 -6.0
NPK 16.7a 7008a 25.0 3.1 21.1 7.0
Control NK
NPK
51.3a 47.7a 45.Oa
3778b
5351a 5572a
2.4 13.0 -10.6
3.1 19.4 -16.3 2.9 19.3 0.6
Control
NK NPK
3.Oa 2.4a
3.2a
34721,
5951a 6905a
0.3 7.2 -6.9
0.3 8.3 -8.0
0.6 15.9 1.7
Control
NK NPK
2.2a
2.4a 2.9a
3567b
3966b 5167a
4.9 -4.9
4.4 -4.4 10.3 6.7
Control NK
NPK
4.5b 4.2b 8.2a
3713a 3751a 4001a
8.6 -8.6 7.7 -7.7
13.4 3.6
Control NK
NPK
6.8b 5.3b
9.5a
2819~ 3339h
3830a
Control
NK NPK
6.6b 7.5b
10.4a
4377b
7920a 7792a
Control NK NPK
3.lb 2.5b 5.8a
2125~ 3905b 5685a
Control NK NPK
2.2b 3.2b
10.8a
3269~ 4506b 5587a
0.0 0.0
17.0
0.0 0.0
17.0
0.0
0.0 17.0
0.0 0.0
17.0
0.0 0.0
19.0
0.0 0.0
17.0
0.0 0.0
17.0
0.0 0.0
21.0
0.0
0.0 0.0
0.0 0.0 0.0
0.0 0.0
0.0
0.0 0.0
0.0
0.0 0.0 0.0
0.0 0.0 0.0
7.6 -7.6
6.1 -6.1 13.0 6.0
9.6 -9.6 17.1 -17.1 19.0 -2.0
4.6 -4.6
5.6 -5.6
17.1 -0.1
5.5 -5.5
7.1 -7.1 9.6 11.4

115
Table 1. (continued)
Site Treatment Olsen-P’ Grain Yteld ’ Fertilizer Recycled P Total P Net P (Country) P Input in Stubble Uptake* Balance3
mg kg-t kgha-’ - kgPha-’
All sites4
Control Mean 3.9 3341 0.0 0.6 7.6 -7.0 Stdev 2.0 685 0.9 2.4 1.8
N Mean 3.3 4654 0.0 0.6 8.5 -7.9 Stdev 2.4 1450 1.1 4.7 5.3
NP Mean 9.5 5530 20.0 2.1 17.2 4.9 Stdev 4.3 1532 3.1 3.6 8.0 5.8
NK Mean 3.3 5112 0.0 0.5 8.5 -8.0 Stdev 2.5 1535 0.8 4.3 5.3
NPK Mean 9.4 6189 20.0 2.0 18.3 3.7 Stdev 6.2 1445 3.1 3.5 8.3 4.3
‘Means with common letters are not significantly different within sites by LSD (5%). *Total P uptake = P grain + P straw. 3Partial net P balance = fertilizer P input - (P uptake-P recycled). 4Mean and standard deviation of 10 sites, excluding Maros because of its very high soil P status.
Table 2. Phosphorus response and P use efficiency in 11 long-term fertility experiments with irrigated rice in 1993
Site Variety Yield increase due to Pt Internal P use Agronomic P A Olsen-P4 NPK-NK efficiency* efficiency3 NPK-Control
kg ha- t % kg grain A kg grain kg P uptake kg P applied mg kg- 1
IRRI IR 72 458 6 339flO6 20 (ns) 15.6* PhilRice IR -I2 2849* 55 436f224 114 5.0* BRIARC IR 72 1795* 34 515f221 72 13.0* MZWIX IR 74 221 4 282f9 13 (ns) -6.3 Lama& IR 42 954* 16 470f 143 56 0.2 Cuu Long IR 64 1201* 30 724fl92 71 0.8 Shipai Guichaoxuan 250 7 399f98 15 (ns) 3.7* Jinxian ER 2106 491* 15 378fl24 26 2.7* Qingpu Hanfeng -128 0 426f29 0 (ns) 3.8* Pantnagar Pam Dhan-4 1780* 46 475fl74 105 2 6* CoimbatoIp CR 1009 1081* 24 593f59 52 8.6*
‘Grain yield (GY) in NPK treatment minus grain yield in NK treatment. *Internal P use efficiency = GY/total P uptake (all measured as kg ha-‘). Average f standard deviation of all treatments at each site. 3Agronomic P efficiency = (GYNpx-GY&/fettiliZer P applied (all measured as kg ha-‘). 401sen-P in NPK treatment minus Olsen-P in the Control, both measured in 1993 DS. *Significant difference by LSD (5%).
show that P uptake by the rice crop can vary greatly K. This wide range is defined by the envelope of max- in relation to yield and that it is heavily influenced by imum P accumulation and maximum P dilution in the the availability of other nutrients, particularly N and plant (Fig. 1). It emphasizes the need for approaches

116
8000
-p 6000
2 2 5000
9 .g 4000 c ‘S $ 3000
maximum accumulation y = 220 (x-0.1)
. IRRI 0 PhilRice n BRIARC •I Maros * Lanrang A Cuu Long v Shipai v Jinxian
+ Qingpu 0 Pantnagar l Coimbatore
15 20 25
Total P uptake (kg ha-‘)
Figure 1. Relationship between grain yield and total P uptake at maturity in long-term fertility experiments with rice at I1 sites. Values shown are replicates of six fertilizer treatments at each site sampled in the 1993 dry season. Hand-drawn dashed lines show the possible envelope of maximum accumulation and maximum dilution of P in the rice plant. The solid line is the average function fitted to the data. In this equation, the (x-0.1) is a fixed constant describing the minimum P uptake (0.1 kg ha-‘) required to produce any grain yield. All other model parameters were significant at P<O.OS. Because of rat damage, data of the NP treatment at Lanrang were excluded.
P use efficiency (kg gram kg P uptake“)
01 Control N NK NP PK NPK
Treatment
Figure 2. Internal P use efficiency in six fertilizer treatments of long- term fertility experiments at 1 I sites in 1993. Boxplots are based on three replicates of each treatment at all sites. The fences represent the 10th (lower) and 90th (upper) percentiles and the symbols (circles) the values outsides these limits.
that can predict P input requirements as a function of the supply of N and K [17]. No data points close to
the line of maximum dilution were available for yields greater than 6.5 t ha-‘. Achieving rice yields above this level may require increased tissue P content which would reduce maximum potential PE of P at these higher yield levels. An exponential equation was fitted to the data from all sites and all treatments (Fig. 1) to describe the average relationship between grain yield and P uptake under a wide range of nutrient supply environments. This equation (Fig. 1) indicates that PE decreases with increasing P uptake. In the yield range of 2-8 t ha-‘, the average total P uptake of rice across 11 sites varied from 1.8 to 4.2 kg P per ton of grain yield. Previously reported values ranged from 4 to 6 kgPtgrain-‘[37]and3tollkgPtgrain-’[16].
Using the assumptions described elsewhere [12] and a P content in rice grain between 0.15 and 0.25% (Table 3), current annual P removal with harvested grain from irrigated ricefields in Asia is as large as OS-O.9 x lo6 t P. By 2025, this may increase to 0.9- 1.5 x lo6 t. The total annual P accumulation by rice (grain + straw) in irrigated rice systems of Asia is in the range of 0.7-1.4 x lo6 t (assuming 24 kg P t-’ grain yield across the most common yield levels in farmers’

117
1.0
0.9
x f
0.8
.- % 0.7
ii
;= 0.6
0.5
0.4
v = -0.63 + 4.48 x - 3.37 x2
I 4 I
0 IRRI 0 PhilRice n BRIARC 0 Maros A Lanrang A Cuu Long v Shipai v Jinxian + Qingpu 0 Pantnagar 0 Coimbatore
0.4 0.5 Harvest index
0.6
Figure 3. Relationship between phosphorus harvest index (P uptake grain/Total P uptake with grain and straw) and harvest index (grain yield/grain + straw yield) in long-term fertility experiments with rice at 11 sites. Values shown am replicates of six fertilizer treatments at each site sampled in the 1993 dry season.
Table 3. Concentrations of P in grain and straw (% P) of rice at maturity in different fertilizer treatments of long-term fertility experiments. Values shown arc based on three replicates of each treatment at 11 sites. The summary statistics shown are based on three replicates of all six fertilizer treatments at eight sites and five fertilizer treatments at three sites without a PK treatment (N=189 samples).
Treatment Mean Minimum 25th 75th Maximum percentile percentile
Grain Control 0.20 0.10 0.17 0.23 0.27 N 0.16 0.09 0.12 0.18 0.26 NK 0.15 0.02 0.12 0.17 0.27 NP 0.24 0.12 0.20 0.27 0.31 NPK 0.23 0.12 0.19 0.26 0.30 PK 0.24 0.14 0.22 0.26 0.40 All 0.20 0.09 0.15 0.25 0.40
straw Control 0.06 0.02 0.04 0.07 0.12 N 0.05 0.02 0.03 0.06 0.14 NK 0.04 0.02 0.03 0.05 0.12 NP 0.10 0.02 0.06 0.12 0.21 NPK 0.09 0.03 0.07 0.11 0.15 PK 0.09 0.03 0.07 0.11 0.12 All 0.07 0.02 0.04 0.10 0.21

118
fields) and may have to increase to 1.2-2.4 x lo6 t by 2025.
Net P balance
Although P inputs from rainfall and irrigation or leach- ing losses were not measured at the experimental sites, we suspect that these factors had only negligible effects on the P balance. Phosphorus concentrations in rainwa- ter [l] and most surface and deepwell waters used for irrigation in tropical Asia are low [l; 191. Increased solution P concentration after flooding may increase the potential for P losses due to leaching compared to non-flooded soils [35]. Most rice soils, however, have heavy texture and, under field conditions, percolation rates are low due to soil puddling. Considering the soil characteristics, good control of water and little runoff at all sites, a fairly complete P balance was estimated as a function of plant P uptake and the P supply from fertilizer and recycled plant residues.
On average, P losses of 7.0 to 8.0 kg P ha-’ per crop were estimated for the -P treatments, whereas the +P treatments had an average net P gain of 3.7 to 4.9 kg P ha-’ crop-’ (Table 1). Phosphorus losses were largest in the NK treatments (4.4 to 17.1 kg P ha-’ season-‘). The P fertilizer rates of 17-25 kg P ha-’ used in the +P treatments were high enough to main- tain the P balance at most sites. At eight sites, Olsen-P in the NPK or NP treatments was significantly higher than in the unfertilized control plots (Tables 1 and 2). At four sites with yields of 5.6-7.9 t ha-’ in the NPK treatment (IRRI, Maros, Qingpu, and Pantnagar), the net P balance was only slightly positive or even nega- tive (Table 1). At the two sites with the highest yields (7.9-8.0 t ha-‘, IRRI and PhilRice), a slightly posi- tive P balance in the NPK treatment was only achieved because about 8 kg P ha-’ was recycled with incorpo- rated stubble (Table 1). Although the P concentration in rice straw was generally low (Table 3), straw man- agement can significantly affect the P balance and must be considered in long-term P management strategies.
Our analysis suggested that, in irrigated rice sys- tems with good water control, changes in extractable soil P levels can be predicted from knowledge of the P balance. To test this, we compared the differences in the long-term P balance between -P treatments (Con- trol, N, NK) and the NPK treatment with differences of the current Olsen-P content among the same treat- ments (Fig. 4). This approach was chosen because initial soil P contents and long-term records of straw yield and total P uptake were not available at most sites.
Figure 4. Relationship behueen treatment differences in the total long-term P balance and Olsen-P content (measured in 1993) in long-term fertility experiments with rice-rice cropping systems at six sites. The A values of the P balance and the current Olsen-P content were calculated as the difference between the NPK treatment and the Control, N, and NK treatments. Values shown are based on treatment means of IRRI (58 crops), PhilRice (51 crops), BRIARC (51 crops), Cuu Long (11 crops), Shipai (21 crops), and Jinxian (25 crops) sites. Because of missing grain yield data for several seasons, Lanrang and Maros sites were not included in this analysis.
At six sites with rice-rice cropping systems (IRRI, PhilRice, BRIARC, Cuu Long, Shipai, and Jinxian), estimates of the overall P balance in these four treat- ments were made using the long-term yield and fer- tilizer P input data (from the beginning of the experi- ments until 1993), and harvest index, P content in grain and straw, and the average percentage of straw recy- cled at each site (all measured in 1993). Differences between the total P balance between the NPK and vari- ous minus P treatments were positively correlated with the respective treatment differences in Olsen-P content in 1993 (Fig. 4). Although this analysis has limitations due to the lack of measured data and the somewhat clustered data points (Fig. 4), it indicates that routine soil analysis for estimating P fertilizer requirements can presumably be restricted to time intervals of sev- eral years, if rough estimates of the partial P balance per rice crop are available.
Assessment of soil P-supplying power based on static parameters
Olsen-P was a more versatile soil test for P than Bray 1-P. Significant positive correlations between Olsen-P in O-20 cm depth and total P uptake across 10 sites were found in most fertilizer treatments. Bray 1-P was not correlated to P uptake in any of the treatments (Table 4). Except for the calcareous soil at Pantnagar, within-

119
site correlations between Olsen-P and Bray 1-P were high, but the slope of this relationship differed between sites (Fig. 5). There was a distinction between acid to neutral soils (pH 5.6-6.8) and the three alkaline soils in our data set (Qingpu, Coimbatore, Pantnagar, pH 7.2- 8.5). Acid extractants such as Bray 1 dissolve Ca-P compounds that are the dominating inorganic P pool in alkaline soils. In contrast, Olsen-P measured on a dried soil sample, provides an index of the Fe(III)-P and Al- P soil P pool, and correlation studies have confirmed that these fractions contribute most to rice P nutrition [6;33].
Total P uptake ranged from 4.4 to 19.4 kg P ha-’ (CV-54%) in the NK plots or from 9.6 to 32.6 kg P ha-’ (CV-41%) in the NPK plots. Olsen-P ranged from 0.3 to 24.0 mg kg-’ in the NK and NPK treat- ments across 10 sites and the correlation explained 43% of the variation in P uptake (Fig. 6a, Table 5). How- ever, the relationship between Olsen-P and P uptake was scattered and, for example, a value of 2.5 mg P kg-’ was associated with uptake of 3 to 15 kg P ha-‘. Incorporating the fertilizer-N rate into the regression equation improved prediction of P uptake in the NK and NPK treatments significantly (Table 5), indicating that the N rates used at some sites [ 121 were not high enough to ensure that N was not limiting P uptake. Therefore, the regression equations shown in Table 5 are of limited use for estimating potential soil P supply as defined above.
Across all sites, other soil properties were not sig- nificantly correlated with P uptake (Fig. 6). Howev- er, some of the data clusters in Figure 6 demonstrate site specific factors affecting P availability. Due to increased P fixation [2], soils with a low CEC,,, and dominating 1: 1 layer clay minerals (Cuu Long, Shipai, Jinxian) also had low P uptake (Fig. 6~). In soils with free Ca- or Mg-carbonate, as indicated by base satura- tion greater than 100% (Qingpu, Pantnagar, Coimba- tore), P uptake was limited because most of the P was contained in more recalcitrant Ca-P fractions (Fig. 6d) that do not become plant available under reduced con- ditions in flooded soil. Equation [3] in Table 5 is one regression attempt to account for the positive effect of CE&, and the negative effect of high base saturation on P uptake under field conditions, and, together with Olsen-P and the fertilizer-N rate, 65% of the variation in P uptake were explained.
With a limited variation in soil and environmen- tal conditions use of Olsen-P on dried soil samples to predict P uptake seems to be satisfactory, if validat- ed site-specific calibration functions are established.
Major theoretical limitations of practically all rapid soil tests used for P in rice are that (1) kinetics of nutrient release are not measured and tests on air-dried soil may not reflect the P status after submergence, (2) unextracted P pools contribute to plant P uptake, (3) diffusion is a key process of P transport to the root surface [3 11, and (4) external mechanisms such as root- induced solubilization of P by acidification contribute significantly to uptake by rice roots [20]. The first two limitations can be solved with reasonable success by using more Fe-P specific extractants such as Olsen-P and by using other available information such as soil texture, pH or clay mineralogy [6; 131. However, none of the soil tests currently in use accounts for diffusion and rhizosphere effects.
Dynamic assessment of soil P-supplying capacity
The mean resin P adsorption kinetics for each fertilizer treatment reflected the expected changes of soil P status as a result of different P balances. At most sites, the fertilizer P rates used were high enough to maintain a positive P balance and soil P release was significantly larger in +P treatments than in -P treatments (Fig. 7). The greatest depletion of soil P reserves was measured in the N and NK treatments, which had an average negative P balance of -8 kg P ha-i per crop (Table 1). At most sites, P uptake in the NPK treatment was similar to the NP treatment and differences between the resin P adsorption curves of these two treatments were not significant (Fig. 7).
The ap value in Eq. [l] is equal to the cumula- tive P adsorption on the resin within one day and mainly represents solution phase P and easily solu- ble/exchangeable P which is in dynamic equilibrium with the soil solution. Stepwise regression resulted in a model describing ap as a function of organic C (g kg-‘), Olsen-P (mg kg-‘) and dithionate-citrate extractable Fe (%):
ap = 0.06 + 0.01 organic C + 0.003 Olsen - P +O.O9Fed
f = 0.36*'* (2)
However, the low coefficient of determination indi- cates that ap provides a measure of readily available P that is not or only partly obtained with conventional methods of soil analysis.
Flooding of a dry soil causes an initial increase in the P concentration in soil solution due reduction of Fe(III) compounds that liberate sorbed and co-

120
80
Table 4. Correlation between total P uptake by rice and static soil P tests in different fetiilizer treatments of LIFE in 1993. Correlation coefficients given were calculated based on data from three replicate plots per treatment at 10 sites, excluding Mares, Indonesia (N=30).
Soil test
Olsen-P Bray 1-P
Treatment
Control N NP NK PK NPK
0.58*** 0.49** 0.34 0.45* 0.73*** 0.48* -0.30 0.05 -0.24 0.06 -0.26 -0.15
*, W, W* Significant at the 0.05,O.Ol and 0.001 probability levels, respectively.
alkaline soils (pH,.,7.2 - 8.5) 1
acid - neutral soils (pH,,, 5.6 - 6.8) 1
y = 2.32 + 1.48 x ? = 0.96”’
IRRI (r=O.98”‘) PhilRice (r=O.99***) BRIARC (i=O 99”‘) Maros (1=0.78**) Lanrang (r=0.95”*) Cuu Long (i=O.91”*) Shipal (1=0 99”‘) Jinxian (t=O.98***) Qingpu (r=O.95***) Pantnagar (1=0.46 n s.) Coimbatore (r=O.79”)
All sites: r = 0.42***
0 10 20 30 40 50 60 70
Olsen-P (mg kg-‘)
Figure 5. Influence of soil pH on the relationship between Bray 1-P and Olsen-P in long-term fertility experiments with rice at 11 sites. Values shown are replicates of six fertilizer treatments at each site sampled in 1993. The r values given in parenthesis are the correlation coefficients within each site. The solid line shows the regression function for the sites with acid to neutral soils.
precipitated P, but the initial P flush is followed by a subsequent decrease due to re-sorption or precipi- tation of Fe(II)-P compounds [6; 341. Much of the re-immobilized P becomes acid-soluble and forms the major pool for P uptake by rice [20; 271. If applied to anaerobic soil, a resin capsule may induce P solu- bilization from this acid-soluble pool. Because the resin capsule adsorbs cations in exchange for H+ and where the net cation uptake is larger than anion uptake, acidification of the soil around a capsule similar to the rice rhizosphere occurs [3; 291. The data obtained in
this study provide indirect evidence that both Olsen-P and the resin method seem to measure a similar soil P pool which is soluble under alkaline, aerobic con- ditions (Olsen-P) but transformed into acid-soluble P forms (resin capsule P) as a result of submergence and reduction. For example, the correlation between Olsen-P (measured on dried soil) and resin-P (mea- sured in reduced soil) increased with the resin incuba- tion time from r=O.22 (n.s.) at Id to r=0.91 (P<O.OOl) at 14 d. Similarly, the correlation between resin-P and

121
Table 5. Regression equations describing the relationships between total P uptake in the NK and NPK treatments and soil properties. The equations shown for static soil tests are based on stepwise forward regression of three replicates at 10 sites sampled in 1993 using a tolerance value of T=O. 1. The equations containing kinetic constants of resin P adsorption are based on bulked samples for each treatment at 10 sites. Data from Maros (Indonesia) were excluded because of the very high soil P content in all treatments at this site.
Regression equations ’ N 3
Static soil tests
[ 11 P uptake = 7.4 + 0.95 Olsen-P 60 0.43***
[2] P uptake = -0.8 + 0.83 Olsen-P + 0.07 Fertilizer-N 60 0.57***
[3] P uptake = 1.6 + 0.88 Olsen-P + 0.13 CEC,t,,/V-value + 0.13 Fertilizer-N 60 0.65***
Ion-exchange resin capsule [4] P uptake = -2.6 + 41.1 ap + 38.1 bp 20 0.38*
[S] P uptake = -14.8 + 43.1 ap + 37.3 bp + 0.09 Fertilizer-N 20 0.64***
‘P uptake = total P uptake with grain and straw at harvest (kg ha-l); Olsen-P = extractable P (mg kg-‘); CEC,t,, = CEC of clay fraction (cmol kg-‘); V-value = base saturation of CEC (%); ap = initial resin P adsorption rate; bp = resin P adsorption rate coefficient.
40 , -1
y-- 30 2 WI
c 2 20 m
%i z 10
o/ I, I / 1 ( I, I ( 0 5 10 15 20 25
Olsen-P (mg kg-‘)
40 I I
1 (c) Y- 30 r = 0.34”
2
o+-, , , I , I , I , ! , I 0 10 20 30 40 50 60
CEC,,,, (cmol kg-‘)
40
8
20 - 08 l * n .
PBV 4b v*
10 - ~~Tgv AA**AA n \ 0 I c I r I ‘I’,‘,
0 5 10 15 20 25 30
Organic C (g kg-‘)
40
(4 30 - :% r=023
.
20 - 0 00 - ** l 0
10 -9 94,
- A
% e
‘* V
PA * oooo l l
0
0 I, 1 ,I ,I I- ,
0 50 100 150 200 250 300
Base saturation (%)
0 IRRI 0 PhilRIce n BRIARC 0 Lanrang A Cuu Long a Shipai v Jinxtan l Qingpu 0 Pantnagar 0 Cormbatore
Figure 6. Relationship between total P uptake by rice and different soil properties in NK and NPK treatments of long-term fertility experiments at 10 sites. Data from Maros (Indonesia) were excluded because of the very high extractable P content in all treatments at this site. Values shown are three replicates per treatment at each site.

122
0.5
Figure 7. Resin adsorption quantities (RAQ) in five different fertilizer treatments of long-term fertility experiments with rice. Curves kinetic parameters are means of each treatment for 11 sites sampled in 1993. All parameters were significant at P<O.OOl.
0.4
f $ 0.3 E 3
0.1
y=axb
i.144 0.203 b 0.98 i2 Control 0.139 0.265 0.96 N 0.162 0.398 0.99 NP 0.142 0.239 0.96 NK 0.164 0.372 0.98 NPK
4 I
6 8 10 12 14
Time (d)
‘NK
dithionate-citrate extractable Fe increased from 0.06 to 0.75 during 2-wk incubation.
The adsorption rate coefficient bp [Eq. l] describes the decrease of the resin P adsorption rate over time and was positively correlated with Olsen-P and dithionite- citrate extractable Fe:
bp = 0.004 + O.l%r(Olsen - P) + 0.10 Fed I2 = 0.75*** (3)
Thus, bp integrates the potential delivery rate from dif- ferent P pools (mostly alkali-soluble Fe-P if measured in dry soil or acid-soluble Fe-P if measured in reduced soil) and diffusive P transport. In terms of practical P management, a large bp may indicate significant amounts of residual fertilizer P (see NP and NPK in Fig. 7) and can be used to determine the need for replen- ishing this pool. A very small bp may mean both small amounts of solubilizable P or limited P diffusion due to other physico-chemical soil characteristics. Further studies are needed to verify these interpretations.
Soils varied much in their kinetic parameters of P release (Fig. 8) and the resin capsule was a sensi- tive assay to characterize the kinetics of P release in soils of very different origin [lo]. Cumulative resin P adsorption was lowest in two kaolinitic, highly weath- ered soils from China (Jinxian, Shipai). The Inceptisol
and
at Maros had an exceptionally high Olsen-P content (37-57 mg P kg-‘) and a high resin P release, both in terms of cumulative resin P adsorption (RAQtd) and bp (0.67). Lanrang and Cuu Long soils had strikingly flat resin P adsorption kinetics (bp-0.04-0.06) in all treat- ments, and most of the total P adsorption by the resin occurred within the tirst day of incubation. At Cuu Long, for example, b was very small for several ions (NHd-N, P, and K, data not shown). The exact reasons for this are not known, but there seems to be a general diffusion-limitation to nutrient supply at this site and none of the classical soil tests used could provide this additional information.
Across ten sites with very different characteristics, a regression model explained 38% of the variation in P uptake in the NK and NPK treatments as a function of ap and bp (Table 5). Taking into account the fertilizer N level, prediction accuracy of the resin soil P test was similar to a more complex model combining various static soil tests. (Eq. 3 and 5 in Table 5). However, the negative intercepts in the two regression models including the resin capsule parameters (Eq. 4 and 5 in Table 5) are difficult to explain. More data are required to establish representative regression models for pre- dicting potential soil P supply as a function of soil test parameters across a wide range of lowland rice soils.

123
IRRI
PhilRice
BRIARC
m RAQ at Id
0 RAQ Id to 14d
1 (0.67)
Jinxian -a (0.64)
Coimbatore -II (0.32)
0.0 0.2 0.4 0.6 0.8 1.0 1.2 Resin P adsorption (RAQ, pmol cm-‘)
I
1.4 1.6
Figure 8. Cumulative resin P adsorption in the NPK treatment at 11 sites. The value of the adsorption rate coefficient bp is given in parenthesis.
Conclusions
In contrast to N fertilizer management, maximizing the recovery efficiency of fertilizer P is less important than predicting the need for applied P and the amount to apply to achieve a targeted yield and to maintain soil P reserves. This is because P is less mobile in the soil, external P inputs other than fertilizer are small, and much of the residual fertilizer P sorbed in a flood- ed soil remains plant available in subsequent cropping cycles. Present recommendations for P fertilizer use of 20-25 kg P ha-t are adequate to maintain yields of 5-6 t ha-‘. Sustaining higher yields of 7-8 t ha-’ will require long-term strategies that maintain or build soil fertility at a level that ensures maximum efficiency from investment in nutrient inputs. Such an improved management strategy must be based on (1) knowledge of crop P demand depending on the supply of oth- er nutrients, (2) prediction of the effective P supply from indigenous soil resources, (3) knowledge of the P balance which considers P removal with harvest, P recycled in stubble, and fertilizer P inputs, and (4) knowledge of the processes that govern residual effects of fertilizer P to predict bioavailability of residual P to subsequent crops.
Soils at the 11 sites differed markedly in their P- supplying power. Both Olsen-P and the resin capsule were suitable predictors of P uptake in intensive, irri- gated rice systems of the tropics across a wide range of
soils. The resin capsule provides a more mechanistic soil testing approach, because it includes diffusion and acid-induced P solubilization as important processes governing P supply to the rice root, and because it pro- vides parameters that are needed to assess both short- and long-term P-supplying power. Kinetic measures of P release such as ap and bp may also be useful in studying the long-term fate of fertilizer P and its residual effects on available soil P The resin capsule method will have a major advantage over chemical extraction methods if it is applied as a multi-nutrient soil test directly in the field within the context of farm- or even field-specific integrated nutrient management. Presumably, routine soil analysis for estimating P fer- tilizer requirements can be restricted to time intervals of several years, if rough estimates of the P balance per rice crop are available.
Acknowledgements
We like to acknowledge the valuable contributions made by our collaborators, including Mr. Josue P. Descalsota (IRRI), Ms. Elisa M. Imperial (BRIARC), Mr. Wilfred0 B. Collado (PhilRice), Dr. S.P. Palaniap- pan (Coimbatore, TNAU), Dr. Pyare Lal (Pantnagar, G. B. Pant University), Dr. R. Djafar Baco, Ir. Reginald Le Cerff, and Ir. Rauf Mufran (Maros and Lanrang, MORIF), Dr. Pham Sy Tan (Cuu Long, CLRRI), Prof.

124
Li Jiakang (Jinxian, Qingpu, Shipai), Dr. Lai Qing- Wang (Jinxian, Red Soil Institute - Jiangxi), Mr. Wang Yinhu (Qingpu, Soil & Fertilizer Institute - SAAS), and Dr. Zhou Xiuchong (Soil & Fertilizer Institute - GAAS).
The Swiss Development Cooperation (SDC) and the Federal Ministry for Economic Cooperation (BMZ) provided funding for different parts of the research presented here.
References
1.
2.
3.
4.
5.
6.
7.
a.
9.
10.
11.
12.
13.
Abedin Mian MJ, Bhune HP, Bhuiya ZH and Eaqub M (1991) Water and nutrient dynamics of a paddy soil of Bangladesh. 2 Pfl -Em Bodenk 154: 93-99 Bajwa MI (1982) Phosphorus status of Philippine rice soils with different clay mineralogical characteristics. Fert Res 3: 435438 Begg CBM, Kirk GJD, Mackenzie AF and Neue HU (1994) Root-induced iron oxidation and pH changes in the rice rhizo- sphere. New Phytol 128: 469-t77 Bray RH and Kurtx LT (1945) Determination of total organic and available phosphorus in soils. Soil Sci 59: 39-45 Cassman KG and Pingali PL (1995) Intensification of irrigated rice systems: Learning from the past to meet future challenges. GeoJoumal35: 299-305 Chang SC (1976) Phosphorus in submerged soils and phosphc- rus nutrition and fertilization of rice. In: The fertility of paddy soils and fertilizer application for rice, pp 93-l 16. Taipei, Tai- wan: Food and Fertilizer Technology Center for the Asian and Pacific Region Cook PJ, Banerjee DM and Southgate PN (1990) The phos- phONS resources of Asia and Oceania. In: Phosphorus require.- ments for sustainable agriculture in Asia and Oceania, pp 97- 114. PO. Box 933, Manila, Philippines: International Rice Research Institute De Datta SK, Moomaw JC, Racho W and Simsiman GV (1966) Phosphorus supplying capacity of lowland rice soils. Soil Sci Sot Am Proc 30: 613-617 De Datta SK, Gomez KA and Descalsota JP (1988) Changes in yield response to major nutrients and in soil fertility under intensive rice cropping. Soil Sci 146: 350-358 Dobermann A, Langner H, Mutscher H, Skogley EO, Neue HU, Yang JE, Adviento MAA and Pampoliio MF (1994) Nutrient adsorption kinetics of ion exchange resin capsules: A study with soils of international origin. Commun Soil Sci Plant Anal 25: 1329-1353 Dobermann A, Cassman KG, Sta.Crux PC, Adviento MAA and Pampolino MF (1996a) Fertilizer inputs, nutrient balance, and soil nutrient-supplying power in intensive, irrigated rice systems. II. Effective soil K-supplying capacity. Nutrient Cycl Agroecosyst 46: 11-21 Dobermann A, StaCruz PC and Cassman KG (19%b) Fertil- izer inputs, nutrient balance, and soil nutrient-supplying power in intensive, irrigated rice systems. I. Potassium uptake and K balance. Nutrient Cycl Agroecosyst 46 l-10 Ekpete DM (1976) Evaluation of chemical methods for the determination of available phosphorus in waterlogged soils. Soil Sci 121: 217-221
14.
15.
16.
17.
18.
19.
20.
21.
22.
23.
24.
25.
26.
27.
28.
29.
30.
31.
32.
Fageria NK, Wright RJ and Baligar VC (1988) Rice cultivar evaluation for phosphorus use efficiency. Plant Soil 111: 105- 109 Goswami NN (1986) Soil tests as a guide to the fertiliser needs of irrigated rice. Fert News 31(6): 2633 Goswami NN and Banerjee NK (1978) Phosphorus, potassi- um and other macroelements. In: Soils and rice, pp 561-580. P.O. Box 933, 1099 Manila, Philippines: International Rice Research Institute Janssen BH, Guiking FCT, Van der Eijk D, Smaling EMA, Wolf J and Van Reuler H (1990) A system for Quantitative Evaluation of the Fertility of Tropical Soils (QUEFTS). Geo- derma 46: 299-318 Katyal JC, Seshu DV, Shastry SVS and Freeman WH (1975) Varietal tolerance to low phosphorus conditions. Current Sci 44: 23&24O Kawaguchi K and Kyurna K (1977) Paddy soils in tropical Asia. Their material natute and fertility, Honolulu: The Uni- versity Press of Hawaii Kirk GJD and Saleque MA (1995) Solubilixation of phosphate by rice plants growing in reduced soil: prediction of the amount soiubihzed and the resultant increase in uptake. Europ J Soil Sci 46: 247-255 Murphy J and Riley JP (1962) A modified single solution method for determination of phosphate in natural waters. Anal Chim Acta 27: 3 l-36 Nambiar EKS, Turner FT, Yogeswara Rao Y, Sastry WK and Bhalk&ar R (1973) Need for reevaluation of soil-testing methods and phosphorus requirement of rice soils in West Godavari district Indian J Agric Sci 43: 113-l 18 Oberthuer T, Dobermann A and Neue HU (1995) Spatial mod- eling of soil fertility - A case study in Nueva Ecija, Philippines. In: Fragile lives in fragile ecosystems. Proceedings of the Inter- national Rice Research Conference, 13-17 February, 1995, Los Banes. pp 689-705. P.O. Box 933, Manila, Philippines: International Rice Research Institute Oberthuer T, Dobermann A and Neue HU (1996) How good is a nxo~ais~an~e soil map for SgrOnOmiC purposes? sOi1 Use Manag 12: 33-43 Olsen SR, Cole CV, Watanabe FS and Dean LA (1954) Estima- tion of available phosphorus in soils by extraction with sodium bicarbonate. USDA Cii. 939, Washington, DC U.S. Gov. print office Panda M, Panda D and Jena B (198 1) Critical limits of available phosphorus for rice in some soils of Orissa. Oryxa 18: 101-104 Saleque MA and Kirk GJD (1995) Root-induced solubilixation of phosphate in the rhizosphere of lowland rice. New Phytol 129: 325-336 Shiga H (1982) Efficient level of phosphorus fertility in pad- dy soils. In: Proc. Int. Symp. on Distribution, Characteristics and Utilization of Problem Soils, 1981, pp 227-241. lbarakiz Tropical Agriculture Research Center Skogley EO and Dobermann A (1996) Synthetic ion-exchange resins: Soil and environmental studies. J Environ Qual 25: 13-24 Sri Adiningsih J, Santoso D and Sudjadi M (1991) The status of N, P, K and S of lowland rice soils in Java. In: Blair G (ed) Sulfur fertilizer policy for lowland and upland rice cropping systems in Indonesia, pp 6&76. Melbourne: ACIAR Turner ET and Gilliam JW (1976) Increased P diffusion as ao explanation of increased P availability in flooded rice soils. Plant Soil 45: 365-377 van Keulen H (1986) Crop yield and nutrient requirements. In: Van Keulen H and Wolf J (eds) Modehing of agricultural pro-

125
duction: weather, soils and crops, pp 155-181. Wageningen: Pudoc
33. Verma TS and Tripathi BR (1982) Evaluation of chemical methods for the determination of available phosphorus in waterlogged Alfisols. 2. Suitability of soil test methods in rela- tion to plant growth parameters. Soil Sci 134: 294-299
34. Willett IR (1986) Phosphorus dynamics in relation to redox processes in flooded soils. In: Trans. XIII. Congr. of the Int. Sot. of Soil Sci. pp 748-755. Hamburg: ISSS
35. Xiao YL (1988) Study on the forms and levels of phosphorus in gley paddy soils. Soils Turang 20: 62-69
36. Yoshida S, Fomo DA, Cock JH and Gomez KA (1976) Labora- tory manual for physiological studies of rice, 3rd edn, P.O. Box 933, Manila 1099, Philippines: International Rice Research Institute
37. Yoshida S (1981) Fundamentals of rice crop science, P.O. Box 933, 1099 Manila, Philippines: International Rice Research Institute