Nutrient diagnostics and fertilizer prescription in Citrus
124
-
Upload
khangminh22 -
Category
Documents
-
view
11 -
download
0
Transcript of Nutrient diagnostics and fertilizer prescription in Citrus


Journal of Eco-friendly Agriculture 13(2) 2018 1
A.K. Srivastava and P.S. ShirgureJournal of Eco-friendly Agriculture 13(2): 1-17. 2018
©2018
Nutrient diagnostics and fertilizer prescription in Citrus: Aperspective analysisA.K. Srivastava1 and P.S. Shirgure2
ICAR-Central Citrus Research Insti tute, Nagpur 440033, MaharashtraEmail : 1aksrivas2007@gmail .com, 2shirgure@gmail .com
Abstract
Productivity of a crop depends essentially on the two premier facts, nutrient balance and the biological activity.Thebiggest constraint in making soil analysis more purposeful i s the non-redressal of spatial variation in soi l fertil ity.Conjoint use of geoinformatics (Geographical Information System, Global Positioning System, Remote Sensing) andsite specific nutrient management strategy have offered an easier method of combating such pivotal factor drivinginto reduced fertil izer use efficiency. Sensor-based technology (called proximal sensing of nutrients on real time basis)has further added a new dimension i n prov iding the nutrient supply as per canopy si ze (Normali sed di fferencevegetation index) using programmable multi -channel fert igation. Rhizosphere properties vis-à-vis microbial andnutrient dynamics has dictated soil fertil ity management options in recent past, especially in many of the perennialfruit crops badly suffering through recurrent replant failures. Identification, isolation and characterization of rhizospherespeci fic microbes and later their up-scal ing in consortium mode has given some def ini te edge, especially, wi thmycor rhi za-based microbial consor tium, in overcoming the mul tiple soi l f ert il i ty constraint s on one hand andsuccessfully addressing the replant i ssues on the other hand. Dev elopment of microbial consor tium (m icrobialreactor) exploiting the native and natural microbial synergisms (with twin role as growth promoter and antagonisticto soil borne pathogens) is one of the popular methods of managing multiple soil fertil ity constraints occurring withinthe rhi zosphere. Such rhizosphere specifi c consor tia (oft en cal led as crop-microbiome) could fur ther engineerrhizosphere’s nutrient demand and supply through loading with organic manures in a much value added form usinga widely accepted concept like integrated nutrient management (INM).
Keywords: Frui ts; Microbial consort ium; I ntegrated nutri ent management ; Rhizosphere propert ies; f ert igation;Geographical information system.
Citrus is considered highly nutrient responsive crop(Fageria et al., 2008; Srivastava, 2009). Balanced fertilizationis considered one of the effective ways of not only cutting thecost of production, but doubling the farmers income as well(Srivastava 2010a; Srivastava and Malhotra 2014). In thisregard, 4R Nutrient steward concept is considered by for thebest strategy towards balanced fertilization (Srivastava andSingh, 2003b; 2005; Srivastava et al., 2010).
Considering 60 per cent of the world’s arable landshaving mineral deficiencies or elemental toxicity problems,citrus, by the virtue of its perenniality have emerged as world’sleading fruit crop (Malhotra and Srivastava, 2015). Nutrientmanagement-based production system of citrus like any otherfruit crop is inherently complex to understand due to largevariat ion in nut r ient-use-ef f iciency (Chanda, 2014;Bhatnagar et al., 2016). Citrus is considered evergreen innature, blessed w ith nutrient conservation mechanism, tofacilitate an increased carbon return per unit of investednu tr ient d ue t o compar at iv ely longer d urat ion ofphotosynthesis eventually leading to higher nutrient-use-efficiency (Bindi et al., 1997., Centritto et al., 1999 a; 1999 b;Scholberg and M organ, 2012). Perennial f ru i t t rees(Ehleringer and Cerling, 1995) play an important role in
carbon cycle of terrestrial ecosystems and sequester ingatmospheric CO2 (Carbon sequestration in biomass of citrustrees ranges from 23.9 tons CO2 ha-1 for young trees to 109tons CO2 ha-1 for mature trees) (Idso and Kimball, 2001;Conroy, 1992; Keutgen and Chen, 2001). 4R nutr ientmanagement concept, exploiting criteria of right choice offertilizers at right dose at right stage of right crop has beenthe most pivotal driving force towards improved nutrient-use-efficiency (Germana, 1994; Keditsu and Srivastava, 2014;Johns et al., 2009). However, citrus by the virtue of theirperennial nature of woody framework (Nutrients lockedtherein), extended physiological stages of growth, differentialroot distribution pattern (root volume distribution), grow thstages from the point of view of nutrient requirement andpreferential requirement of some nutrients by specific fruitcrop, collectively make them nutritionally more efficient thanthe annual crops (Fischer et al; 2012; Goh, 2004).
Diagnosis of nutrient constraintsThe gap in productivity level of Asia from research farm
to farmers field is the major cause of concern (Peng et al.,2000; Srivastava, 2010a; 2010b; 2011; 2013a; 2013b), and theabsence of adequate information on soil fertility and plantnutrition is frequently ascribed (Lareen et al; 2016). The
Review Article

2 Journal of Eco-friendly Agriculture 13(2) 2018
Nutrient diagnostics and fertil izer prescription in Citrus: A perspective analysis
subject is further complicated by merely any reference valuesavailable w ith regard to diagnosis of nutrient constraints ind if ferent commercial ci trus cul tivars. The diagnost icsavailable for other commercial cultivars have not providedthe desired results when evaluated under varied citrus agroclimates. Resultantly, the orchards continue to produce sub-optimally due to increasing gap between the amounts ofnutrients added to that of annual demand w ith orchard age.Such emerging scenario simply goes un-noticed to the citrusgrowers, which is more worrying (Srivastava, 2013c; 2013d).
Many attempts on similar lines were earlier made toidentify nutritional problems of citrus orchards in countrieslike China including other parts of India employing a varietyof diagnostic methods, amounting to many discrepancies inthe interpretation of results (Srivastava and Singh, 2001c;2002; 2003a; 2003b). The nutrient constraint d iagnosishence, seldom addresses the problems that originally existin field and, therefore, not sufficed to inflict the desiredresponse of fertilization (Srivastava and Singh 2004a, 2004b;2004c). Such differences in outcome of diagnosis can beovercome by developing a suitable nutrient diagnostics veryspecific to a cultivar, soil type, and climate (Srivastava andSingh, 2006; 2007). These studies have confirmed that largeamounts of fertilizers are not always essential for maximumyields (Srivastava and Ngullie, 2009). Many methods havebeen used to develop and diagnose nutritional problems,but none of them is considered serving the purpose in entirety.Once a suitable nutrient diagnostics are developed, theirapplication in mapping the distribution of different kinds ofnutr ient def iciencies becomes next important issue atindividual orchard level or at location level (Srivastava etal., 2007; 2015). Application of geospatial tools in precisionmapping of nutrient constraints is envisaged (Das et al., 2015Srivastava et al., 2014). Any attempt of this kind, promise toensure the sustainability in citrus production strongly levelof low orchard productivity. The poor response of fertilizationis largely attributed to non-redressal of nutritional problemsoriginally existing in field in the absence of cultivar specificnutrient diagnost ics (Srivastava and Singh, 2008a). Thepremier citrus cultivars of India, namely Nagpur mandarin(Citrus reticulata Blanco), ‘Mosambi’ sweet orange (Citrussinensis Osbeck), Mal ta sw eet orange (Citrus sinensisOsbeck), (Citrus sinensis Osbeck),Khasi mandarin (Citrusreticulata Blanco), Acid lime (Citrus aurantifolia Sw ingle),Kinnow mandarin (Citrus deliciosia Lour. x Citrus nobilisTanaka) were extensively surveyed. DRIS indices weredeveloped based on leaf analysis data in relation to fruityield and accordingly nutrient constraints were identified(Srivastava and Singh, 2001a; 2001b; 2005; 2007; 2008b;2009b; Srivastava et al., 2007).
Leaf Analysis- Based diagnostics: The leaf nutrients normswere developed employing two diverse diagnostic methods(Field Response Studies and Survey/ M odel l ing andDiagnosis) using different citrus cultivars (Table 1). Thedifference in diagnostic methods apart from the agroclimateand nutr ient uptake behavior of cul tivar are the majorcontributory factors towards variation in reference valuesbeing recommended in relation to yield (Srivastava andSingh, 2003b; 2005; 2007; 2008b).
Nagpur mandarin (Citrus reticulata Blanco): Optimum leafnutrient standards for ‘Nagpur ’ mandarin: 2.24-2.40% N,0.07-0.110% P, 1.18-1.56% K, 1.32-1.55% Ca, 0.48-0.67% Mg,110-132 ppm Fe, 29-43 ppm Mn, 8-14 ppm Cu and 19-30ppm Zn.
Khasi mandarin (Citrus ret iculata Blanco) : Optimum leafnutrient standards for ‘Khasi’ mandarin: 2.23-2.49% N, 0.10-0.11% P, 1.86-2.12% K, 2.12-2.32% Ca, 0.28-0.38% Mg, and148-180 ppm Fe, 72-85 ppm Mn, 10-19 ppm Cu and 24-39ppm Zn.
Kinnow mandarin (Citrus reticulata Blanco) : Optimum leafnutrient standards for ‘Kinnow’ mandarin: 2.28-2.53 % N,0.10-0.13% P, 1.28-1.63% K, 2.12-3.12% Ca, 0.32-0.53% Mg,ppm Fe, 41.7-76.3 ppm Mn, 6.1-10.3 ppm Cu, 21.3-28.5 Zn.
Mosambi sweet orange (Citrus sinensis Osbeck): Optimumleaf nutrient standards for ‘Mosambi’ sweet orange: 1.98-2.57% N, 0.091-0.17% P, 1.33-1.72% K, 1.73-2.98% Ca, 0.32-0.69% Mg, 69.5-137.1 132 ppm Fe, 42.2-87.0 ppm Mn, 6.6-15.8 ppm Cu, 11.6-28.7 ppm Zn, 12.8-23.1ppm B, and 0.39-1.1 ppm Mo.
Sathgudi sweet orange (Citrus sinensis Osbeck): Optimumleaf nutrient standards for ‘Sathgudi’ sweet orange : 2.01-2.42 % N, 0.09-0.12 % P, 1.12-1.82 %K, 1.93-2.73 % Ca, 0.36-0.53 % Mg, 53.5-82.1 ppm Fe, 48.7-79.3 ppm Mn, 3.7-8.9ppm Cu, 16.5-23.2 ppm Zn, 12.8-23.1ppm B, and 0.39-1.1ppm Mo.
M al ta sweet orange (Citrus sinensis Osbeck) : Optimumleaf nutrient standards for ‘Malta’ sweet orange: 2.14-2.31% N, 0.10-0.14 % P, 1.10-1.56 % K, 2.89-3.41 % Ca, 0.39-0.52% Mg, 42.6 – 81.4 ppm Fe, 28.1 – 54.3 ppm Mn, 4.2-8.9 ppmCu, 28.1-54.3 ppm Zn.
Acid l ime (Citrus aurant i fol ia Swingle) : Optimum leafnutrient standards for Acid lime: 1.80-2.12% N, 0.09-0.13%P, 0.79-1.43%K, 2.04-3.12% Ca, 0.28-0.46 % Mg, 38.4-98.3ppm Fe, 28.1-58.4 ppm Mn, 6.1-9.9 ppm Cu, 16.9-21.4 ppmZn.
Soi l Ferti l i ty Norms: The soil test method rests on theassumptions that roots would extract nutrients from the soil

Journal of Eco-friendly Agriculture 13(2) 2018 3
A.K. Srivastava and P.S. Shirgure
in a manner comparable to chemical soil extractants, andthat there is a simple direct relation between the extractableconcentration of nutrients in the soil and uptake by plants(Srivastava et al., 2009). This is based on the concept that anideal soi l is one w here the cations are present in idealproportions (Srivastava and Singh, 2009a). One seriousdefect of this approach, is that it has to be significantlymodified in relation to soil type, in particular as betweencalcareous and non-calcareous soils (Srivastava et al., 2008).Besides adjust ing the recommendations in relat ion totargetted yield. Otherw ise, soil nutrient depletion has graveimplications in terms of : i. more acute nutrient deficiencies,ii. two wide spread nutrient deficiencies, iii. fall in fertilizeruse ef f iciencies and in returns from fert i l i zat ion, iv.weakening the foundation of sustainable high yield and v.very high remedial cost involved in building up the depletedsoils (Srivastava and Kholi, 1997). Differential soil fertilitynorms (Sivastava and Singh, 2001a; 2001b; 2001c; 2002) wereobtained in relation to commercial citrus cultivars are brieflysummarised below (Table 1).
Nagpur mandarin (Citrus ret iculata Blanco) : Optimum soilfertility limit was observed as : Alkaline KMNO4- N 118.4-1321.2 mgkg-1, Olsen-P 9.2-10.3 mg kg-1, NH4OAc-K 178.4-232.5 mg kg-1, DTPA-Fe 12.4-16.2 mg kg-1, DTPA-Mn 8.6-12.2mg kg-1, DTPA-Cu 2.1-2.3 mg kg-1 and DTPA-Zn 0.98-1.1 mgkg-1 in relation to fruit yield of 39.7-54.1 kg tree-1.
Khasi mandarin (Citrus ret iculata Blanco) : Optimum soilfertility limit was observed as : Alkaline KMnO4-N 220.8-240.6 mg kg-1, Bray-P 6.2-7.8 mg kg-1, NH4OAc-K 252.2-300.8mg kg-1,DTPA-Fe 82.2-114.6 mg kg-1, DTPA-Mn 21.4-32.8 mgkg-1, DTPA-Cu 0.82-1.62 mg kg-1, and DTPA-Zn 2.18-4.22 mgkg-1 for an optimum fruit yield of 25.0-32.0 kg tree-1.
Kinnow mandarin (Citrus reticulata Blanco) : Optimum soilfertility limit was observed as : Alkaline KMnO4 -N 118.2-128.4 mg kg-1, Olsen-P 9.4-16.3 kg-1, NH4OAc- K 158.3-208.2mg kg-1, DTPA-Fe 3.1-9.3 mg kg-1, DTPA-Mn 4.8-7.3 mg kg-1,DTPA-Cu 0.58-1.25 mg kg-1, DTPA-Zn 0.64- 0.98 mg kg-1 forthe fruit yield of 61.8-140.3 kg tree-1.
Mosambi sweet orange (Citrus sinensis Osbeck) : Optimumsoil fertility limit was observed as : Alkaline KMnO4 -N 130.1-142.2 mg kg-1, Olsen-P 9.8-11.4 kg-1, NH4OAc- K 182.4-210.3mg kg-1, DTPA-Fe 13.2-18.6 mg kg-1, DTPA-Mn 14.6-22.6 mgkg-1, DTPA-Cu 2.16-2.42 mg kg-1, DTPA-Zn 0.98-1.21 mg kg-
1, hot water soluble-B 0.28-0.48 mg kg-1, and (NH4)2 C2O4-Mo0.08-0.10 mg kg-1 for the fruit yield of 79.4-93.9 kg tree-1.
Sathgudi sweet orange (Citrus sinensis Osbeck): Optimumsoil fertility limit was observed as : Alkaline KMnO4 -N 120.1-152.2 mg kg-1, Olsen-P 10.1-12.3 mgkg-1, NH4OAc- K 162.3-
206.4, DTPA-Fe 11.2-16.4 mg kg-1, DTPA-Mn 10.1-18.3 mgkg-1, DTPA-Cu 2.2-3.6 mg kg-1, DTPA-Zn 0.54-1.10 mg kg-1.
M al ta sweet orange (Citrus sinensis Osbeck): Optimum soilfertility limit was observed as : Alkaline KMnO4 -N 110.5-124.6 mg kg-1, Olsen-P 9.2-14.6 mgkg-1, NH4OAc- K 131.6-181.2, DTPA-Fe 9.8-14.2 mg kg-1, DTPA-Mn 6.9-9.2 mg kg-1,DTPA-Cu 0.82-1.10 mg kg-1, DTPA-Zn 0.81-0.96 mg kg-1 forfruit yield of 23.1-38.9 kg tree-1.
Acid l ime (Citrus aurant i fol ia Swingle) : Optimum soilfertility limit was observed as : Alkaline KMnO4 -N 106.3-118.2 mg kg-1, Olsen-P 9.2-14.6 mgkg-1, NH4OAc- K 102.4-146.6, DTPA-Fe 4.6-12.3 mg kg-1, DTPA-Mn 3.2-10.1 mg kg-1,DTPA-Cu 0.80-1.40 mg kg-1, DTPA-Zn 0.78-0.89 mg kg-1 forfruit yield of 22.0-41.2 kg tree-1.
Di ci si on support f or soi l test -based f ert i l i zersrecommendations: Any attempt to rationalise the fertilizeruse and improve fertilizer efficacy in citrus orchard w illsurely be associated w ith consequent enhancement inproduction provided all other factors are optimum (Zamanand Schmann, 2006; Srivastava, 2013b). Limited attempts inthe past have been made in perennial crop like citrus, whichneeds to be managed through precision based technologies(Srivastava et al., 2014). The development of decision support
Developing soil ferti l ity-based DSS for fertil i zerrecommendations
Identifying target orchards
Geo-coded grid-based sampling
Identifying suitable grid size
Developing nutrient-based spatial variogram
Identifying fruit yield variogram for production zones
Application of fertilizer at variable rate as per spatial
Developing nutrient-based spatial variogram
Superimposing all nutrient based variograms w ithproduction zones
Creating soil fertility analogous vis-a-vis
Developing variograms of fertility analogues vs
fertilization
Field val idation

4 Journal of Eco-friendly Agriculture 13(2) 2018
Nutrient diagnostics and fertil izer prescription in Citrus: A perspective analysis
tool based on soil fertility variation is one such viable optionto address the nutrient mining and fluctuating yield levels.The utility of precision tool like GIS technology in mappingthe fertility status of soil has undoubtedly provided thedesi red he accu racy and ef fect iv eness in fer t i l i zerrecommendations. The rhizosphere (0-20 cm) oriented soilsamples through four grid sizes (10 x 10 m, 20 x 20 m, 40 x40 m and 60 x 60 m) were collected using GPS-based trackingsystem at orchard finally earmarked at Umsaitining Ribhoidistrict of Meghalaya and Ladgaon (Katol), Nagpur districtof Maharashtra. The spatial variograms of these parameterswere developed based on data generated through soil testsunder different grid sizes were developed using geographicalinformation system (GIS) and interpreted for working outthe optimum grid size for soil fertility evaluation in Khasimandarin (Srivastava and Singh , 2006; 2015). The spatialvariogram suggested the optimum grid size for precise soiltesting is 40 m x 40 m under hilly terrain of northeast Indiaand Central India of Maharashtra, cu l t ivating Khasimandarin and Nagpur mandarin, respectively. Based on soiltest values for different nutrients, doses of fertilizers andtargeted fruit yield, a tripartite prediction models weredeveloped viz., Fertilizer Nitrogen = 13.09 (Targeted FruitYield) – 2.37 (Soi l test value for N it rogen); Fert il i zerPhosphorous = 4.08 (Targeted Fruit Yield) – 26.83 (Soil testvalue for Phosphorous); Fertilizer Potassium = 1.69 (TargetedFruit Yield) – 0.39 (Soil test value for Potassium) for Nagpurmandarin. Simi lar ly, predict ion equat ions for Khasimandarin were developed as decision support viz., FertilizerNitrogen = 13.09 (Targeted Fruit Yield) – 2.37 (Soil test valuefor Nitrogen); Fertilizer Phosphorous = 4.08 (Targeted FruitYield) – 26.83 (Soil test value for Phosphorous); FertilizerPotassium = 1.69 (Targeted Fruit Yield) – 0.39 (Soil test valuefor Potassium). These decision supports were duly validatedin field and now in process of facilitating advisory serviceusing 4R guidelines in citrus.
We are currently working in the process of developing4R-Nutr ient Expert for Cit rus w ith the use of aboveinformation. Developing a nutrient diagnostic tool havingcapacity to diagnose a nutrient constraint as it occurs infield, has always been a challenge. in this regard, we havedeveloped a Ready Reckoner for soil test- based fertilizerrecommendation in citrus, the first ever solitary attempt madeso for in India (Table 2)
1.1.4 Soi l sui tabi l i ty cri teria: Ideally, there are three basicrequirements for successful cultivation of any horticulturalcrop, namely, climate relatively free from frost, good qualityof irrigation water and a reasonably deep uniform fertile soilw ith good internal drainage (Srivastava and Kholi 1997;Srivastava and Singh, 2008a). Consequences of poor soil type
can often be tailored through efficient use of irrigation,drainage and soil amendments. More often than not, suchmodifications of the soil (Fig. 1) and its environment are madeto assist crop grow th and survival in addition to increasednutrient uptake eff iciency, a secondary considerat ion(Srivastava et al., 2007). Different citrus cultivers over theyears, have displayed some extraordinary success on greatvariety of soils. And resultantly, development of distinctcommercial belts (Production epicenters) of mango, grapes,citrus, pomegranate, banana, litchi, apple, seed spices/spices, coconut, tea/ coffee, pineapple, potato, onion haveemerged as major success stories of Indian Horticulture. Theirhuge success along these commercial belts needs to beanalysed from the perceptive of role of nature and propertiesof d i f ferent soi ls in order to ensure thei r cont inuedsustenance. Soil suitability criteria developed for Nagpurmandarin and sweet orange (Table 3) would go a long wayin establishing the future citrus industry free of soil relatedconstrains.
Def iciency symptomsLike any other perennial fruit crop, citrus is a heavy
forager of nutr ients and, therefore, highly responsive toapplied ferti l izers. Nutrient mining emerging due tow idening gap between the amounts of nutrients applied andto those removed, amount to occurrence of large scale nutrientdef iciencies (Srivastava 2013d). A variety of nutrientconstraints diagnostic methods are used in citrus orchards.Those comprise of leaf analysis, soil analysis, juice analysis,sap analysis, biochemical analysis, and morphologicalsymptoms-linked deficiency symptoms (Srivastava andMalhotra, 2014). Of them, use of morphological symptomsacts as a field manual for citrus growers who can easilyidentify the nutritional problems in their orchards and adaptthe corrective measures accordingly. The nutrient deficiencysymptoms appear on different plant parts, most frequentlyon leaves, fruits and roots, in addition to types of leaves
Fig 1. Different forms of soi l physical constraints identi fied incitrus

Journal of Eco-friendly Agriculture 13(2) 2018 5
A.K. Srivastava and P.S. Shirgure
depending upon nature and properties of different nutrientelements (Srivastava et al., 2008). The symptoms on fruitsare noticed for very immobi le nutrients l ike B and Ca.Development of visible symptoms is accountable to metabolicdisorders which cause changes in micro-morphology ofplants before these symptoms are identifiable. The way inwhich the symptoms develop and manifest on younger orolder leaves or the fruits, gives a reliable indication aboutthe cause of nutritional disorders (Srivastava et al., 2007).Both deficiency and excess of nutrients can lead to reductionin crop yield coupled with inferior fruit quality (Srivastavaand Singh, 2008a). Mild visible leaf symptoms of some of theessential element deficiencies (Fig. 2) can be tolerated withouta reduction in yield in some citrus varieties, but not in others.For example, sweet orange trees can w ithstand the mildfoliage symptoms of Zn-deficiency w ithout a loss in yield,while the lemon trees suffer the heavy yield loss (Srivastava
and Singh, 2009a).
M an agem ent of n utr i entconstraints: Our initial efforts wereto : standardise optimum fertilizerrequirement as recommended dosesof fertilizers (RDF) through multi-location experiments, schedulingnutr ient appl icat ion across cropphenophases, scheduling fertigationby partitioning both nutrient andwater requi rement across cri ticalgr ow th stages, backed up bydevelopment of cul tivar speci ficnutr ient d iagnost ics, to be in aposi t ion to pract ice ad vancedmethods of nutrient management(Srivastava, 2013b). Attempts werelater made to address these issuesw ith combined use of concepts likeSite Specific Nutrient Management(SSNM ) and soil fert il i ty spat ialvar iogr am-based fer t i l i zerrecomm endat ions as decisi onsupport tool . Success of SSNMdep ends on corr ectness ofmeasurement and understanding onvariabi lity in avai lable supply ofnutrients, which can be summarizedin three steps v iz., i . assessingvariation ii. managing variation, andiii. evaluation but there is hardly anycomprehensive coverage addressingthe perennial crops. Spatial maps arefundamental to SSNM addressing
variation either soil fertility or leaf nutrient compositionbecause they represent either the spatial state of a grow ingcondition. With new advances in technology, grid samplingfor developing precision variogram is increasing.
The first step in the process is to divide large fields intosmall zones using a grid. Next, a representative locationw ithin the gr id is identified for precision soil sampling(Srivastava and Singh, 2015). Grid sampling is integratedinto global positioning system (GPS) based soil samplingand nutr ient-mapping that in turn uses a geographicinformation systems (GIS) to employ variable rate technology(VRT) for fertilizer applications. Optimum grid size soilmapping using specific nutrient-based spatial variogramsas a interpretation tool popularly known as DRIS developedfor Khasi mandarin of northeast India and Nagpur mandarinof central India aided in measuring the magnitude of changes
Fig 2. Morphological expression of nutr ient deficiencies in ci trus: Is i t post mortem diagnosis...?
6 Journal of Eco-friendly Agriculture 13(2) 2018
Nutrient diagnostics and fertil izer prescription in Citrus: A perspective analysis
in pool of soil available nutrients before and after fertilization(Srivastava et al., 2010).
Nutrient management-based production system ofcitrus like any other fruit crop is inherently complex tounderstand due to large variation in nutrient-use-efficiency(Scholberg and Morgan, 2012). Citrus is considered evergreenin nature, blessed w ith nutrient conservation mechanism, tofacilitate an increased carbon return per unit of investednu tr ient d ue t o compar at iv ely longer d urat ion ofphotosynthesis eventually leading to higher nutrient-use-eff iciency. 4R-nutr ient management concept, exploit ingcriteria of right choice of fertilizers at right dose at right stageof right crop has been the most pivotal driving force towardsimproved nutrient-use-efficiency. However, citrus by thevi rtue of thei r perennial nature of woody framew ork(Nutrients locked therein), extended physiological stages ofgrow th, differential root distribution pattern (root volumedistribution), growth stages from the point of view of nutrientrequirement and preferential requirement of some nutrientsby specific fruit crop, collectively make them nutritionally
more efficient than the annual crops. This is the reason, it isconsidered as such a wholesome concept (Srivastava andMalhotra, 2017).
Any attempt to rationalise the fertilizer use and improvefertilizer efficacy using such Nutrient Stewardship Conceptin citrus orchard w ill surely be associated w ith consequentenhancement in quali ty production, provided al l otherfactors are optimum (Tiwari, 2002). Limited attempts in thepast have been made in perennial crop like citrus, whichneeds to be managed through precision-based technologies.Such an attempt exploiting the basic principles of 4R-NutrientStewardship will ensure the sustainability in production byraising productivity per unit of nutrient, but long term soilhealth will be the core agena of such programme (Srivastavaand Singh, 2008).
Inorganic ferti l i zer schedul ing: Soil provides nearly all thenutr ients essent ial to complete the life cycle of a plant.Different soil properties primarily determine the extent of afertilizer response and the crop rotation on some recently
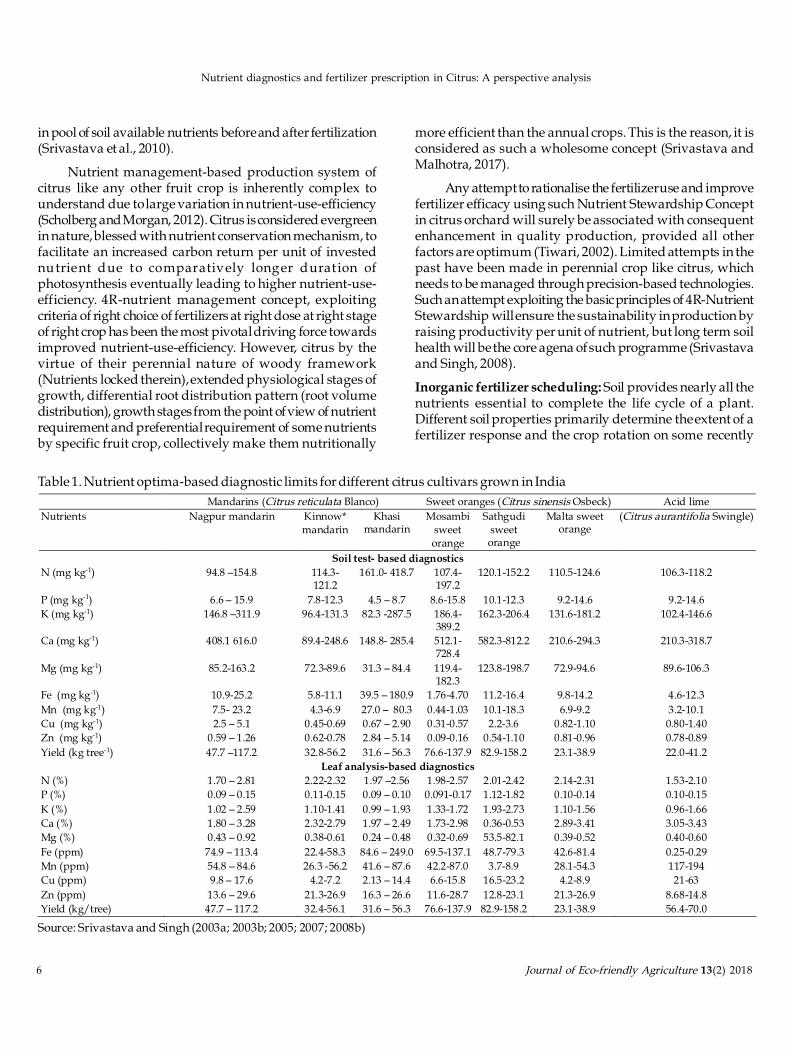
Table 1. Nutrient optima-based diagnostic limits for different citrus cultivars grown in India
Source: Srivastava and Singh (2003a; 2003b; 2005; 2007; 2008b)
Mandarins (Citrus reticulata Blanco) Sweet oranges (Citrus sinensis Osbeck) Acid lime Nutrients Nagpur mandarin Kinnow*
mandarin Khasi
mandarin Mosambi
sweet orange
Sathgudi sweet orange
Malta sweet orange
(Citrus aurantifolia Swingle)
Soi l test- based diagnostics N (mg kg-1) 94.8 –154.8 114.3-
121.2 161.0- 418.7 107.4-
197.2 120.1-152.2 110.5-124.6 106.3-118.2
P (mg kg-1) 6.6 – 15.9 7.8-12.3 4.5 – 8.7 8.6-15.8 10.1-12.3 9.2-14.6 9.2-14.6 K (mg kg-1) 146.8 –311.9 96.4-131.3 82.3 -287.5 186.4-
389.2 162.3-206.4 131.6-181.2 102.4-146.6
Ca (mg kg-1) 408.1 616.0 89.4-248.6 148.8- 285.4 512.1-728.4
582.3-812.2 210.6-294.3 210.3-318.7
Mg (mg kg-1) 85.2-163.2 72.3-89.6 31.3 – 84.4 119.4-182.3
123.8-198.7 72.9-94.6 89.6-106.3
Fe (mg kg-1) 10.9-25.2 5.8-11.1 39.5 – 180.9 1.76-4.70 11.2-16.4 9.8-14.2 4.6-12.3 Mn (mg kg-1) 7.5- 23.2 4.3-6.9 27.0 – 80.3 0.44-1.03 10.1-18.3 6.9-9.2 3.2-10.1 Cu (mg kg-1) 2.5 – 5.1 0.45-0.69 0.67 – 2.90 0.31-0.57 2.2-3.6 0.82-1.10 0.80-1.40 Zn (mg kg-1) 0.59 – 1.26 0.62-0.78 2.84 – 5.14 0.09-0.16 0.54-1.10 0.81-0.96 0.78-0.89 Yield (kg tree-1) 47.7 –117.2 32.8-56.2 31.6 – 56.3 76.6-137.9 82.9-158.2 23.1-38.9 22.0-41.2
Leaf anal ysi s-based diagnosti cs N (%) 1.70 – 2.81 2.22-2.32 1.97 –2.56 1.98-2.57 2.01-2.42 2.14-2.31 1.53-2.10 P (%) 0.09 – 0.15 0.11-0.15 0.09 – 0.10 0.091-0.17 1.12-1.82 0.10-0.14 0.10-0.15 K (%) 1.02 – 2.59 1.10-1.41 0.99 – 1.93 1.33-1.72 1.93-2.73 1.10-1.56 0.96-1.66 Ca (%) 1.80 – 3.28 2.32-2.79 1.97 – 2.49 1.73-2.98 0.36-0.53 2.89-3.41 3.05-3.43 Mg (%) 0.43 – 0.92 0.38-0.61 0.24 – 0.48 0.32-0.69 53.5-82.1 0.39-0.52 0.40-0.60 Fe (ppm) 74.9 – 113.4 22.4-58.3 84.6 – 249.0 69.5-137.1 48.7-79.3 42.6-81.4 0.25-0.29 Mn (ppm) 54.8 – 84.6 26.3 -56.2 41.6 – 87.6 42.2-87.0 3.7-8.9 28.1-54.3 117-194 Cu (ppm) 9.8 – 17.6 4.2-7.2 2.13 – 14.4 6.6-15.8 16.5-23.2 4.2-8.9 21-63 Zn (ppm) 13.6 – 29.6 21.3-26.9 16.3 – 26.6 11.6-28.7 12.8-23.1 21.3-26.9 8.68-14.8 Yield (kg/ tree) 47.7 – 117.2 32.4-56.1 31.6 – 56.3 76.6-137.9 82.9-158.2 23.1-38.9 56.4-70.0

Journal of Eco-friendly Agriculture 13(2) 2018 7
A.K. Srivastava and P.S. Shirgure
published review articles changes in physico-chemical andbiological properties of soil (Srivastava and Ngullie, 2009).One of the major obstacles of conventional practices ofaddressing nutritional requirements of citrus either throughsoil fertilization or through foliar feeding, is the precisediagnosis if the nutrient constraint type, their doses as percrop age and soil type, w ith the result more often suchpractices have not been able to facilitate the realisation ofpotential productivity of citrus (Srivastava et al., 2008).Neither any due consideration is given to exploit the nutrientreserve of the plant’s rhizosphere (native nutrient supplyingcapacity of soil) while formulating the fertilizer doses. Andmost importantly in perennial fruit crops, nutrient doses needto be recommended in tandem with level of fruit yield targeted,a nutrient dose optimum for one fruit yield target w ill becomesuboptimum for higher targeted fruit yield level in couple insubsequent years. Where is such nutrient monitoring tool to
keep vigil on nutrient input and output relationship, a kindof nutrient budgeting.Treatment involving foliar spray of0.50% FeSO4 + 0.50% MnSO4 + 0.50% ZnSO4+0.25% borax +ammonium molybdate + 10ppm 2, 4-D + 1% urea at anthesis,pea size, marble size and initiation of fruit enlargement,produced much superior response on d ifferent grow thparameters, fruit yield, f ruit quality parameters, plantassimilable nutrients in soil, leaf nutrient composition, inaddition to rhizosphere microbial diversity (Srivastava andSingh 2009a). The complete scheduling of micronutrientsthrough soil application and foliar application has beenfurther summarized. (Table 4).
Citrus-based microbial consortium for better nutrient-use-ef f i ci ency v is-a-v is carbon sequestrati on: Exploit ingmicrobial synergisms is one of the popular methods ofsubstrate dynamics and associated changes in nutrientenv i ronment of rhizosphere as a part of rhizosphere
Table 2. Ready reckoner for soil test-based fertilizer recommendation at various targeted fruit yield levels of Nagpur mandarin(Citrus retiulata Blanco)
Source: Srivastava et al . (2010)
N-Recommendation Soil N (kg ha-1)
100
120 140
160 180 200 220 240 260 280 300
100 107.20 159.56 211.92 264.28 316.64 369.00 140 104.83 157.19 209.55 261.91 314.27 366.63 180 102.46 154.82 207.18 259.54 311.90 364.26 220 100.09 152.45 204.81 257.17 309.53 361.89 260 97.72 150.08 202.44 254.80 307.16 359.52 300 95.35 147.71 200.07 252.43 304.79 357.15 340 92.98 145.34 197.70 250.06 302.42 354.78 380 90.61 142.97 195.33 247.69 300.05 352.41 420 88.24 140.60 192.96 245.32 297.68 350.00
P- Recommendation Soil P (kg ha-1)
100
140
180 220 260 300
5 34.58 53.78 72.98 92.18 111.38 130.58 10 21.17 40.37 59.57 78.77 97.97 117.17 15 7.75 26.95 46.15 65.35 84.55 103.75 20 -5.66 13.54 32.74 51.94 71.14 90.34 25 -19.07 0.125 19.32 38.52 57.72 76.92 30 -32.49 177.67 269.83 361.99 454.15 546.31
K – Recommendation Soil K (kg ha-1)
100
140
180 240 260 300
100 130.0 197.78 265.46 366.98 400.82 468.50 140 114.6 182.14 249.82 351.34 385.18 452.86 180 98.82 166.5 234.18 335.70 369.54 437.22 240 75.36 143.04 210.72 312.24 346.08 413.76 260 67.54 135.22 202.90 304.42 338.26 405.94 300 51.90 119.58 187.26 288.78 322.62 390.30 340 36.26 103.94 171.62 273.14 306.98 374.66 380 20.62 88.3 155.98 257.50 291.34 359.02 420 4.98 72.66 140.34 241.86 275.70 343.38

8 Journal of Eco-friendly Agriculture 13(2) 2018
Nutrient diagnostics and fertil izer prescription in Citrus: A perspective analysis
for mass multiplication, iv. safe to environment, v. broadspectrum of action, vi. excellent and reliable efficacy, vii.compatible w ith other rhizosphere microbes, and in able totolerate other abiotic stresses, viii. strong compatibility withinorganic fertilizers and di fferent organic manures.Verylimited efforts have been made in citrus using these directions,which is so important from nutrient conservation point ofv iew (Safeguard ing both ind igenously available andexternal ly appl ied) to have complete stock of nutrientbudgeting in an orchard. Such attempts w ill serve dualpurpose, improve soi l and p lant resi lience and of ferecologi cal serv ice through ef fect iv e or char d f l oormanagement.
The microbial diversity existing w ithin rhizospheresoil from high yielding citrus orchards was characterizedand isolated the promising microbes v iz., Micrococcusyunnanensis (Asymbiotic N-fixer), Bacillus pseudomycoides(Si licate-solubilizer), Paenibacillus alvei (P-solubilizer),Acinetobacter radioresistens (P-solubilizer) , Aspergillusflavus (P-solubilizer). Pure culture of these microbes in valueadded form (108-1010 cfu mL -1) was developed in broth, andprepared a mixture cal led microbial consortium. Themicrobial activity of all the five component microbes wasfurther followed as 15 days interval upto 60 days of storageto find out the shelf li fe of such microbial consortium.Microbial activity of consortium remained active upto 60days (Srivastava, 2017, unpublished data).
Biometric response of microbial consortium : The responseof microbial consortium on rough lemon seedlings showeda significant increase in various grow th parameters (9.59 g
Table 3. Soi l su i tabi li ty cr iter ia for Nagpur mandarin(Citrus reticulate Blanco) and sweet orange cultivarM osambi (Citrus sinensis Osbeck ) grown inMarathwada region of Maharashtra
Soil Nagpur Mandarin Mosambi Sweet orange parameters 0-15 15-30 0-15 15-30
Soil pH 7.6-7.8 7.9-8.0 7.4-7.9 7.6-8.1 Soil EC (dS m-1) 0.12-0.24 0.21-0.28 0.22-0.34 0.26-0.44 Free CaCO3 (%) 11.4-12.8 15.6-18.2 11.2-14.9 12.6-16.8
Particle size distribution (%) Sand 20.8-40.1 19.0-32.7 24.2-38.2 22.3-32.5 Silt 26.8-30.4 11.2-26.8 21.2-31.5 29.3-34.2
Clay 42.8-48.8 54.2-56.1 45.3-52.4 48.5-55.2 Water soluble cations (mg l -1)
Ca2+ 168.3-182.3 192.50-212.45 182.1-216.8 192.6-248.3 Mg2+ 39.4-42.7 32.20-42.10 38.2-46.9 49.2-74.6 Na+ 0.98-1.1 0.68-1.23 0.62-0.98 0.58-0.82 K+ 12.1-28.2 11.40-12.8 11.4-21.2 11.6-18.3
Exchangeable cations [cmol(p+) kg-1] Ca2+ 31.9-32.3 38.1-41.2 35.8-40.2 34.2-44.8 Mg2+ 8.5-10.1 9.2-10.0 10.1-12.2 11.8-14.2 Na+ 0.68-1.23 0.8-1.1 0.42-1.06 0.46-0.98 K+ 3.2-4.1 4.5-4.6 4.3-5.8 3.8-4.9
Fertility status (mg kg-1) Available N 118.4-121.2 92.8-110.2 130.1-142.2 120.4-128.6 Available P 9.2-10.3 7.2-8.0 9.8-11.4 9.2-10.8 Available K 178.4-232.5 204.2-228.1 182.4-210.3 192.2-222.2 Available Fe 12.4-16.2 10.6-12.3 13.2-18.6 11.2-18.9 Available Mn 8.6-12.2 7.2-9.1 14.6-22.6 15.2-21.8 Available Cu 2.1-2.3 1.0-1.2 2.16-2.42 2.10-2.56 Available Zn 0.98-1.10 0.72-0.78 0.98-1.21 0.81-0.92
Yield (Tons ha-1) 11-15 7-10 24.1-26.2 11.8-12.3
Source: Srivastava and Singh (2004b; 2004c)
engineering (Caldwell, 2005). Formation of associations w ithother organisms to promote protect ion from potentiallyinhibitory environmental factors where such associationsreflect synergistic lifestyles facilitating more effective andefficient grow th and biogeochemical cycles than individualpopulations as a community (Berg, 2009). Such associationsare often called microbial consortium in which members ofthe consort i um maintai n metabol ic and ecologi calcompatibility for indiv idual niches to exist in the closeproximity in soil. Such microbial consortium is more resistantto environmental changes, and can compete much better thansingle micro-organism (Harzarika and Ansari,2007). Whendi fferent microbial st rains are made into an inoculumconsortium, each of the constituent stains of the consortiumnot on ly out-compete w i th others f or r hizosphereestabl ishments, but complement funct ionally for plantgrow th promotion.Dif ferent microbial components in amicrobial consortium should possess: i. high rhizospherecompetence, ii. high competitive saprophytic ability, iii. ease

Journal of Eco-friendly Agriculture 13(2) 2018 9
A.K. Srivastava and P.S. Shirgure
root weight, 24.86 g shoot weight, and 11.9 mm stem diameter)over control (2.99 g root weight, 9.08 g shoot weight, and 8.6mm stem diameter) on per plant basis. Similar observationswere made on buddlings also. There was a significantlyhigher growth w ith microbial consortium treated buddlings(11.76 g root weight, 26.41 g shoot weight, and 28.51 mmstem diameter on per plant basis) compared to untreatedcontrol (4.10 g root weight, 10.72 g shoot weight, and 20.20mm stem d iameter). Same microbial consort ium incom binat ion of 50% inor gani c fert i l i zer s + 50%vermicompost) produced a much better quantitative as wellas qualitative response compared to treatment w i thoutmicrobial consortium in bearing Nagpur mandarin orchard.Such an attempt has an excellent potent ial for carbonaccreditation as a climate resilient option, against potentialsoil health deterioration (Srivastava et al. 2012).
Integrated nutrient management: Citrus, by its avid nutrientabsorbing capacity is considered highly nutrient responsiveperennial fruit crop (Srivastava and Singh 2005). Differentialefficacy of two conventional methods of fertilization (soilversus foliar application) has, although helped in improvingthe quality citrus, but of late, continuous fertilization hasfailed to sustain the same yield expectancy on a long termbasis due to depletion of soil carbon stock and consequently,
emerged multiple nutrient deficiencies, irrespective of soiltype (Ferguson, 1990). The menace of multiple nutrientdeficiencies would be further triggered through increase inair temperature via changes in microbial communities andactivities w ithin the rhizosphere in the light of climate change(Fageria et al., 2008). Such changes will dictate adversely onthe orchard’s productive life in long run. Gradual shift frompurely inorganic to organic fertilizers started gaining w idescale use for enhanced biogeochemical nutrient cycl ing(Srivastava et al., 2008). Long term data accrued on responseof organic manuring versus inorganic f ert i l i zersdemonstrated that important soil quality indices like soilmicrobial diversity, soil microbial biomass nutrient (Cmic, Pmic,and N mic) and organic carbon part i tioning d isp layedsignificant changes, but without much difference in quantumof fruit yield (Srivastava, 2009; 2010a). The other approachesinvolving mul tip le microbial inoculation along w ithenrichment of organic manures through inorganic fertilizersknown as substrate have further been highlighted as a partof INM module to provide an understanding on mechanisminvolved in C stabilization in soils for regulating soil Csequestration and associated nutrient dynamics under INM–based production system in citrus orchards. Integration ofsuch microbial consortium w ith organic manures and
Table 4. Fertilizer schedule for different citrus cultivars
In order to prepare 0.5% of FeSO4 solution, dissolve 500 g iron sulphate in 100 l i ters of water and spray on the plant ti l l drench, l ikewiseprepare the solutions of other micronutrients.Source: Huchche et al . (1996), Srivastava (2013 a 2013c), Srivastava et al . (2008)
Soil application Foliar application Ambia (g/ plant) Mirg (g/ plant) Ambia Mirg
Ferti lizer Source Total ferti l izer (g/ tree/ year)
Apr. Aug. Nov. Sept. Nov. Jan. Apr. Aug. Nov. Sept. Nov. Jan. Nagpur mandarin Urea 1300 433 433 434 433 433 434 - - - - - - Single super phosphate 1260 630 630 - 630 630 - - - - - - - Muriate of potash 180 - - 180 - - 180 - - - - - - FeSO4 200 50 50 - 50 50 - 0.50% - 0.50% 0.50% - 0.50% MnSO4 200 50 50 - 50 50 - 0.50% - 0.50% 0.50% - 0.50% ZnSO4 200 50 50 - 50 50 - 0.50% - 0.50% 0.50% - 0.50% Acid l ime Urea 1740 580 580 580 580 580 580 - - - - - - Single super phosphate 1260 630 630 - 630 630 - - - - - - - Muriate of potash 180 - - 180 - - 180 - - - - - - FeSO4 200 50 50 - 50 50 - 0.50% - 0.50% 0.50% - 0.50% MnSO4 200 50 50 - 50 50 - 0.50% - 0.50% 0.50% - 0.50% ZnSO4 200 50 50 - 50 50 - 0.50% - 0.50% 0.50% - 0.50% ‘M osambi ’ Sweet orange Urea 1740 580 580 580 580 580 580 - - - - - - Single super phosphate 1260 630 630 - 630 630 - - - - - - - Muriate of potash 180 - - 180 - - 180 - - - - - - FeSO4 300 75 75 - 75 75 - 0.50% - 0.50% 0.50% - 0.50% MnSO4 300 75 75 - 75 75 - 0.50% - 0.50% 0.50% - 0.50% ZnSO4 300 75 75 - 75 75 - 0.50% - 0.50% 0.50% - 0.50%

10 Journal of Eco-friendly Agriculture 13(2) 2018
Nutrient diagnostics and fertil izer prescription in Citrus: A perspective analysis
chemical fert i l i zers (basis for INM – based nutr i entmanagement) in addition to concepts like sensor based–programmable fertigation and precision oriented site specificnutrient management exploiting spatial variation in soilfertility and leaf nutrient composition could further providethe much desired niche in the production sustainabilitythrou gh engineering nutr ient dynamics w i thi n therhizosphere under changing climatic scenario (Srivastavaand Ngullie, 2009; Srivastava et al., 2012).
Organic management module in Nagpur mandarinCitrus requires 16 essential elements for normal grow th,
production, and quality irrespective of the source (Zekri,1995). Renewed and intensified efforts are in progress duringthe past 10-15 years to grow citrus organically ever since thedepleting soil fertility has attained a serious concern w iththe practice of high density orcharding coupled w ith heavyuse of chemical fertilizers that were immediately availableto the plants for nutrient uptake (Kohli et al., 1998; Srivastavaand Singh, 1999) bringing unprecedented reduction in soilorganic matter. Organic citrus cultivation is often consideredamongst one of the sustainable agricultural practices, if usedappropriately, promises to offer rich dividends on a longterm basis. Opinions vary greatly about organic farming,being perceived as a part of sustainable agricu l ture(Ferguson, 1990b).
Concerns about improv ing nitrogen use efficiency,reducing nitrate pollution, contamination due to byproductsof various chemical pesticides in use, and continued gradualloss of soil organic matter have always been the major core
issues, and more so, in organic citrus (Ferguson, 1994). But,the organic cultivation has yet not received the priority, itdeserves, w ith the resul t, soil physical , chemical, andmicrobiological heal th have not been so favouring toconsistantly high yield (Dahama, 1994; Paroda, 1999; Ghosh,2000). I n add i t ion to changes in land use pat tern,unfavourable climatic conditions have further enhanced therate of decomposition of soil organic matter and its furtherdepletion (Velayutham et al., 1999). These problems warrantrevision of ongoing agricultural practices, and adaptationof some alternative strategies whose origin is presumed tobe age old, popularly known as organic farming or naturalfarming (Srivastava et al.,2002).
Traditional agricultural practices w ith special referenceto rotation, use of green manures and rural agricultural wasteas compost, tank silt application would all help to build soilorganic matter base; a reliable index of fertility. This is long-term endeavour but once attained all parameters, physical,chemical , and biological w ork at opt imum. Bacter ialfertilizers Rhizobium, Azosprillum, etc. become redundant.The indigenous flora w ill be functional at peak efficiency. Aspecial reference is necessary to vermicompost. Each farmercan at best prepare compost on his farm and apply.
The earthworms thus transferred would work as thesoil is hospitable. But to commercialise the process of sale ofearthworms in plastic bags or washings in suitable carriersis at best a gimmick. Recent most queer and uncommonclaims in favour of earthworms are misplaced. Naturallyoccurring in the soil is a recognized indigation of agro-
Table 5. INM- Schedule recommended for Ambia (Spring bloom) and Mrig crop (Monsoon bloom) of Nagpur mandarin
Source: Srivastava et al . (2012, 2015)*FeSO4 (0.50%) to be prepared by dissolving 500g FeSO4 in 100 L water;MnSO4 (0.50%) to be prepared by dissolving 500g MnSO4 in 100 Lwater;ZnSO4 (0.50%) to be prepared by dissolving 500g ZnSO4 in 100 L water;Borax (0.25%) to be prepared by dissolving 250g borax in 100L water.*SSP and MOP stand for single superphosphate and muriat of potash, respectively.
Ambia crop Mrig crop Components of INM April August November August October January
Soi l appl ication Vermicompost (kg) 5.0 5.0 5.0 5.0 5.0 5.0 Inorganic ferti l izers (g/ tree) 300g urea 300g urea 300g urea 300g urea 300g urea 300g urea 260g SSP 260g SSP 260g SSP 260g SSP 260g SSP 260g SSP
110g MOP 110g MOP 110g MOP 110g MOP 110g MOP 110g MOP
Microbial consortium (ml/ plant) 50.0 50.0 50.0 50.0 50.0 50.0 Fol iar spray Month of spray April June September September October December 0.50%FeSO4+0.50%MnSO4 * * * * * * 0.50% ZnSO4 * * * * * * 0.25% Borax * * * * * *

Journal of Eco-friendly Agriculture 13(2) 2018 11
A.K. Srivastava and P.S. Shirgure
ecosystem’s health for stable aggregation of clay-organicmatter complexes and efficient nutrient recycling. Bugg (1994)has updated our know ledge on the role of earthworminvolvement in nitrification.
Alteration of heavy w ith light crop is a common featurein citrus (Reuther, 1973; Moss et al., 1981; Kihara et al.,1995;Haggag et al., 1995). Alternate bearing is more pronouncedfrom tree to tree basis in Kinnow mandarin, w ithout anysignificant di fference in feeder root density comparedbetween on and off year trees (Jones et al., 1975). The presentcitrus production trends are characterized by either frequentcrop failure or recurrence of alternate on and off year settinga substantial monetary loss to the industry (Jones et al., 1975;Rojas, 1998; Dass et al .,1998). These uncertainties inproduction, arising out of nutritional constraints could beresolved to a greater extent by organic cultivation of citrusthrough improved organic carbon stock, and improved theplant metabolism (Kohli et al., 1998; Ghosh, 2000). Besides,these merits of organic citrus, the mobilization of unavailablenutrients could also be effected by speeding up the rate ofmineralization of various organic substrates.
Use of microbial biofertilizers on one hand, and theutilisation of VAM fungi as bioprotectors, bioregulators andbiofertilizers in citrus (Manjunath et al., 1983; Ishii andKadoya, 1996) on the other hand is likely to bring a desirablechanges in the quality production, besides beneficial impacton soil heal th. A comprehensive review on the subject(Srivastava et al., 2002) has shown, the necessity of adoptingorganic ci trus cu lture by using domestically producedorganic manures and enriching them through nutrientenrichment techniques on one hand, and using thebiofertilizers including VAM mycorrhizae on the other handhave to be an integral part of this programme, sincemobil ization of tapped nutrients in the soil is equal lyimportant if sustainable improvement in soil fertility is to bebrought about. Thus, sustainable and organic systems areanticapated to meet nutritional needs to a great extent bymanaging soil biology, chemistry and structure to optimisesoil fertility and nutrient cycling.
The appl icat i on of ver micompost loaded w i thmicrobial consortium (100% N- equivalent basis) + IPM 2(foliar application of Horticulture Minieral oil (2%) followedby Beauveria bassiana @ 5g/ 1 and Azadirachtin (1%) @ 4ml/ 1) + IDM 1 - Bordeaux paste (CuSO4 : Lime: Water = 1:1:10)as pre monsoon / post monsoon trunk application along w ithTrichoderma harzianum nat ive antagonist ic st rain,NRCfBA29 (100g/ plant) with carrier material of FYM (1kg)as soi l applicat ion at root zone recorded maximumproduction and productivity coupled w ith soil health. the
comparative economics of convent ional and oraganicproduction of Nagpur mandarin further demonstrated anadditional income of Rs 1,57,954/ - hectare through organicproduction of Nagpur mandarin (Srivastava et al., 2006).
Fertigation schedul ingCitrus production depends upon the application of
water and fertilizers in appropriate amount at proper time(Shirgure et al., 2000; 2001a; 2001b). The market prices offertilizers required for citrus crops are rising up day-by-dayand farmers cannot afford to buy the required fertilizers.Therefore, it is the time need to apply fertilizers efficiently atproper time when plant needs. The application of fertilizersthrough basin irrigation goes waste (40 - 50% fertilizersaccording to an estimate) through leaching, evaporation andfixation in the soil. Fertigation is application of water solublesolids as well as liquid fertilizers through the irrigation onweekly/ monthly basis so as to reach each and every plantregularly and uniformly. In the area of scarce water resourceand insufficient rainfall, fert igat ion offers the best andsometimes the only way of ensuring the nutrients enter theroot zone of acid lime (Shirgure et al., 2002;2003a;2003b). Ithas many advantages like increasing fertilizer-use efficiency,ensured supply of water and nutrients, labour saving andimprovement in grow th, yield and quality.
Zekri and Koo (1994 a) evaluated micro-nutrientsthrough fertigat ion using di fferent sources and rates.Inorganic forms were ineffective in evaluating micro elementslevels in oranges. But chelated sources of Fe, Mn, Zn and Cuwere very ef fect ive and their rates of appl ication w erecomparable w ith rates through foliar applications. Zekri andKoo (1994 b) later studied that the use of conventional soiland foliar spray applications to correct micronutr ientdeficiency in citrus has not been completely satisfactory. Theeffectiveness of fertigation w ith micronutrients was observedto depend on the fertilizer source. Application of chelatedFe, Mn and Zn through irrigation system increased theconcentration of these micronutrients in the leaves. Thenitrate forms of Fe, Mn and Zn were ineffective, as was thesulphate form of Zn. The sulphate form of M n w asoccassionally effective, but the sulphate form of Cu was veryeffective. Such variability needs to be evaluated with differentcitrus cultivars on a verity of soils.
Syvertsen and Smith (1996) studied the nitrogen uptakeefficiency and leaching losses from lysimeter grown treesfertilized at three nitrogen rates. The average N uptakeefficiency decreased w ith increased N appl ication rates,overall canopy volume and leaf N concentration increasedw ith N rate, but there was no effect of N rate on fibrous rootdry weight. Foguet et al. (1998) showed that the grow th of

12 Journal of Eco-friendly Agriculture 13(2) 2018
Nutrient diagnostics and fertil izer prescription in Citrus: A perspective analysis
Valencia orange trees was positively influenced by irrigationand not so much by nitrogen fertilization in the province ofTucuman, Argentina.
A f ield exp eriment w as conducted on Nagpurmandarin (C. ret i cu lata) duri ng 1998-2010 at t heexperimental farm of NRC for Citrus, Nagpur. The treatmentswere 4 levels of irrigation (10%, 20%, 30% and 40% depletionof available water content ) and 3 levels of fertigation (600,200 and 100 g; 500, 140 and 70 g and 400, 80 and 40 g N, Pand K / plant). The incremental plant height (0.46 m), girth(19.9 cm) and canopy volume (14.3 m3) was more w ithirrigation scheduled at 20 % depletion of available waterand 500, 140 and 70 g N, P and K / plant fertigation. Thefruit yield (26.1 kg-1 tree), fruit weight (135.1 g), total solublesolids in fruits and juice percentage (47.32 %) were higherw ith irrigation scheduled at 20 % and 500, 140 and 70 g N, Pand K / p lant fertigat ion (Shi rgure et al., 2001b). Theincremental height (0.40 - 0.60 m), stock girth (4.07 - 4.26 cm)and canopy volume ( 6.93 m3) of bearing acid lime was morein irrigation scheduled at 30 % depletion of available watercontent w ith 500:140:70 fertigation. The combined effect ofirrigation at 30 % depletion of available water content andfertigation w ith 500:140:70 gave better grow th and yield ofacid lime. The average fruit yield was 15.83 kg/ tree in 30 %depletion of available water content. The average fruit weightand total soluble solids were 30.1 g and 8.1 % in irrigationscheduled at 30 % depletion of available water content with500: 140: 70 fertigation. The juice percent and acidity w ithirrigation scheduled at 30% depletion of available watercontent and 500:140:70 fertigation was more (42.5% and7.0%) as compared to other treatments (Shirgure et al., 2003b;
2004b; 2004c). Authors developed a complete fertigationschedule for Nagpur mandarin. (Table 6)
Potassium is one such essential nutrient known forimprov ing the f ru i t quali ty. Convent ional method offert ili zation suffers from not producing the consistentresponse of fertilizers application. The fertilization usingdrip irrigation has proved very effective in sustaining thequality production of Nagpur mandarin. The fruit yield washighest (25.52 t/ ha) w ith sulphate of potash fertigationfollowed by fertigation w ith 50 g K2O/ plant at 30 daysinterval (23.67 t/ ha). The fruit quality was influenced w ithdifferent potassic fertilizers. Maximum juice TSS (9.63 0Brix)and fruit weight (163.3 g) was observed w ith K fertigationw ith 40 g K2O/ plant at 30 days interval. The highest TSS/acidity ratio was observed w ith K fertigation with 40 g K2O/plant at 30 days interval (10.0).
Fertigation w ith 40 g K2O/ plant at 30 days intervalusing sulphate of potash fertilizer through micro-irrigationproved to be very effective for better fruit yield and quality ofNagpur mandarin (Shirgure et al., 2006a). In the treatmentsof evaluation of different potash fertilizers in K fertigationfor Nagpur mandarin consisted of fertigation w ith potassiumchloride, potassium nitrate, sulphate of potash and monopotassium phosphate w ith dose as 150 g k2O/ plant. TheNagpur mandarin yield w as highest (31.13 t/ ha) w ithfertigation of mono potassium phosphate (150 g K2O/ plant)followed by fertigation w ith potassium nitrate (150 g k2O/plant) at 15 days interval (29.4 t/ ha).The fruit quality is alsoaffected w ith different potash fertilizers. Highest fruit TSS(10.54 0Brix) and fruit weight (159.28 g) was observed in
Table 6. Fertigation scheduling of Nagpur mandarin (Citrus reticulate B lanco) under sub-humid tropical climate of centralIndia
Source: Shirgure (2012; 2013), Shirgure and Srivastava (2013; 2013)
Macronutrients (g/ plant) M icronutrients (g/ plant) Month Crop stage N
(g/ plant) P2O5
(g/ plant) K 2O
(g/ plant) ZnSO4
(g/ plant) FeSO4
(g/ plant) MnSO4
(g/ plant) Borax
(g/ plant) April Flush 60 - - - - - -
May -June Stress period for f lowering July Flowering 60 30 15 50 50 50 25
August Fruit set 60 30 15 50 50 50 25 September Pea size - - - - - - -
October Marble size 60 30 15 50 50 50 25 November Fruit Devp. 60 30 15 50 50 50 25 December Fruit Devp. 60 30 15 - - - - January Fruit Devp. 60 30 15 - - - -
February Maturity 60 - - - - - - March Color break - - - - - - - Total 480 180 90 200 200 200 100

Journal of Eco-friendly Agriculture 13(2) 2018 13
A.K. Srivastava and P.S. Shirgure
fertigation w ith potassium nitrate (150 g k2O/ plant) at 15days interval. The highest TSS / acidity ratio was observedin fertigation of mono potassium phosphate (13.7) followedby potassium sulphate (13.1).
Futuristic goalsDespite many cutting edge technologies, addressing a
variety of core issues on role of soil type-based nutrientmanagement (L ipecki and Berbec, 1997) in raising theproductivity of perennial fruits is the major research anddevelopmental issue. Fruit crops, despite some dist inctdevelopments, are confronted w ith number of soil fertilitychal lenges. These chal lenges could be conv incinglyelaborated as: sustaining the sustainable soi l fert il itymanagement, we need to def ine role of rhizosphere inecological service (CO2 sink), integrating soil nutrient andmicrobial pool over different spatial and temporal scalescropw ise, soil fertility resilience and human health, plant-soil-microbial interface (For example, crop microbiome),coupled reaction processes in soil to add new frontiers ofsoil fertility management, besides robust and dynamic crop-based nutrient modelling duly tested spatio- temporally.
Until recently, research has focused on those organismsthat are culturable. However a wealth of information is nowbeing collected from both culturable and, as yet, unculturableorganisms.
Functions of the soil microbial populat ion impactmany processes and, therefore, productivity (Kennedy andGew in, 1997), if mechanisms involved in the plant-microbeint eract ion are bet ter understood, since, a p lantmanufactures microbial communit ies accord ing to i tsmetabolic requirements. The microbial biomass is one of thebiological properties of soil that undergoes immediate changein response to fertilizer like input. Studies, therefore, need tobe undertaken w ith a view to explore the possibility of whichsoil microbial property could be used as a potential tool forf ind ing out soi l heal th related constraint instead ofconcentrat ion of available nutr ients in soil using someindicator f ruit crop(s).While the genet ic, functional andmetabolic d iversity of soil microorganisms w ithin therhizosphere of w ide range of fruit crops is important, thecapacity of soil microbial communities to maintain functionaldiversity of those critical soil processes could ultimately bemore important to ecosystem productivity and stability thanmere taxonomic diversity (Caldwell and Bruce, 2005).
In this context, it remains to be assessed how nutrient-microbe synergism is associated w i th product iv ity ofperennial fruits. New research methods involving moleculartechniques w ill extend our understanding of taxonomic and
functional diversity in soil systems. With the availability ofmore technical know-how on combined use of organicmanures, prolonged shelf life of microbial bio-fertilizers, andinorganic chemical fertilizers, an understanding on nutrientacquisition and regulating the water relations would helpsw itch orchards to CO2 sink (expanding carbon capturingcapacity of rhizosphere) so that a more sustainable fruit-based integrated crop production system under biotic andabiotic stress could be evolved. The molecular approach tobreeding of mineral def iciency resistance and mineralefficiency would facilitate to produce nutritionally efficientbiotypes in order to maximise the quality production of fruitcrops on sustained basis. The work related to microbialinoculants for mass production, formulation coupled w ithinnovative marketing, interaction and signalling w ith theplant and soil environment need further redressal to reorientfruit nutrition research. The further efforts on homologousmicrobes as rhizosphere microbes versus plant endophyteswould further after way forward approaches in identifyingmore crop endosphere competent microbes for elevated cropresponse. It remains to be investigated, how nutrient-microbeassociat ion could br ing bet ter d ividends to accurateestimation of orchard C budget vis-a-vis time scale andfeedback mechanisms of changes in soil carbon pool andsteady state level under specific fruit crop in order to expandpotential of C credits through perennial fruit crops.
The above nutrient management-based issues andstrategies would find their worth only when backed up w ithsound methodologies of nutrient constraints diagnosis. Thecurrently available leaf nutrient standards for different fruitcrops have certain distinct limitations in terms of: i. Samplingindex plant part(s) leaving very short time for remediation ofidentified constraints, ii. application of diverse interpretationtools bring out varying limits of nutrient concentration andiii. do we need to apply some correction factor when suchnutrient standards are applied in fruits under fertigation. Abetter rationale of nutrient constraints diagnosis as early aspossible in a standing crop would surely pave the way forprecision-based nutrient response accru ing in elevatedproductivity. Proximal sensing, preferably hyper-spectralanalysis would add a new dimension in this regard, sincethe current basis of nutrient constraints diagnosis is skewedmore towards next season crop than current season crop.An early warning system exploiting the metallo-enzymesensor could be another viable option in years to come.Delineation of production management zones linked w ithvariable rate fertilizer application as per the crop phenologyis expected to tailor the fertilizer requirement without alteringthe fertilizer requirement of a crop soil fertility based spatialvariogram would further act as a decision support tool for

14 Journal of Eco-friendly Agriculture 13(2) 2018
Nutrient diagnostics and fertil izer prescription in Citrus: A perspective analysis
precise fert ili zer recommendation. Evaluat ing nutrientresponse at a cellular, sub-cellular, tissue level and plantpart level instead of whole plant basis, would lay a solidfoundation of nutrient management strategy in fruit crops.Eventually, such attempts warrant for developing NutrientExperts based on 4R Stewardship Concept advocated byInternational Plant Nutrition Institute, Gurgaon which havedisplayed some definite yield advantages in cereal crops,but such serious efforts are direly needed in fruit crops, ifnutrient management is to be linked w i th nutrient useefficiency. On the line of 4R in plant nutrition, there is also aneed to look 4W in terms of irrigation management, so that4R and 4W operate complimenting each other to facilitatenot only the sustained quali ty product ion, but aid inmoderating the climate change – related issues as well.
REFERENCESBerg, Gabriele (2009). Plant-microbe interactions promoting plant
gr ow th and heal th: perspecti ves for contr ol led use ofmicroorganisms in agriculture. Applied Microbiology &Biotechnology, 84: 11-18.
Bielorai, H ., Deshberg , Erner and M. Brum (1984). The effect offertigation and partial wetting of the rootzone on productionof shamouti orange. Proceeding of International Society ofCitr iculture, 1: 118-120.
Bindi, M., Fibbi, L., Gozzini , B., Orlandini S., Seghi, L. and S. Poni(1997). The effect of elevated CO2 concentration on grapevinegrowth under field conditions. Acta Horticulture, 42: 325-330.
Bhatnagar, P., Singh, J., Chauhan, P.S., Sharma, M.K., Meena, C.B.and M.C Jai (2016). carbon assimilation potential of Nagpurmandarin (Citrus reticulata Blanco) International Journal ofEnvironmental Science and Technology, 5:1402-1409.
Bugg, R.L (1994) Earthworm update. Sustainable AgricultureNews, 7: 1-4.
Caldwell and C.Bruce (2005). Enzyme activi ties as a componentof soi l diversity, A review. Pedobiologia, 49: 637-644.
Centr i t to, M ., M agnani , F., L ee, H .S.J. and P.GJarvi s (1999a). Inter active effects of elevated [CO2] anddr ought on cher r y (Pr unus av i um ) seed l i ngs. I I .Photosynthet i c capaci ty and w ater r el at i ons. N ewPhytologist, 141: 141-153.
Centri tto, M., Lee, H.S.J. and P.G. Jarvis (1999b). Interactive effectsof elevated [CO2] and drought on cherry (Prunus avium)seedl ings. I. Growth, whole-plant water use efficiency andwater loss. New Phytologist, 141: 129-140.
Chanda, T. K. (2014). A cri tical analysis of ferti l izer use by crops inIndia. Indian Journal of Ferti l isers, 10:14-20.
Conroy, J (1992). Infl uence of el evated atmospher ic CO2 onconcentrati ons of plant nutr ients. Austral i an Journal ofBotany, 40: 445-456.
Dahama, A .K. (1994). Organic Farming for Sustainable Agriculture
(ed.). Agro Botanica, Binkaner, Rajasthan, India, pp. 1-52.Dass, H.C, Srivastava, A .K, Lallan Ram and Shyam Singh (1998).
Flowering behaviour of Nagpur mandarin (Citrus reticulateBlanco) as affected by vertical variations in physic-chemicalcompositions. Indian Journal of Agricultural Sciences, 68:692-694.
Das, B.S, Sarathji th, M.C, Santra, P., Sahoo, R.N, Srivastava, R.,Routray, A . and S.S. Ray (2015). Hyperspectral remotesensing: opportunities, status and chal lenges for rapid soi lassessment in India. Current Science, 108: 860-868.
Ehleringer, J. and T.E. Cerl ing (1995). A tmospheric CO2 and theratio of intercel lular to ambient CO2 concentrations in plants.Tree Physiology, 15: 105-111.
Fageria, N.K, Bal igar, V.C. and Li, Y.C (2008). The role of nutr ientefficient plants in improving crop yields in the twenty fi rstcentury. Journal of Plant Nutri tion, 31: 1121-1157.
Ferguson J.J. (1994). Organic ci trus production Certi fication andproduction guidel ines. Citrus Industry, 75: 40-44.
Ferguson, J.J. (1990). National conference on organic/ sustainableagriculture pol icies. Citrus Industry, 17: 40-44.
Fischer, G., Almanza- Marchan, P.S and F. Ramirez (2012). Source–Sink relationship in frui t speci es. A revi ew- Rev istaColombiana de Ciencias Horticolas, 6: 238-25.
Foguet, J.L., Gonzatez, J.L., Vinkiguerra, H., Blanco, A .S and C.Hernandez (1998). The influence of supplementary irr igationon growth and production of Valencia orange. AdvanceAgroindustrial , 18: 9-13.
Germana, C. (1994). Increasing water use eff iciency throughirr igation management. Proceedings of the InternationalSociety of Citr iculture, 2: 638–42.
Goh, K. M (2004). Carbon sequestration and stabi l ization in soils:Impl ications for soi l productivi ty and cl imate change. SoilScience and Plant Nutri tion, 50: 467–476.
Ghosh, S.P (2000). Nutrient management in frui t crops. Ferti l izerNwes, 45: 71-76.
Haggag, L.F., Maksoud, M.A and F.M.Z El- Barkouky (1995).A lternate bearing of Balady mandarin as influenced bynutri tional status of tree. Annals of Agriculture and Science(Cairo), 40: 759-749.
Hazarika, B.N. and S. Ansari (2007). Bioferti l izers in frui t crops -A review- Agricultural Review, 28: 69-74.
Huchche, A .D, Dass ,H.C, Lal lan Ram, Srivastava, A.K. and R.RKohl i (1996). Response of acid l ime (Citrus auranti fol iaLinn.) to ni trogen ferti lisation. Indian Journal of Horticulture,53: 14-18.
Idso, S.B. and B.A. Kimbal l (2001). CO2 enrichment of sour orangetr ees: 13 year s and counti ng. Env i r onmental andExperimental Botany, 46: 147-153.
Ishi i, T. And k. Kadoya (1996). Uti lisation of versicular- arbusularmycor r hi zal fungi i n ci tr us or char ds. Pr oceed i ngInternational Society Citr iculture, 2: 777-780.
Jones, W.W, Embleton, T.W. and Jr. C.W. Coggins (1975). Starch

Journal of Eco-friendly Agriculture 13(2) 2018 15
A.K. Srivastava and P.S. Shirgure
contentof roots of Kinnow mandarin trees bearing frui ts inalternate years. Hortscience, 10 : 514.
Johnston, A.M., Khurana, H.S., Majumdar, K.and T. Satyanarayana(2009). Site specific nutrient management – Concept, currentresearch and future chal lenges in Indian agriculture. Journalof Indian Society of Soi l Science, 57:1-10.
Keditsu, Rokolhui i and A .K. Srivastava (2014). Substrate dynamics:Development and issues. Annals of Plant and Soil Research,16:1-86.
Kennedy, Ann C. and L. Gewin Virginia (1997). Soi l microbialdiversi ty : present and future considerations. Soil Science,162: 607-671.
Keutgen, N. and K. Chen (2001). Responses of ci tr us leafphotosynthesis, chlorophyl l fluorescence, macr onutrientand car bohydr ate contents to el ev ated CO2. Journal of Plant Physiology, 158: 1307-1316.
Kilhara, T., Iwagaki I., Okuda, H. and K. Kawase (1995). Alternatefrui t branch frui t cluster in Satsuma mandarin : new frui tcontrol method for biennial bearing prevention and quali tyimprovement. Bullatin of Fruit Tree Research Station, Okitsn,Japan, 27, pp.26-32.
Kohl i , R.R, Srivastava, A .K and V.J Shivankar (1998). Organicculture in citrus cultivation. Indian Horticulture, 43:12-15.
Koo, R.C.J, and A .G, Smjstrala (1984). Effect of tr ickle irr igationand fer tigation on fr ui t production and frui t qual i ty ofValencia orange. Proceeding of Florida State HorticultureSciences, 97: 8-10.
Lareen, A ., Burton, F. and P. Schafer (2016). Plant root-microbecommunication i n shapi ng r oot mi cr obiomes. Pl antMolecular Biology, 90: 575-587.
Lipecki, J. and S. Berbec (1997). Soi l management in perennialcrops: orachards and hop gardens. Soil Ti l lage Research,43:169-184.
Lombar, S. (1994). Fertigation of young ci trus trees. Inl igtingeBulletin, Insti tute vir Tropiese on Subtroplese gewasse, 262:10-11.
Malhotra, S. K. and A . K. Srivastava (2015). Fertil izer requirementof Ind i an hor t i cul tur e: A n anal ysis. Ind ian Jour nalof Fertil isers, 11: 16-25.
Manjunath, A ., Mohan, R. and D.J.Bagyaraj (1983). Responses ofcitrus to VAM inoculation in unsteri le soi ls. Canadian Journalof Botany, 61:2779-2732.
Monsel ise, S.P. and E.F. Goldschmidt (1982). A lternate bearing infrui t trees- A review. Horticulture Reviews, 4 : 128-173.
Moss, G.I., Bevington, K.B., Gallasch, P.T. and B. M El-Zaftawai(1981). A lternate cropping of Valencia oranges. New Southwales, Department of Agriculture Science Bulletin, 88, pp. 1-27, New Zealand.
Mosse, B. (1981). Vesicular- arbuscular mycorrhiza research fortropical agriculture. Res. Bul l.194, p.42. Hawaii . Insti tute ofTropical Agriculture and Human Resources. Univ. of Hawaii ,USA.
Paroda, R.S. (1999). Soi l ferti l i ty management – certain issuses.Journal of Indian Socitey of Soi l Science, 47: 580-581.
Peng, L., Wang, C., He, S., Guo, C. and C. Yan (2000). Effects ofelevation and cl imatic factors on the frui t qual i ty of Navelorange. South China Fruits, 29: 3-4.
Plessis, S.F.Du (1985). Irr igation of ci trus. Citrus and Sub-tropicalFruit Journal, 614:12.
Pyle, K.R (1985). An appraisal of micro-irr igation for use in ci truswith an emphasis on drip irr igation. Citrus and SubtropicalFruit Journal, 612: 4-7.
Reuther, W. (1973). Cl imate and ci trus behaviour. Citrus Indus.(ed.), Vol.3,pp.280-337, Uni.of Cal if., Davis, USA.
Rojas, E. (1998). Floral response of Tahiti l ime (Citrus lati fol ia Tan.)to fol iar sprays of hydrogen cyanamide. Fruits (Paris), 53:35-40.
Scholberg J. and K. T. Morgan (2012). Nutrient use efficiency incitrus. In : Advances in Citrus Nutri tion. Srivastava, A .K.(Ed.). Springer Verlag, The Netherlands pp, 205-29.
Shirgure, P. S, Srivastava, A .K and S. Singh (2001a). Effect of panevaporation based irrigation schedul ing on yield and qual ityof drip irr igated Nagpur mandarin. Ind ian Jour nal ofAgriculture Sciences, 71: 264-266.
Shirgure, P. S, Srivastava, A.K and S. Singh (2001b). Growth, yieldand quali ty of Nagpur mandarin ( Citrus reticulata Blanco )in relation to irr igation and fertigation. Indian Journal ofAgriculture Sciences, 71: 547-50.
Shirgure, P. S, Srivastava, A .K and S. Singh (2001c). Effect ofni trogen fertigation and band placement ferti lizer applicationon soi l -leaf nutr ient bui ld-up and incremental growth ofacid lime. Journal of Soi l and Water Conservation, 45 (3&4): 176-181.
Shirgure, P. S, Srivastava A .K and S. Singh (2002). Economics ofdrip and fertigation in acid l ime orchards. Journal of Soi land Water Conservation, 46 : 56-60.
Shirgure P. S, Srivastava A .K and S. Singh (2003a). Evaluatingmicro-irr igation systems in Nagpur mandarin under sub-humid tropical climate. Tropical Agriculture, 80 : 91-96.
Shirgure, P. S, Srivastava A .K and S. Singh (2003b). Irr igationschedul ing and fertigation in acid lime (Citrus auranti fol iaSwingle). Indian Journal of Agricultural Sciences, 73: 363-7.
Shirgure, P. S, Srivastava A.K and S. Singh(2004b). Growth, yieldand qual i ty of acid l ime under pan evaporation based dripirr igation schedul ing. Indian Journal of Soi l Conservation,32 : 32-35.
Shirgure, P. S, Srivastava A.K and S. Singh (2004c).Integrated waterand nutrient management in acid l ime. Indian Journal ofSoi l Conservation, 32 : 148-151.
Shirgure, P. S (2012). Effect of pluse irr igation schedul ing w ithhybrid station control ler on frui t yield and quli ty of Nagpurmandarin (Ci trus ret iculate Blanco). Indian Journal ofHorticulture, 1:76-82.

16 Journal of Eco-friendly Agriculture 13(2) 2018
Nutrient diagnostics and fertil izer prescription in Citrus: A perspective analysis
Shirgure, P.S (2013). Yield and frui t qual i ty of Nagpur mandarin(Citrus reticulate Blanco) as influenced by evaporation baseddrip irr igation schedules. Science Journal of Crop Science, 2:28-35.
Shirgure, P.S and A.K Srivastava (2012). Effect of automatic micro-irr igation scheduling on productivity and quali ty of Nagpurmandarin (Ci trus reticulate Bl anco). Indian Journal ofHorticulture, 71:112-116.
Shirgure, P.S and A.K Srivastava (2013).Plant growth, leaf nutrientstatus, frui t yield and qual i ty of Nagpur mandarin(Citrusreticulate Blanco) as influenced by potassium(K) fertigationwith four potash ferti l izer source. Science Journal of CropScience, 2: 36-42.
Shirgure, P. S, Srivastava A .K and S. Singh(2003). Differentialfertigation response of Nagpur mandarin (Citrus reticulataBalanco) on an alkaline Inceptisol under sub-humid tropicalcl imate. Tropical Agriculture, 80: 97-104.
Srivastava, A .K, Shyam Singh and R.A. Marathe (2002). Organiccitrus: Soil ferti li ty and plant nutr ition. Journal of SusttanableAgriculture, 19:5-29.
Sr ivastava, A .K. (2009). Integrated nutrient management:Concept and appl ication in ci trus. In:Tennant P. BeakebhiaN (eds.) Citrus II. Tree & Forestry Science & Biotechnology,3: 32-58.
Srivastava, A . K. (2010a). Development of INM to harmonizewi th improved ci trus production: Changing scenari o.Advances in Plant Physiology, 12:294-68.
Srivastava, A . K (2010b). Integrated nutrient management inci trus: Frontier developments. Indian Journal of Ferti l isers, 6:34-44.
Srivastava, A .K. (2011). Site specific potassium management forqual i ty pr oducti on of ci tr us. Kar nataka Jour nal ofAgricultural Science, 24:60-66.
Sr ivastava, A .K (2013a). Nutr ient management in Nagpurmandarin: Frontier developments. Journal of AgriculturalScience, 2:1-14.
Srivastava, A .K (2013b). Site specific nutr ient management in citrus.Journal of Agricultural Science, 2:1.
Srivastava, A .K (2013c). Recent developments in diagnosis andmanagement of nutr ient constraints in acid l ime. IndianJournal of Agricultural Sciences, 2:86-96.
Srivastava, A .K (2013d). Nutrient deficiency symptomology incitrus: An effective diagnostic tool or just an aid for post–mortem analysis. Indian Journal of Agricultural Sciences,2: 177-194.
Srivastava, A . K, Das, S. N, Malhotra S. K. and Kaushik Majumdar(2014). SSNM-based rationale of ferti l izer use in perennialcrops: A review. Indian Journal of Agricultural Sciences, 84:3-17.
Sr i vastava, A .K , H uchche A .D, Lal l an Ram and ShyamSingh(2007). Yi el d predi ct ion in i ntercropped ver susmonocropped ci trus orchards. Scientia Horticulturae, 114:67-70.
Srivastava, A.K and R.R. Kohl i (1997). Soi l suitabi li ty criteria forci trus - An appraisal. Agricultural Reviews, 18:134-46.
Srivastava, A .K and S.K. Malhotra (2014). Nutrient managementi n fr ui t cr ops : Issues and str ategi es. Ind ian Jour nalof Ferti l isers, 10:72-88.
Srivastava, A . K, Malhotra S.K and N. K. Krishna Kumar (2015).Expl oi t i ng nutr i en t-mi cr obe sy ner gy i n unl ock i ngproductivi ty potential of perennial frui ts: A review. IndianJournal of Agricultural Sciences, 85:459-81.
Srivastava, A . K and S. K Malhotra. (2017). Nutrient use efficiencyin perennial frui t crops- A review - Journal of Plant Nutri tion,40: 1928-1953.
Srivastava, A .K and E. Ngul l ie (2009). Integrated nutrientmanagement: Theory and practice. Dynamic Soi l , DynamicPlant, 3: 1-30.
Sr ivastava, A .K and Shyam Si ngh (2001a). Soi l proper ti esinfluencing yield and qual i ty of Nagpur mandarin (Citrusreticulata Blanco). Journal of Indian Society of Soi l Science,49: 226-29.
Srivastava, A .K and Shyam Singh (2001b). Soi l ferti l i ty l imit inrelation to optimum yield of Nagpur mandarin (Citrusreticulata Blanco). Journal of Indian Society of Soi l Science,49:758-62.
Srivastava, A .K and Shyam Singh(2001c). Development ofoptimum soi l property l imits in relation to frui t yield andqual i ty of (Citrus reticulate Blanco) cv. Nagpur mandarin.Tropical Agriculture, 78:174-81.
Srivastava, A .K and Shyam Singh (2002). Soi l analysis baseddiagnostic norms for Indian ci trus cultivar. Communicationsin Soi l Science and Plant Analysis, 33:1689-706.
Srivastava, A .K. and Shyam Singh (2003a). Soil-plant nutrient limitsin relation to optimum frui t yield of sweet orange (Citrussinensi s Osbeck ) cul ti var M osambi. Indian Journal ofAgricultural Sciences, 73:209-11.
Srivastava, A .K and Shyam Singh (2003b). Plant and soi l diagnosticnor ms for opti mum productivi ty of N agpur mandarin(Citrus reticulata Blanco). Ferti l izer News, 48: 47-63.
Srivastava, A .K and Shyam Singh (2004a). Zinc nutr ition, a globalconcern for sustai nable ci tr us producti on. Jour nal ofSustainable Agriculture, 25: 5-42.
Srivastava, A.K and Shyam Singh (2004b). Soi l and plant nutr itionalconstraints contributing to ci trus decl ine in Marathawadaregion, India. Communications in Soi l Science and PlantAnalysis, 35:2537-550.
Srivastava, A .K and Shyam Singh (2004c). Zinc nutri tion and citrusdecl ine – A review. Agricultural Reviews, 25:173-88.
Srivastava A .K and Shyam Singh (2005). Diagnosis of nutr ientconstraints in ci trus orchards of humid tropical India. Journalof Plant Nutri tion, 29: 1061-076.
Srivastava, A .K and Shyam Singh (2006). Biochemical markersand nutrient constraints diagnosis in ci trus: A perspective.Journal of Plant Nutri tion, 29: 827-55.

Journal of Eco-friendly Agriculture 13(2) 2018 17
A.K. Srivastava and P.S. Shirgure
Srivastava, A .K and Shyam Singh (2007). DRIS-based nutrientnorms for Nagpur mandarin (Citrus ret iculata Blanco).Indian Journal of Agricultural Sciences, 77:363-65.
Sri vastava, A .K and Shyam Singh(2008a). Ci trus nutr i ti onresearch in India: Problems and prospects. Indian Journalof Agricultural Sciences, 78:3-16.
Srivastava, A.K and Shyam Singh (2008b). DRIS norms and theirfield val i dation in Nagpur mandarin (Citrus reticulataBlanco). Journal of Plant Nutri tion, 31:1091-107.
Srivastava, A.K and Shyam Singh (2009a). Zinc nutri tion in Nagpurmandarin on haplustert. Journal of Plant Nutrition, 32: 1065-081.
Srivastava, A .K and Shyam Singh(2009b). Citrus decl ine: Soi lferti l i ty and plant nutr i tion. Journal of Plant Nutri tion, 32:197-45.
Srivastava, A .K and Shyam Singh (2015). Site-Specific nutr ientmanagement in Nagpur mandarin (Citrus reticulata Blanco)raised on contrasting soi l types. Communications in Soi lScience and Plant Analysis, 47: 447-456.
Srivastava, A .K, Shyam Singh. and L.G. Albrigo(2008). Diagnosisand r emed i ati on of nutr i ent constr ai nts i n Ci tr us.Horticulture Review, 34: 277-64.
Srivastava, A .K, Shyam Singh, Das, S.N. and Harmandeep Singh(2010). Del i neati on of producti vi ty zones in mandarinorchards using DRIS and GIS. Better Crops – South Asia, 4:13-15.
Srivastava, A .K, Shyam Singh, Diware, V.S and HaramandeepSi ngh( 2009). Si te-speci f i c nutr i ent management i n‘Mosambi’ sweet orange. Better Crops – India, 3: 10-11.
Sri vastava, A .K, Shyam Si ngh, and A .D. Huchche (2012).Evaluation of INM in ci trus (Citrus reti culata Bl anco):Biometric response, soi l carbon and nutrient dynamics.International Journal of Innovative Horticulture, 1:126-34.
Sr ivastava, A .K, Shyam Si ngh and A.D, Huchche (2015b).Evaluation of INM in ci trus on Vertic Ustochrept: Biometricresponse and soi l health. Journal of Plant Nutri tion, 38: 1-15.
Srivastava, A .K, Singh, Shyam, and R.A. Marathe (2002). Organiccitrus: Soi l ferti li ty and plant nutr ition. Journal of SustainableAgriculture, 19: 5-29.
Srivastava, A.K, Singh, Shyam and K.N. Tiwari, (2006). Site specificnutr i ent management for N agpur mandar i n (Ci tr usreticulata Blanco). Better Crops, 88: 22-25.
Srivastava, A .K, Shyam Singh. and K.N.Tiwari (2007). Diagnostictools for ci trus: Their use and impl ications in India. BetterCrops – India, 1: 26-29.
Syvertsen, J.P and M.L. Smith (1996). N itrogen uptake efficiencyand Leaching l osses from Lysimeter grown citrus treesfertil ized at three nitrogen rates. Journal of American SociteyHorticulture Scicence, 121: 57-62.
Tiwari , K. N (2002). Site specific nutr ient management for highy iel d and qual i ty of frui t cr ops. (In) Pr oceed i ngs ofWorkshop: Nutrient Status, Needs and Recommendationsfor Major Fruit Crops, pp. 105-111, Lucknow, Uttar Pradesh,India.
Velayutham, M., Pal, D.K. and T . Bhattacharya(1999). Organiccarbon stock in Soi ls of India. Global cl imatic Change andTropical Ecosystems (R. Lal, J. M. Kimble, H. Eswaran andB.A Stewart,ed.), Lewis Publ ishers, pp.71-96 Boca Raton,Florida, USA.
Zaman, Q.U. and A.W, Schumann (2006). Nutrient managementzones for ci trus based on variation in soi l properties andtree performance. Precision Agriculture, 7: 45-63.
Zekri , M. (1995). Nutri tional deficiencies in ci trus trees : nitrogen,phosphorus and potassium. Citrus Industry, 8 : 58-60.
Zekri , M., Koo, R.C.J., (1994a). Treated municipal waste water forci trus irr igation. Journal of Plant Nutri tion, 17: 693-708.
Zekri , M. And R.C.J, Koo (1994b). Appl ication of micronutrientsto ci trus trees through micro-irr igation system. Journal ofPlant Nutri tion, 15: 2517-2529.
Manuscript recived on 10.2.2018Manuscript accepted for publication on 18.4.2018

18 Journal of Eco-friendly Agriculture 13(2) 2018
Comparative response of organic, chemical and integrated mode of cultivation towards yield and sustainability of basmati rice (Oryza sativa)based cropping system
Journal of Eco-friendly Agriculture 13(2): 18-22. 2018
©2018
Comparative response of organic, chemical and integratedmode of cultivation towards yield and sustainability ofbasmati rice (Oryza sativa) based cropping systemD.K. Singh, Shilpi Gupta and Yogesh SharmaDepartment of Agronomy, Col lege of Agriculture, G.B.P.U.A.& T., Pantnagar, U.S. Nagar, Uttarakhand, IndiaEmail: [email protected]
Abstract
Among the different modes of cultivation studied, organic mode of cultivation sustained the productivity ofbasmati rice after one decade which was 52.96 per cent increased over f irst year rice grain yield (2266 kg ha-1).However, inorganic and integrated mode of cult ivation maintained more or less same yields. Bulk density of soilimproved appreciably. It decreased by 8.03 per cent over initial value after ten years of experiment (1.24 g cc-1) underorganic mode over initial (1.37 g cc-1) followed by integrated mode (1.33 g cc-1) and inorganic (1.44 g cc-1). Organicmode of cultivation was found superior in improving the organic carbon (1.15 %) status of soil followed by integratedmode (1.00%) after ten year of experimentation as compared to ini tial (0.65%). The per cent increases in organiccarbon were 76.9 and 53.8 per cent over initial, respectively with organic and integrated modes. Likewise, availabilityof ni trogen and sulphur increased to a greater extent under sole organic mode registering 58.4 and 31.1 per centincrease over initial year, respectively as compared to inorganic and integrated modes. Micronutrient status of soilafter ten years of continuous cropping system improved with organic mode of cultivation emanating 61.9, 18.7, 85.0& 295 per cent increase in availability of Zn, Cu, Fe and Mn, respectively over initial. Thus, the best alternative forsustaining the soil fertil ity in long term without compromising the productivity is to use organic manures as comparedto sole use of inorganic fertil izers.
Key words: Cropping systems, Basmati rice, Organic, Inorganic, Integrated, Soil fertil ity, System Productivity.
The increased crop output w ith the use of high amountof fertilizers and pesticides result in decreased food qualityand soil fertility, degradation of cultivated land, water andair which threatens food safety and food security (Zhoa et al.2007). Sustainability of exhaustive cropping system like rice-wheat is threatened due to indiscriminate exploitation ofnatural resources and non-judicious use of agriculturalinputs w ithout considering the carrying capacity of soil.Escalating cost of chemical fertilizers and no or less use oforganics has lead to decline in soil quality. The soils underexhaustive cropping sequence are now show ing signs offatigue and are no longer exhibiting increased productivityeven w ith increase in input use. The stagnating crop yieldshave general ly been at t ributed to decl ining nutr ientsupplying capacity of soil, imbalanced nutrition and littleand no addit ion of organic manure affect ing physico-chemical properties. The organic farming probably is seldompracticed and there is dearth of data on the comparativeyield and economics of crops w ith pure organic farmingversus intensive farming. Whatever little organic farmingthat is being practiced in India seems to be taken up mainlyas a part of contract farming. For getting optimum yields,crop p lants require balanced plant nutr it ion, throughsources, which could provide the required nutr ients in
sufficient quantities and in readily available form. This couldbe best possible through fertilizers, and hardly throughorganic sources, which not only are bulky, have extremelylow analysis and their nutrients are slow ly available top lants. For plant protect ion, the organic sources andbiological methods that have been tried so far have not metw ith considerable success in the country. However, organicmanures promotes the grow th and act iv ity of usefu lmicroorganisms in soils. Organic matter binds soil particlesinto structural units thus improves soi l st ructure andmaintains favourable cond i t ion for aerat i on andpermeability. The rate of infiltration and percolation of wateris enhanced by application of soil organic matter and alsoincreases the water holding capacity (Das et al. 2000). In thiscontext, an experiment was taken up to evaluate the organicfarming pract ices on high value cropping sequence,especially the Basmati- rice based cropping sequence. Inorganic farming systems, the nutrient needs of plants haveto be met through organic sources viz. inclusion of legumesin cropping systems, green manures (GM), farm yard manure(FYM) etc. Green manure is cheaper alternative to mountingprice of ferti lizer nitrogen and has become an effect ivetechnology in economizing the agricul ture productionsystem, ensuring productive capacity of soil without causing
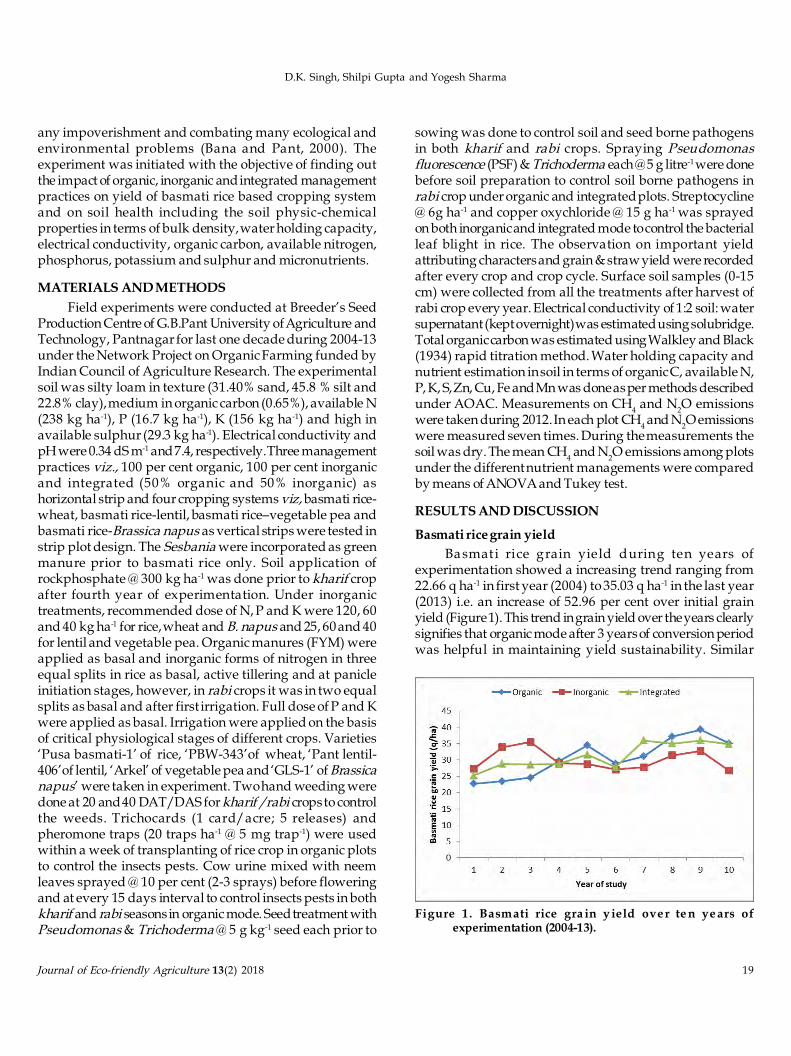
Journal of Eco-friendly Agriculture 13(2) 2018 19
D.K. Singh, Shilpi Gupta and Yogesh Sharma
any impoverishment and combating many ecological andenv i ronmental problems (Bana and Pant, 2000). Theexperiment was initiated w ith the objective of finding outthe impact of organic, inorganic and integrated managementpractices on yield of basmati rice based cropping systemand on soi l heal th includ ing the soil physic-chemicalproperties in terms of bulk density, water holding capacity,electrical conductivity, organic carbon, available nitrogen,phosphorus, potassium and sulphur and micronutrients.
M ATERIALS AND M ETHODSField experiments were conducted at Breeder’s Seed
Production Centre of G.B.Pant University of Agriculture andTechnology, Pantnagar for last one decade during 2004-13under the Network Project on Organic Farming funded byIndian Council of Agriculture Research. The experimentalsoil was silty loam in texture (31.40% sand, 45.8 % silt and22.8% clay), medium in organic carbon (0.65%), available N(238 kg ha-1), P (16.7 kg ha-1), K (156 kg ha-1) and high inavailable sulphur (29.3 kg ha-1). Electrical conductivity andpH were 0.34 dS m-1 and 7.4, respectively. Three managementpractices viz., 100 per cent organic, 100 per cent inorganicand integrated (50% organic and 50% inorganic) ashorizontal strip and four cropping systems viz, basmati rice-wheat, basmati rice-lentil, basmati rice–vegetable pea andbasmati rice-Brassica napus as vertical strips were tested instrip plot design. The Sesbania were incorporated as greenmanure pr ior to basmat i r ice only. Soil applicat ion ofrockphosphate @ 300 kg ha-1 was done prior to kharif cropaf ter fourth year of experimentation. Under inorganictreatments, recommended dose of N, P and K were 120, 60and 40 kg ha-1 for rice, wheat and B. napus and 25, 60 and 40for lentil and vegetable pea. Organic manures (FYM) wereapplied as basal and inorganic forms of nitrogen in threeequal splits in rice as basal, active tillering and at panicleinitiation stages, however, in rabi crops it was in two equalsplits as basal and after first irrigation. Full dose of P and Kwere applied as basal. Irrigation were applied on the basisof critical physiological stages of different crops. Varieties‘Pusa basmati-1’ of rice, ‘PBW-343’of wheat, ‘Pant lentil-406’of lentil, ‘Arkel’ of vegetable pea and ‘GLS-1’ of Brassicanapus’ were taken in experiment. Two hand weeding weredone at 20 and 40 DAT/ DAS for kharif / rabi crops to controlthe weeds. Trichocards (1 card/ acre; 5 releases) andpheromone traps (20 traps ha-1 @ 5 mg trap -1) were usedw ithin a week of transplanting of rice crop in organic plotsto control the insects pests. Cow urine mixed w ith neemleaves sprayed @ 10 per cent (2-3 sprays) before floweringand at every 15 days interval to control insects pests in bothkharif and rabi seasons in organic mode. Seed treatment w ithPseudomonas & Trichoderma @ 5 g kg-1 seed each prior to
sow ing was done to control soil and seed borne pathogensin both kharif and rabi crops. Spray ing Pseudomonasfluorescence (PSF) & Trichoderma each @ 5 g litre-1 were donebefore soil preparation to control soil borne pathogens inrabi crop under organic and integrated plots. Streptocycline@ 6g ha-1 and copper oxychloride @ 15 g ha-1 was sprayedon both inorganic and integrated mode to control the bacterialleaf blight in rice. The observation on important yieldattributing characters and grain & straw yield were recordedafter every crop and crop cycle. Surface soil samples (0-15cm) were collected from all the treatments after harvest ofrabi crop every year. Electrical conductivity of 1:2 soil: watersupernatant (kept overnight) was estimated using solubridge.Total organic carbon was estimated using Walkley and Black(1934) rapid titration method. Water holding capacity andnutrient estimation in soil in terms of organic C, available N,P, K, S, Zn, Cu, Fe and Mn was done as per methods describedunder AOAC. Measurements on CH4 and N2O emissionswere taken during 2012. In each plot CH4 and N2O emissionswere measured seven times. During the measurements thesoil was dry. The mean CH4 and N2O emissions among plotsunder the different nutrient managements were comparedby means of ANOVA and Tukey test.
RESULTS AND DISCUSSION
Basmati rice grain yieldBasmat i r i ce grain y ield d uring ten years of
experimentation showed a increasing trend ranging from22.66 q ha-1 in first year (2004) to 35.03 q ha-1 in the last year(2013) i.e. an increase of 52.96 per cent over initial grainyield (Figure 1). This trend in grain yield over the years clearlysignifies that organic mode after 3 years of conversion periodwas helpfu l in maintaining y ield sustainability. Similar
Fi gure 1. Basm ati r i ce grai n y i el d over ten years ofexperimentation (2004-13).

20 Journal of Eco-friendly Agriculture 13(2) 2018
Comparative response of organic, chemical and integrated mode of cultivation towards yield and sustainability of basmati rice (Oryza sativa)based cropping system
results of gradual increase in grain yield of rice w ith the useof organics over a period of time was also observed bySurekha (2007). The highest yield under organic treatmentswas mainly due to build up of organic matter, accumulationof nutrients over years and improvement in physico-chemicalproperties of soil. Similar t rend w as also reported byMankotia (2007) where higher yield of rice was obtaineddue to in si tu green manuring w ith Sesbania & w ithapplication of FYM. Though, a similar transition in grainyield was observed in the plots which received 50 per centnutrients through organic & 50 per cent through inorganicsources but the increase was not much higher as comparedto organic show ing only 38.1 per cent increase in grain yieldof basmati rice over ten years. However, 100 per cent inorganicplots showed highest grain yield of rice up to three yearsand a decreasing trend is observed in the subsequent yearsof experimentation as compared to organic and integratedmodes of cultivation.
Rice grain equivalent yield (RGEY)The average data over ten years of experimentation
regarding rice grain equivalent yield (Figure 2) revealed thathigher rice grain equivalent yield ( 44.8 q ha-1) was obtainedin integrated plots followed by inorganic plots (43.2 q ha-1)and comparably equivalent yield in organic mode (42.8 qha-1). Rice grain equivalent yield in organic mode over tenyears increased to about 59.1 per cent over init ial ascompared to inorganic mode where increase in yield was25.9 per cent over initial year. modes (193 per cent).
M ethane and ni trous oxide emissions f rom Basmati ricef ields
Neither CH4 emissions (Fig. 3) nor N2O emissions (Fig.4) di ffered significant ly between plots under inorganic,
integrated and organic nutrient management. Results alsoshow that plots which received the same amount of Nthrough different rates of organic amendments did notsignificantly differ in thei r N 2O emissions compared topurely urea fertilized plots (Fig. 4). Although CH4 emissionswere not significantly different, plots fertilized w ith organicamendments (Integrated, Organic) tended to emit less CH4compared to the plots under inorganic nutrient management(Fig. 3), which contradicts many previous studies. Overseveral seasons Wassmann et al. (1996) found that rice fields,which received 120 kg N ha-1 through rice straw (high organicinput) had higher CH4 emissions compared to the fieldswhich received the same amount of N through urea (loworganic input). Also substitution with organic amendments(Sesbania GM, 60 kg N ha-1; urea, 90 kg N ha-1) has beenshown to enhance CH 4 emissions compared to ureatreatments (150 kg N ha-1) (Wassmann et al., 2000).
Transi tion in soi l ferti l ityThe electr ical conduct ivi ty of the organic system
decreased from 0.34 dS m -1 to 0.30 dS m-1 under organic mode,however, in that of inorganic system it increased to 0.45 dSm -1. Here, w ith the increase in dose of organic manure
Figure 2. Ri ce grai n equ i val en t y i el d over ten years ofexperimentation (2004-13).
Figure 3: M ean CH4 emissions (mg m- 2 h-1) from plots underinorganic, integrated and organic nutrient management.
Figure 4: N 2O emissions (g m-2 h-1) from plots under inorganic,integrated and organic nutrient management.

Journal of Eco-friendly Agriculture 13(2) 2018 21
D.K. Singh, Shilpi Gupta and Yogesh Sharma
applied, the EC value decreased (Table 1). The lower EC valuein the organic plots may be due the increase in the WHC ofmanure treated plots due to improvement of soil aggregationthus reducing the salt concentration (Duhan and Singh,2002). I t is ev ident that bu lk density of soil improvedappreciably (it decreased by 8.03 per cent over initial value)to a great extent after ten years of experiment under organicmode (1.24 g cc-1) over initial (1.37 g cc-1) followed byintegrated mode (1.33 g cc-1) and inorganic (1.44 g cc-1). Thelowering of bulk density in organic mode plots and w ithintegrated mode may be due to higher organic carbon, morepore space and good soil aggregation. Similar results havebeen reported by Francis et al. (2006). Organic C, availablenitrogen and sulphur increased to a great extent w ith theaddition of sole organic mode as compared to inorganic andintegrated modes. Better response of sole organic mode inincreasing organic C of soil to the extent of 76.9 per cent ascompared to inorganic mode which is only 30.8 per centwas observed( Table 2). These organic sources besidesadding organic carbon itself to the soil enhance root growth,resulting in addit ion of greater root biomass and rootexudates to the soil which ultimately increases soil organiccarbon. This confirms the results reported earlier by Tripathiet al, 2007. Maximum increment in available nitrogen (58.4per cent) and sulphur (31.1 per cent) over initial after tenyears of experimentation was recorded under organic mode
as compared to integrated mode and inorganic modes. Theavailability of phosphorus remained more or less similarunder inorganic (214 per cent) and integrated modes (218per cent), however availabi l ity of phosphorus of themagnitude of 204 per cent was observed in organic mode ofcu lt ivation. L ikew ise macronutrients, avai labi l i ty ofmicronutrients viz., Fe, Cu and Zn in soil after ten years ofcont inuous crop cycles under sole organic mode ofcultivation increased to the extent of 85.0, 18.7 and 61.9 percent, respectively as compared to integrated and inorganicmodes (Table 3). However, the availability of Mn in soilhighly increased under integrated mode (398.0 per cent) ascompared to organic (295 per cent) and inorganic modes(193 per cent).
Organic farming in basmati rice based cropping systemin tarai region of Uttarakhand could have w ide range oframifications in rural development, economic sustanabilityand remunerative agriculture. Shif ting towards organicfarming in low productive areas where most of the farmersare resource poor who cannot bear heavy prices of chemicalfertilizers could sustain basmati rice productivity and soilhealth in long run.
Table 3: Changes in soi l properties over ini tial af ter tenyears of experimentation
Available Zn
(mg kg-1)
Available Cu
(mg kg-1)
Available Fe
(mg kg-1)
A vailable Mn
(mg kg-1) Value(after 10 years)
1.36 3.69 55.94 12.35 100% Organic
Per cent change
61.9 18.7 85.0 295
Value(after 10 years)
0.97 2.55 35.43 9.16 100 % Inorganic
Per cent change
15.5 -15.0 17.2 193
Value(after 10 years)
1.02 3.33 51.35 15.59 Integrated (Org. + Inorg.) Per cent
change 21.9 11.0 69.8 398
Initial 0.84 mg/ kg
3.00 mg/ kg
30.24 mg/ kg
3.13 mg/ kg
Table 1: Changes in soi l properties over ini tial af ter tenyears of experimentation
WHC (%) E.C (dS m -1)
Bulk Density (g cc-1)
Field capacity
Saturation
Value(after 10 years)
0.30 1.24 25.0 33.3 100% Organic
Per cent change -11.7 -9.5 44.5 6.1 Value(after 10 years)
0.45 1.44 14.3 29.0 100 % Inorganic
Per cent change 32.4 85.1 -17.3 -7.6 Value(after 10 years)
0.35 1.33 23.7 30.5 Integrated (Org. + Inorg.) Per cent change 2.9 -2.9 37.0 -2.9 Initial 0.34 1.37 17.3 31.4
Table 2: Changes in soil properties over ini tial af ter ten years of experimentation
Organic C (%)
Available N (kg ha-1)
Available P (kg ha-1)
Available K (kg ha-1)
Available S (kg ha-1)
Value(after 10 years) 1.15 377 50.8 244 38.4 100% Organic Per cent change 76.9 58.4 204 56.4 31.1
Value(after 10 years) 0.85 354 52.4 250 33.2 100 % Inorganic Per cent change 30.8 48.7 214 60.3 13.3 Value(after 10 years) 1.00 369 53.1 243 38.1 Integrated
(Org. + Inorg.) Per cent change 53.8 55.0 218 55.8 30.0 Initial 0.65% 238 kg/ ha 16.7 kg/ ha 156 kg/ ha 29.3 kg/ ha

22 Journal of Eco-friendly Agriculture 13(2) 2018
Comparative response of organic, chemical and integrated mode of cultivation towards yield and sustainability of basmati rice (Oryza sativa)based cropping system
AcknowledgementThe authors are highly grateful to the Di rector,
Experiment Station, G.B.Pant University of Agriculture andTechnology, Pantnagar (India) for providing necessaryfacilities. The financial assistance provided by the NetworkProject of Organic Farming funded by Indian Council ofAgriculture Research is also highly acknow ledged.
REFERENCESBana, O. P. S. and Pant, K. 2000. Green manuring for ecological ly
sound crop production. Indian Farmers Digest, 33: 19-20.Das, K; Sarkar, D and Nayak, D. C. 2000. Forms of potassium and
thei r distr ibuti on in some soi ls repr esenting r ed andlateri te ecosystem of West Bengal. Journal of PotassiumResearch, 16: 1-6.
Duhan, B. S and Singh, M. 2002. Effect of green manuring andnitrogen on yield and uptake of nutrients by r ice. Journal ofIndian Society of Soil Science, 50: 178-80.
Francis, Z; Bobbi, L. H ; Francis, J. L; Henry, J; Olaacken, O.A andBarry, M. O. 2006. Predicting phosphorus availabi li ty fromsoi l applying compost and non-compostted cattle feedlotmanure. Journal of Environmental Quali ty, 35: 928-37.
Harris,G. H; Hesterman, O.B; Paul, E. A . 1994. Fate of legumeand fer ti l izer N itr ogen -15 i n a long ter m cr oppingexperiment. Agronomy Journal, 86: 910-915.
Jamwal, J. S. 2006. Effect of integrated nutrient management inmaize (Zea mays) on succeeding w inter crops under rainfedconditions . Indian Journal of Agronomy, 51: 14-16.
Mac Rae, R. J; H i l l , S. B and Mehuys, G. R. 1993. Farm scaleagronomic and economic conversion from conventionalto sustainable agriculture. Advances in Agronomy, 43: 155-198.
Mankotia, B. S. 2007. Effect of ferti l izer appl ication w ith farmyard manure and in si tu green manures in standing r ice –wheat cropping system. Indian Journal of Agriculture Sciences,77: 512-514.
Surekha, K. 2007. N itrogen release pattern from organic sourcesof di ffer ent C: N r at ios and l igni n content and thei rcontribution to irrigated rice (Oryza sativa). Indian Journal ofAgronomy, 52: 220-224.
Tripathi, H . P; Mauriya, A . K and Kumar, A . 2007. Effect ofintegrated nutrient management on r ice- wheat croppingsystem in eastern plain zone of Uttar Pradesh. Journal ofFarming System Research & Development, 13: 198-203.
Zhao, J; Luo, Q; Deng, H and Yen, Y. 2007. Oppurtunities andchal lenges of sustainabl e agri cul ture development inChi na. Phi l osophi cal tr ansacti ons of Royal society ofLondon. B31.
Walkley, A and Black, C. A . 1934. The method for determiningsoi l organic matter and proposed modification or chromicacid ti tration method. Soil Science. 37: 28-29.
Manuscript recived on 16.3.2018Manuscript accepted for publication on 28.5.2018

Journal of Eco-friendly Agriculture 13(2) 2018 23
Akshita Banga, Anil Yadava and V. K. SahJournal of Eco-friendly Agriculture 13(2): 23-26. 2018
©2018
Agroforestry is an ideal land use option as it optimizestradeoffs between increasing food production, povertyalleviation and environmental conservation. Agriculturallands are believed to be a major potential sink and can absorblarge quanti ties of carbon, if trees are introduced andjudiciously managed with crops. From agriculture and alliedsectors huge amount of green house gases is released intothe atmosphere. Carbon is the key constituent of these gases.Locking carbon for a long period is the added advantage oftree component in the agroforestry system. Trees on the farmstore carbon in different tree components and in the soilunderneath. Introduction of t rees in the agricul turallandscapes can be a useful tool to lock up the carbon andincrease soil carbon status. The carbon storage in theagroforestry system in above/ below ground biomass andsoi l has been expected to be greater than that in aconventional agricultural operation (Paul et al., 2002; Saueret al., 2007).
Wheat is popular crop being grown in inter tree spacesof the poplar trees. Gill et al. (2009) found variable responsesamong different varieties tested in poplar based system.Chauhan et al. (2011) observed decrease in wheat grow thand yield w ith increase in poplar age. However, the loss inbiomass of under grown crop is compensated by theincreased biomass of the tree component. Nair et al. (2011)found that agroforestry system store more amount of carbonas compared to single species canopy and grazing systems.Due to fall of considerable amount of leaves from the treespecies, the soil properties get benefitted. Gupta and Sharma(2008) found that soil physical properties such as porosity,
Effect of poplar clones and wheat varieties on biomassaccumulation, soil carbon storage and nutrient status underagroforestry systemAkshita Banga, Anil Yadava and V.K. SahAgroforestry Research Unit of G.B.P.U.A. & T., Pantnagar, UttarakhandEmail: [email protected]
A BSTRACT
Field experiments conducted at Agroforestry research unit of G.B.P.U.A. & T., Pantnagar, Uttarakhand duringrabi seasons of 2013-14 and 2014-15 to study the eff ect of DBW-17, PBW-502, UP-2748 and HD-2967 varieti es ofwheat in association with S7C8, G-48, W-39 and Kranti poplar clones on biomass accumulation, soil properties andcarbon stock revealed that the wheat varieties HD-2967 and DBW-17 produced at par but significantly higher totalbiomass than UP-2748 and PBW-502. Poplar clone S7C8 (4.25 t ha-1) in 2013-14 Krant i (12.28 t ha-1) in 2014-15recorded the highest total tree biomass. Soil properties viz., organic carbon, bulk density and total soil carbon stockwere the maximum with the clone Kranti. Wheat varieties failed to affect soil properties and carbon stock significantly.The available soil nitrogen was significantly higher with clone Kranti, while soil available phosphorus and potassiumremain unaffected by the poplar clones.
Key words: Agroforestry, poplar clones, wheat v arieties, biomass accumulation, soil organic carbon, bulk density,available NPK, soil carbon storage
density and water holding capacity and chemical propertiessuch as pH, availability of nutrients, soil organic carbon etc.improved significantly under poplar plantation comparedto sole cropping of wheat. Arora et al. (2014) reported thatthe soil carbon stock increases w ith age of Populus deltoides(1-11 yrs) from 61.2 - 66.8 Mg ha-1 and decreases w ith soildepth.
Therefore, the present study envisaged to quantify thebiomass production of crop and tree components and carbonsequestration potentials in soil under varying wheat varietiesand poplar clones.
M ATERIALS AND M ETHODSField experiments were conducted for two years at
Agroforestry research center of G. B. Pant University ofAgriculture and Technology, Pantnagar, Uttarakhand (29°NLatitude, 79° 30’ E longitude and at an altitude of 243.84 mabove mean sea level) commencing from rabi season of 2013-14. The soil texture of study site was sandy loam rich inorganic carbon (1.175%). The available nitrogen, phosphorusand potassium contents of soil were, respectively, 260, 20and 190 kg ha-1. The site is characterized by a humid sub-tropical, cold and hot dry summers w ith 1400 mm meanannual rainfall, of which 80 to 90% is received between Juneand September. The remaining 10 to 20% rainfall is receivedduring wheat-growing season (November to April).
The experiment was conducted in split plot design w ithtree species in main plots and varieties in sub-plots andtreatments, replicated thrice. Four clones of poplar viz., S7C8,G-48, W-39 and Kranti were planted in 2012 at spacing of

24 Journal of Eco-friendly Agriculture 13(2) 2018
Effect of poplar clones and wheat varieties on biomass accumulation, soil carbon storage and nutrient status under agroforestry system
7.0 m x 3.0 m. Four wheat varieties (DBW- 17, PBW-502, UP-2748 and HD-2967) were sown at a 20 cm rows apart onboth sides of the tree line using 100 kg seed ha-1. The wheatwas supplied w ith 120:60:40 kg N- P2O5- K2O ha-1. The halfdose of N and full dose of P and K were applied as basal. Theremaining nitrogen in equal splits was applied after crownroot initiation stage and pre-heading stage, respectively. Threeirrigations were applied to the crop coinciding w ith crownroot initiation (21 days after sow ing), late jointing (65 DAS)and milking stage (105 DAS) during both the years. For weedcontrol, Clodinafop + MSM @ 150 g ha-1 was applied in 5th
week after sow ing.Intercrop dry biomass was estimated in 1.0m × 1.0m
quadrate. The tree stem biomass was calculated by theequation developed by Arora et al. (2014) for tarai region. Thebiomass of tree branches and leaves was done by oven dryingthe samples. The below ground biomass of t rees w ascalculated by using the guidelines of IPCC (1996). The averageroot: shoot ration for poplar tree has been reported as 1:0.21.The soil bulk density and nutrient analysis was done usingthe standard procedures. The soil organic stock (t ha-1) wasdetermined using the follow ing formula given by Joa et al.(2001)
Soil organic carbon stock (t ha-1) = Soil organic carbon(%) x depth (cm) x bulk density (g cm -3).
Data w ere analyzed by using standard statisticalprocedure for split-split plot design (Panse, and Sukhatme,1967) with the help of OPstat statistical package.
RESULTS AND DISCUSSION
Intercrop and tree biomass accumulationCarbon stock is di rect ly related to the biomass
accumu lat i on. Wheat total biom ass d id not d i f f ersignif icant ly under di f ferent poplar clones (Table 1).However, it was the maximum under the clone S7C8 in 2013-14 and clone Kranti in 2014-15. Higher wheat biomass maybe attributed to improved soil conditions (Table 2) underthese clones. During both the years, wheat total biomass didnot vary significantly between HD-2967 and DBW-17 butwas numerically higher than other varieties. Improved soilorganic carbon ow ing to addition of higher tree biomassmight have helped these varieties to gain more biomass.
The poplar tree total biomass differed significantly onlyat harvest of wheat crop second year (Table 1). During 2013-14 poplar clone S7C8
produced the maximum tree totalbiomass. At termination of the investigation, poplar cloneKranti recorded significantly the highest tree biomass (24.55t ha-1). Among remaining clone it was in the order of W-39(20.95 t ha-1) >S7C8 (20.93 t ha-1)>G-48 (20.13 t ha-1). Spanos(2006) found higher biomass in new ly developed clones and
the lowest in the local poplar clone É-214. The variablepotential of different poplar clones to accumulate biomassmay be ascribed to their genetic potential and are in linew ith Mishra et al. (2010).
Organic carbon content in soi lThe organic carbon content of top 0-15 cm soil layer
was higher than the lower layer (15-30 cm). The increase incarbon content of top layer might be due to incorporation ofleaves and small tw igs into the soil. The increase in the soilorganic carbon stocks at the surface soil layer was attributedto greater carbon input from litter fall, dead roots and rootexudates (Ralhan et al., 1996; Chauhan et al., 2009).
At harvest of second year wheat i.e. termination of thestudy, the organic carbon content in top 0-15 cm soil layervaried significantly among the clones (Table 2). Among theclones Kranti, W-39 and S7C8, the organic carbon content didnot d i f fer signi f i cant ly , but clone K rant i record edsignificantly higher organic carbon content than clone G-48. Variation in soi l organic carbon may be ascribed tovariable biomass addition by different clones (Table 1). Atthis stage wheat verities differed non-significantly for soilorganic carbon content and the order of organic carbon wasHD-2967>DBW-17>UP-2748>PB-502.
The organic carbon content below layer (15-30 cm), didnot exhibit much changes unlike top 0-15 cm layer. At harvestof second year wheat crop, clone W-39 had the maximumorganic carbon content (1.048%) while the lowest was notedw ith clone G-48 (1.042%). Due to wheat varieties the organiccarbon content remained unaffected significantly. In 2014-15, variety DBW-17 showed superiority over other varietiesfor organic carbon content.
Bulk density of soi lAt completion of the study, the bulk density of soil (0-
15 cm) was not affected significantly due to various clonesof poplar (Table 2). At harvest of the second year wheat, itwas the lowest under clone Kranti (1.385 g cm -3) and thehighest under clone G-48 (1.431 g cm -3). The order of BDvalue was G-48>W-39>S7C8> Kranti. Reduction in bulkdensity was due to addition of organic matter in the form oflit ter in the surface layer. Bulk densi ty decreased w ithincrease in soil organic carbon. Such inverse relationship ofthe bulk density and soil organic carbon (%) has also beenreported by Gupta and Sharma (2008) and Singh et al. (2004).
Wheat varieties failed to cause significant variation inthe bulk density values (Table 2). At harvest of second yearwheat, the maximum bulk density was noted w ith varietyPBW-502 and the lowest w ith variety HD-2967. Variety DBW-17 recorded the next lowest bulk density. Bulk density of the15-30 cm of soil layer was not influenced by poplar clone as

Journal of Eco-friendly Agriculture 13(2) 2018 25
Akshita Banga, Anil Yadava and V. K. Sah
well as wheat varieties (Table 4.31). The bulk density washigher in the lower layer compared to upper layer. Thevariation in bulk density was not appreciable among theclones as well as wheat varieties.
Soi l carbon stockAt harvest of wheat 2014-15, the values for soil carbon
stock in top layer were almost comparable among the clonesand clone Kranti recorded the highest value of 25.94 t ha-1. Insecond layer also same clone resulted in the highest soilcarbon stock. The total soil carbon stock differed significantlyamong the clones and clone Kranti sequestered the highestC-stock (49.63 t ha›1). Among other clones, the order was W-39>S7C8>G-48, respectively being 49.33, 48.19, 48.01 t ha-1.
The total soil organic carbon stock (SOC) was observed todecrease w ith increasing the soil depth and the upper soillayer (i.e., up to 15cm) showed the maximum and higher soilorganic carbon stock as compared to lower soil depth (15-30cm) under all the poplar clones. These results are w ellsupported by the findings of Smith and Heath (2002) andSharma (2004). The lower values of soil carbon stock may berelated to the fact that most of the changes in soil carbon andBD occurred in the top layer ow ing to addition of leaf androot biomass.
Inclusion of dif ferent wheat verities did not causesignificant variation in C sequestration. At harvest of secondyear wheat crop the highest values for total C stock werenoted with variety HD-2967 and the lowest w ith variety PBW-502.
Soil avai lable N P KAt harvest of the wheat crop, only available nitrogen
was influenced significantly due to various clones of poplar(Table 3). Among different clones of poplar, clone Krantirecorded the maximum available nitrogen (275 kg ha-1)followed by S7C8 (274 kg ha-1). Both these clones recordedsignificantly higher N than clone G-48. The more additionof leaf litter favours the higher nutrient status of the soil(Shehnaz, 2014). Similar findings were also observed bySingh and Sharma (2007). Variations in available nitrogenamong different clones of P. deltoids ow ing to their variablegenetic potentials w ith respect to litter fall have also beenreported by Mishra et al. (2010). Wheat variety HD-2967recorded the highest available nitrogen (274 kg ha-1), whichwas followed by the variety DBW-17. The lowest and similaravailable N was noted with varieties PBW-502 and UP-2748.
The order of available phosphorus in different clones
Table 1. Intercrop and poplar tree total biomass at harvestof wheat crop as influenced by poplar clones andwheat varieties at end of study.
Total wheat bi omass (t ha-1)
Total tree biomass (t ha-1)
Treatment
2013-14 2014-15 2013-14 2014-15 Poplar cl one
S7C8 8.99 8.25 4.25 10.30 G-48 8.62 8.20 3.60 10.23 W-39 8.66 8.15 3.47 10.47 Kranti 8.86 8.39 3.87 12.28
SEm+ 0.20 0.01 0.29 0.22 CD 5% NS NS NS 0.78 Wheat variety
DBW-17 9.13 8.49 3.96 11.05 PBW-502 8.52 8.09 3.71 10.43 UP-2748 8.42 7.83 3.72 11.00 HD-2967 9.05 8.59 3.80 10.81
SEm+ 0.15 0.10 0.08 0.18 CD 5% 0.45 0.30 NS NS
Table 2. Organic carbon content and bulk density and total soil carbon stock as influenced by poplar clones and wheatvarieties at end of study (2014-15).
Soi l organi c carbon (%) Bul k densi ty (g cm -3) Soi l carbon stock (t ha-1) Treatment 0-15 cm 15-30 cm 0-15 cm 15-30 cm 0-15 cm 15-30 cm Total
Poplar cl one S7C8 1.216 1.047 1.358 1.501 24.73 23.53 48.19 G-48 1.183 1.042 1.388 1.507 24.61 23.53 48.01 W-39 1.250 1.048 1.368 1.508 25.65 23.70 49.33 Kranti 1.280 1.046 1.351 1.500 25.94 24.51 49.63
SEm+ 0.019 0.012 0.019 0.015 0.43 0.47 0.32 CD 5% 0.068 NS NS NS NS NS 1.13 Wheat vari ety
DBW-17 1.238 1.048 1.363 1.507 25.29 24.68 48.92 PBW-502 1.210 1.044 1.377 1.508 24.99 23.60 48.74 UP-2748 1.222 1.044 1.366 1.506 25.02 23.58 48.53 HD-2967 1.258 1.046 1.358 1.495 25.64 23.42 48.98
SEm+ 0.013 0.006 0.008 0.021 0.33 0.32 0.38 CD 5% NS NS NS NS NS NS NS
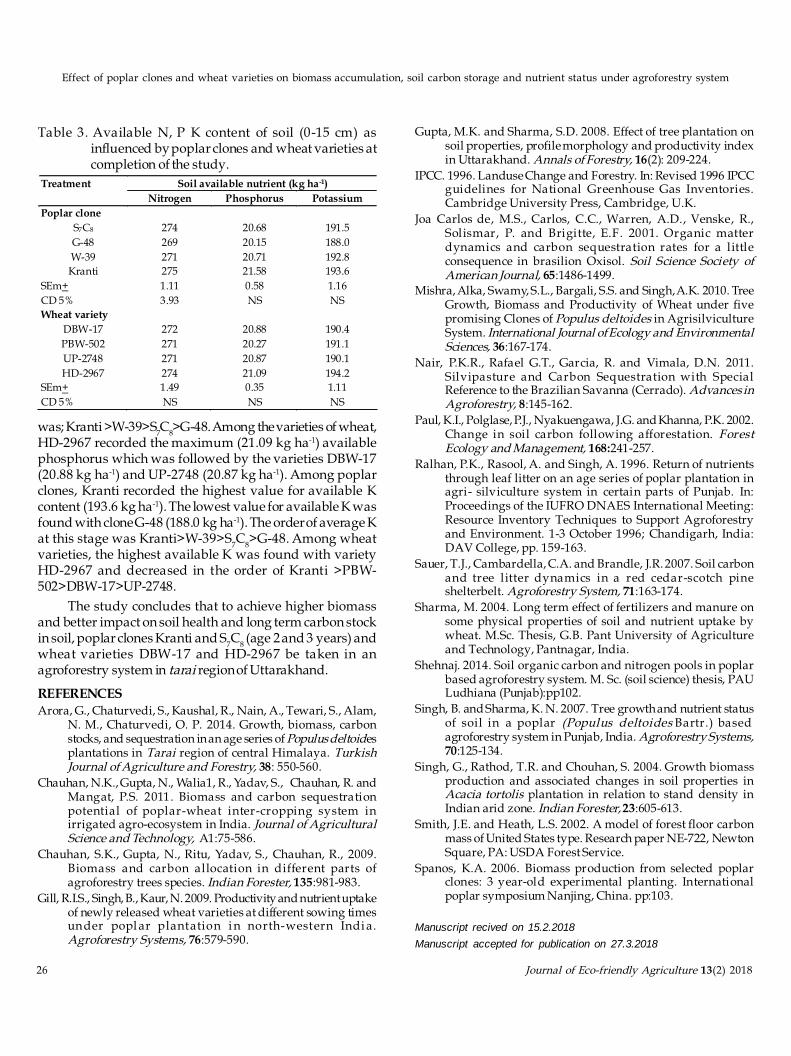
26 Journal of Eco-friendly Agriculture 13(2) 2018
Effect of poplar clones and wheat varieties on biomass accumulation, soil carbon storage and nutrient status under agroforestry system
was; Kranti >W-39>S7C8>G-48. Among the varieties of wheat,HD-2967 recorded the maximum (21.09 kg ha-1) availablephosphorus which was followed by the varieties DBW-17(20.88 kg ha-1) and UP-2748 (20.87 kg ha-1). Among poplarclones, Kranti recorded the highest value for available Kcontent (193.6 kg ha-1). The lowest value for available K wasfound w ith clone G-48 (188.0 kg ha-1). The order of average Kat this stage was Kranti>W-39>S7C8>G-48. Among wheatvarieties, the highest available K was found w ith varietyHD-2967 and decreased in the order of Krant i >PBW-502>DBW-17>UP-2748.
The study concludes that to achieve higher biomassand better impact on soil health and long term carbon stockin soil, poplar clones Kranti and S7C8 (age 2 and 3 years) andwheat varieties DBW-17 and HD-2967 be taken in anagroforestry system in tarai region of Uttarakhand.
REFERENCESArora, G., Chaturvedi, S., Kaushal, R., Nain, A ., Tewari , S., A lam,
N. M., Chaturvedi, O. P. 2014. Growth, biomass, carbonstocks, and sequestration in an age series of Populus deltoidesplantations in Tarai region of central H imalaya. TurkishJournal of Agriculture and Forestry, 38: 550-560.
Chauhan, N.K., Gupta, N., Walia1, R., Yadav, S., Chauhan, R. andMangat, P.S. 2011. Biomass and car bon sequestrati onpotenti al of popl ar -wheat i nter -cr oppi ng system i nirr igated agro-ecosystem in India. Journal of AgriculturalScience and Technology, A1:75-586.
Chauhan, S.K., Gupta, N., Ritu, Yadav, S., Chauhan, R., 2009.Biomass and car bon al locati on i n d i f fer ent par ts ofagroforestry trees species. Indian Forester, 135:981-983.
Gill, R.I.S., Singh, B., Kaur, N . 2009. Productivity and nutrient uptakeof newly released wheat varieties at di fferent sowing timesunder popl ar p l ant at i on i n nor th-w est er n Ind i a.Agroforestry Systems, 76:579-590.
Gupta, M.K. and Sharma, S.D. 2008. Effect of tree plantation onsoi l properties, profi le morphology and productivi ty indexin Uttarakhand. Annals of Forestry, 16(2): 209-224.
IPCC. 1996. Landuse Change and Forestry. In: Revised 1996 IPCCgui del i nes for Nati onal Gr eenhouse Gas Inventori es.Cambridge Universi ty Press, Cambridge, U.K.
Joa Carlos de, M.S., Carlos, C.C., War ren, A .D., Venske, R.,Sol ismar , P. and Bri gi t te, E.F. 2001. Or gani c matterdynami cs and carbon sequestrat ion r ates for a l i t tl econsequence in brasi l ion Oxisol. Soil Science Soci ety ofAmerican Journal, 65:1486-1499.
Mishra, Alka, Swamy, S.L., Bargali , S.S. and Singh, A.K. 2010. TreeGrowth, Biomass and Productivi ty of Wheat under fivepromising Clones of Populus deltoides in Agrisi lvicultureSystem. International Journal of Ecology and EnvironmentalSciences, 36:167-174.
Nair, P.K.R., Rafael G.T., Gar cia, R. and Vimala, D.N. 2011.Si l v ipastur e and Car bon Sequestrat ion w i th SpecialReference to the Brazi lian Savanna (Cerrado). Advances inAgroforestry, 8:145-162.
Paul, K.I., Polglase, P.J., Nyakuengawa, J.G. and Khanna, P.K. 2002.Change i n soi l carbon fol l ow ing affor estat ion. For estEcology and Management, 168:241-257.
Ralhan, P.K., Rasool, A . and Singh, A . 1996. Return of nutr ientsthrough leaf l i tter on an age series of poplar plantation inagri - si lv iculture system in certai n parts of Punjab. In:Proceedings of the IUFRO DNAES International Meeting:Resource Inventory Techniques to Support Agroforestryand Environment. 1-3 October 1996; Chandigarh, India:DAV Col lege, pp. 159-163.
Sauer, T.J., Cambardel la, C.A . and Brandle, J.R. 2007. Soi l carbonand tr ee l i t ter dynami cs i n a r ed cedar -scotch pi neshelterbelt. Agroforestry System, 71:163-174.
Sharma, M. 2004. Long term effect of ferti l izers and manure onsome physical properties of soi l and nutrient uptake bywheat. M.Sc. Thesis, G.B. Pant Universi ty of Agricultureand Technology, Pantnagar, India.
Shehnaj. 2014. Soi l organic carbon and nitrogen pools in poplarbased agroforestry system. M. Sc. (soi l science) thesis, PAULudhiana (Punjab):pp102.
Singh, B. and Sharma, K. N. 2007. Tree growth and nutrient statusof soi l i n a popl ar (Popul us deltoi des Bartr .)-basedagroforestry system in Punjab, India. Agroforestry Systems,70:125-134.
Singh, G., Rathod, T.R. and Chouhan, S. 2004. Growth biomassproduction and associated changes in soi l properties inAcacia tortol is plantation in relation to stand density inIndian arid zone. Indian Forester, 23:605-613.
Smith, J.E. and Heath, L.S. 2002. A model of forest floor carbonmass of United States type. Research paper NE-722, NewtonSquare, PA: USDA Forest Service.
Spanos, K.A . 2006. Biomass pr oduction from selected poplarclones: 3 year-ol d exper imental planti ng. Internati onalpoplar symposium Nanjing, China. pp:103.
Manuscript recived on 15.2.2018Manuscript accepted for publication on 27.3.2018
Table 3. A vailable N , P K content of soil (0-15 cm) asinfluenced by poplar clones and wheat varieties atcompletion of the study.
Soi l avai lable nutri ent (k g ha-1) Treatment Nitrogen Phosphorus Potassium
Poplar cl one S7C8 274 20.68 191.5 G-48 269 20.15 188.0 W-39 271 20.71 192.8 Kranti 275 21.58 193.6
SEm+ 1.11 0.58 1.16 CD 5% 3.93 NS NS Wheat variety
DBW-17 272 20.88 190.4 PBW-502 271 20.27 191.1 UP-2748 271 20.87 190.1 HD-2967 274 21.09 194.2
SEm+ 1.49 0.35 1.11 CD 5% NS NS NS

Journal of Eco-friendly Agriculture 13(2) 2018 27
Gopal Rathor, S. K. Sharma, Neelam Chopra and Bhupendra H. BhargavaJournal of Eco-friendly Agriculture 13(2): 27-30. 2018
©2018
Phosphorus is a second most important nutrient in soilfor crop production and there is no large atmospheric sourcewhich can be made biologically available [1]. The main roleof P to plant is root development, stalk and stem strength,flower and seed formation, crop maturity and production. Ithas a deferent role in plant metabolism such as cell division,development, photosynthesis, breakdown of sugar, nucleartransport w ithin the plant, transfer the genetic characteristicsfrom one generation to another and regulation of metabolicpathway. The phosphorous content in average soil is about0.05% (w / w) but only 0.1 per cent of the total phosphorousis available to plant because of fixation and poor solubilit insoil [2]. The phosphorus available for plant grow th dependsnot only on the total amount of phosphorus in the soil butalso on its solubility. Large amount of P applied as fertilizer(DAP, SSP, DSP and TSP etc) enters in to the immobile poolsthrough precipitation reaction w ith highly reactive Al3+ andFe3+ in acidic, and Ca2+ in calcareous or normal soils [3,4].M icroorganisms w ith phosphate solubil izing potentialincrease the availability of soluble phosphate and enhancethe plant grow th by improving biological fixation [5,6]. Somebacterial species have solubilization and mineralizationpotential for inorganic and organic phosphorus, respectively[7]. Application of PSB w ill help in reduced the conception ofP fertilizer and also reduced the cast of cultivation of farmers.
M ATERIAL AND M ETHODSThe experiment was conducted at farmer ’s field during
kharif season of the year 2016. The geographical location ofthe site is situated between 22°09’40.77" N and 76°042 42.46E w ith an altitude of 641 m above the mean sea level. The
Phosphorus management in maize using PSB (Phosphorussolubilising bacteria) in VertisolGopal Rathor1*, S.K. Sharma2, Neelam Chopra3 and Bhupendra H. Bhargava1,4 SRGBN College, Sanawad, Khargone (M.P.) India.2Depart. of Soi l Sci. and Agricultural Chem., Collage of Agriculture, Indore (M.P.) India.3Department of Chemistry, Government BHEL College, Bhopal (M.P.) India.Email: [email protected] Author Address: Polygon Agro India Pvt. Ltd., Sanawad, Khargone (M.P.) India-44111
Abstract
The field experiment conducted at farmer field during kharif season with deferent treatment of phosphorussolubilising bacteria combination of deferent fertil izers showed that the application of PSB with phosphoric fertil izergave higher effects on growth and yield of maize. PSB increased the solubility of phosphate in soil and enhanced theplant growth by improving biological fixation. Application of PSB helped in reducing 30-40 per cent consumption ofP fertil izer, control soil and water pollution and also balance the physical, biological and chemical soil fertil ity.
Keyword: Phosphorous, PSB, fertil izer, biofertil izer, vertisol
average annual rainfall is nearly 910 mm. The soil of theexperimental area was classified as typic Haplustert subgroup of “vertisol”. The soil of the area has medium depth,black colour and clay loam texture and sandy clay loam intexture, alkaline in reaction.
The experiment consisted of eight treatments viz., T-1Control, T-2 PSB, T-3 NK (100%), T-4 NK (100%) + PSB, T-5NK (100%) + 50% P (SSP), T-6 NK (100%) +50% P (SSP) +PSB, T-7 NPK (100%), and T-8 NPK (100%) + PSB were testedin RBD (randomized block design) w ith three replications.The entire field was divided into micro plots of equal size (2m x 1.5 m) and all the treatments were randomly allocated todifferent plots in each replication. Sow ing of hybrid maize(Pioneer 30V92) was done uniformly in all the plots with at45 cm row to row and 30 cm plant to plant spacing manuallyon 30/ 06/ 2016. Recommended fertilizer dose 120-60-40 kgN, P2O5, K2O per hectare was applied through Urea, SSP andMOP (KCl) respectively, Recommended PSB dose 8 kg ha-1
were applied. Application of ‘N’ in three split doses - 60kgas basal, 30 kg at knee high stage and 30 kg at floweringstage. FYM @ 1 t ha-1 uniform to all plots i.e. 300 g FYMplot-1 as basal. The crop was harvested at 105 days. Afterharvesting the crop, plant samples (grain and shoot) werecollected and successively dried at 70 °C to a constant weight.
Soil sample was collected from experimental field forpre physicochemical parameter and available phosphorousanalysis. Samples were completely air-dried and passedthrough 2 mm sieve and stored in properly labeled in plasticbags for pre analysis.

28 Journal of Eco-friendly Agriculture 13(2) 2018
Phosphorus management in maize using PSB (Phosphorus solubilising bacteria) in Vertisol
Freshly prepared bio-fertilizer of PSB w ith (Lignitebased) was purchased at BPD unit, JNKVV (JawaharlalNehru Krashi Vishvavidhalaya), Jabalpur (M. P.).
The soil pH and EC was determined in 1:2.5, soil: watersuspension [5]. Organic matter was determined by w etoxidation method [9]. Cation exchange capacity (CEC) wascalculated by the summation of exchangeable acidity andbases [10]. The available P of soi l w as analyzed w ithsodiumbicarbonate method [11]. Total phosphorus of root andshoot of maize was measured by digestion method [12].
RESULTS AND DISCUSSIONA perusal of the data presented in the Figure- 2 and 3
ind icated that biomass yield (grain and stover) w eresignificantly affected by the application PSB w ith deferentcombination of fertilizers. The soil treated w ith PSB (no anyfertilizer) recorded highest grain and stover yield (3.97 tha-1 and 5.41 t ha-1) as compared to the control (3.12 t ha-1
and 5.26 t ha-1), which was 27 and 3 per cent more over thecontrol (Fig-1). Many researchers who applied phosphorussolubilizing bacteria (PSB) with NPK fertilizers in wheat crop
Figure 1: Increased yield (%) of grain over control (maize)
Figure 2: Biomass of grain (maize)
Figure 3: Biomass of stover (maize)
Figure 4: Total P content of grain (maize)
Figure 5: Total P content of stover (maize)
and reported that yield was 2.63 t ha-1 in control, 3.41 t ha-1
with NPK only and the highest (3.80 t ha-1) w ith NPK+PSB[13]. There was no difference in the agronomic parameters ofT-4 (NK 100% + PSB) and T-5 (NK 100% + 50% P) (Plate-7)similar to T-6 (NK 100% + 50% P + PSB) and T-7 (NPK 100%)treated plant (Fig- 2,3,4 and 5). The phosphate solubilizingpotential is increase with application of PSB [6]. Biomass yieldand agronomic parameters of maize grown in w ithout PSB
t ha-1
t ha-1

Journal of Eco-friendly Agriculture 13(2) 2018 29
Gopal Rathor, S. K. Sharma, Neelam Chopra and Bhupendra H. Bhargava
treatments were significantly lower than treated of soil withPSB. Higher crop yields result from solubilization of fixedsoi l P and applied phosphates by PSB [14,15]. There w asdecreased grain yield and size of cobs in plots which notreated w ith PSB. The highest straw yield was obtained w ithphosphate solubilizing bacteria [16]. The conjunction of PSBw ith single super phosphate and rock phosphate reducesthe P dose by 25 and 50 per cent, respectively [17]. The Pcontent was increased w ith application of PSB both grainand stover compeer to control (Fig-4 and 5). Phosphoruscontent was significantly increased of cot ton plant w ithBacillusmeliloti combined w ith phosphorus as compared to
uninoculated plants grow ing in the control soil [18]. Similarfindings about the increase in P-uptake by wheat plant dueto PSB inoculation was reported [19].
The study concludes that the application of PSB w ithphosphoric fertilizer gave higher effects on grow th and yieldof maize. It increased the solubility of phosphate in soil,enhanced plant grow th by improving biological fixation,helped in reducing the consumption of P fertilizer as also asthe cost of cultivation. On environmental point of view, itcontrols soil and water pollution and also balances thephysical, biological and chemical soil fertility.
REFERENCESEzawa, T., Smith, S. E. and Smith, F. A . 2002. P metabol ism and
transport in AM fungi. Plant Soil , 244: 221-230.Il lmer, P. A. and Schinner, F. 1995. Solubilization of inorganic calcium
phosphates solubi l ization mechanisms. Soil Biology andBiochemistry, 27: 257-263.
Gyaneshwar, P., Kumar, G. N., Parekh, L. J. and Poole, P. S. 2002.Role of soi l microorganisms in improving P nutri tion ofplants. Plant Soil , 245: 83-93.
Hao, X., Cho, C. M., Racz, G. J. and Chang, C. 2002. Chemicalretardation of phosphate diffusion in an acid soi l as affectedby l iming. Natural Cycle and Agroecosystem, 64: 213-224.
Kucey, R. M. N., Janzen, H. H. and Legget, M. E. 1989. Microbialmed i ated i ncr eases i n pl ant avai l abl e phosphor us.Advantage of Agronomy, 42: 199 – 228.
Ponmurugan, P. and Gopi, C. 2006. Distr ibution pattern andscreening of phosphate solubil izing bacteria isolated fromdifferent food and forage crops. Journal of Agronomy, 5:600-604.
Khiari , L. and Parent, L. E. 2005. Phosphorus transformations inacid l ight-textured soi ls treated w ith dry sw ine manure.Canadian Journal of Soi l Science, 85: 75-87.
Jackson, M. L. 1973. Soi l Chemical Analysis, Prentice Hal l of IndiaPvt. Ltd. pp: 25-214.
Walkley, A . and Black, C. A . 1934. An examination of di fferentmethods for determi ning soi l or gani c matter and aproposed mod i fi cati on of the chr omi c aci d t i tr at ionmethod. Soil Science, 37: 29-38.
Chapman, H. D. 1965. Cation-exchange capacity. In: C.A . Black(ed .), M ethods of soi l anal ysi s - Chemi cal andmicrobiological properties, Agronomy, 9: 891-901.
Olsen, S. R., Cale, C. V. Watanabe, F. S. and Dean, L. A . 1954.Estimation of avai lable phosphorus in soi l by extractionw i th sod i um bi car bonate, Cir cul ar No. 939. USDAWashington, DC, USA.
Page, A . L. 1982. Methods of soi l analysis, in: Chemical andMicrobiological Properties, Soi l Science Society of AmericaJournal, Madison, Wisconsin, USA. pp. 304-305.
Tomar, U. S., Tomar I. S. and Badaya, A . K. 1998. Response ofchemical and bioferti l izer on some matric trai ts in wheat,
Plate 1: Comparison between T-6 (NPK 100%), T-7(NK 100%+50%P +PSB), T-5 (NK 100% +50%)
Table 1: Physicochemical parameter of experimental soilParameter Value pH 7.72 EC dms 0.92 Organic Carbon (%) 0.60 Available Phosphorus (kg/ ha) 12.6 Cation exchange capacity (CEC) (cmol (p+)/ kg) 43.3

30 Journal of Eco-friendly Agriculture 13(2) 2018
Phosphorus management in maize using PSB (Phosphorus solubilising bacteria) in Vertisol
Crop Research H issar, New Delhi. 16: 408-410.Zaidi, A ., Khan, M. S. and Amil , M. 2003. Interactive effect of
rhizotrophic microorganisms on yield and nutrient uptakeof chickpea (Cicer ari eti num L .). European Journal ofAgronomy, 19: 15-21.
Mohammadi, K. 2011. Soil , plant and microbe interaction. LambertAcademic Publ ication, pp-120.
Saad, O. A . O. and Hammad, A . M. M. 1998. Ferti l izing wheatpl ants w i th r ock phosphate combined w ith phosphatedissolving bacteria and V.A– mycorrhizae as alternate forca–superphosphate, Annals Agriculture Science Cairo, 43:445-460.
Sundara, B., Natarajan, V. and Hari , K . 2002. Influence ofphosphorus solubi l izing bacteria on the changes in soi lavai lable phosphorus and sugarcane yields. Field CropsResearch, 77: 43-49.
Egamberdiyeva, D., Juraeva, Poberejskaya, D. S., Myachina,Teryuhova, O. P., Seydal ieva, L. and A l iev, A . 2004. Proc.Inst. Microbiol. Tashkent, Uzekistan.
Mukherjee, P. K. and Rai, R. K. 1999. Sensitivi ty of P uptake tochange in root growth and soi l volume as influenced byVAM, PSB and P levels in wheat and chickpeas. Annals ofAgriculture Research, 20: 528-530.
Manuscript recived on 10.12.2017Manuscript accepted for publication on 13.3.2018

Journal of Eco-friendly Agriculture 13(2) 2018 31
Basavaraj Shellikeri, K. V. Malshe and N. V. MhaskarJournal of Eco-friendly Agriculture 13(2): 31-34. 2018
©2018
Colocasia (Colocasia esculenta L. Schott) also knownas ‘edode’ or ‘arvi’ is a tropical tuber crop belonging to themonocotyledonous family ‘Araceae’ of the order Arales,whose members are known as ‘aroids’ (Henry, 2001 andVan Wyk, 2005). I t is the most ancient comp lex ofdomesticated plants, comprising of nearly 110 genera andmore than 2000 species. Colocasia is believed to haveoriginated in South Central Asia, perhaps in Eastern Indiaor Malaysia (Sturlevant, 1919; Onwueme, 1978 and Watt,1989). Depending on the manner of corm development,colocasia is grouped into tw o varietal types. These areColocasia esculenta var. esculenta (bunda type) which producesa large edible corm w ith few cormels and Colocasia esculentavar. antiquorum (edode type) which has a small or medium-sized corm w ith a large number of edible cormels and isprevalent in India. The ‘Edode’ type is commonly called‘Arvi’ and ‘Bunda’ type as ‘Dasheen’. Edode type is mostprevalent as vegetable.
Colocasia is well adapted to shade and can w ithstanddrought to a great extent. The tuber crop is found to thrivewell in acidic as well as alkaline soils as leafy vegetableunder Konkan during kharif season. It is a rich source ofstarch and reasonably good source of major components ofthe diet viz., proteins, minerals and vitamins. All parts of theplant including corm, cormels, rhizome, stalk, leaves andflowers are edible and contain abundant starch (Bose et al.,2003).
Growth performance and herbage yield of different colocasia(Colocasia esculenta L.) genotypes under Konkan climaticconditionsBasavaraj Shellikeri*, K.V. Malshe and N.V. MhaskarDr. Balasaheb Sawant Konkan Krishi Vidyapeeth, Dapol i, Ratnagir i-415712, Maharashtra, IndiaEmail- [email protected]
A BSTRACT
The growth and herbage yield performance of sixteen colocasia (Colocasia esculenta L.) genotypes was evaluatedat Central Experiment Stat ion, Wakawal i duri ng kharif season of the year, 2016. The genotypes exhibit ed highlysignificant variation for all the growth characters except days to first leaf emergence. The variation studied indicatedthat the growth characters, viz, the plant height (60.34 cm) and petiole length (57.55 cm) were recorded maximum inAC-20 genotype. The genotype Sree Pallavi showed maximum leaf length (55.86 cm), leaf breadth (42.50 cm) andpetiole girth (7.13 cm). Whereas, leaf thickness, leaf area and number of leaves per plant were significantly higher inMahim (0.538 mm), Khed Shiravali (747.29 cm2) and M-9-111 (17.47 plant -1) genotypes, respectively. The genotype M-9111 found to be the best genotypes for herbage yield in terms of per plant (276.93 g), per plot (2.49 kg) and per ha(10.26 ton) followed by Sanjivini and Sree Pallavi. Whereas, Devakibai Walanga produced lowest herbage yield perplant (158.57 g), per plot (1.43 kg) and per ha (5.87 ton).
Key words: Colocasia, Growth parameters, Herbage yield
However, so far not much work towards developmentof high yielding sutiable types has been done in this cropexcept few attempts of germplasm collection and theirevaluation. Hence, it was felt necessary to undertake wellplanned research work to evaluate suitable genotypes ofcolocasia for grow th performance and herbage yield underhot and humid climate of konkan region.M ATERIALS AND M ETHODS
The experiment was carried out during the period ofJune to November, 2016 (Kharif season crop) at CentralExperiment Station, Wakawali that falls under tropicalhumid zone receiving an average rainfall of 3000 mm andsituated at an altitude of 242 m above MSL. The geographicalsituation is 170 48’ N latitude and 730 78’ E longitude. Theexperiment was laid out in Randomized Block Design w ith16 treatments (genotypes) in 3 rep lications. Each plot,measured in 1.35 × 1.8 m, consisted of three rows w ith 3plants per row. Accordingly, 9 plants spaced at 60 × 45 cmapart, were accommodated per plot. Observations wererecorded from f ive randomly selected plants in eachtreatment and rep lication and their mean values wereworked out. Observations on morphological characters wererecorded at 15, 30, 45, 60 and 75 days after planting exceptdays to 1st leaf emergence. Cumulative herbage yield wasrecorded from 45, 60 and 75 days after planting observation.The data was statistically analyzed for the evaluation ofgenotypes of colocasia as a leafy vegetable as per the methodsprescribed by Panse and Sukhatme (1985).

32 Journal of Eco-friendly Agriculture 13(2) 2018
Growth performance and herbage yield of different colocasia (Colocasia esculenta L.) genotypes under Konkan climatic conditions
RESULTS AND DISCUSSIONThe data on grow th performance of different colocasia
genotypes presented in Table 1 show no significant differenceamong different colocasia genotypes for days to first leafemergence. The first leaf emergence was observed in the rangeof 7.53 to 8.73 days after planting. The time of emergence(sprouting) of new shoots or leaves depends on the dormancystatus of the planting material. The plant develops leaves byusing preserve carbohydrates in seed corms. The similarsprouting phenomenon was reviewed by Ravi et al. (2011) inelephant foot yam.
The significant variation in plant height, leaf thickness,leaf area, leaf size and number of leaves was observed amongdifferent colocasia genotypes (Table 1). The plant grow th ofcolocasia was superior in AC-20 (G14) genotype which wasclosely follow ed by Sanjivani (G1). Mahim found to besuperior for leaf thickness (0.538 mm). The variation in leafthickness can be attributed to genetic variation in differentgenotypes and environmental effects. The thickness of leavesincreased w ith crop grow th. The variations in plant heightand leaf thickness of different taro collections were alsoreported by Angami et al. (2015) and Bassey et al. (2016).
The leaf area was maximum in Khed Shiravali genotype(747.29 cm2) and least was in M-12-429. The leaf area mightbe interrelated to leaf shape, size and number of leaves. The
variation in leaf area might be attr ibuted to the plantarchitecture which is decided by the genetic makeup ofrespect ive genotypes and i t s in teract ion w i th t heenvironment. The total number of leaves production upto 75DAP (Cumulative) indicates that the maximum number ofleaves (17.47 leaves) were produced in M-9-111 (G10) followedby Sanjivini (G1) and Sree Pallavi. Leaves play a vital role inthe production of carbohydrates through the process ofphotosynthesis and ultimately increase the vigour of plant.As a leafy vegetable, it is the key feature of the herbage yieldin colocasia. The variations in number of leaves plant -1 ind i fferent colocasia genotypes w ere also reported byChoudhary et al. (2011), Paul and Bari. (2011) and Sibyala(2013).
The genotype Sree Pallavi exhibited the longest leaflength in its grow ing period. While NDB-9 had the shortestleaf length. Highest leaf breadth (42.50 cm) was observed ingenotype Sree Pallavi and it was at par w ith DevakibaiWalang (40.13 cm). The minimum leaf breadth (31.52 cm)was recorded by Kelva genotype. Similar observations weremade by Chadha et al. (2007), in different colocasia genotypesand they reported that the variability in leaf breadth amongthe genotypes might be due to genetic variation. Further,attaining higher leaf length/ w idth is a good indicator as theleaf area of colocasia p lants has important role on theinterception of solar radiation and on biomass production
Table 1.
FLE-first leaf emergence, PH-Plant height, CNL-Cumulative number of leaves, LT-Leaf thickness, LA- Leaf area, LL-Leaf length, LB-Leafbredth, PL-Petiole length, PB-Petiole breadth.
Genotypes FLE (DAP)
PH (cm)
LT (mm)
LA (cm2)
CNL (plant-1)
LL (cm)
LB (cm)
PL (cm)
PB (cm)
G1 Sanjiv ini 8.07 59.03 0.511 481.76 16.00 48.15 35.35 55.14 6.10 G2 NDB-9 8.13 53.85 0.515 483.36 14.13 43.03 33.05 50.60 4.84 G3 M-12-429 8.67 50.85 0.493 464.06 14.00 46.88 35.35 47.88 6.53 G4 Mahim 8.47 47.77 0.538 612.35 14.07 50.87 38.59 46.88 6.02 G5 Devkibai Walanga 8.73 50.97 0.513 640.93 13.00 45.12 40.13 52.93 5.49 G6 Sawantwadi 8.07 46.89 0.515 649.13 13.27 43.74 37.32 45.25 5.53 G7 Muktakeshi 8.47 47.70 0.495 602.28 12.73 49.20 32.79 53.23 5.26 G8 Kelva 7.93 52.22 0.473 577.57 13.20 51.14 31.52 52.62 5.86 G9 BCC -11 7.53 45.82 0.503 681.14 13.07 40.03 34.02 46.26 5.59 G10 M-9-111 8.20 53.13 0.517 482.03 17.47 54.06 32.08 50.53 5.40 G11 Sree Pallavi 8.20 53.45 0.499 739.72 15.13 55.86 42.50 54.14 7.13 G12 Khed Shiravali 8.00 46.37 0.515 747.29 12.93 49.80 37.59 43.14 5.46 G13 Talsure 8.27 49.25 0.525 715.37 13.33 47.09 34.80 53.40 6.91 G14 AC -20 8.47 60.34 0.493 480.30 13.13 51.01 37.03 57.55 6.19 G15 NDB-22 8.33 58.28 0.497 482.17 13.87 47.78 37.06 56.07 5.50 G16 Khopoli 8.33 46.13 0.484 611.04 12.27 45.84 34.82 45.85 5.62
Range 7.53 to 8.73 -------- ------- ---------- -------- ---------- ------- -------- ------ M ean 8.24 51.38 0.505 590.66 13.96 48.10 35.87 50.72 5.84 SEm (±) 0.25 0.31 0.004 7.63 0.70 1.37 1.19 0.82 0.18 CD at 5% NS 0.9 0.010 22.02 2.02 3.94 3.44 2.36 0.53

Journal of Eco-friendly Agriculture 13(2) 2018 33
Basavaraj Shellikeri, K. V. Malshe and N. V. Mhaskar
(Bernardes et al. 2011). The genotype Sree Pallavi consistentlyproduced maximum length and breadth of the leaves.
The pet iole length and girth of different colocasiagenotypes also varied significantly. The highest petiolelength (57.55 cm) was recorded in genotype AC-20 and itwas at par w ith NDB-22 (56.07 cm). Whereas, the lowestpetiole length (43.14 cm) was recorded by Khed Shiravaligenotype. The reason for high petiole length in certaincolocasia genotypes may be attributed to phenotypicalcharacters of that particular genotype. The petiole length incolocasia is also associated w ith plant height. Maximumpetiole girth (7.13 cm) was recorded in Sree Pallavi. Whereas,minimum petiole length (4.84 cm) was recorded by NDB-9.
The data on yield of herbage in different colocasiagenotypes are presented in Table 2. The genotype M-9-111exhibited the highest (276.93 g) cumulative herbage yieldplant-1. While Devakibai Walang had the lowest (158.57 g)cumulative herabge yield plant -1. The genotype M-9-111recorded highest herbage yield (2.49 kg plot -1) and the lowestherbage yield plot -1 (1.43 kg) was recorded in DevkibaiWalanga (G5) and Muktakeshi (G7). The genotype M-9-111recorded the highest herbage yield hectare-1 (10.26 t ha-1)followed by Sanijivini (9.43 t ha-1) and Sree Pallavi (8.77 t ha-
1). The lowest herbage yield (5.87 t ha-1) was recorded inDevkibai Walanga followed by Muktakeshi (5.88 t ha-1),
respectively. The variation in the herbage yield might beattributed to the vegetative grow th (foliage) in different
colocasia genotypes and it is a peculiar character especiallyin tuber crop. Chauhan (2016) observed the variation in theherbage yield of indigenous genotypes of water spinach.
It is concluded that the colocasia genotypes viz., M-9-111, Sree Pallavi and Sanjivini performes best in terms ofgrow th parameter, herbage yield and its attributes. All theseparameters of genotypes should be tested for two to threeseasons for val id conclusion. These genotypes can berecommended for commercial cultivation as a leafy vegetableduring kharif in the Konkan region.
REFERENCESAngami, T., Jha, A . K., Buragohain, J., Deka, B. C., Verma, V. K.
and Nath, A . 2015. Evaluation of Taro (Colocasia esculenta.L) cultivars for growth, yield and qual i ty attr ibutes. Journalof Horticulture Science, 10: 183-189.
Bassey, E. E., Umoh, G. S., Ndeayo, N. U., Nneke, N. E. andAkpan, G. U. 2016. Investigations into taro [Col ocasiaesculenta (L.) Schott] leaf blight outbreak and identi ficationof r esistant cult i vars i n A kw a Ibom State, N i geri a.International Journal of Currant Research Biosciences PlantBiology, 3: 137-143.
Bernardes, C. O., Camila, A . S. M., Flávio, S.L., Maria, J.R.R. andTal i ta, M.T.X. 2011. Leaf area, leaf area index and l ightextinction coefficient for taro culture. Encyclopedia Biosfera,Centro Científico Conhecer-Goiania, 7: 1-9.
Bose, T. K, Kabir, J, Maity, T.K. Parthasarathy, V.A . and Som,M.G. 2003. Vegetable crops, vol 2. Naya Udyog Publishers,Kolkata. pp: 413–442.
Chadha, M. L., Kuo, G. and Gowda, C.L.L. 2007. Comparativestudies on mor phological characters, yiel d, nutr i tionalstatus and isozymes activi ty of some el i te genotypes oftaro [Colocasia esculenta (L.) Schott var. Antiquorum] grownin West Bengal. Acta Horticulture, 752: 219-224.
Chauhan, H. 2016. Collection, evaluation and ccharacterization ofindigenous genotypes of water spinach. Thesis submittedto Indira Gandhi Krishi Vishwavidyalaya, Raipur.
Choudhary, V. K., Kumar, P. S., George, J., Kanwat, M. andSaw anan, R. 2011. Genetic vari abi l i ty and char acterassociation in taro (Colocasia esculenta (L.) Schott) under mid-hi l ls of Arunachal Pradeh. Journal of Root Crops, 37: 155-161.
Henry, R. J. 2001. Plant genotyping: The DNA fingerprinting ofplants. CAB Publishing, Southern Cross University, Australia.
Onwueme, I. C. 1978. The tropical tuber crops: yams, cassava,sweet potato, cocoyams. John Wiley and Sons, New York.
Panse, V.G. and Sukhatme, P.V. (Revised by Sukhatme, P.V. andAmble, V.N.) 1985. Statistical methods for agricultural workers.ICAR, New Delhi. 187-202.
Paul, K. K. and Bari , M. A . 2011. Accession characterization andgenetic variabi li ty studies in [Colocaisa esculenta (L). Schott].Bangaladesh Journal of Scienti fic and Industr ial Research,46: 235-242.
Table 2. Herbage yield of different colocasia genotypes
Genotypes CHY plant-1 (g)
CHY plot-1 (k g)
CHY ha-1 (ton)
G1 Sanjivini 254.63 2.29 9.43 G2 NDB-9 204.65 1.84 7.58 G3 M-12-429 201.37 1.81 7.46 G4 Mahim 210.08 1.89 7.78
G5 Devkibai Walanga 158.57 1.43 5.87
G6 Sawantwadi 161.98 1.46 6.00 G7 Muktakeshi 158.65 1.43 5.88 G8 Kelva 163.06 1.47 6.04 G9 BCC -11 182.59 1.64 6.76 G10 M-9-111 276.93 2.49 10.26 G11 Sree Pallavi 236.82 2.13 8.77 G12 Khed Shiravali 185.61 1.67 6.87 G13 Talsure 189.75 1.71 7.03 G14 AC -20 187.53 1.69 6.95 G15 NDB-22 194.79 1.75 7.21 G16 Khopoli 182.39 1.64 6.76
M ean 196.84 1.77 7.29 SEm (±) 4.61 0.04 0.17 CD at 5% 13.31 0.12 0.49
CHY denotes cumulative hertage yield

34 Journal of Eco-friendly Agriculture 13(2) 2018
Growth performance and herbage yield of different colocasia (Colocasia esculenta L.) genotypes under Konkan climatic conditions
Plucknett, D. L., De la Pena, R. S. and Obero, F. 1970. Taro (Colocasiaesculenta). A Review of Field Crop Abstract, 23: 413-426.
Rav i , V., Rav i nd r an, C. S., Suja, G., Jam es Geor ge,Nedunchezhiyan, M., Byju, G. and Naskar, S. K. 2011. Cropphysi ol ogy of el ephant foot yam [(A mor phophal l uspoeoni i fol ius (Dennst. N icolson)]. Advances in HorticulturalScience, 25: 51-63.
Sibyala, S. 2013. Thesis ti tle-Studied the performance of sixteendifferent taro [Colocasia esculenta (L.) Schott] cultivars forgr owth, y iel d and qual i ty par ameters. Department ofVegetable Sci ence, Hort iculture Col lege and Resear chInsti tute, Dr. Y.S.R. Horticultural Universi ty.
Sturlevant, E.L. 1919. Note on edible plants. Res. N.Y. AgricultureExpteriment Station, 69: 185-186.
Van Wyk, B. E. 2005. Food plants of the world: Identi fication,cul inary uses and nutri tional value. Briza Publ ications,Pretoria, South A frica.
Watt, G. 1989. Dictionary of the economic plants of India. Supt.Govt. Printing, Calcutta, 2: 509-513.
Manuscript recived on 11.1.2018Manuscript accepted for publication on 13.3.2018

Journal of Eco-friendly Agriculture 13(2) 2018 35
S.P. Singh and S.K. SinghJournal of Eco-friendly Agriculture 13(2): 35-38. 2018
©2018
Nigella (Nigella sativa L.) is an important minor seedspices crop commercially cultivated in Punjab, Bihar, WestBengal and Assam. It is cal led Karunjrangan, Kalonji,Mangarail, Kalonkir also. Nigella is an annual herbaceousseed spices crop belonging to the family Ranunculaceae. Theseeds are known as black cumin. Mature seeds are consumedfor edible and medicinal purpose. The seeds of nigella areused in seasoning of vegetables, legumes, pickles anddifferent type of backed products (Atta, 2003 and Datta et al.,2012). The essential oil of nigella have been found to containabout 67 constituents, many of which are capable of inducingbeneficial pharmalogical effects in humans (Aboutable et al.1986). The black cumin is extensively used in traditionalmed icines f or heal i ng v arious r espi ratory andgastrointestinal diseases in the various countries. The wholeseed and their extracts have anti diabetic, anti inflammatory,anti microbial, anti tumor. Its seeds contain thymoquinone,and monoterpene having variety of therapeutic effects ondigestive disorder gynecological disease and respiratorysystem (Baskkbady and shahabi, 1997). Nigellone and non-carboxyl fractions are reported to protect guinea pigs againsthistamine-induced broncho-spasm. Phenolic fractions obtainfr om seeds has been report ed ant i -bact er ial . Theunderstanding of association of characters is of primeimportance in developing an efficient breeding programme.The co-rel at ion stud ies prov ide in format ion aboutassociation between any two characters. The path co-efficientanalysis provides the portioning of co-relation co-efficientinto direct and indirect effects giving the relative importance
Interrelationships between yield and yield components innigella (Nigella sativa L.)S.P. Singh and S.K. SinghDepartment of Horticulture, Tirut Col lege of Agriculture, Dhol i (Dr. RPCAU, Pusa, Bihar), Muzzaffarnagar-843121 (Bihar)E-mail: [email protected]
Abstract
The experiment was carried out at experimental farm of Department of Horticulture, T.C.A., Dholi, Muzaffarpur(Bihar) under AICRP on spices during 2016-17. Genotypic and phenotypic correlation and path coefficient analysiswere carr ied out in nigell a using sixteen diverse genotypes for t en quantitative characters. Analysis of variancerevealed highly signi ficant differences in genotypes for all the characters under study. In general, magnitudes ofgenotypic correlation coefficients were higher than their corresponding phenotypic correlation coeff icient, suggestinga strong inherent relationship in different pairs of characters. Grain yield plant -1 had positive and highly significantcor relat i on w i th plant height , number of f r ui t s plant –1, l ength of f r ui t , number of pr imary branchesplant -1, number of grains fruit -1 and days to maturity. Thi s indicated that these characters could be considered ascriteria for selecting high yielding genotypes of nigella.
Keyword: Nigella, correlation and path coefficient analysis.
of each of the casual factors. The present study wasundertaken in order to find out the interrelationship amongdifferent characters and the direct and indirect contributionsof these characters towards yield.
M ATERIAL AND M ETHODSThe experiment was carried out at experimental field
of Department of Horticulture, Tirhut College of Agriculture,Dhol i , Muzaffarpur during 2016-17 under Al l Ind iaCoordinated Research Project of Spices to evaluate sixteen(16) diverse genotypes of nigella germplasm. The experimentwas laid out in Randomized Block Design (RBD) w ith threereplications. The experiment was sown on 30th October, 2016in net plot size of 3.0 m x 1.0 m accommodating ten lines of30 cm apart w ith 10 cm plant to plant spacing maintained.Observations were recorded from ten randomly selectedplants to each genotypes in each replication for ten charactersviz; plant height (cm), number of primary branches plant -1,number of secondary branches plant-1, days to 50 per centflowering, length of fruit (cm), days to maturity, number offruits plant -1, number of seeds fruit-1 and grain yield plant -1.All the recommended agronomical package and practiceswere performed to get the healthy crop stand. Mean valuesof ten plants were used for statistical analysis. For estimationof the genotypic and phenotypic correlation coefficient forall possible combination, the formula used suggested byJohnson et al. (1995) and Hanson et al. (1956). Path coefficientanalysis was done follow ing by the formula of Dewey andLu (1959). Details of genotypes are given in table-1.

36 Journal of Eco-friendly Agriculture 13(2) 2018
Interrelationships between yield and yield components in nigella (Nigella sativa L.)
RESULTS AND DISCUSSIONThe genotypic and phenotypic correlation among the
yield and yield components in nigella are presented in table-2. In general, the estimates of genotypic correlation coefficientwere higher than their corresponding phonotypic ones,
suggesting strong inherent association among the charactersstudied. In the present investigat ion, seed y ield waspositively correlated w ith number of fruits plant -1, length offruit, number of primary branches plant-1, number of grainsfruit -1 and days to maturi ty. Therefore, these charactersshould be considered while making select ion for yieldimprovement in nigella. These results are in accordance w iththe results of Garg et al. (2003) and Bardideh et al. (2013) forplant height and number of branches plant -1, Singh andMittal (2002) and Salmati and Bagheri(2014) for plant heightand seeds umbel -1 in fennel and Yadav et al. (2013) alsoreported number of branches plant -1, number of umbelsplant-1, number of umbellets umble-1 and weight of grainumbel -1 exhibited positive and significant correlation w ithseed yield in fennel. Significant correlation coefficient ofcharacters suggested that there is much scope for direct andindirect selection for further improvement.
Positive and significant correlation w ith seed yieldplant-1 was found with height of the plant, number of primarybranches plant-1, number of secondary branches plant -1,length of fruit, w idth of fruit, number of fruits plant -1 andnumber of grain frui t -1 and thus, these characters areconsidered as main components for seed yield plant-1. Theresults are in agreement w ith the findings of Jindal & Allah-Rang (1986).
Name of genotypes Source of genotypes Coll ecti on year RN-1 Samastipur, Bihar 1994 RN-2 Samastipur, Bihar 1994 RN-3 Samastipur, Bihar 1994 RN-4 Muzaffarpur, Bihar 1995 RN-5 Muzaffarpur, Bihar 1996 RN-6 Vaishali, Bihar 1996 RN-7 Samastipur, Bihar 1997 RN-8 Vaishali, Bihar 1997 RN-9 Muzaffarpur, Bihar 1997 RN-10 East Champaran, Bihar 1998 RN-11 East Champaran, Bihar 1998 RN-12 West Champaran, Bihar 1999 RN-13 Begusarai, Bihar 1999 RN-14 Aurangabad, Bihar 2000 RN-15 Samastipur, Bihar 2000
Rajendra Shyama (Check) Release variety
Table 1: Name, source and collection year of the nigellagenotypes.
Table 2: Genotypic and phenotypic correlation coefficient for ten quantitative characters in nigella.Characters Height of
the plant (cm)
No. of primary branches (pl ant-1)
No. of secondary branches (plant-1)
No. of days to 50%
f loweri ng
Length of frui t (cm)
Width of f ru it (cm)
Days to maturi ty (No. of days)
No. of f ru its
(pl ant -1)
No. of grains (fruit -1)
Yiel d i n g
(pl ant -1)
G 1.000 0.551** 0.543** -0.184 0.943** 0.575** 0.271 0.641** 0.656** 0.621** Height of the plant P 1.000 0.307 0.349* -0.049 0.396* 0.438 0.091 0.225 0.461** 0.478** G 1.000 0.992** -0.066 0.903** -0.077 0.482** 0.752** 0.526** 0.934** No. of primary
branches per plant P 1.000 0.518** -0.045 0.459** 0.093 0.232 0.457** 0.263 0.521** G 1.000 0.214 0.944** 0.026 0.572** 0.956** 0.211 0.759** No. of secondary
branches per plant P 1.000 0.033 0.502** 0.352* 0.356* 0.598** 0.183 0.398* G 1.000 0.327 0.143 0.917** 0.362* -0.279 -0.234 No. of days to 50%
flowering P 1.000 0.042 0.210 0.461** 0.103 -0.201 -0.046 G 1.000 0.669** 0.428* 0.904** 0.493** 0.852** Length of fruit (cm) P 1.000 0.199 0.323 0.576** 0.304 0.446* G 1.000 0.225 0.176 0.848** 0.304 Width of fruit (cm) P 1.000 0.062 0.003 0.440* 0.197 G 1.000 0.558** 0.053 0.259 Days to maturity P 1.000 0.368* 0.024 0.124 G 1.000 0.259 0.649** No. of fruits per plant P 1.000 0.161 0.428 G 1.000 0.624** No. of grains per fruit P 1.000 0.481** G 1.000 Yield per plant (g) P 1.000
*and ** indicate significant of values at p=0.05 and 0.01, respectively.

Journal of Eco-friendly Agriculture 13(2) 2018 37
S.P. Singh and S.K. Singh
The results on path coefficient analysis (direct andindirect effects) as presented in table-3 revealed that numberof grain fruit-1 had highest positive and direct effect (0.5294)on yield plant -1 followed by number of primary branchesplant -1 (0.4133), number of secondary branches p lant -1
(0.2790), number of days to 50 per cent flowering (0.2366),height of the plant (0.2318), length of fruit (0.2042) andnumber of fruits plant -1 (0.1511) indicating that if otherfactors are held constant, an increase in these charactersindividually w ill reflect in the increased seed yield, whichindicating these are the main contributor to grain yield plant-
1, days to maturity (-0.3307) had highest negative effect ongrain yield plant -1 followed by w idth of fruit (-0.1974) atgenotypic level as presented in table-3. Number of grainsfruit -1 (0.3074) had highest positive and direct effect on grainyield plant -1 followed by number of primary branchesplant-1 (0.2872), number of fruits plant-1 (0.1796), number ofdays to 50% flowering (0.0796), length of fruits (0.0681),height of the p lant (0.0133) and number of secondarybranches plant-1 (0.0038) including that if other factors areheld constant, an increased yield whereas, w idth of fruit(-0.0917) had highest negative direct effect on grain yieldplant-1 followed by days to maturity (-0.0915) at phenotypiclevel. This findings are in agreement w ith Agnihotri et al.(1977) for seed yield plant-1 and umbel per plant and Yadav
et al. (2013) reported days to maturity had highest directeffect on seed yield followed by days to 50 per cent floweringand number of umbels plant-1 in fennel. Number of grainsplant-1 had highest positive correlation w ith seed yield plant-
1 via indirect effect of w idth of fruit. Similarly, number ofpr imary branches p lant -1, w hich had highest posit ivecorrelation with grain seed yield plant -1 also had next highestpositive direct path. The value of residual effect (G-0.7181 &P = 0.4336) indicated that there may be some other secondarycomponents that should not be ignore.
In the light of the above finding, it may be concludedthat improvements in the characters like- plant height, umberof primary branches plant -1, number of secondary branchesplant-1, number of days to 50 per cent flowering, length offruit, w idth of fruit, number of fruits plant -1 and number ofgrains fruit -1 w ill help in improving the seed yield in nigellaboth direct and indirect. Therefore, these characters shouldbe considered for yield improvement in nigella breedingprogramme.
ACKNOWLEDGEM ENTThe authors are thankful to the Project Coordinator,
All India Coordinated Research Project on Spices, Calicut,Kerala for financial support and important guideline.
Table 3: Genotypic and phenotypic direct and indirect effect of different characters on seed yield plant-1 in nigella.
G- R. source- 0.4843, residual effect= 0.7181; P- R. source- 0.8120, residual effect= 0.4336
Characters H eight of the plant
(cm)
No. of primary branches (plant -1)
No. of secondary branches (plant -1)
No. of days to 50%
fl oweri ng
Length of frui t (cm)
Width of f ru it (cm)
Days to maturi ty (No. of days)
N o. of f ruits
(pl ant-1)
No. of grains (f ruit -1)
Yiel d (pl ant-1)
(g)
P 0.0133 0.0711 0.0807 -0.0114 0.0918 0.1016 0.0212 0.0523 0.1070 0.4781 Height of the plant G 0.2318 0.0073 0.0072 -0.0025 0.0147 0.0077 0.0036 0.0085 0.0087 0.6215 P 0.0881 0.2872 0.1488 -0.0132 0.1320 0.0269 0.0668 0.1315 0.0756 0.5212 No. of primary
branches per plant G 0.2276 0.4133 0.4512 -0.0272 0.4145 -0.0319 0.1993 0.3108 0.2173 0.9349 P 0.0013 0.0020 0.0038 0.001 0.0019 0.0001 0.0013 0.0023 0.0007 0.3980 No. of secondary
branches per plant G 0.1515 0.3046 0.2790 0.0598 0.2911 0.0074 0.1595 0.2945 0.0590 0.7593 P -0.0039 -0.0037 0.0027 0.0796 0.0034 0.0168 0.0367 0.0082 -0.0160 -0.0468 No. of days to 50%
flowering G -0.0436 -0.0156 0.0507 0.2366 0.0773 0.0339 0.2406 0.0859 -0.0662 -0.2341 P 0.0270 0.0313 0.0342 0.0029 0.0681 0.0136 0.0220 0.0392 0.0207 0.4463 Length of fruit (cm) G 0.2253 0.2048 0.2131 0.0667 0.2042 0.1367 0.0875 0.1847 0.1006 0.8522 P -0.0402 -0.0086 -0.0032 -0.0193 -0.0183 -0.0917 -0.0057 -0.0003 -0.0404 0.1974 Width of fruit (cm) G -0.1135 0.0152 -0.0052 -0.0283 -0.1322 -0.1974 -0.0445 -0.0349 -0.1675 0.3041 P -0.0084 -0.213 -0.0326 -0.0422 -0.0296 -0.057 -0.0915 -0.0337 -0.0022 0.1244 Days to maturity G -0.0896 -0.1595 -0.1890 -0.3363 -0.1417 -0.0746 -0.3307 -0.1847 -0.0178 0.2595 P 0.0405 0.0822 0.1074 0.0186 0.1035 0.0005 0.0662 0.1796 0.0290 0.4287 No. of fruits per plant G -0.0968 -0.1136 -0.1595 -0.0549 -0.1367 -0.0267 -0.0844 0.1511 -0.0387 0.6491 P 0.1419 0.0809 0.0564 -0.0619 0.0936 0.1353 0.0074 0.0496 0.3074 0.4818 No. of grains per fruit G 0.3473 0.2783 0.1119 -0.1480 0.2609 0.4491 0.0285 0.1355 0.5294 0.6248

38 Journal of Eco-friendly Agriculture 13(2) 2018
Interrelationships between yield and yield components in nigella (Nigella sativa L.)
REFERENCESAboutable, E.A ; EL-Ezzouny and Homerschmidt, F.J. (1986).
Aroma volati les of nigel la sativa seeds in Proc. Progress inessential oi l research. Inter Sumpo. Esse. Oi l spp: 44-45;Holzminden, Neuhaus, Gewrmany, 1 April , 1986.
Agnihotr i , P. (1977). Genetic divergence in germplasm of fennel(Foeniculum vulgare Mil l .) M.Sc. (Agri .). Thesis, RajasthanAgricultural Universi ty, Jobner.
A tta, M.B. (2003). Some characteristics of nigel la (Nigella sativa L.)seed cultivated in Egypt and its lipid profile. Food Chemistry,83: 63-8.
Bardideh, K., Kahrizi , D. and Ghobadi, E.M. (2013). Characterassociation and path analysis of black cumin (Nigella sativaL.) genotypes under di fferent i rr igation regimes. NotulaeScientia Biologicae, 5: 104-108.
Boskkbacy, M.H. and Shahabi (1997). Bronchodi latatory andanthichol inergic effect of nigel la sativa on isolated guineapig fracheal chains. Iranian Journal of Medical Sciences, 22:133-6.
Datta, K.A ., Saha, A., Bhattacharya, A ., Mandal, A ., Paul, R. andSengupta, S. (2012). Black cumin ( N igel la sativa L.) – AReview. Journal of Plant Development and Science, 4: 1-43.
Dewey, D.R. and Lu, K.H. (1959). A correlation and path coefficientanalysis of field components of crested wheat grass seedproduction. Agronomy Journal, 51: 515-518.
Garg, V.K., Shukla, Sudhir and Singh, P.K. (2003). Genetic associationin fennel grown on sol ic soi l . Journal of Spices and AromaticCrops, 12:171-173.
H anson, G.H ., Robi nson, H.F. and Comstock , R.E. (1956).Biometrical studies on yield and segregating populationof Korean Lespedeza. Agronomy Journal, 48: 268-271.
Jonshon, H .W., Robinson, H.F. and Comstock, R.E. (1955).Esti mation of genetic and envir onment var iabi l i ty insoybean. Agronomy Journal, 47: 314-318.
Jindal, L.N. and A l lah-Rang (1986). Variabi l i ty and associationanalysis in fennel. Res. Dev. Rep., 3:50-54.
Salmati, S. M. and Bagheri , M. (2014). The study of the relationshipbetween seed yield and yield components on Nigella sativagenotypes. Research on Crop Ecophysiology, 9: 97-103.
Singh, Y. and Mittal , P. (2002). Studies on variabi l i ty, heritabi li tyand scope of improvement in fennel (Foeniculum vulgareMil l). Bioved, 13: 7-9.
Yadav, P.S., Pandey, V.P. and Yadav, Y. (2013). Variabil i ty studiesin fennel (Foeniculum vulgare Mi l l ). Journal of Spices andAromatic Crops, 22: 203-208.
Manuscript recived on 16.2.2018Manuscript accepted for publication on 19.4.2018

Journal of Eco-friendly Agriculture 13(2) 2018 39
R.K. Rai and Rajendra KumarJournal of Eco-friendly Agriculture 13(2): 39-43. 2018
©2018
Global horticultural industry has grown several-foldin the last 50 years. Current world frui ts production isestimated at 676.9 million tonnes, while vegetable productionis estimated at 879.2 million tonnes. Horticulture industry isf lour ishing and opening up new prospects R& D andemployment emerging from awareness about present life styleand dietary habits. The Asia- Pacificregion accounts fornearly 60 percent of the total area under production, w ithChina and India dominating this space. The challenges ofovercoming mall nutrition to majority of global populationare yet to be fulfilled. Hence, there is need to increase andsustain production and productivity. Horticulture sector hasbeen the mainstay of Indian agriculture w ith a contributionof about 30 percent to the agricultural GDP from about 14percent area and 40 percent of total export earnings fromagriculture as a whole. At present, area under horticulturalcrops is 23.69 million hectare w ith production of 283.47million tones in India, the second largest producer of fruitsand vegetables w ith the claim of largest producer of mango,banana, cucurbits, cauliflower, coconut, cashew, papaya andpomegranate and the largest producer and exporter of spices.Vegetables plays a crucial role in Indian agriculture as it isessential, not only to meet the food and nutritional securityto the people and provide livelihood and income in the ruralareas, but also to meet the export demand and requirementof raw material/ inputs for the processing industries in thedom est i c f r ont . The d iv ersi f ied cl i mat i c and soi l
Marketing strategies for vegetable cropsR.K. Rai and Rajendra KumarU.P. Counci l of Agricultural Research, 8th Floor, KisanMandi Bhawan Vibhuti Khand, Gomti Nagar, Lucknow - 226 010, U.P.
Abstract
The marketing strategies of fruits and vegetables, and that this is leading to high and fluctuating 3-4 times ofconsumer price and only a very small share of the consumer rupee reaching the farmers. Marketing of vegetables cropis complex especially because of permissibility, seasonality and bulkiness. The examine of their marketing focusingparticularly on wholesale markets for vegetables which have been established to overcome deficiencies and improvethe marketing efficiency. The high percentage of margin to farmer-consumer price difference is inductive of largeinefficiency and relatively poor marketing efficiency. There is great need to improve the marketing of vegetables. Oneimpor tant measure would be to bring more market under regulation and supervi sion of well represented marketcommittee. Another measure would be the promotion and perhaps enforcement of open auctions in the markets. Yetother measures could be efforts to bring more buyers and sellers into the market, bringing them closer perfect markets.The direct participation of farmers should be increased. Market infrastructure should be improved through storage(go-down) facil it ies cold storage, loading and weaning facili t ies. Improv ement of road network, and cold- chainfacilit ies are also of substantial importance. Greater transparency of operations through supervision and systems canalso help substantially. The market integration and effi ciency can also be improved by making up-to-date marketinformation avai lable to all part icipants through various means, including a good market information systems,internet and good telecommunications facilit ies at the markets. In order to ensure quality of food, the cultivationpractices adopted by farmers need to be relooked and awareness to be disseminated among farming community toenhance food quality and fetch good price for the vegetable produce.
Keywords: Marketing strategies, vegetable crops
characteristics have helped the country in producing varioustypes of vegetable crops based on their suitability to thespecific environment which gives the country an opportunityto produce a wide range of varieties of a particular vegetablecrop w ith specific characteristics and taste. India in vegetableseeds have contributed immensely in enhancing productivityand production of vegetables in our country but still thereexists a gap of 10.1 per cent in national productivity incomparison to global scenario. Further, 62.1 per cent (18 outof 29 states) states in the country are hav ing low erproduct ivity in comparison to national productivity ofvegetable (17.8 t ha-1). Vegetables are rich sources of vitamins,minerals and plant fibers which provide food and nutritionsecurity. These also generate high income and employment,particularly for small farmers. There has been a revolutionin the vegetable production in India in the early years of 21st
century. The vegetable production of India was very low,less than 20 mi ll ion tons during 1947, at the t ime ofIndependence. The production of vegetables till 1961-65 wasabout 23.45 million tones which increased to 28.36 milliontons in 1967-71 and to 39.99 million tons in 1986. During1991-1992, the total production was 58.54 million tons from5.593 million ha w ith a productivity of 10.5 t ha-1. During theyear 2000-2001, Ind ia produced 93.92 mi ll ion tons ofvegetables from 6.25 million ha raising the productivity to15.0 t ha-1. During 2016-17, the country produced about 108mi l l ion tons of vegetables f rom 7.2 mi l l ion ha w i th

40 Journal of Eco-friendly Agriculture 13(2) 2018
Marketing strategies for vegetable crops
unchanged product ivity of about 15 t ha-1. The currentrequirement of vegetables in India is close to 137 million hato meet the requirement of 1.25 billion population of Indiatak ing 300 g v eget able per day per ind iv id ual asrecommended by food and nutr i tion experts. Thus,production and/ or productivity need to be increased to meetthe actual requirement of vegetables in India. This w illrequire increasing productivi ty w ithout putting extrapressure on cultivated land which is limited and shrinkingday by day. This is also to be noted that vegetables being arich and cheap source of vitamins and minerals, occupy animportant place in the food basket of Indian consumers, amajority of whom are vegetarian by either choice or lack ofaccess. This persistent vegetarianism couple w ith rising percapita income is fuelling a rapid grow th in consumption ofvegetables. This w ill further call for reduction of post-harvestlosses, strong support of infrastructure and encouragingpolicy environment. The rice and wheat are the two majorfood grains, whose production grow th determines the self-sufficiency of the country. Per capita production of rice andwheat has substantially increased from 120 kgs in 1981 toover 144 kgs during the recent year. Meanwhile, the foodbasket has become much more diversified. Dramatic changesin food consumption patterns have taken place in India inthe post green revolution period. Consumers’ preference ismore towards non-cereals and among cereals the preferenceis rice and wheat to coarse cereals. Coarse grains are nowincreasingly used as cattle or poultry feed and hence theirimportance in food grain availability for human consumptionis considerably reduced. Marketing is an area for the “secondgeneration” of green revolution problems. Indian Marketingis undergoing a significant metamorphosis because ofeconomic liberalization and globalization. The successes ofmarket ing strategies and macro-economic pol icies indeveloping countries are influenced by the availability ofinfrastructure development, which plays a significant factorin present era of vegetable marketing. Today, we areexperiencing a significant transformation of horticulturesector. In past, horticulture was driven by bid, at present it isdriven by command using technological interventions in themarket ing process. How ever, w e can art icu late thatagriculture will be driven by technology in the future in orderto provide potential technological opportunities and realizebenefi ts. The monetary potential of technology use inagriculture is not recognized (Kaaya, 1999; Phougat, 2006).Though modern Information Technology (IT) revolution, hashelped in not only market information system but also haschanged the nature of market functioning altogether bymaking several intermediaries redundant, reducing the costof information, lowering the transaction cost and increasingthe competition. Farmers perceive that marketing as the
major constraint rather than production to enhancing farmincomes. Markets are the means of either prosperity ordistress for the farmers. These are the places where thefarmers’ fate for the crops they have grown is decided. Hence,the government does everything possible to ensure that thefarmers realise a better return for their produce. In addition,enactment of Model APMC Act, linking of all APMCs w ithNational Information Network (NIC-NET) to provide thespeedy and timely dissemination of market information tothe growers, separate web portals for dissemination of marketinformation, etc., are some of the efforts of the government Inorder to render the marketing systems more eff icient,government has introduced electronics devices into marketmechanism in some markets for bringing more transparencyin the markets. Electronic medium has been used fortransmission of information in various industries. However,their uses in agricultural markets are relatively low (Murthyand Abhinov, 2012).
Growing demand for vegetables is considered to have
Figure 1: Leading Vegetable Producing Countries
Country Area (in ha)
Production (in t)
Productivi ty (t ha-1)
China 24560900 573935000 23.40 India 9396057 162896911 17.30 United State of America 1104640 35947720 32.50 Turkey 1111702 27818918 25.00 Iran (Islamic Republic of) 876830 23485675 26.80 Egypt 772487 19825388 25.70 Russian Federation 790500 16084372 20.30 Spain 683294 13599497 19.90 Mexico 318971 12531000 39.30 Italy 450186 12297645 27.30 Others 19096425 261467661 13.70 World + Total 59161992 1159889787 19.60
Table 1: Major vegetable producing countries in the World
Source: FAO Website – February 2015 (Data for 2012, 2013 N/ A)and for India Data – (Data for 2013-14) Department of Agriculture& Cooperation.

Journal of Eco-friendly Agriculture 13(2) 2018 41
R.K. Rai and Rajendra Kumar
a favorable economic effect on smallholders who dominatethe Indian agriculture scenario. Small holdings contribute78 percent of total holdings with an area share of 33 percentcontribute more than half of the production of fruits andvegetables. Small holders have a distinct advantage invegetable production; vegetable cul tivat ion is labour-intensive and small holders have abundant labour.Moreover, most of the vegetables have a small crop-cycleand therefore provide returns round the year. The price ofthe horticulture commodities especially onion and potatoare highly volatile. At the harvest time and soon thereafter,a steep fall in the whole sell and retail prices is normallyobserved. With depletion of the stored stocks, the prices trendto increase. This phenomenon is most in the case of onionsand potatoes. Price volatility efforts consumer in a big way.Abnormal increase in price of these commodities effect theconsumers by way of increasing. The efficiency of marketingof fruits and vegetables in India has been of significantconcern in the recent years. Poor efficiency in the marketingchannels and inadequate marketing infrastructure arebelieved to be the cause of not only high and fluctuatingconsumer prices, but also to little of consumer rupee reachingthe farmer (Kaul 1997, Ashturker and Deole 1985). Indianfarmers typically depend heavily on middleman particularlyfruits and vegetable marketing. The producer and consumeroften get a poor deal and the middleman control the market,but do not add much value. There is also massive wastage,deterioration the qual ity as wel l as frequent mismatchbetween demand and supply both spatially and over time(Subbanarasiah, 1991 and M et.al. 1985). In the light of theseconcerns, studies were taken-up. The economic importance
has also increased and high labour intensity in theproduction of most fruits and vegetables production alsomake them important from the employment angle as well(Sharma, 1991).An increase in area al locat ion underhorticultural crops has often been suggested as measure foragricultural d iversification, increased employment andincome of farming community (Malik, 1998).
The area assessment w ill be carried out for the selectedcrops in the selected districts of major states. The crops w illbe selected based on the production share. The follow ingcrops and study area are being proposed by satellite data tobe used are either of LISS III (23.5 m resolution) or LISS IV,depending upon the spatial extent of the crop. In the absenceof availability of Indian satellite data during the crop grow th,foreign satellite data w ill also be explored in given below .
Crop type Crop State (Distri cts) Banana Tamil Nadu, Andhra Pradesh, Maharashtra,
Gujarat, Karnataka Mango Uttar Pradesh, Gujarat, Karnataka, Andhra
Pradesh, Bihar
Fruit
Citrus Andhra Pradesh, Maharashtra, Punjab, Madhya Pradesh, Gujarat
Potato Uttar Pradesh, Bihar, West Bengal, Gujarat, Punjab
Onion Maharashtra, Gujarat, Madhya Pradesh, Karnataka, Bihar
Vegetables
Tomato Andhra Pradesh, Odisha, Karnataka, Madhya Pradesh, West Bengal, Bihar
Spices Chill i Andhra Pradesh, Karnataka, West Bengal, Madhya Pradesh, Odisha
Source: Horticultural Statistics at a Glance -2015
Table 2: Status of vegetables production and productivity in Uttar PradeshArea
(000 ha) Producti on
(000 t) Productivi ty
(t ha-1) Year
I ndia U.P. I ndia (%) I ndia U.P. I ndia (%) U.P. India 2001-02 6155.70 777.90 12.64 88622.00 15044.80 16.98 19.34 14.40 2002-03 6091.80 0.00 0.00 84815.40 0.00 0.00 0.00 13.92 2003-04 6308.90 819.50 12.99 93165.00 18190.40 19.52 22.20 14.77 2004-05 6755.60 840.90 12.45 101433.50 15792.80 15.57 18.78 15.01 2005-06 7218.00 895.50 12.41 111399.00 17337.30 15.56 19.36 15.43 2006-07 7564.00 897.60 11.87 115011.00 18190.40 15.82 20.27 15.21 2007-08 7848.30 960.80 12.24 128448.80 19790.30 15.41 20.60 16.37 2008-09 7980.70 987.80 12.38 129076.80 18950.10 14.68 19.18 16.17 2009-10 7984.80 1020.10 12.78 133737.60 22435.70 16.78 21.99 16.75 2010-11 8494.50 829.40 9.76 146554..50 17679.40 12.06 21.32 17.25 2011-12 8989.60 852.10 9.48 156325.50 18563.70 11.88 21.79 17.79 2012-13 9205.20 912.70 9.92 162186.60 19571.70 12.07 21.44 1762 2013-14 9396.00 859.40 9.14 162897.00 18545.00 11.38 21.60 17.64 2014-15 9541.00 1145.42 12.15 168300.00 23572.30 14.00 20.58 19.94 2015-16 10106.00 1200.06 11.87 169064.00 25510.06 15.08 21.25 20.44 2016-17 10307.89 1400.13 13.59 175194.41 26407.34 15.07 19.00 17.00
Source: Various Issues Horticultural Statistics at a Glance

42 Journal of Eco-friendly Agriculture 13(2) 2018
Marketing strategies for vegetable crops
Not w ith standing these advantages, small holdersconfront a number of constraints in vegetable production.The product ion risks are high, pr imari ly because ofconsiderable production losses caused by pests. These areestimated to be about 30 per cent of the total vegetable output.The post-harvest losses are also quite high due to theirperishable nature. There is lack of marketing and processinginfrastructure. Local markets are thin, and trading in distantmarket s is non-rem uner at i ve d ue t o hi gh cost oftransportation. Also, pr ices are volat ile and of ten fall
drast ical ly w i th harvest ing of normal product ion ofvegetables and this problem gets further worsened in case ofover production. The major constraints in vegetablemarketing are as follows:-
Lack of rural roads.
Lack of cold storage facilities.
Lack of refrigerated transport vans.
Inadequate space.
Inadequate processing capacity.
Poor marketing intelligence.
Lack of mechanical grading and packaging.
Lack of post-harvest management and processingtechnologies.
Costly transportation.
High cost of packaging material.
High price risk (post-harvest losses).
Faulty weighing mechanism and price discounting.
Delayed sale and payment.
Lack of market information and regulation.
Lack of forward trading.
Marketing channel in vegetables in India is complexinvolving large number of channels between producer andconsumer. These channels are as follows:
Village trader.
Commission agent.
Cooperative regulated market.
Forwarding agent.
Primary wholesale trader.
Shipper.
Secondary wholesale trader.
Retailer.
Producers’ share in the price to the consumers has oftenbeen around 40 percent. A few important observations onthis issue are listed as follows:
Farmers selling the produce d irectly to consumersreceive higher prices.
Farmers share is higher in off season than in normalseason crop.
Figure 2: Leading vegetables producing states in terms of area
Fi gure 3: Lead ing vegetabl es pr oduci ng states in terms ofproduction
Figure 4: Leading states in vegetables productivi ty (in metric tones)

Journal of Eco-friendly Agriculture 13(2) 2018 43
R.K. Rai and Rajendra Kumar
Connecting markets by roads had only marginal effectson producers’ share in retail price.
Vegetables like onion, cabbage, and peas normally havehigher producers’ in retail price.
A s the number of channels i ncreases, there isproportional reduction in the consumers’ share of theretail price.
Various suggestions to improve producers’ share inthe retail price are as follows:
Develop strong vegetable network at priority.
Prov ide a p l at form to sel l vegetables thr oughcooperative marketing.
Curb malpractices.
Create healthy competition.
Establish processing units.
Establish cold chain facilities.
The above issues need to be addressed for improvemarketing efficiency through a better infrastructure andinstitutional reforms and these steps w ill go a long way inincreasing vegetable production in the country.
RESULTS AND DISCUSSIONSeveral measures are recommended for improving the
marketing of vegetables in the country the follow ing majorrecommendations emerge from the studies reported here themarketing efficiency of vegetables. First it is important tobring more market under regulation and put them under thesupervision of well represented market committee. Secondis important to promote, and perhaps even enforce throughrule or laws, the practice of open auction in the markets.Third it is important to more number of buyers and sellers tothe wholesale markets so as to encourage healthy competitionclose to perfect market condition and better price realizationto producer farmers. Besides above measures marketinfrastructure should be improved through storage (go-down) facilities cold storage, loading and weaning facilities.Improvement of road network, and cold- chain facilities are
also of substantial importance. Greater transparency ofoperations through supervision and systems can also helpsubstantially. The market integration and efficiency can alsobe improved by making up-to-date market informationavai lable to al l participants through various means,including a good market information systems, internet andgood telecommunications facilities at the markets. In orderto ensure quality of food, the cultivation practices adoptedby farmers need to be relooked and awareness to bedisseminated among farming community to enhance foodquality and fetch good price for the vegetable produce. Toensure safety of perishable farm produce from spoilageduring transit to the processing units, cold chain is veryimportant, including storage capacity and refrigerated trucks.
Therefore, besides training farmers for food safety andquality, awareness among transportation personnel is aprerequisite for quality food to reach at destination becauseinadequate storage and temperature during transportationwould result in loss of quality of the produce. It is herebysubmit ted to ini tiate a short term diploma course fortransporters to obtain license for perishable commoditytransport business.
REFERENCESAsthturker B.M. and C.D. Deole, Producer Share in Consumer
Rupee: A Case Study of Fruits Marketing in Marathwada,Indian Journal of Agricultural Economics, 40: 3, 1985.
Kaaya, J. Rol e of Infor mati on Technol ogy in A gr icul ture,Proceedings of FoA Conference, 4: 315-328. 1999.
Kaul, G.L. Horticulture in India: Production Marketing andProcessing, Indian Journal of Agricultural Economics, 52: 3,1997.
Murthy T. N. and T. Abhi nov, Electroni c Medi a in Rur alA gr i cu l tur al Busi ness - A Pr omoti onal Inject i onwww.abhinavjournal.com, Web. 25 January, 2015.
Phougat, S. Rol e of Information Technology in Agriculture,Science Tech Entrepreneur, August, pp. 1-7. 2006.
Shar ma, Keshav , Marketing management of H or ti cultur alProduce, Deep and Deep, New Delhi 1991.
Subbanarasiah, N. Marketing of Horticultural Crops in India,Anmol Publ ishing Co., Delhi 1991.
Manuscript recived on 9.1.2018Manuscript accepted for publication on 19.3.2018

44 Journal of Eco-friendly Agriculture 13(2) 2018
Problems of saffron marketing in Kashmir ValleyJournal of Eco-friendly Agriculture 13(2): 44-51. 2018
©2018
Problems of saffron marketing in Kashmir ValleyBinish Qadri1
N.E.T ; S.E.T, Gold Medal ist, Research Scholar, Department of Economics, Central Universi ty of Kashmir1Author is Member of Board of Studies, Department of Economics, Central Universi ty of Kashmir.Email : [email protected]
Abstract
Kashmiri saffron is facing marketing problems due to its poor quality on account of traditional post harvesttechniques. Technologies are available which can ensure the best quality of Kashmiri saffron, for which it is famous inthe world and creation of saffron spice park under national saffron mission is a step forward in this direction. Nationalsaffron mission is likely to boost the overall saffron production of Kashmir from 15MT to 22MT. (Souvenir SaffronExporters Brand, 2016). Expansion program in non traditional areas will further enhance the overall production toabout 60MT. Therefore, there is a need to provide the solution to the farmers for the better market which at present isunorganized. Improving marketing value chain of saffron with structured marketing channels will definitely increaselivelihood security of more than 16000 farm families which are associated with this trade directly or indirectly. Thepresent study is therefore an attempt to highlight the problems of marketing of saffron in Kashmir valley so as toprovide remedial measures and benefit the growers as much as possible and encourage this involvement in the saffronvalue chain.
Keywords: Saffron marketing, dalals, marketing channels
Saffron (Crocus sativus) plays a significant role in theeconomy of Jammu and Kashmir. It is the most expensiveand priced spice. It is limited to the Kare was particularly inthe south eastern part of the valley. As per opinion of somenoted researchers it has been cult ivated in Kashmir atPampore by M aharaja A shoka, w ho w as follower ofBuddhism, picked up some of the great principles of Ethicsfrom various religions and these principles were styled asDhamma which was nothing but a code of duties based onpractical ethics. Therefore, the cultivation of saffron accededin Kashmir in 250 B.C. In Kashmir four kinds of saffron areknown which are Lacha, Mongra, Androciam and Perianth.Among them Mongra is the best in quality that consists ofleast floral waste and foreign matter. It is this quality whichis exported. Kashmir stands next to Spain and occupiessecond rank in the international market as far as the qualityof saffron is concerned. India which occupies third place inthe international market as far as the saffron production isconcerned is because of the state of Jammu and Kashmirwhere from the entire production of saffron comes. Theincrease in demand in national and international marketmakes saffron a remunerative agricultural activity becauseof its high value. Despite its less percentage in total croppedarea in Jammu and Kashmir, its high value constitutes it thesecond largest commercial activity after fruit production. Thehub of this activity is district Pulwama which occupies about86 percent of the total area under saffron in the whole stateof Jammu and Kashmir and out of which about 80 percent ofthe saffron area belongs to Tehsil Pampore alone. More than10,000 farm families of 226 villages are associated w ith this
crop directly or indirectly. Saffron cultivation is highly labourintensive activity where most of the field and post harvestoperations are carried out by women (Kamli et al.).
Global scenarioNative of southern Europe, saffron is cultivated in Iran,
Spain, France, Italy, Austria, Greece, Turkey, England, Chinaand India. However, the major saffron producing countriesof the world are Iran, Spain and India. Iran is holding adistinction of being the major shareholder both in terms ofarea and production. The contribution of Iran w ith respectto area and production in the world stands highest in theworld. Contribution of Iran to global saffron production is89% (278.6M T) w hi le as only 5% (15M T) i s J& K’scontr ibut ion. M oreover, minor countries contribute 6%(18.34MT) to global saffron production (ITC, Geneva, 2016).
The leading saffron grow ing countries like Iran, Spainand Greece w ith intensive production technologies are ableto achieve higher production and productiv ity(4-8Kg/Ha)which is much higher than J&K ‘s product ivity andposing great threat to our saffron industry as imports areincreasing every year. Thus there is a need to increaseproduction by bringing more area under cultivation anddouble the average productivity by adopting intensiveproduction system, efficient processing and marketing tomake it globally competitive and remunerative to growers.Major Saffron exporting countries are Iran, Spain, Portugal,France, Afganistan, Germany, India, UAE,Italy. Exportedvalue of saffron at the global level is 169,940 US$ thousandsin 2014. Iran’s contribution in export value at the global level

Journal of Eco-friendly Agriculture 13(2) 2018 45
Binish Qadri
is 41.23% (70,074) while as India’s contribution is only 1.08%(1,850) (ITC, Geneva, 2016).
State scenarioIn India, Jammu and Kashmir state has a natural
monopoly power in the production of saff ron, which iscultivated on karewa lands (wudar). The cultivat ion ofsaffron is confined to districts of Pulwama, Budgam, somehamlets of Srinagar and Doda. The major saffron grow ingbelts are Samboora, Chandhara, Letpora, Kakapora, Shar-Mandekpal, Gundbal, Ladhoo of d istrict Pulw ama andHyatpora of district Budgam. Khunmoh, Zewan, Balhama,Sampora, Ladhoo, Chandhara, Woyan, Khrew, Shar Konibal,Dussu, Namblabal, Kadlabal, Hat iwara, Samboora andLethpora are prominent saffron villages of Tehsil Pampore(Nehvi and Yasmin, 2011). District pulwama accounts for75% of the total area under saffron in the state followed bydistrict Budgam w ith 16.3 percent. Some pockets of DistrictSrinagar accounts for 6.68 percent while hamlets of districtDoda represent 2.5% of the total area under saff ron.(Economic Survey 2010). The production in 2009-10 was 9.46metric tonnes which increased to 15 metric tonnes in 2015-16. However the area under saffron cultivation has remainedsame (no improvement) at 3785ha. The National demandfor Kashmiri saffron is to the tune of 100 MT and the gap isfilled up by the Iranian Saffron. It is interesting to note thatabout 16000 farm families in Kashmir valley are dependenton saffron. (Nehvi F.A., 2011). At the same time it is veryunfortunate that 85 percent families associated w ith saffroncultivation in Kashmir valley are small (marginal) farmers(Imtiyaz-ul-haq, 2014).
Average price of saffron increased from Rs 0.298 lakhkg-1 in 2005-06 to Rs 2.701 lakh kg-1 in 2009-10. Quantity ofexports in 2009-10 were 1.59MT (value of Rs 342.71 in lakhs)while as that of imports were 0.30MT (of Rs 480.00 in lakhs)(source: Spice Board). There are huge price fluctuationsassociated w ith saffron. From October to November thereare peak prices. From January saffron prices fall becausefrom January Kashmiri saffron market is flooded with Iraniansaffron. From April to June there are constant prices and itwas Rs 1.3 lakh kg-1 and Rs 1.75 lakh kg-1 for Mongra andLacha respectively in 2015-16 (Sovenier Saffron ExportersBrand, 2016).
The objectives of the study was to understand theconcept of marketing in a comprehensive manner, to highlightthe problems of saffron marketing in Kashmir Valley and tosuggest remedial measures to efficient saffron marketing inKashmir Valley.
M ETHODOLOGYPulwama accounts for 75 per cent of the total area under
saffron (Economic Survey 2010) and Pampore tehsil of districtpulwama is known all over the world for the quality saffronit produces ow ing to its peculiar topography, suitable climaticconditions, soil and water table. Therefore the present studywas conducted in Pampore.
The Pampore information graph explains 60613 Peopleare living in this Tehsil, 31654 are Male and 28959 are femaleas per 2011 census. Expected population of Pampore in 2017is between 58795 and 64856. Literate people are 32703 outof which 20167 are male and 12536 are female. People livingin Pampore depend on multiple skills, total workers are 22631out of which men are 16981 and women are 5650. Total 1398cultivators are dependent on agriculture farming out ofwhich 1294 are cultivated by men and 104 are women. 886people work in agricultural land as a labour in Pampore,men are 860 and 26 are women. As saffron is the main cropof Pampore so majority of the cultivators are engaged insaffron cultivation. Only a handful of cultivators (roughly20%) are engaged in cu l tivations other than saff ron.(www.indiagrowing.com).
Out of 29 villages in Pampore tehsil, one each havinghighest, medium and lowest saffron production, that leastdispersed in terms of production, were selected. From theselected villages 4 components viz, growers, dalals & localtraders, retailer/ wholesaler and firm/ sub-firm were takeninto consideration (Table 1).
Since we are working w ith a finite population and thepopulation size is known, we applied Taro Yamane’s formulafor determining the sample size.
n= N/ 1+N(e)2
Where, n=corrected sample size, N=populat ionsize(here our population/ universe is 886,assuming 80% of886 cultivate saffron in pampore which becomes 708.8), ande=margin of error, e=0.05 based on the research condition.
A total of 102 respondents of size of 256 w ereinterviewed for identifying problems of saffron marketing.The in terv iew method of col lect ing dat a involv edpresentation of oral-verbal stimuli and reply in terms of oral-verbal responses. Both personal as w el l as telephonicinterview was conducted to get the desired information.Interview w ith saffron associations, cooperative societiesand experts in the field of agriculture and marketing alsoproved helpful for the present study.

46 Journal of Eco-friendly Agriculture 13(2) 2018
Problems of saffron marketing in Kashmir Valley
The secondary data, obtained from Statistical Digest ofState, issued by the Directorate of Economics and Statistics,A gri cu l tural Censu s f rom Planni ng and Stat ist icalDepartment and Economic Review issued by the Directorateof Economics and Statistics, Planning and DevelopmentDepartment were also used.
Understanding marketing f rom broad perspectiveThe concept of marketing can be viewed from social
and managerial perspectives. At its simplest, marketing canbe defined as an exchange transaction that takes placebetween the buyer and sel ler. Market ing occupies animportant position in the organisation of business unit.Traditional view of the marketing asserts that the customerw ill accept whatever product the seller presents to him. Butthis point of view of marketing has now changed. The modernconcept may be viewed from the customer ’s point of view.Marketing is centred around the customer. It does notproduce whatever he likes but whatever consumer wants.Philip Kotler has rightly remarked ‘‘Marketing is analysis,organising, planning and controlling of the firm’s customer-impinging resources, policies, activities w ith a view to aprofit’’. Marketing is a total system of business, an ongoingprocess of (1) discovering and translating consumer needsand desires into products and services (through planningand producing the planned products), (2) creating demandfor these products and serv ices (through pr icing andpromotion), (3) serving the consumer demand (throughplanned physical distribution) w ith the help of marketingchannels, and then ,in turn (4) expanding the market even inthe face of keen competition. In any p lanned economicdevelopment programme, marketing assumes a veryimportant role in maintaining equi l ibr ium betw eenproduction and consumption. Marketing is the basic reasonfor the existence of a business organisation. In the age of fastchanges, marketing is the springboard of all activities. Itw or ks as a gu id e for al l bu siness/ non-businessorganizations. It is a powerful mechanism which alone cansatisfy the needs and wants of consumers at the place andprice they desire. The success of a business depends largelyon the effectiveness w ith which its marketing strategies areformulated and implemented. Marketing is said to be theeyes and ears of a business organisation because it keeps the
business in close contact w ith its economic, political, socialand technological environment and informs it of events thatcan influence its activities as per requirements of the market.Marketing helps in having a good range of products inconstant demand and suggests to the management the scopefor improving and developing new products to satisfy thechanging customer needs. Customer is the king of the market.Customers decide what products suit their needs. Therefore,we can say marketing satisfies our needs by providing formutility, person utility, exchange utility, place utility and timeutility. Marketing can be summed up as consisting of salesin a planned way, creation of customers and creating ofdemand and satisfying it.
Follow ing are the essential elements of marketing:
1. Identifying the customers who are chosen as the targetof marketing efforts.
2. Understand ing the need s and w ants of tar getcustomers.
3. Development of products and services for satisfyingthe needs of the target customers.
4. Satisfying needs of target customers better than thecompetitors.
5. Ensuring reasonable profi t by performing all theseactivities.
M arketing conceptsPhilip Kotler has shown five competing concepts for
carrying out marketing activity in any organization:
1. Production concept: Production concept of marketingbel ieves that customers are interested only in lowpriced, easily and extensively available goods; and finerpoints of the product are not very important to them.
2. Product concept: The product concept impl ies thatcustomers favour those products that offer the mostquality, performance and features.
3. Selling concept: Selling concept assumes that effectiveselling can push its output into the hands of customers.In other words, it assumes that consumers on their ownw ill not buy enough of organization’s products, unlessthe organization undertakes aggressive sales andpromotional efforts.
4. Societal marketing concept: Societal marketing conceptis an extension of modern market ing concept. I temphasises social welfare along w ith the interests ofthe firm and its customers. This concept includes socialimplications in the decision-making.
Village Growers Dalal & Local traders
Retailers/ Whole-salers
Firm/ Sub-firm
Total
Ladoo 12 4 14 5 35 Namblabal 12 4 15 7 38 Khrew 12 4 10 3 29
Table 1. Details of components studied

Journal of Eco-friendly Agriculture 13(2) 2018 47
Binish Qadri
Saffron marketing in Kashmir Val leySaffron market ing cover the serv ices involved in
moving saffron from the farm to the consumer. It is one of themost important foreign exchange earners among the spicesin India. Grown entirely in the state of J&K, about 49% of itstotal produce is exported outside the country (Munshi, 1990).Saffron marketing in the state and the country as a whole ishighly unorganized .Marketing of saffron is concentrated inthe hands of few traders because a common saffron growercannot directly sell his meagre produce as he cannot grade,pack and store the produce at individual level (Zaki et al.,2002). The grower being financially poor is prompted to sellhis produce through middlemen (Dalal) and local traders toowners and private firms who in turn sell it to the wholesaler.The saffron is finally distributed to exporters and domesticmarkets, with negligible record regarding its quality standardand revenue realized. Exports in particular are dispatched,not from the traditional spice exporting ports but from Delhi,Mumbai, Kolkata, Chennai and Amritsar by air. Thus theyescape grading and quality control and fail to att ract apotential competitive foreign market.
Number of surveys of saffron families carried out inKashmir, especially in Pampore, revealed that more than 50percent of them comprising farmers of large, and small landholdings, sell their produce to the brokers (Dalal) and morethan 30 percent to sub firms( Haq. U.I., 2014), while very lesspercentage sell directly to the wholesalers in Delhi, Amritsar,Mumbai, Kolkata etc., and to the cooperative societies .
Accord ing to M unshi (2002) the main marketingchannels involved in saffron marketing are brokers, localtraders ,agents, cooperative societies, government agenciesand companies. However, according to Imtiyaz-ul-haq(2014)the main marketing channels of saffron in the valley ofKashmir are as under:
Dalals (C1) Local Traders (C2) Agents (C3) Sub Firms (C4)
His study revealed a price spread of more than threehundred percent between the farm gate prices and the marketprices of saffron, the advantage of which is reaped by thenetwork of intermediaries that dominate the marketingchannels in saffron trade. There is much scope to increasethe producer ’s share in consumer ’s rupee and marketingefficiency provided the no. of intermediaries is reduced andgovernment’s intervent ion in the marketing system isstrengthened. His study revealed that in Pampore, thetraditional saffron marketing centre of Kashmir valley, thebig traders purchase the marketed surplus at relativelycheaper pr ices from the growers and dalals during the
months of November to January, primarily for hoarding. Thegrowers who lack finance and storage facilities and have noidea about the demand and supply conditions at the terminalmarkets incur huge losses.
Wani et al. (2008) reported that the main market ofsaffron is at Pampore. Their study revealed that the complexmarketing process in saffron renders the grower ’s to realizea lesser share which is thus considered the vital factorresponsible for declining area under saffron.
The primary survey revealed the follow ing problemsin the production and marketing of saffron in the Kashmirvalley:
Low productivi ty and product ion (Expansion ofGeographical Coverage).
Pollution caused by cement factories in Khrew area ofSouth Kashmir is adversely affecting saffron production andmarketing. M ercury element tremendously affected itsproduction. It has affected its corm, bulb and leaves leavingit w ill low production levels. Environmental science expertswho have studied the effects of cement factories in Khrew onthe human lives, flora, fauna and w ild life, said that theirpresence is harmful in the short as well as long run. Khrewarea is important producer of saffron. According to surveyby agriculture departments Khrew is the fourth cultivator ofsaffron in India. As per estimates of saffron dealers of Khrewthis town has a capability to grow minimum 385 Kg of saffronin a year. Upto 2004 saffron growers were producing 248 Kgof saffron but w ith the coming up of seven cement factoriesin a particular area of Khrew close to villages Pakhribal,Nagadore and Botthen the production declined to a greatextent. Now the condition is even worse as they hardly get70 Kg which is show ing that the loss of capacity to growsaffron by the chemicals and dust coming out of thesefactories.
Lack of Standardization, Certificat ion and QualityAssurance.
Kashmir i saf f ron l ike Afghan saf f ron is largelyunbranded in the national/ international markets.
Lack of research and development.
Low capacity/ Know ledge of saffron stakeholders.
Producers are not aware of the marketing channels andmarket structure of saffron.
Lack of efficient post-harvest techniques like drying,grading, packing and storage faci lit ies. This resul ts indistress sale by the growers.

48 Journal of Eco-friendly Agriculture 13(2) 2018
Problems of saffron marketing in Kashmir Valley
Landholdings of majority of the growers are small.Accordingly the produce is also limited w ith each growerw ith no option for the competitive markets.
Saffron growers, majority of which are marginal ,areeconomically poor and this compels them to borrow moneyin advance from the dalals and other money lenders, resultingin distress sale.
Adulteration is another burning issue associated w ithsaffron marketing. It results in the deterioration of the qualityof saffron. Adulteration is one of the biggest cause responsiblefor decline in the demand for Kashmir i saf fron in theinternational market. It is an emerging threat to the industryas large market share of saffron is being exported throughsale of spurious saf fron and thus w arrents detection ofadulterants and there is thus need for devising mechanismfor spot detection of adulterants.
The marketing channels expropriate a substant ialproportion of the profit w ith both the growers as well as theconsumers being the suf ferers. Once the market ing isregularized the demand would increase and the farmers w illget better incentives and subsequently divert more land forthe cultivation of this crop.
In Pampore, the traditional saffron marketing centre ofKashmir valley, the big traders purchase the market surplusat relatively cheaper prices from the growers and dalalsduring the months of November to January, primarily forhoarding. This was also confirmed by the study of Imtiyaz-ul-haq (2014) . The growers who lack finance, storage andother facilities and have no idea about the demand andsupply information at the terminal markets incur huge losses.The big traders and the wholesale firms thus make heavyprofits through exploitation of these growers.
Table 2 clearly reveals that there are huge pr icefluctuat ions associated w ith saf fron. From October toNovember there are peak prices. From January saffron pricesfall because from January Kashmiri saffron market is floodedw ith Iranian saffron.
Saffron is highly remunerative and offers ample scopefor employment generation. Different studies on the economicanalysis of saffron indicate that the crop is economicallyviable. There is much scope for making this crop moreprofitable provided efficient marketing system to expand thearea as well as increase the production of saffron in the stateis made possible. Various studies have found that thosecountries which don’t produce saffron are exporting saffron.This show s that saff ron has healthy market. The pricefluctuations have been the serious cause of concern to thegrowers and there is a need to frame minimum price support
policy for this particular crop. It is important to note thatvarious stud ies have been conducted on product ion,productivity and distribution of saffron in Kashmir valleybut no study has been conducted so far w ith regard toproblems of saffron marketing and price fluctuations ofsaffron. There is a need to work in these areas.
Healthy value chain is that which targets grower. Inother words, the value chain in which the growers getmaximum benefits is said to be the most healthy value chain.There is a need to develop a policy paper to benefit the growersas much as possible and encourage involvement of them inthe saffron value chain.
Remedial measures to ef f icient saf f ron marketing inKashmir val ley1. Increase saf fron product ion and product iv ity. An
extensive studies are to be conducted in agro-eco zonesand sub-eco zones of Jammu and Kashmir to identifysuitable area for saffron production in Jammu andKashmir. The best way in which we can improve saffronproduction and productivi ty levels is preparat ion,production and distribution of quality corm.
2. Barcodes should be provided to all saffron growers.
3. Provide loans to the farmers at low rate of interest sothat they w i ll be f ree from the clu tches of localmoneylenders who squeeze them. It is said that farmeris born into debt, lives in debt and dies in debt. Thepoor farmers approach money lenders for investing intocultivation who levies very high rate of interest andwho takes away the maximum amount of the sharefrom the produce. In case if the crop fails due to naturalcalamities then the situation would be worse as thefarmer is not in a posit ion to pay his loans andultimately he is forced to sell the land at throw awayprice to the money lender.
Source: Sovenier Saffron Exporters Brand, 2016.
Table 2: Market price (Rs in lakhs) 2015-16Month Mongra Lacha October 1.33 1.8 November 1.2 1.7 December 1.2 1.7 January 1.11 1.6 February 1.11 1.6 March 1.11 1.6 April 1.3 1.75 May 1.3 1.75 June 1.3 1.75 July 1.33 1.8 August 1.33 1.8 September 1.33 1.8

Journal of Eco-friendly Agriculture 13(2) 2018 49
Binish Qadri
4. Generate a new distribution network that connects thefarmers directly to the consumers to get maximumreturns as the present channel of distribution involvesmultiple mediatory who takes away the major portionof profits which otherw ise the farmers is supposed toget.
5. There should be str ingent act ion against blackmarketers and hoarders who buy the stocks f romfarmers at cheap prices and create artificial demandand then sell the stocks at higher prices.
6. Creating local outlets at each village where the farmerssel l thei r stocks di rectly to the consumers or theauthorized buyers at fixed prices would help to a greatextent. Intervention of government in this network isessential to bring the fruits to the farmers.
7. At the village level there should be counseling centersfor farmers about the worth of their stocks so that theycan get fair price. The crucial role of Non-GovernmentalOrganizations (NGOs) is needed in this context .Cooperative societies and growers committee can alsoplay great role in this regard.
8. There is a need to establish regulated markets for saffronas saff ron is highly unorganized and unregulated.M oreov er saf f r on r esearch cent ers need to beestablished in all major saffron grow ing areas whichw ill provide timely marketing information to saffrongrowers.
9. There should be proper provision for standardizationand grading of the produce for ensuring good qualityto the consumers and better prices for the farmers. Thereis a need to establish standard/ modern processingcenters, employing modern technology for cleaning,drying and packaging of saffron at the district and theprov isional level . Government should enable theJammu and Kashmir saffron companies/ associationsand firms/ sub-firms to get ISO certification. Need ofthe hour is to create and approve the Nat ionalStandards for Kashmiri saffron suitable for qualityproduction, processing and packaging.
10. There should be promotion of Kashmiri saffron atnational and international markets. Kashmiri saffronshould be exempt from taxes for export purposes till itbecomes internationally strong and compet i tive.Government of India in general and ministry of foreignaffairs in particular can play an important role inpromoting Kashmiri saffron at exhibitions and tradefairs and assisting the saffron growers and traders innetworking. Saffron growers, traders, firms/ sub-firms
should be given good chance in participating in thenational / international conferences, seminars andworkshops. Media help should be taken to raise publicawareness about the nutritional and health benefits ofsaffron.
11. Research sector is key in economic grow th (Romer,1986). It is ideas rather than natural resources that aremore important for grow th and development. Japan isbest example. Fewer natural resources cannot affecteconomic grow th. Japan imported machines from USand later dismantled them to see how they worked andmanufactured their better prototypes. Japan proves that‘Ideas are essential for the grow th of an economy.’ Goodamount of research is done on product ion anddistr ibution of saf fron in the state of Jammu andKashmir but no comprehensive research is conductedso far w ith regard to marketing and development ofsaf f ron exports. Therefore, extensive research isrequired in the field of saffron marketing and the presentpaper attempted to highlight some of the problems ofsaffron marketing in the Kashmir Valley. Governmentshould establish Satellite Sites under the supervisionof National Saffron Research and Development (R&D)Institute in different saffron grow ing areas. VariousResearch studies confirm the high positive correlationof research and development (R&D) and the grow thrate of output. All those countries that allocate a largershare of output to research and development (R&D)are better off in terms of grow th and development. Oureconomy also needs to allocate a larger share of outputto research and development (R&D), education andhuman capital formation.
12. Government should lend support to those who areinvolved in saf f ron product ion, processing andpackaging such as saffron associations, cooperativesocieties, firms/ sub-firms and honor those academicscholars who are contributing to our know ledge ofsaf f r on through d i f ferent research paper s andpublications.
13. Establishment of farmer schools in villages in generaland saffron grow ing areas in particular can help in thecapacity building of saffron stakeholders. Lucas (1988)assumes that investment in education leads to thepr oduct ion of human capi tal w hich is crut i aldeterminant in the grow th process. He makes adistinct ion betw een the internal effects of humancapi tal where the individual w orker undergoingtraining becomes more productive, and external effectswhich spillover and increase the productivity of capital

50 Journal of Eco-friendly Agriculture 13(2) 2018
Problems of saffron marketing in Kashmir Valley
and of other workers in the economy. The higher theproductivity of training, the higher w ill be the increasein the marginal productivity of labour (MPL) thatfollows training and hence the higher the future wagerate. This means that the incentives to training aregreater and so w ill be the grow th rate of the economy.Technical and skilled persons and saf fron growersshould receive training on production, processing andmarketing of saffron. Saffron cultivation being highlylabour intensive activity where most of the field andpost harvest operations are performed by women (Kamliet al .), special pract ical training to women saff rongrowers on field and post harvest operations andmarketing can help in tackling the post harvest andmarketing related issues. Moreover, establishment ofwomen self help groups of saffron, who inculcate thehabit of thrift among members, can raise huge amountin the form of small savings. Help from NABARD canalso be taken. These self help groups can highlight allproblems associated w ith production and marketingof saffron.
14. Since saffron is the major cash crop of Jammu andKashmir hav ing nat i onal and int ernat ionalimportance, coord ination of Jammu and Kashmirgovernment w ith the ministry of higher education toinclude economics of saffron production and marketingin the curricula of schools, colleges and universitiescan help in understanding not only the marketingconcept in comprehensive manner but problems andprospects of saffron marketing as well and accordinglyaddress the remedial measures.
15. The existing legislations are outdated and are not intune w ith the changing trends and technologicalinventions and the same need to be updated forthw ith.
The idea of e-marketing of the agricu l tural andhorticultural products has also been catching on lately.While “organized retail” may not be a panacea foraddressing al l the problems of the agricu l turalmarketing, it could help in improving the supply chainand bring down w ide margins between farm gate andconsumer prices. Further, given the vastness anddiversity of Indian agriculture, the country requiresmultiplicity of instruments, scaling up of successfulexperiences like cooperative marketing and organisedretai l to impart ef f ici ency, compet i veness andmodernization of agricultural marketing. There is alsoa need for the states to promote producers association,producers companies and cooperat ive marketingsocieties to improve bargaining power of producers.
16. The move towards common National Agricul turalMarkets announced in the Union Budget 2015-16 needto be pursued vigorously to ensure remunerative pricesto farmers from the open market and to reduce thedemand for price support mechanism.
The study concludes that poor economic foundation ofthese farmers constrains them to acquire money ahead oftime from dalals coming about into distress deal. This issueneeds to be handled seriously by the government by givingcheap credi t faci l i t ies to the grow ers. Furthermore,accentuation ought to be given on instilling the soul ofcooperative cultivating. By cooperative marketing the chainsof middlemen can be eliminated. Coordinate connectionsbetween the ultimate consumers/ end users and the growerscan improve their monetary standards and provide themwith the market impetuses necessary for the expansion ofthis generally shrinking segment. Another region of seriousconcern is in regards to the adulteration of this very crop bythe middlemen. Adulteration has badly affected the businessof this very crop. This practice has badly affected themarketing of Kashmiri saffron. Serious steps need to be takenby the government to stop it. In order to solve marketingrelated problems of saffron in our state, understandingmarketing from the broad perspective is a sin-qua-non.Everybody does not know everything of anything, thereforethere is need for dialogue making. It can generate solutions.Al l saffron stakeholders must come forward and formdialogue w ith both government as well as non-governmentbodies at national as well as international levels.
REFERENCESAgarwal, S.G., F.A . Nehvi and M.K. Verma. (2004). “Success
Stories.” Sher-I-Kashmir Agricultural Universi ty of Scienceand Technology (SKAUST-K), Shal imar, Kashmir.
Digest of Statistics Jammu and Kashmir, (2011-12) [4] Directorateof Agriculture Jammu and Kashmir (2004).
Digest of Statistics Jammu and Kashmir, (2011-12) [4] Directorateof Agriculture Jammu and Kashmir (2004).
For ay, D. (2004). Economi cs of Know l edge. M IT Pr ess.ISBN0262562235.
Husaini, A . M., Bhat, M.A., Kamil i , A . N. and Mir, M. A . (2013).Kashmir saffron in crisis. Current Science, 104: 686-687.
Imtiyaz-Ul-Haq and Sahina S. (2014). Economic Analysis of saffroncultivation in Kashmir Valley of India. European AcademicResearch, II : 653-685.
Kafi , M. and Showket, T. (2007). A comparative study of saffronagronomy and production systems of Khorasan (Iran) andKashmir (India). Acta Horticulture, 739, 123.
Lucas, R.E.(1988). On the mechanics of Economic Development.Journal of Monetary Economics, 22.

Journal of Eco-friendly Agriculture 13(2) 2018 51
Binish Qadri
Munshi, A .M., 2001. Marketing and trade mechanism of Saffronin Jammu and Kashmir. Proceedings of the seminar cumworkshop on the Development of Saffron. PP81-91.
Phi l ip Kotler, (1983). Marketing Management: Analysis, Planningand Control. New Delhi: Prentice Hal l of India Pvt. Ltd.
Romer, Dav i d (2011).Endogenous Gr ow th . A d vancedMacroeconomics (Fourth ed.). New York: McGraw-Hill . 101-149. ISBN978-0-07-351137-5.
Schleicher,A . (2006). The Economics of Knowledge: Why educationis Key for Europe’s Success. J-06-3350 Pol icy Brief.
Wani M.H., Saraf Abdullah Sajad., Wani S.A . 2006. Economics ofProduction and Marketing of Saffron in Jammu and Kahmir.PP316-323. Vol. VIII No. 2, pp. 116.
Manuscript recived on 22.2.2018Manuscript accepted for publication on 19.4.2018

52 Journal of Eco-friendly Agriculture 13(2) 2018
Biology, varietal screening and management of pulse beetles in storageJournal of Eco-friendly Agriculture 13(2): 52-59. 2018
©2018
Biology, varietal screening and management of pulse beetlesin storageR.A. Balikai and Neenu AugustineDepartment of Agricultural Entomology, Universi ty of Agricultural Sciences, Dharwad-580 005E-mail: [email protected]
Abstract
The arti cle presents detailed informat ions emanated out of var ious research report s on various aspects ofbiology (comparative biology on dif ferent hosts, seasons and species), varietals screening and the management ofpulse beetles through eco-friendly, chemical and IPM techniques in storage conditions. There is insufficient informationon long term use of various toxin grain protectants used against pulse beets in storage, the doses required and therecovery rate of beetle species on treated seeds. Based on these, increased attention and research on adoption of bettermethods like host plant resistance, biopesti cides et c., that meet environmental and food safety r equi rements, isadvocated.
Keywords: Bruchid, Callosobruchus spp., Comparative biology, Pulse beetle, Resistance
Pulses are the second most important group of cropsworldw ide af ter cereals. They are excel lent sources ofproteins (25-40%), carbohydrates (50-60%), fats, minerals andvitamins. They are much cheaper as compared to otherprotein sources like meat, fish and egg. Hence, they are agood supplement to cereal and root crop based diets indeveloping countr ies includ ing Ind ia. Based on therecommendation and expected population growth, about 38million tonnes of pulses would be required by 2018. Eventhough India is the world’s largest producer of pulses w itha total production of about 14.7 million tonnes, still moreproduction is needed to attain the goal of self sufficiency.
Among the various constraints responsible for the lowyield of pulses, insect pests are considered to be veryimportant. More than 200 species of insect pests have beenrecorded infesting pulses in India. Of these, pulse beetlebelonging to the family Chrysomelidae causes considerableloss in quality and quantity of pulses. They are cosmopolitanin distribut ion and poses very serious threat to storedlegumes. The most preferred hosts are cowpea, mungbean,peas, pigeonpea, lentil, greengram, chickpea and soybean.The important species reported from India are Callosobruchusmaculatus (Fabricius), Callosobruchus chinensis Linnaeus,Callosobruchus analis (Fabricius), Callosobruchus phaseoli(Gyllenhall) and Callosobruchus theobromae (Linnaeus).
Generally, bruchid infestation starts from field wherethe adult female oviposits on pods. The grubs penetrate thepod and remain concealed w ithin the developing seeds ashidden infestation. Such infected seeds carry the bruchidpopulation to storage and causes the infestation. The infestedseeds can be recognized by the white eggs glued on the seed
surface and the round exit holes w ith the ‘flap’ of seed coat.
There is high variabili ty in infestation levels f romseason to season. Hence, a quantitative assessment of lossby these storage pests has been difficult. They can cause upto 100 per cent loss when left unattended. They cause grainloss by consumption as well as by contaminating the grainsw ith excrement and fragments. This leads to post-harvestlosses, viz., reduced weight, low viability, poor marketabilityetc. The infested seeds are rendered unf it for humanconsumption as well as for sow ing purposes due to qualityand germination losses and mould grow th. Bruchids candamage 100 per cent of stored seeds causing weight lossesupto 60 per cent (Hill, 1993).
Biology of pulse beetle in storageThe developmental biology of pulse beetle varies with
temperature and humidity, nutritional quality of pulses andcompetition. The adult female lays smooth, white, cigarshaped eggs on the seed surface. The incubation periodaverages to five to six days. It hatches into small, C shaped,pale yellow ish grubs. There are four instars and the totalgrub period is 18-20 days. It is followed by pre-pupal andpupal stages of about seven to eight days. The total life cycleis approximately 28-32 days.
The comparative developmental biology of C. maculatuson different pulses was conducted in the laboratory at theDepartment of Agriculture, Om Parkash Jogender SinghUniversity, Rajasthan during 2014-15 by Sharma et al. (2016).Five treatments i.e., five pulses [green gram (Vigna radiate (L.)R. Wilczek, black gram (Vigna mungo (L.) Hepper), chickpea(Desi) (Cicer arietinum L.), cowpea (Vigna sinensis L.) and pea

Journal of Eco-friendly Agriculture 13(2) 2018 53
R. A. Balikai and Neenu Augustine
(Pisum sativum L.)] were replicated thrice. Significantlyhighest numbers of eggs (89.3) and shortest total life periods(31.6 days) was recorded on cowpea followed by green gramwith 73.1 eggs and 34.6 day, respectively. No significantd i f ferences were found in ov iposi t ion period, post-oviposition period, incubation period and adult longevityon various pulses. It was concluded that of all the pulsesstudied, cowpea is the most susceptible host for C. maculatusfollowed by green gram which may be due to the differentnutritional composition of the pulses.
A study on comparative grow th performance of C.maculatus on three different legumes was studied by Sharmaand Thakur (2014). A mong three legumes stud ied,oviposition was preferred by soybean > cowpea > chickpea(kabuli>desi). This can be attributed to the soft and smoothseed coat of soybean. However, adult emergence and weightloss w ere recorded maximum in cow pea > chickpea(kabuli>desi) > soybean. This can be due to the presence ofvarious anti-nutritional factors in soybean.
Laboratory studies on the biology of C. maculatus onchickpea in three different seasons was studied by Vidyasreeand Thirumalaraju (2015). Observat ions on d if ferentparameters like incubat ion, grub and pupal periods,fecundity and total life span were recorded during kharif,rabi and summer seasons. There was significant differencein the total life cycle of C. maculatus in July-August (46.32days), November-December (62.4 days) and April-May (35.28days). Longer life cycle was observed during rabi season dueto low temperatures and shorter during summer due to idealtemperatures for faster development of C. maculatus.
Studies on the comparative biology of pulse beetles viz.,C. analis, C. chinensis and C. maculatus on soybean underlaboratory conditions was studied by Sibi (2003) at UAS,Dharwad. The results revealed that there was a significantdifference in the fecundity and total development period ofthe three different species. The highest fecundity (110 eggs)and lowest total development period (26 days) was observedin case of C. analis as compared to C. chinensis ((80 eggs and30 days) and C. maculatus (82.5 eggs and 29 days). It wasconcluded that soybean was most preferred by C. analis underDharwad conditions.
Screening varieties for pulse beetle resistanceBruchid resistance of pulses can be studied by two tests:
a) Prel iminary f ree choice tests: It is an antixenotic test donew ith the help of an olfactory chamber where the releasedinsects have free access to all the genotypes at a time. Pre-weighed grains of each genotype are kept separately incircular disc-like craters. Five to ten pairs of freshly emerged
adul ts are t ransferred to the central cav ity. This givesinformation about the oviposition preference of bruchids.
b) Force choice (no choice) tests: The genotypes show ingless susceptibility in free choice tests w ill be further subjectedto force choice tests where the genotypes are enclosedseparately in different containers. There is no choice for theinsects since they have access to only one genotype. Thisgives information about the mean development period, percent adult emergence, per cent damage etc.
Factors contributing to seed resistance to pulse beetlesa) Biophysical factors: These include seed size, lustre, colour,seed volume, seed hardness, seed coat thickness, moisturecontent etc.
b) Biochemical factors: This involves soluble and crudeproteins, starch, total soluble sugars (TSS), phenols, tannins,á-amylase inhibi tor (A I), t rypsin and chymotrypsininhibitors, saponins etc.
Duranti and Gius (1997) reported the presence of anti-nutritional factors in soybean and classified them into two:
i) Non protein ant i -nutr i t ional factors: A lkaloids,tannins, phytic acid, saponins and phenols.
ii) Protein ant i -nu tr i t ional factor s: Trypsin andchymotrypsin inhibi tors, lect ins and ant i fungalpeptides.
Varietal screeningGreen gram: The resistance of 85 green gram accessionsagainst C. analis was evaluated by Soumia et al. (2015) andnone was found to be resistant. Two accessions, viz., Km-12-5 and P-5-16 revealed lesser adult emergence of 12.22 and14.29 per cent, respectively. These accessions also recordedprolonged developmental period (25.67 and 26 days) andlesser susceptibility index (0.042 and 0.044, respectively).
Soybean: The resistance studies of 13 soybean varieties tobruchids in storage by Sharma and Thakur (2014a) revealedthat all genotypes except Harasoya were highly preferred byC. maculatus for egg laying. The genotype Bragg was foundto be resistant based on developmental behaviour. GenotypesPb-1, Shivalik, JS-9305, JS-9560 and Harasoya were found tobe relatively tolerant.
Chickpea: A study was conducted to evaluate the resistanceof 15 chickpea cultivars by Shaheen et al. (2006). Seedmorphological characteristics of these cultivars like moisturecontent, seed size, shape and seed coat characters were notedon v isual basis in consultat ion w ith experts. The studyshowed that cultivars w ith hard, rough, w rinkled and thickseed coat proved to be more resistant when compared w ith
54 Journal of Eco-friendly Agriculture 13(2) 2018
Biology, varietal screening and management of pulse beetles in storage
those hav ing smooth, sof t and thin seed coat . Thesecharacteristics demonstrated a significant harmful effect topest appearance and grain damage. The beetles laid most oftheir eggs on cultivars having smooth seed coat, displayingstrong non-preference for genotypes w ith morphologicallyrough seed coat.
Pi geonpea: Investigations on evaluation of p igeonpeagenotypes against bruchid resistance under laboratoryconditions and biochemical basis for bruchid resistance werecarried out by Nagaraja (2006) at University of AgriculturalSciences, Dharwad. The results revealed that, among the 14genotypes of pigeonpea tested, the genotypes w ith lowestprotein content, highest trypsin inhibitor and highest phenolcontent showed significantly low per cent adult emergence,grow th index value, per cent loss of germination, weightloss, highest developmental period (days) and hence, leastsusceptibility to C. maculatus. The presence of high phenolsin seeds is reported to have inhibitory effect on grow th anddevelopment of bruchids.
M anagement of bruchids in storageIn storage, pulse beetles can be managed by different
methods like manipulation of temperature and moisture,manipulation of air, use of inert dusts, use of radiation, useof traps, improved storage structures, use of botanicals, useof entomopathogens and use of chemicals.
a) Sun dryingThe scope of utilising solar energy for disinfecting the
seeds has great potential in management of pests in storage.It has two consequences on the environment of insects viz.,rise in temperature and decrease in relative humidity ofseeds. Preliminary solar drying of seeds is recommended asan effective prophylactic means against oviposition anddamage due to bruchids during the storage of pulses. Yadav(1977) reported that the absorption of heat by solar dryingbeds raised the temperature of the grain bulk from 50 to 55°Cwhich was sufficient to cause mortal ity of C. chinensis.Choudary (2016) reported that, solar heat exposure for 24hours was quite effective and gave no adult emergence ofbruchids, less grain damage and less weight loss in black,blue and red polythene bags. Sharma (2017) reported that,exposure period of 24 hours to solar energy in black andblue coloured bags were the most effective in reducing adultemergence and increasing the adult mortality of C. chinensis.
An experiment was conducted by Pareek and Kumawat(2012) to find out the combined effect of sunshine and thecolour of storage bags against C. chinensis. Cowpea seedswere filled in different coloured polythene bags like black,blue, red, yellow , green, brown and colourless bags. One
hundred newly emerged beetles were released into the sealedbags. The bags were exposed to solar heat from 9.00 am to4.00 pm on the roof of the building in the month of August.The mortality of beetles was recorded at five and seven hoursof exposure periods. The data on mortality of adult beetlesrevealed that the highest mortality of 94 per cent was observedin black coloured polythene at seven hours of exposureperiod, which was followed by blue, red, brown and greenpolythene bags at seven hours of exposure. The highestmortality was exhibited by black polythene bag as blackcolour absorbs maximum solar radiation and the insidioustemperature of the bag might increase. The minimum adultmortality was recorded in colourless polythene bags w ithfive hours of exposure period. The lowest mortality might bedue to the fact that the temperature was relatively less.
b) M odi f ied atmosphere techniqueExp osur e of insects to toxi c concentrat ions of
atmospheric gases i.e., decreased oxygen or increased carbondioxide has been promoted in recent years as a substitute fortoxic chemicals. An alternative mixture of atmospheric gasescan be imposed on a commodity in a gas-tight container. Itaf fects the respiratory metabol ism and hinders insectdevelopment. The most susceptible stages are metabolicallyact ive stages l ike larvae and adul ts. The target gasconcentration for insect toxicity is 3 per cent or less of oxygen.This could be achieved by f lushing an inert space l ikenitrogen which w ill displace oxygen. Applying vacuum orlow pressure to an air tight chamber also decreases theconcentration of atmospheric gases including oxygen. Thetarget gas concentration for insect toxicity is 60 per cent ormore of CO2. This could be achieved by pumping CO2 fromgas generators or by hermetic storage of infested commodity.
Higher CO2 concentrations viz., 40, 60 and 80 per centnot only protected red gram seeds from bruchid infestationand development; but also maintained good germinationand seedling vigour index even after six months of treatment(Krishnaveni, 2012).
Studies on the management of pulse bruchid (C. analis)under modified atmospheric condition was undertaken inpigeonpea by Shivaraja et al. (2013) at Raichur. In differenttreatments, the concentration of O2 and CO2 gases variedbetween 0-20 percentages. Observations like egg count, adultmortality, per cent germination etc. were taken 45 days afterexposure. It was reported that the CO2 concentrations of 15and 20 per cent exposed for 45 days gave cent per centmortality of insects. Further, there was no adult emergencethereby egg lying and per cent weight loss were also nil.There were no adverse effects on seed germination.

Journal of Eco-friendly Agriculture 13(2) 2018 55
R. A. Balikai and Neenu Augustine
An experiment was conducted by Ingabire et al. (2013)to study the interact ive ef fects of d i f ferent oxygenconcentrations and different exposure periods on C. maculatusin green gram. It consisted of two factors viz., oxygenconcentrations (21, 14, 11, 8, 5 and 2% O2 with remainingpercentage being nitrogen) and exposure periods (3, 5 and 7days). The adult mortality was found to be the highest (91.9%)at 2 per cent O2 exposed for seven days compared to otherconcentrations. Among the three exposure periods, thehighest mortality was recorded at seventh day w ith 71.8 percent. The insect mortali ty increased by decreasing theO2concentration or by extending the exposure period to lowO2. They concluded that nitrogen based modified atmospherecould be one of the promising and un-risky methods for pulsebeetle management.
c) IrradiationIrradiation of durable stored products is legal in most
of the countries and can be carried out by using ionizingradiations such as gamma rays and non-ionizing radiationsuch as microwaves or infrared rays. The effect of ionisingrays on different stages of insects is different. Insect eggsand young larvae treated by gamma rays fail to develop intoadults. The treated adults turn to be sterile, which is exploitedas the Sterile Insect Technique. Radiation causes mortalityof insects through cell cycle disruption following damage toDNA Typically, doses of 0.4 kGy (kilogrey) or less are effectivefor killing most insects. However, radiation at dosages ofupto 10 kGy for grain is safe for stored commodities. Theadoption of ionizing irradiation treatments for post harvestproducts is practically minimal.
Soumya (2015) investigated on the effect of gammaradiation on pulse beetle, C. chinensis with objective ofunderstanding the influence of gamma irradiation on itsreproductive ability and various developmental stages. Inorder to evaluate the mating competitiveness of males andfemales, different mating combinations were employed afterexposing them to sterile dose (50 Gy). There were significantdifferences in fecundity as the irradiation doses increased.The number of eggs laid were least when irradiated malespaired w ith irradiated females. It was two-three folds lessercompared to un-irradiated treatment. The number of eggshatched was nil in mating combinations where irradiatedfemales were used. Hence, it was concluded that egg cellsare more sensi t ive to rad iat ion compared to sperms.Releasing irradiated females has a great potential in reducingthe bruchid population. Further, two days old eggs wereselected for i rradiation stud ies and w ere exposed toirradiation doses in range of 0-20 Gy. Hatching of eggs, gruband pu pae form at ion and ad ul t emer gence w ere
significant ly reduced as the dose increased and it wascompletely inhibited at 20 Gy. Further, 15 Gy was found tobe optimum to inhibit grub and pupae formation and adultemergence from irradiated eggs.
d) Inert materialsDiatomaceous earth largely affects C. chinensis survival,
egg laying, mating behaviour, progeny emergence; morethrough hindrance of reproductive behaviour of insects thanstraight mortality (Remya, 2007). Control of pests of storedproducts by desiccation can be facilitated by treatment ofinfested commodities w ith inert materials like sand, kaolin,ash, wood, clays, diatomaceous earth etc. They inducemortality by causing desiccation due to abrasion of cuticle.Based on number of adults emerged per 1000 seeds and percent seed damage, the seed protectants viz., saw dust, sandand dung cake ash were highly effective as compared tountreated control (Sharma and Devi, 2016).
Fly ash, cow-dung ash, acacia bark ash, red soil powderand turpentine oil were tested for their insecticidal potencyby Shaheen and Khaliq (2005) against C. chinensis in storedchickpea. They w ere appl i ed as post-harvest grainprotectants against pulse beetles by treating 50 g of storedchickpea grains at their application rates of 1.0, 0.5 and 0.25grams. The effectiveness of these materials were comparedw ith the untreated grains in terms of mean days needed for100 per cent mortality of F1 emerged pulse beetles. The resultsrevealed that fly ash @ 1.0 g per 50 g of grains showed theminimum of 5.78 days for 100 per cent mortality of releasedadults. All treatments were significantly superior to controlexcept red soil powder @ 0.25 g per 50 g of grains. However,fly ash proved to be the best in reducing bruchid infestationto lower levels followed by turpentine oil and cow dung ashwhile red soil powder and Acacia bark ash were less effectiveat their lower application rates.
The efficacy of different dosages (0.025, 0.05, 0.1, 0.15,0.2, 0.25 and 0.3%) of d iatomaceous earth under roomconditions were evaluated by Matti and Awaknavar (2009).Adult mortality was recorded after one, three and five daysafter releasing adults. Observations on seed damage, weightloss and germination were also recorded at 30 and 60 daysafter treatment. Significantly least number of eggs and leastadult emergence were reported from diatomaceous earth @0.3 per cent which was followed by 0.25 per cent. No seeddamage and no weight loss were recorded in diatomaceousearth @ 0.3 and 0.25 per cent. Also, diatomaceous earth @ 0.3and 0.25 per cent recorded higher seed germination and werefound to be more effective. It was concluded that the fecundityof female C. maculatus fell geometrically w ith increasing rateof diatomaceous earth content.

56 Journal of Eco-friendly Agriculture 13(2) 2018
Biology, varietal screening and management of pulse beetles in storage
e) Use of trapsTamil Nadu Agricultural University has developed a
‘Stored grain insect pest management kit’ which consists ofseveral traps. Of which the traps and devices specific forbruchids are two-in-one trap and egg removal device (http:// www.mohantrap.com).
Two-in-one trap: This trap consists of a cone-shaped pitfalltrap w ith a perforated lid and perforated tube and a collectiontube. It combines the action of probe trap and pitfall trap. It isbest suited for pulse beetles as the adults are seen wanderingon the grain surface.
Egg removal device: This is a device which can successfullycrush the eggs of pulse beetles. There is an inner perforatedcontainer w ith a rotating rod fixed w ith plastic brushes onall sides. The seeds can be kept in the perforated containerand the rod has to be rotated one full circumference clockw iseand anti-clockwise for 10 minutes. The eggs get crushed dueto the splashing action of the brush in the rotating rod.
f ) Improved storage structuresSome of the improved storage structures that can
provide hermetic storage include Bitumen/ coal tar drum,Udaipur bin, Stone bin, Bamboo bin, Baked clay bin, Pusabin, Pusa cubicle and Pusa Kothar.
g) Use of botanicalsThere is a plethora of studies on the use of plant extracts
or whole plant materials for insect control, but only few areused on a commercial scale. I t includes the use of leafpowders, extracts, rhizome powders, edible and non-edibleoils, etc. Sharma et al. (2016) reported that neem oil @ 10 ml/kg completely inhibited oviposition, adult emergence andseed damage by C. maculatus. Groundnut and mustard oilsalso prevented egg laying, reduced population build up andminimized seed damage as compared to control.
Keita et al. (2000) evaluated essential oils extracted fromfour West African plant species (Tagetes minuta L., Hyptissuaveolens (L.) Poit., white basil Ocimum canum Sims and sweetbasil O. basilicum L.) against C. maculatus, and concludedthat plants of the genus Ocimum can be used as an alternativeto synthetic insecticides.
Varma and Anandhi (2010) evaluated seven plantmaterials, viz. dried leaf powders of neem leaf, chilli, neemseed kernel, tulsi leaf, nerium leaf, lantana leaf and tobaccoleaf at 4.0 and 8.0 per cent w / w / 100 grams of mung bean fortheir effects against pulse beetle. All the seven plant productstested in the study significantly caused adult mortality ofthe pulse beetles at 6 days after treatment in comparison tocontrol at 4.0 and 8.0 g/ 100 g grains. The per cent adult
mortality after 2, 4 and 6 days after treatment increased w ithincrease in the level of doses of each powder. The maximumadult mortality was recorded in the treatment of neem leafpowder (38.33%) at all the three doses whereas nerium leaf(4 g) was found least effective w ith 5.70 per cent mortality.
Nalini et al. (2011) used 0.5 per cent ethanolic extractsof fresh leaves of some medicinal plants viz., bael, sweet basil,poduthalai, kalihari, w ild sage, physic nut, Indian privet,palas, custard apple, adulsa and pippal against C. chinensisin cowpea. The results revealed that ethanolic leaf extractsof Lantana camara L., Clerodendron inerme (L.) Gaertn. andLippia nodiflora (L.) Greene at 0.5 per cent w/ v were effectivegrain protectants in suppressing the pulse beetle damage.Average per cent adult mortality was the highest whengrains were treated with L. camara (100%) and L. nodiflora(95.8%) and they significantly differed from other medicinalplant’s leaf extract and acetone control. The fecundity wassignificantly reduced in grains treated with above three plantextracts.
Among powders of aonla fruits, black pepper fruitsand asafoetida rhizomes, black pepper powder @ 5 g/ kgseed was the most effective for protection of black gram seedsagainst bruchids. Di fferent doses of black pepper andasafoetida powder gave successful protection of black gramseeds up to four months of storage (Kumar, 2016).
h) Use of entomopathogensRecent explorations for entomopathogens resulted in
collection of many isolates of EPFs w ith potential for controlof a number of insect pests of stored grains (Adane, 2003).The lowest adult emergence (16.58%) of C. chinensis wasobserved from the treatment w ith Bacillus subtilis (Ehrenberg)Cohn followed by B. subtilis (Pundibari-1) (Bhattacharya andDhar, 2015). A significant delay in the larval, pupal andtotal development period and 100 per cent adult mortality ofC. maculatus was observed after treatment with B. thuringiensiscoated ZnO nano particles @ 25 ìg/ ml. The LC50 value wasestimated to be 10.71 ìg/ ml (Malaikozhundan et al., 2017).
Sugandi (2014) conducted the laboratory evaluation ofBeauveria bassiana (Bals.) Vuill. and Metarhizium anisopliaeagainst C. chinensis in storage. Desired concentrations ofdifferent isolates of B. bassiana and M. anisopliae conidia wereprepared and mixed w ith 250 g of green gram in a glass jarand shaken gently for 2-5 minutes to ensure a thoroughadmixture w ith the grains. The per cent mortality increasedw ith the increase in concentration of the entomopathogenicfungi (EPF). At the highest concentration of 3.5 x10⁸ conidia/g, 82.00 per cent of the adults were killed in period of 10 daysafter infection and was significantly superior over all other

Journal of Eco-friendly Agriculture 13(2) 2018 57
R. A. Balikai and Neenu Augustine
treatments. Significantly highest per cent mortality wererecorded at 10 days after treatment in the treatment w ithhigh fungal concentration of conidia (80.00%). The per centmortality increased w ith the increase in concentration of theEPF. The least (3.00%) mortality was observed in untreatedcontrol and all the treatments differed significantly w ith eachother.
i ) Natural enemiesThere is a guild of insect natural enemies associated
w ith pests of stored products. The important natural enemiesreported from bruchids include: Anisopteromalus calandrae(Howard), Dinarmus basalis (Rond.), Uscana lariophaga Steffanand Xylocoris flavipes (Reuter).
j ) Use of chemicalsChemical insecticides are being utilized to save the
grains for sow ing purpose and for long term storage. It canbe as pre-harvest application, treatment of packing materialsor direct seed treatment.
Pre-harvest application of Malathion dust @ 25 kg/ haor spray ing Malathion 50 EC @ 2 ml/ l are commonlyrecommended. Duraimurugan et al. (2014) reported that thefield applicat ion of Spinosad 45 SC in mungbean andurdbean revealed that seed damage was checked upto 6months in storage. Hosamani (2015) elucidated that the pre-harvest application of malathion 50 EC, NSKE @ 5 per cent,castor oil @ 1 per cent and neem oil were effective in checkingbruchid infestation in storage up to 5 months and highgermination per cent was also observed.
Dusting of Malathion and fumigation with Aluminiumphosphide are commonly recommended for disinfectingpacking material. Lal and Dikshi t (2001) reported thatdeltamethrin 2.8 EC when sprayed at 15 and 25 ml/ m2 onjute sacks filled w ith chickpea gave 76-78 per cent mortalityof C. chinensis upto six months. Sharma (2017) reported thatemamectin benzoate 5 SG @ 2 g/ l was the best treatment forimpregnation of packing material resulting in minimumdamage by bruchids and minimum weight loss. The nexteffective treatment was del tamethrin 2.8 EC @ 3.5 ml/ lfollowed by chlorantraniliprole 18.5 SC @ 0.5 ml/ l.
Vidyasree (2013) studied the effect of fabric treatmenton the incidence of C. maculatus. Insecticide solutions ofparticular concentrations were prepared and treated on thepackaging material w ith 7.5 ml spray fluid for a bag of 30 x40 cm dimension. Then the packaging material were shadedried, chickpea seeds were fi lled in bags and kept inlaboratory under ambient condition for nine months. Theinteractions betw een treatments and packing materialsrevealed the least damage (0.42%) was in HDPE bags treated
by spinosad 45 SC which differed significantly w ith otherinteractions, followed by gunny bags treated with spinosad45 SC (1.00%), HDPE bags treated with deltamethrin 2.8 EC(1.5%) and gunny bags treated w ith deltamethrin 2.8 EC(2.00%). The highest damage was observed in untreatedcontrol and cloth bags which differed significantly w ith allother interactions.
Seed treatmentRajani et al. (2013) reported that spinosad 45 SC was
found to be most effective against C. chinensis and C. maculatuswith LC50 values of 0.24 and 0.05 ppm, respectively. Thenext best treatment was deltamethrin 2.8 EC with LC50 valuesof 0.69 and 0.76 ppm against C. chinensis and C. maculatus,respectively. Thirumalaraju and Jyothi (2016) elucidated thatinsect damage was the least in spinosad 45 SC @ 2 ppm at 3months (0.09%), 6 months (0.31%) and 9 months (0.83%)after storage, closely followed by deltamethrin 2.8 EC @ 2ppm and emamectin benzoate 5 SG @ 2 ppm. However, whenconsidering cost benefit ratio for 3 years, spinosad 45 SCrecorded highest (1:23.85) followed by deltamethrin 2.8 EC.
Parmar and Pat el (2016) evalu ated synthet icinsecticides as seed protectants against bruchids on mungbean. Nine insecticides were evaluated based on adultmortality and impact on germination. For the purpose, eachinsecticide was applied at respective doses to previouslysterilized bulk of 500 g mung bean grains. The bulk of mungbean seeds under each treatment was stored for six monthsin an airtight plastic bottle at room temperature and utilizedfor further observations. Among the different insecticidesdeltamethrin 2.8 EC at 4 ppm was found to be more effectiveagainst C. chinensis in mung bean under storage conditionfollowed by cypermethrin 10 EC at 4 ppm and spinosad 45SC at 4 ppm. These insecticides emerged as more effectiveseed protectants against bruchids in stored mung bean.
IPM in storage Use of less susceptible pulse varieties.
Pre-harvest spray of malathion 50 EC @ 2 ml/ l.
Pods should be harvested as soon as they mature.
Preliminary solar drying of seeds to optimum kernelmoisture level of about 7-8 per cent.
Broken seeds should not be stored for long periods.
Use of improved storage structures, gunny bags, jutebags or air tight beetle-proof containers.
Dip the old gunny bags in boiled water for 15 minutes.
Impregnating the packing material with botanicals like

58 Journal of Eco-friendly Agriculture 13(2) 2018
Biology, varietal screening and management of pulse beetles in storage
neem oil @ 5 per cent or sweet flag powder @ 2 per cent.
Periodical spraying over the bags w ith malathion 50EC @ 10 ml/ l at the rate of 3 litres of spray fluid/ 100m2 or dusting of malathion 5% D.
Mixing the seeds w ith inert materials like sand, ash orclay @ 30 per cent.
Coat the seeds w ith small quantities of vegetable oil@10-15ml/ kg or mix neem leaf powder @ 8 g/ kg ofseeds in the stored grain.
Treating the seeds w ith chemicals like spinosad 45 SC@ 2 ppm for sow ing purposes.
REFERENCESAdane, K. 2003. Development and testing of mycoinsecticides
based on submer ged spores and aer ial conidi a of theentomopathogenic fungi Beauveria bassiana and Metarhiziumanisopl iae (Deuteromycotina: Hyphomycetes) for controlof locusts, grasshoppers and storage pests. Ph. D. Thesis,Georg August Universi ty, Göttingen, Germany.
Bhattacharya, S. and Dhar, T. 2015. Studies on the bio-efficacy ofsome bi opesti ci des on the bi ol ogy of pul se beetl e,Callosobruchus chinensis. International Journal of Bio-resource,Environment and Agricultural Sciences, 1:59-64.
Choudary, S. 2016. Eco-fr iendly management of pulse beetle,Callosobruchus chinensis (Linn.) on lenti l (Lens esculentaMoench). Ph. D. Thesis, Sri Karan Narendra AgricultureUniversi ty, Jobner, Rajasthan, India.
Duraimurugan, P., Mishra, A ., Pratap, A . and Singh, S. K. 2014.Toxici ty of spinosad to the pulse beetle, Callosobruchuschinensi s (Coleoptera: Br uchi dae) and i ts parasi toid ,Dinarmus basalis (Hymenoptera: Pteromalidae). The Ecoscan,8:17-21.
Duranti , M. and Gius, C. 1997. Legume seeds: Protein contentand nutritional value. Field Crops Research, 53:31-45.
Hi ll, D.S. 1993. Pests of Stored Products and Their Controls. BelhavenPress, London, p. 242.
Hosamani, G. B. 2015., Studies on field carryover, managementand host preference of pulse beetle, Callosobruchus chinensis(L innaeus) (Col eopter a: Bruchi dae) i n gr eengram andcowpea. M. Sc. (Agri .) Thesis, Universi ty of AgriculturalSciences, Dharwad, Karnataka, India.
Ingabire, J. P., Hategekimana, A ., Bhuvaneswari , K., Mohan, K.S. and Ganapathy, S. 2013. Management of pulse beetleCallosobruchus maculatus (F.) population by nitrogen basedmodified atmosphere. Journal of Entomological and ZoologicalStudies, 1: 48-52.
Kei ta, S. M., V incent, C., Schmi t, J. P., Ramaswamy, S. andBel anger, A . 2000. Effect of vari ous essential oi ls onCallosobruchus maculatus (F.) (Coleoptera: Bruchidae). Journalof Stored Products Research, 36:355-364.
Krishnaveni, 2012. Effect of modified atmosphere w ith CO2 and
fabric treatment w ith new insecticide molecules againstCallosobruchus chinensis L. in stored pigeonpea. M.Sc. (Agri)Thesis, A charya N. G. Ranga A gricultural Uni versi ty,Rajendranagar, Hyderabad, India.
Kumar, G. 2016. Estimation of quantitative losses in stored blackgram caused by pulse beetle (Callosobruchus chinensis Linn.)and their management. M. Sc. (Agri.) Thesis, Banaras HinduUniversi ty, Uttar Pradesh, India.
Lal, A . K. and Dikshit, A . K. 2001. The protection of chickpea(Cicer arietinum L.) during storage using deltamethrin onsacks. Pesticide Research Journal, 13:27-31.
Malai kozhundan, B., Vaseeharan, B., V i jayakumar, S. andThangaraj, M. P. 2017. Baci llus thuringiensis coated zinc oxidenanopart icle and i ts biopesticidal effects on the pul sebeetle, Callosobruchus maculatus. Journal of Photochemistry andPhotobiology, 174:306-314.
Matti , P. V. and Awaknavar, J. S. 2009. Efficacy of diatomaceousearth (Protect-It) on pulse beetle, Callosobruchus chinensis(L.). Indian Journal of Entomology, 71:60-64.
Nagar aja, M., 2006, Evaluation of pigeon pea and cowpeagenotypes for bruchid resistance (Bruchidae). M. Sc. (Agri .)Thesis, Universi ty of Agricultural Sciences, Dharwad,Karnataka, India.
Nalini , R., Rajavel, D. S., Geetha, A . and Shanthi, M. 2011. Ethanol icleaf extracts of medicinal plants as grain protectant againstCallosobruchus chinensis (Linn.) in cowpea. Annals of PlantProtection Sciences, 19:327-332.
Pareek, Y. and Kumawat, K. C. 2012. Effect of sunshine exposureand d if ferent col our pol ythene bags on pulse beetle,Cal losobruchus chinensis (Linn.). Pest Management inHorticultural Ecosystems, 18:226-227.
Parmar, V, R. and Patel, B, H. 2016. Evaluati on of synthetici nsecticides as seed protectants agai nst pul se beetle,Callosobruchus chinensis Linnaeus on mung bean. Advancesin Life Sciences, 5:6297-6305.
Rajani, B. R., Pati l , R. H. and Awaknavar, J. S. 2013. Efficacy ofnew insecticide seed protectants against major stor ageinsect pests of wheat and cowpea. Karnataka Journal ofAgricultural Sciences, 26:372-374.
Remya, R. 2007. Evaluation of pulse genotypes and efficacy ofd i atomaceous ear th agai nst d i f fer ent l i fe stages ofCallosobruchus chinensis (L.). M.Sc. (Agri .) Thesis, Universi tyof Agricultural Science, Dharwad, Karnataka, India.
Shaheen, F. A . and Khal iq, A. 2005. Management of pulse beetle,Callosobruchus chinensis L. (Coleoptera: Bruchidae) in storedchickpea using ashes, red soi l powder and turpentine oi l .Pakistan Journal of Entomology, 27:19-24.
Shaheen, F. A ., Khal iq, A . and Aslam, M. 2006. Resistance ofchickpea (Cicer arietinum L.) cultivars against pulse beetle.Pakistan Journal of Botany, 38:1237-1244.
Sharma, M. 2017. Bio-ecology and management of pulse beetle,Callosobruchus chinensis (Linn.) on cowpea under storagecondition. Ph. D. Thesis, Sri Karan Narendra Agriculture

Journal of Eco-friendly Agriculture 13(2) 2018 59
R. A. Balikai and Neenu Augustine
Universi ty, Jobner, Rajasthan, India.Sharma, R. and Devi, R. 2016. Evaluation of certain inert materials
against pulse beetle, Callosobruchus chinensis (L.) infestingstored chickpea [(Cicer arietinum (L.)]. International Journalof Agricultural and Al lied Sciences, 2:1-9
Sharma, R., Devi, R., Soni, A ., Sharma, U., Yadav, S., Sharma, R.and Kumar, A. 2016. Growth and developmental responsesof Callosobruchus maculatus (F.) on various pulses. LegumeResearch, 39:840-843.
Sharma, S. and Thakur, D. R. 2014. Comparative developmentalcompatibi l i ty of Call osobruchu smaculatus on cowpea,chickpea and soybean genotypes. Asian Journal of BiologicalSciences, 7:270-276.
Sharma, S. and Thakur, D. R., 2014a, Studies on varietal preferenceof Callosobruchus maculatus on soybean genotypes. AsianJournal of Biological Sciences, 7: 233-237.
Shivaraja, D. B., Mekali , J., Naganagoud, A., Sreenivas, A . G. andKapasi, M. 2013. Studies on the effect of O2 and CO2 gases atdifferent concentrations on the development of pulse beetleCallasobruchus anal is (Fabricius) (Coleoptera: Bruchidae) inchickpea, Journal of Biopesticides, 6:63-67.
Si bi, V. G. 2003. Comparative biology and management ofCallosobruchus spp. infesting soybean and other pulses w ithspecial reference to Callosobruchus anal is (Fabricius). M. Sc.(Agri .) Thesis, Universi ty of Agricultural Sciences, Dharwad,Karnataka, India.
Soumia, P.S., Srivastava, C., Dikshit, H .K. and Pandi, G.G.P. 2015.Screening for resistance against pulse beetle, Callosobruchusanal is (F.) in gr eengr am (Vi gna rad iata (L.) Wilczek)accessions. Proceedings of the National Academy of Sciences,India - Section B: Biological Sciences, 87: 551-558.
Soumya, 2015. Effect of gamma r adi at ion on pulse beetl e,Callosobruchus chinensis (L.) (Coleoptera: Chrysomelidae).M. Sc. (Agri .) Thesis, Universi ty of Agricultural Sciences,Raichur, Karnataka, India.
Sugandi, R. 2014. Entomopathogens for the management of storedgr ain pests. Ph. D. Thesi s, Uni versi ty of Agricul tur alSciences, Dharwad, Karnataka, India.
Thirumalaraju, G. T. and Jyothi, B. L. 2016. Studies on the effect ofnew i nsect i ci d al m ol ecul es as seed tr eatment f ormanagement of pulse beetle, Callosobruchus maculatus (F.)and seed viabi l i ty of cowpea seeds during storage underambient conditions. Mysore Journal of Agricultural Sciences,50:521-528.
Var ma, S. and A nandhi, P. 2010. Biology of pulse beetl e(Callosobruchus chinensis Linn., Coleoptera: Bruchidae) andtheir management through botanicals on stored munggrains in Al lahabad region. Legume Research, 33:38-41.
Vidyasree, A .S. 2013. Biology and management of pulse beetle,Callosobruchus maculatus Fab. on chickpea and screening ofchickpea entr ies for resistance. M . Sc. (A gr i .) Thesis,Universi ty of Agricultural Sciences, Dharwad, Karnataka,India.
Vidyasree, A. S. and Thirumalaraju, G. T. 2015. Seasonal variationin biology of pulse beetle (Cal losobruchus maculatus) onBengal gram under laboratory conditions. InternationalJournal of Tropical Agriculture, 33:1221-1225.
Yadav, T. D. 1977. Efficacy of di fferent solar drying beds in raisingup the temperature. Indian Journal of Entomology, 39:232-236.
http:/ / www .mohantr ap.com - Pr of. Dr. S. Mohan, TNA U,Coimbatore- Personal Webpage.
Manuscript recived on 15.1.2018Manuscript accepted for publication on 20.3.2018

60 Journal of Eco-friendly Agriculture 13(2) 2018
Management of major insect pests of rice through HPR and judicious insecticides applicationJournal of Eco-friendly Agriculture 13(2): 60-64. 2018
©2018
Management of major insect pests of rice through HPR andjudicious insecticides applicationRabindra Prasad, Lakhindar Hembrom, Binay Kumar and Devendra PrasadDepartment of Birsa Agricultural Universi ty, Kanke, Ranchi- 834006 (Jharkhand)Email: [email protected]
A BSTRACT
The experiment was conducted at the farmer ’s field in village Khunte Tola of block and district Simdega inJharkhand with eight rice varieties having three replications in the randomized block design, under protected andunprotected conditions during wet season of 2013 and 2014. Results revealed that the rice variety Naveen registeredlowest silver shoot due to gall midge (Orseolia oryzae) (1.85%) under protected conditions, which was almost at parwith 0.1 R-36 (1.98%) and Lalat (2.02%). As regards, yellow stem borer, Scirpophaga incertulus infestation, the Lalatvariety under protected conditions showed minimum incidence of dead hearts (2.2%) against maximum of 3.5 percent in Naveen. Varieties IR-36, Lalat and Naveen recorded lower incidence of gall midge silver shoot and yellow stemborer dead hearts as well as ear heads under protected conditions, showing tolerance against the susceptible varieties,IR-64, Birsa Mat i, PAC-801, PAC-807 and TN-1. The findings suggest that pest susceptible varieti es require moreinsecticidal protection as compared to those of the pest resistant/ tolerant varieties. Moreover, need based protectionmeasures proved effective in general irrespective of the varieties grown for enhancement of grains yield. As such,higher yield enhancement to the tune from 28.72 to 40.97 q ha-1; 24.92 to 40.85 q ha-1; 24.92 to 39.34 q ha-1; 27.20 to37.97 q ha-1 and 30.38 to 37.30 q ha-1 were obtained in case of the test rice varieties viz. PAC-807, Naveen, Birsa Mati,IR-64 and PAC-801 due to enforcement of varietal intervent ion coupled wi th need based insect icidal protect ion.Hence, HPR and need based insecticide application could form one of the effective tool for minimizing yield losscaused by the major insect pests of rice.
Key words: Rice, HPR, stem borer, gall midge, insecticide, pest management, yield.
Rice (Oryza sativa L.) is the most important staple foodcrop of Jharkhand. It is grown in about 18 lakh hectare ofland in wet season. Yellow stem borer (Scirpophaga incertulasWLK.) and gall midge (Orseolia oryzae WM) are two majorinsect pests of rice, in the state of Jharkhand, causing loss inyield from 12 to 25 percent. (Dhaliwal and Arora 1996; Pasaluet al. 2004; Prasad and Prasad 2006). In the rice gall midgeendemic areas of Jharkhand, the pest (Orseolia oryzae) couldbe able to cause loss in yield of rice ranging from 10-40 percentdepending upon the choice of rice varieties and weatherconditions prevailing in the cropping season (Prasad 2011).Insecticides is the most effective tool for managing the pestof the crop. Small and marginal farmers occupy the majorareas of rice in the state. They are often unable to afford thecostly chemical insecticides. Hence, use of host plantresistance (HPR) in rice cultivation may be able to reduce thequantity and frequency of use of insecticides for sustainablecrop production. Hence, eight commonly grown rice varietieswere taken under unprotected and protected conditions forascertaining the impact of integration of HPR and needbased application of the recommended insecticide on themajor insect pest viz., YSB and gall midge and their ultimateeffect of yield of rice in the present experimentation.
M ATERIALS AND M ETHODSThe experiment was conducted in the field in wet season
during 2013 and 2014 in the farmer’s field in village : KhuntiToli (Block & district : Simdega) in order to study the impactof varietal resistance and need based use of the recommendedinsecticides. There were eight common rice varieties viz. IR-64, IR-36, Lalat, Naveen, Birsa Mati, PAC-807, PAC- 801 andTN-1. These test rice varieties were grown in each of theprotected and unprotected conditions. As such, 16 treatmentcombinat ions w ere kept in three repl icat ions in therandomized block design with plot size of 5×4 square meter.Transplanting of rice seedlings were made on 11th Augustduring 2013 and 2014. Need based foliar spraying wasprovided w ith the alternated use of chlorpyriphos 20 EC @2.5 litre ha-1 and monocrotophos 36 SL @ 1.5 litre ha-1. Assuch, two foliar sprays were provided at 25 and 75 DAT(day after transplanting). First spray w ith monocrotophos36 SL @ 1.5 litre ha-1 was made at 45 DAT and 2nd spray w iththe same insecticide was made at milking stage of the crop.Observation on the incidence of gall midge was recorded at50 DAT and that on yellow stem borer in terms of dead heart(DH) was registered at 45 DAT and in terms of white earhead (WEH) was taken at the maturity stage of the crop. The

Journal of Eco-friendly Agriculture 13(2) 2018 61
Rabindra Prasad, Lakhindar Hembrom, Binay Kumar and Devendra Prasad
total number of tillers and number of silver shoots (SS) werecounted on 10 randomly selected plants (hills) for calculatingpercentage of silver shoot (SS%) caused by gall midge. Totalnumber of tillers and number of dead hearts (DH) and totalnumber of panicles and number of white ears head (WEH)were counted on 10 randomly selected plants (hills) forcalculating percentage of dead hearts and white ear heads(WEH) caused by yellow stem borer. Yield of grains wererecorded after harvesting at attainment of proper maturityof the crop on the middle of November during both of theyears of experimentation. The data were subjected to thestatistical analysis after suitable transformation for theirinterpretation and draw ing the conclusion.
RESULTS AND DISCUSSION
M anagement of gal l midge (Orseol ia oryzae W.M.)The two year’s results (Table-1) revealed that the pest
incidence in the form of silver shoot (SS) ranged from 6.10per cent SS (IR-36) to 48.0 per cent SS (TN-1) in theunprotected condition and 1.85 per cent SS (Naveen) and13.09 per cent SS (TN-1) in the protected conditions of ricecultivation. Relatively little higher incidence of gall midgein the form silver shoot w as recorded during 2013 ascompared to that of 2014. In general, significantly lowerincidence of SS was found under protected condition ascompared to that of unprotected conditions in case of all theeight respective rice varieties, during the both the years ofexperimentations. IR-36, Lalat and Naveen in the protectedconditions registered significantly lower incidence of the pestin form of SS (%) during both the years as compared to that ofunprotected condtions. The highest incidence of silver shoot(SS%) to the tune of 55.60 and 40.50 percent were recorded invariety, TN-1 during, 2013 and 2014, respectively in theunprotected conditions. The lowest incidence of the pest(2.44% SS) was registered in case of Naveen during, 2013.which remained at par with that of Lalat (2.58 % SS) and IR-36 (2.66% SS), respectively grown under the need basedprotection measures during 2013. Almost similar trends inthe suppression of gall midge incidence were observed inthe second year of experimentations (ie. 2014) as that of thefirst year (ie. 2013) under the influence of varietal resistanceand need based protection provided w ith foliar sprayapplied w i th mococrotophos 36 SL @ 1.5 l i t ha-1 andalternated w ith chlorpyriphos 20 EC @ 2.5 lit ha-1.
Based on the pooled results of two years experiment,lowest incidence of gall midge (1.85% SS) was obtained incase of Naveen in the protected condition which was at parw ith those of IR-36 (1.98% SS) and Lalat (2.02% SS),respectively. Prasad et al. (2012) reported signi ficantlyminimum incidence of gall midge in case of rice varieties
viz. Lalat, Suraksha and BG-380-2 when grown under theneed based insecticidal protection measures. As such, thefindings of Prasad et al. (2012) were in the consonance w iththe present stud ies. The over all results of the presentexperimentation revealed that judicious and need basedprotection measures proved to be significantly effective ingeneral, irrespective of the rice variety, weather resistance/tolerant or susceptible varieties to the pest grown for thesuppression of the pest species. The findings are also inconformity w ith that of the results obtained by Prasad andPrasad (2011) and Prasad et al. (2012). Overall, it wasinteresting to note that significantly higher suppression ofthe pest in the case of the pest susceptible rice varieties vizTN-1, Birsa Mati, IR-64, PAC-801 and PAC-807, ranging from48.05 to 13.09, 37.00 to 12.86, 27.90 to 11.10, 23.45 to 12.30and 27.50 to 10.26 percent incidence of gall midge ascompared to those of the resistant/ tolerant varieties viz;Naveen, Lalat and IR-36 receiving relatively lower reductionin the pest ranging from 7.16 to 1.85, 7.04 to 2.02 and 6.10 to1.98 percent silver shoot were obtained when need basedinsecticidal protection were provided in the present studies.
Table 1. Ef f ect of host p lant resist ance (HPR) andinsecticides on the incidence of gall midge (Orseoliaoryzae Wood Mason) during 2013 & 2014.
Fi gur es under the par entheses cor r espond to angul artransformed values.DAT- Days after transplanting P0-No protectionP1-Need based protection through insecticidal appl ication
Percentage of sil ver shoot (SS%) recorded at 50 DAT
Rice vari eti es Control measures
2013 2014 M ean
2013 & 2014 P0 29.50(32.90) 26.30(30.85) 27.90(31.88) IR-64 P1 13.60(21.64) 8.60(17.05) 11.10(19.46) P0 6.70(15.00) 5.50(13.56) 6.10(14.30) IR-36 P1 2.66(9.28) 1.30(6.55) 1.98(7.92) P0 7.88(16.22) 6.20(14.42) 7.04(15.39) Lalat P1 2.58(9.19) 1.46(6.92) 2.02(8.23) P0 8.53(16.95) 6.80(15.12) 7.16(15.50) Naveen P1 2.44(8.91) 1.26(8.62) 1.85(7.71) P0 39.40(38.88) 34.60(36.03) 37.00(37.47) Birsa Mati P1 15.40(23.11) 10.33(18.72) 12.86(20.96) P0 29.40(32.83) 25.60(30.40) 27.50(31.63) PAC-807 P1 12.15(20.40) 8.38(16.79) 10.26(18.67) P0 26.30(30.85) 20.60(26.99) 23.45(28.96) PAC-801 P1 15.00(23.19) 9.60(18.05) 12.30(20.53) P0 55.60(48.22) 40.50(39.52) 48.05(43.88) TN-1 P1 14.88(22.63) 11.30(19.64) 13.09(21.22)
SEm(±) (2.37) (2.02) (2.16) CD(P=0.05) (6.89) (5.86) (3.53)
CV(%) (17.65) (17.83) (17.54)

62 Journal of Eco-friendly Agriculture 13(2) 2018
Management of major insect pests of rice through HPR and judicious insecticides application
M anagement of yel low stem borer (Sci rpophaga incertulasWalker)
The incidence of dead heart (DH) was recorded at 50days after transplanting (DAT) and that of white ear (WE) atmaturity stage of the crop during the experiment conductedduring wet season of 2013 and 2014. The result (Table-2)revealed that none of the eight test rice varieties were freefrom the pest attack. The extent of attack of YSB (Scirpophagaincertulas), in terms of dead heart (DH) and white ear (WE)was remained almost higher during the second year (2014)as compared to that of 1st year (i.e. 2013) in general under inboth the protected and unprotected situations (Table-2).Significantly lower incidence of dead heart (DH) and whiteear (WE) was also observed in the respective test rice varietiesin the protected condition (P1). Than under unprotectedcondition (P0) in the corresponding varieties during boththe years of experimentations.
The minimum percent of dead heart (DH) of 1.75 and2.70 percent were recorded in case of Lalat during 2013 and2014, respectively in the protected conditions. Varieties atIR-36 (1.8 & 3.5% DH), Naveen (2.9 & 4.12% DH) and BirsaMati (3.8 & 5.3% DH) remained at par under the protectedcrop situations. Almost similar observations were recordedin case of pooled results of the two years field investigations.
It is interesting to note that unprotected crop of pest tolerantrice varieties, IR-36, Naveen and Lalat received significantlylower incidence of dead heart as compared to the susceptiblevarieties viz, IR-36, Birsa Mati , PAC-801, PAC-807 and TN-1 in the unprotected conditions during both the years. Prasadand Prasad (2011) reported that rice entries SKL-7-61-9-10-12 and BG-380-2 suffered from the lowest incidence of ofYSB where as JGL-3855, DJP-1998-11-1-1 and Birsa Matiharboured higher pest incidence.
Prasad et al. (2012) reported that among five commonrice varieties, in general, the protected crop received lowerincidence of the prevailing major insect pest species viz, gallmidge, YSB and leaf folder as compared to that of unprotectedcrop. They observed that the pest resistant rice varieties viz.,BG-380-2, Lalat and Suraksha had signif icantly low erincidence of all the three major insect pest species ascompared to those of the susceptible varieties viz, Jaya andPusa Basmati-(PB-1) grown in the protected condition. Thesefindings are almost in close conformity with that of the resultsof the present studies.
Almost similar trends of varietal response was noticedin case of incidence of white ear head (WEH) too duringboth the years (Table-2). As such, judicious protection proved
Table 2. Effect of host plant resistance (HPR)and insecticides on the incidence of yellow stem borer (Scirpophaga incertulas)during 2013 & 2014.
Figures under the parentheses correspond to angular transformed values.DAT- Days after transplantingP0-No protection; P1-Need based protection through insecticidal appl ication
Dead heart (DH % recorded at 50DAT) White ear (WE% at maturity of the crop) Rice Vari eties Control
M easures 2013 2014 M ean 2013 & 2014
2013 2014 Mean 2013 & 2014
P0 14.30(22.22) 18.30(25.33) 16.30(23.81) 9.40(17.85) 6.41(14.65) 7.90(16.32) IR-64 P1 5.80(13.94) 6.70(15.00) 6.25(14.48) 4.36(12.04) 2.14(8.43) 3.25(10.39) P0 8.30(16.74) 12.50(20.79) 10.40(18.81) 6.15(14.36) 5.16(13.11) 5.65(13.69) IR-36 P1 1.80(7.71) 3.50(10.78) 2.65(9.28) 1.56(7.15) 1.23(6.42) 1.39(6.67) P0 5.60(13.69) 8.50(17.05) 6.45(14.71) 6.06(14.24) 5.44(13.44) 5.75(13.81) Lalat P1 1.75(7.49) 2.70(9.46) 2.22(8.53) 2.15(8.43) 1.94(7.92) 2.04(8.23) P0 6.70(15.00) 9.95(18.34) 8.32(16.74) 7.36(15.73) 5.19(13.11) 6.27(14.48) Naveen P1 2.90(9.81) 4.12(11.75) 3.51(10.78) 3.14(10.22) 1.88(7.71) 2.51(9.1) P0 12.3(20.53) 16.70(24.12) 14.50(22.38) 9.70(18.15) 7.66(16.00) 8.68(17.1) Birsa Mati P1 3.80(11.24) 5.30(13.31) 4.55(12.25) 4.80(12.66) 2.18(8.45) 3.49(10.7) P0 14.49(22.30) 19.30(26.06) 16.85(24.20) 12.60(20.79) 10.13(18.58) 11.36(19.68) PAC-807 P1 6.30(14.54) 7.20(15.56) 6.75(15.00) 3.40(10.63) 1.98(7.92) 2.69(9.37) P0 10.70(19.09) 14.30(22.22) 12.50(20.70) 9.42(17.85) 6.80(15.12) 8.11(16.54) PAC-801 P1 5.70(13.81) 6.150(14.36) 5.92(13.18) 4.36(12.04) 2.14(8.43) 3.23(10.39) P0 16.40(23.89) 22.30(28.18) 19.35(26.09) 11.46(19.77) 9.38(17.80) 10.42(18.81) TN-1 P1 8.31(16.74) 8.33(16.74) 8.32(16.74) 4.3(11.97) 2.88(9.63) 3.59(10.86)
SEm(±) (1.60) (1.64) (1.62) (0.69) (0.61) (0.65) CD(P=0.05) (4.65) (4.76) (2.64) (2.02) (1.78) (1.05)
CV(%) (17.99) (15.85) (16.90) (8.68) (9.15) (8.76)

Journal of Eco-friendly Agriculture 13(2) 2018 63
Rabindra Prasad, Lakhindar Hembrom, Binay Kumar and Devendra Prasad
to be signif icant ly more ef fective in general in the forenhancement of grain yield irrespective of the rice varietiesgrown in the agro-climatic condition of Jharkhand.
Ef fect of HPR (host p lant resi stant) and i nsect icidalappl ication on rice grain yield
The results shown in (Table-3) showed relatively somewhat lower rice grain yields during 2014 probably due tohigher pest incidence than in the year 2013. It was alsoobserved that the protected crop gave rise to higher grainyield as compared to those of unprotected ones in almostall the eight tests rice varieties during both of the year ofexperimentation. Pooled results of two years data followedalmost similar trends in terms of yield enhancement due toprotection measures provided to the crop. It is establishedfact that yield of different varieties is regulated by geneticyield potential of the crop varieties as well as effect of otherbiotic and abiotic factors prevailing in the agro-ecosystem.Higher yield enhancement to the tune of 28.72 to 40.97 qha-1; 24.92 to 40.85 q ha-1; 24.92 to 39.34 q ha-1; 27.20 to 37.97q ha-1 and 30.38 to 37.30 q ha-1 were obtained in the ricevarieties, PAC-807, Naveen, Birsa mati, IR-64 and PAC-801,respectively due to enforcement of varietal interventioncoupled w ith need based insecticidal protection. The results
pertaining to the grains yields obtained during the individualexperimental years 2013 and 2014 followed more or lesssimi lar trends in the present studies. The experimentalfindings of Prasad and Prasad (2011) and Prasad et al. (2012)are in close conformity w ith the results of the present studies.
The perusal of results (Table-4) indicated gain in yieldranging from 23.10 percent (PAC-801) to 57.86 percent (BirsaMati) through alternated and need based foliar sprays withmonocrotophos 36 SL and chlorpyriphos 20 EC @ 1500 mland 2500 ml ha-1, respectively over the unprotected set of therespective varieties. The result also indicated loss in yieldvarying from 18.77% (PAC- 801) to 36.65% (Pusa Basmati-1)over the protected set of the respective varieties.
It was interesting to note a relatively higher yield losses(24.22 to 36.65%) in cases of susceptible varieties viz. IR-64(28.36%), Birsa Mati-1 (36.65%), PAC- 807 (29.89%) and TN-1 (24.22%) as against that of pest resistant (tolerant) varietiesviz. IR-36 (19.20%) to Naveen (31.08%). Prasad et al. (2012)obtained more or less similar results indicating higher yieldlosses from 34.56 to 36.23 percent in cases of Jaya and PusaBasmati-1 as against lower yield losses to the tune of 11.34,16.80 and 20.31 percent in the resistant varieties, Suraksha,Lalat and BG-380-2, respectively. The findings thus suggestthat pest susceptible varieties require more insecticidal
Table 3. Ef f ect of host p lant resist ance (HPR) andinsecticides on yield of grains of rice during 2013& 2014.
P0-No protectionP1-Need based protection through insecticidal appl ication
Yield of r ice grains (q ha-1) Rice varieti es Control measures
2013 2014 M ean 2013 & 2014
P0 24.80 29.60 27.20 IR-64 P1 39.15 36.80 37.97 P0 29.70 29.60 29.65 IR-36 P1 37.20 35.70 36.45 P0 28.75 30.90 29.82 Lalat P1 39.88 37.20 38.54 P0 27.46 28.70 28.15 Naveen P1 42.41 39.30 40.85 P0 26.44 23.40 24.92 Birsa Mati P1 38.30 40.38 39.34 P0 30.14 27.30 28.72 PAC-807 P1 44.15 37.80 40.97 P0 32.16 38.60 30.38 PAC-801 P1 46.30 38.30 37.30 P0 23.75 24.50 25.62 TN-1 P1 35.33 34.70 35.01
SEm(±) 1.50 1.16 1.36 CD(P=0.05) 4.36 3.37 2.22
CV(%) 7.64 5.99 7.12
Total cost of two spray each of monocrotophos 36 SL @ 1500 mlha-1 and chlorpyriphos 20 EC @ 2.5 l i t ha-1 including cost of labourRs. 3,800 ha-1.
Table 4. Gain and loss in yield due to protection measures(based on mean yield of 2013 & 2014)
Addi ti onal gain in yield over the un
protected crop Rice vari eties
Protection measures treatment
Grain yi el d
(q ha-1) (q ha-1) (%)
Avoida-ble l oss i n yi el d
(%)
Protection (P1) 37.97 10.77 39.59 -- IR-64 No protection (P0) 27.20 -- -- 28.36 Protection (P1) 36.45 7.00 27’76 -- IR-36 No protection (P0) 29.45 -- -- 19.20 Protection (P1) 38.54 8.72 29.24 -- Lalat No protection (P0) 29.82 -- -- 22.62 Protection (P1) 40.85 12.70 45.11 -- Naveen No protection (P0) 28.15 -- -- 31.08 Protection (P1) 39.34 14.42 57.86 -- Birsa Mati No protection (P0) 24.92 -- -- 36.65 Protection (P1) 40.97 12.25 42.65 -- PAC-807 No protection (P0) 28.72 -- -- 29.89 Protection (P1) 37.30 7.00 23.10 -- PAC-801 No protection (P0) 30.30 -- -- 18.77 Protection (P1) 35.01 8.48 33.09 -- TN-1 No protection (P0) 25.62 -- -- 24.22

64 Journal of Eco-friendly Agriculture 13(2) 2018
Management of major insect pests of rice through HPR and judicious insecticides application
protection as compared to those of the pest tolerant/ resistantrice varieties. Moreover, need based and judicious insecticidalprotection measures proved to be considerably effective, ingeneral, irrespective of the varieties grown for enhancementin their grains yield.
It may be concluded that the rice varieties IR-36, Lalatand Naveen proved to be promising and considerablyresistant to gall midge and yellow stem borer, resulting ingrains y ields of 29.65, 29.82 and 28.15 q ha-1 in theunprotected condition as well as 36.45, 38.54 and 40.85 qha-1 in the protected conditions. However, impact of needbased protect ion measures could be more effect ive insusceptible varieties viz IR- 64, Birsa Mati, PAC- 807, PAC-801 and TN- 1 in terms of reduction in the incidence of gallmidge and yellow stem borer result ing in considerableenhancement of yields.
REFERENCESDhaliwal, G.S. and Arora, R. 1996. An estimation of yields losses
due to insect pests in Indian Agriculture. Indian Journal ofEcology, 23: 70-73.
Pasalu, I .C, Var ma, N.R.G. Kr ishnaiah, and Katti , G. 2004.Pheromones: Its scope in IPM in r ice. In Souvenir NationalSeminar on Trends in Pheromone Research and Technology heldon 6th and 7th of February 2004, NRCG (ICAR) Junagadh Pp 56-71.
Prasad, R. and Prasad, D. 2006. Account of insect pest problem inrice ecosystem in Ranchi. Indian Journal of Entomology, 68:240-246.
Prasad, R. 2011 Status of the r ice gal l midge (Orsealia oryzae WM ).Journal of Rice Research, 4: 19-20.
Prasad, R. and Prasad, D. 2011. Management of major insect pestsof r ice through host plant r esistance and need basedjudicious appl ication of insecticides. Journal of Appl iedZoological Researches, 22: 41-44.
Prasad, R., Hembrom, L., Prasad, K., Singh, D.N. and Prasad, D.2012. Integrated management of major insect pests throughH PR and jud i ci ous appl i cati on of i nsecti ci des forsustai nable cult ivat ion of r ice under changed cl imaticconditions. In: Souvenir and Abstract of Research Papers. Pp.120, 3rd National Symposium on Agricultural production andProtection in the context of the cl imate change, held at BirsaAgricultural Universi ty Ranchi on 03-05th November, 2012.
Manuscript recived on 13.1.2018Manuscript accepted for publication on 27.5.2018

Journal of Eco-friendly Agriculture 13(2) 2018 65
S.S. Gurav, V.V. Shinde, S.M. Wankhede and R.G. KhandekarJournal of Eco-friendly Agriculture 13(2): 65-67. 2018
©2018
Coconut (Cocos nucifera L.) is one of the traditional cropknown as “Kalpavriksha” grown in Kerala, Karnataka,Tamil Nadu, Andhra Pradesh, Orissa, Maharashtra, WestBengal and Gujarat. The crop provides food, shelter, fuel,medicine and employment to millions of people in the tropics(Venkatesan et al. 2008). Now a days, coconut plantation iscontinuously increasing and there is a w ide scope tocultivate coconut as a commercial crop in future. Amongvarious insect pests infesting coconut palm, coconut blackheaded caterpillar, Opisina arenosella Walker (Lepidoptera:Crytophasidae) stands out as predominant leaf feeder. Thelarvae feed on the parenchymatous tissues on the undersurface of the leaflets and construct galleries along w ith silkand excreta. Under favourable conditions the pest multipliesrapidly and devastates the leaf lamina. The caterpillar canattack palms of any age from nursery to grown up plantscausing yield reduced to half (Subaharan , 2008 ).
The coconut ecosystem is r ich in predators andparasitoids. In India, 43 species of parasitoids and 51 speciesof predators have been recorded on coconut black headedcaterpillar, O. arenosella. Among them Goniozus nephantidisMuesebeck is a dominant parasitoid and is responsible incontrolling the populations build up of O. arenosella upto theextent of 60 to 70 per cent. The desirable characteristics ofthe parasitoid like easy mass multiplication w ith an alternatehost, gregarious nature and high fecundi ty makes theparasitoid promising to be used for controlling the pestpopulation under field condition (Nisha et al, 2006). Hence,G. nephantidis is being w idely used in the biological controlprogramme (Venkatesan et al., 2007).
Impact of pre-conditioned larval parasitoid, Goniozusnephantidis Muesback on coconut black headed caterpillarOpisina arenosella WalkerS.S. Gurav, V.V. Shinde, S.M. Wankhede and R.G. KhandekarAICRP (Palms), Regional Coconut Research Station, Bhatye, Ratnagiri – 425 612, Maharashtra, India
Abstract
The investigation carried out at Bio-control laboratory, RCRS, Bhatye, Dist. Ratnagiri with three treatments viz.,pre-conditioned parasitoid, unconditioned parasitoid and control in ten replications during the year 2012-13 to 2014-15 revealed that the pre-conditioning of the parasitoid G. nephantidis with frass and damaged coconut leaves at thetime of mass multiplication of the parasitoid in the laboratory had more impact on parasitization of coconut blackheaded caterpi llar in the field. The average number of parasi tized larvae/ leaflet under pre-condi tioning of t heparasit oid w as 12.99, 11.96 and 11.46 compared 10.76, 8.49 and 6.84 w ith unconditi oned parasitoids after fir st,second and third months, r espectively. It is therefore recommended that the pre condi tioning of the parasitoid,Goniozus nephantidis with frass and damaged coconut leaves should be done while r earing the parasitoid in thelaboratory for maximizing parasitization of coconut black headed caterpillar.
Keywords: Coconut, Black headed caterpillar, Opisina arenosella Walker, Goniozus nephantidis Muesebeck
Keeping in mind the importance of G. nephantidis in themanagement of coconut black headed caterpillar and toincrease its efficiency this field experiment was conducted.
M ATERIALS AND M ETHODSThe experiment was conducted at Regional Coconut
Research Station, Bhatye, Ratnagiri (M.S.) from the year 2012-13 to 2014-15 on Palm w ith three t reatments and tenreplications. The larval parasitoid, Goniozus nephantidis, weremass multiplied in the laboratory for conducting experimentw ith pre-conditioning of parasitoids w ith a view to improvethe potency of parasitization during mass production of theparasitoid. For olfactory conditioning, the parasitoids wereexposed to odor of larval frass and larval damaged leaves ina test tube of 15 cm long and 3 cm diameter. Such pre-conditioned and unconditioned parasitoids were releasedin the coconut orchard @ 20 parasitoids palm -1. Four releaseswere made at the interval of 10 days during the experimentalperiod. Each t reatment was replicated on 10 palms. Anuntreated control check was maintained to study the naturalparasi t ism. Randomized Block Design w as used forstatistical analysis.
The t reatments comprised of T1-release of pre-condit ioned parasi toids, T2-release of uncondi tionedparasitoids and T3-No release (Control)
Observations were recorded once in month on pretreatment population level of O. arenosella (number of larvaepupae-1 palm -1 (10 leaflets from middle region of the leaf),post t reatment parasitization level and post treatmentpopulation of O. arenosella.

66 Journal of Eco-friendly Agriculture 13(2) 2018
Impact of pre-conditioned larval parasitoid, Goniozus nephantidis Muesback on coconut black headed caterpillar Opisina arenosella Walker
The number of parasitized larvae of O. arenosellarecorded from ten leaflets of the middle region of the leaf wasaveraged into number of parasitized larvae per leaflet. Datathus obtained was converted into square root transformationand analyzed statistically.
RESULTS AND DISCUSSIONData from Table 1 (2012-13) revealed that after one
month the treatments pre-conditioned and unconditionedparasitoid were statistically significant over control but atpar w ith each other. Same trend was observed after twomonths of release. Whereas after three months the treatmentT1 i.e. pre-conditioned parasitoids was significantly superiorover other two treatments. The maximum parasitization of18.00 larvae was observed in pre-conditioned parasitoids.During the year 2013-14, same trend was observed after oneand two months. After three months the treatment T1 recordedmaximum parasitized larvae (11.00) and it was significantly
superior over rest of the treatments. During the year 2014-15,after one month the treatments T1 and T2 were statisticallysignificant over control but at par w ith each other. After twoand three months, treatment T1 i.e. pre-conditioned parasitoidwas significantly superior over other two treatments andrecorded 9.70 and 6.90 parasitized larvae of coconut blackheaded caterpillar by G. nephantidis. Pooled data of threeyears (Table 4) revealed that the treatments pre-conditionedand unconditioned parasitoids were at par w ith other afterone and two months after release. Whereas the treatment,release of pre-conditioned parasitoids (T1) was significantlysuperior over rest of the treatments after three months andrecorded 11.16 parasitized larvae by G. nephantidis.
The results revealed that the pre-conditioning of theparasitoid G. nephantidis w ith frass and damaged coconutleaves at the time of mass multiplication of the parasitoid inthe laboratory had more impact on parasitization of coconut
Table 1: Effect of pre-conditioned parasitoid, G. nephantidison parasitization of O. arenosella (2012-2013)
* Figures in parenthesis are square root transformation
A verage N o. of par asi t i zed l arv ae l eaf l et - 1
(Post rel ease coun t af t er mon ths)
Treatment Pr e rel ease coun t of
unparasi ti zed O. arenosel l a
l ar vae one tw o t hree T1 (Pr e-condi t i oned)
18.20 (4.37)
12.90 (3.71)
14.20 (3.87)
18.00 (4.35)
T2 (Uncondi ti oned ) 18.00 (4.35)
10.30 (3.19)
12.30 (3.62)
14.10 (3.88)
T3 (Contr ol ) 19.50 (4.50)
1.20 (1.45)
0.60 (1.23)
0.00 (1.00)
S.E.± 0.07 0.19 0.16 0.06 C.D. at (5%) N .S. 0.55 0.46 0.16
Table 2: Effect of pre-conditioned parasitoid, G. nephantidison parasitization of O. arenosella (2013-2014)
* Figures in parenthesis are square root transformation
A verage N o. of Par asi t i zed l arvae
l eaf l et -1 (Post r el ease cou nt af ter
month s)
Treatment Pr e r el ease
count of u nparasi ti zed O. aren osel l a
l ar vae one tw o thr ee
T1 (Pr e-condi t i oned)
17.10 (4.23)
13.90 (3.84)
12.70 (3.69)
11.00 (3.44)
T2 (Uncondi ti oned) 17.90 (4.33)
13.20 (3.74)
10.80 (3.41)
7.80 (2.93)
T3 (Contr ol ) 17.40 (4.28)
1.50 (1.54)
0.60 (1.25)
0.50 (1.20)
S.E.± 0.11 0.11 0.12 0.15 C.D. at (5%) N .S. 0.32 0.33 0.43
Table 3: Effect of pre-conditioned parasitoid, G. nephantidison parasitization of O. arenosella (2014-2015)
* Figures in parenthesis are square root transformation
A vg. N o. of par asi t i zed l arv ae l eaf l et - 1
(Post r el ease count af ter months)
Tr eatment Pre r el ease count of
u nparasi ti zed O. aren osel l a
l ar vae one tw o th ree
T1 (Pr e-condi t i oned) 19.00 (4.46)
12.70 (3.68)
9.70 (3.25)
6.90 (2.79)
T2 (Uncondi ti oned ) 18.40 (4.37)
10.40 (3.36)
4.10 (2.21)
1.80 (1.60)
T3 (Contr ol ) 18.70 (4.42)
1.80 (1.59)
1.20 (1.42)
0.30 (1.12)
S.E.± 0.14 0.13 0.15 0.13 C.D. at (5%) N .S. 0.39 0.44 0.38
Table 4 : Pooled data of effect of pre-conditioned parasitoid,G. nephantidis on parasitization of O. arenosella(2012-13, 2013-14, and 2014-15)
* Figures in parenthesis are square root transformation
A vg. N o. of par asi t i zed l arvae l eaf l et -1
(Post r el ease count af ter months)
Treatment Pr e rel ease cou nt of
unp ar asi t i zed O. arenosel l a
l arvae one tw o t hr ee
T1 (Pr e-condi t i oned) 18.01 (4.36)
12.99 (3.74)
11.96 (3.60)
11.46 (3.53)
T2 (Uncondi ti oned) 17.92 (4.35)
10.76 (3.43)
8.49 (3.08)
6.84 (2.80)
T3 (Contr ol ) 18.36 (4.40)
1.34 (1.53)
0.69 (1.30)
0.23 (1.11)
S.E.± 0.05 0.11 0.25 0.26 C.D. at (5%) 0.15 0.32 0.69 0.67
Journal of Eco-friendly Agriculture 13(2) 2018 67
S.S. Gurav, V.V. Shinde, S.M. Wankhede and R.G. Khandekar
black headed caterp i l lar in the f ield compared tounconditioned parasitoids.
The study concludes that the pre- conditioning of theparasitoid, Goniozus nephantidis w ith frass and damagedcoconut leaves helped in maximizing the parasitization ofcoconut black headed caterpillar in laboratory rearing of theparasitoid.
REFERENCESNisha, M .M., Mal l i k, B. and Mural idhar an, K . (2006) M ass
production of Goniozus nephantidis, the parasitoid of coconutblack headed caterpi llar, Opisina arenosel la. Indian CoconutJournal , 37: 69-72.
Subaharan, K. (2008) Educating the parasitoids: Olfactory learningin Goniozus nephantidis Muesbeck, the parasitoid of coconutblack headed caterpi l lar , Opisina arenosel la Walker. ICAR-AP Cess Fund Scheme – Final Report 2005-08., pp. 4.
Subahar an, K ., Kumar, N . R. and Pr asad , A .R. (2011)Electrophysiological and behavioral response of Goniozusnephantidis Muesebeck to plant and host volati les. Journal ofPlantation Crops, 39: 78-85.
Venkatesan, T., Jalal i , S.K., Srinivasamurthy, K., Rabindra, R. J.and Dasan, C.B. (2007) Economics of production of Goniozusnephantidis Muesebeck, an important parasitoid of coconutblack headed caterpi llar, Opisina arenosel la Walker for bio-factories. Journal of Biological Control , 2007, 21: 53-58.
Manuscript recived on 14.2.2018Manuscript accepted for publication on 26.5.2018

68 Journal of Eco-friendly Agriculture 13(2) 2018
A pilot study for area-wide management of fruit fly in mango for the central gangetic plainJournal of Eco-friendly Agriculture 13(2): 68-71. 2018
©2018
A pilot study for area-wide management of fruit fly in mangofor the central gangetic plainSharmila Roy, Balaji Rajkumar and A.K. MisraICAR-Central Institute of Subtropical Horticulture, Lucknow - 226 101(UP)E mail : roysharmilaigfr i@gmail .com
A BSTRACT
The management of fruit fl ies (Diptera: Tephritidae) in mango orchards by the male annihilation t echnique(MAT) is considered beneficial when deployed i n a wide area involving many indi vidual f arms. This exper imentassessed the patterns of invasion of flies when para-pheromone and insecticide-soaked wooden blocks were used in24 hectares area of mango orchard at Central Institute of Subtropical Horticulture, Lucknow (India). The MAT greatlyreduced the fly population in the inner parts of the protected area, while higher population was found in the outerareas. Even after twenty weeks, the population in the inner core remained at a lower level. It was concluded that MATis efficient to protect over large areas, subject to uniform distribution of blocks. However, implementation of techniquesat village level will require sound understanding of village needs, ecology and social aspects.
Key words: Bactrocera dorsalis, mango, MAT
Fruit flies are economically important insects. About500 species are reported as pests of fruits and vegetable cropsfrom Asia. In India fruit flies are represented by 200 speciesbelongs to 71 genera (Kapoor, 2002). They are broadly dividedinto two groups, one attack orchard fruits, such as mango,guava, sapota etc. and the other that attack cucurbits likemelon, cucumber, gourds, etc. The flies attack crops atdifferent stages of maturity but damage is observable moreat the harvest period. The loss in fruit yield ranges from 1 to31 per cent w ith a mean of 16 per cent (Verghese et al., 2004).Department for International Development, UK, (DFID, 2005)report indicated that fruit flies can cause 30-100 per centeconomic losses annually in various crops. In mangoes lossesare about 20 per cent, in sapota about 30per cent, and inmelons and gourds is around 40per cent. The calculationsindicate that annual losses at wholesale level may be Rs17,476 million in mango, Rs 5,508 million in citrus, Rs 5,032million in guava and Rs 1,428 million in sapota. In total, forthese four crops it is about Rs 29,460 million. The program atvillage-level trials (ranging from 1-10 km2) by a cooperativein Gujarat, demonstrated that market quality fruit can beproduced from area-w ide integrated management throughmale annihilation technique (MAT). The yield returns wereof approximately $250,000 in extra f rui t product ion,compared to an adjacent area w ith a mix of conventionalindividual farm treatments or no treatment.
The central gangetic plain is known for its fruits andvegetable cultivation and has great potential for export. Since,flies do direct damage to the fruits it becomes considerableeven they are present in relatively small number. Further,large number of hosts and dispersal of fruit flies in w ide
area, make pest management difficult in individual farms.The losses may be higher in orchards of small farmers whohave limited resources and w illingness towards insecticidalcontrol . Such lim itations and success of v il lage-levelmanagement trials in Gujarat prompted us to undertakethis study. Hence, before taking up area w ide integratedmanagement, a pi lot study was designed to assess thesuccess of MAT for this zone. This paper presents the findingof this study.
M ATERIALS AND M ETHODSThe experiment was carried out during 2016-17 at the
research farm of ICA R-Central Inst itute of SubtropicalHorticulture, Rehmankhera (26°90' N - 80°76' E), Lucknow.The design of this experiment was based on the experimentcarr ied out in experiment stat ion of SDA U, SardarKrishinagar (Gujrat) under DFID R4D project (Stonehouseet al., 2006). The experimental area was about 24 ha (600m x400m) of mango trees, planted in 50 x 50m plots. Generalmaintenance of orchard w as carr ied out by fol low ingrecommended package of pract ices, includ ing p lantprotection measures applied for leaf webber and hoppers.
The stand was protected by MAT blocks @ 9-10 trapsha-1 and were installed in the first week of May 2016. Blocksmade of 2.5 x 1.0 x 1.0 cm plywood pieces were soaked in 6 :4 : 1 v/ v mixture of ethanol: methyl eugenol: DDVP (2, 2-dichlorov iny l d imethyl phosphate). All the t raps wererecharged at about 45 days interval. To define minimumbuffer zone for fly invasion the stand was hypotheticallydelineated into four grids and numbered from inside to theboundary of orchard. In the layout of mango trees were

Journal of Eco-friendly Agriculture 13(2) 2018 69
Sharmila Roy, Balaji Rajkumar and A.K. Misra
ind icated as ‘0’ and t raps in grey shads (Fig. 1). Theobservations were taken at fortnightly interval from theselected traps (6 grid -1) (marked as black in layout), startingfrom 20thto 41st standard metrological week of year 2016.Prior to this pilot study, a monitoring was conducted during2015-16 in the experimental orchard and the two nearbyorchards.
RESULTS AND DISCUSSIONThe monitoring of fruit fly during 2015-16 revealed that
flies were present throughout the year in orchards. But theirpopulation was below thresh-hold (10 fly trap -1 week -1) levelduring most part of the year, except in 26 to 37 metrologicalweeks. Peak population was recorded during 29th-38th SMWwith mean maximum catch of >500 flies trap-1 week-1. Amongthe prevalent species of this area, Bactrocera dorsalis wasdominant (90.3%), while B. zonata and B. cucurbitae wereabout 7.9 and 2.1 per cent respectively. The pattern ofdistribution in 2015-16 is depicted in figure 2.
During the experiment period (May 2016-Oct 2016) theaverage number of flies caught t rap -1 was 3 7.71 on 1st
observation, 204.13 on 2nd observation, and 195.33, 213.75,64.00, 206.04, 91.79, 20.58, 7.00 on successive observations.Peak population was observed during 28thto 36thSMW, whilelowest population was recorded during 41st SMW (Table 1).The population trend was in the line w ith the monitoringstudy conducted during March 2015 to April 2016.
Overall fruit fly population was significantly lower atcentral zone i.e., grid 1 (100m x 300m) (70.8 flies trap-1) incomparison to grid 4, the outer most zone (196.5 flies trap-1)of the orchard. However, the traps placed at 2nd and 3rdgridareas were also recorded significantly lower population(95.3flies trap -1 and99.7flies trap -1 respectively) (Fig. 3; Table1).Though the fly was not eradicated but the population wassignificantly reduced (Table 1; CD >0.01) over the successiveobservations and was maintained at that level in the grid1.In general, fly population was reduced in about150m x500m area in the orchard.
MAT substantially reduced the fly population in theinner most grid of the protected area, while in the outer mostgrid, higher populations of fruit fly were recorded throughout
0
100
200
300
400
500
600
13 15 17 19 21 24 26 28 33 36 39 41 43 45 47 49 1 3 5 7 9 11 13 15 17 19
Frui
t flie
s /tr
ap
Standard metrological weeks
Experiment area Near by area
Fig. 2. Fruit fly dynamics in mango orchard during 2015-16
Fig 1. Arial view (Google map) of the experiment area (left) and the experiment lay out (r ight).
3rd Grid
1st Grid
4th Grid
2nd Grid
≈450m
≈ 650m

70 Journal of Eco-friendly Agriculture 13(2) 2018
A pilot study for area-wide management of fruit fly in mango for the central gangetic plain
the experiment period. Even though the fly population wasvariable in the outer grids of protected area, fly populationin the inner core area was reduced almost at once to the leveland was found significantly low throughout the experiment.Presence of large numbers of flies in the outer grid clearlydefines that fly intrusion occur from outside the orchard.Even after 22 weeks of deployment, the population in theinner core was not completely eradicated. This may be dueto the population existed from previous year/ generation inthe soil of the area.
The findings indicate that profoundly trapped bufferzone is needed to restrict entry of fruit flies to the actualorchard sites. The w ide area management program, usingMAT technique must include at least a 50m buffer zoneoutside the targeted area, for reducing the losses. As reported
by Stonehouse et al. (2007), the risk level may be decreasedfurther by extending the buffer area to 100m or so. Trials ona larger scale may help farmers to get pesticide f reeeconomical fruit production at village level.
However, the w ide area management at village levelhave many other social and economic issues. Stonehouse etal . (2004) in thei r study on the ecological and socialimplications of village-level fruit fly management highlightedfive points necessaries for the success of the program: (i)farm size, if large, reduces the number of farmers needed toobtain cooperative control but , if small, cooperat ion atindividual level may be ineffective, (ii) the problem of thepest must be perceived as serious, and this seriousness applyfor as many farmers as possible, (iii) sustainable cooperativecontrol is enhanced when it can be associated w ith othercooperative activities, such as marketing; rather than startingfrom scratch, (iv) a level of social cohesion and mutual trustis important, (v) forgivingness of incomplete application ofarea-w ide controls. When cooperative control aims to besuppressive, rather than eradicative; private control by eachindividual can still obtain a return, regardless of some defiantwho w ill not cooperate w ith a group effort. The effect is notdestroyed by a few isolated untreated areas.
Although the farm size/ orchards of this zone are ofmedium to small size, farmers and the existing farmersassociations may be brought together for this type of program.However, there could be various ecological and socialimplications that need to be more accurately defined for thesuccess of such programs.
REFERENCESDFID 2005. Management of frui t fl ies (Diptera: Tephri tidae) in
India. www.dfid.gov.uk/ R4D/ Project/ 3026/ Default.aspx.Kapoor, V.C. 2002. Fruit-fly pests and their present status in India.
In: Proceedings of 6th International Fruit Fly Symposium,Stel lenbosch, South A frica. pp. 23-33.
Stonehouse, J.M, Mumford, J.D. and Verghese, A . 2004. Returnsto scale in pest suppression and eradication: Issues for thewide-area management of frui t flies in India. In: Proceedingsof Symposium: National Symposium Frontier Areas of
Table 1. Mean fortnightly fruit fly catch per trap from 20thto 41st SMW (delineated grids numbered in ascending order frominside to periphery of the orchard)
Standard Metrological Weeks (SMW) 20 23 25 28 31 33 36 38 41 Mean
Grid 1 30.67 97.00 79.83 119.67 44.33 193.17 42.83 21.67 8.17 70.81 Grid 2 35.00 159.83 96.00 188.00 41.00 193.00 113.33 26.83 4.67 95.30 Grid 3 30.33 140.50 176.83 226.00 92.33 190.00 22.83 15.50 3.33 99.74 Grid 4 54.83 419.17 428.67 321.33 78.33 248.00 188.17 18.33 11.83 196.52 Mean 37.71 204.13 195.33 213.75 64.00 206.04 91.79 20.58 7.00 CD (>0.01) Grid 36.2 Observation Date 54.9 Observation Date x Grid 18.3
Fig. 3. Fruit fly density in experimental area (Grid 1, 2, 3, 4 fromcenter to outer zone)

Journal of Eco-friendly Agriculture 13(2) 2018 71
Sharmila Roy, Balaji Rajkumar and A.K. Misra
Entomol ogi cal Resear ch, IA RI, N ew Del hi, (eds. B.Subrahmanyam, V.V. Ramamurthy, V.S. Singh). GoldenPrinters and Publ ishers for Entomological Society of India,New Delhi, India. pp. 151-158.
Stonehouse, J.M., Patel, R.K., Mumford, J.M., Patel, V.M., Leach,A. and Verghese, A. 2006. Vil lage-Level Wide-Area Fruit FlySuppression in India: Patterns of Extinction and Invasionunder Male Annihi lation Control in a Mango Orchard. In:Final Technical Report of Integrated Management of FruitFlies (Diptera: Tephri tidae) in India R 8089/ 8440 (ZA 0493/0664): Crop Protection program. pp. 155-162.
Stonehouse, J.M., Patel, R.K., Patel, V.M., Mumford, J.M., Leach,A., Verghese, A . Shukla, R.P., Satpathy, S., Singh, H.S., Ji ji, T.,Thomas, J., Patel, Z.P., Jhala, R.C., Patel, R.K., Manzarc, A .,Shival ingaswamy, T.M., Mohantha, A .K., Nair, B., Vidya,C.V., Jagadale, V.S., Sisodiya, D.B. and Joshi, B.K. 2007.Vi l lage-level area-w ide frui t fly suppression in India: Baitappl ication and male annihilation at vi l lage level and farmlevel. Crop Protection, 26 : 788-793.
Verghese, A ., Tandon, P.L. and Stonehouse, J.M. 2004. Economicevaluation of the integrated management of the orientalfrui t fly Bactrocera dorsal is (Diptera: Tephri tidae) in mangoin India. Crop Protection, 23 : 61-63.
Manuscript recived on 16.3.2018Manuscript accepted for publication on 29.4.2018

72 Journal of Eco-friendly Agriculture 13(2) 2018
Relative incidence of gall midge (Orseolia oryzae Wood-mason) in some rice varieties in the agro-climatic conditions of JharkhandJournal of Eco-friendly Agriculture 13(2): 72-74. 2018
©2018
Relative incidence of gall midge (Orseolia oryzae Wood-Mason) in some rice varieties in the agro-climatic conditionsof JharkhandRabindra Prasad, Lakhindar Hembrom, Binay Kumar and Devendra PrasadDepartment of Entomology, Faculty of Agriculture, Birsa Agricultural Universi ty, Kanke, Ranchi-834006 (Jharkhand)Email: [email protected]
A BSTRACT
The field experiment, conducted in the gall midge endemic district of Jharkhand during wet season in 2013 and2014, to test 16 promising rice varieties for their relative resistance against gall midge (biotype-3), indicated that silvershoot (SS) ranged from 3.46 percent (Kavya) to 56.38 percent (MTU-7029). None of the test genotypes were free fromgall midge incidence. Based on the pooled results of two year experimental results, the rice varieties receiving gallmidge incidence in terms of silver shoot up to 5.00 percent were rated as highly resistant to gall midge. Accordinglyfour ri ce varieties viz, Kavya (2.91%SS), Lalat (3.91%SS), IR-36 (4.66%SS) and RD 202 (4.60%) emerged as highlyresistant t o gall midge. Suraksha (5.99%SS) and BG 380-2 (6.48%SS) remained moderately resistant t o the pest.MTU-7029 (54.39%SS) and TN-1 (52.05%) received more than fifty percent incidence of silver shoot, caused by thepest, hence these two varieties were considered as highly susceptible to the pest. The maximum grains yield of 42.40qha-1 was realized from Lalat, which remained at par with BG 380-2 (42.15 qha-1), Abhishek (41.65 qha-1), RD-202(40.60 qha-1), and IR-36 (37.60 qha-1). Lowest yield of 25.65 qha-1 was obtained in case of the susceptible varieties TN-1, which remained at par with that of IR-64 (28.09 qha-1) and MTU-7029 (29.15 qha-1). As such, cultivation of Kavya,Lalat, IR-36 and RD-202 varieties of ri ce could be recommended in the gall midge endemic areas l ike, Simdega,Gumla, Khunti and Lohardagga districts of Jharkhand.
Key words: Rice varieties, gall midge, Orseolia oryzae, HPR, endemic areas, grains yield.
Rice (Oryza sativa L.) is the one of the major crops ofJharkhand. Out of 29.28 lakh hectares of total cultivated area,rice is grown in 16.92 lakh hectare, which comes to 85 percent(Anonymous, 2008-09) of about 25-30 percent area (4.5 to 5.4lakh hectares) of total rice cultivated area in the state ofJharkhand is endemic to the gall midge biotype-3 (Orseoliaoryzae WM) over the past 4-5 decades (Shaw et al. 1981) andsuffers from 20-70 percent yield loss, annually (Prasad andPrasad 2010). Because of this the farmers of these areas arehesitant to grow hybrid and scented rice varieties which areusually highly prone to attack of gall midge. Especially theresource poor farmers of the pest affected area are unable toafford chemical control measures (Prasad 2011). Therefore,host plant resistance (HPR) could be one of the mosteconomical tool for management of gall midge. In Jharkhandregion, gall midge bio-type-3 is prevalent (Shaw et al. 1981).Hence, field screening of some promising rice varieties forresistance/ tolerance against gall midge in the endemic areaswas done.
M ATERIALS AND M ETHODSThe experiment was conducted during wet season of
2013 and 2014 in the farmers field in the gall midge endemicarea in block and district Simdega, of Jharkhand. There were16 rice varieties, replicated thrice in sub plot size of 5X4
square meter in the randomized block design. Seeds of thetest varieties were sown on 7th and 6th July 2013 and 2014,respectively. Transplanting work was done on 12th and 10th
August of 2013 and 2014. The crop was raised under therecommended packages of practices without applying anyplant protection measures. Total number of tillers andnumber of silver shoots (caused by gall midge) were countedon 10 randomly selected plants (hills) at 30 days af tertransplanting (DAT) to calculate percentage of silver shoot(SS%). Harvesting of the crop was completed on 16th and11th November of 2013 and 2014, respectively. Yield of grainswere recorded in kg plot-1 and converted into qha-1. The datawere subjected to the statistical analysis after su itabletransformation.
RESULTS AND DISCUSSION
Varietal reaction against the Asian gal l midge (Orseol iaoryzae Wood-Mason)
The gall m idge incidence recorded 30 days aftertransplantation (Table-1) indicated that the resistance of gallfly, in terms of incidence of silver shoot (SS) was relativelylow during 2014 than in 2013, in general, in the test ricevarieties/ genotypes. Incidence of silver shoot (SS) during2013 ranged from 3.46 percent (Kavya) to 56.38 percent (MTU)70.29. None of the rice genotype remained free from gall

Journal of Eco-friendly Agriculture 13(2) 2018 73
Rabindra Prasad, Lakhindar Hembrom, Binay Kumar and Devendra Prasad
midge incidence. The lowest incidence of gall midge (3.46%SS) was found in case of Kavya which remained at par withLalat (4.60% SS), RD-202 (4.96% SS) and IR-36 (5.12% SS)followed by Suraksha (6.08% SS), BG- 380- 2 (7.51% SS). Thevarieties receiving incidence of silver shoot (SS%) below 5percent (Kavya, Lalat, RD-202) were rated as highly resistantto gall midge. Thase receiving incidence of silver shoot (SS)between 5.01 to 10.00 percent (IR-36, BG-380-2 (7.51% SS)and BVS-1 (10.33% SS) were rated as resistant to the pest.The highest incidence of gall midge (56.38 %SS) was noticedin case of MTU– 7029, followed by TN-1 (54.60% SS), IR- 64(39.50%SS), Birsamati (39.30% SS) and Pusa Basmati (38.80%SS). The moderate range of incidence of silver shoot (SS) wereregistered in cases of MTU-1010 (12.10% SS), A bhishek(15.20% SS), and Sahbhagi (16.38%SS). Almost similar trendsof incidence of silver shoot (SS) were found during 2014 also.Hower, it was little less than 2013.
Incidence of gal l midge as pooled mean of 2013 and 2014The incidence of gall midge in terms of silver shoot (SS)
followed almost similar trends to that of incidence of thepest recorded during 2013 in the form of varietal response ofdifferent rice varieties. Based on pooled results of the two
years observations, the rice varieties receiving gall midgeincidence in terms of percentage of silver shoot between 0.0to 5.00 percent were rated as highly resistant to gall midge.Accordingly, the highly resistant varieties against gall midgeare: Kavya (2.91% SS), Lalat (3.91 % SS) IR-36 (4.66% SS) andRD-202 (4.60% SS). Prasad et al. (2012) reported that BG-380-2, Lalat and Suraksha proved to be resistant againstgall midge and Pusa Basmati-1 and Jaya received higherincidence of gall midge resulting in yield-loss ranging from34.5 to 36.23 percent.
Varietal reaction of rice varieties in terms of grains yieldThe results presented in (Table-2) showed relatively
higher yields of grains in almost all the 16 tested rice varietiesduring 2014 as compared to that of 2013, probably due tolower incidence of gall midge.
The highest grain yields of 40.60 and 44.20 q ha-1 wererecorded during 2013 and 2014 respectively in case of Lalat,which, in turn, remained at par w ith Abhisek (40.50 & 42.80q ha-1), BG-380-2 (40.50 & 43.80 q ha-1), RD-202 (39.70 &41.50 q ha-1) and IR-36 (36.50 & 38.70 q ha-1) during therespect ive years. The pooled mean y ield of the tw oexperimental years also followed almost similar trends.Accordingly, test varieties could be arranged in descendingorder of : Lalat (42.40 q ha-1) > BG-380-2 (42.15 q ha-1) >Abhisek (41.65 q ha-1) > RD-202 (40.60 q ha-1) > Sahbhagi(35.30 q ha-1) > Kavya (35.15 q ha-1) in terms of grains yield
Percentage of sil ver shoot (SS%) due to gal l midge at 30 DAT SI No. Rice varieti es 2013 2014 M ean 1. IR-64 39.50(38.94) 35.30(36.45) 37.40(37.70) 2. IR-36 5.12(13.16) 4.20(11.83) 4.66(12.39) 3. RD-202 4.96(12.79) 4.25(11.90) 4.60(12.39) 4. Abhishek 15.20(22.95) 13.50(21.56) 14.35(22.26) 5. MTU-1010 12.10(20.36) 10.45(18.86) 11.27(19.59) 6. MTU-7029 56.38(48.65) 52.40(46.38) 54.39(47.49) 7. BPT-5204 32.14(34.54) 29.80(33.09) 30.97(33.77) 8. Kavya 3.46(10.70) 2.36(8.81) 2.91(9.81) 9. Pusa Basmati-1 38.80(38.53) 34.70(36.09) 36.75(37.29) 10. Birsamati 39.30(38.82) 34.90(36.21) 37.10(37.52) 11. Sahbhagi 16.38(23.85) 13.98(21.89) 15.18(22.91) 12. BVS-1 10.33(10.47) 8.80(17.26) 9.56(18.00) 13. Lalat 4.60(12.39) 3.23(10.39) 3.91(11.39) 14. BG380-2 7.51(15.89) 5.46(13.50) 6.48(14.71) 15. Suraksha 6.80(15.12) 5.18(13.16) 5.99(14.06) 16. TN-1 54.60(47.64) 49.5(44.71) 52.05(46.17)
SEm(±) (1.35) (1.69) (1.50) CD(P=0.05) (3.93) (4.92) (4.35)
CV(%) (9.13) (12.39) (10.55)
Table 1. Relative incidence of gall midge (Orseolia oryzaeWood-Mason) in some promising rice varietiesduring 2013 & 2014.
Fi gur es under the par entheses cor r espond to angul artransformed values.SS-Si lver shootDAT-Date after transplanting
Table 2. Yield of rice grains in some promising rice varietiesduring 2013 & 2014.
Yield of r ice grains (q ha-1) Sl . No. Ri ce vari eties
2013 2014 M ean 2013 & 2014
1. IR-64 26.50 29.50 28.00 2. IR-36 36.50 38.70 37.60 3. RD-202 39.70 41.50 40.60 4. Abhishek 40.50 42.80 41.65 5. MTU-1010 29.80 32.90 31.35 6. MTU-7029 27.50 30.80 29.15 7. BPT-5204 28.20 32.50 30.35 8 Kavya 33.60 36.70 35.15 9. Pusa Basmati-1 32.80 33.86 33.33 10. Birsamati 34.60 35.40 35.00 11. Sahbhagi 34.80 35.80 35.30 12. BVS-1 33.70 35.40 34.55 13. Lalat 40.60 44.20 42.40 14. BG380-2 40.50 43.80 42.15 15. Suraksha 32.50 34.70 33.60 16. TN-1 24.50 26.80 25.65
SEm (±) 2.50 2.48 2.87 CD (P=0.05) 7.25 7.19 8.17
CV(%) 12.84 11.99 13.90

74 Journal of Eco-friendly Agriculture 13(2) 2018
Relative incidence of gall midge (Orseolia oryzae Wood-mason) in some rice varieties in the agro-climatic conditions of Jharkhand
and all these seven varieties remained statistically at par.These varieties realized higher yield of grains on account ofhaving signif icantly lower incidence of the insect pestspecies. TN-1 proved to be the most prone to attack of all thepest species, resulting in the significantly lowest grains yieldof 24.50 and 26.80 q ha-1 during 2013 and 2014 and 25.65 qha-1 based on mean y ield of the tw o years ofexperimentations, followed by IR-64 in the present studies.Prasad and Prasad (2012) also reported significantly lowerincidence of major pest complex and higher grain yields incertain rice varieties viz., Naveen, IR-36, BG-380-2, Lalat andSuraksha which is almost in agreement w ith the findings ofthe present experimentation. Findings of Prasad et al. (2012)also endorsed the results of present studies.
ACKNOWLEDGEM ENTThe authors are highly grateful to the Hon’ble Vice
Chancel lor, t he Di rector of Research and the Dean(Agriculture) of the Birsa Agricultural University, Ranchifor provid ing necessary faci li ties during the course ofexperimentation.
REFERENCESAnonymous, 2008-09. Annual r epor t of State A gr icul tural
Management Extension and Training Insti tute (SAMETI),Jharkhand, Ranchi, Pp. 211.
Prasad, R. 2011. Status of r ice gal l midge (Orseol ia oryzae Woodmason). Journal of Rice Research, 4: 19-20.
Prasad, R. and Prasad, D. 2011. Incidence of gal l midge (Orseoliaoryzae WM) in some promising r ice varieties. Journal of PlantProtection and Environment, 8: 57-62.
Prasad, R., Hembrom, L., Prasad, K., Singh, D.N. and Prasad, D.2012. Integrated management of major insect pests throughH PR and jud i ci ous appl i cati on of i nsecti ci des forsustainable cultivation of r ice under the changed cl imaticconditions : In : Souvenir and Abstracts of Research papers,Pp. 120. 3rd National symposium on agriculture production andprotection in the context of climate change, held at B.A.U, Ranchion 03-05th November 2012.
Shaw, SP., Chand, P. and Prasad, S.C., 1981. A different biotypeof gal l midge (Orseol ia oryzae WM) at Ranchi. Oryza, 18:168-169.
Manuscript recived on 11.1.2018Manuscript accepted for publication on 13.3.2018

Journal of Eco-friendly Agriculture 13(2) 2018 75
M. B. Gurunath and R. A. BalikaiJournal of Eco-friendly Agriculture 13(2): 75-79. 2018
©2018
Safflower (Carthamus tinctorius L.) is an ancient crop ofthe family Compositae or Asteraceae, originated in the neareast and has been grown for centuries in China, India andNorth Afr ica. I t is a mul ti-purpose species w ith manytraditional uses. In India, safflower cultivation is being donefor centuries for its orange red and yellow dye (Carthamine)extracted from the florets were once used to colour food andclothing and for its oil, rich in poly unsaturated fatty acidswhich are considered to reduce blood cholesterol and goodfor heart pat ients. There are several causes for lowproductivity in Karnataka, among them biotic factors playkey role.
Among the insect pests that attack safflower the aphid,Uroleucon compositae (Theobald) is considered as a major pestcausing severe losses to the crop throughout the world.Among different insect pests, safflower aphid, U. compositaeis one of the most destructive pests (Akashe et al., 1999),which alone causes 35-72 per cent yield loss during heavyinfestation period (Anon., 2007). Seed and oil content lossesdue to this pest ranges from 20 to 80 per cent, which hasbeen reported from different parts of the country (Singh etal., 2000). The aphids not only reduce yields of seed and oilcontent but also attack petals lowering the quality of thevalue added product of this part of the plant (Sastry, 1997).In addition to this the quality of petals was lowered due toaphid attack (Sastry 1997). The aphid has been effectivelycontrol led using several convent ional i nsect ici des(Upadhyay et al, 1990; Dhruve et al, 1993 and Ali et al, 1994).
Seed treatment, an eco-friendly approach for the managementof safflower aphidsM.B. Gurunath and R.A. BalikaiDepartment of Agricultural EntomologyUniversi ty of Agricultural Sciences, Dharwad-580 005E-mail: [email protected]
A BSTRACT
The field experiment conducted during rabi 2015-16 at the Agricultural Research Station, Annigeri (Karnataka)for the management of safflower aphid through insecticidal seed treatment revealed that seeds treated with imidacloprid70 WS @ 5 g kg-1 seeds, imidacloprid 600 FS @ 5 ml kg-1 seeds and acetamiprid 20 SP @ 5 g kg-1 seeds recordedsignificantly lowest aphid population of (28.04, 32.07 and 33.43 aphids 5 cm apical twig-1, respectively) which weresuperior over other seed treatments and recorded higher seed yield of 9.67, 9.38 and 9.16 q ha-1, respectively. The nextbest treatments were the seeds treated with thiamethoxam 70 WS @ 5 g kg-1 seeds and fipronil 5 SC @ 5 ml kg-1 seedswhich recorded aphid population of 35.70 and 35.08 aphids 5 cm apical twig-1, respectively with seed yield of 8.52and 7.96 q ha-1, respectively which were superior over untreated control. Similarly, imidacloprid 70 WS @ 5 g kg-1
recorded highest B:C ratio (1:1.95) followed by imidacloprid 600 FS @ 5 ml kg-1 (1:1.89) and acetamiprid 20 SP @ 5 gkg-1 (1:1.85) which proved to be good in the management of aphid.
Key words: Aphid, B C ratio, Efficacy, Safflower, Seed treatment
Number of insect icides have been reported for themanagement of safflower aphids (Shetgar et al, 1993;Ghorpade et al, 1994; Balikai and Yelshetty, 2001; Gurunathand Balikai, 2017).
Managing the pest in established safflower ecosystemthrough chemical spraying has several limitations. Farmersare unable to go for spraying due to increased cost ofproduction of safflower, spines present on plants and effectof these insecticides on non-target organisms particularlynatural enemies. Seed treatment is a very important aspectwhich controls the crop pest in early stages and reduces thecost of cultivation in dryland areas as it avoids sprayingalso because of less availability of water. Thus, the presentstudy deals w ith the management of safflower aphid throughseed treatment.
M ATERIALS AND M ETHODSThe field experiment was conducted during rabi 2015-
16 at the Agricultural Research Station, Annigeri (Karnataka)by using safflower variety, Annigeri-1. The experiment waslaid out in RCBD w ith six treatments and four replications.The treatments included T1-fipronil 5 SC @ 5 ml kg-1 seed, T2-imidacloprid 600 FS @ 5 ml kg-1 seed, T3-thiamethoxam 70WS @ 5 g kg-1 seed, T4-acetamiprid 20 SP @ 5 g kg-1 seed, T5-imidacloprid 70 WS @ 5 g kg-1 seed and T6-untreated control.The crop was raised w ith a spacing of 45 × 20 cm in a plotsize of 5.0 × 4.5 m (10 lines of 5 m length) by following all theagronomic practices as given in the package of practices

76 Journal of Eco-friendly Agriculture 13(2) 2018
Seed treatment, an eco-friendly approach for the management of safflower aphids
except for plant protection measures (Anon., 2014). Oneblanket spray was given for head borer management as perpackage of practice.
The seed treatment was done a day before sow ing. Therequired quantities of seeds were taken in plastic containerand to this recommended quantity of insecticide were added.Then container was vigorously shaken to obtain uniformcoating of insecticide over the seeds. The seeds were allowedto air dry in the laboratory.
Observations were recorded on number of aphids (2tender tw igs of 5 cm plant-1) on randomly selected five plantsin each treatment at 55 and 70 DAS. The other grow thparameters such as plant height, number of branches perplant, number of capsules per plant, on five randomlyselected plants were also recorded.
Per cent reduction in aphid population over controlwas also worked out using the follow ing formula.
C-TA = –––––– × 100 CWhere,
A = Per cent reduction in aphid population over control
C = Aphid population in untreated control
T = Aphid population in treated plot
Finally, 100 seed weight and seed yield per plot wassubjected to statistical analysis.
RESULTS AND DISCUSSION
Efficacy of insecticides against aphidsFi fty five days after sowing: Among different treatments theaphid populations ranged from 25.63 to 37.75 aphids on 5cm apical tw ig per plant after 55 days after sow ing w ithsignificant differences between the treatments. The seedstreated with imidacloprid 70 WS @ 5 g kg-1 recorded minimumaphid population (25.63 aphids on 5 cm apical tw ig plant-1)followed by imidacloprid 600 FS @ 5 ml kg-1 (29.43 aphids 5cm apical tw ig-1), acetamiprid 20 SP @ 5 g kg-1 (30.92 aphids5 cm apical tw ig-1), thiamethoxam 70 WS @ 5 g kg-1 (31.36aphids 5 cm apical tw ig-1) and fipronil 5 SC @ 5 ml kg-1
(32.12 aphids 5 cm apical tw ig-1) and these treatments wereon par w ith each other. Whereas, untreated check recordedmaximum aphid population (37.75 aphids on 5 cm apicaltw ig plant -1) as compared to all other treatments (Table 1).
A mong di f ferent t reatments reduction in aphidpopulation over control ranged from 14.79 to 32.01 per cent
after 55 days of sow ing w ith significant differences betweenthe treatments. The seeds treated w ith imidacloprid 70 WS@ 5 g kg-1 recorded highest reduction in aphid population(32.01%) over control followed by imidacloprid 600 FS @ 5ml kg-1 (21.91%), acetamiprid 20 SP @ 5 g kg-1 (18.13%),thiamethoxam 70 WS @ 5 g kg-1 (16.86%) and fipronil 5 SC @5 ml kg-1 (14.79%) which were on par with each other (Table1).
Seventy days after sowing: Aphid populations ranged from30.44 to 50.97 aphids 5 cm apical tw ig-1 w ith significantdifferences between the treatments. The minimum aphidpopulation was recorded by imidacloprid 70 WS @ 5 g kg-1
(30.44 aphids 5 cm apical tw ig-1) which was on par w ithimidacloprid 600 FS @ 5 ml kg-1 (34.70 aphids 5 cm apicaltw ig-1) and acetamiprid 20 SP @ 5 g kg-1 (35.94 aphids 5 cmapical tw ig-1). The latter two treatments were on par w iththiamethoxam 70 WS @ 5 g kg-1 (38.79 aphids 5 cm apicaltwig-1) and fipronil 5 SC @ 5 ml kg-1 (39.27 aphids 5 cm apicaltwig-1). All the seed treatments were superior over untreatedcontrol (Table 1).
Reduction in aphid population over control variedfrom 23.04 to 40.23 per cent after 70 days of sow ing w ithsignificant differences between the treatments. The highestreduction in aphid population over control was recorded inimidacloprid 70 WS @ 5 g kg -1 (40.23%) fol low ed byimidacloprid 600 FS @ 5 ml kg-1 (31.85%) which were on parw ith each other. The latter treatment in turn was on par w ithacetamiprid 20 SP @ 5 g kg-1 (29.52%), thiamethoxam 70 WS@ 5 g kg-1 (23.90%) and fipronil 5 SC @ 5 ml kg-1 (23.04%)(Table 1).
Effect of seed treatmentsThe effect of d i fferent insect icides used as seed
treatments was assessed on plant height, number of branchesper plant, number of capsules per plant, 100 seed weightand seed yield and the results are presented in the Table 2.
On plant height (cm)Effect of different insecticides used as seed treatments
was assessed on plant height and results showed that theplant height varied from 77.04 to 79.46 cm w i th non-significant differences between the various treatments.However, highest plant height was observed in the seedstreated w ith imidacloprid 70 WS @ 5 g kg-1 (79.46 cm) followedby imidacloprid 600 FS @ 5 ml kg-1 (79.26 cm), acetamiprid20 SP @ 5 g kg-1 (78.57 cm), thiamethoxam 70 WS @ 5 g kg-1
(78.26 cm) fipronil 5 SC @ 5 ml kg-1 (77.48 cm) and untreatedcontrol recorded least plant height (77.04 cm).

Journal of Eco-friendly Agriculture 13(2) 2018 77
M. B. Gurunath and R. A. Balikai
Number of branches plant–1
Among different treatments number of branches perp lant ranged f rom 8.60 to 9.84 w i th non-signi f icantd if ferences among the various treatments. However,maximum number of branches was observed in plots treatedw ith imidacloprid 70 WS @ 5 g kg-1 (9.84 branches plant-1)followed by imidacloprid 600 FS @ 5 ml kg-1 (9.42 branchesplant-1), thiamethoxam 70 WS @ 5 g kg-1 (9.22 branchesplant-1), acetamiprid 20 SP @ 5 g kg-1 (9.12 branches plant-1),fipronil 5 SC @ 5 ml kg-1 (8.61 branches plant-1) and untreatedcontrol (8.60 branches plant-1).
Number of capsules plant-1
Among different treatments, number of capsules perplant varied f rom 20.13 to 22.73 w ith non-signif icant
di fferences betw een the various t reatments. How ever,imidacloprid 70 WS @ 5 g kg-1 seed recorded highest numberof capsules (22.73 capsules plant-1) followed by imidacloprid600 FS @ 5 ml kg-1 (22.60 capsules plant-1), acetamiprid 20 SP@ 5 g kg-1 (21.40 capsules plant-1), thiamethoxam 70 WS @ 5g kg-1 (21.33 branches plant-1), fipronil 5 SC @ 5 ml kg-1 (20.53branches plant-1) and untreated control (20.13 branchesplant-1).
Seed weight (g)Inf luence of d if ferent insect icides used as seed
treatments on 100 seed weight was analyzed. There was asignificant difference among the treatments. However, amongdifferent treatments 100 seed weight varied from 4.39 to 5.60g. The maximum grain weight was recorded in imidacloprid
Table 1: Management of safflower aphid, Uroleucon compositae through seed treatment w ith different insecticides
*Figures in the parentheses are 0.5 x ? transformed values ** Figures in the parentheses are arcsine transformed values, DAS -Days
after sowing
No. of aphids on 5 cm apical tw ig pl ant-1 *
Per cent reducti on i n aphids over control**
Treatments
Dosage (ml or g kg-1
of seed) 55 DAS 70 DAS M ean
55 DAS 70 DAS Fipronil 5 SC 5 ml 32.12
(5.71)ab 39.27 (6.30)b
35.70 14.79 (21.51)b
23.04 (28.53)b
Imidacloprid 600 FS 5 ml 29.43 (5.47)a
34.70 (5.93)ab
32.07 21.91 (27.41)b
31.85 (34.30)ab
Thiamethoxam70WS 5 g 31.36 (5.64)ab
38.79 (6.26)b
35.08 16.86 (23.95)b
23.90 (29.13)b
Acetamiprid 20 SP 5 g 30.92 (5.60)ab
35.94 (6.03)ab
33.43 18.13 (24.88)b
29.52 (32.88)b
Imidacloprid 70 WS 5 g 25.63 (5.11)a
30.44 (5.56)a
28.04 32.01 (34.43)a
40.23 (39.35)a
Untreated Control - 37.75 (6.18)b
50.97 (7.17)c
44.36 - -
S.Em.± - 0.20 0.19 - 2.14 1.74 C.D. at 5 % - 0.59 0.59 - 6.61 5.38 C.V. (%) - 6.97 6.30 - 16.23 10.64
Table 2: Plant grow th characters and yield as influenced by different seed treatments
NS- Non-significant, Means fol lowed by the same lower case letter/ s in a column do not di ffer significantly by DMRT (P = 0.05)
Treatments Dosage
(ml or g k g-1 of seed)
Plant height (cm)
No. of branches plant -1
No. of capsules plant -1
100 seed weight
(g)
Yiel d (q ha-1)
Additional yi el d over control
(q ha-1) Fipronil 5 SC 5 ml 77.48 8.61 20.53 5.15c 7.96c 2.58 Imidacloprid 600 FS 5 ml 79.26 9.42 22.60 5.48ab 9.38a 4.00 Thiamethoxam 70WS 5 g 78.26 9.22 21.33 5.17bc 8.52b 3.14 Acetamiprid 20 SP 5 g 78.57 9.12 21.40 5.35abc 9.16a 3.78 Imidacloprid 70 WS 5 g 79.46 9.84 22.73 5.60a 9.67a 4.30 Untreated Control - 77.04 8.60 20.13 4.39d 5.38d - S.Em.± - 0.74 0.28 0.72 0.10 0.17 - C.D. at 5% - NS NS NS 0.31 0.51 - C.V. (%) - 6.87 6.20 6.78 6.89 7.25 -

78 Journal of Eco-friendly Agriculture 13(2) 2018
Seed treatment, an eco-friendly approach for the management of safflower aphids
70 WS @ 5 g kg-1 (5.60 g), followed by imidacloprid 600 FS @5 ml kg-1 (5.48 g) and acetamiprid 20 SP @ 5 g kg-1 (5.35 g)were on par w ith each other. Thiamethoxam 70 WS @ 5 gkg-1 (5.17 g) and fipronil 5 SC @ 5 ml kg-1 (5.15 g) recordedleast 100 seed w eight. However, these treatments weresuperior to untreated check (4.39 g).
Seed yield and cost economicsEffect of different insecticides used as seed treatment
on seed yield and cost economics are presented in Table 3.
Highest seed yield of 9.67 q ha-1 was recorded byimidacloprid 70 WS @ 5 g kg-1 followed by imidacloprid 600FS @ 5 ml kg-1 (9.38 q ha-1) and acetamiprid 20 SP @ 5 g kg-1
(9.16 q ha-1) w hich is on par w ith each other and w eresi gni f icant ly superior over r est of t he t reat ment s.Thiamethoxam 70 WS @ 5 g kg-1 (8.52 q ha-1) was the nextbest treatment. However, lowest yield was recorded by fipronil5 SC @ 5 ml kg-1 (7.96 q ha-1) which was found superior tountreated check (5.38 q ha-1). The highest additional yieldover control was recorded by imidacloprid 70 WS @ 5 g kg-1
(4.30 q ha-1) followed by imidacloprid 600 FS @ 5 ml kg-1
(4.00 q ha-1) and acetamiprid 20 SP @ 5 g kg-1 (3.78 q ha-1).
In the present study seeds treated w ith imidacloprid70 WS @ 5 g kg-1 seeds, imidacloprid 600 FS @ 5 ml kg-1 seedsand acetamiprid 20 SP @ 5 g kg-1 seeds recorded significantlylowest aphid population of (28.04, 32.07 and 33.43 aphids 5cm apical tw ig-1, respectively) which were superior over otherseed treatments and recorded higher seed yield of 9.67, 9.38and 9.16 q ha-1, respectively. The next best treatments werethe seeds treated with thiamethoxam 70 WS @ 5 g kg-1 seedsand fipronil 5 SC @ 5 ml kg-1 seeds recorded aphid populationof 35.70 and 35.08 aphids 5 cm apical tw ig-1, respectivelyw ith seed yield of 8.52 and 7.96 q ha-1, respectively whichwere superior over untreated control. The results are in linew ith Singh et al. (2014) who reported that, among the seed
treatments w ith imidacloprid 70 WS @ 3 g kg-1, thiamethoxam70 WS @ 3 g kg-1, acetamiprid 20 SP @ 2 g kg-1, carbosulfan @30 g kg -1, fiproni l 5 SC @ 2 ml l -1 or kg -1 for 1 hour,monocrotophos 40 EC @ 3 ml kg-1 for 1 hour, imidacloprid70 WS @ 3 g kg-1 was most effective.
Imidacloprid 70 WS @ 5 g kg-1 seed recorded highestgross income of (` 27,083 ha-1) followed by imidacloprid 600FS @ 5 ml kg-1 (` 26,250 ha-1) and acetamiprid 20 SP @ 5 gkg -1 (` 25,641 ha-1). The next best t reatments w erethiamethoxam 70 WS @ 5 g kg-1 (` 23,842 ha-1) and fipronil 5SC @ 5 ml kg-1 (` 22,281 ha-1). However, lowest gross returnswas recorded in untreated check (` 15,050 ha-1).
Imidacloprid 70 WS, imidacloprid 600 FS @ 5 ml kg-1
and acetamiprid 20 SP @ 5 g kg-1 recorded highest net incomeof ` 13,162, 12,325 and 11,810 ha-1, respectively. The nextbest treatments were thiamethoxam 70 WS @ 5 g kg-1 (` 9,940ha-1) and fipronil 5 SC @ 5 ml kg-1 (` 8,473 ha-1). However,lowest net returns was recorded in untreated check (` 1,287ha-1).
Among the different treatments imidacloprid 70 WS @5 g kg-1 recorded highest B C ratio (1: 1.95) followed byimidacloprid 600 FS @ 5 ml kg-1 (1: 1.89) and acetamiprid 20SP @ 5 g kg-1 (1: 1.85) which proved to be good in themanagement of aphid. Thiamethoxam 70 WS @ 5 g kg-1 (1:1.72) and fipronil 5 SC @ 5 ml kg-1 (1: 1.61) showed least BCratio as compared to other seed treatments. However, lowestB C ratio was recorded in untreated check (1: 1.09).
REFERENCESAkashe, V. B., Pisal, A . A ., Mehtre, S. P. and Sawant, P. H. 1999.
Insect pest scenario of safflower in drought prone areas ofMaharashtra (India). Journal of Maharashtra AgriculturalUniversi ties, 14: 103-108.
A l i , S., Reddy, K. R. and Rao, N. G. 1994. Field efficiency ofinsecticides against safflower aphid Uroleucon compositae
Table 3: Effect of different insecticides used as seed treatment on seed yield of safflower and cost economics
Means fol lowed by the same lower case letter/ s in a column do not di ffer significantly by DMRT (P = 0.05)
Treatments Dosage
(ml or g ha-1) Yield
(q ha-1)
Percent i ncrease of yi el d over
control
Gross income (` ha-1)
Cost of cultivati on (` ha-1)
Net income (` ha-1) B:C ratio
Fipronil 5 SC 37.5 ml 7.96c 32.41 22,281 13,808 8,473 1.61 Imidacloprid 600 FS 37.5 ml 9.38a 42.64 26,250 13,925 12,325 1.89 Thiamethoxam70WS 37.5 g 8.52b 36.85 23,842 13,902 9,940 1.72 Acetamiprid 20 SP 37.5 g 9.16a 41.27 25,641 13,831 11,810 1.85 Imidacloprid 70 WS 37.5 g 9.67a 44.36 27,083 13,921 13,162 1.95 Untreated Control - 5.38d - 15,050 13,763 1,287 1.09 S.Em. ± - 0.17 - - - - - C.D. at 5 % - 0.51 - - - - - C.V. (%) - 7.25 - - - - -

Journal of Eco-friendly Agriculture 13(2) 2018 79
M. B. Gurunath and R. A. Balikai
(Theobald) and safflower mosaic disease. APAU ResearchJournal, 22: 45-48.
Anonymous 2007. AICRP (Saffl ower) Annual Repor t 2007,Directorate of Oi lseeds Research. (DOR), Hyderabad, p.165.
Anonymous 2014. Package of Practices for Higher Yields, Universi tyof A gr icultural Sciences, Dhar wad and Universi ty ofAgricultural Sciences, Raichur.
Bal ikai, R. A . and Yelshetty, S. 2001. Effect of ul tra low and highvolume sprayers on insecticides and neem oi l efficacy inthe control of safflower aphid. Indian Journal of AgriculturalResearch, 35: 133-135.
Dhruve, S. B., N imbalkar, S. A ., Undirwade, D. B. and Kulat, S. S.1993. Comparative efficacy of some modern insecticidesagainst aphids (Dactynotus carthami H.R.L.) on safflower.Journal of Soi ls and Crops, 3: 109-111.
Ghorpade, S. A., Pati l , N . M., Thakur, S. G. and Shinde, Y. M. 1994.Control of aphids and Helicoverpa armigera on safflower.Journal of Maharashtra Agricultural Universities, 19: 206-208.
Gurunath, M. B. and Bal ikai, R. A . 2017. Management of safflower
aphid, Uroleucon compositae through spray formulationsof insecticides. Journal of Experimental Zoology India, 20:369-372.
Sastry, K. 1997. Managing pests of safflower: New Paradigm. TheProceedings of IV International Safflower Conference, Bari (Italy),2-7th June, 1997, pp. 285-291.
Shetgar, S. S., Bi lapate, G. G., Puri , S. N. and Londhe, G. M. 1993.Chemical control of safflower aphid (Uroleucon sonchi).Indian Journal of Entomology, 55: 216-218.
Si ngh, D.K., Pal Sundar, Umr ao Ram Singh, Pal, R.K. 2014.Efficacy of insecticides as seed treatment against suckingpests of okra, (Abelmoschus esculuntus). Annals of PlantProtection Sciences, 22: 88-91.
Singh, V., Shing, H., Hegde, D. M., Ghorpade, S. A . and Men, U. B.2000. Insect pests of safflow er and their management.Journal of Appl ied Zoological Research, 2: 196-213.
Upadhyay, V. R., Kaul, C. L. and Mural idharan, C. M. 1990. Effectof various insecticides on the control of Uroleucon compositaeTheobald and economics of safflower , Carthamus tinctorius.Journal of Aphidology, 4: 43-47.
Manuscript recived on 17.2.2018Manuscript accepted for publication on 23.4.2018

80 Journal of Eco-friendly Agriculture 13(2) 2018
Integrated management of root-rot of guar using biological agents along with neem and fungicidsJournal of Eco-friendly Agriculture 13(2): 80-87. 2018
©2018
Integrated management of root-rot of guar using biologicalagents along with neem and fungicidsBurhanuddin Bohra, Kusum Mathur1, P.C. Trivedi2 and B.N. VyasResearch Centre, Godrej Agrovet Limited, Pirojshanagar, Eastern Express Highway, Vikhrol i (East), Mumbai-400 079, India.1Department of Plant Pathology, Rajasthan Col lege of Agriculture, Udaipur-313 001, India. 2Department of Botany, Universi ty ofRajasthan, Jaipur-302 004, India
Abstract
In order to ecofriendly management of root rot of guar, biocontrol agents, oi l based neem formulation andcarbendazim were evaluated in various combinations as seed and seed + soil treatments in field condition. The seedtreatment with T. harzianum Gn1+B. subtilis Ch-Kp-b-1 resulted in highest seed germination and dry biomass ofplants and lowest disease incidence as compared to untreated control where seed germination and dry biomass werelowest and root rot incidence was highest. The combination of T. harzianum with oil based neem formulation and thecombinat ion of B. subt ilis with both oil based neem formulat ion and carbendazim also proved better resulti ng inhigher seed germination and dry biomass and reduced disease incidence as compare to control. In case of soil + seedtreatment T. harzianum soil treatment & carbendazim seed treatment was found higher effective follow ed by thecombination of T. harzianum Gn1+B. subtilis Ch-Kp-b-1 where disease incidence were less dry biomass were high. Ithas been observed that the over all disease incidence was lower and dry biomass of guar plants was higher in thetreatments specially BCAs which were applied as seed treatments compared to their soil treatments. The integratedtreatments were significantly superior over the individual treatment. All the treatments significant ly suppressed theinoculum density of F. solani and R. solani over the untreated control. The studies on population densities of the BCAsand the two pathogens revealed that the BCAs established and multiplied well in guar rhizosphere and could alsoeffectively suppress the pathogens. The effective BCAs- T. harzianum Gn1 and B. subtilis Ch-Kp-b-1, were furtherevaluated in micro plots by integrating the host plant resistance, chemical fungicide carbendazim, and oil based neemformulation. These were tested in different combinations with guar root-rot tolerant cultivar ‘Swati-55’ and highlysusceptible cultivar ‘Pusa Nav Bahar ’. Highest seed germination was recorded in tolerant cultivar where combinationof T. harzianum Gn1 and B. subtilis Ch-Kp-b-1 was applied. This was foll owed by carbendazim seed treatment +drench. Combination of T. harzianum Gn1 and B. subtilis Ch-Kp-b-1 also resulted in lower disease (ranging from 4.4to 14.9 per cent during 30-70 days of sowing) and highest yield of green pod and dry biomass of guar plants followedby carbendazim (seed tr eatment + soi l drench) and T. harzianum Gn1+B. subti li s Ch-Kp-b-1+ oi l based neemformulation. Similar trend of the efficacy of combined treatments were also observed with susceptible cultivar ‘PusaNav Bahar ’. In this seed treatment with oil based neem formulation along with BCAs was significantly superior insuppressing the di sease and higher yield of green pod and dry biomass w eight of plants over control. Al l t hetreatments resulted in significant suppression of the guar root-rot pathogens as compared to untreated control in boththe cultivars. The population densities of F. solani and R. solani was considerably less in tolerant cultivar “Swati-55”(42 and 22 x 105 c.f.u./ g soil, respectively) than in the susceptible cultivar ‘Pusa Nav Bahar ’, where these were 60.3and 30.8 x 10⁵ c.f.u./ g soil, respectively. In Pusa Nav Bahar also, the integrated treatments resulted in significantlylow inoculum densities of the 2 root-rot pathogens as compared to control. The lower population densities of thesetwo guar root -rot pathogens as observed in the pot experiment was further confirmed in micro plot testing. Thoughthe effects of the t reatments w ere consistent i n both, tolerant and susceptible culti vars, their effects were bet terrealized in tolerant cultivar. This shows the effectivity of the selected strains of the BCAs. The integration of fungal andbacterial BCAs as seed treatment proved highly effective than fungicide (carbendazim) seed treatment plus drench,and the individual BCAs were almost at par with it. Integration of BCAs with oil based neem formulation was alsoquite effective.
Keywords: Guar, Root rot, Fusarium solani, Rhizoctonia solani, Biocontrol, Integrated disease management, Neemformulation, Trichoderma harzianum, Bacillus subtilis
Guar [Cyamopsis tetragonoloba (Linn.) Taub.] is aneconomically important drought tolerant annual leguminouscrop in India, where three forth of the global guar cultivationis carried out. Rajasthan, having 4255000 hectares of areaunder guar cultivation and producting 2415000 tones at 567kg ha-1 productivity level, is the largest guar producing statein India (Anonymous, 2014).
Guar is attacked by many fungal pathogens, causingfoliar diseases and root rot diseases. Preliminary surveys inguar cultivation areas of Rajasthan state revealed that bothR. solani and F. solani are involved together in causing rootrot, and a control strategy to suppress both the pathogens isrequired. The popular cu l t ivar ‘Pusa Nav Bahar’ issusceptible to this disease. Application of fungicides is not

Journal of Eco-friendly Agriculture 13(2) 2018 81
Burhanuddin Bohra, Kusum Mathur, P.C. Tri vedi and B.N . Vyas
very effective. When applied as seed treatment, these maynot last longer enough in effective concentration to suppressthe pathogen, while the crop remains susceptible to thedisease throughout the grow ing season. Soil application offungicides is un-economical, hazardous and may also harmnon-target (beneficial) flora in the soil. This problem can,however be tackled through use of botanicals or biocontrolagents and their integration w ith fungicides.
For developing an effective biological control and itsintegration w ith fungicides and/ or other control strategies,i t is imperat ive to select ef fective antagonist(s) andunderstand their behaviour in the rhizosphere and soil.Similarly, botanicals, particularly neem (Azadirachta indica),have also been found effective in management of cropdiseases and there is a need to study their efficiency andexplore the possibility of their integration w ith biocontrolagents for developing effective management package for thisdisease. Keeping in view the above facts, the presentinvestigations were undertaken w ith the objective to explorepossibilities of integrating effective biocontrol agents, neemformulation and/ or fungicides to enhance the efficiency ofdisease control.
M ATERIALS AND M ETHODSPot experiment: Trichoderma harzianum Gn1, Bacitlus subtilisCh-kp-b-1, oil based neem formulation and fungicideCarbendazim found effective in the suppression of guar root-rot w er e ev aluated in p ot exper iment in d i f ferentcombinat ions, as seed and seed + soil t reatments forecofriendly management of guar root-rot. Culture of both F.solani and R. solani was multiplied on corn-meal sand (1:1)medium and added in the pot soil as described in previouspot experiment.
For soil application, T. harzianum Gn1 and B. subtilisCh-kp-b-1 were used. T. harzianum Gn1 was grown onautoclaved shelled maize cobbs - wood saw dust (1:1) inconical flasks at 25 ± 1ºC for 15 days (Meena, 1995). It wasthen air dried and used for soil treatment @ 10g / pot. Theculture of B. subtilis Ch-kp-b-1 was grown on King’s B mediumfor 5 days and then used for soil treatment @ 10ml/ pot bythorough mixing of pot soil.
For seed treatment, culture of T. harzianum Gn1 wasgrown on 2 per cent malt extract liquid medium for 10 days.The mycelial mats along w ith the spores so developed wereseparated by filtering through filter paper and dried overnight at 25 ± 1ºC. Dried culture was gently powdered andmixed w ith equal amount of sterilized fine clay and equalvolume of sterilized water to make a slurry. This mixturewas used for seed coating. The coated seeds were kept
overnight in moist chamber so as to enable the antagonist toestablish on seeds. For seed treatment with B. subtilis Ch-kp-b-1, guar seeds were soaked in the bacterial suspension foran hour and were kept overnight in moist chamber. In caseof multiple seed treatments w ith both, fungus and bacterium,the seeds were first soaked in bacterial suspension and thencoated w ith fungal slurry.
Seeds were soaked in carbendazim (0.1%) and oil basedneem formulation (0.2%) solutions for an hour for individualseed treatments. While in different combined treatments thedose of both carbendazim and oil based neem formulationwas reduced to 0.05 and 0.1per cent, respectively. In case ofmult ip le seed treatments w ith both, oi l based neemformulation/ carbendazim and T. harzianum Gn1/ B. subtilisCh-kp-b-1, the seeds were first treated with oil based neemformulation/ carbendazim and then with T. harzianum Gn1/ B. subtilis Ch-kp-b-1. In case of individual seed treatmentw ith neem formulations and fungicides, soil drenching wasalso done at 15, 30 and 45 days after sow ing @ 50ml/ pot.
Treated seeds w ere sown in pots @ 10 seeds pot-1
keeping 4 replications for each treatment. Samples of 5 seedswere randomly drawn to determine inoculum density of theindividual biocontrol agent in each treatment. Just beforesow ing, soil samples were taken from each pot at the depthof 2 inches to determine initial population densities of thetwo pathogens.
Observations on total number of germinated seedlingswas recorded after 10 days of sowing. Total number of plantsand root-rot infected plants were recorded after 45 and 60days of sow ing. Dry biomass weight of guar plants wererecorded after harvesting and oven drying at 60 days ofsow ing. Observations on root-rot incidence were recordedat 45 and 60 days after sow ing. To determine the populationof biocontrol agents and their possible effect on F. solani andR. solani soil samples from guar rhizosphere and aroundfrom both, diseased and healthy plants were collected after60 days of sow ing. Samples were collected from each pot ofeach treatment carefully by uprooting the plants and lightlyshaking these to remove extra soil. The rhizospere soil wascollected by lightly scrapping with a hard brush. Samples ofall the four replications of each treatment were pooled andplaced in poly thene bags, labeled and bought to thelaboratory. Sub samples from these pooled samples wereused to determining population of biocontrol agents and thepathogens as per the method described earlier.
I I. M icroplot experimentIn order to evolve an effective and eco-friendly approach
for the management of guar root-rot complex, an experiment

82 Journal of Eco-friendly Agriculture 13(2) 2018
Integrated management of root-rot of guar using biological agents along with neem and fungicids
in microplots was conducted in randomized block design(RBD) by integrating the host plant resistance, biologicalcontrol agents, chemical fungicide and Neem formulation.Promising biocontrol agents- fungus T. harzianum Gn1 andbacterium B. subtilis Ch-kp-b-1, effective oil based neemformulation and effective fungicide carbendazim w ereintegrated in different combinations w ith guar root- rottolerant cultivar ‘Swati-55’ and also w ith the susceptiblecultivar Pusa Nav Bahar.
Culture of F. solani and R. solani was multiplied onmaize-meal sand (1:1) mixture at 25±1º C for 10 days. These2 cultures were finally mixed w ith equal proportion andadded in the equal amount of sterilized soil. This mixture ofsoil was added in the soil of micro plots (1.5 x 1.5m) @ 300gplot -1. In each set, 3 micro p lots as 3 replications weremaintained. All the plots were individually lightly irrigatedw ith a hose pipe taking care that the irrigation water doesnot mix in the neighbouring plots. These plots were used forsow ing 20 days after inoculation.
For seed treatments, cultures of T. harzianum Gn1 wasgrown on 2 percent malt extract agar (MEA). The spores andcolonies of T. harzianum Gn1 so developed were harvestedby suspending in 20ml water in each petri dish and mixedw ith sterilized fine clay (10g) to make slurry. B. subtilis Ch-kp-b-1, culture was grown on King’s ‘B’ medium. Guar seedswere soaked in the bacterial suspension for an hour andwere kept overnight in moist chamber. In case of multipleseed treatments w ith both, fungus and bacterium, the seedswere first soaked in bacterial suspension and then coatedw ith fungal slurry.
Seeds were soaked in carbendazim (0.1%) and Oil basedneem formulation (0.2%) solutions for an hour for individualseed treatments. In case of multiple seed treatments w ithboth, Oil based neem formulation/ carbendazim and T.harzianum Gn1 / B. subtilis Ch-kp-b-1, the seeds were firsttreated w ith Oil based neem formulation/ carbendazim andthen w ith T. harzianum Gn1 / B. subtilis Ch-kp-b-1. Drenchingof each oi l based neem formulation @ 0.2 per cent andcarbendazim @ 0.1 per cent was done at 15 days interval upto harvesting, by irrigating 250ml suspension around theplants in each plot.
Observations on total number of germinated seedlingswas recorded after 10 days of sowing. Total number of plantsand root-rot infected plants were recorded after 30, 45 and70 days of sow ing. Green pod Yield was recorded up to 70days of sow ing. Dry biomass of guar plants w as alsoestimated at the time of harvesting. Observations on root-rotincidence were recorded at 45 and 60 days after sow ing. Todetermine the population of biocontrol agents and their
possible effect on F. solani and R. solani soil samples fromguar rhizosphere and around from both, diseased andhealthy p lants w ere col lected after 70 days of sow ing.Samples were collected from each plot of each treatmentcarefully by uprooting the plants and lightly shaking theseto remove extra soil. The rhizospere soil was collected bylightly scrapping w ith a hard brush. Samples of all the fourreplications of each treatment were pooled and placed inpolythene bags, labeled and bought to the laboratory. Subsamples from these pooled samples were used to determiningpopulation of biocontrol agents and the pathogens as perthe method described earlier.
The data were subjected to analysis of variance andleast significant difference (critical deviation) determined at5 per cent probability. Treatment means were compared usingC.D. (critical difference) to determine efficacy of the differenttreatments. All the experiments were repeated once andpooled data were used for analysis.
RESULTS AND DISCUSSIONThe pot experiment results presented in Table 1 showed
that seed treatment w ith combination of T. harzianum Gn1 +B. subtilis Ch-Kp-b-1 was resulted in the highest (85 per cent)germination and lowest root-rot (2.0 and 3.5 per cent) at 45and 60 days, respectively. It also show ed highest drybiomass w eight (10.1g), as compared to 37.5 per centgermination and 74.4 and 86.2 per cent root- rot and 0.65gdry biomass in the untreated control.
The integrated treatments were significantly (p = 0.05)superior over the ind iv idual ones. Combination of T.harzianum Gn1+ oil based neem formulation, B. subtilis Ch-Kp-b-1+carbendazim, B. subtilis Ch-Kp-b-1 + oil based neemformulation and T. harzianum Gn1 + carbendazim followedin order, show ing germination ranging from 83.7-80.0 percent, and root-rot of 2.2-7.1 per cent at 45 days after sow ingand 4.7-12.2 per cent at 60 days after sow ing. The integrationof soil p lus seed treatments of T. harzianum Gn1 andcarbendazim also show ed good d isease suppressionresulting in 80 per cent germination, 5.2 and 8.5 per centroot-rot and 9.4g dry weight of plants. This was followed bycombination of T. harzianum Gn1 and B. subtilis Ch-Kp-b-1as both seed and soil treatment. The latter show ed lessdisease 11.2 per cent at 60 days also and significantly higherdry biomass weight (8.0g).
The over all disease incidence was lower and dryweight of biomass was higher in the treatments, speciallythe BCAs which were applied as seed treatments comparedto their soil treatments.
The data on population density of biocontrol agents

Journal of Eco-friendly Agriculture 13(2) 2018 83
Burhanuddin Bohra, Kusum Mathur, P.C. Tri vedi and B.N . Vyas
and pathogens in rhizosphere soil (Table 2) showed that allthe treatments signif icantly suppressed the inoculumdensity of F. solani and R. solani over the untreated control. Inthe latter, the population density at 60 days were 92.3 and40.1 c.f.u./ g soil. In seed treatment w ith T. harzianum Gn1+B. subtilis Ch-Kp-b-1, the population were 2.0 and 0.4 x 10⁵
c.f.u./ g soil , w hich were significant ly low er than theirindividual treatment as wel l as control. Good pathogensuppression w as also observed in combinat ion of T.harzianum Gn1+ oil based neem formulation and B. subtilisCh-Kp-b-1 and Carbendazim seed t reatment. But othertreatments w ere not effective against F. solani and i tspopulat ion reduced to 18-29.7 x 10⁵ c.f .u ./ g soil . Soi l
application of T. harzianum Gn1 was better effective inpathogen suppression as compared to B. subtilis Ch-Kp-b-1.In these, suppression of R. solani was more than of F. solani.In various soil+seed treatments, the population of F. solaniranged from 14.0-31.1 x 10⁵ c.f.u./ g soil.
Among soil + seed treatment, combination of soilapplication of T. harzianum Gn1+ carbendazim seedtreatment was the most effective in suppression of the twopathogens, where 14.0 x 10⁵ c.f.u./ g soil of F. solani and 1.7 x10⁵ c.f.u./ g soil of R. solani were recorded.
Application of combination of biocontrol agents wasfound better effective than their individual treatments. This
Table 1. Evaluation of biocontrol agents in combination with effective neem formulation and fungicide for suppression of guarroot-rot
*Average of four repl ications DAS = Days A fter SowingValues in parenthesis are ArcsinÖpercentage
Per cent disease i ncidence* Treatment Per cent seed germination* 45 DAS 60 DAS
Dry biomass of plants pot -1* (g)
Seed Treatment Trichoderma harzianum Gn1 75.0 (60.0) 8.9 (17.3) 14.5 (22.3) 6.400 Bacillus subtilis Ch-Kp-b-1 47.5 (43.5) 19.8 (26.4) 25.0 (29.9) 3.475 Trichoderma harzianum Gn1 + Bacillus subtil is Ch-Kp-b-1
85.0 (67.4) 2.0 (8.0) 3.5 (10.7) 10.075
Trichoderma harzianum Gn1 + Oil based neem formulation (0.1%)
83.7 (66.3) 2.2 (7.3) 4.7 (12.5) 9.950
Trichoderma harzianum Gn1 + Carbendazim (0.05%) 80.0 (63.7) 7.1 (15.4) 12.2 (20.4) 7.600 Bacillus subtilis Ch-Kp-b-1 + Oil based neem formulation (0.1%)
80.0 (66.8) 5.7 (13.7) 10.3 (18.7) 9.025
Bacillus subtilis Ch-Kp-b-1 + Carbendazim (0.05%) 82.5 (65.4) 3.9 (11.3) 6.9 (15.1) 9.600 Oil based neem formulation (0.2%) 75.0 (60.0) 10.4 (18.8) 15.2 (22.9) 6.400 Carbendazim (0.1%) 70.0 (56.9) 11.7 (19.9) 20.8 (27.1) 5.375 Carbendazim (0.1%) + Oil based neem formulation (0.2%)
55.0 (47.8) 15.7 (23.3) 22.3 (28.1) 4.850
Soi l + Seed Treatment Trichoderma harzianum Gn1 [both soil + seed treat.] 52.5 (46.4) 15.9 (23.4) 25.0 (29.9) 4.375 Bacillus subtilis Ch-Kp-b-1 [both soil + seed treat.] 55.0 (47.9) 13.8 (21.7) 22.1 (27.9) 5.050 Trichoderma harzianum Gn1 soil treat.+ Carbendazim (0.05%) seed treat.
80.0 (64.1) 5.2 (13.1) 8.5 (16.9) 9.450
Trichoderma harzianum Gn1 soil treat.+ Oil based neem formulation (0.1%) seed treat
77.5 (65.2) 8.6 (17.0) 12.5 (20.6) 6.900
Bacillus subtilis Ch-Kp-b-1 soil treat. + Carbendazim (0.05%) seed treat.
70.0 (57.0) 12.9 (21.0) 20.8 (27.1) 5.150
Bacillus subtilis Ch-Kp-b-1 soil treat.+ Oil based neem formulation (0.1%) seed treat.
77.5 (62.1) 8.9 (17.3) 13.7 (21.7) 6.800
[Trichoderma harzianum Gn1 + Bacillus subtil is Ch-Kp-b-1] soil treat + Carbendazim (0.05%) seed treat.
75.0 (60.6) 9.8 (18.2) 16.4 (23.8) 6.050
[Trichoderma harzianum Gn1 + Bacillus subtil is Ch-Kp-b-1] soil treat. + Oil based neem formulation (0.1%) seed treat.
70.0 (56.9) 10.1 (18.4) 19.2 (25.9) 6.000
Control (Untreated) 37.5 (37.7) 74.4 (59.7) 86.2 (68.3) 0.650 SEm+ 3.85 0.83 0.61 0.29 LSD (p = 0.05) 10.90 2.30 1.70 0.84

84 Journal of Eco-friendly Agriculture 13(2) 2018
Integrated management of root-rot of guar using biological agents along with neem and fungicids
is, because the bio control agents vary in their spectrum andthe type and amount of antibiotics they produce (Hawell etal. 2000). These two pathogens incited pre-germination rotof the guar. This may be the reason that BCAs seed treatmentwas more effective than soil treatment, as the BCAs presenton the seed have better chances for establishing on thedeveloping hypocotyle and root systems (Mukhopadhyayet al.1992), compared to those applied in the soil.
The tested BCAs establish well in guar rhizosphereand significantly suppressed the inoculum density of thetwo pathogens over the untreated (inoculated) control. It wasobserved that w ith plant development, the inoculum densityof the two pathogens also increased. Some effect of oil basedneem formulation and Carbendazim alone applied as both,seed treatment and soil drench at 45 days were also effectivein reducing the disease and suppressing the pathogens. Butin practical disease control, their repeated use is not onlyun-economical but may also have residue hazards. Therefore,development and use of integrated management strategyinvolv ing biocontrol agents and seed t reatment w ithfungicides/ botanicals should be more useful.
The results of the microplot experiment where inpromising biocontrol agents T. harzianum Gn1 and B. subtilisCh-kp-b-1, oil based neem formulation and carbendazim wereintegrated in different combinations w ith Guar root- rottolerant cultivar ‘Swati-55’ and also w ith the susceptiblecultivar Pusa Nav Bahar (Table 3). That the inoculation ofboth the pathogen in soil were effective, as in untreated plots(control), pre-emergence rotting occurred and only 22.7 percent germination was observed in tolerant cultivar ‘Swati-55’, and 12.7 per cent in susceptible cultivar ‘Pusa NavBahar’. All the tested treatments resulted in significantlyhigher germination over the untreated controls. Highestgermination (81.5 per cent) in Swati-55 was recorded w ithcombined application of T. harzianum Gn1+ B. subtilis Ch-Kp-b- 1, followed by carbendazim seed treatment + drench(73.3 per cent). Combination of seed treatment w ith oil basedneem formulation w ith the two BCAs resulted in almost atpar germination with that of carbendazim (67.4 and 67.2 percent, respectively) w ith the two BCAs, while T. harzianumGn1 and B. subtilis Ch-Kp-b-1 alone were not much effectivein the micro plots.
Combination of T. harzianum Gn1 and B. subtilis Ch-Kp-b-1 also resulted in lowest disease, which ranged from4.4- 14.9 per cent during 30-70 days. This was clearlyfol low ed by car bend azim 0.1 per cent (seedtreatment+drenching) and T. harzianum Gn1+ B. subtilis Ch-Kp-b-1+Carbendazim or T. harzianum Gn1+ B. subtilis Ch-Kp-b-1+ Oi l based neem formulat ion (0.2%). All these
treatments developed around 20 per cent root-rot up to 70days. The highest yield of green pods and dry biomass ofplants was obtained w ith T. harzianum Gn1 plus B. subtilisCh-Kp-b-1 seed treatment (1037.5g and 197.5g, respectively)followed by Carbendazim (seed treatment +soil drench) andT. harzianum Gn1+ B. subtilis Ch-Kp-b-1 + oil based neemformulation (Table 3). The latter did not differ significantlyfrom combination of Carbendazim with T. harzianum Gn1+B. subtilis Ch-Kp-b-1.
The combined treatments were significantly superiorin terms of germination, the disease suppression, yield ofgreen pods and dry biomass weight over the individualtreatment. Similar trends of efficacy of combined treatmentswere also recorded w ith cultivar ‘Pusa Nav Bahar’. In this,combined seed treatment of the tw o BCA s w i th Neemformulation was also significantly superior in suppressingthe disease at 45 and 70 days, and also in yield of green podand dry biomass weight of plants over control.
The biocontrol agents applied as seed treatmentindividual ly or in combination, or in combination w ithfungicide carbendazim seed treatment or oil based neemformulat ion, establ ished and mul tip l ied w el l in thedeveloping guar rhizosphere. The population of the eachBCAs was higher in their individual treatment as comparedto their combination as well as in further integration w ithcarbendazim or oi l based neem formulat ion. Al l thetreatments resulted in significant suppression of the twopathogens as compared to the untreated control in both theguar cultivars (Table 4). The population density of F. solaniand R. solani was considerably less in tolerant cultivar ‘Swati-55’ (42.0 and 22.0 x 10⁵ c.f.u./ g soil, respectively), than thatin the susceptible cultivar ‘Pusa Nav Bahar’, where thesewere 60.3 and 30.8 x 10⁵ c.f .u ./ g soi l, respectively . Intreatments w ith two BCAs, the population density of thepathogens was 15.7 and 3.6 x 10⁵ c.f.u./ g soil, while in theirfurther integration with carbendazim, the population densitywas 18.0 and 4.8 x 10⁵ c.f.u./ g soil and w ith oil based neemformulation there was 18.5 and 3.9 c.f.u./ g soil, respectively.Application of carbendazim alone as seed + soil drench alsoresulted in suppression to 22.0 and 8.9 x 10⁵ c.f.u./ g soil,respectively.
In Pusa Nav Bahar also, the integrated treatmentsresulted in significantly low inoculum densities of thepathogens as compared to the untreated control. In theintegration w ith carbendazim, the population densities were18.2 and 10.3 c.f.u./ g soil, while w ith Neem formulation,these were 15.6 and 6.9 x 10⁵ c.f.u./ g soil, respectively.
Diseases caused by soil borne pathogens are difficult

Journal of Eco-friendly Agriculture 13(2) 2018 85
Burhanuddin Bohra, Kusum Mathur, P.C. Tri vedi and B.N . Vyas
to manage, because these pathogens are natural soi linhabitants and can survive in the soil for prolonged periodsin the soil as saprophytes on the decaying crop residues aswell as in the form of resistant resting structures likechlamydospores and sclerot ia (Bochow 1987). Use ofbiocontrol agents has advantage as these are good substratecompetitors, and also suppress the pathogens by activeantagonisms including antibiosis and in case of fungal BCAsby mycoparasitism. The Trichoderma spp. have been termedas opportunistic, avirulent plant symbionts (Harman et al.2004). Establishment and multiplication of the introducedbiocontrol agents in the rhizosphere is crucial for practicalbiological control. The efficacy of the biocontrol agents canbe increased by – (i) Genetic manipulation of the biocontrolagents, (ii) Modification of soil environment to enhance the
grow th and activity of BCAs such as organic or inorganicsoil amendments or use of effective food base, or (iii) Use ofmore than one BCA. In the dry land crop like guar, the latteroption seemed more feasible. Therefore, the two biocontrolagents w ere used in mixture, and further evaluated incombination w ith fungicide (carbendazim) and botanicals(oil based neem formulation). It was found that the efficacyof the two BCAs in combination was much better than theindividual one, and was somewhat reduced when used w ithcarbendazim or oil based neem formulation. The effect of thetreatments varied in the two guar cultivars, and were betterrealized in tolerant cultivar ‘Swati-55’ as compared to thesusceptible cultivar ‘Pusa Nav Bahar’. The lower populationdensities of the two guar root-rot pathogens in rhizosphereof tolerant cultivar as observed in the pot trial were further
Table 2. Population densities of biocontrol agents and pathogens in rhizosphere soil of guar cultivar ‘Pusa Nav Bahar’
Ini tial populationof F.solani at sowing = 1 x 10⁶ Ini tial population of R.solani at sowing = 4 x 10⁵
Ini tial population of T.harzianum Gn1 on seed: 2.0 x 10⁶ c.f.u./ seed Initial population of B.subti l is on seed: 17.5 x 10⁹ c.f.u./ seed
Population of BCAs and pathogens per gram rhizosphere soi l after 60 days of sowing Treatment T.h. Gn1 (c.f.u. x
106) B. s.Ch-kp-b-1(c.f .u. x
109) F. solani
(c.f .u. x 105) R. solani
(c.f.u. x 105) Seed treatment Trichoderma harzianum Gn1 4.5 - 13.1 3.6 Bacillus subtilis Ch-Kp-b-1 - 23.0 27.7 4.3 Trichoderma harzianum Gn1 + Bacillus subtil is Ch-Kp-b-1 0.2 60.3 2.0 0.4 Trichoderma harzianum Gn1 + Oil based neem formulation (0.1%)
2.6 - 3.0 1.0
Trichoderma harzianum Gn1 + Carbendazim (0.05%) 1.5 - 20.0 2.2 Bacillus subtilis Ch-Kp-b-1 + Oil based neem formulation (0.1%)
- 5.0 18.0 2.0
Bacillus subtilis Ch-Kp-b-1 + Carbendazim (0.05%) - 5.6 5.0 1.4 Oil based neem formulation (0.2%) - - 29.7 4.0 Carbendazim (0.1%) - - 28.4 2.4 Carbendazim (0.1%) + Oil based neem formulation 0.2%) - - 29.5 2.5 Seed + soil treatment Trichoderma harzianum Gn1 [both soil + seed treat.] 0.8 - 21.2 2.9 Bacillus subtilis Ch-Kp-b-1 [both soil + seed treat.] - 89.2 31.1 4.0 Trichoderma harzianum Gn1 + Bacillus subtil is Ch-Kp-b-1 [both soil + seed treat.]
0.2 75.8 19.7 2.3
Trichoderma harzianum Gn1 soil treat.+ Carbendazim (0.05%) seed treat.
1.3 - 14.0 1.7
Trichoderma harzianum Gn1 soil treat.+ Oil based neem formulation (0.1%) seed treat
2.2 - 21.0 3.0
Bacillus subtilis Ch-Kp-b-1 soil treat. + Carbendazim (0.05%) seed treat.
- 16.7 29.0 3.6
Bacillus subtilis Ch-Kp-b-1 soil treat.+ Oil based neem formulation (0.1%) seed treat.
- 6.3 23.0 2.8
[Trichoderma harzianum Gn1 + Bacillus subtil is Ch-Kp-b-1] soil treat + Carbendazim (0.05%) seed treat.
1.0 29.0 25.3 2.7
[Trichoderma harzianum Gn1 + Bacillus subtil is Ch-Kp-b-1] soil treat. + Oil based neem formulation (0.1%) seed treat.
2.4 68.0 26.4 2.9
Control (Untreated) - - 92.3 40.1

86 Journal of Eco-friendly Agriculture 13(2) 2018
Integrated management of root-rot of guar using biological agents along with neem and fungicids
Table 3. Integrated management of guar root-rot in micro plots
*Average of three repl ications DAS = Days after sowing Values in parenthesis are ArcsinÖpercentage
Per cent disease i ncidence * Treatment Seed Germinati on*
(%) 30 DAS 45 DAS 70 DAS
Green pod weight (gm)*
Dry bi omass of pl ants plot-1
(gm)* Variety: Swati-55 Trichoderma harzianum Gn1 (ST) 65.6
(54.1) 14.6
(22.4) 15.6 (23.2) 21.9 (27.9)
803.5 110.0
Bacillus subtil is Ch-Kp-b-1 (ST) 45.8 (42.6)
22.2 (28.1) 26.6 (31.0) 32.1 (34.5)
397.0 69.9
Oil based neem formulation (0.2%) (ST+Drench) 55.5 (48.2)
15.9 (23.5) 18.5 (25.5) 27.4 (31.5)
555.0 87.1
Carbendazim (0.1%) (ST+Drench) 73.3 (58.8)
5.2 (13.0) 11.9 (20.1) 17.3 (24.6)
907.0 183.4
Trichoderma harzianum Gn1 + Bacillus subtil is Ch-Kp-b-1 (ST)
81.5 (64.5)
4.4 (11.9) 8.0 (16.30) 14.9 (22.5)
1037.5 197.5
Trichoderma harzianum Gn1 + Bacillus subtil is Ch-Kp-b-1+Carbendazim (0.1%) (ST)
67.2 (55.0)
11.0 (19.3) 14.2 (22.0) 20.7 (27.0) 837.5 114.2
Trichoderma harzianum Gn1 + Bacillus subtil is Ch-Kp-b-1+ Oil based neem formulation (0.2%) (ST)
67.4 (55.0)
8.9 (17.3) 13.7 (21.6) 18.3 (25.3) 850.0 118.6
Control (Untreated) 22.7 (28.3)
27.0 (31.3) 33.9 (35.6) 38.8 (38.2)
197.5 46.1
Variety: Pusa Nav Bahar Trichoderma harzianum Gn1 + Bacillus subtil is Ch-Kp-b-1+ Carbendazim (0.1%) (ST)
37.6 (37.8)
6.5 (14.8)
24.2 (29.4)
31.8 (34.2)
339.3 150.9
Trichoderma harzianum Gn1 + Bacillus subtilis Ch-Kp-b-1+ Oil based neem formulation (0.2%) (ST)
44.4 (41.7)
5.6 (13.6)
9.7 (18.1)
17.3 (24.5)
515.3 192.6
Control (Untreated) 12.7 (20.7)
20.1 (26.5)
59.7 (50.6)
76.9 (61.4)
229.0 37.7
SEM + 1.3 1.0 0.9 1.3 15.9 5.4 LS D (p = 0.05) 3.9 2.9 2.7 3.8 47.1 6.1
Table 4. Population densities of biocontrol agents and pathogens in rhizosphere soil of guar in micro plots
Initial c.f.u. of T. harzianum Gn1: 2.2 x 10⁶ per seed Initial c.f.u. of B. subti l is Ch-Kp-b-1: 17.8 x 10⁹ per seedInitial c.f.u. of F. solani : 10.1 x 10⁵ per g soi l Ini tial c.f.u. of R. solani : 4.8 x 10⁵ per g soi l
Populati on of BCAs and pathogens per g soil 70 days after sowing Treatment T. harzi anum Gn1
(x105) B. subti l i s Ch-Kp-b-1
(x109) F. solani
(x105) R. solani
(x105) Var. Swati-55 Trichoderma harzianum Gn1 3.5 - 15.0 3.9 Bacillus subtilis Ch-Kp-b-1 - 28.5 20.8 3.6 Oil based neem formulation (0.2%) - - 25.1 6.8 Carbendazim (0.1%) - - 28.0 8.9 Trichoderma harzianum Gn1 + Bacillus subtil is Ch-Kp-b-1 3.0 26.1 12.7 3.6 Trichoderma harzianum Gn1 + Bacillus subtil is Ch-Kp-b-1 + Carbendazim (0.1%)
1.6 19.3 18.0 4.8
Trichoderma harzianum Gn1 + Bacillus subtil is Ch-Kp-b-1 + Oil based neem formulation (0.2%)
2.7 19.0 18.5 3.9
Control (Untreated) 0.0 0.0 42.0 22.0 Var. Pusa Navbahar Trichoderma harzianum Gn1 + Bacillus subtil is Ch-Kp-b-1 + Carbendazim (0.1%)
1.8 21.0 18.0 10.3
Trichoderma harzianum Gn1 + Bacillus subtil is Ch-Kp-b-1 + Oil based neem formulation (0.2%)
1.9 20.0 15.6 6.9
Control (Untreated) 0.0 0.0 60.3 30.8
Journal of Eco-friendly Agriculture 13(2) 2018 87
Burhanuddin Bohra, Kusum Mathur, P.C. Tri vedi and B.N . Vyas
confirmed in the microplots also. The consistent effect of theBCAs in tolerant as well as susceptible cultivar also showsthe ef ficacy of the selected strains of BCAs in d iseasesuppression.
Such attempts have been found effective in other studiesalso. Zhang et al. (1996) combined Gliocladium virens withBacillus subtilis to effectively suppress w ilt and root- rot ofcotton caused by Fusarium oxysporum. Jeong et al. (1993)demonstrated that in cucumber, presence of fluorescentbacteria Pseudomonas putida in root system was beneficial forcolonization by Gliocladium virens G 872, and the inoculumof the latter in roots apparently lowered the population ofFusarium oxysporum in cucuber roots. Kroji and Papavizas(1983) successfu l ly combined host p lant resistance,biocontrol agent T. viride (T-1-R4) and seed treatment w ithmetalaxyl to control damping-off and root-rot in pea.Chattopadhyay and Sen (1996) used Aspergillus niger + T.viride + carbendazim seed treatment for control of muskmelon w ilt, and could considerably reduce the disease aswell as population of the pathogen. In the present studiesalso combination of T. harzianum Gn1 and B. subtilis Ch-Kp-b-1 was very effective, and can be used as the majorcomponent s of integrated management package of guar root-rot complex.
There is an increasing body of evidence to demonstratethat the biocontrol agents not only suppress the pathogenby active antagonism, but also act as biochemical elicitors ofdisease resistance. Induction of resistance to Rhizoctoniasolani in cot ton roots through elici tation of terpenoidphytoalexin has been reported by How ell et al. (2000).Induction of phytoalexin capsidiol and pathogenesis relatedproteins like chitinase and â-1, 3 glucanase has also beenreported by Trichoderma spp. in chilli root-rot caused byRhizoctonia solani (Mathur et al. 2004). The possibilities ofinduction of systemic or local resistance responses due tothese BCAs in guar rhizosphere need to be studied. But forpractical application, it is desirable to evaluate these BCAsin integrated package under diverse agro-climatic conditionin conventional guar producing belt of Rajasthan, followedby their commercial production for use by the farmers.
REFERENCESAnonymous, 2014. An analysis of performance of guar crop in
India (2013-14), CCSNIAM, Jaipur.
Bochow, H. 1987. Possibi l i ties of protecting plant roots againstphytopathogens by biological means (Biological Control).In: Interrelationship between microorganisms and plantin soi l . Proceedings of International Symposium Libl ice(Zechoslovakia), June 22-27, 1987.
Chattopadhyay, C. and Sen, B. 1996. Integrated management ofFusar i um w i l t of muskmel on caused by Fusar i umoxysporum. Indian Journal of Mycology and Plant Pathology, 26:162-170.
Harman, G.E.; Howell , C.R.; Viterbo, A .; Chet, I and Lori to, M.2004. Trichoderma species- opportunistic, avirulent plantsymbionts. NatureReview-Microbiology, 2: 43-56.
Hawell , C.R.; Hansan, L.E.; Stipanovic, R.D. and Puckhabar, L.S.2000. Induction of terpenoid synthesis in cotton roots andcontr ol of Rhizoctoni a solani by seed treatment w i thTrichoderma virens. Phytopathology, 90: 248-252.
Jeong, M.J.; Park, C.S. and Kim. 1993. Rhizosphere competenceof Gliocladium virens and Pseudomonas putida and theirsyner gi st ic col onization i n cucumber r oots. 6th ICPP(Abstr.), P. 274.
Kroji , J.M. and Papavizas, G.C. 1983. Use of host resistance,Trichoderma and fungicides to control soi l borne diseasesand increase seed yield of peas. Plant Disease, 67: 1234-1237.
Mathur, K.; Zacharia, S. and Mathur, P.N. 2004. Biocontrol andsystemical ly acquired resistance in chi l l i against root-rotcaused by Rhizoctonia solani Kuhn, ICAR Ad-hoc projectreport, M.P.U.A.&T. pp.72.
Meena, R.L. 1995. Evaluation of some fungal and bacteri albiocontrol agents for suppression of rhizome rot of ginger.M.Sc. Thesis, R.A.U., Bikaner.
Mukhopadhyay, A .N.; Shrestha, S.M. and Mukherjee, R.K. 1992.Biological seed treatment for control of soi l borne plantpathogens. FAO Plant Protection Bul letin, 12: 26-35.
Zhang, J.X.; Howell , C.R. and Starr, J.L. 1996. Suppression ofFusarium colonization of cotton roots and Fusarium wilt byseed treatments with Baci llus subtil is and Gliocladium virens.Biocontrol Science and Technology, 6: 175-187.
Manuscript recived on 19.2.2018Manuscript accepted for publication on 23.5.2018

88 Journal of Eco-friendly Agriculture 13(2) 2018
Bio-efficacy of fungicides against late blight disease of potato caused by Phytophthora infestans (Mont)Journal of Eco-friendly Agriculture 13(2): 88-91. 2018
©2018
Potato (Solanum tuberosum), an important staple foodin different states of India, is prone to more than a hundreddiseases cau sed ei ther by bact er ia, fungi , v i ruses,phytoplasma, viroids and nematodes, etc. The most commonfungal d iseases are late bl ight of potato caused byPhytophthora infestans (Mont.) de Bary (Irish famine, 1845),wart disease caused by Synchytrium endobioticum (Schilb.)Perch., fusarium dry rot caused by Fusarium sulphureumSchlechtendahl, fusarium wilt caused by F. avenaceum (Fr.)Sacc., gray mold caused by Botrytis cinerea Pers.:Fr., pink rotcaused by Phytophthora drechsleri Tucker, phoma leaf spotcaused by Phoma andigena var. andina Turkensteen, powderyscab caused by Spongospora subterranea (Wallr.) Lagerh,rhizoctonia canker and black scurf caused by Rhizoctonia solaniKühn, septoria leaf spot caused by Septoria lycopersici Spegand white mold caused by Sclerotinia sclerotiorum (Lib.) deBary. However, late blight or phytophthora blight caused bythe omycetease fungus, Phytophthora infestans (Mont) de Barryis worldw ide in distribution (Hardy et al., 1995) and is oneof the most important fol iage d iseases in areas w ithfavourable weather conditions.
The late blight is the most destructive disease of potatoin India (Singh, 1996). The disease under conducive weatherconditions causes heavy yield losses in susceptible potatocul t ivars annual ly in d i fferent states of Ind ia. M anyfungicides, contact and systemic, are recommended tomanage the disease and farmers are using them many timesto protect their crops. There is a tendency of development ofresistant fungal races against use of systemic fungicides(Singh, 1996). Josepovits and Dobrevalszky (1985) reportedthat the use of fungicides w ith different modes of action isthe best strategy to delay build up of resistance. New
Bio-efficacy of fungicides against late blight disease of potatocaused by Phytophthora infestans (Mont)Ram ChandraDepartment of Mycology and Plant Pathology, Institute of Agricultural Sciences, Banaras H indu University, Varanasi – 221005 (U.P.)Email: [email protected], [email protected]
Abstract
The present work deals with the bio-efficacy of newer fungicides against sheath bli ght of potato, the mostimportant disease of potato worldwide. All the fungicidal treatments recorded significantly less PDI in comparisonto control. However, amisulbrom 20% SC (Kirari) applied @ 500 ml ha-1, recording minimum and significantly lessPDI was found the most effective in producing disease free tubers and yielding significantly higher yields ie., 402.77q ha-1 in 2013-14 and 380.06 q ha-1 in 2014-15 than other treatments.
Key words: Bio-efficacy, fungieides, potato late flight
fungicide, amisu lbrom 20% SC (Kirar i) w as thereforeevaluated against the late blight disease of potato and theresults are presented.
M ATERIALS AND M ETHODSA comparative study for the evaluation of different
fungicides was carried out at Department of Mycology andPlant Pathology, Institute of Agricultural Sciences, BanarasHindu University, Varanasi, Uttar Pradesh. Well sproutedpotatoes of Kufari Naveen that were susceptible to late blightinfection were planted at 60 cm between row spacing and 9cm w ithin row spacing in a randomized complete blockdesign w ith four replications. The fungicides were appliedas per treatments mentioned above by foot sprayer fitted withhollow cone nozzle at the initiation of disease incidence andrepeated after 10 days. Ten plants were selected randomlyin each plot and the data on disease severity were recordedusing 0-9 disease rating scale as given below, one day beforespray and 10 days after 1st spray and 10 & 20 days after 2nd
spray.
Fungicides w ith active ingredient and dose formulation
Amisulbrom 20% SC (Kirari) 60 300 Amisulbrom 20% SC (Kirari) 80 400 Amisulbrom 20% SC (Kirari) 100 500 Famoxadone 16.6 % + Cymoxanil 22.1 % (Equation Pro SC) 210 500 Metiram 55 % + Pyraclostrobin 5 % (Cabrio top WG) 1050 1750
The yield of potato tubers for different treatments was
recorded at harvest alongw ith the percent tuber infection.Percent disease Index (PDI) and percent tuber infection werecalculated as per formula given below :

Journal of Eco-friendly Agriculture 13(2) 2018 89
Ram Chandra
(Disease severity level x number of leaflets with same severity level)
% Disease Index (PDI) = ––––– –––––––– ––––––––– –––––––– x100 (Total number of leaflets x 9)
Total no. of tuber harvest – Total no. infected tuber from the plot harvest from the plot
Tuber infection (%) =–––––––––––––––––––––––––––––––––––– x 100 Total no. of tuber harvest from the plot
The disease severity data was arcsine transformedbefore analysis of variance (ANOVA). Recorded data weresubjected to statistical analysis using ANOVA of SASstatistical data analysis software. Duncan’s multiple rangetests was used to determine the most significant treatment(Steel, et. al., 1997).
RESULTS AND DISCUSSION
Bio-ef ficacyThe pre-treatment data on percent disease index (PDI)
in different treatments and the control that varied between1.50 to 2.40 and 8.90 to 11.10 in crop season 2013-14 and2014-15, respectively, did not differ significantly.
After 10 days of 1st spray treatment (before 2nd spraytreatment), the PDI ranged from 0.50 to 12.40 percent indifferent treatments and 50 percent in control and all thetreatments recorded significantly less PDI in comparison tocontrol in crop season 2013-14. However, the PDI rangedfrom 5.4 to 12.10 percent in different treatments and 45.40percent in control and all the treatments recorded significantlyless PDI in comparison to control in crop season 2014-15.Amisulbrom 20 percent SC (Kirari) @ 500 ml ha-1 recordedminimum PDI (0.50%) and was found significantly moreeffective in comparison to other fungicides. Famoxadone16.6 percent + Cymoxanil 22.1 percent (Equation Pro SC) @500 ml ha-1, Metiram 55 percent + Pyraclostrobin 5 percent(Cabrio top WG) @ 1750 ml ha-1 and Amisulbrom 20 percentSC (Kirari) @ 400 ml ha-1 were next effective fungicides andall treatments were at par w ith each other in both crop season2013-14 and 2014-15 (Table 1 & 2).
Ten and 20 days after 2nd spray t reatment, all thefungicidal treatments recorded significant ly less PDI incomparison to control. However, amongst the treatments,amisulbrom 20 percent SC (Kirari) @ 500 ml ha-1 recordedminimum and significantly less PDI in comparison to theremaining t reatments. Famoxadone 16.6 percent +Cymoxanil 22.1 percent (Equation Pro SC) @ 500 ml ha-1,Metiram 55 percent + Pyraclostrobin 5 percent (Cabrio top
Disease severity
rating grade
Disease incidence %
age
Level of resistance/ Susceptibil ity
0 0.0 No disease 1 10% Small lesion on the inoculated point with
the lesion area less than 10% of the whole leaflet
3 10% and 20% Lesion area between 10% and 20% of the whole leaflet
5 20% and 30% Lesion area between 20% and 30% of the whole leaflet
7 30% and 60% Lesion area between 30% and 60% 9 Over 60% Lesion area over 60% of the whole leaflet
Rating scale for the assessment of late blight severityon potato leaves (Shutong, et. al., 2007)
Table 1: Per cent disease Index (PDI) of late blight (Phytophthora infestans) on potato in different treatments before and 10 daysafter 1st spray treatment 2013-14
Fungicide Dose ha-1 PDI before treatment
PDI 10 days after 1st spray
treatment
PDI 10 days after 2nd spray treatment
PDI 20 days after 2nd spray
treatment Amisulbrom 20% SC (Kirari) 60 300 2.00
(8.05) 12.40
(20.60) 10.90
(19.20) 15.10
(22.85) Amisulbrom 20% SC (Kirari) 80 400 1.50
(6.92) 7.90
(16.30) 5.80
(13.90) 7.10
(15.43) Amisulbrom 20% SC (Kirari) 100 500 1.90
(7.85) 0.50
(3.91) 0.90
(5.34) 0.00
(0.00) Famoxadone 16.6% + Cymoxanil 22.1% (Equation Pro SC)
210 500 2.10 (8.30)
8.20 (16.60)
7.00 (15.31)
8.20 (16.61)
Metiram 55% + Pyraclostrobin 5% (Cabrio top WG)
1050 1750 2.40 (9.10)
9.80 (18.21)
5.90 (14.03)
7.90 (16.30)
Control - - 1.80 (7.67)
50.00 (44.98)
60.80 (51.20)
70.10 (56.86)
SEm± (0.64) (1.25) (1.25) (1.12) CD 5% (NS) (4.10) (4.01) 3.59)
Figures in parenthesis are angular transformed values

90 Journal of Eco-friendly Agriculture 13(2) 2018
Bio-efficacy of fungicides against late blight disease of potato caused by Phytophthora infestans (Mont)
WG) @ 1750 ml ha-1 and Amisulbrom 20 percent SC (Kirari)@ 400 ml ha-1 were the next effective fungicides and all wereat par w ith each other in both crop season 2013-14 and 2014-15 (Table 1 & 2).
In all the treatments, infested tubers by the disease werefound to be signi ficantly less in comparison to control.However, amongst the treatments, amisulbrom 20 percentSC (Kirari) applied @ 500 ml ha-1 was most effective, as allthe tubers were fee from disease infection. Famoxadone 16.6percent + Cymoxanil 22.1 percent (Equation Pro SC) @ 500
ml ha-1, Metiram 55 percent + Pyraclostrobin 5 percent(Cabrio top WG) @ 1750 ml ha-1 and Amisulbrom 20 percentSC (Kirari) @ 400 ml ha-1 were next effective fungicidesrecording only 2.50 to 2.90 percent of infected tubers asagainst 35 percent and this same fungicides were effectiveranged between 1.10 to 5.40 percent of infected tubers asagainst 32.10 percent in control in both crop season of 2013-14 and 2014-15 respectively (Table 3).
Yield of potato tubersAll fungicidal treatments recorded significantly more
Table 2: Per cent disease Index (PDI) of late blight (Phytophthora infestans) on potato in different treatments before and 10 daysafter 1st spray treatment 2014 -15
Figures in parenthesis are angular transformed values
Fungicide Dose (ha-1)
PDI before treatment
PDI 10 days after 1st spray
treatment
PDI 10 days after 2nd spray treatment
PDI 20 days after 2nd spray
treatment Amisulbrom 20% SC (Kirari) 60 300 10.20
(18.57) 12.10
(20.33) 9.90
(18.32) 10.15
(18.55) Amisulbrom 20% SC (Kirari) 80 400 9.50
(17.82) 8.20
(16.61) 7.80
(16.30) 9.70
(18.10) Amisulbrom 20% SC (Kirari) 100 500 8.90
(17.33) 5.40
(13.31) 1.20
(6.27) 0.90
(5.44) Famoxadone 16.6% + Cymoxanil 22.1% (Equation Pro SC)
210 500 11.10 (19.44)
10.60 (18.40)
8.15 (16.55)
9.90 (18.30)
Metiram 55% + Pyraclostrobin 5% (Cabrio top WG)
1050 1750 10.00 (18.37)
8.60 (17.03)
7.90 (16.29)
10.10 (18.49)
Control - - 9.80 (18.16)
45.40 (42.34)
58.00 (49.58)
60.80 (51.21)
SEm± (0.86) (0.60) (0.50) (0.51) CD 5% (NS) (1.83) (1.52) (1.55)
Table 3: Per cent infested tubers by late blight (Phytophthora infestans) and yield of potato in different treatments during 2013-14 and 2014-15
Figures in parenthesis are angular transformed value
Dose (ha-1)
Dose (ha-1)
Per cent infested tuber at harvest
Yield (q ha-1)
Fungicides
a.i. (g)
Formulation (g ml -1)
2013-14 2014-15 2013-14 2014-15
Amisulbrom 20% SC (Kirari) 60 300 3.50 (10.72)
5.40 (13.41)
260.80 210.40
Amisulbrom 20% SC (Kirari) 80 400 2.50 (9.06)
3.10 (10.08)
360.40 292.10
Amisulbrom 20% SC (Kirari) 100 500 0.00 (0.00)
1.10 (6.01)
402.77 380.60
Famoxadone 16.6% + Cymoxanil 22.1% (Equation Pro SC) 210 500 2.90 (9.77)
2.55 (9.11)
370.50 310.50
(Metiram 55% + Pyraclostrobin 5% (Cabrio top WG) 1050 1750 2.80 (9.62)
2.60 (9.25)
375.50 293.75
Control - - 35.00 (36.25)
32.10 (34.49)
190.40 180.40
SEm± (0.49) (0.34) 8.43 20.38 CD 5% (1.58) (1.04) 26.92 59.13

Journal of Eco-friendly Agriculture 13(2) 2018 91
Ram Chandra
tuber yield in comparison to control. Amongst the treatments,amisulbrom 20 percent SC (Kirari) @ 500 ml ha-1 recordedsignificantly higher yield of 402.77 q ha-1 in 2013-14 and380.06 q ha-1 in 2014-15 in comparison to the remainingtreatments. Famoxadone 16.6 percent + cymoxanil 22.1percent (equation pro SC) @ 500 ml ha-1, was also foundeffective against tuber infection and produced good tuberyield 375.50 q ha-1 in 2013-14 and 293.75 q ha-1 in 2014-15.Another tested fungicide metiram 55 percent + pyraclostrobin5 percent (Cabrio top WG) @ 1750 ml ha-1 and amisulbrom20 percent SC (Kirari) @ 400 ml ha-1 recorded significantlymore yield 375.50 q ha-1 and 293.75 q ha-1 than amisulbrom20 percent SC (Kirari) @ 300 ml ha-1 260.80 q ha-1 and 210.40q ha-1 in crops season 2013-14 and 2014-15. The lowest yieldof potato tuber was obtained from plot of control it wasweighted 190.40 q ha-1 and 180.40 q ha-1 in both crops seasonof 2013-14 and in 2014-15 (Table 3).
Varied range of chemical fungicides are available inthe market for controlling Phytophthora infestans and so isthe extent of disease inhibition w ith them. Therefore, byselecting appropriate chemical fungicides, farmers can savetheir crops in best possible way. The study may be helpful tothe farmers for selection of effective fungicides for control oflate blight of potato and also in obtaining better yield.
ACKNOWLEDGEM ENTThe author gratefu lly acknow ledges the f inancial
assistant for data generat ion under Dhanuka AgritechLimited, New Delhi.
REFERENCESHardy, B, Trognitz, B and Forbes, G. 1995. Late bl ight breeding at
CIP. CIP Circular (Lima-Peru), 21:2-5.Josepovits, G and Dobrevalszky, A . 1985. A novel mathematical
approach to the prevention of fungicide resistance. PesticideScience, 16:17-22.
Si ngh, D. 1996. Fungi ci dal spray schedul e for economicalmanagement of potato late bl ight in North-western hi l lsof India. Indian Journal of Mycology and Plant Patyhology,1:252-255.
Sharma, P. and Saikai, M.K. 2013. Management of late bl ight ofpotato through chemicals. IOSR Journal of Agriculture andVeterinary Science, 2:23-26
Steel, R. G. D., Torrie, J. and Dickey, D. 1997. Principles andProcedues of Statistics: A biometrical approach (3rd edn).McGraw Hil l book Co, New York, US.
Sahu, D. K., Khare, C.P., Singh, H. K. and Thakur, M. P. 2013.Evaluation of newer fungicide for management of earlybl ight of tomato in Chhattisgarh. The Bioscan, 8: 1255-1259
Shutong, W., H.U., Tongle, Z., Fengqiao, H.R., Forrer and Keqiang,C.A.O.. 2007. Screening for plant extracts to control potatolate blight. Frontiers of Agriculture in China, 1:43-46.
Manuscript recived on 17.1.2018Manuscript accepted for publication on 23.5.2018

92 Journal of Eco-friendly Agriculture 13(2) 2018
Evaluation of different substrates on growth period and yield of oyster mushroom (Pleurotus ostreatus) (Jacq. Fr.) P. KummJournal of Eco-friendly Agriculture 13(2): 92-94. 2018
©2018
Oyster mushroom (Pleurotus astreatus), commonly calledas Dhingri in India because of its oyster like shape, belongsto family Pleurotaceae. It has about 40 well recognized species,out of which 12 species are cultivated in different parts ofcountry. Pleurotus is an efficient lignin-degrading mushroomand can grow well on different type of lingo cellulosic materialunder variable temperature conditions and hence are ideallysuited for cultivation throughout the year in various regionsof tropical country like India. Among all cultivated mushroomgenera, Pleurotus comprises the largest number of speciesand varieties. Most of them grow best at temperature below200 C and while others prefer temperatures between 240 and300 C. So oyster mushrooms cultivation of varied shape,colour, texture and aroma can be achieved round the year.
Oyster mushroom growers have wide range of substratecontaining lignin and cellulase together as its carbon sourcerequired for product ion of oyster mushroom. These aresunflower seed hulls, rice/ wheat/ straw , bean, sugarcanebaggasse, rubber tree, sawdust groundnut shells, cottonwaste, cottonseed hulls, coco lumber saw dust, coffee pulp,corncobs, paper, water hyacinth, water lily, cocoa shell wasteand coir pith.
Huge quantities of lingo-celluloid crop residues andother organic wastes are generated annually through theactiv i ties of agricul tural , forest and food processingindustries. It is estimated that India is generating 600 milliontons of agricultural waste besides, fruit and vegetable residue,coir dust, husk, dried leaves, pruning, coffee husk, tea wastewhich when burnet create problems of air soil and water
Evaluation of different substrates on growth period and yieldof oyster mushroom (Pleurotus ostreatus) (Jacq. Fr.) P. KummR. Ravi Naik and Ram ChandraDeptt. of Mycology and Plant Pathology, Insti tute of Agricultural Sciences, Banaras H indu Universi ty, Varanasi – 221005 (U.P.)
Abstract
Mushroom cultivation is the most suitable technology for creating wealth and health out of waste from plants,animal and industries which are abundantly available on earth in India. There are agricultural waste are available inhuge quantity but maximum part of these agricultural waste are burnt after harvesting. This poor management ofagricultural waste are increasing environmental pollution. The investigations carried out on the comparison of differentsubstrates on growth period and yield of oyster mushroom (Pleurotus ostreatus) revealed minimum spawn run periodon wheat straw (20.67 days) against maximum of 25 days on paddy straw. Similar pattern in the cropping period,registering lowest of 54 days on wheat straw and maximum of 60 days on paddy straw was recorded. The highestyield (878 g bed-1) was obtained from mushroom bed of wheat straw + paddy straw + weeds. Wheat straw substratealso gave a good yield (821.33 g bed-1) while the lowest (598.34 g bed-1) from mushroom bed of paddy straw.
Key words: Agri wastes, growth, yield and Pleurotus ostreatus
pollution affecting human, animal and plant vegetationadversly. Burning of agricul tural wastes also increaseproblem of global warming and raise in temperature. Butmilky mushroom production is one of the potent ways to berecycled as substrate. If even one per cent of these cropresidues are used to produce mushroom, India will becomea major mushroom producing country in the world (Tewariand Pandey, 2002). Therefore, the present study was basedon the yield performance of oyster mushroom (Pleurotusostreatus) when grown on different agro based substrates.
M ATERIALS AND M ETHODSThe fresh fruit body of oyster mushroom (Pleurotus
ostreatus) (Jacq. Fr.) P. Kumm collected from growing room ofmushroom spawn laboratory, BHU was used for preparationof mushroom culture. It was sub-cultured and maintainedon PDA medium at 26oC temperature in BOD incubator forfurther investigation. Wheat straw (Triticum aestivum), paddystraw (Oryza sativa), weed (Echinochloa colonum), mango leaf(Mangifera indica), collected from Agricultural Farm, Instituteof Agricultural Sciences, B.H.U. were used as substrates formusroom cultivation.
Wheat straw , paddy straw , mixture of paddy straw ,wheat straw and weed straw (1:1:1), mixture of wheat straw ,weed straw and mango leaf litter (3:2:1), mixture of wheatand paddy straw (1:1).
The substrates were chopped, dr ied, f reed f romdiseases, rottings and other inert matters and soaked in waterfor 15 hr. in large plastic buckets. After soaking, excess water

Journal of Eco-friendly Agriculture 13(2) 2018 93
R. Ravi Naik and Ram Chandra
was drained out. The moist substrates, filled in gunny bags,were sterilized (at 121°C, 15 psi for 1 hr.) in autoclave, cooledand later spread on clean floor. Spawn of Pleurotus ostreatuswere mixed separately in different substrates @ 4 kg quintal -
1 dry substrates and filled in separate polythene bags. Eachbag contained 2 kg moist substrate. Later size 6-8 small holes(1 mm) were made around the bags.
The mushroom bags were kept vertically in a dark room,where temperature and relative humidity, ranging between24-28ºC and 80-85 per cent, respectively was maintained forthe spawn run. After completion of the spawn run, thepolythene bags w ere torn off f rom the sides w i thoutdisturbing the beds, the mushroom removed and kept onwooden racks. To provide adequate moisture, water onmushroom beds was sprayed daily.
Oyster mushrooms were harvested before sprayingwater. The right stage for picking can be judged by the shapeand size of fruiting bodies. In young mushrooms, the edge ofthe cap is thick and the cap margin is enrolled, while the capof mature mushrooms becomes flat and inward curlingstarts. It is advisable to harvest all the mushrooms at onetime from a bag so that the next crop of mushrooms startsearly. Usually 5-6 days after opening the bags, mushroomprimordial began to form. Fruiting bodies were harvested inabout 4-5 days after their appearance. Harvesting was doneby grasping the stalk and gently pulling or tw isting themushroom from substrates level. Mushroom fruiting wascontinued after harvesting f irst, second and so on.Afterharvesting, lower parts of the stalks/ stipes w ith adheringdebris should be cut using a knife. Fresh mushroom washarvested three times at appropriate intervals.
The dat a on grow th peri ods, var ious grow thparameters and the yield potential were recorded andanalysed statistically.
RESULTS AND DISCUSSIONThe data pertaining to grow th period (spawn run
period, initiation of pin head, harvesting of 1st flush, 2nd
flush and harvesting of 3rd flush) of Pleurotus ostreatus onfive substrates is given in table 1.
The mushroom bed of wheat straw was colonized veryfast by mushroom mycelium (20.67 days) followed by mixedsubstrate of wheat straw+weed+mango leaf litter (23 days).The maximum spawn run period of 25 days was recordedfrom mushroom bed of paddy straw . Other grow th periodlike initiation of fruiting bodies, harvesting of 1st flush,harvesting of 2nd flush and harvesting 3rd flush were alsorecorded. The mushroom pin heads were first initiated (25.67days) from mushroom bed of wheat straw followed bymixture of wheat and paddy straw (26.33 days) and wheatstraw+weed+mango leaf (27 days). Maximum period of pinhead initiation (28.33 days) was recorded from paddy strawfollowed by 28.0 days on paddy straw+wheat straw+weedand minimum of 26.33 days on wheat strw. The mushroombed of wheat straw was also first for each harvesting of first(31 days), second (41 days) and third flushes (53.6 days).The minimum total cropping period of 53.6 days f rommushroom bed of wheat straw and maximum of 60 daysfrom mushroom bed of paddy straw was recorded.
Our results are in accordance w ith Ahmed (1998) whoreported the spawn run period of P. ostreatus to be completedw ithin 17–20 days on different substrates. Khan et al., 2001studied the cultivation of oyster mushroom on differentsubstrates and reported that after spawn running, pinheadformation took 7-8 days and sporocarps formed after 10-12days. Cotton waste gave the highest yield. Formations offruiting bodies per bag were also more in the cotton waste.Shah et al. (2004) found that pin-heads appeared in about 6days.
The data on effect of different substrates on grow thparameters on P. ostreatus, presented in table 2, showedhighest number of fruiting bodies on wheat straw (30.67)and minimum on wheat + paddy straw (23.87). Maximumweight of fruiting body was observed on wheat + paddy +weed straw (31.44 gm ) and minimum on wheat + paddystraw (24.33 gm). Maximum stalk length (9.53 cm) was
Table 1. Effect of different substrates on grow th period of Pleurotus ostreatusGrowth period (days) Substrates
Spawn run peri od Pin head ini ti ation 1st Harvesting 2nd Harvesting 3rd Harvesti ng Total crop peri od Wheat straw 20.67 25.67 31 41 53.6 53.6 Paddy straw 25 28.33 36.3 49 60 60 Paddy straw + Wheat straw + Weed (1:1:1) 23.3 28 34.33 44.3 55.3 55.3 Wheat straw + Weed + Mango leaf (3:2:1) 23 27 33 45 57.33 57.33 Paddy straw + Wheat straw (1:1) 23.67 26.33 37.67 47.67 56.6 56.6 SeM 0.89 0.95 1.54 1.74 1.34 CD at 5% 2.81 3 4.88 5.49 4.25 CV 6.69 6.13 7.78 6.65 4.13

94 Journal of Eco-friendly Agriculture 13(2) 2018
Evaluation of different substrates on growth period and yield of oyster mushroom (Pleurotus ostreatus) (Jacq. Fr.) P. Kumm
observed on wheat + paddy + weed straw against minimum(5.57 cm) on wheat + paddy straw . Maximum total length offruiting body was observed on wheat + weed + paddy straw(12.20 cm) against minimum on wheat + paddy straw (8.67cm). Maximum diameter of cap was observed on paddy straw(11.38cm) whereas minimum (8.33 cm) was observed onwheat straw .
Yield potentialThe comparative evaluation of five different substrates
on yield potential of 1st flush, yield of 2nd flush and 3rd flushand the total yield of Pleurotus ostreatus, presented in table 3,showed the highest yield (878 g bed -1) from mushroom bedof wheat straw + paddy straw + weed (1:1:1). The wheatstraw substrate has also gave good yield (821.33 g bed -1).The lowest yield (598.34 g bed -1) w as obtained f rommushroom bed of paddy straw . The above result w asconfirmative w ith finding of Das and Mukherjee (2007) whofound that when weed plants were mixed w ith rice straw inthe 1:1 ratio, there is increase in the yield than when usedindividually. Kumari and Varenyam 2008 reported highestyield of P. ostreatus on wheat straw (29.27 g fresh weight kg-
1 substrate) followed by the combination of paddy and wheatstraw (27.96 g fresh weight kg-1 substrate). Jadhav et al. (1996)studied the effects of different substrates on the yield of oystermushroom, which was cultivated on wheat straw , paddystraw , stalks and leaves of maize and cotton, jowar, soybeanstraw , groundnut creepers plus wheat straw . Cotton stalksand leaves gave the best results as compared to the othersubstrates. It may thus be concluded that mushroom bedprepared from mixture of three agriculture residues likepaddy straw , wheat straw and weed straw was superiorcompared to other substrates in increasing. The grow th andyield potential of oyster mushroom (Pleurotus ostreatus).
REFERENCESAhmed, S. 1998. Performance of di fferent substrates on the growth
and yield of oyster mushroom Pleurotus sajor-caju (Fr.) Sing.M .S. thesi s, Depar tment of H ort i cul tur e. Insti tute ofpostgraduate stud ies in A gr icul ture, Salna, Gazipur ,Bangladesh.
Das, N. and Mukherjee, M. 2007. Indoor Cultivation of Pleurotusostreatus. Philo Agriculture, 61: 253-262.
Jadhav. A . B., Bagal, P.K. and Jadhav, S.W. 1996. Effects of di fferentsubstrates on y ield of oyster mushroom. MaharashtraAgriculture, 3: 424-426.
Kumari, D. and Varenyam, A . 2008. Effect of di fferent substrateson the production and non-enzymatic antioxidant activi tyof Pleurotus ostreatus. Life Science Journal , 5: 73-76.
Shah, Z.A ., Ashray, M. and Ishtiod, M. 2004. Comparative studyon cultivation and yield performance of oyster mushroom(Pleurotus ostreatus) on different substrates. Pakistan Journalof Nutri tion, 3: 158-160.
Tewari, R.P. and Pandey, M. 2002. Sizeable income generatingventure:In the H indu Survey of Indian Agriculture, 155-167.
Manuscript recived on 16.2.2018Manuscript accepted for publication on 26.4.2018
Table 2. Effect of different substrates on grow th parameters of Pleurotus ostreatusSubstrate Total no. of
frui ti ng bodies M ax. wt. of
fruit ing body (g)
M in. wt. of f ru it ing body
(g)
M ax. length of stal k
(cm)
M in. length of stalk
(cm)
Total length of f ru it ing body
(cm)
Max dia. of cap (cm)
M in. d ia. of cap (cm)
Wheat straw 30.67 25.98 9.84 5.93 4 9.85 8.33 5.04 Paddy straw 28.33 31.44 10.44 6.19 3.57 10.47 11.38 4.77 Paddy+Wheat+ Weed straw
29 29.65 11.67 9.53 6.40 12.20 9.29 4.57
Wheat+Weed+Mango leaf
24 28.23 12.32 7.93 4.62 10.42 10.90 5.16
Paddy+Wheat straw 23.87 24.33 10 5.57 4.43 8.67 10.43 5.63 SEM 1.23 1.29 0.94 0.38 0.34 0.36 0.55 0.31 CD at 5% level 3.90 4.06 2.98 1.21 1.08 1.13 1.74 0.98 CV 7.90 8.00 15.13 9.50 12.88 6.04 9.53 10.76
Table 3. Effect of different substrates on yield potential of
Pleurotus ostreatusYield potential (g bed-1) Substrates
1st Fl ush 2nd Flus 3rd Flus Total Wheat straw 308 277.33 236 821.33 Paddy straw 213.67 216 168.67 598.34 Paddy + Wheat + Weed straw 326.33 306.67 245 878 Wheat + Weed + Mango leaf 290 268.33 216.67 775 Paddy + Wheat straw 263 254 193.33 710.33 SeM 12.36 7.50 6.12 CD at 5% level 38.64 23.63 19.30 CV 7.57 4.91 4.99

Journal of Eco-friendly Agriculture 13(2) 2018 95
Krishnaveni R, Vandana Rathod, Prema Kulkarni, Shuba and Hema RaoJournal of Eco-friendly Agriculture 13(2): 95-101. 2018
©2018
Tyrosinase catalyzes the oxidat ion of phenol iccom pounds t o the correspond ing quinones and isresponsible for the enzymatic brow ning of frui ts andvegetables. It is an important enzyme in controlling the qualityand economics of fruits and vegetables in food industry (1).In addition to the undesirable color and flavor, the quinonecompounds produced in the brow ning react ion mayirreversibly react w ith the amino and sulfhydryl groups ofproteins. The quinone-protein react ion decreases thedigestibility of the protein and bioavailability of essentialam ino acid s, i nclu d ing ly sine and cysteine. Theunfavourable darkening from enzymatic oxidation generallyresults in a loss of nutritional value in mushrooms, sea foodsand has been of great concern (1, 2).
Tyr osinase p lay s an imp ortant r ole in t hedevelopmental and defensive functions of insects. Tyrosinaseis involved in melanogenesis, w ound healing, parasi teencapsu lat i on and sclerot izat ion in i nsects(3). Thedevelopment of tyrosinase inhibitors have become an activealternative approach in controlling insect pests. In addition,tyrosinase inhibitors have become increasingly importantin cosmetic (4) and medicinal products in relation to hyperpigmentation. Melanin plays an important role in protectinghuman skin from the harmful effects of UV radiation fromthe sun, also determines phenotypic appearance. Variousdermatological d isorders such as hyper p igmentedlentigenes include melasma, age spots and sites of actinicdamage result in the accumulation of an excessive level of
Raid screening of antityrosinase compounds from fungiKrishnaveni R1,2, Vandana Rathod2, Prema Kulkarni2, Shuba and Hema Rao1Dept of Biotechnology, University of Agricultural Sciences, Dharwad2Department of Microbiology, Gulbarga University KalaburagiE-mail: [email protected]
Abstract
Tyrosinase inhibitors are involved in controlling the undesired browning in fruits, vegetables and marine foodsand also they used as whitening agents. The research in finding tyrosinase inhibitors drawn attention as there is a needin finding new inhibitors because the present tyrosinase inhibitors are having side effects such as carcinogenic properties.The screening of different fungies done through plate assay technique using dual assay technique on enriched PDAand inibitory studies done by using spectrophotometric assay, where partially purifired tyrosinase from Acremoniumrutilum was used, revealed that A.niger-1 and A.ornatus showed 98.3 and 98.1 per cent inhibition, which were highestas compared to other screened fungi . Plate assay method appears t o be the best and rapid method for tyrosinaseinhibitors, as all isolates screened by plate assay has shown inhibition to partially purified enzyme which were usedfor plate assay. A.ornatus showed a strong positive reaction with Fecl3 test indicating that the compound is kojic acidwhich was separated by TLC with a standard kojic acid and the separated compound again showed 98.5 per centtyrosinase inhibition. Kojic acid was identified as a potent fungal tyrosinase inhibitor from A.ornatus. A.niger -1 didn’tshow any of the compounds tested and require a detail study. When the percent inhibition of synthetic kojic acid wascompared with naturally screened and identified kojic acid, the percent inhibition was 91 per cent with synthetic IC 501mM, where as it was 98.5 per cent inhibition which is appreciable with natural kojic acid irrespective of the concentration.
Keywords: Aspergillus ornatus, kojicacid, tyrosinase inhibitory activity
epidermal pigmentation(5). Great interest has shown ininvolvement of melanin in malignant melanoma, the mostlife-threatening skin tumors. Therefore, development of high-performance tyrosinase inhibitors is necessary for theapplications in agricultural, cosmetic, pharmaceutical andfood industries Since most of the research was done on bothsynthetic and natural inhibitors especially plant origin, ourstudy was mainly focused on rapid screening, productionand purification of fungal metabolites as anti tyrosinasecompounds where no reports are existing in this area. Hencescreening of tyrosinase producing fungus Acremoniumrutilum were isolated and tyrosinase was purified. A.rutilumwas used as indicator organism and the anti tyrosinasecompounds w ere screened both by p late assay andspectrometric inhibitory assay.
M ATERIALS AND M ETHODS
Plate assay techniqueSterile enriched czapek dox agar and broth were
amended w ith synthetic inhibitors- benzoic acid, kojic acid,EDTA, L-cysteine, L-ascorbic acid, PVP resorcinol and L-phenylalanine were inoculated w ith A.rutilum and wereincubated for 5-8 days at 30ºC.
Inhibitory assay using tyrosinase enzymePurification of tyrosinase from A.rutilum was done as perKrishnaveni et al. (2015). Ascorbic acid, Benzoic acid, kojicacid and EDTA with different concentrations (0.025, 0.1, 0.5,

96 Journal of Eco-friendly Agriculture 13(2) 2018
Raid screening of antityrosinase compounds from fungi
1mM) w ere added to the standard reaction mixturecontaining 8mM L-dopa, 0.1M sodium acetate buffer (pH5.5)and 0.5 ml purified tyrosinase and rate of inhibition waschecked at 475nm using UV-Vis spectrophotometer. The %inhibition of the tyrosinase activity was calculated by theequation :{[( A-B)-(C-D) / (A-B)]} X100.
Screening of tyrosine inhibi tors from fungus by rapid plateassay method
Based on the prev ious experiments w ith syntheticinhibitors, fungal inhibitors were screened. Isolation of fungiwas done by collecting soil samples in Gulbarga region. Thetyrosinase producing A.rutilum was used as indicator andw as inoculated on ECA . The isolated colonies w ereinoculated near to the indicator at 48hrs and again incubatedfor 4 days at 30oC.
Screening of tyrosine inhibitors from fungus by inhibitingpuri fied Cytosol ic tyrosinase from A.rut i lum
Twenty five ml of sterile potato broth media amendedw ith 0.2% L-Tyrosine, 2% starch, 1% glucose, 1%sucrose,0.5%yeast extract, and 0.5% peptone was inoculated w ith aloopful of the selected fungi by plate assay. The flasks wereincubated for 8 days on orbital shaker incubator at 180rpm,30 oC. 0.5 ml of samples were tested against 0.5 ml purifiedcytosolic tyrosinase catalysed L-DOPA oxidation at 475nm.The % inhibition of the tyrosinase activity was calculated bythe equation :{[( A-B)-(C-D) / (A-B)]} X100.
Identi fication of compoundA.niger -1 and A.ornatus were grown in 100ml of the
broth and the samples were checked for the presence of L-DOPA [9], alkaloids[10],flavonoids [11], kojic acid [12], citricacid, ascorbic acid and ol igosaccharides by quali tativeanalysis and TLC experiments.
Absorption spectrum of koj ic acid by A. ornatus.The UV spectrum of the 0.5ml broth sample in 0.1M
sodium acetate buffer (pH 5.5) was determined by doublebeam UV- Vis spectrophotometer.
RESULTS AND DISCUSSIONNo brown pigmentation on 5th and 8 th day w ith EDTA
and resorcinol indicated that they are strong inhibitors ofboth laccase and tyrosinases. No brown pigmentation on5th day and appearance of brown pigmentation on 8th dayindicates only tyrosinase inhibition but not laccase. Withcysteine and phenylalanine no brown pigmentation at theearlier stage but turned to reddish pigmentation and reddishpur p le at t he l ater stages ind i cates format ion ofpheomelanins. With kojic acid, ascorbic and benzoic acid
light brown pigmentation and slight tyrosine hydrolysis wasseen indicating they are strong inhibitors of monophenolaseactivity of tyrosinase (Fig.1.1&2). The same observations wereshown in the broth samples with all the inhibitors. Syntheticinhibitors selected for inhibitory studies were Ascorbic acid,Benzoic acid, Kojic acid and EDTA. Benzoic acid has shown100% inhibition w ith IC 50 value of 1mM. Next to it wasEDTA w ith 98% inhibition whereas Ascorbic acid and kojicacid have shown 96 and 91% at the same concentration.How ever, EDTA w i th 0.5mM , 99% of inhibi tion wasobserved. As per the experimental data it is proved thatbenzoic acid and EDTA are good inhibitors of tyrosinase ofA.rutilum (Table -1.1).
Fig.1.1 Effect of PVP, Resorcinol , EDTA, Phenyl alanine andcysteine on Melanin Pigmentation of A.ruti lum on 5th dayat 30oC
Fig.1.2 Effect of PVP, Resorcinol, EDTA, Phenylalanine on Melaninpigmentation of A.ruti lum on 8th day at 30oC

Journal of Eco-friendly Agriculture 13(2) 2018 97
Krishnaveni R, Vandana Rathod, Prema Kulkarni, Shuba and Hema Rao
the purified cytosolic tyrosinase from A.rutilum, A.niger-1and A.ornatus showed 98.4 and 98.3 % inhibition whichwas highest as compared to other fungi (Table- 1.3).Plateassay method appears to be the best and rapid method fortyrosinase inhibitors, as all isolates screened by plate assayhave shown inhibition to partially purified enzyme.
A.ornatus showed a strong positive reaction w ith Fecl3test indicating that the compound is kojic acid which wasseparated by TLC w ith a standard kojic acid and theseparated compound again showed 98.5% tyrosinasesinhibition (Fig.1.4 &1.5). When the percent inhibition of
Table 1.1. Effect of inhibitors on partially purified Cyt tyrI nhibi tor Concentration (mM) %inhibi ti on
Ascorbic acid
0.025mM 0.1mM 0.5mM 1mM
72 88.1 96 96
Benzoic acid
0.025mM 0.1mM 0.5mM 1mM
79.8 94 96 100
Kojic acid
0.025mM 0.1mM 0.5mM 1mM
70.3 96 92 91
EDTA
0.025mM 0.1mM 0.5mM 1mM
51 90.5 99 98
Fig.1.3Effect of Fungal Inhibitors of a) A.niger -1, b) Trichoderma.,c) A .niger-2, d) Rhizopus and e) A. ornatus by Plate Assay
The results of screening of antityrosinase compoundsfrom fungi by plate assay method with A.rutilum as indicatorwere tabulated (Table-1.2 and Fig 1.3). According to theresults, 2 factors are observed. 1) The appearance of tyrosinehydrolysis, reddish brown pigmentation, simultaneousdisappearance of brown pigmentation indicates diphenolasereaction gets inhibited 2) no tyrosine hydrolysis, and absenceof brown/ reddish pink pigmentation of the media indicatesinhibition of monophenolase activity. The fungus which w illshow the above characteristics may be considered as inhibitorproducers. A ccord ing to the resul ts of screening ofantityrosinase compounds producing fungus by inhibiting
Table 1.2Screening of antityrosinase compounds- Plateassay method
Fungus Pigmentation of the media
Pigmentati on of the fungus
L-Tyrosine hydrolysi s
A.niger -1 Dark reddish pink
brown pigment absent ++++
A.niger -2 Light pink -do- ++++ Aspergillus spp. (Light brown) Yellowish
Brown at backside ++
A.flavus colorless brown pigment absent
+++
Aspergillus.spp (pecock green) colorless -do- ++
A. terrus - -do- ++
Trichoderma spp. Florescent greenish yellow -do- -ve
Rhizopus spp. Reddish -do- -ve A.clavatus colorless -do- +++ A.niger -4 colorless -do- +++
Unidentified Magenta -do- +ve (very less) A.ornatus colorless -do- +ve (very less) A.niger -3 Yellowish -do- ++

98 Journal of Eco-friendly Agriculture 13(2) 2018
Raid screening of antityrosinase compounds from fungi
acid showed kojic acid in aqueous solutions is colorless withhigh peak at 217and lowest peak at 270nm w ith a ë-max at340nm (12).
As per present findings fungal metabolites are stronginhibitors of tyrosinase enzyme. In this study syntheticinhibitors were used in plate assay and base upon the resultsrapid plate inhibitory assay was designed in order to screenthe tyrosinase inhibitors from microorganisms. Rapid plateinhibitory assay results are co relating w ith inhibitory assayusing purified tyrosinase. Duckworth and Coleman (1970)reported that benzoic acid inhibited diphenolase activity oftyrosinase and this inhibition was competitive w ith catecholand irreversible and bound to Cu (I) which was associatedw ith the deoxy form of tyrosinase (13). Mushroom tyrosinaseshowed 70% inhibition with 100µM benzoic acid [14]. Khanand Andraw is reported an Ic 50 value of 300 µM using L-tyrosine as the substrate and detection of dopachrome [15].Benzoic acid w ith Ic 50 value of 0.64mM showed a mixedtype of inhibition with L-DOPA [16]. EDTA was reported tobe a metal chelator and a strong inhibitor of metalloenzymesespecially laccase and tyrosinase [19]. Calcium disodiumEDTA (21 CFR 172.120) and disodium EDTA (21 CFR172.135) have been approved for use as food additives bythe United States Food and Drug Administration [20].Cysteine is an effective inhibitor of enzymatic browning. Theinhibition of melanosis by cysteine is due to the formation ofcolourless thiol-conjugated o-quinones.. L-ascorbic acid andits various neutral salts and other derivatives have been theleading GRAS antioxidants for use on fruits and vegetablesand in fruit juices, for the prevention of browning and other
200 300 400 500 600 700 8000.0
0.1
0.2
0.3
0.4
0.5
0.6
Abs
orba
nce
wavelength 200-800nm
Figure 1.5. Absorption spectrum of the anti tyrosinase compoundfrom A.ornatus
Table 1.3. Screening of anti tyrosinase compounds - byinhibi ting the partial ly purif ied cy t Tyr fromA.rutilum
Sl.No. Fungus Color of the broth
O.D at 475 nm (8mM L-DOPA)
Percent inhibition
(A-B/A*100) 1 A .niger -1 Straw 0.007 98.3 2 A.ornatus Yellow 0.008 98.1 3 A.flavus yellow 0.022 94.7 4 Rhizopus spp. Straw 0.025 94.9 5 A.clavatus Light orange 0.029 93.1
6 Aspergillus spp. (Light brown) Dark yellow 0.102 75.7
7 Trichoderma spp. Dark flouresecnt yellow
0.108 74.3
8 A.niger -3 Pale yellow 0.117 72.1
9 Aspergillus spp (pecock green )
Dark flouresecnt yellow
0.137 67.4
10 A .niger -2. Pale yellow 0.148 64.8
11 Control (w ithout inhibitor)
233.8
Figure 1.4. a) A .niger–1 (S1) (-ve for kojic acid), A.flavus (S2),A .ornatus (S3) (blood red +ve for kojic acid) and A.terrus(S4) samples were compared w ith standard for kojic acidtest. B) A.ornatus (blood red +ve for kojic acid) comparedwith Standard kojic acid on TLC plate.
synthetic kojic acid was compared w ith naturally screenedand identified kojic acid, the percent inhibition was 91%with synthetic Ic 50 1mM, where as it was 98.5% inhibitionwhich is appreciable w ith natural kojic acid irrespective ofthe concentration. The absorption spectrum from 200-800nmof A.ornatus sample showed a sharp peak w ith absorbanceof 0.219 -0.524 at 280-290 nm which states that the proteinsw ith tryptophan residues are more than tyrosine residues.At 300nm the O.D was 0.55 which was highest. Again at 423nm sharp peak w ith 0.D 0.188 was seen which may be dueto some other metabolites. According to the literature kojic

Journal of Eco-friendly Agriculture 13(2) 2018 99
Krishnaveni R, Vandana Rathod, Prema Kulkarni, Shuba and Hema Rao
oxidative reactions [26]. Polyphenol oxidase inhibition byascorbic acid has been at tr ibuted to the reduct ion ofenzymat ical ly formed o-quinones to thei r precursordiphenols [27]. More stable forms of ascorbic acid derivatives,such as erythrobic acid, 2- and 3-phosphate derivatives ofascorbic acid, phosphinate esters of ascorbic acid , andascorby l-6-fatty acid esters of ascorbic acid , have beendeveloped to overcome these problems [28]. Hulme et al.(1964) suggested that PVP inhibits by combing w ith thecatechol oxidase substrate complex by attachment to thephenolic substrate moiety [29]. Harel et al., (1964) observedthat PVP and its monomer, N-vinyl-2-pyrrolidone inhibitedthe enzyme irreversibly and was able to act in the absence ofadded substrate [30]. Our resul t correlates w i th theassumption of Loomis et al., (1966) [31] and Maurice et al.,(2005) [19]. Although resorcinol is a poor tyrosinse inhibitor,substitution in the 4-position yields increased inhibitoryact ivity. 4-substituted resorcinol showed a competit iveinhibit ion on mushroom tyrosinase w ith L-DOPA as asubstrate.
Besides higher plants, some compounds from fungalsources have also been ident ified and reported for theirinhibi tory activ ity on tyrosinase [33]. A zelaic acid is anaturally occurring straight-chain, saturated dicarboxylicacid which is produced by yeast, Pityrosporum ovale, has adefinite cytotoxic effect on malignant melanocytes of primarycutaneous melanoma, though normal melanocytes appearednot to be affected [34]. Azelaic acid acts as a weak competitiveinhibitor of tyrosinase in vitro, which may be a major causeof its melanocytotoxicity. Kojic acid a fungal metaboliteproduced by many species of Aspergillus and Penicillium [12],are good chelators of t ransi t ion metal ions and goodscavengers of free radicals [22]. Recently, hemolymph serumtyrosinase from larvae of the noctuid moth Spodoptera littoraliswas shown to be effectively inhibited by kojicacid when L-DOPA was used as the substrate [35]. Moreover, kojic acideffectively inhibited the formation of pigmented productsand oxygen uptake when DL-DOPA, nor epinephrine anddopamine were oxidized by tyrosinase, which means thatkojic acid is able to reduce o-quinone to o-diphenol to preventthe final pigment forming and be oxidized to a yellowproduct by chemical interaction w ith o-quinone [36].TheRzepecki and Waite assay procedure has also been used bykobayashi et al., (1996) who investigated the inhibition oftyrosinase by kojic acid and some of its derivatives and foundthat derivatives of kojic acid, where an additional group wasadded via an ester coupling w ith the hydroxyl group atposition 7 of kojic acid were slightly stronger inhibitors thankojic acid (Ic 50 =23 µ M) [21]. About 70% inhibition wasdetermined with 100 µ M kojic acid [14]. Kojic acid with Ic 50value of 0.014mM showed a mixed type of inhibition w ith L-
DOPA [23]. The yeast metal lothioneins are ubiquitouscytosolic proteins, usually characterized by selective bindingof a large amount of heavy metal ions (Zn2+, Cu2+ and Cd2+)and high cy stei ne content [ 37] . N. crassa copper-metal lothionein w as repor ted as a metal donor forapotyrosinase [38].Metallothionein from A. niger was alsofound to be an inhibi tor for a commercial ly puri f iedmushroom tyrosinase, and exhibited a higher inhibitoryeffect on the oxidation of catechin compared w ith that ofchlorogenicacid [39].
Other fungal extracts such as agaritine and inhibitors(Ia and Ib) from Agaricus species were also isolated, purifiedand characterized. Agari tine, b-N-(g-L (+)-glutamyl )-4-hydroxymethylphenylhydrazine, showed a depigmentingeffect that prevented melanin formation. The inhibition wasuncompetitive when L-DOPA was used as the substrate andpartially competitive when tyrosine was used as the substrate[40]. Taking into account that agaritine is very abundant inA. bisporus, it might be suggested that agaritine could play invivo a role as endogenous regulator of mushroom tyrosinaseactivity and the extent of o-quinone concentration formed.Moreover, the inhibitory mechanism of two inhibitors, Ia andIb, isolated from A. hortensis was established [41].
From microbial metabolites inhibitors were screenedand identified the active molecule, terrein, from Penicilliumspp. [42] which inhibits melanogenesis in Mel-Ab cells bydown regulating microphthalmia-associated transcriptionfactor (Mitf) via extra cellular signal-regulated kinase (ERK)activation leading to the inhibition of tyrosinase production[43]. The majority of aspochalasins (Aspochalasin I), havebeen isolated from the species of Aspergillus and inhibitstyrosinases [44].
Kojic acid (5-hydroxy-2-hydroxymethyl-4H-pyran-4-one) is biologically synthesized in the oxygen conditions byvarious microorganisms from the w ide range of carbonsources i.e. glucose, disaccharides and polysaccharides.Kojic acid from A. flavus, A.terrus A.oryzae, A.albus was reported[45, 46]. There are no reports on kojic acid from fungusA.ornatus. Since there is exsistance of kojic acid in most of thegenus Aspergillus, its important to test how much potentA.ornatus as kojic acid producer. It is a good chelator oftransition metal ions such as Fe (III) and Cu (II) and isdegradable in the environment. Its biological activity resultsfrom lipophilic and hydrophilic properties, ability to createchelate compounds w ith metal ions and inhibitory activitytowards tyrosinase. It is extensively used in medicine as theanti-inflammatory and analgesic drug. In the food industry,kojic acid is used as flavor enhancer and as food antioxidantimproving i.e. stability of edible fats and oils. Because of itsinhibitory effect on tyrosinase, kojic acid is commonly used

100 Journal of Eco-friendly Agriculture 13(2) 2018
Raid screening of antityrosinase compounds from fungi
in cosmetic industry as whitening agent and as effectivecompound of creams protect ing the skin against UVradiation. Besides, kojic acid and its derivatives tend to haveant i fungal , insect icidal , anticancer and bacteriostaticproperties, i ts appl icat ion in the above industr ies issignificantly spreading.
A mixture of ascorbic acid and kojic acid has beenpatented for use as an anti-browning agent in foods [47].Kojic acid has potential applicability in the prevention ofmelanosis in both plant and seafood products. Saruno et al.,(1979) demonstrated that kojic acid from Aspergillus albusinhibited mushroom PPO activity [45]. Chen et al., (1991)determined that kojic acid was a competitive inhibitor of theoxidat ion of chlorogenic acid and catechol by applepolyphenol oxidase [48]. Kojic acid inhibits the rate offormation of pigmented products, as well as the rate ofoxygen uptake, when various o-dihydroxy- and trihydroxyphenols are oxidized by ty rosinase [36] . Tyrosinaseinhibition by kojic acid was thought to be due to its ability ofkojic acid to bind copper at the active site of the enzyme.Although kojic acid is a good inhibitor of polyphenol oxidase,its toxicity is of concern. Wei et al. (1991) reported weakmutagenic activity of kojic acid in a Salmonella typhimuriumassay [49].However, because of the hazardous side-effectsof whitening agents, the use of hydroquinone in cosmeticshas been banned by the European Committee [50]. Kojic acidwas also restricted because of the carcinogenic potential [51].Thus, at tention has recently been focused on the novelproducts in cosmetics [52].
It w as concluded that use of natural products incosmetics from microbial sources play a significant role asthey can be produced in an economical way w ith no sideeffects. Advanced studies have shown kojic acid derivativesto be stronger tyrosinase inhibitors. Hence, further work inthis direction is needed.
ACKNOWLEDGM ENTThe first author is thankful to Gulbarga University,
Gulbarga for the award of a merit studentship, UGC for theaward of research fellowship and Dr. M.S. Thakur, seniorscientist, FTBT, CFTRI, Mysore for guidance.
REFERENCESFr iedman M . (1996) Food br owning and i ts preventi on: an
overview. Journal of Agriculture and Food Chemistry, 44:631–653
Ogawa, J. and Shimizu, S (1999) Microbial enzymes: new industrialappl iations from traditionl screening methods. Trends inBiotechnology Tibtech, 17:13-20.
Sugumaran M. (1991) Molecular mechanisms for mammalian
mel anogenesi s compar i son w i th i nsect cu ti cu l arsclerotization. FEBS Letters, 293: 4–10
Maeda K, Fukuda M. (1991). In vi tro effectiveness of severalwhitening cosmetic components in human melanocytes.Journal of the Society of Cosmetic Chemists, 42: 361–368.
Frenk, E., (1995) Treatment of melasma with depi gmentingagents.In Melasma: New Approaches to Treatment. MartinDunitz: London, 9–15.
Kr i shnaveni R, Vandana R, Thakur M .S, N eel gund .Y.F“Transformation of L-Tyrosine to L-Dopa by a novel fungusAcremonium rutilum under submerged fermentation. (2009)Current Microbiology, 58:122-128.
Kr ishnaveni R and Vandana R, Isol at ion puri fi cati on andcharacterization of cytosol ic tyrosinase from Acremoniumrutilum w .gams (2010) communicated
Imada C, Sugimoto Y, Makimura T, Kobayashi T, Hamada Hand Watanabe E, (2001) Isolation and characterization ofty rosinase inhibi tor pr oduci ng micro organi sms fr ommarine environment, 67: 1151-1156.
A r now , L .E., (1937) Col or i metr i c det er mi nat i on of thecomponents of L-3,4 di hydr oxyphenylal anine-ty rosi nemixture Journal of Biochemistry, 118: 531.
Gururaj C (2001). Medicinal plants of Gulbarga and sedam region,Department of Botany, GUG, 1-69.
Upadhya and Upadhya (2001) Experi ment i n biochemistry,H imalaya publ ications, New Delhi, India.
Parrish F. W., Wiley B. J., Simmons E. G. and Long L. (1966)Production of afl atoxins and kojic aci d by speci es ofAspergillus and Penici llium. Appllied Microbiology, 14: 139.
Duckworth, H. W., and Coleman, J. E., (1970) Physicochemicaland kinetic properties of mushroom tyrosinase. Journal ofBiological Chemistry, 245: 1613.
Streffer (2002) highly sensitive measurement of substrates andinhibi tors on the basis of tyrosinase sensors and recycl ingsystems (dissertation).
Kahn, V . and Andrawi s, A . 1985. Inhi bi t ion of mushroomtyrosinase by tropolone. Phytochemistry, 24: 905-908.
Priestly G C (1993) Molecular Aspects of Dermatology. Wiley:Chichester.
Tanaka T., Takeuch M., and Ichishima E., (1989) Inhibi tion studytyrosinase from Aspergi llus oryzae. Agricutural and BiologicalChemistry, 53: 557–558.
Maurice R, Marshal l , Jeongmok Kim and Cheng-I Wei (2000)Enzymatic Brow ning Fruits, Vegetables and Seafoods.http:/ / w ww .fao.or g/ ag/ ags/ agsi / EN ZYMEFINA L/COPYRIGH.HTM.
Anon (1992) Code of Federal Regulations, Food and Drugs 21Parts 170.199, Washington, DC, Office of the Federal RegisterNational Archives and Records Administration.
Kobayashi Y., Kayahara, H., Tadasa K., and Tanaka H., (1996),Synthesis of N-kojic-amino acid and N-kojic-amino acid-kojiate and their tyrosinase inhibi tory activi ty. Bioorganic

Journal of Eco-friendly Agriculture 13(2) 2018 101
Krishnaveni R, Vandana Rathod, Prema Kulkarni, Shuba and Hema Rao
& Medicinal Chemistry Letters, 6: 1303-1308.N iwa Y. and Akamatsu H. (1991) Kojic acid scavenges free radicals
whi l e potenti at ing l eukocyte functions i nclud ing fr eeradical generation. Inflammation, 15: 303–315.
Kobayashi T, Vieira WD, Potterf B, Sakai C, Imokawa G, HearingVJ (1995) Modulation of melanogenic protein expressionduring the switch from eu- to pheomelanogenesis. Journalof Cell Science, 108: 2301-2309.
Kahn, V. (1985). Effects of proteins, protein hydrolyzates, andami no aci ds on o-d i hyd r oxyphenol ase act i v i ty ofpolyphenol oxidase of mushroom, avocado and banana.Journal of Food Science, 50: 111-115.
Ci l l i er s, J.J.L . and Si ngl eton , V .L . (1990) Caffei c aci dautooxidation and the effects of thiols. Journal of Agricultureand Food Chemistry, 38: 1789-1796.
Walker, J.R.L., (1977) Enzymatic browning in foods. Its chemistryand control. Food Technology NZ, 12: 19-25.
Sapers, G. M.; H icks, K. B.; Phi l lips, J. G.; Garzarella, L.;Pondish,D. L.: Matulai tis, R. M.; McCormack, T. J.; Sondey,S. M.;Seib, P. A .; El-A tawy, Y. S. (1989) Control of enzymaticbr ow ni ng i n appl e w i th ascor bi c aci d der i vati ves,polyphenol oxidase inhi bi tors, and complexi ng agents.Journal of Food Science, 54: 997-1002.
Whitaker, J.R., (1972) Polyphenol oxidase. In J.R. Whitaker, (ed).Principles of Enzymology for the Food Sciences, New York,Marcel Dekker. 571-582.
Hulme, A . C., Jones, J. D. and Woll torton, L. S. C. (1964). Nature,201: 795.
Harel, E., Mayer, A . M. and Lerner, H. R. (1970) Journal of Scienceof Food Agriculture, 21: 542.
Loomis, W. D. and Battaile, J. (1966). Phytochemistry., 5: 423.
Nazzro-Porro M., Passi S., Morpurgo G. and Breathnach A. S.(1979) Identi fication of tyrosinase inhibi tors in cultures ofPytirosporum, and their melanocytoxic effect. In: PigmentCel l , (1), 234–243, Klaus S. N. (ed.), Basel, Karger
Schal lreuter K. U. and Wood J. W. (1990) A possible mechanismof action for azelaic acid in the human epidermis. Archivesof Dermatological Research, 282: 168–171.
Lee M. J. and Anstee J. (1995) Phenoloxidase and i ts zymogenfrom the haemolymph of l arvae of the l epi dopteranSpodopteral i ttorl is (Lepidoptera: Noctuidae). ComparativeBiochemistry and Physiology, 110: 379–384.
Kahn V. (1995) Effect of kojic acid on the oxidation of DL-DOPA,norepinephrine and dopamine by mushroom tyrosinase.Pigment Cell Research, 8: 234–240.
Byrd J., Berger R. M., McMill in D. R., Wright C. F., Hamer D. andWinge D. R. (1988) Characterization of the copper-thiolatecluster in yeast metal lothionein and two truncated mutants.Journal of Biological Chemistry, 263: 6688–669.
Lerch K. (1980) Copper metal lothionei n, a copper -bindi ngprotein from Neurospora crassa. Nature, 284: 368–370.
Goetghebeur M . and K er masha S. (1996) Inhi bi t i on of
pol yphenol oxi dase by copper -metal l othi onei n fr omAspergillus niger. Phytochemistry, 42: 935–94.
Espín J. C., Jol i vet S. and Wichers H. J. (1998) Inhibi tion ofmushroom polyphenol oxidase by agari tine. Journal ofAgriculture and Food Chemistry, 46: 2976–2980.
M adhosi ngh C. and Sundber g L . (1974) Pur i fi cat i on andproperties of tyrosinase inhibi tor from mushroom. FEBSLett. 49:156–158.
Kim, W. G., I. J. Ryoo, S. H. Park, D. S. Kim, S. K. Lee, K. C. Parkand I. D. Yoo. (2005). Terrei n, a melanin biosynthesisinhibi tor, from Penici llium sp. 20315. Journal of Microbiologyand Biotechnology, 15: 891-894.
Park, S. H., D. S. Kim, W. G. Kim, I. J. Ryoo, D. H. Lee, C. H. Huh,S. W. Youn, I. D. Yoo and K. C. Park (2004) Terrein: A newmelanogenesis inhibi tor and i ts mechanism. Cellular andMolecular Life Sciences, 61: 2878-2885.
Rochfort, S., J. Ford, S. Ovenden, S. S. Wan, S. George, H. Wildman(2005) A novel aspochalasin with HIV-1integrase inhibi toryactivi ty from Aspergi llus flavipes. Journal of Antibiotics, 58:279-283.
Fukusawa, R., Wakabayashi, H . and Natori , T. (1982) Inhibitor oftyrosinases in foods. Japanese patent. 57: 40875.
Saruno, R., Kato, F. and Ikeno, T. (1979) Kojic acid, a tyrosinaseinhibi tor from Aspergil lus albus. Agriculture and BiologicalChemistry, 43: 1337-1339.
Moo Young Kwak and Joon Shi ck Rhee (1991) Cult ivati oncharacteristics of immobil ized Aspergi l lus oryzae for kojicacid production Biotechnology and Bioengineering, 39: 903-906.
Chen, J.S., Wei, C.I., Rol le, R.S., Otwel l , W.S., Balaban, M.O. andMarshal l , M.R. (1991) Inhibi ti tory effect of kojic acid onsome plant and crustacean polyphenol oxidase. Journal ofAgricultural and Food Chemistry, 39: 1396-1401.
Wei, C.I., Fernando, S.Y., & Huang, T.S., (1991) Mutagenici tystudies of kojic acid. Proceedings of the Fifteenth annualcon fer ence Tr op i cal and Sub tr op i cal Fi sher i esTechnological Conference of the Americas, Orlando, FL,464-470.
Kooyers, T. J. and W. Westerhof. (2004) Toxicological aspectsand health r isks associated w ith hydroquinone in skinbleaching formula. Ned. Ti jdschr. Geneeskd. 148: 768-771.
Fujimoto, N., H. Watanabe, T. Nakatani, G. Roy and A. Ito. (1998)Induction of thyroid tumours in (C57BL/ 6N x C3H/ N) F1
mice by oral administration of kojic acid. Food Chemistryand Toxicology, 36: 697-703.
Nguyen, D. T. M., D. H. Nguyen, L. Hwa-la, H . B. Lee, J. H.Shin,and E. K. Kim. 2007. Inhibition of melanogenesis by dioctylphthalate isolated from Nigel la glandulefera Freyn. Journalof Microbiology and Biotechnology, 17: 1585-1590.
Manuscript recived on 14.2.2018Manuscript accepted for publication on 23.5.2018

102 Journal of Eco-friendly Agriculture 13(2) 2018
Morphological traits in indigenous ivy gourd (Coccinia grandis) genotypes of N.E. region of IndiaJournal of Eco-friendly Agriculture 13(2): 102-105. 2018
©2018
Ivy gourd, Coccinia grandis (L.) Voigt. [Syn. C. indicaWight and Arn., C. cordifolia (L.) Cogn.] belongs to the familyCucurbitaceae and is known by various names like Kundru,tondli, little gourd, scarlet gourd and kunduli. It is a semi-perennial crop of 4-5 years, yielding fruits in summer andrainy season and is indigenous to India. It is reported topossess anti-inflammatory, antioxidant, antimutagenic,ant id iabet ic, ant ibacter ial , ant iprotozoal , ant iu lcer,
Short communication
Morphological traits in indigenous ivy gourd (Cocciniagrandis) genotypes of N.E. region of IndiaJumi Saikia*Department of Horticulture, Assam Agricultural University, Jorhat -785013, Assam*Corresponding author’s E- mail : jsbaruah5@ gmail.com
Abstract
An exper iment was carr ied out at the Experimental Farm, Department of Horticulture, Assam Agri culturalUniversity, Jorhat to study the morphological traits in ivy gourd (Coccinia grandis) genotypes collected from differentpart s of A ssam and other Nor th Eastern States (Arunachal Pradesh, Tripura and Nagaland) during the summerseason. The experiment was laid out in randomized block design with three replications. The qualitat ive traits wererecorded through vi sual observation as per NBPGR descriptor. Morphological character izat ion of 22 genotypesrevealed significant variation among the genotypes.
Key words: Ivy gourd, genotypes, distinct
hepatoprotective, expectorants pharmacological properties(Yadav and Mishra, 2010). In recent time, it is gaining thestatus of an important vegetable crop in Assam because ofincreasing consumer aw areness about i ts signif icantnutraceutical value. Ivy gourd is mostly termed as poor man’svegetable (Singh and Singh, 2014). Landless poors in Bihargrow Ivy gourd on the roof of their huts.
Table 1. Observations on morphological traits (as per NBPGR descriptor)
Genotype Stem pubescence
Stem shape Tendril Tendril branching
Leaf margin Fruit shape Frui t ski n colour
Flesh colour
IG-1 Smooth Rounded Present Unbranched Medium dentate Cylindrical Green White IG-2 Smooth Rounded Present Unbranched Dentate Cylindrical Green White IG-3 Smooth Rounded Present Unbranched Dentate Cylindrical Green White IG-4 Smooth Rounded Present Unbranched Slightly dentate Cylindrical Green White IG-5 Smooth Rounded Present Unbranched Medium dentate Cylindrical Green White IG-6 Smooth Rounded Present Unbranched Dentate Cylindrical Dark green White IG-7 Smooth Rounded Present Unbranched Slightly dentate Cylindrical Green White IG-8 Smooth Rounded Present Unbranched Dentate Cylindrical Green White IG-10 Smooth Rounded Present Unbranched Medium dentate Cylindrical Green White IG-11 Smooth Rounded Present Unbranched Medium dentate Cylindrical Green White IG-12 Smooth Rounded Present Unbranched Medium dentate Cylindrical Green White IG-13 Smooth Rounded Present Unbranched Dentate Cylindrical Dark green White IG-14 Smooth Rounded Present Unbranched Dentate Cylindrical Light green White IG-15 Smooth Rounded Present Unbranched Slightly dentate Cylindrical Green White IG-16 Smooth Rounded Present Unbranched Slightly dentate Cylindrical Green White IG-17 Smooth Rounded Present Unbranched Dentate Cylindrical Green White IG-18 Smooth Rounded Present Unbranched Dentate Globular Green White IG-19 Smooth Rounded Present Unbranched Medium dentate Cylindrical Green White IG-20 Smooth Rounded Present Unbranched Medium dentate Cylindrical Green White IG-22 Smooth Rounded Present Unbranched Dentate Globular Green White IG-23 Smooth Rounded Present Unbranched Dentate Cylindrical Green White IG-25 Smooth Rounded Present Unbranched Medium dentate Cylindrical Dark green White

Journal of Eco-friendly Agriculture 13(2) 2018 103
Jumi Saikia
The experimental material comprised of 22 ivy gourd[Coccinia grandis (L.) Voigt] germplasm collected from farmersof different parts of Assam and other North Eastern states(Arunachal Pradesh, Nagaland and Tripura) including avariety from IIVR, Varanasi. Being dioecious in nature, toevaluate these 22 genotypes, a common male parent wasalso included as an experimental material. Out of total 25initial collection, 3 genotypes i.e. IG-9, IG-21 and IG- 24 werefound to be bitter. Therefore, these genotypes were excluded.Planting w as done at a spacing of 2m x2m. A ll therecommended package of practices were followed.
The qualitative traits were recorded through visualobservation as per NBPGR descrip tor. The results arepresented in Table 1.The stems of all the genotypes werefound to be smooth. From the cross section of al l thegenotypes, it was observed that the stem shape was rounded.Plate 1 show s all the collected genotypes of ivy gourd.
Plate 1. Ivy gourd genotypes
Variations in leaf margin is presented in Plate 2. The leaveshave 3-5 lobes. Leaf margin was found to slightly dentate,medium dentate and dentate. All the genotypes showed unbranched tendrils (Plate 3).
Two distinct types of fruit shapes, viz., cylindrical andglobular were observed in ivy gourd genotypes (Table 1).Two genotypes i.e. IG-18 and IG-22 had globular shapedfruits and rest of the genotypes had cylindrical fruit shape.
Three distinct classes of fruit skin colour at edible stagewere observed, i.e. dark green, green and light green (Plate4). In most of the genotypes, the fruit skin colour was green.The genotype IG-14 had light green skin colour. Fruit skincolour of IG-6, IG-13 and IG-25 was observed to be dark green.
At edible stage, flesh colour of all the genotypes wasobserved to be white (Plate 5). But, when it over matures thecolour turns to yellowish-red.

104 Journal of Eco-friendly Agriculture 13(2) 2018
Morphological traits in indigenous ivy gourd (Coccinia grandis) genotypes of N.E. region of India
Plate 2. Variations in leaf margin
Plate 3. Un branched tendri ls Dark green Green Light greenPlate 4. Fruit skin colour

Journal of Eco-friendly Agriculture 13(2) 2018 105
Jumi Saikia
Plate 5. Flesh colour
REFERENCESYadav, G. and Mishra, A . (2010). Medical properties of ivy gourd
(Cephalandra indica) : A review. International Journal ofPharmaceutical Research and Development, 2: 92-98.
Singh, P.K. and Singh, M. (2014). Everyone’s vegetable : Ivy gourdKashi Bhar poor to enr ich vegetabl e basket. Ind i anHorticulture, 59: 6-7.
Manuscript recived on 26.2.2018Manuscript accepted for publication on 29.5.2018

106 Journal of Eco-friendly Agriculture 13(2) 2018
Silicon nutrition in RiceJournal of Eco-friendly Agriculture 13(2): 106-108. 2018
©2018
Silicon (Si) is the second most abundant element in theearth’s crust. It is not considered as an essential element, butis a beneficial element for crop grow th, especially for Poaceaecrops. Si concentration of plant shoots varies greatly amongplant species, ranging from 0.1 to 10% Si on a dry weightbasis.Silica strengthens the plant, protects the plant againstpests and diseases, increases crop production and quality,stimulates active immune systems of plants, increases plantnutrition, increase plant salt resistance and neutralizes heavymetal toxicity in acid soils. Si fertilizer has a double effect onthe soil–plant system. First, improved plant-silicon nutritionstrengthens plant-protective properties against insect pestsincidence, and unfavorable climatic conditions. Second,Sioptimizes soil fertility through improved water, physico-chemical soil properties and maintenance of nutrients inplant-available forms.
In the soil solution, Si is present as Monosilicic acidand Polysilicic acid as well as complexes w ith organic andinorganic compounds such as aluminium oxides andhydroxides. While it is the PAS (plant available silicon) thatis taken up by the plants and has a direct influence on cropgrow th. The solubility of Si in the soil is affected by a numberof dynamic processes occurring in the soil including theparticle size of the silicon fertilizer, the soil acidity (pH),organic complexes, presence of aluminium (Al), iron (Fe) andphosphate ions, dissolution reactions and soil moisture. Siimproves physical, chemical and biological properties of soil.
Rice is a high silicon accumulating plant and the plantis benefited from Si nutrition. Rice crop can uptake Si in the
Short communication
Silicon nutrition in RiceGuntamukkala Babu Rao1* and Pusarla Susmitha2
1*PhD. Scholar. Department of Agronomy. Assam Agricultural Universi ty, Jorhat, Assam2PhD. Scholar. Department of Seed science and Technology, Anand Agricultural University, Gujarat*Corresponding Author’s Email: [email protected]
Abstract
Silicon (Si) is considered as a beneficial element for crop growth, especially for crops under Poaceae family. Riceis a typical silicon accumulating plant and it benefits from silicon nutrition. Si is absorbed in the form of monosilicicacid and its transportation is governed by three genes i.e. LSi1, LSi2 and LSi6. Silicon is deposited beneath the cuticleas cuticle-silicon double layer in the form of silicic acid. Highly weathered soils are low in available silicon mainly dueto leaching loss. It s supply is essent ial for healt hy growth and economic yield of the rice crop. Si licon interactsfavourably with other applied nutrients and improves their agronomic performance and efficiency in terms of yieldresponse. Also it improves the tolerance of rice plants to abiotic and biotic stresses. Hence, silicon management isessential for increasing and sustaining rice productivity.
Keywords: Silicon, rice, biotic stress, abiotic stress, yield, productivity.
range of 230-470 kg ha-1. Si is a beneficial element for plantgrow th and is agronomically essential for improving andsustaining rice productivity. Besides rice yield increase, Sihas many fold advantages of increasing nutrient availability(N, P, K, Ca, Mg, S, Zn), decreases nutrient toxicity (Fe, P, Al)and minimizing biotic and abiotic stress in plants. Hence,the application of Si to soil or plant is practically useful inlaterite derived paddy soils, not only to increase yield butalso to alleviate the Fe toxicity problems. Si increases themechanical strength of the culm, thus reducing crop lodging(Savant et al., 1997). In soil, Si is not a much mobile elementto plants. Therefore, a continued supply of this elementwould be required particularly for the healthy and productivedevelopment of plant during all grow th stages.
Benef icial ef fects of si l icon in rice1. Decrease lodging
Si in rice shoots enhanced the thickness of the culmwall and the size of the vascular bundles that result inreduction in lodging. Thickening of the cell walls of thesclerenchyma tissue in the culm and/ or shortening andthickening of internodes or increase in Si content of the lowerinternodes provides mechanical strength to enable the plantto resist lodging (Savant et al., 1997).
2. Increase crop grow th and yield
Si promotes grow th, strengthens culms, and favorsearly panicle formation, increases the number of spikeletsper panicle and percentage of matured rice grains and helpsto maintain erect leaves which are important for higher rate
Journal of Eco-friendly Agriculture 13(2) 2018 107
Guntamukkala Babu Rao and Pusarla Susmitha
of photosynthesis.Si p lays an important role in hu l lformation in rice, and, in turn, seems to influence grainquality (Bhaskaran, 2014). Ahmad et al., (2013) reported thatapplication of Si fertilizers enhanced the growth parameters,increased yield, yield attributes and quality of rice crop.
3. Improves availability of applied nutrients
i. Nitrogen
Fertilizing w ith nitrogen tends to make rice leavesdroopy, whereas silicon keeps them erect. By adopting propersilicon management, erect leaves can easily account for a10%increase in the photosynthesis by crop (Yoshida, 1981).Therefore, the maintenance of erect leaves by proper siliconfertilization for higher photosynthetic efficiency becomesmore important when rice is grown w ith liberal applicationsof nitrogenousfertilizers in low land rice fields having highlyweathered tropical soils. (Yoshida et al., 1969).
ii. Phosphorus
The application of calcium silicate to highly weatheredsoils enhanced upland rice response to applied phosphate.Ma et al. (1991) reported that overall beneficial effect of Simay be attributed to a higher P: Mn ratio in the shoot due tothe decreased manganese and i ron uptake, and thusindirectly improved phosphorus utilization w ithin the riceplants.
iii. Potassium
Si lici fication of cell wal ls seems to be l inked w i thpotassium nutrition. According to Nogushi and Sugawara(1966), potassium deficiency reduces the accumulation ofsilicon in the epidermal cells of the leaf blades, thus increasingthe susceptibility of the plant to rice blast. Therefore, siliconmanagement integrated w ith potassium may be moreimportant for sustaining rice yields in upland areas than inlow land areas.
4. Decrease metal toxicities of Fe and Al
i. Iron toxicity
In humid tropical and subtropical area, iron toxicity isone of the major physiological problems in rice grow th.Silicon increases the oxidizing power of roots, which convertsferrous iron into ferric iron, thereby preventing a large uptakeof iron and limiting its toxicity (Ma et al., 2002). Silicon w illregulate Fe uptake from acidic soils through the release ofOH - by roots (Wallace, 1993).
ii. Aluminium toxicity
Si application alleviates aluminium toxicity by creatinginert aluminosilicates, stimulating phenolic exudation by
roots or by sequestration in phytoliths (Guntzer et al., 2012).
5. Increase abiotic stress tolerance
i. Alleviate salt stress
Excessive sal inity in cropping soil is a w orldw ideproblem due mainly to rising water tables. Si may alleviatesalt stress in higher plants either by improved photosyntheticactivity, enhanced K/ Na selectivity ratio, increased enzymeactivity, and increased concentration of soluble substancesin the xylem (Sahebi et al., 2015). Si fertilizer application canalso alleviate the adverse effects of salt stress on plants byincreasing cell membrane integrity and stability through itsability to stimulate the plant’s antioxidant system (Marafonet al., 2013).
ii. Alleviate drought stress
The deposition of Si in the culms, leaves, and hullsalso decrease transpiration from the cuticle thusincreasingresistance to drought stress. Drought stressed plants thatwere treated w ith Si fertilizer retained greater stomatalconductance, relative water content, and water potentialthan untreated p lants. Si increased resistance to strongw inds generated by typhoons, related to the increasedrigidity of the shoots through silicification (Guntzer et al.,2012).
6. Increase biotic stress tolerance
i. Pest tolerance
Si increases the resistance of plants to many insects inrice like stem borer, leaf folder, brown plant hopper, etc. Thedeposition of silica on epidermal layers offers a physicalbarrier to insects by preventing the physical penetration byinsects. Sucking and leaf eating caterpillars have a lowpreference for the silicified tissues than low silica containingsucculent parts. Soluble silicic acid (as low as 0.01 mg/ ml)in the sap of the rice plant acts as an inhibitor of the suckingactivity of the brown planthopper (Yoshihara et al., 1979).
ii. Disease tolerance
Si has been found to decrease several diseases in ricelike sheath blight, brown spot, grain discoloration, etc. Simight form complexes w ith the organic compounds of cellwalls of epidermal cells, thus increasing their resistance tothe enzymes expounded by the pathogen. The antifungalcompounds like momilactones were found to accumulate inSi treated rice plants and these acted against blast pathogen.
Sil icon def iciencySi deficiency makes the rice plants susceptible to pests
and diseases. Si deficiency is common in areas w ith poor

108 Journal of Eco-friendly Agriculture 13(2) 2018
Silicon nutrition in Rice
soil fertility, and in highly weathered soils. Its deficiencyalso seen in organic soils w ith less Si reserves and also occursin highly weathered soils. The critical level of Si in soil is 40mg kg-1 and the critical level of Si in rice (leaf and straw) is5%.Si deficiency leads to soft and droopy leaves, reducedphotosynthetic activity , reduced grain yields, increasedinsect pest incidence, reduced number of panicles and filledspikelets per panicle (IRRI, 2016).
Sil icon ferti l izersCalcium silicate, fine silica and sodium silicate, are
mostly used silicon fertilizers. Potassium silicate, thoughexpensive, is highly soluble and can be used in hydroponicculture and also applied through foliage. Rice husk, rice huskash and straw are organic sources of Si. Rice straw hauledaway from rice fields are used for various purposes, such asanimal feed, biogas production, or mushroom cultivation,may maintain its nutrient value as a source of Si; thus theend products of these uses should be recycled. Si content inrice straw and rice husk ranges from 4-20% and 9-26%respectively. Silicon solubil ising bacteria (SSB)is a bio-fertilizer which contains spores of the Bacillus mucilaginosus.It is used as an effective soil inoculant. It solubilizes silicaand provides the plant w ith strength to tolerate biotic andabiotic stresses and improves i ts resistance to pest anddisease attack. With the changes occurring in the globalenvironment, the role of Silica w ill become more and moreimportant for better and sustainable production of the crop.(Chinnasami et al.,1978).
Rice is a silicon accumulator, so adequate attentionshould be given to silicon nutrition. Highly weathered soilsof the tropics and subtropics are low in available silicon.Silicon management agenda includes silicon fertilizationand recycling of silicon in rice crop residues. Silicon hasmanifold advantages. It is essential for healthy grow th andproductive development of the rice crop. Silicon increasesthe ef ficiency of applied nutrients, increases crop yield,increases resistance against lodging, biotic stresses, andabiot ic st resses. Si licon management is essent ial forsustaining rice productivity in temperate, tropical, andsubtropical soils.
REFERENCESAhmad, A., A fzal, M., Ahmad, A .U.H. and Tamir, M. 2013. Effect
of fol iar appl ication of si l icon on yield and qual i ty of r ice(Oryza sativa L.). Cercetari Agronomice, 10: 106-155.
Bhaskaran, J. 2014. Productivi ty enhancement of medicinal r ice(Oryza sativa L.) cv. N javara. M.Sc.(Ag) thesis, KeralaAgricultural Universi ty, Thrissur, 165p.
Chinnasami, K.N. and Chandrasekaran, S. 1978. Si l ica status incertain soils of Tamil Nadu. Madras Agriculture Journal, 65:743-746.
Guntzer, F., Kel ler, C. and Meunier, J.D. 2012. Benefi ts of plantsi l i con for crops: A review. Agr onomy for SustainableDevelopment, 32: 201–213.
IRRI (International Rice Research Institute). 2016. [On-line]. Sil icondeficiency. Avai lable: http:/ / www.irr i .com[25 DEC.2016].
Ma, J.F. and Takahashi, E. 1991. Effect of si l icate on phosphateavai labi l i ty for r ice in a P-deficient soi l . Plant Soil , 133:151-155.
Ma, J.F., Tamai, K., Ichi i , M. and Wu, K. 2002. A r ice mutantdefective in active Si uptake. Plant Physiology, 130:2111–2117.
Marafon, A .C. and Endres, L. 2013. Si l icon: ferti l ization andnutri tion in higher plants. Amazonian Journal of AgricultureEnvironmental Science, pp.380-387.
Nogushi, J. and Sugawara, T. 1966. Potassium and Japonica Rice.International Potash insti tute” Bern, Switzerland.
Savant, N .K ., Snyder , G.H. and Datnoff, L .E. 1997. Si l iconmanagement and sustainable r ice production. AdvancedAgronomy, 58:1245-1252.
Sahebi, M., Hanafi , M.M., Akmar, A .S.N., Rafi i , M.Y., Azizi , P.,Tengoua, F.F., Azwa, J.N.M. and Shabanimofrad, M. 2015.Importance of Si l i con and M echani sms of Bi osi l i caFormation in Plants. BioMed. Research International, 16p.
Wallace, A . 1993. Participation of si l icon in cation-anion balanceas a possible mechanism for aluminum and iron tolerancein some gramineae. Journal of Plant Nutri tion, 16:547-553.
Yoshihara, T., Sogawa, K., Pathak, M.D., Jul iano, B.O. andSakamur a, S. 1979. Soluble si l i ci c acid as a suck ingi nhi bi tor y substance i n r i ce against the r ice brow npl anthopper . (Depl huci daehomoter a). Entomol ogi cExperimental ist Applicants, 26:314.
Yoshida, S. 1981. Fundamentals of Rice Crop Science. InternationalRice Research Insti tute, Los Banos, Laguna, Phi l ippines.pp.165-167.
Manuscript recived on 13.1.2018Manuscript accepted for publication on 27.4.2018

Journal of Eco-friendly Agriculture 13(2) 2018 109
Augustine, Neenu 52
Balikai, R.A. 52, 75
Banga, Akshita 23
Bhargava, Bhupendra H. 27
Bohra, Burhanuddin 80
Chandra, Ram 88, 92
Chopra, Neelam 27
Gupta, Shilpi 18
Gurav, S.S. 65
Gurunath, M.B. 75
Hembrom, Lakhindar 60, 72
Khandekar, R.G. 65
Krishnaveni R 95
Kulkarni, Prema 95
Kumar, Binay 60, 72
Kumar, Rajendra 39
Malshe, K.V. 31
Mathur, Kusum 80
Mhaskar, N.V. 31
Misra, A.K. 68
Naik, R. Ravi 92
Prasad, Devendra 60, 72
Prasad, Rabindra 60, 72
Qadri, Binish 44
Author IndexRai, R.K. 39
Rajkumar, Balaji 68
Rao, Guntamukkala Babu 106
Rao, Hema 95
Rathod, Vandana 95
Rathor, Gopal 27
Roy, Sharmila 68
Sah, V.K. 23
Saikia, Jumi 102
Sharma, S.K. 27
Sharma, Yogesh 18
Shellikeri, Basavaraj 31
Shinde, V.V. 65
Shirgure, P.S. 1
Shuba 95
Singh, D.K. 18
Singh, S.K. 35
Singh, S.P. 35
Srivastava, A.K. 1
Susmitha, Pusarla 106
Trivedi, P.C. 80
Vyas, B.N. 80
Wankhede, S.M. 65
Yadava, Anil 23

STATEM ENT ABOUT OWNERSHIP AND OTHER PARTICULARS ABOUTJOURNAL OF ECO-FRIENDLY AGRICULTURE
FORM IV
(See Rule 8)
1. Place of Publication Lucknow – 226 016
2. Periodicity of its Publication Biannual
3. Printer’s Name Dr. R.P. SrivastavaNationality IndianAddress Dr. R.P. SrivastavaDoctor ’s Krishi Evam Bagw ani Vikas
SansthaA-601, Indira Nagar, Lucknow-226 016
4. Publisher’s Name Dr. R.P. SrivastavaNationality IndianAddress Dr. R.P. SrivastavaDoctor’s Krishi Evam Bagw ani Vikas
SansthaA-601, Indira Nagar, Lucknow - 226 016
5. Editor’s Name Dr. A.K. MisraFormer Project Coordinator AICRP (STF) CISH, Lucknow
Nationality IndianAddress 4/ 1081, Vikas Nagar, Lucknow-226 022
6. Name and addresses of individual who Doctor’s Krishi Evamown the newspapers and partners or Bagwani Vikas Sansthashareholders holding more than one A-601, Indira Nagar, Lucknow - 226 016per cent of the total capital Registration No. 1-131380
I, Dr. R.P. Srivastava, hereby declare that the particulars given above are true to the best of my know ledge and belief.
Dated: 01. 07. 2018 Sd./ Dr. R.P. Srivastava
Signature of the Publisher

Doctor’s Krishi Evam Bagwani Vikas Sanstha(Doctor’s Agricultural and Horticultural Development Society)
Registered under Society Registration Act 21, 1860Main office : A-601, Indira Nagar, Lucknow-226 016, India
www.ecoagrijournal.comE-mail : [email protected] ; [email protected]
MEMBERSHIP FORM
1. Name : 2. Date of Birth (DD/ MM/ YYYYY)
3. Sex : 4. Type of Membership : Life Annual
(Please give a mark)
5. Designation :
6. Academic and Professional Qualification : 8. Crop(s)/ Commodity :
7. Discipline/ Subject :
9. Specialization :
10. Institutte/ Organization where Employed :
11. Address for Correspondence : .......................................... 12. Permanent Home Address : ...............................................
.............................................................................................................. .............................................................................................................
........................................................ City ............................................ ........................................................ City ............................................
State .............................................. PIN ............................................ State .............................................. PIN ............................................
13. Tel. No. (w ith STD Code) 14. Tel. No. Res. (w ith STD Code) :
15. Mobile No. : 16. E-mail :
Payment of membership fee Rs./ US$/ ............................................................................ by Cash / Multi City Cheque No. / DD No.
................................................................................. Drawn on .................................................................. (Bank) Dated : ............................... in
favour of Doctor’s Krishi Evam Bagwani Vikas Sanstha payable at Lucknow.
Bank Details for onl ine Transfer
1. Name of the Bank - Punjab National Bank 2. Account No. : 2414000100990749 3. IFSC Code : PUNB0241400
4. Branch Address : HAL, Faizabad Road, Indira Nagar, Lucknow 226 016.
DECLARATION
I w ish to become the Life/ Annual member of the Journal of Eco-Friendly Agriculture and if enrolled agree to abide by itsrules and regulations.
Date : ...........................................
Place : ......................................... Signature
1. Mail the duly filed membership form along w ith the fee to the Secretary/Treasurer, Journal of Eco-Friendly Agricultureon the above address.
2. After online transfer, please intimate the General Secretary on the above address.

Doctor’s Krishi Evam Bagwani Vikas Sanstha(Doctor’s Agricultural and Horticultural Development Society)
Registered under Society Registration Act 21, 1860Main Office: A-601, Indira Nagar, Lucknow-226 016, India
www.ecoagri journal.comE-mail : ecofr iendlyagriculture@gmail .com; ecofir iendlyapproaches@gmail .com
Application for the Fel low of Doctor’s Agricultural and Horticultural Development Society (FDAHDS)1. Name in ful l
(Surname fol lowed by forename)2. Date of Birth3. Field of specification
(i ) Major discipl ine (section) :(i i ) Subject of specification :
4. Present Position/ Designation:5. Address : (a) Office : Tel. No. :
Fax No. :E-mail :Mobi le :Address :
(b) Residential : Tel. No. :Mobi le :Address :
6. Academic record and professional attainments:-
7. Service record: -
Exam/ Degree/ Diploma Institution/ Board/ University Year Distinction H igher Secondary Graduation Post graduation Ph. D
8. Significant Achievements of the Nominee9. Awards & Honors, including Scienti fic Leaderships
(i ) International Awards(i i ) National Honor/ Awards(i i i ) Other Honors/ Awards(iv) Scienti fic Leadership
10. Publ ications
Position Held Organization Insti tution & Place of Posting
Period (From-To)
Duration (Year, months)
*N ote: List of Journals identified by the Academy and their assigned weightage is available on Academy web site http:/ / www.naasindia.org11. Please attach additional l ist of publ ication12. Papers publ ished in Journal of Eco-fr iendly AgricultureI certi fy that the information given in the form is correct.
Date: Signature of Nominee
On the successful completion of 12 years, Society has decided to recognize eminent scientists by awarding fel lowship of the society(Fel low of Doctor’s Agricultural and Horticultural Development Society, FDAHDS). For this interested scientists may apply to theGeneral Secretary, Doctor’s Agricultural and Horticultural Development Society w ith their biodata in prescribed format along w ith thefee of Rs 5000/-. The appl ications w i l l be evaluated by a competent committee for the award of the fel lowship.
List below 20 best research publ ications in the descending order of Journals of impact and high standing (as identif ied by the NAAS): indicating (i) name of author(s), (i i ) year, (i ii ) title, (iv) name of journal , volume no. and page nos.
S.No. List of Publ ications* NAAS Journal ID NAAS Rating