NIGERIA - African Fertilizer and Agribusiness Partnership ...
39
NIGERIA
-
Upload
khangminh22 -
Category
Documents
-
view
5 -
download
0
Transcript of NIGERIA - African Fertilizer and Agribusiness Partnership ...

NIGERIA

Nigeria - PESTEL Analysis
Political Economic Social Environment Legal
• Elections early next year• Political divide heightened
by ethnic and religious bias
• Government programmes usually refocused around direct rural benefits
• Pressure on Government regarding achievements
• PFI, ABP and SIP are likely to receive more budget
• Budget still not approved• Clamour for restructuring
- devolution of power
• Trade balance is more respectable• Import control, especially on raw
materials for food, will remain• Export of solid minerals improved
significantly• Infrastructure projects appear to
be adequately funded (mostly by debt) and are construction has started
• Reserves are rising• Debt restructuring – increase in
overall debt but reduction in interest rate from reduction in local borrowing
• ERGP in execution phase• Oil prices have improved in the
last 6 months
Social Investment Programme• School feeding Programme
(7.4M primary school kids in 22 States) to be funded in earnest (election year)
• GEEP programme giving loans (10K – 100K) to MSMEs becoming more aggressive
• Insecurity arising from BH and “herdsmen” still high and to receive $1B in funding
• Cash transfers to poor and vulnerable people (300,000 people)
• Niger – Delta (Ogoni) clean up programme
• Increased focus and allocation of funds to renewable energy (solar) production (plan for a $10B green bond)
• Fertiliser regulatory bill at the last stage of passage at the Senate
• Petroleum industry governance bill passed at the lower house in January. Awaiting signature by the President
Key Takeaways: • Though Boko Haram are contained militarily, they continue a guerrilla war• Elections are starting in Q1 next year and they threaten to be very tribal, religious and bitterly violent • The Economic Recovery Growth Plan (ERGP) is now in execution stage• The Government has restructured debt to lower the interest rate and infrastructure funding• Historically, elections have been funded illicitly by Government; if the same happens this year, there will be lots of distortions to already imperfect social and agriculture (fertiliser)
programmes• The country is focusing on agriculture, social programmes, and MSME funding to improve human capital development and to reduce violence in the country• A bill has been passed limiting election spend. The Treasury Single Account (TSA) also limits access to government cash. These are positive developments
• Poor road infrastructure and high cost of transport adds to the cost of inputs and impact the return to farmers as it affects the harvest.
• Recent investments in the railway are positive although a cargo service is yet to be offered.
• There is widespread use of mobile phones making mobile services possible.
• Low adoption of technology in agriculture
Technical
Agricultural Dynamics - Overview
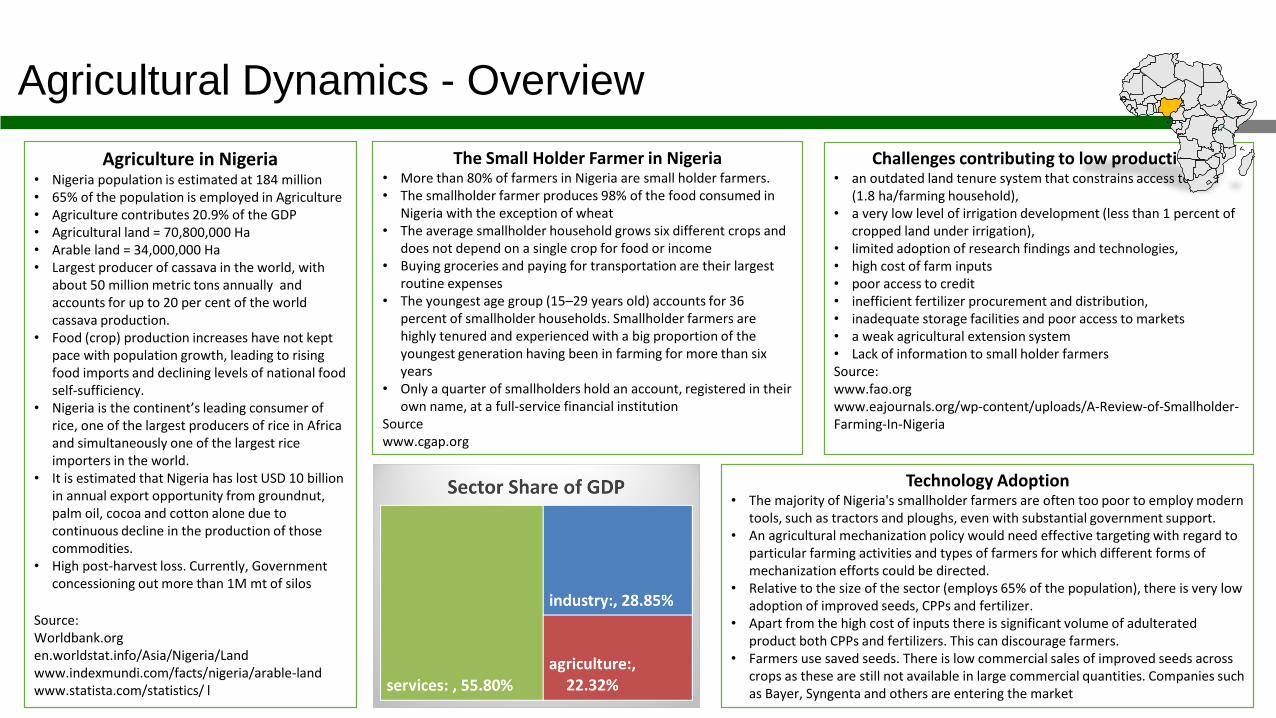
Agriculture in Nigeria • Nigeria population is estimated at 184 million• 65% of the population is employed in Agriculture• Agriculture contributes 20.9% of the GDP• Agricultural land = 70,800,000 Ha• Arable land = 34,000,000 Ha• Largest producer of cassava in the world, with
about 50 million metric tons annually and accounts for up to 20 per cent of the world cassava production.
• Food (crop) production increases have not kept pace with population growth, leading to rising food imports and declining levels of national food self-sufficiency.
• Nigeria is the continent’s leading consumer of rice, one of the largest producers of rice in Africa and simultaneously one of the largest rice importers in the world.
• It is estimated that Nigeria has lost USD 10 billion in annual export opportunity from groundnut, palm oil, cocoa and cotton alone due to continuous decline in the production of those commodities.
• High post-harvest loss. Currently, Government concessioning out more than 1M mt of silos
Source:Worldbank.orgen.worldstat.info/Asia/Nigeria/Landwww.indexmundi.com/facts/nigeria/arable-land www.statista.com/statistics/ l
The Small Holder Farmer in Nigeria• More than 80% of farmers in Nigeria are small holder farmers. • The smallholder farmer produces 98% of the food consumed in
Nigeria with the exception of wheat• The average smallholder household grows six different crops and
does not depend on a single crop for food or income • Buying groceries and paying for transportation are their largest
routine expenses• The youngest age group (15–29 years old) accounts for 36
percent of smallholder households. Smallholder farmers are highly tenured and experienced with a big proportion of the youngest generation having been in farming for more than six years
• Only a quarter of smallholders hold an account, registered in their own name, at a full-service financial institution
Sourcewww.cgap.org
Challenges contributing to low productivity • an outdated land tenure system that constrains access to land
(1.8 ha/farming household), • a very low level of irrigation development (less than 1 percent of
cropped land under irrigation), • limited adoption of research findings and technologies, • high cost of farm inputs • poor access to credit • inefficient fertilizer procurement and distribution, • inadequate storage facilities and poor access to markets • a weak agricultural extension system • Lack of information to small holder farmers Source:www.fao.orgwww.eajournals.org/wp-content/uploads/A-Review-of-Smallholder-Farming-In-Nigeria
Technology Adoption• The majority of Nigeria's smallholder farmers are often too poor to employ modern
tools, such as tractors and ploughs, even with substantial government support. • An agricultural mechanization policy would need effective targeting with regard to
particular farming activities and types of farmers for which different forms of mechanization efforts could be directed.
• Relative to the size of the sector (employs 65% of the population), there is very low adoption of improved seeds, CPPs and fertilizer.
• Apart from the high cost of inputs there is significant volume of adulterated product both CPPs and fertilizers. This can discourage farmers.
• Farmers use saved seeds. There is low commercial sales of improved seeds across crops as these are still not available in large commercial quantities. Companies such as Bayer, Syngenta and others are entering the market
worldbank.org
1,200
1,250
1,300
1,350
1,400
1,450
1,500
1,550
1,600
1,650
2005 2006 2007 2008 2009 2010 2011 2012 2013 2014 2015 2016
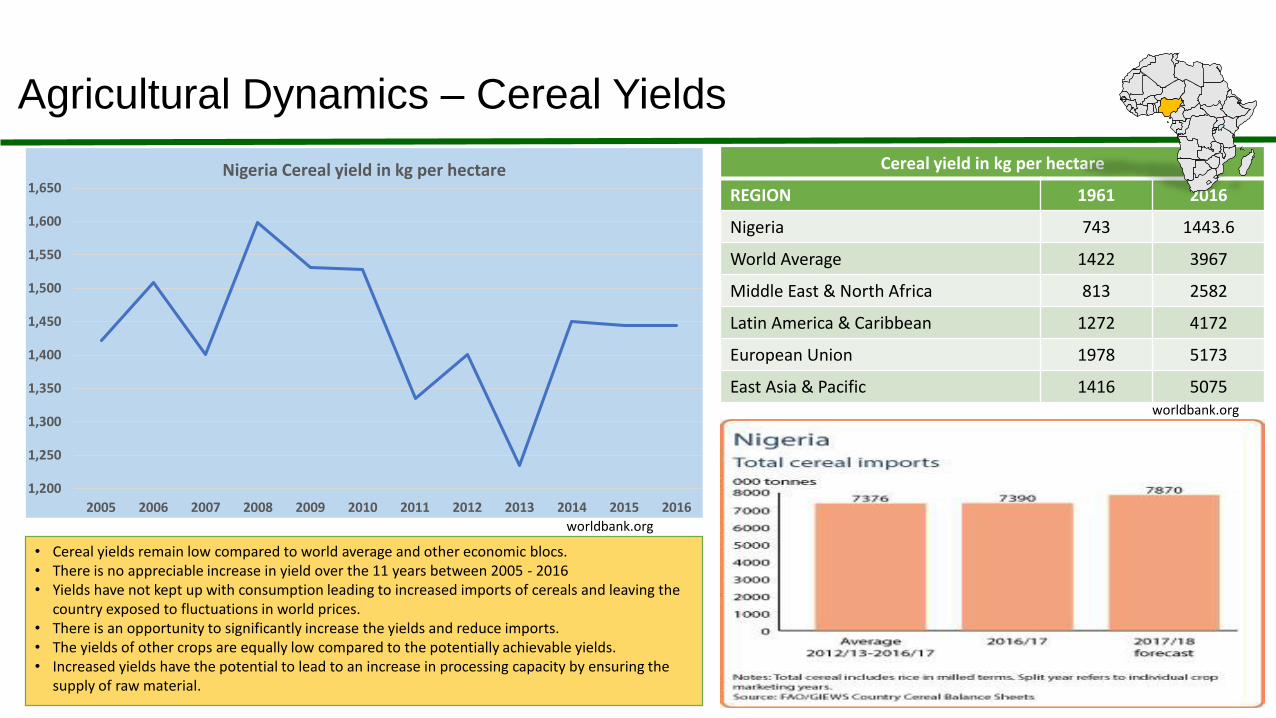
Nigeria Cereal yield in kg per hectare Cereal yield in kg per hectare
REGION 1961 2016
Nigeria 743 1443.6
World Average 1422 3967
Middle East & North Africa 813 2582
Latin America & Caribbean 1272 4172
European Union 1978 5173
East Asia & Pacific 1416 5075
• Cereal yields remain low compared to world average and other economic blocs.• There is no appreciable increase in yield over the 11 years between 2005 - 2016 • Yields have not kept up with consumption leading to increased imports of cereals and leaving the
country exposed to fluctuations in world prices. • There is an opportunity to significantly increase the yields and reduce imports.• The yields of other crops are equally low compared to the potentially achievable yields.• Increased yields have the potential to lead to an increase in processing capacity by ensuring the
supply of raw material.
worldbank.org
Agricultural Dynamics – Cereal Yields

IMPORTED FERTILIZER
Fertilizer Name 2013 2014 2015 2016 2017
NPK 294,980 344,879 165,684 380,455 399,949
MOP 13,921 13,721 408 3,683 121,846
DAP - - 5,500 5,250 102,770
NP compounds 87,988 68,535 47,986 115,845 96,984
Ammonium sulphate 12,301 2,321 10,483 27,450 40,248
Urea 598,616 291,966 120,346 21,013 12
Others fertilizers 6,153 20,796 67,569 40,298 42,285
Total (MT) 1,013,959 742,216 417,976 593,994 804,093
50,000 38,000 82,440
329,630
659,603
-
100,000
200,000
300,000
400,000
500,000
600,000
700,000
Urea
UREA EXPORTS PER YEAR
2013 2014 2015 2016 2017
MT
LOCALLY PRODUCED FERTILIZER
Product 2013 2014 2015 2016 2017
Urea 235,000 170,000 281,750 695,000 1,420,325
SSP 15,000 491 611 -
Total (MT) 250,000 170,491 282,361 695,000 1,420,325
The Fertilizer Market – Overview
• There are 2 urea plants with a combined installed capacity producing 2,250,000 MT. during the low season Urea is exported primarily to Brazil
• There is very little export to the west African sub-region which continues to import urea from outside Africa
• An agreement between the governments of Nigeria and Morocco enabled the formation of the Presidential Fertilizer Initiative (PFI). Through the PFI blenders were contracted to produce NPK 20:10:10 using MOP, DAP and local urea purchased by the government.
• The PFI revived many blending plants that were dormant
• Urea and NPK continue to be the most used fertilizers in the country.
• NPK is the most imported fertilizer constituting 50% of the imported fertilizer.

0.000
2.000
4.000
6.000
8.000
10.000
12.000
14.000
16.000
18.000
2002 2003 2004 2005 2006 2007 2008 2009 2010 2011 2012 2013 2014 2015
Nigeria Fertilizer Consumption Kg/Ha of Arable Land
worldbank.org
Fertilizer Consumption Kg/Ha of Arable Land
REGION 2002 2015
Nigeria 4.5 8.29
World Average 106.4 137.6
Middle East & North Africa 88.6 105.3
Latin America & Caribbean 89.5 122.7
European Union 166.6 157.2
East Asia & Pacific 246.1 327.9
Kenya 27.31 28.58
Cote d’Ivoire 31.02 50.24
South Africa 61.2 58.51
The Fertilizer Market – Consumption
• The current unit consumption is far below the world average and the level in other economic blocs. • Nigeria’s unit consumption is even below that of several sub-Saharan countries.• In spite of the heavy investment in subsidy, the unit consumption has only grown by a factor of 2 in more than 10 years from 4.5Kg/Ha (2002) to 8,29Kg/Ha (2015) .• There have various forms of subsidy over the years but they have been inefficient and have not succeeded in reaching the majority of farmers • Extension services are almost non-existent except for few private sector companies trying to fill the gap but their efforts are still insufficient in effectively covering the whole country

The Fertilizer Market – Consumption
1,213,959
874,216
617,897
959,364
1,564,816
2013 2014 2015 2016 2017
Apparent Consumption for Nigeria (mt) 2017 Apparent Consumption - Nigeria
Fertilizer System Volume (MT)
PFI PFI 427,000 28%
State Bulk Government 98,750 7%
Private Private 976,500 65%
1,502,250
Takeaways• There is an emerging Private sector that should be strengthened• There are 2 functional Urea plants and 2 plants under construction• Nigeria has 32 blending plants of which 23 are functional and 9 are non-functional. There are 5 additional blending
plants in project stage.• Private sector participation should be strengthened to encourage competition which would optimize prices and lead to
innovative products.
The Fertilizer Market – Regulatory Environment
• Currently there is no legal framework to regulate the fertilizer sector. However the Fertilizer Quality Control bill is at the final reading at the Legislature.
• Once it is passed, regulations will have to be drawn up and policies enacted to enable the execution of the regulations.
• Institutional capacity needs to be built both in the private sector and the ministry of agriculture in order to effectively implement the regulations. For example:• Build well equipped labs across to provide services in analysing the fertiliser
• Capacity to prosecute those who adulterate fertilizer and other agricultural inputs
• The Government will require assistance with recruitment, internal policies regarding regulatory control processes, and specifications (and probably budget support) for equipment and tools required to effectively discharge the responsibility.
• Self-regulation through various stakeholders in the sector will be important in effectively implementing the policies that result from the fertilizer bill
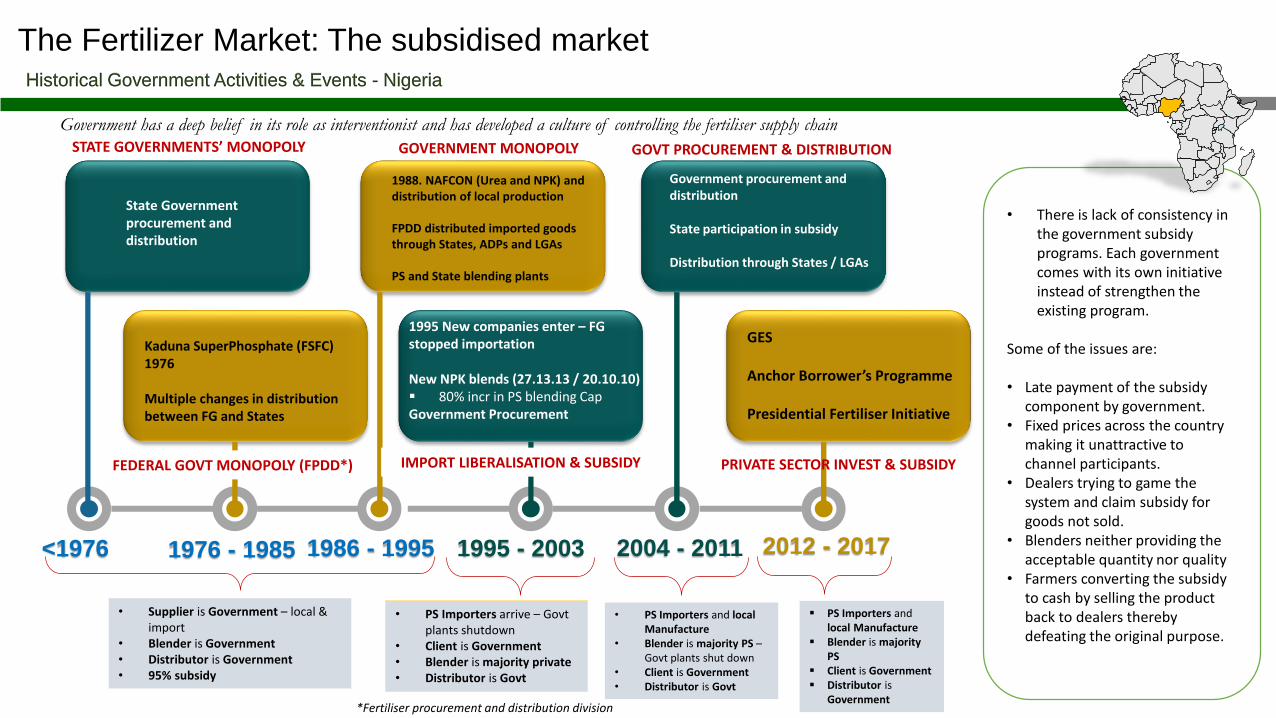
The Fertilizer Market: The subsidised marketHistorical Government Activities & Events - Nigeria
*Fertiliser procurement and distribution division
<1976 1976 - 1985 1986 - 1995 1995 - 2003 2004 - 2011 2012 - 2017
State Government procurement and distribution
STATE GOVERNMENTS’ MONOPOLY
Kaduna SuperPhosphate (FSFC) 1976
Multiple changes in distribution between FG and States
FEDERAL GOVT MONOPOLY (FPDD*)
1988. NAFCON (Urea and NPK) and distribution of local production
FPDD distributed imported goods through States, ADPs and LGAs
PS and State blending plants
GOVERNMENT MONOPOLY
1995 New companies enter – FG stopped importation
New NPK blends (27.13.13 / 20.10.10)▪ 80% incr in PS blending CapGovernment Procurement
IMPORT LIBERALISATION & SUBSIDY
Government procurement and distribution
State participation in subsidy
Distribution through States / LGAs
GOVT PROCUREMENT & DISTRIBUTION
GES
Anchor Borrower’s Programme
Presidential Fertiliser Initiative
• Supplier is Government – local & import
• Blender is Government• Distributor is Government• 95% subsidy
• PS Importers arrive – Govt plants shutdown
• Client is Government• Blender is majority private• Distributor is Govt
• PS Importers and local Manufacture
• Blender is majority PS –Govt plants shut down
• Client is Government• Distributor is Govt
▪ PS Importers and local Manufacture
▪ Blender is majority PS
▪ Client is Government▪ Distributor is
Government
PRIVATE SECTOR INVEST & SUBSIDY
Government has a deep belief in its role as interventionist and has developed a culture of controlling the fertiliser supply chain
• There is lack of consistency in the government subsidy programs. Each government comes with its own initiative instead of strengthen the existing program.
Some of the issues are:
• Late payment of the subsidy component by government.
• Fixed prices across the country making it unattractive to channel participants.
• Dealers trying to game the system and claim subsidy for goods not sold.
• Blenders neither providing the acceptable quantity nor quality
• Farmers converting the subsidy to cash by selling the product back to dealers thereby defeating the original purpose.

The Fertilizer Market: Subsidy investments have not resulted in yield gains
YIELDSNigeria’s Yield Per Hectare has not kept up with
global Increases
INVESTMENTSNigeria’s Fertilizer Investments (Procurement and Subsidy) have had no correlation with changes in yield
YEILD SOURCE: World BankYEILD SOURCE: World BankINFLATION SOURCE: IMFSUBSIDY SOURCE: IFDC
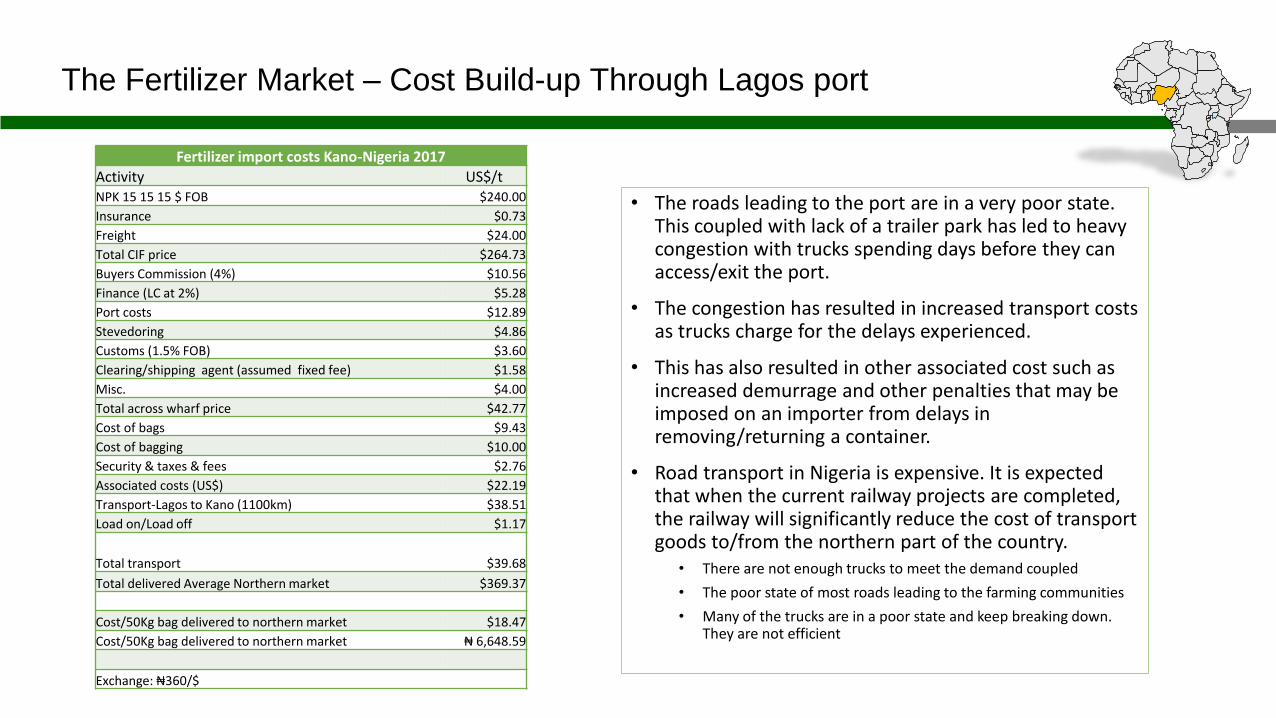
The Fertilizer Market – Cost Build-up Through Lagos port
• The roads leading to the port are in a very poor state. This coupled with lack of a trailer park has led to heavy congestion with trucks spending days before they can access/exit the port.
• The congestion has resulted in increased transport costs as trucks charge for the delays experienced.
• This has also resulted in other associated cost such as increased demurrage and other penalties that may be imposed on an importer from delays in removing/returning a container.
• Road transport in Nigeria is expensive. It is expected that when the current railway projects are completed, the railway will significantly reduce the cost of transport goods to/from the northern part of the country.
• There are not enough trucks to meet the demand coupled
• The poor state of most roads leading to the farming communities
• Many of the trucks are in a poor state and keep breaking down. They are not efficient
Fertilizer import costs Kano-Nigeria 2017
Activity US$/tNPK 15 15 15 $ FOB $240.00
Insurance $0.73
Freight $24.00
Total CIF price $264.73
Buyers Commission (4%) $10.56
Finance (LC at 2%) $5.28
Port costs $12.89
Stevedoring $4.86
Customs (1.5% FOB) $3.60
Clearing/shipping agent (assumed fixed fee) $1.58
Misc. $4.00
Total across wharf price $42.77
Cost of bags $9.43
Cost of bagging $10.00
Security & taxes & fees $2.76
Associated costs (US$) $22.19
Transport-Lagos to Kano (1100km) $38.51
Load on/Load off $1.17
Total transport $39.68
Total delivered Average Northern market $369.37
Cost/50Kg bag delivered to northern market $18.47
Cost/50Kg bag delivered to northern market ₦ 6,648.59
Exchange: ₦360/$

Average Urea Retail Prices (Oct ‘18) in selected countries
401
412406551
486
521
525
540
550
590604
654
614
914
US$/MT
World 240
Nigeria 401
Ghana 406
Tanzania 412
Kenya 486
Mali 521
Burkina Faso 525
Zambia 540
Malawi 550
Cote d'Ivoire 551
Uganda 590
Senegal 604
Rwanda 614
Mozambique 654
Burundi 914
Ratio to World Price
1.5 - 1.74
1.75 - 1.99
2.00 - 2.24
2.25 - 2.49
2.50 - 2.74
> 2.74
• Urea price in Nigeria is as high as Ghana’s even though Nigeria produces and exports Urea.
• High food import bill • Low agriculture productivity• Significant investments in fertilizer and
agricultural processing – rice, feed mills, and now silos
• Government’s bulk procurement scheme, PFI, tries to subsidize the farmer
• ON the back of the PFI, there have been investments in old and new blending plants
• Fertilizer bill to kick-start fertilizer regulation is in the Upper House
• Distributors and blenders are not mature having traditionally targeted Government subsidies
• Transport costs are at an all-time high due to poor condition of port evacuation roads

Crop Prices: History and In-Country Ranges
Observations & Comments:• There was a sharp increase in rice and maize prices in 2016 driven by import tariffs
imposed by the Government as well as forex policies of the CBN• The range of prices within country is large.
• This indicates that profitability may also vary greatly by geography.• The price range does appear to have narrowed over time. Narrowing would be expected if
transport infrastructure had improved, thus better linking the various marketplaces.

Average Crop Prices versus World Urea Price
Observations & Comments:• Prior to the last year, maize has shown little correlation with urea.• Rice price correlation with urea is weak to nonexistent.

Average Crop Prices in international markets
Observations & Comments:• Maize and Rice prices were trending downwards since 2014 • 2017 appeared to have bucked the trend• Relative to 2014, and contrary to international markets, Maize and
Rice prices improved significantly in Nigeria in 2016 through to 2018
0
100
200
300
400
500
600
700
800
900
1000
Jul-
98
May
-99
Mar
-00
Jan
-01
No
v-0
1
Sep
-02
Jul-
03
May
-04
Mar
-05
Jan
-06
No
v-0
6
Sep
-07
Jul-
08
May
-09
Mar
-10
Jan
-11
No
v-1
1
Sep
-12
Jul-
13
May
-14
Mar
-15
Jan
-16
No
v-1
6
Sep
-17
Rice (US$/mt)
0
50
100
150
200
250
300
350
Jul-
98
May
-99
Mar
-00
Jan
-01
No
v-0
1
Sep
-02
Jul-
03
May
-04
Mar
-05
Jan
-06
No
v-0
6
Sep
-07
Jul-
08
May
-09
Mar
-10
Jan
-11
No
v-1
1
Sep
-12
Jul-
13
May
-14
Mar
-15
Jan
-16
No
v-1
6
Sep
-17
Maize (US$/mt)

The Fertilizer Market – VALUE CHAIN SWOT SUMMARY - NIGERIA
Strengths Weaknesses Opportunities Threats
Manufacturer • Annual Urea production is greater than demand
• Brand awareness in the markets • Cheap gas available in Nigeria
• Insufficient working capital downstream leading to lack of products
• Latent demand significantly more than production• Local prices more attractive than export• Proximity to South America (Brazil) makes further
Urea investment attractive.
• Government policy regarding urea movement hinders local supply
• Fears about price of fertilizer to farmer leads to policies that reduce profitability
• Other Government interventions to push availability constrain brand building (and market developing) activities
Importer • Access to finance• Relationship with the international
fertilizer community• Strong Government relationships• Good relationships with wholesalers
• Very little value-addition locally• Excessive interest in Government programmes• Short-term market approach – seasonal interest
only• No farmer relationship
• With PFI, invest in blending and start the development of a distribution network
• Link input supply with the farm output chain• The regulatory bill and regulations will control
quality
• Government policy on import substitution (use of local raw materials) and reduced fertilizer cost
• Forex scarcity or control
Blender • Blending technology • Lack of technical knowledge of soils, blends and
blender management• Farmer relationship
• Specialty blends to improve productivity with the introduction of micro-nutrients
• Brand building • Regulatory bill and regulations will control quality
• The position of most blenders in the chain is precarious; they are maintained by the PFI initiative which selects clients and suppliers
Distributor • Agro Dealer relationship• Manufacturer relationship• Government relationship
• Product knowledge• Governance (management systems and
capacity)• Weak working capital
• Agro dealer finance• Retail (last mile) development
• Government interventions to reduce farm gate prices• Crop specific blending will shorten the distribution
chain
Agro Dealer • Farmer interaction / relationships • Lack of working capital• Product knowledge and retail management• Absence of technology in business
• Farmer education• Specialty blends could improve profitability
• Development of last-mile retail outlets
Processor • Demand for finished product • Lack of working capital• No controlled aggregation structure• Low utilisation of equipment
• Silo concession could integrate aggregation• Specialty blends could improve production
• Weak Profitability (primarily from lack of feedstock)• Insufficient
Key Takeaways:1. Nigeria is able to produce / bring in sufficient fertilizer to meet current demand, buoyed by increased
production capacity, the PFI and the ambition of OCP2. Manufacturers and importers are creating and driving more farmer (market) development activities3. Blending is being resuscitated by the PFI but it is dependent on the PFI who is the client and the supplier4. Distribution is opaque, lacks management capacity, and suffers from an absence of relationship (and trust)
with upstream and downstream partners
5. Processing capacity is underutilised as it continues to compete with consumption rather than benefit from surplus
6. The regulatory bill could potentially improve product quality which will lead to an increase in farmer productivity and profitability
7. Majority of farmers do not appreciate the relationship between fertilisers and yields8. Tthere is a big opportunity for the uptake of digital financial services that are designed to serve the low-income
population especially the small holder farmer at scale

Finance:Agricultural Economy Overview

Economic Overview: Major Points
• The agricultural economy is an important contributor to employment and GDP.
• The agricultural workforce is, on average, poorer than the national average.• This has significant implications relating to the ability to
finance ag-sector activities.

Economic Overview
The agricultural economy is a significant part of the overall economy.
• Over one third of the workforce is employed in the agricultural sector.• The ag sector generates about one fifth of national GDP.

Economic Overview
The size of the ag workforce is larger than its proportional contribution to GDP. This meansthat a smaller amount of GDP accrues to a larger number of workers.
Economy Overview : Implications
Implications:• On average, the ag workforce is “poorer” than average (below national
parity).• The ability of the ag workforce to build wealth (equity) is lower than average
leading to:• Lower ability to self-finance their activities• Lower credit capacity
• This lack of financing has been confirmed in numerous surveys and studies.• Lack of equity capital is severe and the most problematic financing issue to
overcome.• In the absence of new sources and/or structures to provide financing to the
ag sector, it should be expected to grow at a sub-par rate.

Finance:Commercial Banking Sector

Commercial Banking Sector: Major Points
• Commercial bank lending into the agricultural sector is extremely low given the size and importance of the ag economy.
• There are legitimate business reasons for this lack of lending.• Financing the inventories of input dealers would be best achieved
via trade finance.• Financing the farmer, at the scale needed, is a problem that had
yet to be solved.

Commercial Banking Sector
Comments and Observations:• Loans to the agricultural sector are a very small part (<2%) of the banking sector’s asset mix.• In relation to the ag sector’s importance in terms of employment and GDP contribution, ag lending lags
far behind.

Commercial Banking Sector
Comments and Observations (continued):• Bank lending to the ag sector is so small due to the nature of capital financing. Capital comes in two basic
types, equity and debt.• Equity is the risk bearing capital. It participates in the gains/losses of the enterprise.• Debt’s return is fixed, it does not participate in the gains/losses of the enterprise. Thus it is not risk
bearing. Debt is mean to be additive to, or leverage, equity capital. It is not a substitute for equity.• Legitimate business reasons can explain why ag lending is so small. Two major factors are:
1. Ag sector participants do not have adequate risk capital (equity) to support debt. Banks cannot be expected to provide debt financing when there is a lack of risk bearing (equity) capital.
2. Even ignoring risk, small sized and short maturity loans are not profitable for banks. Many financing needs in the ag sector have these attributes.
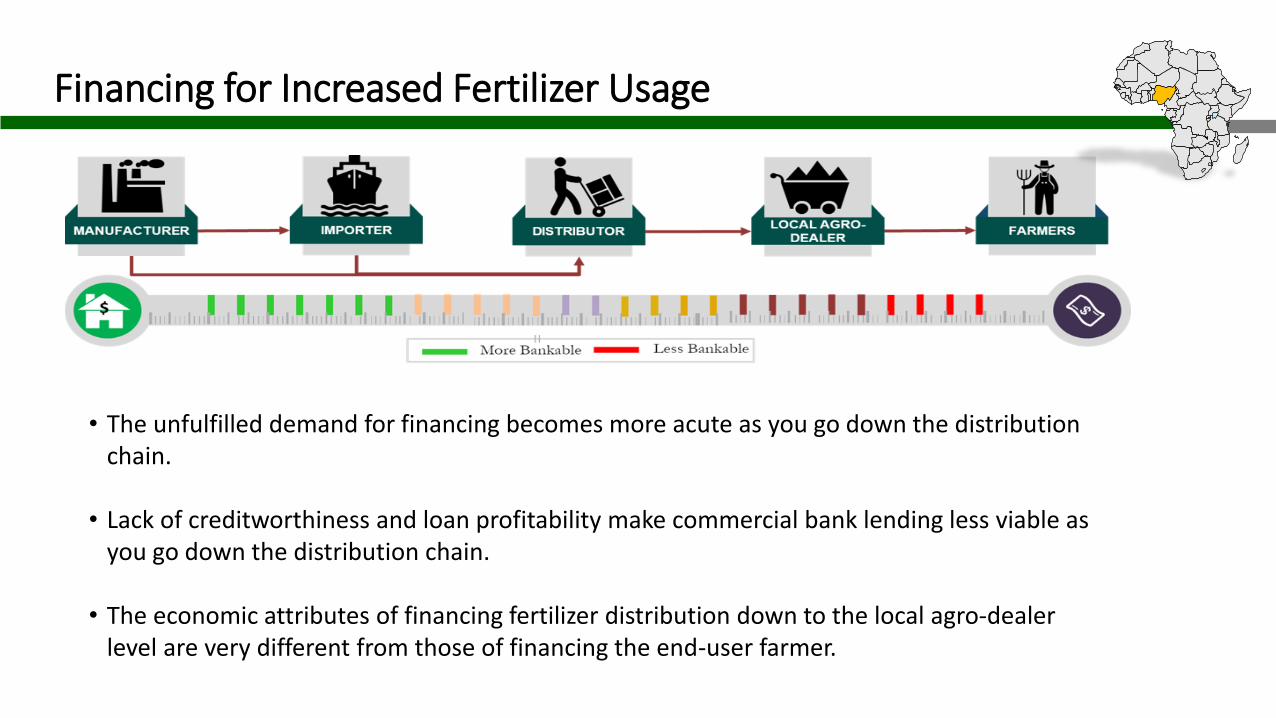
Financing for Increased Fertilizer Usage
• The unfulfilled demand for financing becomes more acute as you go down the distribution chain.
• Lack of creditworthiness and loan profitability make commercial bank lending less viable as you go down the distribution chain.
• The economic attributes of financing fertilizer distribution down to the local agro-dealer level are very different from those of financing the end-user farmer.
Financing for Increased Fertilizer Usage
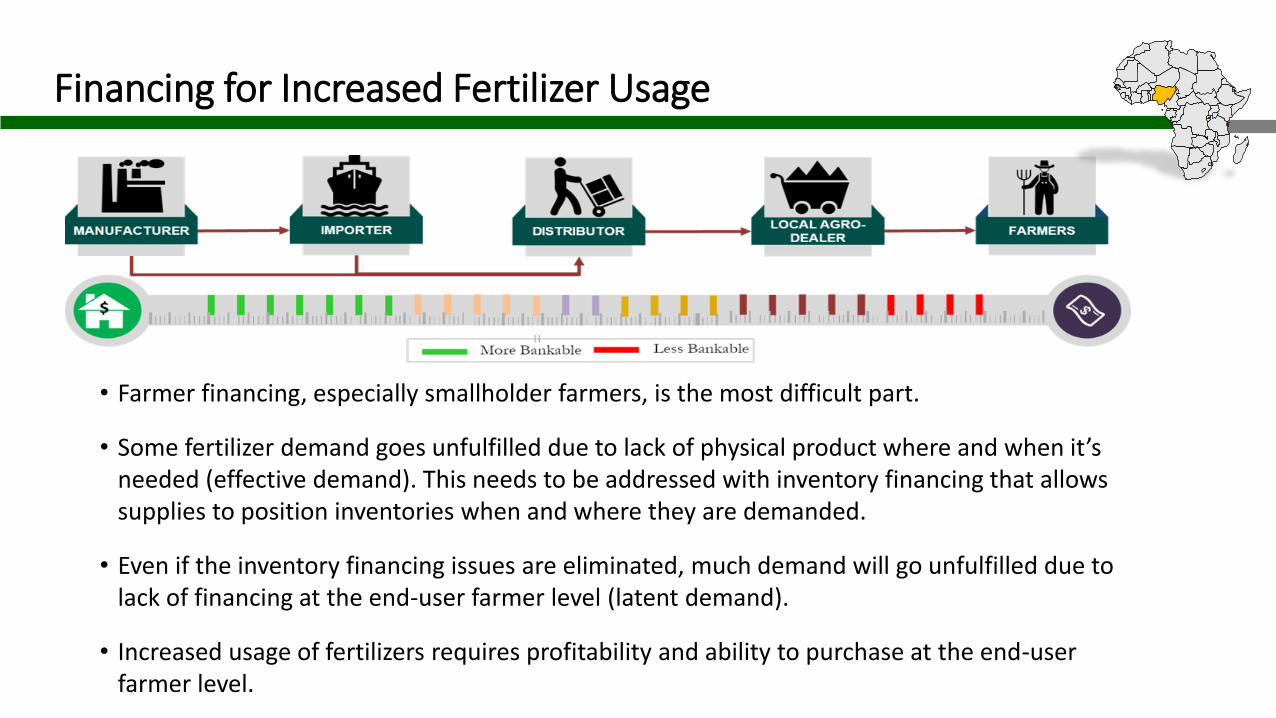
• Farmer financing, especially smallholder farmers, is the most difficult part.
• Some fertilizer demand goes unfulfilled due to lack of physical product where and when it’s needed (effective demand). This needs to be addressed with inventory financing that allows supplies to position inventories when and where they are demanded.
• Even if the inventory financing issues are eliminated, much demand will go unfulfilled due to lack of financing at the end-user farmer level (latent demand).
• Increased usage of fertilizers requires profitability and ability to purchase at the end-user farmer level.

Financing for Increased Fertilizer Usage: Possible Solutions
• Distribution Chain (Inventory) Financing• Trade credit offers the most promising route to provide inventory financing down the
distribution chain. This is due to its attributes of:• Building business trust relationships between supplier and customer.• Control of physical flows allows for more efficient management and monitoring of credit
risk.• Financing improves turnover and thus profitability, allowing financing costs to be balanced
against product margins.• Farmer Financing
• This is the large problem that has yet to be solved. Several mechanisms have shown promise such as:• Outgrower programs• Aggregator programs
• The scalability of the above programs is an issue due to the amount of management capacity and monitoring required to keep losses in check.
• New sources of funding and new credit delivery mechanisms need to be created. Some type of equity (risk bearing) financing needs to part of the solution.

Finance:Fertilizer Profitability

Fertilizer Profitability: Major Points
• Fertilizer profitability has a direct and important influence on demand.• Demand is the key element that shapes the structure of the supply side.• Realized demand depends on potential buyers to be both willing and able to
purchase.• Fertilizer profitability is impacted by large number of complex and ever
changing factors. This makes it difficult to analyze.• For the crops analyzed in Nigeria, our analysis shows that profitability should
support increased demand… if the buyer has the funds required.

Fertilizer Profitability & Demand
• The statistics showing that fertilizer usage in Africa has consistently lagged behind world averages have been well publicized for many years. This fact has driven many efforts across the continent with goal to reduce or eliminate this gap in an effort to increase farm yields.
• In the final analysis, end-user demand will be the driving force that shapes fertilizer distribution systems and the volume that they need to deliver.
• When approaching the demand environment, it is critical to understand the two major types of demand and how they impact current and potential usage of fertilizers:
• Effective demand – This is the volume of demand where the end-user farmer is both willing and able to purchase the products. Effective demand is determined by many factors such as cost/benefit, available supply and ability to purchase. While there exist gaps in certain markets where supply does not meet effective demand, these gaps are usually filled by profit seeking sellers and do not exist for long periods of time. Inefficiencies imposed on the supply chain could however artificially maintain the gaps

Fertilizer Profitability & Demand
• Latent Demand – This is the volume of demand where the end-user farmer would be a willing buyer, but lacks a necessary element in order to become an able and willing purchaser. Common factors that determine latent demand can be product knowledge, unknown cost/benefit and lack of funds.
• Consensus is that latent demand far outstrips gaps in meeting effective demand. There have been numerous programs focused on turning latent demand into effective demand, a few examples are:• Farmer training and demonstrations• Subsidy programs• Input loan programs
• Not withstanding these efforts, the “fertilizer usage gap” still remains.• Understanding the factors behind latent demand is needed in order to:
• Identify effective ways to address those factors, and • Forecast the volume of potential demand in the market. This is critical for private sector
investors who are making investment decisions.

Fertilizer Profitability
• We look to analyze fertilizer profitability because it has an important, but not exclusive, role in the determination of product demand. • Although total profitability of farming is a function of many factors, it is safe
to say that the economic return to the farmer from fertilizer usage defines some important limits. If economic returns are low to negative, issues of supply, education and others become moot. Conversely, high economic returns imply high potential demand. Either case will have significant impacts on investment decisions along the distribution chain.• Returning back to the well known statistics on fertilizer usage in Africa,
before one states that Africa should eliminate the usage “gap”, one needs to first demonstrate that doing so will not cause economic harm to the farmer.
Fertilizer Profitability Analysis
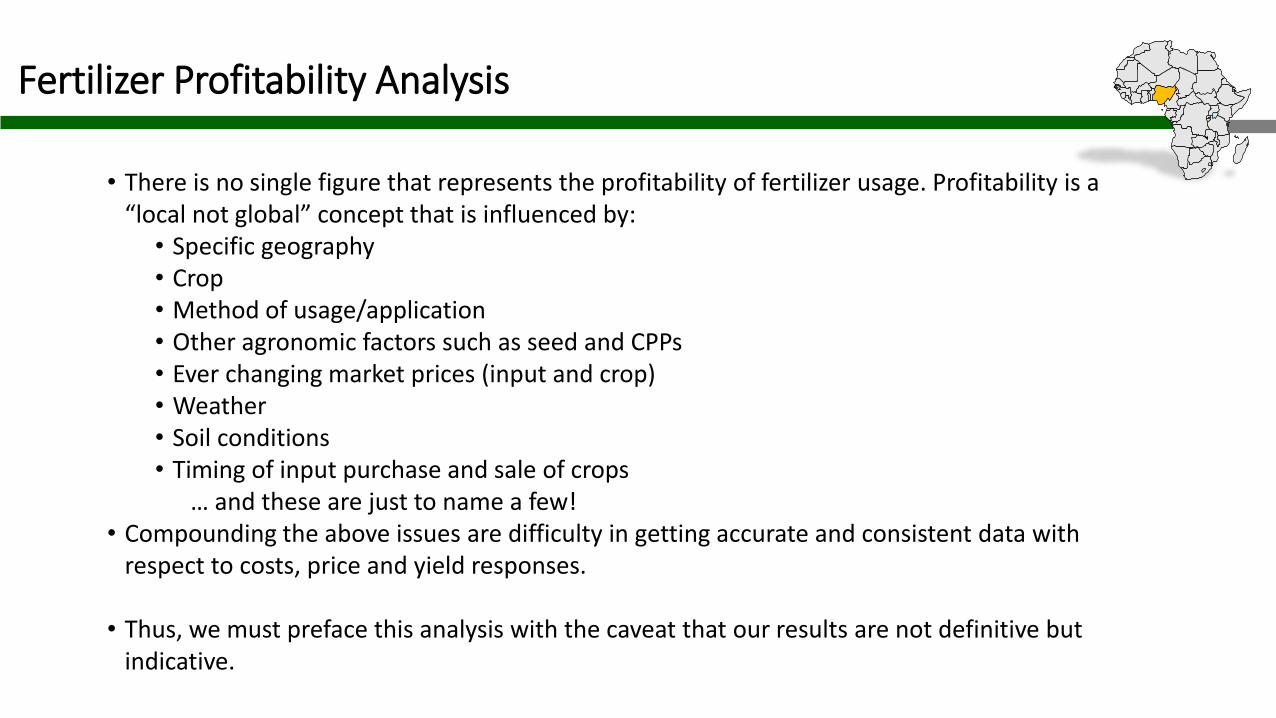
• There is no single figure that represents the profitability of fertilizer usage. Profitability is a “local not global” concept that is influenced by:• Specific geography• Crop• Method of usage/application• Other agronomic factors such as seed and CPPs• Ever changing market prices (input and crop)• Weather• Soil conditions• Timing of input purchase and sale of crops
… and these are just to name a few!• Compounding the above issues are difficulty in getting accurate and consistent data with
respect to costs, price and yield responses.
• Thus, we must preface this analysis with the caveat that our results are not definitive but indicative.

Fertilizer Profitability Analysis
• We have limited the analysis to two staple crops, maize and rice.• Specific sites were chosen that were central market locations.• The most recent growing season was chosen where reliable data was available.• We used fertilizer prices in effect at the planting season and crop prices at harvest season.
While this may represent a “worse case” (for example crop prices can be at seasonal lows during harvest) we felt that it best represented the reality of the smallholder farmer.
• We used suggested fertilizer application rates and only considered “basic” products (DAP, Urea, NPK) and not any blended products.
• The analysis assumes that fertilizer application is the only variable. In practice, combining improved fertilizer usage with improved seed and other inputs and practices can maximize overall yield gains.
• Valid yield response data allows for direct computation of profitability given knowledge of fertilizer prices, application rates and crop prices. However, getting such yield response data is the greatest challenge.
• Because of the difficulty in locating valid yield response data, we calculated a range of yield responses that would be needed to achieve a range of returns on investment (ROI).
• There is no scientific/objective level of a minimum acceptable ROI, but a practical rule of thumb is that a two time return (200% ROI) is needed.
Fertilizer Profitability Analysis: Maize
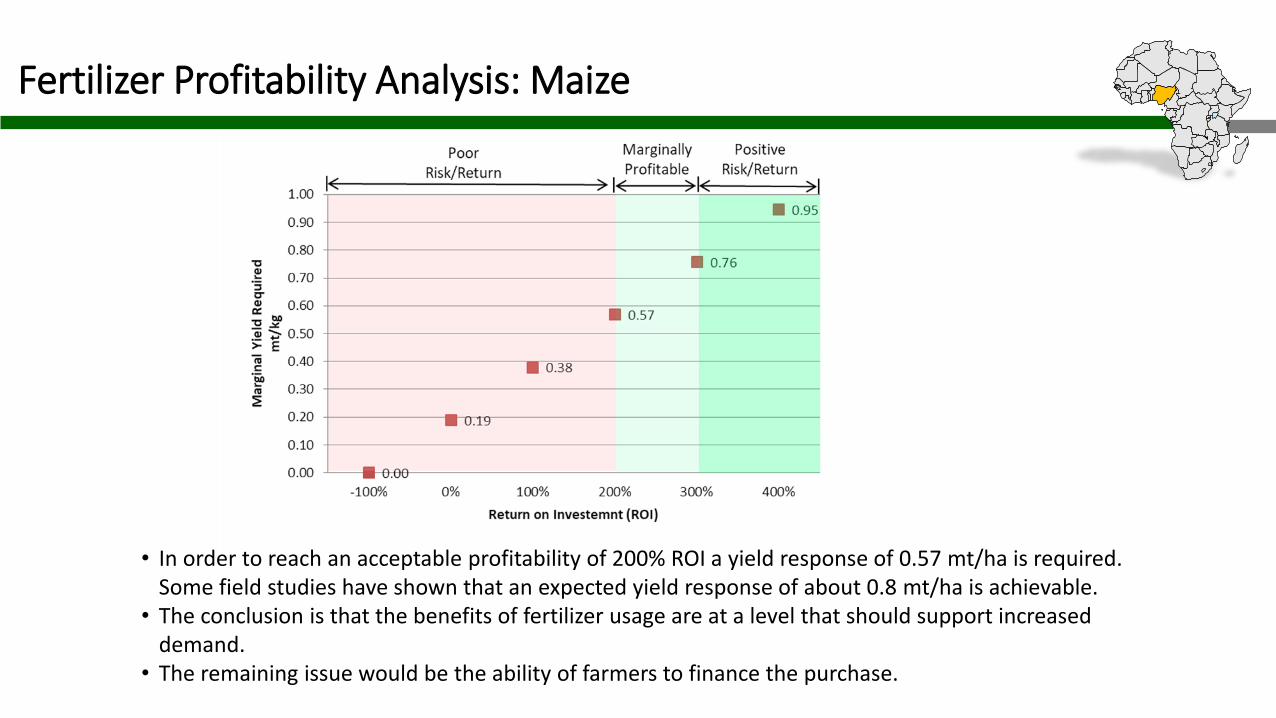
• In order to reach an acceptable profitability of 200% ROI a yield response of 0.57 mt/ha is required. Some field studies have shown that an expected yield response of about 0.8 mt/ha is achievable.
• The conclusion is that the benefits of fertilizer usage are at a level that should support increased demand.
• The remaining issue would be the ability of farmers to finance the purchase.

Fertilizer Profitability Analysis: Rice
• In order to reach an acceptable profitability of 200% ROI a yield response of 0.82 mt/ha is required. Some field studies have shown that an expected yield response of >2 mt/ha is achievable.
• The conclusion is that the benefits of fertilizer usage are at a level that should strongly support increased demand.
• As with maize, the remaining issue would be the ability of farmers to finance the purchase.

Fertilizer Profitability: Summary
• The analyses indicate that profitability should be a positive factor for increasing fertilizer demand with respect to maize and rice in Nigeria.• Use of debt to finance fertilizer purchases introduces another cost that must
be overcome. Obviously, the higher the cost of such financing, the lower the profitability thus reducing potential demand.• Geographic location and infrastructure can have substantial impacts on
profitability. Farms that are distant from centers of end-user demand and are served with poor transport infrastructure get “squeezed” from two directions. The cost of transportation lowers farm gate crop prices and increases input costs.• Profitability is a necessary, but not sufficient element for supporting
increased demand. Funds availability and product knowledge are examples of additional factors that shape final realized demand.

Nigeria Highlights
• High food import bill • Low agriculture productivity• Significant investments in fertilizer and agricultural processing – rice, feed mills, and now
silos• Fertilizer exports growing and by 2019, Nigeria should be a net exporter of fertilzers• Government’s bulk procurement scheme, PFI, tries to subsidize the farmer• On the back of the PFI, there have been investments in old and new blending plants• Fertilizer bill to kick-start fertilizer regulation is in the Upper House• Distributors and blenders are not mature having traditionally targeted Government
subsidies• Transport costs are at an all-time high due to poor condition of port evacuation roads• Significant increase in consumption of fertilizers in 2017. May be an outcome of private
investments and increased farmer income from output price surge• Profitability analysis of the farmer shows good adoption potential• Trade and risk-bearing farmer financing structures are required to support fertilizer growth