Africa Agribusiness Academy (AAA) - WUR eDepot
48
Africa Agribusiness Academy (AAA) Year Report 2014 Hans Nijhoff Simone van Vugt Centre for Development Innovation Wageningen, March 2015
-
Upload
khangminh22 -
Category
Documents
-
view
0 -
download
0
Transcript of Africa Agribusiness Academy (AAA) - WUR eDepot
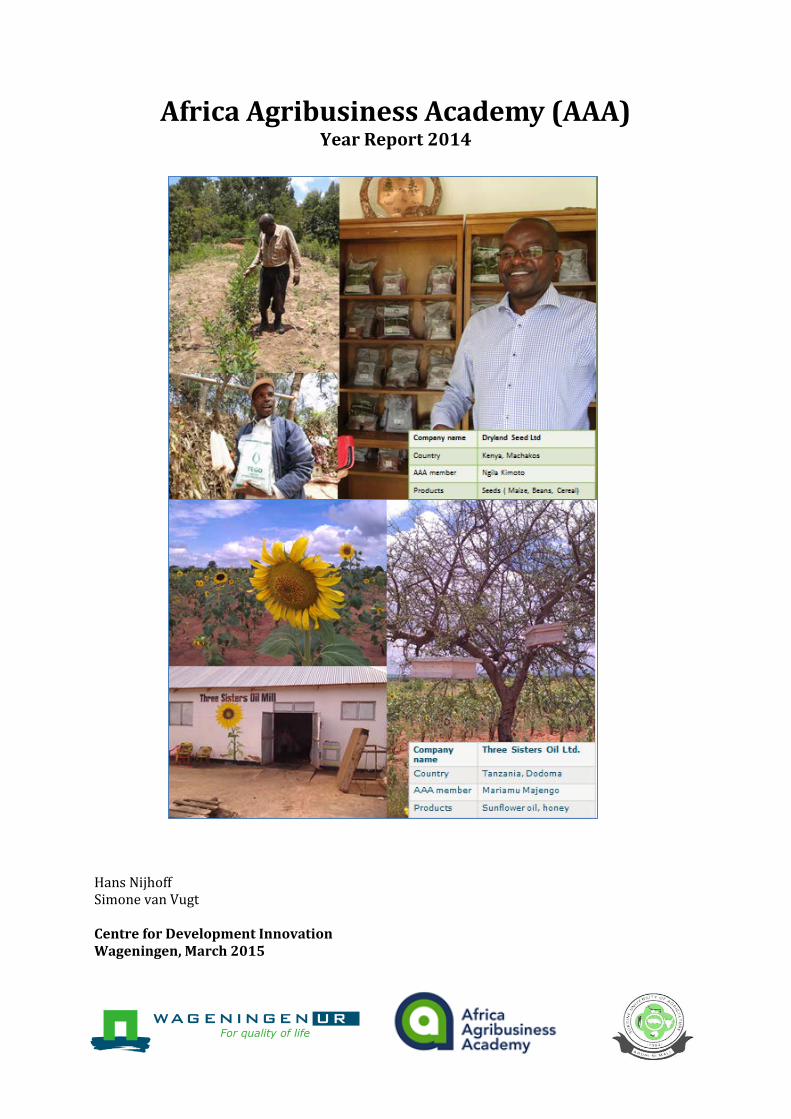
Africa Agribusiness Academy (AAA) Year Report 2014
Hans Nijhoff Simone van Vugt Centre for Development Innovation Wageningen, March 2015
Contents 1. Executive Summary ..................................................................................................................................................... 3 2. Introduction to the report ........................................................................................................................................ 4 3. Status of the Africa Agribusiness Academy ....................................................................................................... 4 4. Introducing the AAA members and their countries ....................................................................................... 5 5. Approach .......................................................................................................................................................................... 8 6. Results ............................................................................................................................................................................. 11 7. Action research ........................................................................................................................................................... 23 8. Outcomes, impact ....................................................................................................................................................... 23 9. Sustainability................................................................................................................................................................ 27 10. Financial report 2014 ............................................................................................................................................ 29 Annex 1: Comparing AAA countries……………………………………………………………………………………….31 Annex 2: Example of CoP plan (CoP Honey)…………………………………………………………………………...33 Annex 3: Example of summary of BC plans in one country (CC Rwanda)…………………………………36 Annex 4: Example of calendar for planning and coordination (CC Rwanda)…………………………….38 Annex 5: Guideline for trainers / coaches of Business plan training………………………………………..40 Annex 6: Sampling strategy…………………………………………………………………………………………………..48 Annex 7: Proposed Policy on financial contribution by AAA members…………………………………….50 Annex 8: Governance structure of AAA………………………………………………………………………………….52 Annex 9: Division of tasks between the SG and the PD for 2015……………………………………………...53
2
1. Executive Summary The Africa Agribusiness Academy (AAA) supports African SME agrifood companies in growing their business. An AAA member companies can enhance knowledge, skills and expertise, and get support in accessing finance and markets. By the end of 2014, AAA had 200 members in five countries: Tanzania, Kenya, Uganda, Ethiopia and Rwanda. These members are in the business of sourcing from or supplying to farmers. AAA’s goal is that by stimulating business growth of the SMEs it indirectly supports business growth of the farmers that are linked to these companies. A conservative estimate is that through its 200 members AAA reached approximately 100,000 farmers. AAA has contributed to the improvement of the SME sector in these countries. In this way AAA contributes to economic growth, improved rural incomes, and food security in Africa. This report provides more insights into who the AAA members are and how they view the progress of AAA. In 2013 AAA management concentrated on building an organizational structure, including legal AAA entities in each country. In 2014 its focus was on establishing and growing its Business Clubs (BCs) and Communities of Practice (CoPs). By the end of 2014 the result was that organizing members took place at a more de-centralized in-country regional level, through regional BCs (rather than at country-level), and with pro-active interaction between BCs and AAA’s content activities (e.g. CoPs, trainings). The AAA CoPs are platforms that develop, structure and share the knowledge and experiences of members. Outcomes of the integration between BC meetings and CoP activities is structured and managed in the AAA Resource centre (RC). In 2014 AAA did not manage to fully professionalize its RC, yet systems were developed to structure such flows and tested at BC level. Various new services were developed after careful needs assessments among members, resulting in three new trainings: Branding & packaging, Inclusive business, and the design and testing of Business growth coaching. The Business plan training meanwhile grew with over 50 members trained and many submitting their business ideas to potential financiers. Rollout of the unique AAA trainings to non-AAA members (public domain) was postponed to early 2015 due to the 2014 focus to consolidate the services to the AAA members first. The AAA Resource portal saw an increase in number of times people visit the portal. Toward the end of 2014, this was about 250 sessions daily. Meanwhile, 67 members have joined the AAA Facebook page, and the AAA Twitter account has 69 followers (of which 23 members). The M&E baseline was implemented with 26 members providing a good zero situation of AAA, with a system in place where Country coordinators monitor output, outcome and impact. Meanwhile, also in 2014, AAA started implementing an 18-month action research on “How does business growth of an SME Agri-Food company benefit the (small-scale) farmers it works with?” In 2014 steps were made to work on the major challenge of AAA: the financial sustainability of the AAA organization after mid-2017, when funding through the Project office stops. In 2014 the initial Policy on financial contribution by AAA members to the AAA organization and activities was designed. The governance structure of AAA became two-sided: the new AAA Secretariat, which focused on Result 1, and the existing AAA Project office, concentrating on Result 2-5.
3
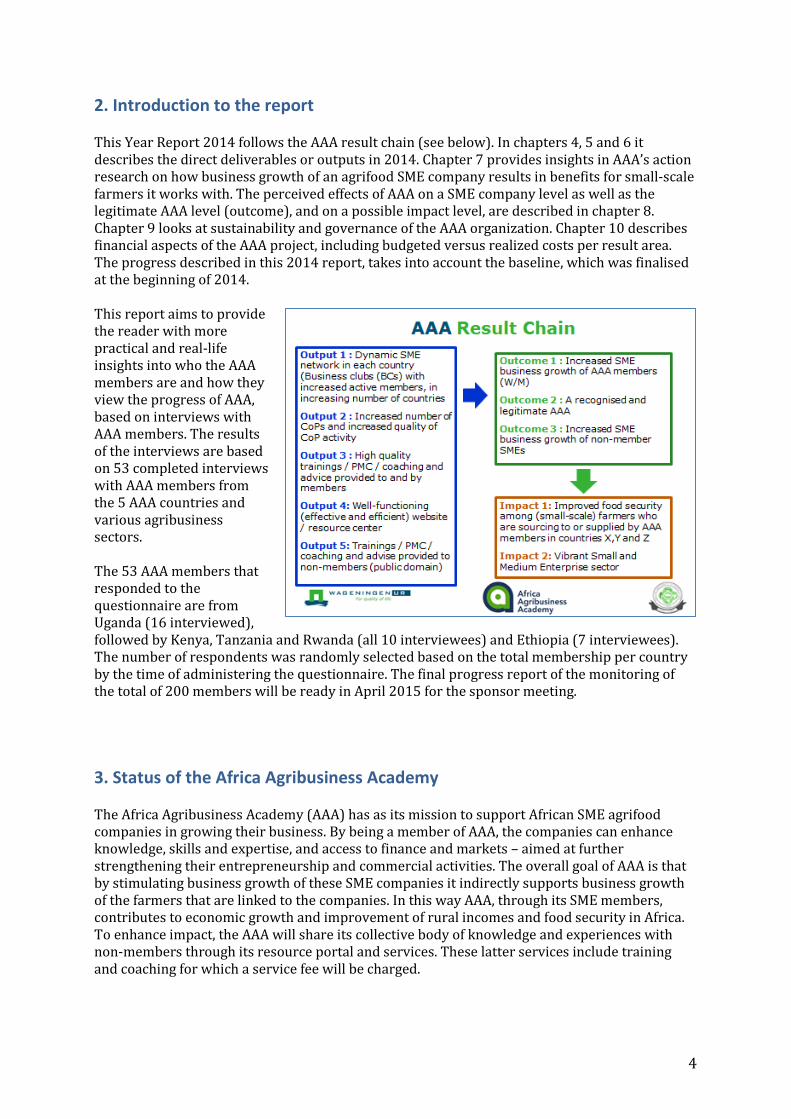
2. Introduction to the report This Year Report 2014 follows the AAA result chain (see below). In chapters 4, 5 and 6 it describes the direct deliverables or outputs in 2014. Chapter 7 provides insights in AAA’s action research on how business growth of an agrifood SME company results in benefits for small-scale farmers it works with. The perceived effects of AAA on a SME company level as well as the legitimate AAA level (outcome), and on a possible impact level, are described in chapter 8. Chapter 9 looks at sustainability and governance of the AAA organization. Chapter 10 describes financial aspects of the AAA project, including budgeted versus realized costs per result area. The progress described in this 2014 report, takes into account the baseline, which was finalised at the beginning of 2014. This report aims to provide the reader with more practical and real-life insights into who the AAA members are and how they view the progress of AAA, based on interviews with AAA members. The results of the interviews are based on 53 completed interviews with AAA members from the 5 AAA countries and various agribusiness sectors. The 53 AAA members that responded to the questionnaire are from Uganda (16 interviewed), followed by Kenya, Tanzania and Rwanda (all 10 interviewees) and Ethiopia (7 interviewees). The number of respondents was randomly selected based on the total membership per country by the time of administering the questionnaire. The final progress report of the monitoring of the total of 200 members will be ready in April 2015 for the sponsor meeting.
3. Status of the Africa Agribusiness Academy The Africa Agribusiness Academy (AAA) has as its mission to support African SME agrifood companies in growing their business. By being a member of AAA, the companies can enhance knowledge, skills and expertise, and access to finance and markets – aimed at further strengthening their entrepreneurship and commercial activities. The overall goal of AAA is that by stimulating business growth of these SME companies it indirectly supports business growth of the farmers that are linked to the companies. In this way AAA, through its SME members, contributes to economic growth and improvement of rural incomes and food security in Africa. To enhance impact, the AAA will share its collective body of knowledge and experiences with non-members through its resource portal and services. These latter services include training and coaching for which a service fee will be charged.
4
At the end of 2014, AAA had 200 members in five countries: Tanzania, Kenya, Uganda, Ethiopia and Rwanda. These are the owners of agrifood SME companies that are either in the business of sourcing from or supplying to farmers. All agrifood sectors are represented in AAA. In 2014 AAA expanded its activities to Rwanda, where a legal AAA entity was established and a core group of AAA members selected. Registration of the Ethiopian chapter however was not yet a success due to bureaucratic procedures. Finding SME companies that wish to join AAA is not difficult; however recruiting members that match the membership profile is. For this reason AAA saw a modest growth in membership in 2014, from 85 to 200 and less than the projected 400. Rather than a focus on membership growth alone, the AAA focus has been on quality and building structures for future sustainability, such as the new Business clubs and CoPs. Whereas in 2013 AAA management concentrated on building an organizational structure (legal AAA entities in each country, Country boards), the focus of 2014 was mainly on development of its Communities of Practice (CoPs), both thematic and sector, and on its Business Clubs (BCs). Also implementation of a framework for financial sustainability – i.e. contribution of members to the costs of AAA activities, was activated. With regard to the institutional sustainability 2014 saw two key developments. The first was the recruitment of the Secretary General (SG), who by the end of 2014, from the secretariat’s base in Kampala, Uganda, was fully operational. The new Secretariat is a clear signal, to its members and sponsors, that AAA is an African organization. The process has started in which it will slowly take over AAA management responsibilities from the Support Project Office. The second key development has been the introduction and reinforcement of the organizational structure of regional Business clubs (BCs), i.e. clusters of AAA member entrepreneurs active in a specific region of the country. Fifteen Business clubs were established, three per country, with an appointed BC leader and operational by the end of 2014. In terms of impact a conservative estimate is that through its 200 members AAA reached approximately 100,000 farmers in the five countries. AAA contributed well to the improvement of the SME sector in these countries of operation. On-going efforts to help grow the business of these members had a positive impact on a percentage of these farmers. A baseline study was carried out to have an idea of the zero-situation at the beginning of 2014. In order to measure progress, a preview been established on the interviews of 53 members the beginning of 2015. A final progress report on the total of 200 members will be available in April 2015.
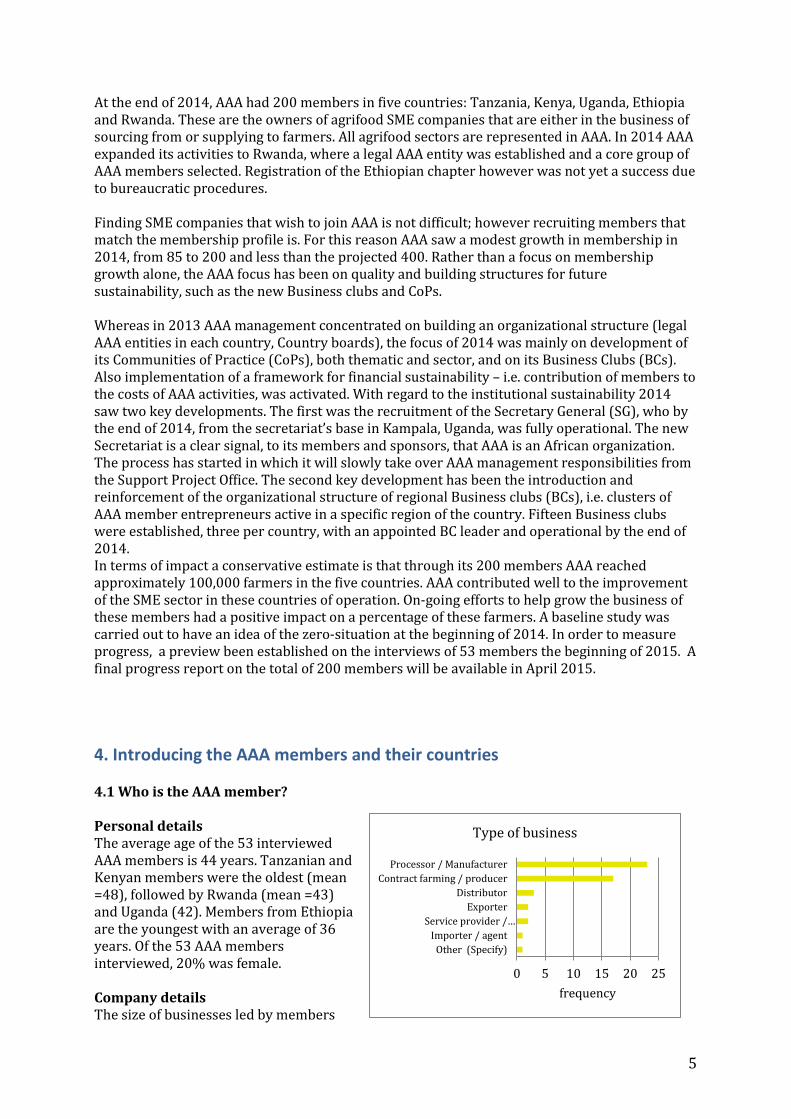
4. Introducing the AAA members and their countries 4.1 Who is the AAA member? Personal details The average age of the 53 interviewed AAA members is 44 years. Tanzanian and Kenyan members were the oldest (mean =48), followed by Rwanda (mean =43) and Uganda (42). Members from Ethiopia are the youngest with an average of 36 years. Of the 53 AAA members interviewed, 20% was female. Company details The size of businesses led by members
0 5 10 15 20 25
Other (Specify)Importer / agent
Service provider /…Exporter
DistributorContract farming / producer
Processor / Manufacturer
frequency
Type of business
5

from the different countries differs strongly. The Kenyan businesses have the largest average annual turnover, followed by Ethiopia and Tanzania. Ugandan businesses had the lowest average turnover. All the members are very open about their turnover. Overall the number of employees of the 53 AAA members ranges between 2 and 150. Ethiopia and Kenya have the highest average number of employees: 47 and 25 respectively. The companies of the AAA members have been established between 1985 and 2015. Most companies were established between 2000 and 2010 (51%), 6% of the companies is older than 15 years and 43% of the companies has been established in the last 5 years. The chart to the right gives an overview of the sectors in which AAA members are active. The sectors are ordered according to their total frequency. Coffee, meat and wheat/grains were the least frequently mentioned (only 2 or 3 times of the 53). In total, food processing was mentioned most frequently (20 times). Other sectors in which members are frequently active are: agri-input supply (9), honey (8), dairy (8) and fruit (6). In the “other” category are companies that work on: food oil processing, agro-tourism and fish. 8 of the AAA members have companies that represents a mix of different types of businesses. The majority of the AAA members are processors/manufacturers (23 of the 53), followed by producers/ contract farmers (17) and distributors (3). The “other” category here represents one AAA member that is a supplier and is not in any of the other types of businesses. During the M&E baseline study, processors and producers were also the main categories for members in both the pilot and up-scaling phase. Most of the 53 companies source their inputs from small-scale farmers (60%). The definition of “small” varies per sector and type of business, but in this questionnaire it was mentioned that farmers with 1-5 acres of land, 1-5 cows, up to 10 pigs or up to 50 chickens were considered as small scale. Medium-scale
262,976 234,230
439,268
250,589 338,857
Tanzania Uganda Kenya Rwanda Ethiopia
Average turnover in USD
01020304050
Tanzania Uganda Kenya Rwanda Ethiopia
Average number of employees
0 5 10 15 20 25
CoffeeMeat
Wheat/GainsSpicesOther
PoultrySeed
VegetableFruit
DairyHoney
Agri-input supplyFood processing
frequency
Sectors in which members are active
Brokers 4% Medium
scale farmers
17% Large scale
farmers 6%
Other 13%
Smallscale farmers
60%
Type of suppliers
6
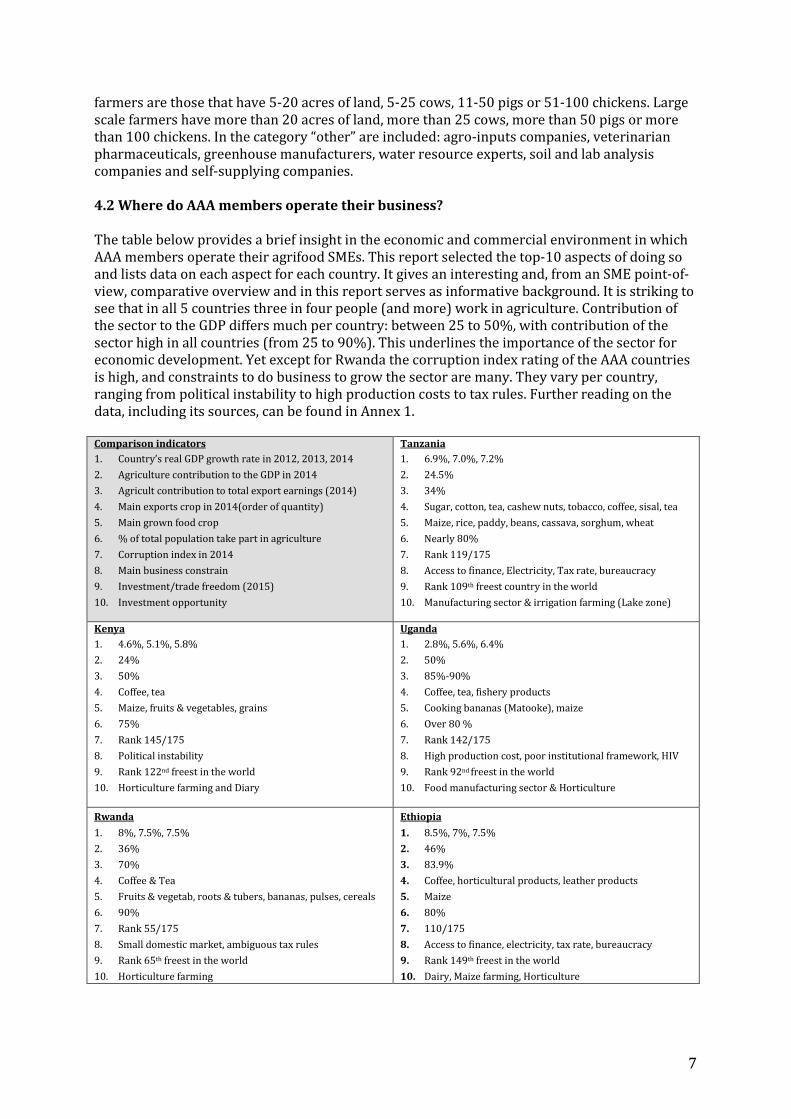
farmers are those that have 5-20 acres of land, 5-25 cows, 11-50 pigs or 51-100 chickens. Large scale farmers have more than 20 acres of land, more than 25 cows, more than 50 pigs or more than 100 chickens. In the category “other” are included: agro-inputs companies, veterinarian pharmaceuticals, greenhouse manufacturers, water resource experts, soil and lab analysis companies and self-supplying companies. 4.2 Where do AAA members operate their business? The table below provides a brief insight in the economic and commercial environment in which AAA members operate their agrifood SMEs. This report selected the top-10 aspects of doing so and lists data on each aspect for each country. It gives an interesting and, from an SME point-of-view, comparative overview and in this report serves as informative background. It is striking to see that in all 5 countries three in four people (and more) work in agriculture. Contribution of the sector to the GDP differs much per country: between 25 to 50%, with contribution of the sector high in all countries (from 25 to 90%). This underlines the importance of the sector for economic development. Yet except for Rwanda the corruption index rating of the AAA countries is high, and constraints to do business to grow the sector are many. They vary per country, ranging from political instability to high production costs to tax rules. Further reading on the data, including its sources, can be found in Annex 1. Comparison indicators 1. Country’s real GDP growth rate in 2012, 2013, 2014 2. Agriculture contribution to the GDP in 2014 3. Agricult contribution to total export earnings (2014) 4. Main exports crop in 2014(order of quantity) 5. Main grown food crop 6. % of total population take part in agriculture 7. Corruption index in 2014 8. Main business constrain 9. Investment/trade freedom (2015) 10. Investment opportunity
Tanzania 1. 6.9%, 7.0%, 7.2% 2. 24.5% 3. 34% 4. Sugar, cotton, tea, cashew nuts, tobacco, coffee, sisal, tea 5. Maize, rice, paddy, beans, cassava, sorghum, wheat 6. Nearly 80% 7. Rank 119/175 8. Access to finance, Electricity, Tax rate, bureaucracy 9. Rank 109th freest country in the world 10. Manufacturing sector & irrigation farming (Lake zone)
Kenya 1. 4.6%, 5.1%, 5.8% 2. 24% 3. 50% 4. Coffee, tea 5. Maize, fruits & vegetables, grains 6. 75% 7. Rank 145/175 8. Political instability 9. Rank 122nd freest in the world 10. Horticulture farming and Diary
Uganda 1. 2.8%, 5.6%, 6.4% 2. 50% 3. 85%-90% 4. Coffee, tea, fishery products 5. Cooking bananas (Matooke), maize 6. Over 80 % 7. Rank 142/175 8. High production cost, poor institutional framework, HIV 9. Rank 92nd freest in the world 10. Food manufacturing sector & Horticulture
Rwanda 1. 8%, 7.5%, 7.5% 2. 36% 3. 70% 4. Coffee & Tea 5. Fruits & vegetab, roots & tubers, bananas, pulses, cereals 6. 90% 7. Rank 55/175 8. Small domestic market, ambiguous tax rules 9. Rank 65th freest in the world 10. Horticulture farming
Ethiopia 1. 8.5%, 7%, 7.5% 2. 46% 3. 83.9% 4. Coffee, horticultural products, leather products 5. Maize 6. 80% 7. 110/175 8. Access to finance, electricity, tax rate, bureaucracy 9. Rank 149th freest in the world 10. Dairy, Maize farming, Horticulture
7
5. Approach 5.1 Professionalizing AAA In 2014 much effort went to further professionalize building blocks of AAA’s approach to achieve results. Among others these were: Country chapters as well as the Pan Africa organization are legally established as local Ltd.’s – except for the AAA Ethiopia Country chapter where due to lengthy procedures this has not yet been achieved. Being a legal entity gives Country chapters the means to officially operate, present itself, collect membership fees etc. It is the most basic building block, which forms a fundament for rollout of activities. Country chapters require a lean organization. For members to be attracted to AAA’s offering, 2014 was the year in which a shift was made from Country-level organization to in-country regional Business club-level organizational structures. Additional local support staff was hired and trained, and by the end of 2014 the AAA project organization operated as a professional and flexible cross-country team. Staff included the new Secretary General, Country coordinators (1 per country), an action- researcher, a communication officer, a Pan-Africa accountant and assistant at the Secretariat. All staff are qualified, work with clear job descriptions and have good understanding of their role within the overall AAA context. The support staffs are critical for coordinating and implementing the growing number of activities that aim at business growth of its members. AAA recruited mostly young professional women to fill the vacancies through which AAA is contributing also to develop young professionals in the agribusiness sectors. All staff has been trained and coached on-the-job, by colleagues, management and CDI staff. Often trainings took place through group trainings to ensure that besides skills training also team building was achieved. ‘Knowing your colleagues’ from each of the AAA countries and being able to rely on good communication between one another has proven to be as vital as skills. At the end of 2014 this resulted in a solid team of AAA support staff, all knowing each other well, having similar skills and formats, and that work through Whatsapp groups and other means of fast communication. Finance and administrative tasks were developed further, put in place in each country, and streamlined into one system that is linked to CDI and tailor made for AAA. The tasks are carried out by the Country coordinators, which were formerly known as Country assistants. To achieve the streamlining, various trainings were provided by CDI’s financial support person that is dedicated by CDI to the AAA project. To ensure good overall insight in the project and to steer Country coordinators to implement the system, the Arusha-based Project office has hired and trained an overall AAA Finance and administration officer. She acts as the local right hand of the CDI person and reports directly to the Project director. The financial system, as building block, ensures a well-controlled flow of funds to support its activities. To ensure transparency and steering a CDI-managed pre-audit on money flows, accountability and financial reporting was carried out in each country in the end of 2014, including at Pan Africa level. At the same time the Uganda, Tanzania and Kenya Country chapters prepared for and implemented national audits, carried out by local auditors, ensuring AAA compliance to national legislation. The financial system brings control and risk-reduction mechanisms into the flow of funds, and supports financial reporting to sponsors. Content is naturally the most critical building block of all. To persuade entrepreneurs to invest time and money in a platform requires carefully developing and making available tailor-made content. In 2014 AAA began to work with clear guidelines that were developed on levels of member contribution to trainings, events and other activities. And, to make this feasible, choices
8
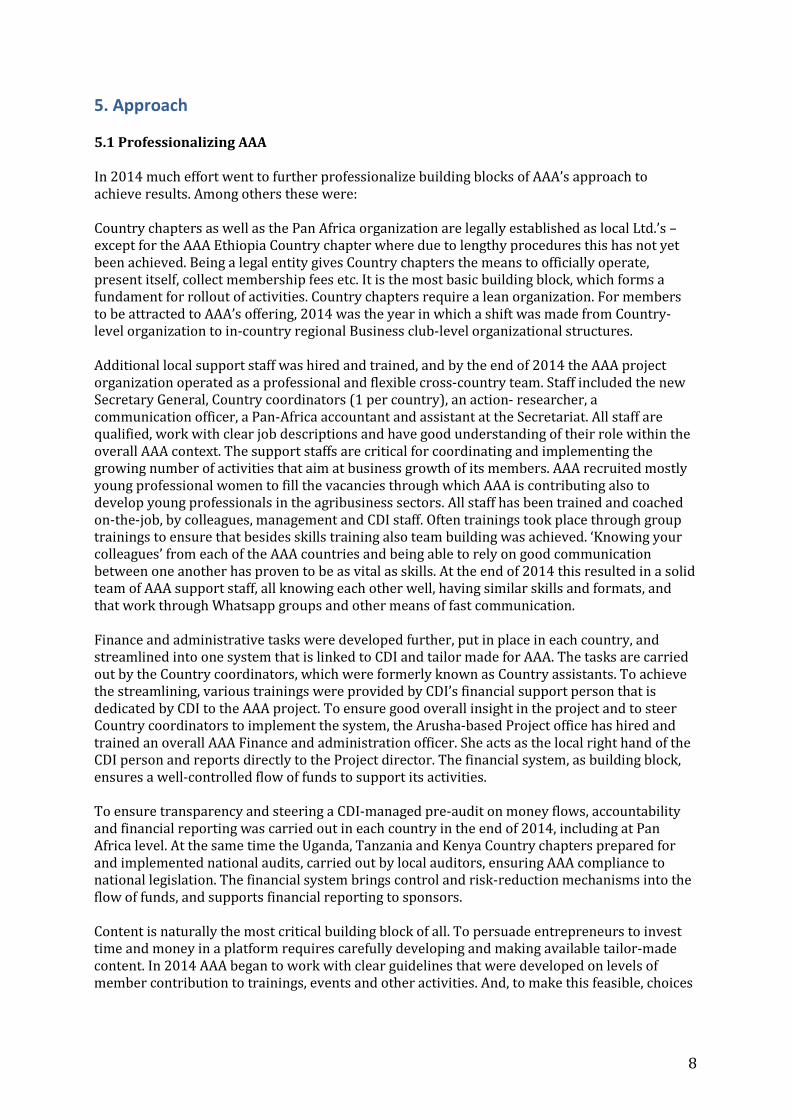
were made on what content to develop, organize and offer to members and what not (more on financial sustainability in chapter 9). 5.2 Business clubs: decentralizing AAA activities Business Clubs (BCs) were established in 2014 as a logical next step in developing the organizational structure of the County Chapters. Initially the Country chapters started with a small group of founding members at the national chapter level. With the increasing number of members it was decided to set up a decentralized structure of BCs aimed at bringing AAA close to its members, and its members closer to other members. This concept was discussed during a special Country chapter and Community of Practice (CoP) leaders meeting in Arusha (March 2014). The result of the meeting was that a) organization of members should take place at a more de-centralized in-country regional level, in the form of regional AAA Business clubs (BC), and less on a country-level; and, in doing so b) creating pro-active intersections between these BCs and AAA’s content creation and offering, such as by the CoPs and through trainings, needed to get full attention in 2014. The meeting resulted with agreement on the following approach:
The figure shows the creation of Business clubs (BC) at country level, including the focus of activities of the BC’s: networking among members; contributing to thematic knowledge creation and sharing, including structured interaction with CoPs; and trainings by (external) experts and trainers on topics for SME business growth. 5.3 CoP interaction with Business clubs The CoPs of AAA are the platforms that develop, structure and share the knowledge and experiences of AAA members. They act as pro-active think tanks. CoP activities and outputs are meant to provide directions to AAA members on how to grow their business. AAA works with Thematic and Sector CoPs. The first category concentrates on hands-on knowledge on cross-country and cross-sector knowledge, such as ‘how to access finance for growing your business?’ The latter category is cross-country as well, yet brings together members from a specific sector, for example from the dairy sector. In this CoP Dairy, members doing business in that sector are
9
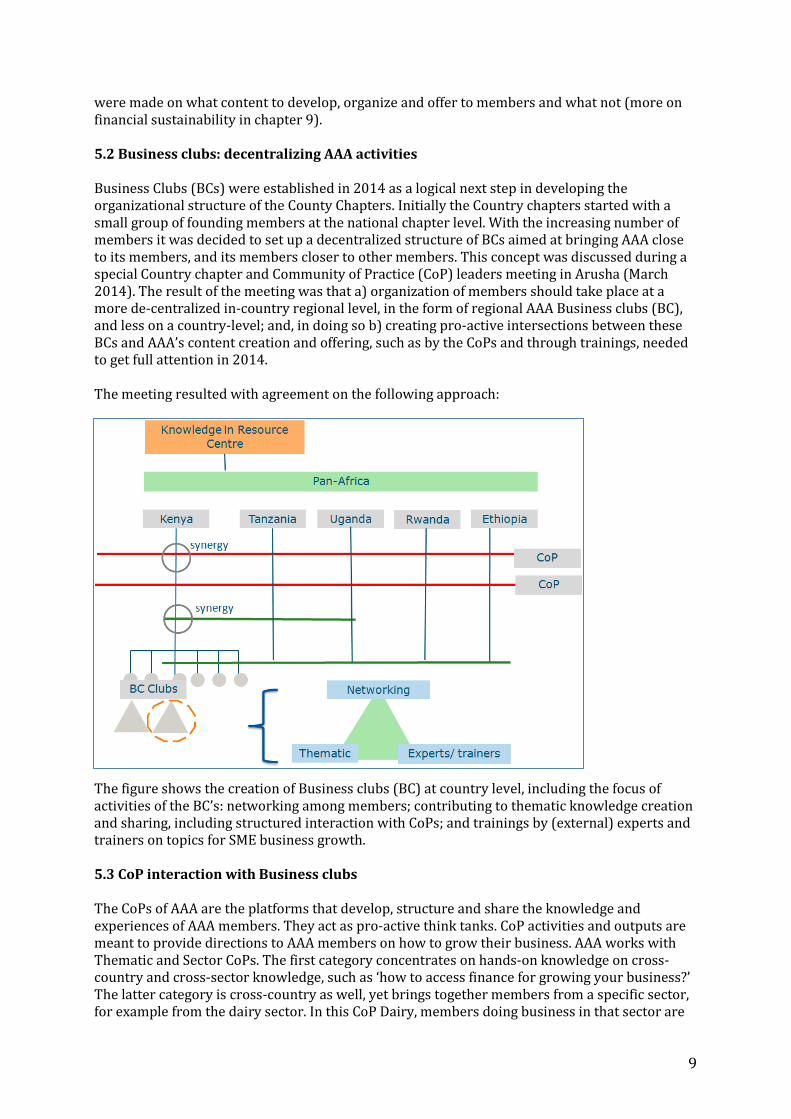
invited to join and share knowledge, experiences, networks, technologies etc. It is as such more of a sector-specific business community that sees each other as colleagues rather than competitors. Bringing these CoPs closer to BC members was a key conclusion of the Arusha meeting (see figure above: creating synergy). Ensuring a well-planned and managed flow from CoPs to BC members, and back, became a key goal in 2014. Activities as a follow up on the Arusha meeting resulted in integrated BC and CoP plans. The integration between BC meetings and CoP activities, and how knowledge generated from such integration will be structured and managed in the AAA Resource centre, is shown in the figure below.
The figure gives a practical insight in the new integrated approach as agreed upon in the Arusha meeting. Like with all BC’s, the AAA members of BC Arua, Uganda, meet between 8-12 times per year. During an upcoming meeting it has chosen to: invite a CoP speaker, let us say from CoP P4P, who explains how each member in the Arua zone – from fruit processor to seed supplier – may benefit from the CoP P4P. For example how this CoP already has structured experiences on technologies or Dutch partnerships from fruit processors and seed suppliers from other BC’s. The CoP representative will explain how this knowledge can be shared, and ensures that experiences relevant to the CoP P4P are collected from Arua members. In turn, the CoP enriches insights from the BC by exchanging with other CoP members and finding new information, and brings it back to the BCs. In 2014 the focus of CoP activities has been on laying the groundwork for collecting and sharing information, from members for members. To ensure inter-linkage between activity plans for CoPs (5 plans) and BCs (20 plans) and CCs (5 plans) much time and effort went to organizing and supporting this planning process. As a result, 30 integrated activity plans for 2015 were prepared by BC, CC and CoP leaders by the end of 2014.
10
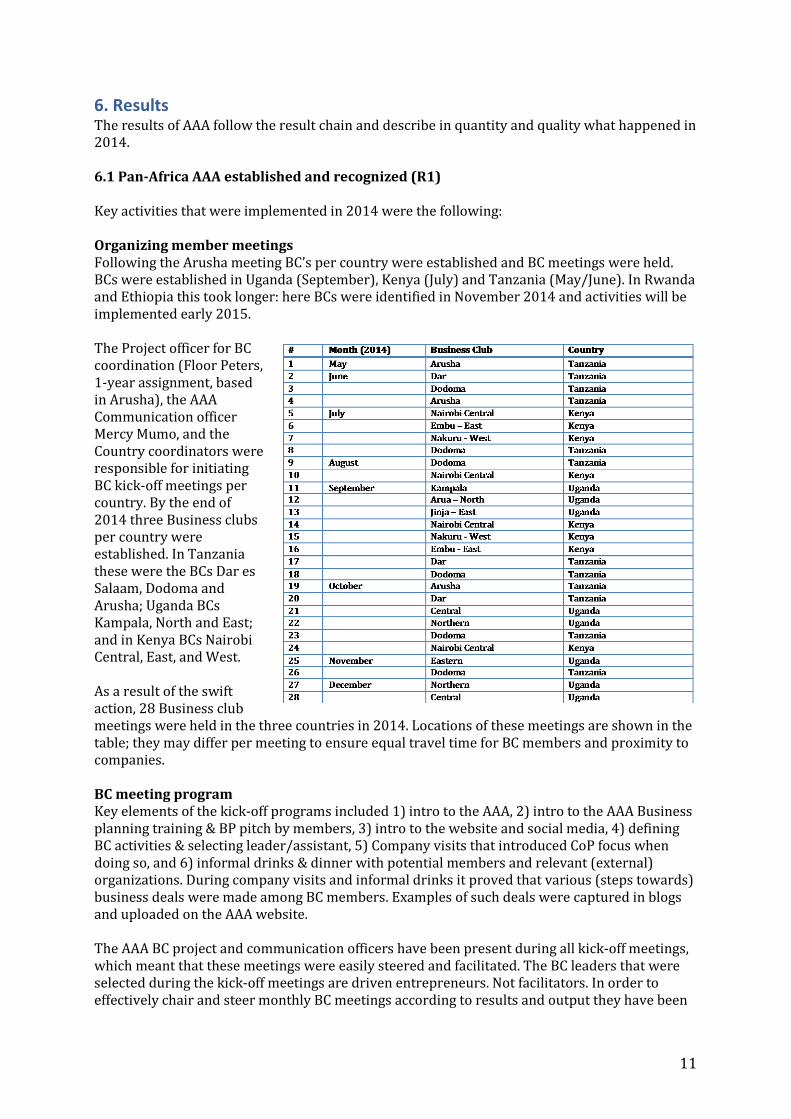
6. Results The results of AAA follow the result chain and describe in quantity and quality what happened in 2014. 6.1 Pan-Africa AAA established and recognized (R1) Key activities that were implemented in 2014 were the following: Organizing member meetings Following the Arusha meeting BC’s per country were established and BC meetings were held. BCs were established in Uganda (September), Kenya (July) and Tanzania (May/June). In Rwanda and Ethiopia this took longer: here BCs were identified in November 2014 and activities will be implemented early 2015. The Project officer for BC coordination (Floor Peters, 1-year assignment, based in Arusha), the AAA Communication officer Mercy Mumo, and the Country coordinators were responsible for initiating BC kick-off meetings per country. By the end of 2014 three Business clubs per country were established. In Tanzania these were the BCs Dar es Salaam, Dodoma and Arusha; Uganda BCs Kampala, North and East; and in Kenya BCs Nairobi Central, East, and West. As a result of the swift action, 28 Business club meetings were held in the three countries in 2014. Locations of these meetings are shown in the table; they may differ per meeting to ensure equal travel time for BC members and proximity to companies. BC meeting program Key elements of the kick-off programs included 1) intro to the AAA, 2) intro to the AAA Business planning training & BP pitch by members, 3) intro to the website and social media, 4) defining BC activities & selecting leader/assistant, 5) Company visits that introduced CoP focus when doing so, and 6) informal drinks & dinner with potential members and relevant (external) organizations. During company visits and informal drinks it proved that various (steps towards) business deals were made among BC members. Examples of such deals were captured in blogs and uploaded on the AAA website. The AAA BC project and communication officers have been present during all kick-off meetings, which meant that these meetings were easily steered and facilitated. The BC leaders that were selected during the kick-off meetings are driven entrepreneurs. Not facilitators. In order to effectively chair and steer monthly BC meetings according to results and output they have been
11
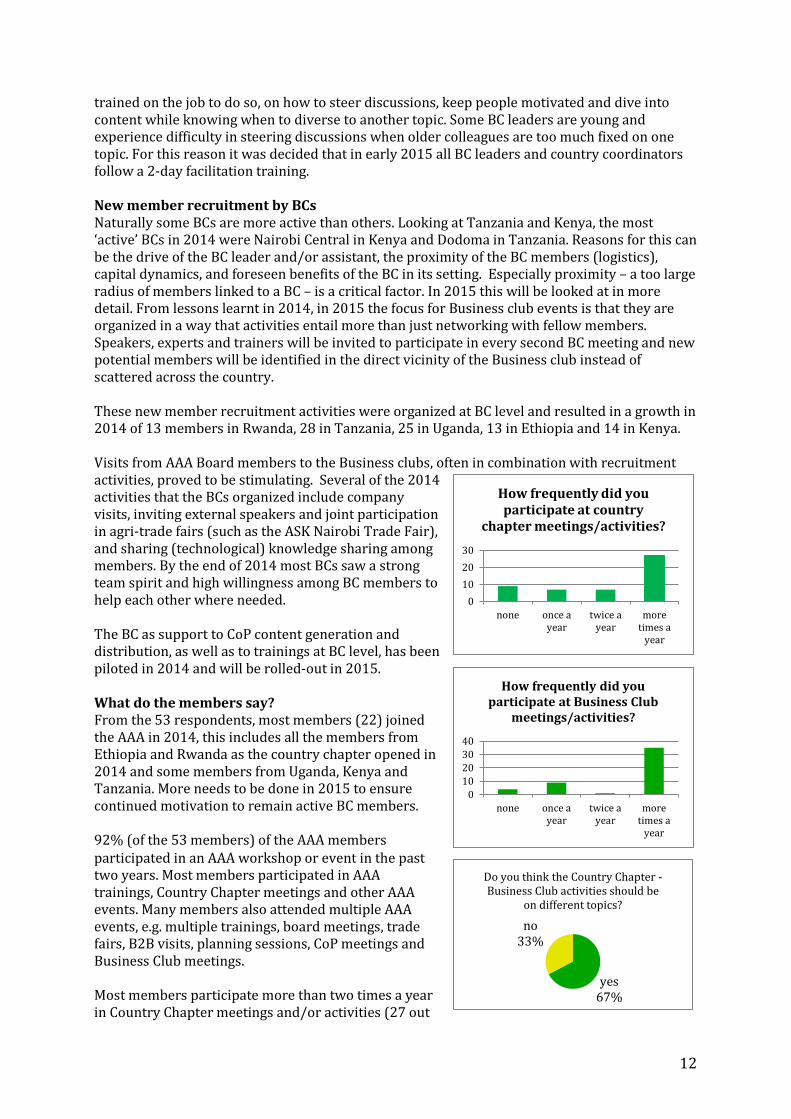
trained on the job to do so, on how to steer discussions, keep people motivated and dive into content while knowing when to diverse to another topic. Some BC leaders are young and experience difficulty in steering discussions when older colleagues are too much fixed on one topic. For this reason it was decided that in early 2015 all BC leaders and country coordinators follow a 2-day facilitation training. New member recruitment by BCs Naturally some BCs are more active than others. Looking at Tanzania and Kenya, the most ‘active’ BCs in 2014 were Nairobi Central in Kenya and Dodoma in Tanzania. Reasons for this can be the drive of the BC leader and/or assistant, the proximity of the BC members (logistics), capital dynamics, and foreseen benefits of the BC in its setting. Especially proximity – a too large radius of members linked to a BC – is a critical factor. In 2015 this will be looked at in more detail. From lessons learnt in 2014, in 2015 the focus for Business club events is that they are organized in a way that activities entail more than just networking with fellow members. Speakers, experts and trainers will be invited to participate in every second BC meeting and new potential members will be identified in the direct vicinity of the Business club instead of scattered across the country. These new member recruitment activities were organized at BC level and resulted in a growth in 2014 of 13 members in Rwanda, 28 in Tanzania, 25 in Uganda, 13 in Ethiopia and 14 in Kenya. Visits from AAA Board members to the Business clubs, often in combination with recruitment activities, proved to be stimulating. Several of the 2014 activities that the BCs organized include company visits, inviting external speakers and joint participation in agri-trade fairs (such as the ASK Nairobi Trade Fair), and sharing (technological) knowledge sharing among members. By the end of 2014 most BCs saw a strong team spirit and high willingness among BC members to help each other where needed. The BC as support to CoP content generation and distribution, as well as to trainings at BC level, has been piloted in 2014 and will be rolled-out in 2015. What do the members say? From the 53 respondents, most members (22) joined the AAA in 2014, this includes all the members from Ethiopia and Rwanda as the country chapter opened in 2014 and some members from Uganda, Kenya and Tanzania. More needs to be done in 2015 to ensure continued motivation to remain active BC members. 92% (of the 53 members) of the AAA members participated in an AAA workshop or event in the past two years. Most members participated in AAA trainings, Country Chapter meetings and other AAA events. Many members also attended multiple AAA events, e.g. multiple trainings, board meetings, trade fairs, B2B visits, planning sessions, CoP meetings and Business Club meetings. Most members participate more than two times a year in Country Chapter meetings and/or activities (27 out
0102030
none once ayear
twice ayear
moretimes a
year
How frequently did you participate at country
chapter meetings/activities?
010203040
none once ayear
twice ayear
moretimes a
year
How frequently did you participate at Business Club
meetings/activities?
yes 67%
no 33%
Do you think the Country Chapter - Business Club activities should be
on different topics?
12
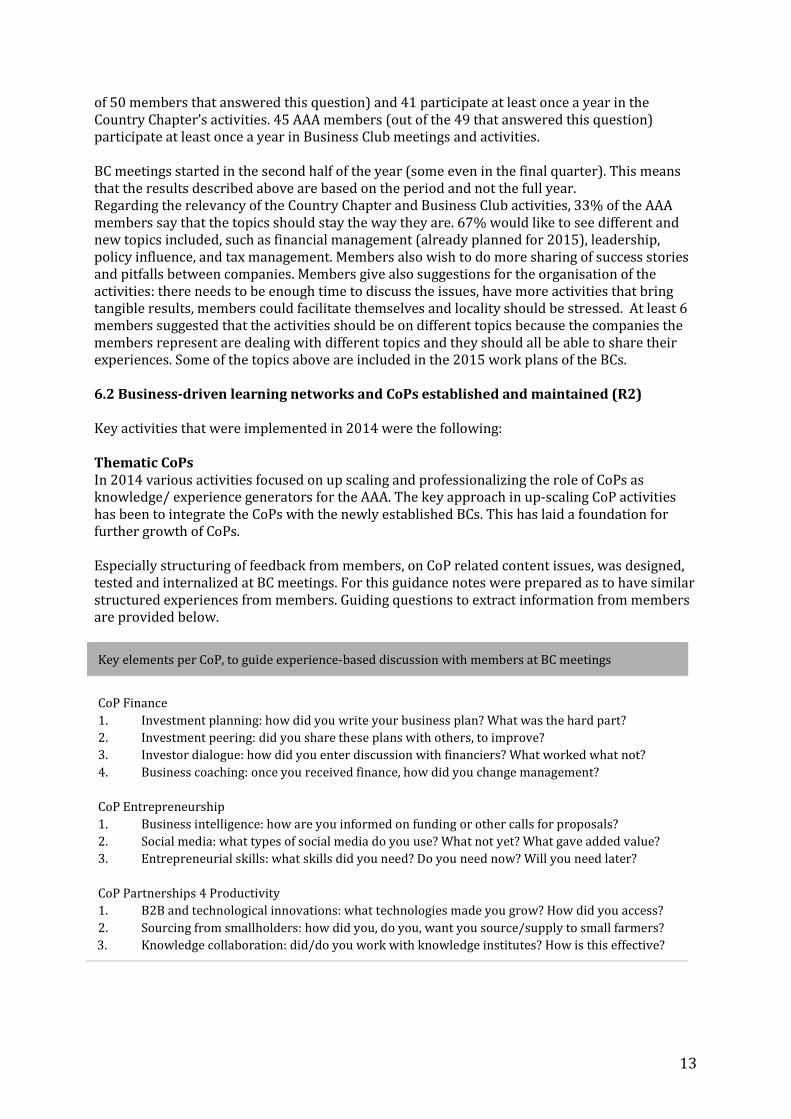
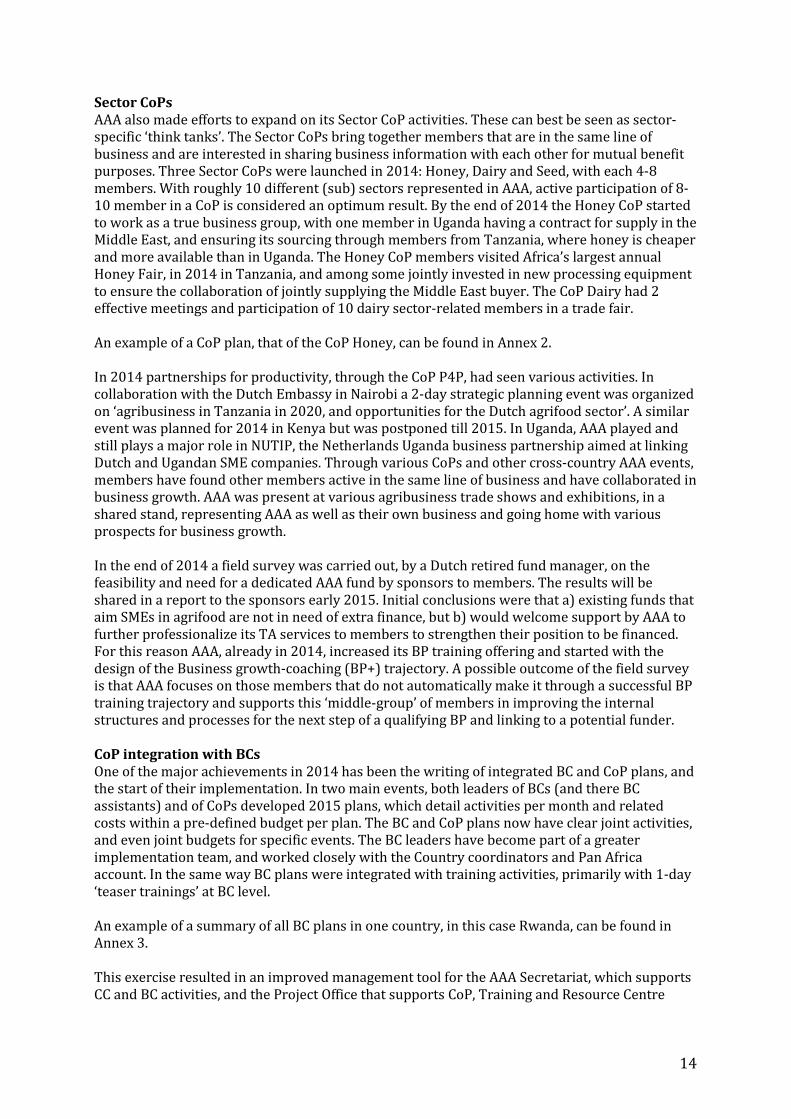
of 50 members that answered this question) and 41 participate at least once a year in the Country Chapter’s activities. 45 AAA members (out of the 49 that answered this question) participate at least once a year in Business Club meetings and activities. BC meetings started in the second half of the year (some even in the final quarter). This means that the results described above are based on the period and not the full year. Regarding the relevancy of the Country Chapter and Business Club activities, 33% of the AAA members say that the topics should stay the way they are. 67% would like to see different and new topics included, such as financial management (already planned for 2015), leadership, policy influence, and tax management. Members also wish to do more sharing of success stories and pitfalls between companies. Members give also suggestions for the organisation of the activities: there needs to be enough time to discuss the issues, have more activities that bring tangible results, members could facilitate themselves and locality should be stressed. At least 6 members suggested that the activities should be on different topics because the companies the members represent are dealing with different topics and they should all be able to share their experiences. Some of the topics above are included in the 2015 work plans of the BCs. 6.2 Business-driven learning networks and CoPs established and maintained (R2) Key activities that were implemented in 2014 were the following: Thematic CoPs In 2014 various activities focused on up scaling and professionalizing the role of CoPs as knowledge/ experience generators for the AAA. The key approach in up-scaling CoP activities has been to integrate the CoPs with the newly established BCs. This has laid a foundation for further growth of CoPs. Especially structuring of feedback from members, on CoP related content issues, was designed, tested and internalized at BC meetings. For this guidance notes were prepared as to have similar structured experiences from members. Guiding questions to extract information from members are provided below.
Key elements per CoP, to guide experience-based discussion with members at BC meetings
CoP Finance 1. Investment planning: how did you write your business plan? What was the hard part? 2. Investment peering: did you share these plans with others, to improve? 3. Investor dialogue: how did you enter discussion with financiers? What worked what not? 4. Business coaching: once you received finance, how did you change management?
CoP Entrepreneurship 1. Business intelligence: how are you informed on funding or other calls for proposals? 2. Social media: what types of social media do you use? What not yet? What gave added value? 3. Entrepreneurial skills: what skills did you need? Do you need now? Will you need later? CoP Partnerships 4 Productivity 1. B2B and technological innovations: what technologies made you grow? How did you access? 2. Sourcing from smallholders: how did you, do you, want you source/supply to small farmers?
3. Knowledge collaboration: did/do you work with knowledge institutes? How is this effective?
13
Sector CoPs AAA also made efforts to expand on its Sector CoP activities. These can best be seen as sector-specific ‘think tanks’. The Sector CoPs bring together members that are in the same line of business and are interested in sharing business information with each other for mutual benefit purposes. Three Sector CoPs were launched in 2014: Honey, Dairy and Seed, with each 4-8 members. With roughly 10 different (sub) sectors represented in AAA, active participation of 8-10 member in a CoP is considered an optimum result. By the end of 2014 the Honey CoP started to work as a true business group, with one member in Uganda having a contract for supply in the Middle East, and ensuring its sourcing through members from Tanzania, where honey is cheaper and more available than in Uganda. The Honey CoP members visited Africa’s largest annual Honey Fair, in 2014 in Tanzania, and among some jointly invested in new processing equipment to ensure the collaboration of jointly supplying the Middle East buyer. The CoP Dairy had 2 effective meetings and participation of 10 dairy sector-related members in a trade fair. An example of a CoP plan, that of the CoP Honey, can be found in Annex 2. In 2014 partnerships for productivity, through the CoP P4P, had seen various activities. In collaboration with the Dutch Embassy in Nairobi a 2-day strategic planning event was organized on ‘agribusiness in Tanzania in 2020, and opportunities for the Dutch agrifood sector’. A similar event was planned for 2014 in Kenya but was postponed till 2015. In Uganda, AAA played and still plays a major role in NUTIP, the Netherlands Uganda business partnership aimed at linking Dutch and Ugandan SME companies. Through various CoPs and other cross-country AAA events, members have found other members active in the same line of business and have collaborated in business growth. AAA was present at various agribusiness trade shows and exhibitions, in a shared stand, representing AAA as well as their own business and going home with various prospects for business growth. In the end of 2014 a field survey was carried out, by a Dutch retired fund manager, on the feasibility and need for a dedicated AAA fund by sponsors to members. The results will be shared in a report to the sponsors early 2015. Initial conclusions were that a) existing funds that aim SMEs in agrifood are not in need of extra finance, but b) would welcome support by AAA to further professionalize its TA services to members to strengthen their position to be financed. For this reason AAA, already in 2014, increased its BP training offering and started with the design of the Business growth-coaching (BP+) trajectory. A possible outcome of the field survey is that AAA focuses on those members that do not automatically make it through a successful BP training trajectory and supports this ‘middle-group’ of members in improving the internal structures and processes for the next step of a qualifying BP and linking to a potential funder. CoP integration with BCs One of the major achievements in 2014 has been the writing of integrated BC and CoP plans, and the start of their implementation. In two main events, both leaders of BCs (and there BC assistants) and of CoPs developed 2015 plans, which detail activities per month and related costs within a pre-defined budget per plan. The BC and CoP plans now have clear joint activities, and even joint budgets for specific events. The BC leaders have become part of a greater implementation team, and worked closely with the Country coordinators and Pan Africa account. In the same way BC plans were integrated with training activities, primarily with 1-day ‘teaser trainings’ at BC level. An example of a summary of all BC plans in one country, in this case Rwanda, can be found in Annex 3. This exercise resulted in an improved management tool for the AAA Secretariat, which supports CC and BC activities, and the Project Office that supports CoP, Training and Resource Centre
14
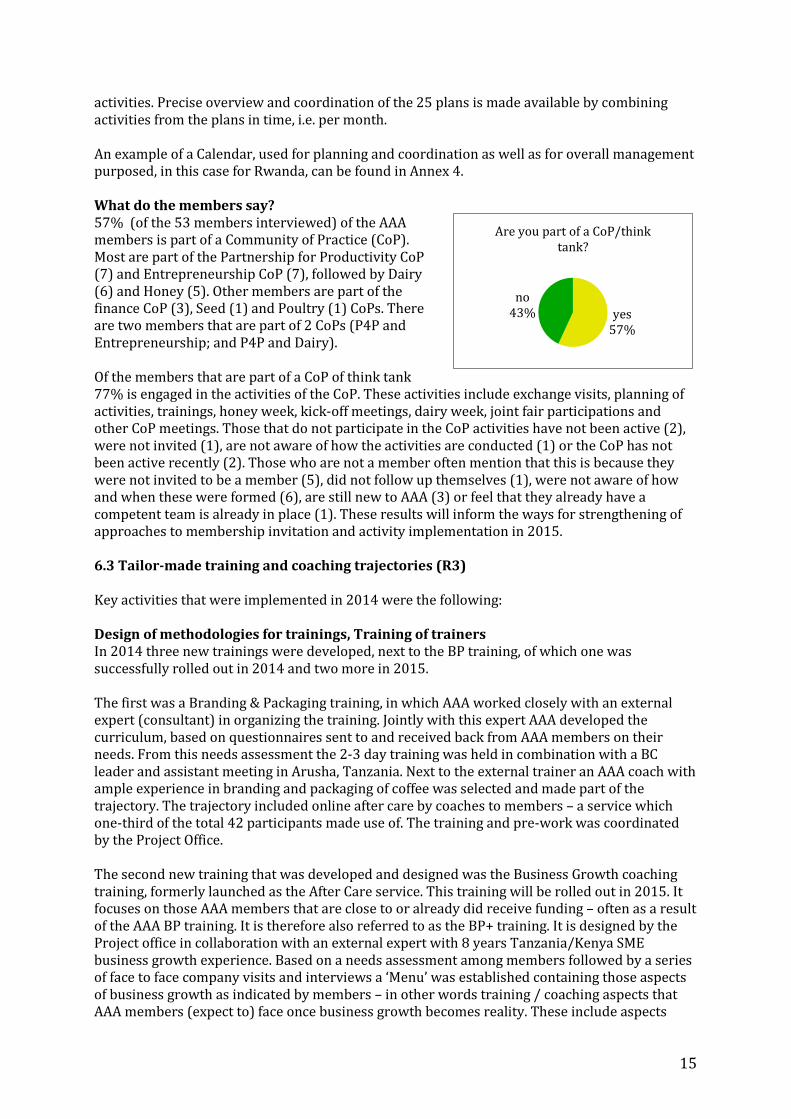
activities. Precise overview and coordination of the 25 plans is made available by combining activities from the plans in time, i.e. per month. An example of a Calendar, used for planning and coordination as well as for overall management purposed, in this case for Rwanda, can be found in Annex 4. What do the members say? 57% (of the 53 members interviewed) of the AAA members is part of a Community of Practice (CoP). Most are part of the Partnership for Productivity CoP (7) and Entrepreneurship CoP (7), followed by Dairy (6) and Honey (5). Other members are part of the finance CoP (3), Seed (1) and Poultry (1) CoPs. There are two members that are part of 2 CoPs (P4P and Entrepreneurship; and P4P and Dairy). Of the members that are part of a CoP of think tank 77% is engaged in the activities of the CoP. These activities include exchange visits, planning of activities, trainings, honey week, kick-off meetings, dairy week, joint fair participations and other CoP meetings. Those that do not participate in the CoP activities have not been active (2), were not invited (1), are not aware of how the activities are conducted (1) or the CoP has not been active recently (2). Those who are not a member often mention that this is because they were not invited to be a member (5), did not follow up themselves (1), were not aware of how and when these were formed (6), are still new to AAA (3) or feel that they already have a competent team is already in place (1). These results will inform the ways for strengthening of approaches to membership invitation and activity implementation in 2015. 6.3 Tailor-made training and coaching trajectories (R3) Key activities that were implemented in 2014 were the following: Design of methodologies for trainings, Training of trainers In 2014 three new trainings were developed, next to the BP training, of which one was successfully rolled out in 2014 and two more in 2015. The first was a Branding & Packaging training, in which AAA worked closely with an external expert (consultant) in organizing the training. Jointly with this expert AAA developed the curriculum, based on questionnaires sent to and received back from AAA members on their needs. From this needs assessment the 2-3 day training was held in combination with a BC leader and assistant meeting in Arusha, Tanzania. Next to the external trainer an AAA coach with ample experience in branding and packaging of coffee was selected and made part of the trajectory. The trajectory included online after care by coaches to members – a service which one-third of the total 42 participants made use of. The training and pre-work was coordinated by the Project Office. The second new training that was developed and designed was the Business Growth coaching training, formerly launched as the After Care service. This training will be rolled out in 2015. It focuses on those AAA members that are close to or already did receive funding – often as a result of the AAA BP training. It is therefore also referred to as the BP+ training. It is designed by the Project office in collaboration with an external expert with 8 years Tanzania/Kenya SME business growth experience. Based on a needs assessment among members followed by a series of face to face company visits and interviews a ‘Menu’ was established containing those aspects of business growth as indicated by members – in other words training / coaching aspects that AAA members (expect to) face once business growth becomes reality. These include aspects
yes 57%
no 43%
Are you part of a CoP/think tank?
15
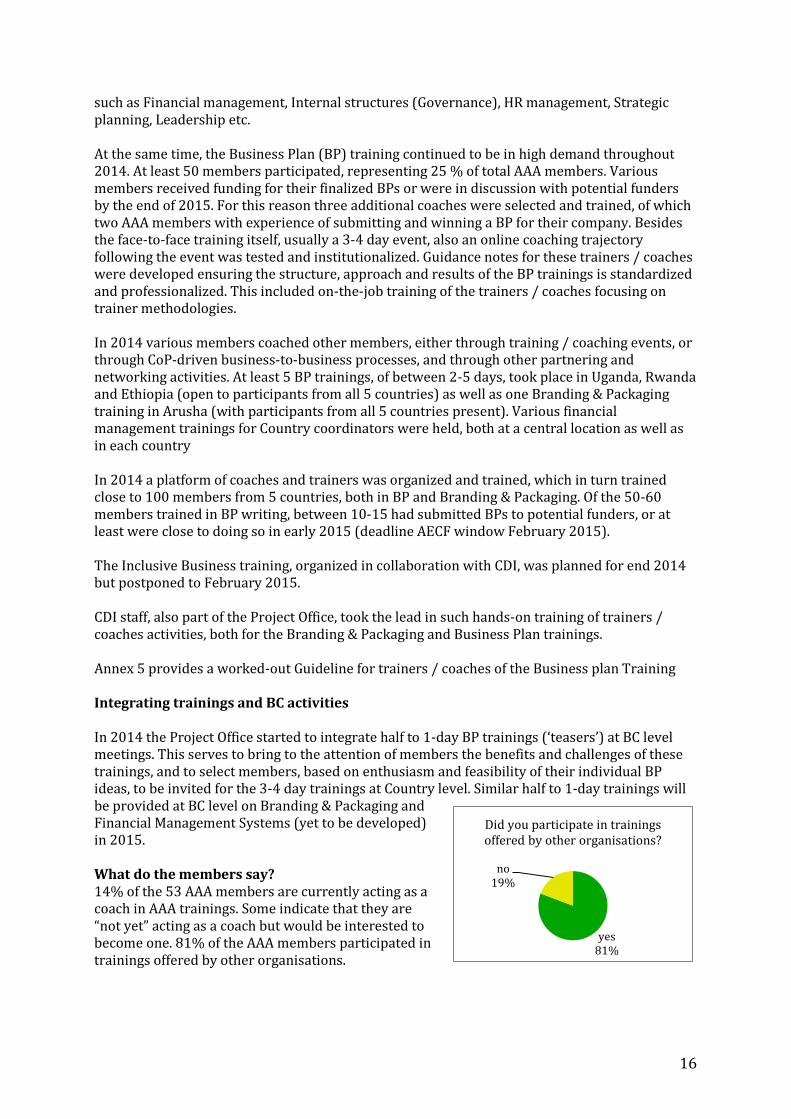
such as Financial management, Internal structures (Governance), HR management, Strategic planning, Leadership etc. At the same time, the Business Plan (BP) training continued to be in high demand throughout 2014. At least 50 members participated, representing 25 % of total AAA members. Various members received funding for their finalized BPs or were in discussion with potential funders by the end of 2015. For this reason three additional coaches were selected and trained, of which two AAA members with experience of submitting and winning a BP for their company. Besides the face-to-face training itself, usually a 3-4 day event, also an online coaching trajectory following the event was tested and institutionalized. Guidance notes for these trainers / coaches were developed ensuring the structure, approach and results of the BP trainings is standardized and professionalized. This included on-the-job training of the trainers / coaches focusing on trainer methodologies. In 2014 various members coached other members, either through training / coaching events, or through CoP-driven business-to-business processes, and through other partnering and networking activities. At least 5 BP trainings, of between 2-5 days, took place in Uganda, Rwanda and Ethiopia (open to participants from all 5 countries) as well as one Branding & Packaging training in Arusha (with participants from all 5 countries present). Various financial management trainings for Country coordinators were held, both at a central location as well as in each country In 2014 a platform of coaches and trainers was organized and trained, which in turn trained close to 100 members from 5 countries, both in BP and Branding & Packaging. Of the 50-60 members trained in BP writing, between 10-15 had submitted BPs to potential funders, or at least were close to doing so in early 2015 (deadline AECF window February 2015). The Inclusive Business training, organized in collaboration with CDI, was planned for end 2014 but postponed to February 2015. CDI staff, also part of the Project Office, took the lead in such hands-on training of trainers / coaches activities, both for the Branding & Packaging and Business Plan trainings. Annex 5 provides a worked-out Guideline for trainers / coaches of the Business plan Training Integrating trainings and BC activities In 2014 the Project Office started to integrate half to 1-day BP trainings (‘teasers’) at BC level meetings. This serves to bring to the attention of members the benefits and challenges of these trainings, and to select members, based on enthusiasm and feasibility of their individual BP ideas, to be invited for the 3-4 day trainings at Country level. Similar half to 1-day trainings will be provided at BC level on Branding & Packaging and Financial Management Systems (yet to be developed) in 2015. What do the members say? 14% of the 53 AAA members are currently acting as a coach in AAA trainings. Some indicate that they are “not yet” acting as a coach but would be interested to become one. 81% of the AAA members participated in trainings offered by other organisations.
yes 81%
no 19%
Did you participate in trainings offered by other organisations?
16
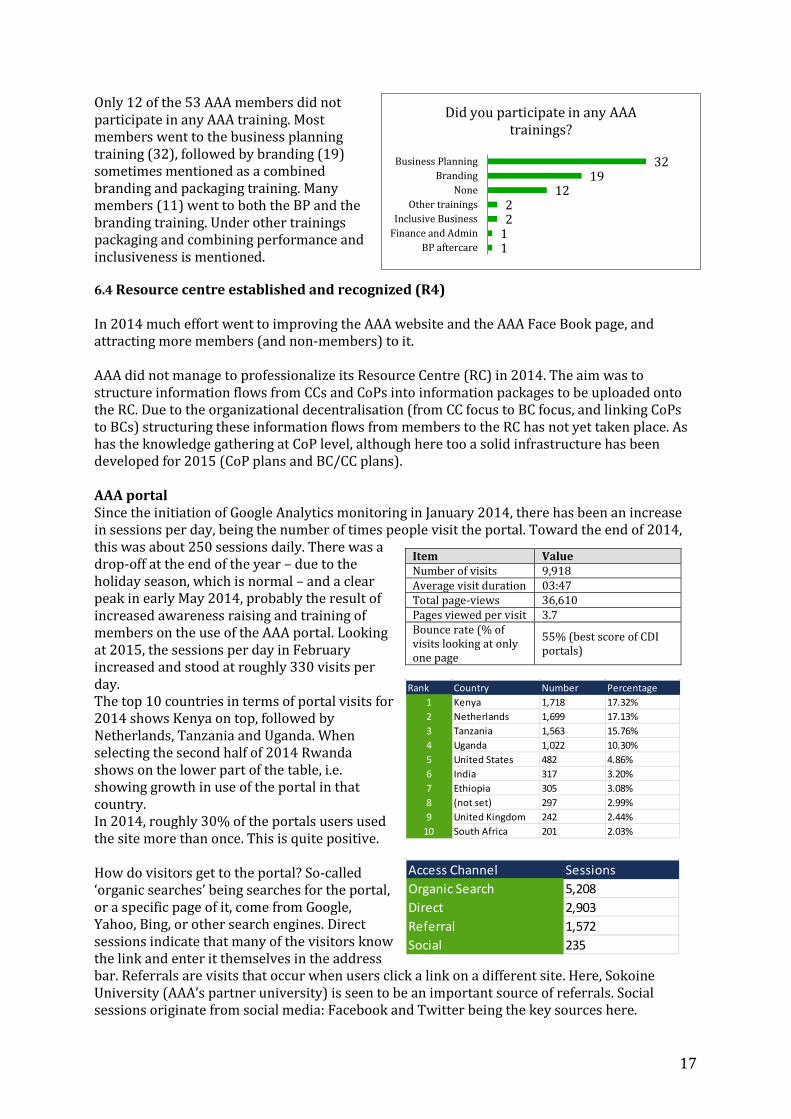
Only 12 of the 53 AAA members did not participate in any AAA training. Most members went to the business planning training (32), followed by branding (19) sometimes mentioned as a combined branding and packaging training. Many members (11) went to both the BP and the branding training. Under other trainings packaging and combining performance and inclusiveness is mentioned. 6.4 Resource centre established and recognized (R4) In 2014 much effort went to improving the AAA website and the AAA Face Book page, and attracting more members (and non-members) to it. AAA did not manage to professionalize its Resource Centre (RC) in 2014. The aim was to structure information flows from CCs and CoPs into information packages to be uploaded onto the RC. Due to the organizational decentralisation (from CC focus to BC focus, and linking CoPs to BCs) structuring these information flows from members to the RC has not yet taken place. As has the knowledge gathering at CoP level, although here too a solid infrastructure has been developed for 2015 (CoP plans and BC/CC plans). AAA portal Since the initiation of Google Analytics monitoring in January 2014, there has been an increase in sessions per day, being the number of times people visit the portal. Toward the end of 2014, this was about 250 sessions daily. There was a drop-off at the end of the year – due to the holiday season, which is normal – and a clear peak in early May 2014, probably the result of increased awareness raising and training of members on the use of the AAA portal. Looking at 2015, the sessions per day in February increased and stood at roughly 330 visits per day. The top 10 countries in terms of portal visits for 2014 shows Kenya on top, followed by Netherlands, Tanzania and Uganda. When selecting the second half of 2014 Rwanda shows on the lower part of the table, i.e. showing growth in use of the portal in that country. In 2014, roughly 30% of the portals users used the site more than once. This is quite positive. How do visitors get to the portal? So-called ‘organic searches’ being searches for the portal, or a specific page of it, come from Google, Yahoo, Bing, or other search engines. Direct sessions indicate that many of the visitors know the link and enter it themselves in the address bar. Referrals are visits that occur when users click a link on a different site. Here, Sokoine University (AAA’s partner university) is seen to be an important source of referrals. Social sessions originate from social media: Facebook and Twitter being the key sources here.
Item Value Number of visits 9,918 Average visit duration 03:47 Total page-views 36,610 Pages viewed per visit 3.7 Bounce rate (% of visits looking at only one page
55% (best score of CDI portals)
1 1 2 2
12 19
32
BP aftercareFinance and AdminInclusive Business
Other trainingsNone
BrandingBusiness Planning
Did you participate in any AAA trainings?
Rank Country Number Percentage1 Kenya 1,718 17.32%2 Netherlands 1,699 17.13%3 Tanzania 1,563 15.76%4 Uganda 1,022 10.30%5 United States 482 4.86%6 India 317 3.20%7 Ethiopia 305 3.08%8 (not set) 297 2.99%9 United Kingdom 242 2.44%
10 South Africa 201 2.03%
17
Access Channel SessionsOrganic Search 5,208Direct 2,903Referral 1,572Social 235
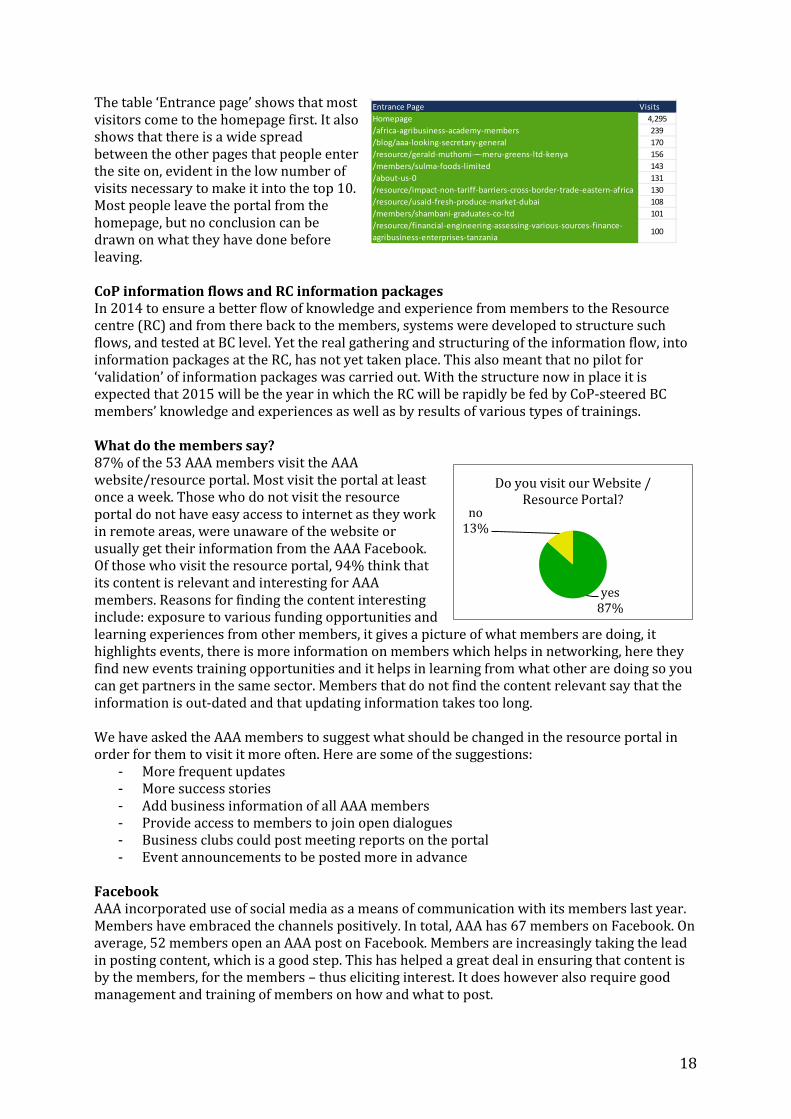
The table ‘Entrance page’ shows that most visitors come to the homepage first. It also shows that there is a wide spread between the other pages that people enter the site on, evident in the low number of visits necessary to make it into the top 10. Most people leave the portal from the homepage, but no conclusion can be drawn on what they have done before leaving. CoP information flows and RC information packages In 2014 to ensure a better flow of knowledge and experience from members to the Resource centre (RC) and from there back to the members, systems were developed to structure such flows, and tested at BC level. Yet the real gathering and structuring of the information flow, into information packages at the RC, has not yet taken place. This also meant that no pilot for ‘validation’ of information packages was carried out. With the structure now in place it is expected that 2015 will be the year in which the RC will be rapidly be fed by CoP-steered BC members’ knowledge and experiences as well as by results of various types of trainings. What do the members say? 87% of the 53 AAA members visit the AAA website/resource portal. Most visit the portal at least once a week. Those who do not visit the resource portal do not have easy access to internet as they work in remote areas, were unaware of the website or usually get their information from the AAA Facebook. Of those who visit the resource portal, 94% think that its content is relevant and interesting for AAA members. Reasons for finding the content interesting include: exposure to various funding opportunities and learning experiences from other members, it gives a picture of what members are doing, it highlights events, there is more information on members which helps in networking, here they find new events training opportunities and it helps in learning from what other are doing so you can get partners in the same sector. Members that do not find the content relevant say that the information is out-dated and that updating information takes too long. We have asked the AAA members to suggest what should be changed in the resource portal in order for them to visit it more often. Here are some of the suggestions:
- More frequent updates - More success stories - Add business information of all AAA members - Provide access to members to join open dialogues - Business clubs could post meeting reports on the portal - Event announcements to be posted more in advance
Facebook AAA incorporated use of social media as a means of communication with its members last year. Members have embraced the channels positively. In total, AAA has 67 members on Facebook. On average, 52 members open an AAA post on Facebook. Members are increasingly taking the lead in posting content, which is a good step. This has helped a great deal in ensuring that content is by the members, for the members – thus eliciting interest. It does however also require good management and training of members on how and what to post.
yes 87%
no 13%
Do you visit our Website / Resource Portal?
Entrance Page VisitsHomepage 4,295/africa-agribusiness-academy-members 239/blog/aaa-looking-secretary-general 170/resource/gerald-muthomi-–-meru-greens-ltd-kenya 156/members/sulma-foods-limited 143/about-us-0 131/resource/impact-non-tariff-barriers-cross-border-trade-eastern-africa 130/resource/usaid-fresh-produce-market-dubai 108/members/shambani-graduates-co-ltd 101/resource/financial-engineering-assessing-various-sources-finance-agribusiness-enterprises-tanzania
100
18
In 2014, the most popular content for the members were calls for proposals by AECF, KFIE and other calls for funding opportunities. The channel has given positive output and feedback in terms of disseminating information, giving updates on meetings and events and offering support to the members. Posts on Business Club meetings, trade fairs and exhibitions, and short-term courses by Wageningen University also gained popularity. Per month, AAA manages to have on average 25 posts on Facebook and 18 on twitter; mostly on ‘live’ feedback from the BC meetings, trade fairs and company visits. Facebook is the most responsive as members rely on it to get information and alerts. Members respond more to posts and rely on the channel to get news and track AAA activities. As one member, Ngila Kimotho of Dryland Seed Ltd. explains: “Due to the nature of my work, I barely have time to go to the website so I rely on my phone to keep tabs on AAA activities via Facebook.” AAA joined Twitter in September 2014. It has 69 followers of which 23 are members. Members are yet to appreciate its use. A few of them re-tweet the posts. Some of the most re-tweeted posts include the December 2014 newsletter, the 2nd round of the AECF agribusiness window in November 2014 and the call for applications by the Africa’s Green Pioneer Accelerator in October 2014. 6.5 Public domain rollout: services for business growth The rollout of the unique AAA knowledge, experience and trainings to non-AAA members (public domain) has not been achieved in 2014. The decision was made to focus and consolidate the services to the AAA members first. However, in order not to delay any longer, planning started late 2014 for AAA’s first rollout early 2015. A 3-day BP training for non-member companies is now planned for April 2015, with planning and marketing of the course being coordinated by the BC Central (Nairobi) of the Kenya Chapter in close collaboration with the CoP Finance and the Project Office. The goal is that in that month between 20-25 non-member companies will participate, at a fee, in a BP training lead by the PD and two AAA BP trainers / coaches. These coaches have by then ample experience, with intensive BP training experience from their latest AECF BP training in February. The rollout-training pilot in Kenya will provide AAA with better insights in the marketing, organizational, content and budgetary aspects of training services for non-members as of the outreach strategy of AAA. A feedback report will then zoom in on the aspects such as: what is AAA’s uniqueness in this context; who are potential / real off-takers (participants); what are needs and available budgets of participants, and; what are the most feasible product-market combinations (besides BP what other subjects, and for what target audience). Also the IB training and the branding will be tailored to non-members in 2015. This progress report will conclude on a scaling strategy, both for non-members (at a fee) and for the public domain, such as farmers or SME start-ups, at no-cost. 6.6 General support activities implemented and coordinated (R6) Much support was required by the Project Office (Arusha and Netherlands) to carry out the activities described under R1-R5, including in establishing the new AAA Secretariat (Kampala). The PO’s key focus was on the following aspects:
- Organizational restructuring: from a centralized CC approach to reach and service members to a decentralized BC approach
- Integrating the new BCs with existing and 1-2 new Sector CoPs, through strategic planning sessions with CC, BC and CoP leads, and with the end-result of 20+ BC plans, CC
19
plans and CoP plans for 2015 – all integrated to achieve maximum results in terms of information flow to and from the RC
- Selecting and hiring new Country coordinators (formerly Country assistants), ensuring a solid team of AAA coordinators per country, responsible for Country level planning, coordination, logistics, budgeting and reporting
- Team building and training of BC leaders and assistants, CoP leaders and sub-leaders, and Country coordinators
- Fine-tuning perfection of the AAA’s financial structure and systems, through on-the-job trainings of Country coordinators, through hiring / training of a new, Arusha-based Pan Africa financial coordinator / accountant with overview of individual Country budgets and Pan Africa budget, and working closely with the CDI financial officer, with the overall goal to minimize financial risks in the project
- Much attention was paid to reporting and communication processes, both through the Year Plan 2015 and the 2013 Year Report and through meetings and events, towards sponsors and stakeholders of the AAA project
- A thorough baseline was implemented in order to have a good idea of situation-0 - Improved communication via website, face book and twitter was implemented (see
below) - New product development: various new products were developed after careful selection
of ideas (needs assessment result) among members, with the outcome in terms of ‘skills development’ resulting in three new trainings: Branding & packaging, Inclusive business, and (design of) Business growth coaching
- Improved company visits with thematic focus and exchanges between members on innovation and new products
- Selection of specialized local resource persons, trainers and coaches, wither AAA members or external consultants
- Stronger linkages with important external stakeholders, such as with Rabobank Development (both in Netherlands and in AAA countries) and with Netherlands Embassies in AAA countries.
Communication Key aspects of a communication strategy have been defined, in line with branding of AAA. This draft will be fine-tuned and implemented in 2015. The focus of the strategy is on the one hand on ‘gain creators’ such as creating new partnerships and increasing reputation; the ‘pain relievers’ such as knowledge sharing and access to finance; AAA services such as trainings and exposure on the AAA website; and on the other on the gains, requirements and challenges of the customers. In 2014 AAA fully incorporated into its Website and other means of communication the use of social media (various digital newsletters, Twitter, Facebook) as a means of communication to its members. Members have embraced the channels positively but the uptake has been slow, especially (still) for the website. Facebook has given positive output and feedback in terms of disseminating information, giving updates on meetings and events and offering support to the members. AAA works towards having 85% of its members on board by the end of 2015. In September 2014 AAA joined twitter. The twitter account is linked to the AAA website to ensure that members have access to tweets even when they do not have their own Twitter account. In order to capture all the social media information, AAA is currently developing a knowledge management approach. Monitoring and evaluation for learning End of 2013 a Monitoring & Evaluation for Learning system was developed, including the M&E Matrix with key questions, indicators and ways how to gather the information jointly with AAA members. It was decided upon that the purpose of this M&E should be:
20
What does AAA and others need to know, on which level (output, outcome and impact –
results, process)? What are the indicators of success? What are the milestones
progressively each year?
• Monitoring change & results of AAA on output, outcome and impact level (including monitoring the context)
• Profiling the results of the project and AAA and ensuring effective operations of the PO and the AAA
• Guiding the strategy of AAA • Creating a learning environment for AAA partnership, deals and innovation.
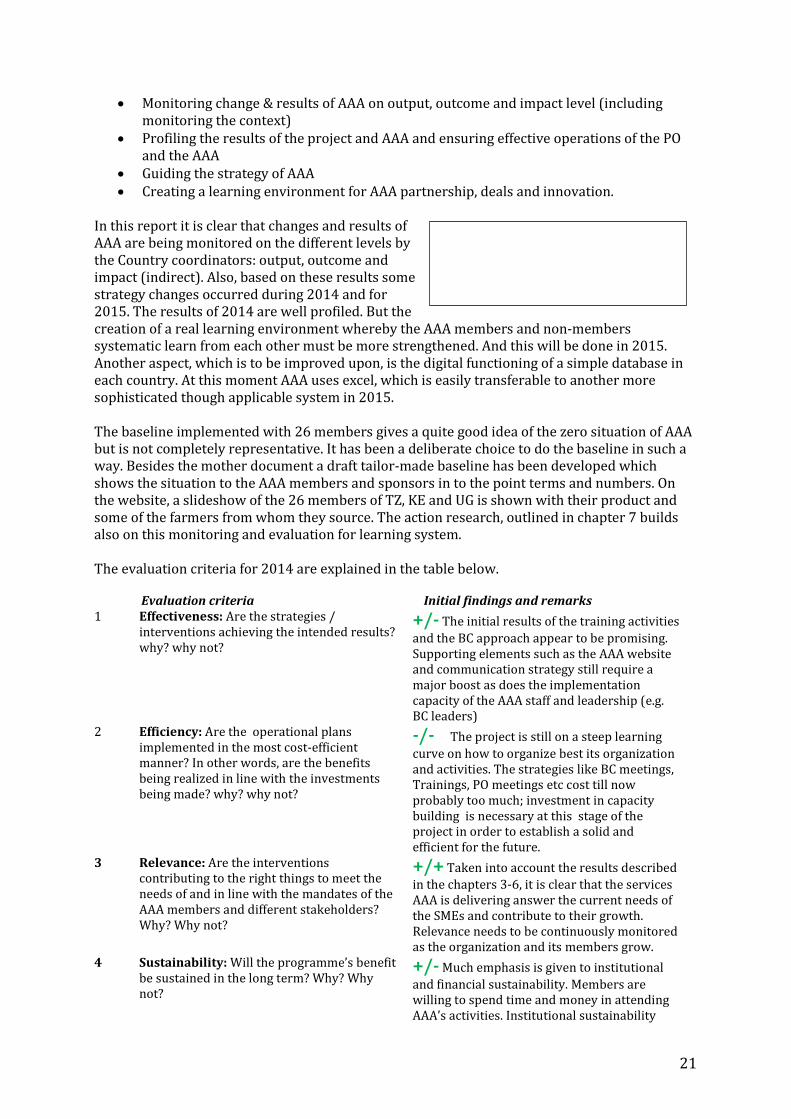
In this report it is clear that changes and results of AAA are being monitored on the different levels by the Country coordinators: output, outcome and impact (indirect). Also, based on these results some strategy changes occurred during 2014 and for 2015. The results of 2014 are well profiled. But the creation of a real learning environment whereby the AAA members and non-members systematic learn from each other must be more strengthened. And this will be done in 2015. Another aspect, which is to be improved upon, is the digital functioning of a simple database in each country. At this moment AAA uses excel, which is easily transferable to another more sophisticated though applicable system in 2015. The baseline implemented with 26 members gives a quite good idea of the zero situation of AAA but is not completely representative. It has been a deliberate choice to do the baseline in such a way. Besides the mother document a draft tailor-made baseline has been developed which shows the situation to the AAA members and sponsors in to the point terms and numbers. On the website, a slideshow of the 26 members of TZ, KE and UG is shown with their product and some of the farmers from whom they source. The action research, outlined in chapter 7 builds also on this monitoring and evaluation for learning system. The evaluation criteria for 2014 are explained in the table below. Evaluation criteria Initial findings and remarks 1 Effectiveness: Are the strategies /
interventions achieving the intended results? why? why not?
+/- The initial results of the training activities and the BC approach appear to be promising. Supporting elements such as the AAA website and communication strategy still require a major boost as does the implementation capacity of the AAA staff and leadership (e.g. BC leaders)
2 Efficiency: Are the operational plans implemented in the most cost-efficient manner? In other words, are the benefits being realized in line with the investments being made? why? why not?
-/- The project is still on a steep learning curve on how to organize best its organization and activities. The strategies like BC meetings, Trainings, PO meetings etc cost till now probably too much; investment in capacity building is necessary at this stage of the project in order to establish a solid and efficient for the future.
3 Relevance: Are the interventions contributing to the right things to meet the needs of and in line with the mandates of the AAA members and different stakeholders? Why? Why not?
+/+ Taken into account the results described in the chapters 3-6, it is clear that the services AAA is delivering answer the current needs of the SMEs and contribute to their growth. Relevance needs to be continuously monitored as the organization and its members grow.
4 Sustainability: Will the programme’s benefit be sustained in the long term? Why? Why not?
+/- Much emphasis is given to institutional and financial sustainability. Members are willing to spend time and money in attending AAA’s activities. Institutional sustainability
21
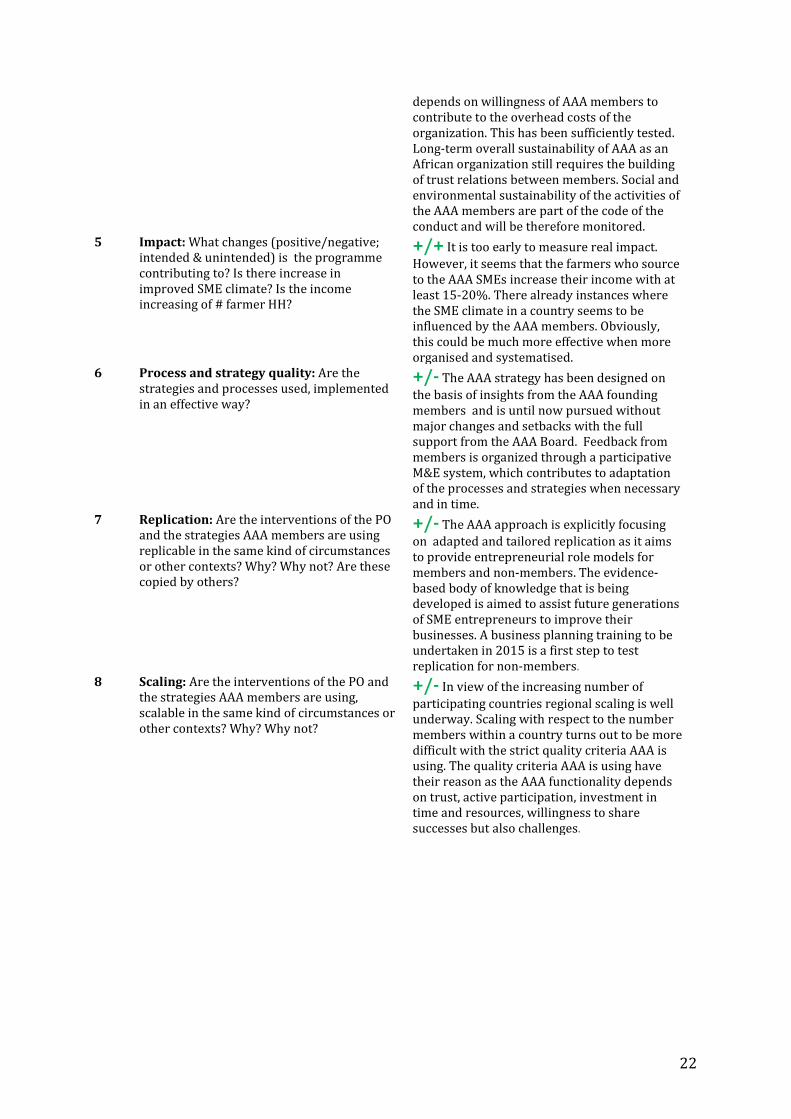
depends on willingness of AAA members to contribute to the overhead costs of the organization. This has been sufficiently tested. Long-term overall sustainability of AAA as an African organization still requires the building of trust relations between members. Social and environmental sustainability of the activities of the AAA members are part of the code of the conduct and will be therefore monitored.
5 Impact: What changes (positive/negative; intended & unintended) is the programme contributing to? Is there increase in improved SME climate? Is the income increasing of # farmer HH?
+/+ It is too early to measure real impact. However, it seems that the farmers who source to the AAA SMEs increase their income with at least 15-20%. There already instances where the SME climate in a country seems to be influenced by the AAA members. Obviously, this could be much more effective when more organised and systematised.
6 Process and strategy quality: Are the strategies and processes used, implemented in an effective way?
+/- The AAA strategy has been designed on the basis of insights from the AAA founding members and is until now pursued without major changes and setbacks with the full support from the AAA Board. Feedback from members is organized through a participative M&E system, which contributes to adaptation of the processes and strategies when necessary and in time.
7 Replication: Are the interventions of the PO and the strategies AAA members are using replicable in the same kind of circumstances or other contexts? Why? Why not? Are these copied by others?
+/- The AAA approach is explicitly focusing on adapted and tailored replication as it aims to provide entrepreneurial role models for members and non-members. The evidence-based body of knowledge that is being developed is aimed to assist future generations of SME entrepreneurs to improve their businesses. A business planning training to be undertaken in 2015 is a first step to test replication for non-members.
8 Scaling: Are the interventions of the PO and the strategies AAA members are using, scalable in the same kind of circumstances or other contexts? Why? Why not?
+/- In view of the increasing number of participating countries regional scaling is well underway. Scaling with respect to the number members within a country turns out to be more difficult with the strict quality criteria AAA is using. The quality criteria AAA is using have their reason as the AAA functionality depends on trust, active participation, investment in time and resources, willingness to share successes but also challenges.
22
7. Action research In 2014 AAA started implementing an 18-month action research. It concentrates on one of the key learning questions within AAA: “How does business growth of an SME Agri-Food company benefit the (small-scale) emerging farmers, it works with?” This question has been subdivided in the 4 following other specific questions: 1. What type of SME investment (finance, technology, extension, other) creates the biggest
benefits for farmers, and why? What are these benefits? And who benefits from this in the farmer family?
2. What sectors show higher/lower benefits for farmers from a same SME investment level (biggest 'bang for invested dollar')?
3. Which business models are used by the SMEs in working with their farmers? Which business models contribute to a win-win?
4. What are the main constraints and main opportunities in the commercial relations (B2B) between farmer (groups) and SMEs, and which main improvements at the level of the producer(groups) and the SMEs would provide win-win situations?
The action research will use the following steps: - Develop analytical framework: key question, sub questions: definitions, linkages - Link to AAA monitoring framework and reporting - Desk study on: SMEs, agri-Businesses, inclusive business, value chain development, context
analysis of 3 countries, farmer situation in 3 countries, etc. - Sampling choice of AAA SMEs and farmers - Choice of tools: desk study, individual surveys (SMEs, farmers), focus group discussions with
farmers, storytelling, observations - Choice of processing tool: Excel / Atlas - Validation by AAA members / farmers and supporting agencies - Reporting / communication
The sampling strategy that was developed, including criteria, choice, method used and reasons behind this, as well as the project team and milestones of the planning, can be found in Annex 6.
8. Outcomes, impact The agreed upon project output deliverable for 2014 was an effective and efficient Project office, resulting from a budget restructuring in 2013, strengthening the Project office in 2014 to provide maximum support to AAA in reaching its goal to promote business growth among members. The deliverables (outputs) have been described in above chapters. This chapter will give insights in the outcomes of the project, and its contribution to foreseen impact. 8.1 Outcomes In 2014 the foreseen outcome of 400 members by the end of that year was not reached – membership stood at half, or 200 by the end of that year. This was the result of various key issues. First: rather than recruiting new members at CC level it was decided to do so at ‘zonal’ or regional level, i.e. through the BCs. Much time and effort went to organizing and setting up these BCs, thereby not having the time and structure (yet) in place for full-scale regional recruitment. Second, in three out of 5 AAA countries membership was reduced, with members to leave AAA due to non-performance as members. Stricter recruitment rules were enacted as a result, also adding to a lower than expected inflow of new members. Thirdly, in 2014 AAA did not enter 8
23
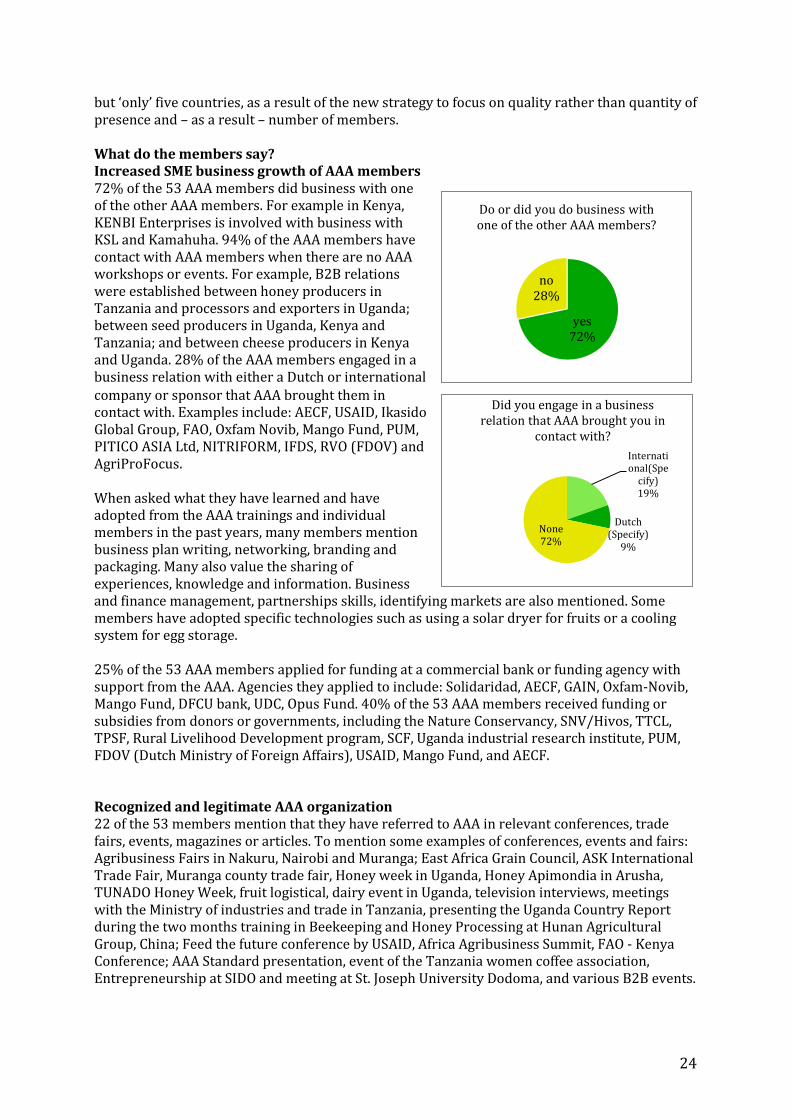
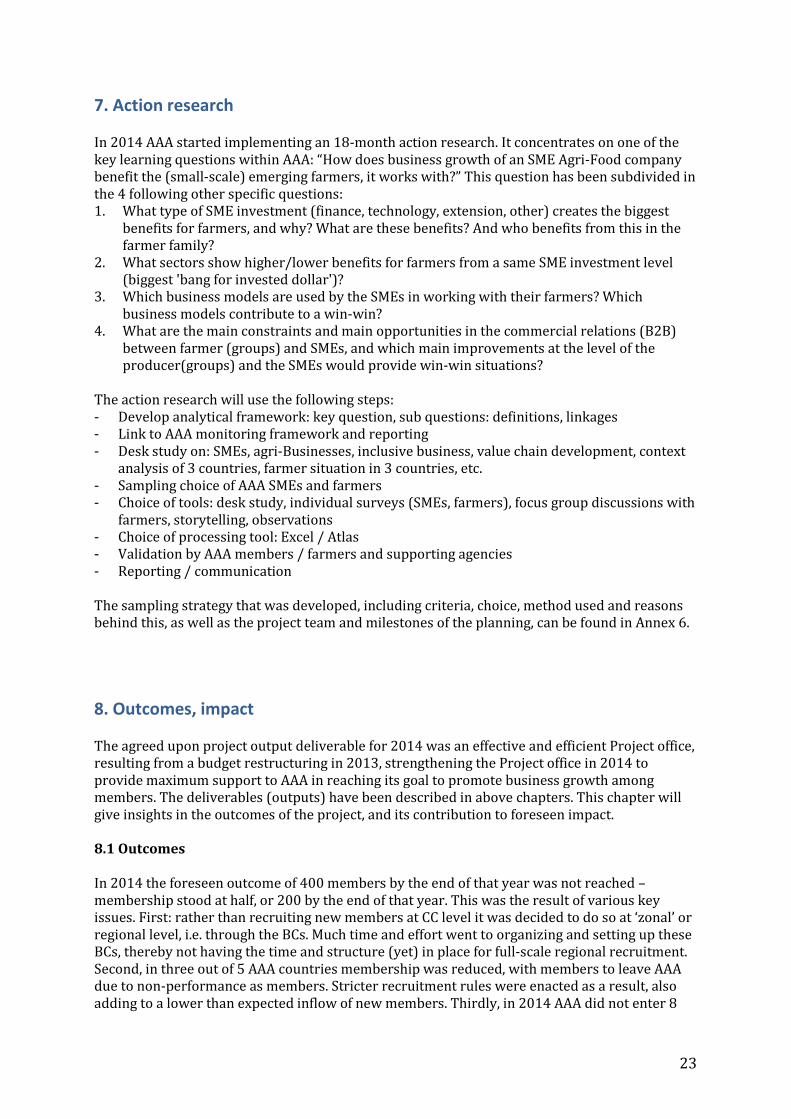
but ‘only’ five countries, as a result of the new strategy to focus on quality rather than quantity of presence and – as a result – number of members. What do the members say? Increased SME business growth of AAA members 72% of the 53 AAA members did business with one of the other AAA members. For example in Kenya, KENBI Enterprises is involved with business with KSL and Kamahuha. 94% of the AAA members have contact with AAA members when there are no AAA workshops or events. For example, B2B relations were established between honey producers in Tanzania and processors and exporters in Uganda; between seed producers in Uganda, Kenya and Tanzania; and between cheese producers in Kenya and Uganda. 28% of the AAA members engaged in a business relation with either a Dutch or international company or sponsor that AAA brought them in contact with. Examples include: AECF, USAID, Ikasido Global Group, FAO, Oxfam Novib, Mango Fund, PUM, PITICO ASIA Ltd, NITRIFORM, IFDS, RVO (FDOV) and AgriProFocus. When asked what they have learned and have adopted from the AAA trainings and individual members in the past years, many members mention business plan writing, networking, branding and packaging. Many also value the sharing of experiences, knowledge and information. Business and finance management, partnerships skills, identifying markets are also mentioned. Some members have adopted specific technologies such as using a solar dryer for fruits or a cooling system for egg storage. 25% of the 53 AAA members applied for funding at a commercial bank or funding agency with support from the AAA. Agencies they applied to include: Solidaridad, AECF, GAIN, Oxfam-Novib, Mango Fund, DFCU bank, UDC, Opus Fund. 40% of the 53 AAA members received funding or subsidies from donors or governments, including the Nature Conservancy, SNV/Hivos, TTCL, TPSF, Rural Livelihood Development program, SCF, Uganda industrial research institute, PUM, FDOV (Dutch Ministry of Foreign Affairs), USAID, Mango Fund, and AECF. Recognized and legitimate AAA organization 22 of the 53 members mention that they have referred to AAA in relevant conferences, trade fairs, events, magazines or articles. To mention some examples of conferences, events and fairs: Agribusiness Fairs in Nakuru, Nairobi and Muranga; East Africa Grain Council, ASK International Trade Fair, Muranga county trade fair, Honey week in Uganda, Honey Apimondia in Arusha, TUNADO Honey Week, fruit logistical, dairy event in Uganda, television interviews, meetings with the Ministry of industries and trade in Tanzania, presenting the Uganda Country Report during the two months training in Beekeeping and Honey Processing at Hunan Agricultural Group, China; Feed the future conference by USAID, Africa Agribusiness Summit, FAO - Kenya Conference; AAA Standard presentation, event of the Tanzania women coffee association, Entrepreneurship at SIDO and meeting at St. Joseph University Dodoma, and various B2B events.
yes 72%
no 28%
Do or did you do business with one of the other AAA members?
International(Spe
cify) 19%
Dutch (Specify)
9%
None 72%
Did you engage in a business relation that AAA brought you in
contact with?
24
Some examples of magazines, newspapers and articles are: Daily Monitor, NBC Dutch Magazine, Ugandan newspaper during the dairy week, and Village model articles (see box below).
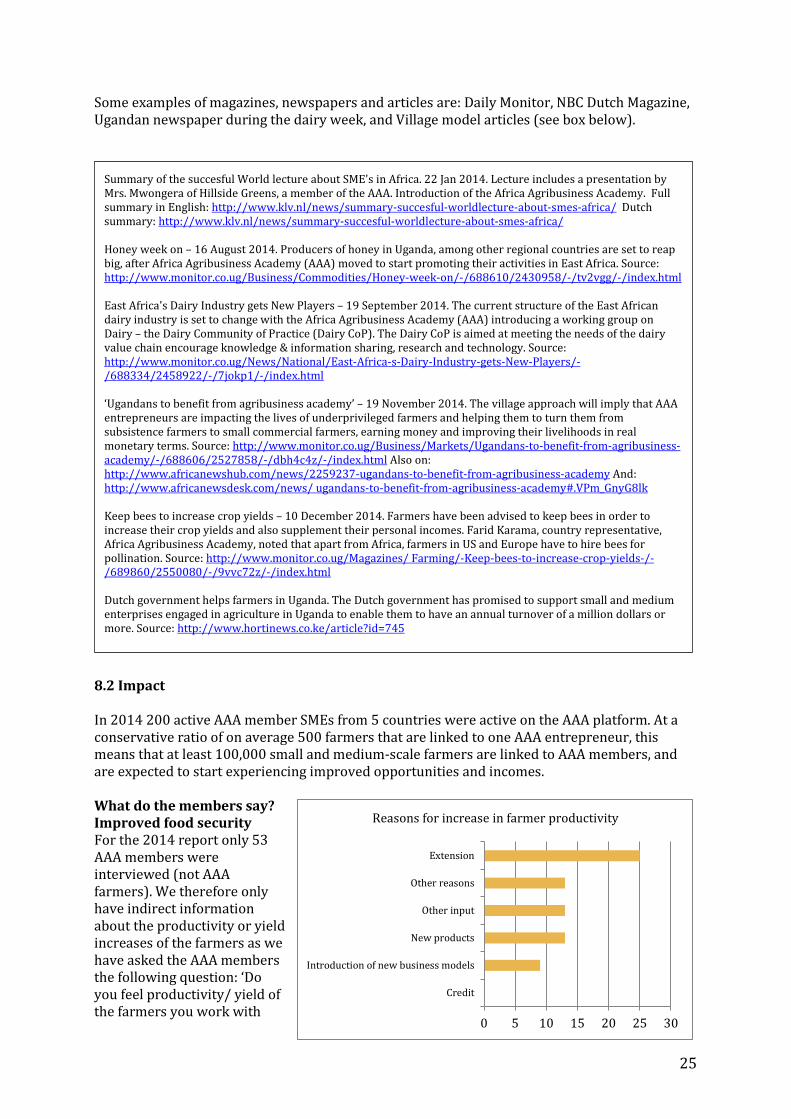
8.2 Impact In 2014 200 active AAA member SMEs from 5 countries were active on the AAA platform. At a conservative ratio of on average 500 farmers that are linked to one AAA entrepreneur, this means that at least 100,000 small and medium-scale farmers are linked to AAA members, and are expected to start experiencing improved opportunities and incomes. What do the members say? Improved food security For the 2014 report only 53 AAA members were interviewed (not AAA farmers). We therefore only have indirect information about the productivity or yield increases of the farmers as we have asked the AAA members the following question: ‘Do you feel productivity/ yield of the farmers you work with
0 5 10 15 20 25 30
Credit
Introduction of new business models
New products
Other input
Other reasons
Extension
Reasons for increase in farmer productivity
Summary of the succesful World lecture about SME's in Africa. 22 Jan 2014. Lecture includes a presentation by Mrs. Mwongera of Hillside Greens, a member of the AAA. Introduction of the Africa Agribusiness Academy. Full summary in English: http://www.klv.nl/news/summary-succesful-worldlecture-about-smes-africa/ Dutch summary: http://www.klv.nl/news/summary-succesful-worldlecture-about-smes-africa/ Honey week on – 16 August 2014. Producers of honey in Uganda, among other regional countries are set to reap big, after Africa Agribusiness Academy (AAA) moved to start promoting their activities in East Africa. Source: http://www.monitor.co.ug/Business/Commodities/Honey-week-on/-/688610/2430958/-/tv2vgg/-/index.html East Africa's Dairy Industry gets New Players – 19 September 2014. The current structure of the East African dairy industry is set to change with the Africa Agribusiness Academy (AAA) introducing a working group on Dairy – the Dairy Community of Practice (Dairy CoP). The Dairy CoP is aimed at meeting the needs of the dairy value chain encourage knowledge & information sharing, research and technology. Source: http://www.monitor.co.ug/News/National/East-Africa-s-Dairy-Industry-gets-New-Players/-/688334/2458922/-/7jokp1/-/index.html ‘Ugandans to benefit from agribusiness academy’ – 19 November 2014. The village approach will imply that AAA entrepreneurs are impacting the lives of underprivileged farmers and helping them to turn them from subsistence farmers to small commercial farmers, earning money and improving their livelihoods in real monetary terms. Source: http://www.monitor.co.ug/Business/Markets/Ugandans-to-benefit-from-agribusiness-academy/-/688606/2527858/-/dbh4c4z/-/index.html Also on: http://www.africanewshub.com/news/2259237-ugandans-to-benefit-from-agribusiness-academy And: http://www.africanewsdesk.com/news/ ugandans-to-benefit-from-agribusiness-academy#.VPm_GnyG8lk Keep bees to increase crop yields – 10 December 2014. Farmers have been advised to keep bees in order to increase their crop yields and also supplement their personal incomes. Farid Karama, country representative, Africa Agribusiness Academy, noted that apart from Africa, farmers in US and Europe have to hire bees for pollination. Source: http://www.monitor.co.ug/Magazines/ Farming/-Keep-bees-to-increase-crop-yields-/-/689860/2550080/-/9vvc72z/-/index.html Dutch government helps farmers in Uganda. The Dutch government has promised to support small and medium enterprises engaged in agriculture in Uganda to enable them to have an annual turnover of a million dollars or more. Source: http://www.hortinews.co.ke/article?id=745
25
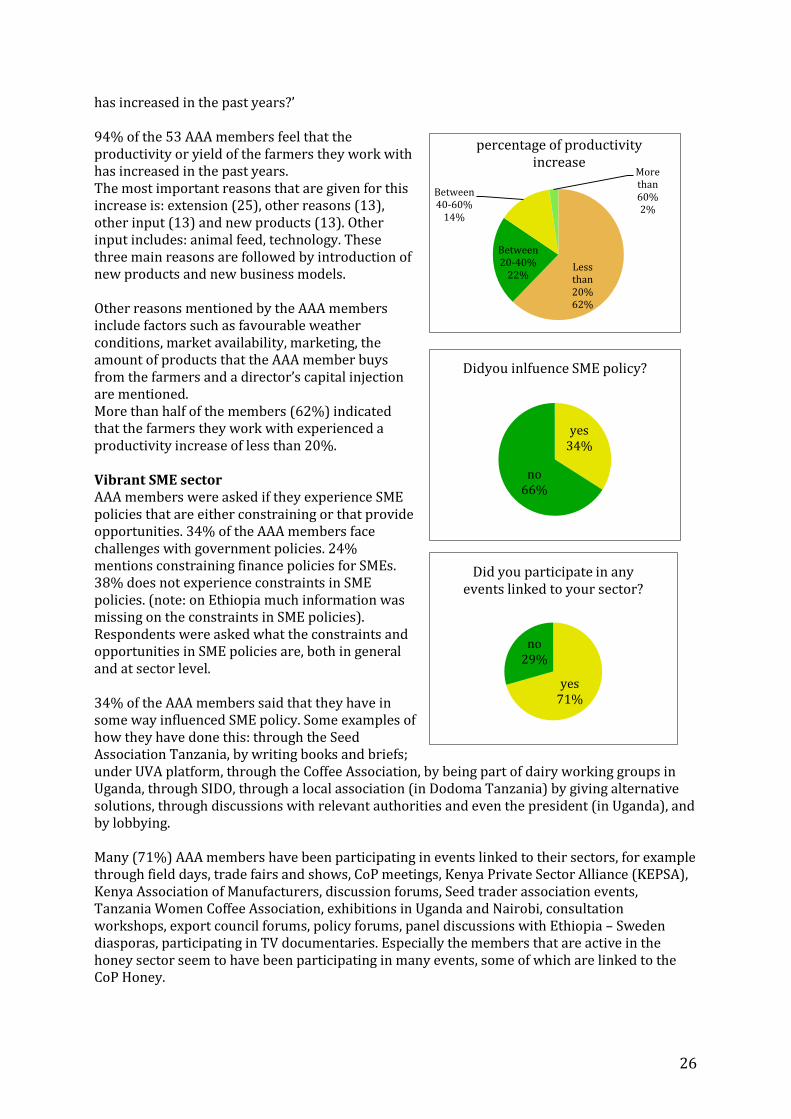
has increased in the past years?’ 94% of the 53 AAA members feel that the productivity or yield of the farmers they work with has increased in the past years. The most important reasons that are given for this increase is: extension (25), other reasons (13), other input (13) and new products (13). Other input includes: animal feed, technology. These three main reasons are followed by introduction of new products and new business models. Other reasons mentioned by the AAA members include factors such as favourable weather conditions, market availability, marketing, the amount of products that the AAA member buys from the farmers and a director’s capital injection are mentioned. More than half of the members (62%) indicated that the farmers they work with experienced a productivity increase of less than 20%. Vibrant SME sector AAA members were asked if they experience SME policies that are either constraining or that provide opportunities. 34% of the AAA members face challenges with government policies. 24% mentions constraining finance policies for SMEs. 38% does not experience constraints in SME policies. (note: on Ethiopia much information was missing on the constraints in SME policies). Respondents were asked what the constraints and opportunities in SME policies are, both in general and at sector level. 34% of the AAA members said that they have in some way influenced SME policy. Some examples of how they have done this: through the Seed Association Tanzania, by writing books and briefs; under UVA platform, through the Coffee Association, by being part of dairy working groups in Uganda, through SIDO, through a local association (in Dodoma Tanzania) by giving alternative solutions, through discussions with relevant authorities and even the president (in Uganda), and by lobbying. Many (71%) AAA members have been participating in events linked to their sectors, for example through field days, trade fairs and shows, CoP meetings, Kenya Private Sector Alliance (KEPSA), Kenya Association of Manufacturers, discussion forums, Seed trader association events, Tanzania Women Coffee Association, exhibitions in Uganda and Nairobi, consultation workshops, export council forums, policy forums, panel discussions with Ethiopia – Sweden diasporas, participating in TV documentaries. Especially the members that are active in the honey sector seem to have been participating in many events, some of which are linked to the CoP Honey.
Less than 20% 62%
Between 20-40%
22%
Between 40-60%
14%
More than 60% 2%
percentage of productivity increase
yes 34%
no 66%
Didyou inlfuence SME policy?
yes 71%
no 29%
Did you participate in any events linked to your sector?
26
9. Sustainability In 2014 the future sustainability of AAA has been a key topic on the agenda of the Pan Africa AAA Board. This was done both in terms of financial sustainability and Governance (institutional sustainability). 9.1 Financial sustainability In 2014 steps were made to work on the major challenge of AAA: the financial sustainability of the AAA organization after mid-2017, when funding through the Project office stops. A key policy document is being prepared by the AAA Pan Africa Board. Such self-financing has been and will be based mainly on total number of paying members when that moment arrives. Internal funds: cost recovery As discussed and agreed with the AAA Board and the AAA Sponsor Group, AAA follows a cautious growth strategy based on quality rather than quantity of members as well as proper consolidation of efforts in existing AAA countries. Based on the experience in the existing 5 countries so far, it is recognized that the initial target of becoming active in 15 countries over a 5-years period having 3000 members is too ambitious. A realistic adjusted target would be 10 countries and 1200 members by the end of the project period in 2017. In 2015 activities will start in two new countries (Malawi and Zambia). In 2016 two other countries will be added, with a final new country, CC 10, in 2017. The downscaling of these targets will only have a slight cost reducing impact on the overall project budget until 2017. A substantial part of the overall costs are ‘fixed’ project costs (PD, SG, support staff) and operational start-up costs within new countries. In the context of self-financing, the CCs are already expected to generate own funds through membership fees and participation fees at trainings and other events, as well as AAA offering commercial services to non-AAA members. This process of fine-tuning income streams, both from members and non-members, started to get structure in 2014, with pilots among members seeming willing to pay by sharing costs of the AAA event. In 2014 the initial Policy on financial contribution by AAA members to the AAA organization and activities was designed. Components of the policy were first discussed and agreed upon at the AAA Board on November 2014. In brief, the elements of this policy relate to AAA members contributing through a membership fee (and one-off registration fee); contributing to costs for BC and CoP meetings; trainings, specific BP training and coaching trajectories (including a 2% no-cure no-pay fee to AAA over the amount of external finance that results from this trajectory); and individual contributions to costs of fairs and other commercial events. The full-text (proposed) Policy on financial contribution by AAA members is shown in Annex 7. 9.2 Governance and management The governance structure of AAA is two-sided (see Annex 8). On the one hand, we have AAA as an organization in development gradually institutionalizing into a sustainable African governed and managed institution, whereas, on the other hand, we have the AAA Project supporting this process according to a 5-years project plan. The AAA organization is governed by a Board composed of representatives of the CCs and representatives of the international sponsor group and Sokoine Agricultural University. The AAA Support Project is implemented by Wageningen UR – CDI that reports to the WUF and DGIS. Regular meetings between the international sponsor
27
group, WUF, DGIS, the AAA Project Director and the AAA Board Chair provides a valuable platform for guidance to the overall initiative. In October 2014, a new milestone was reached in institutionalizing AAA with the recruitment of the AAA Secretary General (SG) and the setting up of the AAA Secretariat. The Secretariat is the implementing arm of the AAA umbrella organization - the Pan Africa Agribusiness Academy - the spider in the web of the AAA network. As stipulated in the 5-years project document, starting in 2015 a progressive transfer of responsibilities from the Project Director (PD) to the SG will take place. In 2017, the Project Office will phase out. As a first focus, the SG has taken up his responsibility to provide leadership to the CCs and the BCs within those countries, including the recruitment of new members. This covers essentially the Project Result Area 1. The SG operates from the office of the AAA Secretariat located in Kampala. In close consultation with the Chapter Boards, he steers/supports the country coordinators in organizing the implementation of the CC/BC plans with additional support from the AAA BC expert. The SG reports directly to the Board of the Pan Africa Agribusiness Academy. The AAA communication officer falls under his responsibility as well. For the implementation of the M&E system he works in close collaboration with the AAA M&E expert. The Arusha-based Project Office headed by the PD is largely responsible for result areas 2-6. Annex 9 provides the specific division of tasks between the SG and the PD for 2015. The PD reports directly to Wageningen UR – Centre for Development Innovation (CDI), the executing agency for the AAA Support Project. On the basis of the above division of tasks, the SG and PD have elaborated a joint programme of activities in support of AAA. They will align and coordinate their activities on a weekly basis - or more frequently if required - and will report jointly to the AAA Board and the Sponsor Group in the Netherlands. The offices of the SG and the PD are shared with the respective CCs of Tanzania and Uganda. The AAA Secretariat supports CCs in collecting membership fees from the members (entrance fees new members and annual membership fees from all members). Under guidance of the Secretariat individual CCs may start raising funds at local level, for example by linking to development initiatives. Sustainability considerations will be an integral part of each activity, asking AAA members to invest themselves as well.
28
Annex 1: Comparing AAA countries TANZANIA Tanzania Real GDP growth rate of 7.2% in 2014, (Financial Stability Report, Sept, 2014). Agriculture contributed 24.5% in 2014 country’s GDP, (National Bureau of Standards, July 2014), i.e., Agriculture contribute 34% of the total export earnings, (Hon Kigoda, The 4th EU-Africa Summit,7th April 2014). Tanzania’s main export crops in 2014(in the order of quantity) are Sugar, Cotton, Tea, Cashew nuts, Tobacco, Coffee, Sisal and Tea while main food crops are Maize, Rice, Paddy, Beans, Cassava, Sorghum and Wheat, (National Bureau of Statistics, July 2014). Agriculture employ 80% of Tanzania population, (TanzaniaInvest, 2014), Ranking 109 out 175 least corrupted countries (Transparency International 2014), corruption is vividly regarded among main constrains of doing business/invest in Tanzania, including access to finance, Electricity, Tax rate and Bureaucracy, (Enterprise Survey data,2013 &world bank, Business Environment Snapshots-Tanzania,2013). Tanzania rank 109th freest country to invest/do business, (World Bank, Business Environment Snapshots-Tanzania, 2013), with investment opportunities in Manufacturing sector and Irrigation farming in Lake Zone Regions, (Diplomat EA,April 2014 & IPP Media,Dec 5,2014). KENYA Kenya’s economic prospects remained strong throughout 2013, with low inflation and stable interest rates (World Bank, 2013). Real GDP grew at 5.8% in 2014, (Reuters 2014), with agriculture accounts for 24% of the DGP growth and contributing 50% of the total export earnings for that year, moreover the country’s main export crops in year 2014 were Coffee and Tea with food crops being Maize, Fruit Vegetables and grains,(Kenya Agriculture & Livestock Research Organization, 2015). Agriculture employ 75% of Kenya population, (Agricultural Policy in Kenya, O.Alila & Atieno,July 2006). Main constrain of investing in Kenya is corruption, ranking higher in the country, i.e. 145th out of 175 least corrupted countries, (Transparency International 2014) and political instability, (PwC-Kenya, Africa Investment). Hence, making the country 122nd freest country do business or invest in the world,( The Heritage Foundation,2015) with feasible investment opportunities being Horticulture and Diary farming, (Kenya Agriculture & Livestock Research Organisation,2015). UGANDA Uganda is well endowed with significant natural resources including ample fertile land with regular rainfall and mineral deposit with Manufacturing sector becoming Uganda’s most valuable economic activity contributing 22% to country’s economic growth (Uganda Business Inquiry. 2012). In 2014, Uganda’s GDP estimated to grow at 6.4%, ( CIA-World Fact Boob &IMF-World Economic Outlook), with agriculture to have contribute 50% of the growth rate , with a stake 85% to90% of the total export earnings, (Agona & Muyinza,National Agriculture Research Organisation (NARO),Uganda). Coffee, Tea and Fishery products were main Uganda’s export commodities in 2014, with counterpart main food crops being cooking bananas (Matooke) and beans, (UN Comtrade & UN Service Trade). Agriculture employs over 80% of Uganda population, (Agriculture, Roads, and Economic Development in Uganda, March, 2010) offering feasible investment opportunities in Food Manufacturing sector and Horticulture, (UN Comtrade & UN Service Trade). High rate of corruption, (ranking 142/175 least corrupted countries), high production cost, poor institutional frame work and HIV/AIDS sets major challenges in doing business in Uganda, (Transparency International 2014 , Africa Economic Outlook,2015) making the Country 92nd freest country to do business and invest in better than Tanzania, Kenya and Ethiopia,( The Heritage Foundation,2015). RWANDA Rwanda’s real GDP growth slowed down to 4.6% in 2013 from 7.3% in 2012 due to poor performance in agriculture including other factors, (Africa Economic Outlook (AEO) 2014.Being
32
a rural landlocked country, 90% of Rwanda population are engaged in agriculture (mainly subsistence), (World Bank 2013), (“Rwanda” CIA-The World Fact book, 15 May 2013). Rwanda real GDP grew at 7.5% in 2014 with Agriculture contributes 36% of the growth, with a stake of 70% of the total export earnings, (IPAR Rwanda Report August, 2009). Rwanda’s main export crops are Coffee and Tea , with main food crops being Fruits and Vegetables, Roots &Tubers, Bananas, Pulses and cereals, (Rwanda Economic Update, April 2011). With minimal corruption rate, ranking 55th out 175 least corrupted countries, (Transparency International 2014) hence, Rwanda offers good agriculture investment opportunities in horticulture farming, (Rwanda Economic Update, April 2011), making the country rank 65th freest country to invest in, though existence of small domestic market and ambiguous tax rules, (The Heritage Foundation, 2015) makes doing business in Rwanda a challenge. ETHIOPIA Ethiopia is fastest growing non-oil producing economies in Africa with the services and the industrial sectors growing at the highest rates, (African Economic Outlook, 2012). Ethiopia’s economy grew by 7.5% in 2014, (CIA-Word Fact Book), Agriculture accounting for 46% of GDP, with a stake of 83.9% of total export earnings, (State.gov, Bureau of Africa Affairs Factsheet, and August 2013). Ethiopia’s main export crops are Coffee, Horticulture and Leather products,( Federal Democratic Republic of Ethiopia, Statistical Appendix), with main food crops being Maize, (Livestock sample Survey, December 2007).Though Ethiopia attract investors with feasible agricultural investments in Dairy, Maize and Horticulture, (The Economist, June 2007, Livestock sample Survey, December 2007), but high corruption rate, ranking 110th out 175 least corrupted countries (Transparency International 2014), low rank as the freest country to invest in ,( i.e. ranks 149th ), (Transparency International 2014) and poor investment environments such as drought, soil degradation, high taxation and poor infrastructure, (State.gov,Bureau of Africa Affairs FactSheet,August 2013) investing/doing business in Ethiopia is of challenging nature. References:
1. Tanzania Financial Stability Report, Sept2014 2. Tanzania National Bureau of Statistics, July 2014 3. Tanzania Minister of Industry and Trade Hon.Kigoda, The 4th EUAfrica Summit. July 2014 4. TanzaniaInvest, 2014 5. Transparency International 2014 6. Enterprise Survey Data, 2013 & World Bank, Business Environment Snapshots 2013 7. The Heritage Foundation 8. Diplomat EA,April 2014 & IP PMedia,Dec 2014 9. Reuters 2014& World Bank 10. Kenya Agriculture & Livestock Research Organization, 2015 11. Agricultural Policy in Kenya, O.Alila & Atieno, July 2006 12. PwC-Kenya, Africa Investment 13. World Economic Outlook, April 2014 14. Agona & Muyinza, National Agriculture Research Organization (NARO), Uganda 15. UN Comtrade & UN Service Trade 16. Agriculture, Road and Economic Development in Uganda, March 2010 17. Africa Economic Outlook 2015 18. IPAR Rwanda Report, August 2009 19. Rwanda Economic Update, April 2011 20. State.gov, Bureau of Africa Affairs Factsheet, August 2013 21. Federal Democratic Republic of Ethiopia, Statistical Appendix 22. Livestock Sample Survey, December 2007 23. The Economist, June 2007
33
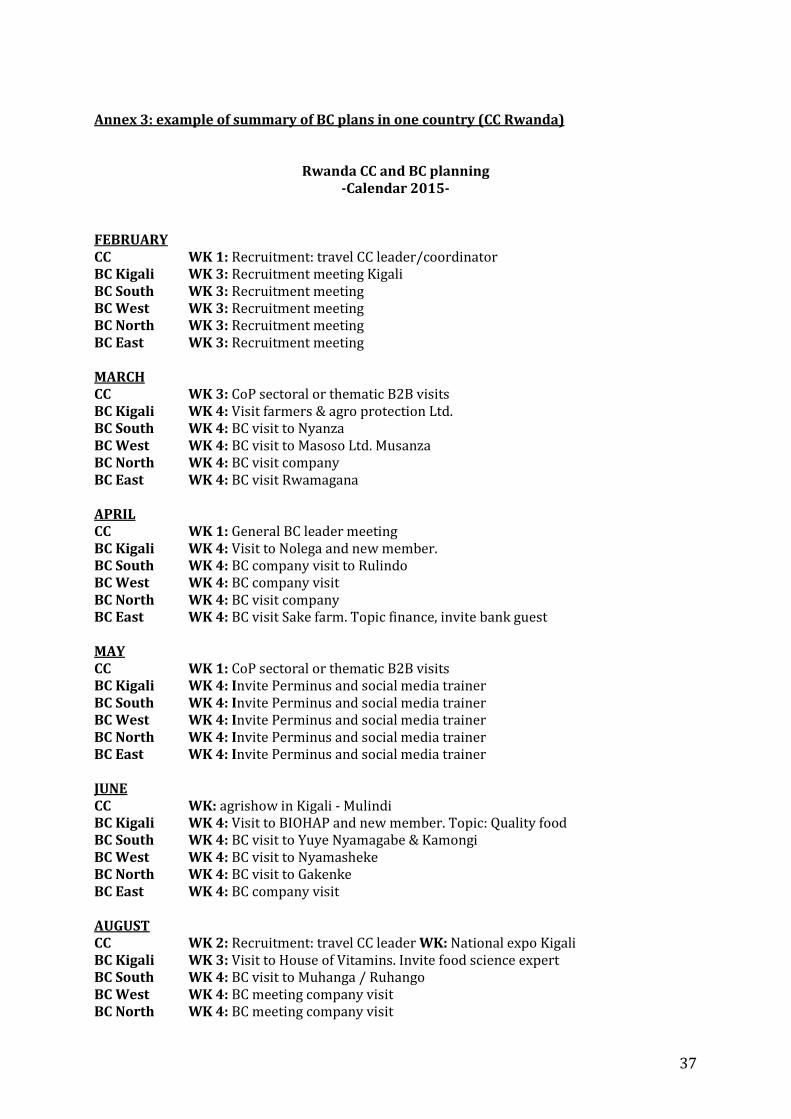
Annex 3: example of summary of BC plans in one country (CC Rwanda)
Rwanda CC and BC planning -Calendar 2015-
FEBRUARY CC WK 1: Recruitment: travel CC leader/coordinator BC Kigali WK 3: Recruitment meeting Kigali BC South WK 3: Recruitment meeting BC West WK 3: Recruitment meeting BC North WK 3: Recruitment meeting BC East WK 3: Recruitment meeting MARCH CC WK 3: CoP sectoral or thematic B2B visits BC Kigali WK 4: Visit farmers & agro protection Ltd. BC South WK 4: BC visit to Nyanza BC West WK 4: BC visit to Masoso Ltd. Musanza BC North WK 4: BC visit company BC East WK 4: BC visit Rwamagana APRIL CC WK 1: General BC leader meeting BC Kigali WK 4: Visit to Nolega and new member. BC South WK 4: BC company visit to Rulindo BC West WK 4: BC company visit BC North WK 4: BC visit company BC East WK 4: BC visit Sake farm. Topic finance, invite bank guest MAY CC WK 1: CoP sectoral or thematic B2B visits BC Kigali WK 4: Invite Perminus and social media trainer BC South WK 4: Invite Perminus and social media trainer BC West WK 4: Invite Perminus and social media trainer BC North WK 4: Invite Perminus and social media trainer BC East WK 4: Invite Perminus and social media trainer JUNE CC WK: agrishow in Kigali - Mulindi BC Kigali WK 4: Visit to BIOHAP and new member. Topic: Quality food BC South WK 4: BC visit to Yuye Nyamagabe & Kamongi BC West WK 4: BC visit to Nyamasheke BC North WK 4: BC visit to Gakenke BC East WK 4: BC company visit AUGUST CC WK 2: Recruitment: travel CC leader WK: National expo Kigali BC Kigali WK 3: Visit to House of Vitamins. Invite food science expert BC South WK 4: BC visit to Muhanga / Ruhango BC West WK 4: BC meeting company visit BC North WK 4: BC meeting company visit
37
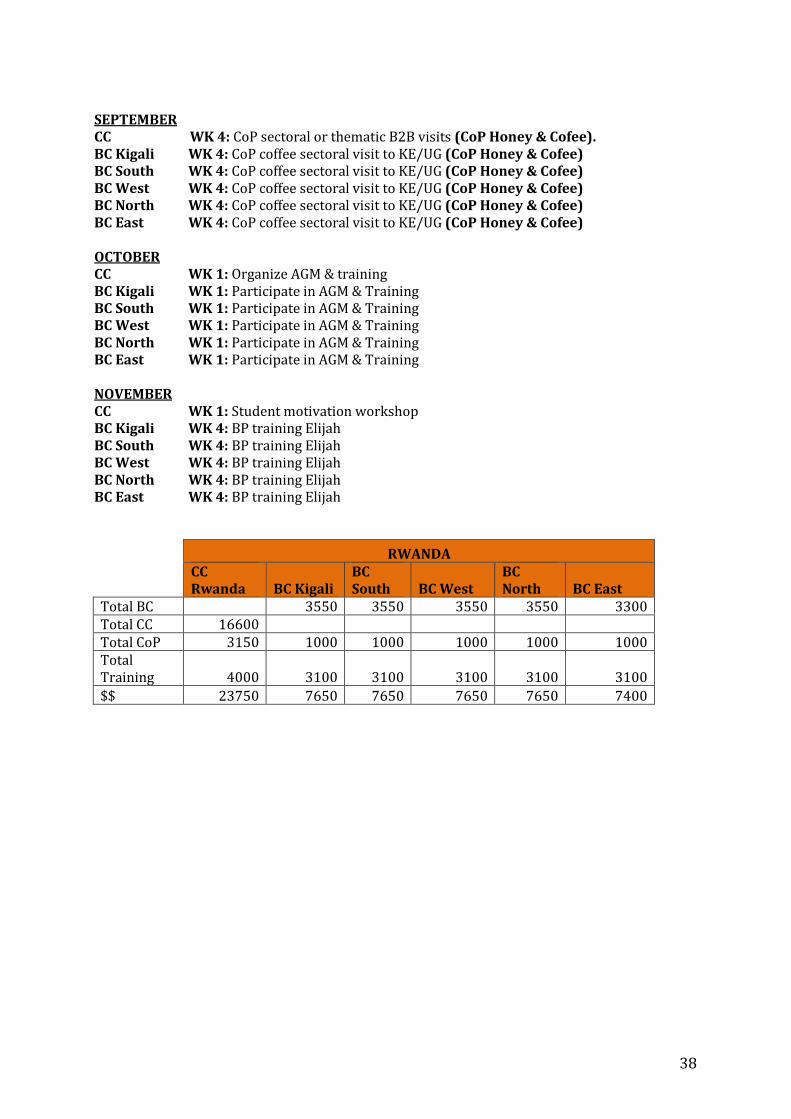
SEPTEMBER CC WK 4: CoP sectoral or thematic B2B visits (CoP Honey & Cofee). BC Kigali WK 4: CoP coffee sectoral visit to KE/UG (CoP Honey & Cofee) BC South WK 4: CoP coffee sectoral visit to KE/UG (CoP Honey & Cofee) BC West WK 4: CoP coffee sectoral visit to KE/UG (CoP Honey & Cofee) BC North WK 4: CoP coffee sectoral visit to KE/UG (CoP Honey & Cofee) BC East WK 4: CoP coffee sectoral visit to KE/UG (CoP Honey & Cofee) OCTOBER CC WK 1: Organize AGM & training BC Kigali WK 1: Participate in AGM & Training BC South WK 1: Participate in AGM & Training BC West WK 1: Participate in AGM & Training BC North WK 1: Participate in AGM & Training BC East WK 1: Participate in AGM & Training NOVEMBER CC WK 1: Student motivation workshop BC Kigali WK 4: BP training Elijah BC South WK 4: BP training Elijah BC West WK 4: BP training Elijah BC North WK 4: BP training Elijah BC East WK 4: BP training Elijah
RWANDA
CC Rwanda BC Kigali
BC South BC West
BC North BC East
Total BC 3550 3550 3550 3550 3300 Total CC 16600 Total CoP 3150 1000 1000 1000 1000 1000 Total Training 4000 3100 3100 3100 3100 3100 $$ 23750 7650 7650 7650 7650 7400
38
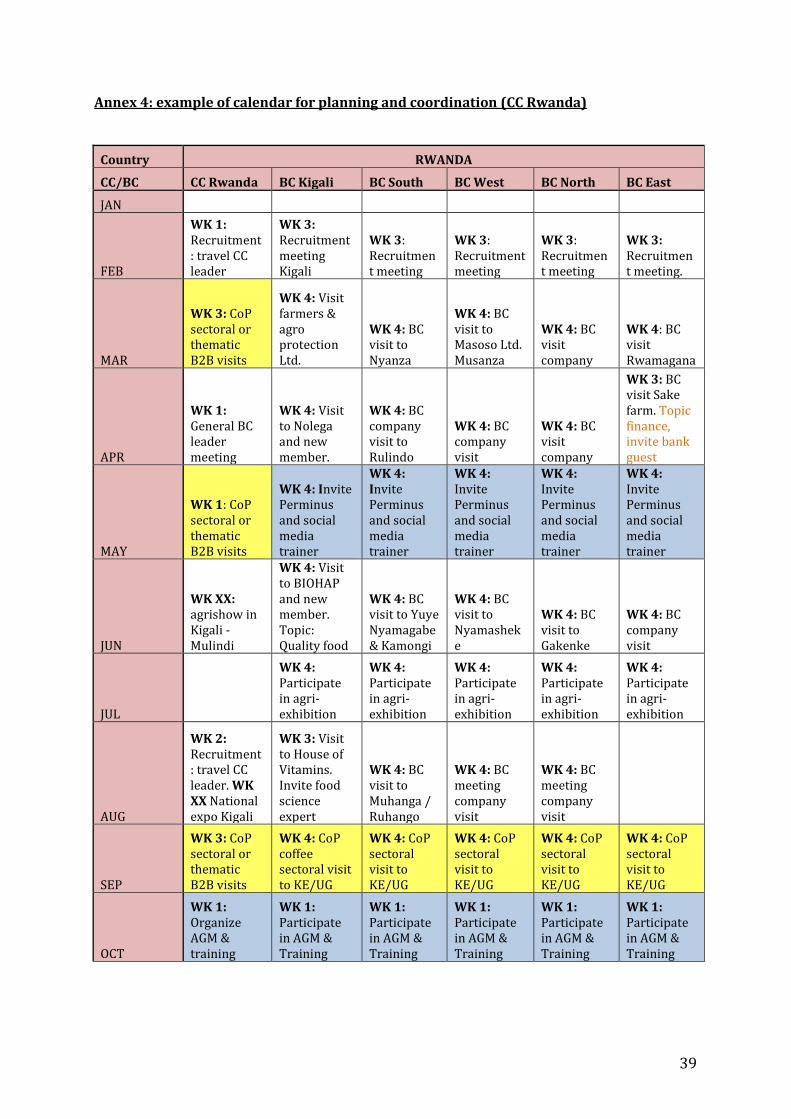
Annex 4: example of calendar for planning and coordination (CC Rwanda)
Country RWANDA
CC/BC CC Rwanda BC Kigali BC South BC West BC North BC East
JAN
FEB
WK 1: Recruitment: travel CC leader
WK 3: Recruitment meeting Kigali
WK 3: Recruitment meeting
WK 3: Recruitment meeting
WK 3: Recruitment meeting
WK 3: Recruitment meeting.
MAR
WK 3: CoP sectoral or thematic B2B visits
WK 4: Visit farmers & agro protection Ltd.
WK 4: BC visit to Nyanza
WK 4: BC visit to Masoso Ltd. Musanza
WK 4: BC visit company
WK 4: BC visit Rwamagana
APR
WK 1: General BC leader meeting
WK 4: Visit to Nolega and new member.
WK 4: BC company visit to Rulindo
WK 4: BC company visit
WK 4: BC visit company
WK 3: BC visit Sake farm. Topic finance, invite bank guest
MAY
WK 1: CoP sectoral or thematic B2B visits
WK 4: Invite Perminus and social media trainer
WK 4: Invite Perminus and social media trainer
WK 4: Invite Perminus and social media trainer
WK 4: Invite Perminus and social media trainer
WK 4: Invite Perminus and social media trainer
JUN
WK XX: agrishow in Kigali - Mulindi
WK 4: Visit to BIOHAP and new member. Topic: Quality food
WK 4: BC visit to Yuye Nyamagabe & Kamongi
WK 4: BC visit to Nyamasheke
WK 4: BC visit to Gakenke
WK 4: BC company visit
JUL
WK 4: Participate in agri-exhibition
WK 4: Participate in agri-exhibition
WK 4: Participate in agri-exhibition
WK 4: Participate in agri-exhibition
WK 4: Participate in agri-exhibition
AUG
WK 2: Recruitment: travel CC leader. WK XX National expo Kigali
WK 3: Visit to House of Vitamins. Invite food science expert
WK 4: BC visit to Muhanga / Ruhango
WK 4: BC meeting company visit
WK 4: BC meeting company visit
SEP
WK 3: CoP sectoral or thematic B2B visits
WK 4: CoP coffee sectoral visit to KE/UG
WK 4: CoP sectoral visit to KE/UG
WK 4: CoP sectoral visit to KE/UG
WK 4: CoP sectoral visit to KE/UG
WK 4: CoP sectoral visit to KE/UG
OCT
WK 1: Organize AGM & training
WK 1: Participate in AGM & Training
WK 1: Participate in AGM & Training
WK 1: Participate in AGM & Training
WK 1: Participate in AGM & Training
WK 1: Participate in AGM & Training
39
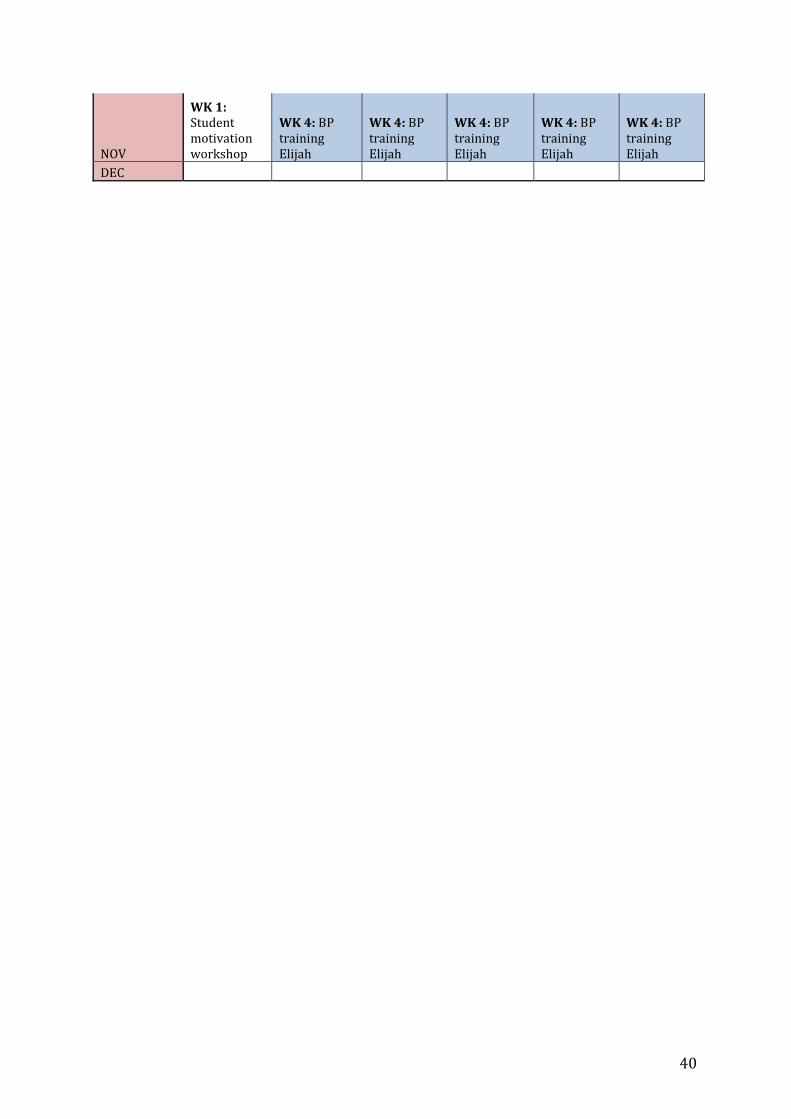
NOV
WK 1: Student motivation workshop
WK 4: BP training Elijah
WK 4: BP training Elijah
WK 4: BP training Elijah
WK 4: BP training Elijah
WK 4: BP training Elijah
DEC
40
Annex 5: guideline for trainers / coaches of Business plan training
AAA Business Plan Training – Guidelines for coaches
Step-by-step approach for efficient project planning, financial forecasting, and realistic writing up of a business idea for growing SME agrifood companies
Introduction The Business plan (or Investment plan) consists of three sections: Detailed planning of the investment project, Forecasting the financials of the investment project, and Writing the narrative of the investment project. The AAA approach is that before one letter is put on paper in the Narrative plan, see Section C, the AAA member being the Company owner him-/herself must first be able to explain in detail what the business idea is about. To achieve this the company owner is supported in detailed planning of each and every step of the investment, and on how to place each activity in a time frame. This is done through step 1: the Work plan format, see Section A. Once this plan is done and redone until complete, the AAA company owner is supported in forecasting the financials of the business idea. A start is already made by adding figures in the cells of the Work plan. Financials will be completed by following at least steps 2, 3 and 4 of Section B. In doing so, the AAA member is forced to put a price tag on the wish list of his/her investment. It will show the AAA company owner the projected difference between revenues (income) and total costs of the investment; support him/her in costing of hardware, and project cash flows per year (or quarter). From there the AAA company owner will see when flows of cash are negative and positive, and with that when external financing is required. Step 5: Projected balance sheets, can be done at a later stage. Then, with a good work plan (which has been done and redone various times to make it as efficient as possible) and good understanding and knowledge of cash flow requirements, the AAA company owner is in the position of writing a good Narrative business plan in Section C. In this Narrative plan he/she will write his business idea – yet now fully supported by facts and figures from Sections A and B. The Narrative plan zooms in on specific aspects of the planned investment, such as: the purpose, objectives and outcomes; the market, competition, marketing and sales; development impact; innovation; management and personnel; risks and assumptions; and monitoring and evaluation. Once the AAA business plan coach(es) agree with the AAA company owner on the final content of the full plan – sections A, B and C – and approve it, they will support the AAA member in submitting the plan to most suitable external financiers in the AAA network. Section A: Detailed planning of the investment project Step 1: Workplan In the workplan we will enter all the (sub)-activities the company will undertake in the (proposed) future. We help the company define, both in time and per key and sub-activity, what it is that it will do and what the outcome of that activity is. We do this in a timeline: we indicate in which Quarter of what year this will take place. We will think in a 4-year trajectory (below only shows 2015 and 2016). The Business plan coach will make use of this table to structure the key and sub elements of the new Business plan for the company. From one-on-one interviews and the BP workshop s/he will get a clear
41
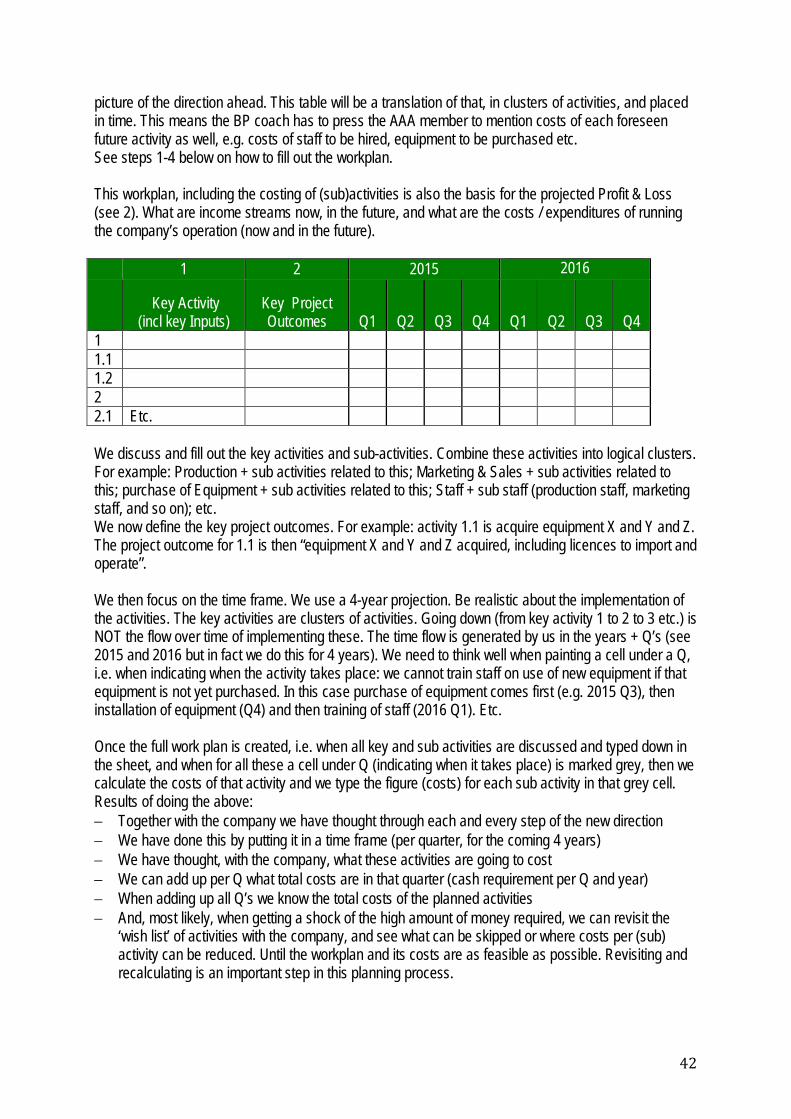
picture of the direction ahead. This table will be a translation of that, in clusters of activities, and placed in time. This means the BP coach has to press the AAA member to mention costs of each foreseen future activity as well, e.g. costs of staff to be hired, equipment to be purchased etc. See steps 1-4 below on how to fill out the workplan. This workplan, including the costing of (sub)activities is also the basis for the projected Profit & Loss (see 2). What are income streams now, in the future, and what are the costs / expenditures of running the company’s operation (now and in the future). 1 2 2015 2016
Key Activity
(incl key Inputs) Key Project Outcomes Q1 Q2 Q3 Q4 Q1 Q2 Q3 Q4
1 1.1
1.2 2
2.1 Etc.
We discuss and fill out the key activities and sub-activities. Combine these activities into logical clusters. For example: Production + sub activities related to this; Marketing & Sales + sub activities related to this; purchase of Equipment + sub activities related to this; Staff + sub staff (production staff, marketing staff, and so on); etc. We now define the key project outcomes. For example: activity 1.1 is acquire equipment X and Y and Z. The project outcome for 1.1 is then “equipment X and Y and Z acquired, including licences to import and operate”. We then focus on the time frame. We use a 4-year projection. Be realistic about the implementation of the activities. The key activities are clusters of activities. Going down (from key activity 1 to 2 to 3 etc.) is NOT the flow over time of implementing these. The time flow is generated by us in the years + Q’s (see 2015 and 2016 but in fact we do this for 4 years). We need to think well when painting a cell under a Q, i.e. when indicating when the activity takes place: we cannot train staff on use of new equipment if that equipment is not yet purchased. In this case purchase of equipment comes first (e.g. 2015 Q3), then installation of equipment (Q4) and then training of staff (2016 Q1). Etc. Once the full work plan is created, i.e. when all key and sub activities are discussed and typed down in the sheet, and when for all these a cell under Q (indicating when it takes place) is marked grey, then we calculate the costs of that activity and we type the figure (costs) for each sub activity in that grey cell. Results of doing the above: − Together with the company we have thought through each and every step of the new direction − We have done this by putting it in a time frame (per quarter, for the coming 4 years) − We have thought, with the company, what these activities are going to cost − We can add up per Q what total costs are in that quarter (cash requirement per Q and year) − When adding up all Q’s we know the total costs of the planned activities − And, most likely, when getting a shock of the high amount of money required, we can revisit the
‘wish list’ of activities with the company, and see what can be skipped or where costs per (sub) activity can be reduced. Until the workplan and its costs are as feasible as possible. Revisiting and recalculating is an important step in this planning process.
42
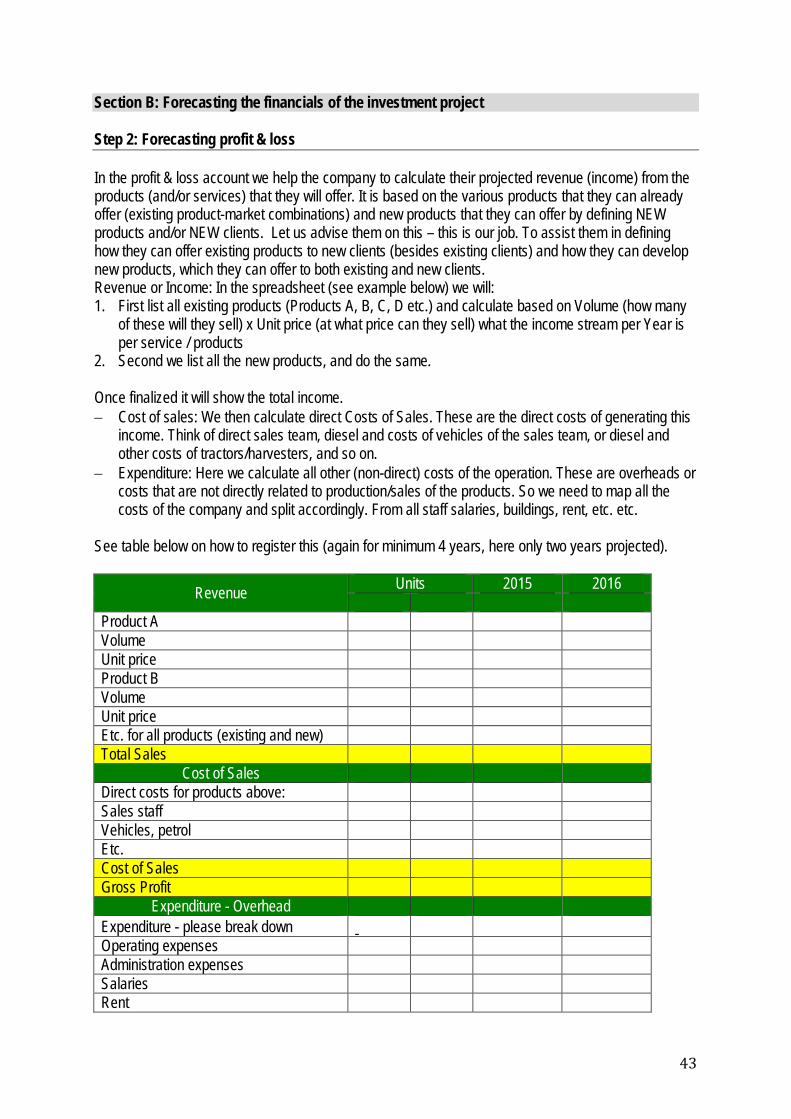
Section B: Forecasting the financials of the investment project Step 2: Forecasting profit & loss In the profit & loss account we help the company to calculate their projected revenue (income) from the products (and/or services) that they will offer. It is based on the various products that they can already offer (existing product-market combinations) and new products that they can offer by defining NEW products and/or NEW clients. Let us advise them on this – this is our job. To assist them in defining how they can offer existing products to new clients (besides existing clients) and how they can develop new products, which they can offer to both existing and new clients. Revenue or Income: In the spreadsheet (see example below) we will: 1. First list all existing products (Products A, B, C, D etc.) and calculate based on Volume (how many
of these will they sell) x Unit price (at what price can they sell) what the income stream per Year is per service / products
2. Second we list all the new products, and do the same. Once finalized it will show the total income. − Cost of sales: We then calculate direct Costs of Sales. These are the direct costs of generating this
income. Think of direct sales team, diesel and costs of vehicles of the sales team, or diesel and other costs of tractors/harvesters, and so on.
− Expenditure: Here we calculate all other (non-direct) costs of the operation. These are overheads or costs that are not directly related to production/sales of the products. So we need to map all the costs of the company and split accordingly. From all staff salaries, buildings, rent, etc. etc.
See table below on how to register this (again for minimum 4 years, here only two years projected).
Revenue Units 2015 2016
Product A Volume Unit price Product B Volume Unit price Etc. for all products (existing and new) Total Sales
Cost of Sales Direct costs for products above: Sales staff Vehicles, petrol Etc. Cost of Sales Gross Profit
Expenditure - Overhead Expenditure - please break down Operating expenses Administration expenses Salaries Rent
43
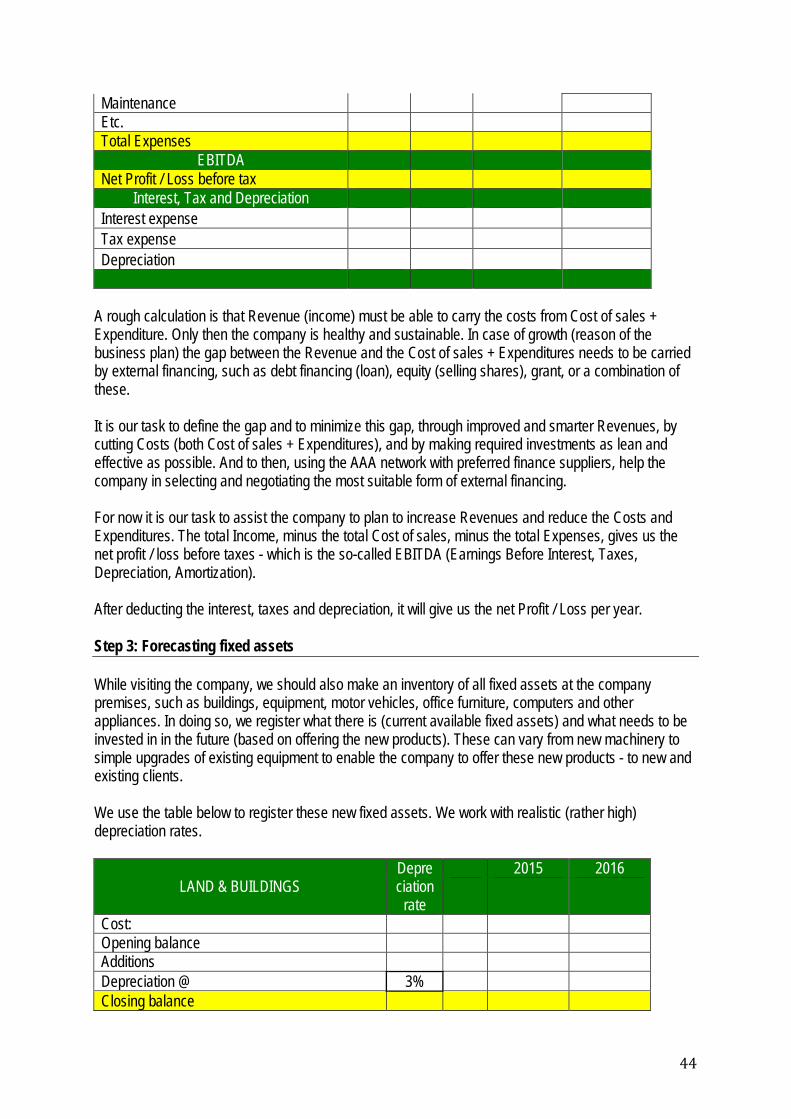
Maintenance Etc. Total Expenses
EBITDA Net Profit / Loss before tax
Interest, Tax and Depreciation Interest expense Tax expense Depreciation
A rough calculation is that Revenue (income) must be able to carry the costs from Cost of sales + Expenditure. Only then the company is healthy and sustainable. In case of growth (reason of the business plan) the gap between the Revenue and the Cost of sales + Expenditures needs to be carried by external financing, such as debt financing (loan), equity (selling shares), grant, or a combination of these. It is our task to define the gap and to minimize this gap, through improved and smarter Revenues, by cutting Costs (both Cost of sales + Expenditures), and by making required investments as lean and effective as possible. And to then, using the AAA network with preferred finance suppliers, help the company in selecting and negotiating the most suitable form of external financing. For now it is our task to assist the company to plan to increase Revenues and reduce the Costs and Expenditures. The total Income, minus the total Cost of sales, minus the total Expenses, gives us the net profit / loss before taxes - which is the so-called EBITDA (Earnings Before Interest, Taxes, Depreciation, Amortization). After deducting the interest, taxes and depreciation, it will give us the net Profit / Loss per year. Step 3: Forecasting fixed assets While visiting the company, we should also make an inventory of all fixed assets at the company premises, such as buildings, equipment, motor vehicles, office furniture, computers and other appliances. In doing so, we register what there is (current available fixed assets) and what needs to be invested in in the future (based on offering the new products). These can vary from new machinery to simple upgrades of existing equipment to enable the company to offer these new products - to new and existing clients. We use the table below to register these new fixed assets. We work with realistic (rather high) depreciation rates.
LAND & BUILDINGS Depreciation
rate
2015 2016
Cost: Opening balance Additions Depreciation @ 3% Closing balance
44
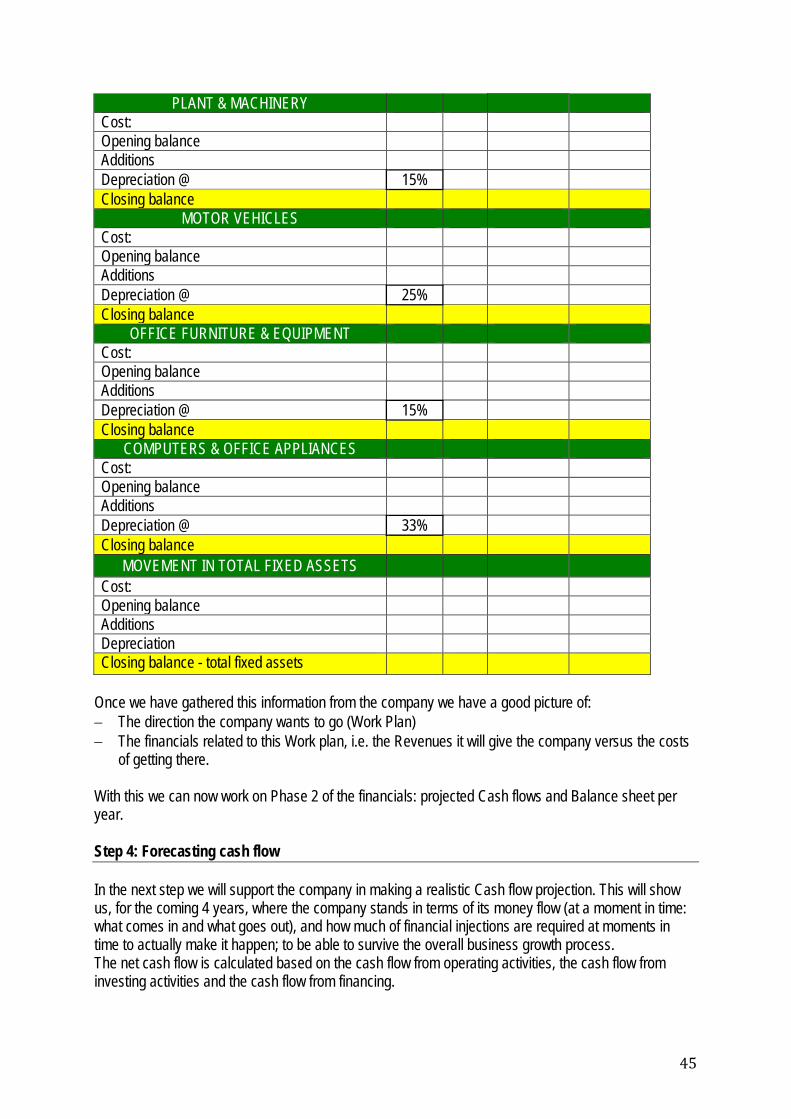
PLANT & MACHINERY Cost: Opening balance Additions Depreciation @ 15% Closing balance
MOTOR VEHICLES Cost: Opening balance Additions Depreciation @ 25% Closing balance
OFFICE FURNITURE & EQUIPMENT Cost: Opening balance Additions Depreciation @ 15% Closing balance
COMPUTERS & OFFICE APPLIANCES Cost: Opening balance Additions Depreciation @ 33% Closing balance
MOVEMENT IN TOTAL FIXED ASSETS Cost: Opening balance Additions Depreciation Closing balance - total fixed assets
Once we have gathered this information from the company we have a good picture of: − The direction the company wants to go (Work Plan) − The financials related to this Work plan, i.e. the Revenues it will give the company versus the costs
of getting there. With this we can now work on Phase 2 of the financials: projected Cash flows and Balance sheet per year. Step 4: Forecasting cash flow In the next step we will support the company in making a realistic Cash flow projection. This will show us, for the coming 4 years, where the company stands in terms of its money flow (at a moment in time: what comes in and what goes out), and how much of financial injections are required at moments in time to actually make it happen; to be able to survive the overall business growth process. The net cash flow is calculated based on the cash flow from operating activities, the cash flow from investing activities and the cash flow from financing.
45
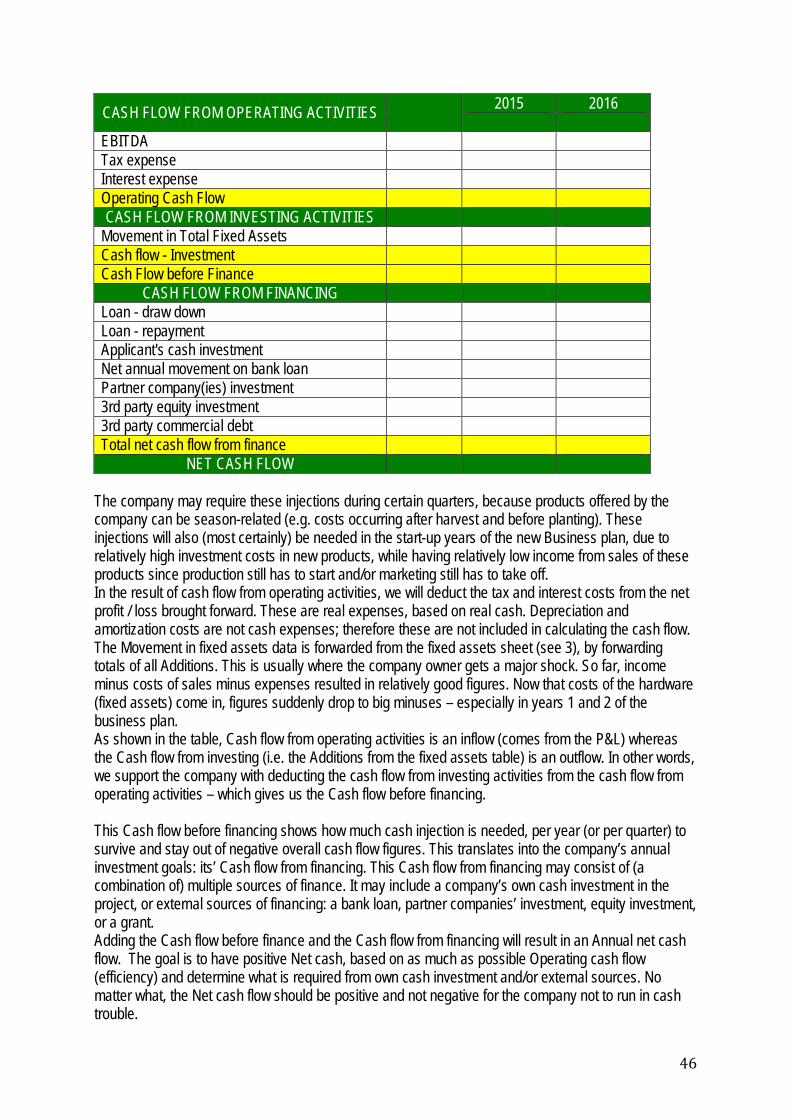
CASH FLOW FROM OPERATING ACTIVITIES 2015 2016
EBITDA Tax expense Interest expense Operating Cash Flow CASH FLOW FROM INVESTING ACTIVITIES
Movement in Total Fixed Assets Cash flow - Investment Cash Flow before Finance
CASH FLOW FROM FINANCING Loan - draw down Loan - repayment Applicant's cash investment Net annual movement on bank loan Partner company(ies) investment 3rd party equity investment 3rd party commercial debt Total net cash flow from finance
NET CASH FLOW The company may require these injections during certain quarters, because products offered by the company can be season-related (e.g. costs occurring after harvest and before planting). These injections will also (most certainly) be needed in the start-up years of the new Business plan, due to relatively high investment costs in new products, while having relatively low income from sales of these products since production still has to start and/or marketing still has to take off. In the result of cash flow from operating activities, we will deduct the tax and interest costs from the net profit / loss brought forward. These are real expenses, based on real cash. Depreciation and amortization costs are not cash expenses; therefore these are not included in calculating the cash flow. The Movement in fixed assets data is forwarded from the fixed assets sheet (see 3), by forwarding totals of all Additions. This is usually where the company owner gets a major shock. So far, income minus costs of sales minus expenses resulted in relatively good figures. Now that costs of the hardware (fixed assets) come in, figures suddenly drop to big minuses – especially in years 1 and 2 of the business plan. As shown in the table, Cash flow from operating activities is an inflow (comes from the P&L) whereas the Cash flow from investing (i.e. the Additions from the fixed assets table) is an outflow. In other words, we support the company with deducting the cash flow from investing activities from the cash flow from operating activities – which gives us the Cash flow before financing. This Cash flow before financing shows how much cash injection is needed, per year (or per quarter) to survive and stay out of negative overall cash flow figures. This translates into the company’s annual investment goals: its’ Cash flow from financing. This Cash flow from financing may consist of (a combination of) multiple sources of finance. It may include a company’s own cash investment in the project, or external sources of financing: a bank loan, partner companies’ investment, equity investment, or a grant. Adding the Cash flow before finance and the Cash flow from financing will result in an Annual net cash flow. The goal is to have positive Net cash, based on as much as possible Operating cash flow (efficiency) and determine what is required from own cash investment and/or external sources. No matter what, the Net cash flow should be positive and not negative for the company not to run in cash trouble.
46
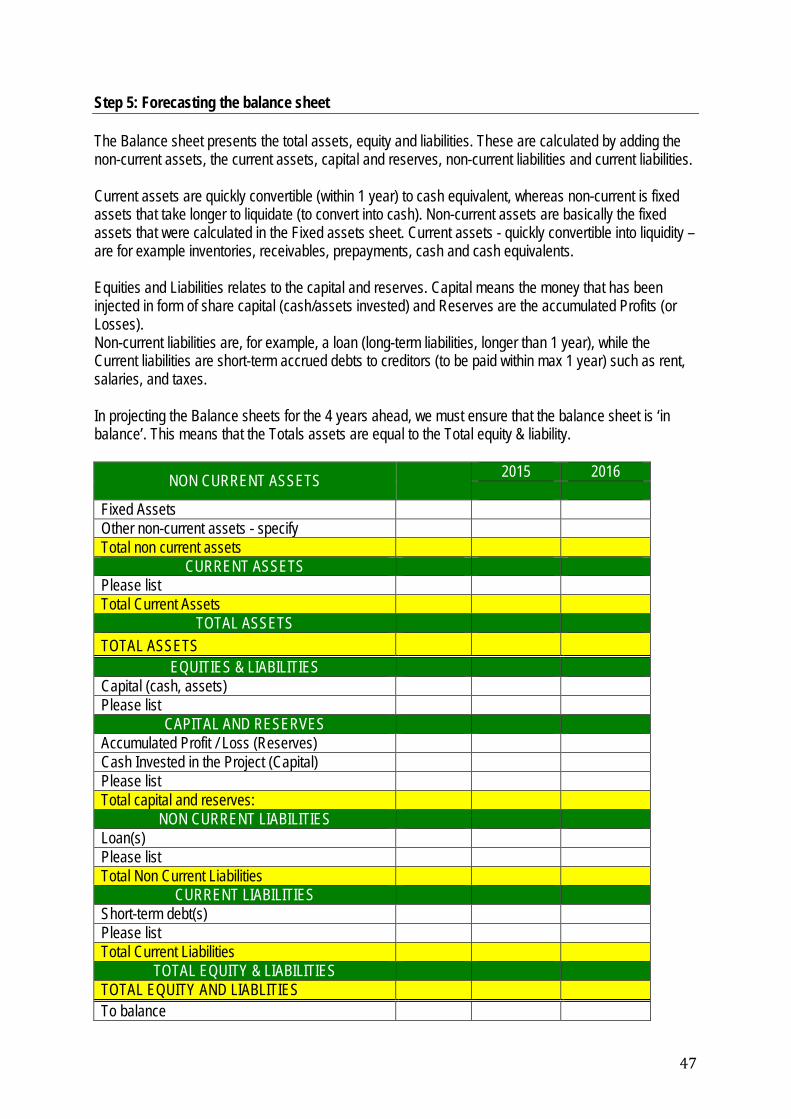
Step 5: Forecasting the balance sheet The Balance sheet presents the total assets, equity and liabilities. These are calculated by adding the non-current assets, the current assets, capital and reserves, non-current liabilities and current liabilities. Current assets are quickly convertible (within 1 year) to cash equivalent, whereas non-current is fixed assets that take longer to liquidate (to convert into cash). Non-current assets are basically the fixed assets that were calculated in the Fixed assets sheet. Current assets - quickly convertible into liquidity – are for example inventories, receivables, prepayments, cash and cash equivalents. Equities and Liabilities relates to the capital and reserves. Capital means the money that has been injected in form of share capital (cash/assets invested) and Reserves are the accumulated Profits (or Losses). Non-current liabilities are, for example, a loan (long-term liabilities, longer than 1 year), while the Current liabilities are short-term accrued debts to creditors (to be paid within max 1 year) such as rent, salaries, and taxes. In projecting the Balance sheets for the 4 years ahead, we must ensure that the balance sheet is ‘in balance’. This means that the Totals assets are equal to the Total equity & liability.
NON CURRENT ASSETS 2015 2016
Fixed Assets Other non-current assets - specify Total non current assets
CURRENT ASSETS Please list Total Current Assets
TOTAL ASSETS TOTAL ASSETS
EQUITIES & LIABILITIES Capital (cash, assets) Please list
CAPITAL AND RESERVES Accumulated Profit / Loss (Reserves) Cash Invested in the Project (Capital) Please list Total capital and reserves:
NON CURRENT LIABILITIES Loan(s) Please list Total Non Current Liabilities
CURRENT LIABILITIES Short-term debt(s) Please list Total Current Liabilities
TOTAL EQUITY & LIABILITIES TOTAL EQUITY AND LIABLITIES To balance
47
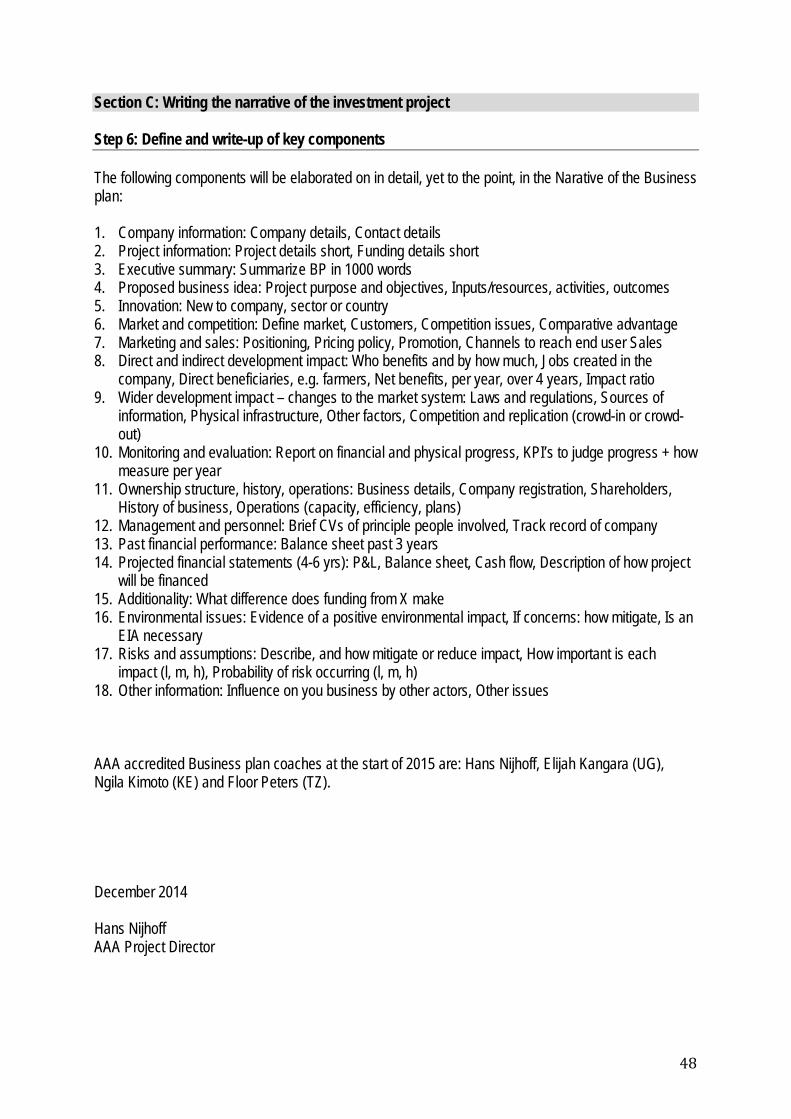
Section C: Writing the narrative of the investment project Step 6: Define and write-up of key components The following components will be elaborated on in detail, yet to the point, in the Narative of the Business plan: 1. Company information: Company details, Contact details 2. Project information: Project details short, Funding details short 3. Executive summary: Summarize BP in 1000 words 4. Proposed business idea: Project purpose and objectives, Inputs/resources, activities, outcomes 5. Innovation: New to company, sector or country 6. Market and competition: Define market, Customers, Competition issues, Comparative advantage 7. Marketing and sales: Positioning, Pricing policy, Promotion, Channels to reach end user Sales 8. Direct and indirect development impact: Who benefits and by how much, Jobs created in the
company, Direct beneficiaries, e.g. farmers, Net benefits, per year, over 4 years, Impact ratio 9. Wider development impact – changes to the market system: Laws and regulations, Sources of
information, Physical infrastructure, Other factors, Competition and replication (crowd-in or crowd-out)
10. Monitoring and evaluation: Report on financial and physical progress, KPI’s to judge progress + how measure per year
11. Ownership structure, history, operations: Business details, Company registration, Shareholders, History of business, Operations (capacity, efficiency, plans)
12. Management and personnel: Brief CVs of principle people involved, Track record of company 13. Past financial performance: Balance sheet past 3 years 14. Projected financial statements (4-6 yrs): P&L, Balance sheet, Cash flow, Description of how project
will be financed 15. Additionality: What difference does funding from X make 16. Environmental issues: Evidence of a positive environmental impact, If concerns: how mitigate, Is an
EIA necessary 17. Risks and assumptions: Describe, and how mitigate or reduce impact, How important is each
impact (l, m, h), Probability of risk occurring (l, m, h) 18. Other information: Influence on you business by other actors, Other issues AAA accredited Business plan coaches at the start of 2015 are: Hans Nijhoff, Elijah Kangara (UG), Ngila Kimoto (KE) and Floor Peters (TZ). December 2014 Hans Nijhoff AAA Project Director
48
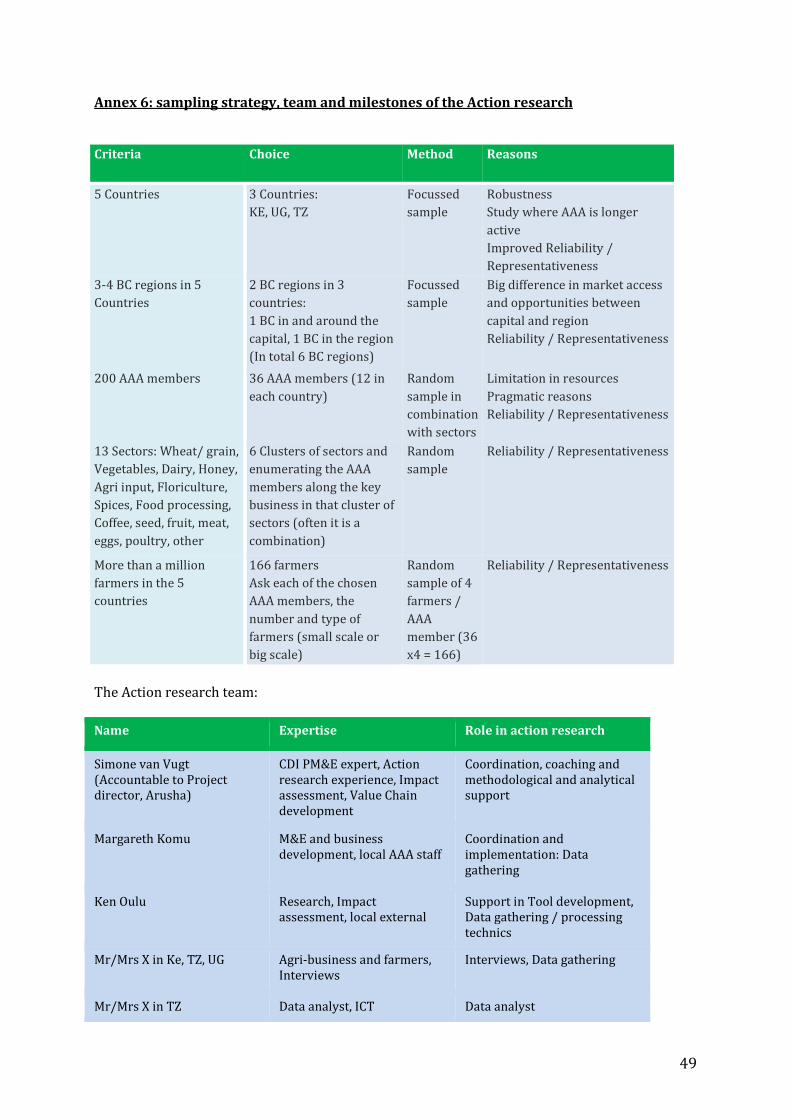
Annex 6: sampling strategy, team and milestones of the Action research Criteria Choice Method Reasons
5 Countries 3 Countries: KE, UG, TZ
Focussed sample
Robustness Study where AAA is longer active Improved Reliability / Representativeness
3-4 BC regions in 5 Countries
2 BC regions in 3 countries: 1 BC in and around the capital, 1 BC in the region (In total 6 BC regions)
Focussed sample
Big difference in market access and opportunities between capital and region Reliability / Representativeness
200 AAA members 36 AAA members (12 in each country)
Random sample in combination with sectors
Limitation in resources Pragmatic reasons Reliability / Representativeness
13 Sectors: Wheat/ grain, Vegetables, Dairy, Honey, Agri input, Floriculture, Spices, Food processing, Coffee, seed, fruit, meat, eggs, poultry, other
6 Clusters of sectors and enumerating the AAA members along the key business in that cluster of sectors (often it is a combination)
Random sample
Reliability / Representativeness
More than a million farmers in the 5 countries
166 farmers Ask each of the chosen AAA members, the number and type of farmers (small scale or big scale)
Random sample of 4 farmers / AAA member (36 x4 = 166)
Reliability / Representativeness
The Action research team: Name Expertise Role in action research
Simone van Vugt (Accountable to Project director, Arusha)
CDI PM&E expert, Action research experience, Impact assessment, Value Chain development
Coordination, coaching and methodological and analytical support
Margareth Komu M&E and business development, local AAA staff
Coordination and implementation: Data gathering
Ken Oulu Research, Impact assessment, local external
Support in Tool development, Data gathering / processing technics
Mr/Mrs X in Ke, TZ, UG Agri-business and farmers, Interviews
Interviews, Data gathering
Mr/Mrs X in TZ Data analyst, ICT Data analyst
49
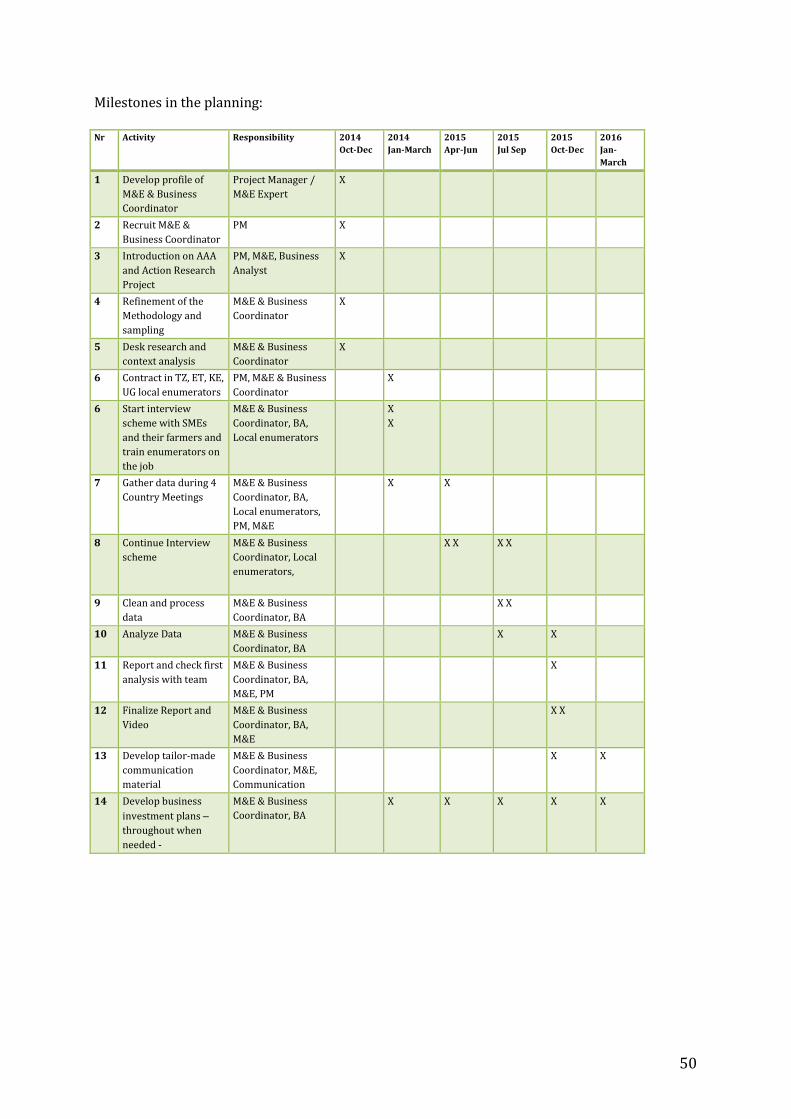
Milestones in the planning:
Nr Activity Responsibility 2014 Oct-Dec 2014
Jan-March 2015 Apr-Jun 2015
Jul Sep 2015 Oct-Dec 2016
Jan-March
1 Develop profile of M&E & Business Coordinator
Project Manager / M&E Expert X
2 Recruit M&E & Business Coordinator PM X
3 Introduction on AAA and Action Research Project
PM, M&E, Business Analyst X
4 Refinement of the Methodology and sampling
M&E & Business Coordinator X
5 Desk research and context analysis M&E & Business
Coordinator X 6 Contract in TZ, ET, KE,
UG local enumerators PM, M&E & Business Coordinator X
6 Start interview scheme with SMEs and their farmers and train enumerators on the job
M&E & Business Coordinator, BA, Local enumerators
X X
7 Gather data during 4 Country Meetings M&E & Business
Coordinator, BA, Local enumerators, PM, M&E
X X
8 Continue Interview scheme M&E & Business
Coordinator, Local enumerators,
X X X X
9 Clean and process data M&E & Business
Coordinator, BA X X 10 Analyze Data M&E & Business
Coordinator, BA X X 11 Report and check first
analysis with team M&E & Business Coordinator, BA, M&E, PM
X
12 Finalize Report and Video M&E & Business
Coordinator, BA, M&E
X X
13 Develop tailor-made communication material
M&E & Business Coordinator, M&E, Communication
X X
14 Develop business investment plans – throughout when needed -
M&E & Business Coordinator, BA X X X X X
50
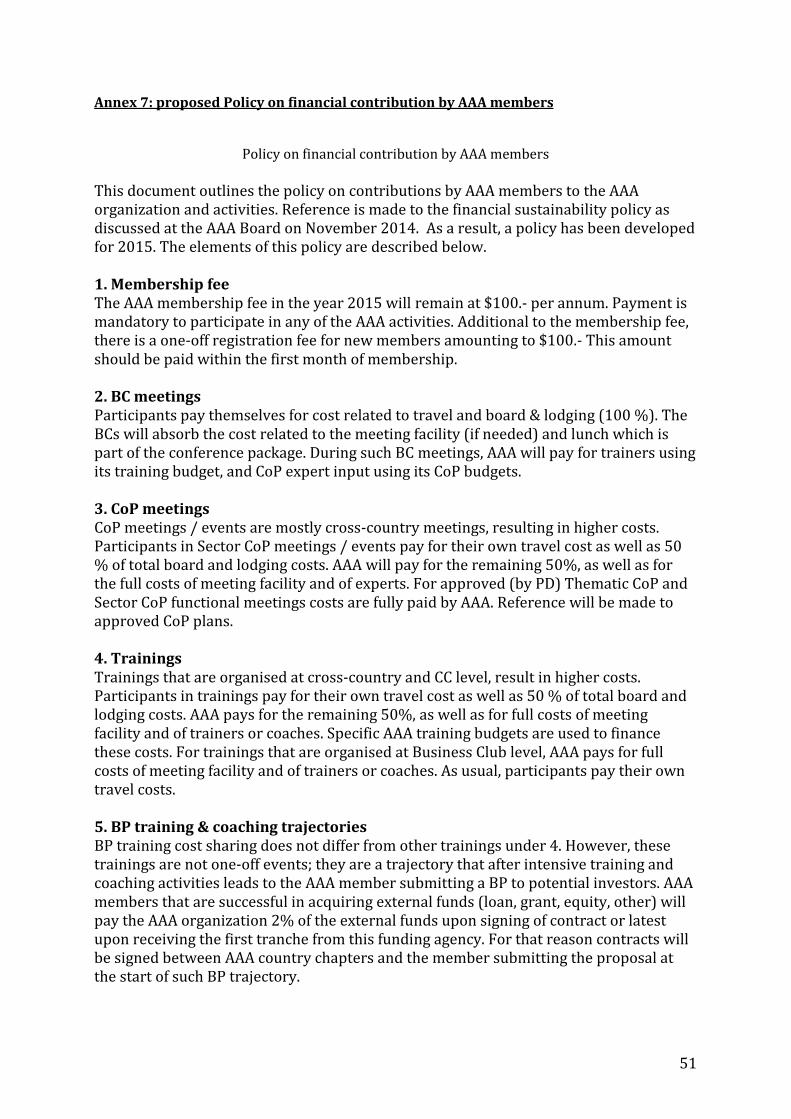
Annex 7: proposed Policy on financial contribution by AAA members
Policy on financial contribution by AAA members This document outlines the policy on contributions by AAA members to the AAA organization and activities. Reference is made to the financial sustainability policy as discussed at the AAA Board on November 2014. As a result, a policy has been developed for 2015. The elements of this policy are described below. 1. Membership fee The AAA membership fee in the year 2015 will remain at $100.- per annum. Payment is mandatory to participate in any of the AAA activities. Additional to the membership fee, there is a one-off registration fee for new members amounting to $100.- This amount should be paid within the first month of membership. 2. BC meetings Participants pay themselves for cost related to travel and board & lodging (100 %). The BCs will absorb the cost related to the meeting facility (if needed) and lunch which is part of the conference package. During such BC meetings, AAA will pay for trainers using its training budget, and CoP expert input using its CoP budgets. 3. CoP meetings CoP meetings / events are mostly cross-country meetings, resulting in higher costs. Participants in Sector CoP meetings / events pay for their own travel cost as well as 50 % of total board and lodging costs. AAA will pay for the remaining 50%, as well as for the full costs of meeting facility and of experts. For approved (by PD) Thematic CoP and Sector CoP functional meetings costs are fully paid by AAA. Reference will be made to approved CoP plans. 4. Trainings Trainings that are organised at cross-country and CC level, result in higher costs. Participants in trainings pay for their own travel cost as well as 50 % of total board and lodging costs. AAA pays for the remaining 50%, as well as for full costs of meeting facility and of trainers or coaches. Specific AAA training budgets are used to finance these costs. For trainings that are organised at Business Club level, AAA pays for full costs of meeting facility and of trainers or coaches. As usual, participants pay their own travel costs. 5. BP training & coaching trajectories BP training cost sharing does not differ from other trainings under 4. However, these trainings are not one-off events; they are a trajectory that after intensive training and coaching activities leads to the AAA member submitting a BP to potential investors. AAA members that are successful in acquiring external funds (loan, grant, equity, other) will pay the AAA organization 2% of the external funds upon signing of contract or latest upon receiving the first tranche from this funding agency. For that reason contracts will be signed between AAA country chapters and the member submitting the proposal at the start of such BP trajectory.
51
6. Fairs and other commercial events Participants pay for own individual costs. In some cases, as part of BC/CC plans, the BC/CC contributes to a joint AAA exhibition stand. 7. AAA general meetings In the case of functional AAA meetings, such as for Pan Africa board meetings, AGM (country level) and specific CC/BC/CoP planning meetings, cost will be absorbed by AAA for those members that are specifically invited to be present – such invitation is to be authorized by the SG or PD. 8. General remark It is common practice that all meetings (BC, CC, CoP etc.) are organized at a location that keeps costs under control and at affordable levels.
52
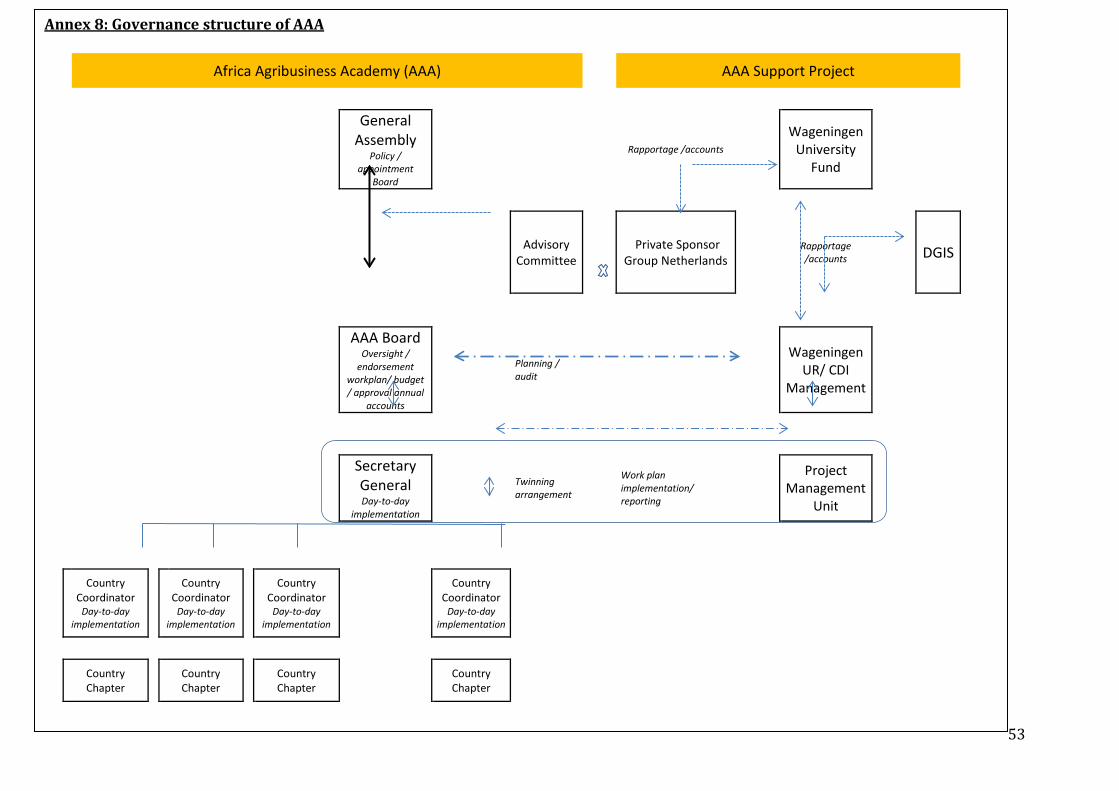
Annex 8: governance structure of AAA
Annex 8: Governance structure of AAA
Africa Agribusiness Academy (AAA) AAA Support Project
General Assembly
Policy / appointment
Board
Rapportage /accounts
Wageningen University
Fund
Advisory Committee
Private Sponsor Group Netherlands
Rapportage /accounts
DGIS
AAA Board Oversight /
endorsement workplan/ budget / approval annual
accounts
Planning / audit
Wageningen UR/ CDI
Management
Secretary General Day-to-day
implementation
Twinning arrangement
Work plan implementation/ reporting
Project Management
Unit
Country Coordinator
Day-to-day implementation
Country Coordinator
Day-to-day implementation
Country Coordinator
Day-to-day implementation
Country Coordinator
Day-to-day implementation
Country Chapter
Country Chapter
Country Chapter
Country Chapter
53
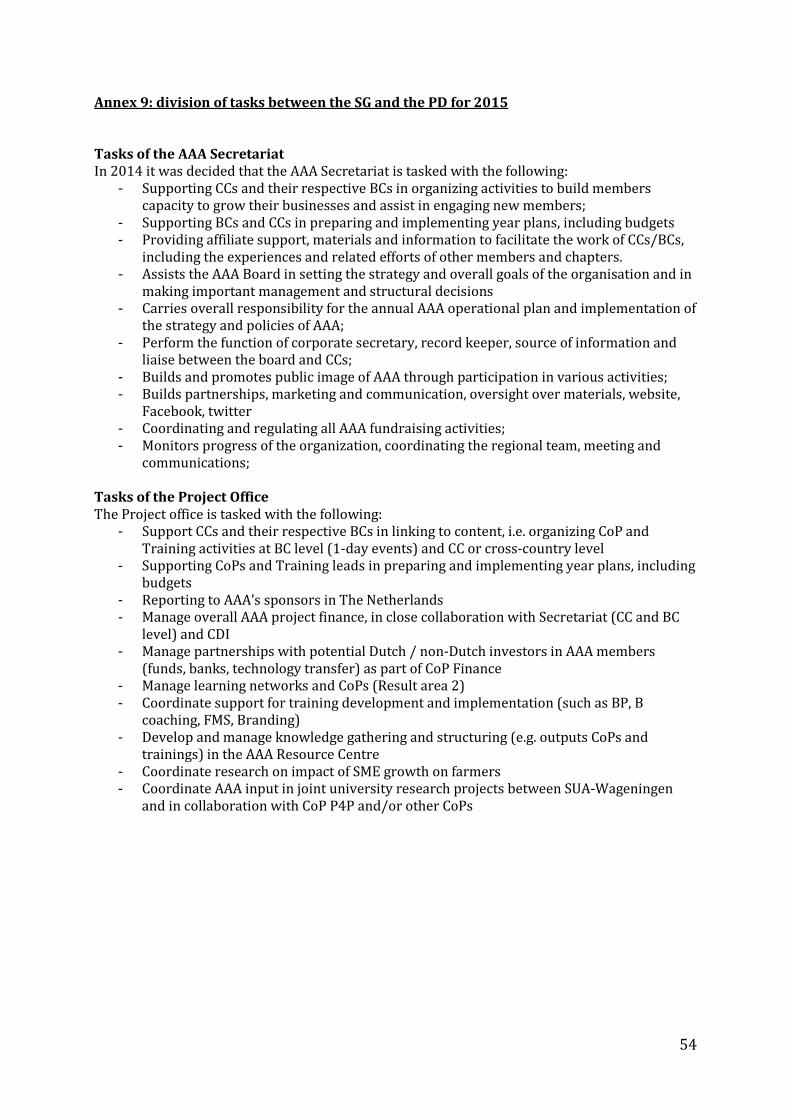
Annex 9: division of tasks between the SG and the PD for 2015 Tasks of the AAA Secretariat In 2014 it was decided that the AAA Secretariat is tasked with the following:
- Supporting CCs and their respective BCs in organizing activities to build members capacity to grow their businesses and assist in engaging new members;
- Supporting BCs and CCs in preparing and implementing year plans, including budgets - Providing affiliate support, materials and information to facilitate the work of CCs/BCs,
including the experiences and related efforts of other members and chapters. - Assists the AAA Board in setting the strategy and overall goals of the organisation and in
making important management and structural decisions - Carries overall responsibility for the annual AAA operational plan and implementation of
the strategy and policies of AAA; - Perform the function of corporate secretary, record keeper, source of information and
liaise between the board and CCs; - Builds and promotes public image of AAA through participation in various activities; - Builds partnerships, marketing and communication, oversight over materials, website,
Facebook, twitter - Coordinating and regulating all AAA fundraising activities; - Monitors progress of the organization, coordinating the regional team, meeting and
communications; Tasks of the Project Office The Project office is tasked with the following:
- Support CCs and their respective BCs in linking to content, i.e. organizing CoP and Training activities at BC level (1-day events) and CC or cross-country level
- Supporting CoPs and Training leads in preparing and implementing year plans, including budgets
- Reporting to AAA’s sponsors in The Netherlands - Manage overall AAA project finance, in close collaboration with Secretariat (CC and BC
level) and CDI - Manage partnerships with potential Dutch / non-Dutch investors in AAA members
(funds, banks, technology transfer) as part of CoP Finance - Manage learning networks and CoPs (Result area 2) - Coordinate support for training development and implementation (such as BP, B
coaching, FMS, Branding) - Develop and manage knowledge gathering and structuring (e.g. outputs CoPs and
trainings) in the AAA Resource Centre - Coordinate research on impact of SME growth on farmers - Coordinate AAA input in joint university research projects between SUA-Wageningen
and in collaboration with CoP P4P and/or other CoPs
54


![Phenomenology in Contact Archaeology [AAA 2013]](https://static.fdokumen.com/doc/165x107/6319d63f77252cbc1a0ee287/phenomenology-in-contact-archaeology-aaa-2013.jpg)