Nutrient management in China Part 1 Nutrient balances and ...
428
Nutrient management in China Part 1 Nutrient balances and nutrient cycling in agro-ecosystems w .. ... .. ............. ... .. ....... ..... .. ...... .. ..... ......... .. ..... ... 4 v-: %vp AN "lip % ih vnn HU 2 mmn- h.-H F. imA ::E", iz I -w NER R h M 0. H. 2 .- LAH n2 fl.: FUq ER M M IN Nx .H " qmm . "U NN .n nn q .Njqi vm M NN Kfl% Nq mq PI S M. 04 7h:7 A V M,I . :0 dn, :H,%: F%M % H.
-
Upload
khangminh22 -
Category
Documents
-
view
0 -
download
0
Transcript of Nutrient management in China Part 1 Nutrient balances and ...
Nutrient management in ChinaPart 1Nutrient balances and nutrient cyclingin agro-ecosystems
w .. ... .. .............
... .. ............ .. ...... .. ..... ......... .. ..... ... 4v-: %vp AN "lip% ih vnnHU 2 mmn-h.-H F. imA ::E", iz I -w
NER R h M 0. H.2 .- LAH n2 fl.: FUq
ERMMIN
Nx.H" qmm ."U NN .n n n q
.Njqivm M
NN Kfl% Nq mqPIS M. 04 7h:7 A VM, I . :0 dn, :H,%:
F%M % H.


Nutrient management in China - Part I
Nutrient balances and nutrient cycling in agro-ecosystems


Nutrient management in China
Part I
Nutrient balances and nutrient cycling in agro-ecosystems
Edited by:
Rolf H5irdterCo-ordinator East Asia, International Potash Institute (IPI)c/o KMA, K+S KALI GmbH, Bertha-von-Suttner-Str.734131 Kassel, GermanyTel. +49-561-9301-2339, Fax. +49-561-9301-1416E-mail. rolf.haerdter(ckali-imbh.com
Jian-Chang Xie, Jian-Min Zhou and Fan Qin-ZhenInstitute of Soil Science, Academia Sinica,P.O.Box 821, Nanjing, P.R. ChinaTel. +86-25-86881585, Fax. +86-25-86881000E-mail. imzhouOns.issas.ac.cn. fanoinzhenosina.com.cn.
0iflZ6.. Institute of Soil ScienceAcademia SinicaP.O.Box 821Nanjing,P.R. China
fInternational Potash InstituteP.O.Box 1609CH-4001 BaselSwitzerland

© All rights held by : International Potash InstituteSchneidergasse 27B.O.Box 1609CH-4001 BaselSwitzerlandPhone: +41-612612922Telefax: +41-612612925E-mail: ipi(.ipipotash.orgWeb: wAw.ipipotash.org
This Country Report is based, in part, on a workshop that was held on nutrient cyclingand management in agro-ecosystems of China, held in Haikou, Hainan, 1999 whichhas been published as Proceedings in Chinese language by Zhou, J.M., Fan, Q.Z., XieJ.C. and H5rdter, R. (2000) (ISBN 7-5630-1553-1/S25). The presented book is an up-dated translation of the Chinese version, including recent developments in the fertiliza-tion practices as described by the various authors.
The editors would like to thank Mr. Wen-Qin Zheng of ISSCAS for his skilful transla-tion of the Chinese papers into English
Layout: Ursula Hartung, K+S KALI GmbH, P.O.Box 102029, 34111 Kassel, Germany
Printing: Druckerei Rindt, Fulda, Germany
2

Contents
page
Introductionto the theme
Hdrdter, R. Understanding the nutrient cycles and nutrient bal-ances at different scales to improve nutrient supplyand allocation to agricultural systems .................. 9
Chapter I GLOBAL AND REGIONAL NUTRIENTB A L A N C E S .......................................................... . I
Krauss, A. Nutrient cycling and transfers in the globaldim ension .......................................................... 13
Uebel, E. Development in nutrient balances in croppingsystems of transitional economies in Central/EasternE u rope ........................................................................ 25
Messick, D. L. Sulphur balance and sulphur requirements inC hinese agriculture ................................................... 35
Zhou, J, Chen, X, Nutrient balance and nutrient management in agro-Xie, J. and Hiirdter. R. ecosystems of China ....................................... 41
Li. J., Lin. B., Liang. G. Prospects for mineral fertilizer use in China ............ 55and Shen, G.
Chapter II FARMLAND NUTRIENT BALANCES ANDFERTILIZER REQUIREMENT OF NORTH-E RN C H IN A ................................................... 67
Jin, J. and Liu, R. Circulation and regulation of potassium in the soil-plant system under major cropping systems ofN orthern C hina ............................................. 69
Wu, Y. Wang, Y and Nutrient cycle and farmland nutrient balances of theSun, B. Heilongjiang Province .................................... 83
Huang, J. Zhang, J. and Analysis of the soil nutrient status of farmland andLui, Z prediction of the mineral fertilizer demand in the
Jilin Province ............................................... 89
Lu, Y.. Qin, S. and Nutrient status of farmland soils in the Hebei Prov-Feng, H. ince and approaches to its improvement ............... 95
Liu, Z., Jiang, L. and Status quo and prospects for the use of mineral fer-Zhang. Y tilizers in the Shandong Province ..................... 101
Ma, W., Mao, D and Allocation of fertilizer nutrients to various crops inZhang, F. the Shandong Province .................................... 109
3

Yan, P. and Mi, Y. NPK balance in farmland soils and future strategyfor fertilization in the Shandong Province .............. 117
Jiao, Y., Duan, G. and Farmland nutrient balances and prediction of theQiao, W. mineral fertilizer requirement for the 21st century in
H enan ........................................................ 12 5
Yang, X, Zhang, S., Nutrient cycle and nutrient balances in the farmlandWang, X, Tong, Y, eco-system of the Shaanxi province ..................... 133Sun, B. and Zhao, H.
Chapter III FARMLAND NUTRIENT BALANCE ANDFERTILIZER REQUIREMENT OF SOUTH-ERN C H INA ............................................... 145
Dong, Y, Wang, X. and Spatial and temporal variation in the nutrient cycleXu, Q. of rice fields in Jiangsu .................................... 147
Du, C. and Zhang, Z. Farmland nutrient balances in the Jiangsu Province... 153
Yin, G., Liti, L., Xu, X., Changes in soil fertility and prediction of fertilizerGao, Q. and Liang, Y demand in Jiangsu .......................................... 161
Tian, J. and Wang, Y The status quo of and a strategy for farmland nutri-ent balance in Shanghai .................................... 175
Ye, S. and Cao, S. Fertilization and farmland nutrient balance in Anhui,status quo and outlook .................................... 181
Xu, N., Li, J. and K cycle and nutrient balance in farmland of theZhang, D . Hubei Province .............................................. 191
Dai, P., Nie, J., Litt, X. Farmland nutrient cycle and nutrient balances inand Yi, G. different eco-regions of the Hunan Province ........... 201
Li, Z., Tao, Q., Liu, G. Farmland NPK nutrient balance and management inand Litt, Y. Jiangxi ....................................................... 2 11
Zhang, Y and Zheng. H Farmland nutrient balance, a strategy for its im-provement and the prediction of future fertilizerdemand in the Guangdong Province ..................... 223
Feng. W., Ta, S., Fu, T, Farmland nutrient cycle and nutrient balance inChen, Q. and Liao, M . Sichuan ...................................................... 231
Tan, H., Zhou, L. and Farmland nutrient cycle and nutrient balances inX ie, R. G uangxi ...................................................... 24 1
Li, S., Zhang, J. and Changes in the supply of major nutrients in paddyHuang, S. soils and rational fertilization in Guangxi ............... 251
Chen Li. Trends of changes in the farmland nutrient statusin the Hainan Province and suggested methods forim provem ent ................................................ 259
4

Chapter IV ON-SITE STUDIES OF FARMLAND NUTRI-ENT BALANCES AND RATIONALFERTILIZATIO N ............................................ 267
Witt, C., Wang, G., Balanced nutrition and nutrient balances in irrigatedDobermann. A., Sun, Q. rice: a case study in the Zhejiang Province, PRand Fu, R. C hina ......................................................... 269
Xi, Z "Cascade" Experiment on fertilizer efficiency andnutrient balance ............................................. 285
Qin, S., Gu, Y and Crop response to fertilizer application and nutrientZhu, Z balance in a fluvio-aquic soil ............................. 297
Lai, Q., Li, C., Lai, T, Nutrient balance of a rice-rice rotation in paddyHuang, Q. and Yu, J. fields of a red earth soil of Jiangxi ....................... 309
Suit, G. Residual effects of mineral fertilizers and organicmanure and their impact on soil nutrients in a long-term experim ent ............................................ 3 17
Liu, Y, Zhang, 0., Soil K status and crop response of wheat toHe, Y., Li, Z and K application in the wheat production area of South-Q iao, H . em Shanxi ................................................... 323
He, C., Sun, X and Effects of K application to a long-term crop rotationQiu, G. of rice, wheat and oilseed rape on yields and soil
fertility ....................................................... 3 3 1
Chapter V NUTRIENT MANAGEMENT IN PERENNIALCROPS, CASH CROPS.AND IN SPECIAL AP-PLIC A T IO N S ............................................. 343
Hdrdter, R. Nutrient turnover and requirements in perennialcrops using oil palm as an example ..................... 345
Magen, H. Recirculating nutrient solutions in greenhouseproduction ................................................... 359
Ruan, J. and Wu, X Nutrient input and evaluation of fertilizationefficiency in typical tea growing areas of China ....... 367
Zhou, Y, Zhang, J., Nutrient balances of vegetable cropping systems andHuang, F., Zhu, J. and their control by fertilization in Tianjin .................. 377Wang, Z.
Lin, Z., Li, S., Cha, Z Fertility of soils under rubber plantations andand Yu, R. fertilizer application in tropical China .................. 389
Xie, L. Pan. S. and Nutrient status and management of tropical fruitZhang, W. crops on Hainan Island .................................... 403
Qi, Z and Tang, S. Study on sustainable use of tropical forage andgrassland in Hainan ........................................ 4 13
5

R. HdrdterCoordinator East/South East Asia,International Potash Institute,c/o K+S KALI GmbH, Kassel. Germanv
Introduction to the theme
Understanding the nutrient cycles andnutrient baRances at different scales toimprove nutrient supply and allocationto agricultural systems
7

Understanding the nutrient cycles and nutrient balances at different scales to im-
prove nutrient supply and allocation to agricultural systems
Rolf Hiirdter
Coordinator East/South East Asia, International Potash Institute,c/o K+S KALI GmbH, Kassel, Germany
With the evolution of the farming systems driven by the requirements for food andfibre by a rapidly growing population, the nutrient management practices in Chinahave undergone dramatic changes during the past four decades. The most drasticchanges occurred with the improvement of the nutrient availability to agriculturethrough manufactured mineral fertilizers. This allowed the Chinese growers to shifttheir nutrient management from a mainly "managing-nutrient-shortages" approach to amore abundant nutrient management in their farms. The former approach was charac-terized by saving and recycling of nutrients in form of organic manures as well ascrops residues or litter, causing that fertility was greatly shifted from one eco-system(e.g. forest) to another (crop- or farmland) and nevertheless was hardly meeting thecrop requirements.On the other hand, the availability of nutrients from mineral fertilizers tends to show acertain affluent use, neglecting important basic principle of good crop husbandry, poorcrop residue management, etc. In many cases, the inadequate nutrient management isexpressed by a one-sided fuelling of the soil-plant system with nitrogen fertilizer andinsufficient replacement of removed potassium. Doing so over years or even decadeshas led to an accelerated depletion of the soil K reserves. The problems which emergedthrough this malpractice have not only created concerns of the agricultural researchersand advisors but has also alarmed the decision makers in the agricultural policy and thesuppliers of agricultural means of production as well as environmentalist.Discussions therefore today concentrate very much on issues of how to reduce the so-called oversupply of nitrogen in the crop production in particular. But isn't this just ansimplification of the overall problem of inappropriate. nutrient management. A reasonfor this could be that many of the assumptions and conclusions are drawn from simpleinput : output statistics, indicating that N inputs exceed the outputs by far. Using thisapproach, however, the various pathways of avoidable and unavoidable nutrient lossesfrom the soil-plant systems are not included. Unavoidable losses are those determinedby transformation processes in the soil or the genetically fixed potential of plants toincorporate nutrients and synthesize organic structures, etc. Avoidable losses of nutri-ents are those occurring through inadequate application (rate, time, etc.) but alsothrough omission or negligence of other important nutrients, especially K, and hencelimiting nitrogen uptake. Before these interrelations are not fully understood by thegrower but also by other decision makers, the tendency of declining efficiency of ap-plied nitrogen will persist since there will always be an attempt to compensate insuffi-cient crop response or performance by larger application rates.Only the conceptual approach of a balanced supply of nutrients based on the demandand real removals, including crop residues, can help to alleviate the current problem.Therefore, in order to shed more light into the question how this can be best achieved,the International Potash Institute (IPI) together with the Institute of Soil Science of theChina Academy of Agricultural Sciences (ISSCAS) have joint forces by teaming upwith a number of Soil and Fertilizer Institutes und the Chinese Academy of Agricul-tural Sciences (CAAS) to form network that covers the most important cropping sys-
9

tem in representative agro-ecosystems of China. The major goal of this network (Fig-ure 1) is to study the current nutrient management practices and their possible im-provement through science and good agricultural recommendations. The workingprinciples are that important issues on nutrient management are picked up andintensely studied over a period of three years and results presented during a workshopat the end of each of such a three year cycle, when details are discussed and publishedto a larger audience in form of proceedings or research topics. The workshops are alsothe forums, where the focus for the next research cycle in a fast changing environmentas affected by crop production and soil fertility management and as it is currently ob-served in China, is decided.
P.o,cc,c._-oper.tin, i.theIPI-ISSAS Researmh Netor k ... ...
F-l Provinces contributing to thenutrient cycling subject
Figure I. Map of China showing the provinces with typical agro-ecosystems of the"Nutrient management network group" and provinces with close associationto the network
In a first approach to improved nutrient management in China, it was decided to ana-lyse in more detail the fate of nutrients entering a cropping system, a farm, a village,county or, at a larger scale, even the province. With these data, it was hoped to obtain abetter insight into nutrient fluxes or transfers within a system and from one system toanother one. The title of the first part of the work has therefore been under the title"nutrient cycling and nutrient balances in different agro-ecosystems in China". Theprinciples on which the whole work is based are field studies for three years and astudy on the quantification of nutrient cycles and transfer within agro-ecosystems atdifferent scales and beyond their borders was initiated.In this book, the whole subject of nutrient cycling has been divided into five chaptersstarting with global and regional nutrient balances, followed by analysis and descrip-tion of the situation in northern China, then by southern China. In the fourth chapter, acloser look at specific on-site studies reveals the current approaches in K crop responsestudies of annual food crop rotations whereas the last chapter deals with perennialcrops and special applications.
10
Chapter I
Global and regional nutrient balances
11


Nutrient cycling and transfers in the global dimension
Adolf Krauss
International Potash Institute, IPI, P.O. Box 1609, 4001 Basel, Switzerland
Abstract
Nutrient cycling and transfers occur on different levels of agro-eco systems. Thisrefers in the same way to nutrient cycles in plants and soils, the cycles in farm systemsand the transfer of nutrients across national and regional boundaries. An importantaspect in nutrient cycling is the balance between input and output. There aresubstantial differences in nutrient balance between regions, stage of development,economic situation and between nutrients. Potassium is usually in short supply, Kbalances are mostly negative, which bear consequences for yield formation and yieldsecurity.
Contents
" Nutrient cycles in plant and rhizosphere" Nutrient cycle within a farm system* Nutrient cycle across national boundarieso Evolution of regional nutrient balanceso Consequences and conclusion
Nutrient cycling takes place since the beginning of life on earth and the early days ofagriculture. Several categories can be distinguished and are different in scale andimpact (Figure 1). It ranges from micro levels like in plants or the rhizosphere, tolarger scales, e.g. nutrient cycling within a farm system to nutrient transfer acrossnational boundaries. In the following, examples of different categories of nutrientflows in agro-eco systems are discussed.
harvest exceeds inputsociety
export beyond recycling realm
loss to atmosphere N7 landscape
leaching N, farm
soil loss field
horizontal nutrient transfer rhizospherechemical occlusion
C/N cycle in yield formation plant
Source: van Nwordwijk. 1999Figure 1. Categories of problems for efficient nutrient flow in agro-ecosystems at
different scales
13
Nutrient cycles in plant and rhizosphere
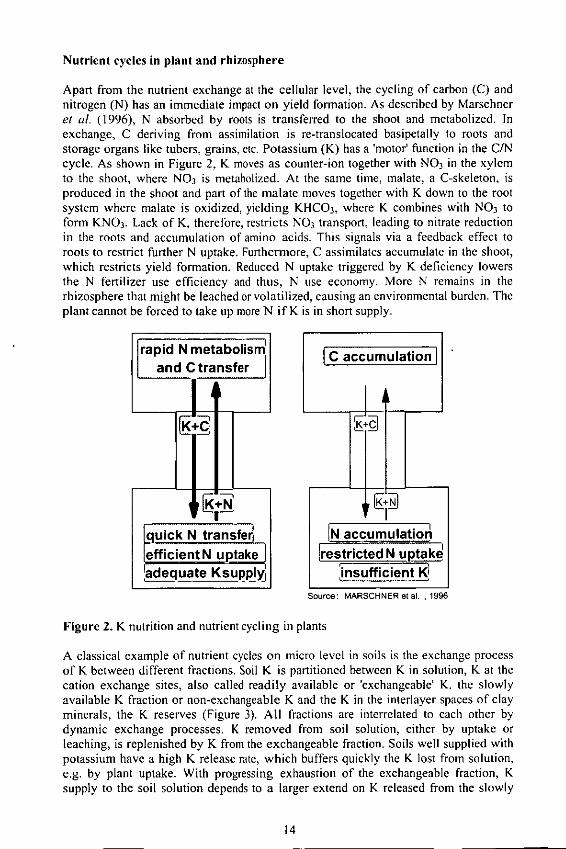
Apart from the nutrient exchange at the cellular level, the cycling of carbon (C) andnitrogen (N) has an immediate impact on yield formation. As described by Marschneret al. (1996), N absorbed by roots is transferred to the shoot and metabolized. Inexchange, C deriving from assimilation is re-translocated basipetally to roots andstorage organs like tubers, grains, etc. Potassium (K) has a 'motor' function in the C/Ncycle. As shown in Figure 2, K moves as counter-ion together with NO 3 in the xylemto the shoot, where NO3 is metabolized. At the same time, malate, a C-skeleton, isproduced in the shoot and part of the malate moves together with K down to the rootsystem where malate is oxidized, yielding KHCO3, where K combines with NO 3 toform KNO 3. Lack of K, therefore, restricts NO3 transport, leading to nitrate reductionin the roots and accumulation of amino acids. This signals via a feedback effect toroots to restrict further N uptake. Furthermore, C assimilates accumulate in the shoot,which restricts yield formation. Reduced N uptake triggered by K deficiency lowersthe N fertilizer use efficiency and thus, N use economy. More N remains in therhizosphere that might be leached or volatilized, causing an environmental burden. Theplant cannot be forced to take up more N if K is in short supply.
rapid N metabolism I C accumulationand C transfer
I II
quick N transfer, N accumulation
efficient N uptake restricted N upakeadequate Ksupply insufficient K _
Source: MARSCHNER et al. , 1996
Figure 2. K nutrition and nutrient cycling in plants
A classical example of nutrient cycles on micro level in soils is the exchange processof K between different fractions. Soil K is partitioned between K in solution, K at thecation exchange sites, also called readily available or 'exchangeable' K. the slowlyavailable K fraction or non-exchangeable K and the K in the interlayer spaces of clayminerals, the K reserves (Figure 3). All fractions are interrelated to each other bydynamic exchange processes. K removed from soil solution, either by uptake orleaching, is replenished by K from the exchangeable fraction. Soils well supplied withpotassium have a high K release rate, which buffers quickly the K lost from solution,e.g. by plant uptake. With progressing exhaustion of the exchangeable fraction, Ksupply to the soil solution depends to a larger extend on K released from the slowly
14

available fraction, i.e. from the non-exchangeable K fraction. However, the releaseintensity of K from the non-exchangeable pool is only a small part compared to thatreleased from the exchange sites. Consequently, with depletion of soil K and thus withthe increase of the contribution from the non-exchangeable pool, the yield declinesbecause the release intensity cannot cope with the K demand of a high yielding crop. Kfrom the reserve pool, i.e. from the interlayer space, is released by weathering andhardly contributes to the requirement of a developing crop during the vegetation period.Use of mineral potash and/or organic manure triggers the reverse process: increase ofthe K concentration of soil solution after fertilizer use initiates absorption processes,which can lead even to K fixation in exhausted soils. The latter is often source ofmisinterpretation of field trials because crops on K exhausted soils hardly show anyyield response to standard K rates when K fixation occurs. To rehabilitate a Kexhausted soil is costly. Experiments with Indian soils showed that it requires up to 5times more units of K to increase the soil K by one unit in contrast to soils with a goodK status where 1.2 units of K were enough to increase the soil K (Srinivasa Rao &Khera, 1995).
K inputK fertilizer
uptake manureetc
desorption
K in soil] lenishment weathering +solution K(r nabsorption rd i ationa
Kabopi: readily fraction lattice Kavailableer slowslwyI
availableavibl
Kleaching
D" soil K is partitioned between 4 major fractionsP, the different fractions are interrelated to each other through dynamic processesD- unlike N and P, there is no long-lasting slow release organic source
Figure 3. Flow of soil K is subject to dynamic processes
Nutrient cycle within a farm system
The nutrient cycle of a farm is governed by several input and output factors (Figure 4).Nutrients enter the farm with fertilizers, manure, deposition, sedimentation andbiological N2 fixation. Manure as input factor is of particular relevance when feedconcentrate is purchased for animals, adding nutrients to the farm system from an
15

exogenous source. Nutrient input with sedimentation can be an important factor inirrigated agriculture. I ppm nutrient per 100 mm irrigation adds I kg nutrient ha', e.g.5 ppm K in 600 mm irrigation correspond with 30 kg ha' K.Major output factors are nutrient removal by harvested crops, residues if removed,leaching, volatilization and erosion. Nutrient losses through erosion and leachingdepend very much on the climatic conditions. In Malawi for instance, which is in thehumid tropics, K loss through erosion and leaching represents 69% of the total K loss.In contrast, the major source of K loss in Mali, which is in the arid Sahel zone ofAfrica, is K removal by crops and residues. Leaching and water erosion in aridclimates are naturally of lesser importance.As a general rule, when nutrient input exceeds nutrient output, the nutrient balancebecomes positive. This signals nutrient accumulation in soils and build-up of soilfertility. On the other hand, when nutrient output exceeds nutrient input, then thenutrient balance is negative. A negative nutrient balance indicates soil nutrient miningand loss in soil fertility.
input output
manure residues
depositions leaching
BNF gaseous
sedimentation erosion
Source: STOORVOGEL & SMALING, 1990
Figure 4. Factors governing the balance in nutrient flow
The economic performance of a particular crop is another important determinant forthe nutrient balance. Farms in Kenya, which grow cash crops like tea, have a nutrientbalance which is almost in equilibrium. The gross margin of the farm is more than120'000 KSh (1 ,580 USD) ha yr-. Farms in Kenya, cultivating only stable crops likemaize, which is a less profitable crop (gross margin only 34'000 KSh (448 USD) ha'tyr-'), have a highly negative nutrient balance (Figure 5). Similarly, farmers inPunjab/India invest much more potash and farmyard manure in potatoes, a highlyprofitable crop compared to wheat and rice. The K balance of potato is positive, that ofcereals highly negative (Tandon & Sekhon, 1988). And thirdly, as soon as qualitybased procurement prices for crops are involved, the K balance improves. Farmers inNorth India, growing mostly stable crops like rice and wheat, use a very wide N : Kratio of 27:1 in fertilizer application. The unbalanced fertilization indicates a highlynegative K balance like shown with the previous example. Farmers in South India
16

grow cash crops like tea, coffee, pepper, cardamom, which are paid according toquality. The N : K ratio of 3:1 in fertilizer use indicates a K balance fairly close toequilibrium.
kg ha 1 example from Kenya
4016 E N balance
20 06 K balance
-20 -19.3
-40-43
-60
-80
-100-104
-120cash crop (tea) stable crop (maize)
gross margins (KSh ha"1 yr 1) 127'905 33'639Source: GITARI et al., 1999
Figure 5. Nutrient balance at farm level as affected by the economic performance
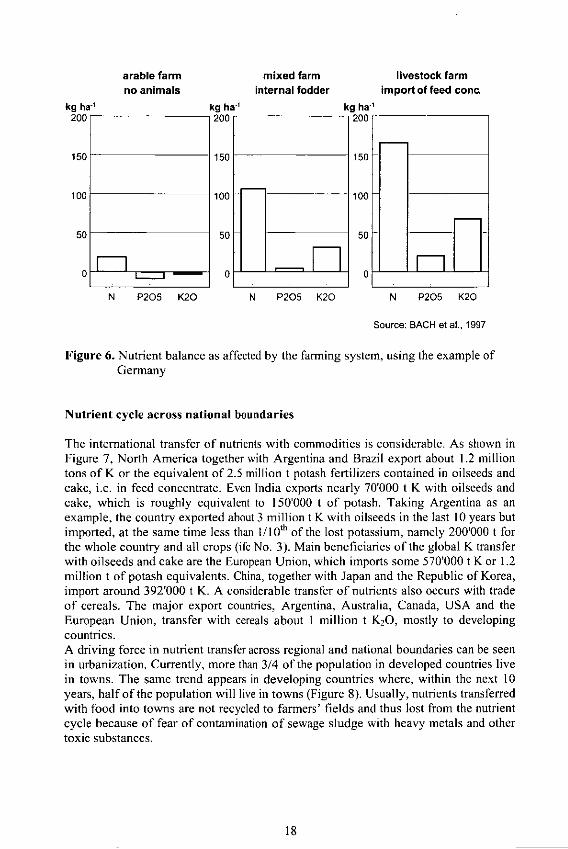
As mentioned earlier, farmyard manure will occupy an important position in thenutrient cycle when purchased feed concentrate adds nutrients from an exogenoussource. In Germany for instance, the nutrient balance improves with the intensity oflivestock (Figure 6). Arable farms without animals have a nutrient balance rather inequilibrium, though P and K are already in short supply, i.e. showing a slightlynegative balance. Crops sold to the market are the major source of nutrient loss. Mixedfarms, internally producing fodder, have already a positive nutrient balance becausenutrient exports with animal products are much less than with plant products. A verypositive nutrient balance is seen in typical livestock farms. Major source of nutrientinput is feed concentrate. A comparable situation is experienced in typical dairy farmsin Belgium, where in spite of substantially decreased use of mineral fertilizers thenutrient surplus is quite high explained by increasing use of feed concentrate (Michielset al., 1997). On the other hand, use of farmyard manure, which only recycles farm-borne nutrients, i.e. no additional nutrients from outside, fail to counterbalance nutrientlosses. This is the case in countries of Central/Eastern Europe, where farmers canhardly afford to buy feed concentrate. The nutrient content of farmyard manuredecreases, as well as the number of animals. The current use of mineral fertilizersrepresents only one third of the amount used to be applied in the pre-reform period atthe end of the eighties. The nutrient balance for instance of the Czech Republic ishighly negative (Klir et al., 1998).
17
arable farm mixed farm livestock farmno animals internal fodder import of feed cone
kg ha-1 kg ha kg ha"
200 200 200
150 150 150
100 100 100
50 50 50
0 0_N P205 K20 N P205 K20 N P205 K20
Source: BACH et al., 1997
Figure 6. Nutrient balance as affected by the farming system, using the example ofGermany
Nutrient cycle across national boundaries
The international transfer of nutrients with commodities is considerable. As shown inFigure 7, North America together with Argentina and Brazil export about 1.2 milliontons of K or the equivalent of 2.5 million t potash fertilizers contained in oilseeds andcake, i.e. in feed concentrate. Even India exports nearly 70'000 t K with oilseeds andcake, which is roughly equivalent to 150'000 t of potash. Taking Argentina as anexample, the country exported about 3 million t K with oilseeds in the last 10 years butimported, at the same time less than 1/ 10th of the lost potassium, namely 200,000 t forthe whole country and all crops (ifc No. 3). Main beneficiaries of the global K transferwith oilseeds and cake are the European Union, which imports some 570'000 t K or 1.2million t of potash equivalents. China, together with Japan and the Republic of Korea,import around 392'000 t K. A considerable transfer of nutrients also occurs with tradeof cereals. The major export countries, Argentina, Australia, Canada, USA and theEuropean Union, transfer with cereals about I million t K20, mostly to developingcountries.A driving force in nutrient transfer across regional and national boundaries can be seenin urbanization. Currently, more than 3/4 of the population in developed countries livein towns. The same trend appears in developing countries where, within the next 10years, half of the population will live in towns (Figure 8). Usually, nutrients transferredwith food into towns are not recycled to farmers' fields and thus lost from the nutrientcycle because of fear of contamination of sewage sludge with heavy metals and othertoxic substances.
18

8 kt K EU ChlJ,Kor+N 572kInK +392ktK/
4V
\J'%a Arg, Bras 1.-542kInK . 0rid
-69 ktSource: FAOSTAT98
Figure 7. Regional K net transfer with oilseeds/cake figures for 1997
Urbanites eat more meat, fruits and vegetables than their rural counterparts. Export offruits and vegetables together with stimulants represents about 400'000 t K20, most ofit being utilized in towns and thus lost for recycling.
billion inhabitants billion inhabitants
1.2 - developed countrie 3.5 -developing countrie&-
urban *,?"23
0 .8 r u rl2"
2
0.6 -o 1.50
rural 1 0.
0.4 0.5 -o
urban0.2 01950 1970 1990 2010 2030 1950 1970 1990 2010 2030
1960 1980 2000 2020 1960 1980 2000 2020
Figure 8. Development of the global population
Evolution of regional nutrient balances
Distinct differences occur in the trend of nutrient balances with respect to the nutrientitself and the region considered. In the nineteen seventies and eighties, fertilizer use indeveloped countries exceeded the nutrient removal by crops (Figure 9). As mentioned,the deriving positive nutrient balance can be considered as build-up of soil fertility.
19

mean of 3 yearsmillion t N million t P205 million t K20
35 35 35
30 * 30 30
fertilizer use -25 %- 25 25
2020 20removal ,,e ,o,°
15 by crops " __
10 10 __"---___ 10
5 5 565 70 75 80 85 90 95 65 70 75 80 85 90 95 65 70 75 80 85 90 95
Source: FAO YearbooksFigure 9. Fertilizer use in relation to nutrient removal by crops in developed countries
However, end of the eighties, the situation changed quite drastically. Fertilizerconsumption in developed countries declined sharply for several reasons such as:a) set-a-side programs, economic and ecological considerations, poor crop prices in
'Western' countries like USA or the European Union;b) economic reform in Central/Eastern Europe and the Former Soviet Union with the
aftermath in form of lack of credits and funds to buy fertilizers and other inputs,unclear land titles, lack of knowledge of new land owners after re-allocatingcollective land.
In the meantime, nitrogen use seems to revive whereas phosphate and especiallypotash use lags behind removals by crops.
The evolution of the nutrient balance in developing countries shows a contrastingpicture (Figure 10). Use of nitrogen equals or surpasses nitrogen removal by crops. InChina for instance, an estimated N removal by crops of about 17 million t is'counterbalanced' with 23.6 million t N from mineral fertilizers (mean of 1996-98).The trend in phosphorus is comparable to nitrogen although less pronounced. Use of Pfertilizers closes progressively more the gap caused by P removal by crops. In China,about 9 million t P205 are used and about 8 million t P20 5 are removed by crops.
The situation of potassium is completely different from N and P. K removal by crops isa multiple of K use with mineral potash. The K balance is highly negative. Someexamples (figures represent mean of 1996-98):* China has a mineral potash input of 3.1 million t K20, output with crops of about 17
million t K20 (Figure 11);" India uses 1.2 million t K20 in form of potash, output with crops is 8.8 million t
K20;o Sub-Saharan Africa's K input is 0.2 million t K20 but output with crops is 4.3
million t;
20

o West Asia North Africa, the WANA region's K input with potash is 0.3 million tand output with crops 4.1 million t K20, respectively.
The apparent deficit in K increases in China with a rate of about 250'000 t K20 and inS-Asia of 180'000 t K20 annually.
mean of 3 yearsmillion t N million t P205 million t K2060 .. 60. 60
so
50 --
50-removal Zby crops I
30 30
20 20-20
fertilizer use1 0 10
65 70 75 80 85 90 95 65 70 75 80 85 90 95
Source: FAO Yearbooks
Figure 10. Fertilizer use in relation to nutrient removal by crops in developingcountries
Use of organic manure, which is a great tradition especially in China, cannotcompensate the huge loss of potassium from soils by harvested crops. Assuming thatmineral K represents 30% of the total K use in China, the grand total of about 10million t K20 from manure and potash is still far below the total removal of 17 milliont K20 by crops (Figure 11).
million t nutrient million t nutrient million t nutrient25 , 25 25
N 4 P205 K20
20020 ; 20 20
P or;
fertilizer use
t-o -- " -- -1- 15 -
0 1061
by crops o.
5 __ -.- 5 - -
o0 I00 0 00 0 P00 O 0.0
81182 $5131 89C 93f94 979S" SI2 858 S9O 9494 9719' 5o1112 85136 89110 9394 579B
" preliminary figuresFAOIIFA FYB's
Figure 11. Fertilizer use in relation to nutrient removal by crops in China
21

The same applies to India. Even with a very optimistic approach, Singh & Biswas(2000) estimate that only 25% of the future nutrient demand in Indian's agriculture canbe covered by all kinds of organic manure like FYM, urban/rural waste. Moreover,alternative use of FYM as fuel and building material in developing countries iswidespread. Furthermore, the low nutrient content and bulkiness require high labordemand for its mobilization, processing and application. But, labor costs are becomingless affordable to farmers also in developing countries.
Consequences and conclusion
In nature, removing items from a closed cycle either weakens the cycle or it requirescompensation to maintain the full strength. This refers also to nutrient cycles.Potassium in comparison to N and P, appears to be in a bad situation, showing that theK deficit is increasing worldwide although with regional differences. Developingcountries are badly affected by this aspect.Why is unbalanced fertilization with emphasis to nitrogen so common in developingcountries? It is the immediate and evident effect of nitrogen. At times of economicstress, limited financial resources of the farming community, unclear land title,insecure land tenure systems, etc. are the recognizable effects that make nitrogen to bethe most preferred nutrient. In contrast, use of potash commonly results in lessspectacular yield effects. The action of potash is more discreet and related to quality,stress tolerance and other traits. Nevertheless, the quantity of potassium that a highyielding plant requires is in the same order of magnitude or even higher than that ofnitrogen. What are the consequences of continued soil K mining at negative Kbalances? Results from long-term experiments conducted in Germany show that withadvancing soil K mining and thus declining soil K status the gap between potential andachievable yield increases (Figure 12).
obtainable yield (%)100
lOO , , o, , , cereals
90 - ,-
S.0
80 -___
70
60
advancing soil K mining -50very high high adequate low very low
soil K status
Source: KERSCHBERGER & RICHTER, 1987
Figure 12. Loss in potential yield at different levels of soil K status
22

The farmer loses substantial yield opportunity. In this context, long-term experimentsin UK showed that with the same amount of 144 kg ha-' N barley yielded only 2 t ha-
on exhausted soil with 68 ppm K, but 5 t ha-i on fertile soil with 329 ppm K (Johnston,1994). The impact that such unbalanced fertilization has on fertilizer use economy andon the ecology is evident. In addition, K deficient plants are poor in quality,susceptible to stress and therefore a risk in crop production.The deriving consequences are clear. We have to convince the farmer to invest in soilK capital. The economic returns are good. For example, for each rupee invested inpotash, Indian farmers achieve a return of about 5 rupees with higher yields in rice, 8-10 rupees in soybean and more than 15 rupees in potato. There is also a substantialgain in quality and yield security.We also have to convince the advisors in the extension sector to provide theinformation to the farmer and the fertilizer sector to provide the potash right in timeand quantity. And last but not least, we have to convince decision-makers to providethe policy and economic frame for balanced fertilization.
References
Bach, M., Frede, H.G. and Lang, G. (1997): Entwicklung der Stickstoff, Phosphor-und Kalium-Bilanz der Landwirtschaft in der Bundesrepublik Deutschland.Gesellschaft fdr Boden- und Gewisserschutz e.V., Wettenberg, Germany.
Gitari, J.N.. Matiri, F.M., Kariuki, I.W., Muriithi, C.W. and Gachanja, S.P. (1999):Nutrient and cash flow monitoring in farming systems on the Eastern slope ofMount Kenya. In: Nutrient disequilibria in agroecosystems (ed. E.M.A. Smaling etal.), CABI Publishing, pp. 211-228.
Johnston, A.E. (1994): The Rothamsted classical experiments. In: Long-termexperiments in agriculture and ecological sciences (ed. R.A. Leigh and A.E.Johnston), CAB International, pp. 9-37.
Kerschberger, M. and Richter, D. (1987): Neue Versorgungsstufen (VST) ffir denpflanzenverftigbaren K-Gehalt (DL-Methode) auf Ackerb6den. Richtlinien derDingung 11, 14-18.
Klir, J., Vostal, J. and Lipavsky, J. (1998): Plant nutrient balances in Czech agriculture.In: Proceedings of the 1 Ith Int. Symposium on Codes of good fertilizer practice andbalanced fertilization, September 27-29, 1998, Pulawy, Poland, pp. 428-434.
Marschner, H., Kirkby, E.A. and Cakmak, I. (1996): Effect of mineral nutritionalstatus on shoot-root partitioning of photo-assimilates and cycling of mineralnutrients. J. Exp. Botany 47: 1255-1263.
Michiels, J., Verbruggen, I., Carlier, L. and van Bockstaele, E. (1997): In- and outputof minerals in Flemish dairy farming: the mineral balance. In: Proc. 11th Intern.World Fertilizer Congress of CIEC on Fertilization for sustainable plant productionand soil fertility, September 7-13, 1997, Gent, Belgium, pp. 695-702.
Noordwijk van, M. (1999): Nutrient cycling in ecosystems versus nutrient budgets ofagricultural systems. In: Nutrient disequilibria in agroecosystems (ed. E.M.A.Smaling et al.), CABI Publishing.
Singh, G.B. and Biswas, P.P. (2000): Balanced and integrated nutrient management forsustainable crop production. Fertilizer News, Vol. 45 (5), pp. 55-60.
Srinivasa Rao Ch. and Khera, M.S. (1995): Consequences of potassium depletionunder intensive cropping. Better Crops, Vol. 79, pp. 24 -2 7 .
23

Stoorvogel, J.J. and Smaling, E.MA. (1990): Assessment of soil nutrient depletion inSub-Saharan Africa: 1983-2000. Report 28, The Winand Staring CentreWageningen, The Netherlands.
Tandon, H.L.S. and Sekhon, G.S. (1988): Potassium research and agriculturalproduction in India. FDCO New Delhi, 144 p.
24

Development in nutrient balances in the cropping systems of transi-tional economies in Central/Eastern Europe
Eberhard Uebel
International Potash Institute, Basel, Switzerland (IPI)Former Coordinator Central/Eastern Europe, Kassel, Germany
Abstract
In Central/Eastern Europe (CEE), a vast agricultural area of about 66 M ha has to pro-duce food for 122 M people and for export. Until the end of the 80's, under conditionsof the central planned economy, in most of CEE countries, fertilizers were stronglysubsidized by the state. The consequence was agricultural mass production throughhigh fertilizer input, reaching levels of Western European countries and positive nutri-ent balances. Since the beginning of the 90's with the transition to the market economy,a dramatic decline in mineral (-55 % in N and -80 % each in P and K) and organic(-30 % to -50 %) nutrient consumption set in. Today, agricultural production is carriedout at the expense of soil nutrient reserves. Negative nutrient balances led to decreas-ing soil nutrient contents and loss in soil fertility. Yield levels declined by about 20 to30 %. However, the agricultural crop production is showing again a slight recoverysince the revised increase in fertilizer use in 1993/94. Supportive agricultural policy,regular soil monitoring in farms and relevant strategies for economical, ecological andnutritional balanced fertilization can avoid great losses for farmers and accelerate thisstarting development.
Introduction
The fertilizer consumption in Central/Eastem Europe (CEE) is characterized by astrong increase from the beginning of the 60's until the end of the 80's and a dramaticdecline in mineral and organic nutrient consumption since the beginning of the 90's. Inthe first period until the end of the 80's, this development was accompanied by an im-mense growth in crop production fuelled by a fertilizer subsidy through the govern-ment under the conditions of central planned economies. In most of the CEE countries,the nutrient balances changed from negative values until the end of the 60's to positivevalues with an increasing tendency since the beginning of the 70's. The proportion ofagricultural land with low soil nutrient contents decreased continuously. Soil fertilitywas built up. However, in the run of the years, that proportion of soils with high andvery high nutrient contents increased partly to an undesirable extent. In the secondperiod, since the beginning of the 90's with the transition of the CEE countries to themarket economies, the farmers had to fight for economical survival and were forcednearly to abstain from the use of yield increasing means of production, especially fromfertilizers. Agricultural production was carried out at the expense of nutrient soil re-serves. Negative nutrient balances led to decreasing soil nutrient contents and losses insoil fertility. Since 1993/94, a renewed slight increase in fertilizer consumption set in.In this paper, the consequences of different fertilizer consumption practices for nutrient
25

balances, soil fertility and crop production are analyzed, using typical examples. Con-clusions for future economical and ecological relevant fertilizer strategies are drawn.
Methods
The development of fertilizer consumption, the nutrient balances, development of thenutrient supply status of soils and crop production of selected countries of the CEEwere analyzed on the basis of statistical data from FAO, publications of scientists fromuniversities and other sources. Typical tendencies were characterized and needs forfuture development discussed.
Results and discussion
Importance of agriculture in the economies of CEE
Agriculture has a much greater importance in the national economies in CEE countriesthan in the countries of Western Europe (WE). An average share of 7 % of GNP(European Union 1,7 %) is assigned to agriculture of CEE and the share of employeesin agriculture reaches 23 % (EU 5,1 %) of total employees. An agricultural area ofabout 66 M ha has to produce food for 122 M people and to earn revenue from export.
Development of fertilizer consumption
In view of the importance of agriculture in CEE, it is mandatory to maintain soil fertil-ity and agricultural production at a high level. But with the economic transition sincethe beginning of the 90's, fertilizer consumption, the most important means of produc-tion declined at the most by -51 % in N use, by -78 % in P and -76 % in K use interms of mineral sources and by -30 % to -50 % in terms of organic manure comparedto the 1988/89 level. Only in 1994/95, a renewed slight increase in total fertilizerconsumption set in (Tab. 1).
Table I. Development in mineral fertilizer consumption (1000 t) in CEE 1992/93until 2001/02 and absolute and relative changes 1988/89 to 2001/02
Year N P20 5 K 2 0 NPK*1992/93 1,827 614 518 2,9591993/94 1,946 584 492 3,0221994/95 2,160 615 523 3,2981995/96 2,144 655 599 3,3981996/97 2,402 693 650 3,7451997/98 2,227 646 699 3,5722001/02 2,270 577 600 3,447change 88/89 absolute -2,373 -2,079 -1,854 -6,316to 01/02 relative -51.1 -78.3 -75.6 -64.7* N + P20 5 + K20(Source: FAO)
26
The level of mineral fertilizer consumption which reached 3,447,000 t NPK in 2001/02equals a fertilizer input of 32.5 kg ha-' N, 9.5 kg ha' P20 5 and 10.2 kg ha- K20, re-spectively, or 52.2 kg ha-' NPK. This low level in fertilizer use does not form a basisfor a high agricultural production intensity.
Nutrient balances in agriculture
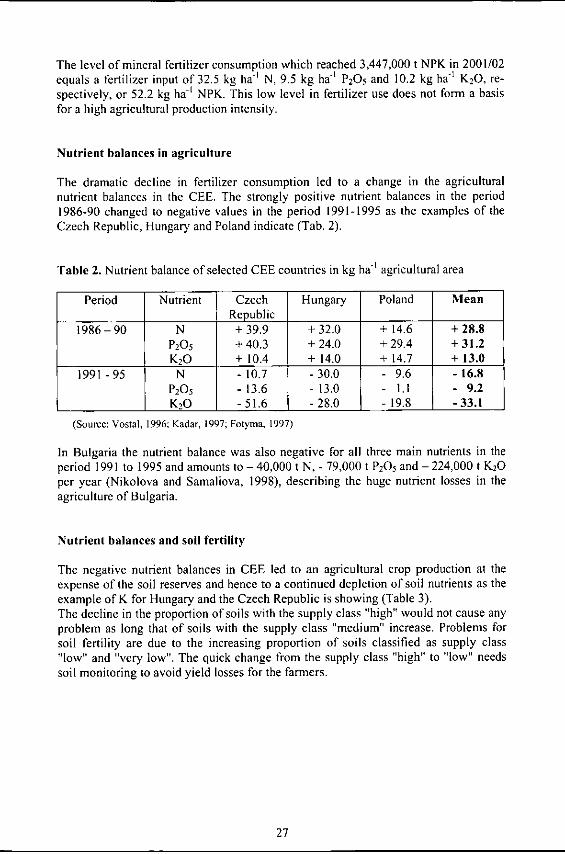
The dramatic decline in fertilizer consumption led to a change in the agriculturalnutrient balances in the CEE. The strongly positive nutrient balances in the period1986-90 changed to negative values in the period 1991-1995 as the examples of theCzech Republic, Hungary and Poland indicate (Tab. 2).
Table 2. Nutrient balance of selected CEE countries in kg ha- agricultural area
Period Nutrient Czech Hungary Poland MeanRepublic
1986-90 N + 39.9 + 32.0 + 14.6 + 28.8P20 5 +40.3 +24.0 +29.4 +31.2K20 + 10.4 + 14.0 + 14.7 + 13.0
1991 -95 N - 10.7 -30.0 - 9.6 -16.8P205 - 13.6 - 13.0 - 1.1 - 9.2K20 -51.6 -28.0 - 19.8 - 33.1
(Source: Vostal, 1996; Kadar, 1997; Fotyma, 1997)
In Bulgaria the nutrient balance was also negative for all three main nutrients in theperiod 1991 to 1995 and amounts to - 40,000 t N, - 79,000 t P20 5 and - 224,000 t K20per year (Nikolova and Samaliova, 1998), describing the huge nutrient losses in theagriculture of Bulgaria.
Nutrient balances and soil fertility
The negative nutrient balances in CEE led to an agricultural crop production at theexpense of the soil reserves and hence to a continued depletion of soil nutrients as theexample of K for Hungary and the Czech Republic is showing (Table 3).The decline in the proportion of soils with the supply class "high" would not cause anyproblem as long that of soils with the supply class "medium" increase. Problems forsoil fertility are due to the increasing proportion of soils classified as supply class"low" and "very low". The quick change from the supply class "high" to "low" needssoil monitoring to avoid yield losses for the farmers.
27

Table 3. Shift in K status of arable soils in % of the area in Hungary and the CzechRepublic based on K supply classes
Country Period K supply classlow medium high
Hungary 1986-90 15 25 601991 -95 20 35 45
shift +5 +10 - 15Czech Republic 1986-90 4,7 70,9 24,3
1991 -95 7,9 71,9 20,1shift +3,2 +1,0 -42
(Source: Kadar, 1997; Travnik et. al., 1996)
Results from Poland (Gosek and Fotyma, 1998) give an insight into the dynamics ofthe interrelation between the level of fertilization, the nutrient balance and the status ofsoil nutrient supply using the example of potash (Fig. I -3).
180 -
160-
140
v 120
-~100
80 -
60 - - -
40 -
20 -
0years 1975 1978 1981 1984 1987 1990 1993 1996
- - - organic - - mineral - total(Gosek and Fotyma, 1998)
Figure I. Development of potash fertilization in Poland (kg ha-' K20)
28

180
135
90
45
0
-45 .5 . . . . .. .
years 1975 1978 1981 1984 1987 1990 1993 1996
input - - - output - - -balance(Gosek and Fotyma, 1996)
Figure 2. Potassium input output balance (kg ha - K20) in Poland
60 15
5014 5
40
.=' 0 20 1 12 > "-
100
0 13
years 1975 1978 1981 1984 1987 1990 1993 1996
= low, wry low =high, very high - mg K(20 (IOg)-' soil(Gosek and Fotyma, 1998)
Figure 3. Change in potash supply of soils in Poland 1975 to 1997
For the Polish agriculture with its high proportion of light soils, the data convincinglyshow that positive potash balances led to an increase of potash contents in the soil anda proportional decrease in soils with low and very low K content (1975 - 1990). Incase of negative K balances, in a range of -20 to -40 kg ha- K20 per year, since thebeginning of the 90's, the soil K content remained for a certain time at the same level,depending on the buffering capacity of soils. After this period, the potash content de-clined rapidly. The proportion of soils with low and very low K contents increased,indicating the decline in soil fertility.
29

The latest data of a soil survey in Poland carried out in 1999 reveal that 48 % of thesoils belong to the K soil supply class "low" and "very low". This may threaten thePolish agricultural production as K deficient plants are more susceptible to climaticcalamities like droughts, frost, heat and to pests and diseases. Insufficient K supplyalso reduces the efficiency of other fertilizers, especially of N. This reduces the fertil-izer use economy, the production costs and causes the risks of environmental pollutionto increase. Despite the low level of fertilizer input in the CEE, this problem is of cur-rent importance since N has been the preferred nutrient when fertilizer use picked upagain. The nutrient balance for the main crops of Bulgaria shows the already existingone-sided use of nitrogen in 1996 (Tab. 4). On average of all crops tested, only thenitrogen balance is positive.
Table 4. Nutrient balances for the main crops of Bulgaria (1996)
Nutrient balances (in tons)
Crops Balance sheets N P20 5 K2 0
Wheat Crop removal 46,442 19,649 41,083Fertilizer input 62,926 6,920 230Balance +16,484 -12,729 -40,852
Barley Crop removal 9,576 5,016 10,945Fertilizer input 10,695 487 48Balance +1,119 -4,529 -10,897
Maize Crop removal 28,301 9,797 30,478Fertilizer input 11,220 435 0Balance -17,081 -9,362 -30,478
Sunflower Crop removal 13,247 13,777 40,800Fertilizer input 5,902 1,504 295Balance -7,345 -12,273 -40,505
Sugar beet Crop removal 208 173 736Fertilizer input 30 17 8Balance -178 -156 -728
All crops Crop removal 120,404 69,582 210,736Fertilizer input 151,883 12,824 187Balance +31,479 -56,758 -210,548
More emphasis has to be laid on the promotion of balanced fertilization to increase thefertilizer use efficiency and to avoid environmental pollution. Nutrient balances canhelp to find the way to a more precise fertilizer management.
Fertilization and crop production
Under European conditions, mineral fertilizers contribute on average 35 to 40 % and inspecial cases even more to the final yield. They are a very important factor for cropproduction and crop quality. The dramatic decline in fertilizer consumption in agricul-
30
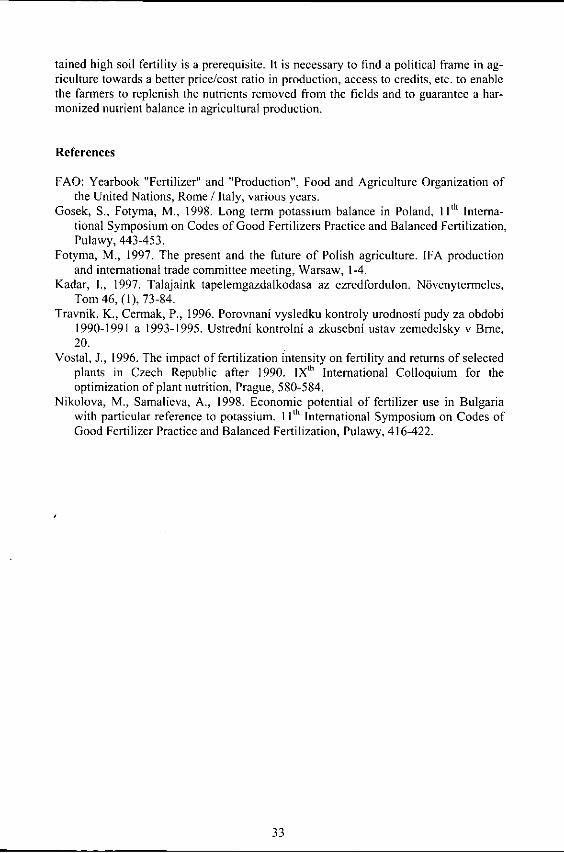
ture of CEE with its losses in soil fertility was therefore strongly connected with theyield decline by about 20 % to 30 % since the beginning of the 90's (Tab. 5). The slightrecovery in fertilizer consumption since 1993/94 (Table 1) correspondingly led to anincrease in the average crop production indices of CEE countries (Figure 4). Howstrongly yield levels depend on the amount of fertilizer input is shown in Figure 5.
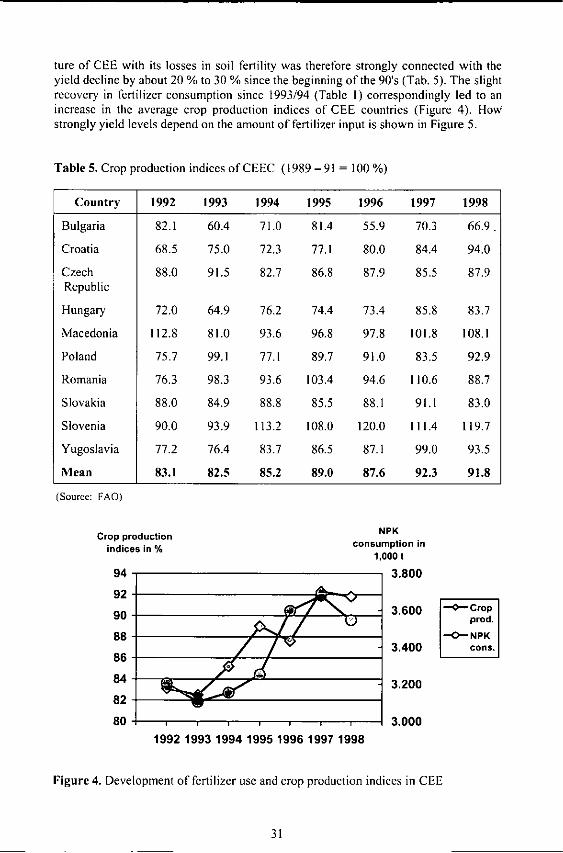
Table 5. Crop production indices of CEEC (1989 - 91 = 100 %)
Country 1992 1993 1994 1995 1996 1997 1998
Bulgaria 82.1 60.4 71.0 81.4 55.9 70.3 66.9.
Croatia 68.5 75.0 72.3 77.1 80.0 84.4 94.0
Czech 88.0 91.5 82.7 86.8 87.9 85.5 87.9Republic
Hungary 72.0 64.9 76.2 74.4 73.4 85.8 83.7
Macedonia 112.8 81.0 93.6 96.8 97.8 101.8 108.1
Poland 75.7 99.1 77.1 89.7 91.0 83.5 92.9
Romania 76.3 98.3 93.6 103.4 94.6 110.6 88.7
Slovakia 88.0 84.9 88.8 85.5 88.1 91.1 83.0
Slovenia 90.0 93.9 113.2 108.0 120.0 111.4 119.7
Yugoslavia 77.2 76.4 83.7 86.5 87-1 99.0 93.5
Mean 83.1 82.5 85.2 89.0 87.6 92.3 91.8
(Source: FAO)
Crop production NPK
indices in % consumption in1,000 t
94 3.800
92-
90 3.600 Crod.
88 I ,-O-NPK
86 3.400 cons.
84 - 3.200
82
80 3.0001992 1993 1994 1995 1996 1997 1998
Figure 4. Development of fertilizer use and crop production indices in CEE
31

Wheat yield (t ha-1)
6
SLO5 tl
H4 BG '
BIH I-PL
3CZM K
YU2 AL
0 20 40 60 80 100
kg NPK ha-1
Figure 5. Relationship between fertilizer use and yield of wheat in the CEE, 1998
The countries with the largest fertilizer inputs per unit area like Slovenia, Croatia, Po-land and the Czech Republic have reached the largest average wheat yield with about4.2 t ha-' in 1998. The countries with the lowest level of fertilizer use like Albania,Yugoslavia, Bosnia and Herzegovina and Bulgaria harvested only 2.9 t ha- winterwheat in 1998. This shows the huge reserves which can be mobilized by the agricul-tural potential of CEE by appropriate fertilization practices.
Conclusions
The CEE countries have a great agricultural potential. At present, agricultural produc-tion is mainly carried out with negative nutrient balances and hence at the expense ofsoil reserves. To maintain all chances for sustainable agricultural production, losses insoil fertility have to be avoided by increasing fertilizer use in mineral as well as in or-ganic form on the basis of regular soil monitoring and harmonious nutrient balances.For economic farm management and sustainable production the "medium" or "opti-mum" nutrient fertility class is recommended. Farmers with an increasing share of lowsupply class soils have the wrong fertilization strategy. Such farms are likely to en-counter losses in yield and quality, because nutrient release, especially of potassium,from the soil reserves will be limited and the soils will lose the capacity to buffer stresssituations like drought, etc.On the other hand, there is no need to accumulate available phosphate and potash re-serves in the soil above the optimum level as the costs for the farmers increase andusually only insignificant yield increases are obtained. However, the possibilities ofbalanced fertilization must be fully exploited to ensure high yields and good qualityproducts. Farming must be environmentally friendly but at the same time profitable.In view of the coming membership in the European Union, the CCE countries have totransform their agriculture into productive and competitive systems for which a sus-
32
tained high soil fertility is a prerequisite. It is necessary to find a political frame in ag-riculture towards a better price/cost ratio in production, access to credits, etc. to enablethe farmers to replenish the nutrients removed from the fields and to guarantee a har-monized nutrient balance in agricultural production.
References
FAO: Yearbook "Fertilizer" and "Production", Food and Agriculture Organization ofthe United Nations, Rome / Italy, various years.
Gosek, S., Fotyma, M., 1998. Long term potassium balance in Poland, 11" Interna-tional Symposium on Codes of Good Fertilizers Practice and Balanced Fertilization,Pulawy, 443-453.
Fotyma, M., 1997. The present and the future of Polish agriculture. IFA productionand international trade committee meeting, Warsaw, 1-4.
Kadar, 1., 1997. Talajaink tapelemgazdalkodasa az ezredfordulon. Nvenytermeles,Tom 46, (1), 73-84.
Travnik, K., Cermak, P., 1996. Porovnani vysledku kontroly urodnosti pudy za obdobi1990-1991 a 1993-1995. Ustredni kontrolni a zkusebni ustav zemedelsky v Bme,20.
Vostal, J., 1996. The impact of fertilization intensity on fertility and returns of selectedplants in Czech Republic after 1990. IX'h International Colloquium for theoptimization of plant nutrition, Prague, 580-584.
Nikolova, M., Samalieva, A., 1998. Economic potential of fertilizer use in Bulgariawith particular reference to potassium. 1I t International Symposium on Codes ofGood Fertilizer Practice and Balanced Fertilization, Pulawy, 416-422.
33


Sulphur balance and sulphur requirements in Chinese agriculture
Donald L. Messick
The Sulphur Institute, 1140 Connecticut Ave, NW Suite 612, Washington, DC 20036,USA,
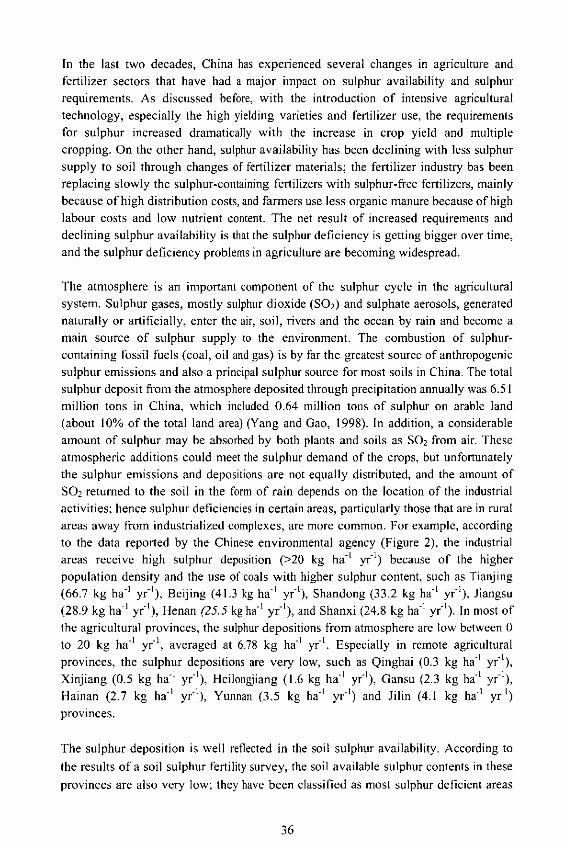
Abstract
The difference between sulphur supply and removal determines the soil sulphurfertility status. The components of sulphur supply and demand in the soil-plant-atmosphere system are conceptualised in Figure 1. The relative importance of each ofthese components varies from one system to another, but, generally, sulphur supplydepends on native sulphur content and sulphur addition from external sources, such asprecipitation, irrigation water, manure, crop residues and the addition from chemicalsources, such as sulphur-containing fertilizers and other chemicals. These supplysources vary with locality, level of industrialization, environmental considerations andstage of economic development. On the other hand, sulphur is taken up by the plant,fixed in the soil system and lost through leaching or volatilization. Again, the relativeimportance of each of these pathways depends on soil, crops and sulphur sources.Available data suggest that most soils in China have low total sulphur reserves,because of low organic matter content, intensive cultivation and crop production, aswell as leaching losses in the humid areas. Moreover, not all the sulphur supplied tothe soil is taken up by the plant. A large share of it may be lost or may become fixed inthe soil in compounds from which the sulphur is not readily available as the useefficiency of sulphur is rather low. Consequently, depending on the use efficiency, theamount of sulphur that needs to be added to the soil may be two to four times that ofsulphur removed by crops.
Sulphur supply Sulphur demand
I plants
K~ationFixed in thesoils
Crop b
Loss by
Animal leacingresidues
Figure I. Components of sulphur supply and demand in soil-plant-atmosphere system.
35
In the last two decades, China has experienced several changes in agriculture andfertilizer sectors that have had a major impact on sulphur availability and sulphurrequirements. As discussed before, with the introduction of intensive agricultural
technology, especially the high yielding varieties and fertilizer use, the requirementsfor sulphur increased dramatically with the increase in crop yield and multiple
cropping. On the other hand, sulphur availability has been declining with less sulphur
supply to soil through changes of fertilizer materials; the fertilizer industry has beenreplacing slowly the sulphur-containing fertilizers with sulphur-free fertilizers, mainly
because of high distribution costs, and farmers use less organic manure because of high
labour costs and low nutrient content. The net result of increased requirements and
declining sulphur availability is that the sulphur deficiency is getting bigger over time,and the sulphur deficiency problems in agriculture are becoming widespread.
The atmosphere is an important component of the sulphur cycle in the agricultural
system. Sulphur gases, mostly sulphur dioxide (SO 2) and sulphate aerosols, generatednaturally or artificially, enter the air, soil, rivers and the ocean by rain and become a
main source of sulphur supply to the environment. The combustion of sulphur-containing fossil fuels (coal, oil and gas) is by far the greatest source of anthropogenic
sulphur emissions and also a principal sulphur source for most soils in China. The totalsulphur deposit from the atmosphere deposited through precipitation annually was 6.51million tons in China, which included 0.64 million tons of sulphur on arable land
(about 10% of the total land area) (Yang and Gao, 1998). In addition, a considerableamount of sulphur may be absorbed by both plants and soils as SO 2 from air. Theseatmospheric additions could meet the sulphur demand of the crops, but unfortunatelythe sulphur emissions and depositions are not equally distributed, and the amount of
SO 2 returned to the soil in the form of rain depends on the location of the industrial
activities; hence sulphur deficiencies in certain areas, particularly those that are in ruralareas away from industrialized complexes, are more common. For example, accordingto the data reported by the Chinese environmental agency (Figure 2), the industrialareas receive high sulphur deposition (>20 kg ha -' yr -') because of the higher
population density and the use of coals with higher sulphur content, such as Tianjing(66.7 kg ha -' yr-'), Beijing (41.3 kg ha - ' yr'), Shandong (33-2 kg ha -' yr'), Jiangsu
(28.9 kg ha-' yr-'), Henan (25.5 kg ha' yr-'), and Shanxi (24.8 kg ha -' yr-'). In most ofthe agricultural provinces, the sulphur depositions from atmosphere are low between 0to 20 kg ha - yr-1, averaged at 6.78 kg ha - ' yr -'. Especially in remote agricultural
provinces, the sulphur depositions are very low, such as Qinghai (0.3 kg ha -1 yr),
Xinjiang (0.5 kg ha' 1 yrl), Heilongjiang (1.6 kg ha' yr-'), Gansu (2.3 kg ha' yr'),
Hainan (2.7 kg ha' yr'), Yunnan (3.5 kg ha' yr') and Jilin (4.1 kg ha' yr')provinces.
The sulphur deposition is well reflected in the soil sulphur availability. According to
the results of a soil sulphur fertility survey, the soil available sulphur contents in these
provinces are also very low; they have been classified as most sulphur deficient areas
36
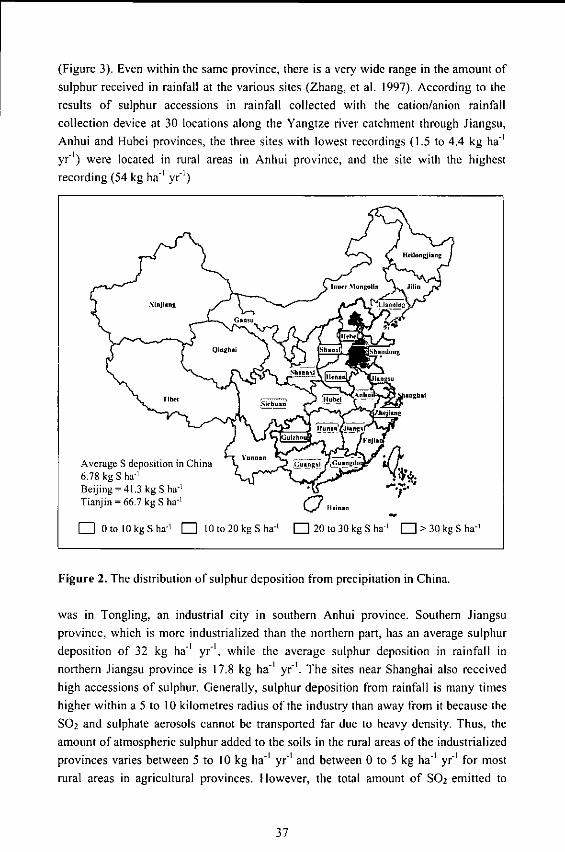
(Figure 3). Even within the same province, there is a very wide range in the amount ofsulphur received in rainfall at the various sites (Zhang, et al. 1997). According to the
results of sulphur accessions in rainfall collected with the cation/anion rainfallcollection device at 30 locations along the Yangtze river catchment through Jiangsu,
Anhui and Hubei provinces, the three sites with lowest recordings (1.5 to 4.4 kg ha-
yr - ') were located in rural areas in Anhui province, and the site with the highest
recording (54 kg ha-1 yr -f)
;u
QI.'M S ...III Shadong
Tlinnt Kib -an,, n ni ia a ' I
Average S deposition in China lunnan ag
6.78 kg S ha" angi G- nin
Beijing = 41.3 kg S ha"1
Tianjin = 66.7 kg S ha-' H.inn
FH1 0to 0kgSha- [ 10 to 20 kg S ha4 "'20 to 30 kg S ha' >30kgS ha-'
Figure 2. The distribution of sulphur deposition from precipitation in China.
was in Tongling, an industrial city in southern Anhui province. Southern Jiangsuprovince, which is more industrialized than the northern part, has an average sulphur
deposition of 32 kg ha- ' yr-', while the average sulphur deposition in rainfall innorthern Jiangsu province is 17.8 kg ha- I yr -'. The sites near Shanghai also receivedhigh accessions of sulphur. Generally, sulphur deposition from rainfall is many times
higher within a 5 to 10 kilometres radius of the industry than away from it because theSO 2 and sulphate aerosols cannot be transported far due to heavy density. Thus, the
amount of atmospheric sulphur added to the soils in the rural areas of the industrializedprovinces varies between 5 to 10 kg ha- l yr' and between 0 to 5 kg ha-1 yr' for most
rural areas in agricultural provinces. However, the total amount of SO2 emitted to
37

atmosphere and returned to the soil in rain will decrease because of regulations tocontrol air pollution. Liu (1995) studied the sulphur input and output in paddy fields ofsouthern China. The amounts of sulphur added annually to the soil from fertilizers,precipitation and irrigation water were 16.99 kg ha-', 6.88 kg ha-' and 3.90 kg ha-',respectively. However, sulphur removal by crop uptake and leaching were 19.06 and10.50 kg ha-1, respectively, which produced a 1.79 kg ha- sulphur deficit.
Inne M giaomn
Gan an
401. of Noilusmples 3014 0 /
ofil p 20- 301
o sool s < 20% of soil oamples
.S.on<.I;2mggo S.n...... mj/k R ll Sc........ 12mg<k, E] S Scome.nt< 12mWkg
Figure 3. Distribution of soils with low sulphur content (S < 12 mg kg-') in China
These data indicate that the amount of sulphur through precipitation and irrigationwater was almost equivalent to the amount of sulphur lost through leaching. Therefore,the sulphur balance in the soil depends greatly on fertilization and crop removal.
In 1995, the total amount of sulphUr uptake by crops in China was 1.98 million tons(Table I). Considering the fertilizer use efficiency (35%) of applied sulphur, the totalplant nutrient sulphur requirement was estimated at 5.66 million tons sulphur.However, the total amount of sulphur added as fertilizer, farm manure and straw in1995 was 4.77 million tons, of which 3.1 million tons were from SSP, 1:3 million tonsfrom manure, 0.32 million tons from crop straw and 0.15 million tons from ammoniumsulphate. This produced a deficit of 0.9 million tons sulphur or about 16% of the totalrequirement, clearly indicating the serious sulphur deficiency emerging in Chinese
38

agriculture and the need for effective sulphur supply strategies. Moreover, the mostpopular sulphur-containing fertilizers like SSP are not uniformly distributed in China;SSP has been mostly used in southern and central China, such as Jiangsu, Sichuan,Hubei, Hunan, Yunnan, Guizhou, Zhejiang, Fujian, and Anhui provinces, where it isproduced. While the rest of the provinces, especially in northern China, mainly useeither fused calcium-magnesium phosphate or high-analysis phosphate fertilizers likeTSP, MAP/DAP or nitro-phosphate, which has further accelerated soil sulphurdeficiency and increased the magnitude of response to sulphur fertilizers in variousagricultural systems of these areas.
Table I. Estimated sulphur balance in Chinese agriculture in 1995 (1000 tons).
Crop Sulphur removal Sulphur source Sulphur input
Grain crops 1100 SSP 3100Cotton 136 Ammonium sulphate 150Oil crops 188 Potassium sulphate 85Vegetables 310 Organic manure 1200Soybean 88 Straw 235Sugar 60Fruits 51Others 50Total 1983 4770Total demand: 1983/0.35 (Efficiency factor) = 5660Total Input: 4770Deficit: 890
The intensification of agricultural production per unit area, coupled with an expandinguse of high-analysis, sulphur-free fertilizers or low-sulphur fertilizers, such as urea andammoniated phosphates, is causing sulphur deficiencies to spread rapidly throughoutChina. The problem could be exacerbated further as sulphur dioxide emissions areincreasingly controlled. If this problem is neglected, the inevitable consequences willbe decreased yields and reduced efficiency of other inputs, which will, in turn, result inhigher production costs. According to TSI, the current annual deficit for sulphurfertilizers in China will increase to 1.5 million tons by 2005 and to 2.3 million tonsannually by 2010 unless corrective measures are taken (Table 2) (Messick and Fan,1999). The challenge is clear: to develop sustainable Chinese agriculture, the majorstrategy is to promote the balanced and efficient use of plant nutrients from bothorganic and inorganic sources at farm levels to intensify agriculture in a sustainablemanner. Whatever strategies are developed, they must consider the essential role ofsulphur for future crop production and quality. It is expected that the sulphur fertilizeruse in China will significantly increase over the coming decade and make a greater
39
contribution to the increase of Chinese agricultural production through value-addedbalanced fertilization, including sulphur. Based on the results in sulphur researchconducted in China, including sulphur fertilizer into the fertilization program couldincrease yield by an average of 10% in sulphur deficient soils (0.6 ton ha'). Byextrapolation, this would amount to a total grain yield increase of 18 million tons inChina every year, and an estimated increase in economic returns at approximately 36billion yuan (4.4 billion USD) for farmers.
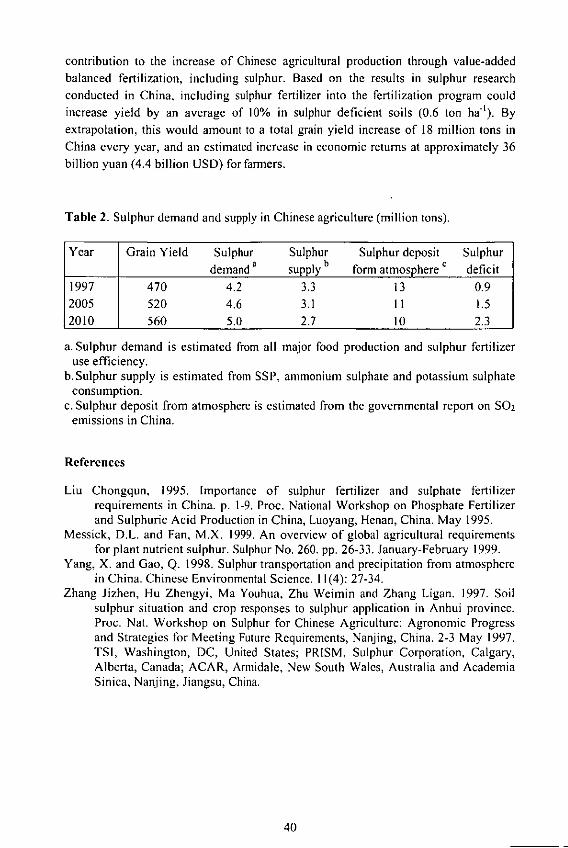
Table 2. Sulphur demand and supply in Chinese agriculture (million tons).
Year Grain Yield Sulphur Sulphur Sulphur deposit Sulphurdemand a supply b form atmosphere c deficit
1997 470 4.2 3.3 13 0.92005 520 4.6 3.1 11 1.52010 560 5.0 2.7 10 2.3
a. Sulphur demand is estimated from all major food production and sulphur fertilizeruse efficiency.
b.Sulphur supply is estimated from SSP, ammonium sulphate and potassium sulphateconsumption.
c. Sulphur deposit from atmosphere is estimated from the governmental report on S02emissions in China.
References
Liu Chongqun, 1995. Importance of sulphur fertilizer and sulphate fertilizerrequirements in China. p. 1-9. Proc. National Workshop on Phosphate Fertilizerand Sulphuric Acid Production in China, Luoyang, Henan, China. May 1995.
Messick, D.L. and Fan, MX. 1999. An overview of global agricultural requirementsfor plant nutrient sulphur. Sulphur No. 260. pp. 26-33. January-February 1999.
Yang, X. and Gao, Q. 1998. Sulphur transportation and precipitation from atmospherein China. Chinese Environmental Science. 1] (4): 27-34.
Zhang Jizhen, Hu Zhengyi, Ma Youhua, Zhu Weimin and Zhang Ligan. 1997. Soilsulphur situation and crop responses to sulphur application in Anhui province.Proc. Nat. Workshop on Sulphur for Chinese Agriculture: Agronomic Progressand Strategies for Meeting Future Requirements, Nanjing, China. 2-3 May 1997.TSI, Washington, DC, United States; PRISM, Sulphur Corporation, Calgary,Alberta, Canada; ACAR, Armidale, New South Wales, Australia and AcademiaSinica, Nanjing, Jiangsu, China.
40

Nutrient balance and nutrient management in agro-ecosystems of
China
Zhou Jianmin', Chen Xiaoqin', Xie Jianchang', and Rolf Hirdter
'Institute of Soil Science, Chinese Academy of Sciences, Nanjing, P. R.Chini,2100082International Potash Institute, c/o K+S KALI GmbH, Kassel, Germany
Introduction
Since Liebig put forward the mineral element theory, it has been recognized that thereturning of nutrients is the key for maintaining soil fertility and plant production.Without the scientific foundation, Chinese ancestors had already realized this impor-
tance long time ago and put returning of nutrients into practice much earlier. China,
being a country with thousands of years of tillage history, realized the miracle to keep
the soil productive for such a long time without mineral fertilizer, just by efficient re-
cycling of residues and applying organic manure. Before 1950, all of the applied nu-
trients originated from organic manure. In the 1950's, manufactured nitrogen fertilizer
appeared in the agricultural practice. With the improvement of crop cultivars, the de-
velopment of the chemical fertilizer industry and the progress of tillage methods, min-
eral fertilizers gained increasing importance in returning nutrients to the soil. Nitrogen
fertilizer use gradually increased in 1960's whereas phosphorous fertilizer use only took
off at the end of 1960's. Potash use started only at the end of the 1970's. The fertilizer
input from that time onwards increased year by year (Table 1). In 2001, the total N fer-
tilizer input was as much as 21,641,000 t (of N), the P fertilizer input was 7,060,000 t
P20 5, K fertilizer was 3,998,000 t K20, not including the nutrients contained in
9,842,000 t compound fertilizer (Table 1).
Table 1. Input of mineral fertilizer in China,000 t
Year Total N P205 K20 Compound(N+P20 5 +K20) fertilizer
1957 373 320 531965 1,447 1,331 108 3 51975 5,211 3,309 1,463 113 3261980 12,694 9,342 2,733 346 2731985 17,758 12,049 3,109 804 1,7961990 25,903 16,384 4,629 1,479 3,4161995 35,936 20,219 6,324 2,685 6,7081996 38,278 21,452 6.584 2,908 7,3471997 39,807 21,717 6,891 3,220 7,9811998 40,856 22,344 6,828 3,463 8,2222001 42,254 21.641 7,060 3,998 9,842
41

The application of mineral fertilizers resulted in an increase of grain yield, which inrecent years has stagnated in many places, despite of further increase in fertilizer input.Though this observation is found in all crop production systems once a certain level ofproduction is reached, there is no doubt that in China this stagnation is also related to theunbalanced and the inappropriate ratio of nutrient input. This has been proved by theeutrophication of waters and the reduction in soil productivity. Therefore, it is necessaryto investigate and evaluate the nutrient balance of farmland, in order to improve andmaintain soil productivity and to develop sustainable systems. This must provide thenecessary guidance for the improvement of fertilization strategies in the agriculturalpractice, and assist the fertilizer policy for a national program for improved fertilizerproduction, importation, exportation and distribution.
Forms and pathways of major nutrients in farmland ecosystems
The diagram of a typical nutrient cycle in the field is presented in Figure l. The mainnutrient input in the farmland ecosystem include: mineral fertilizer, organic fertilizer(nutrient reuse from agricultural by-products, e. g. residues from animal husbandry andcrops), biological nitrogen fixation, wet and dry deposition, irrigation, etc.. The path-ways of output of nutrients mainly comprise removal with crop harvest, runoff, leaching,ammonia volatilization, denitrification, nitrogen gas released directly by crops, etc.Irrational fertilizing techniques and measures can accelerate the unproductive loss ofnutrients, i.e. those which are not removed by harvest, resulting in low use efficiency offertilizer.
Rain and BMinl Og t Biologicalirrigation FeilizeI 5 N Fixation
I AsiatonrdI urin River
- Ground waler Leaching -
Figure. I Nutrient cycling in farmland production systems
42
Generally, the amounts of nutrients from inorganic and organic fertilizers constitute theinputs, those in the harvested crops are the main outputs. These data can be easily as-sessed.
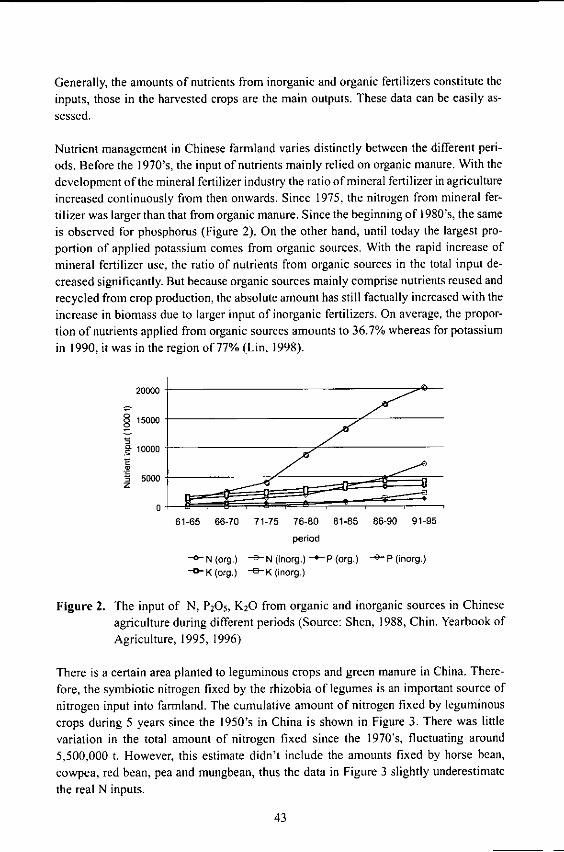
Nutrient management in Chinese farmland varies distinctly between the different peri-ods. Before the 1970's, the input of nutrients mainly relied on organic manure. With thedevelopment of the mineral fertilizer industry the ratio of mineral fertilizer in agricultureincreased continuously from then onwards. Since 1975, the nitrogen from mineral fer-tilizer was larger than that from organic manure. Since the beginning of 1980's, the sameis observed for phosphorus (Figure 2). On the other hand, until today the largest pro-portion of applied potassium comes from organic sources. With the rapid increase ofmineral fertilizer use, the ratio of nutrients from organic sources in the total input de-creased significantly. But because organic sources mainly comprise nutrients reused andrecycled from crop production, the absolute amount has still factually increased with theincrease in biomass due to larger input of inorganic fertilizers. On average, the propor-tion of nutrients applied from organic sources amounts to 36.7% whereas for potassiumin 1990, it was in the region of 77% (Lin, 1998).
20000
15000
g 10000C)
S5000zZ
0
61-65 66-70 71-75 76-80 81-85 86-90 91-95
period
-- N (org.) -s-N(inorg.) I-P(org.) - P(inorg.)K (org.) - -K (inorg.)
Figure 2. The input of N, P20 5, K20 from organic and inorganic sources in Chineseagriculture during different periods (Source: Shen, 1988, Chin. Yearbook ofAgriculture, 1995, 1996)
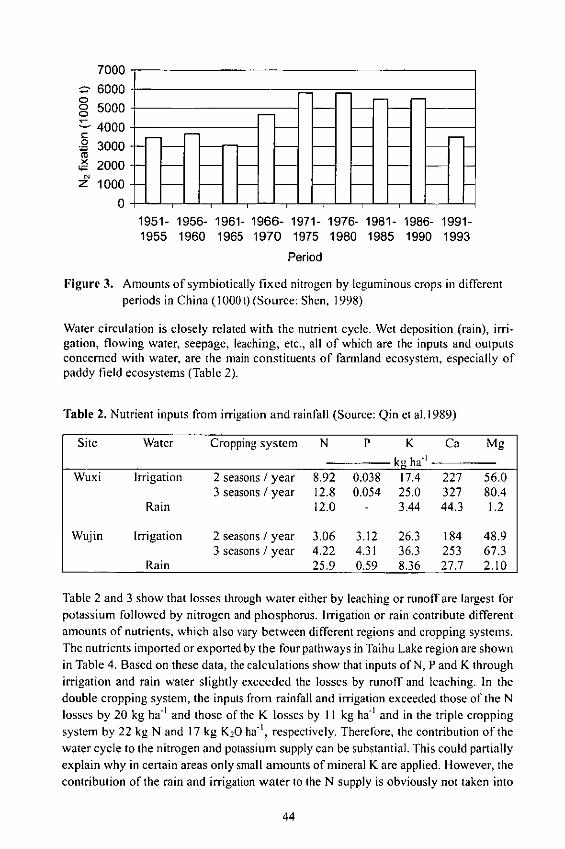
There is a certain area planted to leguminous crops and green manure in China. There-fore, the symbiotic nitrogen fixed by the rhizobia of legumes is an important source ofnitrogen input into farmland. The cumulative amount of nitrogen fixed by leguminouscrops during 5 years since the 1950's in China is shown in Figure 3. There was littlevariation in the total amount of nitrogen fixed since the 1970's, fluctuating around5,500,000 t. However, this estimate didn't include the amounts fixed by horse bean,cowpea, red bean, pea and mungbean, thus the data in Figure 3 slightly underestimatethe real N inputs.
43
7000c"6000C -o 5000C
4000
30002000
z 1000_
1951- 1956- 1961- 1966- 1971- 1976- 1981- 1986- 1991-1955 1960 1965 1970 1975 1980 1985 1990 1993
Period
Figure 3. Amounts of symbiotically fixed nitrogen by leguminous crops in differentperiods in China (1000t) (Source: Shen, 1998)
Water circulation is closely related with the nutrient cycle. Wet deposition (rain), irri-gation, flowing water, seepage, leaching, etc., all of which are the inputs and outputsconcerned with water, are the main constituents of farmland ecosystem, especially ofpaddy field ecosystems (Table 2).
Table 2. Nutrient inputs from irrigation and rainfall (Source: Qin et al.1989)
Site Water Cropping system N P K Ca Mgkg ha"
Wuxi Irrigation 2 seasons / year 8.92 0.038 17.4 227 56.03 seasons / year 12.8 0.054 25.0 327 80.4
Rain 12.0 - 3.44 44.3 1.2
Wujin Irrigation 2 seasons / year 3.06 3.12 26.3 184 48.93 seasons / year 4.22 4.31 36.3 253 67.3
Rain 25.9 0.59 8.36 27.7 2.10
Table 2 and 3 show that losses through water either by leaching or runoff are largest forpotassium followed by nitrogen and phosphorus. Irrigation or rain contribute differentamounts of nutrients, which also vary between different regions and cropping systems.The nutrients imported or exported by the four pathways in Taihu Lake region are shownin Table 4. Based on these data, the calculations show that inputs of N, P and K throughirrigation and rain water slightly exceeded the losses by runoff and leaching. In thedouble cropping system, the inputs from rainfall and irrigation exceeded those of the Nlosses by 20 kg ha-' and those of the K losses by I I kg ha-1 and in the triple croppingsystem by 22 kg N and 17 kg K20 ha-1, respectively. Therefore, the contribution of thewater cycle to the nitrogen and potassium supply can be substantial. This could partiallyexplain why in certain areas only small amounts of mineral K are applied. However, thecontribution of the rain and irrigation water to the N supply is obviously not taken into
44
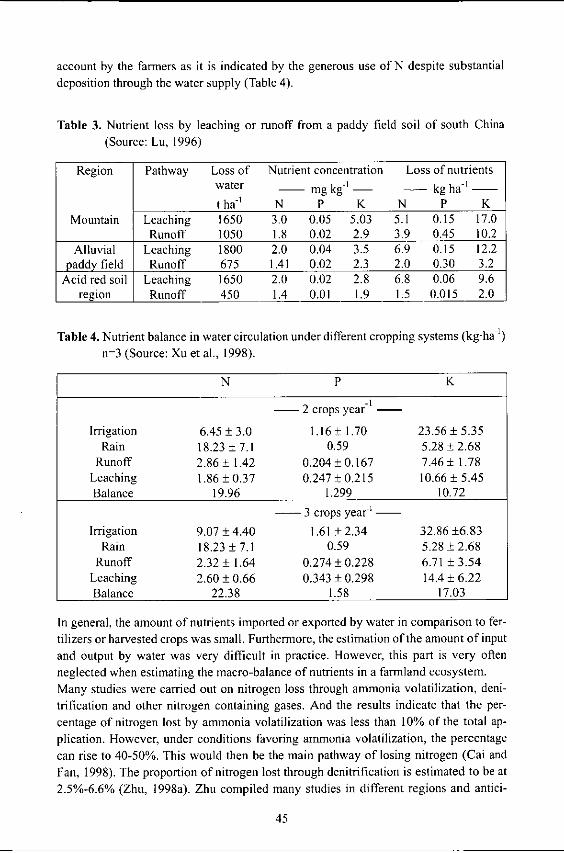
account by the farmers as it is indicated by the generous use of N despite substantialdeposition through the water supply (Table 4).
Table 3. Nutrient loss by leaching or runoff from a paddy field soil of south China(Source: Lu, 1996)
Region Pathway Loss of Nutrient concentration Loss of nutrientswater - mg kg -' - - kg ha- ' -
t ha-' N P K N P KMountain Leaching 1650 3.0 0.05 5.03 5.1 0.15 17.0
Runoff 1050 1.8 0.02 2.9 3.9 0.45 10.2Alluvial Leaching 1800 2.0 0.04 3.5 6.9 0.15 12.2
paddy field Runoff 675 1.41 0.02 2.3 2.0 0.30 3.2Acid red soil Leaching 1650 2.0 0.02 2.8 6.8 0.06 9.6
region Runoff 450 1.4 0.01 1.9 1.5 0.015 2.0
Table 4. Nutrient balance in water circulation under different cropping systems (kgha-)
n-3 (Source: Xu et al., 1998).
N P K-I
- 2 crops year -
Irrigation 6.45 + 3.0 1.16 ± 1.70 23.56 ± 5.35Rain 18.23 ± 7.1 0.59 5.28 ± 2.68
Runoff 2.86 + 1.42 0.204 ± 0.167 7.46 ± 1.78Leaching 1.86 ± 0.37 0.247 ± 0.215 10.66 ± 5.45Balance 19.96 1.299 10.72
- 3 crops year
Irrigation 9.07 + 4.40 1.61 ± 2.34 32.86 ±6.83Rain 18.23 ± 7.1 0.59 5.28 ± 2.68
Runoff 2.32 ± 1.64 0.274 ± 0.228 6.71 ± 3.54Leaching 2.60 ± 0.66 0.343 + 0.298 14.4 ± 6.22Balance 22.38 1.58 17.03
In general, the amount of nutrients imported or exported by water in comparison to fer-tilizers or harvested crops was small. Furthermore, the estimation of the amount of inputand output by water was very difficult in practice. However, this part is very oftenneglected when estimating the macro-balance of nutrients in a farmland ecosystem.Many studies were carried out on nitrogen loss through ammonia volatilization, deni-trification and other nitrogen containing gases. And the results indicate that the per-
centage of nitrogen lost by ammonia volatilization was less than 10% of the total ap-plication. However, under conditions favoring ammonia volatilization, the percentagecan rise to 40-50%. This would then be the main pathway of losing nitrogen (Cai andFan, 1998). The proportion of nitrogen lost through denitrification is estimated to be at2.5%-6.6% (Zhu, 1998a). Zhu compiled many studies in different regions and antici-
45

pated that the average loss of nitrogen from fertilizer was about 45%. This roundedfigure was calculated from estimated average losses of 50% in paddy fields, 40% inmaize and about 30% in wheat (Zhu, 1992) and is hence very rough. It may vary byseveral orders of magnitude from side to side and for a good fertilizer managementshould be assessed for each particular conditions.
The development of nutrient balances for N, P, K in Chinese farmland ecosystem
The nutrient balance of N, P, K in different periods in China
There are different methods to evaluate the nutrient balance in farmland, such as thenutrient input/output ratio, including the rate of nutrient returned and calculating thecoefficient of balance. Some authors used the permitted efficient or deficient ratio con-sidering the real soil fertility in China based on the criteria that crop yield is not affectedunder a certain level of deficiency and nutrients are not wasted within a certain range ofsufficiency. Figure 4 shows the nutrient balance for N, P, K which has been calculated bycomparing inputs and outputs based on existing statistics.
.... N - P -- K
5000
4000
3000
2000
-1000
0)
-1000- - --
Period51-55 61-65 71-75 81-85 91-95
Figure 4. The development of the nutrient balances for N, P20 5, K20 in Chinesefarmland (Source: Shen, 1998; Chinese Yearbook of Agriculture, 1995,1996)
Before the 1970's nitrogen had been deficient because only small amounts were appliedby inorganic fertilizers. Since the 1970's nitrogen became more and more sufficient dueto large amounts of inputs from inorganic sources. However, the nitrogen content infarmland wasn't increased to a measurable extent, which may be explained by the factthat applied N remains mobile, is not incorporated into soil constituents and hence allwhat is not absorbed by the plants is lost from the soil again. Before the 1970's phos-phorus was also deficient, but since 1980's it has accumulated greatly in the soil, mainlybecause of relatively small P removals in comparison to the amounts applied. It wascalculated by Lu (1998) that P fertilizers (P205) imported to farmland had been up to 100Mt during the past 50 years. Considering the current and residual use efficiency of Pfertilizer, 50% being regarded as taken up by crops, the accumulated P in the soil wouldbe over 50 Mt P20 5, equal to 375 kg P20 5 accumulated per hectare. If 5% - 10% of theabove P would be in the available form, the availability should be 4-8 mg kg' greater
46

than that in 1949. Potassium has always been deficient, although the input of K fertilizerhas gradually increased. With larger yields, the potassium removed by crops has alsoincreased. From Figure 4 it is evident that the current input of potash is by far insuffi-cient.
The nutrient balance of N, P, K in China at present time
Helongjiang, Shaanxi, Henan, Jiangsu, Sichuan, Hunan and Guangxi provinces repre-sent typical agro-ecoregions of I season / year, 2 seasons / year, 3 seasons / 2 years, 5seasons / 2 years, 3 seasons / year cropping systems. Therefore, the nutrient balance ofthese provinces may be representative for the variation found in the whole country. Thenutrient balance in all of these 7 provinces was surveyed and the results are presented inTable 5.
Table 5. Nutrient budget of farmland in seven agro-ecological-regions in China (kg ha1)
N P205 K20Province Input Out- Bal- Input Out- Bal- Input Out- Bal-
put ance put ance put anceHelongjiang 108.2 102.4 5.9 46.8 10.8 36.0 27.3 47.3 -20.1Shaanxi 194.4 122.8 71.7 23.1 11.5 11.6 33.1 44.2 -11.2Henan 136.2 122.9 13.3 75.5 50.4 25.1 70.1 117.7 -47.6Jiangsu 481.1 394.3 86.8 154.9 91.4 63.5 162.6 195.9 -33.3Sichuan 322.5 249.0 73.5 121.5 67.5 54.0 75.0 196.5 -121.5Guangxi 416.1 504.0 -87.6 150.6 84.2 66.4 285.4 443.5 -158.1Hunan 582.7 253.2 329.5 188.0 155.8 32.3 318.1 360.7 -42.6
Note: "-" indicates nutrient depletion.
The results presented in Table 6 indicate that N and P were sufficient and K was defi-cient in all provinces except that N was deficient in the Guangxi Province. A comparisonbetween irrigated lowlands and uplands in Guangxi showed that although upland oc-cupies only a little less land, the input of mineral fertilizer in upland was much lowerthan that in irrigated lowland. Thus N was especially and seriously deficient in the up-land, which caused that the overall N supply to the cropping systems of the province wasdeficient (Tan et al., 2000). In this investigation N losses were accounted as 45% of theapplication, though Wang et al. (2001) found much lower recovery of applied N infarmers fields, indicating N losses of up to 70-75% and larger. Large and partly un-avoidable losses of N maybe to a great extent a reason for excessive N application inChina, which influences the quality of product and also the environment. Surplus ap-plication of phosphorus was also observed in every region of China. Although phos-phorus is generally fixed in the soil and little lost, large amounts applied especially tosandy soils may increase its mobility, and also result in losses which then affect theenvironment. Furthermore, the poor nutrient use efficiency of both N and P directlyaffect the economic returns from their application.
47

The causes of nutrient imbalance in Chinese farmland
Many factors caused the nutrient imbalance. One of the major reasons is deeply rootedin the perception of many farmers. For a large number of them mineral fertilizer meansnitrogen and vice versa. This is due to the significant and quick action of nitrogen fer-tilizer which farmers could rely on. It will need a long time to change this perceptionamong users, though scientists have done a lot of research on balanced fertilization inrecent years, proving the essentiality of all nutrients. It may be mainly because of in-adequate education of the farmers which limits the spread of a new approach to fertili-zation. It may be also due to the fact that the development of a service system for ag-ricultural means of production in China lags behind so that farmers can't get the type offertilizers and the appropriate recommendations required. Too much nitrogen fertiliza-tion became a common and serious problem. In the South Jiangsu Province, the nitrogeninput was as much as 600-750 kg per hectare N (Li et al., 1998). Undoubtedly such highinput of nitrogen seriously influences the economical and ecological impact of farming.The use efficiency of phosphorus fertilizer in the current cropping seasons is very low,between 10%-25% (Lu and Jiang, 1990). The poor mobility of phosphorus caused thatlarge amounts of phosphorus were fixed in the soil. Certain soils, however, need largeamounts of phosphorus to saturate the soil matrix and make enough P available to meetcrops' requirements. This usually led to the observation that the input surpassed therequirement, and large amounts of phosphorus accumulated in the soil. The low useefficiency of phosphorus fertilizer, however, also depends on the type of P fertilizer.After introduction of highly concentrated water-soluble P fertilizers, sources with lowphosphorus content, low solubility, low prices and low use efficiency followed. Thesefertilizers, easily accepted by farmers for their low prices, resulted in the large amountphosphorus being applied every year and even during each cropping season.Besides the good mobility of potassium in the soils responsible for losses especiallythrough leaching, the observed K deficit in China is mainly due to the current K fer-tilization policy. This comprises the fertilizer supply structure, people's perceptions, andfertilization measures/techniques in the field, etc.. This altogether caused that on onehand, a serious imbalance in fertilizer consumption of N, P, K developed. The applica-tion ratio of N to K20 which in plants is about I : I was less than 1 : 0.2 (Xie et al., 1998;Xie, 1998), which certainly led to the exhaustion of the soil K reserves. On the otherhand, the ratio of organic manure input, which for a long time had been the only potas-sium source for farmland, decreased significantly with the increasing use of mineralfertilizer, enhancing the imbalance of N, P, K. Potassium deficiency not only limits theyield and quality of agricultural products, but also restricts the use efficiency of N and Pfertilizer, intensifies the environmental problems caused by the loss of N and P. Longperiods of exhaustion of soil K reserves resulted in a degradation of soil fertility. Thelatter couldn't meet the requirement of a sustainable agricultural development. In addi-tion, the introduction of high yielding cultivars and the increase of multiple croppingboosted the tendency of imbalance. Consequently the K deficient areas in China areexpanding.Returning straw to the field is an important way to reduce the strain on soil K. Not onlythe amount but also the way it is returned can have a distinct impact. A long-term ex-periment on returning straw from 1979-1993 in blue and purple soil in the suburb ofShanghai (Table 6) showed that if straw (2,100 kg ha- in each cropping season) wasreturned together with inorganic N, P and K, hardly any deficiency occurred. This ex-periment also showed that returning of straw as much as 4,200 kg ha' per year was not
48
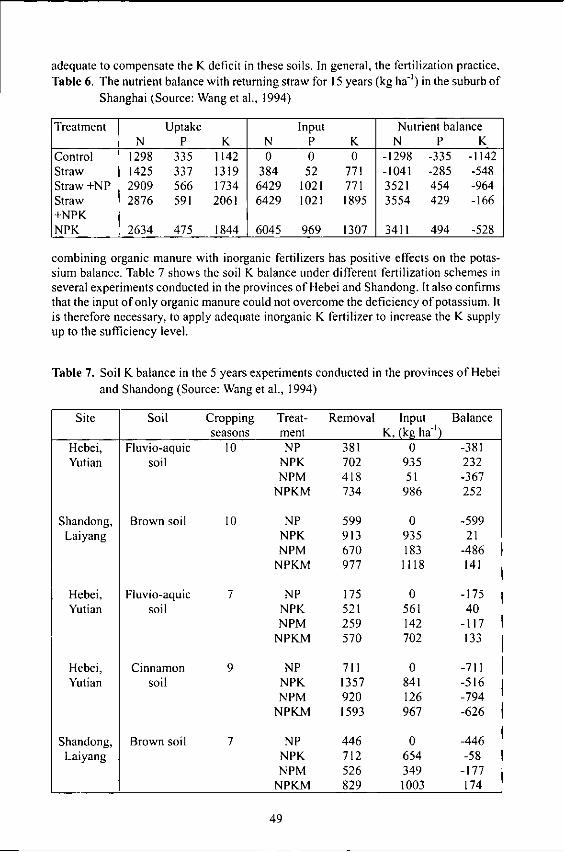
adequate to compensate the K deficit in these soils. In general, the fertilization practice,Table 6. The nutrient balance with returning straw for 15 years (kg ha- ) in the suburb of
Shanghai (Source: Wang et al., 1994)
Treatment Uptake Input Nutrient balanceN P K N P K N P K
Control 1298 335 1142 0 0 0 -1298 -335 -1142Straw 1425 337 1319 384 52 771 -1041 -285 -548Straw +NP 2909 566 1734 6429 1021 771 3521 454 -964Straw 2876 591 2061 6429 1021 1895 3554 429 -166+NPK
NPK 2634 475 1844 6045 969 1307 3411 494 -528
combining organic manure with inorganic fertilizers has positive effects on the potas-sium balance. Table 7 shows the soil K balance under different fertilization schemes inseveral experiments conducted in the provinces of Hebei and Shandong. It also confirmsthat the input of only organic manure could not overcome the deficiency of potassium. Itis therefore necessary, to apply adequate inorganic K fertilizer to increase the K supplyup to the sufficiency level.
Table 7. Soil K balance in the 5 years experiments conducted in the provinces of Hebeiand Shandong (Source: Wang et al., 1994)
Site Soil Cropping Treat- Removal Input Balanceseasons ment K, (kg ha- ')
Hebei, Fluvio-aquic 10 NP 381 0 -381Yutian soil NPK 702 935 232
NPM 418 51 -367NPKM 734 986 252
Shandong, Brown soil 10 NP 599 0 -599Laiyang NPK 913 935 21
NPM 670 183 -486NPKM 977 1118 141
Hebei, Fluvio-aquic 7 NP 175 0 -175Yutian soil NPK 521 561 40
NPM 259 142 -117NPKM 570 702 133
Hebei, Cinnamon 9 NP 711 0 -711Yutian soil NPK 1357 841 -516
NPM 920 126 -794NPKM 1593 967 -626
Shandong, Brown soil 7 NP 446 0 -446Laiyang NPK 712 654 -58
NPM 526 349 -177NPKM 829 1003 174
49
Consequences of nutrient imbalance in farmland
Economical losses
The mineral nitrogen applied in the form of urea, ammonium and nitrate, etc. undergoestransformations in the soil which depending on site specific conditions, may lead tolarge N losses into water or air. This, besides the environmental impact also leads tosubstantial economic losses. According to the statistics, 21,164,110 t (elemental N) ni-trogen fertilizer was applied to farmland in 2001. If the loss of nitrogen fertilizer is in theregion of 45% as estimated by Zhu, the total annual loss is as much as about 9,522,000 tN from China's farmland. This amount is equivalent to 20 Ml of urea. At a price of 2,000RMB Yuan/t urea, the total loss is 40 billion RMB Yuan (4.9 billion USD) (ChineseAgricultural Yearbook, 1998; Zhu, 1998b).
Waste of energy and resources
Production of N, P, K fertilizers is generally a natural resource and energy consumingprocess. Hence it is a perpetual loss to the development and utility of the non-renewableresources in the future.
Environmental problems
Surplus application of nitrogen does not lead to an accumulation in the soil, but is gen-erally lost through different pathways into the atmosphere or water. The increase ofammonia flux in the atmosphere leads to soil acidification followed by a replacement ofvegetation, e.g. forest decline, etc., affecting whole ecosystems. In addition, the dis-charge of N20 and other NO, gases destroy the ozone layer. As to water, the nitratecontent in surface and ground waters may be increased. Efflux of excessive P into water,furthermore, leads to an eutrophication so that with increasing attention paid to thecontrol of industrial pollutants in sewage, more and more importance has also to beattached to the potential pollution caused by agriculture.
Decline in soil fertility
Large supplies in nitrogen and phosphorus and inadequate supply of potassium leads toan imbalance between N, P and K. This means that the crops' demand for normal growthcannot be met, and the potential crop yields cannot be fully exploited. In contrast, im-balances between these nutrients will accelerate the exhaustion of soil potassium at thesame time. This will surely result in a further decrease in the use efficiency of NP fer-tilizers, thus the sustainable soil productivity and development of agriculture will bethreatened.
Strategy to resolve the current nutrient imbalance in China
The limited farmland resources and the strong population pressure make it necessary tocontinuously improve crop yield per unit area. For China, this situation will persist forquite a long time in the future. Increasing the fertilizer input will still be the key method
50

to supply the food demand. But the nutrient imbalance in current farmland and the se-rious maladjustment of N, P, K ratios in fertilization, if not corrected in time, will in-evitably lead to further decline in quality of farm products and increase in cost of pro-duction. Together with a poor fertilizer use efficiency, the threat to the environment, thedecrease of soil fertility, etc., will affect China's food security and sustainable devel-opment of agriculture in the 21" century. It's a great challenge for Chinese soil and fer-tilizer scientists to achieve high efficiency, high yield and high quality of agriculturalproducts as well as to improve soil fertility and to maintain environmental quality.
Principles to improve the balance situation of nutrient in fertilization
The major causes which led to the nutrient imbalance are evident from the results of theabove investigation on the current nutrient utilization practice in China. Thus the generalprinciples in fertilization can be summarized as 'economizing N, activating P, and sup-plementing K'.
'Economizing N' refers to improvement of nitrogen input towards better techniques andsmaller quantities. It could be carried out by improving the adjustment of N fertilizeramount according to the requirement of crops. Using new fertilization applicationtechniques to minimize nitrogen losses and increase use efficiency of N fertilizer, e.g. bybetter splitting the application. The application of new type of release-controlled andslow-release fertilizer will play an important role in this field. "Activating P" refers toreduce the fixation of P from fertilizer and activate P accumulated in soil through newtechniques by employing soil organisms which are capable to mobilize this fractions.Furthermore, using appropriate fertilizer varieties and methods of fertilization accordingto the cultivation systems and soil conditions has a great potential in this respect. Theapplication of many kinds of synergistic agents for phosphorus fertilizers will hencehave promising prospects. The strategy of 'supplementing K' is rather simple, whichmeans to increase the application of K fertilizer to a large extent. Besides maintaininghigh crop yield, the potential with larger K application lies in increasing product qualityand maintaining soil fertility. Since this is the tendency of the agricultural development,a further increase of K fertilizer application is of utmost importance
Application of organic manure will constitute an important component to maintain abalance in soil fertility
As outlined, application of organic manure has been well recognized in China for cen-turies. The returning of most of the organic matter to farmland is a need to an efficientutilization of nutrient resources. Returning nutrients from organic residues to the fieldcan also help to reduce the mineral fertilizer input and may as well reduce environmentalpollution caused by excessive one-sided application of especially N fertilizer. Organicmanure is generally characterized by a complete and balanced ratio of nutrients, thus,could well contribute to an alleviation of the nutrient imbalance situation in China.Taking K as an example, the ratio of potassium applied by organic manure to the whole
51

potassium input is up to 70%. But the organic manure is also characterized by low nu-trient concentrations and slow release combined with inconvenient handling of bulkymaterial. Therefore, improved techniques for the application of organic fertilizer have tobe developed, including the returning of straw and the commercial manufacturing oforganic fertilizers from organic residues.
Supplement of micronutrients should not be neglected in the nutrient balance.
The application of macronutrients and the increasing of crop production inevitably leadsto the exhaustion of micronutrients and some other beneficial elements, which will re-sult in the decrease of crop yield and quality. Thus it is necessary to supplement theseelements to keep nutrient balance in farmland. Application of organic manure and re-turning of straw has long been the best way to supplement nutrients not yet recognizedfor being limiting production at a site.
Strengthening the macro-control of fertilizer distribution.
The agricultural service system in which the official advisory service together with thefertilizer Industry advise farmers, has not been well developed in China. The influenceof governmental intervention will therefore play a continued role in the nutrient supplyto farms. This means that government services improve the advices on appropriate fer-tilizer use to farmers and at the same time care is taken of that the serious imbalance ofnutrients is reverted in the importation and production of fertilizers so that the requirednutrients are available on the market, The new approach should also pay attention to thedistribution of various fertilizers. Fertilizers should be allocated to the regions of higherproduction potentials, i. e. where the return from fertilizer is higher and should be re-duced in regions, where already excessive fertilizer use and comparatively smaller po-tentials exist. The basis for putting high-efficient utilization of fertilizer resources andmaintain nutrient balances in future into practice is to build and develop anagro-technical service system.
References
Cai, G. X., Fan, X. H., 1998. Soil nitrogen and the efficient application of N fertilizers. In:Lu, R. K., (ed.), Theories of Soil and Plant Nutrition and Application of Fertilizer.Chemical Industry Press, Beijing, pp. 112-15 1. (in Chinese)
Chinese Yearbook of Agriculture. 1995. Chinese Agricultural Press, Beijing. (in Chi-nese)
Chinese Yearbook of Agriculture. 1996. Chinese Agricultural Press, Beijing. (in Chi-nese)
Chinese Yearbook of Agriculture. 1998. Chinese Agricultural Press, Beijing. (in Chi-nese)
Li, Q. K., Zhu, Z. L., Yu, T. R., (eds.), Fertilization Problems in Sustainable Develop-ment of Chinese Agriculture. Jiangxi Science and Technology Press, Nanchang, P. R.China. (in Chinese)
Lin, B., 1998. Problems and management in the development of fertilizer structure andeffect in China. In: Li, Q. K., Zhu, Z. L., Yu, T. R. (eds.), Fertilization Problems in
52

Sustainable Development of Chinese Agriculture. Jiangxi Science and TechnologyPress, Nanchang, P. R. China, pp. 12-27. (in Chinese)
Lu, R. K., Jiang, B. F., 1990. Phosphorus in Soils. In: Hseung, Y., Li, Q. K. (eds.), Soilsof China (2th edition). Science Press, Beijing, pp. 486-501. (in Chinese)
Lu, R. K., Liu, H. X., Wen, D. Z., Qin, S. W., Zheng, J. Y., Wang, Z. Q., 1996. Studies onnutrient cycle and equilibrium in a typical agroecological system in China: I. Pa-rameters of nutrient output in field systems. Chinese J. of Soil Sci, 27(4): 145-151.(in Chinese)
Qin, Z. P., Xu, Q., Hseung, Y., 1989. Nutrient cycling in wheat-rice and barley-rice-ricerotation systems of the Tai Lake region: II. Cycling of five major nutrients in normalpaddy field ecosystems. Acta Ecologica Sinica. 9(3): 245-252. (in Chinese)
Shen, S. M., 1998. The cycle of carbon and main nutrients in the agricultural system andthe soil nutrient balance in China. In: Shen, S. M. (ed.), Soil Fertility in China.Chinese Agricultural Press, Beijing, pp. 57-110. (in Chinese)
Tan, H. W., Zhou, L. Q., Xie, R. L., 2000. Studies on the cycling and balance of fieldnutrients in Guangxi Province. In: Zhou, J. M., (ed.), Nutrient Cycling and Man-agement in Chinese Agro-ecosystems. Hehai University Press, Nanjing. pp. 220-225.(in Chinese)
Wang, G.., Dobermann, A., Witt, C., Sun, Q. and Fu, R. 2001. Performance of si-te-specific nutrient management for irrigated rice in Southeast China. Agron. J. 93,869-878.
Wang, Z. L., Jin, J. Y., Wang, L. C., Gao, . L., 1994. K balance and preliminary studieson potash requirement of some soils in the North areas of China. In: ChineseAcademy of Agricultural Sciences, the Beijing Agency of PPIC, (eds.), Soil potas-sium and effect of potash application in the North areas of China. Chinese Agri-cultural Press, Beijing, pp. 17-25. (in Chinese)
Wang, Y. H., Ke, F. Y., Zhang, M. Z., Gu, Y. M., Chen, C. H., 1994. The overall effect oflong-term turning over straw into soils. Chinese J. of Soil Sci. 25(7): 53-56- (inChinese)
Xie, J. C., 1998. The use and requirement of potash and management in China. In: Li, Q.K., Zhu, Z. L., Yu, T. R. (eds.), Fertilization Problems in Sustainable Developmentof Chinese Agriculture. Jiangxi Science and Technology Press, Nanchang, pp. 69-85.(in Chinese)
Xie, J. C., Xing, W. Y., Zhou, J. M., 1998. Current use of and requirement for nutrientsfor sustainable food production in China. In: Johnston, A. E., Syers, J. K. (eds.),Nutrient management for sustainable crop production in Asia. The University Press,Cambridge, UK, pp. 267-277.
Xu, Q., Yang, L. Z., Dong, Y. H. (ed.), 1998. The rice field ecosystem of China. ChineseAgricultural Press, Beijing. (in Chinese)
Zhu, Z. L., 1992. Processes of nitrogen loss and management in the field system. In: Zhu,Z. L., Wen, Q. X. (eds.), Nitrigen in Soils of China. Jiangsu Science and TechnologyPress, Nanjing, pp. 213-249. (in Chinese)
Zhu, Z. L., 1998a. The fertility and management of soil N in China. In: Shen, S. M. (ed.),Soil Fertility in China. Chinese Agricultural Press, Beijing, pp. 160-211. (in Chi-nese)
Zhu, Z. L., 1998b. Problem and management in the use of nitrogen fertilizer in China. In:Li, Q. K., Zhu, Z. L., Yu, T. R., (eds.), Fertilization Problems in Sustainable De-velopment of Chinese Agriculture. Jiangxi Science and Technology Press,Nanchang, pp. 38-5 1. (in Chinese)
53

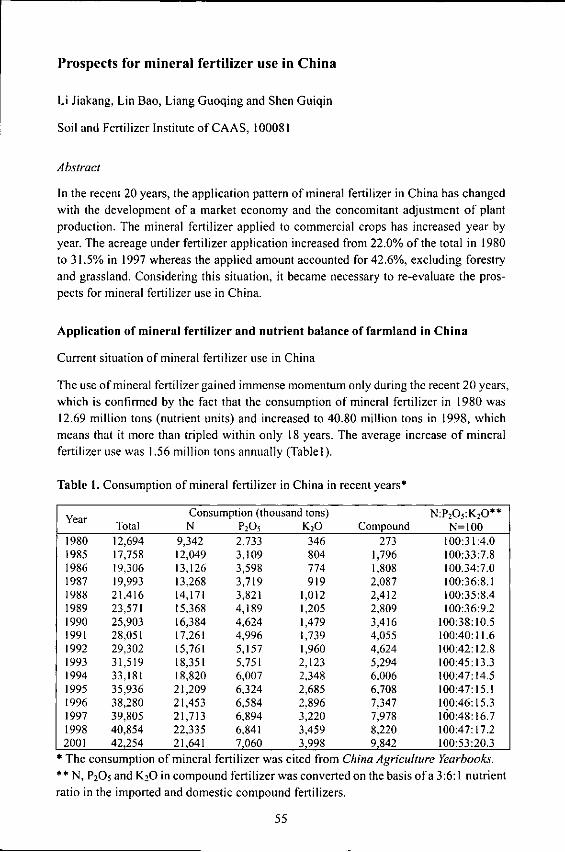
Prospects for mineral fertilizer use in China
Li Jiakang, Lin Bao, Liang Guoqing and Shen Guiqin
Soil and Fertilizer Institute of CAAS, 100081
Abstract
In the recent 20 years, the application pattern of mineral fertilizer in China has changedwith the development of a market economy and the concomitant adjustment of plantproduction. The mineral fertilizer applied to commercial crops has increased year byyear. The acreage under fertilizer application increased from 22.0% of the total in 1980to 31.5% in 1997 whereas the applied amount accounted for 42.6%, excluding forestryand grassland. Considering this situation, it became necessary to re-evaluate the pros-pects for mineral fertilizer use in China.
Application of mineral fertilizer and nutrient balance of farmland in China
Current situation of mineral fertilizer use in China
The use of mineral fertilizer gained immense momentum only during the recent 20 years,which is confirmed by the fact that the consumption of mineral fertilizer in 1980 was12.69 million tons (nutrient units) and increased to 40.80 million tons in 1998, whichmeans that it more than tripled within only 18 years. The average increase of mineralfertilizer use was 1.56 million tons annually (Tablel).
Table 1. Consumption of mineral fertilizer in China in recent years*
Year Consumption (thousand tons) N:P205:K20**Total N P2O K20 Compound N=100
1980 12,694 9,342 2,733 346 273 100:31:4.01985 17,758 12,049 3,109 804 1,796 100:33:7.81986 19,306 13,126 3,598 774 1.808 100.34:7.01987 19,993 13,268 3,719 919 2,087 100:36:8.11988 21.416 14,171 3,821 1,012 2,412 100:35:8.41989 23,571 15,368 4,189 1,205 2,809 100:36:9.21990 25,903 16,384 4,624 1,479 3,416 100:38:10.51991 28,051 17,261 4,996 1,739 4,055 100:40:11.61992 29,302 15,761 5,157 1,960 4,624 100:42:12.81993 31,519 18,351 5.751 2,123 5,294 100:45:13.31994 33,181 18,820 6,007 2,348 6,006 100:47:14.51995 35,936 21,209 6,324 2,685 6,708 100:47:15.11996 38,280 21,453 6,584 2,896 7,347 100:46:15.31997 39,805 21,713 6,894 3,220 7,978 100:48:16.71998 40,854 22,335 6,841 3,459 8,220 100:47:17.22001 42,254 21,641 7,060 3,998 9,842 100:53:20.3
* The consumption of mineral fertilizer was cited from China Agriculture Yearbooks.** N, P20 5 and K20 in compound fertilizer was converted on the basis of a 3:6:1 nutrientratio in the imported and domestic compound fertilizers.
55

Calculated on the basis of 133.33 million ha of farmland and 208.00 million ha ofacreage under crops due to a 1.56 multiple cropping-index, the average amount ofmineral fertilizer applied in 1998 was 306 kg ha" farmland and 196 kg ha' per crop,respectively.Table 2 indicates that world-wide there is a good relationship between the fertilizer ap-plied per unit area and the general stage of economic development as well as betweenfertilizer application and the average of farmland per person. Generally speaking, theapplication level of fertilizer in developed countries was higher than that in developingcountries. The application rate of fertilizers in those countries with more available arableland per capita was less than in countries with limited availability of arable land,showing that intensity of agriculture increases with scarcity of land.
Table 2. Comparison of fertilizer applied per unit area between China and somecountries or regions of the world
Fertilizer application (kg ha-') Farmland for eachRegion or country 1989 1994 1997 person
(ha person I)World 98.7 90 97.1 0.239North America and Central 83.7 97 97.1 0.589AmericaAsia 114.8 129 141.1 0.129Europe 229.4 163 85.1 0.242All the developed countries 124.6 - -All the developing countries 76.8 - -U.S.A. 93.6 104 108.8 0.713Russia 117.0 20 14.1 0.879India 65.2 124 88.0 0.181Japan 415.0 442 396.3 0.032France 311.5 280 277.0 0.316Germany 411.3 248 238.2 0.144Netherlands 649.6 587 569.5 0.059United Kingdom 345.7 339 364.7 0.104China* 306.0 216 267 0.114China** 196.0 139 171 0.168Calculated on 133.33 million ha of arable land.
** Calculated on 133.33* 156%=208.00 million ha of arable land.
The total amount of fertilizer applied in China was larger than in the average of thedeveloped countries world-wide. But compared with Germany and the United Kingdomwith similar farmland availability per capita, China's total fertilizer consumption is stillless.During the course of increasing the consumption of mineral fertilizers, China had toadjust the ratio ofN : P : K in the fertilizers. Whereas in 1980, this ratio was 100:31:4, itsteadily improved to a ratio of 100:53:20 in 2001. In the current situation, the applica-
56

tion ratio between N and P is more according the plants' requirements whereas theproportion of potassium applied is yet far from matching the crop removals. This causesa continuous depletion of soil K reserves.
Nutrient balance of farmland in China
For several decades, our agricultural production was depending on the input of organicsources, mainly crop residues, animal and human wastes, which caused that all nutrientswithout exception became the main production limiting factor. Since the 1980's, this
situation greatly changed with increasing the input of mineral fertilizer. In 1995, Chinese
farmers applied 28.35 million tons of N, 13.65 million tons of P and 10.96 million tons
of K, including organic and inorganic fertilizer with a ratio of 100:48:48 of N : P20 5 :
K20. The nutrients removed by crops were 13.73 million tons of N, 5.77 million tons ofP and 14.55 million tons of K at a ratio of 100:42:106 ofN : P205 : K20. The balance
between inputs and outputs shows that N was sufficient with 3.50 million tons, P suffi-cient with 4.89 million tons and K was deficient with 3.55 million tons. This situation
further worsened until 2000 (Table 3).According to the nutrient balance of farmland, Chinese farmers applied much morenitrogen fertilizer and less potassium fertilizer before. Although an excess in phospho-rous was applied because in the beginning our soil was widespread deficient in P, and
owing to the behavior of P in the soil not being leached, it was necessary to keep a high
application level over a long time, to develop the soil fertility of farmland. It then be-came essential for us to adjust the application ratio of N and K and improve the potas-sium status in both soil and crop.
Table 3. Input and output of nutrient of farmland in China (thousand tons)
Year 1949 1957 1965 1975 1980 1985 1990 1995 2000
Organ N 1620 2490 2930 4100 4160 5030 5260 6110 6520Fertilizer P20, 790 1230 1380 1940 2060 2560 2800 3300 3440
K20 1870 2860 3060 4620 5090 6210 6930 7600 8320
Inorgani N 6 316 1210 3640 9430 12590 17400 2224022480cP 20 - 52 550 1610 2900 4190 6680 10350 8410Fertilizer PO 211 9K 20 - - 3 130 370 980 1820 3360 3350
N 2910 5110 5220 7490 8670 11140 12790 1373016620Output P205 1380 2360 2370 3340 3780 4790 5590 5770 6640
K20 3060 5620 5600 8130 9330 12080 13750 14550 17390N -1290 -2460 -1690 -1570 210 190 1170 3500 1140
Balance P205 -590 -1100 -600 -280 310 710 1890 4890 1000K20 -1190 -2760 -2540 -3380 -3870 -4890 -4990 -3550 -5720
Note: Use efficiency of N applied was calculated as 50% (including after effect), P 70%(including after effect), organic fertilizer and K as 100%, assuming minimum
losses as residual effects over the years are included.
57
Developing trend of mineral fertilizer use in China
Change of fertilizer application pattern of China during the past 20 years
With the development of a market economy, the adjustment of plant production, anincrease in tea, fruit, mulberry, tropical commercial trees and popularization of fertilizeruse, the pattern of fertilizer consumption in China greatly changed. According to thestatistical information from the China Agriculture Yearbooks, in the period from 1980 to1997, the acreage under crop for grain was stable at around 0. 11 billion ha. The increaseof total grain production was achieved by raising the per unit-area yield which dependedon the increase of fertilizer application. During the same period, the acreage undercommercial crops increased rapidly by 2.13 times for melon, 3.85 times for fruit trees,4.93 times for tobacco, 56% for oil seeds, 108.6% for sugar. The total acreage forcommercial crops, receiving fertilizer increased from 14.93 million ha in 1980 to 16.47million ha in 1997 whereas the proportion of acreage under grain crops, receivingfertilizer declined from 78% in 1980 to 68.5% of the total in 1997, down 10% (Table 4).Moreover, the fertilizer applied per unit-area to grain crops was smaller than that appliedto commercial crops. According to the results from a survey covering 1958 farmers fromthe Jilin, Shandong, Shaanxi, Sichuan, Hubei, Guangxi, Jiangsu provinces or munici-palities, the average amount of mineral fertilizer applied to grain crops in 1996 was 273kg ha' and 441 kg ha-1 to commercial crops (Table 5). The fertilizer applied to com-mercial crops was 61.5% larger than that applied to grain crops. If calculated on croparea basis, using the data from China Agriculture Yearbook and the information from theabove described survey, 40% of mineral fertilizer was applied to commercial crops in1997 (Table 6). Even though the data of the survey indicate a 35 % larger applicationthan what is actually applied according to the statistics, it revealed an apparent insightinto the application pattern of China during the past 20 years.Furthermore, according to the survey with 1958 farmers, comparing the fertilizer ap-plication in 1996 and 1994, the fertilizer applied to commercial crops raised by 53kg ha" and only 13 kg ha-i to grain crops (Table 7), or 13.6% and 5%, respectively.Underestimating the proportion of fertilizer applied to commercial crops in the past andoverestimating that applied to food crops, could be a reason for the observation that thegrain yield of China in recent 20 years could not catch up with the increase of mineralfertilizer application. The discussion above did not include the fertilizer application toforestry and grass.
58

Table 4. Area of various crops in China, receiving fertilizers in recent 20 years(1000 ha)
Crop variety 1980 1985 1990 1995 1997Grain 116472 108845 113467 110061 112913Cotton 4920 5140 5588 5421 4491Oilseed 7929 11800 10900 13101 12380
Crude fiber 314 1231 495 376 327Sugar 922 1525 1679 1820 1923Tobacco 397 1313 1593 1470 2353Melon and vegetable 4021 5673 7059 10616 12591Other crops 10642 8097 7583 7013 6991Tea tree 1041 1045 1061 1115 1076Fruit tree 1783 2736 5179 8098 8649Mulberry 287 413 484 (484) (484)Tropical crops (588) 588 698 668 685Total 149315 148407 155785 160244 164864Grain (%) 78.0 73.3 72.8 68.7 68.5
Note: cited from China Agriculture Yearbook. Mulberry lacked the information of 1995and 1997 so that data of 1990 were used. The information of 1980 on Tropical crops wasused instead of that of 1985.
Table 5. Fertilizer applied to each crop based on a survey with 1958 farmers in 1996(kg ha-')
Crop Type N P2O5 K20 Total Acreage applied(ha)
Wheat 171 80 20 277 318.2
Corn 203 70 27 300 411.7Rice 196 51 55 302 364-5Root crop 104 36 15 155 63.8Bean 34 28 21 83 76.7Others 132 38 7 177 15.1Average of grains 177 64 32 273 1250Melon and Vegetable 263 237 121 721 51.6Cotton 215 79 57 351 50.1Crude fiber 159 55 84 298 2.2Sugar 304 112 208 624 21.1Oil seed 114 56 27 197 76.1
Tobacco 119 91 71 281 11.7Fruit tree 326 197 73 596 57.9Tea tree 448 19 12 479 2.2Mulberry 251 21 14 286 3.3Others 145 65 38 248 9.3Average of commercial crops 240 126 75 441 285.5
Note: cited from the survey carried out by SF of CAAS and PPIC.
59

Table 6. Proportion of fertilizer applied to grain and to commercial crops of China in1997
Total mineral Grain crop Commercial cropfertilizer Acreage Application Of total Acreage Application Of totalapplied
(mill. tons) (1000 ha) (mill, tons) (%) (1000 ha) (mill. tons) (%)53.75 112913 30,82 57.4 51951 22.91 42.6
Note: 1. The mineral fertilizer application was calculated, using the information inTable 4, namely 273 kg ha- for grain crop and 441 kg ha-' for commercial crop.
2. The actual mineral fertilizer applied in 1997 was 39.80 million tons.
Table 7. Comparison between the application of mineral fertilizer of 1958 farmers in1984 and 1996
1994 1996Crop type N P20 5 K 20 Total N P205 K20 Total Change
Grain crop 172 62 26 260 177 64 32 273 13Commercial crop 216 112 60 388 240 126 75 441 53
Note: cited from the survey carried out by SF1 of CAAS and PPIC.
Fertilizer application to forestry
Since 1979, three surveys on forestry were carried out and a foui'th is in progress. Theinformation on area development of commercial forest, bamboo and seedling nurseriesare shown in Table 8. According to this, commercial forest and bamboo productiondeveloped very fast, increasing 89.0% and 18.5% in the period of 14 years from 1979 to1993. Fast-growing forest was not surveyed and an amount for 2000 was anticipated.Commercial forest refers to those forests planted for dry fruit, oil seed, beverage, fla-voring agents, raw industrial material and drug production excluding fruit, mulberry andtea, which are listed separately in the China Agriculture Yearbook. Generally speaking,fast-growing forests, commercial forests, bamboo and seedling nurseries have to receivemineral fertilizers.
Table 8. Artificial and grown forest resource in China (1000 ha)
Period of Fast-growing Commercial bamboo Seedlingsurvey forest" forest* nursery
1979-1981 6259 3200 -
1984-1988 - 8722 3546 184.51989-1993 800 11830 3791 114.9
* Commercial forest was referred to those forest planted for dry fruit, oil seed, beverage,flavoring agents, raw industrial material and drug production.** Fast-growing forest was not surveyed and 8 million ha were anticipated for 2000.
60

In recent years, considerable research on the fertilizer application to forestry was carried
out. Some of the results are shown in Table 9, in which 3 groups can be distinguished as
fast-growing forest, commercial forest and bamboo. Fast-growing forest included 49
varieties, e.g. fir, red pine, slash pine, other pines, eucalyptus and poplar, etc., The re-
sults revealed that fast-growing forest needed mainly nitrogen and phosphorous fertil-
izer whereas potassium was not essential at this stage. However, based on a calculation,
using 17 field trials in commercial forests, including fruit, flavoring agents and oil seed,the application of fertilizer should be 200 kg N ha-] , 100 kg P205 ha' and 150 kg K,Oha-I.
II trials on bamboo were carried out and the results show that the application of fertil-
izer should be 212 kg N ha - ', 77 kg P20 5 ha" and 68 kg K20 ha - '.
Furthermore, the trials above indicated that the fertilizer application to forestry was
generally larger than that to grain crops and the fertilizer applied to commercial forest
was even much greater.
Table 9. Fertilizer application to forestry (from 1989 to 1997)
Trial ApplicationVariety Trial (kg ha') Trial location
amount-N PO K,N P205 K20O
Fast- Fir 12 53(7) 61(11) 31(5) Jiangxi, Fujian, Yunnan,growing Guangxi, Guangdong,forest Jiangsu, Zhejiang, Hunan
Masson Pine 7 94(5) 119(7) 54(4) Guangxi, Guizhou,Sichuan, Hunan, Anhui
Slash Pine 7 39(4) 67(6) 14(2) Jiangxi. Hunan. Anhui.Guangdong
Other pines 7 76(6) 51(5) 21(2) Guangdong, Liaoning,Fujian, Heilongjiang
Eucalyptus 6 50(5) 84(6) 53(4) Guangdong, Guangxi,Fujian, Yunnan
Poplar 10 126(10) 72(9) 14(4) Shandong, Hebei, Hunan,Gansu
Commercial Jujube 5 116(5) 75(4) 34(2) Shandong, Hebeiforest Chestnut 5 264(5) 110(5) 30(1) Zhejiang, Liaoning, Henan,
HebeiChinese 1 150 100 120GooseberryPersimmon I 200 150 150Hawkthon 1 150 I50 150 LiaoningHickory 1 207 67.5 67.5 ZhejiangCashew 1 160 40 70 HainanPepper I 570 304 375 HainanTung tree 1 120 71 78 Zhejiang
Bamboo I1 212(11) 77(9) 68(8) Zhejiang, Sichuan,Guizhou, Anhui
Average of all trials and ( ) indicates the current recommendation.
61
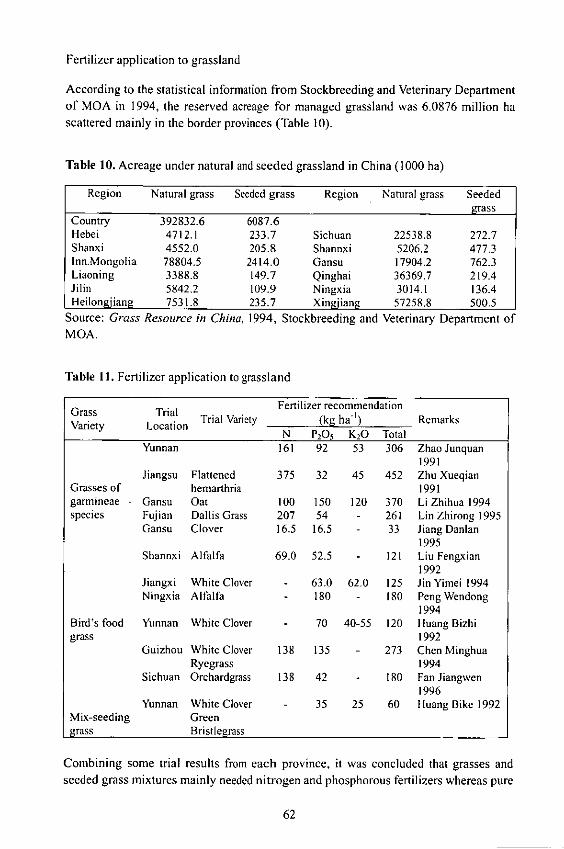
Fertilizer application to grassland
According to the statistical information from Stockbreeding and Veterinary Departmentof MOA in 1994, the reserved acreage for managed grassland was 6.0876 million hascattered mainly in the border provinces (Table 10).
Table 10. Acreage under natural and seeded grassland in China (1000 ha)
Region Natural grass Seeded grass Region Natural grass Seededgrass
Country 392832.6 6087.6Hebei 4712.1 233.7 Sichuan 22538.8 272.7Shanxi 4552.0 205.8 Shannxi 5206.2 477.3lnn.Mongolia 78804.5 2414.0 Gansu 17904.2 762.3Liaoning 3388.8 149.7 Qinghai 36369.7 219.4Jilin 5842.2 109.9 Ningxia 3014.1 136.4Heilongiiang 7531.8 235.7 Xingiiang 57258.8 500.5
Source: Grass Resource in China, 1994, Stockbreeding and Veterinary Department ofMOA.
Table 11. Fertilizer application to grassland
Grass Trial TFertilizer recommendationVariety Location Trial Variety (kg ha') Remarks
N P205 K20 TotalYunnan 161 92 53 306 Zhao Junquan
1991Jiangsu Flattened 375 32 45 452 Zhu Xueqian
Grasses of hemarthria 1991garmineac Gansu Oat 100 150 120 370 Li Zhihua 1994species Fujian Dallis Grass 207 54 - 261 Lin Zhirong 1995
Gansu Clover 16.5 16.5 - 33 Jiang Danlan1995
Shannxi Alfalfa 69.0 52.5 - 121 Liu Fengxian1992
Jiangxi White Clover - 63.0 62.0 125 Jin Yimei 1994Ningxia Alfalfa - 180 - 180 Peng Wendong
1994Bird's food Yunnan White Clover - 70 40-55 120 Huang Bizhigrass 1992
Guizhou White Clover 138 135 - 273 Chen MinghuaRyegrass 1994
Sichuan Orchardgrass 138 42 - 180 Fan Jiangwen1996
Yunnan White Clover - 35 25 60 Huang Bike 1992Mix-seeding Greengrass Bristlegrass
Combining some trial results from each province, it was concluded that grasses andseeded grass mixtures mainly needed nitrogen and phosphorous fertilizers whereas pure
62
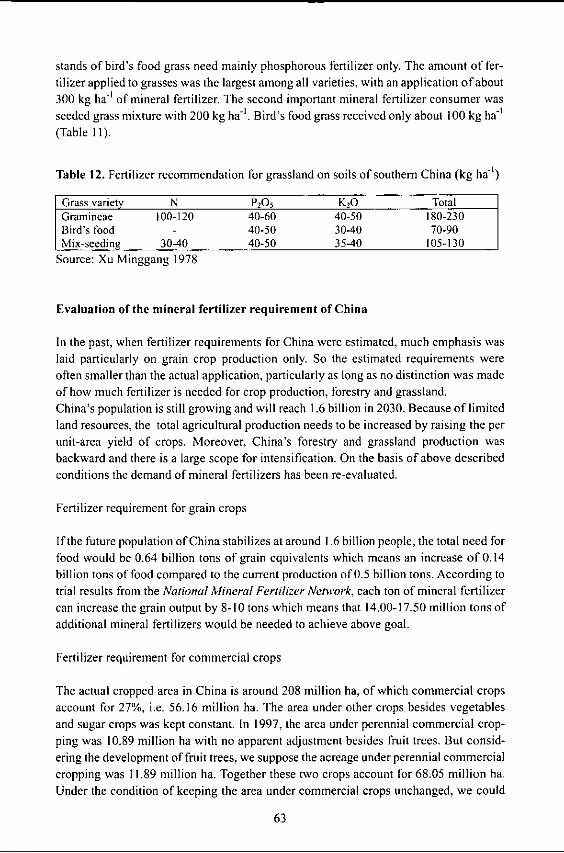
stands of bird's food grass need mainly phosphorous fertilizer only. The amount of fer-tilizer applied to grasses was the largest among all varieties, with an application of about300 kg ha-1 of mineral fertilizer. The second important mineral fertilizer consumer wasseeded grass mixture with 200 kg ha-'. Bird's food grass received only about 100 kg ha-'(Table 11).
Table 12. Fertilizer recommendation for grassland on soils of southern China (kg ha')
Grass variety N P2 0 5 K,O TotalGramineae 100-120 40-60 40-50 180-230Bird's food - 40-50 30-40 70-90Mix-seeding 30-40 40-50 35-40 105-130
Source: Xu Minggang 1978
Evaluation of the mineral fertilizer requirement of China
In the past, when fertilizer requirements for China were estimated, much emphasis waslaid particularly on grain crop production only. So the estimated requirements wereoften smaller than the actual application, particularly as long as no distinction was madeof how much fertilizer is needed for crop production, forestry and grassland.China's population is still growing and will reach 1.6 billion in 2030. Because of limitedland resources, the total agricultural production needs to be increased by raising the perunit-area yield of crops. Moreover, China's forestry and grassland production wasbackward and there is a large scope for intensification. On the basis of above describedconditions the demand of mineral fertilizers has been re-evaluated.
Fertilizer requirement for grain crops
If the future population of China stabilizes at around 1.6 billion people, the total need forfood would be 0.64 billion tons of grain equivalents which means an increase of 0.14billion tons of food compared to the current production of 0.5 billion tons. According totrial results from the National Mineral Fertilizer Network, each ton of mineral fertilizercan increase the grain output by 8-10 tons which means that 14.00-17.50 million tons ofadditional mineral fertilizers would be needed to achieve above goal.
Fertilizer requirement for commercial crops
The actual cropped area in China is around 208 million ha, of which commercial cropsaccount for 27%, i.e. 56.16 million ha. The area under other crops besides vegetablesand sugar crops was kept constant. In 1997, the area under perennial commercial crop-ping was 10.89 million ha with no apparent adjustment besides fruit trees. But consid-ering the development of fruit trees, we suppose the acreage under perennial commercialcropping was 11.89 million ha. Together these two crops account for 68.05 million ha.Under the condition of keeping the area under commercial crops unchanged, we could
63

increase the per unit-area yield of crop by applying more mineral fertilizers. It is esti-mated that additional 6.80 million tons of mineral fertilizer would be needed in 2030 ifthe fertilizer applied increased by 100 kg h " .
Fertilizer requirements by forestry
According to the results of the third forestry survey (1989-1993), the forestry area, in-cluding fast-growing forest, commercial forest, bamboo and seedling nurseries was23.74 million ha.I) Fast-growing forest: The area under this type of forest was supposed to be 8.00 mil-lion ha. The production cycle of fast-growing forest is 15 to 20 years. Generally, fer-tilizers should be applied 3 to 4 times, including a basal dressing. According to therecommendation, 70 kg N ha-', 70 kg P20 5 ha-1 and 30 kg K20 ha' (Table 9) are neededfor each application. Calculated on a 20 years production cycle and 3 applications, theaverage fertilizer needed for each year would be around 0.20 million tons.2) Commercial forest: This type of forest, including bamboo and seedling nurserycovers together an area of about 15.74 million ha. According to the recommendation(Table 9) based on an application of 400 kg ha-', the fertilizer needed for each year is inthe region of 6.30 million tons. The fertilizer needed by forestry together is therefore6.50 million tons of nutrients.
Fertilizer requirement by grassland
According to the statistics of Stockbreeding and Veterinary Department of MOA in 1994,the reserved needed grassland area in China was 6.087 million ha. Assuming that fiftypercent of the grassland is fertilized, using the recommendation in Table II and Table 12(namely 200 kg ha' per application), the mineral fertilizer needed by grassland is about0.6 million nutrient tons.According to the above estimated results, the additional fertilizer needed together wouldbe 27.90-31.40 million tons, including 14.00-17.50 million tons for grain crop, 6.80million tons for commercial crops, 6.50 million tons for forestry and 0.60 million tonsfor grassland. In 2001, the application of fertilizer in China was 42.20 million tons.Together with the additional increase, the total amount of fertilizer needed is in the re-gion of 68.70-72.20 million nutrient tons, which means that the fertilizer requirementhas to increase by approximately 70% until 2030. The actual total cropping area inChina is approximately 208.00 million ha. Based on this area the fertilizer applicationwould be 330-347 kg ha-' (similar to that of the United Kingdom). The evaluation ispreliminary, its suitability in the reality of China needs further discussion and research.
Summary
1) In 2001, the total application of fertilizer in China was 42.25 million nutrient tons.Calculated on 133.33 million ha of farmland and 208.00 million ha of annually cropped
64

area in China, the application of mineral fertilizer was 316 kg ha1 and 203 kg ha -'.During recent years (1995 to 2000) the farmland received annually 2.55 million tons of
surplus N (in excess of the amount removed by the crops), 4.58-4.89 million tons of
surplus P20 5 and was under-supplied by 2.89-3.55 million tons of K20.2) During the recent 20 years, the fertilization pattern changed greatly. The proportion of
acreage under commercial crops increased from 22.0% in total in 1980 to 31.5% in 1997.
According to the survey, the fertilizers applied to commercial crops accounted for 40%
of the total application, which was discussed as the main reason for the observation that
crop yield did not increase at the same rate as the mineral fertilizer consumption during
the past 20 years.3) The total supply of mineral fertilizer in China is apparently insufficient. In order to
satisfy the future need for agricultural products to supply 1.6 billion people, the input of
mineral fertilizer has to be further increased. It is estimated that the upper limit of totalmineral fertilizer needed is around 70.00 million tons, including the nutrients applied to
forestry and grassland.4) The estimation for mineral fertilizer consumption by agriculture is mainly based on
the development of agriculture, forestry and stockbreeding, using the average input ofmineral fertilizer to achieve a certain yield target. So, the aspects of natural resource and
economy for reacting to this amount of mineral fertilizer was not considered. Further-more, the economic benefits of fertilizer application was also not discussed. In a market
economy, farmers' choice, how much fertilizer and what kind they want to apply towhich crop, depends on the returned profit from fertilizer application.
65


Chapter I1
Farmland nutrient balances andfertilizer requirement ofNorthern China
67


Circulation and regulation of potassium in the soil-plant system under majorcropping systems of Northern China
Jin Jiyun and Liu Rongle
PP/PPIC Beijing Office, SF1 of CAAS 100081
Abstract
Potassium supply of soils in China follows a clear zonal pattern. Compared with the soils inSouthern China, the potassium content and its availability in the soils of North China are re-garded as being higher. Referring to the distribution of major clay minerals and the results ofbio tests, the potassium supply potential of soils in China can be divided into 7 classes, fromvery low to very high, using the fraction of slow-release potassium. Meanwhile, a Sketch Mapfor Soil Potassium Supply Potential in China was drawn, showing an increasing trend fromNorth to South. This was used as the scientific basis for the reasonable distribution and use ofpotassium fertilizer in China.The National Chemical Fertilizer Network carried out more than 5000 experiments with N, Pand K on 18 crop species in the whole country and analyzed the concentration of numerous soilfertility parameters. The results show that potassium deficiency mainly occurred south of theChangliang River whereas in the three largest agricultural regions of the north, most of the soilshad a high to medium potential to supply potassium, except for some sandy soils and brownsoils in Jiaodong Peninsula and Liaodong Peninsula. Trial results showed also that there wereno yield-increasing effects of potassium applied to grain crops in Northern China during thisperiod.In the 1980's, a number of reports appeared, showing potassium deficiency and the yieldpromoting effect of potassium increased steadily. Then in the 1990's, with the increase in theuse of nitrogen and phosphorous and the consequently larger yields, response to K applicationin Northern China became more evident. This caused that the consumption of potassium alsoincreased steadily. Even in the northwest of China, where soils are generally known for theirinherent abundance in potassium reserves, farmers began to apply potassium to K-responsivecrops.To better understand these observations and to describe the interaction between crop production,nutrient uptake/removal and replacement, studies were undertaken on the potassium cycling inthe soil-plant system under major cropping systems in Northern China. Led and organized bythe Ministry of Agriculture in co-operation with PPI//PPIC and all the Soil and Fertilizer In-stitutes (SF1) of the Chinese Academy of Agricultural Sciences (CAAS), a so-called"Sino-Canada Potassium Agronomic Development" project was initiated which has nowcompleted its third phase (1993-1998). One of the main objectives of this project was to studythe K supply potential of various soils and the efficiency of K application. Since 1992, repre-sentative cropping systems on major soil types in the northern 13 provinces (or cities) of Chinawere selected and 25 fixed location trials were set up. Using these results, this paper focuses onthe cycle and balance characteristics as well as regulation mechanisms for the potassium supplyunder the major cropping systems in Northern China.
69

Materials and methods
Trial locations
Starting in 1993/1994, 25 field experiments were set up in 13 provinces, such as Shandong,Henan, Hebei, Tianjin, Liaoning, Jilin, Heilongiang, Shanxi, Shaanxi, Ningxia, Gansu,Qinghai and Xinjiang. Considering the local conditions of agricultural production, representa-tive cropping systems were chosen, such as winter wheat-maize, winter wheat-soybean, maize,rice, wheat-soybean, winter wheat-spring wheat, wheat-cotton and multiple-season vegetable.Most trial results were recorded except for some trials which had to be discontinued because ofchanging ownership of the fields (Table 1).
Table I. Description of sites selected for the long-term fixed location trials on potassium re-sponse in the northern part of China
Province Location Soil type Cropping system Period(City)
Shandong Daling of Linyi Brown soil Wheat- maize 1993-Sunlou of Linzi Drab soil Wheat- maize 1993-1997
Hebei Chenchun of Chao drab soil Wheat- maize 1993-Luancheng
Leitou of Xinji Drab soil Wheat- maize 1993-Henan Luoyang Chao drab soil Wheat- maize 1993-
Luohe Chao soil Wheat- maize 1993-Hexing of Shuiping Shajiang black soil Wheat- maize 1993-
Tianjin Zhangwo of Xiqing Chao soil Wheat- maize 1993-Shuigao of Xiqing Chao soil Wheat- maize 1993-1996
Heilong- Hongxinglong Farm Meadow soil Vegetable rotation 1993jiang
Shuangcheng Black soil Wheat to soybean 1993-Zhaodong Chemozem maize 1993-
Jilin Liufangzi of Black soil maize 1993-Gongzhuling
Taojia of Black soil maize 1993-Gongzhuling
Liaoning Farm of LAAS Meadow soil maize 1993-Shahe of Hancheng Paddy soil rice 1993-1997
Ningxia Daxin of Yinchuan Anthropogenic- Wheat with maize 1993-alluvial soil interplanting
Qinghai Mayingkala of Ledu Chestnut soil Wheat 1993-SFI of QAAS Chestnut soil Wheat 1993-
Shanxi Qiaoli of Linfen Drab soil Wheat 1993-Shannxi Yangling of Xian Lou soil Wheat-maize 1994-Gansu Farm of GAAS Anthropogenic- wheat 1994-1995
alluvial soilXinjiang Shangong of Changji Gray desert soil Wheat-maize 1994-1997
Saili of Zepu Anthropogenic- Wheat-maize to 1994-1997alluvial soil cotton
70

Fixed location trials were arranged on soils which were widespread and which had a repre-sentative fertility. The major soils used included the most common soil types in the northernpart of China.
Trial design
Considering the possibility of returning crop residues to the field, two programs were adoptedin the trials. The first program consisted of four treatments of NP, NPK, NPSt and NPKSt, de-signed in accordance with the cropping systems including wheat, where St means that wheatresidues were returned (Table 2). The second program consisted of three treatments includingNP, NPKI and NPK 2 (Table 3).
Table 2. Design and treatments of fixed location trials (first program)
TPlot N P20 K application in each treatmentTrialo n Crop (K 20, kg ha')
(m2) (kg ha-') (kg ha- ) NP NPK NPSt NPKSt
Luancheng and Soybean 50 180 150 0 150 0 150Xinji of Hebei Maize 180 ISO 0 150 0 150
Luoyang and Wheat 30 150 180 0 150 0 150Luohe of Henan Maize 225 150 0 150 0 150
Shuiping of Henan Soybean 60 180 0 150 0 150Wheat 150 180 0 150 0 150
Linyi of Shandong Wheat 13 150 112.5 0 150 0 150
Maize 150 112.5 0 150 0 150
Linzi of Shandong Wheat 33 112.5 112.5 0 56.25 0 56.25
Maize 112.5 112.5 0 56.25 0 56.25
Xiqing of Tianjin Wheat 45 225 150 0 150 0 150
Maize 225 150 0 150 0 150
Hongxinglong of Wheat 21 120 240 0 240 0 240
Heilongjiang Maize 300 240 0 240 0 240
Yinchuan of Wheat 34 406.5 104.7 0 150 0 150Ningxia Maize 406.5 104.7 0 150 0 150
Yangling of Wheat 12 187.5 187.5 0 150 0 150
Shannxi Maize 187.5 187.5 0 150 0 150
Linfen of Shanxi Wheat 33 172.5 105 0 150 0 150
Lanzhou of Gansu Wheat 27 150 75 0 112.5 0 112.5
Ledu of Qinghai Wheat 25 110 55.2 0 150 0 150
Xining of Wheat 25 147 73.5 0 150 0 150
Qinghai
71

Table 3. Design and treatments of fixed location trials (second program)
Trial location Crop Plot N P2 0 5 K application in each treat-(M
2) (kg ha') (k ment (K 20, kg ha - ')
ha") NP NPKI NPK 2Shuangcheng of Maize 30 375 240 0 187.5 375Heilongjiang
Zhaodong of Maize 30 375 240 0 187.5 375Heilongjiang
Gongzhuling of Maize 40 225 112.5 0 112.5 225Jilin
LAAS Maize 30 300 150 0 112.5 225
Sujia of Liaoning Rice 360 180 0 112.5 225
Sujia of Liaoning Maize 300 150 0 112.5 225
Changji of Wheat 30 0 112.5 225Xinjiang Maize 40 0 112.5 225
Zepu of Xinjiang Cotton 30 0 112.5 225Wheat 40 0 112.5 225Maize 40 0 112.5 225
Xiging Vegetable 22 300 225 0 112.5 225
All plots received abundant nitrogen, phosphorous and other nutrients in order to avoid otheryield limiting factors than potassium and crop residues. The plots' sizes varied between
13 m2 and 15 m and the treatments were randomly arranged with 4 replications. High-yieldingcrop varieties, popular in the local agricultural production, were planted.
Harvest and soil analysis
The crop in each plot was harvested separately and analyzed for yield parameters. At the same
time, grain and straw were collected and analyzed for potassium and water contents. After theharvest of each autumn crop grown in a two crop per season cropping system or after harvest of
the single crop grown in the one-crop per season cropping system, soil samples from 0-20 cm
and 20-40 cm depth were taken and analyzed for readily available and slow-release potassium.
Conventional methods were adopted for the extraction and analysis of soil potassium.
Results and discussion
Characteristics of potassium cycling in the soil-plant system under different cropping systems
The potassium in the soil-plant system could be divided into two pools, namely the soil potas-sium reserve and the crop potassium sink. A transfer of potassium occurred between the two
72

pools by crop uptake from the soil and return from crop roots and residues back to the soil. The
potassium removed from the system by straw was the typical exportation whereas the applica-
tion of potassium reflected the importation.
Characteristics of the crop as potassium sink
For the soil-plant system, the crop potassium sink could be divided into 3 parts. The first are the
residues in the soil after harvesting, which include the potassium in plant roots; the second is the
removal from the system by the harvested parts, which include the potassium in the grain and/or
the harvested plant parts meant for consumption. The third is the removal or residues depending
on the field management technologies, which includes the potassium in the straw, where it is
found as one of the major nutrient elements. The difference in soil potassium reserve, crop type
as well as variety affects the crop potassium sink and the proportion of each part. The results
show that there is a significant difference among crop potassium sinks under different cropping
systems in different regions. The average absorption of potassium by the crops in 5 years for the
three major agro-ecological regions is summarized in the Tables 4, 5 and 6.
Table 4. Comparison between potassium sinks of various wheat and maize cropping systems in
the north of China (kg K20 ha-1, average of 5 years)
Location Crop NP NPK NPKSt NPSt
Luancheng of Wheat 150.7 165.4 169.1 144.3
Hebei Maize 107.8 141.3 166.9 117.1Total 258.3 306.7 336.1 261.4
Xinji of Hebei Wheat 145.7 194.6 194.3 143.3Maize 66.5 137.9 146.7 91.5Total 212.2 332.4 340.9 234.8
Linyi of Wheat 111.4 174.5 205.5 145.8
Shandong Maize 77.5 134.3 148.7 87.7Total 188.9 308.8 354.2 233.5
Linzi of Wheat 98.7 154.6 182.4 133.1
Shandong Maize 74.6 119.7 135.0 87.1Total 154.6 244.3 283.6 198.4
Linfen of Shanxi Wheat 195.3 205.2 247.0 203.2
Zhangwo of Tian- Wheat 143.5 138.9 24.2 20.8
jin Maize 106.2 131.6 139.2 100.4
Total 243.4 262.5 154.4 113.9
Mean (locations) Wheat 142.1 179.9 200.4 154.8Maize 82.4 134.8 150.9 96.8
Total 224.4 314.7 351.3 251.6
73

In Northern China with the prevailing wheat-maize rotations (Table 4), the plots without K andno straw application showed an average potassium absorption of 142 kg K20 ha-' for wheat and82 kg ha-' for maize. On average, both crops together absorbed 209 kg K20 ha-'. There was asignificant difference in the K absorption between locations within the same cropping systemsand crops. In the wheat-maize cropping system in the north of China, the potassium absorptionby wheat in Hebei and Tianjin was 140-150 kg K20 ha-' and that in Shandong was 100-110 kgK20 ha -'. The 5 year average of potassium absorption by maize was 105 kg K2O ha-' inLuancheng of Hebei and Tianjin whereas in other regions it was 66-78 kg K20 ha'. Improvingthe K supply by mineral fertilizer application (NPK) increased K absorption by wheat andespecially maize at all locations. On average over all locations, K absorption by the crops in-creased by 38 kg K20 ha-' for wheat and 52 kg K20 ha-' for maize. Further increase in K uptakeby both crops was obtained in treatment NPKSt with additional 21 kg and 16 kg K20 ha-' forwheat and maize, respectively. With recycling of crop residues (NPSt), total K absorption ofboth of each individual crop was much reduced, indicating that best K absorption is obtained inthe combination of NPKSt, followed by NPK.In contrast to the two-crops per season cropping systems of the north, the potassium absorptionby the single-crop per season maize in the northeast of China was comparatively small (Table 5).The average of potassium absorption in the plots without K application over all locations was inthe region of 92 kg ha'. This amount dramatically increased with the application of K, showingthat the first rate (KI) had the strongest effects whereas after application of the 2nd rate (K2) Kresponse was much less significant. Differences in K absorption between locations were sig-nificant in the NP plots, reflecting mainly the differences in K availability. At the higher rate ofK application (NPK 2), only the location Liufangzhi considerably exceeded the K uptake, whichotherwise was in the region of 160 kg K20 ha -1. This could reflect the greater maize productionpotential due to better growth conditions (climate) at this"location.
Table 5. Comparison between potassium sinks of maize in the northeast of China (kg K20 ha-',average of 5 years)
Location NP NPKI NPK,
Shuangcheng of Heilongjiang 70.7 111.6 159.0Zhaodong of Heilongjiang 88.9 115.1 155.5Liufangzi of Jilin 101.3 149.1 195.5Taojiatun of Jilin 84.4 153.0 160.3Shuizhong of Liaoning 108.9 123.2 151.8Mean (locations) 91.7 150.5 164.4
In the northwest of China with the prevailing cropping system wheat-maize-(cotton), the annualpotassium absorption by the crops largely depended on whether cotton was included in therotation (Table 6). In comparison to the wheat-maize cropping system the cotton-wheat-maizerotation had a larger K absorption of 200-400 kg additional K2O. Greatest differences in Kabsorption between these to basic crop rotations occurred in the NPKSt treatment, where Kuptake was obviously not limited by the supply from the soil. On the other hand, smallest dif-ferences between the cropping systems occurred in the NP treatment, where K supply by thesoil was obviously limiting. It is interesting to note that the K sink for maize was larger than for
74

wheat when the rotation system included cotton whereas it was vice versa when the croppingsystem consisted of wheat-maize only. Dramatic effects of absorption by each crop and by the
whole cropping system were observed through mineral K application and the additional recy-
cling of wheat straw (NPKSt).
Table 6. Potassium sink of a wheat-maize-(cotton) rotation in the northwest of China (kg K20ha - l , average of 5 years)
Trial location Crop NP NPK NPKSt NPSt
Yinchuan, Ningxia Wheat 129.6 175.6 168.5 155.1Maize 188.1 253.3 258.4 232.0Total 317.7 428.9 426.8 387.1
Xining, Qinghai Wheat 199.7 268.0 233.7 241.8Maize 231.2 310.8 279.2 308.1Total 430.8 578.8 512.9 549.9
Changji, Xinjiang Wheat 167.9 199.6 219.5Maize 272.2 330.3 388.7Total 440.1 529.9 608.1
Zepu, Xinjiang Cotton 370.4 479.4 532.5Wheat 141.6 152.0 166.7Maize 119.7 129.7 158.4Total 631.7 761.0 857.6
Mean (locations) Cotton 370.4 479.4 532.5Wheat 169.7 206.5 206.6 198.4Maize 207.7 256.9 275.4 270.0
The potassium distribution within the plant among grain and straw at harvest showed that it was
affected by the crop species, trial location and fertilization practice. This was revealed by cal-culating the potassium absorbed by either grain or straw and expressing it as percentage of thetotal K uptake by the crop. The results show that the proportion of potassium allocated to the
grains was larger in maize and rice than in wheat (Table 7). There was also a significant dif-ference in the K distribution within the plant between the fertilizer treatments of the same crop
at the same location. The application of potassium decreased the percentage of potassium in the
harvested grain. For example, in Xinji of Hebei and Hongxinglong of Heilongjiang, the pro-
portion of K in the grain was 13.7% and 12.4%, respectively, without potassium application and
with returning of residues, respectively. K application alone and K application plus returning of
residues led to a decline in the proportion of K in the crop. A similar observation was made formaize. It can be concluded that the application of potassium increased the total potassium ab-
sorption by the plants and enlarged the crop potassium sink. However, it decreased the pro-portion of potassium in the grain as a potassium sink in the plants, showing that under low K
supply the plant gives priority to the K allocation to the generative parts (seeds, grains).
75
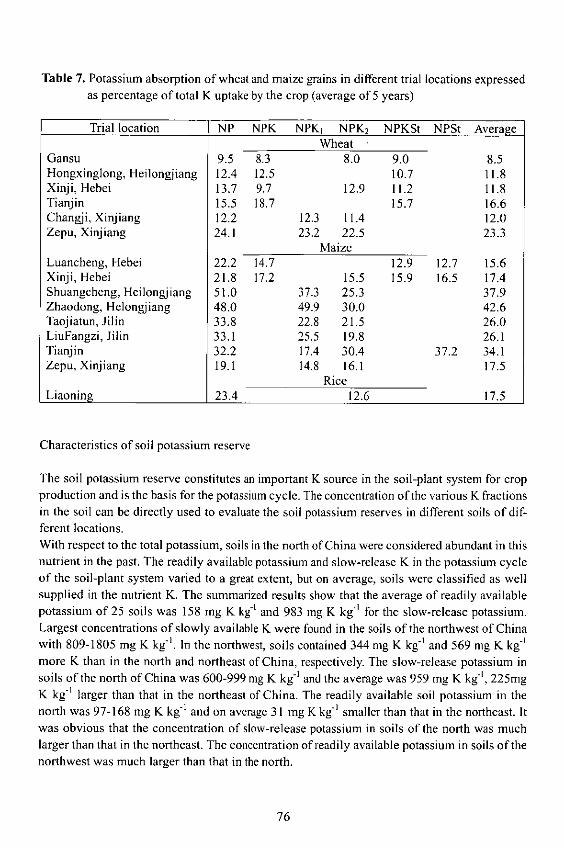
Table 7. Potassium absorption of wheat and maize grains in different trial locations expressedas percentage of total K uptake by the crop (average of 5 years)
Trial location NP NPK NPK NPK 2 NPKSt NPSt AverageWheat
Gansu 9.5 8.3 8.0 9.0 8.5Hongxinglong, Heilongjiang 12.4 12.5 10.7 11.8Xinji, Hebei 13.7 9.7 12.9 11.2 11.8Tianjin 15.5 18.7 15.7 16.6Changji, Xinjiang 12.2 12.3 11.4 12.0Zepu, Xinjiang 24.1 23.2 22.5 23.3
MaizeLuancheng, Hebei 22.2 14.7 12.9 12.7 15.6Xinji, Hebei 21.8 17.2 15.5 15.9 16.5 17.4Shuangcheng, Heilongjiang 51.0 37.3 25.3 37.9Zhaodong, Helongjiang 48.0 49.9 30.0 42.6Taojiatun, Jilin 33.8 22.8 21.5 26.0LiuFangzi, Jilin 33.1 25.5 19.8 26.1Tianjin 32.2 17.4 30.4 37.2 34.1Zepu, Xinjiang 19.1 14.8 16.1 17.5
RiceLiaoning 23.4 12.6 17.5
Characteristics of soil potassium reserve
The soil potassium reserve constitutes an important K source in the soil-plant system for cropproduction and is the basis for the potassium cycle. The concentration of the various K fractionsin the soil can be directly used to evaluate the soil potassium reserves in different soils of dif-ferent locations.With respect to the total potassium, soils in the north of China were considered abundant in thisnutrient in the past. The readily available potassium and slow-release K in the potassium cycleof the soil-plant system varied to a great extent, but on average, soils were classified as wellsupplied in the nutrient K. The summarized results show that the average of readily availablepotassium of 25 soils was 158 mg K kg-1 and 983 mg K kg-' for the slow-release potassium.Largest concentrations of slowly available K were found in the soils of the northwest of Chinawith 809-1805 mg K kg -'. In the northwest, soils contained 344 mg K kg -' and 569 mg K kg -'more K than in the north and northeast of China, respectively. The slow-release potassium insoils of the north of China was 600-999 mg K kg-' and the average was 959 mg K kg', 225mgK kg1 larger than that in the northeast of China. The readily available soil potassium in thenorth was 97-168 mg K kg-1 and on average 31 mg K kg- smaller than that in the northeast. Itwas obvious that the concentration of slow-release potassium in soils of the north was muchlarger than that in the northeast. The concentration of readily available potassium in soils of thenorthwest was much larger than that in the north.
76

Table 8. Concentration of various soil potassium fractions of 25 fixed location trials in the northof China
Total Slow-release Readily availablepotassium potassium potassium
(%) (mg kg-') (mg kg I)Northwest (5 provinces) 2.02 1303 174Northeast (3 provinces) 2.01 734 164North* 1.90 959 133Average for 13 provinces 1.97 983 158
* Not including the vegetable soil of Shuigao village, Xiqing district of Tianjin.
Soil samples of long-term fixed location trials were taken and analyzed for potassium after theharvest of the last crop each year. The results show that because of variable climatic conditions,soil sampling, analytical procedures to analyze readily available and slow-release K, themeasured soil K concentrations differed greatly among years. However, certain principlesamong the treatments in the same location could be observed. The results of soil analysis fromeach trial showed that the readily available potassium in soil increased in the treatments withpotassium application and where both mineral K was applied and crop residues returned to thefield. In the treatment without returning residues, the application of potassium also increasedthe soil K concentrations, however, to a lesser degree (Figure 1). On the other hand, the resultsof two fixed location trials in Shandong, however, showed that the concentration of readilyavailable K in the soil of NP and NPSt decreased by 5.2 mg kg-1 and 4.7 mg kg-' each year.
-0-NP -0,NPK -NPKSI -*- NPSI
ISr 140In Linzi. Shandong In .i, Sh..d.ng
Mir 125
S140
E .j110012 0
95l0
80 801992 1993 1994 1995 1996 1997 1992 1993 1994 1995 1996 1997
Figure 1. Change of available potassium in soils at different locations
In the Chaozongrang soil, which was classified as medium in K and characterized by sandytexture, the available K decreased by 0.5 mg kg -t per year which was slower than that of thebrown soil with higher fertility. Potassium application alone, returning residues and potassiumapplication plus returning residues increased the concentration of soil K to a different extent.With respect to readily available potassium a similar situation was found in the vegetable soilsof Tianjin.
77

The results of fixed location trials in Heilongjiang showed that readily available potassiumdecreased by 2.48 mg kg-' annually when potassium was applied continuously for 5 years. Theconcentration of potassium increased by 4.34 mg kg'" yearly in the K, and 11.32 mg kg-' in theK2 treatment (Figure 2). The application of potassium also reduced the decline in slow-releasepotassium, but the effect was not significant (results not shown). The slow-release potassiumdecreased continuously for 5 years by 47.8 mg kg' in the treatment without potassium appli-cation, by 44.6 mg kg-' in the K, and by 31.4 mg kg-' in the K2 treatment. Two fixed locationtrials in Jilin showed similar trends.
260
230
v 200
170
140
110-
1992 1993 1994 1995 1996 1997 1998
Figure 2. Change of available potassium in soils of Heilongjiang (0-20cm depth of soil)
Potassium balance in the soil-plant system in different cropping systems
The nutrient balance of the soil-plant system was calculated as K surplus or deficit in thevarious cropping systems by using four parameters, including K removal by grain (harvestedproduct) and removed crop residues (straw) as output, K fertilizer application and returnedresidues as input. The results show that without potassium application and returning of residuesa yearly loss of 134-258 mg K20 kg-' was observed in the north. In all treatments without Kapplication (NP, NPSt), the balances were negative in all locations, reaching from -63 kg K20ha -' yr-' in NPSt at Linfen (wheat only) to -258 kg K20 ha' yr' in Luancheng (Table 9). At alllocations, with the exception of Lynyi, the balance remained negative after K was applied (NPK)to a variable extent. They were only slightly negative at Xinji and Luancheng but considerablynegative at Linzi and Linfen. This indicates that K application rates were not sufficient tobalance the removal of K. On the other hand, all treatments receiving NPK plus wheat straw(NPKSt) revealed a positive K balance, with the exception of Linzi, where even both NPK andstraw did not compensate for the K losses by removal.
78
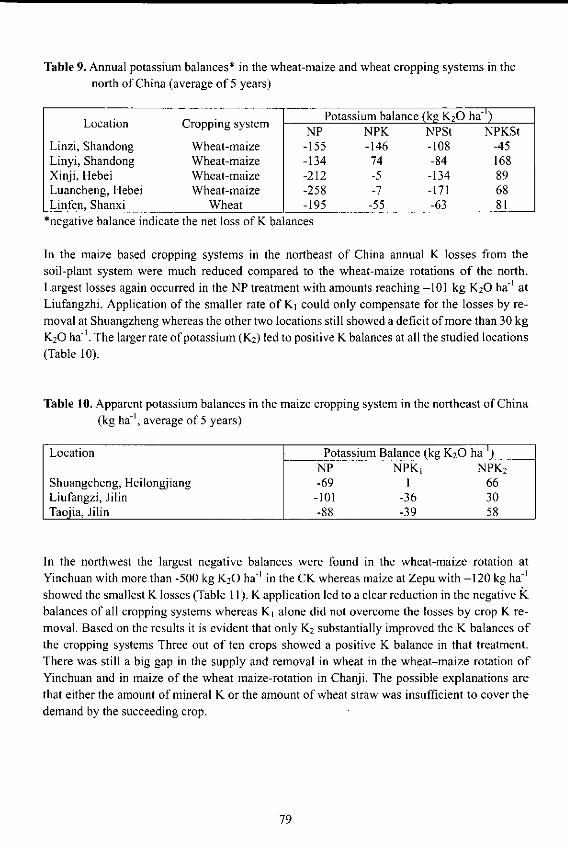
Table 9. Annual potassium balances* in the wheat-maize and wheat cropping systems in thenorth of China (average of 5 years)
Potassium balance (kg K20 ha - ')Location Cropping system NP NPK NPSt NPKSt
Linzi, Shandong Wheat-maize -155 -146 -108 -45Linyi, Shandong Wheat-maize -134 74 -84 168Xinji, Hebei Wheat-maize -212 -5 -134 89Luancheng, Hebei Wheat-maize -258 -7 -171 68Linfen, Shanxi Wheat -195 -55 -63 81
*negative balance indicate the net loss of K balances
In the maize based cropping systems in the northeast of China annual K losses from thesoil-plant system were much reduced compared to the wheat-maize rotations of the north.Largest losses again occurred in the NP treatment with amounts reaching -101 kg K20 ha- atLiufangzhi. Application of the smaller rate of K, could only compensate for the losses by re-moval at Shuangzheng whereas the other two locations still showed a deficit of more than 30 kgK20 ha-'. The larger rate of potassium (K2) led to positive K balances at all the studied locations(Table 10).
Table 10. Apparent potassium balances in the maize cropping system in the northeast of China(kg ha -', average of 5 years)
Location Potassium Balance (kg K20 ha -')NP NPKI NPK2
Shuangcheng, Heilongjiang -69 1 66Liufangzi, Jilin -101 -36 30Taojia, Jilin -88 -39 58
In the northwest the largest negative balances were found in the wheat-maize rotation atYinchuan with more than -500 kg K 20 ha-' in the CK whereas maize at Zepu with -120 kg ha -'showed the smallest K losses (Table 11). K application led to a clear reduction in the negative Kbalances of all cropping systems whereas K, alone did not overcome the losses by crop K re-moval. Based on the results it is evident that only K2 substantially improved the K balances ofthe cropping systems Three out of ten crops showed a positive K balance in that treatment.There was still a big gap in the supply and removal in wheat in the wheat-maize rotation ofYinchuan and in maize of the wheat maize-rotation in Chanji. The possible explanations arethat either the amount of mineral K or the amount of wheat straw was insufficient to cover thedemand by the succeeding crop.
79

Table 11. Apparent annual potassium balances in various cropping systems in the northwest ofChina (kg ha-')
Potassium Balance (kg K2 0 ha -
Location Year Crop CK* K, K2 or St KSt
Changji, Xinjiang 1994 Wheat -168 -106 -331995 Maize -272 -237 -202
Zepu, Xinjiang 1994 Wheat -142 -59 20Maize -120 -36 28Total -261 -95 48
1995 Cotton -370 -386 -346
Yinchuan, Ningxia 1994 Wheat -516 -509 -293 -146Maize -346 -349 -I1 78
Shaanxi 1997 Wheat -152 -5 -42 88Maize -98 -42 -105 -74
* CK = Control with NP only
Yield-increasing effect of returning residues and potassium application
The results indicate that under the wheat-maize cropping system in the north, the potassium
application, the returning of residues and the potassium application together with returning
residues could significantly increase the yields of wheat and maize. The observed
yield-increasing effects of these three management practices were greater in maize than in
wheat. However, for each crop, response to potassium was greatest if K was applied together
with recycled crop residues of particularly wheat. Wheat yield increased by 12.5% whereas that
of maize by 19.1% on average. The effect of returning residues alone was poorest, with a yield
increase in wheat of only 4.9% for wheat and 8.6% for maize. The effect of potassium appli-
cation alone had a medium effect, increasing wheat and maize yields by 8.5% and 12.4% on
average (Figure 3).
25
20 19.1
15 --- NPS
El NPK-~10 0 6M3NPKSt
12.5 A
12.4I
5 49
0Wheat Maize
Figure 3. Average yield increase (%) caused by K application in Northern China
80

Yield increases differed between trial locations in different provinces of Northern China. Wheatyields on average over 5 years increased by more than 10% with potassium in Shuiping ofHenan. In the treatment of returning residues together with potassium application (NPKSt), theyield increase of Shuiping, Linzi of Shangdong and Linfen of Shanxi was more than 10% eachyear. In Luancheng of Hebei and Luoyang of Henan in one out of 5 years yield increased bymore than 10%. The probability of maize yield increase in Luoyang and Luohe of Henan waslowest.In the one-season maize cropping system in Northeastern China, the potassium applicationincreased yields significantly. Compared with the treatments without potassium application,larger rates also contributed to larger crop yields. However, in general, differences betweenyields of high and low potassium application at each trial location were small. On average, thesmaller K application rates increased crop yield by 10.6% whereas only by 11.1% at the largerrate (K2). Potassium applied to rice increased yields significantly by more than 10%.In the wheat-soybean cropping system of the north and wheat-soybean cropping system in thenortheast, K application, NPSt and NPKSt increased yields of wheat and soybean. Soybeanyields benefited more from K application than those of wheat in this cropping system. In theHenan province, the yield-increasing effect of both potassium application plus returning ofresidues on a Shajiang black soil was better than that on the meadow soil in Helongjiang. Thelatter was also better than the average effect on wheat and maize in the north of China.Compared with the significant yield effects in the north and northeast, there were also yieldresponses to K and to returning wheat straw in the various provinces of the northwest of China.In Shaanxi, the yield of wheat which received potassium without crop residues increased in 3out of 5 years at a range of below 10%. The yield of plants which received potassium andresidues (NPKSt) increased in all 4 years, and in 3 out of 4 years the yield increments observedexceeded 10%. The yield of maize receiving potassium increased by more than 5% only in oneyear whereas it increased by 10% in two years when both potassium and residues were applied.In Ningxia, both potassium application alone and potassium application together with residuescaused a significant yield increase each year. Wheat applied with potassium or potassium plusresidues showed yield increases of more than 5% in 3 out of 4 years and of more than 10% inonly one year. A similar observation as for wheat was made for maize in Ningxia. Potassiumapplication and returning of residues increased yield at many locations but within a narrowrange. In 4 years, the fixed location trial of Qinghai showed a yield effect during droughtwhereas in the first year, when the wheat was irrigated, no yield response to K was observed. InZepu of Xinjiang, potassium application to wheat increased the yields by more than 2-5% butmore than 15% in wheat ofChangji of Xinjiang. In this region, potassium application to maizeincreased yields by more than 8% and more than 10% with a larger rate of potassium applica-tion. Small application rates increased yields of cotton in Xinjiang by more than 8.8% whereasthe larger K rates produced 16.2% more lint.The calculation of the agronomic efficiency (1 kg grain per kg K20) shows that in the wheat-maize rotations of the north, each kg K20 produced only 3.2 kg additional wheat grain (5.7%yield increase) on average. A slight additional wheat yield increase to 3.9 kg per kg K20 wasfound when wheat straw was returned to the field. In maize, each kg K20 produced 5.5 kg ofgrain on average. In maize of the northeast, each kg of K20 produced additional 5.5 kg of grainat K, and 3.2 kg at the rate of K2. Compared with that, the scope of increasing yield in the
81

northwest with 0.4-0.8 kg kg' K20 for wheat and 0.6-1.7 kg kg-' K20 for maize was muchsmaller than in the Northwest. In different trials of the same region, there was a big difference inthe agronomic efficiency of potassium application.
Conclusion
In the winter wheat-maize, winter wheat-soybean, maize, rice, wheat-soybean, winterwheat-spring wheat and wheat-cotton cropping systems of Northern China, the potassiumbalance and the potassium cycle in the soil-plant system of fixed location trials over a period of5 years showed:1) There were distinct differences in the potassium absorption by plants between locations andbetween plants at the same location. The yearly potassium absorption by plants under differentcropping systems was significantly different. There was a difference in crop potassium sink(potassium absorption) under different cropping systems in different locations. Without potas-sium, the yearly potassium absorption of a maize-wheat rotation in the north was greater thanthat of a one crop per season maize in the northeast. The potassium absorption increased sig-nificantly with potassium application and the practice of returning residues in a wheat rotation.The potassium distribution between grain and straw was affected by crop, trial location andfertilizer application.2) Without potassium, the soil-plant system showed a K-deficit. The return of residues afterharvest decreased significantly the apparent loss of potassium from the soil-plant system. In thewheat-maize cropping system, returning of wheat residues returned one third to one half ofpotassium absorbed by the crop. However, this amount was not sufficient to keep the balancebetween input and output. The apparent yearly loss of potassium in the wheat-maize croppingsystems of the north was much greater than that of a one crop per season maize in the northeastof China.3) In the wheat-maize rotation of the north of China, the potassium application, returning ofresidues and application of potassium together with residues significantly increased crop yield.Maize yields responded to these 3 treatments to a larger extent than wheat. Regarding the samecrop, the application of potassium together with the return of residues was better. In thenortheast of China with a one crop per season maize, the potassium application increased yieldssignificantly. In the northwest, yield response to potassium alone and potassium with return ofresidues on wheat and maize was found to be within a narrow range. The probability of Kpromoting yields of cereals was limited with respect to certain locations and years.
82

Nutrient cycle and farmland nutrient balances of theHeilongjiang Province
Wu Ying, Wang Ying and Sun Bin
Soil and Fertilizers Institute, Heilongiang Academy of Agricultural Science,Harbin, 150086
Abstract
In this paper, the input and output of N, P and K and their balance in the farmland eco-system in the Heilongjiang Province during the period from 1977 to 1999 are dis-cussed. Based on the analysis of the changes, taking place in the soil nutrient cycle andbalance, fertilization measures are recommended for maintaining N, reducing P andsupplementing K in the cropping systems of the Heilongjiang Province.The nutrient cycle and balance is an important indicator of the potential farmland pro-ductivity. Therefore, a good understanding of the observed changes is of great signifi-cance in order to regulate the farmland nutrient cycle and balance as well as in estab-lishing an ecosystem with a sustainable and large yield. potential. The HeilongjiangProvince with its favorable natural conditions and fertile soils, contributes greatly tothe overall grain production of China. However, the production still has to overcome anumber of limitations. For instance, the ever-deteriorating soil quality of the farmlandand serious nutrient imbalances have started to affect ecological functions of the soil.The research was carried out by combining stationary investigations of cropping sys-tems and soils of typical farmland around cities, towns and villages with an analysis ofdata from a survey and the provincial statistics.
Research method
Calculation of nutrient input into farmland
The calculation of nutrients in inorganic fertilizers was conducted on the basis of therate of nutrient elements contained in the fertilizers applied.Organic manure, including human and animal waste (night soil, pig dung, cow dung,sheep and poultry droppings), harvest residues (rice straw, wheat straw and cornstalks) and plant ash (only ash of burned rice, wheat, corn and bean plants) were ana-lyzed for their nutrient content as well as seeds (including seedlings), irrigation wa-ter and precipitation.For estimating the amount of symbiotically fixed N of soybean as main legume inHeilongjiang was calculated on the basis of 7 kg N mu-1 (105 kg N ha-').
83

Calculation of nutrient output from farmland
The nutrients taken up by crops were calculated on a basis of nutrient concentration inthe biomass multiplied by the weight of the biomass.The loss of nutrients from the soil, e.g. N by denitrification, volatilization, P throughfixation and K through leaching and runoff and from organic manure through compost-ing, was estimated.
Results and discussion
Nutrient input into farmland
In the past 20 years, the nutrient input into the farmland in the Heilongjiang Provincehas shown three main characteristics. The first is the ever-increasing application rate ofinorganic N, P and K. N increased by 53.5% in the years from 1977 to 1987 and by100% from 1977 to 1997; P (P20,) by 42.8% and 92.8%, respectively, and K (K20) by100% and 200%, respectively (Table 1). The input of large volumes of inorganic fertil-izers has increased the material flow within the soil-plant system and plays also a keyrole in promoting material cycling within the whole ecosystem, maintaining soil fertil-ity, and improving farmland productivity. The average grain yield in the HeilongjiangProvince was 1,699.8 kg ha" in 1977 and has been raised up to 1961.4 kg ha-1 in 1987and further to 2,638.9 kg ha- ' in 1997 (Table 2).
Table I. Average application of mineral nutrients in the Heilongjiang Province dur-ing the past 20 years
Year N P20 5 K20Year-------------------- kg ha ------------------ :P2 :K 2 0
1977 22.5 21.0 1.5 1:0.93:0.061987 34.5 30.0 3.0 1:0.86:0.081997 45.0 40.5 4.5 1:0.90:0.102001 52.3 28.4 11.8 1:0.54:0.23
Table 2. Grain yield in the past 20 years in the Heilongjiang Province
Year Acreage of farmland Total output of Average yield(1000 ha) grains (kg ha-')
(Mt)
1977 8692 14.775 1699.81987 8859 17.376 1961.41997 11545 30.466 2638-9
84
The second characteristic is the serious imbalance of the NPK ratio of the suppliednutrients. The ratio was 1:0.93:0.06 in 1977, 1:0.86:0.08 in 1987 and 1:0.9:0.1 in 1997,though the input of inorganic fertilizers in 1997 was 4 times as much as that in 1977.The input of K is obviously inadequate. The Heilongjiang Province is an importantgrain producing region in China, where the practice of balanced fertilization is the keyfor achieving continuous high yields. K deficiency weakens the soil's self-regulating
function, thus limits the farmland productivity. In the 1960's and 1970's, the N:P ratioof the supplied nutrients was 1:0.2-0.3. The correct ratio at the time should have been
1:0.4-0.5, showing that P deficiency was apparent in crop production. In the 1980's,the import of large quantities of diammonium orthphosphate and triple super phos-phate rapidly raised the proportion of P, reducing the seriousness of P deficiency. Be-
cause of the strong ability of the soil to fix P and the steady expansion of the cultivated
area of NK demanding crops and other cash crops, a surplus of P and a shortage in Kdeveloped in the soil in the late 1980's and early 1990's. The proper N:P:K ratio at that
time was supposed to be 1:0.5:0.3 whereas the actual ratio in the nutrient input was1:0.6-0.8:0.1.The last characteristic is the downward trend of the organic manure input into the
farmland ecosystem. Although the number of livestock in the year 1997 was muchlarger than that in 1977 and 1987, the farmers were reluctant to spend more efforts inusing organic manure. They lacked faith in the policy of dividing land among farmers.
In a few regions, only a small amount of farmyard manure was applied to the fields.Thus, the fertility of several major soil types in the province has decreased year by
year. In some places the soil OM was reduced to only 1.2% - 1.5%. Investigations re-vealed that in recent years, of the major crops (maize, rice, soybean and wheat) grownin the province, all harvest residues (stalks, stems and straw of the crops, except stubs)
were removed from the fields and almost never returned. About 90% of the maizestalks were used as fuel and 10% as silage; 70% of the rice straw was used as fuel,20% as raw material for straw plaiting and 10% for livestock bedding; 60% of the soy-
bean stems were used as fuel and 40% as fodder; and 95% of the wheat straw was usedas fuel and 5% for bedding livestock or other purposes. Consequently, restoring soil
fertility by increasing the input of organic manure has been classified as an importantissue on the agenda for agricultural development in the province. The aim is to im-prove the yield and quality and therefore, the economic profit.
Nutrient output from farmland
The nutrient output from the farmland includes the nutrients taken up by the crops andnutrient losses from the soil. In the past 20 years, the nutrient output from the farmland
ecosystem has been increasingly significant. The output of N, P and K increased by248%, 163% and 157%, respectively, in the years from 1977-1979 to 1985-1989 and
by 473%, 228% and 257% from 1977-1979 to 1995-1997 (Table 3).
85
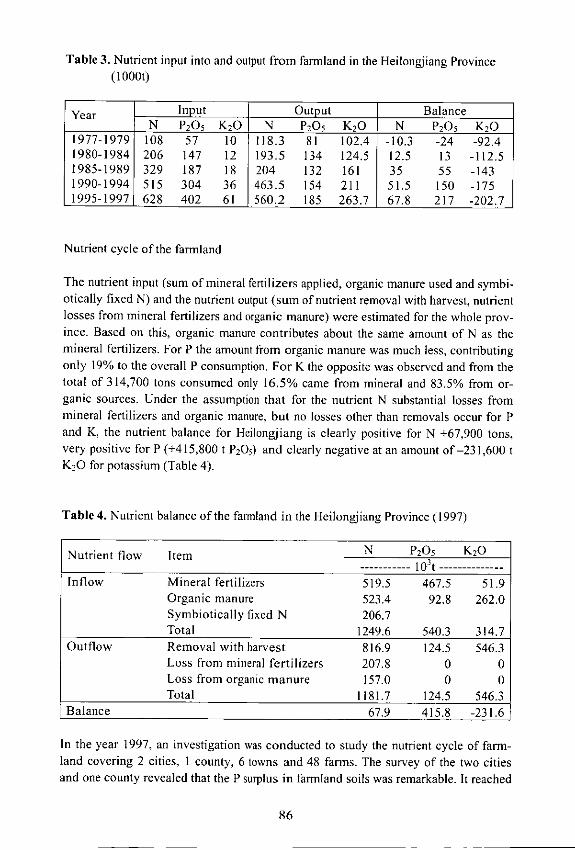
Table 3. Nutrient input into and output from farmland in the Heilongjiang Province(1000t)
Year In ut Output BalanceN P20 5 K20 N P20 5 K20 N P20 5 K20
1977-1979 108 57 10 118.3 81 102.4 -10.3 -24 -92.41980-1984 206 147 12 193.5 134 124.5 12.5 13 -112.51985-1989 329 187 18 204 132 161 35 55 -1431990-1994 515 304 36 463.5 154 211 51.5 150 -1751995-1997 628 402 61 560.2 185 263.7 67.8 217 -202.7
Nutrient cycle of the farmland
The nutrient input (sum of mineral fertilizers applied, organic manure used and symbi-otically fixed N) and the nutrient output (sum of nutrient removal with harvest, nutrientlosses from mineral fertilizers and organic manure) were estimated for the whole prov-ince. Based on this, organic manure contributes about the same amount of N as themineral fertilizers. For P the amount from organic manure was much less, contributingonly 19% to the overall P consumption. For K the opposite was observed and from thetotal of 314,700 tons consumed only 16.5% came from mineral and 83.5% from or-ganic sources. Under the assumption that for the nutrient N substantial losses frommineral fertilizers and organic manure, but no losses other than removals occur for Pand K, the nutrient balance for Heilongjiang is clearly positive for N +67,900 tons,very positive for P (+415,800 t P 2 0 5) and clearly negative at an amount of -231,600 tK20 for potassium (Table 4).
Table 4. Nutrient balance of the farmland in the Heilongjiang Province (1997)
Nutrient flow Item N P20 5 K20t10t--------
Inflow Mineral fertilizers 519.5 467.5 51.9Organic manure 523.4 92.8 262.0Symbiotically fixed N 206.7Total 1249.6 540.3 314.7
Outflow Removal with harvest 816.9 124.5 546.3Loss from mineral fertilizers 207.8 0 0Loss from organic manure 157.0 0 0Total 1181.7 124.5 546.3
Balance 67.9 415.8 -231.6
In the year 1997, an investigation was conducted to study the nutrient cycle of farm-land covering 2 cities, I county, 6 towns and 48 farms. The survey of the two citiesand one county revealed that the P surplus in farmland soils was remarkable. It reached
86
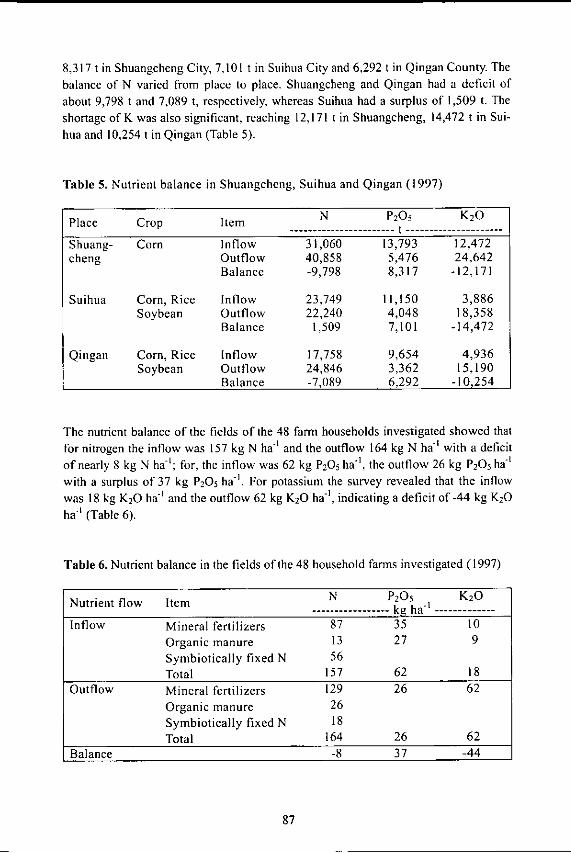
8,317 tin Shuangcheng City, 7,101 tin Suihua City and 6,292 tin Qingan County. The
balance of N varied from place to place. Shuangcheng and Qingan had a deficit ofabout 9,798 t and 7,089 t, respectively, whereas Suihua had a surplus of 1,509 t. The
shortage of K was also significant, reaching 12,171 t in Shuangcheng, 14,472 t in Sui-hua and 10,254 t in Qingan (Table 5).
Table 5. Nutrient balance in Shuangcheng, Suihua and Qingan (1997)
Place Crop Item N P205 K 20----------------------- t -------------------
Shuang- Corn Inflow 31,060 13,793 12,472cheng Outflow 40,858 5,476 24,642
Balance -9,798 8,317 -12,171
Suihua Corn, Rice Inflow 23,749 11,150 3,886Soybean Outflow 22,240 4,048 18,358
Balance 1,509 7,101 -14,472
Qingan Corn, Rice Inflow 17,758 9,654 4,936Soybean Outflow 24,846 3,362 15,190
Balance -7,089 6,292 -10,254
The nutrient balance of the fields of the 48 farm households investigated showed that
for nitrogen the inflow was 157 kg N ha' and the outflow 164 kg N ha -1 with a deficitof nearly 8 kg N ha-1; for, the inflow was 62 kg P20 5 ha' " , the outflow 26 kg P205 ha'
with a surplus of 37 kg P20 5 ha- '. For potassium the survey revealed that the inflowwas 18 kg K20 ha- and the outflow 62 kg K20 ha-', indicating a deficit of-44 kg K20
ha' (Table 6).
Table 6. Nutrient balance in the fields of the 48 household farms investigated (1997)
N P205 K 2O
Nutrient flow Item kN P20 - K2Nutiet lo Itm----- ----------------- k h-----'---------
Inflow Mineral fertilizers 87 35 10
Organic manure 13 27 9Symbiotically fixed N 56Total 157 62 18
Outflow Mineral fertilizers 129 26 62
Organic manure 26
Symbiotically fixed N 18
Total 164 26 62
Balance -8 37 -44
87
Conclusions
I) The farmland in the Heilongjiang Province is very fertile, having a highproduction potential. However, in recent years, dramatic nutrient imbalancesoccurred with a clear surplus of P, N inputs, being almost in balance with theoutputs whereas K outputs significantly exceed the inputs, creating a negative Kbalance. To fully utilize the natural production potentials of the soils as afoundation for high yield and good quality at reasonable cost, more attention hasto be paid to balance the nutrient budgets of the farmland.
2) During the 20 years from 1977 to 1997, the input of large quantities of inorganicN and P nutrients improved soil fertility and promoted the crop yields. With in-creased biomass production the material flow and the biological circulation of nu-trients in the farmland ecosystem of the province were stimulated. However, withincreasing surplus application of P fertilizers in recent years, there was a continu-ous P accumulation in the soil. Consequently, measures need to be implemented todevelop the agriculture in the province towards high yield and good quality andgreater economic benefit. These include to use fully the potential of P accumulatedin the soil and to increase the application rate of K.
3) Returning harvest residues to the field is another effective measure to improve soilfertility and to supply crops with nutrients. The soil fertility of the farmland in theHeilongjiang Province has been on the decline for years and consequently, one-third of the cultivated land has turned into medium- and low-yielding areas. Greatefforts should be made to encourage the return of crop residues to the field, to re-duce the waste of straw and to make full use of this resource. The effective use ofbarnyard manure should also be supported as well as the incorporation of organicmanagement principles to improve soil fertility.
88

Analysis of the soil nutrient status of farmland and prediction of themineral fertilizer demand in the Jilin Province
Huang Jian, Zhang Jiangtan and Liu Zhiwen
Jilin Province Soil and Fertilizers Head Station, 130012
Abstract
Based on the analysis of the farmland soil nutrient status and its evolution during thepast decades, the soil nutrient supply and crop response to fertilization was studied. Thispaper suggests that priority should be given to an increase in K application rates and to apartial reduction of the P application rates. Calculated nutrient balances were used todetermine the total demand for mineral fertilizers and to predict appropriate NPK ratiosfor the Jilin Province in the period from 2000 to 2010. The paper is providing a soundbasis for an ecologically sound and sustainable utilization of the farmland.Soil nutrient status has been assessed and evaluated as indicator soil fertility needed tosupport high and stable grain yields. Paying attention to farmland soil nutrient status andunderstanding its evolution will not only play a guiding role in current agriculturalproduction, but also lay down a solid basis for developing sustainable agriculture.
Introduction
Lying in the hinterland of the Song-Liao Plain, the Jilin Province with a vast territory offertile soil has long been enjoying the fame of "Black soil in Northeastern China anddark gold of the treasure land" which means that soils were regarded as very rich innutrients. This was confirmed by two soil surveys conducted in 1958 and 1979. Theprovince has a total of 5,351,000 ha of cultivated land comprising about 19 soil types,such as black earth, Chemozem, Baijiang soil, dark brown forest soil, meadow soil,paddy soil, young alluvial/colluvial soils, alkali-saline soil, aeolian sandy soil, etc.During the past 20 years, there was a distinct rise in the crop production and yields perunit area, especially after the reform in farming systems, intensifying the crop rotationsand reducing the fallow periods. Furthermore, changes in mineral fertilizer use (both inrate and nutrient composition), the aggravation of soil erosion and some other factorshave caused great changes in the farmland soil nutrient status. Based on several years ofsoil monitoring, including analysis of the farmland soil nutrient status, demonstrationexperiments, testing crop response to mineral fertilizers, this paper tries to predict withmore precision the demand for and the structural changes in mineral fertilizer use. Theinterpretation of these data is aiming at providing a theoretical basis for developingbeneficial agriculture and ecology-orientated, sustainable utilization of the farmland.
89

The nutrient status of farmland soil in the Jilin Province
The Jilin Province can roughly be divided into three parts. The eastern part is amountainous and semi-mountainous region whereas the central part forms a hill plateauand the western part can be described as a plain. Differences between regions withregard to climate, landform, vegetation and some other soil forming factors like land use,multiple cropping indexes, cultivation history and management caused that the soilnutrient status of farmland today is distinctly regional.
Distribution of soil N content
The second soil survey of the province (1979) revealed that the total N content of the soildecreased from east to west. The average content of available N was 199 mg kg"' in theeastern region, 104 mg kg' in the central and 97 mg kg- in the west (Table 1).According to soil types, N contents were larger in the mountainous soils and smaller inthe meadow soils. Among the six soil types, i.e. dark brown forest soil, paddy soil,Baijiang soil, meadow soil, black earth, and chemozem, largest N contents wererecorded in dark brown earth with an average of 207 mg kg-1 and the smallest inchernozem, averaging 98 mg kg " . The.order of N availability in the six soil types wasdark brown forest soil > paddy soil > Baijiang soil > meadow soil > black earth >chemozem.
Table 1. Soil N content in the plow layer of farmland in the 3 natural regions of the JilinProvince
Natural region Total N (%) Alcalytic N* (mg kg')Range Mean Range Mean
Eastern region 0.070-1.482 2.22 61-1014 199.0Central region 0.020-0.361 1.17 14-268 104.4Western region 0.021-0.395 1.08 10-238 97.0
* 1.0 M NaOH incubation at 40 'C for 24 h, reflecting the available N pool
Distribution of soil P content
Similar to nitrogen, the distribution of soil P content also showed a general trend ofgradual decline from cast to west. The average content of readily available P in theplough layer was 10.3 mg kg" in the eastern region, 5.2 mg kg-' in the central and 3.7mg kg-' in the west (Table 2). With regard to soil types, the largest P content was foundin dark brown earth with an average of I 1.4 mg kg -' and the smallest in the acolian soilwith an average of 2.6 mg kg-j.P availability in the soils followed the order dark brownforest soil > Baijiang soil > recent soil > meadow soil > black earth >paddy soil >chernozem > aeolian sandy soil.
90

Table 2. Soil P content in the plow layer of farmland in the 3 natural regions of the JilinProvince
Total P (%) Readily avail. P (mg kg")Natural region Range Mean Range MeanEastern region 0.009-1.18 0.56 0.9-36.6 10.3Central region 0.07-0.137 0.38 0.1-22.8 5.2Western region 0.014-0.11 0.29 0.2-69.3 3.7
Distribution of soil K content
Under the influence of their parent materials (mainly weathered feldspar and mica-typerocks in the eastern, loess-like sediments in the central and loess-like loamy sands in thewestern region), the soils of the province contain rather large amounts of total K. Theaverage readily available K content was above 100 mg kg-'. Within the province there isa decreasing trend in the K contents in the order: western region > eastern region >central region (Table 3). With regard to soil types the following order was observed:solonchak > solonetz > dark brown forest soil > black earth > chemozem > recent soil >Baijiang soil > paddy soil > meadow soil > acolian sandy soil. The largest amounts ofreadily available K were found in alkali-saline soils, averaging 150 mg kg-' and thesmallest in the aeolian sandy soil, averaging 83 mg kg"I.
Evolution of the soil nutrient status under farmland in the Jilin Province
In 1987, a long-term program of monitoring farmland soil fertility at fixed sites wasstarted. Across 8 soil types (black earth, paddy soil, recent soil, Baijiang soil, chernozem,alkali-saline soil, meadow soil and peat soil) 40 monitoring posts were laid out, covering1,705,300 ha, about 32% of the total acreage of cultivated land of the province.
Table 3. Soil K content in the plow layer of farmland in the 3 natural regions of the JilinProvince
Natural region Readily available K (mg kg" )
Range Mean
Eastern region 28.1-239.6 116.8Central region 25.7-324.6 103.3Western region 33.2-412.5 129.4
The soil monitoring data of 1987 were taken as a basis and data collected from 1988 to1995 were divided into two portions, one encompassing the data from 1988 to 1990 andthe other batch from 1991 to 1995 for a comprehensive analysis on a period-by-periodbasis (Table 4).
91
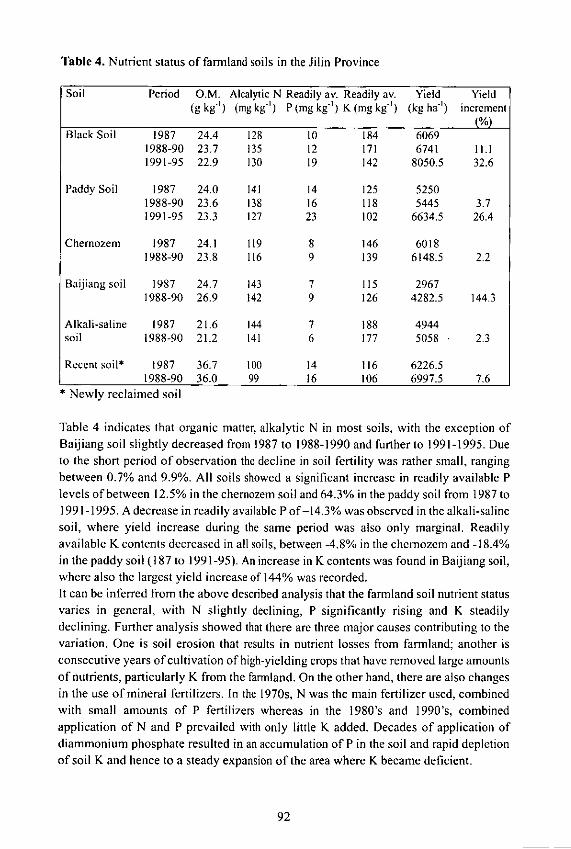
Table 4. Nutrient status of farmland soils in the Jilin Province
Soil Period O.M. Alcalytic N Readily av. Readily av. Yield Yield(g kg") (mg kg-') P (mg kg-) K (mg kg") (kg ha") increment
Io/)Black Soil 1987 24.4 128 10 184 6069
1988-90 23.7 135 12 171 6741 11.11991-95 22.9 130 19 142 8050.5 32.6
Paddy Soil 1987 24.0 141 14 125 52501988-90 23.6 138 16 118 5445 3.71991-95 23.3 127 23 102 6634.5 26.4
Chernozem 1987 24.1 119 8 146 60181988-90 23.8 116 9 139 6148.5 2.2
Baijiang soil 1987 24.7 143 7 115 29671988-90 26.9 142 9 126 4282.5 144.3
Alkali-saline 1987 21.6 144 7 188 4944soil 1988-90 21.2 141 6 177 5058 2.3
Recent soil- 1987 36.7 100 14 116 6226.51988-90 36.0 99 16 106 6997.5 7.6
Newly reclaimed soil
Table 4 indicates that organic matter, alkalytic N in most soils, with the exception ofBaijiang soil slightly decreased from 1987 to 1988-1990 and further to 1991-1995. Dueto the short period of observation the decline in soil fertility was rather small, rangingbetween 0.7% and 9.9%. All soils showed a significant increase in readily available Plevels of between 12.5% in the chernozem soil and 64.3% in the paddy soil from 1987 to1991-1995. A decrease in readily available P of-14.3% was observed in the alkali-salinesoil, where yield increase during the same period was also only marginal. Readilyavailable K contents decreased in all soils, between -4.8% in the chemozem and -18.4%in the paddy soil (187 to 1991-95). An increase in K contents was found in Baijiang soil,where also the largest yield increase of 144% was recorded.It can be inferred from the above described analysis that the farmland soil nutrient statusvaries in general, with N slightly declining, P significantly rising and K steadilydeclining. Further analysis showed that there are three major causes contributing to thevariation. One is soil erosion that results in nutrient losses from farmland; another isconsecutive years of cultivation of high-yielding crops that have removed large amountsof nutrients, particularly K from the farmland. On the other hand, there are also changesin the use of mineral fertilizers. In the 1970s, N was the main fertilizer used, combinedwith small amounts of P fertilizers whereas in the 1980's and 1990's, combinedapplication of N and P prevailed with only little K added. Decades of application ofdiammonium phosphate resulted in an accumulation of P in the soil and rapid depletionof soil K and hence to a steady expansion of the area where K became deficient.
92

Crop response to mineral fertilizers in farmland
Crop response to reduced P application
In 1995, we carried out demonstration experiments on the effect of reduced Papplication in five typical soils of the province. The experiments had 5 treatments, i.e.treatment I) control, 169.5 kg ha-' of diammonium phosphate, which corresponds to thetraditional application rate; treatment 2) reduced application rate by 15%; treatment 3)reduced application rate by 30%; treatment 4) reduced application rate by 45%; andtreatment 5) reduced application rate by 60%. Results of the experiment are summarizedin Table 5.
Table 5. Yield response of maize to reduced P application in 1995 (kg ha- ')
Treatment Control T2 T3 T4 T5(100%)* (-15%) (-30%) (-45%) (-60%)
Mean 8837.1 8885.4 8446.7 8473.9 8148.4Variation 48.3 -390.4 -363.2 -688.7
Variation (%) 0.75 -66.0 -61.5 -115.5*standard application rate of P = 100%
The analysis of variance and LSR test for multiple regression of the data in Table 5showed that differences between the control and treatments 2, 3 and 4 were notsignificant. However, treatment 2 showed the best crop response and increased the
utilization rate of fertilizer P from 14.5% in the control to 18.7%. On this basis, thefollowing recommendations for P fertilizer application in the province were made: 1)For the current production level, application of P fertilizers at a rate of 15 - 45% lessthan the traditional application rate is economical and advisable; 2) In the central andeastern regions of the province, where P has been applied at a high rate for many years, itis recommended to reduce the P application by 45% whereas in the western region,where soil readily available P contents and P application rates were less during the pastyears, it is recommended to reduce the P application rate by only 15%; 3) In selectedplaces, where the soil fertility is poor and fertilisation rate has also been low, it is notadvisable to reduce the P application rate. 4) As P has a very low mobility in the soil,uptake may be restricted by low soil moisture contents, therefore, attention should bepaid to the use of P fertilizers as basal dressing and more generously in areas, wheredry-spells during the vegetation period are expected.
Crop response to K application
Benefiting from their parent materials, inherent K fertility of farmland soils in the JilinProvince is high. Crop response to K application therefore used to be insignificant in thepast. In recent years, however, due to the causes discussed above, symptoms of K
deficiency began to appear and response to K application became increasingly obvious.
93

Field experiments and surveys of farm households show that application of K producedvarying yield responses. Crop response to potassium application in the six major soils inthe province, generally follow this order: Recent soil > aeolian sandy soil > Baijiang soil> paddy soil > chemozem > black earth. Yield responses ranged between 5% and 10%.In soils, where readily available K was less than 100 mg kg', yield response reached upto 10%. In soils with a readily available K ranging between 100 - 150 mg kg', yieldresponse was up to 5% whereas in soils with a readily available K content above 150 mgkg-1, most crops did not respond to additional K, except some K-demanding cash crops,such as melons, fruits, tobacco, etc. Therefore, if K is applied in combination with NP atrates of 45 - 75 kg ha-' K20 a yield response of 4.5 kg maize, 3 kg rice or 2 kg soybeanper every kilogram of K20 applied can be expected.
Prediction of the province's demand for mineral fertilizers
Mineral fertilizer is an important factor for increasing grain output and to improve thefarmland nutrient balance. Based on the general planning of the province for developinggrain production, a prediction of the province's demand for mineral fertilizers in 2001(actual use), 2005 and 2010 is made by using a nutrient accounting (input : outputbalance) system. The data in Table 6 are obtained through calculation, using the Stanfordequation for the nutrient balance, that is D - A - B/C, where D stands for the predicteddemand for mineral fertilizers, A for the total crop uptake of nutrients, which is workedout by multiplying the expected total output of five major crops in the target year by thenutrient demand per hundred kg economical yield. B signifies the available soil nutrients,which is determined by soil analysis and the calculation of soil nutrient supply, using theavailable nutrient multiplier method. The results are then weighted according to theacreage of each soil type. C stands for the fertilizer recovery rate by the crop within therespective period, which is the mean value of the results of years of experiments in theprovince.
Table 6. Prediction of the Jilin Province's demand for mineral fertilizer (103t)
Year N P20 5 K20 Total N:P205:K202005 A 732.6 168.2 144.9
B 452.4 103.4 89.5C 337.6 195.0 369.5D 830 330 150 1,310 1:0.4:0.18
2010 A 750.3 178.6 193.2B 463.3 110.3 119.3C 337.6 195 369.5D 850 350 200 1,400 1:0.41:0.24
Table 6 indicates that in the target years of 2005 and 2010, the Jilin Province needs atotal of 1.31 and 1.4 million tons of mineral fertilizers (nutrient units). Following thispredicted demand, the N:P20 5 :K20 ratio will adjust to 1:0.4:0.18 and 1:0.41:0.24,respectively.
94

Nutrient status of farmland soils in the Hebei Province and ap-proaches to its improvement
Lu Yinghua, Qin Shuangyue and Feng Hong'en
Hebei Province Soil and Fertilizers Head Station, 050021
Abstract
Data gathered from stationary monitoring and general investigations of nutrients in theplough layer of farmland soils show that the soil nutrient status varies depending on
the studied parameters. However, it can be noted that over the years the organic matterlevel is maintained with a slight trend to larger nutrient contents, especially with regardto N. The readily available P in the soil is rising steadily whereas the contents of read-ily available K are continuously and drastically declining. The changes in nutrientstatus of the familand soil are closely related to the cropping system, yield, application
of organic manure, input of mineral fertilizers and other crop management practices.Based on research findings, approaches are promoted on how to improve the nutrientcycling in the farmland ecosystem.
Introduction
With the development of the agricultural production and the intensification of the crop
management, great changes have taken place in terms of farming system, the agricul-
tural production conditions and the soil nutrient status. In order to understand the
changes happening to the soil nutrient status, a long-term stationary soil nutrient moni-toring system was set up in 1984. It also aimed at studying the relationship between
soil quality and yield to provide guidelines for the regulation of the nutrient manage-ment in the agricultural production systems. Monitoring sites were deployed all overthe province, covering all major farmland soils, i.e. cinnamon soils, fluvio-aquic soilsand paddy soils. Two treatments, no fertilization and conventional fertilization, wereset up for the monitoring. For the purpose of verifying the findings of the monitored
sites and remedying the shortcoming of the monitoring site, as they are representing avery large area, a province-wide investigation of soil nutrients in the plough layer of
farmland was carried out in 1993. By comparing the findings with the data of the soil
survey, a fairly sound knowledge was acquired concerning the trend in changes of thesoil nutrient status of the farmlands all over the province-
95

Changes in farmland soil nutrient status and their causes
Organic matter maintained with a slight upward trend
According to the data from 12 monitoring sites, soil organic matter content increasedfrom 9.8 g kg-' in 1984 to 12.7 g kg" in 1996, which means an increase of 29.6% onaverage of all 12 sites. In the soil nutrient survey conducted in 1993, a total of 9,495soil samples were collected for the determination of organic matter (SOM). With amean value of 12.8 g kg" ', SOM increased by 11.1% compared to the soil survey in1984. About 69.5% of the soil samples had elevated whereas 29.2% showed decreasedSOM and 1.3% of the samples remained unchanged. The rise in soil organic matterwas attributed to larger quantity and quality of the applied organic manure. Especially,the areas to which harvest residues were applied showed also increased crop yields.Harvest residues that used to be fuel for cooking, are now used as manure and fodder,thus greatly raising the proportion of straw returned to the fields and therefore improv-ing soil organic matter both in quantity and quality.
Accumulation of soil N
According to the data from the 12 monitoring sites, total soil N was 0.818 g kg-' in1996, about 31.7% larger than in 1984. Five out of 12 sites showed an accumulation ofN. During the soil nutrient survey conducted in 1993, a total of 8,067 soil samples wascollected for the determination of total N. The mean value of 0.87 g kg-1 was about17.2% larger than during the soil survey in 1984. About 67.9% of the soil samplesshowed a trend towards larger, 31.2% towards smaller and 0.9% stagnating contents.The close relationship of total N with soil organic matter may explain the upward trendof nitrogen and is obviously a result of applying large quantities of N fertilizers in con-secutive years as well as the supplementation of large amounts of quality organic ma-nure.To determine the easily available N fraction, the soil samples were analyzed for alka-lytic N (incubating the soil with 1.0 M NaOH at 40 'C for 24 h). At the 12 monitoringsites, alkalytic N increased from 54.2 mg kg-' in 1984 to 82.3 mg kg' in 1993 by morethan 50%, about 28.1 mg kg-' larger than in 1984. Of the 9,523 soil samples taken inthe 1993 survey, the mean value was 68.5 mg kg"', about 11.7 mg kg' l or 20.6% largerthan that in 1984. About 68.4% of the soil samples showed an increase, 30.7% a de-crease and 0.9% were unchanged, indicating a similar trend to that of total soil N. As areadily available nutrient, alkalytic N is subject to rapid changes in the soil and ismainly affected by N application.
Soil readily available P rises steadily
According to the statistics of the monitoring data from the 12 monitoring sites, in 1994soil readily available P was 12.3 mg kg-', 6.0 mg kg-' larger than that in 1984, showingan upward trend. The analysis of the 9,072 soil samples collected in 1993 all over the
96

province revealed that the mean content of readily available P was 10 mg kg -', 4 mgkg -' or 64.4% larger than in 1984. 69.7% of the soil samples taken showed an increase,27.4% a decrease and 2.9% were unchanged. In the early 1980's, the second province-wide soil survey revealed that the mean content of readily available P in the soil wasonly 6.1 mg kg -' and about 85% of the soil was deficient in P. To solve the problem ofP deficiency, application of P fertilizers was promoted and introduced all over theprovince. Especially the extensive application of large amounts of P-based fertilizers,
e.g. DAP, increased the soil P content year by year and eventually reversed the situa-tion of P deficiency towards a P surplus. Although soil P increased to some extend,there is still a large proportion of farmland which is deficient in P with a soil P contentof less than 10 mg kg'. Therefore, emphasis needs further to be laid on promotingadequate P application.
Soil readily available K dropping drastically
According to the 1996 statistics of the 12 monitoring sites, soil readily available K wasreduced by 19.2 mg kg-' or 18.3% compared to 1984. In the 7 monitoring sites withtwo crops per year, it decreased from 113.2 mg kg' in 1984 to 80.3 mg kg' in 1996,showing a drastic downward trend. The analysis of the 9,351 soil samples collected all
over the province in 1993 indicated that the mean content of readily available K wasIll mg kg -', 20 mg kg -' or 15.1% smaller than in 1984. 65.4% of the soil samplestaken showed a reduction, 33.9% an increase and 0.7% remained unchanged. Beforethe second province-wide soil survey, it was believed that the soils in the Hebei Prov-ince were not deficient in K. Nevertheless, after the second soil survey, the long-termmonitoring and the soil nutrient survey in recent years, it was discovered that soil read-ily available K in the farmland dropped drastically, causing widespread appearance ofK deficiency symptoms. The yield response of cotton, wheat and rice to K application
became significant. K deficient soils still deserve more attention. The main causes ofthe drastic decrease in soil readily available K are: Continued and increasing K re-moval with increasing crop yield, little K input in the form of mineral fertilizer. Fur-thermore, it was found that K in farmyard manure is inadequate to meet the cropneeds. All this has resulted in the failure to stop decreasing K levels, hence, has led tothe drastic drop of soil readily available K. That calls for readjustment of the NPK ra-tio in fertilization by supplementing K fertilizers, particularly in those high-yieldingregions with two crops per year.
Changes in crop yields
Most of the monitoring sites in the province have been monitored for more than 10years. The data show that the yield in the non-fertilized fields was relatively stable.According to the data of the monitoring sites, on the plain farmland with maize andwheat in rotation, it was found that unfertilised plots yielded only 44.1% of the fertil-ized fields. This figure was 4.1% less than in 1994. In paddy fields, the yield of unfer-
97
tilized fields is only 35.8% of the fertilized fields, 6.5 % smaller than in 1994. Thisshows the dramatic yield increases by fertilization and the concomitant yield decline ifno fertilizers are applied.Usually more than 50% of the current yield is credited to mineral fertilization. It isobvious that the input of fertilizers is the dominant factor for high yields. Omission atfertilization for consecutive years will further reduce crop yield, but it was observedthat after a certain number of years, the yield will maintain a certain level. The moni-toring data of the past twelve years reveal that this yield without fertilization stabilizesat around 50% of the yields in fertilized fields.
Approaches to improve the nutrient cycle of the farmland
Increasing application rate of nutrients and improving nutrient recycling to farmland
Mineral nutrients applied to farmland not only increase the yield of crops but also theby-products, e.g. stalks, roots and leaves. A large part of these residues remain on thefield at harvest or can be recycled in form of farmyard manure. This is often done ifcrop residues are used as fodder for the livestock. In addition, human and animal ex-cretions (night soil, farmyard manure) can be recycled to the field. Still in the 1980's,the Hebei Province relied to a great extend on these organic nutrient sources. 52-54%of the N, 63-64% of the P and 95% of the K and most of the micronutrients applied tocrops came from organic manure. This however, led to a dramatic depletion of the soildue to the fact that the nutrient cycle in the field is not closed and even under strictestcontrol and recycling, nutrient losses are unavoidable.It should be kept in mind that as long as there is no import of feed or food stuff to thecountry, to the province, county or farm, the organic manure and human wastes ap-plied to the field contribute no net additions to the nutrient pools of the soil. They onlyreturn parts of what was removed for feed or food production during harvest. A com-bination of organic manure, recycling and demand adjusted mineral fertilizer applica-tion is therefore the only promising approach to sustainable crop production.
Readjusting N fertilizer application rate and improving N fertilizer recovery rate
Mineral fertilizer N has become the major source of nitrogen applied to farmland sinceit is the most important measure for achieving large yields. Recently, the Hebei Prov-ince consumes 1.5 million tons of N per year, with an average application rate of 231kg ha-: Through its application both crop yields and soil N contents increased what isconducive to the N balance of the farmland but may also have side-effects whichshould not be ignored. For instance, poor N recovery rate, limited crop response,higher costs and pollution to the environment are problems which need to be tackled.Therefore, on the premise of maintaining the total N consumption constant, it is essen-tial to readjust the allocation of N fertilizers according to the demand of the variousregions. The N use efficiency in high-yielding regions should be improved by means
98
of balanced fertilization whereas in the medium- to low-yielding regions N rates needto be increased. The same is required in regions with generally smaller, insufficient Napplication rates. N efficiency can be improved by means of balanced fertilization,split application techniques, etc. Poor N recovery rates of partly only 35% of the ap-plied N or even below are a major problem in using N fertilizers. Consequently, thefocus of scientific fertilization should be placed on improving the N recovery rate,rather than increasing N application rate alone.
Steadily increasing P application rate and crop response to P application
During the past twelve years, readily available P in soils has increased by more than60% on average. The consumption of P fertilizers in the province has reached 450,000tons averaging 69 kg P205 ha '. The current situation shows that, although soil P con-tent rises rapidly, it is still at a low level and needs to be further supplemented by usinglarger P application rates. Region-specific or even site-specific P application strategiesneed to be adopted. In high-yielding regions where large rates of P fertilizers were ap-plied in the past and led to a sufficient accumulation of available P in the soil, P fertil-izers can be saved and can be used for only every second crop in the rotation. It is ad-vised to apply the P to the most responsive crop.
Raising K application rate to reverse the trend of drastically falling K soil reserves
The drastic decline in soil K levels in farmland and the widespread crop response to Kapplication has changed the traditional understanding that the soils in the Hebei Prov-ince are sufficient in K. Owing to limited K fertilizer resources and unpopular K appli-cation techniques, the Hebei Province only consumed 175,000 tons of K fertilizers (in2001), leaving much of its farmland unsupplied. A large number of experiments needsto be carried out in order to determine area, distribution and extent of K deficiency infarmland. Furthermore, recommendations for proper K application rates need to bedeveloped so that applied K can be used more efficiently. Priority in K supply shouldreceive those crops with the largest response to K. Recycling of K with the aid of Kcontaining organic manure such as straw, green manure crops, plant ash, etc., can re-duce the decline of the K fertility of soils and to a certain extend can supplement min-eral K application. It has to be born in mind that poor efficiency of nitrogen use is of-ten caused by insufficient supply of P and especially of K.
99

Status quo and prospects for the use of mineral fertilizers in theShandong Province
Liu Zhaohui, Jiang Lihua and Zhang Yulan
Soil and Fertilizers Institute of Shandong Province Academy of Agricultural Sciences, 250100
Abstract
Shandong is a big agriculture-based province, leading in output and yield per unit-areaof grains among the provinces or regions in China. In recent years, Shandong's con-sumption of mineral fertilizers has been rising steadily. Within the 18 years from 1980to 1997, its consumption increased by 1.86 times or at an average rate of 10.9% annu-ally. K fertilizers and compound fertilizers increased at a faster rate than N fertilizers.In 1997, every hectare of farmland received on average 579 kg of fertilizers (on thebasis of net nutrient), about 3.10 times as much as in 1980 (187 kg ). Nevertheless, thegrain output rose only at an average rate of 3.6% annually during the same period. Thisis an indication that certain problems exist with regard to the use of fertilizers in Shan-dong. For instance, in 1995, organic manure had only a share of 30% in nutrient sup-ply; the system of fertilizer consumption was irrational with an NPK ratio (on the basisof N:P 20 5 :K20, the same below) being only 1:0.29:0.13; the distribution of fertilizerswas unreasonable, showing abundance in the eastern region and shortage in the west-em part of the province. Especially in the eastern part, N fertilizers seriously pollutegroundwater and agricultural products, bringing the nitrate levels in 30% of the shal-low groundwater beyond the critical value of the water sanitation regulation. Based onthe analysis of the use of fertilizers during those 18 years, it is predicted that the con-sumption of fertilizers will continue to rise in the coming years, with K fertilizers in-creasing at a faster rate than others, which should be taken care of when fertilizers areused in the future.In 1996, Shandong's grain output reached 43.327 million tons and its yield 5,260 kgha- . Such a large grain output is attributed to the input of fertilizers, which put Shan-dong in the lead among the provinces or regions in China. In 1997, it consumed 3.867million tons (on the basis of net nutrient, the same below). On one hand the use oflarge amounts of mineral fertilizers has promoted the production of cereals and cottonin the province, but on the other hand it also caused a number of problems that need tobe solved urgently.
Status quo of the use of fertilizers
During the study period of 18 years, the consumption of mineral fertilizers in Shan-dong has steadily increased (Table I) from 1.3529 million tons in 1980 to 3.867 mil-lion tons in 1997 (Shandong Statistical Yearbook) by 1.86 times or at a rate of 10.9%annually. The proportion of K fertilizers and compound fertilizers expanded faster thanthat of N fertilizers. In 1997, every hectare of farmland received on average 579 kg of
101
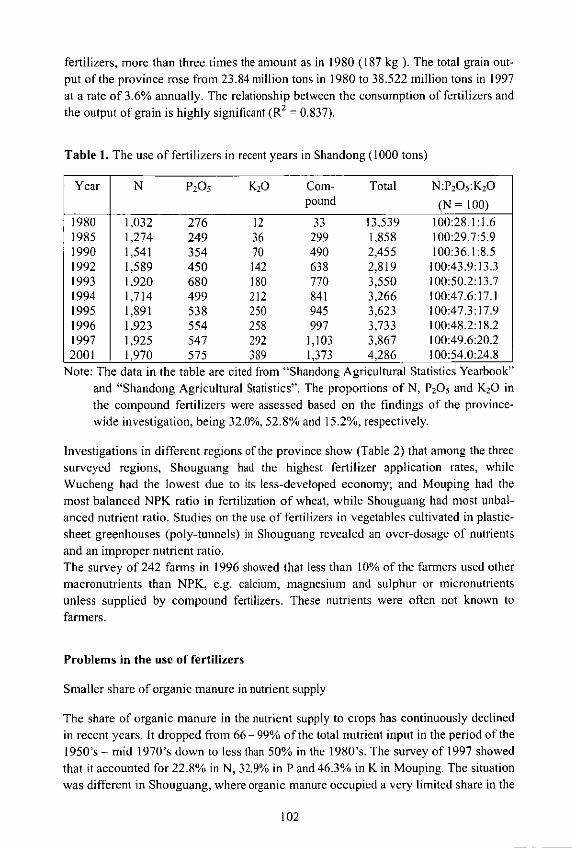
fertilizers, more than three times the amount as in 1980 (187 kg ). The total grain out-put of the province rose from 23.84 million tons in 1980 to 38.522 million tons in 1997at a rate of 3.6% annually. The relationship between the consumption of fertilizers andthe output of grain is highly significant (R2 -0.837).
Table 1. The use of fertilizers in recent years in Shandong (1000 tons)
Year N P20 5 K20 Com- Total N:P 2 05:K 20pound (N = 100)
1980 1,032 276 12 33 13,539 100:28.1:1.61985 1,274 249 36 299 1,858 100:29.7:5.91990 1,541 354 70 490 2,455 100:36.1:8.51992 1,589 450 142 638 2,819 100:43.9:13.31993 1,920 680 180 770 3,550 100:50.2:13.71994 1,714 499 212 841 3,266 100:47.6:17.11995 1,891 538 250 945 3,623 100:47.3:17.91996 1,923 554 258 997 3,733 100:48.2:18.21997 1,925 547 292 1,103 3,867 100:49.6:20.22001 1,970 575 389 1,373 4,286 100:54.0:24.8
Note: The data in the table are cited from "Shandong Agricultural Statistics Yearbook"and "Shandong Agricultural Statistics". The proportions of N, P20 5 and K20 inthe compound fertilizers were assessed based on the findings of the province-wide investigation, being 32.0%, 52.8% and 15.2%, respectively.
Investigations in different regions of the province show (Table 2) that among the threesurveyed regions, Shouguang had the highest fertilizer application rates, whileWucheng had the lowest due to its less-developed economy; and Mouping had themost balanced NPK ratio in fertilization of wheat, while Shouguang had most unbal-anced nutrient ratio. Studies on the use of fertilizers in vegetables cultivated in plastic-sheet greenhouses (poly-tunnels) in Shouguang revealed an over-dosage of nutrientsand an improper nutrient ratio.The survey of 242 farms in 1996 showed that less than 10% of the farmers used othermacronutrients than NPK, e.g. calcium, magnesium and sulphur or micronutrientsunless supplied by compound fertilizers. These nutrients were often not known tofarmers.
Problems in the use of fertilizers
Smaller share of organic manure in nutrient supply
The share of organic manure in the nutrient supply to crops has continuously declinedin recent years. It dropped from 66-99% of the total nutrient input in the period of the1950's - mid 1970's down to less than 50% in the 1980's. The survey of 1997 showedthat it accounted for 22.8% in N, 32.9% in P and 46.3% in K in Mouping. The situationwas different in Shouguang, where organic manure occupied a very limited share in the
102

case of grain production, but was abundantly used in the greenhouse vegetable produc-tion, where it accounted for 26.5% in N, 21.0% in P and 37.7% in K. In Wucheng, it
accounted for 24.6% in N, 21.4% in P and 64.2% in K supply. Organic manure pro-
vided a larger proportion of K than N and P with the latter two occupying slightly more
than 20% of the total nutrient application.
The inadequate input of organic manure may lead to a reduction of the soil organic
matter content, reduced soil fertility and as a result poor ability to produce high and
stable yields. Every year, the province has a huge amount of crop stalks or straw avail-
able for utilization. Except for only a small amount being used as manure, more than
12 million tons of the material are burned, not only polluting the environment but also
wasting resources.
Table 2. Nutrient application rates of three surveyed regions in Shandong (kg ha-)
Site Crop N P20 5 K20 Ratio* Sites
MF OM MF OM MF OM N=I00
Mouping Wheat 168.9 51.0 115.1 35.4 80.9 42.8 100:68.1:47.9 n=29
Maize 122.6 3.6 17.1 4.3 20.9 5.8 100:13.9:17.0 n=29
Shouguang Wheat 300.2 203.7 21.1 100:67.9:7.0 n = 25
Maize 186.5 30.2 61.1 12.4 16.5 100.9 100:32.8:8.8 n = 25
VG** 1828.8 659.0 2591.1 688.0 730.1441.6 100:142:39.9 n=31
Wucheng Wheat 130.4 31.9 115.2 13.5 29.1 15.9 100:88.3:22.3 n = 30
Maize 90.3 14.5 22.8 6.2 11.9 42.1 100:25.2:13.2 n = 22*
Mean Wheat 199.8 27.6 144.7 16.3 34.0 19.6 100:72.4:17.0
Maize 133.1 16.1 33.7 7.6 16.4 49.6 1:0.253:0.123
Note: MF stands for mineral fertilizers and OM for organic manure.*: N:P 205 :K20 ratio, including OM in the form of crop residues returned to the field.**: Vegetables in greenhouse.
Irrational structure of the mineral fertilizer consumption
Irrational NPK ratio, over-dosed N application, inadequate K fertilizers and negligenceof the use of other macronutrients as well as micronutrient fertilizers are problems re-lated to the use of mineral fertilizers. According to the statistics, the N:P:K ratio in thenutrient use was 100:28.1:1.6 in 1980 and 100:36.1:8.5 in 1990. Though it was read-justed to 100:49.6:20.2 in 1997, it is still far from the appropriate ratio of 100:45:35.Of the three surveyed regions, Mouping had a very narrow and balanced N:P:K ratioof the mineral fertilizers in wheat (100:68.1:47.9) and a rather wide ratio in maize(100:13.9:17.0). This practice led to K deficiency which is widespread in Moupingcovering 13% of the farms. In Shouguang, the N:P:K ratio of 100:67.9:7.0 in wheatand 100:32.8:8.8 in maize resulted in a strong exploitation of the soil K resources dueto inadequacy of K fertilizer application. This was the cause for K deficiency in about
103

84% of the grain-producing farmland. The N:P:K ratio of vegetables of 100:141.7:39.9clearly shows that P was over-applied, resulting in an accumulation of a large P con-centrations in the soils whereas the K supply was inadequate. In Wucheng, the N:P:Kratio applied was 100:88.3:22.3 to wheat and 100:25.2:13.2 to maize, which alsoshowed significant K inadequacy, causing that 83.3% of the farmland became deficientin K.An inadequate K input is the direct cause for a continuous expansion of the area beingK-deficient, which has reached 65% of the farmland in Shandong in the meantime.About 35% of the area is seriously K deficient and our studies revealed that only 5.3%of the 432 wheat fields surveyed and only 3.8% of the 1,022 summer maize fields usedmicronutrient fertilizers. Owing to the neglect in the use of these nutrients, the area ofsoil deficient in certain macro (Ca, Mg, S) and micronutrients (B, Cu, Zn, etc.) ex-pands, especially in the eastern, central and southern parts of Shandong. The area ofZn-deficient soils comprises 60%, of B-deficient soils 62% and of serious Mo-deficient soils 53% of the farmland.
Unreasonable fertilizer distribution
Unreasonable fertilizer distribution can be observed I) between crops, 2) betweenfields and 3) between regions. Cereals generally receive much less fertilizers thanvegetables and fruits. Especially, vegetables in poly-tunnel greenhouses were oftenover-fertilized, having only a very poor recovery rate of applied N and P fertilizers,resulting in a dramatic waste of resources and in environmental pollution. 2) Fieldsclose to the village, though generally being more fertile compared to remote fields,generally receive larger fertilizer dressings than the latter. 3) Unreasonable distributionbetween regions manifests in the fact that the application rate is generally larger ineconomically well-developed regions, like the eastern and central part of Shandong. InShouguang the application rate for wheat was about 1.92 times greater than inWucheng. Obviously, too much was applied in Shouguang whereas it nutrients wereinadequate in the economically underdeveloped regions like the western part of Shan-dong. In Wucheng, 40% of the studied 30 farms were deficient in N. The figure wouldhave been larger if N losses had been taken into account.
Unreasonable use of fertilizers leading to environmental pollution
The analysis of a large number of research results revealed that the mean recovery rateof N fertilizers lingers around 30% and that the rest of the N applied was lost via vari-ous pathways into groundwater, surface water and the air. After N fertilizers enteredthe soil, a part is converted to nitrate-N, which is easily leached into the groundwaterby rain or irrigation water. Nitrate- and nitrite-containing water is regarded as detri-mental to consumer's health, because they may form carcinogenic nitrosamines. In1997, 16 groundwater or surface water samples were collected from three differentplaces (Table 3). The groundwater samples from Shouguang, though taken from deeplayers, all contained considerable amounts of nitrates. The measured concentrations
104

Table 3. Element content in groundwater (mg 1-')
Location K P NO3 Use )
MoupingLijiatuan 1.50 N/D2 ) 100 Tap waterDongxishan 7.70 N/D 50 Irrigation, drinkingNangou Reservoir, Ninghai 2.20 N/D 10 IrrigationYuniao River 2.25 N/D 10 IrrigationGaoling Reservoir 2.25 N/D 0 IrrigationPohe River 2.70 N/D 25 Irrigation
ShouguangLiujia, Beiluo Town 1.05 N/D 200 Irrigation (1 8.5m)Shangjia Village, Beiluo Town 0.40 N/D 100 Irrigation (19.0m)Xichen Village, Wenjia 0.90 N/D 25 Irrigation, drinking
Township (21 m)Zhaojia Village, Guzheng 0.90 N/D 50 Irrigation, drinkingTownship (1 7m)Antou village, Gucheng 1.05 N/D 25 Irrigation (19m)Township
WuchengYoufang, Caicun Township 2.40 0.002 0 Irrigation (17m)Caixi Village, Caicun 0.90 N/D 0 Irrigation (13.2m)TownshipRongzhai, Caicun Township 1.85 N/D 0 Irrigation, drinking
(6.9m)Zhangwang Zhuang, Datun 0.60 N/D 0 Irrigation, drinkingTownship (I1.5m)Dingwang Zhuang, Datun 1.45 N/D 0 Irrigation, drinkingTownship (4.7m)
1) Depth from which sample was taken in brackets2) N/D stands for not determined.
reached levels as high as 200 mg P'. The high nitrate concentrations in the groundwater
are closely related to the large N application rates. Nitrates were also found in the
ground and surface water samples taken in Mouping. No nitrates were detectable in the
five groundwater samples from Wucheng. All 16 water samples contained K whereas
large K concentrations of 3.1 mg r' on average appeared in the water samples from
Mouping, Yantai, with the highest being 7.7 mg P. There was seemingly no correlation
between fertilization and K concentrations in the groundwater since in the water sam-
ples from Shouguang (largest amounts of K applied) only 0.86 mg K F' were found.
On the other hand samples from Wucheng (smallest amounts of K applied) showed K
concentrations in the groundwater of 1.44 mg K F'. Out of the 16 samples only one
sample was analyzed for P, showing that in contrast to N and K the less mobile P is not
found at substantial concentrations in the ground water but more often found in surface
water, where it may lead to eutrophication of lakes and rivers.
105
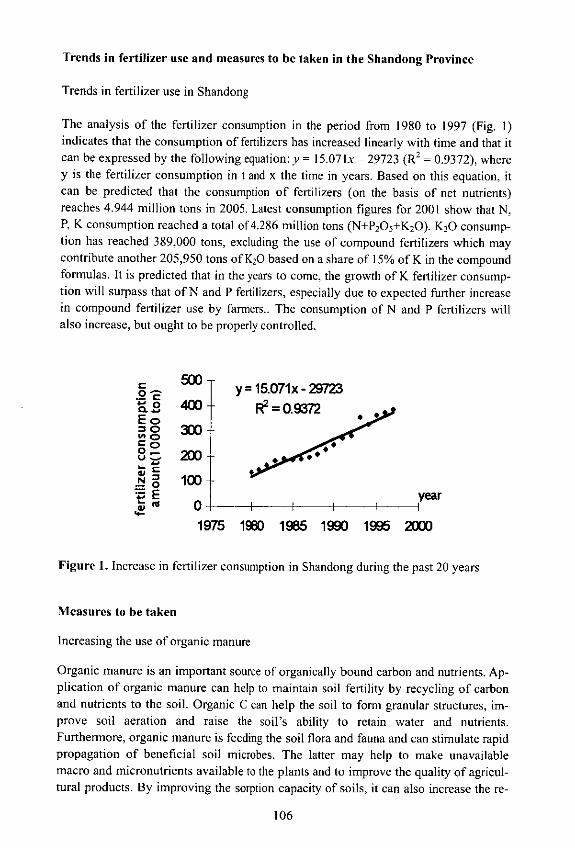
Trends in fertilizer use and measures to be taken in the Shandong Province
Trends in fertilizer use in Shandong
The analysis of the fertilizer consumption in the period from 1980 to 1997 (Fig. I)indicates that the consumption of fertilizers has increased linearly with time and that itcan be expressed by the following equation: y = 15.07 Ix -29723 (R 2 = 0.9372), wherey is the fertilizer consumption in t and x the time in years. Based on this equation, itcan be predicted that the consumption of fertilizers (on the basis of net nutrients)reaches 4.944 million tons in 2005. Latest consumption figures for 2001 show that N,P, K consumption reached a total of 4.286 million tons (N+P 20,+K20). K20 consump-tion has reached 389,000 tons, excluding the use of compound fertilizers which maycontribute another 205,950 tons of K20 based on a share of 15% of K in the compoundformulas. It is predicted that in the years to come, the growth of K fertilizer consump-tion will surpass that of N and P fertilizers, especially due to expected further increasein compound fertilizer use by farmers.. The consumption of N and P fertilizers willalso increase, but ought to be properly controlled.
a W5000 2y= 15.071x- 29723a2 400 R2 =9 . 2Eoano 300-oCo. 2 0 100
E yearV 0-
1975 190 1985 1990 1995 2000
Figure 1. Increase in fertilizer consumption in Shandong during the past 20 years
Measures to be taken
Increasing the use of organic manure
Organic manure is an important source of organically bound carbon and nutrients. Ap-plication of organic manure can help to maintain soil fertility by recycling of carbonand nutrients to the soil. Organic C can help the soil to form granular structures, im-prove soil aeration and raise the soil's ability to retain water and nutrients.Furthermore, organic manure is feeding the soil flora and fauna and can stimulate rapidpropagation of beneficial soil microbes. The latter may help to make unavailablemacro and micronutrients available to the plants and to improve the quality of agricul-tural products. By improving the sorption capacity of soils, it can also increase the re-
106
covery rate of mineral fertilizers. It should therefore be emphasized that harvest resi-
dues and animal wastes are returned to the field in combination with the use of mineral
nutrient sources.
Paying attention to the application of macro- and micronutrient fertilizers
The recent years, substitution of single super phosphate and calcium magnesia phos-
phate fertilizers by MAP and DAP has greatly reduced the amount of Ca, Mg and S,
being applied to the field. With increasing crop yield, the removal of these nutrients
also increased as it is confirmed by the expanding area of farmland deficient in these
macronutrients in recent years. Field experiments also showed significant crop re-
sponses both in yield and quality to the application of Ca, Mg, S and to a variety of
micronutrients (especially B, Zn and Mn). Besides the application of compound fertil-
izers containing all macro- and micronutrients, single micronutrient fertilizers are also
recommended for the application to certain crops, especially vegetables.
107


Allocation of fertilizer nutrients to various cropsin the Shandong Province
Ma Wenqi' , Mao Dart? and Zhang Fusuo'
'College of Agronomy, Hebei Agricultural University 071001Plant Nutrition Department, Chinese Agricultural University 100094)
Abstract
Based on the available statistics and a survey with 1,000 farmers, the fertilization prac-
tice and the distribution of fertilizer nutrients among crops in the Shandong Province
was studied. The results show that the largest area is cultivated with cereals which
have the biggest share in both uptake and consumption of NPK nutrients from mineral
fertilizers and organic manure followed by vegetables, melons and fruit trees. How-
ever, regarding the ratio between cultivated land and fertilizer consumption, a propor-
tionally smaller amount of fertilizer is used in cereals than in vegetables, melons and
fruit trees. Considering the nutrient demand, however, cereals would need a larger
share in the proportional fertilizer allocation. In terms of nutrient recovery rate, cereals
are more efficient than vegetables, melons and fruit trees. In the Shandong Province,
about 49.8% of the N, 71.3% of the P and 58.6% of the K absorbed by crops are re-
turned to the soil in the form of organic manure. Soil nutrients are also transferred
from grain-producing fields to vegetable gardens and orchards in the form of organic
manure. During the period from 1981 to 1996, the proportion of fertilizers applied to
cereals decreased whereas fertilizer consumption in vegetables, melons and fruit trees
increased. The total input of fertilizers, however, rose at about 50% in cereals, 25% in
vegetables and melons and 20% in fruit trees. The province's macroscopic regulation
of mineral fertilizer consumption aims at reducing N fertilizer application rates, espe-
cially in cereals, vegetables and melons, properly reducing P fertilizer application rates
in vegetables, melons and fruit trees and maintaining the P application rate in cereals.
Taking into account the return of K through organic manure, the use of mineral K fer-
tilizers should be increased accordingly. The largest proportion should be used in cere-
als and fruit trees followed by vegetables and melons.
Introduction
Considering that the issues, such as population growth, food supply, resources and
environment protection are increasingly becoming prominent, proper soil fertility
management gains high priority. Sustainable agriculture that is based on comprehen-
sive utilization of natural resources, protection of the agricultural environment and
harmonized development of economical, social and ecological benefits has become the
only way for countries throughout the world to develop their agriculture in the 21"
109

century. The management of mineral fertilizer and organic manure resources hasevolved to be one of the world's most important problems in relation to the sustainabledevelopment of agriculture. In the past two decades, both China's production and con-sumption of mineral fertilizers have developed so rapidly that this country has becomea major mineral fertilizer producer, importer and consumer. Ever since 1989, Chinahas always ranked first among the mineral fertilizer consumers. In 2001, its mineralfertilizer consumption reached 42.540 Mt (on the basis of net nutrients, the same be-low), which exceeded its own production capacity by far. In 2001, it produced 29.527Mt, amounting to only 70% of what was consumed. In 2001, 6.827 Mt were importedfrom other countries. For this, the country spent 1.849 billion USD, indicating the im-portance of fertilizer in the international trade relationships of China. At the same time,the mineral fertilizer recovery rate in China is very low, about 10 percentage pointsless than that in developed countries. That alone costs more than 9.00 Mt tons of nitro-gen, equalling to over 38 billion Yuan RMB (4.6 billion USD). Consequently, how touse mineral fertilizers more efficiently, how to bring the yield-increasing effect ofmineral fertilizers into full play, how to lower N loss and how to reduce pollution arenow questions of utmost significance. The performance of macroscopic regulations forthe production, distribution, importation and consumption of mineral fertilizers and theoptimization of resource allocation are important approaches to raise the effectivenessof mineral fertilizers. Owing to the lack of needed information about the status quo ofthe distribution of crop nutrient resources within regions, a number of crucial issuesremain not addressed, such as the relationship between the input of mineral fertilizersand the increase in crop yield, the rationality of the fertilization of cereals that enjoy aspecial position in the agricultural production of China. Furthermore, information isneeded on the distribution of the large quantities of mineral fertilizers produced athome and imported from abroad and the allocation of mineral fertilizer resources onthe basis of region, variety of mineral fertilizer product and crop and structure of min-eral fertilizers allocated. For this reason, the following study was carried out looking atthe distribution of fertilizer nutrients on the basis of crops by conducting a survey onfertilization systems.
Research method
Data collection and characterization of data
For the investigation, eight counties (or cities), i.e. Shouguang City, Qixia City, PingduCity, Feixian County, Yuncheng County, Feicheng County, Qihe County, and YangxinCounty, were chosen throughout the province. Then three or four townships out ofevery county (or city), three or four villages out of each township, and nine to fifteenfarms out of each village were randomly selected. In total, 1,046 farmers were visited;each one had to fill out a questionnaire.The survey covered basic conditions of the farms such as crops cultivated, fertilizersused, crop yields and output values and their knowledge about modem fertilization.
110

Before each visit, interviewers designed a questionnaire according to the outline of theinvestigation. The questionnaires were filled out during the farm visits.
Calculation of net nutrient content in organic manure
The net nutrient content in the different sources of organic manure was calculated on atype-by-type basis, referring to the "Manure Handbook", "Agro-chemistry", etc.
Distribution and fate of nutrients
Based on the findings of the investigation, mean nutrient inputs per unit area were cal-culated. If a large number of samples of a crop could be gathered, the calculation wasconducted on the basis of the counties' average in combination with the cultivated areaof that crop recorded in the statistics of the respective regions selected for the survey ineach county. If only a few samples could be collected, the calculation was performedon the basis of a uniform average figure of the province.
Crop nutrient uptake
Crop nutrient uptake was calculated based on the crop production recorded in the sta-tistics and the nutrient uptake parameters listed in relevant literature.
Macroscopic rational application rate
From relevant literature, data about the rational application rate of a crop was gathered,especially, the data concerning Shandong. Mostly the upper limits were used for thecalculation of the province's mean suitable application rate, based on which the prov-ince's macroscopic rational application rate was worked out in combination with itscultivation structure.
Results and analysis
According to the 1997 statistics, in Shandong 63.5 % of the farmland was cultivatedwith cereals, 13.3% with vegetables and melons, 7.5% with fruit trees, 3.6% with cot-ton and 8.2 % with other crops, such as hemp, sugar crops and tobacco (Figure I).
Crop nutrient uptake, application and balance of nutrients
Nitrogen
Table I shows that N comes in the form of either mineral fertilizer or organic manure.The total N input was 3.7807 Mt, of which 75% was in the form of mineral fertilizer.
III

70 63.5
60
o 50
40
a 30
~1320S10 74 7.5 8.2
Cereals Oil crops Cotton Veg. & Fruit trees Others
melon
Figure 1. Proportional distribution (% of total cultivated land) of cultivated area inShandong by the various crop types in 1997
The total crop N uptake was estimated at 1.8613 Mt, accounting for 49.2% of the totalN input. The province's N equilibrium index (input : output ratio) was 2.04, indicatingthat the N input was twice as much as the N output. The investigation revealed thatorganic manure in Shandong, including mudash manure, barnyard manure, animaldung and crop stalks or straw, was returned to the field. All these types of manuremainly originate from harvest residues, returned to the field either directly or afterprocessing or in the form of human and animal waste after digestion in their bodies.Therefore, the input of nutrients in the form of organic manure can be taken as theamount of nutrients recycled within the entire production system. Thus, the nitrogenrecycling rate of the province was reckoned at 49.8%, that means that about half of thenutrients present in harvest residues was returned to the soil.Among the crops, cereals are still the biggest consumer of N with approx. 64.7% of thetotal consumption. This is less than could be expected from the proportion cereals oc-cupy in terms of cultivated area. Vegetables and melon crops were the second largestN users with 17.9% whereas fruit trees sharing 10.3% are ranked third. Both highercrop groups had much larger N consumption than could be expected from their sharein area. Cereals used 49.8% of the total organic N (from manure), which is less thantheir respective share in the mineral fertilizer N input. Vegetables and melons con-sumed 25.2% of the organic N which is larger whereas fruit trees consumed 13.0%,which is slightly larger than their respective share in the mineral fertilizer N input. Noutputs by cereals accounted for 72.4% of the total N output, a share which clearlyexceeds that observed in the inputs. This is different for vegetables and melons sharing13.7% of the total outputs by crops and being less than their respective share in thetotal N input and cultivated area. N output by fruit trees was only 6.0% of the inputsallocated to these crops. Cereals with 0.58 had a higher input : output ratio than vege-tables and melons. This shows that the problem of irrational fertilization with vegeta-bles, melons and fruit trees is more serious than in cereals. The percentage of total Ninput, deriving from organic manure, was the lowest in cereals, only 20% lower than
112

the province's average, around 30% in oil crops, cotton, vegetables, melons and fruittrees and 55.6% in other crops. The N input : output ratios show that in the mean overall crops more than twice the amount of N removed by the crops was returned to thefields by both organic manure and fertilizer application. Looking at the individualcrops reveals that in fruit trees more than 16 times, in cotton more than 6 times and invegetables almost 3 times the amount of N removed is applied. An apparent under-supply of N in oils crops is due to the fact that leguminous crops are in these groupwhere less N is applied and the amount of N2 fixed from the atmosphere has not beenassessed.
Table I. Input and output of nutrients by mineral fertilizer and organic manure inmajor crops in the Shandong Province (Unit:l,000 t)
Nutrients Cereals Oil Cotton Vege- Fruit Other Totalcrops table & trees crops
melonsN Input
Min. fertilizer 1,846 96 84 510 294 23 2,853Org. manure 462 46 38 234 120 28 928Output 1,347 210 18 254 25 6 1,861Balance 961 -68 104 490 389 44 1,919Input : output 1.72 0.68 6.67 2.94 16.67 8.33 2.04
P20 5 InputMin. fertilizer 678 64 46 280 200 14 1,282Org. manure 209 21 17 148 66 13 473Output 508 40 6 98 9 1 663Balance 379 44 57 330 257 25 1,092Input : output 1.75 2.08 10.00 4.35 25.00 25.00 2.63
K20 InputMin. fertilizer 170 30 2 92 91 0 386Org. manure 524 55 44 210 123 31 987Output 1,188 118 16 326 34 2 1,683Balance -495 -32 30 -24 181 29 -311Input : output 0.58 0.72 2.86 0.93 6.25 16.67 0.81
Phosphorus
Table I shows that the total P input in the province was 1,755,100 t, of which the ma-jor part with 1,282,200 t P205 entered the systems in form of mineral fertilizer P. Or-ganic manure with 472,900 t P20 5 accounted only for 26.9% of the total input. Thetotal crop P uptake was 0.663 Mt, resulting in a balance index (input : output) of 2.63,which means that the total P input was 2.6 times the amount of P removed by all crops.Similar to N there is a large difference in this ratio between the individual crops, show-ing that fruit trees and other crops received the most excessive rates, followed by cot-ton and vegetables. Cereals and oil crops received about double the amount of P that isremoved from the soil. Cereals are the largest P consumer with 51.9% of the total min-
113

eral P fertilizer, which is less than could be expected from their share in the cultivatedarea of the province. Vegetables, melons and fruit trees consume about 21.9% and15.6% of the total P supplied to agriculture. Both crop types consumed larger amountsthan could be expected from the cultivated area under these crops. Most of the organicmanure P, 44.3%, were recycled to cereals whereas 31.3% were entering the vegetableand melon sector. Fruit trees received 14.0% of the organic manure, similar to theirshare in the mineral fertilizer P input. Putting the manure consumption into perspectivewith the area occupied by both crop types (13% under vegetables, 7.5% under fruittrees), it is evident that there is a large transfer of nutrients from other crops, especiallycereals, to vegetables and fruit trees.
Potassium
Table I indicates that the province had a total K input of 1,372,600 t, of which385,900 t were from mineral fertilizer and 986,700 t from organic manure. The latteraccounted for 71.9%, which implies that organic manure is the major source of K. Thecrop K uptake reached 1,683,300 t, much larger than the total K input, forming a bal-ance index of 0.81. Therefore, most of the cropping systems in the province revealed adeficit in K, though the soil K values were not extremely low. With 42.9% of the totalmineral fertilizer K input, cereals consume the largest proportion of K consumed in theprovince, followed by vegetables and melons, consuming about 23.8%, and fruit treeswith 23.7%. Regarding the K inputs from organic manure, cereals shared 53.1%,which is larger than their share in the mineral fertilizer K input. Vegetables/melons andfruit trees received 21.2% and 12.5% of the organic manure K, respectively, both indi-cating smaller values than their share in the mineral fertilizer K input. In terms of totalcrop K removal (output), cereals accounted for 70.6%, which is larger than their sharein the total K input. Vegetables and melons reached 19.3%, which is less than theirshare in the total K input, and fruit trees only 2.0%, which is also much less than theirshare in the total K input. Unlike N and P, the percentage of the total K, deriving fromorganic manure exceeded 50% in all crops. Cereals occupied 75.5%, vegetables andmelons 69.4% and fruit trees 57.4%. Input : output ratios indicate that in cereal 58%,in oil crops 72% and vegetables 93% of the amount of K removed is only returned tothe fields by mineral and organically recycled K. In cotton and fruit trees almost 3 andmore than 6 times the removed amount of K is returned to the field. This shows that adramatic under-supply of K in cereals and oil crops on one hand, contrasts a K over-supply in cotton and fruit trees. Among all these crops, cereals showed poorest returnof removed K, indicating that a net transfer of K nutrient exists between differentcropping systems, dominantly from cereal fields to orchards and cotton fields in theform of organic manure.
Yearly variations in nutrient supply
The distribution of mineral fertilizers among crops in different years was assessedbased on the proportions the crops under investigation share in the total input of min-
114

eral fertilizer nutrients (on the basis of N + P20 5 + K,O), the cultivation structure andthe total consumption of mineral fertilizers of each year. The results show that in 1981cereals consumed 73% of the total input, vegetables and melons 5.5%, fruit trees 4.0%,
cotton 10.1%, oil crops 5.1% and other crops 2.3%. By 1988, the share of cereals inthe consumption of mineral fertilizers had dropped to 62.5%, that of oil crops with
5.1% remained the same, that of cotton increased to 13.2%, that of vegetables andmelons increased to 7.0% and that of fruit trees increased to 9.6%. By 1996, the share
in fertilizer consumption of cereals, oil crops and cotton further declined to 59.6%,4.8% and 4.2% whereas the share in fertilizer consumption of vegetables and melonsrose to 17.5% and that of fruit trees to 12.5%. From 1981 to 1988 and to 1996, thoughthe relations fluctuated, total consumption of mineral fertilizers increased in all the
crops, except for cotton in 1996 (Figure 2). In the case of cotton, the consumption ofmineral fertilizers increased significantly from 1981 to 1988, but dropped from 1988 to1996 to more or less the same level as in 1981, which is closely related to recent reduc-
tion in the area under cotton fields. The incremental increase in mineral fertilizer con-sumption from 1981 to 1996 can be to 50% attributed to cereals, 25% to vegetablesand melons, 20% to fruit trees and 4.5% to oil crops, which shows clearly that cereals
remain to be the major consumer, calling for more mineral fertilizers.
250
) 200 01981 01988 01996
150
100
50
cereals oils cotton vegetables fruits other cropsand melons
Figure 2. Input of mineral fertilizer nutrients to various crops in different years in
Shandong
Strategy for the regulation and rational distribution of mineral fertilizers among differ-
ent crops
Based on the fertilizer application rates recommended in the literature for various
crops and the cultivation areas of various crops in the province's agricultural yearbook,rational consumption of mineral fertilizers for every type of crop in the province was
assessed. The comparison of the actual consumption and the rational consumption
115
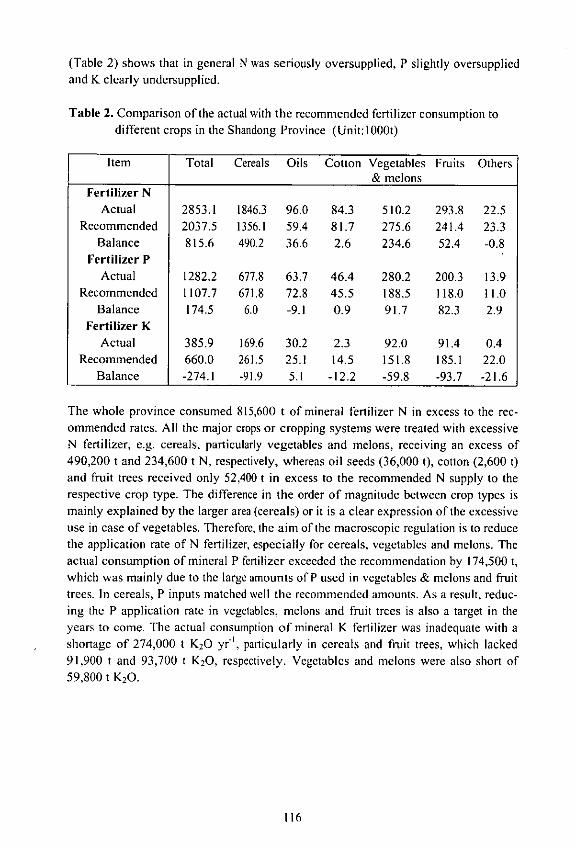
(Table 2) shows that in general N was seriously oversupplied, P slightly oversuppliedand K clearly undersupplied.
Table 2. Comparison of the actual with the recommended fertilizer consumption todifferent crops in the Shandong Province (Unit:000t)
Item Total Cereals Oils Cotton Vegetables Fruits Others& melons
Fertilizer NActual 2853.1 1846.3 96.0 84.3 510.2 293.8 22.5
Recommended 2037.5 1356.1 59.4 81.7 275.6 241.4 23.3Balance 815.6 490.2 36.6 2.6 234.6 52.4 -0.8
Fertilizer PActual 1282.2 677.8 63.7 46.4 280.2 200.3 13.9
Recommended 1107.7 671.8 72.8 45.5 188.5 118.0 11.0Balance 174.5 6.0 -9.1 0.9 91.7 82.3 2.9
Fertilizer KActual 385.9 169.6 30.2 2.3 92.0 91.4 0.4
Recommended 660.0 261.5 25.1 14.5 151.8 185.1 22.0Balance -274.1 -91.9 5.1 -12.2 -59.8 -93.7 -21.6
The whole province consumed 815,600 t of mineral fertilizer N in excess to the rec-ommended rates. All the major crops or cropping systems were treated with excessiveN fertilizer, e.g. cereals, particularly vegetables and melons, receiving an excess of490,200 t and 234,600 t N, respectively, whereas oil seeds (36,000 t), cotton (2,600 t)and fruit trees received only 52,400 t in excess to the recommended N supply to therespective crop type. The difference in the order of magnitude between crop types ismainly explained by the larger area (cereals) or it is a clear expression of the excessiveuse in case of vegetables. Therefore, the aim of the macroscopic regulation is to reducethe application rate of N fertilizer, especially for cereals, vegetables and melons. Theactual consumption of mineral P fertilizer exceeded the recommendation by 174,500 t,which was mainly due to the large amounts of P used in vegetables & melons and fruittrees. In cereals, P inputs matched well the recommended amounts. As a result, reduc-ing the P application rate in vegetables, melons and fruit trees is also a target in theyears to come. The actual consumption of mineral K fertilizer was inadequate with ashortage of 274,000 t K20 yr-1, particularly in cereals and fruit trees, which lacked91,900 t and 93,700 t K20, respectively. Vegetables and melons were also short of59,800 t K20.
116
NPK balance in farmland soils and future strategy forfertilization in the Shandong Province
Yan Peng and Mi Yunlu
Shandong Province Soil and Fertilizers Ilead Station, 250100
Abstract
At present, the farmland of Shandong has a deficit of 3 11,800 t K. Field experimentsdemonstrate that each kilogram of K can increase the yield by 8.34 kg. In a first step, it isrecommended to increase the K input by 311,800 t which could lead to an additionalgrain output of 2.60 Mt. To further increase the cereal production to 7.40 Mt, vegetable& melon production to 10 Mt and fruit production by another 2 Mt, additional 304,200 tN, 60,400 t P and 589,800 t K (equal to 138,300 t P205 and 707,800 t K20) will be re-quired. If in the increment of fertilizer input the current ratio between nutrients frommineral fertilizers and those from organic manure will be sustained, in 2010 the provincewill have an additional demand for 228,200 t N fertilizers, 107,700 t P fertilizers and336,200 t K fertilizers. It is predicted that in 2010 Shandong will consume 4.43 million tof mineral fertilizer nutrients, accounting for 8.7% of the country's planned total of 50.0million t. The N:P 205:K20 ratio in Shandong will then be 1:0.41:0.32. Calculation onsuch a basis indicates that in the next 10 years the fertilizer input will increase by 0.05-0.06 million t every year, about 0.1 million t less than the annual increment in the past 10years.
Introduction
Shandong is a major agriculture-based province in China. With a total land area of156,700 km 2 , it has about 8.001 million hectares of cultivated land and produces variousagricultural products, all accounting for a fairly large proportion of the total agriculturaloutput of the country. The province, on the other hand has a total population of 87 mil-lion, which means only 0.092 ha of cultivated land per capita. Constraints to agriculturalproduction are particularly inadequate fresh water resources, which are on average4,560m3 ha" , only one-sixth of the country's average. As a result, there is a high pres-sure on the resources due to high population and fast economic development whichleads to concerns regarding the ecological balance. Consequently, in order to developagriculture in future, the Shandong Province has to continue to raising the per unit landproductivity by developing sustainable agriculture. Soil fertility is the base for sus-tainable development of agriculture, in which the balance of soil nutrients plays an es-sential role. Scientifically based fertilization, using the knowledge of the law of nutrientrecycling and monitoring the status of nutrient balance in the soil-plant system, is acrucial approach to raising soil fertility, protecting and improving the farmland eco-system. In this paper, the NPK balance in farmland of the Shandong Province is studied,which is used as a basis for recommendations for future nutrient management practices.
117

Changes in soil NPK content of the farmland in Shandong
The four major soil types, fluvio-aquic soil, cinnamon soil, brown earth and Shajiang
black soil, account for 84% of all soils of Shandong's cultivated area. Comparison of the
results of a long-term stationary soil fertility monitoring program (Table 1) and the re-
sults of soil nutrient surveys over several years (Table 2) show that the changes in the
soil nutrient contents of farmland since the early 1980's can be described as follows:
1) The organic matter and total N contents have increased significantly in fluvio-aquicsoils, cinnamon and brown earths but decreased in Shajiang black soils. This may be
due to the large proportion of organic matter in Shajiang black soil, which has been
mobilized through the higher intensity of the cultivation by mineralization.
2) The alkalytic N (easily available N) and available P contents have increased sig-
nificantly in all four soil types. Available P has increased by over 50%. That is be-
cause more N and P fertilizers have been applied to farmland since the second soil
survey in the 1980's.3) The readily available K content has decreased in all four soil types. In relative terms,
soils which originally had a high readily available K have lost more K than those
with low readily available K at the beginning of the study. For instance, Shajiang
black soil, originally with 113 mg kg -1 of readily available K, has been losing 2.4 mgkg -l every year whereas brown earth with originally 68 mg kg' lost only 0.92 mg
kg-l every year. Brown earths are the soils which are the most deficient in K in
Shandong and hence, the first receiving K fertilizers. The relatively large input of K
causes that the readily available K in brown earth soils is not too rapidly decreasing.
Table 1. Results of long-term monitoring of nutrients in topsoils (0-20cm) under
farmland in the Shandong Province
Soil Year OM. Total N Alkalytic N Available P R. available K(g kg-') (g kg -') (mg kg-') (mg kg -') (mg kg -')
Fluvio-aquic 1985 9.0 0.63 63 5.9 97soil (n=1 1) 1996 11.3 1.23 69 19.0 78Cinnamon 1985 10.5 0.70 70 6.1 90(n=6) 1996 11.6 1.12 IH] 10.1 84Shajiang black 1985 13.4 0.8 68 4.7 122soil (n=7) 1996 11.8 1.14 74 18.0 101Brown earth 1985 8.0 0.59 63 5.9 75(n=9) 1996 12.3 1.20 113 21.4 67
Note: O.M. = organic matter, Alkalytic N = determined by 1.0 M NaOH incubation at
40 'C for 24 h, representing the available N pool, R. available K = readily
available or exchangeable potassium
118

Table 2. Results of surveys on soil nutrient contents in topsoils (0-20cm) of the majorsoil types in Shandong
Soil Year 0. M. Total N Alkalytic N Available P R. available K(g kg') (g kg') (mg kg') (mg kg -') (mg kg-')
Fluvio-aquic 1980-85 9.1 0.62 55 5.9 110soil 1992-97 10.4 0.68 63 12.8 91
Cinnamon 1980-85 10.8 0.72 56 5.9 971992-97 12.4 0.85 86 12.7 89
Shajiang black 1980-85 14.0 0.94 59 4.3 133soil 1992-97 12.5 0.78 78 10.4 104
Brown earth 1980-85 8.1 0.54 56 5.5 681992-97 9.5 0.64 76 14.4 57
Mean 1980-85 10.5 0.71 57 5.4 1021992-97 11.2 0.74 76 12.6 85
Note: The data in the table are mean values.
NPK balance in farmland soils
According to historical material, during the period from 1950's to mid-1970's, thefarmland always suffered from a nutrient deficit, and inputs were almost exclusivelysupplied in the form of organic manure. Since the 1970's, the consumption of mineralfertilizers increased rapidly. In 1976, the supply of N by mineral fertilizer exceeded thatof organic manure. In 1982, fertilizer P had surpassed the amount applied by organicmanure. During this time, supply of both nutrients began to turn from deficit to surplus.Since the 1990's, the input of K fertilizer has been rising rapidly and by the year 2001,the province's total consumption of mineral fertilizers reached 4.286 Mt, accounting for10.1 % of the country's total and averaging 380 kg ha-' (based on a sown area of 11 M hain 2001). This figure was far beyond the country's average and close to four times asmuch as the world's average. The nutrients were applied at a ratio of 1:0.45:0.21 N :
P20 5 : K20 and accounted for 75%, 77.9% and 47.5% of the respective nutrient in thetotal input (mineral fertilizer plus and organic manure).
Our survey conducted in 1996 shows that the total N input reached 3,024,300t, of which1,987,200t, about 65.8%, was in the form of mineral fertilizer, 21.7% in the form oforganic manure and anticipated 8.4% from the biological N2 fixation. The total N outputwas 2,538,949 t, of which 60.3% were removed with crop harvest and 30.4% lost byvarious pathways. The total N input was 1.19 times as much as the total N output, thus
leading to an N surplus of 455,081 t (Table 3).For the past twenty four years, N input always exceeded the N output, which is reflected
by the rising trends in soil N levels. In 1997, the province's total consumption of Nfertilizer reached 2.24 million t or 9.3% of the country's total. Average application at thistime was 248.0 kg N ha-' whereas for the whole country it was 188 kg N ha-. Accordingto local research results, a surplus of 10% in soil N may affect both quality of agricul-tural products and that of the environment. To secure large yields at the current nitrogen
uses efficiency, which varies from crop to crop and cropping system, the high-yielding
119

regions in Northern China, such as Shandong, require relatively large inputs of N.Nevertheless, it is recommended for especially environmental reasons to limit the Napplication to 400 kg N ha-' in a two cereal crops per year rotation and to 500 kg N ha '
to vegetables. Whether these limits are feasible under practical conditions, however,needs more research.
Table 3. Nutrient balance (1000 t) in the farmland of the Shandong Province (1996)(Mt)
Balance Item N P KInput Mineral fertilizers 1,987 378 428
Organic manure 600 97 322Stalks 56 7 102Biological N fixation 254Rain & irrigation 76 0.4 50Seeds 50 9.6 16Subtotal 3,024 492 918
Output Harvest 1,561 280 1,230N loss from fertilizer 751N loss from manure 180Leaching & runoff 47Subtotal 2,539 280 1,230
Balance 485 213 -312
Table 4 shows that crop yield response to N fertilizers was most expressed in flu-vio-aquic soil and similar for the other three soils. This was consistent with the obser-vation that the fluvio-aquic soil contained less nitrogen. The farmland which records anN surplus has reached 19.1%.
Table 4. Balance of soil nutrients and permissible surplus or deficit rate in the majorsoils in Shandong (kg ha-')
Soil N P KFluvio-aquic soil
Actual balance +26 +79 -37Permissible balance range -5 +4 -73
CinnamonActual balance +19 +74 -21Permissible balance range -21 -9 -69
Brown earthActual balance +17 +67 -12Permissible balance range -13 -23 -51
Shajiang black soilActual balance +25 +78 -34Permissible balance range -19 +13 -81
120

The surplus, however, varies drastically from place to place and from crop to crop. In-
vestigations showed that N input to cereals and to cash crops was close to the demand
oriented amount so that farmland under these crops generally had only a little surplus of
N. This did not lead to a substantial increase in nitrate contents in either the ground wateror the harvested crop. On the other hand, there exists a distinct N surplus in vegetable
gardens. As a result, in some vegetable-producing regions, nitrate content in the well
water reached 170 - 250 mg I" , which is regarded as detrimental to the groundwater
quality. This situation aggravated to a serious problem in the meantime, calling for ur-
gent solutions.Farmers in the Shandong Province began to use P fertilizers only in the 1960's. Until this
time and for another 20 years after introduction, P input into farmland has been inade-
quate. P deficiency as a major yield limiting factor was the consequence. However, largescale extension of P use began only after the second soil survey in the 1980's. The in-troduction of P fertilizer application caused significant yield responses of crops grown in
all soils, especially in soils like fluvio-aquic soil and Shajiang black soil, which wereseriously deficient in P. In 1984, certain farmlands already started to show a surplus in
application. By 1996, the surplus had reached 240,100 t and the 1/O ratio of P reached1.76. Table 4 shows that the current P balances for the four main soils in Shandong were
similar. Field experiments indicate that currently the yield response to P fertilizers
ranges between 18% and 27%, which is about 10 - 15% less compared to the 1980's. Itcould be shown that if the yield response to P fertilizers should be in a range of 10% -
25%, a surplus of < 20% in P application is required. In case of yield response should
exceed 25%, a balance of 20% or slightly above is tolerated, depending on the soil P
reserves. Though crops may benefit from the generally long lasting residual effects of P
application, strong P accumulation in the soils can have negative effects on uptake of
other nutrients, e.g. micronutrients like Zn. Furthermore, the economic and ecologicalaspects of continued application of large amounts of P fertilizers need to be taken intoconsideration.The soil K balance in the farmland depended mainly on the K supply through organic
manure and therefore showed a clear undersupply in this nutrient. In 1990, the provinceconsumed a total of 2.455 Mt mineral fertilizers with an NPK ratio of 1:0.35:0.09 whichmeans that only 152,000 tons of K20 were consumed. Since the early 1990's, great ef-
forts have therefore been made to promote the use of K fertilizers in the province. K
consumption took off, especially in the brown earth regions with good K response. As a
result, the K deficient area declined and by 1996 the area of K deficient soils had de-
clined to 25%. Today, the extent of K deficiency varies from soil to soil and is smaller inbrown earths and larger in fluvio-aquic soils and Shajiang black soils. A large proportion
of the K consumption is used in vegetables & melons and fruit trees in recent years. This
means that cereals usually do not receive adequate amounts so that the K deficit in soils
of cereal fields persists. The results of the current field experiments with cereals showyield responses of 8 - 15% to K application in fluvio-aquic soils, cinnamon and Shajiang
black soils. These soils were formerly categorized as adequate in soil K. There is evi-dence that these soils are in the process of changing from K adequacy to K deficiency. In
121

brown earths, cereal yield responses to K application have generally reached more than20%. Based on the principle of conserving soil fertility and under the present productionconditions, the province need to increase the K consumption by another 311,800 t tokeep the soil K supply in balance with the demand.
Forecast of Shandong's demand for fertilizers for agricultural production in thefuture
In the next 10 years with the current growth of population and development of theeconomy, the demand for agricultural products will increase and so will the require-ments for product quality. According to the province's development plan for agriculture,on the premise of maintaining the current dynamic balance of the farmland, by 2010, thecereal output will have to be increased from the present 43.20 Mt up to 53.20 Mt. Thevegetable & melon output need to be raised from 62 Mt to over 70 Mt, the fruit outputfrom 8.0 Mt to 10.0 Mt and the output of other cash crops by a fairly large degree. Tomeet the targets of the plan, it is essential to readjust farmland input and to raise the levelof scientifically based fertilization.The course of reaching the planned target of increasing the cereal output by 10.0 Mt canbe divided into two phases. Phase I is to increase grain yield by readjusting the ratio ofsoil nutrient input and correcting the soil K deficit. At present, the farmland of the wholeprovince has a deficit of 311,800 t K. Field experiments showed that each kilogram of Kcan increase the yield by 8.34 kg. Thus increasing the K input by 311,800 t can lead to anadditional grain output of 2.60 Mt.Phase I1 is to achieve the remaining part of the increment in grain output by increasingthe NPK input. To produce 7.40 Mt of cereals, the crops need to absorb 181,300 t of N,34,400 t of P and 142,700 t of K. To produce an additional 10.0 Mt of vegetables andmelons, the crops need additional 0.06 Mt of N, 8,800 t of P and 66,600 t of K. And toraise the fruit output by 2.0 Mt, the fruit trees need additional 662,900 t of N, 13,700 t ofP and 68,700 t of K. The increment in the NPK consumption needed to raise the outputof other crops will come from the cut of NPK use in those crops of which the area undercultivation decreases as a result of readjustment of the crop cultivation structure. At thesame time, it is also under consideration that within the next 10 years, the savings infertilizers due to improved fertilization technology can be used to balance the incre-mental fertilizer needs. To sum up, the additional amounts will be 304,200 t N, 60,400 tP and 589,800 t K (equal to 138,300 t P20 5 and 707,800 t K20).If the current ratio between nutrients from mineral fertilizers and those from organicmanure will be sustained, in 2010 the province will have an additional demand for228,200 t N fertilizers, 107,700 t P fertilizers and 336,200 t K fertilizers or 672,100 taltogether. Considering the current surplus of soil P, it is not advised to further increase Pinput. The needed incremental production by crops due to P can be obtained by read-justing the ratio of fertilization and by raising the fertilizer recovery rate. In this case, in2010, the province will consume 4.43 million t of mineral fertilizers, accounting for8.7% of the country's planned total of 50.0 million t. Its N:P 205 :K20 ratio should be
122

1:0.41:0.32. This means that in the next 10 years, the fertilizer consumption will in-crease by 0.05- 0.06 million t every year, which is about 0.1 million t less than the ob-served annual increment during the past 10 years.
Strategy for fertilizers management in the future
The increase of nutrient recovery rate from fertilizers and the increase in economicbenefit from fertilization by applying fertilizers in a scientific way is an important partof a sustainable agriculture. Based on the current situation of Shandong, the work in thefollowing aspects should be accomplished for future fertilization management:1) Readjust the ratio of mineral fertilizer nutrients input. Currently the ratio of fertilizer
input is 1:0.45:0.21 (N:P20 5 :K20). According to the prediction, the total fertilizerconsumption in 2010 will range between 4.40 -4.50 million t with a proper ratio of1:0.41:0.32. Therefore, in the coming years, the input of mineral fertilizers ought tofollow the principle of slightly increasing N, maintaining P and increasing K inputs.The fertilizer application rate to vegetables has to be reasonably reduced while therate in low-yielding cereal fields has to be increased.
2) Establish a consumer-demand-oriented production system and a service-orienteddistribution system. For that purpose, it is essential to set up consumer markets,produce adequate quantity of demanded products and make stocking plans. Sales ofmineral fertilizers should also be based on providing farmers with technical serviceand supplying mineral fertilizers combined with guiding farmers to scientificallybased fertilization. The production of blended fertilizers should be standardized andthe scope of their application expanded. Now the province has more than 300 fer-tilizer blending plants with a total designed capacity of over 6.0 million t. But theiractual output is less than 3.0 million t, far from the actual demand of 6.0-7.0 milliont. The extension of fertilizer blending techniques should be promoted and the plantsreasonably designed and located so as to reduce unnecessary transport. The pro-ducers of fertilizers must comply to strict quality criteria, optimize formulas andimprove technology. Each plant should build up its own consistent service unit, notonly supplying farmers with blended fertilizers, but also helping farmers to analyzesoil samples and to set up fertilization records and files. Furthermore, providingtechnical consultation service and even apply fertilizers for farmers could be part ofthe agro-technical service centers.
3) Increase and improve types of mineral fertilizer. For long, the province used only afew, mainly single nutrient, straight fertilizers with often low nutrient contents. Theiraverage nutrient content was only 29.1%. Urea and ammonium bicarbonate were thedominant N fertilizers, among which the latter accounted for 49% of the N supply.Calcium phosphate and calcium magnesium phosphate amounted to approx. 50% ofthe P fertilizers. From now on, it is a priority to raise the proportion of highly con-centrated compound fertilizers. Then, while efforts are made to change ammoniumbicarbonate production lines into urea plants, the production of improved ammo-nium bicarbonate should be promoted to increase the use efficiency of this N source
123
in the meantime. Moreover, it is necessary to develop a series of granular N and Pfertilizers and stimulate the development of BB manure. In addition, research andproduction of controlled-release fertilizers, instantly soluble fertilizers, liquid fer-tilizers, microbial additives and commodity organic manure should be promoted.
4) Make full use of crop residues (straw and stalk) as a source of nutrients. Every year,the province produces 63.0 million t of crop residues of which about 20% (13.0million t) are not utilized. The technology of returning crop residues to the fieldthrough machines during harvesting, through digestion by animal and throughfast-composting processes ought to be widely extended. At the same time, effortshave to be made to tap other sources of organic manure. Investigations revealed thatin the province, one hectare of farmland could have 52.5t of fresh organic manure, ofwhich only 75% is utilized at the moment.
5) Intensify research and extension of scientific fertilization techniques. This is astrategic measure to raise the economic benefit of fertilization. For that purpose, acomplete and sound extension system has to be set up and through the system thetechnology of balanced fertilization has to be widely popularized by means oftraining, publicizing, conducting demonstration experiments, etc. Currently, em-phasis should be laid on intensifying the use of K fertilizers, micronutrient fertilizers,blended and compound fertilizers, fertilization in protected cultivation, deepplacement of mineral fertilizers and returning crop residues to the field. Then a fer-tilizer testing network and an information system should be established or restored tointensify the study on fertilization techniques and enhance the practical implemen-tation. The focus of the study should be on cumulative recovery rate of fertilizers inhigh-yielding rotation systems and scientific fertilizer application methods, rela-tionship between fertilization and the environment, preparation of new types offertilizers and breeding of new crop varieties with improved or genetically modifiednutrient features.
124

Farmland nutrient balances and prediction of the mineralfertilizer requirement for the 21" century in Henan
Jiao You Li Guibao', Duan Guangyin 2, Qiao Wenxue3
Soil & Fertilizers Institute, Henan Academy of Agricultural Sciences 450002Soil & Fertilizer Station, Lankao Agricultural BureauAgricultural Station, Shuitun Township, Runan County
Abstract
Nutrient balance studies of 65 households in 3 counties of the Henan Province were carriedout. The investigation revealed that there is a surplus application of the nutrients N and Pwhereas K is under-supplied. The rate at which K farmers of the studied counties returned Kto replace removals was in the order of Runan > Lankao > Mengzhou. Of the total nitrogenfertilizer input, straight nitrogen fertilizer accounts for about 50%, mainly in form of ammo-nium bicarbonate. Among the phosphate fertilizers, SSP is the major type used with only alittle calcium magnesium phosphate included in compound fertilizers. K from straight potas-sium fertilizer accounts for less than 50% of total K input and makes up only 20.3% inLankao. In this county N inputs were almost in balance with the output. The same was ob-served for P in Mengzhou and for K in Runan. There was a dramatic K deficit in Lankao andMengzhou. At the provincial level, all the nutrients, including N, P and K were not compen-sating for the losses from the soil by harvest. The current use of mineral nutrients (2001) is1.977 Mt of N, 547,000 t of P20 5 and 403,000 t of K20. For sustained productivity of itsfarmland, by 2020, Henan farmland requires N at the amount of 2.07 million tons, P at510,000 tons of P20 5 and K at 680,000 tons of K20 from mineral sources to cover the demandfor an increased food production. The amounts were calculated based on the observation that30% of the N requirement will be supplied by organic sources (residues, farmyard manure,etc.) and the application ratio in this material is I : 0.6 : 1.5 and the efficiency including re-sidual effects of the mineral fertilizers is 60%, 70% and 100% for N, P and K, respectively.
Introduction
Henan is located in the central part of China. The total area is 16.7 M ha, equal to 1.74% ofthe national area. By the end of 2001, the population was 96.03 million, ranking first andcomprising 7.71% of the national population. Being situated in north subtropical and temper-ate zones, Henan agricultural production benefits greatly from sufficient radiation, tempera-ture and water resources. With the increase of yield per ha and the multiple crop index, thenutrient input to farmland became insufficient, thus nutrient input/output are not balanced.Therefore, it is necessary to investigate the nutrient balance status and to predict the futuremineral fertilizer requirement in Henan.
Materials and methods
Three counties, each representing a typical agricultural production area, were chosen in He-nan. Mengzhou in the North-West (low hill), Lankao in the eastern plain and Runan in south-ern depression. Two representative townships from each county, two production groups fromeach township and four to five rural households from each production group were chosen. A
125

representative soil sample, weighing about 500g, was collected from the farmland of eachhousehold. Three to five irrigation water samples from each county were collected and weretested for N0 3-N at the site with an indictor paper. The nutrient balance for the householdswere calculated with the obtained results. The nutrient balances for the county and provinciallevels were gained from statistics. The results shown in the tables were calculated on areasown per crop and on average weight. Animal excrements were considered in the manure ap-plication.Lankao is located in North-East Henan. The mean annual precipitation is 678 mm and themean temperature is 140 C. Three former branches of the Yellow River crossed the territory,thus fluvio-aquic soil is the major soil type derived from alluvial deposit. Agricultural devel-opment has always been severely limited by wind, sand, salinity and alkalinity. It is one of thepoorest counties in Henan. Total population in 1997 was 734 thousand, including the agricul-tural population of 615 thousand. The cultivated area is 60.3 thousand hectares. Major rota-tions are wheat-maize and wheat-oilseeds. The most commonly used fertilizers are urea, am-monium bicarbonate and single super-phosphate. In recent years potassium chloride has alsobeen used in small quantities.Mengzhou is located in northwest Henan with a mean annual precipitation of 550 mm and amean annual temperature of 15* C. Total population in 1997 was 330 thousand, including theagricultural population of 235 thousand. Its cultivated area is 23.3 thousand hectares. Wheat-maize/cotton is the major rotation. The main soil types used for cultivation are cinnamon soilderived from loess and fluvio-aquic soil derived from alluvial deposit. Ammonium bicarbon-ate and single super-phosphate are popular fertilizers in Mengzhou. A small amount of potashis used in the fields since the end of the 1980's.Runan is located in southern Henan. The mean annual precipitation is 876mm and the meantemperature is 14.9' C. Total population in 1997 was 808 thousand, including the agriculturalpopulation of 734 thousand. The cultivated area is 100 thousand hectares. Wheat-maize/oil-seeds is the major rotation. This area is dominated by Shajiang black soil derived from sedi-ments of old rivers or lakes. Owing to extensive cultivation, drought problem over the recent10 years and rainfall not synchronized with crop growth, crop yield is low and unstable.
Result and discussion
Nutrient input : output for household fields
In total, 21 households were surveyed in Lankao. Of them, 10 were from Mengzai Townshipwith an cultivated area of 4.19 ha, mainly situated on light loam or loamy soils. I I householdswere from Yifeng with a cultivated area of 9.35 ha mainly located on loamy or clayey soil.Soil analysis revealed I) N and P inputs largely exceed their output, especially P, whereas Kwas insufficiently supplied with a return rate of only 59.8% of the removed amount (Table 1).3) Urea and ammonium bicarbonate are common nitrogen fertilizers and the rest in form ofcompound fertilizer which greatly increased recently (data of 2001) to 887,000 t of nutrients.The calculated nutrient input ratio (excluding compounds) of N: P20 5: K20 was 1:0.48:0.19,whilst the ratio of removal by crops was 1:0.30:0.52. It is clear that the amount of K inputcannot guarantee an adequate replacement.20 households were surveyed for the nutrient balance in Mengzhou. Of them, 10 were fromZhaohuo township with a cultivated area of 9.68 ha, consisting mainly of cinnamon soils. Theother 10 households were from Xiguo with a cultivated area of 5.65 ha on mainly fluvio-aquicsoils. As shown in Table 1, there was a certain surplus of N whereas P inputs nearly met thecrop requirement based on a 70% recovery efficiency (including its after-effect).
126

1-~OCen 0<0-~ ~ ~6 NenoCvy t-~ ~~CoO-cC)
t'ir--'nr-- 0 . cCt04- nON -04o Or-- tCr-j ---- r'J ~C ON(N~t04 04 - \OCN C
-o 0 ± a
000 0'0 trCOr-t--O- 4-en-tenr'Ir-It--- ~tJNC 4-~0oOr-4'~C t-0en'~'.0.t- t- &
'.0 04 en 0' 't One' -(N - - ~ + 0
C-0C(NONON'0~ N-OOOC'4 r-'C
'.0 (N '~ -(N ~O -,-cC)
to C-24 0 (NtCctON en~tn t ~O ~
OONtcO04 - en 'o
(NO. (N - 0 IC.
0 ,, .. C-t
ON NON -b ON(N C)- c ~(N 0ON0N00000C) (N&Nefl..\0 -CcrCO'--C Ct-*E ~z C 0-ON t- en Oen~N - C)-o CC) C,
20 O~OON~~ ~ ,~ mO a
- r-'a o, 0<0 en_ (N(NCO _ 6 Ct0 ONd No *o 0-c - -CC) C)-t
C) C0 *tOfl.tCc (N04qC ONO Lfle' ~
OQ 0ON"tt '0-'0 cnn Or- C)~"4 06 a\C
o ... a - -'~ _ +~ .0
-d- 0
C) ~C)
ON 004CC 0'CN'0 04CNt- On NC) C, (N tt~O0 000 ONCO 00- _
CC r-- en (N en~n O'~~Cc C~- .42 (N - t- - - en ± C
C)C C-
C)o C)0 CCCCC
.0 C-N 0
C)- 0C) _ ~Cno C) 0 _2 *.C 00* 0 -o _
cn~0 ±22 0C. ~C)C)~ ~.2 ~ -.
CCC ~ ~ ~ toco ~ C)C)C) S.C)r~S~ z coo> ~ ~0 0
CCI- ~ C)C) 't~2 5
C) 0 C- ~- C- -C) o~~t £
.2 H 0 HZ m~ oz
127

On the other hand, K input : output ratio is extremely unbalanced with the K supplied,covering only less than 50% of the crop requirement. Taking into account that ammoniumbicarbonate with 58% is the major nitrogen source, N losses may be large so that the balancefor nitrogen is less positive than calculated above.24 households were chosen for the nutrient investigation in Runan. Of them, 15 are fromShuitun township with a cultivated area of 6.02 ha. The other 9 households were fromHanzhuang with a cultivated area of 4.76 ha. Shajiang black soil is the major soil type in thiscounty plus some yellow cinnamon soil. In this county, N and P show an obvious surpluscompared with the other two counties mentioned above, due to nitrophosphate as commonfertilizer used by these households (Table I). About double of the removed amount wasreturned by mineral fertilizer, leading to a P return rate of 222%.. K inputs were smaller thanthe outputs, however, to a lesser extent than in the two counties. It is therefore recommendedthat the use of N and P ferilizer should be decreased and that the K input should be increasedaccordingly. For such an adjustment, compound fertilizer with low P and high K could beintroduced for the future. In order to save costs, indigenous soil nutrients should be activatedthrough appropriate tillage and cultural practices, considering the high nutrient supply poten-tial of the Shajiang black soil.
County-wide nutrient balance for Lankao, Mengzhou and Runan.
The county-wide nutrient balances were calculated based on the cropping pattern, respectiveyields and nutrient uptake by the crops and compared with the input by mineral fertilizer andorganic manure. The total figures were then divided by the area that each crop occupies in thecounty to calculate the average figures per hectare (Table 2).
Table 2. Average nutrient balance on farmland of the three surveyed counties based on sta-tistical data in 1997
County Lankao Mengzhou RunanN P2O K,0 N P2O K20 N P205 K20
(kg ha-') (kg ha-') (kg ha -')
Input M.F 118 81 22 207 65 42 158 76 37O.M.b) 45 29 57 35 24 42 52 33 72Total 163 110 79 242 89 84 210 109 110
OutputCereals 93 31 93 161 69 160 82 35 82Cotton 27 41 27 5 2 4 4 1 3Oilseeds 35 4 11 21 5 14 37 9 24Vegetables - - - 5 3 7 4 2 4Total 155 76 131 192 79 185 127 47 113
Balance 8 34 -52 50 10 -101 83 62 -3
Note: a) M.F. - Mineral fertilizer N utilization rate of 60% (including after-effect); P utilizationrate of 70% (Including after-effect); b) OM. = Organic manure: N utilization rate 60% (includingafter-effect).
Lankao: The comparison between inputs and outputs reveal that supply and removal are inbalance for N with a slight surplus of N and P. However, these amounts can only be regardedas surplus under the assumption of the respective nutrient utilization rates. Based on the cal-
128

culations outputs exceed the inputs of K by 52 kg ha1 of K20 which means that on average ofthe county this amount is lost from the soil K reserves every year.Mengzhou: Mengzhou is one of the counties in Henan characterized by high crop yield due tointensive cultivation. The calculated nutrient balance shows a positive balance for N and Pand a negative balance at an annual rate of-101 kg K,O ha-' for potassium. With this kind ofinsufficient replacement of removed K, soils in the medium to long-term will be depleted ofpotassium.Runan: Crops production due to less favourable conditions in Runan is difficult and relatedproduction problems receive high priority by the provincial government. At the time of thesurvey, the county had a positive balance for N and P whereas K with application rates of 110kg was rather balanced. The surplus application of N and P is related to the widespreadfertilisation practice of using nitro-phosphate as common mineral fertilizer in this county.
Changes in nutrient balances for the whole Henan Province
To monitor the trends in soil fertility and as a decision tool for the fertilizer supply applicationin order to enhance their economic efficiency, nutrient balances should be periodically as-sessed. Using available statistical data, nutrient inputs and outputs for the whole Henan Prov-ince were calculated for three different periods (Table 3).From 1980 to 1997. with the increase in yields and the raise in the multiple crop index, thedemand for N, P and K increased accordingly. Although the nutrient input was also increased,no nutrient balance was achieved due to an inefficient fertilizer input system. Assuming anutrient utilization efficiency for N of 60% in 1980, only 80% of the N removed by the cropswas replaced by nutrients from organic and mineral sources. In the two periods of the 1990'sthough N inputs were increased, there was no substantial oversupply (7% in 1992 and 11% in1997) of nitrogen. This is different for P which was insufficiently supplied in 1980 and cov-ered only approx. 74% of the amount removed. In the 1990's, this P deficit in the balance haschanged to a surplus supply of 60% in 1992 and about 50% in 1997. These amounts of P werebadly needed to compensate for the P depletion of the soils that took place in the 1980's. Inthe meantime soils have, however, been charged with P and application rates can be reduced.This is different for K, where until today removals greatly exceed the inputs, showing thatonly between 51% in 1992 and approx. 60% in 1997 of the removed amounts are returned tothe fields. With annual K undersupply of 584,000 tons, Henan soils would loose more than 10Mt of K20 until 2020. Since this cannot sustain the needed high crop production, the provincehas implemented a "K supplementation project". With regard to the requirement of the crops,the N:P205:K20 with 1: 0.41-0.42: 0.94-0.98 is almost constant. The small deviation is due tothe annual changes of sown areas allocated to various crops. Field experiments carried outover several years showed that N fertilizer had the strongest effect on crop yields.
Estimation to the requirement of mineral fertilizers in Henan
Population growth is the key, driving force for the nutrient consumption in the 21 " century tosupply the growing food demand. It is estimated that the population of Henan will reach itspeak of 108.73 million in 2020, from 96.03 million in 2001. In order to maintain the level offood supply from the main crops grown in Henan, food agricultural production has to matchthe rate of population growth (Table 4). By means of extrapolation from the current yield lev-els and the respective nutrients needed to supply the requirements to produce these yields, thefuture nutrient has been anticipated. In 1997, 80%, 78% and 42% of the total N, P205 and K20input to farmland was supplied by mineral fertilizers, respectively. By including nutrientsfrom recycled crop residues and farmyard manure, etc., it is estimated that the nitrogen com-ing from mineral fertilizer will around 70% of the total demand in the future. The rest needs
129
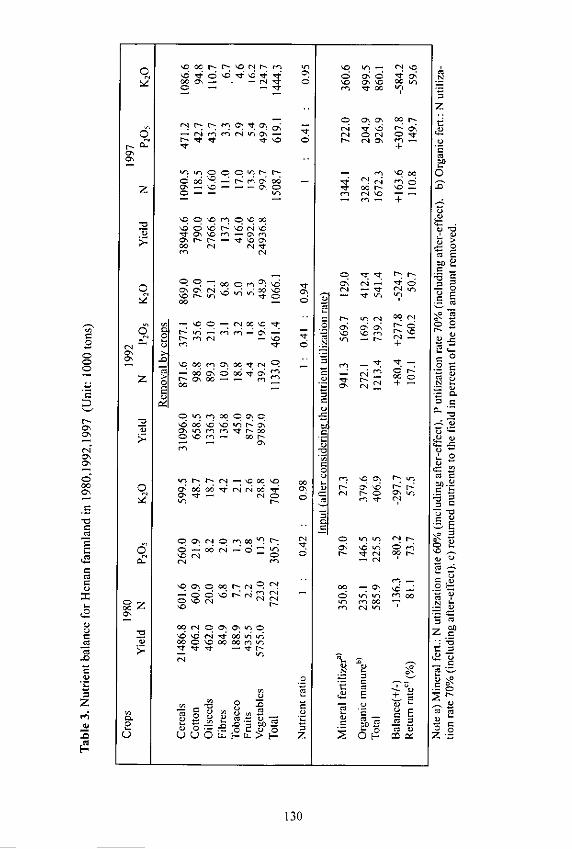
a ~CCCNr-'ttlr-en ro '0 ~-'646'64'b 44 ~ 6o<6~o N~ . ~C4 0 'a ON't O0Ls;
-~ en *t00 fl =
zOCr
Clt~.eflONtC>oR ~ d4~r-oN 0)o -C4enenC-rnON- . Cl Cr1 0-i-
t'.C 0 r- cla~ en- ~I-~.c~ .t +ONON ..
~N ~N 000 VOItI> '000 0- ma
en rio --- en- ±
C.)'.000en0'toO
- '00'.CN'0t4't cutONOen-C'en L.~ ~
0C 't't NN
a 00t000rn ON Cl- 'tOC-I~ ~ 6
'C 0 - Cl 000 t 0~ 0 ~ . 0 r.. 0 00- 'C 'ten C--'0 C-
rnr1a 't ~ ~ + .C
0 .- 0
ocenor - 2 en .- ~ ~C) N CCC 000)~.. ON Cl 2~ .~'-
~0)0
I 0
I- OvNenCC0oNc -~
ON ON ~N en en 'tr- 00 0 00 0 a 'ro'n~0 htC'JCON. 0)S 6~o~ri46tn a; ~6.A
C-i en -Cl 0)0)C
C)0) 'CON0OCNCl~.~N ON en- 000 ~c~< .2~Z
- a AA enCC ~ yC C'CCI ~.. ro enCo -~ N0Ct~ '0 en C1V~ *- 0
0) CCCICONONCflO0o ~ 'd'6d4o~~5 Zo
0) 000'tCoOCrnvo~ z"~ -~
CO N C..0) C
.- -- C00 <%~ --- 000 ~ E ~
Z ~ S ~ ~.2 ~'-'-0
Cr'- 00,00 0)~ ~ ~ C0~ ~ -~B ~ Th - -~t~ U QUOi?-u>H- z 2 ~&
ci
130
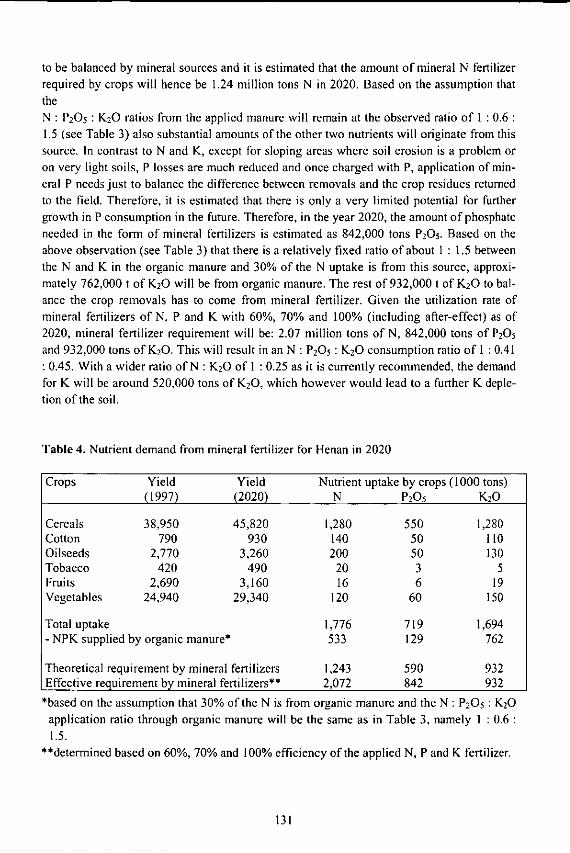
to be balanced by mineral sources and it is estimated that the amount of mineral N fertilizerrequired by crops will hence be 1.24 million tons N in 2020. Based on the assumption thattheN : P20 5 : K20 ratios from the applied manure will remain at the observed ratio of I : 0.61.5 (see Table 3) also substantial amounts of the other two nutrients will originate from thissource. In contrast to N and K, except for sloping areas where soil erosion is a problem oron very light soils, P losses are much reduced and once charged with P, application of min-eral P needs just to balance the difference between removals and the crop residues returnedto the field. Therefore, it is estimated that there is only a very limited potential for furthergrowth in P consumption in the future. Therefore, in the year 2020, the amount of phosphateneeded in the form of mineral fertilizers is estimated as 842,000 tons P20 5. Based on theabove observation (see Table 3) that there is a relatively fixed ratio of about I : 1.5 betweenthe N and K in the organic manure and 30% of the N uptake is from this source, approxi-mately 762,000 t of K20 will be from organic manure. The rest of 932,000 t of K20 to bal-ance the crop removals has to come from mineral fertilizer. Given the utilization rate ofmineral fertilizers of N, P and K with 60%, 70% and 100% (including after-effect) as of2020, mineral fertilizer requirement will be: 2.07 million tons of N, 842,000 tons of P20 5
and 932,000 tons of K20. This will result in an N : P205 : K20 consumption ratio of 1 : 0.41: 0.45. With a wider ratio of N : K20 of I : 0.25 as it is currently recommended, the demandfor K will be around 520,000 tons of K20, which however would lead to a further K deple-tion of the soil.
Table 4. Nutrient demand from mineral fertilizer for Henan in 2020
Crops Yield Yield Nutrient uptake by crops (1000 tons)(1997) (2020) N P20 5 K20
Cereals 38,950 45,820 1,280 550 1,280Cotton 790 930 140 50 110Oilseeds 2,770 3,260 200 50 130Tobacco 420 490 20 3 5Fruits 2,690 3,160 16 6 19Vegetables 24,940 29,340 120 60 150
Total uptake 1,776 719 1,694- NPK supplied by organic manure* 533 129 762
Theoretical requirement by mineral fertilizers 1,243 590 932Effective requirement by mineral fertilizers** 2,072 842 932
*based on the assumption that 30% of the N is from organic manure and the N : P20 5 : K20application ratio through organic manure will be the same as in Table 3, namely 1 : 0.61.5.
"determined based on 60%, 70% and 100% efficiency of the applied N, P and K fertilizer.
131

Conclusions
The nutrient balance study in cropping systems of 65 households in 3 counties, applicationof mineral N exceeded the removal through the crops by between 13% and 50% in the orderof Runan > Lankao>Mengzhou. At the time of the study most of the N (>50%) was appliedin the straight form, mainly as ammonium bicarbonate. In case of phosphorus, the amountapplied on average exceeded the removal through the crops by 50% and 120% in the orderMengzhou < Lankao < Runan. Among the phosphate fertilizers, single super-phosphate isthe major type with only a little calcium magnesium phosphate included in compound fertil-izers. The K balances of the studied households revealed that between 48% (in Mengzhou)and 89% (in Runan) of the amounts of K removed were returned to the field by mineral andorganic sources. This indicates a continued depletion of the soil K pools.The nutrient balance of farmland at the provincial level reveals that in 1980 all the consid-ered nutrients were insufficiently supplied, causing negative balances of N, P and K. Thischanged in 1992 and 1997 when slight surplus application of N and a stronger surplus of Poccurred. This latter was probably due to the strong P depletion of the soils in the years until1990 and to the requirement of recharging the soils with P. With a continued undersupply ofK, Henan soils are facing a strong depletion of their K pools. For a sustained productivity ofthe soils, the removals must be balanced and the recommendation for the future nutrientconsumption in Henan has to be adjusted accordingly. It will mean that N and P fertilizersshould only have a moderate growth whereas for K a strong growth in consumption is rec-ommended to reach crop production goals and to meet the future food demands of the prov-ince.
132

Nutrient cycle and nutrient balances in farmland ecosystemsof the Shaanxi Province
Yang Xueyun, Zhang Shulan, Wang Xifang, Tong Yan'an, Sun Benhua and ZhaoHubing
Shaanxi Province Soil and Fertilizers Institute 712100
Abstract
Results of studies on nutrient cycles and balances in farmland of the Shaanxi Provinceindicate that in 1977 all three nutrients, N, P, K, were deficient but N and P developedto a slight surplus at the end of the 1980's. The surplus of these two nutrients furtherincreased until 1997, while K remained deficient. In 1997, the N:P 20 5:K20 ratio offertilizer consumption with 1:0.26:0.08 was significantly wider compared to that in thedeveloped countries of 1:0.42:0.42. It is estimated that the province's demand for fer-tilizers for its farmland in 2007 - 2012 will be 0.87 Mt N, 0.365 Mt P205 and 0.174 MtK20 with a ratio of 1:0.40 - 0.42:0.15 - 0.20.
Introduction
A farmland ecosystem is very susceptible to the influence of anthropogenic factors,affecting the nutrient cycle and its balance. Therefore, a study of the current nutrientcycle of various farmland ecosystems can serve as a basis for issuing new regulationsto improve the nutrient supply to crops towards a more sustainable agriculture.So far, nothing has been reported about the nutrient cycle and balance of the farmlandecosystem of the Shaanxi Province. Based on field studies of typical cropping systemsselected at representative sites in the province and the agricultural statistics of differenttime periods, the nutrient cycle and balance of the farmland at different scales of the
province were assessed.
Natural conditions
Placed in the middle reaches of the Huanghe River, the Shaanxi Province strides overthree climatic zones, i.e. the northern subtropics, the warm temperate and the temper-
ate climate. Furthermore, Shaanxi has three distinct moisture zones, i.e. a humid, asemi-humid and a semi-arid zone. The Beishan Mountain and the Qinling Mountainranges split the pi ovince into three natural regions, i.e. the Loess Plateau in the north,the Guanzhong Basin in the center and the Qinba mountain region, each having itsown distinct features. For this research project, three counties (cities), Yan'an, Fufengand Hanzhong were selected to represent the three typical agro-ecological zones of the
133

province. Yan'an in the north of the province is characterized by the lowest mean tem-perature and the smallest amount of annual rainfall (Table I). Only one crop per yearcan be cultivated in this region. Towards the center of Shaanxi, in Fufeng the annualtemperatures and rainfall are sufficient for 2 crops-per-year rotation systems mainlybased on either wheat-maize or oilseed rape-maize. In Hangzhong in the south, rainfalland temperature are adequate to grow rice based cropping systems of wheat-rice oroilseed rape-rice.
Table 1. Natural conditions in the typical agro-ecological regions of Shaanxi
Region Yan'an, north Fufeng, central Hanzhong, south
Climatic zone Mid-temperate, Warm temperate, North subtropics,semi-arid semi-humid humid
Cropping system Maize, upland cereals Wheat (rapc)-maize Rice-wheat (rape)(one crop a year) (two crops a year) (two crops a year)
Annual mean temp. 9.0 13.0-15.0 14.3>0°C cumulative temp. 3000-3500 >4000 >4500Annual precipitation 400450 mm 545-700 mm 800-1200 mmLandform Hills-gully residual Fluvial terraces, Basin
plateau loess plateauSoil type Huangmiantu Loutu Yellow cinnamonParent material Loess Loess Alluvium
Basic status of soil nutrients
The soil analysis of the plough layer (0-20 cm) in the surveyed farmland indicates sig-nificant differences between the three counties in respect to their soil nutrient status.The soil properties show distinct regional difference, with most parameters increasingfrom north to south (Table 2).
Table 2. Soil nutrients in the investigated regions
Item Yan'an, north Fufeng, central Hanzhong, south
Organic matter (g kg-) 7.10 11.40 17.50Total N (g kg-') 0.61 0.80 1.38Total P (g kg- 0.62 0.79 1.42Total K (g kg"t ) 23.00 23.00 22.40Available N (mg kg-') 43.00 57.00 96.00Available P (mg kg') 4.70 8.80 9.80Available K (mg kg']) 118.00 179.00 106.90pH 8.50 8.20 6.50
134
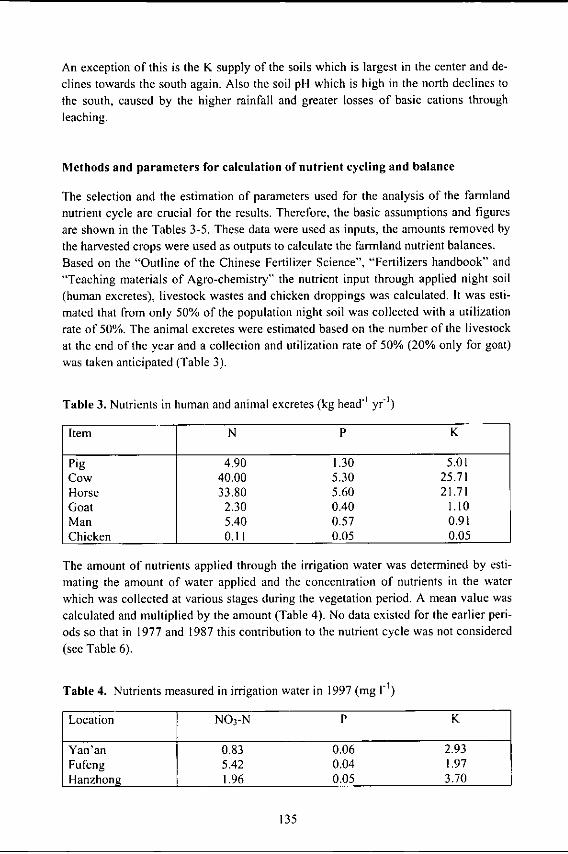
An exception of this is the K supply of the soils which is largest in the center and de-
clines towards the south again. Also the soil pH which is high in the north declines to
the south, caused by the higher rainfall and greater losses of basic cations through
leaching.
Methods and parameters for calculation of nutrient cycling and balance
The selection and the estimation of parameters used for the analysis of the farmlandnutrient cycle are crucial for the results. Therefore, the basic assumptions and figures
are shown in the Tables 3-5. These data were used as inputs, the amounts removed by
the harvested crops were used as outputs to calculate the farmland nutrient balances.Based on the "Outline of the Chinese Fertilizer Science", "Fertilizers handbook" and
"Teaching materials of Agro-chemistry" the nutrient input through applied night soil(human excretes), livestock wastes and chicken droppings was calculated. It was esti-
mated that from only 50% of the population night soil was collected with a utilization
rate of 50%. The animal excretes were estimated based on the number of the livestock
at the end of the year and a collection and utilization rate of 50% (20% only for goat)
was taken anticipated (Table 3).
Table 3. Nutrients in human and animal excretes (kg head " yr')
Item N P K
Pig 4.90 1.30 5.01Cow 40.00 5.30 25.71Horse 33.80 5.60 21.71Goat 2.30 0.40 1.10Man 5.40 0.57 0.91Chicken 0.11 0.05 0.05
The amount of nutrients applied through the irrigation water was determined by esti-mating the amount of water applied and the concentration of nutrients in the water
which was collected at various stages during the vegetation period. A mean value was
calculated and multiplied by the amount (Table 4). No data existed for the earlier peri-
ods so that in 1977 and 1987 this contribution to the nutrient cycle was not considered
(see Table 6).
Table 4. Nutrients measured in irrigation water in 1997 (mg -1)
Location N0 3-N P K
Yan'an 0.83 0.06 2.93Fufeng 5.42 0.04 1,97Hanzhong 1.96 0.05 3.70
135

Nutrient removal by the crop was calculated using the nutrient concentrations of thevarious plant parts at harvest and the weight of the biomass produced at this stage (Ta-ble 5).
Table 5. Nutrient removal at harvest (kg t-' harvested crop)
Crop N P20 5 K20 Crop N P20 5 K20
Wheat 25.0 5.0 17.0 Hemp 79.6 10.0 40.8Maize 22.0 4.0 18.0 Sweet potato 4.8 0.8 7.1Soybean 28.0* 6.0 28.0 Tomato 2.8 0.6 3.2Millet 17.0 5.0 38.0 Cabbage 5.3 0.5 5.7Rice 20.0 4.0 18.0 Carrot 4.2 0.8 5.6Oilseed rape 60.0 9.0 38.0 Cucumber 1.8 0.5 2.5Peanut 24.0* 5.0 26.0 Vegetables 3.9 0.7 5.1
(mean)*The amount of symbiotically fixed N2 deducted.
The amount of nutrients recycled to the field in form of crop stalks and straw was nottaken into account since based on the current practice by farmers only a very smallproportion of this material is returned to the field. The amount of symbiotically fixednitrogen by leguminous crops was deducted from the amount of N removed in the har-vested crop and hence not added as additional input. Non-symbiotically fixed N2 and Nin irrigation water was neglected. The N loss from mineral fertilizers was set as 40%whereas it was assumed that losses of P and K are negligible in the studied areas. Thenutrient input by mineral fertilizer was taken from the statistical yearbooks. The nutri-ents deriving from compound fertilizers were calculated on the basis of an N:P2Os:K 20ratio of 2:3:1 in the formula and then added to the N, P and K consumption figures.
Results and discussion
Farmland nutrient balance in the province
The farmland nutrient balance for the whole province of the years 1977, 1987 and1997, using data from the statistical yearbooks, have been calculated. It is evident thatfrom the 1970's to the 1990's, the Shaanxi Province experienced three completely dif-ferent phases in N, P and K balance (Table 6). The three major nutrients were all defi-cient at the end of the 1970's. During the next phase, at the end of the 1980's, the nu-trients were balanced with a slight surplus in N and P and a deficit of K of approxi-mately 30 kg K20 ha-'. The surplus in N and P further increased to reach 90 kg N ha-1and 15 kg P20 5 ha-1 in 1997. At this time, the input of nitrogen by organic manure ac-counted for 17.4% of the total input, which was much less than in 1977 and 1987, dueto the larger amounts of mineral N supplied. The absolute amount of N appliedthrough organic manure even slightly increased from 1977 to 1997. In the case of
136

phosphorus, the proportion of P from organic manure declined to 22.5% in 1997 whichis also due to the increased use of mineral P fertilizer. With regard to K, there was alsoa decline in the proportion of organic manure contributing to the K supply due to in-creased mineral K application. However, in 1997 still 63% of the K applied to farm-land was coming from organic manure.
Table 6. Farmland nutrient balance in the Shaanxi Province (1000 t yr-)
Item 1977 1987 1997N P20 5 K20 N P205 K20 N P205 K20
InputMineral fertilizers 127.6 6.1 5.2 345.0 33.3 12.3 703.2 79.6 47.8Organic 107.6 16.9 58.8 117.9 17.8 61.7 148.2 23.1 80.3manureSeeds 5.6 0.9 1.5 5.9 1.0 1.6 5.8 0.9 1.6Irrigation water .. .... .. 18.4 0.3 19.3Subtotal 240.8 23.9 65.5 468.8 52.1 75.6 875.6 103.9 149.0OutputCereals 189.5 35.1 146.3 236.8 45.1 179.6 247.1 48.4 184.6Oil crops 16.0 2.5 9.8 25.6 3.5 15.0 24.5 3.4 14.7Loss from fertilizers 51.0 - - 138.0 - - 281.3 - -subtotal 256.5 7.6 156.1 400.4 48.6 194.6 552.9 51.8 199.2Balance (1000 t) -15.7 16.3 -90.6 68.4 3.5 -119 322.7 52.1 -50.2
Balance (kg ha- ) -4.1 -3.56 -23.5 19.2 0.9 -30.9 90.6 14.6 -14.1
The fertilizer input quadrupled during these 20 years, signifying the great changes thattook place in the agricultural development of the province. Nevertheless, the incrementin grain yield credited to the input per unit of fertilizer decreased by a large extent,whilst the input of one kg fertilizer nutrients (NPK) led to a yield increase of 8.4 kg ofgrain in 1977, this ratio declined to 3.9 kg kg- fertilizer in 1997. In 1997, however, theprovince consumed on average 211.5 kg ha" N, 54.9 kg ha- P205 and 17.3 kg ha"K20 with an N:P 205:K20 ratio of 1:0.26:0.082 (see Table II and 12). This rate of Nwas comparable to the amounts used in one cereal cropping season in developed coun-tries whereas the rates of P and K were much less. It is quite obvious that the potentialin using fertilizers is great, but inappropriate application may also result in certainrisks.
Farmland nutrient balance in typical counties (city)
Based on the statistical yearbooks, the farmland nutrient balances were estimated forthe typical counties (Table 7, 8 and 9), resulting in a more or less similar trend to thatof the province. However, the absolute variations in input and output varied greatlybetween counties or districts.In the three years, shown in Table 7, mineral fertilizer application in Yan'an increaseddramatically by more than 5 times for N and by almost four times for P whereas nomineral K was applied. This created a fairly large surplus in both N and P in 1997 anda K deficit, ranging between 17 and 44 %.
137
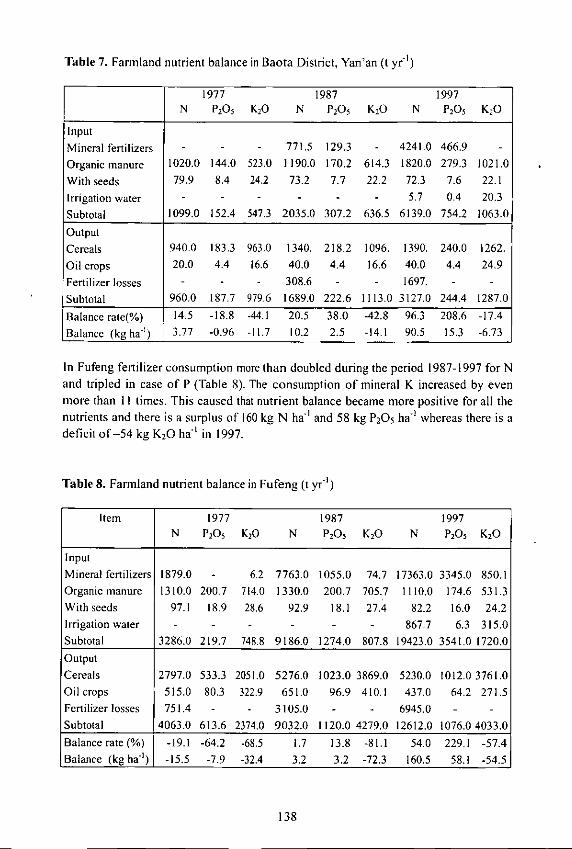
Table 7. Farmland nutrient balance in Baota District, Yan'an (t yr')
1977 1987 1997N P205 K20 N P205 K20 N P205 K2O
InputMineral fertilizers - - - 771.5 129.3 - 4241.0 466.9 -
Organic manure 1020.0 144.0 523.0 1190.0 170.2 614.3 1820.0 279.3 1021.0With seeds 79.9 8.4 24.2 73.2 7.7 22.2 72.3 7.6 22.1Irrigation water - - - - - - 5.7 0.4 20.3
Subtotal 1099.0 152.4 547.3 2035.0 307.2 636.5 6139.0 754.2 1063.0
OutputCereals 940.0 183.3 963.0 1340. 218.2 1096. 1390. 240.0 1262.Oil crops 20.0 4.4 16.6 40.0 4.4 16.6 40.0 4.4 24.9Fertilizer losses - - - 308.6 - - 1697. - -
Subtotal 960.0 187.7 979.6 1689.0 222.6 1113.0 3127.0 244.4 1287.0
Balance rate(%) 14.5 -18.8 -44.1 20.5 38.0 -42.8 96.3 208.6 -17.4Balance (kg ha-') 3.77 -0.96 -11.7 10.2 2.5 -14.1 90.5 15.3 -6.73
In Fufeng fertilizer consumption more than doubled during the period 1987-1997 for Nand tripled in case of P (Table 8). The consumption of mineral K increased by evenmore than II times. This caused that nutrient balance became more positive for all thenutrients and there is a surplus of 160 kg N ha-' and 58 kg P205 ha
-' whereas there is adeficit of-54 kg K20 ha" in 1997.
Table 8. Farmland nutrient balance in Fufeng (t yr-)
Item 1977 1987 1997N P205 K20 N P20, K20 N P2O, K20
InputMineral fertilizers 1879.0 - 6.2 7763.0 1055.0 74.7 17363.0 3345.0 850.1Organic manure 1310.0 200.7 714.0 1330.0 200.7 705.7 1110.0 174.6 531.3With seeds 97.1 18.9 28.6 92.9 18.1 27.4 82.2 16.0 24.2Irrigation water - - - - - - 867.7 6.3 315.0
Subtotal 3286.0 219.7 748.8 9186.0 1274.0 807.8 19423.0 3541.0 1720.0OutputCereals 2797.0 533.3 2051.0 5276.0 1023.0 3869.0 5230.0 1012.0 3761.0Oil crops 515.0 80.3 322.9 651.0 96.9 410.1 437.0 64.2 271.5Fertilizer losses 751.4 - - 3105.0 - - 6945.0 - -
Subtotal 4063.0 613.6 2374.0 9032.0 1120.0 4279.0 12612.0 1076.0 4033.0Balance rate (%) -19.1 -64.2 -68.5 1.7 13.8 -81.1 54.0 229.1 -57.4Balance (kg ha-') -15.5 -7.9 -32.4 3.2 3.2 -72.3 160.5 58.1 -54.5
138

In Hanzhong mineral fertilization started earlier with already substantial use in 1977(Table 9). However, the nutrient consumption was not adequate to replace the removedand lost nutrients by the various pathways so that until 1987 all nutrients had a nega-tive balance. This drastically changed in 1997, when the increase input of especially Ncaused an oversupply of this nutrient at an amount of almost 172 kg ha-'. Similar ob-servations were made for P, where increased inputs by mineral fertilizers caused thatthe balance became slightly positive with 19 kg P20 5 ha -' in 1997. Increased applica-tion of mineral K also caused that the balance for this nutrient improved from -146 kgK20 ha- to -74 K20 ha in 1997. The major part of the K applied, however, still camefrom the organic manure. This proportion significantly declined for the other two nu-trients.
Table 9. Farmland nutrient balance in Hantai District, Hanzhong (t yr')
Item 1977 1987 1997
N P2O K20 N P205 K20 N P205 K20
InputMineral fertilizers 968.4 144.0 71.9 3953.0 396.0 107.8 8032.0 790.8 362.5Organic manure 1030.0 161.5 506.4 1080.0 170.2 514.7 1320.0 222.6 655.9With seeds 60.7 11.0 12.6 56.9 10.3 11.9 58.8 10.6 12.2Irrigation water - - - - - - 370.4 9.1 699.8
Subtotal 2059.0 316.5 590.9 5090.0 576.5 634.4 9781.0 1033.0 1730.0
OutputCereals 2150.0 427.7 1810.0 3220.0 645.9 2698.0 3167.0 632.8 2632.0Oil crops 170.0 26.2 107.9 480.0 74.2 307.2 520.0 78.6 332.1Fertilizer losses 387.4 - - 1581.0 - - 3213.0 -
Subtotal 2707.0 453.9 1918.0 5281.0 720.1 3005.0 6900.0 711.3 2964.0Balance rate (%) -23.9 -30.3 -69.2 -3.6 -19.9 -78.9 41.8 45.2 -41.6Balance (kg ha') -37.4 -7.9 -76.7 -11.7 -8.8 -146. 171.7 19.2 -73.5
A closer look at this reveals that the input of N, P and K with organic manure in Yan'anaccounted for a very large proportion, still over 30% in 1997 which is explained by itsrapid development of the animal production (Table 10). In Yan'an, organic manure in1997 was the only resource for K since no mineral K was used. This is exceptional forthe three regions studied and can't be continued in the long run without any detrimen-tal effect on the productivity, despite the intensive animal husbandry, unless feed staffis imported. This is different in Fufeng, where only 6%, 5% and 38% of the N, P and Kwere applied through organic manure. Mineral fertilizers there are the main nutrientsuppliers to farmland. In Hanzhong this is different and organic manure still contrib-utes significantly to the nutrient supply of the farmland with 14%, 22% and 64% for N,P and K.
139

Table 10. Contribution of organic manure to the total input of nutrients (%) from 1977to 1997
Region 1977 1987 1997N P2O, K20 N P2'O K20 N P'o K20
Shaanxi 45.7 73.5 91.9 25.5 34.8 83.4 17.4 22.5 62.7Yan'an 100.0 100.0 100.0 60.7 56.8 100.0 30.0 37.4 100.0Fufeng 41.1 ? 99.1 14.6 16.0 90.4 6.01 5.0 38.5Hanzhong 51.5 52.9 87.6 21.5 30.1 82.7 14.1 21.9 64.4
Using the N : P20 5 : K20 ratios of mineral fertilizer use (Table 11) as an indicator forbalanced fertilization it is evident that throughout the periods studied the ratios divert
very much from ratios found in the removal of nutrients which on average are I - 0.4 :I (N : P20 5 : K20). The application ratios were extremely wide for N : K, showing thatthere is a strong reliance by the farmers to supply the crops nearly from indigenous K
sources (soil and organic manure): This is particularly evident from the fact that the
surveyed farmers in Yan'an and Fufeng were not using any mineral K at all (Table 11).
Table 11. N:P205:K20 ratios of mineral fertilizer consumption in Shaanxi in com-
parison to the surveyed regions
Region 1977 1987 1997 Farmer*Shaanxi 1:0.11:0.05 1:0.22:0.04 1:0.26:0.08Yan'an 1:0.38: - 1:0.25: - 1:0.29:0Fufeng 1:?:0.004 1:0.31:0.01 1:0.44:0.06 1:0.468:0Hanzhong 1:0.34:0.089 1:0.23:0.03 1:0.23:0.054 1:0.38:0.075
* Based on a survey of farm households
The nutrient application rates confirm the described situation, but indicate a clear in-
crease, showing a doubling of the N and P rates and a tripling of the K rates on average
of the studied regions (Table 12). Very large rates of N and P in Fufeng and Hanzhongare in contrast to the relative moderate application rates in Yan'an. In the latter region,no K is applied which may be due to the overall smaller yield potential in this region.
Table 12. Nutrient application rates in Shaanxi and the typical regions investigated(kg ha -t)
Region 1977 1987 1997
N P205 K20 N P20 5 K 20 N P20 5 K 20Shaanxi 33.1 3.63 1.6 96.8 21.5 4.2 211.5 54.9 17.3Yan'an - - - 22.9 8.8 - 127.4 32.1 0Fufeng 37.5 - 0.2 161.8 50.4 1.9 409.1 180.6 24.1Hanzhong 55.9 19.0 5.0 243.0 55.8 8.0 478.7 108.0 26.0
140

Nutrient balance in farmers' field
The nutrient balances in farmers' fields in the three typical regions in 1997 are shownin Table 13. The comparison of Table 13 with Table 7, 8 and 9 shows in farmers' fieldsin Fufeng and Yan'an, there was more serious K deficit than the average of the respec-tive region. In Hanzhong, crop yield response to K was significant, while in Fufengand Yan'an, the soils contained relatively large amounts of available K, so farmersseldom get response to K, hence omit application. The N and P surpluses in the farm-ers' fields in Yan'an were much smaller than the county's average whereas in Fufeng,they were quite close to the county's average. In Hanzhong, the N surplus in the farm-ers' fields was smaller than the county's average and the P surplus slightly bigger,which could be attributed to the local farmers' preference for diammonium phosphate.
Table 13. Farmland nutrient balance in farmers' fields (mean value) [kg ha- yr -']
Item Yan'an Fufeng HanzhongN P20 5 K20 N P205 K20 N P20 5 K20
InputMineral 136.7 17.7 0 356.6 72.8 0 358.2 59.5 22.3fertilizersOrganic manure 17.6 2.5 6.6 30.3 4.4 9.6 44.1 6.4 15.4With seeds 2.2 0.2 0.7 1.9 0.4 0.6 3.5 0.6 0.7With irrigation 1.8 0.1 6.3 20.4 0.1 0.5 22.1 0.5 41.7waterSubtotal 158.3 20.5 13.6 409.1 77.7 10.7 427.9 67.0 80.1OutputRemoval with 75.2 13.1 68.7 114.5 22.0 85.9 235.8 44.5 189.0harvestLoss from 54.6 - - 142.6 - - 143.3 - -
fertilizersSubtotal 129.8 13.1 68.7 257.1 22.0 85.9 379.1 44.5 189.0Balance rate (%) 22.0 56.5 -80.2 59.1 253.2 -87.5 12.9 50.6 -57.6
Farmland nutrient status
Based on the research method of Lu Rukun et a., permissible balance rates wereelaborated for nutrients in the Guanzhong region (Table 14). Based on this in Yan'an,the soil nutrient balance was reasonable both on the scale of the region and on farmers'fields. It is quite interesting to note that the N, P and K surpluses in the farmers' fieldswere apparently smaller than indicated by the statistical yearbooks. Investigations re-vealed that in that region, the actual area of farmland under cultivation was much lar-ger than the area of farmland under contracti .
' (Here, 'farmland under contract' means the farmland lent to the farmers by the government under acontract. For all the farmland belongs to the Country, the official report includes only the farmland area
141

Table 14. Permissible balance rates for farmland nutrients in Yan'an and Fufeng
Location Item Scope N P KYan'an Actual balance rate (%) County 96.3 208.6 -17.4
Farmers 22.0 56.5 -80.2Permissible balance rate (B%) 132.0 250.0 -100.0
Fufeng Actual balance rate (%) County 61.4 229.1 -57.4Farmers 67.8 253.2 -87.5
Permissible balance rate (B%) 98.6 160.0 -100.0
It was quite common that farmers reclaimed wasteland on slopes of more than 20 de-grees. Cultivation of land that according to the land use regulations should have beenforestland or grassland also received fertilization, which resulted in a reduced applica-tion rate to land classified as farmland. This important aspect should receive more at-tention in future agricultural production. In Fufeng, the nutrient balance in the farmers'fields was close to the county's average, with N surplus and K deficit being within thepermissible range. Only the application rate of P fertilizers was too high, which wasalso reflected in the N : P ratio (see Table II), because the local farmers are used toapply one bag of white fertilizer and one bag of black, i.e. ammonium bicarbonate andhigh-effective P fertilizer (18% P205). P fertilizers were usually applied to wheat,rather than to maize. The method is worth, being extended to general practice, but at asmaller application rate. At present, there are no data of any long-term stationary fieldexperiment available that could be used to evaluate the nutrient balance in the southernpart of the Shaanxi Province. But enough field experiments have been carried out toconfirm a significant crop response to K application in the region. In 1997, the Kapplication rate for farmland was only 26 kg hectare. The project of "Ksupplementation" has shown its effectiveness. Efforts should be continued in relatedaspects.Prediction of the fertilizer consumption for the next 10 years in the Shaanxi Province
The major concerns in the use of mineral fertilizer application are related to the dra-matic increase in nitrogen consumption which in certain regions reached levels whichare far beyond the requirements and it seems that certain accumulation in the ecosys-tems could be the result of this practice. To address this issue, it was suggested to regu-late the N fertilizer supply to crops by setting the recommendation to 150-180 kg Nha" , independent of the crop, e.g. rice, wheat or maize. This was based on observationsthat yield response was usually insignificant when the rate was raised to 250-270 kgha- '. The field experiments conducted in the past two years have shown similar results.When the application rate of N reached 210-270 kg ha-1, the crop yield did not furtherincrease by additional N. Concerns are particularly related to the ground water pollu-tion with nitrate, which should not exceed II mg N I-'. Investigations revealed that insome wells the nitrate content of the water reached 9.3 mg N 1 and in Guanzhong,about 29.7% of the well water was already contaminated with nitrate at levels above
under contract. However, the authors' investigation revealed that there is a considerable area of farm-land owned by the farmers.)
142

the critical II N mg I'. In Shaanbei (the northern part of the Shaanxi Province), 21.5%of the sampled wells exceeded this value. Consequently, 375 kg ha-' N for two cropsand 195 kg ha"' N for one crop have now been established as acceptable norms forcontrolling N application and reducing its side effects. Inefficient use of N, hence lar-ger nitrate residues in the soil, may also be caused by insufficient supply of other nu-trients, especially of K. In recognition of this fact, large emphasis is placed on adjust-ing adequate nutrient ratios which for the whole China are proposed as N:P205:K20 of1:0.40-0.45:0.25. The current N:P205:K 20 ratio of the province is only 1:0.26:0.08,and it has been found, due to the relative well supplied soils and the prevailing crop-ping systems, the ideal ratio for the Shaanxi is in the region of 1:0.42:0.20. Based onsuch a ratio and the multiple-cropping index of 137% (mean of 1986-1997) Shaanxiwill need 0.870 Mt N, 0.365 Mt P205 and 0.174 Mt K20 during the next 10 years. It isnot likely that the N consumption will reach 1.00 Mt, although the province's fertilizerconsumption will possibly increase to a great extent due to expansion of the acreage ofhigh-yielding fields. Furthermore, expansion of cash crops, a reduction of the area ofcultivated land, strong development of animal husbandry and related feed requirementswill have a positive effect on the future mineral fertilizer consumption. The proposedimproved utilization of crop stalks and straw, the technical advancement in raising thefertilizer recovery rate and heightened awareness of environment protection will cer-tainly have their impacts so that a rather moderate increase in fertilizer consumptionmay be expected. Since in most regions, soil K supply is regarded as high and cropyield response to K application in long-term experiments is only 2-6% at the moment,it is predicted that organic manure and crop straw recycling will continue to remain themain sources of K. Therefore, during the next decade, no exceptional growth in theconsumption of mineral K in Shaanxi can be predicted despite the irrational N : K ra-tios and the negative K balances in the various regions.
Problems in farmland nutrient cycling and suggestions for a better balance
1) Farmland ecosystems of Shaanxi reveal an inadequate N:P 20:K20 application ratiowhich is currently 1:0.26:0.08. In addition to increasing N input, P and K inputshould be increased too, to bring the ratio up to 1:0.40-0.45:0.15-0.20. It is not ad-vised to reach an N:P20 5 ratio closer than 1:0.50.
2) There is a widespread practice of burning of crop stalks and straw in the province'sfields. It is suggested that more efforts should be made in research and managementon the re-use of straw and stalks. Regulations should be formulated that encouragethe composting of organic manure and to prevent straw burning.
3) Improved regulations for the farmland nutrient cycling should increase farmers'awareness of cultivating in a scientific way and to prevent irrational fertilization,causing environmental problems, which deserve high attention by the agriculturaladministration.
143


Chapter III
Farmland nutrient balance and fertilizerrequirement of Southern China
145


Spatial and temporal variation in the nutrient cycle of rice fieldsin Jiangsu
Dong Yuanhua, Wang Xia and Xu QiInstitute of Soil Science, Chinese Academy of Sciences, Nanjing 210008
Abstract
Rice cultivation has been practiced for almost 6,000 years in Jiangsu. With the utiliza-tion of improved seeds and mineral fertilizers, rice yield has been increased graduallyyear by year since 1949. Meanwhile, the cropping system and the fertilizer applicationpractice have also been changed. Studies on nutrient cycling in rice field ecosystemsbegan at the end of the 1970's and became a hot topic in the 1980's in China, of whicha substantial amount of research was conducted in Taihu areas. This paper highlightsthe spatial and temporal variation of nutrient cycling in the rice field ecosystem in theJiangsu Province, based on the results of field experiments carried out by the Instituteof Soil Science in the 1960's and 1980's and the investigation of fertilization in highyielding rice fields by the Jiangsu Station of Soil and Fertilizer, in the late 1990's.
Temporal variation in the output of the rice ecosystem
The output of rice has changed during the different periods and can be largely attrib-uted to the cropping system, improved seeds and increased fertilization. In the Taihuarea, for example, at the beginning of the 1960's, the output of rice and wheat were5,340 kg ha-' and 3,810 kg ha*1, respectively, and 6,510 kg ha-' and 3,360 kg ha" in theearly 1980's. The decrease of wheat output at that time may be caused by the triplecropping system. In the early years of the 1990's, rice yields reached 8,040 kg ha-',which is an increase of approximately 50% in comparison to the 1960's and by 22% incomparison to the 1980's (Fig.I).
100008000
- 'a 6 0 0 0- m 4 0 0 02000
01960's 1980's 1990's
Year
I e DWheat I
Figure 1. Rice and wheat yields in Taihu area
147
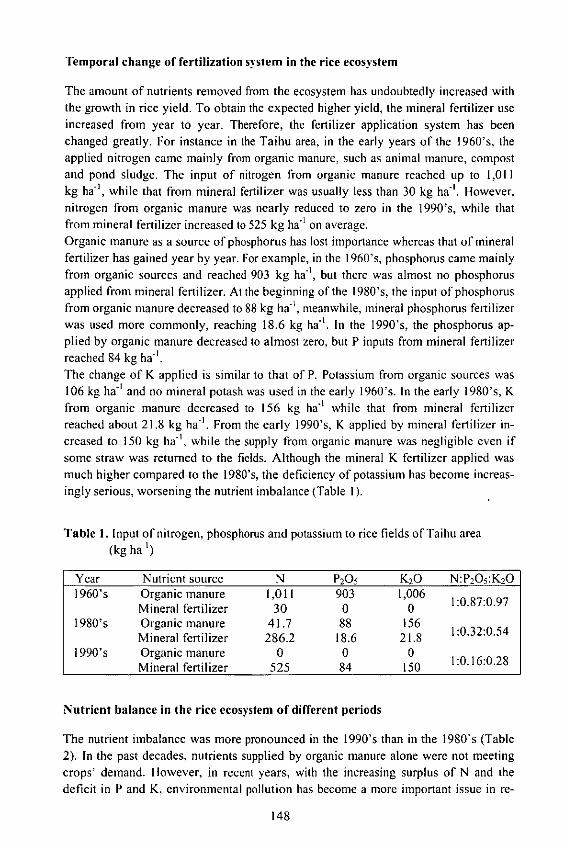
Temporal change of fertilization system in the rice ecosystem
The amount of nutrients removed from the ecosystem has undoubtedly increased withthe growth in rice yield. To obtain the expected higher yield, the mineral fertilizer useincreased from year to year. Therefore, the fertilizer application system has beenchanged greatly. For instance in the Taihu area, in the early years of the 1960's, theapplied nitrogen came mainly from organic manure, such as animal manure, compostand pond sludge. The input of nitrogen from organic manure reached up to 1,011kg ha-, while that from mineral fertilizer was usually less than 30 kg ha-. However,nitrogen from organic manure was nearly reduced to zero in the 1990's, while thatfrom mineral fertilizer increased to 525 kg ha'I on average.Organic manure as a source of phosphorus has lost importance whereas that of mineralfertilizer has gained year by year. For example, in the 1960's, phosphorus came mainlyfrom organic sources and reached 903 kg ha', but there was almost no phosphorusapplied from mineral fertilizer. At the beginning of the 1980's, the input of phosphorusfrom organic manure decreased to 88 kg ha-1, meanwhile, mineral phosphorus fertilizerwas used more commonly, reaching 18.6 kg ha" . In the 1990's, the phosphorus ap-plied by organic manure decreased to almost zero, but P inputs from mineral fertilizerreached 84 kg ha-'.The change of K applied is similar to that of P. Potassium from organic sources was106 kg ha-' and no mineral potash was used in the early 1960's. In the early 1980's, Kfrom organic manure decreased to 156 kg ha' while that from mineral fertilizerreached about 21.8 kg ha-. From the early 1990's, K applied by mineral fertilizer in-creased to 150 kg ha1, while the supply from organic manure was negligible even ifsome straw was returned to the fields. Although the mineral K fertilizer applied wasmuch higher compared to the 1980's, the deficiency of potassium has become increas-ingly serious, worsening the nutrient imbalance (Table I).
Table 1. Input of nitrogen, phosphorus and potassium to rice fields of Taihu area(kg ha-')
Year Nutrient source N P20 5 K20 N:P 20 5 :K20
1960's Organic manure 1,011 903 1,006Mineral fertilizer 30 0 0
1980's Organic manure 41.7 88 156Mineral fertilizer 286.2 18.6 21.8
1990's Organic manure 0 0 0Mineral fertilizer 525 84 150 1:0.16:0.28
Nutrient balance in the rice ecosystem of different periods
The nutrient imbalance was more pronounced in the 1990's than in the 1980's (Table2). In the past decades, nutrients supplied by organic manure alone were not meetingcrops' demand. However, in recent years, with the increasing surplus of N and thedeficit in P and K, environmental pollution has become a more important issue in re-
148

gard to farmland and water bodies (such as rivers, lakes, etc). To a great extent, thismay be attributed to the change of the fertilization practice. The surplus of nitrogen asindicated in Table 2, however, does not pose serious problems to the soil quality. It ismerely the imbalance of N:K 20 input that may negatively affect the sustainability of
production.
Table 2. Change of nutrient balance and input/output ratio in different periods in the
Taihu area
Period Nutrient balance (kg ha') Input/outputN P205 K20 N P205 K20
1980's 7.0 -4.1 -14.6 1.47 0.63 0.451990's 16.1 -7.7 -33.4 1.85 0.42 0.23
Cropping systems and nutrient removals
The cropping system has a distinct influence on the nutrient cycling and balance. Tri-
ple cropping systems of rice-rice-winter crops have been practiced in Jiangsu since the1970's, and in the Taihu area for the last 10 years. Generally speaking, yields of triplecropping are larger than in double cropping systems of rice-winter crops grown in fer-tile soils. For example, annual yield of rice-wheat cropping was 9,870 kg ha -1, whilethat of rice-rice-wheat could reach up to 12,400 kg ha -'. Studies showed that nitrogen
removed from soil amounted to 236 kg ha' in the double cropping system and 281 kgha - ' in the triple cropping system. The removals of phosphorus and potassium showeda similar trend (Table 3).
Table 3. Nutrients removed from soil in different cropping systems (kg ha')
Cropin system N P20 5 K20Double cropping 236 166 542Triple cropping 281 202 641
Spatial variation in the nutrient cycling of rice fields in the Taihu area
The Taihu area can be split into five geographic zones, namely Taihu plain, higher ele-vation plain, plain along the Yangtze river, polder and hill. The nutrient cycles and bal-
ances are different in each of the various zones. In the double cropping system of rice-wheat for example, the annual output was 10,500 kg ha ' in Taihu plain, 9,600 kg ha - 'and 9,700 kg ha' in the higher elevation plain and plain alone and 9,300 kg ha -' alongthe Yangtze River whereas in the polder and hill areas average yields reached only7,600 kg ha -'. Fertilizer input varied also according to the zones. Input of nitrogen,phosphorus and potassium depended on crops and soil fertility, which significantlyinfluenced the annual yield and nutrient balance ( Table 4).
149
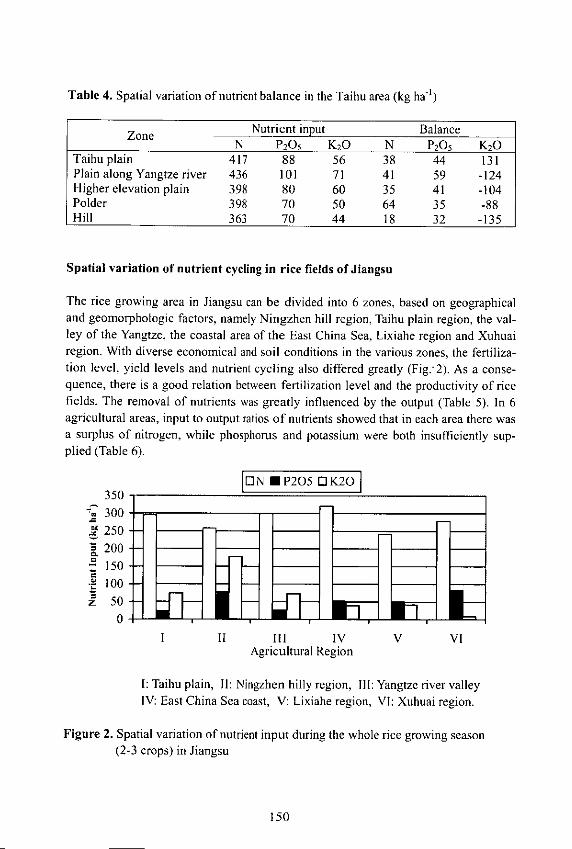
Table 4. Spatial variation of nutrient balance in the Taihu area (kg ha-')
Zone Nutrient input BalanceN P 20 5 K20 N P20 5 K20
Taihu plain 417 88 56 38 44 131Plain along Yangtze river 436 101 71 41 59 -124Higher elevation plain 398 80 60 35 41 -104Polder 398 70 50 64 35 -88Hill 363 70 44 18 32 -135
Spatial variation of nutrient cycling in rice fields of Jiangsu
The rice growing area in Jiangsu can be divided into 6 zones, based on geographicaland geomorphologic factors, namely Ningzhen hill region, Taihu plain region, the val-ley of the Yangtze, the coastal area of the East China Sea, Lixiahe region and Xuhuairegion. With diverse economical and soil conditions in the various zones, the fertiliza-tion level, yield levels and nutrient cycling also differed greatly (Fig. 2). As a conse-quence, there is a good relation between fertilization level and the productivity of ricefields. The removal of nutrients was greatly influenced by the output (Table 5). In 6agricultural areas, input to output ratios of nutrients showed that in each area there wasa surplus of nitrogen, while phosphorus and potassium were both insufficiently sup-plied (Table 6).
[ON E P205 0' K20350
<, 300
2250--S200 - -: 150 - -. 100 - -
50 -- -0 -l ----
1 1I Ill IV V VIAgricultural Region
I: Taihu plain, 11: Ningzhen hilly region, Ill: Yangtze river valleyIV: East China Sea coast, V: Lixiahe region, VI: Xuhuai region.
Figure 2. Spatial variation of nutrient input during the whole rice growing season(2-3 crops) in Jiangsu
150

Table 5. Spatial variations of rice yields (kg ha-') and nutrient removals in 6 agricul-tural regions of Jiangsu (kg ha-)
Taihu Ningzhen Yangtze Region Lixiahe XuhuaiZone plain hill river along
valley East SeaTotal yield 8,040 8,520 8,085 8,175 8,025 8,010
N 170 181 171 173 170 170removal P20 5 120 128 121 122 120 120
K20 420 445 422 427 419 418
Table 6. Spatial variation of nutrient input/output ratio in rice field in Jiangsu
Zone N P20 5 K20Taihu plain 1.73 0.20 0.18
Ningzhen hill 1.43 0.60 0.40Yangtze River valley 1.74 0.22 0.17East China Sea coast 1.85 0.42 0.09
Lixiahe 1.42 0.42 0.10Xuhuai 1.64 0.69 0.02
Conclusions
Before the 1960's, the fertilization systems in the Jiangsu Province were dominated byapplication of organic manure. Inputs and outputs of nitrogen, phosphorus and potas-sium were in balance but in low supply. Hence the productivity of the rice fields waslow. Obvious changes took place in the early 1980's. Nitrogen input mainly originatedfrom mineral fertilizer, while phosphorus and potassium were largely applied in formof organic sources. An imbalance of nitrogen, phosphorus and potassium was the re-sult. In the early 1990's, the fertilization system completely changed. Nitrogen, phos-phorus and potassium originated mainly from mineral fertilizer. The imbalance be-tween nitrogen, phosphorus and potassium worsened.
151

Farmland nutrient balances in Jiangsu Province
Du Chenglin and Zhang Zhongyi
Institute of Soil Science, Chinese Academy of Sciences 210008
Abstract
Representative case studies and the analysis of the statistics for the whole province
reveal that Jiangsu has a surplus in the N and P supply and a deficit in the supply of Kto its farmland. All the soils of the province, except warp soil and Lianghetu soil de-rived from the Huanghe River flood sediments as well as the coastal saline soils ofcentral Jiangsu, have a poor K-supplying potential. In general, nutrient imbalancesthrough the management practices of farmers developed to such an extent that theyadversely affect crop production. As a result, it is a crucial link in farmland nutrientmanagement to continue implementing the project of"K supplementation" by increas-ing K application rates.
Introduction
The total area of cultivated land in the Jiangsu Province declined from 4,672,790 ha in
1977 to 4,435,450 ha in 1997, at a mean rate of 11,870 ha per year during these 20years. The area of cultivated land per hundred persons also declined from 8.1 ha to 6.2
ha during the same period. It is anticipated that the gap between the increasing popula-
tion and the shrinking cultivated land will widen. Since the province's land reserves
are limited and it is very difficult to further raise its multiple cropping index, the in-
crease in yield per unit area by improving and maintaining soil fertility has to become
general practice. In the following paper a farmland nutrient balance was calculated forthe counties/cities of Siyang, Qidong and Changshu, which differ widely with regard
to ecotype and production level. In the study, the fertilization levels and yields of the
different cropping systems were investigated. Furthermore, with related statistical datathe nutrient balance for the whole Jiangsu province was analyzed, in order to recom-
mend measures for improving and maintaining the soil fertility.
Material and methods
For the investigation the counties/cities of Siyang, Qidong and Changshu were selected
to represent three major agricultural zones, Xuhuai, Binhai and Taihu in Jiangsu. Out
of the three counties, six townships (or towns) were selected, being different in produc-
tion levels and soil types. In each township, two villager teams were chosen and in
each villager team, 4 - 5 farmers were nominated for the investigation. 61 farms were
studied in total. At the same time, soil samples were taken in autumn before sowing.
153

During the investigation, in addition to related materials collected from the provinceand city statistic bureaus, information was gathered about each farm, including numberof family members, area of farmland they cultivate, the area covered by cereals, cottonor oil crops. Furthermore, yield, type and quantity of fertilizers used, size of livestockherd, source of feed, use of crop straw and stalks in 1997 were assessed. This informa-tion was used for the analysis and computation of the farmland nutrient balance.The major farming system of the province is a two-crops-per-year rotation system ofwheat (or oilseed rape, broad bean, pea) and rice (or maize, soybean, cotton). FarmlandNPK nutrient balance was assessed on the basis of a rotation cycle (one year) by de-ducting nutrient output from input of the field. The data were used to calculate nutrientgains or losses in the respective system.
Results and discussion
Nutrient inputs and balances in farmers' fields in Siyang, Qidong and Changshu
As mineral fertilizers have an instant and distinct effect and are easy to handle, farmersare willing to invest in them, pushing the dosage higher and higher up, especially Nfertilizers (Table 1). The comparison between the three counties/cities reveal large dif-ferences in nutrient application rates. Largest amounts of all nutrients were applied inChangshu. It is assumed that this is associated with its better economic conditionscompared to the other two regions. On the other hand, Qidong had the smallest appli-cation rates in all nutrients, but particularly the K application rate was small, leading tothe widest N : K ratio.
Table 1. Rate and ratio of mineral nutrient inputs in the three regions (1997)
Region Number of Rate (kg ha-') N: P205 .: K20
farms* N P20 5 K20Siyang 18 299 79 78 1 :0.27 :0.25Qidong 20 253 78 23 I : 0.31 : 0.09
Changshu 23 521 94 100 1 :0.18 :0.19*: Number of farms investigated
Although farmyard manure is rich in organic matter and contains a variety of nutrients,its relative contribution to the total quantity of nutrients applied is declining. One ofthe possible reasons for this is the inconvenient and labor-consuming handling of themanure.Traditional organic manure mainly consists of animal wastes. However, because ofrising animal feed costs, strongly fluctuating meat prices, decreasing profits and in-creasing environmental sanitation requirements the size of livestock herds is appar-ently shrinking in the studied areas. For instance, in Changshu City, out of 23 farmersunder investigation, only 21.7% kept pigs. Even on pig-rearing farms the averagenumber was only 9.6 pigs per farm. In Qidong City, of the 20 farms under investiga-tion, 33 goats and I buffalo were kept, but no pigs. In Siyang, where for years much
154

attention had been given to pig rearing, 18 farms kept 42 pork pigs, 2 sows, 42 piglets,4 buffaloes and goats. The decrease in the size of livestock herds and the populariza-tion of farming machines directly affect the input of nutrients from animal wastes.As buffaloes and goats often graze in the field, the utilization rate of their wastes isestimated at 75% only. There is also a certain proportion of pigs that is herded outside,so that about 10% of their excretion is lost. By deducting that portion which is used oncash crops, about 50% of cattle and sheep droppings are recycled to cereal and cottonfields. The proportion of pig dung returned to the field with 70% of the total is slightlylarger.The investigations in these regions revealed that the practice of returning crop stalksand straw to the field is gradually popularized. It is done roughly by three tech-niques.1) harvesting rice or wheat, leaving high stubs in the field, usually 10-15 cm
taller than before, equaling to 15-20% of the total amount of straw; 2) returning stemsand straw directly, for instance, in Qidong, farmers often bury wheat straw, horsebeanand pea stems and leaves directly in the soil between cotton rows, using about 30% of
the total residues. In Changshu, small-sized combine harvesters are used to harvestcereals which leave the straw in the field at harvest. But the farmers usually bum thestraw so that the amount of straw returned to the field reaches only about 30% of thetotal and 3) returning straw to the field after it was used for livestock bedding. Thisaccounts for 5-10% of the total.In this paper, the nutrient input of the farmland covers only nutrients supplied by min-eral fertilizers, organic manure, seeds, seedlings and also the amount of symbioticallyfixed N whereas the farmland nutrient output includes nutrients removed in the har-vested crop and nutrient losses from fertilizers. Statistical analyses were carried outwith the results gained from 61 farms, looking separately at each source of the nutri-ents N, P and K. The results show that N and P were mainly supplied by mineral fertil-izers (fertilizer N : manure N = 1 : 0.03-0.27, and fertilizer P : manure P - I : 0.11-0.40) whereas K was mainly supplied through organic manure (fertilizer K : manure K
= I : 0.68-2.43). The quantity and quality of organic manure used is the key factor todetermine whether there is a gain or loss in farmland K.The farmland nutrient balances of the 61 farms are shown in Table 2, which indicatethat N and P balances are positive to a varying extent due to differences in the produc-
tion level. On the other hand, the K balance was negative with the exception on farmswhere pigs were kept.
Table 2. Farmland nutrient balance of typical farms (1997)
Region Number of Balance (kg ha')farms* N P 20 5 K20
Siyang 18 3.8 8.8 -14.5Qidong 20 28.8 25.5 -58.4
Changshu 18 * 61.4 -15.6 -104.95 203.7 40.2 103.6
*: Number of farms investigated. ** farms without pigs. *** farms with pigs.
155

Data from 50 fertilizer monitoring posts in Changshu (Table 3) also indicate thatwithin a period of seven years, the total N content increased from 1.10 g kg-' to 1.12 gkg- 1 and alkalytic N (see Table 3) increased by 11.45%, but K decreased by 10% or40.8% as compared to the figure of 179.0 mg kg ' found in 1980. This observation isconsistent with the negative K balance.In Changshu, the 14 years continuous rice-wheat rotation system on a yellow earth(waterlogged paddy soil) received a total of 5,773 kg N, 857 kg P205 and 705 kg K20per hectare. During the same period (1984-1997), a total of 173,262 kg crops wereproduced that removed 3,764 kg N, 749 kg P205 and 3,048 kg K20. By balancing theinput with the removal, it was found that the soil gained 2,008 kg N and 109 kg P20 5,which was basically in balance with the removals, but lost 1,112 kg K20. It has to bementioned that the farmers who were assigned as monitoring posts were local farmingheadmasters with a relatively good knowledge of science based cultivation techniques.Even under such circumstances, K deficit seemed to be inevitable.
Table 3. Variation of major soil nutrients in Changshu
Year Total N Alkalytic N* Readily available P Readily available K(g kg ) ...................... mg kg ..............
1990 1.10 82.1 6.7 116.01993 1.09 110.3 5.9 107.41996 1.12 91.5 6.6 106.3
1.0 M NaOH incubation at 400 C for 24 h
Farmland nutrient balance in Jiangsu Province
Since 1978, with implementation of the family output-based contract system farmlandnutrient input gradually increased, thus ensuring a continuous increase in the yield of
cereals, cotton and oil crops (Table 4).From there, it is evident that yields of all the major crops increased, except cotton,yields which fluctuated sharply due to pests, adverse weather conditions and changesin marketing. In 1997, the output of grains, lint and oils were 96%, 34% and 737%,respectively, larger than 20 years ago. If furthermore the substantial reduction in areaavailable for farming is taken into account which coincided during this period, the realyield increments per unit area were even larger.
Table 4. Development in major crops in Jiangsu Province during the past 20 years
Year Grains Lint Oils Total103 t % ]Olt % tot % 103 t %
1977 18,197 100 380 100 169 100 18,746 1001982 28,555 157 576 152 917 541 30,048 1601987 32,577 179 444 117 1,208 713 34,229 1831992 32,913 181 527 139 1,273 752 34,714 1851997 35,638 196 508 134 1,419 837 37,564 200
Sources: Jiangsu Province Statistics Bureau
156

Table 5 shows that the input of mineral fertilizers rose significantly over the years,
while the input of organic manure remained stagnated at the same level, which implies
that in the meantime, mineral fertilizers dominate the nutrient input today. Readjust-
ment of the N: P205: K20 nutrient application to an acceptable ratio is a key measure
for a sustainable development of the agriculture in Jiangsu Province.
Table 5. Nutrient input by mineral and organic sources in different years in Jiangsu
Province (1,000 t)
Year N P2O5 K20
Mineral Organic Mineral Organic Mineral Organicfertilizers manure fertilizers manure fertilizers manure
1982 1,038.1 96.6 325.0 26.8 30.0 87.21987 1,201.9 93.8 368.0 21.9 82.5 85.21992 1,530.1 107.9 483.0 25.0 215.6 114.21997 1,906.4 105.0 624.3 24.1 328.8 94.4
Based on the data provided by the provincial Statistical Bureau and related depart-ments on outputs of crops and nutrient contents in the crops, nutrient balances of the
province in different years were estimated (Table 6). These show that the inputs of N,
P20 5 and K20 in 1997 have significantly increased in comparison to 1977. ThoughK20 in particular increased by 261.9%, the province still suffers an annual K20 deficit
of 314,900 t. On the contrary, in 1997 N showed a surplus supply of 1,047,100 t and
P20 5 of 510,900 t. If the status of nutrient imbalance is not remedied, it is expected
that besides yields and quality of the crops, the profits and also the environment will be
negatively affected.
Table 6. Nutrient balances of Jiangsu Province in different years (1,000 t)
Year Input Removal BalanceN P20 5 K20 N P205 K20 N P20 5 K20
1982 1,135 352 117 786 168 583 349 184 -4661987 1,296 390 168 891 180 669 404 210 -5011992 1,636 508 330 910 190 687 726 318 -3591997 2,011 648 423 964 178 738 1047 471 -315
Note: Calculation based on data supplied by the Jiangsu Province Statistics Bureau
Soil K supply in Jiangsu
Since the 1970's, systematic studies have been carried out on soil K supply and crop
response to K application in different soils and in different regions. Results indicate
that only the warp soil in Xuhuai and the saline soil along the coast are fairly rich in K.
On these soils, crop response to K application is generally insignificant.. All the other
soils in the province have a K supply potential basically below medium level. In the
1990's, studies in different regions concentrated on determining the trend of soil K
157
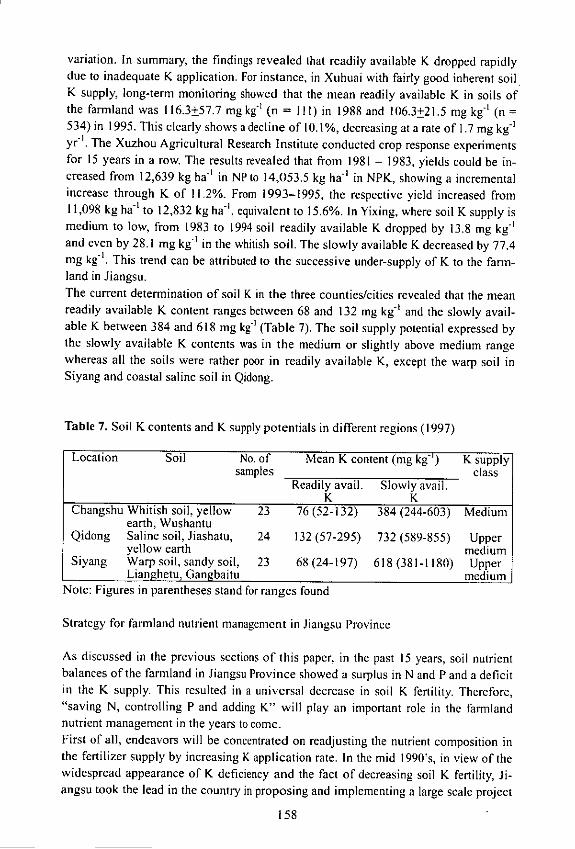
variation. In summary, the findings revealed that readily available K dropped rapidlydue to inadequate K application. For instance, in Xuhuai with fairly good inherent soilK supply, long-term monitoring showed that the mean readily available K in soils ofthe farmland was 116.3+57.7 mg kg" (n = Ill) in 1988 and 106.3+21.5 mg kg-' (n =534) in 1995. This clearly shows adecline of 10.1%, decreasing at a rate of 1.7 mg kg-1
yr -'. The Xuzhou Agricultural Research Institute conducted crop response experimentsfor 15 years in a row. The results revealed that from 1981 - 1983, yields could be in-creased from 12,639 kg ha-' in NP to 14,053.5 kg ha-' in NPK, showing a incrementalincrease through K of 11-2%. From 1993-1995, the respective yield increased from11,098 kg ha-1 to 12,832 kg ha-', equivalent to 15.6%. In Yixing, where soil K supply ismedium to low, from 1983 to 1994 soil readily available K dropped by 13.8 mg kg'and even by 28.1 mg kg-' in the whitish soil. The slowly available K decreased by 77.4mg kg'. This trend can be attributed to the successive under-supply of K to the farm-land in Jiangsu.The current determination of soil K in the three counties/cities revealed that the meanreadily available K content ranges between 68 and 132 mg kg-' and the slowly avail-able K between 384 and 618 mg kg' (Table 7). The soil supply potential expressed bythe slowly available K contents was in the medium or slightly above medium rangewhereas all the soils were rather poor in readily available K, except the warp soil inSiyang and coastal saline soil in Qidong.
Table 7. Soil K contents and K supply potentials in different regions (1997)
Location Soil No. of Mean K content (mg kg") K supplysamples class
Readily avail. Slowly avail.K K
Changshu Whitish soil, yellow 23 76(52-132) 384 (244-603) Mediumearth, Wushantu
Qidong Saline soil, Jiashatu, 24 132 (57-295) 732 (589-855) Upperyellow earth medium
Siyang Warp soil, sandy soil, 23 68(24-197) 618 (381-1180) UpperLianghetu, Gangbaitu medium
Note: Figures in parentheses stand for ranges found
Strategy for farmland nutrient management in Jiangsu Province
As discussed in the previous sections of this paper, in the past 15 years, soil nutrientbalances of the farmland in Jiangsu Province showed a surplus in N and P and a deficitin the K supply. This resulted in a universal decrease in soil K fertility. Therefore,"saving N, controlling P and adding K" will play an important role in the farmlandnutrient management in the years to come.First of all, endeavors will be concentrated on readjusting the nutrient composition inthe fertilizer supply by increasing K application rate. In the mid 1990's, in view of thewidespread appearance of K deficiency and the fact of decreasing soil K fertility, Ji-angsu took the lead in the country in proposing and implementing a large scale project
158

of "K supplementation", which led to significant changes in the nutrient managementtechniques by farmers.Secondly, the practice of returning straw to the field should be extended more vigor-ously. The data in Table 5 indicate that in the past 15 years, Jiangsu depended mainlyon mineral fertilizers to increase its nutrient input, with the input of organic manureremaining stable at around 0.1 Mt N, 0.025 Mt P20 5 and 0.09 Mt K20. Whether theinput of organic manure can be increased, will largely depend on the success of ex-panding the practice of returning straw to the field. Currently, average rice yields inJiangsu are 6.000 kg ha' which means at the same time approximately 6,000 kg ha' ofstraw are produced (grain : straw = 1:1). If 30% of the straw were returned, each hec-tare of farmland would save 45 kg of K20 which is an important means to maintain Kfertility. But the current situation shows that only 10% of the rice or wheat straw arereturned by means of leaving longer stubs during harvest. In the cotton fields along thecoast, cotton stalks are left standing in the field until the frost causes the leaves to fall
and thus returning the nutrients to the field. Rainfall during this period helps the K inthe cotton stalks to be washed into the soil for recycling. In general, returning strawmay pose some difficulties to the farmers due to slow mineralization and immobiliza-tion of N by soil bacteria. Furthermore, the shortage of fuel in certain rural areascauses that straw is used as fuel for cooking and heating. Another factor limiting thepopularization of returning crop residues is the lack of suitable machines to chop strawand to incorporate it into the soil.Where crop stalks are used as fuel, effective measures have to be implemented to re-turn the ash and prevent its loss through runoff or leaching.
159

Changes in soil fertility and prediction of fertilizer demand in Jiangsu
Yin Guangde, Liu Linwang, Xu Xuehong, Gao Qin and Liang Yonghong
Jiangsu Province Soil and Fertilizers Technique Guiding Station 210013
Abstract
In this paper the changing pattern of the physical and chemical properties of the majorsoil types in the Jiangsu Province in the late 1990's are studied by monitoring thechange in soil fertility, the yield in relation to soil fertility and the basic land contribu-tion rate. Soil organic matter, total N, readily available P and readily available K, allshowed an upward trend. The indigenous soil productivity and its proportionalcontribution to rice and wheat production rose steadily. This can be mainly attributedto the dissemination of multi-pattern practice of returning straw to the field, the "K-supplementing project" and balanced fertilization techniques through the research andadvisory system in the province during this period. Nevertheless, it is important to notea trend towards poor soil physical and chemical properties. Though soil readily avail-able K was recovering, levels still ranged below those found in the second soil surveyduring the 1980's. It is a long-term challenge to halt the decline of soil K. Accordingto the requirements of the agricultural development plan of the Jiangsu Province forthe early 2000's and based on cultivation experience and the nutrient balance method,Jiangsu's demand for fertilizers in 2005 and its nutrient composition are predicted.Based on this, the demand for N is 1.5862 Mt, for P205 0.6473 Mt and for K20 0.7044Mt, forming an N:P205 :K20 ratio of 1:0.41:0.44. In order to ensure the supply of agri-cultural products and to promote sustainable development of agriculture with highyields, quality and benefit, it is important to readjust the total quantity of mineral fertil-izer input. An optimization of the fertilization system means to improve fertilizationefficiency by making rational plans, applying fertilizers in a scientific way and by in-tensifying the fertilizer management. Through the extension of reducing N and sup-plementing K for balanced fertilization, more efforts should be made to improve tech-niques and mechanisms as well as to promote the extension of improved soil manage-ment and fertilization techniques.
Introduction
Located at the lower reaches of the Changjiang River, the Jiangsu Province has a totalarea of 0.1026 M km2, accounting for only 1.05% of the country's total area, and has apopulation of 70 M people which means less than 0.067 ha of cultivated land per capitaare available for crop production. It is a typical province that has a large population,small land resources. The province has six major agricultural regions, Taihu (the TaihuLake region), Yanjiang ( areas alongside the Changjiang River), Yanhai (coastal re-gion), Ning-Zhen-Yang Hills (Nanjing-Zhenjiang-Yangzhou region), Lixiahe and Xu-
161

huai, producing mainly cereals (rice, wheat, barley, rye and maize), cotton and vegeta-ble oils (oilseed rape and peanut). Having only 4.7% of the country's farmland, Ji-angsu produces 7% of the China's cereals, approx. 10% of the country's cotton and 7%of the country's oil. During the late 1990's, the agriculture and rural economy showeda trend towards the following:I) The agricultural production conditions were improved and the ability to produce
major agricultural and sideline products was further strengthened. For four consecu-tive years, excellent yields were achieved. For the first time, the highest historicalproduction of 35 Mt grain was recorded in Jiangsu in 1997. In 1999, the productioncould be further improved up to 35.59 Mt, achieving the best annual average yieldha-t during the period from1995 to 1999. In 1999, the output of vegetable oilreached 1.84 Mt, about 15.7% larger than that in 1995, being the highest historicalrecord in acreage, yield and total output in oil production. The output of cotton was0.246 M1, about 56.2% lower than in 1995 as a result of the macroscopic-factor-induced reduction in cultivated cotton area. A synchronized development of forestecology and forestry industry was achieved. In 1999, the total rural social outputvalue of the province reached 1,308,771 M Yuan, 23.8% higher than in 1995. Thegross output value of agriculture, forestry, animal husbandry and fisheries was183,740 M Yuan, a 7.2% increase compared to 1995 on the basis of comparableprices. The farmers' net income per capita was 3,495.2 Yuan, 42.2% higher than in1995. Obviously, the rural integrated economic strength was further strengthened.
2) The process of readjusting the industrial structure was sped up by continuous ra-tionalization. In 1999, the ratio of the primary, secondary and tertiary industries was14:77:9 and increased by about 2 percentage points in the secondary and tertiary in-dustries compared to 1995. The proportion of high quality farm products increasedso that in 1999, the area of quality japonica rice rose to 77% and the area of qualityoilseed rape to I 1%.
3) The results of invigorating agriculture by developing science and education weresignificant, and the contribution of science and technology to agricultural develop-ment was also increased. Three fields of innovations are envisaged, including seeds,techniques and knowledge. The "seed breeding project", the "K-supplementationproject" and the "balance fertilization project" were launched and implemented inthis course. The contribution of science and technology to the growth of agriculturerose from 45% in 1995 to 51.4% in 1998, 10 percentage points higher than thecountry's average.
4) A big headway was made in agricultural industrialization. Advantages of regionalscale for 3 highly-efficient animal husbandry belts in Jiangnan, Huainan andHuaibei and 10 horticulture bases were taking shape.
162

Results and analysis of the changes in soil fertility in Jiangsu
Changes in fertility of major soil types in different agricultural regions
Based on the findings of 8 national and 72 provincial long-term stationary soil fertilitymonitoring posts all over the province and some local soil monitoring sites, the dynam-ics of the changes in fertility of the major soil types of the province are summarized inthe following.
Yield in relation to soil fertility and contribution of indigenous soil fertility
Indigenous soil fertility, though the result of a number of factors, is still an importantindex for evaluating soil fertility and integrated productivity of the soil. Generally, it isexpressed by the yield of a crop grown in soil without fertilization. To facilitate itscomparison with the yield of crops grown in fertilized soil, indigenous soil fertility asproportional contribution to yield is used. With the other conditions being the same,the yield of a crop grown in soil without fertilization (omitting nutrient application inthe measured crop) is set against the yield of the crop grown in soil fertilized at a con-ventional rate expressed as percentages. For example, looking at the two major cerealsrice and wheat in Jiangsu in the 1990's, for both the yields of unfertilized and conven-tionally fertilized crops were rising (Table 1).
Table 1. Variation of the proportional contribution of indigenous soil fertility to theproduction of rice and wheat in Jiangsu in the 1990's
Wheat RiceYear Sample Yield (kg ha') CISF * Sample Yield (kg ha') CISF*
(n1.) CK Fertil- (%) (n.) CK Fertil- (%)ized ized
1990 76 1695 4155 40.8 64 4575 7080 64.61995 42 2235 4545 49.2 41 5100 8130 62.71999 59 2820 5010 56.3 48 5535 8295 66.7
*: Contribution of indigenous soil fertility.
The contribution of indigenous soil fertility to wheat yield rose from 40.8% in 1990 to49.2% in 1995 and to 56.3% in 1999. In the case of rice, it decreased from 64.6% in1990 to 62.7% in 1995 and increased again to 66.7% in 1999. The contribution of in-digenous soil fertility in the latter case is on average 10 percentage points higher thanin the former case, indicating that rice depends more heavily on soil fertility thanwheat. The built-up of soil fertility helps to lower fertilization costs and to increasereturns from fertilization. Indigenous soil fertility of the regional soils in rice andwheat production areas of the province varied unevenly and sharply during the periodfrom 1990 to 1999. For example, in 1997 the contribution of indigenous soil fertility ofHuanggangtu soil in the Zhenjiang Hilly regions was 45% - 50% in rice and 20% -
30% in wheat, while that of a whitish soil in Yixing was 73.1% and 48.2%. Recently,
163
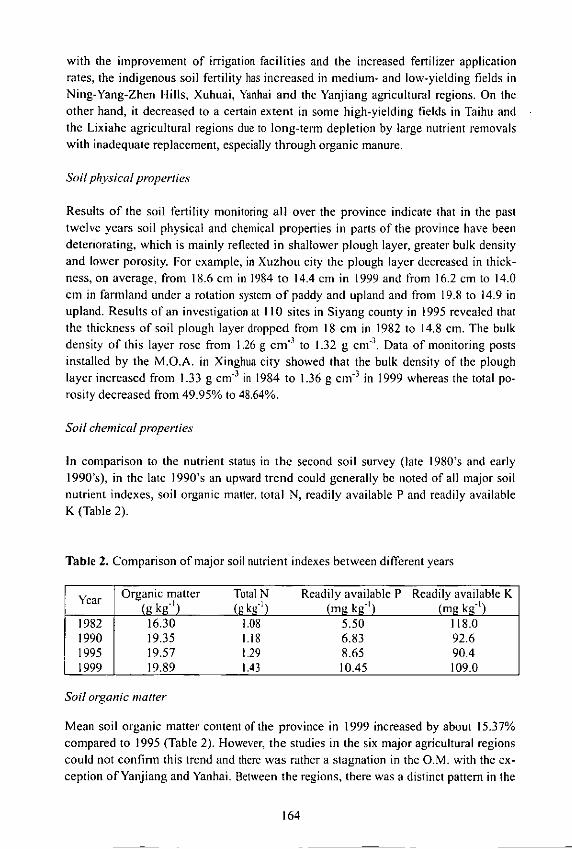
with the improvement of irrigation facilities and the increased fertilizer applicationrates, the indigenous soil fertility has increased in medium- and low-yielding fields inNing-Yang-Zhen Hills, Xuhuai, Yanhai and the Yanjiang agricultural regions. On theother hand, it decreased to a certain extent in some high-yielding fields in Taihu andthe Lixiahe agricultural regions due to long-term depletion by large nutrient removalswith inadequate replacement, especially through organic manure.
Soil physical properties
Results of the soil fertility monitoring all over the province indicate that in the pasttwelve years soil physical and chemical properties in parts of the province have beendeteriorating, which is mainly reflected in shallower plough layer, greater bulk densityand lower porosity. For example, in Xuzhou city the plough layer decreased in thick-ness, on average, from 18.6 cm in 1984 to 14.4 cm in 1999 and from 16.2 cm to 14.0cm in farmland under a rotation system of paddy and upland and from 19.8 to 14.9 inupland. Results of an investigation at 110 sites in Siyang county in 1995 revealed thatthe thickness of soil plough layer dropped from 18 cm in 1982 to 14.8 cm. The bulkdensity of this layer rose from 1.26 g cm'3 to 1.32 g cm -'. Data of monitoring postsinstalled by the M.O.A. in Xinghua city showed that the bulk density of the ploughlayer increased from 1.33 g cm-3 in 1984 to 1.36 g cm-' in 1999 whereas the total po-rosity decreased from 49.95% to 48.64%.
Soil chemical properties
In comparison to the nutrient status in the second soil survey (late 1980's and early1990's), in the late 1990's an upward trend could generally be noted of all major soilnutrient indexes, soil organic matter, total N, readily available P and readily availableK (Table 2).
Table 2. Comparison of major soil nutrient indexes between different years
Year Organic matter Total N Readily available P Readily available K(g kg') (g kg1) (mg kg') (mg kg-1)
1982 16.30 1.08 5.50 118.01990 19.35 1.18 6.83 92.61995 19.57 1.29 8.65 90.41999 19.89 1.43 10.45 109.0
Soil organic matter
Mean soil organic matter content of the province in 1999 increased by about 15.37%compared to 1995 (Table 2). However, the studies in the six major agricultural regionscould not confirm this trend and there was rather a stagnation in the O.M. with the ex-ception of Yanjiang and Yanhai. Between the regions, there was a distinct pattern in the
164

soil organic matter contents in the following order of Taihu > Lixiahe > Yanjiang >Hills > Xuhuai > Yanhai. It needs to be noted that 4 years is not a period which can beregarded as very representative and indicative for the dynamics in O.M. which usuallytakes longer unless very dramatic measures have been taken, e.g. application of hugeamounts of organic manure, etc.
Table 3. Change in soil organic matter in Jiangsu during the late 1990's (g kg-')
Region 1995 1996 1997 1998 1999Taihu 28.48 28.71 28.93 28.55 28.45
Lixiahe 21.33 21.57 21.99 21.94 21.95Yanjiang 19.74 20.08 19.98 19.89 19.92
Hills 18.64 18.63 18.51 18.33 18.61Xuhuai 15.44 15.29 15.73 15.81 15.88Yanhai 13.78 13.55 13.98 14.62 14.53Mean 17.24 19.63 19.85 19.73 19.89
Total N
The mean total soil N of the province increased from 1.29 g kg' in 1995 to 1.44 g kg- 'in 1999. by 12% or at an annual rate of 0.0375 g kg' (Table 4). The increment was thelargest in the agricultural regions Xuhuai and Lixiahe and then in the regions Hills,Yanhai and Yanjiang and at last in the region Taihu, where the total soil N leveled off.The mean value of total soil N in the six regions were in the order of Taihu > Lixiahe >Hills > Yanjiang, Xuhuai > Yanhai.
Table 4. Changes in total N in soils of Jiangsu during the late 1990's (g kg')
Region 1995 1996 1997 1998 1999 1995-1999(in %)
Taihu 1.80 1.92 1.86 1.66 1.79 0Lixiahe 1.26 1.49 1.26 1.48 1.52 21Yanjiang 1.32 1.42 1.36 1.38 1.38 4Hills 1.37 1.39 1.44 1.49 1.47 7Xuhuai 1.06 1.19 1.37 1.36 1.38 30Yanhai 0.95 1.06 1.05 1.17 1.08 14Mean 1.29 1.41 1.39 1.42 1.44 12
Readily available P
The mean readily available P in the soils of the province rose faster in the late 1990's,which is associated with the vigorous extension of the application of P, including com-pound (blended) fertilizers during this period (Table 5). It was raised by 21% over thatin 1995 and by 90.18% over 5.5 mg kg-' in 1982. But readily available P varied
165

strongly between agricultural regions. The largest increase was recorded in Lixiahe,reaching 1.55 mg kg-' per year, while it dropped signficantly in Yanjiang and Hills by-20% and -11% compared to 1995. The agricultural regions could be arranged accord-ing to their available P contents in the soil in the order of Xuhuai > Hills > Lixiahe>Yanhai > Taihu > Yanjiang in 1999.
Table 5. Changes in readily available P in soils of Jiangsu during the late 1990's(mg kg-')
Region 1995 1996 1997 1998 1999 1995-1999
I%)Taihu 6.27 7.58 8.1 7.4 8.03 28Lixiahe 6.33 10.58 8.3 12.34 12.55 98Yanjiang 7.68 6.09 6.63. 5.34 6.18 -20Hills 15.02 15.16 15.14 12.5 13.4 -I1Xuhuai 10.75 12.87 12.79 13.49 13.57 26Yanhai 5.87 7.26 6.5 10.17 9.07 54Mean 8.65 9.9 9.58 10.21 10.47 21
Readily available K
After 1995, when Jiangsu was the first province to propose and implement the "K sup-plementation project", the downward trend of soil readily available K was effectivelyhalted and turned into a rising trend (Table 6). The mean content of readily available Kof the province's soils increased by about 20 % from 1995 to 1999. It rose at a rate of4.7 mg kg' per year. But it was still lower than during the second soil survey in the1980's. Based on K levels, the six agricultural regions were in the order of Yanhai >Lixiahe > Hills. Xuhuai > Yanjiang > Taihu, with the latter three regions revealing stilllow K availability in their soils.
Table 6. Changes in readily available K in soils of Jiangsu during the late 1990's(mg kg-)
Region 1995 1996 1997 1998 1999 1995-1999(%)
Taihu 79.38 74.47 80.63 75.7 86.56 9Lixiahe 98.02 103.89 105.56 135.57 127.89 30Yanjiang 74.73 75.57 74.15 85.24 88.13 18Hills 77.42 78.04 79.51 115.5 107.41 39Xuhuai 83.8 86.72 87.67 109.76 98.76 18Yanhai 128.76 131.74 131.88 145.32 144.78 12Mean 90.35 91.74 93.23 111.18 108.92 20
166

Available nicronutrients
The soil samples from 80 soil monitoring posts all over the province were also ana-lyzed for available micronutrients in 1997 (Table 7). Available Cu was commonlyhigh, except for a few soil types. Available Zn was higher in South Jiangsu than inNorth Jiangsu. Though it was lower in Xuhuai and Yanhai, it was still above the criti-cal value of 0.5 mg kg-. Available Mn varied strongly and was higher in Hills, Lixiaheand Taihu and lower in Xuhuai. The regions varied in the supply of these differentmicronutrients, depending on the element. For available Cu, the order was Taihu >Hills > Lixiahe > Yanjiang > Xuhuai > Yanhai, for available Zn Lixiahe > Yanjiang >Taihu > Hills > Yanhai > Xuhuai, for available Mn Hills > Lixiahe > Taihu > Yanjiang> Yanhai > Xuhuai.
Table 7. Status of available micronutrient contents in soils of Jiangsu in 1997
Region Cu Zn Mn.......................... (m g kg-1) ....... ...... ......
Taihu 5.98 2.32 86.8Lixiahe 4.56 2.60 92.9Yanjiang 4.18 2.51 68.8Hills 5.00 2.26 101.5Xuhuai 2.83 1.72 39.9Yanhai 2.71 1.76 52.7Mean 4.01 2.12 64.9
Causes of changes in the indigenous soil nutrient supply in Jiangsu during the late1990's
Multi-pattern practice of returning crop residues to the field
In the 1990's, the traditional practice of preparing and applying organic manure couldnot keep soil fertility at a satisfying level. In particular, green manure crops are onlygrown in small patches, totaling less than 0.1333 M ha. Multi-patterned practice ofreturning crop residues to the field has shown to be an effective measure to increaseinput of organic material into the farmland. During the late 1990's, the province pro-duced approx. 50 Mt of crop residues annually. In addition to the movement of "theyear of raising farmland quality" and other activities such as the enforcement of theban of burning of straw and the popularization of the technique of "comprehensiveutilization of straw", increased the amount of straw returned to the field up to one-thirdof the total amount produced. According to statistics, the area of farmland where thepractice was adopted rose from 2.33 M ha in 1985 to 4.0 M ha in 1995 and 4.67 M hain 1999, and the rate also increased from 1,650 kg ha-' in 1985 to 3,570 kg ha-' in1999. The recycling of straw in the farmland ecosystem has laid down a basis formaintaining and raising soil organic matter and soil fertility, and partially makes up forthe shortage of mineral K fertilizers in China- At the same time, wastes from livestock
167
and some other organic wastes are processed into refined organic manure through spe-cial fermentation, which is also a new approach to raise soil organic matter for produc-tion of quality products.
Balanced fertilization
During the late 1990's, the extension of the "technique of balanced fertilization" wasintensified, by setting up 13 balanced fertilization demonstration counties (cities) inJiangsu. Launching a movement of "extending balanced fertilization by conductingintegrated soil testing, designing formulas and supplying fertilizer to one thousandvillages" aimed at improving the fertilization practices. The establishment of an inte-grated service of soil testing, designing of fertilizer formula, production, supplying andapplication, the system of fertilizer input and the fertilizer recovery rate were im-proved. In 1995, the total input of NPK (in blended fertilizers) was 1.50 Mt N, 0.2153Mt P205 and 0.2052 Mt K20, forming a ratio of 1:0.14:0.14. In 1999, though the acre-age of farmland shrank to some extend, the output of cereals, cotton and vegetable oilwas increased and the input of NPK fertilizers was 1.6162 Mt N, 0.4066 Mt P20 5 and0.2856 Mt K20, forming a ratio of 1:0.25:0.18. The increment in NPK application wasbig and their ratio improved. Over 40% of the farmlands used formulated blended fer-tilizers at that time.
Prediction of Jiangsu's demand for fertilizers in the period until 2005
Basis for prediction
For this prediction the agricultural development plan of the Jiangsu Province 2001-2005 and the following analysis were used.
Demand for assurance of supply of agricultural products
According to the agricultural development plan of the province for the next five years,the gross agricultural output value should increase at a rate of 4%, and the farmers' percapita net income per year should improve at a rate of 6%. In 2005, the contribution ofscience and technology should account for 60% of the agriculture economical growth.In crop production, the ratio of cereals and cash crops should reach 60:40, and foddercrops should account for 12% of the cereals, gradually forming an appropriate patternof crop cultivation. The total output of cereals should be controlled at around 27.50 Mt,of which 18.25 Mt will be rice. For cereal production with the total output under con-trol, the acreage of cultivation should be reduced and the quality of products improved.In 2005, the total output of cereals should be adjusted to meet the need for the cerealconsumption and seed production. For rice cultivation, the development of quality riceshould be intensified to account for 50% of the rice production in the province. Thequality of wheat should also be improved. While the cereal production will be reduced,quality oilseed rape production should be expanded. The total output of vegetable oil isplanned to be 2.20 Mt. For cotton cultivation, the area of cotton cultivation should be
168

maintained or restored, with emphasis on producing quality cotton. The total output ofcotton is planned to be 0.385 Mt. Special-purpose cereals and special cash cropsshould be developed intensively. For vegetable cultivation, the variety of vegetablesshould be further diversified and the product quality improved. The planned area ofvegetable cultivation should reach 1.0667 M ha. The total output of fruit should beabout 2.15 Mt by simultaneous developing the fresh fruit and dry fruit production. Thetotal output of tea should be 0.018 Mt according to the plan. The emphasis of tea pro-duction should be on developing high-grade quality famous tea and deep processedtea. The production of flowers should be concentrated on ornamental saplings and bon-sais. For animal husbandry, the emphasis is on maintaining the number of pigs andpoultry and on increasing the number of goats, dairy cows and special animals. Thegross output value of animal husbandry is planned to be 32 billion Yuan (on the basisof the fixed prices of 1990), accounting for 30% of the gross agricultural output value.For forestry, the forest coverage of the province should be increased to up to 12% byafforesting 66,700 ha and by opening up 10,000 ha of hills for forestation. The totaloutput value of forestry is planned to reach 15 billion Yuan. Farmland with slopes ofmore than 25 degrees in hilly regions and farmland in aeolian-sand-stricken areas inthe plains should be afforested instead of being cropped. The input of fertilizers mustmeet the demand of the production of these agricultural products.
Demand for higher quality of agriculttral products and protection ofjagriculturalenvironment
Currently, the relationship between demand and supply of agricultural products isshifting in nature from quantity to quality and structure. Particularly, the production ofcereals has shifted from long-term deficit to surplus in the total quantity coupled withstructural shortage. The shift of the demand for agricultural products from quantity toquality and variety is becoming more obvious. Agricultural development used to belimited by one single factor which was the availability of resources. It is now deter-mined by mainly two factors, e.g. the market and the resources, with the former be-coming the dominant one. With the development of the economy, the pressure on qual-ity and safety of agricultural products and the deterioration of the environment is in-creasing. Currently, the issue of pollution damaging the environment in Jiangsu gainsin importance, for instance, soil erosion, pollution of agricultural irrigation water andsoil, worsening quality of farmland, discharge of wastes in large quantities and over-dose of fertilizers and agricultural chemicals, etc.. They cause the aggravation of theeutrophication of the Taihu Lake water and poorer quality of agricultural products bycontaining for example substances which are detrimental to human health. With thedomestic country-wide opening of the market to the world market, the agriculturalproducts of the province are confronted with the ever-growing pressure of competitionin the domestic and world markets. Low-priced quality agricultural products fromother areas pose a thread to the agricultural products of the province. Therefore, it isurgent for the province to develop new quality fertilizers to optimize the structure ofmineral fertilizer products, to raise their quality and grade, to improve their applicationmethods, to make a scientifically based fertilization plan, to reduce fertilization cost, to
169

minimize fertilizer losses, to increase fertilization returns and to improve the qualityand safety of agricultural products and to protect the environment.
Sustainable development of agriculture
The central and the provincial governments clearly stated this year that the main workin agricultural and rural areas in the years to come will be to promote the structuralreadjustment of the agricultural and rural economy and to work on the soil and fertil-izer issues. The major problems are inadequate input of quality organic manure, com-mon shortage of P and K in the soil, depletion of other macronutrients (Ca, Mg, S) andmicronutrients from the soil, irrational structure of fertilization and fertilization plan-ning, overdose of N in fertilization, low recovery rate of mineral fertilizers and seriousagricultural pollution of the environment. Therefore, it is essential and urgent to im-prove the quality of the farmland by "taking immediate measures in combination witheffecting a permanent cure". The extension of balanced fertilization techniques shouldbe intensified and the system of fertilizer input optimized, raising the integrated farm-land productivity and promoting a sustainable development of an agriculture, high inquality and efficiency. For the structural readjustment of agriculture, it is urgent tochange the core of the work on soils and fertilizers in the following aspects: From thepursuit of high yield towards high quality; from providing technical guidance for thecultivation of cereals, cotton and oil crops towards technical services for introducingand improving the cultivation of vegetables, fruit and tea; from providing mere tech-niques for agricultural production towards pre- and post- production services; and frombasal-based fertilizer formulations to the supply of need-adjusted fertilization concepts.For the input of fertilizers, therefore, it is essential to practice the combination of min-eral fertilizers with organic manure, to optimize the NPK ratio and to improve the sup-ply of the remaining macro- and micronutrients needed by crops.
Fertilizer resources and fertilizer production capacity
Jiangsu only produces two-thirds or three-quarters of the fertilizers it needs for supply-ing its agricultural production. The gap in the supply of high-quality N fertilizers islarge; the supply of mineral K fertilizers is extremely short and the supply of P fertiliz-ers is about adequate. The problem of the product structure of N and P fertilizers isserious. The capacity for the production of ammonium bicarbonate and P fertilizers isin surplus, which, however, have a poor grade and have a simple composition. Theproduction capacity for ammonium bicarbonate is 5 Mt a year and for P fertilizers0.594 Mt (P205 ). The output of blended fertilizers in Jiangsu reaches 7 Mt, accountingfor 1/10 of the country's production, but it depends heavily on raw materials importedfrom other provinces and other countries. Moreover, having mainly low concentrationfertilizers and irrational fertilizer systems, the market adaptability is difficult and thecompetitive power weak. It is essential to put more emphasis on readjusting productstructures in the fertilizer market, to improve technical development in the processesinvolved, to provide post-sales services and to adopt operational mechanisms suitingthe markets.
170

Prediction of nutrient demand based on two methodological approaches
There are many methods that can be used to predict the demand for fertilizers. In thefollowing two methods are used: 1. Cultivation experience method and 2. The nutrientbalance method.
Cultivation experience method
Based on years of cultivation experience the quantity of fertilizers needed is calculatedby multiplying the amount of nutrients required for an expected yield by the area ofthat respective crop. The total amount is obtained by the sum of nutrient requirementof all crops (area x uptake per unit area).
Results of the prediction
Based on the cultivation experience method, .liangsu needs 1.7639 Mt N, 0.6138 MtP20 5 and 0.5358 Mt K20 in 2005, which will result in a NPK ratio of 1:0.34:0.30. Thepredicted demand for fertilizers increases about 11%, 51% and 89% for N, P20 5 andK20 respectively, in comparison to 1999 (Table 8).
Table 8. Predicted demand of NPK fertilizers for Jiangsu in 2005 based on thecultivation experience method
Target Planned Target Input of nutrients Total demand ofCrop output area yield (kg ha') nutrients (I 03t)
(M 3 (103 ha- ) (kgha-1) N P20 5 K20 N P20 5 K20Rice 18.25 2333 7830 210 53 53 490 123 123Wheat* 9.0 2000 4500 180 60 45 360 120 90Com 2.4 400 6000 203 60 53 81 24 21Cotton 0.385 367 1050 240 83 68 88 30 25Oilseedrape 1.675 667 2512 225 113 60 150 75 40Peanut 0.5 133 3750 34 83 90 5 11 12Sesame 0.025 17 1500 150 75 75 3 I 1Yam 1.0 167 6000 68 15 15 11 3 3Soybean 0.61 213 2850 0 45 15 0 10 3Vegetables* 1067 450 150 150 480 160 160Fruit 2.15 167 12900 375 225 225 63 38 38Tea 0.018 20 900 128 105 150 3 2 3Green 12.0 133 30000 0 68 45 0 9 6manureOthers* 32 1 12Total 7684 1764 61 536* Wheat actually comprises wheat, barley and rye; for vegetables the data are the
mean values of several crops per year, excluding the amount of organic manure ap-plied; and the item of others includes forestry, fisheries, animal husbandry and lawns.
171

Nutrient balance method
The calculation is performed by multiplying the total amount of nutrients required by acrop to meet the target yield by the amount of nutrients (%) in the fertilizers. Than theresult is divided by the recovery rate of the fertilizers. The equation is as follows: F =A* (1-S016)IFt, where F is the predicted amount of a certain nutrient; A the total amountof the nutrients needed to reach a certain target output; S is the percentage of the nutri-ents supplied by the soil; Fu for the recovery rate of related fertilizers. The contributionfrom the indigenous supply of the soil ranges between 50% and 70%. In this equation,S has been set as 55%. Fu for N, P and K fertilizers is set as 35%, 30% and 60%, re-spectively. Based on an economical yield of 100 kg the nutrient requirements by cropshave been calculated (Table 9).
Table 9. Predicted demand of NPK fertilizers for Jiangsu in 2005 based on the nutrientbalancing method
Target Planned Target Input of nutrients Total demand ofCrop output acreage yield (kg) nutrients (103t)
(Mt) (10 3 hi) (kgha- ) N P 20 5 K 2 0 N P205 K 20
Rice 18.25 2333 7830 1.99 0.98 2.6 415.5 268.6 356Cereals* 9.0 2000 4500 2.73 0.87 2.18 316 117.5 147.2
Corn 2.4 400 6000 2.21 0.98 2.60 68 35 46.8Cotton 0.385 367 1050 5.08 1.93 3.18 25.2 7.3 9.2
Oilseed rape 1.675 667 2512.5 4.75 1.90 3.29 102.3 47.7 41.3Peanut 0.5 133 3750 5.53 0.99 1.88 35.5 7.4 7.1Sesame 0.025 17 1500 3.47 1.77 3.13 1.1 0.7 0.6
Yam 1.0 167 6000 2.15 0.95 2.31 27.6 16.0 17.3Soybean 0.61 213 2850 7.56 1.85 3.6 59.1 16.9 16.4
Vegetables* 40.0 1067 0 0.4 0.5 0.5 204.8 112.5 150Fruit 2.15 167 12900 1.6 1.2 2.2 44 25.8 35.4Tea 0.018 20 900 4.7 0.8 1.95 1.1 0.2 0.3
Green 12.0 133 30000 0.5 0.09 0.37 766.8 16.2 33.3manureOthers* 7684 31.5 9.0 12.0
Total 1408.5 680.8 872.9*: "Cereals" comprises wheat, barley and rye; for vegetables the data are the mean
values of several crops per year, excluding the amount of organic manure applied;and the item of others includes forestry, fisheries, animal husbandry and lawns.
According to this method, Jiangsu needs about 1.4085 Mt N, 0.6808 Mt P205 and0.8729 Mt K20 in 2005. This differs from the prediction based on the cultivation ex-perience method. For N this is 0.3554 Mt less, for P20 5 0.067 Mt more and for K200.3371 Mt more than current amounts applied. This indicates that there is a potentialfor saving N by using this method. According to the calculations, the current P applica-tion rate can roughly maintain the soil P balance whereas to halt a further decline insoil potassium, K application rate has to be greatly increased. Using the average of
172

both methods, the mean fertilizer demand has been calculated, which is 1.5862 Mt N,0.6473 Mt P20 5 and 0.7044 Mt K20 with a N : P20 : K20 ratio of 1:0.41:0.44 (Table10).
Table 10. Averaged demand for fertilizers in Jiangsu in 2005 based on the predictionsusing two different methods (103t)
Method N P20 5 K20 N: P205:K 20
Cultivation experience 1763.9 613.8 535.8 1:0.34:0.30Nutrient balance 1408.5 680.8 872.9 1:0.48:0.62Mean 1586.2 647.3 704.4 1:0.41:0.44
Looking at the fertilizer resources and the production capacity of the province, meetingthe target of balancing N and possibly fulfilling the need for P fertilizers is very diffi-
cult. However, it is essential to readjust the product structure of N and P fertilizers cor-respondingly by raising the proportion of highly concentrated fertilizers and improvingthe quality grade of fertilizers. For N fertilizers, it is necessary to reduce the production
of ammonium bicarbonate or modify the product, to develop granular ammonium bi-carbonate, granular NK fertilizers or controlled-release ammonium bicarbonate. At thesame time, the proportion of highly concentrated N fertilizers (e.g. urea) should beincreased. The Jiangsu Province is extremely short of K resources and has to recycle asmuch of the K as possible by organic manure and by intensifying the practice of re-turning straw. Due to the increasing reluctance of farmers to handle large quantities ofbulky material, possibilities of developing commodity organic manure need to be ex-plored. The Jiangsu Province should develop crop-specific formulated compound orbulk blended fertilizers, containing the three macronutrients NPK and where neededMg, S and Ca. Furthermore, a mix of organic and inorganic nutrient sources formu-lated in one compound can help to alleviate deficiencies in other macronutrients (Mg,S, Ca) or micronutrients (B, Cu, Zn etc.). By introducing a fertilizer registration sys-tem, the supervision and management of fertilizer quality and the extension of bal-anced fertilization should be intensified. There is a need for readjusting the structure ofthe fertilizer input by saving and supplementing K, by improving the nutrient recoveryrate (more efficient use of inorganic and organic fertilizer resources) and through pro-moting a sustainable development of agriculture in Jiangsu.
173


The status quo of and a strategy for improved farmland nutrient bal-ances in Shanghai
Tian Jilin and Wang Yinhu
Environment Research Institute, Shanghai Academy of Agricultural Science, 201106
Abstract
Investigations were conducted on the application of fertilizer in two rotation systems
(rice-wheat and rice-oilseed rape) in the suburbs of Shanghai. Results show that thefarmland nutrient balance changed with changing cultivation pattern, mainly because
of N dosage. It is, therefore, essential to take practices into consideration, such aslowering N application rate, applying more organic manure and keeping NPK in bal-ance. Based on the status quo of fertilization, the paper suggests the practices of re-
turning straw to the field, recycling of potassium, allocation of organic wastes, lower-ing application rate of mineral fertilizers and readjusting planting structure by increas-ing the area of green manure and fallow fields. More P and K will be needed in areaswhere reduced tillage practices are introduced.
Introduction
The suburbs of Shanghai, as part of the Taihu high yield region in China, have a totalof 0.32 million ha cultivated land with the rotation systems rice-wheat and rice-oilseed rape as the major cultivation pattern. The area of paddy rice is maintained ataround 0.213-0.22 million ha, that of wheat and barley at 0.08 million ha, that of oil-seed rape at 0.053 million ha and that of vegetable at 0.01-0.012 million ha. The agri-cultural production is increasingly facing the problem of low output : input ratios withregard to fertilizer use. Therefore, the aim of this study was the attempt to assess al-ternatives to current practices which include the possible readjustment of the cultiva-tion system, especially for summer crops except rice, which will remain unchangedwith regard to area. Another aspect which needs attention is the possible changes inthe nutrient requirement when the cultivation pattern of paddy fields changes fromdeep ploughing to non-tillage or direct seeding. The study on the current farmlandnutrient balance, therefore, is of great significance for the maintenance of sustainedhigh yields and the rationalization of fertilization in agriculture.
Nutrient balance of farmland for major crops
Rice
Rice has the largest share of cultivated land in the suburbs of Shanghai with high out-put, accounting for 80% of the total grain output in Shanghai. The agro-ecologicalregion around Shanghai is characterized by rice grain yields which have been main-
175

tained above 7,500 kg ha-' for many years and by an intensive consumption of min-eral fertilizers which to a great extent has driven the production to the current level.Investigations in the early 1990's revealed that organic manure supplied 66.2 kg ha1N, 102.8 kg ha t P20 5 and 45.8 kg ha-' K20, while mineral fertilizers contributed222.9 kg ha-1 N, 30.6 kg ha- P20 5 and 12 kg ha-' K20, leading to a nutrient input of1:0.46:0.20 in N:P 20 5 :K20. The N:P20 5 ratio, being close to 1:0.5, is basically ac-cording to crops' demand, but K is slightly below the crop requirement. In recentyears, changes in the rice cultivation pattern have led to a larger proportion of directseeding by broadcasting the seed and higher N application rates, leading again to anNP imbalance (Table 1).
Table I. Current nutrient input and output in irrigated rice based systems in the sub-urbs of Shanghai
OM CR GM Subtotal MF Total Output Balance(organic) (org + MF)
(kg ha- )N 65.0 5.2 5.7 75.9 289.5 365.4 143.7 +221.7P20 5 85.8 1.4 1.7 88.8 12.9 101.7 68.7 +33.0K20 52.0 9.5 5.0 66.5 3.9 70.4 164.3 -93.9Ratio 1:1.2:0.9 1:0.04:0.01 1:0.28:0.19 1:0.48:1.14
Note: OM stands for organic manure, CR for crop residues, including rice straw andoilseed rape stalks, GM for green manure crop and MF for mineral fertilizers
The comparison of the input and output ratios indicate the discrepancy between sup-ply and demand which is also reflected by the surplus application of N and the under-supply of K. Whereas in the current fertilizer management in rice P has still a slightsurplus of about 33 kg per crop per hectare, there is a negative balance of K and 93.9kg K20 ha' are lost from the soil by the rice crop. N application rate is 2.5 times lar-ger than the amount absorbed by rice. According to several stations, a non-fertilizedcrop of rice can yield on average 5,385 kg ha-' by relying solely on the soil nutrientsupply. This means that at the current application rates the theoretical yield contribu-tion of N fertilizers could be 2,070 kg ha -'. However, the poor N efficiency leads tothe fact that 20 kg of mineral nitrogen fertilizers are needed to produce only around140 kg additional grains. The results of recent studies indicate that the application of195 - 240 kg of mineral fertilizers per hectare seem to be adequate under the currentcultivation conditions.
Wheat
The area of wheat cultivation is about one-third of that occupied by rice in the suburbsof Shanghai. With regard to nutrient management, wheat receives a little more organicmanure than rice (Table 2) and also more P and K fertilizers, but less N fertilizers.This may be explained by the lower yield of wheat. The N application rate for wheathas increased by 21.9%, over 170.4 kg ha' from the early 1990's until today. As aresult of increased organic manure, the present NPK ratio is 1:0.50:0,36 with P and K
176

well in balance both in rate and ratio. The application rate of N, however, is still veryhigh, about 3.8 times as much as its absorption, which may be related to surfacebroadcasting of N fertilizers under direct seeding conditions. Due to the large amountof organic manure combined with straw and a small amount of mineral K, the K bal-ance for wheat is positive. With a larger surplus this also relates to P which in the longrun, however, may lead to an accumulation. N and P application levels need to becorrected.
Table 2. Current nutrient input and output for wheat in the suburbs of Shanhai
Organic Straw Mineral Total Output Balancemanure fertilizer
(kg ha-)N 94.3 16.5 207.8 318.6 83.4 +235.2P20 5 124.7 4.8 31.5 161.0 42.9 +118.1K20 75.6 34.2 6.3 116.1 50.4 +65.7
Note: OM stands for organic manure, SR for straw returned, and MF for mineralfertilizers
Oilseed rape
Table 3 shows fertilization for oilseed rape which is almost similar to that of wheat.Today, organic manure contributes more nutrients to the crop nutrition than it did inthe early 1990's. The application rate of mineral N fertilizers has increased by 5.4%.P is adequately supplied and K is kept basically in balance. With these applicationrates of both mineral and organic sources a positive balance of almost 193 kg N ha-,132 kg P20 5 and 30 kg K20 ha-' is observed. It again shows that N and P are largelyoversupplied which in case of N may be due to the poor N efficiency caused by largeN losses. In case of P, the oversupply may lead to a strong P accumulation in the soil.
Table 3. Nutrient input and output for rape (kg ha-)
Organic manure Mineral fertilizers Total Output Balance(kg ha-')
N 86.1 187.4 273.5 80.9 +192.6P20 5 113.7 55.0 168.7 37.1 +131.6K20 69.0 5.3 74.3 45.0 +29.3
Considering the whole rice-wheat or rice-oilseed rape rotation may give a better re-flection of the true nutrient balance of the farmland in the region (Table 4 and 5). Thefigures indicate that both of the two important rotation systems in the suburbs ofShanghai lose substantial amounts of K from their soil reserves every year. The rice-wheat rotation system loses 32.7 kg K20 per ha and rice-oilseed rape about 64.7 kgha'. On the other hand, soils gain to a great extent in N and to a slightly smaller ex-tent in P due to surplus application of both nutrients. The nutrient balances shown
177
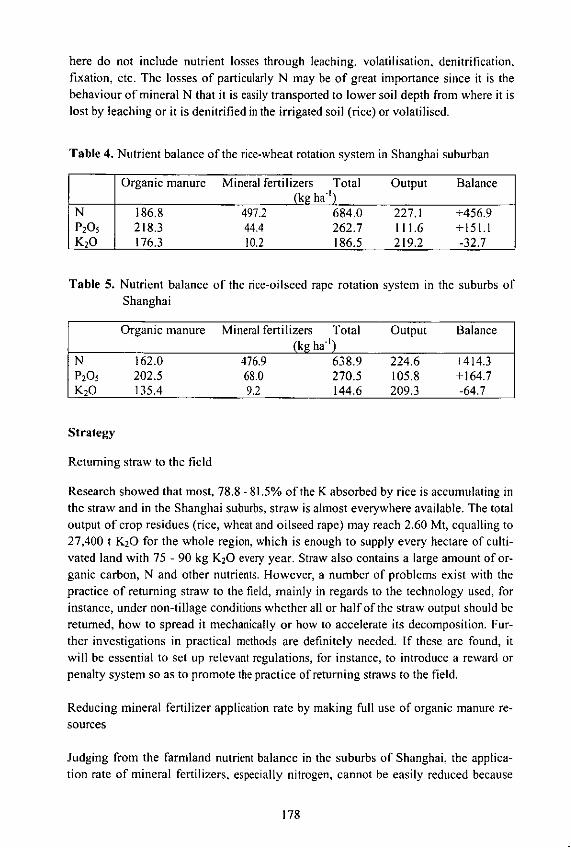
here do not include nutrient losses through leaching, volatilisation, denitrification,fixation, etc. The losses of particularly N may be of great importance since it is thebehaviour of mineral N that it is easily transported to lower soil depth from where it islost by leaching or it is denitrified in the irrigated soil (rice) or volatilised.
Table 4. Nutrient balance of the rice-wheat rotation system in Shanghai suburban
Organic manure Mineral fertilizers Total Output Balance(kg ha- )
N 186.8 497.2 684.0 227.1 +456.9P205 218.3 44.4 262.7 111.6 +151.1K20 176.3 10.2 186.5 219.2 -32.7
Table 5. Nutrient balance of the rice-oilseed rape rotation system in the suburbs ofShanghai
Organic manure Mineral fertilizers Total Output Balance(kg ha-')
N 162.0 476.9 638.9 224.6 +414.3P20 5 202.5 68.0 270.5 105.8 +164.7K20 135.4 9.2 144.6 209.3 -64.7
Strategy
Returning straw to the field
Research showed that most, 78.8 - 81.5% of the K absorbed by rice is accumulating inthe straw and in the Shanghai suburbs, straw is almost everywhere available. The totaloutput of crop residues (rice, wheat and oilseed rape) may reach 2.60 Mt, equalling to27,400 t K20 for the whole region, which is enough to supply every hectare of culti-vated land with 75 - 90 kg K20 every year. Straw also contains a large amount of or-ganic carbon, N and other nutrients. However, a number of problems exist with thepractice of returning straw to the field, mainly in regards to the technology used, forinstance, under non-tillage conditions whether all or half of the straw output should bereturned, how to spread it mechanically or how to accelerate its decomposition. Fur-ther investigations in practical methods are definitely needed. If these are found, itwill be essential to set up relevant regulations, for instance, to introduce a reward orpenalty system so as to promote the practice of returning straws to the field.
Reducing mineral fertilizer application rate by making full use of organic manure re-sources
Judging from the farmland nutrient balance in the suburbs of Shanghai, the applica-tion rate of mineral fertilizers, especially nitrogen, cannot be easily reduced because
178
of its poor use efficiency. Moreover, within the overall ecosystem of Shanghai, large
quantities of wastes exist, including night soil in the urban areas, garbage, animal
dung from intensive animal farms, which have begun to seriously pollute the envi-
ronment with their emissions. Therefore, dealing with the waste problem is a real
challenge. These organic wastes need to be treated in waste treatment plants before
going back to the field as manure, which cannot only help reducing the application
rate of mineral N fertilizers and supplement P and K but also to solve environmental
problems. Much scientific work has been done in Shanghai in this respect and the
results show that significant amounts of P and K from organic manure can be supplied
to wheat and oilseed rape. However, no substantial progress to introduce this system
to farmers fields has been made so far. Especially, there are no matching policies that
can strengthen and promote this kind of environment-friendly practice.
Expansion of green manure fallow land by taking advantage of readjustment of culti-
vation structure
Due to generally small wheat yields in Shanghai suburban the economic benefits of
this crop in the rotation are controversially discussed and therefore arises the question,
whether wheat should not be replaced by a green manure as fodder crop. Today China
is sufficiently supplied with cereals, Shanghai could hence readjust the structure of
summer crop cultivation, for instance, to develop green manure by growing horsebean
and leave a certain percentage of land under fallow every year. The practice would
not only reduce the costs in agriculture but also increase the income and supply of
green manure and fresh grass. And at the same time in combination with deep plough-
ing, it could prevent a long-term fallow from lowering the effectiveness of N fertiliz-
ers. Of course, site-specific research should be carried out as to what extent the culti-
vation structure should be readjusted.
179


Fertilization and farmland nutrient balance in Anhui, status quo andoutlook
Ye Shijuan and Cao Shuqin
Anhui Province Soil and Fertilizers Head Station 230001
Abstract
Mineral N fertilizers account for 62% of the total fertilizer consumption, while mineralpotash accounts for only 10.6% in Anhui. Soil readily available K has decreased by28.6 mg kg- from 105.5 mg kg- ' in the early 1980's down to 76.9 mg kg "1 in the late1990's. The acreage of K deficient farmland has expanded to 3.172 million ha, about52% of the actual total cultivated area. Imbalance also exists in fertilizer distribution.The farmland in Jianghuai region accounts only for 38% of the province's total area,but for 50% of the province's total fertilizer consumption. A large proportion of me-dium- and low-yielding farmland does not have an adequate supply of fertilizers. Tosolve the problems, the following countermeasures should be taken: 1) Between 2000and 2010, the total input of fertilizers needs to be increased to 2.70 Mt and 3.10 Mt,respectively, and the application rate for each crop to 220 kg ha-' and 250 kg ha-', re-spectively. More fertilizers are required in medium- and low-yield regions, where fer-tilization can be effective. 2) The large nitrogen application needs to be controlledwhile K consumption has to be increased as well as the supply of other macronutrients,
e.g. Ca, Mg and S, as well as micro-nutrients need to be supplemented. 3) More em-phasis should be laid on recycling crop residues, especially straw to the fields, eitherafter animal digestion as farmyard manure or directly through machines and 4) theresearch on balanced fertilization to be intensified.
Introduction
Positioned in the middle and lower reaches of the Changjiang River, Anhui is an im-portant cereal, vegetable oil and cotton producing region in China. Currently it has atotal of 6.100 million ha of cultivated land, of which over 60% are medium- and low-yielding fields, forming a tremendous potential for increased production in the future.The agriculture in the Anhui Province has increased by a large extent in both yield perunit area and total output. In comparison with the production in the early 1950's, theprovince's total output of cereals has increased 3-fold, that of vegetable oil by 16- fold
and that of cotton 12-fold. During the recent two decades, the input of large quantitiesof fertilizers contributed greatly to the development of the agriculture and the farmlandnutrient balance. Improving the use of fertilizers and to study the farmland nutrientbalance plays a crucial role in developing sustainable agriculture. Nevertheless, prob-lems are quite serious with farmland nutrient balance, fertilizer distribution and fertil-
181

izer application. They are mainly displayed as irrational NPK ratio, inadequacy in thesupply of other macro-nutrients than NPK and micro-nutrients as well as an overallimbalance of farmland nutrients. This study has therefore been carried out to have acloser look at the fate of nutrients applied to representative cropping systems in orderto improve the nutrient management for large sustainable crop production.
Role of mineral fertilizers in agricultural production
The agricultural production of the Anhui Province used to depend largely on organicmanure with application rates reaching more than 30 t ha-'. Organic manure has playedan important role in developing agricultural production and ameliorating medium- andlow-yielding fields.Since mineral fertilizer made its debut in the early 1950's, its use has been increasingyear by year both in rate and in area. Particularly since 1978, the consumption of min-eral fertilizers has been soaring up to 0.11 Mt (on nutrient basis) per year, with signifi-cant effects on yields. According to the statistics, in 1997, the yield of cereals, vegeta-ble oil and cotton reached 4,726 kg, 1,806 kg and 754 kg ha-I of harvested products,respectively. Comparing this with figures from 1978, it shows that these yields in-creased by 103% in cereals, by 74% in vegetable oil and 188% in cotton. Compared tothe 1950's the difference is even more impressive, with 3-fold, 16-fold and 12-foldincreases in crop yields. The input of mineral fertilizers has played a crucial role in thisdevelopment. The yields of cereals, cotton and oil crops during the period of 1985 -1997 were within a certain range closely related to the application rate of mineral fer-tilizers. The respective correlation coefficients between fertilizer consumption andcrop production were 0.7828 for cereals, 0.7983 for cotton and 0.7096 for oil bearingcrops, at highly significant level. According to the fertilizer trials (1984 -1997), 40-60% of the achieved yield increments during this period can be directly attributed tothe use of mineral fertilizers.
Farmland nutrient balance
Before the 1970's, when agriculture depended mainly on organic manure, the farmlandreceived little inputs and produced small outputs. The lack of fuel and feed forced thefarmers to harvest the crops together with the roots. The proportion of straw returneddirectly or indirectly to the field was not more than one fifth. As a result, the farmlandbecame depleted of its nutrients. The development of the agricultural production andthe rise in the multiple-cropping index accelerated decomposition of soil organic mat-ter. For instance, the first soil survey in 1958 discovered that soil organic matter was10.3 g kg-1 and average content of total N was 0.75 g kg'. But the second soil surveyin 1979 revealed that the figures were reduced to 9.5 g kg-1 and 0.63 g kg-', a declineof 8% and 16%, respectively.
182

In the mid 1970's, the use of mineral fertilizers began to develop and hence the cropoutput. However, bias towards N fertilizers became common among the farmers, lead-ing to seriously unbalanced NPK ratio (N:P 205 :K20 = 1:0.25:0.025) and deficits ofsoil P and K (Table 1). By the end of the 1970's, the province had 3.84 million hafarmland deficient in P and 0.64 million ha deficient in K, accounting for 90% and15%, respectively, of the total. Since the 1980's, with the development of the mineralfertilizer industry in China, the application rate of mineral fertilizers has been increas-ing to a great extent. Though the total amount of nutrients used increased, the propor-tional application of organic manure decreased due to the increasing amounts of min-eral fertilizers applied. According to the statistics, in the 1980's, the farmland in Anhuireceived a total nutrient input of 1.799 million tonnes of which 44% were in the formof organic manure. The application of N from organic manure accounted for 29% ofthe total N input, for 34% of the P and for 87% of the K supplied to the fields. In the1990's (1990 - 1997), the total nutrient input into the farmland was 2.255 million ton-nes of which only 33% were in the form of organic manure, despite further increase inthe total amount of organic manure. Today, the nutrient supply through organic ma-nure accounts for 23% of N, 24% of P and 67% of the total N, P and K consumption.
Table I. Annual farmland soil nutrient balance in Anhui ('000 tonnes)
Period 1950's 1960's 1970's 1980's 1990'sInputTotal N 160.1 203.8 429.4 937.7 1218.4
P20 5 78.1 89.2 161.9 420.3 545.4K20 163.7 162.6 275.6 421.5 491.0
Organic manure N 151.4 165.3 260.1 273.9 278.6P205 77.4 81.5 119.6 143.9 131.8K20 163.6 161.9 271.4 366.5 328.2
Mineral fertilizers N 8.7 38.5 169.3 663.8 939.0P20 5 0.7 7.7 42.3 276.4 413.6K20 0.1 0.7 4.2 55.0 162.8
OutputN 256.9 244.3 441.6 673.8 672.8P20 5 118.2 112.8 202.5 306.6 299.5K20 285.2 272.6 489.3 730.5 722.0
BalanceN -96.8 -40.5 -12.2 +263.9 +545.6P20 5 -40.1 -23.6 -40.6 +114.0 +245.9K20 -121.5 -110.0 -213.7 -309.0 -231.1
Note: Mineral fertilizer N was discounted by 45% and organic manure N by 15% dueto losses. The nutrient contents in organic manure were worked out in referenceto the manure handbook published by the Ministry of Agriculture. The amount oforganic manure resources was calculated according to the Anhui Province's sur-vey on organic manure. 1990's refers to the years 1990 to 1997.
Table I shows that before the 1980's, farmland nutrient input mainly came in the formof organic manure which was insufficient to balance the inputs with the outputs. After
183

the 1980's, mineral fertilizers supplied most of the N and P nutrients whereas organicmanure remained to be the main source of K. Balancing nutrient input with nutrientoutput showed that farmland soils received a surplus of N and P, but have been clearlyundersupplied with K. Years of K deficit led to a prominent problem in the nutrientbalance. The increased input and the changes of the farming system also caused a se-ries of changes of the soil nutrient status. In Table 2, the results, summarizing theanalysis of 4,520 soil samples collected from plough layers nearby the 275 soil nutrientmonitoring posts all over the province, are shown. They reflect the downward trend ofsoil nutrient contents with the beginning of the 1980's.
Table 2. Trend of the changes in soil organic matter, total N, readily available P andreadily available K
Item Time Huaibei Jianghuai Jiangnan ProvinceContent Incre- Content Incre- Content Incre- Content Incre-
ment ment ment mentOrganic 1980's 11.5 17.0 22.5 17.0matter 1990's 13.0 1.5 18.1 1.1 20.3 -2.2 17.1 0.1(gkg) Recent 13.8 2.3 19.0 2.0 20.9 -1.6 17.9 0.8Total N 1980's 0.81 1.03 1.36 1.07(g kg-') 1990's 0.96 0.15 1.12 0.09 1.35 -0.01 1.11 0.04
Recent 0.91 0.10 1.19 0.16 1.38 0.02 1.16 0.09Readily 1980's 5.1 7.0 6.1 6.1avail. P 1990's 9.6 4.5 9.3 8.8 2.7 9.2 3.1(mg kg-1) Recent 13.6 8.5 11.0 1.7 12.0 5.9 12.1 6.0Readily 1980's 140,2 117.2 74.6 105.5avail. K 1990's 120.7 -19.5 98.9 -18.3 67.0 -7.6 95.5 -10.0(mg kg-1) Recent 109.4 -30.8 89.7 -27.5 52.8 -22.6 76.9 -28.6Note: Samples have been taken early 1980 and early 1990
Increasing trend of soil organic matter, total N and readily available P
Generally, the province displays a trend towards larger soil organic matter contents(excluding Jiangnan, the part along the southern bank of the Changjiang River), total Nand readily available P contents. Readily available P has increased by a large margin,about 6 mg kg-' and particularly in Huaibei from 5.1 mg kg' in the late 1970's to 13.3mg kg-' in the 1990's.Organic matter and total N have increased in most soils of the farmlands, but they aredecreasing in farmland far away from villages. According to 35 farmland monitoringposts in the Mengcheng County, within the five years from 1993 to 1998, farmland soilnutrients have decreased in a pattern of concentric circles from 15.8 g kg-' to 13.1 gkg-' in organic matter. The critical radius of the concentric circle is around 250 m,which indicates that with development of the market economy, farm labour is runningshort. Because of the inconvenience of transport, organic manure is applied far more to
184
fields nearby the village than in the remote fields, which have to depend on a limited
amount of mineral fertilizers to replenish soil nutrients but not the organic matter.
Drastic decline in readily available K
It is clearly indicated that since the 1980's, readily available K of soils has dropped in
all the monitoring posts across the province on average by 28.6 mg kg-' from 105.5 mg
kg' in the early 1980's to the current 76.9 mg kg -', by 30.8 mg kg' in Huaibei, by
27.5 mg kg' in Jianghuai and by 21.8 mg kg' in Jiangnan (Table 2). The decline of
soil K is much more serious in high-yielding cotton and double-cropping rice regions.
The scope of K deficiency is expanding from south to north. Symptoms of K defi-
ciency have also begun to appear in Huaibei, which used to be considered as a region
with soils rich in K. Therefore, for the whole province, soil K has become the major
limiting factor for the development of agricultural production.
Protruding problem of inadequate micronutrient supply
With the increase in crop output, the problem of soils being deficient in micro-nutrients is becoming more and more apparent. The second soil survey discovered that
about 86% of the land was deficient in B, 85.4% of the upland soils and 63,6% of the
paddy soils were deficient in Zn, and 89.7% of the soils exhibited small amounts of
Mo to a varying extent. The results of 746 micronutrient fertilizer experiments in dif-
ferent soils and on different crops all over the province revealed that in 668 experi-ments about 89.6%- of the total showed significant crop responses, which is another
proof that the farmland soils in Anhui are deficient in micronutrients. The experiments
also indicated that the crop response of wheat and rice to Zn was greater in Huaibei
than in Jianghuai and Jiangnan whereas the crop response of oilseed rape to B was
greater in Jiangnan than in Huaibei and Jianghuai.
Problems with soil nutrient balance
Despite the rapid progress made in keeping soils productive, problems exist concern-ing fertilizer management and the build-up of soil fertility. Although years of higher
nutrient application has increased organic matter, total N and readily available P in
most of the soils, results from monitoring posts indicate that the basic soil fertility is
quite low and the area of medium- and low-yielding fields is quite large. This is the
real reason why in most of the medium- and low-yielding fields after rising the fertil-
izer application rate, average yields of the province still haven't reached satisfactory
levels.
185
Somewhat irrational fertilization structure
Although in recent years attention has been given to the use of organic manure incombination with inorganic fertilizers, problems exist with macroscopic regulation andthe ratio of mineral nutrient input. The NPK ratio (N:P 205 :K20 = 1:0.44:0.17) cannotmatch the nutrient output from the farmland.
Decreased area for green manure crops and under-utilized organic manures combinedwith poor nutrient recovery from applied fertilizers
Due to the recent expansion in cultivating oilseed rape, the area of green manure culti-vation decreased from 0.667 million ha in the 1970's to 0.27 million ha. Investigationsshowed that only about 60% of the human and animal wastes and crop residues areapplied to the fields whereas in some areas burning of straw is very popular. Althoughfor years efforts have been made to extend the practices of deep placement to reducenutrient losses and balanced fertilization, the recovery rate of nutrients from mineralfertilizers remains in the region of only 38%, far below that in the developed countries.
Fertilizer management and strategy for developing sustainable agriculture
Increase of total amount of fertilizers used and performance of regional macroscopicregulation
The soils in Anhui are inherently poor and the crop production per unit area is muchless than that in the neighboring provinces. In 1997, the province consumed 2.406 mil-lion tonnes (net nutrient) mineral fertilizers, which is an average of 394 kg ha'I culti-vated land and 198 kg ha-1 per crop, worked out on the basis of the total acreage ofcultivated land in the province, which is 6.10 million ha (figure from the soil survey)and the multiple-cropping index of 1.9. Both consumption figures (per year and percrop) are smaller than the country's average. Furthermore, the allocation of fertilizerwithin the province is very uneven, The relatively developed agriculture in Jianghuai,though occupying only 38% of the total farmland of the province, consumes over 50%of the total fertilizer. The fertilizer application rates in some of the high-yielding farm-land is slightly exceeding the demand, especially in terms of N. It may reach levels upto 450 - 500 kg N ha' per crop. However, the medium- and low-yielding farmland,accounting for over 60% of the province's total farmland, are inadequately supplied. Insome places, the application rate is only 150 kg ha' per crop, one-third of the former.Nevertheless, practices demonstrate that crop response to fertilization of the medium-and low-yielding farmland is 50% - 100% larger than that in the high-yielding farm-land.In order to benefit from the yield-increasing effect of fertilizers and to improve landproductivity, it is essential to further increase the nutrient input into the farmland.Based on the targeted output, the demand for mineral fertilizers in 2010 is estimated to
186
be 3.10 Mt and the average application rate per crop 250 kg ha 1, respectively. Whilean adequate fertilizer supply is ensured for high-yielding regions, it is essential to sup-ply fertilizer to regions with high crop response, especially to the medium- and low-yielding farmland in the Huanghuaihai region. At the same time, the practice of return-ing straw to the field and the application of organic manure should be intensified.
Control N over-dosage, increase K input and supplement other macro- as well as mi-
cro-nutrients
Of the currently used fertilizers in Anhui, 62% are N fertilizers of which single N fer-tilizers account for 82%. Despite its yield-increasing effect, nitrogen application aloneand the shortage of P and K fertilizers, particularly K, causes some crops to lodge andto delay maturity, so that the full yield potential cannot be tapped. There is also a dan-ger that N fertilizers applied in excess will lead to an adverse impact on the environ-ment. The multi-location experiments on balanced fertilization and 803 experiments inthe province showed that in the farmland wheat, rice, maize and some other cerealsachieved yields of 7,500 kg grain ha"t, oilseed rape 2,700 kg seed ha-' and cotton 1,800kg lint ha -'. These large yields are sometimes produced in areas, where the N applica-tion rate reached up to 450 - 550 kg ha -'. These high inputs, however, indicate poor Nuse efficiency and may be partly a waste of resources. Therefore, the demand orientedN application rate, aiming at greater efficiency, should be in the region of 180 kg ha1
for cereals, 180 kg ha' for oilseed rape and 240 kg ha -' for cotton.The soil K supply in Anhui is medium and low. Balancing the nutrient input with nu-trient output (Table 2) shows that soil N and P have turned from deficit to surplus dur-ing the past decades. On the other hand, K has long been neglected and soil K reservesbecame rapidly depleted. In the process of implementing the "K Supplementation Pro-ject", it was found that the area of crops, suffering from K deficiency, reached 3.172million ha, accounting for 52% of the actual cultivated area. K deficiency is found in50% of the wheat, 89% of the rice, 60% of the oilseed rape and 79% of the cotton area.
Furthermore, there is a certain area of high-yielding farmland that must be supple-
mented with a substantial amount of K, if large yields should be sustained. It is quite
obvious that there is a great potential to increase yield by K application so that the task
of supplementing K to the soil is a real challenge.Mineral K fertilizers have to be used at larger amounts, especially in view of the nega-
tive soil nutrient balance. The recommended critical value in the soil for K (on a basis
of readily available K) is 100 mg kg-' for cotton, 90 mg kg' for wheat, maize and soy-
bean, and 80 mg kg-' for oilseed rape. The fact that the critical value of K deficiency of
a crop varies with soil should be born in mind. For instance, in Huaibei, the value for
wheat in sandy soil is 80 mg kg'1 and in clayey soil 110 mg kg -' and for the double-
cropping rice alongside the river 60 mg kg -'. Full use should be made of the local ex-
perimental and demonstration fields in guiding fertilization. Furthermore, to comple-
ment mineral K, it is advisable to also increase the amount of organic manure and to
disseminate the practice of recycling crop residues to the field instead of burning or
using them for other purposes.
187

The responses of oilseed rape to B application, of rice and maize to Zn application andof beans to Mo application are widespread in the province. According to investiga-tions, about 4.445 million ha of farmland need an application of micronutrients. Cur-rently only 0.80 million ha, about 18%, are being treated with micronutrients. Somefarmlands also showed a different extent of deficiency in other macronutrients such ascalcium, magnesium and sulphur. Investigations revealed that about two-thirds of thesoils in the province are deficient in S. Of the major soils such as yellow fluvio-aquicsoil, grey fluvio-aquic soil and purplish soil about 40 - 60% had an available S contentof less than 16 mg kg-', a problem that needs to be also addressed.
Intensify the study on balanced fertilization and introduce new fertilization techniques
With regard to balanced fertilization, technical criteria have been worked out for Anhuibased on soil analysis, basic yield, residual effect of fertilization to the succeeding cropin a crop rotation, production level and different types of fertilizers. Crop-specific fer-tilization models were established, optimal application rates were recommended, criti-cal values of deficiency in K and other elements (micronutrients) developed and areasfor K supplementation defined. Thus, fertilization technology in Anhui has beenpushed up onto a new level. Experience has shown that the overall service, e.g. inte-grating soil analysis, formula designing, production, supply and guided-application ofcompound fertilizers, is a successful approach to accelerate the transformation of sci-entific findings into products and to promote balanced fertilization techniques. Today,with the rapid development of the information technology, it is essential to further in-tensify the study on balanced fertilization techniques, to data processing, geographicinformation system and remote-sensing technology for "precision fertilization". It isimportant to combine organic manure with mineral fertilizers, macronutrients withmicronutrients and fertilization methods with cultivation management with the purposeof improving the recovery rate of fertilizers.
Actively develop organic manure, intensify mechanization of the recycling of cropresidues to the field and follow the road to manufacture of organic manure
Organic manure is an important nutrient source. Currently, in Anhui the nutrient inputin the form of organic manure accounts for over 40% of the total nutrient input into thefarmland, greatly mitigating the pressure of the shortage of mineral fertilizer supplyand the imbalance in the nutrient consumption. The organic manure resources, includ-ing human and animal wastes and crop residues, can be converted into more than 3.40Mt of NPK. However, only less than 60% are utilized, leaving a great potential unused.In view of the common practice of burning straw, it is essential to intensify the effortto develop and extend a technique for mechanized straw recycling. Mechanical opera-tions save time and labour which is a prerequisite that the technique is accepted byfarmers.However, with all the progress made in this respect, manufacturing fertilizers fromorganic wastes, etc., it should be remembered that organic manures are not adding but
188
just recycling nutrients which originally have been removed from the soil. Net gains insoil fertility have to come either from mineral fertilizers or imported feed staff. Unlessnutrients are imported with animal feed or food for humans, it is mainly mineral fertil-izer which has to produce more biomass, causing larger amounts of crop residueswhich can either be directly or after industrial processing recycled to the fields.
189


K cycle and nutrient balance in farmland of the Hubei Province
Xu Nenghai, Li Jianfu and Zhang Decal
Hubei Province Soil and Fertilizers Working Station 430070
Abstract
In this paper, K cycling and nutrient balances in farmlands of Hubei Province areelaborated in a systematic way based on the data and materials from two soil sur-veys, long-term soil fertility monitoring and large numbers of field experiments. Onone hand, the development of the agricultural production resulted in larger applica-tion rates of N and P fertilizers, causing larger yields but also larger K removalsfrom the soil by the harvested crops. Since these cannot be replaced by K applica-tion through organic manure, the recycling of straw and the application of K-containing fertilizers is not sufficient, K deficiency in the Province is spreading.Farmland that shows a K deficit has become a major limiting factor for the agricul-tural development in Hubei. In this paper, some specific measures are brought for-ward for regulating the K cycle and the nutrient balance of the farmland.
Introduction
Located in the middle reaches of the Changjiang River, Hubei Province covers atotal land area of 18.59 millionha, of which 3.34 millionha(1998 statistics) is culti-vated farmland with various soils, dominantly red soil, yellow earth, yellow brownearth, fluvio-aquic soil and paddy soils. Hubei Province has a subtropical monsoonclimate with ideal light, rain and temperature distribution during the year. Its annualprecipitation ranges from 750 mm to 1,600 mm and its annual mean temperaturefrom 15 to 17C. This makes the province suitable for the development of agricul-tural production and also propitious to accelerating nutrient cycling in the soil. Ac-cording to the second soil survey, the sampling investigations in 1997 and long-termmonitoring, the soil K content in the plough layer of the farmland is universally lowand shows a downward trend. Hubei may be described as a K-deficient province andit was the purpose of this study to provide information and guidelines to improvefertilizer management for better, demand-oriented nutrient supply to Hubei's farm-land.
191

Farmland K status
Soil K content of the farmland
Based on the second soil survey (end of 1970's, beginning of 1980's), about 80% ofthe farmland soils were paddy soils, fluvio-aquic soil and yellow brown earths, Thearea covered by paddy soil was 2.04 million ha, accounting for 50.35% of the prov-ince's total cultivated land. Being the largest in area and contributing greatly to theprovince's agricultural production, paddy soil produces 15.54 - 17.90 Mt of rice.This leads to an annual removal of about 0.39 - 0.45 Mt of K20 from the paddyfields, to which a substantial amount of K lost from the fields through mainly leach-ing, etc. has to be added. The removal of K led to K deficiency in the soil. Fluvio-aquic soil, mostly cropped by cotton, has the size of 761,700 ha and accounts for19% of the agricultural land. The soil is deep and fertile but relatively light in tex-ture with about 85%, being sandy loam to loamy sand. Moreover, about 50% of thesoils have a sand layer in the solum, making it difficult to conserve nutrients. As aresult, K loss in the soil is very serious. According to our survey, about 54% of thefluvio-aquic soil contained less than 100 mg kg-' readily available K. The acreage ofyellow brown earth comprises 582,100 ha, accounting for 14.54% of the cultivatedland. The soil is heavy in texture and has poor drainage properties. The subtropicalhumid monsoon climate and the strong influence of southeast monsoon with an an-nual precipitation of 900 - 1,300 mm and periodically heavy rains, exceeding 100mm d-', serious soil K losses through erosion and surface runoff may occur.
Table 1. K contents and their variation in the major soils groups of Hubei Province
2n' Soil survey (a) 1997 survey (b) Change (a-b)
Soil N Range N Range I %Total K (g kg l )
Red soil 186 16.8+4.8 62 15.1+5.2 -1.7 10.1Yellow earth 41 18.6+5.3 I1 16.9+3.7 -1.7 9.1Yellow brown earth 364 17.3+5.9 92 15.2+6.1 -2.1 12.1Fluvio aquic soil 351 19.9+3.7 118 16.5+4.3 -3.4 17.0Paddy soil 1703 17.9+3.7 633 15.3+3.5 -2.6 14.5Total 2645 18.1+4.9 916 15.5+5.0 -2.6 14.4
Readily available K (mg kg"t)Red soil 863 95+43 262 81+37 -14 14.7Yellow earth 590 117+53 204 97+62 -20 17.1Yellow brown earth 3167 98+50 988 83+52 -15 15.3Fluvio aquic soil 6751 109+37 2446 87+41 -22 20.2Paddy soil 11685 99+31 4369 78+37 -21 21.2Total 23056 102+47 8269 85+44 -18 16.7
Note: N stands for number of points investigated
192

On average, from the 2nd soil survey at the end of 1979, early 1980 until 1997, thetotal K in the plough layer of cultivated farmland decreased by 2.6 g K kg-' or
14.4%. Greatest changes were found in the fluvio aquic soil and smallest in the yel-low earth soil. The readily available K which was in the region of slightly above 100mg K kg' and hence at the lower margin of adequate supply during the 2nd soil sur-vey declined clearly below the threshold levels of adequate K supply. The order ofmagnitude of changes with 17% on average was similar to the total K. Slight differ-
ences were also observed between the soils, so that the largest decline with 21%occurred in the paddy soil whereas the smallest changes with 15% in the yellow
earth soil (Table I).
The land use, whether as non-irrigated farmland, paddy or so-called upland which isfound in the sloping areas of the province may have a distinct influence on the de-velopment of the soil K status. The impact on the development from the 2"' soil sur-vey until the 1997 survey is shown in Table 2. The results confirm a.m. observation
(see Table 1) of declining contents in available K during this period from the ade-quate to the below adequate range for all land-use systems. Most serious decline inavailable K was found in the uplands, followed by non-irrigated farmland and irri-gated paddy fields.
Table 2. Changes in readily available K of soils of major land types in Hubei Prov-
ince from the 2"d soil survey to the 1997 survey
Land use 2 nd soil survey (a) 1997 survey (b) Change (a-b)type Sites (N) Mean(mg kg') Sites (N) Mean(mg kg -') (mg kg) (%)Farmland 548 136 204 91 -45 33.1Paddy 327 125 116 90 -30 28.0Upland 221 152 88 92 -60 39.5
Across the various counties surveyed, the development in K availability shows asimilar picture (Table 3). With only 94 mg K kg-I the average K contents of the
studied counties were already below the level of adequate supply during the 2"' soilsurvey and further decreased to deficiency levels during the survey in 1997. A re-duction of 22% in available K during 20 years reflects the strong K depletion thathas taken place in the soils of the various counties. Most severely affected were
Huangmei, Xinkai and Yanglu where in 1997 extreme K deficiency could be found.Less extreme was the situation in Xinyan and Ducheng where larger initial K con-tents prevented the soils from dropping into the K deficiency range.
193

Table 3. Readily available K and its variation in the plough layer of the surveyedcounties (cities) in Hubei Province
Location Soil type Sites 2n survey 1997 survey Change(N) (a) (b) (a-b)
mg kg-' %Tangxian, Suizhou CS, PS 75 98 80 -18 18.4Xinyan, Hanchuan FS, PS 30 164 148 -16 9.8Ducheng, Huangzhou FS 65 117 107 -10 8.5Xinkai, Huangmei FS 70 53 40 -13 24.5Huangmei, Huangmei RS, PS 85 51 38 -13 24.5Yangliu, Yingshan YBE, PS 60 69 42 -27 39.1Luoqiao, Daye RS, PS 120 108 76 -32 29.6Sike, Daye RS, PS 122 115 83 -32 27.8Panwan, Jiayu FS, PS 121 92 65 -27 29.3Huaqiao, Wuxue PS, PS 64 76 51 -25 23.8Mean 81 94 73 -21 22.3
Note: CS stands for cinnamon soil, PS for paddy soil, FS for fluvio-aquic soil, RSfor red soil, YBE for yellow brown earth.
Farmland soil K supply
The low K content of the farmland soil and its general downward trend has led to asignificant decline in the ability of the cultivated land to supply K to crops, whichmanifests itself in expanding acreage of K-deficient farmland and the severity of theobserved deficiency.The area of farmland deficient in K (with soil readily available K below 100 mgkg-') increased from 1.4 million ha in 1982 to 2.0 million ha in 1996, from 19% to72% of the total area. The area of farmland seriously deficient in K (with soil readilyavailable K less than 50 mg kg-') jumped from 0.8 million ha to 1.3 million ha. Thefarmland, deficient or seriously deficient in K, is widely scattered all over the prov-ince. Total soil K of the farmland of the province was in the range 0.6 - 38.6 g Kkg- with an average of 14.5 g kg-'. Soils with soil total K of less than 15 g kg-' wereclassified as class 3 soils and account for 58.4% of the total cultivated land. Theslowly available K varied between 98 - 1635 mg kg' with a mean of 534 mg kg'.Using slowly available K as an indicator, soils can be classified as class 3, if themeasured contents are < 600 mg K kg-'. The area below this threshold level inslowly available K accounted for 65.7% of the total. With regard to readily availableK, class 3 is characterizing soils when exchange K was < 100 mg kg-'. The surveyrevealed a strong variation of 15 - 343 mg K kg- with a mean of 105 mg kg-' , Thearea of farmland in class 3 accounted for 55%. Farmland in and below class 3 is landbeing deficient and seriously deficient in K (Table 4).
194

Table 4. Soil K'supply potential of the farmland in Hubei Province (1997)
Type Total K (g kg') Slowly available K (g kg"')Sites (N) Range Mean Sites (N) Range Mean
Farmland 1124 0.6-38.6 14.5 1109 98-1653 534Paddy 604 3.7-32.4 14.8 595 147-1394 522Upland 520 0.6-38.6 14.2 514 98-1653 547
K cycling and balance of farmland and crop response to K application
K cycle of the farmland
K fluxes between crop - soil - fertilizer is subjected to the integrated influence ofnatural conditions, biological factors and human activities.Agricultural production removes large amounts of K from the soil and from the Kcycle of the farmland. According to the survey during the years 1991 to 1995, in thedouble rice cropping region, the crops removed a total of 185 kg K2 0 ha-1 per year,whereas the K input amounted only to 78 kg K20 ha-1, indicating a loss of 107 kg. Inthe cotton-wheat regions, the crops took up I II kg K20 ha' while the input wasonly 38 kg, causing losses of 74 kg K20 ha-'. In the rice-wheat regions, the removalwas 129 kg K20 ha- while the input was 29 kg, causing losses of 101 kg K20 ha-1.In addition, soil erosion has not been accounted for in this balance calculation but,depending on rainfall events, losses of K by this pathway may be substantial. Thus,as consequence, the soils are characterized by a serious K deficit.
Table 5. Soil K balance in Hubei Province (K20)
Year K(OM) K(MF) Total Area Crop Crop Total Loss perinput produc- removal Loss unit area
tionI000t I000t I000t 1000hba -l 000t I000t I000t kg ha-'yr-'
1950 94.9 94.9 3767.0 6466.9 201.0 105.2 281960 150.4 150.4 4271.7 9299.1 285.6 135.3 321970 214.6 214.6 3964.0 12776.3 389.8 175.6 441980 280.4 23.9 304.3 3738.5 15879.4 489.2 184.9 501985 367.8 69.0 426.8 3584.6 23707.0 161.4 334.6 931990 388.4 136.7 525.1 3483.4 37456.8 892.0 366.9 1051995 417.8 137.2 555.0 3443.4 36551.0 890.0 369.1 1071996 362.7 158.7 521.4 3437.4 36728.7 891.1 369.7 1081997 376.6 143.0 519.6 3426.8 36615.2 889.7 370.1 1081998 336.4 161.3 497.7 3342.5 35722.5 868.1 370.4 111
Note: OM stands for organic manure and MF for mineral fertilizers.
195

Farmland K balance
K input and output
Since there is no closed potassium cycle in the farm or even in the field, soil K re-serves are depleted with the duration of production unless soil K is adequatelyreplenished by fertilizers. The study revealed that K input is insufficient to balancethe K output, so farmland soil K gradually depleted. Table 5 shows that the K deficitwas 105,200 t K20 (28 kg K20 ha-t ) in 1950 and raised to 370,400 t K20 (111 kgK20
ha-') in 1998. Second, K is not in balance with N and P. Soil analysis and correlationwith crop production showed that an ideal ration of the available nutrients in thesoils, using standard extraction methods, is N : P20 5 : K20 of I : 0.1 : 1.2. Duringthe 2nd soil survey the ratio was I :0.07 : 1.15, which widened to 1 : 0.08 : 0.96 andfurther to 1:0.09:0.71 at the time of the survey. This indicates that the imbalance inthe supply of N, P and K in the farming systems was getting more serious.
Causes offarnuland soil K deficit
The drastic drop of soil K has mainly the following three causes:I ) A higher multiple cropping index increased crop output and hence removal of K
from the soil without adequate K return. In 1998, the province had 3.34 millionha of cultivated farmland with a multiple cropping index of 2.3. On about 84% or2.81 million ha, two or three crops per year were grown. A higher multiple crop-ping index has increased crop output and hence removal of K from the soil.Moreover, the K absorbed by the crops originates mainly from the soil resources,thus intensifying soil K depletion.
2) Reduction in the amount of organic manure applied leads to inadequacy in K sup-ply. In recent years, the amount of organic manure used has been decreasingsignificantly, which is mainly caused by: i) A reduction of green manure, an ae-rea which declined from 1.33 million ha in the 1970's to 0.2 million ha in the late1990's. ii) Crop residues, particularly cereal straw were not fully or properly re-cycled. Only less than 30% of the straw is returned to the field and the practice ofburning straw is still quite prevalent. According to statistics, every year about 10Mt of straw are left unused. On a basis that per hectare 3,000 kg of straw are pro-duced on 3.33 million ha, and if used this would equal to 273,000 tonnes of po-tassium chloride. iii) Less farmyard manure is collected and returned to the fields.
3) Irrational fertilizer application results in inadequate K supplementation. Duringthe period from 1992 to 1997, the NPK ratio (N:P 2 0 5 :K2 0) of the fertilizers ap-plied was 1:0.38:0.25 for paddy fields and 1:0.25:0.16 for upland fields, far dif-ferent from the ratio of NPK absorbed by the crops (1:0.28:1.2 for rice, 1:0.41:0.8for wheat, 1:0.35:1.2 for cotton and 1:0.4:0.9 for rape). The total consumption ofmineral fertilizers in the province was 129,400 t in 1970 and increased to1,485,900 t in 1990 or 10-fold within 20 years. N fertilizers increased almost 9-
196

fold and P fertilizers by 21-fold while the total output of crops increased almostonly 2-fold. The combined effect of larger N and P fertilizer application rates,raising crop yields and inappropriate fertilization systems accelerated soil K de-pletion.
Crop response to K application
Additional application of K fertilizers can build up soil fertility, regulate soil K bal-ance and increase crop output. In 1992 - 1998, soil and fertilizer stations of 32 coun-ties all over the province were organized to carry out stationary experiments on cropresponse to K application on 12 major crops in 6 major soils. The results showed asignificant response of rice, wheat, corn, sweet potato, potato, oilseed rape, sesame,cotton and ramie. K application increased the yield of rice by 725 - 792 kg ha- 1 or I I- 15% with an 0/1 ratio of 7.1 (7.1 kg rice kg - K20 applied), of oilseed rape by 305- 417 kg or 32 - 47% with an 0/1 ratio of 3.9, of lint by 117 - 182 kg or of cotton by15 - 21% with an 0/1 ratio of 1.59 and of wheat by 425 - 520 kg or 15 - 21% with anO/I ratio of 6.
Strategy for management of the farmland soil K balance
The major approach to regulate K cycling in a farming system and to keep K remov-als in balance with the supply, is to recycle as much K as possible within the farm,back to the field and to add external K resources to the soil. The practice of return-ing crop residues or straw to the field and the application of organic manure are pos-sibilities to recycle K within the system. The application of K fertilizers on the otherhand is the only net application of K, unless large amounts of manure produced fromexternally purchased animal feed is used. Based on the agricultural production prac-tices in Hubei Province the following management strategies are put forward forregulating the soil K balance in the farmland.
Dissemination of the balanced fertilization principle
Balanced fertilization is an important measure to improve agricultural productionsince currently the annual K deficit is increasing due to higher N application ratesand insufficient K supply. A fixed NPK ratio for balanced fertilization should becontinuously adapted based on frequent soil analyses by using a formula worked outby an expert system software. Macroscopic regulation will be exerted to control theflow of K fertilizers to regions with medium and high crop response. Microscopi-cally, one soil sample is taken every 6.67 - 13.3 ha for analysis and recommendationworked out for each administrative unit (village). Thus, K fertilizers should be ap-plied according to soil and crop requirements for each specific region.
197

Intensifying the practice of returning straw to the field
The practice of returning straw to the field will reduce the removals and hence the Klosses from the soil. This is a major approach to economize the use of the urgentlyneeded and scarce nutrient K in the province. Besides leaving high stubs or strawdirectly in the paddy field, another pattern of returning straw to the field is usingcrop stalks and stems as mulching for upland crops like wheat, cotton and com. Thebeneficial effects of straw mulching in wheat fields are evident from yield increasesof 531 kg ha-' or 12%, in corn fields of 706 kg ha-' or 16%, in oilseed rape fields of347 kg ha' or 16%, in cotton fields of 137 kg ha1 or 12% additional lint. The vari-ous vegetables responded with average yield increases of 10 - 25% through transferof straw from the rice fields to the vegetable gardens.
Making full use of plant ash and human and animal wastes
Rice straw, wheat straw and cotton stalks are extensively used as fuel in the country-side. The remaining ash contains high K and can be used as basal and side dressing.Human and animal wastes easily get fermented or composted into organic manure,which can be applied to promote crop growth. Composts have the advantage thatbesides supplying K they can also improve physical and chemical properties of thesoil. Statistics show that the total amount of night soils, barnyard manure and com-post may reach 76,772,000 t, accounting for 53% of the total of organic manure. Anapplication of 15,000 - 18,000 kg ha-' can increase the yield of cereals by 750 - 900kg.
Making full use of biological K manure
Exploiting biological K manure is another approach to enrich soil K and also an ef-fective method to have K recycled within the system. The province has a huge vari-ety of biological K resources, such as green manure crops, water grass, duckweed,alligator altemanthera, etc., which may reach 36,576,000 t in quantity, containing139,100 t K20. These K-consuming plants have a strong capability of taking up Kfrom soil and water through their root system. Expanding the area of green manure,crops can reduce the soil K losses and improve circulation and recycling of soil K. Itneeds to be pointed out that an area expansion in these kind of crops unless grownon otherwise non-cultivated areas, are competing with food crops for land and ifplanted on the same land would even lead to an accelerated K depletion of the soils.
Making full use of K in water
Hubei Province has a huge number of lakes with a vast water surface. In some pondsand pools, the K content ranges between 3.6 and 15.7 mg kg" (mean = 9.6 mg kg',n = 5, CV. = 55.9%). The K concentration in lake waters is between 3.3 mg kg -' and8.3 mg kg-' (mean = 6.2 mg kg " , n = 5, C.V. = 45%), that in rivers and ditches is
198

between 2.0 mg kg' and 8.3 mg kg- ' (mean = 4.3 mg kg', n = 7, C.V. = 51.3%). Inorder to make full use of the K in water, certain growing of aquatic green manurecrops could be grown to extract the K from the waters.
Making full use of K in the subsoil layers
The K contents in the subsoil layers are usually in a similar order of magnitude asthose in the plough layer, though plants often do not benefit from this reserve due totheir shallow root system. Therefore, typical paddy based cropping systems could beenriched with one upland crop during the non-irrigated time to extract K from lowersoil depth. For instance, the subsoil layer (usually 30 - 70cm thick) of the fluvio-aquic soil in the Jianghan Plain contains 15.9 g kg- total K and 96 mg kg-l readilyavailable K which could be tapped by deep-rooted plants and available K in the cropresidue could be recycled to the succeeding crops..
Capital construction of farmland
K loss can also be reduced by controlling soil erosion through growing grass andtrees on contours of non-cultivated, partly unproductive hills and slopes. 0.4 millionha (20% of the province's paddy field area) consists of so-called cold water paddyfields with intensive water. Measures could be taken to transform the cold waterpaddy fields into running water paddy fields in order to improve the soil K supplyability.All these alternative K sources can be tapped though bearing in mind that they canonly be regarded as K which is recycled within the agro-ecosystem. Net additions ofK to a crop or cropping system only occur when external mineral inputs are applied.Using internal sources of K, such as organic manure, means only minimizing deple-tion or shifting fertility from one place (upland-lowland or vice versa) to another. Anexception to this would be if animal feed is imported from other countries or prov-inces etc., then this resource would be a real net input as well.
199


Farmland nutrient cycle and nutrient balances in different eco-regions of the Hunan Province
Dai Pingan, Nie Jun, Liu Xianghua and Yi Guoying
Hunan Province Soil and Fertilizers Institute, 410125
Abstract
Farmland nutrient cycles and balances of typical eco-regions, comprising the lake,mountain and hilly regions of the province are presented. In the hilly regions, nutrientdeficits have been observed in the order of K > N > P. In the lake regions, the K bal-ance was negative whereas N and P had a positive balance. In the mountain regions, Kbalance became increasingly negative whereas N and P maintained their levels. In thewhole province, K use is deficient whereas there is surplus supply of N and P (P > N).The results of a farmers' survey were similar to the statistics of the government. Read-ily available nutrient contents in soils were in the order of mountain regions < hill re-gions < lake regions. In order to sustain a constant development of the agriculturalproduction, it is essential to supply K to all eco-regions and also to increase N and Pinputs to the hill and mountain regions. An estimate of the future fertilizer demand ismade.
Introduction
The Hunan Province is located in the central subtropical part of China and has a rathermarginal landform for agricultural production. About 64.6% are mountains, 28.7%hills and 6.7% lakes. Locations covering the three major agro-ecological zones of Hu-nan were selected and surveys on the fate of plant nutrients in the main cropping sys-tems were carried out, Since the physical conditions and the agricultural productionlevels of the different eco-regions vary strongly, Yongshun, Ningxiang and Nanxianwere selected as representative counties for the investigations. The aim of the study of
the farmland nutrient cycle and balance was to find a scientific basis for an improvedfertilisation to promote a reasonable distribution of mineral fertilizers in the province.
Materials and methods
Investigation
In order to obtain representative results for the whole province, suitable farming sys-tems, production and fertilization practices, three agro-ecological-regions were se-lected for the investigation and studied in more detail. Four to five key farmers were
201

invited to attend a meeting at which they were individually interviewed and samplesfrom their farms taken. Information about the agriculture in the counties and the prov-ince were also gathered from statistical records. The survey was completed at the endof November 1998.
Calculation
Nutrient input
1) The input of nutrients in the form of mineral fertilizers was calculated by multiply-ing the actual amount of fertilizers used by the standard nutrient content in the fertiliz-ers. 2) The nutrient input in the form of organic manure was determined for eachhousehold by multiplying the amount of manure applied by the estimated nutrient con-tent based on tables from published data. For the province and the respective county,the amount of night soil and farmyard manure was estimated on the basis of the excre-tion per person or per animal per year. The amount of plant ash was calculated on thebasis of the straw : grain ratio and the amount of ash taken as 15% of the residualstraw. Then the input of these manures was estimated on the basis of a utilization rateof 80%. Besides, about 10% of the total input of mineral fertilizers and organic manurewas deducted from the use by the annual grain crops, assuming this proportion wasapplied to adjacent vegetables, fruit trees and tea gardens. 3) Nutrients brought in withrain and irrigation water and 4) nutrients applied with seeds and seedlings were alsotaken into .consideration by taking published data on nutrient contents in this material.
Nutrient removal
Nutrients removed were calculated as 1) nutrients consumed to produce the respectiveamount of economic product and 2) nutrients lost through runoff and leaching. 3) Theloss of mineral N was estimated at 50% in the irrigated rice fields and 35% in the up-land fields whereas the amount of N removed from the organic manure fraction was setat 30% of the applied amount.
Results and analysis
General introduction to the eco-regions
A general information about the three agro-ecological regions is given in Table 1. Thisclearly shows that the selected regions differ greatly with regard to physical and socialeconomic conditions as well as regarding their farming systems. As a result, theseagro-ecological regions also vary in farmland nutrient input, output and balance.
202

Table 1. Facts about the three eco-regions
Agro-ecological Hill region Lake region Mountain regionregion (Ningxiang) (Nanxian) (Yongshun)Altitude (m) 200-500 < 50 > 1000Mean Temp.(7C) 17.7 17.2 16.5Rainfall (mm) 1358.6 1201.1 1155.1Population (103) 1299.7 658.6 474.1Area ofcultivated Paddy 6.861 3.544 2.100land (M ha) Upland 0.889 2.191 0.685Area/capita (ha) 0.075 0.051 0.075Farming system Paddy Rice-rice-green Rice-rice-green Rice-rape
manure manure (rape) (wheat)Upland Sweet potato-rape Cotton-rape Tobacco
Soybean-potato Ramie, sugarcane (peanut) Potato
Table 2. Average farmland nutrient balance for 26 farms in the hill regions(kg ha' yr')
Item Paddy Upland MeanN P20 5 K20 N P20 5 K20 N P205 K20
Total input 358.0 126.5 302.6 83.0 24.6 38.0 338.0 119.1 283.3Mineral 276.9 85.8 96.5 29.0 9.0 4.7 258.8 80.2 89.8fertilizersOrganic 75.8 38.7 200.4 36.4 13.7 31.9 73.7 36.9 188.1manureSeed 2.3 1.4 0.6 7.6 1.9 1.4 2.7 1.4 0.7Irrigation 3.0 0.6 5.1 2.8 0.6 4.7rain waterTotal 383.2 135.2 362.9 66.4 17.3 44.7 360.1 126.6 339.7removalGraincrop 184.7 131.6 296.9 23.3 12.1 41.1 172.9 122.9 278.3Oil crop 20.1 4.3 1.6 1.5 0.3 0.1Fibre crop 2.8 0.9 2.0 0.2 0.1 0.1Nutrient 198.5 3.6 66.0 29.2 185.5 3.3 61.2loss*Balance -25.2 -8.7 -60.3 16.6 7.3 -6.7 -22.1 -7.5 -56.4
Note:* includes loss from mineral fertilizer, organic manure, runoff and leaching.Numbers in Tab. 3 and Tab 4 are based on the same calculations.
Farmland nutrient balance
Farmland nutrient balance in the hill regions
Table 2 shows that because irrigated rice (paddy fields) constitutes a large proportionof cultivated farmland in the hill region, farmers put great emphasis on fertilization ofpaddy fields. They apply more fertilizers and larger rates of P and K to paddy fieldsthan to upland fields. The nutrient removal in the paddy fields, however, still exceeds
203
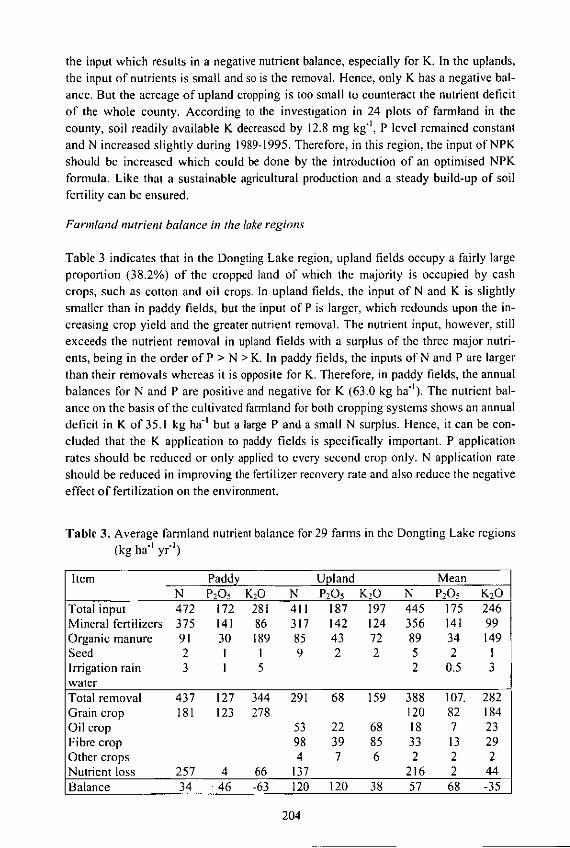
the input which results in a negative nutrient balance, especially for K. In the uplands,the input of nutrients is small and so is the removal. Hence, only K has a negative bal-ance. But the acreage of upland cropping is too small to counteract the nutrient deficitof the whole county. According to the investigation in 24 plots of farmland in thecounty, soil readily available K decreased by 12.8 mg kg" , P level remained constantand N increased slightly during 1989-1995. Therefore, in this region, the input of NPKshould be increased which could be done by the introduction of an optimised NPKformula. Like that a sustainable agricultural production and a steady build-up of soilfertility can be ensured.
Farmland nutrient balance in the lake regions
Table 3 indicates that in the Dongting Lake region, upland fields occupy a fairly largeproportion (38.2%) of the cropped land of which the majority is occupied by cashcrops, such as cotton and oil crops. In upland fields, the input of N and K is slightlysmaller than in paddy fields, but the input of P is larger, which redounds upon the in-creasing crop yield and the greater nutrient removal. The nutrient input, however, stillexceeds the nutrient removal in upland fields with a surplus of the three major nutri-ents, being in the order of P > N > K. In paddy fields, the inputs of N and P are largerthan their removals whereas it is opposite for K. Therefore, in paddy fields, the annualbalances for N and P are positive and negative for K (63.0 kg ha'). The nutrient bal-ance on the basis of the cultivated farmland for both cropping systems shows an annualdeficit in K of 35.1 kg hat but a large P and a small N surplus. Hence, it can be con-cluded that the K application to paddy fields is specifically important. P applicationrates should be reduced or only applied to every second crop only. N application rateshould be reduced in improving the fertilizer recovery rate and also reduce the negativeeffect of fertilization on the environment.
Table 3. Average farmland nutrient balance for 29 farms in the Dongting Lake regions(kg ha" yr"1)
Item Paddy Upland MeanN P20 5 K20 N P20 5 K20 N P20 5 K20
Total input 472 172 281 411 187 197 445 175 246Mineral fertilizers 375 141 86 317 142 124 356 141 99Organic manure 91 30 189 85 43 72 89 34 149Seed 2 I I 9 2 2 5 2 IIrrigation rain 3 I 5 2 0.5 3waterTotal removal 437 127 344 291 68 159 388 107. 282Grain crop 181 123 278 120 82 184Oil crop 53 22 68 18 7 23Fibre crop 98 39 85 33 13 29Other crops 4 7 6 2 2 2Nutrient loss 257 4 66 137 216 2 44Balance 34 46 -63 120 120 38 57 68 -35
204
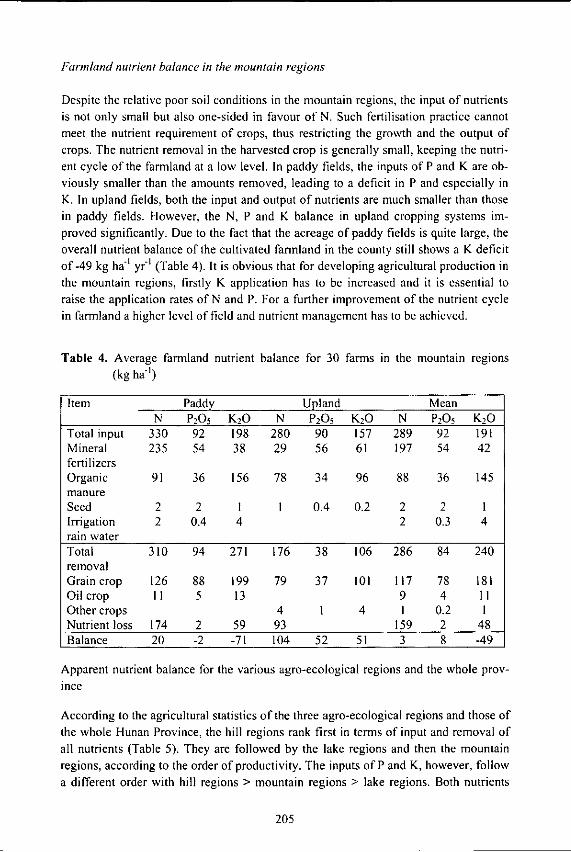
Farmland nutrient balance in the mountain regions
Despite the relative poor soil conditions in the mountain regions, the input of nutrientsis not only small but also one-sided in favour of N. Such fertilisation practice cannotmeet the nutrient requirement of crops, thus restricting the growth and the output ofcrops. The nutrient removal in the harvested crop is generally small, keeping the nutri-ent cycle of the farmland at a low level. In paddy fields, the inputs of P and K are ob-viously smaller than the amounts removed, leading to a deficit in P and especially inK. In upland fields, both the input and output of nutrients are much smaller than thosein paddy fields. However, the N, P and K balance in upland cropping systems im-proved significantly. Due to the fact that the acreage of paddy fields is quite large, theoverall nutrient balance of the cultivated farmland in the county still shows a K deficitof-49 kg ha' yr' (Table 4). It is obvious that for developing agricultural production inthe mountain regions, firstly K application has to be increased and it is essential toraise the application rates of N and P. For a further improvement of the nutrient cyclein farmland a higher level of field and nutrient management has to be achieved.
Table 4. Average farmland nutrient balance for 30 farms in the mountain regions(kg ha" )
Item Paddy Upland MeanN P20 5 K20 N P20 5 K20 N P205 K20
Total input 330 92 198 280 90 157 289 92 191Mineral 235 54 38 29 56 61 197 54 42fertilizersOrganic 91 36 156 78 34 96 88 36 145manureSeed 2 2 1 I 0.4 0.2 2 2 1Irrigation 2 0.4 4 2 0.3 4rain waterTotal 310 94 271 176 38 106 286 84 240removalGrain crop 126 88 199 79 37 101 117 78 181Oil crop I1 5 13 9 4 11Other crops 4 I 4 I 0.2 1Nutrient loss 174 2 59 93 159 2 48Balance 20 -2 -71 104 52 51 3 8 -49
Apparent nutrient balance for the various agro-ecological regions and the whole prov-ince
According to the agricultural statistics of the three agro-ecological regions and those ofthe whole Hunan Province, the hill regions rank first in terms of input and removal ofall nutrients (Table 5). They are followed by the lake regions and then the mountainregions, according to the order of productivity. The inputs of P and K, however, followa different order with hill regions > mountain regions > lake regions. Both nutrients
205

show significantly smaller ratio of input : removal in all three eco-regions, especiallyK. This nutrient is deficient in all three agro-eco-regions with a range between 29 - 38kg ha'. For P still a small surplus was calculated which is related to the relativesmaller inputs of K. This is similar to what was found by the farm survey. The prov-ince's average N and P input is larger than that of the individual agro-eco-regions,whereas the average K application rate of the province is smaller than that of the lakeand mountain regions. The apparent nutrient balance still indicates a deficit in K and asurplus in N and P. Even the high-yielding fields show a similar tendency, indicatingthat the nutrient imbalance is an important factor, limiting the agricultural productionin Hunan.
Table 5. Apparent farmland nutrient balance of the various agro-eco-regions and thewhole province
Agro-eco- Nutrient Input Removal A. balance Intensity ofregion (kg ha') Fertilization
(kg ha -') Ratio (kg ha-') Ratio (%)Hill region N 628 282 347 223(Ningxiang) P20 5 213 0.34 188 0.67 25 113
K20 406 0.65 439 1.56 -32 93Lake region N 607 249 358 244(Nanxian) P20 5 190 0.31 155 0.62 35 122
K20 298 0.49 336 1.35 -38 89Mountain N 445 230 215 193regions P205 151 0.34 116 0.50 34 130(Yongshun) K20 266 0.60 338 1.47 -29 79Province N 649 265 384 245
P20 5 218 0.34 164 0.62 55 133K20 397 0.61 397 1.50 -0.2 100
Changes in nutrient input over the years
Table 6 shows that K deficits and inadequacy of P appeared in the hill and mountainregions in 1987. When realizing the seriousness of the situation, Ningxiang countyadopted effective measures to increase the fertilizer input. N, P and K use increased by23.9%, 90.7% and 125.6%, respectively, from 1987 to 1997. As a result, though thefarmland area declined by 10% in the same period, the output of cereals rose by187.1%, that of oil crops by 161.1% and that of cotton increased 7 times. The in-creased output caused a larger removal of nutrients. The aim of the fertilisation policywas to minimise the deficit of K, to turn the P deficit into a P surplus and to raise the Ninputs. In the mountain regions, though the overall fertilizer application rate increased,the inadequate input of K caused a gap in the apparent balance. About 10 years ago,large fertilizer application rates caused a highly positive apparent balance, especially inthe lake regions. However, in the following years, the reduced input of P and K fertil-izers caused the appearance of K deficit and rapid reduction of the N and P surplus.The evolution of the negative nutrient balance has significantly reduced soil fertility,
206

especially, it caused a decline in the availability of K. The paddy fields all over theprovince are losing K at a rate of 2 mg kg -' per year. Considering the changes of thefarmland nutrient balance of all three eco-regions, the K input needs to be increased toreach an equilibrated nutrient balance.Table 6 also reveals that the proportion of organic manure in the total nutrient input
differed from one agro-eco-region to another and from year to year. In 1987, inputfrom organic manure was largest in the mountain regions, followed by the hill regionsand the lake regions. For various reasons, organic manuring receives less attention inthe hill regions and the mountain regions during recent years. On the contrary, in thelake regions, organic manuring rapidly increased because of the practice of reapingonly the ears and leaving all the straw for soil incorporation on the field. A techniquewhich has been widely disseminated in the meantime. According to stationary experi-ments of the province, the application of organic manure, amounting to 30 - 40% ofthe total N input is the most effective- Nitrogen directly increase crop yields and alsolargely contributes to the maintenance and the improvement of the soil fertility bygreater root biomass and larger amounts of plant residues. Both total and readily avail-able nutrients can be raised to a different extent, showing that the application of or-ganic manure promotes the circulation of nutrients within the farmland.
Table 6. Variation of nutrient inputs and balances between agro-eco-regions in differ-ent years (kg ha- yr-1)
Agro-eco- Nutrient 1987 1997region Input Removal Balance OM Input Removal Balance OM
Hill region N 449 200 249 31 628 282 346 38(Ningxiang) P20 5 99 139 -40 54 213 188 25 51
K20 159 319 -158 74 406 439 -32 58Lake region N 565 122 443 13 607 249 358 29(Nanxian) P205 282 82 200 9 190 155 35 34
K20 417 189 228 16 298 336 -38 60Mountain N 265 108 157 61 445 230 215 57regions P2O5 67 66 1 74 151 116 34 56(Yongshun) K20 114 160 -46 93 266 338 -71 79
Difference in soil readily available nutrients between agro-eco-regions
The readily available nutrient contents of the soil are directly affected by the annualnutrient balance, the soil parent material and soil conservation measures taken in theprevious years. The results of the analyses (Table 7) show that the available nutrientcontents in the plough layer varied between the three agro-ecological regions and thecropping system, paddy or upland. Paddy fields of the Lake regions contained the larg-est amounts followed by the hill regions and the mountain regions. On average over alleco-regions, K availability in paddy fields was poor whereas nitrogen availability wasin the sufficiency range. P availability was highest in paddy fields of the lake regionand very low to medium in the other two agro-ecological regions. The upland fieldsrevealed a different pattern of nutrient availability.
207

en 0- 'C ~0
V Ine ON o0en.~ V N, 00
>-~C) 01 en VA -en~ Io~ - o en 6 o~ 'C
-t - - In - 01Cd In -C) N a
- - N
~0- Cd ON Cl - 01C-)t.. ~ 0 V C
0 0 IntO N In ON 00 'C O~
i n 01 NO 04 N 'C - 00 'C 04 N- Cd 'C t -C)
Z ~N 04C.) ON -- '.6
i ~0' ~ V N e040 ~ - 01 01 - en
-~ ~0) 04 V -
ON 6 600 00 00
Cd N V
en en0 00~ ON ON - V V
a en - en od -2 -.N Cl 00 - 00 '0 en 00 N 01
c ~0
Cd en -t eno ~ V 'C V VC)to
C)
Cd
to -t Cdo ~ V N '0 N
-~ C O\ In Cl 'C ON V>1 >'± t6'd o~ 00 In 'CC) I g6 t ~ 6N
* -~ ~-.C '~ - en ON - en 01 N Cl - 'fl-~ tCd
Cd In 00 en ento ~CdCr
0
N '0 00 '0= 0 flen~tflN
- ~PON~ ~V0I 04 ~2 i 01 Cl ON 604 ~ a
CA -
Cd ON N - In ON - 5 Cl 0 - ClC) -~ en enen V 00
0CACdC)
=0C)
~ ~C-'
CCo C C
~ 0* C)
N 2- Cr*J 00 to Cd- - C.c toto - *- -~ Cd 0
'~ <2 Z
208
Whereas all soils of the upland fields could be classified as low to medium in N withslight differences between the agro-eco regions, P availability covered a wide rangefrom very low to high supply. On average, soils of the lake region had the highest Pavailability, the mountain region the lowest. Similar observations were made in thereadily available K contents. Altogether, better K availability in the upland comparedto the paddy fields was observed. The numbers, however, show wide ranges from lowto high supply. On average, soils of highest K availability in upland soils was found in
the lake region.
Prediction of the fertilizers demand and recommendations
Within 20 years from 1977 to 1997, the population of Hunan increased at a rate of0.677 M yr'. Based on such a growth rate, the population is estimated to be 70.07 Mand 73.45 M, respectively, in 2005 and 2010. Assuming a requirement of 500 kg grain,20 kg oil and 5 kg cotton per person by 2005, the province will need 35.03 Mt of grain,1.40 Mt of oil and 0.35 Mt of cotton. By the year 2010, 36.726 Mt of grain, 1.469 Mtof oil and 367,000t of cotton will be needed. Based on the nutrient consumption andthe nutrient removal by respective amounts of economical products, the nutrient bal-ance in 1997 and the amount of fertilizers needed to raise soil fertility, it is estimatedthat the province will need 385,000t N, 113,000t P 20 5 and 777,000t K20 in 2005 and439,000t N, 131,000t P20 5 and 830,000t K20 (from organic manure and mineral fertil-izers) in 2010. The nutrient ratio has to be 1 : 0.29-0.30 : 1.98-2.02, N : P20 5 : K20.Looking at the nutrient balance and the readily available nutrients in the soils of the
agro-eco-regions, it is advised that the input of N fertilizers should follow the recom-mendations for paddy fields in the hill and mountain regions. P fertilizers should bereduced in the lake regions and increased in the hill and mountain regions. K fertilizersshould be increased in upland fields in the hill regions and in paddy fields in the moun-tain and lake regions. Furthermore, it is suggested that all the straw and other cropresidues are returned to the field to ensure a closer farmland nutrient cycle.
209

NPK balance and nutrient management in farmland of Jiangxi
Li Zuzhang, Tao Qixiang, Liu Guangrong and Liu Yiren
Soil and Fertilizers Institute, Jiangxi Province Academy of Agricultural Sciences330200
Abstract
In retrospect of the history of the farmland nutrient balance, the status and balance ofthe NPK nutrients in Jiangxi in 1997 were calculated. The outcome is that since thesoil survey carried out in 1981, N balance improved by 17%, that of P by 49.7%whereas the K balance deteriorated by 25.4%. Based on the current fertilization prac-tice, measures for managing nutrients in the province's farmlands are suggested. Forthis study typical agro-ecological regions were selected, consisting of Nanchang(plain), Xingan (plain-hill transitional zone) and Xingguo (mountain). 147 soil sampleswere collected for chemical analyses in 1997 from the plough layers at the same sitesused for the second China-wide soil survey in 1981. The results showed that on aver-age, compared to 1981 the soil organic matter content of the farmland increased by37.6%. The total N content rose by 23.9%, available (alkaline) N by 9.2%, readilyavailable P by135%, but readily available K decreased by 16.5% and the pH droppedslightly. To explain these observations, a detailed analysis of the nutrient balance ofthe farmland was carried out.
Evolution of farmland NPK nutrient balance in Jiangxi
Farmland nutrient balances in Jiangxi of the past 50 years clearly indicate that the his-torical development can roughly be divided into three phases (Table 1):I) The years before 1960 are set as the first phase, which is characterized by a deficit
in all three major nutrients.2) The period between 1960 and 1980 is the second phase, which witnessed a great
change in the farmland nutrient balance, i.e. N shifted from being deficient to beingbasically in balance and P started to receive some importance. Such a change wasthe foundation needed for the agriculture in the Jiangxi Province.
3) The last phase stretches from 1980 until now. This phase is characterized by a sur-plus application of N and P whereas K is undersupplied. This causes widespread Kdeficiency and reduced crop yields and crop quality.
211

Table I. Changes in the history of farmland NPK nutrient balance in Jiangxi
Year Mean (%)N P20 5 K20
1949 -22.1 -14.4 -29.41955 -26.0 -20.0 -32.21960 -2.3 +4.6 -16.91965 -8.8 +30.5 -36.51970 +4.4 +47.5 -35.61975 +4.2 +27.4 -29.31980 +20.7 +45.7 -36.11985 +20.6 -19.1 -42.51990 +53.3 +14.4 -23.31997 +87.4 +98.6 -20.2
Note: The data before 1983 were cited from "Regionalization of chemical fertilizers inthe Jiangxi Province"
Farmland nutrient balance in Jiangxi
NPK removal from farmland soil
The nutrient removal from farmland soil is based on total crop production and theamount of nutrients absorbed for the production of a certain unit of crop product. Sincethese vary with crop, climate, year and fertilization, average values (Basic Parametersfor Calculating Farmland Nutrient Cycling and Balance in Jiangxi) were compiled bythe Soil and Fertilizers Institute of the Jiangxi Province Academy of Agricultural Sci-ence, and the agricultural statistics of Jiangxi (1997) and used for the nutrient balancecalculations (Table 2).
Table 2. Amounts of nutrients consumed by major crops in Jiangxi (1997)
Crop N P20 5 K20(x 1000 t) (%) (x 1000 t) (%) (X 1000 t) (%)
Grain crops 353.5 73.9 159.1 72.7 388.1 78.0Cash crops 51.9 10.8 27.3 12.5 41.2 8.3Oil crops 56.3 11.8 21.8 10.0 44.4 8.9Melon-fruit 16.5 3.5 10.6 4.8 23.8 4.8Total 478.2 100 218.8 100 497.5 100
Among the four crops, cereals consumed most of the nutrients, about 72.7% - 78% ofthe total consumption. Though the share absorbed by the other three crops is compara-tively small, crop diversification caused that during the past few years the proportionalconsumption of especially cash crops, fruit and vegetables increased.. Among the threemajor nutrients, the absorption from the soil is largest for K, accounting for 41.6% ofthe total followed by N and P, accounting for 40% and 18%, respectively.
212
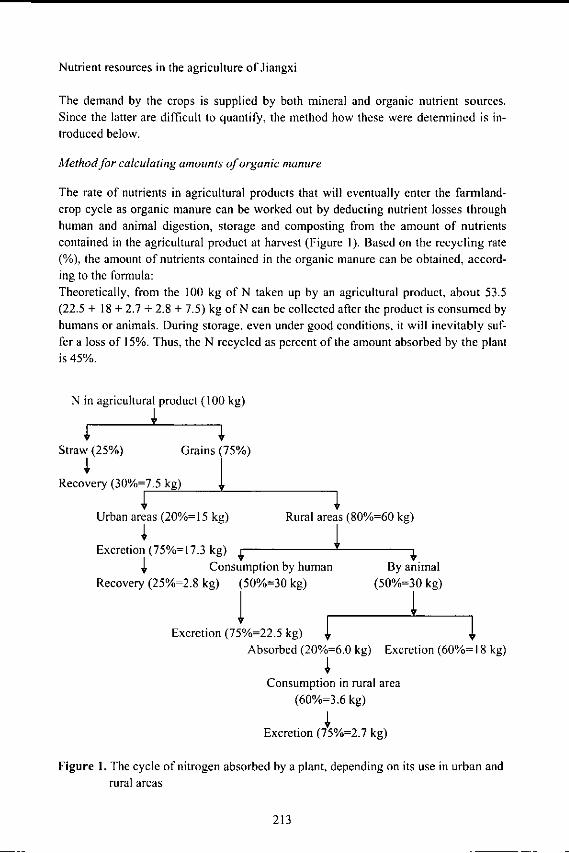
Nutrient resources in the agriculture of Jiangxi
The demand by the crops is supplied by both mineral and organic nutrient sources.Since the latter are difficult to quantify, the method how these were determined is in-troduced below.
Method for calculating amounts of organic manure
The rate of nutrients in agricultural products that will eventually enter the farmland-crop cycle as organic manure can be worked out by deducting nutrient losses throughhuman and animal digestion, storage and composting from the amount of nutrientscontained in the agricultural product at harvest (Figure I). Based on the recycling rate(%), the amount of nutrients contained in the organic manure can be obtained, accord-ing to the formula:Theoretically, from the 100 kg of N taken up by an agricultural product, about 53.5(22.5 + 18 + 2.7 + 2.8 + 7.5) kg of N can be collected after the product is consumed byhumans or animals. During storage, even under good conditions, it will inevitably suf-fer a loss of 15%. Thus, the N recycled as percent of the amount absorbed by the plantis 45%.
N in agricultural product (100 kg)
Straw (25%) Grains (75%)
Recovery (30%=7.5 kg)
Urban areas (20%= 15 kg) Rural areas (80%=60 kg)
Excretion (75%=17.3 kg) _, _,
Consumption by human By animalRecovery (25%=2.8 kg) (50%=30 kg) (50%=30 kg)
Excretion (75%=22.5 kg)Absorbed (20%=6.0 kg) Excretion (60%=18 kg)
Consumption in rural area(60%=3.6 kg)
Excretion (75%=2.7 kg)
Figure 1. The cycle of nitrogen absorbed by a plant, depending on its use in urban andrural areas
213
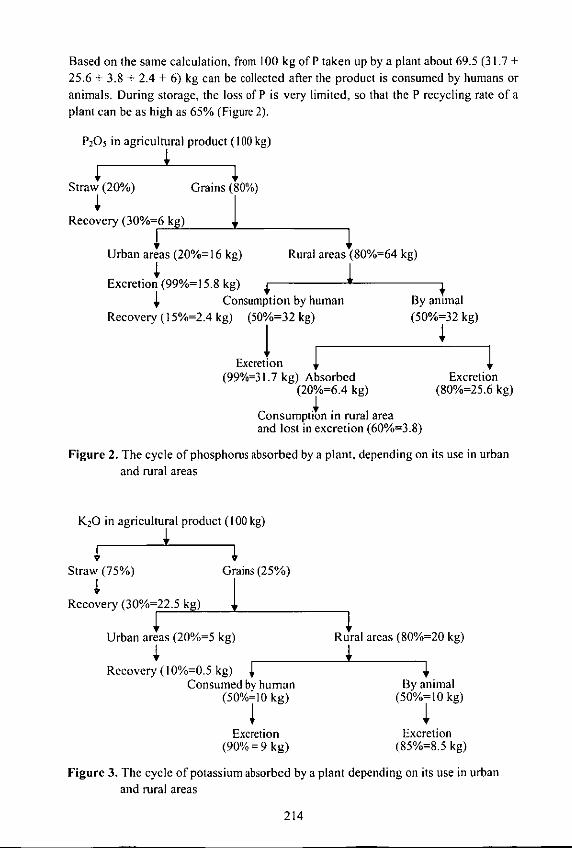
Based on the same calculation, from 100 kg of P taken up by a plant about 69.5 (31.7 +25.6 + 3.8 + 2.4 + 6) kg can be collected after the product is consumed by humans oranimals. During storage, the loss of P is very limited, so that the P recycling rate of aplant can be as high as 65% (Figure 2).
P205 in agricultural product (100 kg)
Straw (20%) Grains (80%)
Recovery (30%=6 kg)
Urban areas (20%=16 kg) Rural areas (80%=64 kg)
Excretion (99%=]15.8 kg) ~, Consumption by human By anmal
Recovery (15%=2.4 kg) (50%=32 kg) (50%=32 kg)
Excretion(99%=31.7 kg) Absorbed Excretion
(20%=6.4 kg) (80%=25.6 kg)t
Consumption in rural areaand lost in excretion (60%=3.8)
Figure 2. The cycle of phosphorus absorbed by a plant, depending on its use in urbanand rural areas
K20 in agricultural product (100 kg)
Straw (75%) Grains (25%)
Recovery (30%=22.5 kg)
Urban areas (20%=5 kg) Rural areas (80%=20 kg)
Recovery (I0%=0.5 kg)Consumed by human By animal
(50%=10 kg) (50%=10 kg)I+Excretion Excretion
(90% = 9 kg) (85%=8.5 kg)
Figure 3. The cycle of potassium absorbed by a plant depending on its use in urbanand rural areas
214

Based on the above-described calculation from 100 kg of K20 absorbed by a plantabout 40.5 (9 + 8.5 + 0.5 + 22.5) kg can.be collected after the crop is consumed byhumans or animals (Figure 3). During storage in good conditions, certain limited losseshave to be taken into account. Thus, the K recycling rate of an agricultural product isestimated at 0.40 % of the total amount absorbed.
Green manure
In 1997, the total area of green manure crops reached 558,380 ha, which theoreticallycould approximately provide 16,700t N, assuming that each hectare of green manurecrops can fix 30 kg N ha- . The amounts of P and K contained in the green manure areno net gains of nutrients, as they were absorbed from the farmland itself.
Total amount of nutrients in the various sources of organic manure in Jiangxi
Based on the above-estimated nutrient recycling rate (0.45 for N, 0.65 for P and 0.40
for K) the nutrient removal by crops (see Table 2) and the nutrient supply from greenmanure and the total amount of nutrients contained in the organic manure of Jiangxi in1997 was estimated at 0.2319 Mt N, 0.1422 Mt P205 and 0.199 Mt K20.
Mineral fertilizers
According to the Statistical Yearbook of the Jiangxi Province in 1997, the provinceconsumed in total 0.602 Mt N, 0.231 Mt P20 5 and 0.185 Mt K20 plus 186xl0 t ofcompound fertilizers, totalling 1.204 Mt. Based on the assumption that compound fer-tilizers contained the same amounts of N, P20 5 and K20 the total consumption of thethree major nutrients through mineral fertilizer (including compounds) was 0.664 MtN, 0.293 Mt P205 and 0.247 Mt K20 in 1997. Taking the figures of 2001, the con-sumption of mineral nutrients declined to 0.561 Mt N, 0.275 Mt P205 and 0.260 MtK20. This shows that the ratio changed in favour of K consumption in the meantime.
Farmland NPK nutrient input
Based on the nutrient recycling rate of agricultural products and the consumption ofmineral fertilizers the farmland nutrient input was determined (Table 3). 74.1% of N,67.3% of P and 55.4% of K were supplied in the form of mineral fertilizer and the bal-ance in the form of organic manure, indicating the important role of organic manure inthe supply of particularly K to farmland. Mineral fertilizers accounted for 67.8% andorganic manure for 32.2% of the total nutrient input.
215

Table 3. Farmland nutrient input in Jiangxi (1997)
N P205 K20 Total nutrient(Mt) (%) (Mt) (%) (Mt) (/) (Mt) (%)
Mineral 0.664 74.1 0.293 67.3 0.247 55.4 1.204 67.8fertilizersOrganic manure 0.2319 25.9 0.1422 32.7 0.1990 44.6 0.5731 32.2Total 0.8959 100 0.4352 100 0.4460 100 1.7771 100
Farmland nutrient balance in Jiangxi
The results in Table 4 show that the apparent nutrient balance in 1997 was positive forN (+16.98%) and P205 (49.72%) and negative for K20 (-25.4%). On the basis of 2.302million ha farmland in Jiangxi, the nutrient balance for each hectare showed a surplusof 66.1 kg N and 94 kg P20 5 and a deficit of 49.2 kg K20. Under the humid and warmconditions of Jiangxi, it is very likely that most of the N surplus did not accumulate inthe soil but was lost into the air (volatilisation, denitrification) or leached into water-bodies by various pathways. It was observed that most of the surplus applied P, how-ever, accumulated in the soil and became an important P source for the succeedingcrops. The current fertilization characterized by an imbalance between K input andoutput speeds up soil K depletion, leading to a decrease in soil K fertility. This is themajor reason for the expanding area with K-deficient soils. The results of the calcula-tion are reflected by soil analyses, showing a decrease in K supply of soils.
Table 4. Farmland nutrient balance in Jiangxi (1997) (Mt)
Item N P20 5 K20
Nutrient input 0.896 0.435 0.446Nutrient output 0.478 0.219 0.498Mineral fertilizer N loss (40%) 0.266Mineral fertilizer leaching loss (25%) 0.062Balance +0.152 +0.216 -0.113Balance I%) (apparent) +16.98 +49.72 -25.4
Furthermore, Table 5 reveals that in the farmland ecosystem, the nutrient recycling ratereaches 31.2% for N, 65% for P20 5 and 35.6% for K20, on average 37.7%. Comparingthese results with Figure 1-3, it is evident that there is further potential for N and Krecycling. The key lies in rationalizing fertilization, reducing losses, making reason-able use of pig and cattle dung and returning crop residues to the field with specialattention to quantity and quality.
216

Table 5. Nutrient recycling of the farmland in Jiangxi (1997) (Mt)
Nutrient Total output* Return Recycling (%)
N 0.744 0.232 31.18P20 5 0.219 0.142 64.99K20 0.559 0.199 35.58Total 1.522 0.573 37.66
* Note: including N and K losses
Effect of fertilization on farmland nutrient balance
Stationary experiments were carried out to study the effect of fertilization on farmlandnutrient balance for several years. Some data of the experiments are used to explain theeffects on farmland nutrient balance caused by applying mineral fertilizers or organicmanure.
Effect of successive application of different formulas of mineral fertilizers on farmlandnutrient balance
On paddy soils derived from quaternary red clay, granite, pelite, river alluvium, terti-ary red sandstone and Xiashu loess, stationary experiments were carried out at six dif-ferent experimental sites from 1984 to 1994 to investigate the effect of successive ap-plications of different formulas of mineral fertilizers on double-cropped rice. The re-sults (Table 6) indicate that the application of N at a rate of 270 kg ha' N led to a sur-plus of 43-72 kg N ha' annually and the application of P caused a small P surplus ofbetween 4.7 and 22.9 kg P ha-'. Despite an application of 150 kg K 20 ha-, the nega-tive balance for this nutrient prevailed though it was most severe in the NP plot..
Table 6. Soil nutrient balance during the experiments (mean of six sites)
Treat- Total nutrient input Total nutrient output Balancement (kg ha- ') (kg ha') (kg ha)
N P20 5 K 20 N P20 5 K20 N P20 5 K20CK 0 0 0 96.8 42.4 131.3 -96.8 -42.4 -131.3PK 0 90 150 135.1 67.1 242.3 -135.1 +22.9 -92.3NP 270 90 0 226.5 85.3 214.1 +43.5 +4.7 -214.1NK 270 0 150 197.5 66.4 265.1 +72.4 -66.5 -115.1NPK 270 90 150 219.2 94.6 245.3 +50.8 -4.6 -95.3
217

Effect of application of mineral fertilizers in combination with organic manure onfarmland nutrient balance
From 1983 to 1996, stationary experiments were carried out to study the combinedeffect of mineral fertilizers and organic manure on double-cropped rice in a Chaoshanipaddy field in XiangTang (Table 7). Comparing the nutrient input and nutrient outputof 26 rice crops during 13 years revealed that in treatments M (organic manure), F(mineral fertilizer) and M + F, nitrogen was in surplus, which rose according to theapplication rate. P was in surplus in treatment M and M + F and slightly deficient intreatment F, where small amounts of P were applied. K was deficient in treatment Mand F but showed a surplus in treatment M + F. All these results indicate that the cur-rent application rate of mineral fertilizers or organic manure alone can't keep nutrientsin balanced supply. Only when mineral fertilizers are applied in combination with aproper amount of organic manure, the nutrient input and output can be kept in balance.
Table 7. Effect of combined application of chemical fertilizers and organic manure onfarmland nutrient balance (mean of 13 years)
Treatment Total nutrient input Total nutrient outpu Balance(kg ha -') (kg ha-')t (kg ha - )
N P205 K20 N P20 K20 N P205 K20CK 0 0 0 121 56 193 -121 -56 -193M* 234 81 249 189 77 315 +45 +4 -66F* 234 81 249 189 83 322 +45 -3 -73M+ F 468 162 498 233 103 375 +235 +59 +123(M + F)/2 234 81 249 191 86 345 +43 -5 -96(M + F)/3 156 54 166 180 80 282 -24 -26 -116
*: M stands for organic manure and F for mineral fertilizers.
Effect of successive application of K at different rates on the K balance in paddy fields
From 1986 to 1990, stationary experiments were conducted with successive applica-tions of K at different rates on rice in Liantang and Gaoan. The results revealed that inHuangni paddy field and Hongni paddy field both low in soil K the annual crop K up-take rate decreased significantly over the years when only N + P fertilizers were ap-plied (Figure 4). After five years, the K uptake of rice at Huangni was reduced by 51%and by 73% in the Hongni soils. This shows that intensive cropping caused the soil Kfertility to drop rapidly. If soil K is not replenished K deficiency seriously affects theeffectiveness of N and P fertilizers as well as the crop yield and quality.In the same experiments, the K supply by mineral fertilizer varied from 373.5 - 1120.5kg ha-' (cumulative over 5 years). The cumulative balance shows that the amount of Kremoved from the soil ranged from 981.0 - 1553.3 kg ha -t, causing a K deficit of 407.4-656.8 kg hat (Table 8). The output of K was always larger than the input. Apparently,the soil made up for the deficit, causing a depletion of soil K reserves which was
218

350
300-
S250-a 200 _ -0--Huangni
150 -0- Hongni
Z, 100" 50
0
I 2 3 4 5
Year after K omission
Figure 4. The effect of K omission on K uptake by rice at two locations over a period
of 5 yearsreduced in the treatments, receiving K application, especially at. the large applicationrate. Nevertheless, even there a cumulative negative balance of greater than 400 kg ha -'
(80 kg ha ' yr-') indicates soil K mining. Though the deficit declined with the amount
of mineral fertilizers and organic manure supplied (see Table 6), the K application ratehas to be increased to 450 kg ha-' to maintain or even improve the soil K status. There-
fore, the fertilization principle for the years to come should be "reducing N, controlling
P and increasing K application rates".
Table 8. Balancing of soil K nutrient (cumulative over 5 years)
Soil Treatment Total K uptake Total K input Balance(kg KO 0ha -_) (kg K20 ha - ') (kg K20 ha - ' )
Huangni NP 624.4 0 -626.4NPKI 981.0 373.5 -607.5NPK2 1275.4 747.0 -528.4NPK 3 1553.3 1120.5 -432.8
Hongni NP 675.5 0 -675.5NPK1 1030.3 373.5 -656.3NPK2 1364.0 747.0 -617.0NPK3 1515.4 1120.5 -407.4
Management of farmland nutrients
Mineral fertilizer consumption in the agriculture of Jiangxi
By reviewing the forty-year history of the development in mineral fertilizer consump-
tion in the agriculture of Jiangxi, three phases can roughly be distinguished. In the
years before 1960, Jiangxi used mainly N fertilizers with little P fertilizers and no K
219

fertilizers at all. The NPK ratio during this period was 1: 0.29 : 0 (N : P2 0 5 : K20).During the years from 1960 to the early 1980s, the consumption of P fertilizers in-creased significantly, gradually forming a fertilization system in which N and P are thedominating components and K is only considered as a supplement. The N:P:K ratioduring this period changed to 1:0.60:0.05. And during the years from the early 1980'sto the late 1990's, the N and K application rates increased drastically, changing theN:P:K ratio from 1:0.58:0.07 in 1980 to 1:0.25:0.32 in 1990 and 1:0.44:0.37 in 1997.The current NPK consumption is 1.332 million t (2001) at a ratio of 1:0.41:0.37 (NP20 5 : K20), indicating that nutrient rates stabilize around these figures.
The management of farmland N, P and K nutrients
Based on the set principles of "reducing N, controlling P and increasing K, the de-mands for mineral fertilizer nutrients in 2005 and 2010 are predicted.Based on the growth rate of mineral fertilizer consumption in the past 10 years, thecurrent status of farmland nutrient balance (surplus in N, excessive P use and deficit inK) and the changes in the cropping structure in the Jiangxi Province, the demand formineral fertilizers in 2005 and 2010 are predicted (Table 9).
Table 9. Predicted demand for mineral fertilizers of Jiangxi in 2005 and 2010 (Mt)
Nutrient Consump- Growth Estimated Growth Estimatedtion rate till demand in rate till demand in
in 1997 2005 2005 2010 2010N 0.664 1.6 0.792 1.2 0.852P205 0.293 0.8 0.357 0.6 0.387K20 0.247 1.7 0.383 1.9 0.478Total 1.204 4.1 1.532 3.7 1.717N:P 20 5:K 20 1:0.45:0.48 1:0.45:0.56
To balance the nutrient demand with the supply, by 2010 Jiangxi will have to doubleits consumption of K fertilizers to keep the K fertility of its soils and hence the produc-tivity of its cropping systems. The NPK demand for 2005 is estimated at 1.532 milliontons of NPK at a ratio of N : P20 5 : K20 of 1:0.45:0.48. Taking into account thechanges towards cropping systems with larger K demand in the future, the ratio willeven narrow to 1:0.45:0.56 in 2010.
Use of organic manure and raising farmland nutrient recycling rate
The use of organic manure is an optimal system of recycling nutrients within the agri-cultural production. It is anticipated that the strategy for fertilization, "combining theapplication of mineral fertilizers and organic manure with the former as main and thelatter as supplement", will last for decades to come. The application rate of organicmanure of over 15,000 - 18,000 kg ha-1 yr-' was able to maintain the soil organic mat-
220

ter content of paddy fields. However, the scenario may change drastically in the up-lands, where much faster turnover of soil organic matter, etc. cause a greater demandfor soil protective measures, including the recycling of crop residues and farmyardmanure. The current recycling of rice straw is still very small, only 30% of what isproduced is returned to the field. Emphasis should therefore be laid on returning atleast 60% of the straw back to the field.
Popularizing scientific fertilization technique and improving effectiveness of fertiliza-
tion
Mainly the fertilization techniques such as "adequate N application rates and modifiedN application" need to be disseminated to farmers to reduce N loss and improve Nrecovery rate. On the basis of a crop rotation, an integral plan is required for applyingP with large amounts during winter and small dressings during summer. More P shouldbe applied to upland fields and less to paddy fields. Leguminous crops should be gen-erously supplied with P, whereas cereals need less. Generally, no or little P fertilizersshould be applied to soils, where the readily available P is beyond 35 mg kg -'. Supplylevels of 25 mg kg -' available P indicate good P supply of the soils, depending on soiltypes. To keep this status of availability, P should be applied to every second crop inthe rotation or every second year. In view of the fact that K resources are inadequate inChina, great efforts should be devoted to safe K by putting great emphasis on returning
crops residues, especially cereal straw back to the field. Nevertheless, greater amounts
of mineral K fertilizers have to be used to supplement and maintain soil K levels at ahigh availability. Therefore, besides stressing the need of applying K to paddy rice,attention should also be given to upland fields and cash crops. In the rotation oil crops-rice-rice, more K fertilizers should be allocated to oil crops and late rice and less to
early rice to make full use of the after-effect of K fertilizers.
Developing with vigour special-purposed blended fertilizers or granular compound
f rtilizers
Special-purpose blended fertilizers and granular compound fertilizers are promoted todisseminate and implement the idea of balanced fertilization techniques. In 1998, Ji-angxi consumed 0.526 Mt blended fertilizers, of which 0.09 Mt were compound fertil-izers, over an area of 0.22 million ha. The survey indicated that as a consequence thecrop output increased by 8.2% or 99.245 million kg of grain and by 98.16 millionYuan (RMB). Considering the economic and social benefits, it is essential to designsoil-specific and crop-specific formulas of fertilizers which can include fertilizer-manure blends that are fit to better supply the crop demand.
221


Farmland nutrient balance, a strategy for its improvement and theprediction of future fertilizer demand in the Guangdong Province
Zhang Yucan and Zheng Huidian
Soil and Fertilizers Head Station, Agriculture Bureau, Guangdong Province, 510500
Abstract
A study was carried out to assess the nutrient balance in the farmland of Guangdong.For this purpose, data from the second soil survey, from long-term stationary monitor-ing of soil nutrients, parameters of crop demand for fertilizers, the actual fertilizer con-sumption and the status of farmland nutrients were analysed. The results reveal that inGuangdong Province N is generally in low, P in surplus and K in marginal supply. Thepaper proposes to close the gap between K removal and input and to increase the ap-plication of organic manure, intensify the dissemination of the principles of balancedfertilization techniques and improve farmers' understanding of a science based fertili-zation practice. The paper concludes with a prediction of future fertilizer demand.
Introduction
Guangdong Province located in the south of China enjoys an abundance of tempera-ture, light, soil and water resources. The total output of agricultural crops in 1998 in-creased by 1.6 times over that in 1978. Among all the crops, fruits exhibit the fastestgrowth in production by 1,556 % whereas sugar crops show an increase of 110 %, riceof 27 % and groundnut around 12 % (Table 1). The total output of vegetables reached21.492 Mt in 1998, accounting for 5.6% of the country's total. The output of fruits andsugar crops ranked second in the country and that of vegetables, groundnut and ricefifth. All this indicates that Guangdong is a province with a well-developed agricul-ture. The increased production has also created a stronger demand on nutrients and it isthe purpose of this study to shed more light into the relationship between nutrient de-mand and supply to better understand the needs of balanced fertilization.As the output of agricultural crops has a large volume, there is a great removal of nu-trients from the soil in the province. Emphasis is laid on assessing whether the input ofnutrients is matching the requirements for crop growth. Furthermore, the aspect ofwhether nutrients are applied in appropriate ratios and to determine whether the prov-ince's farmland nutrient status as a whole shows imbalances which need to be cor-rected. Main focus received the macronutrients N, P and K whereas other nutrients,e.g. Mg, S and micro-nutrients were not specifically analysed, the issue, however, wastaken into account to see whether current fertilization practices fail to meet the cropdemand in this respect.
223

Table i. Output (1000t) of the major agricultural products in Guangdong in the past 20
years in comparison to fertilizer consumption (1000t)
Item Year Growth rate Rank*1978 1998 (%)
Grains 15095.1 20077.4 133Rice 13285.6 16885.3 127 5Vegetables -- 21492.0 5Fruits 291.0 4531.2 1557 2Sugar crops 8354.2 17569.0 210 2Groundnut 351.7 780.5 222 5Consumption of fertilizers 2862.9 6015.2 210 9
* Note: Rank indicates the position of Guangdong in terms of respective production orfertilizer consumer among all provinces in China
Farmland nutrient balance
At the end of the 1970's and the beginning of the 1980's, Guangdong Province carriedout the second soil survey with results, showing that the farmland soil was moderate inorganic matter and N, deficient in P, low in K, short of B and Mo, moderately wellsupplied with Cu and Zn and rich in Fe and Mn. The nutrient management was charac-terized by a nutrient imbalance which lasted for the past 20 years, especially until theearly 1990's. According to the investigations conducted in the winter of 1990, the 419
soil surveys and soil fertility monitoring posts all over the province revealed that soilorganic matter decreased slightly by about 3% during these ten years. Total N de-creased by 7%, total K by 4% and the readily available K which was already low with69.73 mg kg -' decreased further by about 9%. During the same period, there was also a
slight decline in soil pH slightly whereas total P and readily available P increased (Ta-ble 2).
Table 2. Changes in soil nutrient status in paddy fields in Guangdong Province(n =419)
Early 1990 Percentage of monitoring posts1980's
Parameter Increasing Decreasing No changeO.M, g kg' 26.6 25.9 48.1 51.4 0.5Total N, g kg - 1.43 1.33 46.4 53.3 0.3Alkalytic N, mg kgl 105.5 108.8 51.4 47.6 1.0Total P, g kg ' 1.02 1.06 61.3 36.2 2.5Readily available P, mg kg-' 19.7 22.2 53.3 43.5 2.5Total K, g kg -' 19.5 18.8 48.5 51.5 0Readily available K, mg kg -' 69.73 65.37 45.2 0.5 54.3pH 5.76 5.47 29.8 61.7 8.5
*Alcalytic N: 1.0 M NaOH incubation at 40 'C for 24 h, reflecting the available N
224

These results differed greatly from the ones obtained during the second soil surveycarried out ten years earlier. It is clearly shown in Table 2 that out of 419 monitoringposts about half display a downward trend in soil organic matter, total N, total K andpH, a significant increase in total and readily available P and no changes in readilyavailable K. This indicates that after 10 years of supplementing P and K fertilizers,total and readily available P as well as readily available K in the farmland soil wereimproved in comparison to the second soil survey (early 1980's).According to the long-term stationary monitoring of soil fertility initiated in 1984,from the 151 posts under all-year-round monitoring in paddy fields, about 65.6%,62.3%, 85.4% and 63.6% revealed an upward trend in soil organic matter, alkaline N,readily available P and K, respectively. The upward trend of readily available P wasthe most obvious (Table 3).With the exception that less increases were recorded, the studies in the upland fieldsshowed a very similar pattern as the paddy fields (Table 3). Largest differences oc-curred in organic matter and in readily available K.
Table 3. Changes in farmland nutrient balance in Guangdong Province (1984-1998)
Paddy fields Upland fieldsParameter Increase Decrease Increase Decrease
Posts % Posts % Posts % Posts %OM, g kg-I 99 65.6 51 33.8 6 50 6 50Total N, g kg' 107 70.9 39 25.8 9 75 3 25*Alkalytic N, mg kg-1 94 62.3 54 35.8 8 67 4 33Readily available P, mg kg-l 129 85.4 22 14.6 11 92 1 8Readily available K, mg kg' 96 63.6 53 35.1 7 58 5 42p H 51 33.8 86 57.0 7 58 4 33*Alcalytic N: 1.0 M NaOH incubation at 40 OC for 24 h, reflecting the available N pool
The reason for this observation is that during the period from 1980 to 1995, the con-sumption of mineral fertilizers in Guangdong increased by a factor of 1.36 and the ap-plication rate from 301.5 kg ha- to 844.5 kg ha -'. The consumption of P fertilizers in-creased by 62.9%, reaching 0.272 Mt in 1995, and the consumption of K fertilizersreached 0.341 Mt, four times as much as in 1980. This increased the proportion of K inthe total fertilizer consumption from 8.2% in 1980 to 17.4% in 1995. The consumptionof N fertilizers also rose from 0.58 Mt to 0.995 Mt (Table 4). During this period, theamount of organic manure applied also increased, contributing to the increase in soilorganic matter, alkalytic N, readily available P and readily available K contents to avarying extent. The consumption figures in Table 4 do not include the nutrients fromcompound fertilizers. The consumption of compound fertilizers in 2001 was 390,400 t.Assuming an N:P 20 5 :K 20 ratio of 15:15:15, the consumption figures for 2001 were N= 1.03 Mt, P 20 5 = 0.260 Mt and K20 = 0.425 Mt.
225
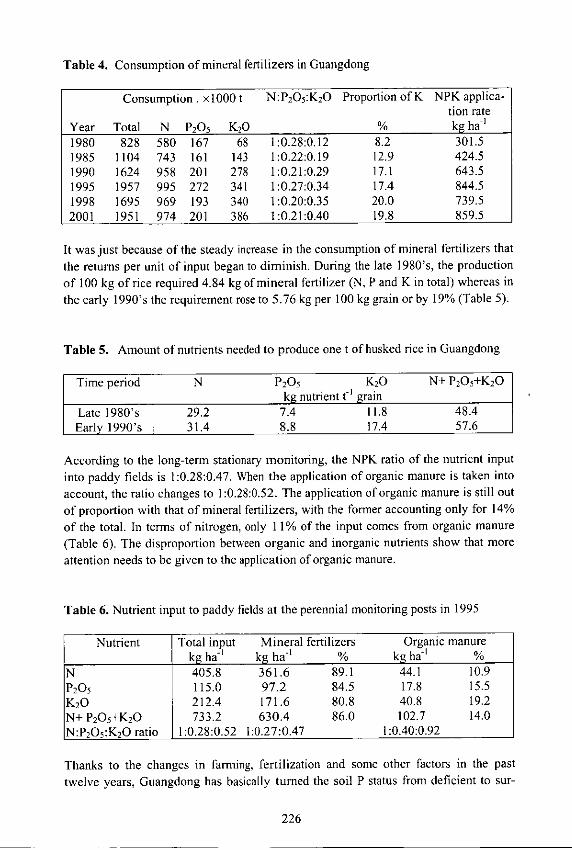
Table 4. Consumption of mineral fertilizers in Guangdong
Consumption. ×1000 t N:P 20 5:K20 Proportion of K NPK applica-tion rate
Year Total N P20 5 K 20 % kg ha-'1980 828 580 167 68 1:0.28:0.12 8.2 301.51985 1104 743 161 143 1:0.22:0.19 12.9 424.51990 1624 958 201 278 1:0.21:0.29 17.1 643.51995 1957 995 272 341 1:0.27:0.34 17.4 844.51998 1695 969 193 340 1:0.20:0.35 20.0 739.52001 1951 974 201 386 1:0.21:0.40 19.8 859.5
It was just because of the steady increase in the consumption of mineral fertilizers thatthe returns per unit of input began to diminish. During the late 1980's, the productionof 100 kg of rice required 4.84 kg of mineral fertilizer (N, P and K in total) whereas inthe early 1990's the requirement rose to 5.76 kg per 100 kg grain or by 19% (Table 5).
Table 5. Amount of nutrients needed to produce one t of husked rice in Guangdong
Time period N P20 5 K20 N+ P20 5+K 20kg nutrient f grain
Late 1980's 29.2 7.4 11.8 48.4Early 1990's 31.4 8.8 17.4 57.6
According to the long-term stationary monitoring, the NPK ratio of the nutrient input
into paddy fields is 1:0.28:0.47. When the application of organic manure is taken into
account, the ratio changes to 1:0.28:0.52. The application of organic manure is still out
of proportion with that of mineral fertilizers, with the former accounting only for 14%
of the total. In terms of nitrogen, only 11% of the input comes from organic manure
(Table 6). The disproportion between organic and inorganic nutrients show that more
attention needs to be given to the application of organic manure.
Table 6. Nutrient input to paddy fields at the perennial monitoring posts in 1995
Nutrient Total input Mineral fertilizers Organic manurekg ha- ' kg ha -' % kg ha - 1 %
N 405.8 361.6 89.1 44.1 10.9P2 0 5 115.0 97.2 84.5 17.8 15.5K20 212.4 171.6 80.8 40.8 19.2
N+ P20 5+K20 733.2 630.4 86.0 102.7 14.0
N:P 20 5:K 20 ratio 1:0.28:0.52 1:0.27:0.47 1:0.40:0.92
Thanks to the changes in farming, fertilization and some other factors in the past
twelve years, Guangdong has basically turned the soil P status from deficient to sur-
226
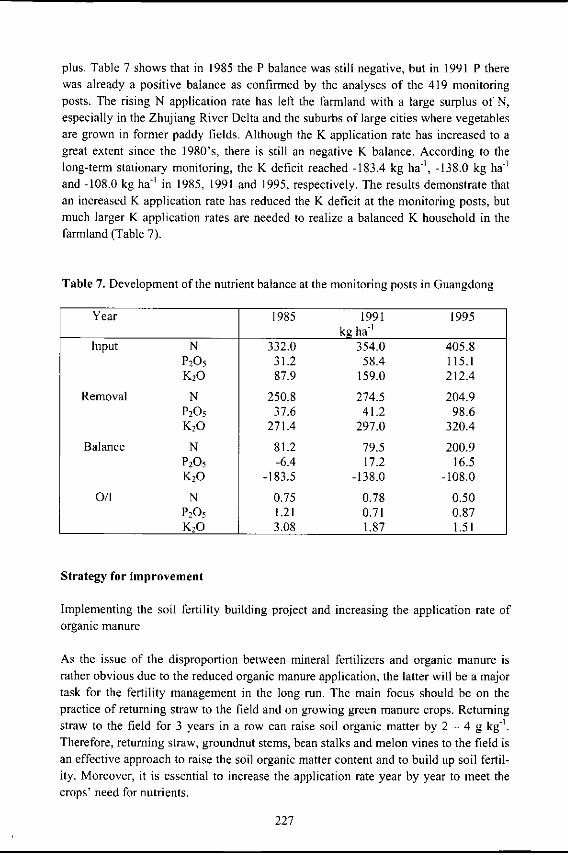
plus. Table 7 shows that in 1985 the P balance was still negative, but in 1991 P therewas already a positive balance as confirmed by the analyses of the 419 monitoringposts. The rising N application rate has left the farmland with a large surplus of N,especially in the Zhujiang River Delta and the suburbs of large cities where vegetablesare grown in former paddy fields. Although the K application rate has increased to agreat extent since the 1980's, there is still an negative K balance. According to thelong-term stationary monitoring, the K deficit reached -183.4 kg ha - ', -138.0 kg ha -1
and -108.0 kg ha -' in 1985, 1991 and 1995, respectively. The results demonstrate thatan increased K application rate has reduced the K deficit at the monitoring posts, butmuch larger K application rates are needed to realize a balanced K household in the
farmland (Table 7).
Table 7. Development of the nutrient balance at the monitoring posts in Guangdong
Year 1985 1991 1995kg ha -'
Input N 332.0 354.0 405.8P20 5 31.2 58.4 115.1K20 87.9 159.0 212.4
Removal N 250.8 274.5 204.9P20 5 37.6 41.2 98.6K20 271.4 297.0 320.4
Balance N 81.2 79.5 200.9P20 5 -6.4 17.2 16.5K20 -183.5 -138.0 -108.0
0/I N 0.75 0.78 0.50P20 5 1.21 0.71 0.87K20 3.08 1.87 1.51
Strategy for improvement
Implementing the soil fertility building project and increasing the application rate oforganic manure
As the issue of the disproportion between mineral fertilizers and organic manure israther obvious due to the reduced organic manure application, the latter will be a majortask for the fertility management in the long run. The main focus should be on thepractice of returning straw to the field and on growing green manure crops. Returningstraw to the field for 3 years in a row can raise soil organic matter by 2 - 4 g kg-'.Therefore, returning straw, groundnut stems, bean stalks and melon vines to the field isan effective approach to raise the soil organic matter content and to build up soil fertil-ity. Moreover, it is essential to increase the application rate year by year to meet thecrops' need for nutrients.
227

Intensifying the extension of balanced and complete fertilization techniques
In view of the current farmland nutrient status of the province, the following tasksmust be followed up:I) In regions with suitable conditions, crop-specific fertilizers should be introduced.
As a result of the extension of techniques for multi-nutrient fertilizer, the consump-
tion of compounds and fertilizer blends has been increasing steadily. Locally-madecompound fertilizers (mainly compacted blends) are gradually displacing importedones, sharing 80% of the total. In 1998 the province consumed 1.214 Mt of nutri-
ents, 32 times more than in 1980. In recent years the area of cash crops in the prov-ince has increased rapidly. Cash crops demand high application rates of fertilizers.In order to keep farmland nutrients in balance, crop-specific fertilizer applicationhas to be extended. In regions where the farmland nutrients are close to balance, the
area of a single crop cultivation is large, the potential of the fertilizer market isgreat. Farmers are ready to accept crop-specific fertilizer types, for instance in re-gions where sugarcane, tobacco, litchi, longan, grapefruit or vegetable (i.e. hazard-free vegetables gardens in the suburbs of larger and medium cities) are intensively
grown.2) K, N and P fertilizers must be supplemented according to the crop demands. Con-
sidering the farmland nutrient status, K fertilizers must be supplemented in theyears to come. This applies especially to the northern and western parts of the prov-ince, where the soil is deficient in K and K-demanding crops like yam, banana, etc.are grown. The application rates of N and P fertilizers should be adjusted to an ade-quate level to rice. In fruit trees, N and P fertilizers need to be supplementedwhereas for vegetables a more demand-oriented application has to be implemented.
3) Other macronutrients, such as Ca, Mg, S and micro-nutrients, e.g. Si, B, Mo, Zn,Cu, Mn, Fe, etc. should be supplemented according to the crop and farmland nutri-ent status. With the output of agricultural crops rising steadily, the removal of thesenutrients in the harvested crop also increases. Therefore, it is essential to supple-
ment those fertilizers which keep Ca, Mg and S and micronutrients in balance in thesoil.
Sticking to high standard in farmland capital construction and remolding medium- and
low-yield fields
According to the investigations in 1994, the acreage of medium- and low-yieldingfields with a yield below 12,000 kg ha-' was 1.14 million ha, accounting for two-thirds
of the total farmland. Of that portion, 0.706 million ha of farmland produced yields,ranging between 10,500 - 12,000 kg ha-1 and 0.434 million ha had yields below 10,500kg ha-. Remoulding of medium- and low-yielding fields could increase the yield by900 kg ha' and some by 1,500 kg ha-. The remoulding of each hectare of medium-and low-yielding fields costs about 2,910 Yuan (partially invested by the farmers), but
the crop immediately after the remoulding may bring about an additional income of
228

2,178 Yuan (265 USD) due to the obtained yield increment. Therefore, the potential ofremoulding the medium- and low-yielding fields is great.
Speeding up the readjustment of the cropping structure and improving the farmers'knowledge and understanding of scientific based fertilization
In regions with suitable conditions, idle fields should to be concentrated in hands ofexpert farmers. They should become shareholders with their idle land as investment,thus facilitating the realization of larger-scale intensive farming management. WithChina's entrance to WTO, the farmers need to be guided into growing high valuecrops, competitive with regard to quality. An increased use of organic manure and theextension of balanced and complete fertilization cannot only keep farmland nutrientsin balance, but is also able to significantly improve quality and crop output. Mean-while, it is vital to train farmers and raise their awareness and understanding of scien-tific fertilization and hence to reduce production cost and increase the benefit of culti-vation.
Prediction of future demand for fertilizers in Guangdong Province
The prediction of future demand for fertilizers has been made on the basis of the prov-ince's agricultural development plans for the next 5 and 10 years, in compliance withthe needs of sustainable agricultural production (Table 8).
Table 8. Predicted demand for chemical fertilizers in Guangdong Province (1000 t)
Fertilizer 2001 * 2005 2010N 1104 1200 1250P205 330 300 350K20 515 600 800Total 1951 2100 2400N:P 205:K20 1:0.29:0.47 1:0.25:0.5 1:0.28:0.64*actual consumption including nutrients from compound fertilizers with a ratio of 1 :
: I in N: P205 : K20.
The future demand depends also on the government's fertilizers policies and on vari-ous factors, such as market price of fertilizers, market price of agricultural products,farmers' ability of acceptance, growers' benefit in cultivation, etc. The prediction putsemphasis on increasing K application rate and the use of organic manure whilst othermacro-nutrients (Ca, Mg, S) and micro-nutrient fertilizers are supplemented. It is esti-mated that the demand for K fertilizers (K20) will rise from 0.34 Mt in 1998 to 0.60Mt in 2005 and to 0.80 Mt in 2010. The demand for nutrients from mineral fertilizerswill increase from 1.95 Mt in 2001 to 2.10 Mt in 2005 and to 2.40 Mt in 2010 with aratio of I : 0.25 : 0.50 in 2005 and to 1 : 0.28 : 0.64 in 2010.
229


Farmland nutrient cycle and nutrient balance in Sichuan
Feng Wenqiang, Tu Shihua, Fu Tao, Chen Qingrui and Liao Minglan
Soil and Fertilizers Research Institute,
Sichuan Province Academy of Agricultural Science, 610066
Abstract
Three typical regions of Sichuan, Chongzhou City in the Chuanxi Plain, Jianyang City
located on the calcareous purplish soils of the mountainous region and Fushun Countylocated on the neutral purplish soils of the hilly region, were studied with regard to
nutrient cycling in their main cropping systems. Furthermore, statistical data from the
agricultural yearbooks were used to analyse nutrient inputs and outputs of the prov-ince. Based on the latter it was found that fertilization in Sichuan was unbalanced,
showing that N and P inputs greatly exceeded outputs whereas the opposite was ob-
served for K, showing that outputs by far exceeded the K inputs. The nutrient balancefor the whole province was positive for nitrogen with +460,000 tons of N (73.5 kg N
ha-'), for phosphorus with +329,000 tons of P20 5 (54 kg ha- ' P20 5) whereas it wasnegative for K at an amount of -748,000 tons of K20 (122 kg ha - ' K20). Down to farm
level, the observations varied strongly from region to region and from farm to farm,
though dramatic negative balances were also found on this level. However, the overall
conclusions that N and P are applied in excess is not universally applicable and a
stronger differentiation is needed. The paper nevertheless tries to conclude and suggest
fertilizer management practices for a more balanced and sustainable agricultural pro-duction in the future. The recommendation includes to reduce inefficient use of N and
P which is partly caused by the nutrient imbalance, causing limitations to yield forma-tion by reduced uptake and large losses of these nutrients. It is further proposed to im-
prove the supply of mineral K and, in case needed, other limiting macronutrients, e.g.
Ca, Mg and S as well as micronutrients. The improvement of the recycling of organicresidues and manure to the fields to supplement the mineral nutrient application is also
suggested.
Introduction
With the population, rising steadily and the area of cultivated farmland continuouslyshrinking, the gap between population and land availability for crop production wid-
ens. To meet the people's growing demand for agricultural products, it is essential to
continuously improve the utilization of the cultivated farmland and its multiple-cropping index. This will inevitably aggravate the depletion of soil nutrients, espe-
cially of those which are not applied to the soil by means of fertilization, thus leading
to an imbalance between the supply and demand of nutrients in the various cropping
231
systems. To ensure a sustainable productivity of the farmland and to promote agricul-tural development, the study on the farmland nutrient cycle and balance was an excel-lent opportunity to provide us with a scientific basis for formulating plans for a soundand environmental friendly fertilization. The purpose of this paper is therefore to sug-gest improvements in the fertilization practice.
General conditions of the agriculture
General conditions of the agriculture of the province (excluding Chongqing)
The Sichuan Province, lying in the hinterland of Southwest China, covers a total landarea of 48.5 million hectare, being the fifth largest province in the country. In 2001, ithad a total population of approximately 84 million people, of which more than 80%were living in the rural areas. The sown area during this time was 9.5 million hectares,which translates into 4.3 million hectares of farmland due to a cropping index which iscurrently about 2.2, meaning that 2.2 crops can be grown on the same field during oneyear. From this area, the province produced a total of 23.99 Mt grain, which comprised14.29 Mt rice, 4.48 Mt wheat, 4.52 Mt maize, 4.29 Mt (grain equivalents) of tubercrops, mainly sweet potato, 1.81 Mt oil, 15.57 MT sugar and approximately 30,000tons of cotton. The soils in the province are mainly purplish soils and yellow earths,and about 80% of the farmland is on agric-purplish soil and purplish paddy soil.
General conditions at the investigation sites
The study sites were selected in Chongzhou City, Jianyang City and Fushun County,representing the major double-cropping rice growing areas in the province.Chongzhou City is situated in the Chengdu Plain, the western part of the Sichuan Ba-sin. It has a total of 36,700 ha of cultivated farmland, of which 33,300 ha grow twocrops per year. About 0.4 Mt of grain and 0.013 Mt of oilseed rape are produced and0.55 million pigs and 0.01 million cattle are raised. The major soil is grey fluvio-aquicsoil derived from grey alluvium of the Minjiang River and is mainly cultivated by arice-wheat (or rice-oilseed rape) rotation system. The annual precipitation is around1,000 mm and the annual mean temperature 16'C.Jianyang City located in the mountainous region in the middle of the Sichuan Basinhas a total of 0.1 million ha of cultivated farmland, of which 66,700 ha are on upland.About 0.7 Mt of grain, 0.03 Mt of oilseed rape and peanuts and 0.02 Mt cotton areproduced and 1.0 million pigs and over 0.1 M sheep and goats are raised. The majorsoils are brown purplish soils and red purplish soils derived from purplish sedimentaryrock of Penglai Town Group and Suining Group in the Jurrasic System and are mainlycultivated by the three cropping systems wheat-maize-sweet potato or oil seed-cottonrotations in upland fields and rice-wheat (rice-oilseed rape) rotations in the paddyfields. The annual precipitation is around 880 mm and the annual mean temperature170C.
232

Fushun County, lying in the hilly area of the southern part of the Sichuan Basin, has a
total of 53,300 ha of cultivated farmland, of which over 40,000 ha are paddy fields.About 0.5 Mt of grain and 0.1 Mt of oil seeds are produced and 0.90 million pigs and
over 0.30 million sheep are raised. The major soils are grey brown purplish soils and
red brown purplish soils derived from purplish sedimentary rock of Shaximiao Group
and Suining Group in the Jurrasic System. The agricultural production compriseswheat-sorghum (maize)-sweet potato rotations in the upland and fallow-rice-regene-
rative rice rotations in the paddy fields. The annual precipitation is around 900 mm and
the annual mean temperature 18'C. A detailed description of the 3 sites studied, in-
cluding the average structure and yields of the households is given in Table 1.
Table 1. General conditions of the three investigation sites
Item Chongzhou Jianyang Fushun
Number of farms surveyed 30 27 29
Number of people covered 109 112 127People per family 3.63 4.15 4.38Land per family (ha) 0.2300 0.2700 0.3047
Paddy (ha) 0.2300 0.1933 0.1000
Upland (ha) 0.0777 0.2047
Land per capita (ha) 0.0634 0.0651 0.0696
Total output (kg family- ') 2151 2246 2119Yield (kg ha' yr-') 9438 8455.5 7281
Results and discussion
Results of the investigation sites
In the plain (Chongzhou City), the hilly region (Fushun County) and mountainous re-
gion (Jianyang City), the number of family members and the size of farmland per cap-
ita increased whereas the grain yield per unit area decreased in the order Chongzhou< Fushun < Jianyang. This is determined by their respective agricultural production
conditions (see Table 1).Table 2 shows that the fertilizer application rate was the largest in Fushun County and
the smallest in Jianyang City while the K application rate was the largest in Chong-zhou City, much larger than in Fushun County and Jianyang City.With regard to soil nutrient balance, all the three sites revealed a deficit for K and had
a surplus of P. N was in surplus in Fushun County and deficient in Chongzhou City
and Jianyang City with the latter being more serious. Farms with an N, P and K deficit
were observed in Chongzhou City, only differing slightly. About 85% of the farmers in
Fushun County manage their farmland with a strong deficit in K. The deficits of N andP were both quite large whereas K was extreme, reaching 96% in Jianyang City.
233

Among the three study sites, the largest amounts of organic manure were applied inFushun County followed by Chongzhou City and Jianyang City. The sites followed thesame order with respect to mineral fertilizer consumption. In Fushun County and Jian-yang City, the application rate of N was larger and that of K smaller. In ChongzhouCity the application rate of K reached as much as 75 kg K20 ha-'. Therefore, the pro-portion of farmland suffering nutrient deficiency differed slightly between N, P and K.In Jianyang City, about 96 % of the farmland was deficient in K and 79% in N. In Fu-shun County, the proportion of farmland, showing a nitrogen deficit, was smallwhereas 85% suffered from a K deficit. The nutrient P showed a surplus in Fushun.The results clearly indicate that farmers in the Chuanxi Plain had a greater awarenessof balanced fertilization whereas in the mountainous and hilly regions, where generaleconomy is also less developed, such as Jianyang City and Fushun County, lessawareness about a balanced fertilization approach exists. Although Fushun County hadthe largest fertilizer application rates, the nutrients were not applied in a balancedmanner by taking into account demand and supply.
Table 2. Nutrient balance of the three investigation sites
Site Item* N P20 5 K20Chongzhou City Input (kg ha- )
Mineral fertilizer 217.5 59.3 75.2Organic manure 59.3 53.3 99.3Total 276.7 112.5 174.5
Output (kg ha-1) 197.8 88.1 265.7Balance (kg ha - ) -4.1 24.5 -91.2Farmers in deficit (%) 26.7 30.0 40.0
Fushun County Input (kg ha-')Mineral fertilizer 251.5 81.0 3.5Organic manure 76.5 63.5 78.9Total 328.1 144.5 82.4
Output (kg ha -') 114.6 51.3 161.4Balance (kg ha -') 115.0 93.2 -79.1Farmers in deficit (%) 3.7 0.0 85.2
Jianyang City Input (kg ha-1)Mineral fertilizer 127.2 66.8 7.4Organic manure 45.6 39.2 32.3Total 172.8 105.9 39.6
Output (kg ha-') 213.2 88.8 233.1Balance (kg ha -') -92.2 17.1 -193.5Farmers in deficit (%) 79.3 41.4 96.6
* N loss is estimated at 30%
234

Agriculture of the past 20 years in the Sichuan Province (including Chonqing)
The development in the agriculture of Sichuan during the last 20 years indicates thatthe population increased by 15.1%, the acreage of farmland decreased by 7.7%, thearea of farmland per capita dropped by 18.5% and the multiple cropping index in-creased by 18.3%. This is explained by a compensation for the lost agricultural landduring the same period. Furthermore, animal husbandry increased by 29.9% more cat-tle, 33.1% more pigs and 45.1% more sheep and goat (Table 3).
Table 3. Selected statistical data of agriculture in Sichuan (including Chongqing*) inthe last 20 years
Differ-Year 1982 1987 1992 1996 2001 ence
Population (M) 100.2 104.583 109.429 112.382 115.345 15.1Farmland (103 ha) 6563 6326 6255 6165 6085 -7.7Land per capita (ha) 0.065 0.061 0.057 0.055 0.053 -18.5Multiple cropping index 185.9 188.9 206.1 210.4 220.0 +18.3
Cattle (M heads) 9.180 9.730 10.193 11.339 11.930 +29.9Pig (M heads) 51.900 60.230 66.542 70.816 69.070 +33.1Goat (M heads) 10.030 8.850 9.452 13.354 14.550 +45.1
*Chongqing with a current population of approx. 30 M inhabitants has become mu-
nicipality in 1997 and is listed independently from Sichuan in the latest statisticalbooks.
**Difference between 2001 and 1982 (%)
Development in the output of cereals, tubers, oil crops and cotton
There was a steep increase in the overall crop production from 1982 until 1996 fol-lowed by a decline until 2001 (Table 4). The year 2001 was exceptional with regard toweather conditions when severe droughts affected the production.Nevertheless, the comparison between the years shows a clear trend towards a stabili-zation of the grain production, increased tuber and oil seed production as well as in-creasing the animal husbandry. Taking the up-to-date production of 2001 as reference,grain output only slightly increased by 2.8% on average with 5.2% increase in rice, adecrease in wheat and maize production which may be clearly a result of poor wateravailability in 2001. Tuber output with sweet potato as major crop increased by 53.7%compared to 1982, which may only be partly attributed to direct consumption butlargely to the fast development in pig raising (see Table 3). Oil production also in-creased by 78.4% whereas cotton further declined in 2001, being only 36% of thatwhat was produced in 1982.
235

Table 4. Cereal, tuber, cotton and oil production in Sichuan (including Chongqing) inthe last 20 years
Differ-Year 1982 1987 1992 1996 2001 ence*
I%)Total grain yield (Mt) 38.42 39.213 44.311 47.417 39.500 +2.8Wheat (Mt) 6.405 6.584 7.845 10.048 5.400 -15.7Rice (Mt) 18.065 19.797 22.295 22.888 19.010 +5.2Corn (Mt) 6.39 5.214 6.445 7.612 6.330 -1.0Sweet potato (Mt) 4.36 4.884 4.517 5.237 6.700 +53.7Oil (Mt) 1.177 1.335 1.326 1.234 2.109 +78.4Cotton (1000 t) 0.820 0.102 0.151 0.126 0.030 -64.5*: Difference between 2001 and 1982 (%)
Development of the fertilization practice
The mineral N fertilizer application rate rose steadily from 148.6 kg ha-' in 1982 to276.6 kg ha-' in 2001. Before 1982, mineral P and K fertilizers were rarely used. In themeantime, mineral P application reached 96.6 kg ha-I P20 5 and that of mineral Kreached 21.3 kg ha-' K20. The consumption of compound fertilizers developed rapidlyduring the past decade. In 2001, the nutrient input in the form of compound fertilizersreached 75.3 kg ha '. The application of organic manure also rose steadily but by asmaller margin than that of mineral fertilizers. In 2001, the recycling of nutrients fromthis nutrient source was in the region of 62 kg ha' N, 38 kg ha - ' P20 5 and 62 kg ha'K20 (Table 5).
Table 5. Changes in nutrient application in Sichuan (including Chongqing),distinguished between mineral fertilizers and organic manure during the
last 20 years
Year 1982 1987 1992 1996 2001kg ha' 10' t kg ha' 103 t kg ha-' 10 t kg ha - ' 10' t kg ha -' 10 t
Compoundfertilizer 7.80 49 31.8 199 56.0 345 75.3 456
Mineral N 148.6 976 173.4 1097 224.4 138 262.6 1619 276.3 1676Mineral P20 5 44.4 291 49.7 314 70.4 440 85.5 527 96.6 585Mineral K20 0 0 3.2 20 8.3 52 15.2 93 21.3 129Organic N 44.4 291 50.6 322 55.5 347 60.0 369 62.4 378Organic P205 25.5 167 29.9 189 33.0 206 35.9 221 38.1 231Organic K20 44.1 289 49.8 315 54.0 338 60.0 369 62.4 378
236

Farmland nutrient balance
The nutrient balance of 1996 for the whole province (including Chongqing) was calcu-
lated using yields, respective calculated nutrient removals by crops as output and nu-trient application by mineral fertilizers and organic manure as inputs (Table 6).Losses were only estimated for nitrogen, assuming that no losses for P and K occurred.This is due to the fact that no figures were available regarding leaching and runoff
losses which may be severe for both nutrients in very light soils and on sloping land,respectively. Taking this into account, the real balances for P and K therefore can be
assumed to be considerably less positive for P and more negative for K.In Table 6 the nutrients used in cash crops like fruits and vegetables were not takeninto account, assuming that these were covered by the compound fertilizers (see Table
5) which were not included in the nutrient balance calculations of Table 6. Based onthese figures it is evident that N and P inputs exceeded the outputs by the crops and
positive balances were calculated for N at the amount of 73 kg -' N ha-' and for P at the
amount of 54 kg P20 5 ha-'. These balances imply large over-supply of N and P and
poor efficiency of both nutrients, which could be partly due to poor uptake caused by
deficiency of other nutrients, limiting biomass production of the plants which washence inhibiting the uptake of N and P. The large deficit of K could be a reason for thisobservation, since continuous large K removals from the soil without adequate re-placement has caused an annual deficit of -122 kg K2 0 ha-'. Potassium therefore may
be the major nutrient that limits crop production in Sichuan, however, also othermacronutrients, e.g. Ca, Mg and S, or micronutrients could be limiting in the intensive
cultivated soils with more than two crops per year.
Table 6. Farmland Nutrient Balance in Sichuan (including Chongqing) (1996)
Nutrient N P20 5 K20
1/0 Item kg ha1 10' t kg ha -' 103t kg ha-' 10 tMin. fertilizers 262.5 1619 85.5 527 15.2 93
Input Manure 60.0 369 36.0 221 60.0 369Total 322.5 1989 121.5 748 75.0 463N:P 20 5:K20 ratio 1 0.38 0.23Removal by crop 151.5 932 67.5 419 196.5 1211Loss of min. fertil- 795 486izers.
output Loss of manure 18.0 111
Total 249.0 1529 67.5 419 196.5 1211N:P 20 5 :K20 ratio 1 0.27 0.79
Balance 73.5 460 54.0 329 -121.5 -748
237

Current fertilizer use and recommended requirement based on nutrient input : outputratios in Sichuan
Based on changes in the population, acreage of farmland and grain output in the periodfrom 1982 to 2001, the fertilizer demand of Sichuan for the next 10 years was esti-mated (Table 7). Comparing the actual demand with the prediction for 2005 and 2010,it is evident that today nitrogen and phosphorus are obviously already consumed atamounts close to those predicted in the future, which means that the growth potentialfor the use of these two nutrients is regarded as limited and that focus has to be laid onthe increase of their use efficiency. On the other hand, there is a huge gap betweencurrent and predicted use of K based on good agricultural practice. More than tentimes as much mineral K would be needed to achieve this goal.
Table 7. Comparison between actual consumption (2001) and prediction of fertilizerdemand depending on population, land and yield development (includingChongqing)
Year Population Land Yield N* P20 5 K20(M) (M ha) (kg ha-') (Mt) (Mt) (Mt)
**2001 115.345 60.58 5047 1.676 0.585 0.1292005 120.248 58.86 5443 1.589 0.501 1.4542010 124.582 57.46 5839 1.735 0.547 1.586
Note: *N loss is assumed as 30%, **current figures from the China Agric. Yearbook2002, excluding the nutrients from compound fertilizers
After the flooding in 1998, in response to the state policy of controlling soil erosion inthe upper streams of the Changjiang River, the province has decided to restore grass-land and forests on 0.7693 million ha of farmland. At the same time, it was decided toreadjust the agricultural production structure by implementing the concept of eco-agriculture and by keeping the grain production per capita at the same level as in 1998.Therefore, prediction of fertilizer demands based on the above changes is rather con-servative, assuming that the large discrepancy between K input and removal will beovercome by the implementation of above regulations.
Suggestions for fertilizer management in the province
The investigation at county and farm level has shown that a stronger differentiation forthe conclusions and recommendations is required and that the calculated province-wide nutrient balances may only serve as a relatively rough guideline to determine thereal nutrient requirement. In the absence of better data on efficiency and losses for thevarious nutrients, it is therefore advised not to generalise with respect to over-supply ofN and P. Efficiency in uptake of both nutrients may be inhibited due to insufficientsupply of especially K and other macro- and micronutrients, promoting either their
238

losses or, especially in case of P, an accumulation in the soil. It is certain that the ne-glect of K due to an imbalance in fertilization over many years caused a decrease insoil fertility and productivity. In order to ensure the sustainable development of theagriculture while setting aside 0.7693 million ha farmland for restoring grassland andforests, balanced fertilization must be implemented. This does not only apply to thethree macronutrients N, P and K, but also to all the other nutrients needed by crops.
Consequently, the following priorities are proposed:1) Improving N and P efficiency and maintaining or, in case of less demand, through
better efficiency, reducing their application. This can be done by the approach of
balanced nutrient supply, better timing for N and better sources of fertilizers whichare less prone to losses (e.g. volatilisation, denitrification, leaching or fixation).
2) Improving the mineral K supply and promotion of recycling K in the straw and inthe organic residues from animal husbandry.
3) Creating awareness for the importance of other macronutrients, e.g. Ca, Mg and S aswell as micronutrients, to avoid that those are becoming limiting for growth andhence reducing uptake and efficiency of N and P in particular.
4) Standardizing the production of raw material fertilizers to produce high quality,highly concentrated compound fertilizers or site-/ crop specific bulk-blends.
5) Setting up a county-based integrated advisory service, providing farmers with guide-lines based on research results. Based on the combination of soil monitoring withexperimental results of research institutions, formulas for crop-specific and site-specific fertilizers should be developed for the fertilizer industry and then popular-
ised among the users.
239


Farmland nutrient cycle and nutrient balances in Guangxi
Tan Hongwei, Zhou Liuqiang and Xie Rulin
Soil and Fertilizers Institute, Guangxi Academy of Agricultural Science, 530007
Abstract
A study on nutrient cycling and nutrient balances at different scales in the autono-mous region of Guangxi was carried out. Using data from a survey in representativecropping systems in different counties and nutrient input : output calculations basedon published data, the agricultural statistics revealed a detailed knowledge about thenutrient inputs from organic and inorganic resources to the main cropping systems onlowland and upland. The overall consumption of N and K was not sufficient to coverthe demand of the crops whereas the P balance showed a positive value. In lowlands,N inputs clearly exceeded outputs whereas on the uplands the balance of N was nega-tive, leading to an overall negative balance for nitrogen. Substantially more potashfertilizer is required to overcome the negative balance and the severe K deficit ob-served. The prediction for future mineral fertilizer consumption indicates 7-10% an-nual increase to meet the growing demand and to establish balanced nutrient budgetsin the farmlands.
Introduction
With a total population of more than 47 million, the autonomous region of Guangxi isthe tenth most populous province in China. In terms of area under cultivation,Guangxi also occupies rank 10 among the provinces. With a beneficial climate allyear round cultivation is possible, posing a particular strain on the nutrient supply ofthe soils which are inherently poor in all the major nutrients. The crop production ofthe province therefore increasingly depends on the use of mineral fertilizer inputs,especially to produce the required food for the continuously growing population. Onthe other hand, Guangxi is gaining importance in the production of tropical cashcrops, fruits and vegetables for the export to other provinces and to abroad. This typeof high-input-demanding agriculture, however, bears a number of risks to productquality, resource protection, especially to the soils, surface and ground waters. It istherefore important to introduce an agricultural management system that relies on aknowledge based input of nutrients. With this in mind, the study on the farmland nu-trient cycle, to quantify in a precise way inputs and outputs of nutrients to the variouscropping system, deserves high priority. Through a survey and by using the availabledata from scientific publications and the statistics of the province, this study under-takes the attempt to assess the nutrient balance for representative cropping systems atvarious scales to develop a recommendation system for the fertilizer use of Guangxi.
241

Materials and methods
According to the characteristics of the agricultural production in Guangxi, five typicalcounties (including one city), i.e. Hepu County, Hezhou City, Laibin County, DahuaCounty and Tianyang County, were selected for the survey. In each county, two town-ships, in each township three villages and in each village 5 farms were selected for thesurvey, so that in total five counties, ten townships, thirty villages and one hundredand fifty farms were studied. During the investigation, statistics of the agriculturalproduction of the related units were collected for analysis.* Hezhou City represents the agricultural zone in the northeast of Guangxi, growing
mainly rice, vegetables and tobacco." Laibin County represents the agricultural zone in the centre of Guangxi, growing
mainly rice, sugar cane, maize, soybean and peanut." Hepu County represents the agricultural zone in the south of Guangxi, growing
mainly rice, yam, sugar cane, peanut and tropical fruits.* Dahua County represents the agricultural zone in the northwest of Guangxi, grow-
ing mainly maize, soybean and yam." Tianyang County represents the agricultural zone in the west of Guangxi, growing
rice, winter vegetables, sugarcane, banana and mango.
Farmland nutrient input
Farmland nutrient input is closely associated with fertilization, nutrient supply viarainfall and irrigation water. For calculating the nutrient contents in farmyard manure,it was referred to the data provided in the Agro-chemistry volume of the Chinese Ag-ricultural Encyclopaedia and the data collected in field experiments. For the nutrientcontents in rain and irrigation water, published data from field experiments were used.
Farmland nutrient output
Absorption of nutrients by crops and the proportion removed at harvest usually ac-counts for the largest nutrient output from the farmland. Another important output arelosses of indigenous and fertilizer nutrients by leaching, runoff and volatilisation (ni-trogen only). The calculation of the removal of nutrients by crops was based on re-sults from field experiments. Nutrient leaching losses and fertilizer N losses from thefarmland were calculated on the basis of published data from China.
Results and discussion
General conditions of the agricultural production.
Guangxi is an autonomous region located in the south of China. According to the sta-tistics in 2001, the province had a population of 47.58 million, of which 39.12 million
242
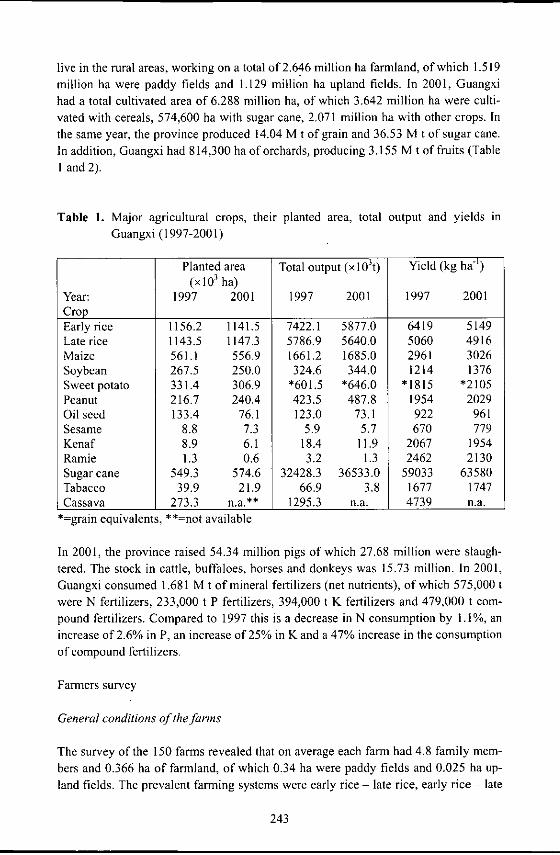
live in the rural areas, working on a total of 2.646 million ha farmland, of which 1.519
million ha were paddy fields and 1.129 million ha upland fields. In 2001, Guangxihad a total cultivated area of 6.288 million ha, of which 3.642 million ha were culti-vated with cereals, 574,600 ha with sugar cane, 2.071 million ha with other crops. In
the same year, the province produced 14.04 M t of grain and 36.53 M t of sugar cane.In addition, Guangxi had 814,300 ha of orchards, producing 3.155 M t of fruits (Table
I and 2).
Table 1. Major agricultural crops, their planted area, total output and yields in
Guangxi (1997-2001)
Planted area Total output (x 103t) Yield (kg ha -')(x10 3 ha)
Year: 1997 2001 1997 2001 1997 2001CropEarly rice 1156.2 1141.5 7422.1 5877.0 6419 5149Late rice 1143.5 1147.3 5786.9 5640.0 5060 4916Maize 561.1 556.9 1661.2 1685.0 2961 3026Soybean 267.5 250.0 324.6 344.0 1214 1376Sweet potato 331.4 306.9 *601.5 *646.0 *1815 *2105Peanut 216.7 240.4 423.5 487.8 1954 2029
Oil seed 133.4 76.1 123.0 73.1 922 961Sesame 8.8 7.3 5.9 5.7 670 779Kenaf 8.9 6.1 18.4 11.9 2067 1954Ramie 1.3 0.6 3.2 1.3 2462 2130Sugar cane 549.3 574.6 32428.3 36533.0 59033 63580Tabacco 39.9 21.9 66.9 3.8 1677 1747Cassava 273.3 n.a.** 1295.3 n.a. 4739 n.a.
*=grain equivalents, **-not available
In 2001, the province raised 54.34 million pigs of which 27.68 million were slaugh-
tered. The stock in cattle, buffaloes, horses and donkeys was 15.73 million. In 2001,Guangxi consumed 1.681 M t of mineral fertilizers (net nutrients), of which 575,000 twere N fertilizers, 233,000 t P fertilizers, 394,000 t K fertilizers and 479,000 t com-
pound fertilizers. Compared to 1997 this is a decrease in N consumption by 1.1%, anincrease of 2.6% in P, an increase of 25% in K and a 47% increase in the consumption
of compound fertilizers.
Farmers survey
General conditions of thefirrms
The survey of the 150 farms revealed that on average each farm had 4.8 family mem-bers and 0.366 ha of farmland, of which 0.34 ha were paddy fields and 0.025 ha up-
land fields. The prevalent farming systems were early rice - late rice, early rice - late
243

rice - winter vegetable, kenaf- late rice and early rice - peanut for paddy fields andsugarcane, peanut - sweet potato, kenaf - sweet potato and maize - sweet potato forupland fields. In the cereal production areas, the average grain output of each farmwas 3,645 kg, of which 829 kg were delivered to the state as agricultural tax and1,264 kg were sold on the market. Each farmer applied on average 1,448 kg of farm-yard manure (pig, cattle, goat and horse manure) per year and used up to 766 kg ofmineral fertilizers, of which 446 kg were N, 223 kg P20 5 and 97 kg K20.
Agricultural production in Guangxi
The statistics of Guangxi shows that cereals like rice and maize occupy the largestarea (see Table 1). Comparing the figures of 2001 with those of 1997, it is obviousthat there was no expansion in area during the last four years and also production andyields stagnated. This was observed for most of the crops, with the exception of pea-nut and sugar cane in both area and yield.This is different for the major tropical fruits that are grown in Guangxi (Table 2). Theproduction of fruits had a significant expansion in the cultivated area as well as inyields and even during the last four years the production further expanded. Bananaproduction increased by almost 35% and that of citrus by 31%. Other fruits which arenot shown in Table 2, such as mango, also went through an expansion during the last10 years and are today important sources of income for farmers on the uplands.
Table 2. Major fruits and their total production in Guangxi (1997-200 1)
Fruit Banana Pomelo Citrus Pineapple Longan Litchi1000t
1997 839.5 152.0 1007.0 79.5 137.6 162.02001 1129.5 n.a.* 1320.7 63.1 n.a.* 210.3
*=not available
Fertilizer application to major crops
Staple food crops
In 1997, the autonomous region of Guangxi had 6.203 M ha of cultivated land ofwhich 3.738 M ha were used for the production of staple food crops. The total culti-vated area expanded slightly to 6.288 M ha in 2001, whereof 3.641 M ha were graincrops, showing that the latter lost in importance compared to other crops, which mayindicate a trend towards the production of more valuable crops by farmers. Using theaverage application rates (Table 3) of mineral fertilizer nutrients, the total nutrientconsumption for the food crops was calculated (Table 4). Based on this it was esti-mated that in 1997, grain crops consumed 944,900 t nutrients in form of mineral fer-tilizers or 64.7% of the total, amounting to 1.461 M t. Due to double cropping of riceand the relatively large application to this crop, rice has the by far greatest consump-
244

tion (72% of the nutrient consumption can be attributed to this crop) (Table 4). Maizewith only about 18% is second, followed by sweet potato and soybean.
Table 3. Average fertilizer application rate to major staple food crops in Guangxi
Crop Application rate (kg ha')N P20 5 K20
Rice 159.65 62.53 76.17Maize 169.31 68.98 70.17Sweet potato 54.19 43.86 36.57Soybean 53.10 52.89 47.12
Table 4. Consumption of mineral fertilizers in major staple food crops in Guangxi in1997
Crop Mineral fertilizer consumptionN P20 5 K20 Total
(10 t) (%) (101) (%) (103t) (%) (103t) (%)Rice 367.1 74.3 143.8 68.1 175.2 73.2 686.1 72.6Maize 95.0 19.2 38.7 18.3 39.4 16.5 173.1 18.3Sweet potato 18.0 3.6 14.5 6.9 12.1 5.1 44.6 4.7Soybean 14.2 2.9 14.1 6.7 12.8 5.3 41.1 4.3Total 494.3 100.0 211.1 100.0 239.5 100.0 944.9 100.0
Cash crops
It is evident from above that approximately 35% of the nutrients were used both incash crops (16% of the cultivated area) and other crops (24% of the cultivated area).According to our study, the average fertilizer application rates on major cash crops in1997 revealed that sugar cane received by far the largest amounts of N, P and K fol-lowed by kenaf (Table 5). Multiplying the application rates by the area, sugar cane,being produced on a larger area, is also the largest nutrient consumer among the cashcrops. The consumption of mineral fertilizers by cash crops reached 240,400 t, ac-counting for 16% of the province's total. This means that approximately 277,000 t ofnutrients were used by other crops than the food and cash crops listed in Tables 4 and5. It may be assumed that these nutrients are mainly consumed by the strengtheningsector of fruits and vegetables which were not taken into account. From 1997 until2001, the total fertilizer nutrient consumption increased from 1.461 M t to 1.681 M tand with the stagnation in area and production in the food crop sector (see Table 1) itmay be assumed that cash crops and other crops were increasingly responsible forincreased fertilizer consumption of the province. Current fertilizer use by crops (2001)can be estimated as 980,000 t in the staple food sector, 300,000 t in the cash crops (asdefined in Table 5) and approximately 400,000 t in fruits, vegetables and other crops.This assumption is supported by the fact that the consumption of nutrients in form ofcompound fertilizers has increased to 470,000 t and the compounds are usually thepreferred nutrient sources for these crops in Guangxi.
245
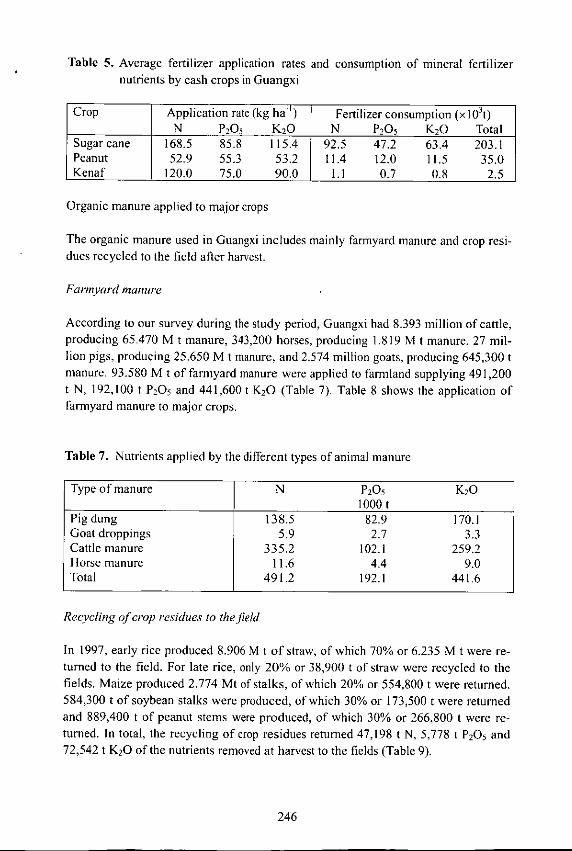
Table 5. Average fertilizer application rates and consumption of mineral fertilizernutrients by cash crops in Guangxi
Crop Application rate (kg ha -') Fertilizer consumption (x 103t)N P20 5 K20 N P20 5 K20 Total
Sugar cane 168.5 85.8 115.4 92.5 47.2 63.4 203.1Peanut 52.9 55.3 53.2 11.4 12.0 11.5 35.0Kenaf 120.0 75.0 90.0 1.1 0.7 0.8 2.5
Organic manure applied to major crops
The organic manure used in Guangxi includes mainly farmyard manure and crop resi-dues recycled to the field after harvest.
Farmyard manure
According to our survey during the study period, Guangxi had 8.393 million of cattle,producing 65.470 M t manure, 343,200 horses, producing 1.819 M t manure, 27 mil-lion pigs, producing 25.650 M t manure, and 2.574 million goats, producing 645,300 tmanure. 93.580 M t of farmyard manure were applied to farmland supplying 491,200t N, 192,100 t P2 0 5 and 441,600 t K20 (Table 7). Table 8 shows the application offarmyard manure to major crops.
Table 7. Nutrients applied by the different types of animal manure
Type of manure N P20 5 K201000t
Pig dung 138.5 82.9 170.1Goat droppings 5.9 2.7 3.3Cattle manure 335.2 102.1 259.2Horse manure 11.6 4.4 9.0Total 491.2 192.1 441.6
Recycling of crop residues to the field
In 1997, early rice produced 8.906 M t of straw, of which 70% or 6.235 M t were re-turned to the field. For late rice, only 20% or 38,900 t of straw were recycled to thefields. Maize produced 2.774 Mt of stalks, of which 20% or 554,800 t were returned.584,300 t of soybean stalks were produced, of which 30% or 173,500 t were returnedand 889,400 t of peanut stems were produced, of which 30% or 266,800 t were re-turned. In total, the recycling of crop residues returned 47,198 t N, 5,778 t P20 5 and72,542 t K20 of the nutrients removed at harvest to the fields (Table 9).
246
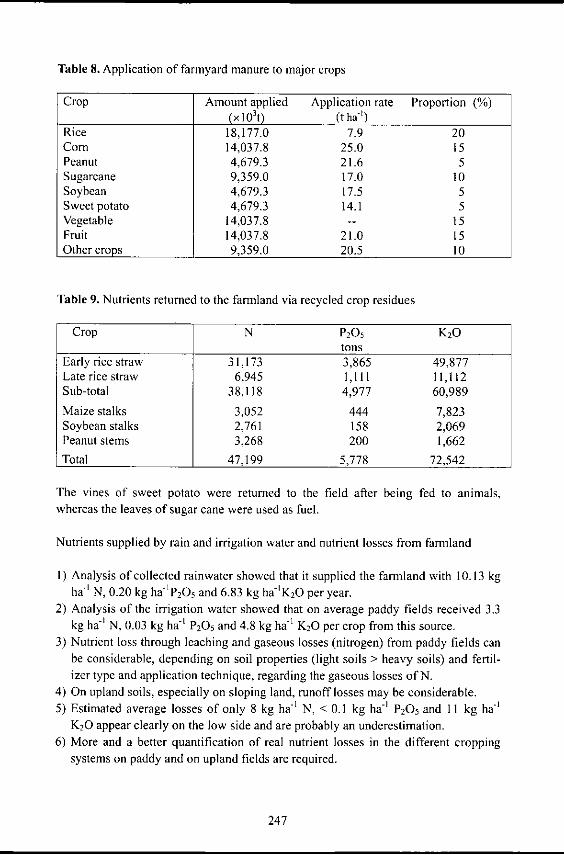
Table 8. Application of farmyard manure to major crops
Crop Amount applied Application rate Proportion (%)(x 10 3 t) (t ha')
Rice 18,177.0 7.9 20Corn 14,037.8 25.0 15Peanut 4,679.3 21.6 5Sugarcane 9,359.0 17.0 10Soybean 4,679.3 17.5 5Sweet potato 4,679.3 14.1 5Vegetable 14,037.8 -- 15Fruit 14,037.8 21.0 15Other crops 9,359.0 20.5 10
Table 9. Nutrients returned to the farmland via recycled crop residues
Crop N P20 5 K20tons
Early rice straw 31,173 3,865 49,877Late rice straw 6,945 1,111 11,112Sub-total 38,118 4,977 60,989
Maize stalks 3,052 444 7,823Soybean stalks 2,761 158 2,069Peanut stems 3,268 200 1,662
Total 47,199 5,778 72,542
The vines of sweet potato were returned to the field after being fed to animals,whereas the leaves of sugar cane were used as fuel.
Nutrients supplied by rain and irrigation water and nutrient losses from farmland
I) Analysis of collected rainwater showed that it supplied the farmland with 10.13 kgha -' N, 0.20 kg ha'P 20 5 and 6.83 kg ha-'K 20 per year.
2) Analysis of the irrigation water showed that on average paddy fields received 3.3kg ha -' N, 0.03 kg ha -' P205 and 4.8 kg ha -' K20 per crop from this source.
3) Nutrient loss through leaching and gaseous losses (nitrogen) from paddy fields canbe considerable, depending on soil properties (light soils > heavy soils) and fertil-izer type and application technique, regarding the gaseous losses of N.
4) On upland soils, especially on sloping land, runoff losses may be considerable.5) Estimated average losses of only 8 kg ha' N, < 0.1 kg ha -' P20 5 and II kg ha-'
K20 appear clearly on the low side and are probably an underestimation.6) More and a better quantification of real nutrient losses in the different cropping
systems on paddy and on upland fields are required.
247

The nutrient balance of farmland in the whole province
Based on the survey and published data related to nutrient input and output, a farm-land nutrient balance for the whole Guangxi province was assessed (Table 10). Thisnutrient balance is characterized by a deficit of 280,400 t N and 507,900 t K20 in1997 whereas a surplus of 241,100 t of P20 5 was recorded. The fertilization in vege-table gardens, orchards and forestland was not taken into account. Since these lattercrops play an increasingly important role in the agricultural production and fertilizerconsumption, the balances shown in Table 10 may underestimate the deficit in N andK and overestimate the surplus of P in Guangxi..
Table 10. Farmland nutrient cycle and balance in Guangxi (103t)
Source N P20 5 K201000 t
Nutrient Mineral fertilizer 599.4 271.0 315.1input Organic manure 291.9 192.1 262.4
Straw 47.2 5.8 72.5Symbiotically fixed N 94.4Crop seeds 10.9 3.0 3.7Rain and irrigation water 20.4 0.3 11.8Total 1064.2 472.2 665.5
Nutrient Removal at harvest 987.4 230.3 1160.1output Loss from fertilizer 239.7
Loss from manure 108.0Leaching loss 9.5 0.8 13.3Total 1344.6 231.1 1173.4
Balance -280.4 241.1 -507.9
Nutrient balance in paddy fields
According to our estimation, paddy fields received about 525,400 t N, 187,800 t P20 5and 334,000 t K20 in 1997. The total N input originated to about 69.9% from mineralfertilizer, 18.2% from organic manure and 7.3% from straw recycled to the field. An-other 1.0% came from crop seeds and 3. 7% from rainfall and irrigation. On the out-put side 57.8% could be ascribed to the removal by rice, 31.0% to losses from mineralfertilizers, 9.2% to losses from organic manure and 2.0% to losses from the soil pool.In the whole province, the paddy fields were characterized by a surplus of 51,900t yr' N, a surplus of 139,600 t yr' P20 5 and a deficit of 4,400 t yr' K20 (Table 11).
Nutrient balance in upland fields
The survey revealed that about 232,300 t N, 127,200 t P20 5 and 139,900 t K20 wereapplied to upland fields (Table 12). The input of N reached 538,800 t, of which 43.1%were supplied by mineral fertilizers, 36.5% by farmyard manure, 1.7% by recycledstraw, 1.0% by seeds, 0.2% by rainfall and 17.5% were symbiotically fixed. The N
248

output amounted to 860,200 t, of which 82.4% were removed with the harvested crop,10.8% lost from fertilizers and 6.85% lost from organic manure. The comparison be-tween input and output revealed a deficit in the balance of 331,300 t N yr".
Table 11. Balance of nutrients in paddy fields (103t)
Source N P20 5 K 201000 t
Nutrient Mineral fertilizer 367.1 143.8 175.2input Organic manure 95.4 37.3 85.8
Straws returned to the field 38.1 4.9 60.9Crop seed 5.5 1.5 1.1Rain and irrigation water 19.3 0.3 11.0Total 525.4 187.8 334.0
Nutrient Removal with rice 273.5 47.4 325.1output Loss with fertilizer 146.9
Loss with manure 43.6Leaching loss 9.5 0.8 13.3Total 473.5 48.2 338.4
Balance +51.9 +139.6 -4.4
Table 12. Nutrient balance in upland fields in Guangxi
Source N P20 5 K201000 t
Nutrient Mineral fertilizer 232..3 127.2 139.9input Organic manure 196.5 76.8 176.7
Straws 9.1 5.8 I 1.5Symbiotically fixed N 94.4Crop seeds 5.4 0.7 2.6Rainfall 1.1 0.02 0.8Total 538.8 210.5 331.5
Nutrient Removal with harvest 708.3 174.4 835.0output Loss with fertilizer 92.9
Loss with manure 68.9Total 870.1 174.4 835.0
Balance -331.3 +36.1 -503.5
The input of P reached 210,500 t, of which 60.3 % were supplied by mineral fertiliz-ers, 36.5% by farmyard manure, 2.7% by recycled straw, 0.3% by seeds and minoramounts by rainfall. The P output amounted to 174,400 t, which was mainly theamount removed in the harvested crops. Under the assumption that no losses of P,especially by erosion and runoff on the sloping uplands occurred, the nutrient balancefor P had a surplus of 36,100 t yr '(Table 12).
249

The input of K reached 331,500 t, of which 42.2 % were supplied by mineral fertiliz-ers, 53.3 % by farmyard manure, 3.5% by recycled straw, 0.8 % by seeds and 0.2% byrainfall. The K output amounted to 835,000 t, mainly removed in the harvested crops,assuming no losses by runoff or leaching. Based on this assumption the differencebetween input and output revealed a deficit of 503,500 t K20 yr' (see Table 12).
Conclusion
Based on a survey of the farmland nutrient cycle, current fertilization practice to ma-
jor crops and the nutrient balance in paddy and upland fields was studied. The follow-ing aspects were observed and discussed in this paper:1) A systematic knowledge was acquired about the application rate of mineral fertil-
izers, organic manure and straw per hectare for the major crops and their respectiveproportion in the total nutrient input to paddy and upland fields.
2) The farmland nutrient balance of the whole autonomous region of Guangxi indi-cates that the application rate of N and K was not enough to meet the crop demand.The deficit was 280,400 t and 507,900 t for N and K20, respectively. P was tenta-tively oversupplied with a surplus of 241,1 00 t.
3) Considering the nutrient balance for the two main agricultural systems, paddyfields and upland fields separately, large differences occurred between the two sys-tems.
4) The paddy fields had an apparent surplus of 51,900 t N and 139,600 t P205 and adeficit of 4,400 t K20. This suggests that there was an excess of N and P whichmay have been additionally lost to the environment, posing certain risks of pollu-tion.
5) In the upland fields, only a P surplus of 36,100 t was estimated whereas both N(-321,400 t) and K (-503,500 t) revealed a significant deficit in nutrient supply tocrops.
6) The surplus of P may be overestimated and the deficit of N and K underestimated,taking into consideration that especially in the uplands, substantial nutrient lossesby leaching, runoff and erosion generally occur which were not taken into account.
7) A large sector of other crops, e.g. fruits and vegetables which enjoyed a goodgrowth in production during the past years, has not been taken into consideration inthe nutrient balance calculations and may further affect the results of the survey,hence underestimate the total amount of the nutrients required.
8) Emphasis in future should hence be laid on a more precise anticipation of the nu-trient cycles in the various cropping systems to improve and maintain the produc-tivity and raise the efficiency of nutrient use.
9) The technique of balanced fertilization for sustainable agriculture needs to be fur-ther extended, so that the autonomous region of Guangxi needs additional 280,400t N and 507,900 t K20 to maintain its current yields and to reach a nutrient bal-ance.
10) It is predicted that Guangxi will have to increase the supply of mineral fertilizersby 7 - 10% annually to meet the demand for a sustainable crop production.
250

Changes in the supply of major nutrients in paddy soils andrational fertilization in Guangxi
Li Shaoquan, Zhang Jielu and Huang Shaofu
Guangxi Zhuang Autonomous Region Soil and fertilizers Station 530007
Abstract
The statistical analysis of 15 years of monitoring paddy soil fertility at 47 long-termmonitoring posts in Guangxi revealed that under the current conventional productionand management conditions, all the major nutrients in paddy soils show an upwardtrend, except for readily available K and slowly available K. Total N and alkali ex-tractable N fraction rose the fastest. In calcareous paddy soils nutrients increased to alarge extent whereas in high-yielding fields, soil nutrient contents mostly stagnated andsome dropped slightly. The application rate of mineral fertilizers grew annually whilethat of organic manure decreased year by year. The ratio of mineral fertilizers vs. or-ganic manure was 1:0.56 in the early 1980's and declined to 1:0.18 in the late 1990's.The N surplus in the soil was increasing and P changed from slightly deficient into aslight surplus during this period. The input of K had long been inadequate, increasingthe K deficit in the soil substantially. On such a basis, it is suggested that the input ofN and P has to be maintained and the K input has to be increased accordingly. Thepractice of growing green manure crops and of returning crop straw to the field has tobe developed by taking advantage of the natural conditions. Furthermore, the tech-nique of fertilization based on soil diagnosis has to be improved in order to increasethe recovery of nutrients from fertilizers.
Introduction
Paddy soils constitute the majority of cereal producing land in Guangxi and accountsfor 58.2% of the total cultivated land or 65.8% of the total area of cereal crops. Theoutput of rice, however, comprises only 87.9% of the region's total grain output. It istherefore of important practical significance to build up a high-yielding paddy soil forpromoting agricultural development. Guangxi has a climate which is characterized bywarm temperatures and high precipitation, both occurring simultaneously, thus pro-moting plant growth but also intensifying mineralization, mobility and hence the leach-ing of soil nutrients. However, distinct regional characteristics in the climatic and soilconditions also lead to a variation in the cycling and balance of soil nutrients. There-fore, this paper attempts to describe the characteristics of the variation and cycling ofthe major nutrients in paddy soils for the typical agro-ecological regions where paddyis grown. For this purpose, 47 long-term experiments over a period of 15 years (begin-ning in 1984) were established to exploring approaches for rational fertilization.
251
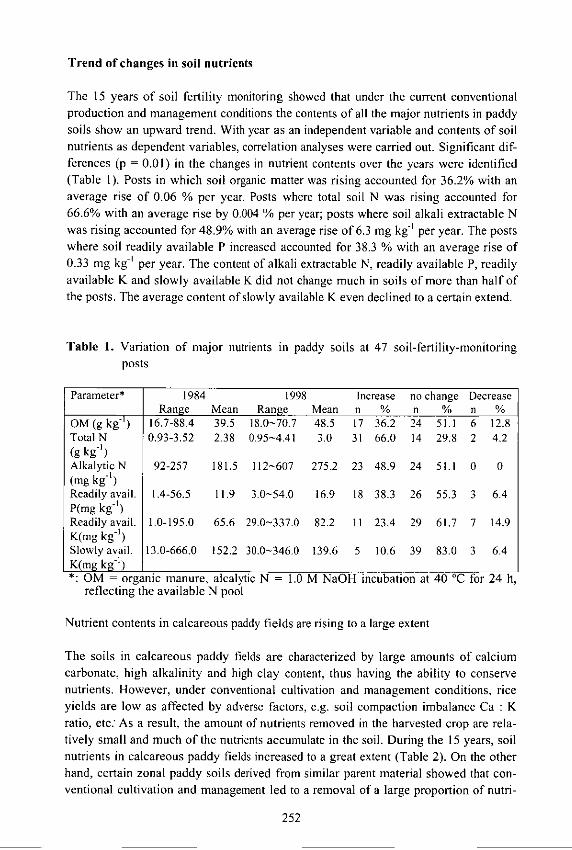
Trend of changes in soil nutrients
The 15 years of soil fertility monitoring showed that under the current conventionalproduction and management conditions the contents of all the major nutrients in paddysoils show an upward trend. With year as an independent variable and contents of soilnutrients as dependent variables, correlation analyses were carried out. Significant dif-ferences (p = 0.01) in the changes in nutrient contents over the years were identified(Table 1). Posts in which soil organic matter was rising accounted for 36.2% with anaverage rise of 0.06 % per year. Posts where total soil N was rising accounted for66.6% with an average rise by 0.004 % per year; posts where soil alkali extractable Nwas rising accounted for 48.9% with an average rise of 6.3 mg kg' per year. The postswhere soil readily available P increased accounted for 38.3 % with an average rise of0.33 mg kg-' per year. The content of alkali extractable N, readily available P, readilyavailable K and slowly available K did not change much in soils of more than half ofthe posts. The average content of slowly available K even declined to a certain extend.
Table 1. Variation of major nutrients in paddy soils at 47 soil-fertility-monitoringposts
Parameter* 1984 1998 Increase no change Decrease_ Range Mean Range Mean n % n % n %
OM (g kg') 16.7-88.4 39.5 18.0-70.7 48.5 17 36.2 24 51.1 6 12.8Total N 0.93-3.52 2.38 0.95-4.41 3.0 31 66.0 14 29.8 2 4.2(g kg -')Alkalytic N 92-257 181.5 112-607 275.2 23 48.9 24 51.1 0 0(mg kg -')Readily avail. 1.4-56.5 11.9 3.0-54.0 16.9 18 38.3 26 55.3 3 6.4P(mg kg -')Readily avail. 1.0-195.0 65.6 29.0-337.0 82.2 11 23.4 29 61.7 7 14.9K(mg kg -')Slowly avail. 13.0-666.0 152.2 30.0-346.0 139.6 5 10.6 39 83.0 3 6.4K(mg kg -1)* OM - organic manure, alcalytic N = 1.0 M NaOH incubation at 40 'C for 24 h,
reflecting the available N pool
Nutrient contents in calcareous paddy fields are rising to a large extent
The soils in calcareous paddy fields are characterized by large amounts of calciumcarbonate, high alkalinity and high clay content, thus having the ability to conservenutrients. However, under conventional cultivation and management conditions, riceyields are low as affected by adverse factors, e.g. soil compaction imbalance Ca : Kratio, etc: As a result, the amount of nutrients removed in the harvested crop are rela-tively small and much of the nutrients accumulate in the soil. During the 15 years, soilnutrients in calcareous paddy fields increased to a great extent (Table 2). On the otherhand, certain zonal paddy soils derived from similar parent material showed that con-ventional cultivation and management led to a removal of a large proportion of nutri-
252

ents with the harvested crop, so that under these circumstances a nutrient accumulationdid not occur.
Table 2. Variation of soil nutrients in paddy fields of different soils
Soil No. of Year pH OM Total Alkaline R. a. P R.a. K S.a. K
type posts N Ntype posts g kg- g kg - mg kg- mg kg- mgkg' mg kg-Calcareous 14 1984 7.9 39.5 2.38 181.5 11.9 65.6 152.2soil 1998 7.8 48.5 3.00 275.2 16.9 82.2 139.0
Zonal soil 1984 6.0 33.0 1.73 151.5 12.3 44.3 104.91998 6.0 34.6 2.00 234.3 14.3 73.1 116.1
Note: OM stands for organic manure, R.a. for readily available and Sa. for slowly
available.
Nutrients in the soils of North-Eastern Guangxi are increasing to a large extent
In the north-eastern part of the province, it was the tradition that farmers used to growgreen manure crops (like milk vetch, common vetch etc.) followed by ploughing the
crop entirely or partly under before replanting in spring of the following year. This isan effective measure to build up soil fertility and soil nutrients. For instance, in Guilinin 35% of the paddy fields green manure crops are grown during winter. At the 4monitoring posts in the area, soil organic matter increased from 3.11 in 1984 to 4.14%in 1998, and readily available P increased from 7.0 mg kg-' to 15.6 mg kg -'. In areaswith little attention paid to growing green manure crops in winter and applying organic
manure instead, soil nutrients in the paddy fields were on the decline. For instance, atGusan monitoring post in Laibin County, a region that lagged behind in agriculturaldevelopment, farmers used to manure traditionally before they began to use mineral
fertilizers in 1984. Since then, they have replaced green manure and organic manurewith mineral fertilizers. As a result, soil organic matter decreased from 3.57% in 1984to 3.04% in 1998 or by 15%. Similar observations were made for the other nutrients to
a varying extent.
Soil nutrients mostly stagnating or declining in high-yielding paddy fields
In 1995, the Beiliu City wasnamed "Ton-Grain City" because its rice yields exceeded15,000 kg ha-1. In 1998, the city's rice yields averaged 15,825 kg ha - '. High-yieldingrice removes large amounts of nutrients from the soil. Fifteen years of monitoring
showed that though the annual application rate of organic manure reached 18,000 kgha-' and that of mineral fertilizers 728.4 - 756.2 kg ha - ', little changes in the soil nutri-ent status occurred (Table 3). The observation indicates that in high-yielding regions,soil management should not only maintain an adequate nutrient supply but also take
253

care of the nutrient balance in order to secure the land's productivity for a sustainable
farmland development.
Table 3. Changes in soil nutrients in high-yielding paddy fields in Beiliu City
Site Year OM Total N Alkalytic N R.avail. P R.avail. K S.avail. K(g kg - ) (g kg 1) (mg kg') (mag kg) (rag kg- ) (mg kg')
Longsheng 1984 39.8 1.49 153 20.0 49.0 1271998 31.6 1.66 201 17.0 52.0 270
Goulou 1984 28.5 1.49 107 13.6 28.0 37.01998 28.5 1.60 165 16.0 53.0 71.0
*: OM stands for organic manure, R. avail, for readily available and S. avail, forslowly available.
Soil nutrient contents are increasing to a great extent in the suburbs of cities andeconomically developed regions
The monitoring of the soil fertility revealed that soil nutrients of paddy fields increasedto a great extent in the vicinity of suburbs of cities and economically-developed re-gions. Because there the farmers have a high income and good access to agriculturalinputs (especially to mineral fertilizers). The cities demand a wide range of agriculturalproducts, which stimulates reasonable rotations and interrow cultivation. Rapid devel-opment of stock-raising widens the sources of manure. All this contributes to the buildup of soil fertility in the suburban fields compared to those far from suburbs and thefields in the mountainous regions.
Law of the nutrient cycling and balance
The survey of 47 monitoring posts (Table 4) showed that with the rise in the applica-tion rate of mineral fertilizers, the rate of organic manure decreased simultaneously.The ratio between mineral fertilizers and organic manure dropped from 1:0.56 in theearly 1980's to 1:0.18 in the late 1990's and at the same time, the returns from fertili-zation also declined. It was calculated that the crop response per kg of applied mineralnutrient dropped slightly from 8.57 kg in the early 1980's to 8.19 kg in the late 1980's,7.78 kg in the early 1990's and 7.62 kg in the late 1990's, following the rule of dimin-
ishing yields with increased inputs.
Nutrient cycling
The degree of nutrient recycling is usually expressed by the percentage of nutrientsreturned in the form of organic material (including organic manure) to the field in rela-tion to the total amount of nutrients consumed by the crop. The results of the monitor-ing posts revealed that in the early 1980's the proportion of organic material recycled
254

to the paddy field was fairly high, about 35.59% of the total biomass produced and themean nutrient recycling rate was 34.5%. The amounts of N, P and K applied in theform of organic manure accounted for 22.0%, 57.3% and 51.6%, respectively, of thetotal nutrient input. 27.9% of the N, 56.9% of the P and 36.1% of the K removed bythe plants was returned to the field. In the late 1990's, however, the nutrient input inthe form of organic manure accounted for only 15.2% and the nutrient recycling ratewas declined to 15.0%. Then the amount of N, P and K applied in the form of organicmanure accounted for only 8.8%, 18.2% and 25.9%, respectively, of the total nutrientinput. At this time, only 11.9% of the N, 19.2% of the P and 17.0% of the K removedby the crops was recycled to the field.
Table 4. Nutrient input and nutrient removal during different periods
Period Item N P20 5 K20 Total N: P20 5 :K20kg ha - yr -
1984- Input Fertilizer 225.6 20.0 93.2 338.81985 Manure 63.6 26.8 99.3 189.7
Total 289.2 46.8 192.5 528.5 1:0.16:0.67Removal 228.3 47.1 274.8 550.2 1:0.2 1:1.2(grains & straw)
1986- Input Fertilizer 253.4 24.8 114.3 392.51990 Manure 63.3 21.8 100.4 185.5
Total 316.7 46.6 214.7 578.0 1:0.15:0.68Removal 244.5 52.4 297.3 594.2 1:0.21:1.22(grains & straw)
1991- Input Fertilizer 307.5 39.3 141.6 488.41995 Manure 40.7 10.8 61.4 112.9
Total 348.2 50.1 203.0 601.3 1:0.14:0.58Removal 252.3 49.4 300.1 601.8 1:0.20:1.19(grains & straw)
1996- Input Fertilizer 318.8 39.9 144.0 502.71998 Manure 30.6 8.9 50.4 89.9
Total 349.4 48.8 194.4 592.6 1:0.14:0.56Removal 256.6 46.3 296.3 599.2 1:0.18:1.15(grains & straw)
Table 5. Nutrient recycling in paddy fields in Guangxi
Period NPK input by NPK removal* Nutrient recycling rate(%)organic manure Total N P20 5 K20
kg ha -'1984-1985 189.7 550.2 34.5 27.9 56.9 36.11986-1990 185.5 594.2 31.2 25.9 41.6 33.81991-1995 112.9 601.8 18.8 16.1 21.8 20.51996-1998 89.9 599.2 15.0 11.9 19.2 17.0
255

Nutrient balance
The nutrient balance was calculated, using the nutrients removed by the crop as nutri-ent output and nutrients applied to the field (including mineral fertilizers and organicmanure) as input. Results indicate that the N:P20 5 :K20 ratio of the nutrient input inpaddy fields in Guangxi was 1:0.14-0.16:0.56-0.67 (Table 4). Since 1984, the input ofN has always been greater than the removal of N with the tendency that the surplus isbecoming larger. By 1998, the N surplus reached 92.8 kg ha ' yr'. Though the lossesthrough volatilization and leaching were not assessed, the long-term effect of N lost tothe environment cannot be ignored. Before 1990, the input of P was inadequate andnow shows a slight surplus. The change has contributed to a positive P balance. Never-theless, the recovery rate of P is still very small and the crop growth often shows that Psupply is inadequate. The K input has long been inadequate. Although the problem ofinsufficient K supply slightly declined, the K deficit is still fairly large and was 101.9kg K20 ha-1 yr -1 in 1998. In many places, the application rate of organic manure hasdropped rapidly and caused that an important K source, e.g. by recycling straw, is ig-nored. As a result, soil K did not accumulate, causing that the soil K fertility is fluctu-ating around the medium to low supply level.The monitoring in the recent years has also shown that the application of more organicmanure has increased the K uptake by the crop (particularly in the rice straw) and alsothe P uptake (particularly in grains), indicating the important effect of organic manurein improving the fertilizer recovery and the grain-formation of rice.
Rational fertilization
Rational fertilization is the integration of soil, crop and fertilizers designed to achievean optimal output with an input level that is both the most economical and the mostreasonable. Based on the long-term monitoring of soil fertility, crop responses of dif-ferent crops to different fertilization systems in different soils can be assessed.
High-yielding soils and fertilization
The results of 23 monitoring posts in paddy fields (termed locally as Ton-Grain Field)with rice output beyond 15,000 kg ha-1 revealed that the soils from the paddy fieldshad a pH of 6.38 contained 3.83% organic matter, 0.219% total N, 18.3 mg kg ' read-ily available P, 76.0 mg kg-' readily available K. The features of high-yielding fertili-zation (Table 6) are: 1) The total application rate is high, about 34.1% larger than theaverage of all the monitoring posts. The larger nutrient application increased yields byabout 35.3%. 2) The proportion of nutrients applied in the form of organic manure ishigh, especially P and K, accounting for about 50%, respectively. 3) The K applicationrate is high, with an N:K ratio of 1:0.75-0.78, significantly larger than that in othermonitoring posts.
256
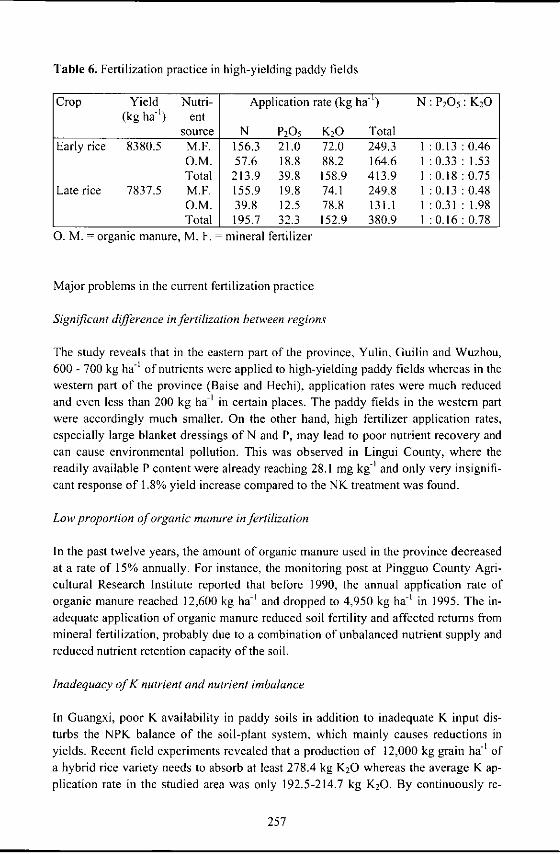
Table 6. Fertilization practice in high-yielding paddy fields
Crop Yield Nutri- Application rate (kg ha -1) N : P20 5 : K20(kg ha') ent
source N P20 5 K20 TotalEarly rice 8380.5 M.F. 156.3 21.0 72.0 249.3 1 :0.13 :0.46
O.M. 57.6 18.8 88.2 164.6 1:0.33 :1.53Total 213.9 39.8 158.9 413.9 1 :0.18 :0.75
Late rice 7837.5 M.F. 155.9 19.8 74.1 249.8 1 :0.13 :0.48O.M. 39.8 12.5 78.8 131.1 1:0.31 :1.98Total 195.7 32.3 152.9 380.9 1: 0.16: 0.78
0. M. = organic manure, M. F. - mineral fertilizer
Major problems in the current fertilization practice
Significant difference in fertilization between regions
The study reveals that in the eastern part of the province, Yulin, Guilin and Wuzhou,600 - 700 kg ha -1 of nutrients were applied to high-yielding paddy fields whereas in thewestern part of the province (Baise and Hechi), application rates were much reducedand even less than 200 kg ha-' in certain places. The paddy fields in the western partwere accordingly much smaller. On the other hand, high fertilizer application rates,especially large blanket dressings of N and P, may lead to poor nutrient recovery andcan cause environmental pollution. This was observed in Lingui County, where thereadily available P content were already reaching 28.1 mg kg-) and only very insignifi-cant response of 1.8% yield increase compared to the NK treatment was found.
Low proportion of organic manure in fertilization
In the past twelve years, the amount of organic manure used in the province decreasedat a rate of 15% annually. For instance, the monitoring post at Pingguo County Agri-cultural Research Institute reported that before 1990, the annual application rate oforganic manure reached 12,600 kg ha-1 and dropped to 4,950 kg ha-' in 1995. The in-adequate application of organic manure reduced soil fertility and affected returns frommineral fertilization, probably due to a combination of unbalanced nutrient supply andreduced nutrient retention capacity of the soil.
Inadequacy of K nutrient and nutrient mbalance
In Guangxi, poor K availability in paddy soils in addition to inadequate K input dis-turbs the NPK balance of the soil-plant system, which mainly causes reductions inyields. Recent field experiments revealed that a production of 12,000 kg grain ha- ofa hybrid rice variety needs to absorb at least 278.4 kg K2 0 whereas the average K ap-
plication rate in the studied area was only 192.5-214.7 kg K20. By continuously re-
257

moving more nutrients from the field than replacing by fertilizers, soils become de-pleted of K and K deficiency becomes increasingly prominent.
Recommendations for rational fertilization
Though Guangxi's fertilization level of paddy fields exceeds that of the country's av-erage and inputs of N and P seem to be in balance with the outputs. Nevertheless, addi-tional efforts have to be paid to improve the nutrient supply to paddy. This particularlyapplies to the poor P recovery rate and to the fact that soil P varies strongly from placeto place and the P deficient area is still quite large. Therefore, P application needs to befurther improved both in quantity and quality of application. The inadequate use of Kfertilizer calls for an improved K supply both through mineral fertilizer and throughorganic manure. The strategy for future fertilization has to put emphasis on increasingK input while keeping up N and P application rate and readjusting the N:P:K ratiofrom the current 1:0.12:0.45 to 1:0.14-0.15:0.48-0.50. In Guangxi, the natural condi-tions are favourable for developing green manure and for returning straw to recycle thenutrients to the field. It is expected that through the development of dual-purpose greenmanure, such as "green manure cereals, green manure oil crops and green manurevegetables", the area of green manure grown in winter can reach over 500,000 ha andthe area used for returning straw over 1,000,000 ha. Together with the application offarmyard manure, the recycling rate of nutrients can reach around 40% of the total nu-trient removed by the crops.In view of differences in soil and crop type, full use should be made of modem soiland plant testing methods towards a diagnosis-based fertilization. Through fertilizerexperiments and the soil fertility monitoring during the past 24 years, the soil and fer-tilizers administration in Guangxi has developed the "Guangxi Soil Diagnosis and Fer-tilization Software System". With such a system, predictions of target yields and fer-tilization recommendation can be conducted. During the four years of practice, from1995 onwards, it was demonstrated that the technology of soil diagnosis and fertiliza-tion based on this system can increase the fertilizer recovery rate by 7.2 % and the eco-nomic benefit by about 10%.
258

Trends of changes in the farmland nutrient status in the HainanProvince and suggested methods for improvement
Chen Li
Hainan Province Soil and Fertilizers Station 570203
Farmland nutrient status
Organic matter and nitrogen contents
Of the farmland in the province, about 49.9% is relatively poor in soil organic matter.Soils are mainly percogenic paddy soils along the coast derived from shallow marinesediments and submerged paddy soils in the mountainous region in the center of theprovince. Paddy soils with poor total N status account for 52% of the cultivated landwhereas areas deficient in readily available N are in the order of 55% (Table 1).
Table 1. Farmland soil organic matter and N contents in the Hainan Province(1000 ha)
Item O.M. (g kg -') Total N (g kg') Alkalytic N (mg kg')
>20 10-20 <10 >1 1-0.5 <0.5 >90 60-90 <60high med. low high med. low high med. low
Area (1000 ha)* 381.8 280.0 100.6 360.4 311.6 89.9 410.0 176.0 196.6Area (%) 50.1 36.7 13.2 47.3 40.9 11.8 53.8 23.1 25.8* based on a total sown area of 762 000 ha in 2001
Phosphorus contents
Analysis revealed that overall farmland has a relatively poor P status. The total soil Ppool is inadequate and readily available P can be classified as insufficient. The farm-land, deficient in soil P, accounts for 68% of the total acreage (Table 2).
Table 2. Farmland soil P in the Hainan Province (1000 ha)
Item Total P (g kg -') Readily available P (mg kg)
>0.14 0.9-0.14 <0.9 >20 10-20 <10high med. low high med. low
Area (1000 ha)* 48.0 71.6 642.4 67.1 173.7 521.2Area (%) 6.3 9.4 84.3 8.8 22.8 68.4
* based on a total sown area of 762 000 ha in 2001
259

Potassium contents
Total K in the province's farmland varies between < 9 and > 18 g kg'1 of which themajority of 44.6% of the area has a poor K status. These soils, poor in K, are derivedmainly from basalt and shallow marine sediments. Looking at the readily availably Kin the soil indicates that only 13% can be classified as being high (>100 mg kg-1)whereas more than 86% of the soils show a medium or poor K availability (<100 mgkg-1). 61% of the area may be regarded as seriously K deficient (Table 3).
Table 3. Farmland soil K in the Hainan Province (1000 ha)
Item Total K (g kg -') Readily available K (mg kg-')
>18 9-18 <9 >100 50- 100 <50high med. low high med. low
Area (1000 ha)* 282.7 139.4 339.8 100.6 195.1 466.3Percentage 37.1 18.3 44.6 13.2 25.6 61.2
* based on a total sown area of 762 000 ha in 2001
Separate analysis for P and K has been carried out in the irrigated lowland soils meant
for rice cultivation (Table 4). The results indicate a very poor supply of the lowlandsoils with P and K. Only one soil, Honghetu, derived from granite substantially ex-
ceeded in the critical soil P levels for poor supply of> 10 mg kg -1 as given in Table 2.
Table 4. Nutrients in submerged paddy soils in the Hainan Province
Total P Avail. P Total K Avail. KSoil genus Parent material N* g kg-1 mg kg-' g kg' mg kg'
Zini Purplish sandshale 9 0.5 14.3 10.6 52Carboniferous Shallow marine sedi- 25 0.25 4.4 3.7 26Heini mentsChitu Basalt 270 1.17 7.9 2.8 35Huoshanhui Pumilith 17 0.8 12.1 3.2 51.9Heshani River alluvium 120 0.4 14 16 44Chashani River alluvium 341 1.02 14 22.7 44Niruo River alluvium 121 0.86 11 19 44Hongchitu Granite 419 0.45 12.8 23.3 56.3Honghetu Granite 10 0.36 80 32.2 163Yechitu Sandshale 438 0.64 6.5 10.1 51.3Yehechitu Sandshale 3 0.26 9 3.08 66Anchitu Andesite 2 0.35 6 36.3 60Anhechitu Andesite 1 0.36 4 3.12 46
*Number of sites analysed
260

The same is true for potassium, where only the Honghetu soil significantly exceededthe critical level of> 50 mg kg-I (as classified in Table 3), all the other soils analysedwere clearly below orjust at that level of K supply.
Trend of changes in farmland soil nutrients
The long-term stationary monitoring of soil fertility in the province showed that soilorganic matter and soil K have been declining in recent years. In areas, such as Qiong-hai and Haikou, where the rotation of rice-vegetables is popular, successive years ofapplying highly-concentrated compound fertilizers (15-15-15) has caused that P accu-mulated in the soil, showing an upward trend. In double-cropping rice growing areas,such as Dingan and Qiongzhong, soil P displays a downward trend. The major causefor the difference is whether or not P straight fertilizers and/or compound fertilizers,containing P were used (Table 5).
Table 5. Changes in soil nutrients
Site Year Drop in O.M. Drop in readily Drop in readilyavailable P available K
% gkg % mg kg- % mg kg'Qionghai 1991-1995 69 0.78 38 1.96 77 6.22Province 1990-1992 55 1.3 62.7 2.64 70.6 5.24
Table 6. Effect of cultivation system on farmland soil nutrients in BeiPo,Wanning City
Location Rotation Year O.M. Total N Alka- R.avail. R.avail. pH
line N P K----g kg- --------- mg kg -I ........
Shuibianyang Rice-fruit 1989 31.7 1.77 129 10 60 5.51995 20.1 1.04 90.3 28.8 34.9 5.2Rate* 1.93 -0.12 -6.45 3.13 -4.18 -0.05
Danaiyang Rice-cash 1990 21.5 1.62 109.0 13 53 5.3crop 1995 16.2 0.89 87.8 13.7 51.7 5.4
(sugarcane) Rate* -1.06 -0.146 -4.24 0.14 -0.26 0.02
Shuibianyang Double rice 1985 31.7 1.77 129 10 60 5.51995 24.9 1.06 87.3 4.4 34.2 4.8
Rate* -0.68 -0.071 -4.17 -0.56 -2.58 -0.07
Lichunyang Double rice 1985 32.1 1.52 163 9.9 90 5.41995 24.3 1.42 122 4.6 74.3 5.1
Rate* -0.78 -0.01 -4.1 -0.53 -1.57 -0.03
The effect of the cultivation pattern on soil nutrients (Table 6) also clearly explains thetrend of changes. For instance, in Shuibianyang, Beipo Town, Wanning City, in therice-fruit rotation, after guava was grown on the farmland of Chaoshani, all the soil
261

fertility parameters showed a deteriorating trend. Except readily available P, whichincreased due to the use of compound fertilizer in fruits, the other soil fertility indica-tors decreased greatly with an annual rate of 1.93 g kg' in organic matter, 0.12 g kg-'in total N, 6.45 mg kg-' in alkalytic N and 4.18 mg kg -' in readily available K. The ro-
tation of rice-fruit or rice-cash crop (sugarcane) and double cropping rice produced asimilar effect.
The change of farmland into orchard or sugarcane field improves the soil nutrient
status temporarily. As a result, soil bioactivity is strengthened, thus accelerating de-composition and mineralization of soil organic matter, total N and K. At the sametime, the two types of crops demand large amounts of K and farmers do not pay much
attention to the application of N and K fertilizers, so N and K contents in the soil oftenshow a downward trend.Analysis of the fertilisation in the province shows that the gap between areas well andthose poorly supplied with nutrients is widening. In 1997, the application rate was thehighest in the coastal area and the suburbs of cities, such as Nongken (1,166 kg ha-),Wanning (965 kg ha ') and Sanya (864 kg ha'), and the lowest in the minority regionsand poverty-stricken areas, such as Tongshi (182 kg ha -') and Changjiang (148 kgha-'), where nutrient deficiency is rather common. The average application rate in theprovince was 520 kg ha -'.The application rate also varies with the crop. At the time of the survey, it was 352 kgha -' for cereals, 880 - 1,500 kg ha1 for vegetable and 3,246 kg ha -' for banana. Farm-land nutrients are likely to display a declining trend in paddy fields that have long beencultivated with rice but have not received enough fertilizers in the past. Soils of landcultivated by crops like winter melon, vegetable and banana may also show a down-ward trend in nutrients where fertilizers are not duly supplemented (Table 7).
Table 7. Application rate, varying according to crops (kg ha')
Crop Yield Application rate (kg ha-) N : P205 : K20(kg ha -') Total N P20 5 K20 ratio
Rice 4,500 352 161 69 122 1 :0.42 :0.75Pepper 52,500 1,470 682 428 360 1 :0.62 :0.53
Wax melon 90,000 1,015 295 304 417 1 :1.03:1.4Watermelon 30,000 880 295 259 326 1:0.9 :1.1
Banana 60,000 3,247 716 506 203 1 :0.7 :2.8
Approaches to improve farmland nutrient management
Principle
The aim of improving the soil supply of nutrients is to increase the yield of crops andbuild up soil fertility as well as to reduce possible pollution to the soil and environment
at the same time. Therefore, the following aspects should be taken into consideration:
262

Characteristics of the nutrient demand of crops (temporal and quantitative requirementduring the cropping season), soil nutrient supply capacity, nutrient availability, thenutrient balance (input : output) and replacing the nutrient removals/losses by a com-bined application of organic manure and mineral fertilizers.
Measures
To improve nutrient supply by the soil, it is necessary to increase nutrient input byfertilisation and to increase the effectiveness of nutrients applied by taking into ac-count the nutrient pools and the nutrient retention capacity of the soil. Through thisnutrient losses can be avoided.
Extension of the technique of returning straw to the field
Currently, in the coastal regions, in combination with the extension in the use of har-vesting machines, the technique of returning chopped straw to the field through theharvester is studied. In hilly and mountainous regions, straw is returned to the field byleaving long stubs (over 40 cm) in the field to reduce soil and nutrient losses by runoffand erosion. The long stubs are either plowed into the soil or used as mulch. In thelight of the characteristics of the farming system of "three crops per year", emphasis isplaced on techniques to speed up the decomposition of the straw in the field, mainly byextending the use of bacterial agents, such as Fugenling and saccharomvcetes.In the period from 1994 to 1998, the Hainan Province Soil and Fertilizers Station car-ried out demonstration experiments on returning straw to the field in a paddy field ofShani in WenYuan Dongyang, Longgun Town, Wanning City. The field of the demon-stration experiment with an area of 26.7 ha received 4,500 kg ha" fresh straw, 600kg hat quality lime and 150 kg ha' potassium chloride. The yields were 7,162 kg ha-i
rice, about 757 kg ha-i' or 10.5% larger than in the adjacent fields without straw return(6,405 kg ha'). Pot experiments showed that rice yields could be increased between3.9% and 17.4% by the use of rice straw (Table 8).
Table 8. Effect of returning straw to the field on yield and economic properties of rice
Treatment* P. Effective Grains/ear Bearing Yield Yield incrementheight ears ha-1 rate
cm x 1000 % kg ha-' %A 115 280.8 97.3 97.3 7507.5 1111.5 17.4B 113 288 85.2 68.3 6771 375 5.9C 110 262.8 89.7 72.4 6646.5 250.5 3.9
CK 103 255.6 82 66.8 6396*Note: Treatment A: 4,500 kg straw + 600 kg lime powder + N=138 kg; P20 5=42 kg;
K20=90 kg ha-1; Treatment B: 4,500 kg straw + 600 kg lime powder + N-82.5kg; P20 5 22.5=kg; K20 54Ag ha-1; Treatment C: 4,500 kg straw + 600 kg limepowder + N=138 kg; P20 5=42 kg ha-'; CK: N=138 kg; P20 5=42 kg; K20=90kg ha- '.
263

After four successive years of returning straw to the field, the soil organic matter con-tent, total N and readily available K increased by 14.5%, 3.8% and 22.6%, respec-tively, whereas soil pH slightly decreased.
Extension of wet-dry cultivation patterns mainly as rice-winter melon (vegetable)
Many years of practice have shown that by taking advantage of climate (radiation andtemperature) in Hainan Province, the extension of multi-cropping cultivation patternssuch as "rice-rice-vegetable" or "rice- winter melon (vegetable)" can lead to benefits inthe following aspects:1) Increase in returns. According to preliminary statistics, in the period from the win-
ter of 1985 to the spring of 1996, the rotation system of "rice-vegetable" over anarea of 47,466 ha produced a total output value of 3.05 billion Yuan (372 M USD)and a net profit of 1.68 billion Yuan (205 M USD), about 1.41 billion Yuan (172M USD) more than the rotation system of "rice-rice". The annual total outputvalue of the rotation system of rice-winter melon (vegetable) can reach 64,338Yuan ha-' (7846 USD ha-') whereas that of "rice-rice" only achieves 11,393 Yuanha' (1389 USD ha').
2) Increase in fertilizer input. According to a survey, in the rotation system of "rice-rice" the mean annual application rate of organic manure was approx. 13 t hal . Itdropped below 4.5 t ha -' or even to zero application in certain areas. On the otherhand, in rice-vegetable rotation system, the annual application rate of organic ma-nure was 25 t or even 37 t per hectare and year. In the winter crop alone 11.35 -22.5 t ha-' of manure were applied. Mineral fertilizers show a similar pattern. Inthe rotation system "rice-vegetable", the application rate per crop was 377 kg,about 142 kg or 60% more than in the "rice-rice" rotation. The use of compoundfertilizers increased to the greatest extent, reaching 112 kg ha-', comprising 17 kgha t in N, 8 kg ha-' in K and 4 kg ha-' in P.
3) Increase in soil nutrients. The increase in input of organic manure significantlyimproved the soil nutrient status. According to the analysis of soil samples fromSanya, Danzhou, Chengmai and Wanning, in fields cultivated for 5 - 8 years by arice-winter vegetable rotation, soil organic matter increased at a rate of 0.06 - 0.68g kg-1, readily available P at 0.02 - 3 mg kg-1 and readily available K at 0.42 - 11.5mg kg- annually (Table 9).
Table 9. Effect of duration of cropping by different rotation systems on the changes inthe soil nutrient status (expressed as change compared to the beginning of therotation)
Site No- of O.M. Total N Readily av. N Readily av. P Readily av. Kyears gkg' % gkg-I % mgkg' % mgkg % mgkg %
Sanya 5 0.3 1.54 0.08 4.9 0 n.d. 0.1 3.1 2.8 2.2Danzhou 7 1.9 14.1 0.18 29.0 0 n.d. 0.9 29.0 3.0 15.0Chengmai 6 1.3 4.9 0.3 20.0 5.0 7.4 8.0 114.0 69.0 627Wanning 8 4.9 35.3 0 n.d.* 24.6 31.5 24.1 142.0 80.0 1333
Note: O.M. stands for organic matter, and R.A. for readily available.
264

Fertilization guided b.v scientific principles
Currently the recommended formula for fertilization of farmland in the Hainan Prov-ince is 90- 120 kg N, 45 - 75 kg P20 5 and 69 kg K20 per crop ha-I at an N : P20 5 :K20 ratio of 1:0.45:0.8, depending on crop type and yield expectation. Though this is avery rough method, the recommended fertilizer rates usually lead to larger yields thanthe conventional practice by farmers (Table 10).
Table 10. Demonstration of fertilization based on recommended formula
Site Year n NPK ratio Yield Increment over conventionalN: P20 5 : K20 kg ha' kg ha ',
Qionghai 1990 12 1 :0.46 :0.9 5430 675 14.41991 111 1:0.56:0.7 5946 563 10.5
Dongfang 1991 3 1 :0.12 :0.8 5910 1080 22.4Lingao 1988-1991 37 1 :0.46 :0.65 5818 515 9.7Tunchang 1991 2 1 :0.41 :0.7 4347 458 11.8Chengmai 1991 I 1 :0.5 :0.8 7770 503 6.9Qiongshan 1991 4 1 :0.44 :0.72 5814 781 15.5Dingan 1991 1 1: 0.53 :0.93 5850 810 16
To improve and maintain the soil nutrient status of farmland in the Hainan Province,the following recommendations are made:I) application rate for one crop of rice should be adjusted to 120 - 150 kg N, 60 - 75
kg P205 and 150 -180 kg K20 per hectare with a ratio of 1:0.5:1.2, which hasshown to be more appropriate than the above.
2) In the fields under the rice-winter vegetable rotation, the preference of the farmersfor 15-15-15 compound fertilizers has caused P accumulation in the soil. It istherefore recommended to control the rate of P and increase the rate of K by eitheradditional straight fertilizer application or a change in the formulas towards largerK and smaller P contents.
3) A rotational fertilizer application system is recommended that puts greater empha-sis on the supply of P and K to the vegetable crop in the rotation which is morenutrient demanding than the cereal preceding or succeeding the vegetables. In thisrespect, larger amounts of K can especially improve quality of the seedlings, theflowering rate and hence increase yields.
In order to improve fertilization techniques and to raise the recovery rate of fertilizers,the following points deserve more attention:4) Raising the proportion of mineral fertilizers as basal dressing and mixing them
well with the soil to ensure a continuous nutrient supply and higher recovery rate.Extending fertilisation techniques like deep placement.
5) Applying N with in water suspensions or watering immediately after broadcastingof N fertilizer to reduce volatilisation losses of nitrogen fertilizers-
265

6) Larger amounts of P should be applied to the upland crops and less to lowlandirrigated rice cultivation. Blending of organic material with P fertilizers in com-posts has shown good results and should therefore be extended.
7) Using site-specific fertilizer forms, e.g. ammonium-N-based mineral fertilizers toirrigated rice fields and nitrate-N-fertilizers to upland fields.
Prediction of the fertilizer demand
The prediction of the demand for fertilizers depends on the need of agriculture for sus-tainable development and the economics of fertilizer use (fertilizer prices, crop pricesetc.). According to the statistics in the province from 1985 to 2001, the consumption ofN fertilizers rose by 29%, that of P fertilizers by 182%, that of K fertilizers by 420%and that of compound fertilizers by 840% (Table I1).
Table I1. Consumption of mineral fertilizers in the Hainan Province (1000 t)
Year Total N P20 5 K20 Compound fertilizer N: P20 5 : K201985 105.6 69.0 21.6 5.0 10.0 1 :0.31 :0.071990 136.4 78.2 13.2 15.0 30.0 1:0.17:0.191995 172.6 78.2 14.2 18.9 60.0 1 :0.18 :0.261997 211.9 92.9 30.0 23.6 75.4 1 :0.32 :0.252001 270.0 89.0 61.0 26.0 94.0 1:0.68:0.29
Based on the increase in fertilizer consumption of the past, the orientation of the agri-culture in the province in the years to come, it is predicted that the supply of mineralfertilizers will reach 349,000 t in 2005, of which N fertilizers will be 110,000 t, P fer-tilizers 44,000 t, K fertilizers 55,000 t and compound fertilizers 140,000 t at an N
P20 5 : K20 ratio of 1:0.40:0.50.
266

Chapter IV
On-site studies of farmland nutrientbalances and rational fertilization
267


Balanced nutrition and nutrient balances in irrigated rice:A case study in the Zhejiang Province, PR China
C. Witt', G. Wang 2, A. Dobermann' 3 , Q. Sun 4, and R. Fus
' International Rice Research Institute (IRRI), DAPO Box 7777, Metro Manila, Philip-Pines-Zhejiang University, Hangzhou, P.R. China' University of Nebraska, Department of Agronomy, Lincoln, NE 68583-0915, USA4 Agricultural Research Station, Jinhua, Zhejiang, P.R. Chinas Agricultural Technical Extension Station, Jinhua, Zhejiang, P.R. China
Abstract
Plant based performance indicators were successfully used in on-farm and on-stationexperiments to develop, evaluate and refine a novel site-specific nutrient management(SSNM) strategy in Jinhua, Zhejiang Province. With SSNM, current average riceyields of about 6 t ha- ', representing only 60% of the yield potential, were raised infarmers' fields by about 0.5 t ha-, resulting in profit increases of 88 USS ha - crop'.Yield increases were achieved with improved splitting and timing of N applicationsreducing fertilizer N needs by 21%. In contrast to the farmers' fertilizer practice, lessN was applied with SSNM early in the season while fertilizer N supply was increasedduring the time of greatest plant demand between tillering and panicle initiation. Re-sults indicate that several parameters would need to be measured to fully evaluate andfine-tune balanced nutrient management strategies. Fertilizer N, P and K requirementsin the SSNM approach are largely based on the attainable yield gain over a plot with-out application of the fertilizer nutrient of interest (omission plot). We consider the ag-ronomic N efficiency (grain yield increase per unit fertilizer N) as the most practicalparameter for the development and evaluation of N management strategies in exten-sion. Omission plots can be used to both relate fertilizer requirements to yield in-creases and visually demonstrate nutrient limitations to farmers. Where a direct yieldresponse to fertilizer P and K application is less clear, the SSNM approach recom-mends maintenance rates that are based on a simple nutrient balance model for irri-gated rice. On-farm measurements of nutrient balances, however, probably supply lim-ited information, regarding the risk of nutrient depletion, unless combined with esti-mates of medium- or long-term changes in indigenous nutrient supplies.
Introduction
Considerable progress has been made in recent years in developing field- and season-specific nutrient management approaches, as alternatives to blanket recommendationsfor NPK fertilizers (Dobermann and White, 1999; Balasubramanian et al., 1999; Do-bermann and Fairhurst, 2000; Wang et al., 2001; Dobermann et al., 2002). These site-specific nutrient management (SSNM) approaches have been widely evaluated infarmers' fields in Asia and were recently refined and simplified into tools and guide-lines for the participatory development of improved nutrient management in Asia'sirrigated rice systems (Witt et al., 2002b; Dobermann et al., 2003c). Wider scale deliv-
269
cry will also require a framework for participatory evaluation used by extension to en-sure that disseminated nutrient recommendations are scientifically sound and meetfarmers' needs. A large number of well defined criteria have been used by researchersin the evaluation of nutrient management strategies in irrigated rice (Cassman et al.,1998; Dobermann et al., 2003a). A major challenge for the extension sector is to selectthose criteria which are crucial for both the development and bio-physical evaluationof improved SSNM management strategies.Thus, the major objectives of this paper are:* to summarize the principles of site-specific nutrient management," to present the conceptual framework of plant based indicators used by researcher in
the evaluation of nutrient management strategies, and* to evaluate the proposed framework of plant based indicators comparing the site-
specific nutrient management approach with the farmers' fertilizer practice, usingdata from on-station and on-farm experiments in Jinhua, Zhejiang Province.
The principles of site-specific nutrient management (SSNM)
The SSNM principles offer a basic plan for a pre-season calculation of balanced fertil-izer rates, considering the deficit between plant nutrient requirement and soil nutrientsupply. Soil nutrient supplies can be indirectly estimated as plant nutrient uptake orgrain yield in nutrient omission plots (Dobermann et al., 2003b; Dobermann et al.,2003c). A nutrient omission plot receives all nutrients applied as fertilizer in ampleamounts except for the nutrient of interest. For example, a nitrogen omission plotwould receive fertilizer P and K in sufficient amounts but no fertilizer N. Plant basedestimates of soil nutrient supply integrate the supply of all indigenous sources esti-mated underfield conditions and also offer the possibility for estimating the nutrientsupplying power of organic manures, irrigation water and biological N2 fixation. Amajor advantage of this approach is that the soil supply is expressed as nutrient limitedyield, i.e. in a unit that can be directly used in the calculation of fertilizer requirements.Fertilizer requirements largely depend on the expected yield gain, which we define asthe required yield increase over the nutrient limited yield to reach a season-specificyield goal. To consider differences in soil supply among nutrients, yield gains have tobe estimated for N, P and K separately. For example, if the nutrient limited yield was 5t ha-' for P and 6 t ha" for K as measured in omission plots, the required yield in-creases to achieve a yield goal of 6 t ha - I would be I t ha- for P and 0 t ha-' for K.Thus, fertilizer P rates would have to be sufficiently high to support the required yieldincrease whereas preventive fertilizer strategies would focus on replenishing most ofthe crop nutrient removal to maintain soil K supplies. As a 'rule of thumb', we esti-mate that 40-50 kg fertilizer N, 20 kg P20 5 or 30 kg K20 would be required to raise therespective nutrient limited yield by I t ha-' (Witt et al., 2002b; Witt and Dobermann,2003). The fertilizer N requirement was based on field measurements, indicating thatan agronomic efficiency of 20-25 kg grain kg-' fertilizer N can be achieved with goodN management. For comparison, about 60 kg fertilizer N per ton grain yield increasewould be required, if an agronomic efficiency of only 16-17 kg grain per kg fertilizerN can be achieved due to less favorable growing conditions.These principles only provide a basic plan for the development of balanced fertilizerrates. Local adaptation and participatory evaluation is particularly required for the de-velopment of suitable N management strategies. Asian farmers generally apply fertil-izer N in several split applications, but the number of splits, amount of N applied per
270
split and the time of application varies substantially even within small domains. Theapparent flexibility of rice farmers in adjusting the time and amount of fertilizer appli-cation offers great potential to synchronize N application with the real-time demand ofthe rice crop. There are probably three major practical forms of N management rec-ommendations, namely (a) location-specific split schedules for preventive N manage-ment, (b) corrective N management using a leaf color chart (LCC) or chlorophyll me-ter (SPAD), and (c) a combination of both in which LCC or SPAD are used at certaingrowth stages to identify the need for fertilizer N ('split N + LCC' or 'split N +SPAD'). Details of these approaches are described elsewhere (Balasubramanian et al.,1999; Dobermann and Fairhurst, 2000; Yang et al., 2003). The most suitable strategyfor a particular site probably depends as much on bio-physical conditions (e.g., season-to-season variation in climate) as on socio-economic factors (e.g. number of field vis-its, labor input).Finally, information on soil nutrient supply is of particular importance for the com-monly less limiting macronutrients P and K, because of i) uncertainties in short- andmedium-term crop responses to P and K application and ii) limited options for an im-mediate correction of these deficiencies within one season as compared to N. In gen-eral, P and most K should be applied early in the season for greatest efficiency and toavoid nutrient deficiencies at early growth stages. We propose to install a limited num-ber of nutrient omission plots in recommendation domains, i.e. areas with a commoncropping system and similar soil types and topography to help extension workers indeveloping an improved understanding of the local distribution of soil fertility in part-nership with farmers (Dobermann et al., 2003b; Dobermann et al 2003c). Furthermore,the yield gain concept was refined to offer simple rules on fertilizer requirements thataim at medium-term strategies in the adjustment of soil P and K supplies (Witt andDobermann, 2003). This improved approach considers the soil indigenous nutrientsupply as the status quo and takes more information (e.g. on straw management) intoaccount when developing fertilizer P and K requirements. Local adaptation and re-finement of these generic principles may be required integrating other research find-ings, e.g. on the soil P and K supplying capacity as determined in long-term experi-ments.
Conceptual framework for the development and evaluation of SSNM
In the following, we briefly discuss the conceptual framework used by researchers toassess the agronomic and economic performance of site-specific nutrient management(SSNM) in comparison to the farmers' fertilizer practice (FFP). Further information isprovided elsewhere (Cassman et al., 1998; Dobermann et al., 2003a). In addition toyield and gross return over fertilizer cost (GRF, revenue minus fertilizer cost), we usedplant nutrient accumulation, nitrogen use efficiencies and nutrient balances in treat-ment and/or nutrient omission plots to answer the following, more specific questions:I. What is the respective yield response to fertilizer N, P and K application?
Yield response to fertilizer application is an important indicator for the need to ap-ply fertilizer nutrients particularly for fertilizer N. It may be advisable to apply fer-tilizer P and K even if a yield response was not expected (maintenance applica-tion), e.g. if there is evidence that soil indigenous nutrient supply would rapidlydecline without replenishing P and K removed with grain and straw.
2. Is the plant uptake of N, P and K sufficient to achieve the targeted yield?The plant N, P and K requirements of rice have been described using the model
271

"Quantitative Evaluation of Fertility of Tropical Soils" (QUEFTS) (Janssen et a.,1990; Witt et al., 1999). Under optimal conditions, the nutrient requirement of riceis about 14.7 kg N, 2.6 kg P and 14.5 kg K per 1000 kg of grain. Nutrient require-ments will increase for yields beyond 70-80% of the yield potential. Nutrient re-quirements can also be expressed as grain yield per unit plant nutrient accumula-tion at physiological maturity (internal nutrient efficiencies):* Internal nutrient efficiencies for grain yield production ([EN, IEP, IEK)
IEX = GY / UX [equation I]
where IEX is the internal nutrient efficiency in kg grain kg-' plant nutrient; X isthe nutrient N, P or K, GY is grain yield in kg ha'i and UX is the plant nutrientin the above-ground dry-matter in kg ha' at physiological maturity of rice. Thecorresponding optimal values are 68 kg grain kg"' plant N, 385 kg grain kg-'plant P and 69 kg grain kg' plant K.
3. Are fertilizer nutrients used efficiently?Fertilizer use efficiencies include agronomic, physiological and recovery efficien-cies and are most important for the evaluation of fertilizer N management strate-gies. Fertilizer use efficiencies are less crucial for the evaluation of fertilizer P andK strategies, because their management may not only aim at overcoming a nutrientdeficit, e.g. if maintenance applications are required to avoid medium- or long-term nutrient depletion term. However, fertilizer P and K recovery efficiencieswere important input parameters for the development of the generic SSNM ap-proach for P and K (Witt et al., 2002b; Witt and Dobermann, 2003). The physio-logical and agronomic efficiencies are commonly only used to evaluate N man-agement strategies. The following definitions on nutrient use efficiency are basedon a framework described by Cassman et al., (1998):
* Recovery efficiency of applied fertilizer nutrients (REN, REP, REK)
REX = (UX.x - UX_x)/FX [equation 2]
where REX is the recovery efficiency in kg plant nutrient kg-' fertilizer nutrient(for other abbreviations, see above). The REN largely depends on the congru-ence between plant N demand and quantity of N released from applied fertilizerN. With good crop and nutrient management, REN of > 0.5 kg kg-' can beachieved. The recovery efficiencies of fertilizer P and K can vary widely asthey are influenced by a number of factors including the amount of fertilizerapplied, the difference between yield in fertilized and unfertilized plots, appli-cation method including splitting and timing of applications and soil properties.lnterquartile ranges of recovery efficiencies measured across five tropicalAsian countries in 1997-1998 ranged from 0.11 to 0.35 kg kg" for P and 0.16to 0.66 kg kg' for K (Witt, 2003).
* Physiological N efficiency for grain yield production (PEN, PEP, PEK)
PEN = (GYIN - GY.N)/(UN+N - UN-N) [equation 3]
where PEN is the physiological N efficiency in kg grain increase per kg in-crease in plant N accumulation due to fertilizer N application. In a healthy ricecrop with no significant constraints to growth, PEN should be close to 50 kggrain kg-' N taken up from fertilizer.
272

o Agronomic N use efficiency (AEN) or yield increase per unit fertilizer N:
AEN = (GY+N - GY-N)/FN [equation 4]
where AEN is the agronomic N use efficiency in kg grain kg ' fertilizer N; GYis the grain yield in kg ha -' and +N and -N are treatments with and without fer-tilizer N application, respectively, and FN is the amount of fertilizer N in kFha -'. With proper nutrient and crop management, AEN should be 20 kg kg.Note that AEN = REN x PEN.
4. Are there any indications of substantial net removal of P and K with grain andstraw that might result in long-term reduction of soil indigenous P and K supply?Nutrient balances can be used to obtain a first indication whether a nutrient man-agement strategy bears the risk of causing a decline of soil indigenous P and Ksupply in the long-term.We used the following general formula for estimating the nutrient budget (B) foreach rice crop:
B - M + A + W + N 2 - C - PS - G [equation 5]
where (all components measured in kg elemental nutrient ha') M - added inor-ganic and organic nutrient sources, A -atmospheric deposition (rainfall and dust),W = irrigation, floodwater and sediments, N2 - biological N2 fixation (BNF), C -net crop removal with grain and straw (total uptake - nutrients in crop residues re-turned to the soil), PS = percolation and seepage losses, and G = gaseous losses(denitrification, NH 3 volatilization).
5. Is there evidence from long-term experiments, suggesting a rapid decline in soilindigenous P or K supplies, if fertilizer P or K was not applied'?The effect of negative nutrient balances on the degree of soil nutrient depletion canonly be reliably estimated, if data from long-term experiments are available. Ifimmediate crop responses to fertilizer P or K application are not expected and donot develop within 5-10 cropping seasons, maintenance rates may not even be nec-essary. Conditions should be re-evaluated every 5-10 years or sooner, if the cropmanagement changes or current yield levels are exceeded by about 0.5 t ha -I com-pared to current yield levels.
Materials and methods
The study site
Experimental sites were located in the Jinhua District, Zhejiang. The district has anirrigated rice area of about 146,000 ha which is about 87% of the total cultivated land.The climate is humid, warm continental with an annual rainfall of 1,300-1,500 mm.The selected 21 farms with sizes of 0.2 to 5 ha were located in seven villages and cov-ered a wide range of biophysical and socioeconomic conditions. Soils were mostly fer-tile with a clay loam to silty clay texture and a relatively high soil organic C content of15.5-23.0 g kg'. The pH ranged from 4.8-6.3 (median 5.3). The average cation ex-change capacity was low to moderate (6.9-16.3cmoc kg'). All farmers followed adouble rice-cropping system with early rice (ER, April to July, mostly inbred varieties)and late rice (LR, July to October, mostly hybrid rice). Rice is predominantly trans-planted with a density of 25 hills m-2 for early rice and 18 hills m 2 for late rice. Theclimate-adjusted yield potential is lower for ER than for LR (9-10 t ha' for early in-bred varieties versus 10-12 t ha-' for late hybrid rice) (ten Berge et al 1997; Zheng et
273

al 1997). Crops are harvested by hand (sickle), leaving only a little straw in the field orcombine-harvested, leaving moderate amounts of straw in the field, which is incorpo-rated.
On-farm experiments
In 1998 and 1999, on-farm experiments included a farner's fertilizer practice (FFP)and a site-specific nutrient management (SSNM) treatment. General crop and pestmanagement was performed entirely by farmers, and researchers only interfered bymanaging fertilizer nutrients in the experimental SSNM plot of 300-1000 m2 embed-ded in the farmer's field. Fertilizer recommendations for SSNM were based on themodel QUEFTS (Quantitative Evaluation of the Fertility of Tropical Soils) (Janssen etal., 1990; Witt et al., 1999), and calculated on a field- and crop-specific basis, consid-ering indigenous nutrient supply, economically sensible grain yield targets, corre-sponding nutrient demand, nutrient balance and estimates of fertilizer nutrient recoveryefficiencies (Wang et al., 2001; Dobermann et al., 2003d). Briefly, estimates of indige-nous nutrient supplies of N, P and K (INS, IPS, IKS) were derived from the nutrientaccumulation in the aboveground plant dry matter at physiological maturity as meas-ured in nutrient omission plots embedded in farmers' fields measured in the 1998 ERand LR. For example, plant N uptake in a +PK plot is used as an integrative measureof the indigenous N supply (INS, kg N ha-'). These INS, IPS, and IKS estimates wereused as model inputs and target yields were set at 7.2-8.0 t ha-' in ER and 7.5-8.5 t ha
in LR. This is equivalent to about 83-88% of the yield potential in ER and 75-85% inLR. The climatic yield potential was assumed to be 9 t ha- ' for ER and 10 t ha' for LR(Zheng et al., 1997). First crop recovery efficiencies of 0.4, 0.2 and 0.5 kg kg- ' wereassumed for fertilizer N, P and K, respectively. Fertilizer sources used were urea (46%N), single superphosphate (6.1% P) and muriate of potash (50% K). All P fertilizerwas incorporated into the soil before transplanting (100% basal). K fertilizer was splitinto 50% basal plus 50% at Pl.In 1998, N (urea) was applied in three splits at fixed growth stages (40% at I or 2 dbefore transplanting incorporated into soil, 20% topdressed at 14 DAT and 40% top-dressed at PI). Compared with most farmers' practices (two early applications only),this splitting already represented a more evenly distributed N application scheme. Re-sults obtained in 1998, however, suggested that further fine-tuning could be achievedby a more dynamic, plant-based N management. In 1999, therefore, fertilizer N wasapplied as two fixed applications and one or two more topdressings, depending onchlorophyll meter readings at the critical growth stages.Nutrient balances were calculated for P and K based on equation 5 given above. Sinceonly three of 21 farmers occasionally applied organic manure, the estimation of fertil-izer nutrient input (M) was entirely based on measured values of inorganic fertilizernutrients. Inputs from atmosphere (A) or water (W) were unknown, but we assumedthat they were equivalent to losses by leaching (PS) so that these three terms were notconsidered in our calculations. Farmers at the study site used river or reservoir waterwith presumably low nutrient concentrations for irrigation. Crop removal with grainand straw was measured for each crop cycle. The net amount of P and K returned tothe field from crop residues was deducted from the total removal assuming (1) a typi-cal percentage of straw remaining in the field and (2) a typical percentage of nutrientslost from the crop residues due to burning or leaching.The agronomic performance of SSNM was tested against the FFP in four croppingseasons in 1998 and 1999. Plant sampling followed a standard procedure (Witt et al.,
274
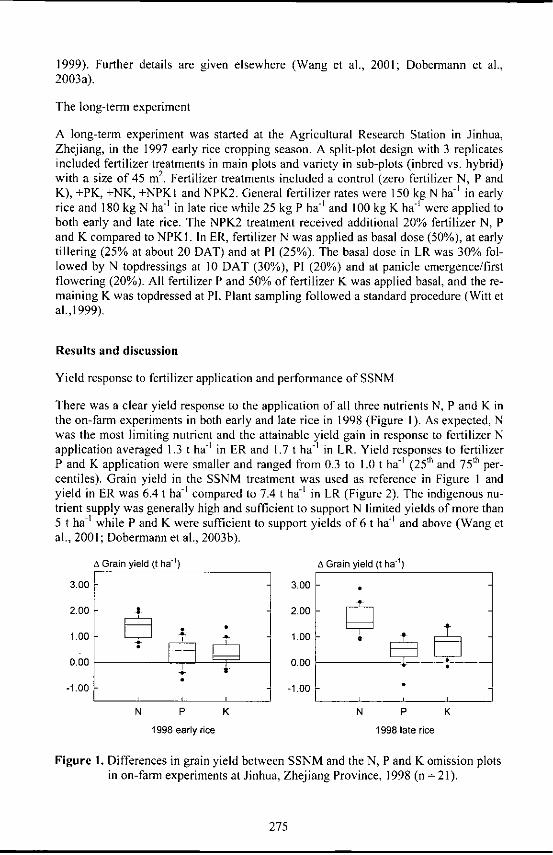
1999). Further details are given elsewhere (Wang et al., 2001; Dobermann et al.,2003a).
The long-term experiment
A long-term experiment was started at the Agricultural Research Station in Jinhua,Zhejiang, in the 1997 early rice cropping season. A split-plot design with 3 replicatesincluded fertilizer treatments in main plots and variety in sub-plots (inbred vs. hybrid)with a size of 45 m'. Fertilizer treatments included a control (zero fertilizer N, P andK), +PK, +NK, +NPKI and NPK2. General fertilizer rates were 150 kg N ha-' in earlyrice and 180 kg N ha-' in late rice while 25 kg P ha-' and 100 kg K ha' were applied toboth early and late rice. The NPK2 treatment received additional 20% fertilizer N, Pand K compared to NPKI. In ER, fertilizer N was applied as basal dose (50%), at earlytillering (25% at about 20 DAT) and at PI (25%). The basal dose in LR was 30% fol-lowed by N topdressings at 10 DAT (30%), PI (20%) and at panicle emergence/firstflowering (20%). All fertilizer P and 50% of fertilizer K was applied basal, and the re-maining K was topdressed at Pl. Plant sampling followed a standard procedure (Witt etal.,1999).
Results and discussion
Yield response to fertilizer application and performance of SSNM
There was a clear yield response to the application of all three nutrients N, P and K inthe on-farm experiments in both early and late rice in 1998 (Figure I). As expected, Nwas the most limiting nutrient and the attainable yield gain in response to fertilizer Napplication averaged 1.3 t ha' in ER and 1.7 t ha-' in LR. Yield responses to fertilizerP and K application were smaller and ranged from 0.3 to 1.0 t ha-' (2 5 th and 7 5 th per-centiles). Grain yield in the SSNM treatment was used as reference in Figure 1 andyield in ER was 6.4 t ha-' compared to 7.4 t ha- ' in LR (Figure 2). The indigenous nu-trient supply was generally high and sufficient to support N limited yields of more than5 t hat while P and K were sufficient to support yields of 6 t hd' and above (Wang etal., 2001; Dobermann et al., 2003b).
A Grain yield (t ha-') A Grain yield (t ha')
3.00 3.00
2.00 - 2.00 -1.00 t 100
0.00 0.00
-1.00 -1.00
N P K N P K
1998 early rice 1998 late rice
Figure 1. Differences in grain yield between SSNM and the N, P and K omission plotsin on-farm experiments at Jinhua, Zhejiang Province, 1998 (n = 21).
275

With SSNM, the yield increase over the -F plot in 1999 was comparable to the previ-ous year and yield was significantly higher than in FFP in all four seasons in 1998-1999 (Fig. 2). This was mainly attributed to an improved congruence of N applicationwith N demand (Wang et al., 2001). The SSNM concept evolved with time and yieldincreases over SSNM in the second year were achieved with significantly less fertilizerN, P and K (Fig. 2). The yield response to fertilizer P and K application in farmers'fields was small unless the N management was improved with SSNM. The averageprofit increase with SSNM was 88 US$ ha -' crop' (Wang et al., 2001).
98 a b c b - F: bb
ab
a Z NK
--6 "C d ba
NP- 5 FFP
Q55, 4 SSNM._ 3
2ofm
9ER 9LR 99ER 99LR
160 a 220 07 40 a 200a
a2 a a18100 Jb 160 ZZ 80 T 1406b_ 40120
40 100i20 1 1000 80
98E 98R 9ER 9LR 98E 98R 9ER 99LR
35 a 3530 a a 3025 tbT a a 25 ¢2 0 b, a b 20
25 15
Q 5 5i I'iZ 8
98ER 98LR 99E 99L 98 R 98 R 9ER 99LR180 I120F160[ a aI 1t. ° 014 0 - 90
0 900 bib 75 ,a 60
40FL_2 30
98ER 98LR 99ER 99LR 9AER 98LR 99ER 99LR
Figure 2. Grain yield, nutrient uptake and fertilizer rates of N, P and K in treatmentswith farmers' fertilizer practice (FFP) and site-specific nutrient management
(SSNM) in Jinhua, Zhejiang Province, China, 1998-1999. Additional treat-ments included fertilizer omission plots without N, P and K application (-F)in 1998-1999 and without P (+NK) and K application (+NP) in 1998. ER -early rice; LR - late rice. Bars = mean; error bars = standard deviation.Means with the same letter within a season are not significantly different atP<0.05 (LSD).
276
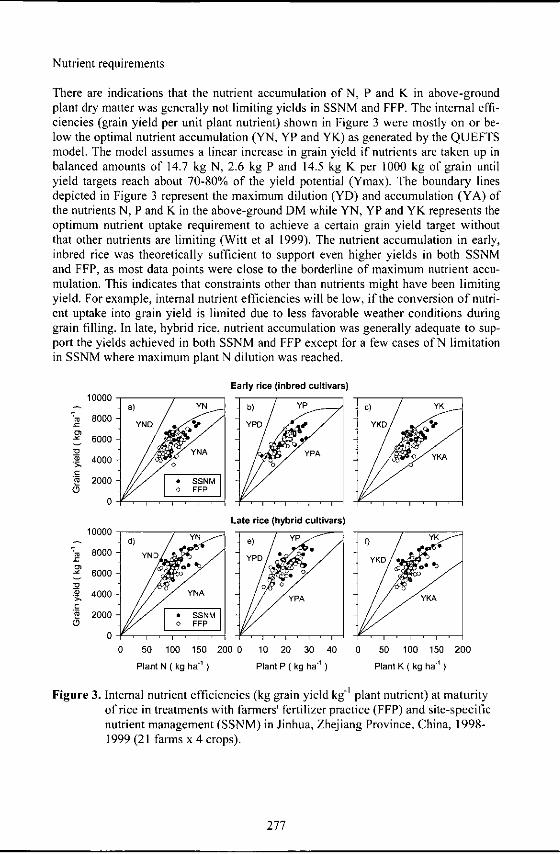
Nutrient requirements
There are indications that the nutrient accumulation of N, P and K in above-groundplant dry matter was generally not limiting yields in SSNM and FFP. The internal effi-ciencies (grain yield per unit plant nutrient) shown in Figure 3 were mostly on or be-low the optimal nutrient accumulation (YN, YP and YK) as generated by the QUEFTSmodel. The model assumes a linear increase in grain yield if nutrients are taken up inbalanced amounts of 14.7 kg N, 2.6 kg P and 14.5 kg K per 1000 kg of grain untilyield targets reach about 70-80% of the yield potential (Ymax). The boundary linesdepicted in Figure 3 represent the maximum dilution (YD) and accumulation (YA) ofthe nutrients N, P and K in the above-ground DM while YN, YP and YK represents theoptimum nutrient uptake requirement to achieve a certain grain yield target withoutthat other nutrients are limiting (Witt et al 1999). The nutrient accumulation in early,inbred rice was theoretically sufficient to support even higher yields in both SSNMand FFP, as most data points were close to the borderline of maximum nutrient accu-mulation. This indicates that constraints other than nutrients might have been limitingyield. For example, internal nutrient efficiencies will be low, if the conversion of nutri-ent uptake into grain yield is limited due to less favorable weather conditions duringgrain filling. In late, hybrid rice, nutrient accumulation was generally adequate to sup-port the yields achieved in both SSNM and FFP except for a few cases of N limitationin SSNM where maximum plant N dilution was reached.
Early rice (inbred cultivars)10000
a) YN b) YP YK8000 -
YND '*p YPID 0 YKD 1d
6000:2YNA YPAoy'
40000 0
C
"y 2000
Late rice (hybrid cultivars)10000 -
d) YN e) YP0YK8 8000 - YND YPD YKD*
6000 0
.0 4000 -YNAYPA YKA
2 2000 -SN0~~ ~~ FFP '('k(D 0
0 50 100 150 200 0 10 20 30 40 0 50 100 150 200
Plant N ( kg ha 1 ) Plant P ( kg ha ) Plant K ( kg ha-'
Figure 3. Internal nutrient efficiencies (kg grain yield kg-' plant nutrient) at maturityof rice in treatments with farmers' fertilizer practice (FFP) and site-specificnutrient management (SSNM) in Jinhua, Zhejiang Province, China, 1998-1999 (21 farms x 4 crops).
277

5000 YNA Optimal YND 80 YNA Optimal YND1" 70 1 I
III4000 "-1IM 60 1
3000 e I 50 1
(92000 I z 40
>Z 1000 I Z 200 I.P I 0 I
0 ----- 040 60 80 100 120 40 60 80 100 120
Internal N efficiency in -F plots (kg kg- ) Internal N efficiency in -F plots (kg kg 1 )
YPA Optimal YPD YPA Optimal YPD2000 s- 16 __ YPI I -I
141500I
S12
00 4 1000 200 10 4 6 8 1
200 8
I>* 70I
.1: I •
500I I 0 .
20 40 60 00 1 4020 40 60 00 10
.4
29 000 I 80I DI I • I
0"7
=z 15 0 I I Z ID_ IL-5 00 0
00 600 8000 120 10 400 60 0 00 120 100
Internal K efficiency in NP plots (kg kg") Internal K efficiency in NK plots (kg kg-)
200 I 80
du ofetlze ,PIn aplcto ove thI epcie msinpo
(500 i N ir n th t NP a i
100 6 01010104 0 8 0 2 4
plots, long-term experiment, Jinhua, 1998-1999.
In conclusion, internal nutrient efficiencies seemed to be a poor indicator of nutrientlimitation because yield increases with SSNM were associated with significant in-creases of plant nutrient uptake of N (+8%), P (+13%) and K (+10%) as shown in Fig-ure 2. Thus, the yield advantage with SSNM appeared to be related to greater nutrient
278

uptake without that internal nutrient efficiencies changed much. However, internal nu-trient efficiencies of crops grown in nutrient omission plots may be a useful indicatorof P and K limitations. The relationship between yield and nutrient uptake increasesdue to fertilization and internal nutrient efficiencies in omission plots is depicted inFigure 4. Yield and nutrient uptake responses to fertilizer P and K application weregenerally low when internal efficiencies in omission plots were near optimal levels.Yield responses to fertilizer P and K application increased when P and K uptake wereclose to the borderline of nutrient dilution (YPD, YKD). This relationship does notseem to hold for N, as substantial yield responses to fertilizer N application were evenobserved when internal N efficiencies were close to optimal levels in -F plots. A largerdata set would be required to better evaluate these relationships.
Nitrogen efficiencies
Average yield increases of 0.45 t ha-I with SSNM were achieved despite a reduction infertilizer N rates by 21% compared to FFP (133 vs. 167 kg ha'). Thus, the agronomicN efficiency (kg grain yield per kg fertilizer N) in SSNM was on average about 80%higher (11.4 vs. 6.3 kg kg ') compared to FFP (Figure 5).
• , ,-1
Recovery efficiency (REN, kg kg-1 ) Physiological efficiency (PEN, kg kg)
0.7 - P=o.i9s8 P=0.089 P=OMOOO P=000 70 P=O. 114 P=C820 P=0,773 P=0,203
0.6 60
0.5 50
0.4 - 40 -
0.3 J 300.2 L 200.1 K 100.0 0
98ER 98LR 99ER 99LR 98ER 98LR 99ER 99LR
Agronomic efficiency (AEN, kg kg- )
21 - P=O 001 P-01006 P=O.000 P=O.000 Farmers' fertilizer practice (FFP)1 Site-specific nutrient management
18 -(SSNM)
15
12
9
6
3
098ER 98LR 99ER 99LR
Figure 5. Recovery efficiency (increase in plant N per kg fertilizer N applied),physiological efficiency (increase in grain yield per unit increase in plantN), and agronomic efficiency (increase in grain yield per unit fertilizer Napplied) in treatments with farmers' fertilizer practice (FFP) and site-specific nutrient management (SSNM) in Jinhua, Zhejiang Province,China, 1998-1999 (21 farms). ER = early rice; LR = late rice.
279

In other words, more grain was produced per unit fertilizer N applied. This corre-sponded to an average increase in fertilizer recovery efficiency from 19 to 29% withSSNM, which was mainly due to a better congruence of N supply with plant demand(Wang et al., 2001). The physiological N efficiency (kg grain yield increase per in-crease in plant N) remained largely unchanged with SSNM just like the internal effi-ciency was not much affected (Figure 5). While the physiological N use efficiencies inthe on-farm experiments at Jinhua were comparable to those of other sites (Dobermannet al., 2002), average recovery efficiencies (29%) and agronomic efficiencies (11.4 kgkg-') were generally low in SSNM treatments compared with the 40-50% REN and 20-25 kg kg-' AEN that can be reached with good crop and nutrient management. TheSSNM strategy employed in 1998-1999 included relatively large early season applica-tions of fertilizer N, which reduces N efficiencies but stimulates tillering before farm-ers practice a mid-season drainage prior to panicle initiation. With increasing experi-ence, however, N management was further fine tuned in 2000 and 2001, resulting inincreased N efficiencies of 30-40% for REN and 15-18 kg kg-' for AEN (RTOP un-published). However, fertilizer N requirements in the rice systems of Jinhua may stillbe closer to 60 kg fertilizer N per ton grain yield increase, which is substantially largerthan the 40-50 kg per ton recommended under optimal conditions (Witt et al., 2002a).
Nutrient balances
The nutrient balances for the on-farm experiments in 1998-1999 given in Table Ishowed a net P removal with grain and straw in SSNM (-5 kg ha' crop') while P sup-ply and removal were well balanced in FFP (+1 kg P ha-'crop'). This was mainly dueto an increase in P removal with grain and straw due to higher yields in SSNM (seeFigure 2), while fertilizer P rates were at the same time reduced by an average of 4 kgha -' crop- ' compared to FFP (15 vs. 19 kg P ha-' crop ' (see Figure 2)).
Table 1. Nutrient balances for P and K in treatments with site-specific nutrient man-agement (SSNM) and farmers' fertilizer practice (FFP) in 21 farmers' fieldsin Zhejiang Province, China, (1998-99). ER -early rice; LR -late rice.
Year and season Mean of all1998 ER 1998 LR 1999 ER 1999 LR fourcrops
P balance SSNM -1 -12 -3 -3 -5(kg ha - ' crop') FFP -4 -6 9 6 1
Aa 3 -6 -12 -9 -6P>IT 0.312 0.066 0.000 0.001 0.000
K balance SSNM -12 -31 -31 -47 -30(kg ha -' crop') FFP -35 -37 -20 -17 -27
Aa 23 6 -11 -30 -3P>IT 0.038 0.646 0.374 0.000 0.575
A - SSNM - FFP. P>JT - probability of a significant mean difference betweenSSNM and FFP.
In 1999, fertilizer P rates were even 9 kg P ha- crop-' smaller with SSNM (13 vs. 22kg P ha -' crop'). Although fertilizer P rates were insufficient to fully balance P re-moval with grain and straw in SSNM, there was good evidence from internal P use ef-ficiencies and increased P uptake that smaller P rates were sufficient to support the tar-
280
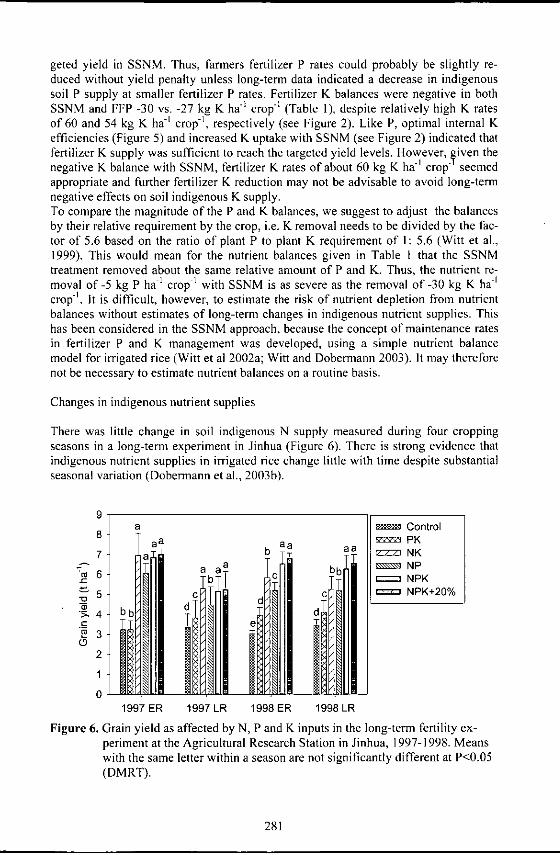
geted yield in SSNM. Thus, farmers fertilizer P rates could probably be slightly re-duced without yield penalty unless long-term data indicated a decrease in indigenoussoil P supply at smaller fertilizer P rates. Fertilizer K balances were negative in bothSSNM and FFP -30 vs. -27 kg K ha1 crop' (Table 1), despite relatively high K ratesof 60 and 54 kg K hat crop', respectively (see Figure 2). Like P, optimal internal Kefficiencies (Figure 5) and increased K uptake with SSNM (see Figure 2) indicated thatfertilizer K supply was sufficient to reach the targeted yield levels. However, fiven thenegative K balance with SSNM, fertilizer K rates of about 60 kg K ha' crop n seemedappropriate and further fertilizer K reduction may not be advisable to avoid long-termnegative effects on soil indigenous K supply.To compare the magnitude of the P and K balances, we suggest to adjust the balancesby their relative requirement by the crop, i.e. K removal needs to be divided by the fac-tor of 5.6 based on the ratio of plant P to plant K requirement of I: 5.6 (Witt et al.,1999). This would mean for the nutrient balances given in Table I that the SSNMtreatment removed about the same relative amount of P and K. Thus, the nutrient re-moval of-5 kg P ha ' crop ' with SSNM is as severe as the removal of -30 kg K ha I
crop'. It is difficult, however, to estimate the risk of nutrient depletion from nutrientbalances without estimates of long-term changes in indigenous nutrient supplies. Thishas been considered in the SSNM approach, because the concept of maintenance ratesin fertilizer P and K management was developed, using a simple nutrient balancemodel for irrigated rice (Witt et al 2002a; Witt and Dobermann 2003). It may thereforenot be necessary to estimate nutrient balances on a routine basis.
Changes in indigenous nutrient supplies
There was little change in soil indigenous N supply measured during four croppingseasons in a long-term experiment in Jinhua (Figure 6). There is strong evidence thatindigenous nutrient supplies in irrigated rice change little with time despite substantialseasonal variation (Dobermann et al., 2003b).
9a Control
8aa aa P
7 b aa NK
'a 6 8a~NPKa bb NP
d NPK+20%5 C
, 4 1)b
S3
2
0 ....
1997 ER 1997 LR 1998 ER 1998 LR
Figure 6. Grain yield as affected by N, P and K inputs in the long-term fertility ex-periment at the Agricultural Research Station in Jinhua, 1997-1998. Meanswith the same letter within a season are not significantly different at P<0.05(DMRT).
281

More important for the development of adequate SSNM recommendations are me-dium- or long-term changes in indigenous P and K supplies. Yield differences between-P (NK plots), -K (NP plots) and plots with full fertilizer N, P and K application wereinsignificant in the first season in Jinhua (Figure 6). Starting with the LR 1997, how-ever, a significant yield response to fertilizer P and K application evolved with time,indicating that maintenance applications of fertilizer P and K rates are clearly requiredto prevent a degradation of soil indigenous P and K supplies, even if a yield responsewas not observed in the first season. In 1998 LR, the yield response to fertilizer P andK application was about I t ha'. There was no effect on yield when additional 20%fertilizer N, P and K were applied.Instead of using a single long-term experiment, multiple on-farm omission plots dis-tributed in a larger area may be more representative to estimate long-term changes inindigenous P and K supplies. If a yield response was not observed in the first one ortwo seasons, the location of the omission plots could be fixed to estimate whether anutrient response would develop within a few seasons without fertilizer application.Such stationary long-term omission plots would have a different purpose than the tem-porary omission plots used to develop fertilizer P and K recommendations as recentlysuggested for the simplified SSNM approach (Witt et al., 2002a; Dobermann et al.,2003c).
Conclusions
Plant based performance indicators were successfully used to develop, evaluate andrefine a novel site-specific nutrient management strategy in Jinhua, Zhejiang Province.Results indicate that a range of parameters would be necessary to fully evaluate andfine-tune nutrient management strategies. Several nutrient efficiency parameters wererequired to fully isolate the causes of yield increases with SSNM compared to thefarmers' fertilizer practice, including internal nutrient efficiencies, recovery efficien-cies of applied fertilizer N, physiological N use efficiencies and agronomic N use effi-ciencies. These allowed to separate out effects whether yield increases were due to in-creased nutrient uptake, recovery of applied fertilizer N or the efficiency with whichnutrient uptake is translated into grain yield. The most relevant parameter for extensionpurposes is probably the agronomic efficiency (grain yield increase per unit fertilizer Napplied), since only grain yield measurements would be required in plots with andwithout N fertilizer application. Omission plots can be used to both relate fertilizer re-quirements to yield increases and visually demonstrate nutrient limitations to farmers.Nutrient balances might give some indications whether nutrient management strategieswould bear the risk of nutrient depletion with time. This would be of particular interestwhere yield responses to fertilizer P and K application are less clear and maintenanceapplications are to be recommended. However, final conclusions on whether negativenutrient balances can be sustained for longer periods without yield penalties can onlybe drawn from long-term experiments. The intensity of declining soil indigenous P andK supply without fertilizer application could be estimated from single, replicated on-station or multiple on-farm experiments with omission plots at fixed locations. If yieldresponses occur within few cropping seasons, maintenance applications of fertilizer Pand K should be recommended, even if an immediate yield response is not expected.The presented data strongly suggest that several cropping seasons of on-farm trails arerequired to develop meaningful and economically sensible fertilizer recommendations.
282

Acknowledgments
We wish to thank Ms. M.A. Adviento (IRRI) for her help with the soil and plant analy-sis and Mr. G.C. Simbahan (IRRI) for help with data management and statisticalanalysis. We acknowledge contributions made by scientists involved in this research,Professor C. Huang and Dr. Y. He of Zhejiang University and Mr. X Ding and Mr. J.Wu of Agricultural Bureau of Jinhua. The International Fertilizer Industry Association(lFA), the Potash and Phosphate Institute Canada (PPIC) and the International PotashInstitute (IPI) provided funding for the research project.
References
Balasubramanian V, Morales AC, Cruz RT, Abdulrachman S. 1999. On-farm adapta-tion of knowledge-intensive nitrogen management technologies for rice systems.Nutr.Cycl.Agroecosyst. 53:59-69.
Cassman KG, Peng S, Olk DC, Ladha JK, Reichardt W, Dobermann A, Singh U. 1998.Opportunities for increased nitrogen use efficiency from improved resource man-agement in irrigated rice systems. Field Crops Res. 56:7-39.
Dobermann A, Fairhurst T. 2000. Rice: Nutrient disorders and nutrient management.Singapore and Los Bafios: Potash & Phosphate Institute (PPI), Potash & PhosphateInstitute of Canada (PPIC) and International Rice Research Institute (IRRI). p 1-191.
Dobermann A, Simbahan CC, Moya PF, Witt C, Dawe D. 2003a. Methodology forsocioeconomic and agronomic on-farm research in the RTDP project. In: Dober-mann A, Witt C, Dawe D, editors. Increasing the productivity of intensive rice sys-tems through site-specific nutrient management. New Delhi (India) and Los Bafios(Philippines): Science Publishers and International Rice Research Institute (IRRI)(In press).
Dobermann A, White PF. 1999. Strategies for nutrient management in irrigated andrainfed lowland rice systems. Nutr. Cycl. Agroecosyst. 53:1-18.
Dobermann A, Witt C, Abdulrachman S, Gines HC, Nagarajan R, Son TT, Tan PS,Wang GH, Chien NV, Thoa VTK, Phung CV, Stalin P, Muthukrishnan P, Ravi V,Babu M, Simbahan GC, Adviento MA. 2003b. Soil fertility and indigenous nutrientsupply in irrigated rice domains of Asia. Agron.J. (in press)
Dobermann A, Witt C, Abdulrachman S, Gines HC, Nagarajan R, Son TT, Tan PS,Wang GH, Chien NV, Thoa VTK, Phung CV, Stalin P, Muthukrishnan P, Ravi V,Babu M, Simbahan GC, Adviento MA, Bartolome V. 2003c. Estimating indigenousnutrient supplies for site-specific nutrient management in irrigated rice. Agron.J. (inpress)
Dobermann A, Witt C, Dawe D. editors. 2003d. Increasing the productivity of inten-sive rice systems through site-specific nutrient management. New Delhi, India andMakati City, Philippines: Science Publishers and International Rice Research Insti-tute (IRRI) (In press).
Dobermann A, Witt C, Dawe D, Abdulrachman S, Gines HC, Nagarajan R, Satawa-thananont S, Son TT, Tan CS, Wang GH, Chien NV, Thoa VTK, Phung CV, StalinP, Muthukrishnan P, Ravi V, Babu M, Chatuporn S, Sookthongsa J, Sun Q, Fu R,Simbahan CC, Adviento MAA. 2002. Site-specific nutrient management for inten-sive rice cropping systems in Asia. Field Crops Res. 74:37-66.
283

Janssen BH, Guiking FCT, van der Eijk D, Smaling EMA, Wolf J, van Reuler H.1990. A system for quantitative evaluation of the fertility of tropical soils(QUEFTS). Geoderma. 46:299-318.
ten Berge HFM, Shi Q, Zheng Z, Rao KS, Riethoven JIM, Zhuong X. 1997. Numeri-cal optimization of nitrogen application to rice. Part II. Field evaluations. FieldCrops Res. 51:43-54.
Wang GH, Dobermann A, Witt C, Sun QZ, Fu RX. 2001. Performance of site-specificnutrient management for irrigated rice in southeast China. Agron.J. 93:869-878.
Witt C. 2003. Principles of site-specific phosphorus and potassium management in ir-rigated rice. Paper presented at the workshop on P and K recommendation for Rice,Solo, Indonesia, 2-3 October2002. AIAT Central Java: Solo, Indonesia. p 1-11.
Witt C, Balasubramanian V, Dobermann A, Buresh RJ. 2002a. Nutrient management.In: Fairhurst T, Witt C, editors. Rice: a practical guide for nutrieht management.Singapore and Los Bafios: Potash and Phosphate Institute & Potash and PhosphateInstitute of Canada and International Rice Research Institute. p 1-45.
Witt C, Buresh RJ, Balasubramanian V, Dawe D, Dobermann A. 2002b. Improvingnutrient management strategies for delivery in irrigated rice in Asia. Better CropsInt. 16-2:10-17.
Witt C , Dobermann A. 2003. A decision support system for site-specific nutrientmanagement. In: Dobermann A, Witt C, Dawe D, editors. Increasing productivity ofintensive rice systems through site-specific nutrient management. New Delhi, Indiaand Makati City, Philippines: Science Publishers and International Rice ResearchInstitute (IRRI) (In press).
Witt C, Dobermann A, Abdulrachman S, Gines HC, Guanghuo W, Nagarajan R, Sa-tawathananont S, Tran Thuc Son, Phan Sy Tan, Le Van Tiem, Simbahan GC, OlkDC. 1999. Internal nutrient efficiencies in irrigated lowland rice of tropical and sub-tropical Asia. Field Crops Res. 63:113-138.
Yang W-H, Peng S, Sanico AL, Buresh RJ, Witt C. 2003. Estimation of leaf nitrogenstatus using leaf color charts in rice. Agron.J. 95:212-217.
Zheng Z, Yan L, Wang ZQ. 1997. Simulation of potential production and studies onoptimum quantitative population indices of hybrid rice. J.Zhejiang Agric. Univer-sity. 23:59-64.
284

"Cascade" Experiment on fertilizer efficiency and nutrient balance
Xi Zhenbang
Soil and Fertilizers Institute of Shanghai Academy of Agricultural Science 201106
Abstract
A crop response experiment with 4 treatments (CK: no-fertilization, OM: organic ma-nure, MF: mineral fertilizer and OF: organic manure + mineral fertilizer) was carriedout under a three-crop-per-year rotation system for three years in a row. The experi-ment was designed in a cascade pattern. At the beginning of each crop, a new treat-ment was laid out adjacent to the original treatment plot to ensure the treatments woulddevelop continuously in a cascade pattern. The initial results show that under differentfertilization treatments both crop yield as well as the N, P and K uptake declined withtime. The decline was most pronounced in CK (no-fertilization). Meanwhile, the nutri-ent recovery rate showed an upward trend with time, especially those nutrients sup-plied by organic manure. For the first crop, the N recovery from applied fertilizer was28.9% in treatment MF and 11.7% in treatment OM. The cumulative N recovery offour crops rose to 36.2% in treatment MF and 26.9% in treatment OM, showing that
the cumulating nutrient efficiency of organic manure is high. A comparison of the nu-trient consumption was also conducted between the three-cropping-per-year and the
two-cropping-per-year rotation system.
Introduction
Response to nutrient application, independent on source either from organic manure ormineral fertilizer, is often influenced by the residual effects of the management to thepreceding crop. This not only applies to observed yield differences but also to assessednutrient use efficiencies. It may be assumed that a comparison of different fertilizertreatments over several years shows increasingly cumulative effects and it may be dif-ficult to interpret the observation. This applies particularly to the question of nutrientefficiency calculations based on annual rates of fertilizers applied . To separate imme-diate and cumulative response to nutrient application, but also in order to assess theutilization of nutrients from either organic manure or mineral fertilizer, a specific triallayout was necessary. Therefore, during the period from 1979 to 1981, a continuousfixed location fertilizer efficiency experiment was designed in a cascade pattern. Theselected locations were situated on three typical paddy soils in the suburbs of Shanghaiand the tested crops were early rice, late rice and barley in a three-crop rotation system.The experiment lasted three years, involving eight crops. Plant samples and corre-sponding soil samples were collected for analysis. In this paper the results obtainedduring the cultivation of the first four crops are presented.
285
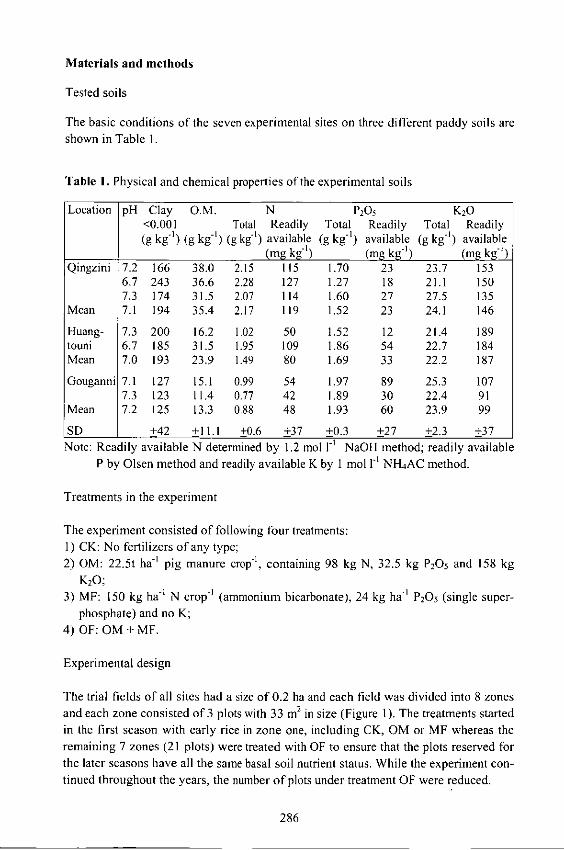
Materials and methods
Tested soils
The basic conditions of the seven experimental sites on three different paddy soils areshown in Table 1.
Table I. Physical and chemical properties of the experimental soils
Location pH Clay O.M. N P205 K20<0.001 Total Readily Total Readily Total Readily(g kg -') (g kg -') (g kg- 1) available (g kg -1) available (g kg j ) available
(mg kg (mg kg - ) (mg kg 1)
Qingzini 7.2 166 38.0 2.15 115 1.70 23 23.7 1536.7 243 36.6 2.28 127 1.27 18 21.1 1507.3 174 31.5 2.07 114 1.60 27 27.5 135
Mean 7.1 194 35.4 2.17 119 1.52 23 24.1 146
Huang- 7.3 200 16.2 1.02 50 1.52 12 21.4 189touni 6.7 185 31.5 1.95 109 1.86 54 22.7 184Mean 7.0 193 23.9 1.49 80 1.69 33 22.2 187
Gouganni 7.1 127 15.1 0.99 54 1.97 89 25.3 1077.3 123 11.4 0.77 42 1.89 30 22.4 91
Mean 7.2 125 13.3 0.88 48 1.93 60 23.9 99
SD +42 +11.1 +0.6 +37 +0.3 +27 +2.3 +37Note: Readily available N determined by 1.2 mol I-' NaOH method; readily available
P by Olsen method and readily available K by 1 mol I-' NH 4AC method.
Treatments in the experiment
The experiment consisted of following four treatments:
I) CK: No fertilizers of any type;2) OM: 22.5t ha-' pig manure crop-1, containing 98 kg N, 32.5 kg P20 5 and 158 kg
K20;3) MF: 150 kg ha -' N crop' (ammonium bicarbonate), 24 kg ha' P20 5 (single super-
phosphate) and no K;4) OF: OM + MF.
Experimental design
The trial fields of all sites had a size of 0.2 ha and each field was divided into 8 zonesand each zone consisted of 3 plots with 33 m2 in size (Figure 1). The treatments startedin the first season with early rice in zone one, including CK, OM or MF whereas theremaining 7 zones (21 plots) were treated with OF to ensure that the plots reserved forthe later seasons have all the same basal soil nutrient status. While the experiment con-tinued throughout the years, the number of plots under treatment OF were reduced.
286
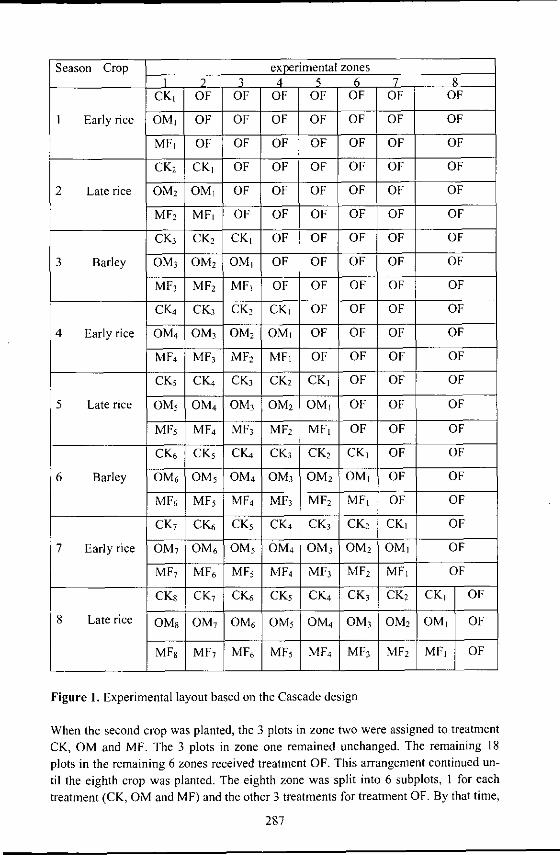
Season Crop experimental zonesI 2 3 4 5 6 7 8
CK OF OF OF OF OF OF OF
I Early rice CMI OF OF OF OF OF OF OF
MFI OF OF OF OF OF OF OF
CK 2 CK, OF OF OF OF OF OF
2 Late rice OM2 OM1 OF OF OF OF OF OF
MF 2 MF OF OF OF OF OF OF
CK3 CK 2 CK, OF OF OF OF OF
3 Barley OM3 OM2 OM, OF OF OF OF OF
MF3 MF 2 MF OF OF OF OF OF
CK4 CK 3 CK2 CK, OF OF OF OF
4 Early rice OM4 UM 3 OM2 OM, OF OF OF OF
MF 4 MF 3 MF 2 MFi OF OF OF OF
CK5 CK 4 CK 3 CK 2 CK, OF OF OF
5 Late rice OM5 OM 4 OM 3 OM 2 OMI OF OF OF
MF5 MF 4 MF 3 MF 2 MF, OF OF OF
CK 6 CK 5 CK4 CK 3 CK 2 CKI OF OF
6 Barley OM 6 OM 5 OM4 OM3 OM 2 OMI OF OF
MF 6 MF 5 MF 4 MF 3 MF 2 MF OF OFCK 7 CKQ CK 5 CK4 CK 3 CK 2 CKi OF
7 Early rice UM 7 OM 6 OM 5 OM 4 OM 3 OM 2 OMI OF
MF7 MF 6 MF 5 MF 4 MF 3 MF 2 MF 1 OF
CK8 CK 7 CK6 CK5 CK4 CK 3 CK 2 CK, OF
8 Late rice OM8 OM 7 OM 6 OM 5 OM 4 OM3 OM 2 0M OF
MF 8 MF 7 MF6 MF 5 MF 4 MF 3 MF 2 MFi OF
Figure 1. Experimental layout based on the Cascade design
When the second crop was planted, the 3 plots in zone two were assigned to treatment
CK, OM and MF. The 3 plots in zone one remained unchanged. The remaining 18
plots in the remaining 6 zones received treatment OF. This arrangement continued un-
til the eighth crop was planted. The eighth zone was split into 6 subplots, I for each
treatment (CK, OM and MF) and the other 3 treatments for treatment OF. By that time,
287

7 crops had been grown successively on zone one under the treatment CK, OM andMF. The aim of the design was to achieve the mean values of a multi-point stationaryexperiment under large-scale field production conditions. Then by using the differen-tial technique, the evolution trend of continuous effect, residual effects, recovery rateof fertilizers and soil productivity were analysed. As the number of treatment replica-tions of the experiment rose in synchrony with the number of crops, the whole experi-ment developed in a cascade pattern.
Field management and sampling
The crops used in the experiment were local cultivars and managed according to thelocal traditional practice except for fertilization. In each plot, a sampling patch of I m2
was installed for collecting samples of soils and plants during the growing period.Samples from organic manure for each crop were collected and immediately analyzed.The nutrient contents in organic manure, soils and plants were determined by conven-
tional methods.
Results and Discussion
Based on the mean values of the first four crops on the 7 sites of the experiment, cropyield, fertilizer efficiency, after-effects of fertilizers, soil productivity and nutrient bal-
ances are presented and discussed.
Crop yield
The crop yield of the CK can be used to determine the indigenous nutrient supply atthe beginning of the experiment. The yield increment of OM and MF to CK reflectsthe nutrient application effect. It shows that the inherent soil fertility was rather high.However, the total yield of the whole rotation in CK was only 73% of the yield in OF,reaching a total of 16.4 t ha-' yr- (Table 2).
Table 2. Crop yields of different treatments
Treatment Yield (t ha<) Total YieldEarly rice Late rice Barley Total (%)
CK 5.26 4.61 2.13 12.0 73OM 5.52 4.85 2.75 13.1 80MF 6.58 5.77 3.26 15.6 95OF 6.61 5.92 3.84 16.4 100
In Table 2, fertilizer efficiency is determined based on the total production of the threecrops per year. The production in CK reflects the inherent soil productivity, beingabout 73% of the fertilized plots in this experiment. The efficiency of organic manure
288

and mineral fertilizers was 7% and 22%, respectively, while the combined fertilizerefficiency of organic manure plus mineral fertilizers was 27%. The grain production intreatment OF was 5% greater than that in treatment MF, what can be attributed to theeffect of organic manure. The comparison of early rice with barley shows that earlyrice where the yield in the control (CK) was 80% of that of treatment OF could benefitmore from the inherent soil fertility than barley where the yield in treatment CK wasonly 55%. The poor productivity of barley in this treatment may be attributed to thelow mean temperature below 200 C during the growing period. Low temperature re-duces obviously the plant's access to inherently available nutrients in the soil.The observation of successive yield responses in different fertilization treatments re-vealed that the yield response of barley dropped most dramatically from OF to CK andmuch less in early rice. Whereas in early rice an additional yield increase of 15-20%through mineral fertilization (MF) compared to organic manure (OM) was observed,the yield increment in barley in the same comparison was much less (10% increase).This indicates that in a typical upland crop like wheat stronger yield response to or-ganic manure was observed than in irrigated rice (Table 3).
Table 3. Yields of crops and relative yields (OF = 100) of early rice and barley undercontinuous treatments
Early rice BarleyS* CK OM MF CK OM MF
(t ha*') (%**) (t ha -') (%*) t ha') (%) (t ha-i') (%) (t ha) (%) (t ha - ) (%)I 3.78 65 4.28 74 5.44 94 2.13 55 2.75 72 3.26 852 3.56 61 4.23 73 5.51 95 1.79 47 2.30 60 3.13 823 3.36 58 4.08 70 5.36 92 1.64 43 2.24 58 3.02 794 3.23 55 4.02 69 4.99 86
*Number of season,**: The yield in treatment OF taken as 100% was 3.84 t ha' for barley and 5.82 t ha-
for early rice.
As the yields in CK declined with the number of crops grown, the yield gap betweenCK and OF widened. After 3 consecutive crops, the yield in CK was only 50% of thatin OF, indicating that the third crop's yield had to rely to 50 % on fertilizers. The yieldin MF, though being reduced compared to that in OF, was much larger than that inOM. Thus, it is clearly indicated that a systematic consecutive fertilization (mineralfertilizers and organic manure) is needed to raise crop yield and to build up and main-tain soil fertility. Furthermore, mineral fertilizer, just like organic manure, caused af-ter-effects, showing that the succeeding crop benefited from previous nutrient applica-tion to the preceding crop (Table 4). The variation of crop response of the 4 consecu-tive crops to fertilization in different treatments was increasing with the duration ofcropping on the same plot. In CK, the relative yield dropped from 79% to 55%, thefastest among the four treatments. In OM, the relative yield decreased from 83% to69% or 10 points. The comparison of the relative yields in OM with those in CKshowed that crop response rose from 4% in the first crop to 14% in the fourth crop,
289

reflecting a quite significant residual effect. In MF, the relative yield declined from98% to 86% at a rate much less than that in CK. The relative yield of the fourth crop inMF was 86% or 31% larger than that of the fourth crop in CK and 12% larger than thedifference between the treatments in relative yield of the first crop. Obviously, the dif-ference of 12% can be taken as residual effect of the consecutive application of min-eral fertilizers which is reflected in the yield.
Table 4. Crop responses in consecutive cropping under different fertilizationtreatments (%)
Treatment Early rice Late rice Barley Early rice(1st crop) (2nd crop) (3 r crop) (4
t h crop)Rel. yield Rel. yield Rel. yield Rel. yield
CK 79 64 43 55OM 83 70 58 69MF 98 92 79 86OF 100 100 100 100Note: Rel. yield is the yield in % of OF which has been set 100.
The difference between OF and MF in relative yield which is small for the first crop ofearly rice can be considered as the contribution of organic manure applied to the samecrop. The relative yield in OF minus that in OM can be regarded as the contribution ofthe mineral fertilizer applied to the same crop. The contribution of mineral fertilizerhas been calculated as 17% for the first crop of early rice. When the experiment wenton to the third crop of barley, the yield contribution of organic manure increased toabout 21% and that of mineral fertilizers to 42%. Consequently, in order to evaluatethe effect of mineral fertilizers on crop yield, it is necessary to determine both the yieldincrement of the current crop (grain increased kg-1 nutrients) and the after-effects byanalysing the yield increments of the succeeding crops to obtain an idea about the fer-tilizer efficiency over years.
Nutrient uptake
Fertilizer efficiency of the different treatments was also determined by using the cropnutrient uptake. In CK, the uptake of N reached 60%, that of P 71% and that of K 68%in comparison to OF (set as 100%). The nutrient uptake by the third crop in CK de-creased to 35% for N, 39% for P and 38% for K compared to OF. That means if nofertilizer was applied to three consecutive crops, depending on the nutrient, the soilcould only supply between 35- 38% of the requirements of the crop (Table 5).One of the main causes for reduced nutrient uptake, especially that of K which hasbeen faster than the reduction in crop yield, is that with less reduction in biomass pro-duction, the nutrient content in the dry matter became diluted. There were clear differ-ences in the nutrient concentrations between plant organs. In the grains, the K content
290

dropped only slightly whereas it dropped drastically in the straw by about 25%. Thisshows that the plant gives priority to K supply of the grains. There, the reduced nutri-ent uptake may lead to a decrease in the protein content as well as K and other miner-als which will reduce the nutritional value of the product. Consequently, improvingfertilization raises both yield and nutrient uptake of the crop, thus bringing more nutri-ents into the cycle of the biosphere that includes both man and animal.
Table 5. Nutrient uptake by crops as affected by fertilization
Crop Treatment N P K(kg ha") (%) (kg ha-') (%) (kg ha') (%)
Early rice CK 78.8 60 18.8 71 119 68(I" crop) OM 87.0 66 20.3 77 131 75
MF 131.0 99 25.4 97 179 102OF 132.0 100 26.3 100 175 100
Late rice CK 47.2 49 11.4 61 44.2 47(2 d crop) OM 52.9 55 11.7 62 54.7 58
MF 90.0 94 18.5 98 84.8 87OF 96.0 100 18.8 100 94.5 100
Barley CK 24.8 35 6.53 39 23.3 38(3m crop) OM 35.2 50 11.6 69 35.3 58
MF 60.1 85 11.6 69 45.1 74OF 70.3 100 16.7 100 61.1 100
Nutrient recovery rate
The proportion of the nutrients taken up by the crop against the nutrients in the fertiliz-ers applied is defined as nutrient recovery rate or utilization rate. In field experiments,the differential technique is used for calculation. The mean nutrient recovery rate ob-served in this experiment was similar to what is generally reported for the whole coun-try. In treatment MF, the N and P recovery rate was 28.9% + 1. 1% and 8.8% + 0.53%,respectively. In Treatment OM the N, P and K recovery rate was 11.7% + 3.4%, 9.6%+ 1.5% and I 1.5% + 1.6%, respectively.If the recovery rate of mineral N and organic N was determined separately, the recov-ery rate of the former was significantly higher than that of the latter. The N recoveryfrom mineral fertilizer remained the same in the succeeding crops. In contrast, the re-covery rate of organic N improved with the number of crops from 8.6% in the firstcrop to 16% in the fourth, which is probably associated with the rapid decrease in thesupply of readily available N in the plough layer in treatment OM (Table 6).Depending on the nutrient source (OM or MF), nutrients which were not removed bythe crop or lost, i.e. by leaching or volatilisation, remain in the soil and can be utilizedby the succeeding crops to a different extent. Obviously, independent of the form (in
291

solution, adsorbed or organic), these residual nutrients can be regarded as residual ef-fect of the fertilizers applied. Since every crop and every year fertilizers are applied,
Table 6. Recovery rate of N in fertilizers as affected by organic manure and mineralfertilizer application, depending on number of crop in the rotation
No. of crop in the rotation N recovery rate (%)Organic manure (OM) Mineral fertilizers (MF)
1 8.6 27.52 9.3 30.13 13.0 29.44 16.0 28.6
Mean 11.7+3.4 28.9+1.1
the residual effect is determined by the observed cumulative yield increase. Therefore,after consecutive systematic fertilization of the crops grown in the same field, therewill still be an upward trend in yields compared to the control, once fertilization isomitted in the year of recording. The long-term residual effect of N can be directlydetermined by 5N. However, in this experiment, the differential method has been em-ployed to calculate the residual effects of nitrogen (Table 7).
Table 7. N recovery rate of organic manure in comparison to mineral fertilizer deter-mined by the differential technique.
Fertilizers N recovery rate in different crop (%)I" crop 2"' crop 3" crop 4" crop Cumulative
RR RR RR RR (St-4th crop)Mineral fertilizer 28.9 5.9 0.9 0.5 36.2Organic manure 11.7 7.9 5.7 1.6 26.9
Note: RR - relative recovery rate.
Table 7 shows that in the I" crop, nitrogen recovery from mineral fertilizer was higherthan from organic manure. In the following years, recovery of N from organic manurewas always greater. Nevertheless, the cumulative recovery (1 -4 crop) with 36.2 % inthe mineral fertilizer treatment (MF) was greater than in the organic manure treatment(OM) with only 26.9% of the applied amounts.
Soil nutrient balance
Since the 1960's when the cropping system of "three-crops-per-year" was introducedto the suburbs of Shanghai, the balance of soil nutrients became a major concern incrop production of this region. According to the reported research project and the dataof previous field experiments, the net depletion of soil nutrients soared, although thenutrient consumption per unit of output (grain) for each crop remained nearly the same
292

(Table 8). Using the data in Table 8, the total nutrient uptake of each crop was calcu-lated, depending on crop yield (Table 9). The "three-crop-per-year" system produced atotal of 13 t ha -' of grain, removing about 253 kg N, 56 kg P20 5 and 291 kg K20 perhectare as much as 53 % more N, 55 % more P20 5 and 58 % more K20 from the soilthan the "two-crops-per-year system".
Table 8. Nutrient uptake per unit of crop product as affected by the intensity of the
cropping system.
System Crop No. of sam- Nutrient uptake (kg 1000 kg-1)pies N P20 5 K20
3-crop-per-year Early rice 14 21.6 0.389 2.44Late rice 12 17.3 0.337 2.12Barley 22 24.5 0.490 1.49
2-crop-per-year Single rice 36 18.5 0.390 2.48Wheat 6 26.1 0.420 1.30
Note: Data cited from experiments conducted in 1974 -1979.
With 20 kg grain per kg of nutrients in the "three-crops-per-year" system and 22 kggrain per kg of nutrients in the "two-crops-per-year", the former had a 10 % smallernutrient demand per unit of output. However, due to the larger yields, the more inten-
sive "three-crops-per-year" system caused a stronger strain on soil nutrients.
Table 9. Crop yield and nutrient uptake in fertilized plots as affected by the intensityof the cropping system
System Crop Yield Nutrient uptake (kg ha-1)(t ha-') N P20 5 K20
3-crop-per-year Early rice 5.4 117 21 132Late rice 4.8 83 16 102
Barley 2.8 69 14 42Total 13.0 293 56 291
2-crop-per-year Single rice 5.7 105 22 141Wheat 3.3 86 14 43Total 9.0 191 36 184
Note: the yield of single crops in non-fertilized plots was 4.46 t ha' for rice and 0.906t ha' for wheat.
On the other hand, with the rise in nutrient uptake under the "three-crops-per-year"system, the depletion of nutrients also increased. This is indicated by the nutrient re-movals of unfertilized fields of both crop rotations, showing that removal of all nutri-ents together was 73 % or 63 %, 106 % and 76 % (N, P20 5 and K20) larger in the"three-crops-per-year" system (Table 10).
293

The nutrients taken up by the crop accounts for a large proportion of the readily avail-able nutrients stored in the soil. Under the system of "three-crops-per-year", 88%, 53%and 65% of the available pool of N, P and K were removed from the soil. This is much
more than in the "two-crops-per-year" system (Table 11). The proportion of the nutri-ent removed from the total nutrient stored in the soil was the highest for N, being 4.8%under the former and 2.9% under the latter cropping system. Taking into account thatonly approximately 5% of N are mineralised annually, the values of 4.8% and 2.9%would be very high. Therefore, in order to sustain the yields under the "three-crops-
per-year system, it is essential to apply large amounts of fertilizers and manure andsystematically to build up soil fertility.
Table 10. Annual nutrient removal from the soil in non-fertilized fields as affected bythe intensity of the cropping system
System Crop Nutrient removal (kg ha-1)N P20 5 K203-crop-per-year Early rice 78.8 18.8 119.0
Late rice 60.9 15.3 66.0Barley 33.5 9.5 30.5Total 173.0 43.6 216.0
2-crop-per-year Single rice 82.5 17.4 111.0Wheat 23.6 3.8 11.8Total 106.0 21.2 123.0
Table 11. Effect of intensity of cropping system on the depletion of soil nutrients
N P KTotal Available Total Available Total Available
NSL* (kg ha') 3600 196 3803 82 52.7x 10 327
Removal by 3-crops-per-year
(kg ha - l ) 173 43.6 212(%) 4.8** 88*** 1.1 53 0.4 65
Removal by 2-crops-per-year
(kg ha - ') 106 21.2 123(%) 2.9 54 0.6 26 0.2 38
* NSL - nutrients in the surface soil layer (17 cm), **% of total, ***% of available.
294
Conclusions
1) The experimental soil has an initially high indigenous fertility being able to produce
approx. 73% of the yield of fertilized plots.2) Nutrient use efficiency was greater in mineral fertilizer than in organic manure
whereas the combination of both showed the greatest efficiency with 27%.3) Crops responded differently to the treatment, showing that rice was obviously better
in acquiring of soil nutrients than barley which depended more on applied inputs by
either mineral or organically bound nutrients.4) With the duration of the experiment, the yield gap between fertilized and un-
fertilized crops widened.5) Consecutive nutrient omission led to an expected significant decline in nutrient up-
take, which after 3-4 crops stabilized at around 35-38% of the N uptake of a fertil-
ized plot.6) Nutrient recovery rate of the whole crop rotation was between 12% and 30% for N,
3% and 9% for P and 12% for K (from the organic manure).7) There were clear differences in the nutrient recovery between organic manure and
mineral fertilizer with the latter being 2-3 times larger.8) Recovery rate of N from organic manure increased with the number of crops
whereas that of mineral N remained the same.9) Soil nutrient balance was affected by intensity of cropping, being more negative in
the 3-crops-per-year rotation than in the 2-crops-per-year rotation, leading to a dra-matic depletion of the available nutrient pools in the soil.
295


Crop response to fertilizer application and nutrient balance in afluvio-aquic soil in Henan
Qin Shengwu, Gu Yichu and Zhu Zhaoliang
Institute of Soil Science, Chinese Academy of Sciences, 210008
Abstract
A long-term (1989-1999) stationary field experiment has been conducted on crop re-
sponse to several major types of fertilizers. Furthermore, the effect of applying differ-ent fertilizer combinations on soil nutrient supply capability of a yellow fluvio-aquic
soil in the Henan Province was studied. Results indicate that the yield-increasing po-
tential of fertilization of yellow fluvio-aquic soil is large, but currently the response ofcrops grown in poor fluvio-aquic soils to the application of single N or single P is
rather limited. As soon as both nutrients are applied in combination, crop response is
highly significant. In the so-called "gold-gilded land", crop cultivation in fluvio-aquicsoils for 10 successive years without any application of K fertilizers or organic manure
did not affect the yield of wheat and maize to any significant extend, thanks to the K-rich clay soil below the plough layer. However, the readily available and slowly avail-
able K in the plough layer depleted rapidly. The apparent cumulative mean recovery
rate (58.5%) for N and P of the 10 years is much greater than the 48.1% obtained froma single crop experiment. Under the current cultivation pattern and yield level, most
fluvio-aquic soils have a positive N and P as well as organic matter balance, but show
a negative balance for K.
Introduction
Fluvio-aquic soils constitute a large proportion of Henan's soils and are regarded as
important crop production base in the province. The soils are generally regarded asrich, especially with regard to K reserves so that in the past no or only limited response
to K application was observed. With the intensification of crop production and the
long-term omission of potassium, the situation in the nutrient supply power of the soil
should have undergone dramatic changes within the past decade. It is therefore thepurpose of this experiment to study yield response to various nutrients and the nutrient
supply capability of the yellow fluvio-aquic soils in the Huang-Huai-Hai Plain undercurrent crop management and fertilization practices. Furthermore, development trends
as caused by different fertilization patterns are studied, depending on the form and
content of the major nutrients in soils and how they vary over time after long-term or-
ganic manure and mineral fertilizer applications. Finally, trends regarding soil fertility
and economic returns from fertilization were assessed. The preliminary results ob-tained during 10 years of experimentation are reported in the following.
297

Experimental design and methodological approach
Design of the experiment
The experimental site is situated within the Fengqiu Agro-ecological System Experi-ment Station, Chinese Academy of Sciences in Henan Province. The soil for the ex-periment is a light loam yellow fluvio-aquic soil (Lianghetu) with a clay layer at adepth between 40 and 60 cm. The local farmers call the soil "Gold-gilded land". Dur-ing the three years preceding the experiment, the land had been cultivated without anyfertilization to achieve proper trial conditions. In the fall of 1989, the experiment wasformally started, when the soil was rather poor in soil fertility. Analysis of the soil fornutrients had been conducted right before the start of the experiment with resultsshown in Table I.
Table I. Soil nutrient contents at the beginning of the experiment
O.M. Total N Total P Total K R.A. N R.A. P R.A. K S.A. K(g kg-') (g kg-') (g kg-') (g kg') (mg kg-') (mg kg') (mg kg') (mg kg-') pH
5.83 0.445 0.50 18.6 9.51 1.93 78.8 558.0 8.65
Note: O.M. stands for organic manure, R.A. for readily available and S.A. for slowlyavailable
The experiment consisted of seven treatments with four replicates. The plot size foreach treatment was 47.5 m 2. The entire experiment was divided into four blocks ar-ranged at random.The seven treatments of the experiment were: 1) CK (no fertilization); 2) NK; 3) PK;4) NPK; 6) O.M.; and 7)1/2 O.M. + 1/2 NPK. The fertilizers used in the experimentwere urea for N, single superphosphate for P and potassium sulphate for K. Their ap-plication rates are shown in Table 2. Organic manure (O.M.) was mainly composed offragmented wheat straw, 4,500 kg ha' and a certain amount of ground soybean cakesor cottonseed cakes added to raise N content in the organic manure.
Table 2. Fertilization rates applied to the trial field
N fertilizer P fertilizer K fertilizerCrop Time of dressing (N kg ha -') (P 20 5 kg ha - l) (K20 kg ha')
Wheat Basal 90 75 150Side dressing 60 0 0
Maize Basal 60 60 150Side dressing 90 0 0
298

The shortage of P and K in the organic manure was made up with P and K fertilizers.The application rate in the experiment was only moderate in comparison to the fertil-izer rates used by local farmers.The cropping system was a "two-crops-per-year" rotation system of "wheat -maize"with the varieties extensively grown in the region. After the harvest of maize in the fallof each year, samples for laboratory analysis were taken from the plough layer, andevery five years samples were taken from the soil layer at a depth of 20 - 40 cm. Sam-ples of plants for laboratory analysis were also collected after each crop was harvested.
Results and Discussion
Crop yield response to combined N and P fertilizer application to a fluvio-aquic soil
As the fluvio-aquic soil is deficient in both N and P, the mean yield of wheat over tenyears in the CK is only 603 kg ha -1, even with irrigation, yields only reached about12% of those in treatment NP. If only one nutrient was applied no matter whether N orP, there was hardly any effect and yields were not increased compared to CK. Rationalnutrient combination of N and P raised yields of wheat and maize in the same year to arather high level, even if the application rate was only moderate in comparison to localpractice. Continued balanced fertilization of N and P was able to maintain high cropyield successively. In the experiment, the mean yield of wheat in the NP treatment hasreached 5,118 kg ha -1 and the yield of maize 7,328 kg ha -' (Table 3), indicating that theyield-increasing potential of fluvio-aquic soil is great if it is properly fertilized. Thereturns from fertilization of the fluvio-aquic soil are also significant, showing that onekg of fertilizer (N or P20 5) increased maize grain yields by 20.07 kg and those ofwheat by 31.58 kg. Wheat was supplied with 225 kg ha-' N and P20 5 and maize with210 kg ha-' N and the same amount of P20 5.
Table 3. Treatments mean yield (kg ha')
Crop Year Treatment
CK NK PK NP NPK O.M 1/20.M+
1/2NPK
Wheat 1990-1999 603 651 1166 5118 5120 3623 4937
Maize 1990-1999 696 747 1352 7328 7409 5863 7329
Variation of soil K during the 10 years and response to K fertilizers of crops grown in
fluvio-aquic soil
According to soil analysis (Table 1), the initial content of readily available K in thetested soil with 78.8 mg kg1 was rather on the low side. Nevertheless, during the stud-
299
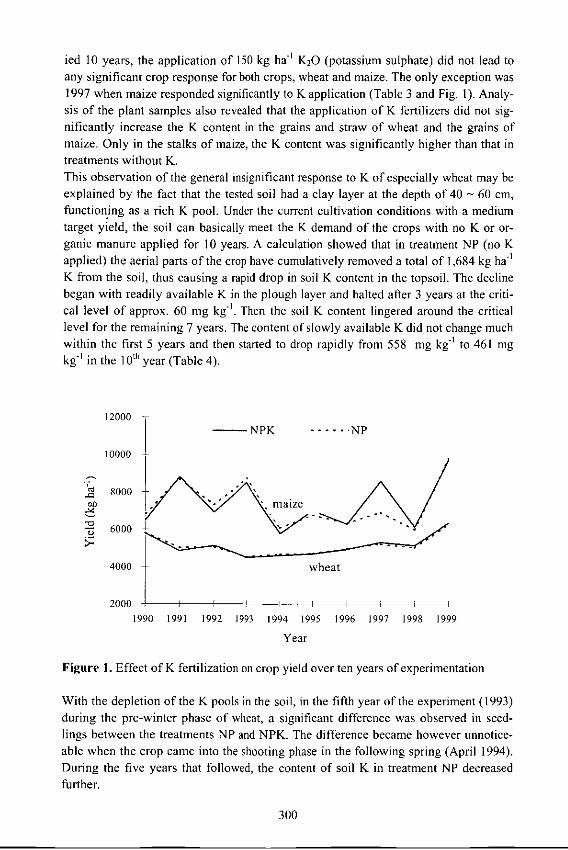
ied 10 years, the application of 150 kg ha l' K20 (potassium sulphate) did not lead toany significant crop response for both crops, wheat and maize. The only exception was1997 when maize responded significantly to K application (Table 3 and Fig. I). Analy-sis of the plant samples also revealed that the application of K fertilizers did not sig-nificantly increase the K content in the grains and straw of wheat and the grains ofmaize. Only in the stalks of maize, the K content was significantly higher than that intreatments without K.This observation of the general insignificant response to K of especially wheat may beexplained by the fact that the tested soil had a clay layer at the depth of 40 - 60 cm,functioning as a rich K pool. Under the current cultivation conditions with a mediumtarget yield, the soil can basically meet the K demand of the crops with no K or or-ganic manure applied for 10 years. A calculation showed that in treatment NP (no Kapplied) the aerial parts of the crop have cumulatively removed a total of 1,684 kg ha-I
K from the soil, thus causing a rapid drop in soil K content in the topsoil. The declinebegan with readily available K in the plough layer and halted after 3 years at the criti-cal level of approx. 60 mg kg-'. Then the soil K content lingered around the criticallevel for the remaining 7 years. The content of slowly available K did not change muchwithin the first 5 years and then started to drop rapidly from 558 mg kg-I to 461 mgkg-' in the 10 th year (Table 4).
12000 t -- NPK ----- NP
10000
8000 * m0 maize
6000
4000 wheat
2000 - J i i I i i
1990 1991 1992 1993 1994 1995 1996 1997 1998 1999
Year
Figure 1. Effect of K fertilization on crop yield over ten years of experimentation
With the depletion of the K pools in the soil, in the fifth year of the experiment (1993)during the pre-winter phase of wheat, a significant difference was observed in seed-lings between the treatments NP and NPK. The difference became however unnotice-able when the crop came into the shooting phase in the following spring (April 1994).During the five years that followed, the content of soil K in treatment NP decreased
further.
300

Table 4. K uptake by crops and variation of soil K content in different treatments
K rate Annual K 1989 1994 1999Treat- removalment ha" (kg K20 R.A. K S.A. K R.A. K S.A.K R.A. K S.A. K
ha-')_ ha-')NP 0 168 78.8 558.0 59.5 558.9 57.1 460.9NPK 249 226 78.8 558.0 119.7 641.1 136.7 560.7
The seedlings of wheat and maize were significantly poorer in growth than those intreatment NPK, especially during drought years. With the plants growing taller, theirroot system developed and stretched into the deep K-rich soil layer, taking up readilyavailable K which was then replenished by release from the slowly available pool. Theclay layer at a depth of 40 - 60 cm, containing much higher K than the surface layer ofthe sandy loam can therefore serve as a K source that is available to plants in their lategrowth stage. These are reasons why the K deficiency symptoms disappeared in thelate growth stage of the crop in treatment NP, and there was no big difference between
treatment NP and treatment NPK in grain yield.The experiment also showed that soil K supply is significantly related to the soil mois-ture regime. In normal years, during the wheat and maize growing periods, the soilmoisture regime is often favourable and does not affect K supply to the plants verymuch. In 1997, drought occurred during the maize growing period. The soil moisturesupply was reduced. In that year, the maize performance in treatment NP was signifi-cantly poorer than that in treatment NPK throughout the whole growing period fromseeding to harvesting. The grain yield was 19.4% less. Nevertheless, this phenomenonappeared only once during the whole duration of the experiment of 10 years.Although the application of K fertilizers to fluvio-aquic soil did not have any signifi-cant yield response in cereals (except in fields of sandy topsoil), the soil K content offluvio-aquic soil has dropped drastically in the recent 20 years. According to stationarymonitoring of different soil types in five prefectures (cities) of Henan Province and thestationary investigation of the 10,000 mu (666.7 ha) experiment zone of the FengqiuAgro-ecological Experiment Station of the Chinese Academy of Sciences, readilyavailable K dropped at a rate of 10 - 15% every 3 - 5 years and 25 - 30% every 10years.With the increase in NP application rate and the resultant increase in crop yield, it isquite common to have one hectare of farmland to produce over 15 tons of grain (twocrops per year). As a result, 225 kg K20 ha1 are removed annually in the harvestedcrop from the soil. The local farmers, however, seldom apply K fertilizers. Accordingto the 1998 statistics, on average only 44.55 kg K20 ha-1 were applied in Henan Prov-ince. It is even worse in Fengqiu where only 13.65 kg K20 ha-1 were applied. The re-plenishment of soil K relies mainly on organic manure and straw returned to the field.Statistics show that about 50% of the K recycled in the cropping system comes fromeither organic manure or the straw returned to the field.
301
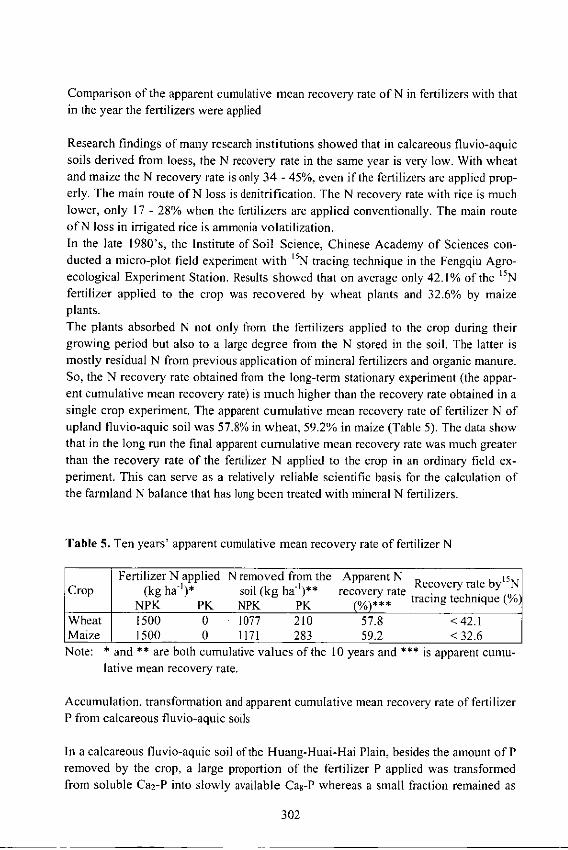
Comparison of the apparent cumulative mean recovery rate of N in fertilizers with thatin the year the fertilizers were applied
Research findings of many research institutions showed that in calcareous fluvio-aquicsoils derived from loess, the N recovery rate in the same year is very low. With wheatand maize the N recovery rate is only 34 - 45%, even if the fertilizers are applied prop-erly. The main route of N loss is denitrification. The N recovery rate with rice is muchlower, only 17 - 28% when the fertilizers are applied conventionally. The main route
of N loss in irrigated rice is ammonia volatilization.In the late 19 8 0's, the Institute of Soil Science, Chinese Academy of Sciences con-ducted a micro-plot field experiment with 5N tracing technique in the Fengqiu Agro-ecological Experiment Station. Results showed that on average only 42.1% of the 15Nfertilizer applied to the crop was recovered by wheat plants and 32.6% by maizeplants.The plants absorbed N not only from the fertilizers applied to the crop during theirgrowing period but also to a large degree from the N stored in the soil. The latter ismostly residual N from previous application of mineral fertilizers and organic manure.So, the N recovery rate obtained from the long-term stationary experiment (the appar-ent cumulative mean recovery rate) is much higher than the recovery rate obtained in asingle crop experiment. The apparent cumulative mean recovery rate of fertilizer N ofupland fluvio-aquic soil was 57.8% in wheat, 59.2% in maize (Table 5). The data showthat in the long run the final apparent cumulative mean recovery rate was much greaterthan the recovery rate of the fertilizer N applied to the crop in an ordinary field ex-periment. This can serve as a relatively reliable scientific basis for the calculation ofthe farmland N balance that has long been treated with mineral N fertilizers.
Table 5. Ten years' apparent cumulative mean recovery rate of fertilizer N
Fertilizer N applied N removed from the Apparent N Recovery rate by' 5NCrop (kg ha-)* soil (kg ha')** recovery rate rcing t e (%)
NPK PK NPK PK (%)*** tracing techniqueWheat 1500 0 1077 210 57.8 <42.1Maize 1500 0 1171 283 59.2 <32.6Note: * and ** are both cumulative values of the 10 years and *** is apparent cumu-
lative mean recovery rate.
Accumulation, transformation and apparent cumulative mean recovery rate of fertilizerP from calcareous fluvio-aquic soils
In a calcareous fluvio-aquic soil of the Huang-Huai-Hai Plain, besides the amount of Premoved by the crop, a large proportion of the fertilizer P applied was transformedfrom soluble Ca 2-P into slowly available Ca8-P whereas a small fraction remained as
302

Al-P and Fe-P in the soil. The slowly available proportion of P is likely to have a re-sidual effect to the succeeding crops. In this long-term experiment, after P fertilizerswere applied to the first 10 crops during the first 5 years, the soluble P and slowlyavailable P significantly accumulated, while the content of fixed P, Ca]o-P did notchange much (Figure 2). After 10 years of continued P fertilizer application, a largeproportion of the applied P has accumulated in the soil in the form of readily availableand slowly available P, rather than being transformed into apatite or other unavailableforms.A number of experiments carried out all over China, whether in the field or in the potand partly using radioactive isotopes showed that the P fertilizer recovery rate of thecrop to which it is applied is roughly 10 - 25%. In the early 1980's, an experimentconducted by the P Research Team of the Institute of Soil Science, Chinese Academyof Sciences in Fengqiu revealed that the apparent recovery rate of single superphos-phate in wheat was 15.9% and in maize it was 11.4%. On the other hand, the experi-ment carried out by the Chinese Academy of Agricultural Sciences in North Chinashowed that the P fertilizer recovery rate was 18%.
4000 -
3500 -
300,0
'W 250.0-250.0-O-Ca2-P -0l-Ca8-P -&--AI-P
2oo.o - -X- Fe- P -- 0 - - p -0O- Cal10- P200.0~ - *OP -- a-
150 00
100,0 -
50.04
1989 1990 1991 1992 1993 1994
Year
Figure 2. Changes of P forms in the soil of the PK treatment
In this experiment, the apparent cumulative mean recovery rate of P fertilizer (singlesuperphosphate) was relatively high, being about 35.8% for wheat, 63.5% for maizeand 48.1% on average, which is much higher than the results obtained in the single Pfertilizer test (Table 6).Apparent cumulative recovery rate of P fertilizer refers to thepercentage of the total fertilizer P absorbed consecutively by a series of crops againstthe amount of fertilizer P applied. In this long-term experiment, however, the P fertil-
303

izer was applied according to common practice, i.e. a certain amount of P fertilizer wasapplied to every crop and every crop was harvested. Thus, we eventually get the meanP recovery rate of the 20 crops in 10 years. In order to distinguish this from the above-mentioned apparent cumulative recovery rate, this is called the apparent cumulativemean recovery rate.
Table 6. Apparent cumulative mean recovery rate of fertilizer P in 10 years
Crop Fertilizer P applied P removed from the Apparent P Recovery rate in
(kg ha'), soil (kg ha-l)* recovery rate single crop(%)** experiment (%)
NPK NK NPK NKWheat 327.3 0 132.8 15.8 35.8 15.9Maize 261.8 0 192.2 26.0 63.5 11.4Note: * cumulative values of the 10 years and ** is the apparent cumulative mean
recovery rate.
The apparent cumulative mean recovery rate of P fertilizer obtained in this experimentwas 48.1%, which means that under the current cultivation conditions in the Huang-Huai-Hai Plain any P fertilizer applied to the field 50% will be at least absorbed andutilized by the crops. This can be used as a reliable basis for evaluating soil P balancein the region, and at the same time P recovery calculations can serve as a reliable pa-rameter for rational application of P fertilizers. Continued P application over years hasraised soil P nutrient levels in the soils in certain regions to such an extent that fresh Papplication to a crop does not lead to yield response to P anymore.
Developmental trends in the nutrient contents of fluvio-aquic soils under differentcombinations of fertilizer application
Combined N and P fertilization
In treatment NP of this experiment, mineral N and P fertilizers were applied to everycrop every year (see Table 2) at rates which were 35% and 80% larger than the absorp-tion by the plants. The used rates were defined as medium, whereas the yield responseto the application can be classified as medium to high based on the observations insimilar experiments.Since the tested soil originally had a poor fertility, which was further depleted bycropping without any fertilizer application for three years prior to the experiment, theinherent nutrient availability of the soil was very poor (see Table 1). Due to the treat-ments during the 10 years of cultivation, the total soil N content rose significantly from0.445 g kg -' to 0.534 g kg -' in the first 3 years, and then lingered around that level inthe following seven years. In contrast to that, the available N fraction showed a con-tinuous increase until the final year without indicating a particular pattern betweenyears (Table 7).
304

The content of total P reflected a regular pattern. In the first year, readily available P
jumped from 1.93 mg kg ' to 3.06 mg kg ' and then stabilized around this level. It in-creased only by 1.4 mg kg -1 within 9 years.
Table 7. Changes in the soil nutrient contents of plough layers of the treatments dur-ing ten years (1989-1999).
Year Treatment Total N Total P Total K r.a. N r.a. P r.a. K s.a. K O.M.(gkg') (glkg') (g kg-') (mg kg')(mg kg')(mg kg')(mg kg') (g kg')
1989 Original 0.445 0.495 18.6 9.51 1.93 78.8 558.0 5.91
1994 CK 0.459 0.486 19.3 6.81 1.23 67.7 601.9 5.93NK 0.480 0.492 19.2 31.4 1.31 222.1 681.7 6.04PK 0.520 0.576 19.3 7.02 10.3 207.7 648.5 6.37NP 0.534 0.544 18.9 6.93 2.90 59.5 558.9 7.38
NPK 0.582 0.547 19.2 7.66 3.17 119.7 641.1 7.45O.M. 0.740 0.544 19.2 8.87 6.21 126.5 638.6 11.6
1/20.M.+ 0.634 0.534 19.4 8.42 3.81 116.0 626.1 9.41I/2NPK
1999 CK 0.420 0.492 19.5 13.2 0.909 68.4 462.9 5.99NK 0.433 0.496 20.1 33.5 1.05 299.7 568.3 6.44PK 0.464 0.677 20.5 12.1 17.1 254.9 610.1 7.26NP 0.531 0.616 19.4 17.2 4.46 57.1 460.9 8.18
NPK 0.553 0.610 18.9 17.2 4.54 136.7 560.7 8.19O.M. 0.813 0.583 19.6 20.7 6.87 147.6 569.1 12.2
1/2.M. 0.639 0.597 20.0 17.9 6.75 141.1 574.8 10.0+ 1/2 NPKII
Note: Original nutrient contents determined prior to the experiment, r.a. stands forreadily available, s.a. for slowly available and O.M. for organic matter.
As treatment NP did not receive any K, neither in the form of fertilizer nor throughorganic manure, the fertilizer management in the experiment put a heavy strain on theK reserves of the soil, because during the ten years the crops removed a total of 1,680kg ha- K, about 168 kg hat per year from the soil. However, as the soil has a largetotal K pool, no significant changes in this parameter was observed. The content ofreadily available K, however, dropped from 78.8 mg kg' to 61.2 mg kg -1, almost to thecritical value (60 mg kg -') during the first three years. And in the seven followingyears, the content fluctuated around the critical value instead of dropping further.Slowly available K did not change much during the first five years and then droppedfrom 558.0 mg kg-' to 460.9 mg kg-' during the last five years. It seems to be clear thatduring the first five years the K absorbed by the crops was mainly readily available Kand during the following five years the K taken up by the crops mainly derived fromthe slowly available K pool in the soil.As in treatment NP, the two fertilizers were applied in combination, the crops grewnormally and produced a fairly high yield. As a large amount of crop residues re-mained in the soil, soil organic matter rose slowly with a distinct pattern from 5. 91
g kg- to 8.18 g kg -'.
305

NPK combinedftrtilization
In treatment NPK, the changes in soil N, P and organic matter were similar to those intreatment NP (see Table 7). Since this treatment received 150 kg ha -' K20 in form of Kfertilizers which was 10% higher than K removed by the crop, the content of readilyavailable K soared from 78.8 mg kg-1 to 196.7 mg kg-' within ten years.
Application of organic manure only
Treatment O.M. was designed to simulate a fertilization pattern of applying only or-ganic manure. In order to keep abreast with other treatments, a small amount of P andK fertilizers were applied to make up the P and K shortage in the organic manure.As organic manure is not suitable for side dressing due to its slow release of nutrients,the manure was applied as basal dressing to meet the requirement of the crops duringthe vegetative period. Mineral fertilizer was applied in a split application divided intobasal and side dressing. This may explain that the efficiency of the organic manure isslightly lower than if an equal amount of nutrients in the form of mineral fertilizerswas applied. The 10 years of experiment showed that the yield of wheat and maize in
treatment O.M reached only 70% and 80% of that in treatment NPK (see Table 3).However, with regard to soil nutrient accumulation, O.M. was superior to treatmentNPK, especially in terms of soil organic matter content, which increased steadily dur-
ing the ten years from 5.91 g kg 1 to 12.2 g kg'. In NPK, however, soil organic matterrose only from 5.91 g kg -1 to 8.19 g kg-', equivalent to 38%.Furthermore, soil physical properties developed more favourably in treatment O.M.
than in the other treatments with mineral fertilizers only. This is reflected by reducedbulk density, improved soil porosity, larger water-holding capacity, better water per-meability and enhanced soil aggregation in the O.M. plots.Experience, however, shows that availability of organic manure is limited and it isvirtually not feasible to advocate the road of so-called "organic farming" which woulddepend solely on organic manure. Only by making full use of organic manure, exclud-ing any resources of organic manure that may pollute the environment (contaminatedmaterial) and utilizing organic manure in combination with mineral fertilizers, a sus-tainable agriculture can develop.
Organic manure applied in combination with mineral fertilizers
In the experiment, treatment 1/2 O.M. + 1/2 NPK was arranged to simulate the localfertilization practice of farmers, relying on mineral fertilizers as main nutrient sourcesfor N and P supplemented by organic manure. In recent years, however, this practicehas dramatically changed and local farmers reduced the application of organic manure,which currently contributes far less than 1/2 of the total nutrient input.
Crop response in treatment 1/2 O.M. + 1/2 NPK was greater than the mean of those inthe treatments O.M. and NPK, which is attributed to the interaction between organicmanure and mineral fertilizers. The results of the experiment showed that the yield
306

increase attributed to the interaction between organic manure and mineral fertilizer was12.9% in wheat and 10.4% in maize (Table 8).
Table 8. Yield increase attributed to the combined effect of organic manure and min-
eral fertilizers
CropII Ill1/2 O.M+1/2NPK 1/2 O.M 1/2NPK
---------------------------- -kg ha------------------
Wheat 4937 1812 2560Maize 7329 2932 3705
The effect of treatment 1/2 O.M. + 1/2 NPK on accumulation of soil nutrients was re-duced compared to that of treatment O.M. alone but much larger than that in treatmentNPK (see Table 7).Combined application of N and P coupled with organic manure as supplement is themajor fertilization pattern in agricultural production in North China. This pattern,however, supplies only a small amount of K, far below the amounts required to com-pensate for the K removed in the harvested crop. As a result, a serious K deficit ap-pears in the K balance.
Conclusion
1) In the Huang-Huai-Hai Plain, the potential of fertilization to increase crop yield onfluvio-aquic soil is great and yield response to a combined N and P application issignificant. This is explained by the fact that the soil is low in fertility and has apoor ability to conserve nutrients. Therefore, crop yields usually drop to very lowlevels, once fertilization with these two nutrients is discontinued.
2) The loamy fluvio-aquic soil with its rich K pool and the existence of a clay layerunderneath the plough layer is able to ensure a good crop yield for 10 years withoutapplying organic manure or K fertilizers. But the content of readily available K inthe plough layer dropped from 78.8 mg kg 1 to 61.2 mg kg' during the first threeyears. Slowly available K decreased by nearly 100 mg kg -' during the 10 years.
3) The long-term experiment showed that the apparent cumulative mean recovery rateof fertilizer N determined by 5N dilution technique was 58.5%, much larger com-pared to 32 - 42% if only one cropping year is considered. The apparent cumulativemean recovery rate of P fertilizer was 48.1%, more than twice as much as the 10 -25%, usually found for P fertilizers in the crop to which it has been applied.
4) Under the current fertilization pattern based on N and P fertilizers with organic ma-nure as supplement, soil nutrients of fluvio-aquic soils are not balanced. Generally,N and P nutrients and organic matter are slightly accumulating whereas K seriouslydepletes over the years. Therefore, increased emphasis needs to be placed on the Ksupply as a standard practice in the nutrient management of fluvio-aquic soils.
307


Nutrient balance of a rice-rice rotation in paddy fields on a red earthsoil of Jiangxi
Lai Qingwang, Li Chagou, Lai Tao, Huang Qinghai and Yu Jinxiang
Jiangxi Province Red Soil Research Institute 331717
Abstract
The effect of fertilization on yield, nutrient balance and nutrient recovery was studiedin a long-term rice-rice-green manure rotation on a paddy soil derived from red earth,over a period of 18 years (1981-1998). The treatments consisted of a control (CK), N,,PI, Ki, NIP,, N1K1 , PIK,, N1P1 Ki, N 1PIKI+ O.M. (including organic manure) andN2 P 2K2. Results show drastic differences in the cumulative yields being in the orderNI PI K 1+ O.M. > N2P 2K2 > NP IKI > NIP, > N,K, > N, > PIK, > P, > K, > CK. Withthe exception of two treatments, N1PIKI+ O.M. and N2P2K2, yields continuously de-clined from the first until the last year of experimentation. Largest yield declines wereobserved in KI and smallest in the N, treatment. The nutrient budgets calculated as thetotal input over 18 years minus the total output (grains and straw) showed that nutrientbalances varied greatly between the nutrients and treatments involved. Negative bal-ances for N occurred in those treatments without N application in the order PIK, > P >Ki > CK. Strongly positive balances were especially observed in NIPIKI+ O.M. andN2P2K2, which in the former treatment reached almost 3.5 tonnes of N per hectare over18 years or 194 kg N ha- yr'. For P, similar trends were observed and a P depletion ofthe soil between 870 and 994 kg P205 ha -I or 48 and 55 kg P20 5 ha
l yr' was recordedin plots without P application. P accumulation as indicated by a positive P balance wassmallest with an amount of 303 kg ha -' in the N1 P IKI treatment and exceeded 1.5 t ha'in N2P2 K2 over the whole study period. Negative balances for potassium occurred inall treatments without K but also in NIK 1, PIK, and NiP,K,, showing that the applica-tion of K in these treatments was not sufficient to balance the removals by grain andstraw. The most severe K depletion of the soil of up to 2.3 t ha-' was observed in P1 ,followed by CK and NIP, at the amount of 1.9 and 1.8 t ha -1. Nutrient recovery effi-ciency varied dramatically between nutrients and treatments. Cumulative recovery (36crops) was in the order K >> N > P, following the fertilization practice, it was largestin the balanced (NPK treatments) and smallest in the unbalanced treatments (Ni; PI,K1.etc.). Soil chemical analysis at the beginning and at the end of the'study periodindicate a general decline in soil fertility parameters with the exception in NIPIKI +O.M. and N2P2K2, where soil fertility levels could be maintained. P application at therates applied, generally led to an increase in Olsen P in the soils.
Introduction
Rice-rice-green manure are the typical crop rotations on a paddy soils developed fromred earth in the sub-humid to humid subtropical region of the Jiangxi Province. The
309

increasing demand for mineral fertilizers to sustain the production of two to threecrops per year has resulted in an increased demand for improved fertilizer recommen-dations. For this purpose a long-term experiment was set up to study various treat-ments with different nutrient rates from mineral fertilizer, including one treatment withorganic manure. Main focus is laid on studying annual grain yields and cumulativenutrient balances over a period of 18 years or 36 crops. Furthermore, the aim of thestudy is to record changes in the soil nutrient status over time as affected by the fertil-izer management.
Materials and methods
The study was carried out in the experimental field of the Red Soil Research Institutein Jiangxi. Prior to the experiment, the field had been cultivated by a rice-rice-greenmanure rotation, with an average rice yield of 9000 kg ha- yr-'. The paddy soil derivedfrom a quaternary red clay which had a profile described as A-P-W-W 2. The experi-ment consisted of 10 treatments with CK (Control without fertilization); N, PI. KI;NIP,; NKj; PIK,; NIPIK; N2P2K2 ; NIPIKI + O.M. The fertilizer application rateswere N, = 90 kg N ha -,, P1 = 45 kg P20 5 ha -' and KI - 75 kg K20 ha-'; N2 = 180 kg Nha', P2 = 90 kg P20 5 ha -I and K2 = 150 kg K20 ha - '. The Organic manure (O.M.) inNjPIKI + O.M. consisted of 22,500 kg ha-' (milk vetch for early rice and pig dung forlate rice). The plot size for each treatment was 46.67 m2 and each treatment had threereplications, randomly arranged. The experiment began in 1981 with early rice under arotation system of rice-rice-winter fallow. The varieties of early and late rice werechanged every five years. Soil and plant samples were taken for analysis of readilyavailable nutrients every year or every crop during the period from 1981 to 1990 andonce every two years during the period from 1991 to 1998. Soil samples were takenafter the late rice was harvested, and nutrient analysis was conducted using conven-
tional methods.
Results and discussion
Variation of rice yield under long-term fertilization
The cumulative rice yield of the 36 crops in 18 years varied from treatment to treat-ment, following the order of NPIKI + O.M. > N2P2K2 > NIP]KI > NIP] > NIKI > N,> PIK, > Pi > KI > CK. This shows a trend that the combination of organic manurewith mineral fertilizers in a long-term cultivation is superior to mineral NPK only, asshown by the differences between NIPIKI + O.M. and NIPIKI.and N2P2K2. (Figure 1).Comparing the yields of the first year of the experiment (1981) and those of the finalyear (1998), the different treatments can be analysed with regard to their long-termyield trends, giving an indication about their sustainability. It is interesting to note thatin all treatments the rice yields declined after 36 crops were continuously grown inrotation on the same field. The only exceptions were the treatments N2P2K2 andNIPIK+ O.M. with yield increases of 9.4% and 10.5% over the 18 years (Figure 2).
310
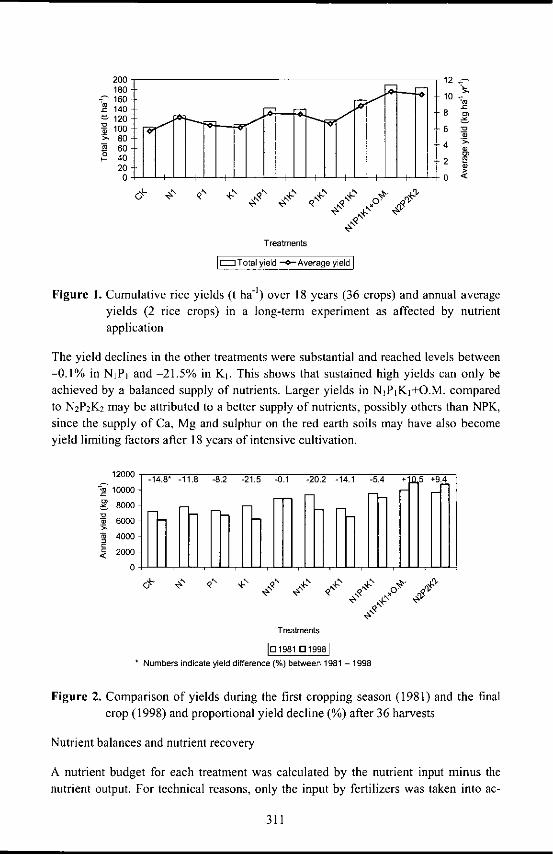
200- 12<-180 10 2
140 8- 120 8
100 -- 6
60 -4 .3,k- 4 0
2
200 -4- - 0 <
°+ # ¢ # # +° 4. . A
Treatments
I = Total yield --O Averageyel
Figure 1. Cumulative rice yields (t ha- l) over 18 years (36 crops) and annual average
yields (2 rice crops) in a long-teni experiment as affected by nutrient
application
The yield declines in the other treatments were substantial and reached levels between
-0.1% in NIP and -21.5% in KI This shows that sustained high yields can only be
achieved by a balanced supply of nutrients. Larger yields in NPK+O.M. compared
to N2P2K2 may be attributed to a better supply of nutrients, possibly others than NPK,
since the supply of Ca, Mg and sulphur on the red earth soils may have also become
yield limiting factors after 18 years of intensive cultivation.
' 1 000 -14.8 ' -11.8 -8.2 -21.5 -0.1 -20.2 -14.1 -5.4 9 .4 ,
w 6000
-a 4000
2000
Treatments
*Numbers indicate yield difference (%) beheen 1981 - 1998
Figure 2. Comparison of yields during the first cropping season (1981) and the final
crop (1998) and proportional yield decline (%) after 36 harvests
Nutrient balances and nutrient recovery
A nutrient budget for each treatment was calculated by the nutrient input minus the
nutrient output. For technical reasons, only the input by fertilizers was taken into ac-
311

count and no estimate for nutrients supplied by rainfall and irrigation water was made.Nutrient output was calculated on the basis of removed biomass and nutrients con-tained in the grains and straw. The nutrients left in the field in form of crop stubblesand roots were not taken into account. Nutrient recovery efficiency (RE) was calcu-lated by deducting the nutrient uptake of a non-fertilized plot (indigenous soil nutrientsupply) from the uptake of a fertilized plot, than dividing it by the amount applied,
according to the formula:
RE(%) -[(NUrt. - NUunfe,) / Npph,ed] x 100, (1)
where NUfert is the nutrient uptake of the fertilized plot, NU,fr, the nutrient uptake inthe unfertilized plot and Na,,pied the nutrient applied.
Nitrogen
The nitrogen balance was negative for all treatments without N application (CK, PI,K1, PIKi) at amounts accumulating to approximately 1.5 t ha-1 on average over thewhole study period. The nitrogen in these treatments can be regarded as the indigenoussupply from the soil (Table 1). In all the treatments receiving nitrogen, the cumulativeN balance was positive between 655 kg N ha1 (equal to 36 kg N ha' yr-') in NIPIK,and 3458 N ha-' (equal to 192 kg N ha1 yr) in N,P,Ki+O.M. From this it is evidentthat the latter treatment led to a dramatic over-supply of nitrogen whereas the formerwith the smallest positive N balance, however, was clearly inferior with regard toyields (see Figure 2). Using the figures of average uptake of those plots which didn'treceive any nitrogen from mineral fertilizer (mean of CK, P, Ki, PIK, in Table 1) asindigenous nitrogen supply from the soil, the recovery efficiency was calculated ac-cording to above shown equation 1.
Table 1. Cumulative nutrient budget of a rice-rice rotation (36 crops) calculatedbased on the total inputs and outputs (crop removal) as affected by differentfertilization treatments (kg ha - 1)
Treat- Input Output Balancement N P2 0 5 K2 0 N P 20 5 K 2 0 N P 20 5 K 2 0
CK 1405.6 796.5 1920.8 -1405.6 -796.5 -1920.8NI 3330 2173.5 967.2 1495.4 1156.5 -967.2 -1495.4Pi 1665 1591.8 1034.1 2256.9 -1591.8 630.9 -2256.9KI 2775 1506.4 873.0 2662.5 -1506.4 -873.0 112.5NiP] 3330 1665 2302.6 1201.2 1813.5 1027.4 463.8 -1813.5N IKI 3330 2775 2197.8 994.6 3424.2 1132.2 -994.6 -649.2PIK, 1665 2775 1630.0 1094.6 2910.6 -1630.0 570.4 -135.6N,P,K, 3330 1665 2775 2674.6 1361.6 3685.4 655.4 303.4 -910.4N 2P2K 2 6660 3330 5550 3542.4 1826.1 5202.0 3117.6 1503.9 348.0N IPIKI 6660 3330 5550 3201.9 1877.1 4883.0 3458.1 1452.9 667.0+OM.
312
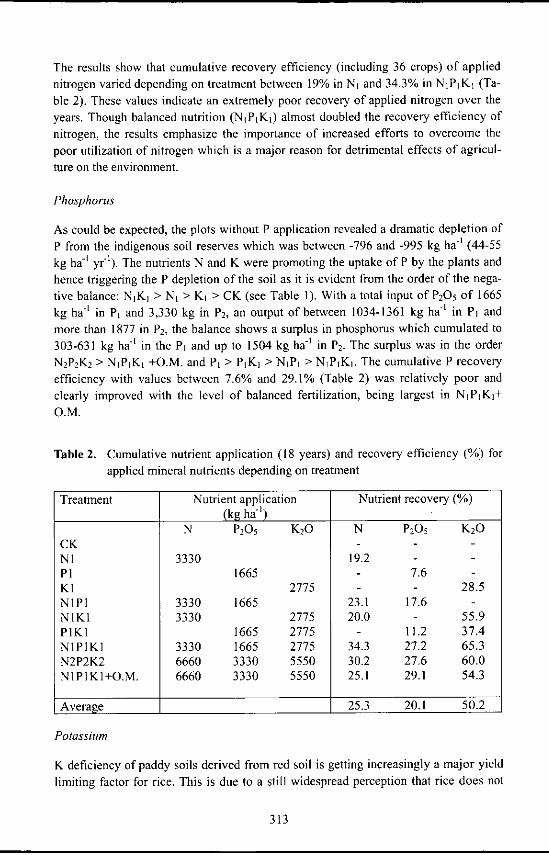
The results show that cumulative recovery efficiency (including 36 crops) of applied
nitrogen varied depending on treatment between 19% in N, and 34.3% in NIP'KI (Ta-
ble 2). These values indicate an extremely poor recovery of applied nitrogen over the
years. Though balanced nutrition (NiPiKI) almost doubled the recovery efficiency of
nitrogen, the results emphasize the importance of increased efforts to overcome the
poor utilization of nitrogen which is a major reason for detrimental effects of agricul-
ture on the environment.
Phosphorus
As could be expected, the plots without P application revealed a dramatic depletion of
P from the indigenous soil reserves which was between -796 and -995 kg ha' (44-55
kg ha-' yr-1 ). The nutrients N and K were promoting the uptake of P by the plants and
hence triggering the P depletion of the soil as it is evident from the order of the nega-
tive balance: N,Ki > N, > KI > CK (see Table 1). With a total input of P20 5 of 1665
kg ha in P1 and 3,330 kg in P2, an output of between 1034-1361 kg ha- in P1 and
more than 1877 in P2 , the balance shows a surplus in phosphorus which cumulated to
303-631 kg ha- in the P, and up to 1504 kg ha - ' in P2 . The surplus was in the order
N2 P2K2 > N1PIKI +O.M. and P1 > PIK] > NIP, > NIPIKI. The cumulative P recovery
efficiency with values between 7.6% and 29.1% (Table 2) was relatively poor and
clearly improved with the level of balanced fertilization, being largest in NIP 1 KI+
O.M.
Table 2. Cumulative nutrient application (18 years) and recovery efficiency (%) for
applied mineral nutrients depending on treatment
Treatment Nutrient application Nutrient recovery (%)(kg ha)
N P20 5 K20 N P 20 5 K 20
CKNI 3330 19.2 -
PI 1665 - 7.6 -
KI 2775 - - 28.5NIPI 3330 1665 23.1 17.6 -
NIKI 3330 2775 20.0 - 55.9PIKI 1665 2775 - 11.2 37.4NIPIKI 3330 1665 2775 34.3 27.2 65.3N2P2K2 6660 3330 5550 30.2 27.6 60.0NIP1KI+O.M. 6660 3330 5550 25.1 29.1 54.3
Average 25.3 20.1 50.2
Potassium
K deficiency of paddy soils derived from red soil is getting increasingly a major yield
limiting factor for rice. This is due to a still widespread perception that rice does not
313

need much potash for average yields caused by relatively small removals if straw isreturned to the field after harvest. However, the practice of returning straw to the fieldlost in importance due to alternative uses of the straw in recent years. The experimentwas therefore undertaken to study the K uptake and removal as affected by the K sup-ply. The plots without K application (CK, N1, PI, NIP 1) show a dramatic negative bal-ance of K and reflect to a certain extent the situation in many farmers' fields. Surpris-ingly, the K deficit was most severe with 2.26 t ha - ' (equal to 126 kg ha -I yr -') and 1.9 tha -' (equal to 106 kg ha- yr -1) in the P, and the CK plots, not in the NIP, or NJ plots ascould be expected from the fact that N is usually stronger fuelling growth and hencetriggering to a greater extent the K removal from the soil than P. It is important to notethat even if K was applied, certain treatments still showed a negative balance for K ofup to 910 kg K20 ha - ' (equal to 51 kg K20 ha' yr -') in NIPIKI. The order of K deple-tion was hence: P1 > CK > NIP, > NJ > NIP]KI > NjKj > PIK, (Table 1). Positivebalances were only observed in three treatments, KI < N2 P2K2 < NIP 1KI+O.M. Theselatter ranged from 112 kg K20 ha' to 667 kg K20 ha - ' (equal to 6 and 37 kg K20 ha '
yr-'). Recovery efficiency of K with 28.5% - 65.3% was generally larger than for Nand P (Table 2). Poorest K recovery was observed in KI due to the lack of N and P,needed to fuel the biomass production and hence the uptake of K. Largest K recoverywas found in the NIPIKI treatment.
Changes in soil fertility parameters during the long-term experiment
Looking at the nutrient balances and the distinct variation between the treatments (seeTable 1), it was of particular interest to study how this would affect the nutritionalstatus of the soil. Therefore, results of soil analyses at the beginning of the experiment(1981) and after 18 years (1998) are compared in Table 3 (total nutrients) and Table 4(readily available nutrients).
Table 3. Changes in soil fertility parameters during the long-term experiment
Treatment pH Organic C Total N Total P Total K1981 1998 1981 1998 1981 1998 1981 1998 1981 1998
------------------------------- (g kg 1) ------------------CK 6.2 5.7 16.1 16.0 1.35 1.43 1.09 0.94 10.7 12.3N 6.2 5.6 16.5 17.9 1.50 1.66 1.10 0.84 11.0 12.8P1 6.5 6.0 16.4 17.2 1.45 1.40 1.13 1.45 11.0 13.2K, 6.6 5.7 15.2 17.5 1.44 1.57 1.04 0.86 11.7 12.2NIP, 6.3 5.7 16.6 17.7 1.48 1.89 1.17 2.05 10.7 12.3N,K, 6.6 5.3 16.1 17.2 1.57 1.69 1.04 0.97 11.0 12.5P IK, -- 5.3 - 16.7 - 1.69 -- 1.54 -- 12.7NIP IKI 6.6 5.6 17.0 17.5 1.64 1.64 1.19 1.52 11.0 12.5N2 P2 K2 6.3 6.1 17.3 18.5 1.64 1.70 1.18 2.52 11.1 12.7N,P,K, 6.4 6.0 17.7 21.0 1.52 2.01 1.28 3.28 11.6 12.5+OMMean 6.41 5.7 16.5 17.7 1.51 1.67 1.14 1.60 11.1 12.6
314
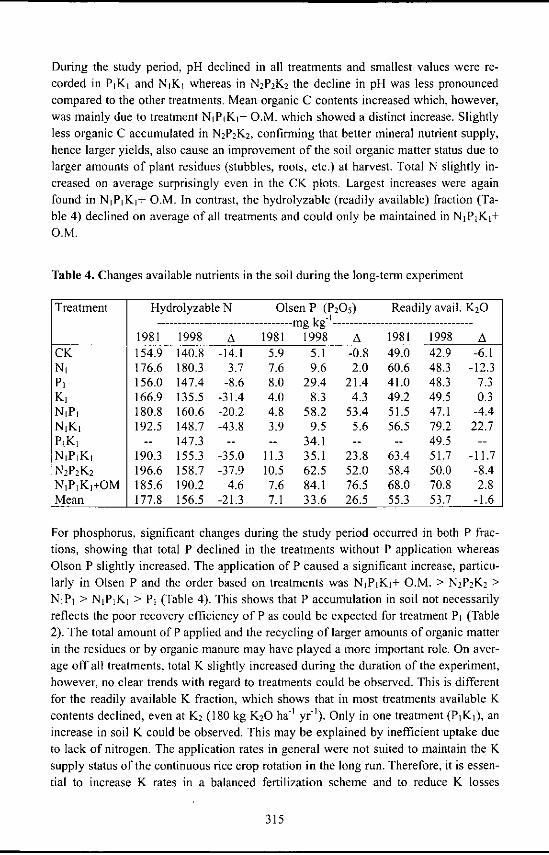
During the study period, pH declined in all treatments and smallest values were re-corded in PjKj and NIKI whereas in N2P2 K2 the decline in pH was less pronouncedcompared to the other treatments. Mean organic C contents increased which, however,was mainly due to treatment NIPIKI+ O.M. which showed a distinct increase. Slightlyless organic C accumulated in N2 P2 K2, confirming that better mineral nutrient supply,hence larger yields, also cause an improvement of the soil organic matter status due tolarger amounts of plant residues (stubbles, roots, etc.) at harvest. Total N slightly in-creased on average surprisingly even in the CK plots. Largest increases were againfound in N,P,K,+ O.M. In contrast, the hydrolyzable (readily available) fraction (Ta-ble 4) declined on average of all treatments and could only be maintained in NIPIKI+O.M.
Table 4. Changes available nutrients in the soil during the long-term experiment
Treatment Hydrolyzable N Olsen P (P2 0 5 ) Readily avail. K20--------------------------------- mg kg ---------------------
1981 1998 A 1981 1998 A 1981 1998 ACK 154.9 140.8 -14.1 5.9 5.1 -0.8 49.0 42.9 -6.1NI 176.6 180.3 3.7 7.6 9.6 2.0 60.6 48.3 -12.3PI 156.0 147.4 -8.6 8.0 29.4 21.4 41.0 48.3 7.3K, 166.9 135.5 -31.4 4.0 8.3 4.3 49.2 49.5 0.3NiP] 180.8 160.6 -20.2 4.8 58.2 53.4 51.5 47.1 -4.4NIKI 192.5 148.7 -43.8 3.9 9.5 5.6 56.5 79.2 22.7P IK, -- 147.3 -- - 34.1 .. .. 49.5 --
N IPIKI 190.3 155.3 -35.0 11.3 35.1 23.8 63.4 51.7 -11.7N2P2K2 196.6 158.7 -37.9 10.5 62.5 52.0 58.4 50.0 -8.4N IP IK]+OM 185.6 190.2 4.6 7.6 84.1 76.5 68.0 70.8 2.8Mean 177.8 156.5 -21.3 7.1 33.6 26.5 55.3 53.7 -1.6
For phosphorus, significant changes during the study period occurred in both P frac-tions, showing that total P declined in the treatments without P application whereasOlson P slightly increased. The application of P caused a significant increase, particu-larly in Olsen P and the order based on treatments was NIPIKI+ O.M. > N2 P2K2 >
NIPI > NIPIKI > P, (Table 4). This shows that P accumulation in soil not necessarilyreflects the poor recovery efficiency of P as could be expected for treatment P (Table2). The total amount of P applied and the recycling of larger amounts of organic matterin the residues or by organic manure may have played a more important role. On aver-age off all treatments, total K slightly increased during the duration of the experiment,however, no clear trends with regard to treatments could be observed. This is differentfor the readily available K fraction, which shows that in most treatments available Kcontents declined, even at K2 (180 kg K20 ha -I yr-'). Only in one treatment (PIK,), anincrease in soil K could be observed. This may be explained by inefficient uptake dueto lack of nitrogen. The application rates in general were not suited to maintain the Ksupply status of the continuous rice crop rotation in the long run. Therefore, it is essen-tial to increase K rates in a balanced fertilization scheme and to reduce K losses
315
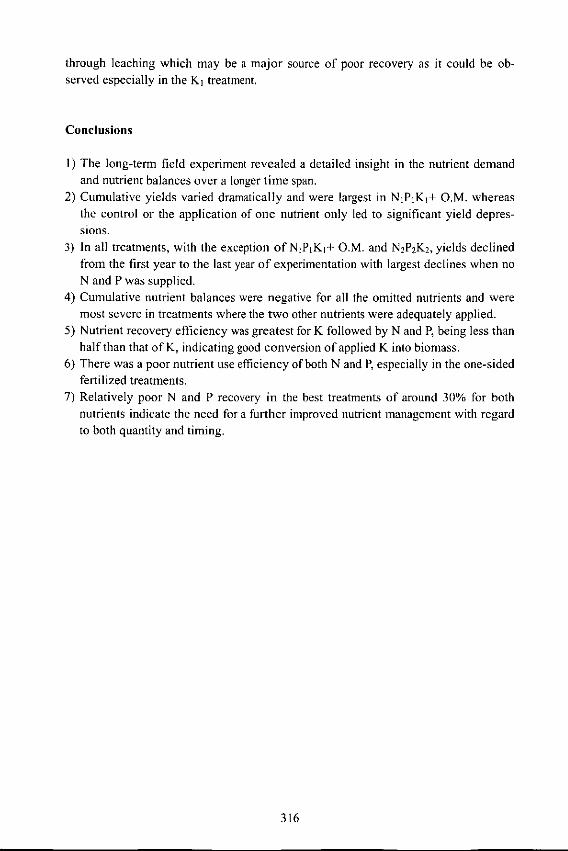
through leaching which may be a major source of poor recovery as it could be ob-served especially in the K, treatment.
Conclusions
1) The long-term field experiment revealed a detailed insight in the nutrient demandand nutrient balances over a longer time span.
2) Cumulative yields varied dramatically and were largest in NIPIKI+ O.M. whereasthe control or the application of one nutrient only led to significant yield depres-sions.
3) In all treatments, with the exception of NlPiKl+ O.M. and N2P2K2, yields declinedfrom the first year to the last year of experimentation with largest declines when noN and P was supplied.
4) Cumulative nutrient balances were negative for all the omitted nutrients and weremost severe in treatments where the two other nutrients were adequately applied.
5) Nutrient recovery efficiency was greatest for K followed by N and P, being less thanhalf than that of K, indicating good conversion of applied K into biomass.
6) There was a poor nutrient use efficiency of both N and P, especially in the one-sidedfertilized treatments.
7) Relatively poor N and P recovery in the best treatments of around 30% for bothnutrients indicate the need for a further improved nutrient management with regard
to both quantity and timing.
316
Residual effects of mineral fertilizers and organic manure and theirimpact on soil nutrients in a long-term experiment
Sun Gengyin
Soil and Fertilizers Institute, Jiangsu Province Academy of Agricultural Science210014
Abstract
A long-term field experiment was carried out on desalinised fluvio-aquic soil in Ji-angsu to study the effect of a combination of organic manure (MO, MI) on yield aswell as the residual effect to the succeeding crop. The mineral fertilizer treatmentsconsisted of C (control), PK, NK, NP and NPK. The results reveal significant differ-ences between yields without and with organic manure and best exploitation of theyield potential of wheat and maize grown in rotation was found in M I + NPK. In theaverage of seven years, NPK application more than tripled wheat yields in MO whereasthey only doubled in M1, though the yield level was much higher in MI than in MO.This is due to the yield increasing effect of organic manure in the control treatment inMO. For maize, a similar observation was made and largest yields were found in thecombination MI and NPK. Omission of one nutrient always led to a yield declinewhich was most dramatic for N and P whereas the latter was particularly limiting theyield of wheat when no organic manure was applied (MO). Residual effects followed
the order NP > NPK > NK > C in MO and NK > NP > NPK > C > PK in MI. Soilanalysis after 7 years revealed drastic differences between both MO and MI and be-tween the different mineral fertilizer treatments. Though there were also differences inthe total N and O.M. contents, the long-term fertilization practice mainly influencedthe readily available nutrients. Extreme depletion for P was observed in the combina-tion MO-C, MO-NK whereas in MO-NPK, MO-NP and MO-PK a slight enrichment ofsoil P could be observed. In the combination M1, the P accumulation was PK > NP >NPK > C > NK. Readily available K was clearly in the deficiency range for the com-bination MO-C, MO-NP and MO-NPK. Only MO-PK and MO-NK showed K availabil-ity at the lower range of adequate supply. In the M1 treatment, with the exception ofM I-PK, all soils showed low to extremely low K availability. This clearly indicates theinsufficient K supply despite organic manure application over the years.
Introduction
An anticipation of the yield response to fertilization has to include the direct effect onthe crop the fertilizer is applied to and the residual effects from fertilizers to the suc-ceeding crops. Most methods currently used for making fertilizer recommendation,however, do not take into account the residual effect of the applied nutrients. To quan-tify residual effects of mineral fertilizers and organic manure under different rotation
317

systems could assist in providing an improved basis for fertilizer recommendation. Incertain countries, nitrogen fertilizer recommendation is based on the determination ofresidual N03-N in the soil. However, this method has not yet been widely adopted inthe practice of Chinese agriculture.A long-term fertilizer experiment was therefore carried out in the Experiment Zone forComprehensive Management of Saline-alkalytic Fluvio-aquic soils in Wangji, SuiningCounty, Jiangsu Province, to study the direct and the residual effect of fertilizer appli-cation on yield and soil parameter in more detail.
Materials and methods
The trial soil was originally salinized-alkalized fluvio-aquic soil. After years of inten-sive management, the soil has been desalinized and may be described as sandy loam intexture and moderate to low in soil fertility. The groundwater table was recorded at I -3 m, fluctuating in the range between 0.5 - 1.5 m. The chemical properties are domi-nated by HC03,-Na'-Mg + or HC0 3-CI--Na+-Mg + .
The experiment was initiated in October 1986 and has been going on for 13 years. Itwas designed as a split plot with organic manure as main plots: 1) without organic ma-nure (MO) and 2) with organic manure (MI), 37.5 t ha- farmyard manure, containing186 kg N, 140 kg P20 5 and 232 kg K20 applied in this treatment. The subplots con-sisted of: 1) no mineral fertilizers (C), 2) with P and K fertilizers (PK), 3) with N andK fertilizers (NK), 4) with N and P fertilizers (NP) and 5) with N, P and K fertilizers(NPK). The rotation system adopted for the experiment was wheat-maize with twocrops per year. The fertilizer application rate was 210 kg N, 112.5 kg P20 5 and 112.5kg K20 per hectare for wheat and 165 kg N, 75 kg P20 5 and 75 kg K20 per hectare formaize. From fall 1991 onwards, the N application rate has been changed to 187.5 kg Nha-'. For N urea, for P single super phosphate and for K potassium sulphate were used.Organic manure, P and K fertilizers were all applied as basal application. Three-quarters of the N fertilizer for wheat and two-thirds of the N fertilizer for maize werebasal applied whereas the rest was side-dressed. The cultivar of wheat was Xuzhou-211 and the cultivar of maize Yedan-2. The plots for the treatments were 13.3 m 2 eachand arranged at random. Each treatment had three replicates. Beginning with wheat inthe autumn of 1993, fertilization was discontinued in all treatments for the observationof residual effects resulting from fertilization to the preceding crop. And in the autumnof 1994 fertilization was resumed.
Results and discussion
Crop yield, depending on residual effects of long-term fertilization
Mean yields (1987-1993) and residual effects of mineral fertilizers and organic manureon crop yield and yield increase are shown in Table 1. The yield depending on residualeffects in treatment M I is equal to 40% - 55.6% of the mean yield of the preceding 7years, whereas in treatment MO only amounts to 25.8% - 52.1%. Obviously, the differ-
318
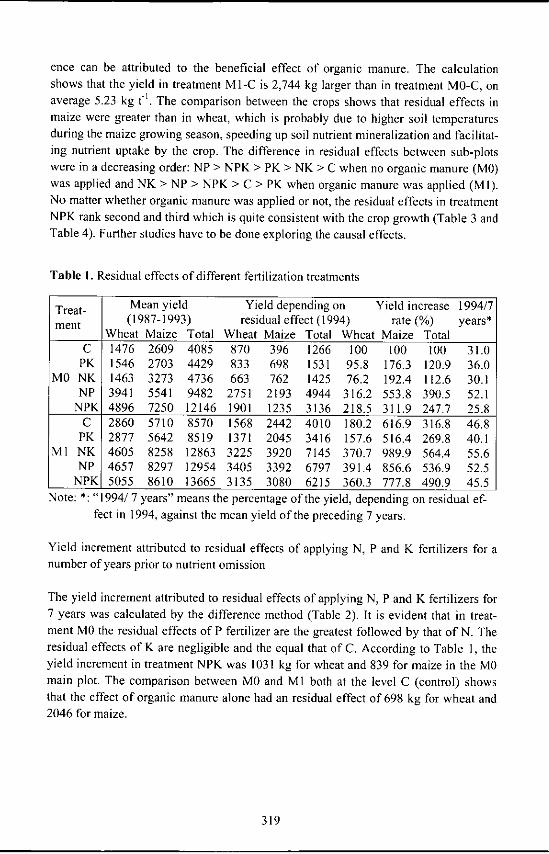
ence can be attributed to the beneficial effect of organic manure. The calculationshows that the yield in treatment M 1-C is 2,744 kg larger than in treatment MO-C, onaverage 5.23 kg t1.The comparison between the crops shows that residual effects inmaize were greater than in wheat, which is probably due to higher soil temperaturesduring the maize growing season, speeding up soil nutrient mineralization and facilitat-ing nutrient uptake by the crop. The difference in residual effects between sub-plotswere in a decreasing order: NP > NPK > PK > NK > C when no organic manure (MO)was applied and NK > NP > NPK > C > PK when organic manure was applied (Ml).No matter whether organic manure was applied or not, the residual effects in treatmentNPK rank second and third which is quite consistent with the crop growth (Table 3 andTable 4). Further studies have to be done exploring the causal effects.
Table I. Residual effects of different fertilization treatments
Treat- Mean yield Yield depending on Yield increase 1994/7ment (1987-1993) residual effect (1994) rate (%) years*
Wheat Maize Total Wheat Maize Total Wheat Maize TotalC 1476 2609 4085 870 396 1266 100 100 100 31.0PK 1546 2703 4429 833 698 1531 95.8 176.3 120.9 36.0
MO NK 1463 3273 4736 663 762 1425 76.2 192.4 112.6 30.1NP 3941 5541 9482 2751 2193 4944 316.2 553.8 390.5 52.1NPK 4896 7250 12146 1901 1235 3136 218.5 311.9 247.7 25.8C 2860 5710 8570 1568 2442 4010 180.2 616.9 316.8 46.8PK 2877 5642 8519 1371 2045 3416 157.6 516.4 269.8 40.1
M1 NK 4605 8258 12863 3225 3920 7145 370.7 989.9 564.4 55.6NP 4657 8297 12954 3405 3392 6797 391.4 856.6 536.9 52.5
NPK 5055 8610 13665 3135 3080 6215 360.3 777.8 490.9 45.5Note: *: "1994/7 years" means the percentage of the yield, depending on residual ef-
fect in 1994, against the mean yield of the preceding 7 years.
Yield increment attributed to residual effects of applying N, P and K fertilizers for anumber of years prior to nutrient omission
The yield increment attributed to residual effects of applying N, P and K fertilizers for7 years was calculated by the difference method (Table 2). It is evident that in treat-ment MO the residual effects of P fertilizer are the greatest followed by that of N. Theresidual effects of K are negligible and the equal that of C. According to Table 1, theyield increment in treatment NPK was 1031 kg for wheat and 839 for maize in the MOmain plot. The comparison between MO and MI both at the level C (control) showsthat the effect of organic manure alone had an residual effect of 698 kg for wheat and2046 for maize.
319
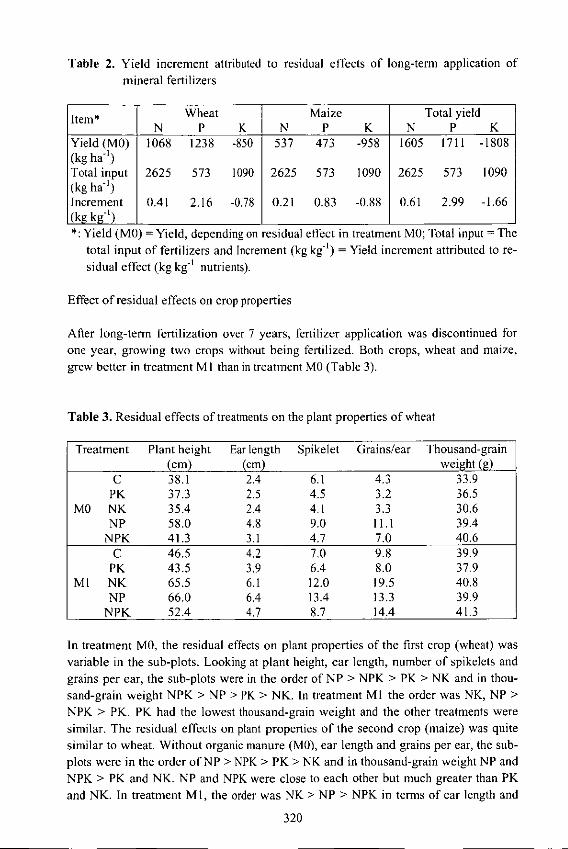
Table 2. Yield increment attributed to residual effects of long-term application of
mineral fertilizers
Item* Wheat Maize Total yieldN P K N P K N P K
Yield (MO) 1068 1238 -850 537 473 -958 1605 1711 -1808(kg ha -')Total input 2625 573 1090 2625 573 1090 2625 573 1090(kg ha- )Increment 0.41 2.16 -0.78 0.21 0.83 -0.88 0.61 2.99 -1.66(kg kg -') 1*: Yield (MO) = Yield, depending on residual effect in treatment MO; Total input = The
total input of fertilizers and Increment (kg kg -1) = Yield increment attributed to re-
sidual effect (kg kg -' nutrients).
Effect of residual effects on crop properties
After long-term fertilization over 7 years, fertilizer application was discontinued for
one year, growing two crops without being fertilized. Both crops, wheat and maize,grew better in treatment M I than in treatment MO (Table 3).
Table 3. Residual effects of treatments on the plant properties of wheat
Treatment Plant height Earlength Spikelet Grains/ear Thousand-grain(cm) (cm) weight (g)
C 38.1 2.4 6.1 4.3 33.9PK 37.3 2.5 4.5 3.2 36.5
MO NK 35.4 2.4 4.1 3.3 30.6NP 58.0 4.8 9.0 11.1 39.4
NPK 41.3 3.1 4.7 7.0 40.6C 46.5 4.2 7.0 9.8 39.9PK 43.5 3.9 6.4 8.0 37.9
Ml NK 65.5 6.1 12.0 19.5 40.8NP 66.0 6.4 13.4 13.3 39.9
NPK 52.4 4.7 8.7 14.4 41.3
In treatment MO, the residual effects on plant properties of the first crop (wheat) was
variable in the sub-plots. Looking at plant height, ear length, number of spikelets andgrains per ear, the sub-plots were in the order of NP > NPK > PK > NK and in thou-sand-grain weight NPK > NP > PK > NK. In treatment MI the order was NK, NP >NPK > PK. PK had the lowest thousand-grain weight and the other treatments were
similar. The residual effects on plant properties of the second crop (maize) was quitesimilar to wheat. Without organic manure (MO), ear length and grains per ear, the sub-plots were in the order of NP > NPK > PK > NK and in thousand-grain weight NP and
NPK > PK and NK. NP and NPK were close to each other but much greater than PKand NK. In treatment M1, the order was NK > NP > NPK in terms of ear length and
320

grains per ear and NK > NPK > NP > PK with regard to thousand grain weight. Thecrop response in plant properties was consistent with that in yield.
Effect of crop cultivation after long-term fertilization on soil nutrients
Soil tests, after 7 and the first year of discontinued fertilization, when the first crop(wheat) was harvested, revealed that readily available K dropped most significantlyfollowed by organic matter content. The drop of total N was not significant. After thesecond crop (maize), total N contents decreased in all treatments. Readily available Pgenerally increased in treatment MO, reflecting the release of adsorbed P from the soil.A decline in readily available P was observed in PK and in all the treatments in MI,which may be due to a faster release of P when organic manure was applied.. Therewere clear differences in readily available K in the control (C) between MO and MI,showing larger K contents when organic manure was applied. In both MO and MI theprevious application of K maintained the available K contents in the PK and NKtreatments at higher level but not in the NPK treatments. This may be explained by anaccumulation of K due to reduced K uptake caused by lack of N (PK treatment) or P(NK treatment). In the second crop (maize) residual effects on available K clearly de-clined but were apparent in PK and NK only.
Table 4. Effect of crop cultivation after long-term fertilization on soil nutrients
After wheat (1993) After maize (1994)T'reatment
O.M.TotalNAI. N r.a.P r.a. K O.M. Total N Al. N r.a. P r.a. Kg kg-lgkg-lmg kg mg kg- mg kg -' gkg4 g kg' mg kg - 'mg kg'mg kg -'
C 7.6 0.64 46.7 1.9 44.8 7.3 0.54 41.0 37.1PK 8.5 0.68 50.8 40.0 105.3 8.3 0.54 53.2 22.0 53.9
MO NK 8.2 0.71 52.5 2.9 116.9 8.9 0.59 68.4 5.0 54.3NP 10.7 0.80 115.5 14.0 49.2 9.9 1.37 73.0 20.1 40.1
NPK 10.5 0.84 121.1 9.5 55.6 10.1 0.67 76.9 27.0 33.5C 14.7 1.05 80.3 15.5 58.7 11.9 0.84 100.4 5.9 33.4
PK 15.5 1.06 82.3 73.6 109.5 15.4 0.85 99.0 38.4 58.3M NK 14.8 1.09 87.2 13.3 74.6 14.7 1.00 93.6 4.7 40.2
NP 15.5 1.13 91.2 42.3 49.0 12.9 0.84 62.5 16.2 31.9NPK 14.4 1.05 94.3 38.5 53.4 16.5 1.11 106.5 17.6 38.5
Note: OM. = organic matter; Al. N - alkalytic N (1.0 M NaOH incubation at 40 "C for24 h, reflecting the available N pool); r.a.- readily available
Conclusion
I) The yield response to residual effects of long-term fertilization was great. With or-ganic manure (M l), the yield amounted to 48% of the average yield of the preced-ing 7 years whereas it accounted for 53% when no organic manure was applied(MO).
321

2) Without organic manure (MO), it was the nutrient P which revealed the most sig-nificant residual effects followed by N and K fertilizer. For K, only small residualeffects were observed. This indicates that the application rate of 187.5 kg ha' is justenough to keep K in balance.
3) After long-term combined NPK application similar residual effects with regard toagronomic efficiency (0.44 kg nutrient kg' yield) in MO (no organic manure) and0.45 kg kg- in M I (organic manure) were observed.
4) Residual effects on yield parameters (plant height, ear length, number of spikeletsand grains per ear) were in the order of M1 > MO and NP, NK > NPK. Furtherstudy needs to be done to explore the reason.
5) After long-term fertilization, discontinuation of fertilization for one year (twocrops) did not have much effect on soil organic matter. Total N dropped in alltreatments and readily available K decreased drastically.
322

Soil K status and crop response of wheat to K application in the wheatproduction area of Southern Shanxi
Liu Yinzhong, Zhang Ouzhu, He Yuzhu, Li Zheng and Qiao Hongiin
Shanxi Province Soil and Fertilizers Work Station 030001
Abstract
The rise in multiple cropping index and crop yield increase in Shanxi fuelled by in-crease in mineral N and P consumption, insufficient return of K through organic ma-nure has caused that the loess derived fluvio-aquic soils and drab soils as major soiltypes in the wheat production areas in South Shanxi experienced a dramatic decline inK availability in recent years. The degree of the reduction varies according to soil, ag-ricultural ecosystem and soil fertility and followed the order of fluvio-aquic soil > drabsoil; basin > hills > tableland > mountain; and low fertility > high fertility > mediumfertility soils. Crop response to K is closely related to the status of soil K, showinggreat response of wheat where the readily available K was :< 80 mg kg -'. A value of100 mg K kg-' was found to be the critical value for K response under general produc-tion conditions. Under certain conditions, however, yield response to K applicationwas significant, even if the readily available K reached 120 - 130 mg K kg', highlight-ing the strong influence of site conditions (soil, climate) on the critical soil K thresholdlevels. Combined application of organic manure together with N and P fertilizers, 75 -225 kg ha' K20 increased wheat yields by 7.8 - 15.5% or 2.2 - 4.2 kg grain kg -' K20.Crop response to K was greater in soils with high fertility and smaller in soil with lowfertility. Including the current price relationships between grain and fertilizer, an opti-mal K application rate for wheat of 135 - 180 kg ha -' was worked out.
Introduction
Potassium is one of the nutrients that is needed for crop growth at largest amounts. Inrecent years, with an enhanced development of the agricultural production, the applica-tion rates of mineral N and P fertilizers were rising year by year and partly substitutedthe application of organic manure. This caused that potassium was only to a lesser ex-tent recycled to the field, leading to a steady decline in soil K reserves and a significantcrop response to mineral K application. Experiments and surveys were carried out toquantify the change in soil K and crop response to K application in the wheat produc-tion area in South Shanxi. The study here analyses the changes in readily available K,depending on agro-ecosystem and tries to link changes in soil fertility to yield andyield parameters of wheat: In the end, an attempt is undertaken to develop an appropri-ate fertilizer recommendation for wheat in various important agro-ecological regions inShanxi.
323

Changes in soil K in the wheat production area in South Shanxi
Changes in readily available K in different soil types
The survey carried out in 1997, covering 519 sites in Linfen and Yuncheng revealed
that in recent years readily available K in soils of fields cultivated with wheat showeda distinct downward trend. The extent to which this decline occurred differs from soilto soil. It dropped faster in fluvio-aquic soil than in drab soil. In comparison to 1983,readily available K of fluvio-aquic soils dropped by 39.7mg kg-' (average) at a rate of2.8 mg kg-' per year while in cinnamon soils it decreased by 21.8 mg kg-' at a rate of1.6 mg kg-' yr'. Among the fluvio-aquic soils, the severity in decline followed the or-der: salinized fluvio-aquic soil > fluvio-aquic soil > de-fluvio-aquic soil. Among thedrab soils, the sequence was cinnamon-like soil > fluvio-aquic cinnamon soil > cal-careous cinnamon soil > cinnamon soil (Table I).
Table 1. Contents of readily available K of different soil types (983 and 1997)
Soil Number of 1983 1997 Balancesamples (mg kg- ) (mg kg') (mg kg') (%)
Cinnamon 39 190 186 -4 -2.1Calcareous cinnamon 158 173 150 -23 13.2Cinnamon-like soil 137 167 132 -35 26.5Fluvio-aquic cinnamon 55 178 153 -25 14.0Fluvio-aquic soil 95 155 127 -28 18.1De-fluvio-aquic soil 24 207 186 -21 10.1Salinized fluvio-aguic soil I1 221 151 -70 31.7
Changes in readily available K in soils of different agricultural ecosystems
Table 2 shows that readily available K in all the analysed soils showed a downwardtrend, which varied strongly in its extent among the different agricultural ecosystems.
It dropped fastest in the basins, by 34 mg kg' (at a rate of 2.4 mg kg- yr-'). The declinein readily available K followed the order of basin > hills > tableland > mountains.
Table 2. Contents of readily available K in soils of different agricultural ecosystems(1983 and 1997)
Ecosystem Number of 1983 1997 Balancesamples (mL ku') (mg kg " ) (mg kg-') (%)
Basin 220 174 140 -34 -19.5Tableland 99 199 169 -30 -15.1Hills 185 175 142 -33 -18.9Mountain 15 121 114 -7 -5.8
324
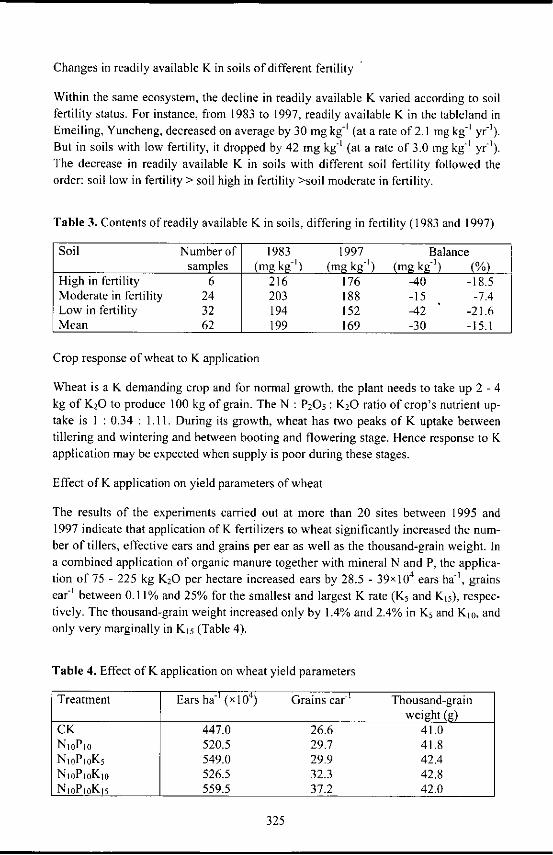
Changes in readily available K in soils of different fertility
Within the same ecosystem, the decline in readily available K varied according to soilfertility status. For instance, from 1983 to 1997, readily available K in the tableland inEmeiling, Yuncheng, decreased on average by 30 mg kg -' (at a rate of 2.1 mg kg -' yr-).But in soils with low fertility, it dropped by 42 mg kg' (at a rate of 3.0 mg kg- ' yr-').The decrease in readily available K in soils with different soil fertility followed theorder: soil low in fertility > soil high in fertility >soil moderate in fertility.
Table 3. Contents of readily available K in soils, differing in fertility (1983 and 1997)
Soil Number of 1983 1997 Balancesamples (mg kg-') (mg kg') (mg kg -') (%)
High in fertility 6 216 176 -40 -18.5Moderate in fertility 24 203 188 -15 -7.4Low in fertility 32 194 152 -42 -21.6Mean 62 199 169 -30 -15.1
Crop response of wheat to K application
Wheat is a K demanding crop and for normal growth, the plant needs to take up 2 - 4kg of K20 to produce 100 kg of grain. The N : P20 5 : K20 ratio of crop's nutrient up-take is I : 0.34 : 1.11. During its growth, wheat has two peaks of K uptake betweentillering and wintering and between booting and flowering stage. Hence response to Kapplication may be expected when supply is poor during these stages.
Effect of K application on yield parameters of wheat
The results of the experiments carried out at more than 20 sites between 1995 and1997 indicate that application of K fertilizers to wheat significantly increased the num-ber of tillers, effective ears and grains per ear as well as the thousand-grain weight. Ina combined application of organic manure together with mineral N and P, the applica-tion of 75 - 225 kg K20 per hectare increased ears by 28.5 - 39x104 ears ha ', grainsear' between 0.1 % and 25% for the smallest and largest K rate (K5 and K15), respec-tively. The thousand-grain weight increased only by 1.4% and 2.4% in K, and K,0, andonly very marginally in Ki5 (Table 4).
Table 4. Effect of K application on wheat yield parameters
Treatment Ears ha-I (xl0 4) Grains earT Thousand-grainweight (g)
CK 447.0 26.6 41.0N,oP,o 520.5 29.7 41.8NjoPjoK5 549.0 29.9 42.4N,oP,K,o 526.5 32.3 42.8NP,oK,5 559.5 37.2 42.0
325

Effect of K application on wheat yield
Using 150 kg of N and P20 5 ha', the application of 75 - 225 kg K20 per hectare in-creased the yield of wheat by 316.5 - 625.5 kg or by 7.8% - 15.5%. K efficiency was2.16 - 4.22 kg kg- ' K20 (Table 5). Crop response varied according to soil fertility. Insoils where the yield of non-fertilized wheat exceeded 2,250 kg ha', the application ofK increased the yield by 379.5 - 532.5 kg or 8.6% - 16.6% which equals 2.37 - 5.06 kgkg' K20. In soils where the yield of non-fertilized wheat was less than 2250 kg ha ',the application of K increased the yield by 150 - 378 kg (5.5% - 13.6%) equivalent to1.6 - 2 kg kg' K20 (Table 6). It is obvious that the yield-increasing effect of K appli-cation is greater in fertile soils than in soils moderate or low in fertility.
Table 5. Crop response of wheat to K application
Treatment Yield (kg ha-1) A Akg ha- % (kg kg-') K2
CK 2949N,oP,o 4040 - -
NjoPjoK5 4356 316 7.8 4.22NjoPjoKjo 4665 525 15.5 4.17NjoPiol(j5 4526 486 12.0 2.16
Table 6. Crop response of wheat to K application, varying with soil fertility
Yield in CK* <2250 kg ha' Yield in CK > 2250 kg ha- 'Treatment Yield A A Yield A A
kg ha-' % kg kg' K20 kg % kg kg-'1 K20CK 1880 3287NjoPjo 2777 4427NjoPjoK5 2928 5.5 2.20 4806 8.6 5.06NjoPioKu 3080 10.9 2.02 5165 16.6 4.92NjoPioK,_ 3155 13.6 1.68 4959 12.0 2.37
*CK - control (without mineral fertilizer)
Effect of K application on wheat quality
According to the tests in Yuncheng, Yongji, Linfen, Quwo and Hongdong counties, Kapplication increased crude protein and crude oil in wheat by 9.1% - 11.4% and 3.5% -5.5%, respectively. Meanwhile, it also significantly increased the content of the valu-able amino acids, e.g. serine, glucine, leucine and lysine in grains.
326

Effect of K application on stress-resistance of wheat
Application of K to wheat significantly improved the crop's stress-resistance. Observa-tions showed that application of K fertilizers improved crops' resistance to drought. In
1996- 1997, wheat seriously suffered from drought during its growing period. Onlycrops supplied with K maintained their yield. In Linyi County, the wheat crop in a333.3 hectare K demonstration field grew healthily with dark green leaves and wellfilled grains. In comparison with fields without K application, K increased the thou-sand-grain weight by 1.2 g and yield by 600 kg ha I or 14.3%. The results of the ex-periment in Yuncheng showed that after K application, high-yielding wheat shortenedthe distance between the first node and the second by I - 2 cm and thickened the wallof the second section of the stalk by 54.6 prm. The mechanical tissue increased by 52pIm in thickness, thus strengthening the crop's tendency to lodge. Investigations of a
number of experiments revealed that addition of K application to the basal N and Pfertilizer application reduced incidence of sheath blight by 25% - 67%. The effect wasmore significant the greater the application of K.
Techniques for K application on wheat
Soil conditions and K application
Results of the multi-location field experiment showed that in wheat fields with soil,containing <100 mg kg-1 of readily available K, potassium application in addition to Nand P fertilizers significantly or highly significantly increased yield. Consequently,100 mg kg -' readily available K can be regarded as the critical threshold value of soilsunder general production conditions. In some fields where the crop was sown late, de-spite the fact that readily available K in the soil ranged between 120 - 130 mg kg -1,there was a clear yield response to K application. Therefore, the content of soil K atwhich K response is observed varies with crop yield and other ecological and technical
factors.
K application rate
The decision how much K should be applied is closely associated with soil fertility andthe soil's K supply capacity. The results of the experiment on K application rate con-
ducted between 1995 and 1997 showed, under the current pricing system and agricul-tural production management, the optimal K20 application rate for wheat is 135 - 180kg K20 ha - . The smaller amount is for soils with high fertility and the large amount
for soils with low fertility (Table 7).
327

Table 7. Equation for calculating effect of K application on wheat and optimal appli-cation rate (kg K20 ha')
Yield level Equation R Optimal rate (kg ha-')(kg ha- )> 2250 r- 44 10 +8.3x-0.0253x' 0.9949 138< 2250 v-2772+2.45x-0.0327 2 0.9956 184.2
Timing of K application
Wheat has a typical K nutrient uptake during the growing season with a peak, occur-ring between tillering and flowering stage. Therefore, K application at an early stagecan cause the major yield response to K application. In Linfen City, the results of anexperiment on K application at different wheat growth stages in fields with a moderatesoil fertility indicate that K applied either in one application as basal dressing or splitinto 60% as basal and 40% as side-dressing at greening stage produced the best results.100% used as side-dressing produced the smallest yield increase (Table 8).
Table 8. Effect of K application at different growth stages on wheat yield
Treatment Pattern of K Range of yield Mean yield Aapplication (kg ha-') (kg ha- ') kg ha-' %
NP(CK) None 4368-5552 5259NPK (B) 100% (B) 5180-6243 5825 566 10.8NPK(B+S) 60% (B),40%(S) 4955-6087 5573 314 6.0NPK (S) 100%(S) 4653-5708 5456 182 3.4
Note: (B) = basal and (S) = side dressing.
Placement of K
Studies on placement (results not shown) revealed that band application produced thebest effect. Foliar application at booting and milking stages also led to a significantyield response.
Conclusion
I) Fluvio-aquic soils and drab soils are the major soil types in the wheat productionareas in South Shanxi. Derived from loess, they usually contain 80 - 200 mg kg'
readily available K. In recent years with the rise in multiple cropping index andcrop yield increase caused by larger N and P application rates, concomitant reduc-tion of organic manure application, an imbalance of NPK nutrient input ratios oc-curred. The surplus of N and P and the deficit of K accelerates the decline of readilyavailable K. The degree of the reduction varies according to soil, agricultural eco-
328

system and soil fertility and followed the order of fluvio-aquic soil > drab soil; ba-
sin > hills > tableland > mountain; and low fertility > high fertility > medium fertil-
ity soils.
2) Crop response to K is closely related to the status of soil K. In wheat fields of South
Shanxi with readily available K < 80 mg kg -1, crop response was high. The value of
100 mg kg- can be taken as the critical value for K response under general produc-
tion conditions. In some individual wheat fields where the crop was sown late or the
soil texture consisted of heavy clay, crop response to K application was significant,even if the readily available K reached 120 - 130 mg kg-'. This indicates the strong
influence of site conditions on the critical K value of a soil.
3) Crop response varies with soil fertility. On the basis of rational application of or-
ganic manure and N and P fertilizers, application of 75 - 225 kg ha-' K20 increasedthe yield by 7.8 - 15.5% equivalent to 2.16 - 4.22 kg kg -' K20. Crop response was
greater in soils with high fertility and smaller in soil with low fertility.
4) Under the current agricultural management and pricing (grain versus fertilizer) sys-tem, the optimal K application rate for wheat is 135 - 180 kg K20 ha -'. The smaller
rate is for wheat fields high in soil fertility and the larger rate for wheat fields low in
soil fertility. Best results were obtained when K fertilizers were applied as basal
dressing and banded along the seeding rows.
329


Effects of K application to a long-term crop rotation of rice, wheatand oilseed rape on yields and soil fertility
He Caifu', Sun Xifa' and Qiu Gubin2
Soil and Fertilizers Institute, Sichuan Province Academy of Agricultural Science6100662 Leshan City Agricultural Research Institute, Sichuan Province, 614216
Abstract
A long-term field experiment in Hongnitian, Sichuan, on the application of potassiumand organic manure was carried out with 23 crops of rice, wheat and oilseed rapegrown in a crop rotation. The six treatments consisted of 1. CK (no fertilisation) 2. NP(120 kg N and 60 kg P205 ha-'), 3. NPK (120 kg N and 60 kg P20 5 ha' and 60 kg K20ha'), 4. OM (15 tons ha 1 pig dung), 5. OM + NP and 6. OM + NPK. Results showedthat the yield was largest in the treatment NPK and OM + NPK. The yield differencesbetween treatments with and without K increased with the duration of the experiment.On average of the whole rotation, yield differences due to K application were 37.4%and 11.7% for rice, 248.6% and 142.1% for wheat and 89.7% and 17.3% for oilseedrape, in the NPK and OM + NPK treatments, respectively. Crop response to K withoutorganic manure (NPK) was larger than with organic manure (OM + NPK). Soils underlong-term K application had a reduced bulk density, greater porosity and containedlarger amounts of soil organic matter as well as larger N and P contents. The K : Nratios in plant tissues were used to determine whether K deficiency occurred for therespective crop. The results indicate that K deficiency for rice can be expected if theK : N ratio in the plant is <0.6. For wheat and oilseed rape, K deficiency can be ex-pected at K : N ratios <0.5. The steady rise in N and P application rate and the declin-ing recycling of K to the field through organic manure led to a nutrient imbalance andto a K deficit in the soil. As a result, crops began to show K deficiency symptoms andbecame more susceptible to plant diseases, thus greatly affecting the crops' yield andquality.
Introduction
With the introduction of high yielding crop rotations, relying increasingly on the sup-ply of mineral nitrogen and phosphorus in the Sichuan Province, observations revealedthat yields stagnated or even declined. In order to find out whether this is caused by anundersupply of potassium, which during this time was rarely applied as a standard fer-tilization, in 198, a long-term experiment on K application was laid out on a red earthin Jiufeng township, Leshan City. The experiment was designed to test the effect ofpotassium in a rotation of rice-wheat-rice-oilseed rape of 23 crops altogether. The ob-
331

jectives of this study were to monitor yield differences and to assess the effect of Kapplication on soil mineral and physical conditions with and without the use of organicmanure. Furthermore, plant tissue analysis was carried out with the aim of definingcritical K : N ratios as a K deficiency indicator.
Materials and methods
The experimental soil was a red earth with a sandy loam texture derived from thickcolluvial sandstone of the Jiaguan Group. Prior to the experiment, the soil of theplough layer had a pH of 6.6 and contained 15.6 g kg -' organic matter, 0.7 g kg-1 totalN, 0.66 g kg' total P, 15.5 g kg' total K and 79.1 mg kg-1 slowly available K. Thecontents of available nutrients in the soil were N - 78 mg kg -', P = 27.7 mg kg', K -21.2 mg kg-', Mg = 12.2 mg kg 1, B - 2.0 mg kg -', Zn = 1.0, Mn = 0.13 mg kg-' andMo = 0.01 mg kg -' Mo.The plot size was 13.34 m 2 and the treatments were randomly arranged and four timesreplicated. To separate the fields from each other, a piece of cement board was buried30 cm deep into the soil to prevent nutrient transfer from one plot to another. Ditcheswere also built between plots for irrigation and drainage. The crops used in the ex-periment were rice, wheat and oilseed rape cultivated in a rotation of rice - wheat -oilseed rape, according to the following sequence (crop No. in the rotation in brack-
ets):
Year Crop Crop
1981: Rice (1)1982: Wheat (2) - Rice (3)1983: Oilseed rape (4) - Rice (5)1984. Wheat (6) - Rice (7)1985: Oilseed rape (8) - Rice (9)1986: Wheat (10) - Rice (11)1987: Oilseed rape (12) - Rice (13)
1988: Wheat (14) - Rice (15)1989: Oilseed rape (16) - Rice (17)1990: Wheat (18) - Rice (19)1991: Oilseed rape (20) - Rice (21)1992: Wheat (22) - Rice (23)
The fertilizer treatments consisted of the following 6 basic treatments and 2 additionaltreatments (7. and 8.) added during the course of the experiment:
1. CK (non-fertilized)2. NP(120 kg N and 60 kg P20 5 ha - ')3. NPK (120 kg N and 60 kg P20 5, 60 kg K20 ha1)
4. OM (15,000 kg ha-' pig dung)5. OM + NP6. OM + NPK7. NP + K (60 kg K20 ha - ', applied to crop (8) - (13))8. OM + NP (60 kg K20 ha 'to crop (8) - (13))
332

The continued omission of K, especially in treatment 2. (NP) and 5. (OM + NP) led toa drastic depletion of the K reserves in the soil. Therefore, starting with oilseed rape
(8) in 1985, two of four replicates of NP, OM + NP received 60 kg K2 0 ha'- for anentire rotation of six consecutive crops, ending with rice (13) in 1987. With this kindof arrangement the question should be answered whether fresh K applications to soilsdepleted for a certain period can fully overcome the yield gap that developed betweenthe fertilized and non-fertilized plots. Furthermore, it was of interest whether similarcrop productivity can be re-established by this measure. K supplementation was dis-continued, starting from the 14t' crop (wheat), to determine the residual effect of Kapplication in wheat and the succeeding rice as 15tb crop in the rotation.Plant analysis was carried out at different stages during the vegetation period to deter-mine the nutrient contents and to develop critical K : N ratios which could indicate theoccurrence of K deficiency. For this purpose, whole plants were harvested at culmelongation and heading for rice, tillering, stem elongation and head emergence forwheat, rosette, booting and flowering stage for oil seed rape. Samples were analysed,using conventional methods.
Results and discussion
Effect of long-term nutrient application
The incremental yields of the crops due to K application with and without organic ma-nure (OM) for the period 1981 - 1992 are shown for each crop individually in Figure1-3. Yield increments compared to the NP control were significant in all crops in each
year.
1--NPK -1-OM+NPK
3500
a 3000
2500
2000S 1500
.E 1000 7
500
1981 1982 1983 1984 1985 1986 1987 1988 1989 1990 1991 1992
Year
Figure I. Incremental crop response of rice to K application in comparison to the NPtreatment (NP or OM+NP)
333

I-- NPK -0l- OM+NPK
2500 -
L 2000
1500Ee 1000
500
0-
1982 1984 1986 1988 1990 1992
Year
Figure 2. Incremental crop response of wheat to K application in comparison to theNP treatment (NP or OM+NP)
-4- NPK -Cl OM+NPK
1200
1000
800-
600
. 400
: 200" 0
1983 1985 1987 1989 1991
Year
Figure 3. Incremental crop response of oilseed rape to K application in comparison tothe NP treatment (NP or OM+NP)
With few exceptions (possibly due to variation of conditions from year to year), in allthree crops, the average yield increments due to K were larger in the NPK than in theOM+NPK plots. This indicates that crops benefited from better K supply in the plotsreceiving manure as was also confirmed by the higher yield level in these plots.The average yields of the three crops differed between the various treatments(Table 1). Rice yields were smallest in the NP treatment, indicating a slight depressiveeffect if only nitrogen and phosphorus were applied. Organic manure alone (OM)caused a yield increase over the control (CK) of 27.3% followed by OM + NP with30.6%, NPK with 36.3% and OM + NPK with 45.8%. This observation shows that
334
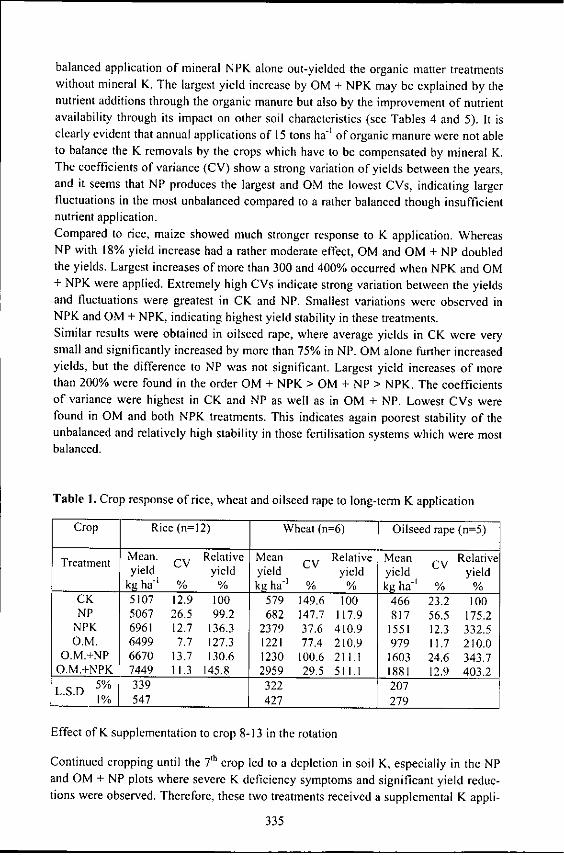
balanced application of mineral NPK alone out-yielded the organic matter treatmentswithout mineral K. The largest yield increase by OM + NPK may be explained by thenutrient additions through the organic manure but also by the improvement of nutrientavailability through its impact on other soil characteristics (see Tables 4 and 5). It isclearly evident that annual applications of 15 tons ha" of organic manure were not ableto balance the K removals by the crops which have to be compensated by mineral K.The coefficients of variance (CV) show a strong variation of yields between the years,and it seems that NP produces the largest and OM the lowest CVs, indicating largerfluctuations in the most unbalanced compared to a rather balanced though insufficientnutrient application.Compared to rice, maize showed much stronger response to K application. WhereasNP with 18% yield increase had a rather moderate effect, OM and OM + NP doubledthe yields. Largest increases of more than 300 and 400% occurred when NPK and OM+ NPK were applied. Extremely high CVs indicate strong variation between the yieldsand fluctuations were greatest in CK and NP. Smallest variations were observed inNPK and OM + NPK, indicating highest yield stability in these treatments.Similar results were obtained in oilseed rape, where average yields in CK were verysmall and significantly increased by more than 75% in NP. OM alone further increasedyields, but the difference to NP was not significant. Largest yield increases of morethan 200% were found in the order OM + NPK > OM + NP > NPK. The coefficientsof variance were highest in CK and NP as well as in OM + NP. Lowest CVs werefound in OM and both NPK treatments. This indicates again poorest stability of theunbalanced and relatively high stability in those ferfilisation systems which were mostbalanced.
Table 1. Crop response of rice, wheat and oilseed rape to long-term K application
Crop Rice (n= 12) Wheat (n=6) Oilseed rape (n=5)
Treatment Mean. CV Relative Mean Relative Mean CV Relativeyield yield yield yield yield yield
kg ha " I% % kgha- % % kg ha - ' % %CK 5107 12.9 100 579 149.6 100 466 23.2 100NP 5067 26.5 99.2 682 147.7 117.9 817 56.5 175.2
NPK 6961 12.7 136.3 2379 37.6 410.9 1551 12.3 332.5O.M. 6499 7.7 127.3 1221 77.4 210.9 979 11.7 210.0
O.M.+NP 6670 13.7 130.6 1230 100.6 211.1 1603 24.6 343.7O.M.+NPK 7449 11.3 145.8 2959 29.5 511.1 1881 12.9 403.2
L.S.D 5% 339 322 207I % 1 547 427 279
Effect of K supplementation to crop 8-13 in the rotation
Continued cropping until the 7tb crop led to a depletion in soil K, especially in the NPand OM + NP plots where severe K deficiency symptoms and significant yield reduc-tions were observed. Therefore, these two treatments received a supplemental K appli-
335

cation of 60 kg ha ' K 20 per crop over an entire rotation from the 8 h crop to the 13thcrop which again was discontinued in the 4t" (wheat) and 15th crop (rice).Table 2 shows that the supplementation of 60 kg K20 ha-' to these two treatments in-creased the yield drastically. In both years of rapeseed cultivation, yields almost dou-bled in the NP+K treatment but had no effect in the OM+NP+K treatment. In bothtreatments which were supplemented with K, yields were inferior to those in the re-spective NPK or OM + NPK plots. This clearly indicates that yields after fresh appli-cation of K to depleted soils could not catch up with those in continuously fertilizedplots.Dramatic yield increases were also observed in rice, following the K supplementationand yields jumped by almost 30% in NP+K. In the OM+NP plots, yields increased byalmost 20% after K was applied. Yields of the supplemented treatments could clearlycatch up with those which until this point had received a continued supply (NPK, OM+ NPK) of potash over the years.In wheat, only one crop enjoyed the K supplement in 1986, when yields in both NP+Kand OM + NP+K were about three times increased compared to NP and OM + NP.Wheat is hence the crop in the rotation with the strongest response to K supplementa-tion after long-term depletion of potash reserves in the soil. Comparing the supple-mented plots (NP+K, OM +NP+K) with those of continuously K supplied treatments(NPK, OM +NPK) reveals that the continued supplied crops showed slightly largeryields. Supplementation after depletion of K was hence inferior to continued K appli-cation.
Table 2. Effect of K supplementation on rice, wheat and oilseed rape
Crop Year NP NP+K* NPK OM +NP OM+NP OM Crop+K* +NPK order*
Oilseed 1985 717 1379 1686 1820 1820 1950 (8)rape 1987 987 1622 1730 1877 1890 2033 (12)
Mean 852 1500 1781 1848 1856 1992
Rice 1985 4053 5784 5769 5406 6675 6323 (9)1986 5654 6801 6744 6053 7289 7434 (11)1987 5205 6413 6717 6512 7391 7370 (13)1988 4352 4955*** 7545 7029 7098*** 8052 (15)
Mean 4816 5988 6694 6250 7113 7295
Wheat 1986 905 2408 2477 875 2711 2885 (10)
Wheat 1988 179 371*** 2390 384 837*** 3014 (14)
Mean 542 1390 2434 1259 3548 2950
*60 kg K20 ha- applied to former treatments NP and OM+NP to crop (8)-(13)**in the rotation (see Materials and Methods)***yields after re-omission of K application to crop (14) and (15)
336
After discontinuing the K supplementation to wheat (14), yields were still about dou-ble those of the respective NP and OM + NP crop. This indicates a strong residual ef-fect of previous application of 360 kg K20 ha I to six crops. However, looking at theoverall yield level obtained in the same year, especially those observed in NPK andOM + NPK, reveals a dramatic yield loss by omitting K again. Yields in the NPK andOM + NPK plots were 6.4 and 3.6 times larger than in the respective supplementedcrops after reintroducing K omission.Similar effects were observed in rice, succeeding wheat in the rotation ( 15
th crop).
Though yield differences were significantly increased in both NP+K and OM + NP+Kwith almost 14% and about 1% compared to NP and OM + NP, they were much lessdramatic than in wheat. The NP+K treatment was clearly inferior to the NPK treat-ment, showing a less pronounced residual effect. In view of the overall yield level inthe continued fertilized treatments, the two supplemented treatments were clearly infe-rior.Both the example of wheat and rice show that even though significant residual effectsof previous K application exist, the duration of this effect is very limited and yieldscompared to continued fertilized crops were clearly inferior. Therefore, it can be con-cluded that under the studied conditions it is important to continuously supply K forsustained large yields with little fluctuation between the years.
Effect of long-term nutrient application on K uptake by and the K : N ratios in thecrops during growth
The K concentration in the plant tissue and the K : N ratios have been used for diag-nosing the K status of the crops (Table 3). Rice: The analysis of rice during culm elon-gation and heading stages reveal poor K status of especially NP, CK and OM + NP.Only the two treatments with K application showed K concentrations in the sufficiencyrange. Caused by dilution during growth there was a further decline in K concentra-tions until heading stage. The K : N ratios showed the same trend and were extremelylow in NP and OM + NP. Serious K deficiency was observed when rice showed Kconcentrations during culm elongation stage of <1%. So the plants suffered extremelyfrom K deficiency in the following order NP > OM + NP > OM. The plants were re-tarded in growth and yields were strongly affected. When K : N ratios were below 0.4,plants generally suffered from K deficiency and this could be overcome once K : Nwas clearly above 0.5 so that the recommended ratio for rice is >0.5.Wheat: Tissue K concentrations in wheat followed a similar pattern with greatest val-ues at tillering followed by stem elongation and head emergence (Table 3). There wereagain significant differences between the treatments in the order CK < NP < OM + NP< OM < OM + NPK < NPK. This order changed with the age of the crop, when thedilution of K by growth due to a more intensive biomass production in NP and OM +NP caused a stronger K depletion of the plants compared to CK. This pattern persistedalso throughout the head emergence stage. K : N ratios indicate the same trends andwere extremely wide, below 0.2 in the NP plot at heading stage. Deficiency symptomswere already severe at K : N ratios of < 0.4 during stem elongation stage when K con-centrations hardly reached 2.0% in all treatments with the exception of NPK. Stem
337

elongation is still a phase in which corrective applications with potassium can reduce
the occurrence of yield depression due to K deficiency. Therefore, it is recommended
that during this period tissue samples are taken and K : N ratios determined which ac-
cording to the trial observations should be above 0.5 to avoid K deficiency.
Oil seed rape: In this crop, plant tissue samples were collected at rosette, booting and
flowering stage. Again the largest K concentrations in the plant tissue were observed at
the youngest stage and declined with the age of the plants (Table 3). During all growth
stages, there were significant differences in the K concentrations and the K : N ratios
in the plant tissue between the treatments. Similar to wheat during the early growth, at
rosette stage of the oilseed rape, the K concentrations and K : N ratios were smallest in
CK followed by OM + NP < OM < NP. This changed dramatically with the increasing
biomass production during growth. Based on the observations during the crop monitor-
ing, the K : N ratios in the biomass of oilseed rape at booting should be > 0.5 to secure
adequate K supply for large yields.
Table 3. K concentrations in plant tissues and K : N ratios as affected by fertilizer ap-
plication and growth stage
Crp rowth OM ONMGstage Item CK NP NPK OM +NP +NPK Mean
Rice Culm K (%) 0.71 0.44 1.55 0.87 0.73 1.67 0.99elongation K: N 0.45 0.17 0.55 0.52 0.26 0.57 0.42
Heading K (%) 0.31 0.19 0.69 0.47 0.33 1.05 0.51K: N 0.30 0.13 0.59 0.46 0.21 0.73 0.40Yield
Harvest (kghal ) 5619 5354 6749 6794 6051 7436 6334
Wheat Tillering K (%) 1.34 1.47 3.67 2.43 1.77 3.56 2.37
K: N 0.27 0.41 0.66 0.48 0.29 0.62 0.46
Stem K (%) 1.14 0.74 2.45 1.79 0.94 1.97 1.51
elongation K: N 0.36 0.16 0.51 0.49 0.19 0.43 0.36
Head K (%) 0.51 0.40 0.89 0.71 0.49 0.79 0.63emergence K: N 0.48 0.18 0.62 0.55 0.30 0.48 0.44
YieldHarvest (kg ha') 438 940 2478 1167 875 2885 1464
Oilseed Rosette K(%) 1.23 1.82 2.88 1.62 1.09 2.20 1.81
rape K: N 0.43 0.12 0.54 0.51 0.19 0.40 0.37
Booting K(%) 1.20 0.67 1.63 2.39 1.09 2.05 1.51K: N 0.39 0.15 0.33 0.57 0.23 0.42 0.35
Flowering K(%) 1.34 0.61 1.44 2.15 1.05 2.06 1.44K: N 0.46 0.14 0.35 0.63 0.25 0.51 0.39Yield
Harvest (kg hal) 486 984 1730 1049 1877 2033 1360
338

Effect of long-term K application on soil fertility
In 1990, soil analysis for physical and chemical properties was carried out after harvestof rice ( 19 h crop). The results show that the un-fertilized control (CK) had a greaterbulk density and smaller total porosity than the treatments O.M. and O.M.+NPK (Ta-ble 4). This improved porous system through fertilization was also evident from thelarger proportion of the gas phase. It shows that particularly the application of organicmanure breaks up the soil and improves aeration, thus raising the soil's ability of con-serving water and nutrients. Though less pronounced, also the application of mineralfertilizers alone (NP, NPK) improved soil physical properties. This may be explainedby larger amounts of roots and residues remaining on the field after harvest comparedto the CK treatment.
Table 4. Effect of long-term nutrient application on soil physical parameters
OM + OM+Parameter CK NP NPK OM NP NPK
Bulk density (g cm 3) 1.36 1.36 1.31 1.28 1.27 1.26
Total porosity (%) 48.64 50.34 50.64 51.70 52.23 52.34
Gas phase proportion (%) 4.53 8.20 11.58 12.60 10.76 13.85
Liquid phase proportion (%) 43.28 44.32 44.35 45.60 42.33 46.27
Chemical soil analyses from the plough layers of different treatments were carried outat the time when the experiment was laid out in 1981 and after rice (I 9 th crop) in 1990.
The results reveal the following:1. Total nutrients: Total nitrogen in the soil decreased slightly by about -4.6% com-
pared to 1981 in CK and NPK, remained unchanged in NP and increased by about+4.6% in OM and by about +17.4% in both OM + NP and OM + NPK. A very
similar observation was made for total P, which slightly declined by -9.8% in CK,-2.8% in NPK, remained again unchanged in NP and increased by +7.0% in OM,+47.9% in OM + NP and 45.1% in OM + NPK. In contrast, all treatments showed a
decline in total K which surprisingly was most severe in NPK and OM + NP with-13.3% compared to the initial level in 1981. The smallest decline of -9.8% in total
K was observed in OM. Even OM + NPK revealed a strong decline in total K of-12.5% which indicates that despite largest K supply by both mineral and organicsources the nutrient balance for K was obviously negative in this system.
2. Organic matter: Soil organic matter contents declined by almost -9% in CK whereasthey increased in all the fertilized treatments in the order NP (2.6%) < NPK (5.1%)< OM + NPK (14.7%) < OM (16%) < OM + NP (20.5%). This clearly shows theimportance of organic manure in increasing soil organic matter. What becomes alsoevident is, however, that mineral fertilisation also substantially contributes to a
339

maintenance or even slight improvement of the SOM status under intensive crop ro-
tation systems.3. Available nutrients: The available nitrogen contents only declined in the CK
(-2.6%) whereas they increased in all the other treatments in the order NPK (2.6%)
< OM + NP (5.1%) < NP (7.7%) < OM and OM + NPK (both 21.8%). The avail-able phosphorus contents, which were very high at the beginning of the trial, de-clined in all treatments in the order CK (-89.5%) > NPK (-76.9%) > OM (-75.4%) >NP (-67.5%) > OM + NPK (-58.8%) > OM + NP (-58.5%). The accumulated P inthe soil due to previous P application prior to the experiment was therefore depleted
to a very great extent in all treatments with the exception of those receiving organicmanure. To maintain soil productivity, in the mid to long-term, therefore largeramounts of mineral P than the 60 kg P20 5 ha
l in the experiment should be applied.A similar trend was observed in case of available K where the decline was most se-vere in NP (-47.2%) followed by OM + NP (-40.6%). The other treatments fol-lowed in the order OM (-32.5%) > CK (-23.1%) > NPK (-20.7%).
Table 5. Comparison between soil nutrient contents at the beginning of the experiment(1981) and after continued cultivation of 19 crops (1990) as affected by nutri-ent application
Parameter Year 1981 Year 19901981
OM + OM+CK NP NPK OM NP NPK
Total N 0.086 0.082 0,086 0.082 0.09 0.101 0.101
Change (1981-1990) -0.004 0 -0.004 0.004 0.015 0.015
Total P (P 205 ) 0.071 0.064 0.071 0.069 0.076 0.105 0.103
Change (1981-1990) -0.007 0 -0.002 0.005 0.034 0.032
Total K (K20) 1.570 1.391 1.397 1.361 1.416 1.361 1.373
Change (1981-1990) -0.179 -0.173 -0.209 -0.154 -0.209 -0.197
Organic matter 1.56 1.42 1.60 1.64 1.81 1.88 1.79
Change (1981-1990) -0.14 0.04 0.08 0.25 0.32 0.23
Available N 78.0 76.0 84.0 80.0 95.0 82.0 95.0Change (1981-1990) -2.0 6.0 2.0 17.0 4.0 17.0
Available P20 5 27.7 2.9 9.0 6.4 6.8 11.5 11.4Change (1981-1990) -24.8 -18.7 -21.3 -20.9 -16.2 -16.3
Available K20 21.2 16.3 11.2 16.8 14.3 12.6 17.1
Change (1981-1990) -4.9 -10.0 -4.4 -6.9 -8.6 -4.1
In conclusion, based on the selected chemical parameters a general declining trend ofsoil fertility could be observed. This could partly be compensated or even reversed,e.g. for total organic matter content and nitrogen contents by the use of organic manure
340
but not for the nutrient K. Mineral application could partly compensate for the lossesin P and especially K fertility. However, employed application rates in the experimentwere obviously too small to maintain adequate supply levels. Using the described soilfertility indicators, OM + NPK appeared as the most sustainable system in the experi-ment.
Conclusions
The yield-increasing effects of applying K in combination with NP and in particularwith organic manure (OM + NP) on rice, wheat and oilseed rape was evident throughthe 12-year experiment, comprising 23 crops. The significance of yield differences tothe treatments without K increased with the duration of the experiment. Supplementa-tion of K to the cropping system after the 7 h crop of continued cultivation without Kshowed that yields immediately recovered, but that yield levels clearly remained belowthose of continuously K supplied crops. Re-omission of K after supplementationcaused that yields of succeeding wheat and rice crops dropped quickly again. Planttissue analysis at various growth stages of the crops revealed that integrated analysis ofN and K contents, including K : N ratios are valuable diagnostic tools. All three cropssuffered serious K deficiency and lost much of their yield when the K : N ratios were <0.2. K deficiency and concomitant yield losses already appeared when K : N ratioswere < 0.4. At K : N ratios of > 0.5, normal crop growth can be expected and it wasfound that an adequate K : N ratio is > 0.6 for rice and > 0.5 for oilseed rape and wheatat the early growth stages. Using this assessment would allow a supplementation of Kduring the growth period if poor K status has been diagnosed. The development of soilphysical and chemical parameters indicate a strong deterioration of the soil conditionsif inadequate amounts of nutrients are applied. Even in the NPK treatments, the ap-plied amounts of P and K were insufficient to compensate for removals and otherlosses from the soil. Maintenance or improvement of the soil fertility can only beachieved if nutrient removals are balanced with the application and organic manure isapplied in combination with mineral fertilizers.
341


Chapter V
Nutrient managementin perennial crops, cash cropsand in special applications
343

Nutrient turnover and requirements in perennial crops using oil palmas an example
Rolf H5rdter
Coordinator East/South East Asia, International Potash Institute,c/o K+S KALI GmbH, Kassel, Germany
Introduction
Oil palm has become one of the most important vegetable oil producing crops in theworld. Having its origin in the Guinea zone of West Africa, oil palm today is found ina narrow band of 100 north and south of the equator. The main producers of palm oilare the two SE Asian countries Malaysia and Indonesia. The reason for the great ex-pansion of this crop in these two countries may be largely the favorable climate withan average rainfall of clearly above 1,600 mm per year. This is usually more than inthe area of its origin. Oil palm moreover has shown to be the most suitable crop culti-vated on former tropical rain forest land, where adverse soil conditions often restrictthe successful cultivation of other, especially annual crops.Though these advantages had been known for many decades, it was only during the1980's when the expansion of this crop really took off. The success of oil palm, espe-cially in SE Asia, may be largely because of the research carried out and implementedby the plantation industry. Today oil palm is probably one of the best studied crops dueto its great economic importance to the oil palm cultivating countries. Therefore, theplantation industry is continuously challenged to further optimize the performance andproductivity of oil palm.This paper tries to share some of the knowledge accumulated about oil palm, espe-cially in the field of crop nutrition, looking at the past achievements and at the chal-lenges lying ahead. Being a perennial tree crop, the lessons learned in optimizing oilpalm nutrition may also serve as examples for other long-term crops cultivated else-where under similar conditions. After adapting the experience and research resultsgained from cultivating oil palm, certain basic aspects may be used in other perennialcrops, e.g. fruit trees, rubber and tea.
Oil palm in comparison with other oil crops
In the ecological region of the tropical rain forest belt, oil palm performs so well that itclearly out-yields other vegetable oil producing crops, e.g. soybean, oilseed rape seed,sunflower, etc. At times of diminishing rain forest and other natural resources as wellas shrinking availability of agricultural land, this advantage over the traditional oilseeds receives an additional ecological dimension, i.e. much less land area is requiredcompared with other crops (Figure I).
345

ha I 1
3,5
3
2,5
2
1,5
0,5
0Oil palm (Mal.) Soybean (EU) Groundnut (China)
Sunflower (EU) Rape seed (EU) Cotton (USA)
Figure 1. Land requirement of selected oil crops to produce one ton of vegetable oil(Source: H5lrdter et al., 1997)
Based on this productivity, oil palm appears to be more favorable in converting inputsinto high value biomass. This becomes evident from an energy balance in which allinputs and outputs in joule equivalents were compared. A medium productive oil palmplantation is able to produce more than nine times the energy equivalents needed asinputs for its cultivation. This high ratio between output and input is unsurpassed byother vegetable oil crops as it is indicated in Figure 2.
E Input U OutputGj ha -1200 -
150
100
50
Oil palm Rape seed Soybean
Figure 2. Output versus input ratios of selected vegetable oil producing crops (Source:Wood and Corley, 1991)
Owing to these advantages, countries with large populations, generally high demandsfor cooking oils and concomitant land shortages are very interested in introducing oilpalm as main producer for cooking oil. However, it was only recently that the mostpopulous two countries China and India have discovered oil palm. Whereas in India
346

the growth rate of oil palm appears to get a certain momentum, China's expected ex-pansion of oil palm seems to be rather unimportant (Figure 3).
China India
1000 tons
100
80
60
40
2 0 .0o0oo o. .
0000000000 0000* 000000
01980 1990 1991 1993 1995 1997 1999 2001 2003 2005
Figure 3. Palm oil production in the P.R. China and India (Source: Mielke, 1998)
The major reason for the slow development in China and the major reliance on otheroil crops, especially oilseed rape, may be mainly explained by limited land availabilityand the marginal conditions found in its main growing area Hainan. The island is re-garded as the only area of China, where due to climatic conditions, oil palm could besuccessfully cultivated.
Nutrient requirement and uptake by oil palm
The growth cycle of oil palm which lasts for about 25 years is characterized by differ-ent stages of which each has its specific requirement regarding nutrition. Three mainstages can be distinguished: 1. Young immature (year 0 to 3), 2. Young mature (year 4to 7) and 3. Mature (year 8 to 11) and 4. Old mature trees (> 12 years). The annualuptake of the various nutrients is shown in Figure 4, indicating the relatively smalldemand during the initial two years after planting and the dramatic increase in uptakeduring the following third year. From this figure, it is evident that maximum nutrientuptake is already reached from the third year onward and will be sustained until year10 - 12. After 10 - 12 years, the annual nutrient uptake slows down slightly, especiallywhen mutual shading of trees occurs as production limiting factor and is not properlyhandled by the agronomists. Figure 4 also shows that potassium is quantitatively themost important nutrient followed by nitrogen, magnesium and phosphorus. On thewidespread nutrient deficient Ultisols and Oxisols, on which oil palm is usually grown,great emphasis should be placed on the initial supply of P. Therefore, oil palm receivesbetween several hundred grams and one kilogram of rock phosphate into the plantinghole.
347

K N Mg P
kg ha-1300
2 5 0 . . . . . . . . ..iO O i a I l l
150
100
0 1
50
1 2 3 4 5 6 7 8 9 10
Figure 4. Annual uptake of N, P, K and Mg of oil palm as affected by age (Source:Ng, 1977)
Additional P is required to develop a decent leguminous cover crop, which is neededto reduce soil erosion (especially in the initial years) and also to provide symbioticallyfixed nitrogen to the growing trees. Additional nitrogen supplied by mineral fertilizeris, however, required to satisfy the high demands of the palms. The same is applicablefor potassium and magnesium which are almost exclusively supplied in the mineralform as potassium chloride (KCI) and Kieserite (MgSO4). Because of their high watersolubility, these two fertilizers have shown to be the most suitable for adequate andtimely supply. In case large amounts are required, all nutrients with the exception ofphosphorus are usually split into two and more splits per year to optimize uptake andto reduce losses by runoff and leaching.Once taken up by the roots, the nutrients are redistributed within the palm to the grow-ing tissues or serve as a reserve in trunks, fronds and roots as it is shown in Table 1.
Table I. Nutrient removal, immobilization and recycling in mature oil palms (30 tonsFFB ha - ') (Source: Based on Ng and Tamboo, 1967)
N P K Mg(kg ha-) (kg ha- ') (kg ha-') (kg ha - ')
Removal with harvested fruit bunches 85 15 109 24
Immobilized in palm tissue 47 4 81 12
Nutrients recycled 91 13 119 33
Total uptake 223 32 309 69
Removal in % of total uptake 38 47 35 35
The figures clearly indicate that a large proportion of the nutrients taken up is neededfor the formation of the trunk, fronds, etc. where they are partly stored as a reservepool for the formation of fruit bunches and fruits. A large proportion of nutrients is
348

also recycled by cut fronds during harvest. Therefore, the amounts of nutrients finallyremoved from the field in the harvested fresh fruit bunches (FFB) constitute only arelatively small proportion as it is shown in Figure 5.
0 Uptake 0 Removalkg.ha -1
300
250
200
150
100
50
0N P K Mg
Figure 5. Annual uptake and removal of nutrients by one hectare of mature oil palmplantation, producing 25 tons of FFB (Source: Based on Ng and Tamboo,1967)
The proportion of the total uptake which is removed varies between 35% for K and Mgand 47% for P. If only these amounts were considered in the fertilizer management ofthe plantations, a drastic under-supply of nutrients would be the result. The remainingproportion of the total nutrient uptake is required for the built-up of tree biomass, e.g.trunk and canopy. From these plant organs, a part of the nutrients can be mobilized andre-translocated to supply the new tissues and fruits. For an adequate and sufficient nu-trient supply, the nutrients fixed in the tree biomass have to be considered as well asthe large proportion of applied nutrients that is usually lost, mainly through leachingand surface runoff.
Nutrient losses and gains in palm oil plantations
If properly managed, the main nutrient losses from a stand of palms are those whichare removed in the harvested crop. However, conditions that usually prevail in the hu-mid tropics, e.g. high levels of rainfall, high rainfall intensities and partly sloping landwith soils, having a poor water and nutrient retention capacity, make unproductivenutrient losses from the system through runoff and leaching unavoidable. The magni-tude of these losses may vary drastically, depending on above mentioned environ-mental or site factors. Hence, the numbers given in Figure 6 and 7 may only serve asapproximation and have to be determined for each location. To reduce these losses,good management practice is to plant leguminous cover crops which protect the landfrom runoff and erosion losses. Especially, critical stages are the period of establishingthe plantation and the juvenile growth of the palms when trees provide only very lim-ited shelter to the soil surface. The age of the trees has also a significant impact onnutrient losses through leaching as it is evident from Figure 7. In this trial, both thenutrients lost by leaching expressed as percentage of nutrients applied and the magni-
349

tude or range of losses were larger in the more mature palms. An observation thatcould be due to the reduced uptake, especially by the trees or by the cover crop.
kg ha-1
250
206200
150
100 90
50 33
0EN OP o K OMg 0 Ca
Soil: Durian series (typic Hapludult)
Figure 6. Nutrient losses by runoff in a mature oil palm plantation in Malaysia(Source: Maene et al., 1979)
Ranges l%)
76 -6 5-8yearold 9-14 years old432
Mean values (%)
4-2-10
N P K N P KSoil: Munchong series (typic Hapludo)
Figure 7. Nutrient leaching losses as'affected by palm age (in % of applied nutrients)(Source: Foong, 1993)
In this experiment, the losses through leaching (clearly below 10%) were relativelysmall for all nutrients studied. In a similar experiment, in Nigeria, leaching losses weredistinguished according to applied and native nutrients (Figure 8). The results indicatethat in general, slightly more nutrients were leached out in the young planting than inthe older or mature planting. However, it appeared that in the young planting the ma-jority of the nutrients came from fertilizers whereas it was vice versa in the matureplantation. There, the losses of applied nutrients seemed to be drastically reducedcompared to the so-called native nutrients. This, however, may be partly also losses ofnutrients that had been previously applied or recycled with the fronds and roots of thetrees and were mineralized in the soil. Besides magnesium that is heavily leached inthe immature plantation, it is mainly nitrate that contributes to the nutrient losses in oil
350

palm. The high mobility of these two nutrients in the soil profile makes them veryprone to losses.
kg ha-1
6050 4 years old 22 years old50
40
30 ____
20
10
0NH4-N N03-N K Mg NH4-N N03-N K Mg
0] Native FE FertilizerSoil: Rhodic Paleudult
Figure 8. Leaching losses of native and applied nutrients in Central-South Nigeria asaffected by palm age (Source: Omoti et al., 1983)
However, nitrogen, which is often applied in the form of urea, can also be lost by vola-tilization. Estimations of gaseous losses from urea show that up to 70% of the appliednitrogen may be lost in this way. Therefore, guidelines were developed to assess theselosses better, depending on the conditions and hence to adapt fertilizer spreading ac-cordingly to reduce volatilization (Table 2).
Table 2. Major environmental parameters for assessing potential volatilization lossesfrom applied urea (Source: Ng et al., 1983)
Probability of NH 3 losses from urea High Moderate Low
Clay & Silt (%) < 35 35-65 > 65
Soil moisture (% WHC) <45 45 -65 65 -85
Soil surface hard firm to friable friable
Site conditions open moderately shaded well shaded
Radius of weeded circle (cm) 160 160 - 200 200 - 240
Days between application and rain > 4 3 -4 1 - 2
The examples indicate that the quantification of losses through the major pathwaysdescribed above may need a site specific approach due to the large variation betweenlocations and also between stands of different age and productivity. General figuresprovide only rough estimates of nutrient losses from oil palm plantations. In case theselatter need to be evaluated according to their nutrient efficiency, more quantitative ob-
351
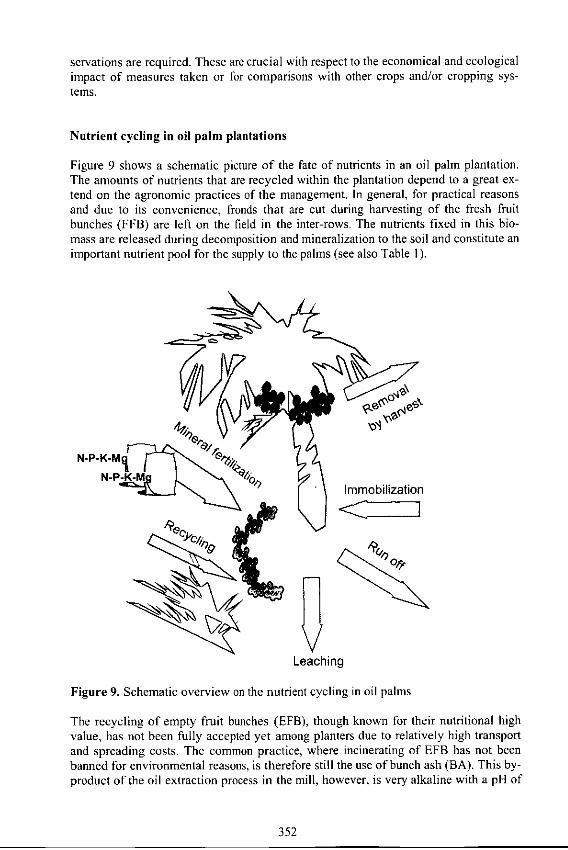
servations are required. These are crucial with respect to the economical and ecologicalimpact of measures taken or for comparisons with other crops and/or cropping sys-tems.
Nutrient cycling in oil palm plantations
Figure 9 shows a schematic picture of the fate of nutrients in an oil palm plantation.The amounts of nutrients that are recycled within the plantation depend to a great ex-tend on the agronomic practices of the management. In general, for practical reasonsand due to its convenience, fronds that are cut during harvesting of the fresh fruitbunches (FFB) are left on the field in the inter-rows. The nutrients fixed in this bio-mass are released during decomposition and mineralization to the soil and constitute animportant nutrient pool for the supply to the palms (see also Table I).
N-P-K-Mq
N-P-K-M ~/ I Immobilization
Leaching
Figure 9. Schematic overview on the nutrient cycling in oil palms
The recycling of empty fruit bunches (EFB), though known for their nutritional highvalue, has not been fully accepted yet among planters due to relatively high transportand spreading costs. The common practice, where incinerating of EFB has not beenbanned for environmental reasons, is therefore still the use of bunch ash (BA). This by-product of the oil extraction process in the mill, however, is very alkaline with a pH of
352

close to 12 and poses certain risks, especially when applied together with nitrogen fer-tilizers, increasing the losses by volatilization. Nevertheless, bunch ash potentially re-cycles slightly higher amounts of nutrients, especially K, within the plantation. On theother hand, the nitrogen contained in the empty bunches is virtually lost during incin-eration (Figure 10). In addition to being an important nutrient source, EFB mulching isa valuable tool for erosion control and improvement of nutrient uptake efficiency. It istherefore preferably used in the sloping areas where soil erosion poses a great problemand where topsoil losses prevail. Under such conditions, widespread occurring Mgdeficiency can be corrected by a combined application of EFB and mineral magnesiumfertilizer.
OEFB BAkg.ha 150
40
30
20
10
N P K Mg
Note: 25 t FFB = 1.65 t EFS (DM) 0.125 t BA
Figure 10. Amounts of nutrients recycled from empty fruit bunches (EFB) and bunchash derived from 25 tons of FFB yield (Source: Based on Redshaw, 2003)
Another by-product of the oil extraction from the FF8 is the palm oil mill effluent(POME). The use of this material which is relatively rich in nutrients, especially potas-sium and nitrogen, however, needs to be treated due to its high biological oxygen de-mand prior to its use for land application. The amount of nutrients that is returned withPOME after it has been digested in ponds is shown in Figure 11. The use of this or-ganic residue from the processing of the FFB is usually restricted to fields close to thepalm oil mill from where it is transported through pipes or channels to the places ofapplication.In summary, integrating organic residues into the fertilization scheme of an oil palmplantation to supplement the application of mineral fertilizers appears to be sound interms of environment and with regard to fertilizer economy. The feasibility of the useof all by-products as organic manure, however, depends on the infrastructure, laboravailability and, especially, distance from the oil mill to the field. Nevertheless, even ifall by-products from the mill were returned to the field, under the assumption that nolosses occur during storage and transport, there would be a negative balance for thenutrient potassium of about 7 kg per ton of FF8 or approximately 180 kg K ha -' of amedium productive plantation with 25 tons FFB per hectare. So, mineral fertilizationof considerable amounts is a prerequisite for supplying sufficient nutrients to the crop.
353

kg-ha- 1
25
20
15
10
5-
0N P K Mg
Figure 11. Amounts of nutrients that can be recycled to the field by palm oil mill ef-fluent (POME) produced form the processing of 25 tons of FTB (Source:Based on Redshaw, 2003)
Nutrient management for higher efficiency
In order to remain competitive as vegetable oil producer, the palm oil industry faces anumber of challenges, especially with respect to its productivity. The dramatic increaseof palm oil production in the two major producing countries Malaysia and Indonesiaduring the last two decades has been mainly achieved by the expansion of the croppingarea and not by an increase in yields, hence improvement of its productivity as it couldbe observed for other oil producing crops. With land suitable for the cultivation of thiscrop becoming increasingly limited, new approaches are introduced to improve theoverall productivity of oil palm. One step into this direction is the introduction ofhigher yielding planting material obtained from tissue culture as it has been success-fully demonstrated by Ng et al. (1999).
Oil yield (t.ha -
12
10-
8-
6-
4-Clone 2
2- DxP
0-25-36 3748 49-60 61-72 73-84
Months after planting
Figure 12. Comparison of FEB yields between traditional DxP and clonal oil palmproduced from tissue culture (Source: Agrocom, 1998)
354
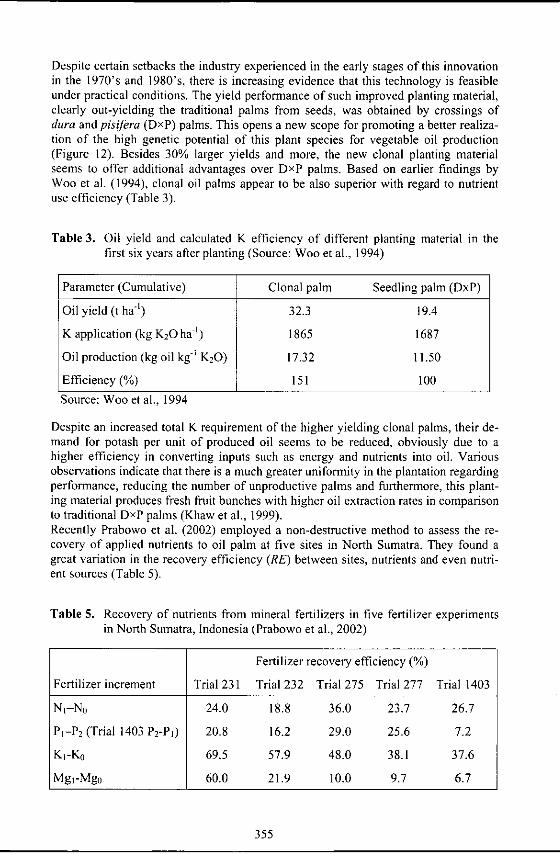
Despite certain setbacks the industry experienced in the early stages of this innovationin the 1970's and 1980's, there is increasing evidence that this technology is feasibleunder practical conditions. The yield performance of such improved planting material,clearly out-yielding the traditional palms from seeds, was obtained by crossings ofdura and pisifera (DxP) palms. This opens a new scope for promoting a better realiza-tion of the high genetic potential of this plant species for vegetable oil production(Figure 12). Besides 30% larger yields and more, the new clonal planting materialseems to offer additional advantages over DxP palms. Based on earlier findings byWoo et al. (1994), clonal oil palms appear to be also superior with regard to nutrientuse efficiency (Table 3).
Table 3. Oil yield and calculated K efficiency of different planting material in thefirst six years after planting (Source: Woo et al., 1994)
Parameter (Cumulative) Clonal palm Seedling palm (DxP)
Oil yield (t ha') 32.3 19.4
K application (kg K20 ha') 1865 1687
Oil production (kg oil kg-' K20) 17.32 11.50
Efficiency (%) 151 100
Source: Woo et al., 1994
Despite an increased total K requirement of the higher yielding clonal palms, their de-mand for potash per unit of produced oil seems to be reduced, obviously due to ahigher efficiency in converting inputs such as energy and nutrients into oil. Variousobservations indicate that there is a much greater uniformity in the plantation regardingperformance, reducing the number of unproductive palms and furthermore, this plant-ing material produces fresh fruit bunches with higher oil extraction rates in comparisonto traditional DxP palms (Khaw et al., 1999).Recently Prabowo et al. (2002) employed a non-destructive method to assess the re-covery of applied nutrients to oil palm at five sites in North Sumatra. They found agreat variation in the recovery efficiency (RE) between sites, nutrients and even nutri-ent sources (Table 5).
Table 5. Recovery of nutrients from mineral fertilizers in five fertilizer experimentsin North Sumatra, Indonesia (Prabowo et al., 2002)
Fertilizer recovery efficiency (%)
Fertilizer increment Trial 231 Trial 232 Trial 275 Trial 277 Trial 1403
NI-No 24.0 18.8 36.0 23.7 26.7
PI-P 2 (Trial 1403 P2-PI) 20.8 16.2 29.0 25.6 7.2
KI-Ko 69.5 57.9 48.0 38.1 37.6
Mgj-Mg0 60.0 21.9 10.0 9.7 6.7
355

Preliminary results from one year of measurements indicate recovery efficiencies of19.4% (N), 7.3% (P), 29.7% (K) and 10.6% (Mg). Large differences in RE were meas-ured for different fertilizer sources of P and Mg fertilizer, and RE was much greaterwhen these nutrients were supplied in soluble forms respectively as TSP and Kieserite.This became evident by smaller nutrient recovery when TSP and Kieserite in Trial1403 were substituted by rock phosphate and dolomite. In almost all cases, RE wasgreater for each nutrient when other nutrients were supplied in non-limiting amounts.RE was smaller in Trial 231 where high rainfall resulted in large fertilizer nutrientlosses in surface water runoff and eroded soil (Prabowo et al ., 2002). In Trial 231, REwas >100% for K where yield was less than 23 t ha-'. This suggests that palms wereable to use soil indigenous K more efficiently after K deficiency had been corrected.
Summary
Oil palm has become one of the most important vegetable oil producing crops in theworld with a yield potential that, for the time being, is unsurpassed by other oil bearingcrops. To realize this high potential, a generous nutrient supply is a prerequisite, inparticular, in the climatic zone of the humid tropics where high rainfall levels com-bined with soils of poor fertility and low sorption capacity for nutrients prevail. In per-ennial crops exists a relative close nutrient cycle similar to forest ecosystems. How-ever, due to large nutrient removals in the harvested crops as well as by natural, un-productive losses, the nutrient cycle is far from being closed, even if all the waste orby-products from oil extraction are returned to the field. Though these amounts of re-cycled nutrients may be considerable, mineral fertilizers and in particular potassiumare needed to compensate for these losses to make the plantation system highly pro-ductive and sustainable. In the attempt to further improve the productivity of the oilpalm, new approaches to higher yielding, more uniform plantations, i.e. with the intro-duction of clonal oil palm, offer a new perspective. Latest results on nutrient use effi-ciency studies in oil palm indicate large differences between nutrients and nutrientsources, suggesting there is an increased need to further fine-tune the nutrient man-agement techniques to this important plantation crop.
References
Agrocom (1998). Towards 2000 with super bio-tech oil palm. Bulletin No. 3. AgrocomEnterprises Sdn. Bhd. Ipoh, Malaysia, pp. 10.
Foong, S.F. (1993). Potential evapo-transpiration, potential yield and leaching lossesof oil palm. In: Y. Basiron, J. Sukaimi, K.C. Chang, S.C. Cheah, I.E. Henson, N.Kamaruddin, K. Paranjothy, N. Rajanaidu and M.D. Tayeb (Eds). 1991 PORIMInt. Oil Palm Conf Progress, Prospects and Challenges Towards the 21st Century,PORIM, Kuala Lumpur, 105-119.
Hirdter, R., Woo, Y.C and Ooi S.H. (1997). Intensive plantation cropping, a source ofsustainable food and energy production in the tropical rain forest areas in South-east Asia. Forest Eco. and Management 91, 93-102.
Khaw, C.H, Ng, S.K. and Thong, K.C. (1999). Commercial production of clonal oilpalms by tissue culture - Prerequisites, constraints and issues. Paper presented atthe Porim International Palm Oil Congress (PIPOC 1999), Febr. 1-6, Kuala Lum-pur, Malaysia.
Maene, L.M., Thong, K.C., Ong, T.S. and Mokhtaruddin, A.M. (1979). Surface wash
356
under mature oil palm. In: E. Pushparajah, (Ed.). Proc. Symposium on Water inMalaysia Agriculture, MSSS, Kuala Lumpur, 203-216.
Mielke, S. 1998. The outstanding role of Indonesia in the phenomenal developmentof the world palm oil industry in the past and in the future. Proc. 1998 Intern. OilPalm Conf., Bali, Indonesia, Sept. 23-25, 1998.
Ng, S.K. (1977) Review of oil palm nutrition and manuring - scope for greater econ-omy in fertilizer usage. In: D.A. Earp and W. Newall (Eds.) International Devel-opments in Oil Palm. Inc. Soc. of Planters, Kuala Lumpur: 209-233.
Ng, S.K. and Thamboo, S. (1967) Nutrient contents of oil palms in Malaysia: I. Nutri-ents required for reproduction; fruit bunches and male inflorescences. Malay. Ag-ric. J. 46: 3-45.
Ng, S.K., Thong; K.C., Ooi, S.H. and Woo, Y.C. (1983). Urea, its potential role in acompetitive oil palm industry. In: S.K. Ng (Ed.): Compilation of Research andScientific papers on "The Agronomy, nutrition and fertilization of the oil palm",Agromac Sdn. Bhd. Ipob, Malaysia, 1997, 463-477.
Ng, S.K., Ooi, S.H. and Leng, K.Y. (1999). Potassium dynamics in the nutrition andfertilizer management for the oil palm (Elaeis guineensis Jacq.) in the 2 1 " cen-tury. In: A. E. Johnston (ed.). Proc. of the Workshop C 16" World Congress ofSoil Science Montpellier, France, 20-26.08.1998. Intern Potash Inst., Basel, Swit-zerland.
Omoti, U., Ataga, D.O. and Isenmila, A.E. (1983). Leaching losses of nutrients in oilpalm plantations determined by tension lysimeters. Plant and Soil 73, 365-376.
Prabowo, N.E., Lubis, T., Fairhurst, T., Foster, H.L. and Nafisah, E.N. (2002). Effi-ciency of fertiliser recovery by oil palm in Sumatra. In: 2002 International OilPalm Conference and Exhibition. IOPRI, Bali, Indonesia, 8-12 July 2002, 9 p.
Redshaw, M. (2003). Utilization of field residues & mill wastes. In: T. Fairhurst and R.HArdter (eds.). Oil palm -fertilizing for large and sustainable yields. PPI-PPIC,Singapore, IPI, Basel, Switzerland, 307-320.
Woo, Y.C., Ooi S.H. and Hdrdter R. (1994). Potassium for clonal oil palm in the 21stcentury. Proc. 1994 IFA-FADINAP Conference for Asia and the Pacific. KualaLumpur, Malaysia (unedited).
Wood, B.J. and Corley, R.H.V. (1991). The energy balance of oil palm cultivation.PORIM Int. Palm Oil Conf., 133-143.
357

Recirculating nutrient solutions in greenhouse production
Hillel Magen, Coordination China, International Potash Institute
c/o DSW, P.O. Box 75, Beer Sheva, Israel, 84100
Abstract
Environmental laws and regulations support recirculation of drainage water (DW)from greenhouse facilities. The water and nutrients in the DW is of significant valueand recirculation system may save up to 40% of water and nutrients. The initial and thesetting of critical limits of EC, Na and Cl in the solution dictate the frequency of dis-charge from the system. The system constantly monitors the nutrient solution for EC,pH and nutrient concentrations. Nutrients are applied according to factors such as plantrequirements, transpiration, required content of elements in tissue and level of nutri-ents in the solution. A frequent level of analysis and monitoring of these factors is re-quired to maintain the stability of the system, to save water and nutrients and toachieve maximum yield.
Introduction
Recirculation of nutrient solutions is increasing steadily in many countries with inten-sive greenhouse culture. There are several driving forces for the development of thesesophisticated systems: 1) restrictive environmental laws and regulations, aiming toreduce nutrient leaching to the environment, 2) significant savings of water and nutri-ents and 3) better control of nutrient supply.Recent European Community directives emphasize the need for growers to reducetheir nitrate emission. For example, the greenhouse industry in the Netherlands hastargeted to reduce the nitrate emission of the glasshouse vegetable production based onclosed systems by 80% until 1995 and by 100% until 2000 (Hand & Fussel, 1995).Several other countries are reducing the amount of discharged drainage water (DW) byregulations and/or by subsidizing water recirculation (Bolusky and Regelbrugge,1992).Water is a scarce natural resource, but is at a constant total quantity. The sphere ofmankind activity is constantly reducing the fraction of fresh water in favour of uselesswater (Tognoni et al., 1998). According to this report, agriculture uses only 60% of theglobally available fresh water. Total protected cultivation is 200,000 ha and the aver-age biomass production is approximately 50kg m -3 yr-'. Since water content in thisbiomass is 90%, the total theoretical usage of water is approximately 100 millionm3 yr-' which is only 0.0037% of total irrigation water in the world. Global usage ofirrigation water is 2.7 million *106 m3 yr , but the actual greenhouse usage is esti-mated at -5,000* 106 m3 yr 1 , much more than the theoretical value. Calculation ofpossible savings through the use of recirculation systems shows that a saving share of30% in quantity will directly save $150 million yr- (for price of water of$ 0.10 m-3).
359
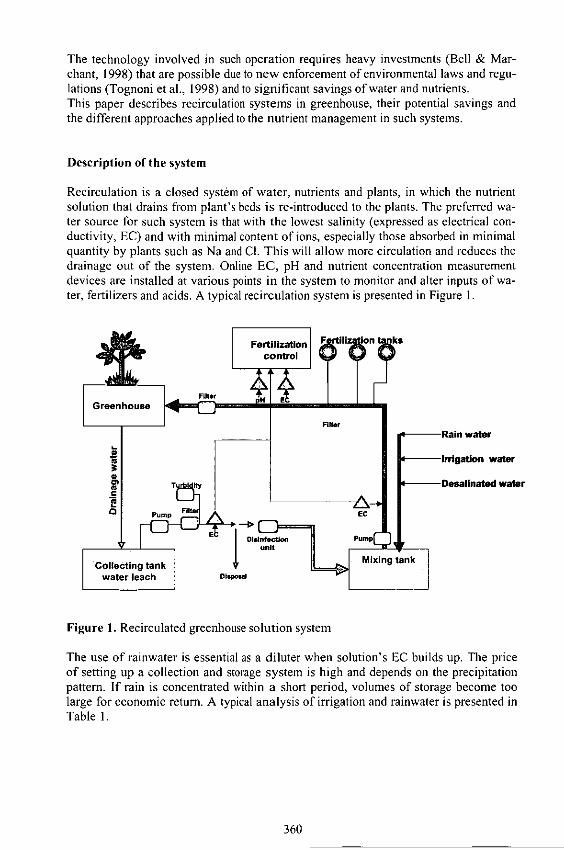
The technology involved in such operation requires heavy investments (Bell & Mar-chant, 1998) that are possible due to new enforcement of environmental laws and regu-lations (Tognoni et al., 1998) and to significant savings of water and nutrients.This paper describes recirculation systems in greenhouse, their potential savings andthe different approaches applied to the nutrient management in such systems.
Description of the system
Recirculation is a closed system of water, nutrients and plants, in which the nutrientsolution that drains from plant's beds is re-introduced to the plants. The preferred wa-ter source for such system is that with the lowest salinity (expressed as electrical con-ductivity, EC) and with minimal content of ions, especially those absorbed in minimalquantity by plants such as Na and Cl. This will allow more circulation and reduces thedrainage out of the system. Online EC, pH and nutrient concentration measurementdevices are installed at various points in the system to monitor and alter inputs of wa-ter, fertilizers and acids. A typical recirculation system is presented in Figure 1.
F e r t i l iz a t io n F u i n k s
Rain water
S Irrigation water
T fy Desalinated water
Pump F 11
E C
P u m p u m
Collecting tank E
ni
I V
water leach 01W.1
Figure 1. Recirculated greenhouse solution system
The use of rainwater is essential as a diluter when solution's EC builds up. The priceof setting up a collection and storage system is high and depends on the precipitationpattern. If rain is concentrated within a short period, volumes of storage become toolarge for economic return. A typical analysis of irrigation and rainwater is presented inTable 1.
360

Table 1. Chemical analyses of tap and collected rainwater for rose irrigation (Raviv etaL, 1995)
Water pH EC Na+ Ca+ + K + CI NO3
Source dS m -' meq liter - '
Tap water 7.1 1.11 4.63 2.50 0.14 6.180.20
Rain water7.4 0.13 0.24 0.35 0.04 0.80 0.10
The change from soil-grown crops to soil-less culture growing has not resulted in adisappearance of soil-borne pathogens (Van Os, 1998). In addition, contaminants suchas sprays and other chemicals used in greenhouse production threaten the health ofplants. The installation of a disinfection or treatment unit to control the level of patho-gens and other contaminants is therefore an integral part of the system. Disinfectionmethods of irrigation water are presented in Table 2. While heat treatment is the mostfrequent method used in Europe (Van Os, 1998) this may differ in other places. Forexample, big volume sand and biological filters are used in Israel.
Table 2. Disinfection of recycled nutrient solution (van Os, 1998)
Method Dosage Active against pathogens
Heat treatment 950C for 30s All pathogensUV radiation 250 mJ cm -2 All (widely used)
Slow sand filtration 1001 M- .h'; D10<0.4 mm Phytophthora, pythium
Hydrogen peroxide + ac- ? 9
tivatorsLava filtration ? ?Ozonization 10 g ozone per m 3 for I h AllMembrane filtration All
D-average diameter
Saving of water and nutrients
The cost of recirculating systems is high. Installation of I hectare can cost $ 18,000,but the annual saving from water and nutrients can reach about $ 4,000 each year (Bell& Marchant, 1998). In Israel, the price of water for farmers is $ 0.2-0.3 m, thus thevalue of saving 40% in water consumption is in the order of $ 3,000 ha- yr-. Whenavailable water is limited, recirculation is the only way to supply sufficient water forgreenhouse production.The luxury feeding usually used in intensive systems and the relatively high leachingfraction leads to high concentration of nutrients in the drainage water (MacAvoy,1994). The method employed with soil-less culture demands approximately 30 - 50%leaching fraction. This fraction is simply spilled and diverted out of the growth area.
361

The combination of high leaching fraction (LF) and the high nutrient concentration inthe DW (or LF) leads to a significant amount of wasted nutrients. Typical nutrientconcentrations in DW in tomatoes and roses grown in greenhouse are presented in Ta-ble 3.
Table 3. Typical average summer run-off nutrient analysis (Bell & Marchant, 1998)
Crop pH EC N-N03 P K Ca Mg NadS m-1 -------------- mg kg- -------------
Tomatoes 6.1 2.75 175 22 350 220 75 100
Roses 6.5 2.34 260 25 250 150 42 135
An example of potential saving of potassium from recirculation is presented. Assum-ing that LF is being recirculated instead of sending LF out of the system:
LF - 20%,220 days of irrigation with 5 mm day- - 11,000 m 3 ha -' yr -1,
the total amount of LF: 11,000 * 0.2 - 2,200 m3 yr',2,200m3 * 350 mg K kg-' - 770 kg K ha- yr- ' .
Nutrient management
Bar-Yosef (1999) describes the main management topics related to recirculated sys-tems as follows:
* Salinity build-up,* Root pathogens* The presence of root exudates and growth substrates dissolution,* Al3" toxicity (released from substrate),* Adjusting nutrient and oxygen demand.
The topic of salinity build-up will be described in more detail.
Salinity build-up
Since irrigation water contains an initial amount of soluble ions, mainly those that arenot needed in plant nutrition (Na, Cl), the initial EC of nutrient solution should be con-sidered. Build-up of EC is due to accumulation of ions that are not absorbed by plants.The following example (Table 4) shows the nutrient concentrations in the solution of atomato crop grown in the greenhouse after 3 weeks of applying the treatments (Ravivet al., 1995). In this experiment, the influence of rainwater and recirculation (RCRLN)were tested. Data for the nutrient solution are presented in the upper part of the Table 4and the respective analysis of DW is at the bottom part.The treatment with no recirculation (tap, commercial) had a slightly reduced level ofEC in the nutrient solution (2.05 compared 2.12 and 2.13 dS m) and reduced levels ofCl, Na and Ca concentrations (6.4 compared to 7.4 and 7.8 meq F', respectively) butno clear differences and even opposite results for other ions. Salinity in DW has
362

increased by approximately 50%. In this experiment, a build-up of NO 3 in DW wasalso observed, suggesting an excess application of this element.
Table 4. Chemical analysis of irrigation and DW of 3 treatments (Raviv et al., 1995)
Treatment pH EC Na + Ca ++ K+ Cl" NO3 NH4+ P0 4
3-
dS m- meq liter'
Tap, (Commercial), LF 6.9 2.05 4.8 2.8 4.2 6.4 7.1 3.4 1.125%, < 3.5 dS in"
Tap + rain, RCRLN, 7.0 2.12 6.0 3.4 3.8 7.4 7.4 2.1 0.7< 3.5 dS m"
1
Tap, RCLN, < 3.5 dS m" 7.0 2.13 6.2 3.6 3.7 7.8 7.1 1+9 0.6
DW 1 4.6 3.18 9.5 5.7 6.5 10.2 12.7 0.6 0.5
DW 2 4.8 3.08 10.4 5.8 5.4 11.1 12.5 0.2 0.3
DW3 4.8 3.18 10.7 5.8 6.0 12.1 12.7 0.4 0.4
Renewing the nutrients in recirculated systems
Management of recirculated systems is complicated because of the "consolidation" oftwo systems: water consumption and nutrient absorption (Ben Asher, personal com-munication). If water uptake is higher than that of nutrients, EC will build up and viceversa. Replenishing nutrients should be calculated as per single ion; otherwise a quickexcess of ions is caused, leading to spillage of water.Various factors influence the application of nutrients. A major factor is the nutrientconsumption of plants throughout the growing and yielding periods, which was inves-tigated in other field or laboratory experiments, as described in Figure 2 (data fromBar-Yosef, 1999).
7
....... ..........
-
4- ................. ....... ............. .........-0P
23 .... . . ... K
Days (DAP)
Figure 2. Periodical N, P & K consumption rate (kg ha -' day -") of greenhouseTomatoes (Bar-Yosef, 1999)
363

Bugbee (1996) suggested using both nutrient and watering requirement and combiningthese via the transpiration to dry matter growth ratio; the plant needs to transpire 300kg of water to form I kg of dry matter. Under normal conditions a ratio of 300:1 isacceptable. At low humidity, the ratio increases to 400 but under high CO2 levels re-duces to 200 or even less. For example, if the desired K concentration in the plant is4% (40 g kg-'), at a transpiration to dry matter ratio of 300:1, 300 litres must have 40 gof K and the consequent concentration in the nutrient solution is 3.4 mM.Moreover, essential nutrients can be put into 3 major categories based on speed of de-pletion from the solution (Bugbee, 1996). Group "I" elements are actively absorbed byroots and removed from the solution in a short time (few hours). The second group (2)elements have intermediate uptake rates and are usually removed from the solutionslightly faster than that of water via transpiration. Ca and B (group 3) are passivelyabsorbed from solution and often accumulate in the solution. For example, phospho-rous and potassium (group 1) are rapidly absorbed by the plant, so that very low con-centrations (IM) in the solution may occur, This is a positive indication of the plant'sability to absorb nutrients, and there is no need to add more of these elements immedi-ately. P concentration of only 0.5 mM is sufficient after the first vigor growth period(Bugbee, 1996).
Table 5. Approximate uptake rates of the essential plant nutrients (Bugbee, 1996).
Group Type of uptake NutrientsI Active uptake, fast removal NO 3 , NH 4, P, K, Mn2 Intermediate uptake Mg, S, Fe, Zn, Cu, Mo, C3 Passive uptake, slow removal Ca, B
Recirculated systems are totally based on the nutrient concentration in the solution,without the buffer supply that the soil provides. Two examples of beneficial effect bynutrients usually not considered as plant nutrients are given: 1) Silicon is not known asa plant nutrient in the solutions, but there is evidence for it's role in avoiding toxicityof metals and increased protection against insects (Bugbee, 1996); 2) Chloride, usuallyregarded as a undesired element, but at concentrations of 8-13 mM increases Ca up-take, decrease blossom-end rot and increases gold specs in tomato fruit (Kreij, 1995).
References
Bar-Yosef, B. 1999. Advances in Fertigation. In: Advances in Agronomy (D.L. Sparksed.). V-65, pp 2-65.
Bell, F. R. and A. Marchant. 1998. The development and implementation of rn-offmanagement plans for the collection, containment and disposal of nutrient richrun-off from glasshouse crops, grown in artificial substrates in Guernsey. Proc. ISWater Quality & Quantity in Greenhouse Horticulture. (Ed): Rafael Munoz Car-pena. Acta Hort. 458, ISHS, pp 395-399.
Bolusky, B. & C. Regelbrugge. 1992. Political perspective on water quality impact.Hort. Technology 2, 80-82.
Bugbee, B. 1996. Nutrient management in recirculating hydroponic culture. CropPhysiology, Laboratory, Utah State Univ. Logan, UT 4322-4820.
364

De Kreij, C. 1995. Latest insights into water and nutrient control in soil-less cultiva-tion. Acta Hort. 408: Soil-less Cultivation Technology, pp 47-61.
Hand, D. J. & M. Fussel. 1995. The effect of reduced nitrate input on tomato yield andfruit quality. Acta Horticulture 401. Growing Media & Plant Nutrition, pp 319-325.
MacAvoy, R.J. 1994. Nitrate nitrogen movement through the soil profile beneath acontainerized greenhouse crop irrigated with two leaching fractions and two wet-ting agent levels. J. Amer. Soc. Hort. Sci. 119; 446-451.
Raviv, M., Reuveni, R., Medina, Sh. Shamir, Y., Duvdevani, 0., Shor, 0. and R.Schayar. 1991. Changes in tuff during prolonged cultivation which affect roseproductivity. Acta Hot. 294, 99-104.
Raviv, M., Reuveni, R., Krasnovsky, A. and Sh. Medina. 1995. Recirculation of rosedrainage water under semi-arid conditions. Acta Hort. 401. Growing Media &plant nutrition, 427-433.
Tognoni, F., Pardossi, A. and G. Serra. 1998. Water pollution and the greenhouse envi-ronmental costs. Proc. IS Water Quality & Quantity in Greenhouse Horticulture.(Ed): Rafael Munoz Carpena. Acta Hort. 458, ISHS., 385-394.
Van Os, E. A. 1998. Closed soiless growing systems in the Netherlands: The finishingtouch. Proc. IS Water Quality & Quantity in Greenhouse Horticulture. (Ed): Rafa-el Munoz Carpena. Acta Hort. 458, ISHS, 279-291.
365


Nutrient input and evaluation of fertilization efficiency in typical teagrowing areas of China
Ruan Jianyun and Wu Xun
Tea Research Institute, Chinese Academy of Agricultural Sciences, Hangzhou Zheji-ang 310008
Abstract
A study on nutrient inputs in typical tea producing areas in the West Lake District ofHangzhou and the Xinchang County in Zhejiang Province (Green tea) and AnqiCounty in Fujian Province (Oolong tea) was carried out in 1998-99. The surveyed teagardens represented 6.2%, 2.6% and 2.0% of the total areas in the above three regions,respectively. The results showed that the average amounts of nutrient (N+P205 +K 20)input were 738 kg ha- ' in West Lake District of Hangzhou, 712 kg ha-' in XinchangCounty and 694 kg ha ' in Anqi County with N : P20 5 : K20 ratios of I : 0.07 : 0.06,1 : 0.13 : 0.11, and I : 0.25 : 0.26, respectively. There was a tendency that the amountof nutrient consumed increased with the output value of the tea product. In particularthe amounts of applied P and K were remarkably larger in tea gardens of high productvalue than in those of low values. Calculation of an apparent nutrient balance showedthat the K input in comparison to the output in 67.2% of the area of the surveyed plan-tations in Xinchang and 74.8% in West Lake District of Hangzhou was insufficientwith deficit values of 12.9 and 22.2 kg K20 ha-' yr' , respectively. In about 35.3% ofthe area of the investigated plantations in Xinchang and 67.2% in West Lake Districtof Hangzhou, the balance of phosphorus was also negative whereas in most tea fields,there was a surplus input of nitrogen. Soil analysis indicated that the contents of avail-able K in 63-95% of the samples taken from these areas were in the deficiency range(<80 mg kg-'). The study demonstrated the problems of imbalanced fertilization andover-application of fertilizers in some of the tea gardens.
Introduction
Tea is an important commercial crop and there are presently .I million hectare of teafields, covering hilly areas in southern China. For some rural families in this area, teaproduction is a dominant source of income. Since 1990's, the main management targethas been to gradually shift from obtaining the highest yield to achieve the productionof quality tea and to improve the overall economic efficiency. Accordingly, attentionhas been mainly given to solutions for both the better quality hence higher sellingprices and lower production and processing costs. Both yield and quality of tea aregreatly influenced by the fertilization program and therefore the input of nutrients isone of the key elements of production. In 1998-1999, the situation of nutrient input intypical tea counties was investigated with the aim to generate the background informa-tion on fertilization by farmers or in tea plantations and further to provide a basis foran efficient improvement in the application of fertilizers.
367

Materials and methods
Investigation Sites
Three typical tea producing regions, i.e. West Lake District of Hangzhou and Xin-chang County in Zhejiang Province and Anqi County in Fujian Province, were selectedas survey areas. West Lake District of Hangzhou is a traditional green tea producingarea, enjoying a high reputation for being the hometown of Longjing Tea with a his-tory of over 300 years. Xinchang County is formerly known for Gunpowder tea, butrecently Mingcha (quality tea) production developed rapidly and received recently the
name 'The Hometown of Mingcha' from the Ministry of Agriculture. In this county,the value of tea production accounts for one third of its total economic output fromagricultural based production. Anqi County of Fujian province is the most importantproduction base of Oolong tea. Tieguanyin and Huangjingui which represent the topoolong tea types produced in China are the most famous products of this county.
Methods
In the above areas, representative farms or plantations were chosen to collect the in-formation on tea area, yield, product value and fertilizer input in 1998. The basic in-formation of the survey is given in the Table I and 2. The quality teas of green teawere referred as those made from tender spring shoots usually with one bud togetherwith one or two leaves, which are elaborately processed most often by hand and occa-
sionally by machines. Quality oolong tea is made from vegetatively propagated clonessuch as Tiguanyin, Huangdan and Shuixian, etc. Based on the data collected, the aver-
ages of fertilizer inputs to unit area were calculated.
Table 1. Basic information on tea production in the counties engaged in the survey
Item Anqi Xinchang West Lake DistrictFujian Zhejiang of Hangzhou
ZhejiangGeneral
Tea type Oolong tea Green tea Green tea
Total tea area, ha 16,667 4,467 918.4Total output, ton 13,000 4,175 787.3Total value, thousand Yuan* 242,000 152,000 44,790Average yield, kg ha - ' 819 1,044 888
SurveyNumber of Tea plantations 20 13 7Area, ha 331.8 117 83.4Area as percent of the total, % 2.0 2.6 9.0
Output, ton 328.6 132 88.47Average yield, kg ha' 1,226 1,450 1,119
Note:* Yuan stands for RMB Yuan (1 USD = 8.2 RMB), the same below.
The apparent nutrient balance of the tea systems was also calculated as the differencebetween the output over input. Only nutrients supplied in form of.fertilizers (inorganicand organic) were considered in the estimation of the input. For convenience, the bio-
368

logical N, fixation and wet or dry deposition of nutrients were not taken into account.The output parameters of nutrients comprise the removals by harvest and pruning,gaseous loss, runoff and leaching which were estimated by experience. The removalsof nutrients in the harvested crop were calculated from the yield and the average con-centrations of nutrients in the shoots in which N, P20 5 and K20 accounted for 4.5%,1.0% and 2.5%, respectively. It was assumed that deep pruning was performed every 5years and the pruned materials (leaves and stems) were completely removed from thefields. The mean biomass weight was 12,000 kg ha-1 , containing 1.7% N, 0.5% P20 5and 1.1% K20. Therefore, the amounts of N, P2O and K20 removed by deep pruningwere 40.8, 12.0 and 26.4 kg ha' yr-'. The percentages of N and K20 loss by gas, runoffand leaching were 40% for inorganic N, 20% for N from organic manure and 20% forpotassium, respectively. Therefore, the apparent balance of each nutrient was calcu-lated according to the equation:
Apparent balance = Fertilizer input - (removal in harvested crop + removal by deeppruning + loss),
where, the removal in harvested crop = yield x nutrient concentration in shoot;removal by deep pruning = determined by experience data (see the text) and
converted to values on annual basis; andloss = the amount of nutrient input x loss percentages (40%, 20%, and 20% for
N from inorganic fertilizers, organic manure, and K20, respectively).
Table 2. Basic information on farms/plantations engaged in the survey
Region Tea type Value Area Total tea Quality teaAmount Value Amount Value
Yuan ha - ha kg ha - Yuan ha - kg ha' Yuan ha'Anqi, Fujian Dolong te <45,000 319.8 1,187 13,712 416.4 1,536
>45,000 12.0 2,455 119,482 954.8 74,297
Xinchang, Green tea S45,000 60.7 1,879 31,824 136.5 19,568Zhejiang >45,000 56.5 1,268 108,613 1,136.8 107,495
West Lake Dis- Green tea <45 000 9.1 932 15,552 92.9 7,753trict Hangzhou, >45,000 47.6 1,128 85,607 376.6 58,930Zhejiang
Results
Nutrient input
The area of tea managed by one family farm or in a plantation varied widely from lessthan one hectare to more than hundreds of hectares. This has led to large differences infertilizer inputs among farms or plantations. The total input of N+P 20 5+K 20 in AnqiCounty of Fujian ranged from 203 to 4,177 kg ha-t and the amounts of N, P20 5 andK20 varied from 38 to 2,644 kg ha - ', from 96 to 683 kg ha-' and from 45 to 1,420 kgha', respectively (Table 3). In West Lake District of Hangzhou in Zhejiang Province,the corresponding values ranged from 327 to 2,104 kg ha -' for total input, 289 to 1,593
369
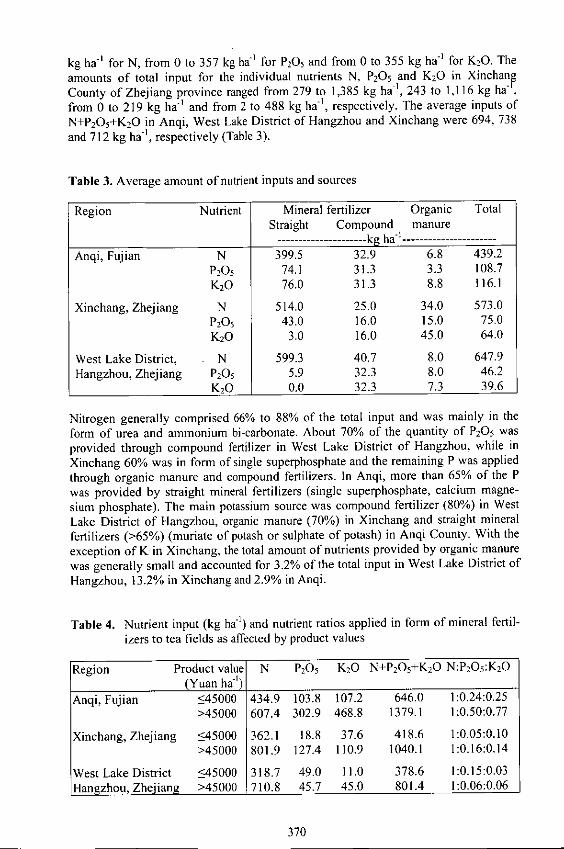
kg ha-' for N, from 0 to 357 kg ha-' for P20 5 and from 0 to 355 kg ha-' for K20. Theamounts of total input for the individual nutrients N, P20 5 and K20 in XinchangCounty of Zhejiang province ranged from 279 to 1,385 kg ha', 243 to 1,116 kg ha-',from 0 to 219 kg ha' and from 2 to 488 kg ha-, respectively. The average inputs ofN+P 20,+K20 in Anqi, West Lake District of Hangzhou and Xinchang were 694, 738and 712 kg ha-', respectively (Table 3).
Table 3. Average amount of nutrient inputs and sources
Region Nutrient Mineral fertilizer Organic TotalStraight Compound manure------------- kg ha'--------------
Anqi, Fujian N 399.5 32.9 6.8 439.2P20 5 74.1 31.3 3.3 108.7K20 76.0 31.3 8.8 116.1
Xinchang, Zhejiang N 514.0 25.0 34.0 573.0
P20 5 43.0 16.0 15.0 75.0K20 3.0 16.0 45.0 64.0
West Lake District, N 599.3 40.7 8.0 647.9
Hlangzhou, Zhejiang P20 5 5.9 32.3 8.0 46.2K20 0.0 32.3 7.3 39.6
Nitrogen generally comprised 66% to 88% of the total input and was mainly in the
form of urea and ammonium bi-carbonate. About 70% of the quantity of P20 5 was
provided through compound fertilizer in West Lake District of Hangzhou, while in
Xinchang 60% was in form of single superphosphate and the remaining P was appliedthrough organic manure and compound fertilizers. In Anqi, more than 65% of the P
was provided by straight mineral fertilizers (single superphosphate, calcium magne-
sium phosphate). The main potassium source was compound fertilizer (80%) in West
Lake District of Hangzhou, organic manure (70%) in Xinchang and straight mineral
fertilizers (>65%) (muriate of potash or sulphate of potash) in Anqi County. With the
exception of K in Xinchang, the total amount of nutrients provided by organic manure
was generally small and accounted for 3.2% of the total input in West Lake District of
Hangzhou, 13.2% in Xinchang and 2.9% in Anqi.
Table 4. Nutrient input (kg ha') and nutrient ratios applied in form of mineral fertil-
izers to tea fields as affected by product values
Region Product value N P20 5 K20 N+P 20 5+K 20 N:P 205:K20(Yuan ha -')
Anqi, Fujian <45000 434.9 103.8 107.2 646.0 1:0.24:0.25>45000 607.4 302.9 468.8 1379.1 1:0.50:0.77
Xinchang, Zhejiang _<45000 362.1 18.8 37.6 418.6 1:0.05:0.10>45000 801.9 127.4 110.9 1040.1 1:0.16:0.14
West Lake District <45000 318.7 49.0 11.0 378.6 1:0.15:0.03
Hangzhou, Zheiang >45000 710.8 45.7 45.0 801.4 1:0.06:0.06
370
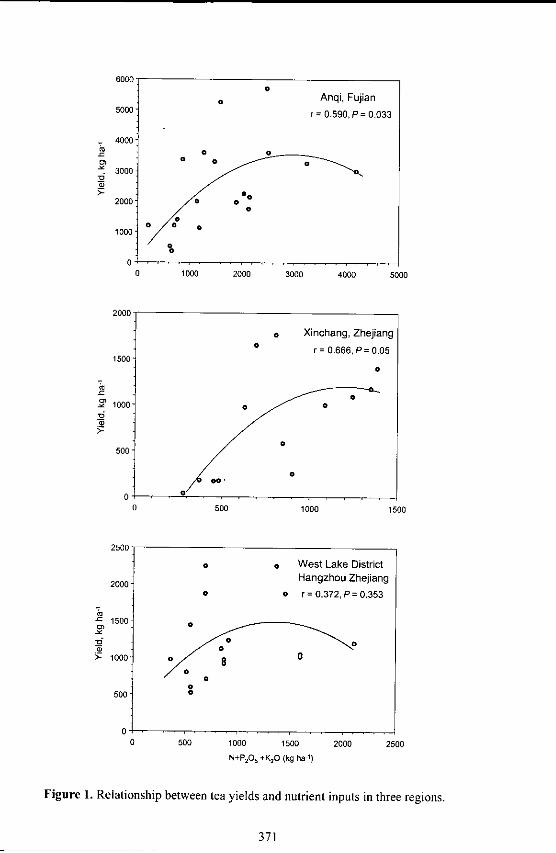
6000 -0
Anqi, Fujian5000 r = 0.590,P= 0.033
4000a 0
3000
2000 o 61
1000
00
0 1000 2000 3000 4000 5000
2000
o Xinchang, Zhejiang
r= 0.666, P= 0.051500
0
500)
500 1000 1500
2500
o 0 West Lake District
2000 Hangzhou Zhejiango 0 r =0.372, P= 0,353
-c 1500
-n 0 0
o 0>- 1000 / 0
500 a0
0 .0 500 1000 1500 2000 2500
N+P205 +K20 (kg ha 1)
Figure 1. Relationship between tea yields and nutrient inputs in three regions.
371
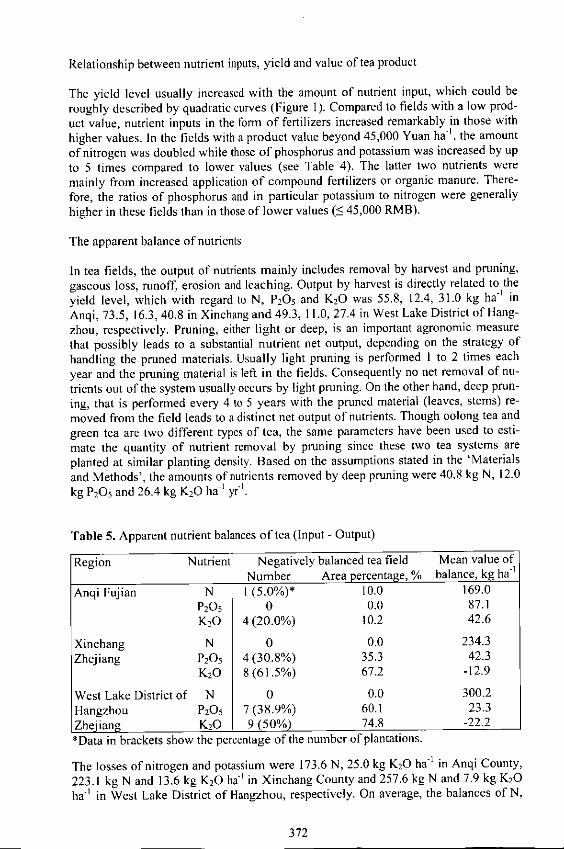
Relationship between nutrient inputs, yield and value of tea product
The yield level usually increased with the amount of nutrient input, which could be
roughly described by quadratic curves (Figure 1). Compared to fields with a low prod-
uct value, nutrient inputs in the form of fertilizers increased remarkably in those with
higher values. In the fields with a product value beyond 45,000 Yuan ha', the amount
of nitrogen was doubled while those of phosphorus and potassium was increased by up
to 5 times compared to lower values (see Table 4). The latter two nutrients were
mainly from increased application of compound fertilizers or organic manure. There-
fore, the ratios of phosphorus and in particular potassium to nitrogen were generally
higher in these fields than in those of lower values ( 5 45,000 RMB).
The apparent balance of nutrients
In tea fields, the output of nutrients mainly includes removal by harvest and pruning,gaseous loss, runoff, erosion and leaching. Output by harvest is directly related to the
yield level, which with regard to N, P205 and K20 was 55.8, 12.4, 31.0 kg ha in
Anqi, 73.5, 16.3, 40.8 in Xinchang and 49.3, 11.0, 27.4 in West Lake District of Hang-
zhou, respectively. Pruning, either light or deep, is an important agronomic measure
that possibly leads to a substantial nutrient net output, depending on the strategy of
handling the pruned materials. Usually light pruning is performed I to 2 times each
year and the pruning material is left in the fields. Consequently no net removal of nu-
trients out of the system usually occurs by light pruning. On the other hand, deep prun-
ing, that is performed every 4 to 5 years with the pruned material (leaves, stems) re-
moved from the field leads to a distinct net output of nutrients. Though oolong tea and
green tea are two different types of tea, the same parameters have been used to esti-
mate the quantity of nutrient removal by pruning since these two tea systems are
planted at similar planting density. Based on the assumptions stated in the 'Materials
and Methods', the amounts of nutrients removed by deep pruning were 40.8 kg N, 12.0
kg P205 and 26.4 kg K20 ha I yr-'.
Table 5. Apparent nutrient balances of tea (Input - Output)
Region Nutrient Negatively balanced tea field Mean value of
Number Area percentage, % balance, kg ha !
Anqi Fujian N 1 (5.0%)* 10.0 169.0P20 5 0 0.0 87.1K20 4(20.0%) 10.2 42.6
Xinchang N 0 0.0 234.3
Zhejiang P20 5 4(30.8%) 35.3 42.3K20 8(61.5%) 67.2 -12.9
West Lake District of N 0 0.0 300.2
Hangzhou P20 5 7(38.9%) 60.1 23.3
Zhejiang K20 9(50%) 74.8 -22.2
*Data in brackets show the percentage of the number of plantations.
The losses of nitrogen and potassium were 173.6 N, 25.0 kg K20 ha in Anqi County,
223.1 kg N and 13.6 kg K20 ha' in Xinchang County and 257.6 kg N and 7.9 kg K20ha - l in West Lake District of Hangzhou, respectively. On average, the balances of N,
372

P 20 5 and K20 in Anqi were positive which means that the input surpassed the output.However, in nearly 10% of the fields, based on area, the N and K20 balances werenegative (Table 5). In both West Lake District of Hangzhou and Xinchang, N had apositive balance while phosphorus in about 35.3% of the area of the surveyed tea fields(30.8% farms or plantations) in Xinchang and 67.2% of the area (38.9% farms or plan-tations) in West Lake District of Hangzhou had a negative balance, although the aver-aged P balances were positive. In the case of K20, about 61.5% of farms or plantations(representing 67.2% of the area) in Xinchang and 50% (representing 74.8% of thearea) in West Lake District of Hangzhou did not apply sufficient potassium fertilizer.The average deficits were 12.9 kg ha - ' in Xinchang and 22.2 kg ha- in West Lake Dis-trict of Hangzhou.
K Status of tea soils
Soil samples which were taken from the surveyed plantations and analysed for ex-changeable K indicate that the apparent balance was mostly negative for K. The resultsshowed that, though the exchangeable K content varied from one site to another, Kdeficiency was rather common in all three regions (Table 6). The lowest average Ksupply level of the soils was found in the tea fields in West Lake District of Hangzhouwhere 90% of the tea fields may be regarded as deficient in K. In Xinchang, the meanlevel of exchangeable K was 71 mg kg-' with 63% of the fields being deficient in K. InAnqi, although the K balance in most of the tea fields was positive, the fields with Kdeficiency still accounted for 75%. This may be due to the fact that our investigationonly reflects the situation of one year whereas the level of exchangeable K reflects thefertilization of many years.
Table 6. Available soil K content (mg kg -') from surveyed plantations (0-40 cm soildepth)
Region Number of soil Range Mean Percentage of Ksamples deficient fields*
Anqi Fujian 40 16-220 70 75%Xinchang Zhejiang 16 15-164 71 63%Hangzhou Zhejiang 21 18-162 54 95%
*Critical level of available K by NH 4OAC is 80 mg kg'.
Discussion
Fertilization is one of the key factors which greatly influences the productivity of tea.According to Shui and Chang (1996), the input of fertilizers contributes by 41% to theannual production in the main tea producing countries such as China, India, Kenya andSri Lanka. This is greater than the contribution by land (25%) and labour (8%). Thepresented results also show the close relationship between fertilizer input level andyield and product value. In this study, the mean quantity of total nutrient input(N+P 20 5 +K2 0) was as high as 694-737 kg ha-' and in some extreme cases even up to4,000 kg ha '. This value was much greater than the current recommendation of 25-27.5 kg (12.5-15 kg N and 12.5 kg P20 5+K 20) for every 100 kg made tea (Ruan, 1999)and was about twice as much than in some other tea producing countries. For example,the average input of N+P 20 5 +K20 in tea fields of Sri Lanka in 1997 was 297 kg ha -'
373

(Han Wenyan, personal communication). In Kenya, the recommended quantity wasabout 280-350 kg ha -' (Othieno, 1994). Meanwhile, the presented results also showthat the amount of N applied to the fields varied greatly from 279 to 2,104 kgha' in the green tea areas (West Lake District of Hangzhou and Xinchang) with anaverage of 597 kg ha - '. This is more than twice the recommended amount of 214 kgha' which is based on yield (for every 100 kg made tea, 12.5 - 15 kg N). This applica-tion was also much larger than the 100-300 kg ha-' usually applied to black tea (Owuor1997). This difference might be explained by the different response to nitrogen withrespect to the quality of green and black tea. Whereas for green tea, the quality isclosely correlated with the contents of total nitrogen and free amino acids in the leaf(Lu et al., 1994; Mukai et al., 1992), for black tea, however, large nitrogen applicationmay reduce the quality. This is largely due to the decreased formation of catechins,leading to a lower content of theaflavins, brightness and flavour index (Owuor andOdhiambo, 1994). Therefore, to produce a better quality usually smaller nitrogen fertil-izer rates are applied to black tea than to green tea.On the other hand, the presented results showed that the nutrients were not properlybalanced. In the three regions, the ratio of N : P20 5 : K20 was I : 0.1-0.2 : 0.1- 0.2,distinctly different from those observed in the product (leaf) where it is approximately1 0.22 : 0.56. This shows that insufficient P and in particular too little K was appliedas compared to the recommendation of I : 0.25-0.5 : 0.25-0.5 for China (Ruan, 1999),1 :0.16 : 0.4 for Sri Lanka (Han Wenyan, personal communication) and 1 : 0.25 : 0.25or I : 0.5 : 0.5 for Kenya (Othieno, 1994). In India, the appropriate N : K20 ratio is inthe range of I : 0.6 to I : I (Barbora, 1994). The results from soil analysis and also thefield experiments confirmed that more K is needed in the tea production systems ofChina, showing the significant response of tea to K fertilizer application (Ruan et al.,1999).
Acknowledgement
The financial supports from the International Potash Institute and '151 Project' ofZhejiang Province were acknowledged. The authors thank the assistances of GuanghanLin, Jianming Cai, Xiangbao Hong, Yuanzhi Shi, Lifeng Ma and Wenyan Han.
References
Barbora, B. C. (1994). Practices adopted in North-East India enhance tea productivity.Proceedings of the International Seminar on "Integrated crop management in tea:towards higher productivity", Colombo, Sri Lanka, April 26-27, 1994. Internatio-nal Potash Institute, Basel, Switzerland. pp. 67-78.
Lu, J. S., Wei, H. F. and Li, C. H. (1994). Composition of major free amino acids inyoung shoots and effects on quality of tea. J. Southwestern Agric. 7 (Supplement),13-16.
Mukai, T., Horie, H. and Goto, T. (1992). Differences in free amino acids and totalnitrogen contents among various prices of green teas. Tea Res. J. 76, 45-50.
Othieno, C. 0. (1994). Agronomic practices for higher tea productivity in Kenya. Pro-ceedings of the International Seminar on "Integrated crop management in tea: to-wards higher productivity", Colombo, Sri Lanka, April 26-27, 1994. InternationalPotash Institute, Basel, Switzerland. pp. 79-95.
374

Owuor, P.O. (1997). Fertilizer use in tea: the case of nitrogen. Tea I8, 132-143.Owuor, P. 0. and Odhiambo, H. 0. (1994). Response of some black tea quality pa-
rameters to nitrogen fertilizer rates and plucking frequencies. J. Sci. Food Agric.66, 555-561.
Ruan, J., Wu, X. and Hirdter. R. (1999). Efficiency of potassium and magnesium inChina's tea gardens. In: Proceedings of workshop C organized by the InternationalPotash Institute at the 16" World Congress of Soil Science, Montpellier, France,20-26 August 1998: Essential role of potassium in diverse cropping system. Ed. A.E. Johnston. pp. 73-86. International Potash Institute, Basel, Switzerland.
Ruan, J. (1999). Balanced fertilization for quality tea production. In: Proceeding of 9thCongress of Soil Society of China. 'Soil Sciences towards 21 century: improve-ment of soil quality and sustainable development of agriculture'. pp. 160-163.China Environmental Science Publishing House, Beijing.
Shui, S. and Chang, K. (1996). Contributions of technical progress to the tea economy-A quantitative assessment. International Tea Workshop: Advances in tea sciencesand technologies and the world tea economy. 1996, July 9-11. Beijing, China.
375


Nutrient balances of vegetable cropping systems and their control byfertilization in Tianjin
Zhou Yimin, Zhang Jinsheng*, Huang Feng, Zhu Jinghua and Wang Zhengxiang
Soil and Fertilizer Institute of TAAS (Tianjin 300192)*Information Institute of TAAS Tianjin 300192
Abstract
The soil nutrient balance and fertilization management of vegetable fields were studiedby surveying different crop rotation and planting patterns in different areas of Tianjin.
Furthermore, results of long-term fixed location trials were included to present and
discuss current fertilizer management issues of an important vegetable production area
of China. Results for typical vegetable rotations indicate that in the surveyed areas thebalance for nitrogen was always positive and application of N exceeded the removal by
the crops between 4 and 58%. For P and K, the removals generally exceeded the inputs
and for P, between 49% and 88% of the removed P was returned to the fields throughmineral fertilization. The ratio between input and output of K was even wider and
showed that between only 27% and 71% of the K removed was returned to the field. Thesituation changed dramatically when the location and the production systems were
individually analyzed. In suburban vegetable gardens and under protected cultivation(greenhouse), inputs of N and P were so excessive that sometimes more than 6 times the
amount of N removed was applied to the field. For P, the ranges of oversupply were
between 80% - 270%. In the more remote from the urban areas located fields the
balances were negative, especially when vegetables were cultivated in rotation withfield crops. The situation for K was completely different and even in the suburban,
protected cultivation systems, the K inputs were dramatically smaller than the removals
and only between 0 and 83% of the removed K was returned in form of mineral fertilizer.The long-term trials showed that even when 450kg K20 ha -1 were annually applied to
the vegetable rotation, the K balances were clearly negative with 106-418 kg K20 ha -1.Only in two years when substantial amounts of K were applied through organic manure,
the balances were positive. In total of six years with the combination of two applications
of organic manure and sufficient application of mineral potassium (450 kg K20 ha-'), theK balance was positive. The application of 225 kg K20 ha -' yr- was too small to balance
removals over the time period to avoid that the soil becomes depleted of K whereas the
combination of two applications of organic manure and 450 kg K20 ha - ' in the mineralform may lead to an K accumulation in the soil if no losses by leaching, etc. occur.
Introduction
Developing vegetable production and ensuring the supply to urban consumers are the
foremost tasks facing urban-suburban type agricultural production in metropolis. In
377
order to achieve the three aims of vegetable production (high yield, high quality andhigh efficiency), scientific and reasonable fertilization is necessary. Studying the soilnutrient balance and developing rational fertilization practices is therefore of greatimportance.Tianjin is located along the bank of the Bohai Sea and lies within the warm temperatezone with a semi-arid monsoon climate. Planting vegetables along the bank or coast ofvast alluvial plains such as the northern and southern Grand Canal and Haihe Rive, etc.has a history of at least one hundred years. In recent years, the vegetable fields shifted tothe outer suburbs due to the expanding cities. More than 60,000 hectares are cultivatedwith vegetables and of the total, 2/3 of the area is newly developed. China-wide up to500 million tons of vegetables are produced annually to meet the need of 900 millionurban citizens. However, a significant proportion of the production is also exported. Thevegetable production has become an important pillar of the suburban market economy.Along with the fast developing economy and the mineral fertilizer industry, theapplication of fertilizer to vegetables has been doubled, producing a higher output andincome today. However, as the fertilizer application to vegetable fields is lacking ascientific standard and technical advises, cases of reduced output and environmentalcontamination have been reported, causing an unfavorable image to agriculture. Aimingat further understanding of the vegetable nutrition, this paper tries to give insight intonutrient balances, nutrient contents in the soil, depending on various soil fertilitymanagement practices in the vegetable gardens.
Materials and methods
Selection of sampling location
Places of representative cropping systems (including one crop, two crops and threecrops per year and five crops per 2 years rotations) were selected for sampling. Thesample collection included protected (greenhouse) and non-protected systems. The siteswere also analyzed with respect to cultural practices so that depending on those, NPKbalances could be determined. The cultivation practices included mulching, protectedand open field cultivation with varying degree of management level, depending on thedistance from the city. The fertilization practices varied also largely, showing that theintensity of organic manuring increased with the proximity to the urban areas.
Investigation method
The investigation was carried out by interviewing farmers, technical staff and leaders ofbrigade and inspections at the sites and by analyzing the taken samples.
378

Budgetary estimate of soil nutrient balance
The soil nutrient balance was estimated according to the nutrient input (organic manure
and fertilizer, etc) and removal.
Fixed location trial
In order to study the effect of a varied nutrient supply to vegetable on the potassium
balance and to monitor the effect of management practices on soil nutrients, from 1993to 1998 a long-term fixed position trial was conducted. This comprised three treatments
consisting of NP, NPKI and NPK2. When every planting period was finished, vegetableyield, potassium absorbed by plants and soil potassium content were analyzed and the
nutrient balance was calculated.
Result and discussion
The status of NPK balance in vegetable garden soil of different crop rotations
At first, the NPK balance of vegetable gardens cultivated with different crop rotations
was investigated. Results show that in open fields the average input was 847 kg N ha',239 kg P ha- and 369 kg K ha1 whereas the average output was 696 kg N ha', 411 kg P
ha -1 and 602 kg K ha' (Table I).
Table 1: Status of NPK balance in vegetable garden soil cultivated with different crop
rotations
Location Type of Nitrogen Phosphorus Potassium
rotation Input, Output Index InutI Output Index* Innut Output Indexkgt kgha % kgU akgha-'I % kgaalkglha- %
CabbageYangliuqing Cucumber 840 763 110 240 470 55 360 716 50
Xiqing ChinesecabbageSpinach
Baitangkou Eggplant 794 765 104 151 282 54 225 443 51Jinnan Chinese
cabbage
Xinlicun TomatoChinese 713 562 127 190 392 49 135 497 27
Dongli cabbage
Tianmu CeleryPimento 1,019 643 158 450 606 74 375 714 53
Cucumber
Shuigaozhuang Eggplant 875 743 117 300 342 88 452 638 71Xiqing Squash
Average 848 695 122 238 418 64 369 602 50*Note: The index signifies how much of the respective nutrient in % of the plant
removal is replaced by fertilization
379
Comparing the nutrient outputs with the inputs, a nutrient replacement index could becalculated in which output was set as 100. An index of greater than 100 hence signifiesthat more than has been removed is returned to the field whereas as an index of< 100indicates insufficient nutrient replacement. The indexes of 122% for N, 64% for P and50% for K show that N has been applied slightly in excess whereas P and K were clearlyundersupplied. With approximately half of the potassium replaced by fertilization, a Kdeficit is building up over the years, leading to a drastic K depletion of the soils.
The NPK balances in vegetable gardens depending on cropping pattern
The NPK balance in vegetable gardens, depending on differences in cropping pattern,was studied in the following and results indicate that the fertilization level varied
between locations and cropping patterns. Comparisons between protected cultivationand open field in the vicinity of the city and outer suburbs showed that the amount offertilizer applied in protected cultures was larger than in open fields. Furthermore, fieldsnear the city received more than those in the outer suburbs. The experience is thatgrowers apply heavy amounts of fertilizer to cucumber, eggplant and Chinese cabbagedue to greater response and higher benefit. The majority of mineral fertilizers appliedconsisted of nitrogen and phosphorus whereas the use potassium was ratherunderrepresented. This results in a nutrient imbalance, especially in protectedcultivation and in fields near the city. The details (Table 2) reveal that in the rotation ofcucumber, cucumber and Chinese cabbage, the total nitr6gen applied was up to 3,779 kgha ' whereas the amount of nitrogen removed by the plants was only 630 kg ha'. Thisleads to a replacement index 600%, meaning that six times the amount removed hasbeen applied to the crops in only one year. Similar observations could be made forphosphorus, showing that the applied amounts largely exceed the amount removed bythe plants. The replacement index was 158-373%, indicating that rates were adjusted toreturn 1.6-3.7 times the amount removed by the plants. This may be the reason whythere is a positive correlation between the number of vegetables planted per year and theaccumulation of phosphorus in the soil. The survey also shows that in the case ofpotassium, the amounts applied usually did not match the amounts of K removed by thecrops. Even in the most intensive protected cultivation only between 56% and 83% ofthe K removed was replaced by fertilizer application. In open field cultivation, thereplacement index of between 0-37% shows that K is clearly neglected and in the longrun a severe K depletion of the soil occurs. It seems, there is also a clear trend in thenutrient supply from the vicinity of the field to the urban areas, showing that the nutrientinput declines the further away the field is from the city. The amount of fertilizer appliedto the field of the outer suburbs and where vegetables were intercropped or rotated withgrain crops was much less and often did not meet the demand, even for nitrogen andphosphorus. The replacement index was 41-114% for N, 32-76% for P and 0-83% for K.Furthermore, data revealed that there was almost zero potash applied in the open fieldsof outer suburbs due to reduced organic manure application. Unbalanced fertilizationtherefore poses a big threat to sustainable vegetable production.
380

'C en c 0- en o -
In 00 en (N (N
o0) ~ - C '~1 - 04 ONo ~ - In ON In 0- 'C 00C - ON 'C In 00 0- ~a -(0
-Oa)
0- en ~ en en c -H (N ON CC C- 'C
0)~ en 00 ON ON CI '~O (N0- In (N ~0 00 0- eno en - (N en -
0-
oo ~o ~C C In en 1~ (N en In
00 ~ 0- ~ ON In 00- t (N - (N 't -
-~ o.~e-c0)-c
In ON0- 0- C (N en en ~- n000 'C 0- 'C In In en
1<0)~ 00 0 - ~ 'C 't -
In C 0- '0 In -
z ~ - 'C (N en (N -
0
a.", 00 C (N en'C en - - 00 00 00~ o~ 0- 'C In ~ In 'C en
-t
.~ -0) In ON t - -
o~ 0 0- C ON ON 0- 000.~ 04 0--~ ~- st 0- In
---------00
0-CI 0)2 8 .2-~ ~ 0)C) 0) -~ C) ,fl
0 0 ~
>1 0) 0)~E 0)
00 0t .C 00) ~ Q.fl~o0c .0
-~a',nco~co ,Z~0- 0- ~O~OO L~ 'V C~
00 ~', 0)000 ~ ~ 11 05 U £
O -O0) 0 0
.0 -- a','0 - U'0 0)
o C ~ .00 -. ct U'
0
~U' C~tfl 0)
03E t.00~C C0
0)0 ~
H ________
381

The effect of fertilization on salinity and accumulation of nitrate in vegetable gardensoils
The survey of the effect of fertilization on salinity and accumulation of nitrate in gardensoil concentrated on the analysis of two soil depth 0-20 cm and 20-40 cm. The resultsindicate that heavy fertilization of vegetables increased salinity and nitrate accu-mulation in these soil depths and there was a clear difference between vegetables eitherunder polytunnels or in greenhouses and the open field (Table 3).
Table 3. Accumulation of salinity and nitrate in vegetable garden soils
Soil .. NitrateLocation Planting Duration Salinity N rati
pattern (years) depth () (%) PO or Gto(cm) () () P/orGO
ShangXinkou Polytunnel 3 2-20 0.352 0.092 2.6
XiQing 20-40 0.208 0.035 11.7
suburb Open field 3 2-20 0.265 0.035 -
20-40 0.170 0.003 -
Green house 16 2-20 0.225 0.047 4.320-40 0.236 0.038 7.6TianMu Tinu2-20 0.161 0.057 5.2
BeiChen Polytunnel 16suburb 20-40 0.116 0.023 4.6
Open field 2-20 0.136 0.011 -
20-40 0.105 0.005 -
Green house 25 2-20 0.207 0.068 3.220-40 0.154 0.058 9.7
WanXinCun Polytunnel 19 2-20 0.097 0.027 1.320-40 0.130 0.031 5.2DubgLi 2-20 0.120 0.024 1.1
suburb Polytunnel 620-40 0.095 0.022 3.7
Open field 2-20 0.153 0.021 -
20-40 0.088 0.006 -
Green house 7 2-20 0.126 0.028 0.820-40 0.067 0.016 0.5
ChengGuan 2-20 0.13 0.027 0.8BaoDi Polytunnel 10 2-20 0.071 0.02 0.8cony20-40 0.079 0.0 12 0.4
Open field 2-20 0.115 0.034 -
20-40 0.115 0.032*Note: The ratio in the soil contents between polytunnel and open field (P/O) orgreenhouse and open field (G/0) was calculated.
Compared with open fields both soil depths showed a significant greater accumulationof salts and nitrate in protected fields (polytunnel and greenhouse). The nitrateaccumulation at a depth of 20-40 cm in the protected field was 3.7-11.7 times larger
382
than in the open fields. Further away from the cities in the outer county, there were nodifferences between the protected and open field in both soil depths. According to theresults of 55 samples taken from 10 different locations, it was reported that there was aclose correlation between the nitrate content and salinity in greenhouses and poly-tunnels at a depth of 0-20 cm and 20-40 cm, respectively. The coefficient was 0.8432**(n-19) and 0.7281**(n-17), respectively, indicating that applying large quantities ofnitrogen increased salinity. This unfavorable influence on vegetable growth wasadditionally accompanied by an accumulation of nitrate in the vegetable tissue,reducing their edible value. Furthermore, the nitrate which remains in the soil may beleached from the root zone and poses also a certain risk of contaminating the groundwater. Therefore, it is important to keep soil nutrients in balance and to use nitrogen,phosphorus and potassium based on the crops' requirements.
Effect of applying fertilizer on the soil potassium balance studied in long-term fieldtrials
The results shown in Table 3 indicate that attention needs to be paid to supplementingpotassium to vegetables in order to keep nutrients in balance. A fixed location trial hasbeen conducted for 7 years in an alluvial fluvio-aquic soil in Tianjin, with the treatmentsNP, NPKI (112.5 kg K20 ha-') and NPK2 (225 kg K20 ha-'). Every other year, organicmanure was applied to the plots. The aim was to find a method of applying potash moreeffectively so that vegetable yields increase and the soil nutrients are kept in balance.
Effect of different treatments on vegetable yield
Table 4 shows vegetable yields under different crop rotations over the years. The resultsindicate that potash fertilizer increased the yield of vegetables.From 1993 to 1998, 16 crops were grown in the trials. In the treatment NPKI, in 8vegetables, yield increased whereas 7 crops had the same yield as the NP control. Onlyone crop (fennel) had a lower yield in NPKI compared to the NP control. In thetreatment NPK2, yield increases were observed in 12 crops, in 2 crops yields were thesame as in the NP control whereas in 2 crops yields decreased with an average of -5.2%.The results also showed that based on the farmers' application practice supplying potashis efficient in maintaining a consistently good vegetable production. Particularly in yearswith a high disease pressure, the vegetable fields treated with potash showed a betterdisease resistance (for example eggplant in 1998).
383

Table 4. Effect of potash on vegetable yield in a fixed position trial
Location Plant Year Yield Yield increase (%)Location Plant Year NP (kg ha') NPK1 NPK2
Shuigao- Tomato 1993 94,400 1.48 2.12zhuang Xiqing Chinese cabbage 134,000 10.67 13.13District Tomato 35,470 13.05 5.72
Chinese cabbage 1994 108,600 13.35 17.59Rape* 23,800 -1.26 9.66Cauliflower **1995 40,550 7.50 8.66Eggplant 39,010 9.79 11.66Fennel* 18,130 22.61 16.05Tomato 1996 ***43,610 -1.38 2.66Green turnip 87,070 2.14 14.96Fennel 13,080 -12.84 -5.73Squash **1997 37,270 5.90 7.00Chinese cabbage 50,610 -0.59 -4.80Fennel* 15,300 -2.10 7.10Eggplant 1998 ***73,570 87.50 35.50Green turnip 34,510 -3.39 5.67
Note: *Vegetable planted throughout the winter: No fertilizer applied ,**The year inwhich organic manure was used, ***Serious disease pressure.
Soil potassium balance under different fertilization methods
The total amount of K taken up in comparison to the amount applied to the various crops
in the trial and the estimated potassium balance for the vegetable garden over several
years is summarized in Table 5. It is generally known that due to their intensive biomass
accumulation and the relative high hirvest index (only little amounts of biomass areremaining on the field at harvest), vegetables usually require a larger supply of
potassium than other crops, e.g. cereals. Under conditions where no K is applied (NP
control), the total amount of potassium removed from the soil by plants was 2,643 kgha-1 over the studied period. During the same time, only 1,828 kg K20 ha1 were applied,
resulting in a deficit of 815 kg ha1 potassium within 6 years or an annual undersupply of
136 kg K20 ha'. The yearly supplementation of certain amounts of potassium to the soil
(such as treatment KI and treatment K2) reduced the imbalance between supply and
demand. In 1995 and 1997, large amounts of organic manure were applied (15 t ha' in1995 and 7.5 t ha-' in 1997) which added another 1,156 kg K20 ha-' and 672 kg K20 ha -'to the system. This caused that at the larger rate of K application (NPK2) the overall K
balance (over 6 years) became positive and there was a net gain in the soil K supply,
unless no K was lost by leaching. Despite the large addition of organic manure in the NP
and NPK1 treatment (225 kg K20 ha - ' yr'), the overall balance remained negative.Though other experience shows that the application of organic manure is also
economically beneficial, it seems that its use is limited to the suburban areas, where the
material is dumped without spending great efforts on transport, etc. In the remoter areas
the use of organic manure was reduced due to labor and transport requirement so that an
384
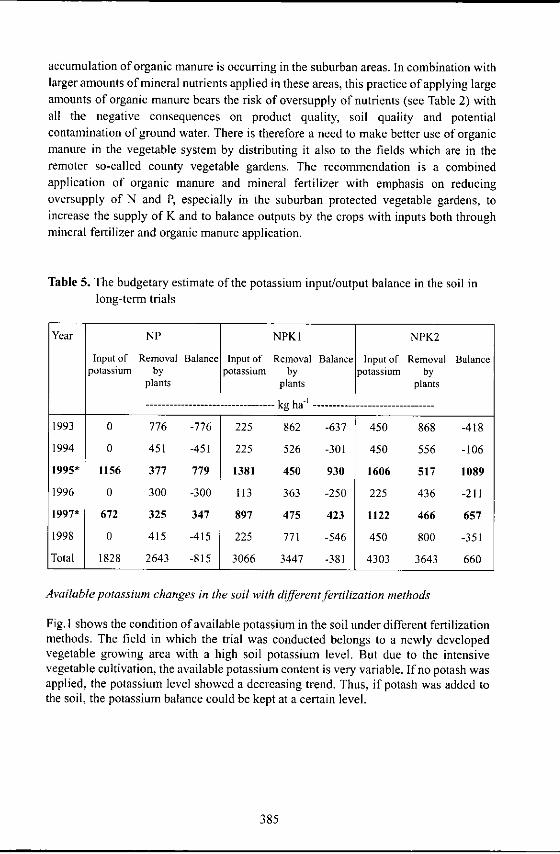
accumulation of organic manure is occurring in the suburban areas. In combination withlarger amounts of mineral nutrients applied in these areas, this practice of applying largeamounts of organic manure bears the risk of oversupply of nutrients (see Table 2) withall the negative consequences on product quality, soil quality and potentialcontamination of ground water. There is therefore a need to make better use of organicmanure in the vegetable system by distributing it also to the fields which are in theremoter so-called county vegetable gardens. The recommendation is a combinedapplication of organic manure and mineral fertilizer with emphasis on reducingoversupply of N and P, especially in the suburban protected vegetable gardens, toincrease the supply of K and to balance outputs by the crops with inputs both throughmineral fertilizer and organic manure application.
Table 5. The budgetary estimate of the potassium input/output balance in the soil inlong-term trials
Year NP NPK I NPK2
Input of Removal Balance Input of Removal Balance Input of Removal Balancepotassium by potassium by potassium by
plants plants plants
------------------------------ kg ha 1 --------------------
1993 0 776 -776 225 862 -637 450 868 -418
1994 0 451 -451 225 526 -301 450 556 -106
1995* 1156 377 779 1381 450 930 1606 517 1089
1996 0 300 -300 113 363 -250 225 436 -211
1997* 672 325 347 897 475 423 1122 466 657
1998 0 415 -415 225 771 -546 450 800 -351
Total 1828 2643 -815 3066 3447 -381 4303 3643 660
Available potassium changes in the soil with different fertilization methods
Fig. I shows the condition of available potassium in the soil under different fertilizationmethods. The field in which the trial was conducted belongs to a newly developedvegetable growing area with a high soil potassium level. But due to the intensivevegetable cultivation, the available potassium content is very variable. If no potash wasapplied, the potassium level showed a decreasing trend. Thus, if potash was added tothe soil, the potassium balance could be kept at a certain level.
385

400--0-NP NPK1
E 300
S 2500-o - 200
> 150
100
1993 1994 1995 1996 1997 1998
Experimental years
Figure I. Annual variation in available potassium contents in the soil as affected by
different K treatments
Conclusion
1. The NPK balance in open fields cultivated with different vegetable rotations showed
that the average input was 847 kg N ha', 239 kg P20 5 ha - ' and 369 kg K20 ha - in
one year. The average output amounted to 696 kg N ha-', 411 kg P20 5 ha -' and 602
kg K2 0 ha -1, showing a nutrient replacement index 122% for N, 64% P and 50% for
K. It is indicated that both P and K were insufficiently supplied whereas the K deficit
was more serious than that of P.
2. The study of the nutrient balance in open fields in comparison to protected vegetable
cultivation showed that the input of NP in protected fields in the urban and suburban
areas was much larger than in open fields and exceeded by far the input of protected
fields in the county. The nutrient replacement index in protected fields ranged
between 158-600% for N, 180-445% for P and 56-83% for K, indicating that the N
supply exceeded the N removal between 1.6-6 times, that of P 1,8 to 4.5 timeswhereas for K the supply covered only 56%-83% of the K removals. The index was
smaller, between 225-346% for N, 182-369% for P and 0-37% for K and in the
county remote from the city only 41-114% for N, 32-76% for P and 0-21% for K.
This shows clear gradients in the nutrient supply between locations, indicating
oversupply in the vicinity of cities and an undersupply in the remote fields. A general
replacement rate <100 and in certain cases even 0 indicates soil K depletion.
3. The survey of the effect of fertilization on salinity and nitrate accumulation in
vegetable garden soil indicated that both mainly occurred in protected fields,
because of a great quantity of nitrogen fertilizer being applied. Main accumulationoccurred at a depth of 0-20 cm and 20-40 cm, respectively. The nitrate accumulation
at a depth of 20-40 cm in protected fields was 3.7-I 1.7 times greater than in open
fields and fields in the county.
386

4. The study on potassium application in a long-term field trial shows that it was veryimportant to add appropriate amounts of potash to vegetables in order to increase theyield and to improve quality. From 1993-1998, the analysis of 16 in rotation grownvegetables indicated that potash application led to a high yield response, rangingbetween 5.7% and 87.5%.
387


Fertility of soils under rubber plantations and fertilizer applicationin tropical China
Lin Zhaomu, Li Shicong, Cha Zhengzhao and Yu Rangshui
Chinese Academy of Tropical Agricultural Sciences, Danzhou, Hainan 571737
Abstract
The 8 major soil types in the rubber tracts of China are described, showing that theirfertility varied considerably, revealing a downward trend after planting of rubber. Aconsumption and supply analysis of nutrients in prime rubber plantations revealed thatthe annual consumption of nutrients by rubber trees equalled those coming from thesoil. A nutrient depletion of the soils occurs due to additional nutrient losses by runoff,soil erosion, leaching, etc. Fertilizer application promotes the growth of rubber treesand rubber production, showing that young rubber trees, receiving organic manure +N and P fertilizers, grew faster by 7%-20% in Hainan and 24%-177% in Guangdong.Generally, rubber trees planted in fertile rubber plantation soils produced 50% -100%more dry rubber than those planted in less fertile soils. This indicates that increasingthe soil fertility by fertilizer application is an effective measure of improving thegrowth and latex yield of rubber trees. The effect of fertilizers was enhanced by stimu-lated tapping of the rubber trees.
Introduction
Rubber plantations in China are spread over the provinces of Hainan, Yunnan, Guang-dong, Guangxi and Fujian located at the 180 - 240 N, ranging between the northernfringe of the tropics and the southern subtropics. The major soil types are lateritic soilsand red soils. The nutrient status of the soils in the rubber plantations in general israther poor and the rubber trees grow slowly and yields are small. For many years,research has been carried out to obtain more information on the nutritional status of themajor soil types and the soil fertility change after planting of rubber trees. The purposeof this study is to look into the aspects of nutrient demand and improvement of fertil-izer application to rubber trees in order to raise the soil fertility of the plantations tosustain better growth and larger latex yield of rubber trees.
Soil fertility of different soil types in rubber plantations in China
There are 8 major soil types in China's rubber plantations and their fertility parametersare shown in Table 1. The main occurrence and fertility of these soil types are de-scribed in the following.
389
Granite-derived lateritic soil under tropical rain forest
This soil is found in the hills and low mountainous area in the Southern and CentralHainan. The soil is gravely and reddish yellow and the topsoil has an organic matter
content of 24.7 g kg -', 1.43 g kg-' of N, 38.3 g kg -' of K20 with high inherent fertility.The topsoil also contains large amounts of exchangeable K' and a high K /Mg' ratio(11-17), usually resulting in occurrence of so called yellow leaf disease which is due toMg deficiency in rubber plantations.
Granite and schist-derived laterite under tropical monsoon forest
This soil type is found in the hilly areas of Western and Central Hainan. The topsoilhas an organic matter content of 16.9 g kg -', 0.87 g kg' of N and 22.4 g kg -' K20. Theexchangeable K'/Mg 2
1 ratio with 0.6-0.9 is in the adequacy range.
Basalt-derived ferruginous laterite under tropical shrubbery and miscellaneous treeforest
This soil type is found in the hilly areas with slight slope in Northeast Hainan and Le-izhou Peninsula of the Guangdong Province. The soil has a thick horizon with a rela-tively high clay content and has a brownish red colour. The topsoil is relatively rich inorganic matter (35.3 g kg-'), N (1.79 g kg') and P20 5 (1.75 g kg-') but very poor intotal K (only 2.39 g kg -') and available P (0.8 mg kg-'). Rubber trees, growing on thissoil often show P deficiency and an oversupply of Mg, leading to early coagulation of
latex during tapping.
Granite and gneiss-derived red soil in south subtropical bracken grassland (Dicranop-teis linearis)
This soil type is found in the hilly areas of south subtropical Guangdong, Guangxi andFujian. The topsoil has a rather small organic matter content (19. lg kg-') and is poor inN (0.68 g kg-'), P20 5 (0.22 g kg-'), available N, P, K and Mg. The fertility is low andrubber plantations can only produce large yields after receiving mineral fertilizers.
Phyllite-derived laterite in tropical bamboo and miscellaneous tree forests
This soil type is found in the south of the Yunnan Province. The soil is clayey and richin mineral nutrients. The topsoil has a large content of organic matter (36.3 g kg-') andN (1.62 g kg -') and is sufficient in exchangeable K , Ca 2 and Mg' . But this soil isalso poor in P (0.9 mg kg-'). It has a high exchangeable A13 (1.67 cmol kg -') contentdue to soil acidity (pH 4.4 - 4.5), conditions which are detrimental to the growth ofrubber trees.
390

z eno en- tOot No' tot en - - 0>
4- *fln 'C'C 1fl '.00) (flit) t- it 'C 'C Ott)'2'.0O 0>N 'C'C 00) 'Cen en to ot o ot'0
q) <~o' (Nit to(fl (Nefi Not 'tot N - ON0 00 00 0 0 0 - - 000
4. (fiN -ot (N. 0 0)Cl 'C '.0 0 XtNen- toot -0) v~tot 0'C en ot - n o]o]~O0 -- -O 00 (NO OCt 0 -O
~.d6 66 66 6666 66 66 66
toE too' otto 0)N 'Cr4 t0) OC 't N 0 to10 Q(~ Vto 'to] tot -O 0)ot 0) it (N 0 'C'CCd'.~Cdoto] torn en- ~CN en- 0 to to 'C it-0 066 66 66 66 66 <6 a - Co4)
L12 0 (fl en '0 - en (N '.0 tO - (N 0) tO ot 0' 'C+ CC) tot o]'t 'Ott) 'ON 0 to 0 fl No]
-- -O 00 en- '.0 en - 0 00cc 66 66 66 66 6 6 o o 00
-r
Cd enN otto t)to 0)0) 0) 't) (N en Into> eno rio 00 -26 66 < 6 - a o]~
'to] (Not (No] (N - 't) 0 to'C~otN (l'C Cfl'C ON 04 fl N -
~enen (No] (N--------------------------------------(N (NN'>o'it 0)0 toen o]'t 0)N en to 0 0) 'Cot
Cenen tin Nit (No] enen 't en to 't '.0'C
-~&66 66 << 6666 66 00 co
to-~ Zento Nen 0)0 oten o]'C (N (N - 't enen~ itN toit Not 'Cit 'C- 't N N N Nit
-O 00 -0 0------------------------------0 00Cd0
Nit o'N ento to ento (N 'C 0) (N 0'to
0 'ten '66 &'6 &-2 'nt -en - (N 'Coten- -- (flo] en - it - -
S0o 't'C On enN ento 0-? In en 'C 01 eno'-s 0 No] 0't oto' o]N 0) 'C - ot 't oto]
-- (N-----------(N
~C) "(N enot 'tot N0) Nen en (N N 0) 0)ot
0 Cd Q(Nen enit toot itt Not 'C tO 0) - 't'C0 ~ --
CdI-
Nen~ tom nto Oto '1-to 0 00 to to 004) O0)en too oo tin o'to It N In 0'
NN enen N'C Into 'C 'n 'n it toN0
4) -O 0)0' -N to 0) to 'C to 'CO~ 66 '66 A'6 62 c-i 5 -o' o'-
Cd ~ Oo]en (No] nit (Nen tn'C in it it "1- c-len
4)Not -en 0)ot ICI't 'Cot to 'C -
- to't en'C 'ON 0)0) No' 0 ~ 5 '.6 'tt---------- (No] -- (No] ot - (N (N (N'C0 -z
0 '~rnN tON enen 'to 'C (N 0 00 In N'C0 ~ cttoot '6at '65 In't 0)0) 't 't No]
totoit 'Cin -04 tot (No' en en en (N 'C'C
0 0 0 0 0 0 0 0o ~OO 00 00 00 00 0 0 0 0 00~(N (N- (N (N (N-I (N - (N -
0 o~655555~55 ~ 00 00to - (N (N (N (N (N (N 04 (N
0) *-*~ > >0I: to
4) I-- 4) -t* 0- 0 I-- ~
C) - -0 4) ~ 4) ... ~ ~ 4) 004-I 0> ct~ 0> C 0t~ Ct~> --
- - 00 Cdti~ 3 m-- t ~
to 0~ Q-~ ~~O-o
391

Granite-derived laterite in tropical bamboo and miscellaneous tree forests
This soil type is found in the south of the Yunnan Province. The topsoil is relativelyrich in organic matter (31.2 g kg'), N (1.42 g kg-'), exchangeable K , Ca2" and Mg"and contains less exchangeable Al" (0.437cmol kg-') which makes it better suitable forrubber cultivation than the phyllite-derived laterite.
Red sandstone and limestone-derived red soil in south subtropical bracken grasslandand brushwood
This soil is found in the south of Guangxi, where abundant rainfall occurs. The soilcolour is brownish yellow and it consist mainly of silty clay. The topsoil contains largeamounts of organic matter (41.9 g kg-') and N (1.471 g kg-') with a wide C/N ratio(14.2). The amounts of available N and P are insufficient whereas the exchangeableMg 2+ with 0.11 cmol kg-' is relatively abundant. Al+ with 1.78 cmol kg ' often leadsto toxicity and the rubber trees grown in this soil usually suffer from K deficiency.
Shallow-sea deposit-derived red soil in south subtropical sparse grassland
This soil is found in the coastal terrace regions of Guangdong, Guangxi and Hainan.The topsoil is poor in organic matter (16.9 g kg-'), N (0.73 g kg-') and K20 (2.5 gkg-). The rubber trees grow slowly and yields are generally small in this soil due toshortage of N, P, K and Mg.
Soil fertility change after planting of rubber trees in tropical soil
Rubber plantations established on different soil types but from similar clones and simi-lar age were selected, and the unclaimed land with natural vegetation in the vicinity ofthe rubber plantations was taken as control. Soil samples of the 0-20 cm soil layer werecollected and the fertility status was analysed to record the change in soil fertility byusing the t test (see Table 2)(').It was observed that the soil fertility after planting rubber tended to decline, showingalso an increasing soil acidity indicated by a decline in pH by 0.22 (Table 2). Most ofthe soil nutrients were reduced in the topsoil (0-20 cm). The organic matter, N, K20,exchangeable K+, exchangeable Ca2+ and exchangeable Mg 2 + were reduced by 16.9%,20.6%, 10.5%, 50.0%, 46.7% and 69.6%, respectively. Phosphorus was the only nutri-ent of which the total content increased by 8.6% and the available P even by 300%.The increase in P content was due to long-term application of P fertilizers. Observa-tions suggest that considerable amounts of soil was lost by erosion. Assuming that dur-ing 17 years of rubber cultivation, 15 cm of the topsoil or 150 t soil mu - (2,250 t ha- 'at a bulk density of 1.5 g cm ) were eroded, the following amounts of nutrients werelost: organic matter at the amount of 4,065 kg mu- ' (60,975 kg ha-'), 185 kg mu - '(2,775 kg ha-') of total N, 99 kg mu - ' (1,485 kg ha') of total P20 5 and 2250 kg
392

K2 0 mu' (33,750 kg K,0 ha'). The downward trend of soil fertility after planting
rubber indicates that soil and water conservation and fertilizer application should bestrengthened after rubber planting to control and reverse this trend for a sustainable
utilization of the land.
Table 2. Change of soil fertility of a tropical soil after planting rubber (PR107, age 17,
soil layer: 0-20cm)
Total nutrients (g kg') Available PSample Organic matter N P20 5 K20 (mg kg -')
Natural soil 27.10 1.235 0.663 15.07 1.62Plantation soil 22.53 0.980 0.720 13.49 6.93
% to the natural 83.1 79.4 108.6 89.5 427.8soil
t value 2.216* 3.244** 1.340 0.738 1.688
Exchangeable cations (cmol kg -')K+ Ca2+ Mg 2+ A13+ pH
Natural soil 0.220 0.471 0.168 2.182 4.92
Plantation soil 0.110 0.251 0.051 2.133 4.70
% to the natural 50.0 53.3 30.4 97.8soil
t value 2.208* 2.708* 1.884a 0.290 2.079 a
(Pairing method, using the t test, n = 20, to1=1.729 a t0.05 2.093*, tOo=2.863**)
Balance between demand and supply of nutrients in prime rubber plantations
A rough estimate was made of the demand and supply of nutrients in prime rubber
plantations (Table 3). The annual consumption of nutrients from the soil by prime rub-
ber trees were N = 13.73 kg mu , P = 1.37 kg mu- and K = 6.13 kg mu -' (I mu =1/15ha) among which 30%-37% was fixed in the trunk and root system and 39%-58%
found in the leaves. Some of these nutrients were returned to the soil through shedding
and some of the nutrients can be recycled after the rubber trees are felled. The nutrientsremoved in the harvested latex were N - 0.75 kg mu- or 5.5% of the total nutrient
uptake, P = 0.24 kg mu -' or 17.5% and K = 1.05 kg mu'I or 17.1% of the uptake. This
suggests that nutrients removed by latex comprises only a small proportion of the total
nutrient uptake. The soil nutrients in rubber plantations are replenished by litters, pre-
cipitation, microbial fixation of N, fertilizer application, etc. The soil of well-managed
rubber plantations usually receives annual nutrient applications, equivalent to N -
13.61 kg mu ', 99.1% of the anticipated N uptake, P - 1.48 kg mu-l, 108.0% of the
anticipated P uptake and K - 6.14 kg mu-', 100.2% of the anticipated K uptake. This
discloses that the demand and supply of nutrients in such a fertilization system are bal-
393

anced. A deficit occurs by the fact that nutrient losses are not only due to uptake andremoval but also caused by soil erosion and runoff, leaching and N denitrification.This fact needs to be additionally taken into account. It is hence very important tocarry out measures such as water and soil conservation and diagnosis-based fertilizerapplication to prevent the soil nutrients from being lost.
Diagnosis-based fertilizer application
Fertilizers contribute a large proportion of the nutrient supply in rubber plantations.Under normal fertilizer application (15 kg tree' yr-' of organic manure to mature rub-ber trees) the N, P and K supplied accounted for 45.4%, 87.1% and 66.4% of the totalnutrient supply, respectively (Table 3). Additional fertilizer application improved thenutritional status of the soil and trees and hence evidently the growth and the latex pro-duction of the rubber trees.
Relationship between fertilizer application and the growth of young rubber trees
Experiments and commercial production show that fertilizer application encouragedthe rubber tree growth and reduced the immaturity period (Huang and Pan, 1964a). Ina fertilizer experiment carried out on the Tuanjie State Farm of the rubber tract of theWest Guangdong Province, the young trees grew 22.4 cm in girth without fertilizerapplication after 7 years, but 47.0 cm with organic fertilizer and NP fertilizer with afertilizer effect of 109.8% (Table 4), (Huang and Pan, 1964b).The effect of fertilizer application on young rubber trees grown on different soil typesin Guangdong and Hainan Province showed that the growth effect of young rubbertrees treated with NP fertilizer in Hainan was 7%-20% (Table 5). It usually takes 7-10years for the young rubber trees grown without fertilizer applications to be ready forproduction, but only 5-6 years for those which are well-managed and receive fertilizer,reducing the immaturity period by 1-3 years. In the rubber plantations grown on redsoil in the State Farms of the Guangdong Province, a more evident growth effect up to129%-177% occurred when organic manure was applied. In poor red soil, it takesmore than 15 years for the rubber plantations without fertilizer or manure applicationto grow to a girth size ready for tapping but only 7-8 years for the young trees treatedwith fertilizer or manure. The young rubber trees generally require no K fertilizer be-fore taken into production, but a little amount of K fertilizer is needed for the rubberplantations in ferruginous laterite and poor red soil. There, it is needed to promote thecold hardiness of rubber trees and their latex regeneration and flow after the beginningof tapping.
394

a)N
CE~ -~ XE
- ~ S a)-~ a)
~ -~
S -~
M C) '~ t ~~ a) Cr-."-. Cl a) aCd a) ~ Cd Cd - -
a) ~-a>--.2~ ~ a-)Cl~r~ Cd a) ~ C) - -
- - -- Cd CdCd Cd
- a-) BC C)-e ~2~- -~ ~
c~
5 Cd ~2 ~ a-"~ -~ C~0.~0 tw,.ornn
C..) c~~flr- ~ Cdr.C&Cr -2el~Cl Uen~en
C- C C---. ON 0 ~ en ~ cc 0
Cd~ 0 Cl
a ~ Cl ~Th C en cc 0 *i-~ 0 en ~c 1~Cl Cl - o '-o - - Cl-C
a-Ia)N
a) C '~ ,t ON Cl aON ON C-- en Cg a 'coCl en - - - Cl ~ -
-cCO C - ~ Cd cc r- - co - cc
S ~ 'fl Cl - en - 0 en ON 1-00a-~ CCC C - a 6 6 6 -. 20
Cr- 4
Ca)
~ C ~ 1- a Cl en C en - aC - 00 ~ C ~ 6 6 e--i en C
en v~ - Cl - Cl - en -0
~ ~ ~ ~-, en 00 Ca 5 en c C-- K ~fl -C
CC C 6 en en - - -&- Cl -
-C -~CCdata)a)I- C Ca-. C Ca) -O - -O I 0
an C) C -~C) Cd C '1 1- Cd
O 5 -~I-. -~ - an
a S.0 5 a a-a) G- ~ .0 a) a) -~
Cd a) Na) at a) 0 *-~0 C C
Cd -- 4-~ - at a-~ ~ C *- C- ~ C -a ~ a a) I- Cb~ Cd Cd tC '- -~ a ~ ~Cr 5C >~,an -OXZ C - o - C4-.a) C ~ *~ ~%t~-~ C
-C- ~ -da- > tot- - a) Ca) ~ -~
ZCdZ 0 Cd-. C5- ZZoOCdCOC Cd
a) ~5-an Ca)>.
en Cd- ~a -'.~ C
F-
395

Table 4. Effect of different nutrient management practices on girth growth of young
rubber trees (Tuanjie State Farm, Guangdong)
Treatment No fertilizer C C+N C+P C+N+PGirthgrowth over 22.4 34.8 31.8 43.3 47.07 years (cm)
% 100 155.3 142.0 193.7 209.8*Note: C 5 kg compost tree' yr",
C+N = 5 kg compost + 0.125 kg AS** tree-' yr-I,C+P = 5 kg compost + 0.125 kg SSP** tree- yr- ,C+N+P = 5 kg compost + 0.125 kg AS and 0.125 kg SSP tree yr 1,
**AS - ammonium sulphate, SSP = single superphosphate,
Table 5. The effect of fertilizer application on the growth of young rubber trees invarious soil types
Effect of Effect of N+ PLoca- Soil N Soil P20 5 N P fertilizertion Soil type (g kg') (g kg') fertilizer fertilizer effect
__________(%) (%) (%)Granite and gneiss-derived red soil in 035- 0.25-0.74 62-64 60-83 129-177south subtropical 0.98bracken grasslandGuang-
dong Basalt-derived fer-ruginous laterite intropical shrubbery 1.9-2.1 0.96-1.18 5-6 20-27 24-36and miscellaneoustree forest
Basalt-derived fer-ruginous laterite in
Hainan tropical shrubbery 0.9-1.0 0.93 5-8 7-9 8-15and miscellaneoustree forest
Granite-derivedlaterite soil in 1.6-1.7 0.34-0.74 7-11 6-7 7-20tropical rain forest
Fertilizer application to tapped rubber trees
The influence of fertilizer application on latex yield of rubber trees increased with treeage. This is due to the fact that rubber trees require larger amounts of nutrients fromthe soil with increasing age, which means that more nutrients have to be suppliedthrough fertilizer application. Moreover, fertilizer application encourages the girth
396

growth, bark thickening, differentiation and development of latex vessels, etc., whichpromote the latex production potential and increase latex yield gradually.
Soil fertility, the key factor for high yielding of mature rubber trees
The soil fertility in rubber plantations has a distinct effect on growth and latex yield(Table 6). Comparison of growth and latex yield of two rubber tracts grown at a simi-lar latitude but at different soil fertility levels showed that the soil of the rubber plan-tations in Yunnan contained 64% more organic matter, 52% more total N, 194% moreexchangeable K' and 21% more Mg 2+ as compared to Guangdong and Guangxi (Ta-ble 6A). The corresponding leaf levels, dry matter synthesized and latex yield were55.7%, 104.7% and 45.0% larger, respectively (Table 6B). This indicates that the soilfertility in rubber plantations is consistent with the growth and yield of rubber trees(Xiao and Li, 1991).
Table 6. Soil nutrient contents (A) and growth and latex yield of rubber trees (B)grown in soils of different nutritional status
A Plantation Soil nutrientsLocation OM N Avail P Exch K+ Exch Mg>+
(%) (mg kg-') (rg kg-') (cmol kg - ) (cmol kg " )Yunnan 3 32.8 1.36 1.54 0.215 0.063WestGuangdong, 5 19.96 0.894 2.24 0.073 0.050GuangxiComparison +64.3 +52.1 -31.3 +194.5 +20.6
B Plantation Growth and yield of rubber treesLeaf Leaf nutrient content Girth Dry mat- Latex
weight (g kg-') (cm) ter yield(kg N P K (kg mu-') (kg mu-')mu I)
Yunnan 3 207.8 33.1 2.50 12.8 73.1 1070.9 76.1WestGuangdong, 5 133.5 31.3 1.88 9.42 47.2 523.2 52.5GuangxiComparison +55.7 +5.8 +33.0 +35.9 +54.9 +104.7 +45.0%LNote: The rubber tract is distributed at 22°-22.5' N in Yunnan and at 20.3o-22.0' N
in Guangxi and Guangdong. Rubber plantations with clone PRI07 at age 17,tapped without stimulation.
Application of fertilizer based on the soil fertility
The soil fertility varied much in rubber plantations with different soil types. The gran-ite-derived laterite soil in tropical rainforest in South Hainan and the basalt-derived
397

ferruginous laterite soil in tropical shrubbery and miscellaneous tree forest in NorthHainan differed largely in their nutrient contents (Table 7). The former soil is rich inK and the latter is deficient in K but contains large amounts of available Mg. Thegranite-derived soil has a 4.6 times larger exchangeable Kt but 70.5% less exchange-able Mg". Therefore, plantations with granite-derived laterite soil are usually suscep-tible to yellow leaf disease caused by magnesium deficiency.
Table 7. Observed soil fertility parameters in different soil types and recommendednutrient ratios
Soil type Total Avail. Exchangeable Nutrient ratio*N P 20 5 P K Mg2t KM N: P20 5 : K20
g :MgO---- g kg- --- mg kg -. .... cmol kg -'--- ratio
Granite-derived 1.43 0.39 3.0 0.560 0.033 17.0 1.6 :1.0 :0.4:red soil in tropi- 0.2cal rainforestBasalt-derived 1.79 1.75 0.8 0.121 0.112 1.1 1.7: 1.0 :2.3:ferruginous lat- 0erite in tropicalshrubberyComparison % -20 -78 +275 +363 -71
*Note: Recommended nutrient application ratios, suitable for rubber trees understimulated tapping.
On the other hand, plantations with basalt-derived ferruginous laterite soil are prone toyellow leaf disease due to K deficiency and early coagulation of the latex. The latter isespecially observed on soils with large supplies of divalent cations such as Ca 2+ and
Mg' +. Therefore, it is necessary to apply fertilizer with different ratios of nutrients,according to the soil types of the rubber plantations. For example, for plantations inSouth Hainan, a nutrient ratio of N : P 20 5 : K20 : MgO of 1.6 : 1.0 : 0.4 : 0.2 and for
plantations in North Hainan, a ratio of 1.7 : 1.0 : 2.3 : 0 is recommended. The ratesrecommended are 1.5-2.0 kg tree' yr 1, using compound fertilizers with a total nutri-ent content of 27-30% (including trace elements). Trials and experiments proved thatwith such application the general nutrient deficiencies can be corrected. Dry rubberyield was usually increased by 4.2%-6.9% as compared to the traditional fertilizerapplication method (Zhong, 1992).
Fertilizer application to rubber plantations, using a stimulated tapping system
Stimulated tapping of rubber trees with ethephon at a reduced frequency with shallowtapping is one of the innovations to improve rubber production. The principle is thatstimulants prolong the latex flow time and hence increase latex flow. Observationsshow that through the increased productivity also the demand for nutrients is in-creased. Table 8 shows how the nutrient uptake changes in rubber plantations under
398
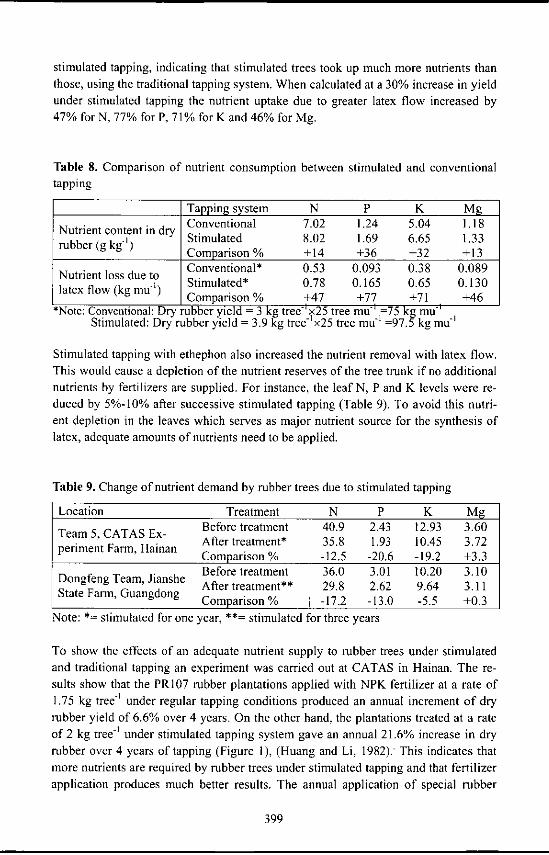
stimulated tapping, indicating that stimulated trees took up much more nutrients thanthose, using the traditional tapping system. When calculated at a 30% increase in yieldunder stimulated tapping the nutrient uptake due to greater latex flow increased by47% for N, 77% for P, 71% for K and 46% for Mg.
Table 8. Comparison of nutrient consumption between stimulated and conventionaltapping
Tapping system N P K Mg
Nutrient content in dry Conventional 7.02 1.24 5.04 1.18Stimulated 8.02 1.69 6.65 1.33rubber (g kg -') Comparison % +14 +36 +32 +13
Nutrient loss due to Conventional* 0.53 0.093 0.38 0.089latex flow (kg mu') Stimulated* 0.78 0.165 0.65 0.130
Comparison % +47 +77 +71 +46*Note: Conventional: Dry rubber y eld = 3 kg tree-Ix25 tree mu- 75 kg mu
Stimulated: Dry rubber yield = 3.9 kg tree-'x25 tree mu' =97.5 kg mu-I
Stimulated tapping with ethephon also increased the nutrient removal with latex flow.This would cause a depletion of the nutrient reserves of the tree trunk if no additionalnutrients by fertilizers are supplied. For instance, the leaf N, P and K levels were re-duced by 5%-10% after successive stimulated tapping (Table 9). To avoid this nutri-ent depletion in the leaves which serves as major nutrient source for the synthesis oflatex, adequate amounts of nutrients need to be applied.
Table 9. Change of nutrient demand by rubber trees due to stimulated tapping
Location Treatment N P K MgBefore treatment 40.9 2.43 12.93 3.60Teaiment CaTS Ea After treatment* 35.8 1.93 10.45 3.72
periment Farm, Hainan Comparison % -12.5 -20.6 -19.2 +3.3
Before treatment 36.0 3.01 10.20 3.10Dongfeng Team, Jianshe After treatment** 29.8 2.62 9.64 3.11State Farm, Guangdong Comparison % -17.2 -13.0 -5.5 +0.3
Note: *= stimulated for one year, **= stimulated for three years
To show the effects of an adequate nutrient supply to rubber trees under stimulatedand traditional tapping an experiment was carried out at CATAS in Hainan. The re-
sults show that the PRI07 rubber plantations applied with NPK fertilizer at a rate of1.75 kg tree - ' under regular tapping conditions produced an annual increment of dry
rubber yield of 6.6% over 4 years. On the other hand, the plantations treated at a rateof 2 kg tree- ' under stimulated tapping system gave an annual 21.6% increase in dryrubber over 4 years of tapping (Figure 1), (Huang and Li, 1982). This indicates thatmore nutrients are required by rubber trees under stimulated tapping and that fertilizerapplication produces much better results. The annual application of special rubber
399

compound fertilizer, containing 25%-30% N, P, K will generally satisfy the nutrientrequirements by rubber trees under stimulated tapping system and maintain the soilfertility when green manure is applied in deep trenches as it is usually practiced.
6 25
5 20
'~) 4
10
• 2
1 5
0 0,1
0 N NP NK NPK
[- Yield (kg ha- I) -C- Yield increase (%)
Note: N = 0.8 kg ammonium sulphate per tree, P = 0.8 kg single superphosphateper tree, K = 0.4 kg potassium chloride per tree
Figure 1. Yield increasing effect of nutrients applied to rubber trees under stimulatedtapping
Conclusions
1) China has 8 major soil types in its rubber tract, varying drastically in their fertility,which shows a downward trend after land reclamation for rubber planting.
2) Organic matter, total N and total K of the soil were reduced by 16.9%, 20.8% and20.5%, respectively, after 17 years of planting rubber. The exchangeable K, Ca 2+
and Mg 2 + and pH were also reduced to some extent, and only P was increased,which may be the result of long-term application of P fertilizer to rubber planta-tions.
3) The estimated nutrient uptake showed that mature rubber trees have an annual nu-trient demand of 13.73 kg N mu'1, 1.37 kg P mu - and 6.13 kg K mu-".
4) The nutrient supply to the rubber plantations was in the region of 13.61 kg N mu- ,equal to 99.1% of the uptake, 1.48 kg P mu' , equal to 108.0% and 6.14 kg K mu'- ,equal to 100.2% of the annual uptake.
5) These amounts are not sufficient to fully cover the demand since the efficiency ofuptake is hardly 100% under field conditions and significant nutrient losses can beexpected in the humid climate where rubber is grown. This is especially true for N,which shows a clear deficit in the supply as soon as leaching losses such as ero-sion, leaching and N denitrification were taken into account. The same is true forthe cations K and Mg which are easily lost by leaching particularly on coarse tex-tured, light soils.
400

6) It is hence necessary to conserve water and soil and apply fertilizer to avoid thedecline in soil fertility and to ensure sustainable land use.
7) The N, P and K application by organic manure normally accounts for 45.4%,87.1% and 66.4% of the nutrient supply to the crop. The differences, including theanticipated nutrient losses need to be balanced by mineral fertilizer.
8) Fertilizer can improve the nutritional status of both the soil and the rubber trees andhence encourage greatly the growth and latex production of the trees. Young rub-ber trees showed a growth effect of 7%-20% in Hainan and 24%-177% in Guang-dong when treated with manure and mineral fertilizer.
9) Fertilizer application caused a distinct effect on rubber yield of mature rubbertrees. The dry latex yield of rubber trees was 1.5-2 times larger in fertile than lessfertile rubber plantations. This suggests that it is a good practice to improve the soilfertility in rubber plantations.
10) For rubber plantations with different soil types, the fertility varies and hence fer-tilizer with different nutrient ratios should be applied. The K-rich rubber planta-tions (on granite-derived soils) should receive fertilizer at a nutrient ratio of N :P20 5 : K20 : MgO, being 1.6 : 1.0 : 0.4 : 0.2. For the K-deficient and Mg-rich rub-ber plantations (basalt-derived soils), the fertilizer nutrient (N : P20 5 : K20 : MgO)should be adjusted to 1.6 : 1.0 : 0.4 : 0.2.
11) Fertilizer application should be based on the soil nutrient status to correct nutrientdeficiency of rubber trees and to overcome in soil nutrient supply. An observationshows that this practice can increase dry rubber yield by 4.2%-6.9% as comparedto the conventional fertilizer application without looking at the soil nutrient supply.
12) Rubber trees consumed 46%-77% more nutrients in stimulated than in conven-tional tapping systems. The successive stimulation usually led to a decline in leafnutritional levels. In this case, fertilizer application produced an evident increase inrubber yield. The conventionally tapped rubber trees produced 6.6% more yieldwhen NPK fertilizer was applied while the stimulated rubber trees yielded 21.6%more.
13) Organic manure should be incorporated in trenches and annual application of the1.5 - 2.0 kg tree-' of a concentrated multi-nutrient fertilizer, including N,P,K, Mgand micronutrients should be annually applied to meet the nutritional requirementsof rubber trees with stimulated tapping.
References
Lin Deguang (1977). Experimental Design and Statistical Analysis for TropicalCrops. Hainan: South China College of Tropical Crops, 52-55.
Huang Zongdao, Pan Yanqing (1964a). Study of Fertilizer Application System forRubber Trees in China. Hainan: South China Subtropical Crops Research In-stitute, 3-6.
Huang Zongdao, Pan Yanqing (1964b). Study of Fertilizer Application System forRubber Trees in China. Hainan: South China Subtropical Crops Research In-stitute, 6-27.
401

Xiao Jizhen and Li Shicong (1991). The fertility of several types of soil in the rubbertract in West Guangdong and Guangxi and the effect of the fertility on rubbertree growth and latex production. Research of Tropical Crops, (1): 36-39.
Zhong Jingyi (1992). Development of rubber special compound fertilizer and its ap-plication effect. Research of Tropical Crops. (3): 12-15.
Huang Zongdao and Li Shicong (1982). High yielding (150 kg mu' -200 kg mu-')cultural practice for rubber trees in West Hainan. Research of Tropical Crops,(1): 7-8.
402

Nutrient status and management of tropical fruit cropson the Hainan Island
Xie Liangshang, Pan Shunqiu and Zhang Wen
Soil and Fertilizers Institute, Hainan Province Academy of Agricultural Science571100
Abstract
Hainan Island accounts for most part of the tropics in China and enjoys favourableconditions to produce tropical fruits. But the soils are strongly weathered, acid, containsmall amounts of organic matter and are deficient in total and readily available nutri-ents. In addition to inherently poor fertility, inadequate nutrient input and imbalance ofNPK seriously limit the yield potential of the fruits. The yield of banana is only 22.0 1ha- , of pineapple 24.6 t ha-1 and of mango 4.5 t ha-'. Analysis of soil samples from 73orchards revealed poor organic matter, total N, total P, and total K as well as readilyavailable N, P and K. According to the classification for nutrient availability during thesecond soil survey, most of the soil samples were deficient or seriously deficient innutrients. Though in the recent 10 years, the consumption of mineral fertilizers on theisland has doubled, reaching 270,000 t of nutrients in 2001, with an average applica-tion of only 150 kg ha-' it may be still regarded as low. The N : P20 5 : K20 ratio of themineral fertilization has improved to 1:0.32:0.25, but it is obvious that the current. Kapplication cannot meet the high K demand of tropical fruit crops. Our survey revealedthat the annual nutrient balance in fruit orchards on Hainan is roughly +20 kg ha-I forN, -11.8 kg ha- for P20 5 and -123 kg ha- in terms of K20. On this basis, it is esti-mated that Hainan will need additional 150,000 t of nutrients from mineral fertilizers.Balanced fertilization by supplementing K fertilizers in six demonstration sites hasresulted in a significant yield response of banana. The experiments of balanced fertili-zation in pineapple showed that the application rate of N350 K800 achieved the bestplant growth and the highest nutrient absorption by the plants.
Introduction
Hainan Island, a brilliant pearl inlaid in the South China Sea, has a land area of 3.40million ha, accounting for 42.5% of the country's total tropical area. On this island, itis all year round summer, it is free from frost and snow, with an annual mean tempera-ture ranging between 22 - 26°C, an annual sun shine of 1,750 - 2,750 hours and an
annual solar radiation of 502.4 - 615.5kj cm-. Under the influence of the tropical mon-soon, the island has plenty of rainfall. Though it has distinct dry and wet seasons and75% - 86% of the rainfall is concentrated in the period from May to October, rainfalland warm temperatures coincide, which is promoting plant growth and cycling of bio-mass. Favourable water and temperature resources endow the mysterious land with a
403

wide coverage of tropical rainforests. Fragrant mango, pineapple and coconut treesgrow everywhere. Rice can be harvested three times per year, sugarcane growsthroughout the year and vegetables and melons are planted in fall and harvested inwinter.In terms of landscape of the 3.40 million ha of land, 25.4% are considered mountains,13.3% hills, 32.6% tablelands and 28.1% terraces and plains. 30% of the land is suit-able for farming, 23.9% for tropical crops, 27.3% for forests, 9.2% for grazing and4.0% consist of surface waters. According to the soil classification, 53.3% are latosols,10.0% latosolic red soils, 3.6% yellow earths, 2.6% dry red earths, and 8.4% alluvialsoils. In 1998, the island had 0.428 million ha of cultivated land (including 0.243 mil-lion ha of paddy fields), 0.140 million ha of orchards (including 0.106 million ha offruit orchards) and 0.426 million ha of tropical crop plantations (including 0.371 mil-lion ha of rubber plantations). Agriculture is the most important business and source ofincome on the island. Plantations, tropical fruits, cereals, vegetable and melon crops inwinter and tropical cash crops represent the mainstay of the tropical agriculture.
Production of tropical fruits
The island has a huge variety of fruits, about 61 families, 138 genera, 273 species, in-cluding popular fruits like pineapple, litchi, citrus, longan, guava, papaya, banana,carambola, wampee (Clausena lansium), etc. Furthermore, special tropical fruits likemango, jackfruit and naseberry (sapodilla) and local specialties of the island such asegg-shaped litchi, rambutan, mangosteen, etc. are found in Hainan. Since 1950, theproduction of fruits has undergone four phases, restoration from 1950 to 1960, techni-cal renovation from 1960 to 1967, stagnation from 1968 to 1978 and continuous de-velopment from 1978 till today. By 1998, the area of fruit tree cultivation had ex-panded to 0.1062 million ha with a total output of 0.5663 M t (Table 1), which is anincrease of about 143.6% and 284.8% compared to 1987 when the island became aprovince.
Table 1. Cultivation area and output of major fruits on Hainan Island in 1998
Crop Area (1000 ha) Yield (kg ha') Output (000t)
Pineapple 147 10,728 1.577Litchi 156 276 43Citrus 22 4,955 109Banana 173 15,347 2,655Longan 94 96 9Mango 363 1,860 675Others 107 - 598Total 1.062 5,332 5.663
404

Among the six major fruits, pineapple is grown mainly in Qionghai and Wanning,which both accounted for 58.6% of the province's pineapple production. Litchi, longanand citrus are mainly grown in Qiongshan, Danzhou and Qiongzhong, mango mainlyin Changjiang, Dongfang and Sanya. Altogether these three areas account for 45.5% ofthe province's mango production area. Banana is extensively planted in all 19 counties(cities), with Ledong County ranking first, looking at a cultivated area of 2,584 ha.In recent years, with the development of an agricultural cooperation between Taiwanand Hainan, numerous Taiwanese businessmen have invested in fruit cultivation on theisland. Not only that they brought in capital, they also introduced new fruit varietiesand cultivation techniques for high quality and yield, for instance guava, red caram-bola, passionfruit, etc. to the island.
Soil nutrient status in fruit cultivation
Soil nutrient status
Soil pH
Since Hainan island is located in the humid tropics with high temperature, plenty ofrainfall and alternation of dry and wet season, the soils are subjected to strong desilici-fication and aluminium enrichment, weathering and leaching, which causes that theybecame acidic over time. According to the findings of Chen Jing (Table 2), the pHvalue ranges between 4.05 - 6.87. 75.4% of collected soil samples were acid and ex-tremely acid, 22.3% slightly acid and only 2.3% neutral.
Table 2. pH value of soils in the mango plantations on Hainan island
pH Samples tested Percentage (%) Classification4.05-4.50 38 29.2 extremely acid4.51-5.50 60 46.2 acid5.51-6.50 29 22.3 slightly acid6.51-6.87 3 2.3 neutral
Acidity causes that the root systems of the plants are subjected to large Al3+ and H+
concentrations, which affect their ability to extend or penetrate into the soil to effec-tively absorb available nutrients. The analysis of soils derived from different parentmaterials in pineapple and banana plantations further revealed that there is a strong Pfixation. 36.3 - 87.4% of the collected soils showed this disorder. Between 7.5% -41.2% were poor in K, 2.0% - 64.3% poor in S, 26.9% - 32.8% poor in Cu, 12.9% -41.5% poor in Zn, 4.6% - 38.4% poor in Mn and 12.9% - 70.1% poor in B (Table 3).In total, the extent to which these nutrients became limiting to crop production eitherthrough fixation or due to low supply decreases in the following order: P > B > Cu >Zn> K>S> Mn.
405

Table 3. Proportion of studied soils (%) derived from different parent material whichshow distinct disorders in nutrients for the production of pineapple or ba-
nana
Plantation Parent material P K S Cu Zn Mn BPineapple Basalt 87.4 7.5 64.3 32.0 41.5 3.6 70.1
Sandstone 53.1 21.2 11.4 26.9 12.9 -4.6 63.4Banana Basalt 62.9 21.6 44.0 32.8 39.0 16.8 12.9
Basalt 58.2 41.2 12.6 31.0 32.2 24.2 50.9Shallow marine deposit 36.3 16.7 2.0 31.6 25.6 38.4 48.8
Mean 59.6 21.6 26.9 30.9 30.2 15.7 49.2
Soil organic matter
On Hainan, organic substances decompose rapidly due to the favourable water and
temperature conditions. Litters can reach 10 - 11 t ha- every year so that organic mat-
ter in natural soils is not as low as generally assumed. Cultivation, however, has rap-
idly depleted soil organic matter. According to a soil analysis from 5 orchards, the con-
tent of soil organic matter ranged between 8.55 g kg' - 28.8 g kg -' with an average of
15.94 g kg -' (Table 4). On the basis of the nutrient status grading criteria of the second
soil survey, the soils are classified as Grade 4, indicating medium to low nutrient con-
tents. The reason for the low soil organic matter content is the fast turnover under hot
and humid conditions and the negligence of the use of organic manure in cultivation,
besides natural conditions that are adverse to organic matter accumulation in the soil.
Table 4. Soil nutrient status in orchards on Hainan island, depending on parentmaterial
Orchard Parent material n. O.M. Total N Total P Total K r.a. N r.a. P r.a. K
S(g kg ) ----------------- (mg kg-1) ----..
Mango Granite 4 13.15 0.77 0.26 33.98 70.5 4.04 82.1Shallow ma- 10 8.72 0.42 0.14 12.91 22.8 3.91 30.8rine deposit
Banana Basalt 4 19.60 0.34 0.41 10.62 21.6 17.90 48.0Shallow ma- 16 9.20 0.24 0.20 8.58 19.1 2.80 52.2rine deposit
Pineapple Sandstone 2 8.55 0.58 0.21 8.54 18.9 3.50 32.9Basalt 6 11.60 0.62 0.47 5.10 22.4 3.40 18.5
Litchi Basalt 11 19.20 0.67 0.58 15.87 19.8 5.53 21.4Basalt 6 28.80 0.92 0.26 24.92 31.6 4.78 140.1
Longan Basalt 10 23.20 0.55 1.20 15.90 2.59 19.40 10.0Granite 4 17.40 0.79 0.39 21.57 27.7 19.50 110.8
Mean 15.94 0.59 0.37 15.01 27.0 7.18 55.6Note: n = number of samples; O.M. = organic matter; and r.a - readily available.
406
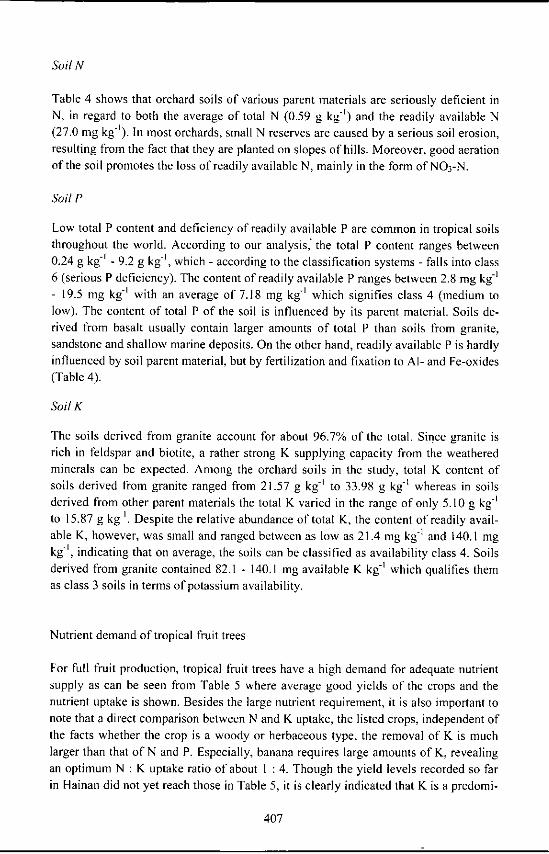
Soil N
Table 4 shows that orchard soils of various parent materials are seriously deficient inN, in regard to both the average of total N (0.59 g kg-') and the readily available N(27.0 mg kg'). In most orchards, small N reserves are caused by a serious soil erosion,resulting from the fact that they are planted on slopes of hills. Moreover, good aerationof the soil promotes the loss of readily available N, mainly in the form of NO3-N.
Soil P
Low total P content and deficiency of readily available P are common in tropical soilsthroughout the world. According to our analysis, the total P content ranges between0.24 g kg-' - 9.2 g kg-', which - according to the classification systems - falls into class6 (serious P deficiency). The content of readily available P ranges between 2.8 mg kg-1
- 19.5 mg kg -1 with an average of 7.18 mg kg -1 which signifies class 4 (medium tolow). The content of total P of the soil is influenced by its parent material. Soils de-rived from basalt usually contain larger amounts of total P than soils from granite,sandstone and shallow marine deposits. On the other hand, readily available P is hardlyinfluenced by soil parent material, but by fertilization and fixation to Al- and Fe-oxides(Table 4).
Soil K
The soils derived from granite account for about 96.7% of the total. Since granite isrich in feldspar and biotite, a rather strong K supplying capacity from the weatheredminerals can be expected. Among the orchard soils in the study, total K content ofsoils derived from granite ranged from 21.57 g kg'1 to 33.98 g kg -' whereas in soilsderived from other parent materials the total K varied in the range of only 5.10 g kg-1
to 15.87 g kg-'. Despite the relative abundance of total K, the content of readily avail-able K, however, was small and ranged between as low as 21.4 mg kg1 and 140.1 mgkg -', indicating that on average, the soils can be classified as availability class 4. Soilsderived from granite contained 82.1 - 140.1 mg available K kg-1 which qualifies themas class 3 soils in terms of potassium availability.
Nutrient demand of tropical fruit trees
For full fruit production, tropical fruit trees have a high demand for adequate nutrientsupply as can be seen from Table 5 where average good yields of the crops and thenutrient uptake is shown. Besides the large nutrient requirement, it is also important tonote that a direct comparison between N and K uptake, the listed crops, independent ofthe facts whether the crop is a woody or herbaceous type, the removal of K is muchlarger than that of N and P. Especially, banana requires large amounts of K, revealingan optimum N : K uptake ratio of about 1 : 4. Though the yield levels recorded so farin Hainan did not yet reach those in Table 5, it is clearly indicated that K is a predomi-
407
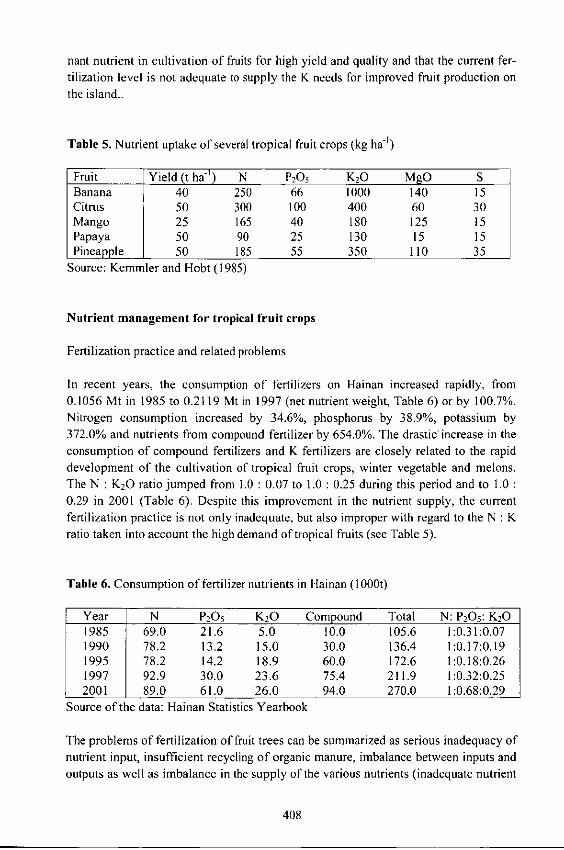
nant nutrient in cultivation of fruits for high yield and quality and that the current fer-tilization level is not adequate to supply the K needs for improved fruit production onthe island..
Table 5. Nutrient uptake of several tropical fruit crops (kg ha-)
Fmit Yield (t ha-') N P20 5 K20 MgO SBanana 40 250 66 1000 140 15Citrus 50 300 100 400 60 30Mango 25 165 40 180 125 15Papaya 50 90 25 130 15 15Pineapple 50 185 55 350 110 35Source: Kemmler and Hobt (1985)
Nutrient management for tropical fruit crops
Fertilization practice and related problems
In recent years, the consumption of fertilizers on Hainan increased rapidly, from0.1056 Mt in 1985 to 0.2119 Mt in 1997 (net nutrient weight, Table 6) or by 100.7%.Nitrogen consumption increased by 34.6%, phosphorus by 38.9%, potassium by372.0% and nutrients from compound fertilizer by 654.0%. The drasticincrease in theconsumption of compound fertilizers and K fertilizers are closely related to the rapiddevelopment of the cultivation of tropical fruit crops, winter vegetable and melons.The N : K,O ratio jumped from 1.0 : 0.07 to 1.0 : 0.25 during this period and to 1.0 :0.29 in 2001 (Table 6). Despite this improvement in the nutrient supply, the currentfertilization practice is not only inadequate, but also improper with regard to the N : Kratio taken into account the high demand of tropical fruits (see Table 5).
Table 6. Consumption of fertilizer nutrients in Hainan (I000t)
Year N P20 5 K 2 0 Compound Total N: P20 5 : K201985 69.0 21.6 5.0 10.0 105.6 1:0.31:0.071990 78.2 13.2 15.0 30.0 136.4 1:0.17:0.191995 78.2 14.2 18.9 60.0 172.6 1:0.18:0.261997 92.9 30.0 23.6 75.4 211.9 1:0.32:0.252001 89.0 61.0 26.0 94.0 270.0 1:0.68:0.29
Source of the data: Hainan Statistics Yearbook
The problems of fertilization of fruit trees can be summarized as serious inadequacy ofnutrient input, insufficient recycling of organic manure, imbalance between inputs and
outputs as well as imbalance in the supply of the various nutrients (inadequate nutrient
408

application ratios) and insufficient supply of other macronutrients and of the wholerange of micronutrients.
Serious inadequacy in nutrient input
Hainan has a total of 427,852 ha of cultivated land with a multiple cropping index of215%. Each hectare receives only 241 kg of nutrients, being only 72.8% of the coun-try's average. If the acreage (172,460 ha) of the tropical cash crops, fruits, tea and me-dicinal crops that also need fertilization, are included, the average application rate isonly 203 kg ha- '. Based on the calculation that 60% of the fertilizers consumed areused on cereals, vegetables and melons, the tropical fruit and cash crops receive only120 kg ha-' of fertilizer nutrients.
Inadequacy in input of organic manure
Banana exhausts the soil fertility as it creates a lot of biomass and has a short growingcycle. This means that a continued good nutrient buffer has to exist in the soil to ade-quately supply this demand. Therefore, organic manure becomes essential in buildingup soil fertility and to create this nutrient buffer for such demanding crops. With therapid development of the cultivation of winter vegetables and melons, large amountsof organic manure are now absorbed by vegetable gardens. Therefore, the supply oforganic manure to orchards sharply declined and only approx. 5 t ha' yr" are currentlyapplied. The growers are not used to apply organic manure to pineapple, or making useof pineapple stubs left on the field after harvest of the previous crop. For convenienceof field preparation, the crop residues are often burned after collection so that the bene-fit from the nutrients in the ashes is small. The important function of accumulatingorganic matter as nutrient buffer in the soil is completely neglected by this practice.Organic manure is also seldom applied to other tropical fruits due to the general short-age because of alternative uses and because of its relatively high prices and the incon-venience of transport.
Imbalance of N/K ratio
The unbalanced N/K ratio is caused by both the demand and the supply situation in themarket. The first reason is that most growers use fertilizers in an uncontrolled mannerpartly due to lack of knowledge that tropical fruit crops are K-demanding plants, theydemand and consume more N than K fertilizer. The second reason is that on the mar-ket, the supply of N and compound fertilizers dominate over that of straight K fertiliz-ers. Several banana and pineapple growers were surveyed and it was found that theyuse the following NPK ratios. To banana, they applied 750 kg N ha- , 570 kg P20 5 ha-I
and 600 kg K20 ha-, at a ratio of 1.0 : 0.76 : 0.80 and to pineapple, they applied 807kg N ha-', 214 kg P205 ha -I and 319 kg K20 ha"', at a ratio of 1.0 : 0.26 : 0.40. To op-timise production, these ratios appear to low to supply adequate K for the uptake andto make full use of the nitrogen applied.
409
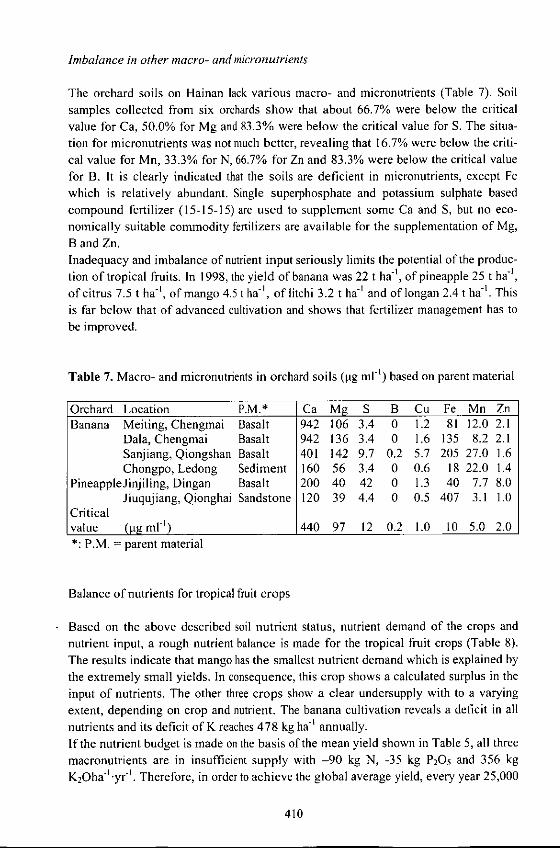
Imbalance in other macro- and micronutrients
The orchard soils on Hainan lack various macro- and micronutrients (Table 7). Soilsamples collected from six orchards show that about 66.7% were below the criticalvalue for Ca, 50.0% for Mg and 83.3% were below the critical value for S. The situa-tion for micronutrients was not much better, revealing that 16.7% were below the criti-cal value for Mn, 33.3% for N, 66.7% for Zn and 83.3% were below the critical valuefor B. It is clearly indicated that the soils are deficient in micronutrients, except Fewhich is relatively abundant. Single superphosphate and potassium sulphate basedcompound fertilizer (15-15-15) are used to supplement some Ca and S, but no eco-nomically suitable commodity fertilizers are available for the supplementation of Mg,B and Zn.Inadequacy and imbalance of nutrient input seriously limits the potential of the produc-tion of tropical fruits. In 1998, the yield of banana was 22 t ha-1, of pineapple 25 t ha-1,
of citrus 7.5 t ha-', of mango 4.5 t ha- ', of litchi 3.2 t ha-' and of longan 2.4 t ha-'. Thisis far below that of advanced cultivation and shows that fertilizer management has to
be improved.
Table 7. Macro- and micronutrients in orchard soils (Ing ml-) based on parent material
Orchard Location P.M.* Ca Mg S B Cu Fe Mn ZnBanana Meiting, Chengmai Basalt 942 106 3.4 0 1.2 81 12.0 2.1
Dala, Chengmai Basalt 942 136 3.4 0 1.6 135 8.2 2.1Sanjiang, Qiongshan Basalt 401 142 9.7 0.2 5.7 205 27.0 1.6Chongpo, Ledong Sediment 160 56 3.4 0 0.6 18 22.0 1.4
PineappleJinjiling, Dingan Basalt 200 40 42 0 1.3 40 7.7 8.0Jiuqujiang, Qionghai Sandstone 120 39 4.4 0 0.5 407 3.1 1.0
Criticalvalue (Pg ml') 440 97 12 0.2 1.0 10 5.0 2.0*: P.M. = parent material
Balance of nutrients for tropical fruit crops
Based on the above described soil nutrient status, nutrient demand of the crops and
nutrient input, a rough nutrient balance is made for the tropical fruit crops (Table 8).The results indicate that mango has the smallest nutrient demand which is explained bythe extremely small yields. In consequence, this crop shows a calculated surplus in theinput of nutrients. The other three crops show a clear undersupply with to a varyingextent, depending on crop and nutrient. The banana cultivation reveals a deficit in allnutrients and its deficit of K reaches 478 kg ha-' annually.
If the nutrient budget is made on the basis of the mean yield shown in Table 5, all threemacronutrients are in insufficient supply with -90 kg N, -35 kg P205 and 356 kgK2 Oha- .yr -'. Therefore, in order to achieve the global average yield, every year 25,000
410

I of N, 26,000 t of P20 5 and 102,000 t of K20 need to be additionally applied, which isequal to two-thirds of the current annual consumption.
Table 8. Budget of nutrients for four major fruit crops (kg ha-' yr -')
Crop N P20 5 K20Banana -37 -17 -478Citrus 32 3.7 -17Mango 70 11.5 39Pineapple 15.6 -10 -37Mean 20 -11.8 -123
Crop response to balanced fertilization of tropical fruit crops
In recent years, with the support of PPIC and IPI, experiments and demonstration ofbalanced fertilization have been performed on banana and pineapple with significanteffects.
Balanced fertilization on banana
Based on five experiments and demonstrations in Qiongshan, Ledong and Chengmai,the yield of banana was 37.4 t ha-1 under conventional fertilization and 46.1 t ha1,
about 23.6% larger, when K was supplemented (Table 9). Supplementation of K fertil-izers has not only increased the yield but also improved quality and even, advancedmaturity by 30 - 86 days, thus raising economic benefit significantly.
Table 9. Effect of K fertilizers supplementation on yield, quality and economic benefit
of banana
Location Treat- Yield Yield Length*Weight* Tot. Vc Net profit
ment (t ha- ) A (cm) (g) sugar* (mg kg-') (Yuan A(%) (%) ha-') (%)
Qiongshan -K 28.8 21.1 93.6 14.4 6.6 15,637 -+K 37.0 28.9 24.5 153.0 18.3 11.3 62,315 298.5
Qiongshan -K 31.0 - 19.3 117.2 14.4 6.6 14,947 -+K 38.3 23.5 20.1 139.3 14.4 6.6 51,978 247.7
Qiongshan -K 27.0 - 19.3 113.3 14.4 6.6 7,513 -+K 31.5 16.7 21.4 171.4 14.4 6.6 48,315 543.1
Ledong -K 58.6 - 21.6 145.0 18.5 26.6 81,840 -+K 71.6 22.2 23.2 162.0 20.2 27.4 131,190 54.7
Chengmai -K 41.6 - 21.6 145.0 18.5 26.6 34,410 -+K 52.3 25.7 21.6 145.0 18.5 26.6 62,235 80.9
*Note: Length refers to average finger length; weight = average weight of fingers; andTot. sugar = total sugar content.
411

Balanced fertilization on pineapple
According to Tan Hongwei et al. (this volume), crop response of pineapple to balancedfertilization ranges between 4.8% to 37.5%. Experiments on NK balanced fertilizationwere carried out in Qionghai and Dingan. Results show that NK balanced fertilizationpromotes growth and development of pineapple and increases nutrient content inleaves, preparing a good foundation for high yield and high quality of pineapple (Table10). It is noteworthy that the crop response to treatment N2 (700 kg Nha') and treatment N, (350 kg N ha- ') differed slightly in plant properties. The N con-tent in leaves was slightly higher in treatment N2 than in treatment N, and dry matter intreatment N2 even showed a downward trend. In treatment N1, crop growth and NKcontents in leaves rose with the increase in K application rate while in treatment N 2,
crop response was not significant, indicating that too much N disturbs the balance be-tween N, K and other nutrients in the plants with significant effect on the metabolism.
Table 10. Effect of NK balanced fertilization on growth of and nutrient content inleaves of pineapple (Jiuqujiang, Qionghai)
Treat- Plant Leaf Leaf Dry N P K Ca Mg
ment height length width weight (g) ------------- (g kg) ------------(cm) (cm) (cm)
N1Ko 51.9 73.2 4.7 32.28 13.08 1.20 14.45 18.55 1.28NIKI 53.6 73.7 4.8 35.05 12.02 1.36 22.76 20.18 1.09N,K 2 55.4 75.6 5.2 39.46 14.48 1.31 28.22 20.22 1.12N2K0 55.9 69.1 9.9 32.39 14.40 1.20 15.42 19.00 1.12N2K, 55.5 74.0 5.4 37.02 14.18 1.24 21.58 20.76 1.10N2K2 55.9 70.3 5.4 35.38 14.10 1.24 25.08 19.22 1.08
Conclusion
Hainan Island enjoys favourable climatic conditions to produce tropical fruits, but dueto strongly weathered, acid soils with low organic matter content fruits suffer from allkinds of nutrient deficiencies. In addition to inherent low fertility, inadequate nutrientinput and imbalance of NPK seriously limit the yield potential of the fruits. The yield
of banana is only in the region of 22 t ha-1, that of pineapple 25 t ha- and of mangoonly 4.5 t ha-'. Analysis of soil samples from 73 orchards revealed that according tothe classification system for nutrient availability of the second soil survey, most of thesoil samples were deficient or seriously deficient in nutrients. Though in the recent 10years, the consumption of mineral fertilizers has doubled, the average application isstill only around 150 kg ha-i of nutrients, which is very little in view of a year-round
cultivation (cropping index >2) Besides the general insufficient nutrient supply, alsothe NPK ratio of 1.0 : 0.32 : 0.25 may be regarded as inadequate for sustained largeyields. This is particularly evident from the nutrient balance which is negative for mostof the tropical crops studied. More emphasis needs to be placed on better nutrient sup-
ply, adapting the supply to the crop demand by especially increasing the K application.
412
Study on sustainable use of tropical forage and grassland in Hainan
Qi Zhiping' and Tang Shumei2
' Tropical field Crops and Animal Husbandry Research Institute (CATAS) Hainan5717372 Agricultural College the South China University of Tropical Agriculture Hainan
571737
Abstract
A long-term trial was carried out on tropical forages in Hainan located in the tropicalregion of China. The results indicate that the concentration of N and Ca in legume for-ages were greater than that of grass forages. Because of nitrogen fixation, legume for-ages absorbed more nitrogen than grass forage. Nevertheless, there was a clear declinein soil nitrogen and organic matter which was less pronounced under legume foragecompared to grass forage.
Introduction
The grassland of Hainan is characterized by typical tropical grasses and a few trees andbushes. The tropical grassland can be divided into four types: Savanna, wet grassland,low mountain-tableland grassland and hill-mountain grassland. Although the grassbiomass of tropical natural grassland is twice as large as that of temperate zone grass-land, the grass suited for fodder is relatively rare and usually located on slopes. Thegrassland is often mixed with farmland and forestry, leading to competition betweenagriculture, forestry and animal husbandry.Hainan has about 117,000 ha of wasteland which could be used for forage crops.Therefore, in recent years, the artificial sown pastures have been gradually enlarged inorder to fully exploit the tropical grassland production potentials, to improve the live-stock stocking rate and to make rational use of wasteland. Because of the establish-ment of artificially sown pastures, the production has been increased manifold, un-doubtedly accelerating the nutrient cycling of the soil. A long-term trial has been car-ried out on several tropical forages since 1988, in order to study how a sustainabletropical grassland can be developed.
413

Materials and methods
The natural conditions
The long-term trial was carried out in the experiment station of the Tropical FieldCrops and Animal Husbandry Research Institute of the Chinese Academy of Tropical
Agricultural Science.The station is located at the northern boundary of the tropics, with tropical monsoon
climate. The temperature is high and with a lot of rain concentrated in summer and
autumn. In winter and spring, the climate is characterized by lower temperature andvery dry conditions. The boundary of wet season and dry season is very clear. The an-nual average temperature is 24.00 C, the absolute highest temperature is 38.3 0C and theabsolute lowest is 9.1 'C. The annual precipitation is 2,160 mm and the annual sun-shine reaches up to 1,820 h. The soil in the tested area consisted of laterite. The phys-icochemical properties of the soil are shown in Table 1.
Table 1. The physicochemical properties of tested soil
Soil Depth Total-N O.M. Available-P Available-K Bulk density pH(cm) ---- (g kg')---- ------- (mg kg -' ) ------- (g cm -3 ) (H20)
Laterite 0-20 0.85 14.39 10.3 163 1.45 5.220-40 0.56 9.69 6.7 83.5 1.52 5.1
Plant material
The tested grass forages were Panicum maximum Jacq., Paspalum plicatulum, Setariaanceps cv. Nandi, Chloris gayana and Pennisetum purpureum K. Schumach x P. tv-phoideum Rich., and the legume forages were Arachis pintoi, Leucaena leucocephalacv. salvador and Stylosanensis guianensis cv. CIATI84. The plot area was 30 m2 andthe plots were replicated three times.
Methods
According to the different biological characteristics of the tested forages, samples wereregularly taken to measure dry matter weight and nutrient content. The samples were
digested by the H2SO 4+H 20 2 method. Total N was determined by the Kjeldahl diges-tion ammonia steam distillation method, total P with the molybdovanadophosphoric
acid colorimetry method and total K by flame photometry. The dry combustionmethod was used to measure total carbon, Ca and Mg was determined with the EDTAtitration method. The soil samples were analyzed by routine methods.
414

Results and discussion
Nutrient contents of the forages
Nutrient uptake by forage is one of the major characteristics in grassland nutrient cy-cling. It controls the speed of cycling and dominates the output of nutrients. The de-termined mean nutrient content is shown in Table 2.
Table 2. Nutrient contents of the tested forages (g kg1)
Species Nutrient contentsN P K Ca Mg
P. maximum 12.36 2.11 10.71 5.55 3.31P. purpureum x P. typhoideum 12.83 2.12 16.92 3.31 1.95P. plicatulum 13.91 1.75 13.92 6.92 4.31C. gavana 8.72 4.67 12.80 3.17 2.31S. anceps 12.59 2.30 11.92 3.37 1.94A. pintoi 33.68 1.58 21.37 19.26 3.42L. leucocephala 46.34 3.43 16.24 8.57 2.92S. guianensis 27.59 3.93 10.53 14.26 5.10
Note: Data represent the mean of 10 years.
The contents of N and Ca in legume forages were significantly higher than those ingraminaceous forages, and those of P, K and Mg showed no difference between leg-ume and grass forages.
Nutrient uptake by the forages
The amount of nutrients taken up is related to the biomass of forage, which varies dras-tically among forages. Table 3 shows that the amount of nitrogen taken up by legumeswas larger than that of the grasses. The N uptake among the three legumes was in theorder: L leucocephala > S. guianensis > A. pintoi. Among the graminaccous plants,the N uptake by P. maximum was the highest followed by P. purpureum . The yieldand nitrogen content as well as N uptake of C. gayanawas the lowest. Of the eighttested forages, P. maximum and S. guianensis took up the largest amounts of P fol-lowed by P. purpureum and L. leucocephala. A. pintoi took up the smallest amounts ofnutrients. The K uptake of P. purpureum and P. maximum was significantly higherthan that of the others. The Ca uptake of S. guianensis was significantly higher thanthat of the others. Highest Mg uptake was found in P. maximum and S. guianensis.
415

Dynamics of soil physicochemical properties in grassland
After 10 years, the cultivated soil of the long-term trial was analyzed to study the ef-fects of different forages on soil nutrients and physicochemical properties. The resultsare shown in Table 4. The dry root mass of L. leucocephala (g kg- soil) was the great-est followed by P. maximum. The roots of P. maximum were much better in exploringthe soil volume than that of L.leucocephala.
Table 3. The nutrients uptake of different tropical forages (kg ha -')
Species Nutrients uptake
DM yr N P K Ca Mg
P. maximum 29,251 361.5 61.7 313.3 162.3 96.8
P .purpureum 26,151 335.5 55.4 442.5 86.6 51.0
P. plicatulum 11,509 160.1 20.1 160.2 79.6 49.6
C. gayana 6,109 53.3 28.5 78.2 19.4 14.1
S. anceps 9,928 125.0 22.8 118.3 33.5 19.3
A.pintoi 6,343 213.6 10.0 135.5 122.2 21.7L. leucocephala 1,125 52.1 38.6 182.7 96.4 32.9
S. guianensis 15,690 432.9 61.7 165.2 223.7 80.0
Note: Data represents the mean often years.
Table 4. The effect of tropical forages on soil physicochemical properties
Species Depth Roots B density Total N OM. Available P Available K pH
(cm) (g kg -') (g cm-3 ) (g kg-') (g kg-') (mg kg-') (mg kg -') (H20)
P. maximum 0-20 5.033 1.43c 0.85 13.5 1.7 25.7b 4.4920-40 1.184 0.34 5.4 0.7 16.4 4.92
P. purpureum 0-20 3.732 1.50b 0.76 12.0 2.7 15.8c 4.92
20-40 1.558 0.54 8.2 1.7 5.3 5.42
P. plicatulum 0-20 2.537 1.46bc 0.77 12.0 2.6 18.2bc 4.5520-40 0.850 0.55 8.4 1.2 7.7 4.94
C. gayana 0-20 2.526 1.58a 0.73 1.0 1.9 2.6c 4.6420-40 0.904 0.49 7.3 1.2 5.8 5.33
S anceps 0-20 4.414 1.47bc 0.74 10.7 2.8 9.5c 4.72
20-40 1.078 0.50 7.1 1.1 6.0 5.33A. pinto 0-20 1.607 1.43c 1.30 18.9 2.4 42.7a 4.91
20-40 0.861 0.61 9.5 1.2 23.2 5.12L. leucocephala 0-20 7.492 1.39c 1.09 15.6 2.2 35.3ab 4.82
20-40 0.758 0.56 8.8 1.3 23.3 5.41
416
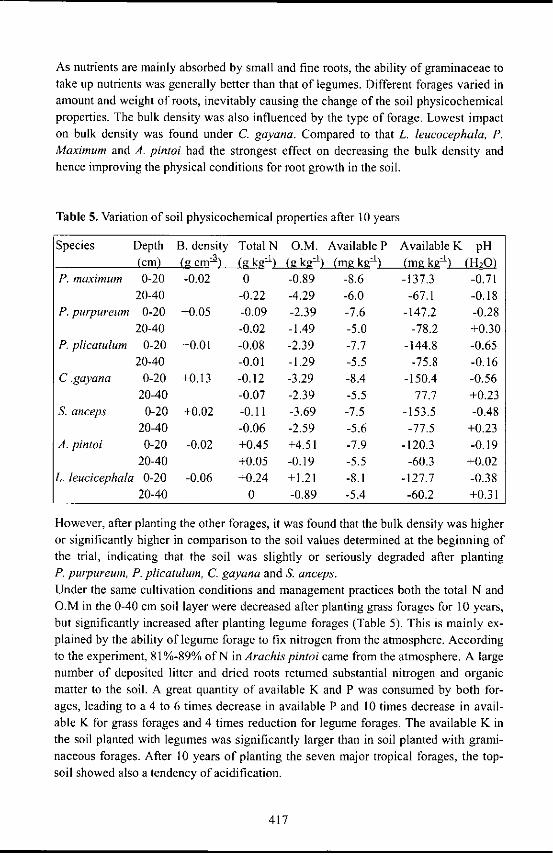
As nutrients are mainly absorbed by small and fine roots, the ability of graminaceae totake up nutrients was generally better than that of legumes. Different forages varied inamount and weight of roots, inevitably causing the change of the soil physicochemicalproperties. The bulk density was also influenced by the type of forage. Lowest impacton bulk density was found under C. gayana. Compared to that L. leucocephala, P.Maximum and A. pintoi had the strongest effect on decreasing the bulk density andhence improving the physical conditions for root growth in the soil.
Table 5. Variation of soil physicochemical properties after 10 years
Species Depth B. density Total N O.M. Available P Available K pH(cm) (g cm--g 4 ,j ) (ma ka4 ) (m kt (H0)
P. maximum 0-20 -0.02 0 -0.89 -8.6 -137.3 -0.7120-40 -0.22 -4.29 -6.0 -67.1 -0.18
P. purpureum 0-20 +0.05 -0.09 -2.39 -7.6 -147.2 -0.2820-40 -0.02 -1.49 -5.0 -78.2 +0.30
P. plicatulum 0-20 +0.01 -0.08 -2.39 -7.7 -144.8 -0.6520-40 -0.01 -1.29 -5.5 -75.8 -0.16
C.gayana 0-20 +0.13 -0.12 -3.29 -8.4 -150.4 -0.5620-40 -0.07 -2.39 -5.5 77.7 +0.23
S. anceps 0-20 +0.02 -0.11 -3.69 -7.5 -153.5 -0.4820-40 -0.06 -2.59 -5.6 -77.5 +0.23
A. pintoi 0-20 -0.02 +0.45 +4.51 -7.9 -120.3 -0.1920-40 +0.05 -0.19 -5.5 -60.3 +0.02
L. leucicephala 0-20 -0.06 +0.24 +1.21 -8.1 -127.7 -0.3820-40 0 -0.89 -5.4 -60.2 +0.31
However, after planting the other forages, it was found that the bulk density was higheror significantly higher in comparison to the soil values determined at the beginning ofthe trial, indicating that the soil was slightly or seriously degraded after plantingP. purpureum, P. plicatulum, C. gayana and S. anceps.Under the same cultivation conditions and management practices both the total N andO.M in the 0-40 cm soil layer were decreased after planting grass forages for 10 years,but significantly increased after planting legume forages (Table 5). This is mainly ex-plained by the ability of legume forage to fix nitrogen from the atmosphere. Accordingto the experiment, 81%-89% of N in Arachis pintoi came from the atmosphere. A largenumber of deposited litter and dried roots returned substantial nitrogen and organicmatter to the soil. A great quantity of available K and P was consumed by both for-ages, leading to a 4 to 6 times decrease in available P and 10 times decrease in avail-able K for grass forages and 4 times reduction for legume forages. The available K inthe soil planted with legumes was significantly larger than in soil planted with grami-naceous forages. After 10 years of planting the seven major tropical forages, the top-
soil showed also a tendency of acidification.
417

Strategies for sustainable development of tropical grassland
Intercropping graminaceous and legume forages
It was reported that the effect of grasses and legume forages on soil properties and nu-trient consumption was different. By intercropping graminaceous with legume forages,the soil physicochemical properties and nutrient utilization could be improved bycombining crops with deep and shallow, big and small roots. The nitrogen fixationability of the legume forages could supply a certain proportion of nitrogen needed bythe grasses. Graminaceous forages could supply some available P to legume forages,since their roots are more efficient to extract fixed P from the soil and transform it intoa more available form. Without application of P fertilizer, this strategy, however, leadsto a depletion of the P resources of the soil.
Increasing P and Kfertilizers
According to our observations, the input of P and K was clearly insufficient, causing aserious deficit of available P and K. It is necessary to use P and K fertilizers in order toachieve a high yield and a good quality in tropical forages and to ensure efficient nu-trient cycling in tropical grassland. The rate of P and K fertilizers can be calculatedaccording to the annual uptake by forages. An experiment on a lateritic soil revealedthat the yield of Stylosanensis could be increased 23.8% by applying 96 kg ha-1 P205.With the model of P and K efficiency, the optimum economical fertilization rate forStvlosanensis could be predicted as 114 kg ha-' for P205 and as 126 kg ha -' for K20.Dry matter reached up to 9,005 kg ha-'. However, it was not suitable to apply too muchK fertilizer (>180 kg ha-' K20), as it has shown the decrease of the protein content ofStylosanensis. The application of P and K increased soil available P and K as well asthe ability of legume forages to fix nitrogen. P and N fertilizers had to be applied at thesame time. Other experiments showed that the application of I kg N could increase thefresh grass yield of Setaria anceps cv. Nandi by 150 kg ha -1.
Applying lime
In our experiment, acidification occurred in the topsoil after growing continuouslyforages for ten years. Most soils cultivated with tropical grassland forages were acid orstrongly acid and the exchangeable Ca and Mg contents were very low. The applica-tion of lime was necessary in order to neutralize the acidity and to supply Ca to theforages. Some experiments showed that applying lime to acid grassland could not onlyneutralize soil acidity, but also decreased the K concentration in the soil solution sothat the risk of K leaching has to be compensated by additional K application.
418

Conclusions
1) The tested forages showed that legumes contained larger contents of N and Ca thanin the grasses. The nutrient contents of P7 K and Mg showed no difference betweenthe legumes and grasses.
2) Legumes removed more nitrogen than grasses. The N uptake among the three leg-umes were in the order: L. leucocephala > S. guianensis > A. pintoi. Among thegraminaceac, P. maximum took up the largest amount of N followed by P. pur-pureum.
3) Graminaceous forages consumed more total soil N and organic matter than legumeforages. After planting the 7 major tropical forages, the available P and K contentswere decreased to a large extend and the topsoil tended to acidify. Thus, it is sug-gested that the amount of P and K fertilizer and lime applied should be increased intropical forage production.
419


I

S.