Nutrient flows and balances at the field and farm scale: Exploring effects of land-use strategies...
12
Nutrient flows and balances at the field and farm scale: Exploring effects of land-use strategies and access to resources Amare Haileslassie a, * , Joerg A. Priess c , Edzo Veldkamp b , Jan Peter Lesschen d a International Livestock Research Institute (ILRI), Addis Ababa, P.O. Box 5689, Ethiopia b Institute of Soil Science and Forest Nutrition, University of Goettingen, Buesgenweg 2, D-37077 Goettingen, Germany c Center for Environmental Systems Research, University of Kassel, Kurt-Wolters-Str.3, D-34109 Kassel, Germany d Institute for Biodiversity and Ecosystem Dynamics, University of Amsterdam, Nieuwe Achtergracht, 166 1018 WV Amsterdam, The Netherlands Received 9 October 2005; received in revised form 30 October 2006; accepted 16 November 2006 Abstract Nutrient flux and balance studies are valuable tools to assess the sustainability of agro-ecosystems and potential consequences for agricultural productivity. This paper presents results from a study at the field/farm scale representing mixed farming systems typical for the East African Highlands. We selected catchments in the Dega (cool highlands and Woina Dega (warm-to-cool mid-highlands) of the Central Highlands of Ethiopia, to get more insight on how individual land use strategies and access to resources affect the mag- nitude of nutrient flows and resulting balances and to explore some of reasons of the variability within and between farming systems at different altitudes. Our results show that environmental condition, farming system (e.g. choice of crop), access to resources (e.g. land, livestock and fertilizer) and smallholders’ source of off farm income influence the magnitude of nutrient fluxes and the degree to which nutrient fluxes may be imbalanced. In some respects our results differ from studies carried out at larger (i.e. more aggregated) spatial scales, which consistently show that homestead fields are zones of accumulation and distant fields as zone of depletion. Our results indicate that this is not always the case, and highlight the need for studies at the field and farm scales to include detailed biophysical and socioeconomic information to help explain major nutrient fluxes and to evaluate the system with respect to sustainable production. Ó 2006 Elsevier Ltd. All rights reserved. Keywords: East Africa; Ethiopia; Highland agriculture; Soil fertility; Spatial scales; Socio-economic and environmental factors 1. Introduction Nutrient flux and balance studies are valuable tools to assess the sustainability of agro-ecosystems and provide information to answer the question whether changes in pro- ductivity are to be expected. In addition, in case of imbal- ances, the major in- or outgoing fluxes can be identified and nutrient management and/or land-use strategies may be adapted accordingly. Nutrient flux and balance studies have been conducted at different spatial scales ranging from field and farm, via watershed to national and continental scales. At national and continental scales, nutrient balances have been used to draw attention to nutrient depletion as a principal cause for low agricultural productivity and food insecurity in Africa (Sanchez, 2002; De Jager et al., 1998; Fresco et al., 1990). Studies indicate increasing population pressure as the major cause of the problem. For example, in densely populated areas of the East African Highlands 0308-521X/$ - see front matter Ó 2006 Elsevier Ltd. All rights reserved. doi:10.1016/j.agsy.2006.11.013 * Corresponding author. Fax: +251 1 6 4612 52/6464645. E-mail addresses: [email protected], [email protected] (A. Haileslassie). www.elsevier.com/locate/agsy Agricultural Systems 94 (2007) 459–470 AGRICULTURAL SYSTEMS
-
Upload
independent -
Category
Documents
-
view
0 -
download
0
Transcript of Nutrient flows and balances at the field and farm scale: Exploring effects of land-use strategies...
www.elsevier.com/locate/agsy
Agricultural Systems 94 (2007) 459–470
AGRICULTURALSYSTEMS
Nutrient flows and balances at the field and farm scale: Exploringeffects of land-use strategies and access to resources
Amare Haileslassie a,*, Joerg A. Priess c, Edzo Veldkamp b, Jan Peter Lesschen d
a International Livestock Research Institute (ILRI), Addis Ababa, P.O. Box 5689, Ethiopiab Institute of Soil Science and Forest Nutrition, University of Goettingen, Buesgenweg 2, D-37077 Goettingen, Germany
c Center for Environmental Systems Research, University of Kassel, Kurt-Wolters-Str.3, D-34109 Kassel, Germanyd Institute for Biodiversity and Ecosystem Dynamics, University of Amsterdam, Nieuwe Achtergracht, 166 1018 WV Amsterdam, The Netherlands
Received 9 October 2005; received in revised form 30 October 2006; accepted 16 November 2006
Abstract
Nutrient flux and balance studies are valuable tools to assess the sustainability of agro-ecosystems and potential consequences foragricultural productivity. This paper presents results from a study at the field/farm scale representing mixed farming systems typicalfor the East African Highlands. We selected catchments in the Dega (cool highlands and Woina Dega (warm-to-cool mid-highlands)of the Central Highlands of Ethiopia, to get more insight on how individual land use strategies and access to resources affect the mag-nitude of nutrient flows and resulting balances and to explore some of reasons of the variability within and between farming systems atdifferent altitudes. Our results show that environmental condition, farming system (e.g. choice of crop), access to resources (e.g. land,livestock and fertilizer) and smallholders’ source of off farm income influence the magnitude of nutrient fluxes and the degree to whichnutrient fluxes may be imbalanced.
In some respects our results differ from studies carried out at larger (i.e. more aggregated) spatial scales, which consistently show thathomestead fields are zones of accumulation and distant fields as zone of depletion. Our results indicate that this is not always the case,and highlight the need for studies at the field and farm scales to include detailed biophysical and socioeconomic information to helpexplain major nutrient fluxes and to evaluate the system with respect to sustainable production.� 2006 Elsevier Ltd. All rights reserved.
Keywords: East Africa; Ethiopia; Highland agriculture; Soil fertility; Spatial scales; Socio-economic and environmental factors
1. Introduction
Nutrient flux and balance studies are valuable tools toassess the sustainability of agro-ecosystems and provideinformation to answer the question whether changes in pro-ductivity are to be expected. In addition, in case of imbal-
0308-521X/$ - see front matter � 2006 Elsevier Ltd. All rights reserved.
doi:10.1016/j.agsy.2006.11.013
* Corresponding author. Fax: +251 1 6 4612 52/6464645.E-mail addresses: [email protected], [email protected]
(A. Haileslassie).
ances, the major in- or outgoing fluxes can be identifiedand nutrient management and/or land-use strategies maybe adapted accordingly. Nutrient flux and balance studieshave been conducted at different spatial scales ranging fromfield and farm, via watershed to national and continentalscales. At national and continental scales, nutrient balanceshave been used to draw attention to nutrient depletion as aprincipal cause for low agricultural productivity and foodinsecurity in Africa (Sanchez, 2002; De Jager et al., 1998;Fresco et al., 1990). Studies indicate increasing populationpressure as the major cause of the problem. For example,in densely populated areas of the East African Highlands
460 A. Haileslassie et al. / Agricultural Systems 94 (2007) 459–470
depletion rates as high as 112 kg N ha�1 yr�1, 3 kg Pha�1 yr�1 and 70 kg K ha�1 yr�1 (Kenya) and 173 kg Nha�1 yr�1, 60 kg P ha�1 yr�1 and 41 kg K ha�1 yr�1
(Uganda) and 122 kg N ha�1 yr�1, 13 kg P ha�1 yr�1 and82 kg K ha�1 yr�1 (Ethiopia) have been reported (Haileslassieet al., 2005; Walaga et al., 2000; Stoorvogel and Smaling,1998; Smaling, 1993; Henao and Baanante, 1999). How-ever, those results contrasted with a study in two watershedsin Ethiopia, where the dominant reason for the negativenutrient balances was not nutrient export from the water-sheds but redistribution of nutrients within the watershedcausing simultaneous nutrient deficiencies and oversupplyin different land use types (Haileslassie et al., 2006). Gilleret al. (1997) reported that a continuous concentration ofnutrients in smaller areas around homesteads, at theexpense of nutrients depleted in more distant and largerfields, are creating zones of nutrient accumulation aroundthe homestead.
In many farming systems nutrient management of dif-ferent fields belonging to single farm households may varyconsiderably (Smaling et al., 1996). Farmers’ decisions offertility management are influenced by both socio-eco-nomic and biophysical environments, resource endow-ment and production objectives (i.e. land use and cropselection).
Therefore, field and farm scale nutrient studies can pro-vide information on how environmental conditions andagricultural management affect the variation in nutrientflows between and within the fields of a farm. This infor-mation is also indispensable for properly understandingvariations in nutrient flux studies at higher spatial scalesand their limitations (Smaling, 1993; Van den Boschet al., 1998; Wijnhoud et al., 2003).
In the East African highlands, detailed nutrient balancestudies at the field, farm and landscape scale are scarce,although there is a significant heterogeneity and diversityin farming system (Giller et al., 1997; Elias et al., 1998; Erg-ano et al., 2004; Beyene et al., 2006). As a result, it is notwell known how nutrient management practises areaffected by or embedded in the livelihood strategies of ruralhouseholds (e.g. crop selection, source of off farm income,agricultural systems). Furthermore, it is uncertain how thelocation of a farmer’s plot within the landscape affectsnutrient management.
Our study presents a detailed analysis of nutrient flowsat field and farm level in two watersheds at different alti-tudes focusing on cropland and meadows. This papercompletes a series nutrient flux studies, that was carriedout at national and the watershed level (Haileslassieet al., 2006, 2005). The main objectives of our study were:(i) to assess the contribution of individual farm activities(e.g. land use); and (ii) to identify the effects of farmers’livelihood strategies and access to resources to fieldsand farm level nutrient fluxes. In addition this study(iii) sheds new light on the degree of unsustainability interms of nutrient mining in East African highlandagriculture.
2. Materials and methods
2.1. Site selection and biophysical characterization
2.1.1. Site selection
A nutrient flux study for the states of Ethiopia revealedstrong depletion of N, P and K in the state of Oromiya ascompared with other states (Haileslassie et al., 2005). Thenutrient depletion was large under farming systems basedon cereals and pulses, while farming systems based onenset (Ensete ventricosum) partly showed nutrient accumu-lation. A second more detailed study in Oromiya showedsimilar trends for the West Showa zone, a typical EastAfrican highland mixed farming region in Ethiopia. Over-all nutrient balances were strongly negative, indicatinghigh nutrient losses, while some of the farming systemsseemed to accumulate nutrients (Haileslassie, unpublisheddata). In order to gain more insight into the land-usestrategies and nutrient management practices of highlandfarmers, we focused on two watersheds representing differ-ent temperature zones. In the cool highlands, between2500 and 3500 m elevation (11–16 �C; locally called Dega)we selected Galesa watershed, where an enset-based farm-ing system is practiced. In the temperate highlandsbetween 1500 and 2600 m. elevation (16–21 �C; locallycalled Woina Dega Gare watershed was selected as studyarea (Table 1) (De Pauw and Bruggeman, 1988; FAO,1983).
2.1.2. Farm selectionIn May 2003, we stratified farm households of the two
watersheds into three wealth groups (rich, medium andpoor) using criteria set by the community, which includedmainly farm size and number of livestock. In each of thewatersheds we sampled five randomly selected farmhouseholds representing the three wealth groups (Table2) for detailed field level investigation (‘case study farms’).In addition to the case study farms, we randomly selected50 farm households (‘survey farms’) at Galesa and 16farm households at Gare to characterize socio-economicconditions that may affect nutrient balances and to verifywhether the case study farms represented their respectivewealth groups. In both cases, selected farm householdswere proportionally distributed between the wealthgroups in the watersheds. The number of sample house-holds in the watersheds reflects the different size of thecommunities.
2.1.3. Mapping and grouping farm fields
We mapped farms’ fields with a Geographic PositioningSystem (GPS). Using a Digital Elevation Model (DEM)and field observations we divided the watersheds into threemajor landscape positions: upper slope, middle slope andfoot slope (Brubaker et al., 1993; Jones et al., 1989). Theupper slope position includes upper and lower interfluvesand receives little or no runoff, but contributes runoff to
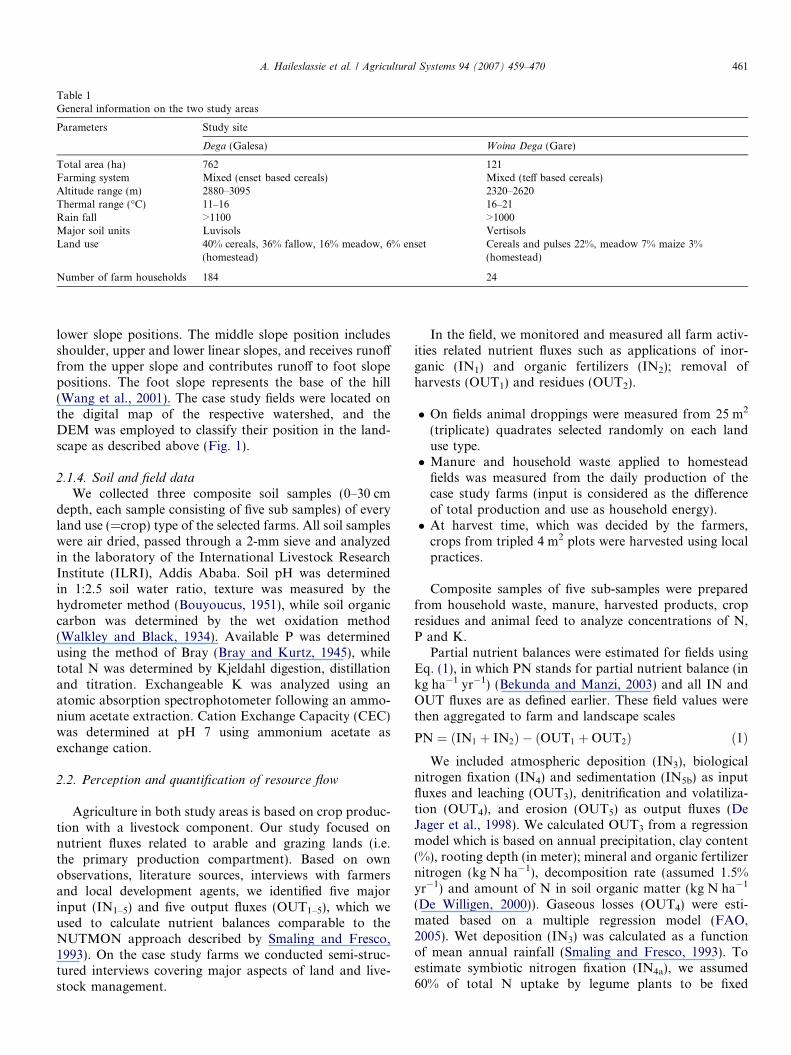
Table 1General information on the two study areas
Parameters Study site
Dega (Galesa) Woina Dega (Gare)
Total area (ha) 762 121Farming system Mixed (enset based cereals) Mixed (teff based cereals)Altitude range (m) 2880–3095 2320–2620Thermal range (�C) 11–16 16–21Rain fall >1100 >1000Major soil units Luvisols VertisolsLand use 40% cereals, 36% fallow, 16% meadow, 6% enset
(homestead)Cereals and pulses 22%, meadow 7% maize 3%(homestead)
Number of farm households 184 24
A. Haileslassie et al. / Agricultural Systems 94 (2007) 459–470 461
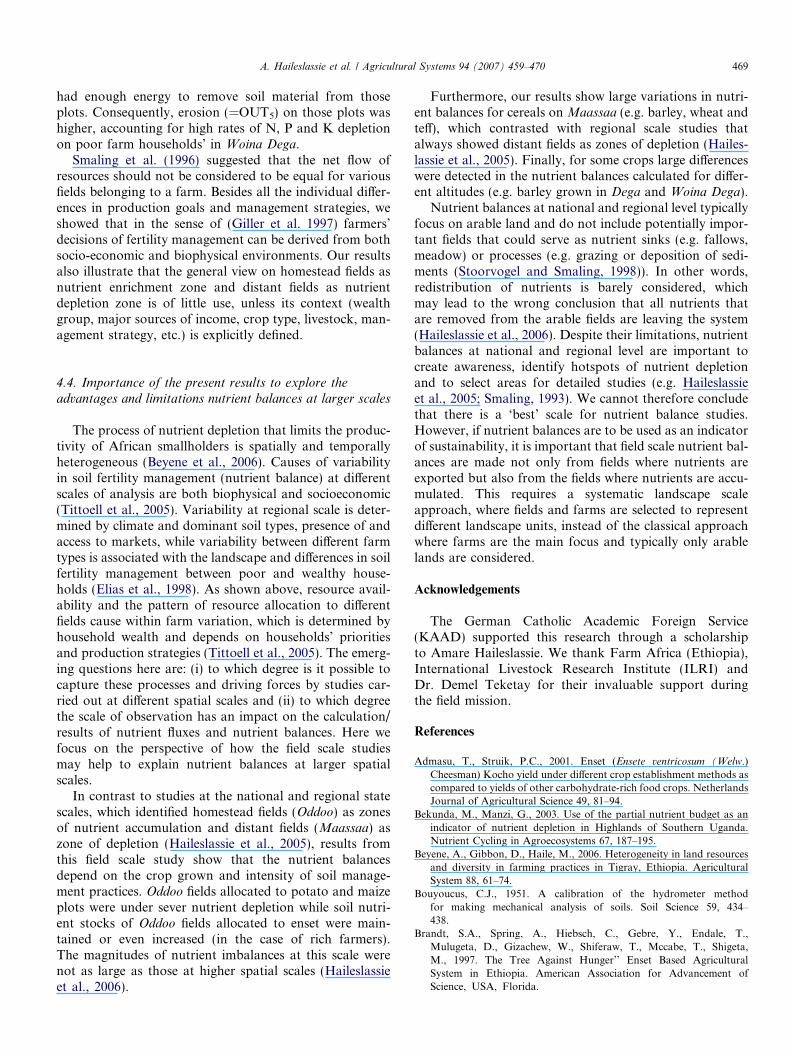
lower slope positions. The middle slope position includesshoulder, upper and lower linear slopes, and receives runofffrom the upper slope and contributes runoff to foot slopepositions. The foot slope represents the base of the hill(Wang et al., 2001). The case study fields were located onthe digital map of the respective watershed, and theDEM was employed to classify their position in the land-scape as described above (Fig. 1).
2.1.4. Soil and field data
We collected three composite soil samples (0–30 cmdepth, each sample consisting of five sub samples) of everyland use (=crop) type of the selected farms. All soil sampleswere air dried, passed through a 2-mm sieve and analyzedin the laboratory of the International Livestock ResearchInstitute (ILRI), Addis Ababa. Soil pH was determinedin 1:2.5 soil water ratio, texture was measured by thehydrometer method (Bouyoucus, 1951), while soil organiccarbon was determined by the wet oxidation method(Walkley and Black, 1934). Available P was determinedusing the method of Bray (Bray and Kurtz, 1945), whiletotal N was determined by Kjeldahl digestion, distillationand titration. Exchangeable K was analyzed using anatomic absorption spectrophotometer following an ammo-nium acetate extraction. Cation Exchange Capacity (CEC)was determined at pH 7 using ammonium acetate asexchange cation.
2.2. Perception and quantification of resource flow
Agriculture in both study areas is based on crop produc-tion with a livestock component. Our study focused onnutrient fluxes related to arable and grazing lands (i.e.the primary production compartment). Based on ownobservations, literature sources, interviews with farmersand local development agents, we identified five majorinput (IN1–5) and five output fluxes (OUT1–5), which weused to calculate nutrient balances comparable to theNUTMON approach described by Smaling and Fresco,1993). On the case study farms we conducted semi-struc-tured interviews covering major aspects of land and live-stock management.
In the field, we monitored and measured all farm activ-ities related nutrient fluxes such as applications of inor-ganic (IN1) and organic fertilizers (IN2); removal ofharvests (OUT1) and residues (OUT2).
� On fields animal droppings were measured from 25 m2
(triplicate) quadrates selected randomly on each landuse type.� Manure and household waste applied to homestead
fields was measured from the daily production of thecase study farms (input is considered as the differenceof total production and use as household energy).� At harvest time, which was decided by the farmers,
crops from tripled 4 m2 plots were harvested using localpractices.
Composite samples of five sub-samples were preparedfrom household waste, manure, harvested products, cropresidues and animal feed to analyze concentrations of N,P and K.
Partial nutrient balances were estimated for fields usingEq. (1), in which PN stands for partial nutrient balance (inkg ha�1 yr�1) (Bekunda and Manzi, 2003) and all IN andOUT fluxes are as defined earlier. These field values werethen aggregated to farm and landscape scales
PN ¼ ðIN1 þ IN2Þ � ðOUT1 þOUT2Þ ð1ÞWe included atmospheric deposition (IN3), biological
nitrogen fixation (IN4) and sedimentation (IN5b) as inputfluxes and leaching (OUT3), denitrification and volatiliza-tion (OUT4), and erosion (OUT5) as output fluxes (DeJager et al., 1998). We calculated OUT3 from a regressionmodel which is based on annual precipitation, clay content(%), rooting depth (in meter); mineral and organic fertilizernitrogen (kg N ha�1), decomposition rate (assumed 1.5%yr�1) and amount of N in soil organic matter (kg N ha�1
(De Willigen, 2000)). Gaseous losses (OUT4) were esti-mated based on a multiple regression model (FAO,2005). Wet deposition (IN3) was calculated as a functionof mean annual rainfall (Smaling and Fresco, 1993). Toestimate symbiotic nitrogen fixation (IN4a), we assumed60% of total N uptake by legume plants to be fixed
Tab
le2
Res
ou
rce
ho
ldin
gso
f‘s
urv
eyfa
rms’
and
‘cas
est
ud
yfa
rms’
inD
ega
and
Wo
ina
Deg
aal
titu
de
bel
ts(C
entr
alH
igh
lan
ds
of
Eth
iop
ia)
Alt
itu
de
bel
tsW
ealt
hgr
ou
ps
Sam
ple
sH
erd
size
(TL
U)
Oxe
n(T
LU
)C
ult
ivat
edla
nd
(ha)
To
tal
lan
d(h
a)L
abo
ur
forc
eW
aste
(Mg
ha�
1yr�
1)
DA
Pan
du
rea
(kg
ha�
1yr�
1)
Man
ure
(Mg
ha�
1yr�
1)
Deg
aR
ich
n=
10A
12.3
a2.
4a1.
6a3.
3a4.
9a0.
711
3.9a
3.6a
n=
1B24
.12.
81.
94.
24.
80.
115
4.0
3.5
Med
ium
n=
20A
6.7b
1.5b
1.6b
2.3b
4.5b
0.5
62.5
b1.
8bn
=2B
7.4
1.4
1.7
3.2
4.4
0.1
83.0
2.2
Po
or
n=
20A
2.4c
0.5c
1.0c
1.6c
3.9c
0.6
71.8
b1.
1bn
=2B
2.6
0.4
1.5
2.5
3.1
0.2
50.0
1.9
Wo
ina
Deg
a
Ric
hn
=5A
6.2a
1.4a
2.1a
2.3a
3.7a
0.1a
46.2
a2.
9an
=2B
5.1
1.4
2.6
2.8
2.6
0.03
54.6
0.5
Med
ium
n=
7A3.
5b1.
0b1.
3b1.
6b3.
3b0.
04b
52.1
a0.
4ab
n=
2B3.
90.
71.
21.
62.
70.
0352
.00.
3P
oo
rn
=4A
2.5c
0.5c
1.2c
1.3c
2.6c
0.02
b7.
5b0.
1bn
=1B
1.9
0.0
0.5
0.5
2.2
0.0
0.0
0.0
Alo
ng
colu
mn
sm
ean
sfo
llo
wed
by
the
sam
ele
tter
are
no
tsi
gnifi
can
tly
diff
eren
t;va
lues
for
was
tean
dm
anu
rear
egi
ven
on
fres
hw
eigh
tb
ase,
on
lyw
hat
isp
rod
uce
dd
uri
ng
nig
ht.
AIn
dic
ates
‘su
rvey
farm
s’.
BIn
dic
ates
the
10ca
sest
ud
yfa
rms;
pro
bab
ilit
yis
bas
edo
nT
uk
eyH
SD
test
(0.9
5).
462 A. Haileslassie et al. / Agricultural Systems 94 (2007) 459–470
symbiotically, while nitrogen fixation by free-living bacte-ria (IN4b) was estimated as a function of rainfall (Smalingand Fresco, 1993). Soil erosion (OUT5) and sediment depo-sition (IN5a) were calculated using the LAPSUS model(Schoorl et al., 2002), while the nutrient flux values werecomputed from a combination of LAPSUS results and soilnutrient concentrations. Since erosion selectively removesthe nutrient rich topsoil, we took an enrichment ratio intoaccount. In this study, we assumed a conservativeenrichment ratio of 1.5 for all nutrients, which is at thelow end of the range of values reported in Ethiopia (1.5–2.5 (Kefeni, unpublished)).
We estimated full nutrient balances from all measuredand estimated fluxes (Eq. (2)) in which FN is the full nutri-ent balance in (kg ha�1 yr�1) and all IN and OUT fluxes asdefined above
FN ¼ ðIN1 þ IN2 þ IN3 þ IN4 þ IN5Þ � ðOUT1
þOUT2 þOUT3 þOUT4 þOUT5Þ ð2Þ
2.3. Statistical analysis
Data sets from the household survey were analyzedusing one-way analysis of variance (ANOVA) and Tukey’sHSD test (0.95 and 0.99 confidence intervals) to separatemeans of significantly different parameters (for land useand wealth group data). All statistical analyses were per-formed with STATISTICA 6.0.
3. Results
3.1. Land, livestock and labour resources
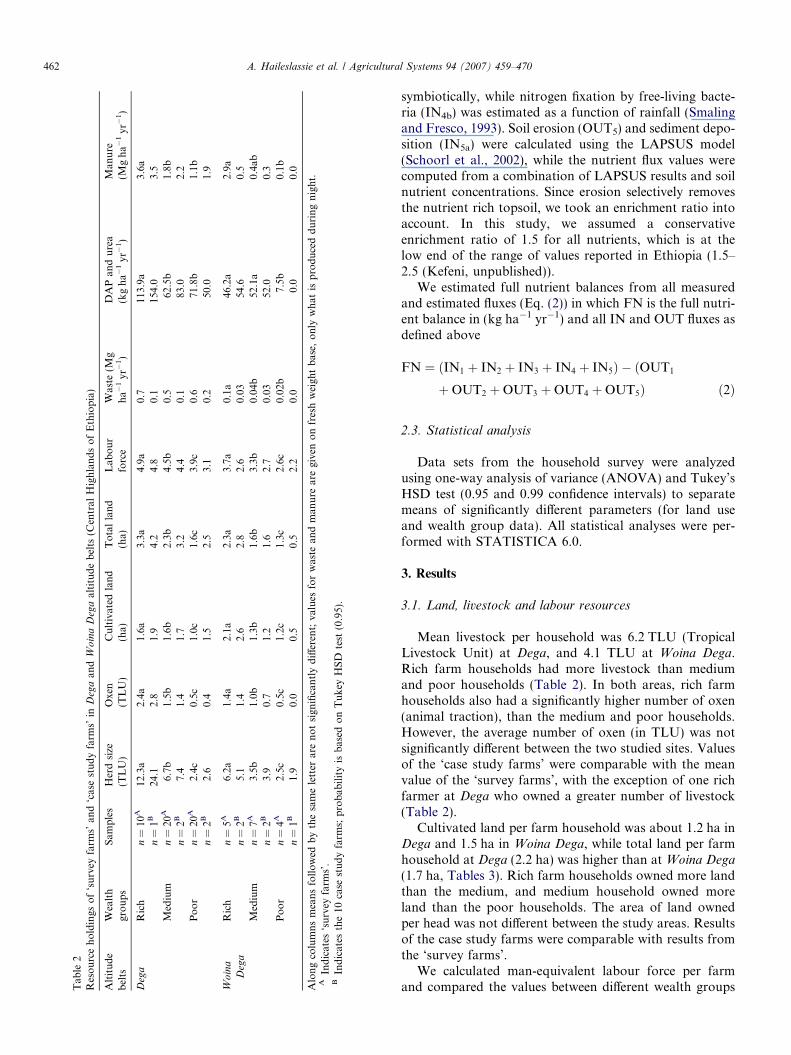
Mean livestock per household was 6.2 TLU (TropicalLivestock Unit) at Dega, and 4.1 TLU at Woina Dega.Rich farm households had more livestock than mediumand poor households (Table 2). In both areas, rich farmhouseholds also had a significantly higher number of oxen(animal traction), than the medium and poor households.However, the average number of oxen (in TLU) was notsignificantly different between the two studied sites. Valuesof the ‘case study farms’ were comparable with the meanvalue of the ‘survey farms’, with the exception of one richfarmer at Dega who owned a greater number of livestock(Table 2).
Cultivated land per farm household was about 1.2 ha inDega and 1.5 ha in Woina Dega, while total land per farmhousehold at Dega (2.2 ha) was higher than at Woina Dega
(1.7 ha, Tables 3). Rich farm households owned more landthan the medium, and medium household owned moreland than the poor households. The area of land ownedper head was not different between the study areas. Resultsof the case study farms were comparable with results fromthe ‘survey farms’.
We calculated man-equivalent labour force per farmand compared the values between different wealth groups
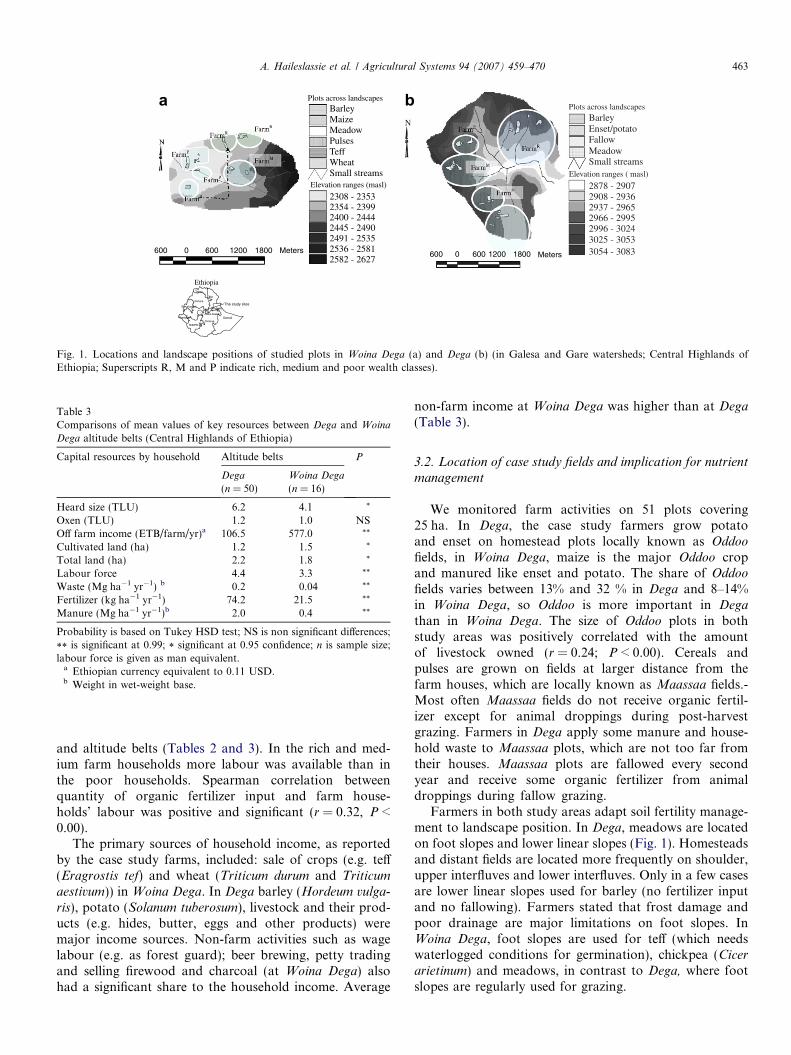
Fig. 1. Locations and landscape positions of studied plots in Woina Dega (a) and Dega (b) (in Galesa and Gare watersheds; Central Highlands ofEthiopia; Superscripts R, M and P indicate rich, medium and poor wealth classes).
Table 3Comparisons of mean values of key resources between Dega and Woina
Dega altitude belts (Central Highlands of Ethiopia)
Capital resources by household Altitude belts P
Dega
(n = 50)Woina Dega
(n = 16)
Heard size (TLU) 6.2 4.1 *
Oxen (TLU) 1.2 1.0 NSOff farm income (ETB/farm/yr)a 106.5 577.0 **
Cultivated land (ha) 1.2 1.5 *
Total land (ha) 2.2 1.8 *
Labour force 4.4 3.3 **
Waste (Mg ha�1 yr�1) b 0.2 0.04 **
Fertilizer (kg ha�1 yr�1) 74.2 21.5 **
Manure (Mg ha�1 yr�1)b 2.0 0.4 **
Probability is based on Tukey HSD test; NS is non significant differences;
** is significant at 0.99; * significant at 0.95 confidence; n is sample size;labour force is given as man equivalent.
a Ethiopian currency equivalent to 0.11 USD.b Weight in wet-weight base.
A. Haileslassie et al. / Agricultural Systems 94 (2007) 459–470 463
and altitude belts (Tables 2 and 3). In the rich and med-ium farm households more labour was available than inthe poor households. Spearman correlation betweenquantity of organic fertilizer input and farm house-holds’ labour was positive and significant (r = 0.32, P <0.00).
The primary sources of household income, as reportedby the case study farms, included: sale of crops (e.g. teff(Eragrostis tef) and wheat (Triticum durum and Triticum
aestivum)) in Woina Dega. In Dega barley (Hordeum vulga-
ris), potato (Solanum tuberosum), livestock and their prod-ucts (e.g. hides, butter, eggs and other products) weremajor income sources. Non-farm activities such as wagelabour (e.g. as forest guard); beer brewing, petty tradingand selling firewood and charcoal (at Woina Dega) alsohad a significant share to the household income. Average
non-farm income at Woina Dega was higher than at Dega
(Table 3).
3.2. Location of case study fields and implication for nutrient
management
We monitored farm activities on 51 plots covering25 ha. In Dega, the case study farmers grow potatoand enset on homestead plots locally known as Oddoo
fields, in Woina Dega, maize is the major Oddoo cropand manured like enset and potato. The share of Oddoo
fields varies between 13% and 32 % in Dega and 8–14%in Woina Dega, so Oddoo is more important in Dega
than in Woina Dega. The size of Oddoo plots in bothstudy areas was positively correlated with the amountof livestock owned (r = 0.24; P < 0.00). Cereals andpulses are grown on fields at larger distance from thefarm houses, which are locally known as Maassaa fields.-Most often Maassaa fields do not receive organic fertil-izer except for animal droppings during post-harvestgrazing. Farmers in Dega apply some manure and house-hold waste to Maassaa plots, which are not too far fromtheir houses. Maassaa plots are fallowed every secondyear and receive some organic fertilizer from animaldroppings during fallow grazing.
Farmers in both study areas adapt soil fertility manage-ment to landscape position. In Dega, meadows are locatedon foot slopes and lower linear slopes (Fig. 1). Homesteadsand distant fields are located more frequently on shoulder,upper interfluves and lower interfluves. Only in a few casesare lower linear slopes used for barley (no fertilizer inputand no fallowing). Farmers stated that frost damage andpoor drainage are major limitations on foot slopes. InWoina Dega, foot slopes are used for teff (which needswaterlogged conditions for germination), chickpea (Cicer
arietinum) and meadows, in contrast to Dega, where footslopes are regularly used for grazing.

Tab
le4
Nu
trie
nt
inp
ut
and
ou
tpu
tfl
uxe
sb
yw
ealt
hgr
ou
ps,
fiel
ds
and
farm
sin
Deg
aal
titu
de
bel
t(C
entr
alH
igh
lan
ds
of
Eth
iop
ia)
Lan
du
se/f
arm
sIN
1IN
2IN
3IN
4O
UT
1O
UT
2O
UT
3O
UT
4O
UT
5
NP
KN
PK
NP
KN
NP
KN
PK
NK
NN
PK
Bar
ley
1837
00
00
52
44
138
1113
224
203
45
213
Po
tato
00
087
963
52
44
110
1816
143
449
1148
73
17
En
set
00
010
59
545
24
47
17
233
364
3812
00
0F
allo
w0
00
204
145
24
481
1380
00
015
34
11
1M
ead
ow
00
051
1266
52
413
519
480
00
185
72
17
Far
mR
1422
039
838
52
48
419
426
111
1911
74
111
Far
mM
38
050
848
52
47
4810
4912
118
1611
74
111
Far
mM
513
035
635
52
47
6012
7315
219
1617
51
04
Far
mP
411
033
634
52
48
359
3611
119
1711
43
18
Far
mP
38
029
636
52
47
338
3310
116
1719
42
16
Far
mer
s(m
ean
)6
120
3711
385
24
743
1047
111
1717
145
31
8
R,M
,P,s
up
ersc
rip
tsin
dic
ate
rich
,med
ium
and
po
or
wea
lth
clas
ses;
IN1
ind
icat
esin
org
anic
fert
iliz
er;I
N2
org
anic
fert
iliz
er;I
N3
wet
dep
osi
tio
n;I
N4
nit
roge
nfi
xati
on
;OU
T1
ish
arve
sted
pro
du
ct;O
UT
2
resi
du
es;
OU
T3
leac
hin
g;O
UT
4d
enit
rifi
cati
on
and
OU
T5
iser
osi
on
;O
UT
1in
fall
ow
and
mea
do
wla
nd
use
isgr
azin
gb
yli
vest
ock
.
464 A. Haileslassie et al. / Agricultural Systems 94 (2007) 459–470
3.3. Fields and farm level nutrient fluxes
3.3.1. Input fluxes
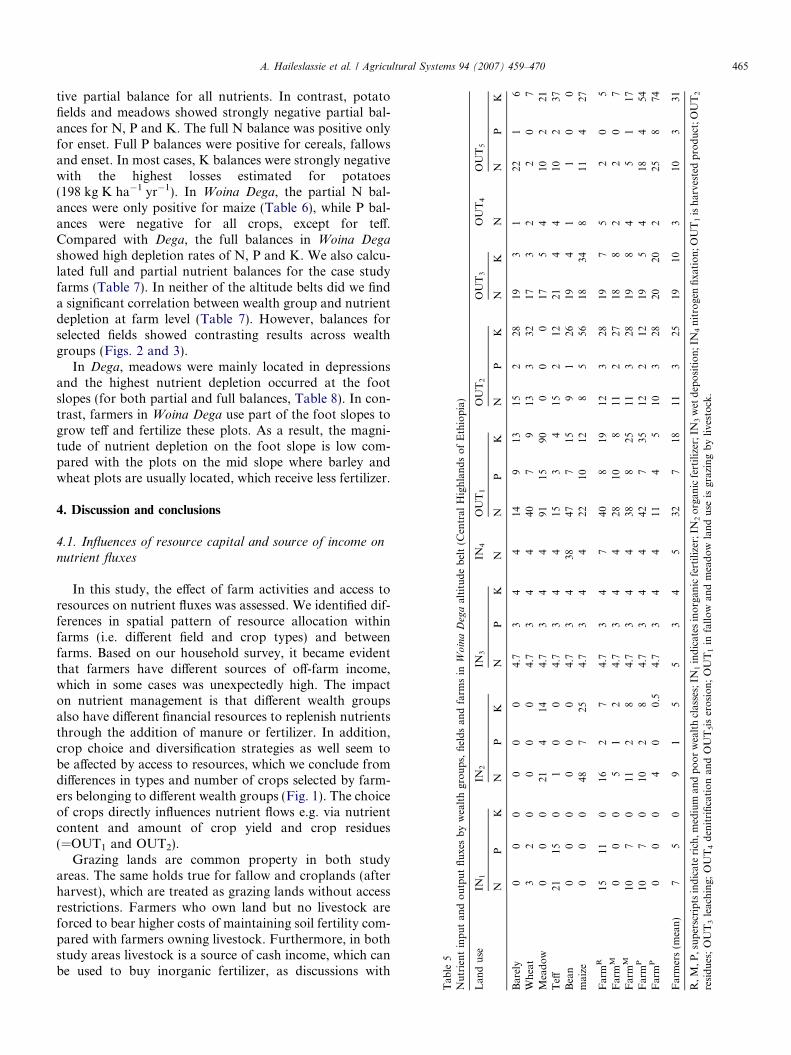
In Dega, barley received the highest input (IN1) of min-eral fertilizer (18 kg N ha�1 yr�1, 37 P ha�1 yr�1 Table 4).The quantity of mineral fertilizer to barley plots decreasedwith decreasing access to resources. Other crops like ensetand potato received relatively large amounts of nutrientsfrom organic (IN2) sources (87 kg N ha�1 yr�1, 9 kg P ha�1
yr�1 and 63 kg K ha�1 yr�1). Although occasionally appli-cation of mineral fertilizers to potato fields was observedduring field work, none of the case study farmers reportedthis application during the survey (Table 4). As was thecase with mineral fertilizer, the rates of organic fertilizerapplication were related to the wealth class of farmers.
In Woina Dega, farmers applied inorganic fertilizer(IN1) mainly to teff plots (Table 5), but application towheat fields was also recorded (Table 5). Unlike in Dega,barley plots in Woina Dega received neither mineral nororganic fertilizers. We observed differences in the quantitiesof mineral fertilizers applied on fields, which are owned byfarm households of different wealth groups (e.g. teff plotsof rich farmers received higher amounts of N and P). Likepotato and enset plots in Dega, maize (Zea mays) plots inWoina Dega received high inputs from organic sources(Table 5).
3.3.2. Output fluxes
In Dega, the highest export of N, P and K was estimatedfor harvested potatoes (Table 4). On potato fields ownedby poor farmers we observed the lowest fluxes via OUT1
(=crops) and OUT2 (= residues). One of the medium classfarmers had a clearly higher value of out fluxes on potatofields caused by a high yielding variety. In Woina Dega,yields of fertilized wheat and maize fields were high, result-ing in high exports of nutrients via grains (OUT1) and cropresidues (OUT2). In contrast to barley and wheat, OUT1-and OUT2 fluxes from maize plots decreased with decreas-ing access to resources.
In both watersheds OUT1 and OUT2 were the mostimportant fluxes (for N and K). In the field also no appar-ent differences in physical soil conservation measures wereobserved between the poor farm and the rich farms plots.Erosion losses of more than 10 Mg ha�1 yr�1 were calcu-lated for 71% of the poor farmer’s fields at Woina Dega,while in the Dega most poor farmers’ fields were locatedin areas where erosion ranged only between 0 and2.5 Mg ha�1 yr�1. We did not find any statistically signifi-cant correlation between the magnitude of erosion fluxes(=OUT5) and farmers’ wealth class.
3.4. Partial and full nutrient balances by crop, landscape
position and farm
Partial and full nutrient balances were calculated foreach individual field and aggregated to crop and farmscales (Tables 6 and 7). In Dega, enset had a strongly posi-
able
5u
trie
nt
inp
ut
and
ou
tpu
tfl
uxe
sb
yw
ealt
hgr
ou
ps,
fiel
ds
and
farm
sin
Wo
ina
Deg
aal
titu
de
bel
t(C
entr
alH
igh
lan
ds
of
Eth
iop
ia)
and
use
IN1
IN2
IN3
IN4
OU
T1
OU
T2
OU
T3
OU
T4
OU
T5
NP
KN
PK
NP
KN
NP
KN
PK
NK
NN
PK
arel
y0
00
00
04.
73
44
149
1315
228
193
122
16
hea
t3
20
00
04.
73
44
407
913
332
173
22
07
ead
ow
00
021
414
4.7
34
491
1590
00
017
54
102
21eff
2115
01
00
4.7
34
415
34
152
1221
44
102
37ea
n0
00
00
04.
73
438
477
159
126
194
11
00
aize
00
048
725
4.7
34
422
1012
85
5618
348
114
27
arm
R15
110
162
74.
73
47
408
1912
328
197
52
05
arm
M0
00
51
24.
73
44
2810
811
227
188
22
07
arm
M10
70
112
84.
73
44
388
2511
328
198
45
117
arm
P10
70
102
84.
73
44
427
3512
212
195
418
454
arm
P0
00
40
0.5
4.7
34
411
45
103
2820
202
258
74
arm
ers
(mea
n)
75
09
15
53
45
327
1811
325
1910
310
331
,M,P
,su
per
scri
pts
ind
icat
eri
ch,m
ediu
man
dp
oo
rw
ealt
hcl
asse
s;IN
1in
dic
ates
ino
rgan
icfe
rtil
izer
;IN
2o
rgan
icfe
rtil
izer
;IN
3w
etd
epo
siti
on
;IN
4n
itro
gen
fixa
tio
n;O
UT
1is
har
vest
edp
rod
uct
;OU
T2
sid
ues
;O
UT
3le
ach
ing;
OU
T4
den
itri
fica
tio
nan
dO
UT
5is
ero
sio
n;
OU
T1
infa
llo
wan
dm
ead
ow
lan
du
seis
graz
ing
by
live
sto
ck.
A. Haileslassie et al. / Agricultural Systems 94 (2007) 459–470 465
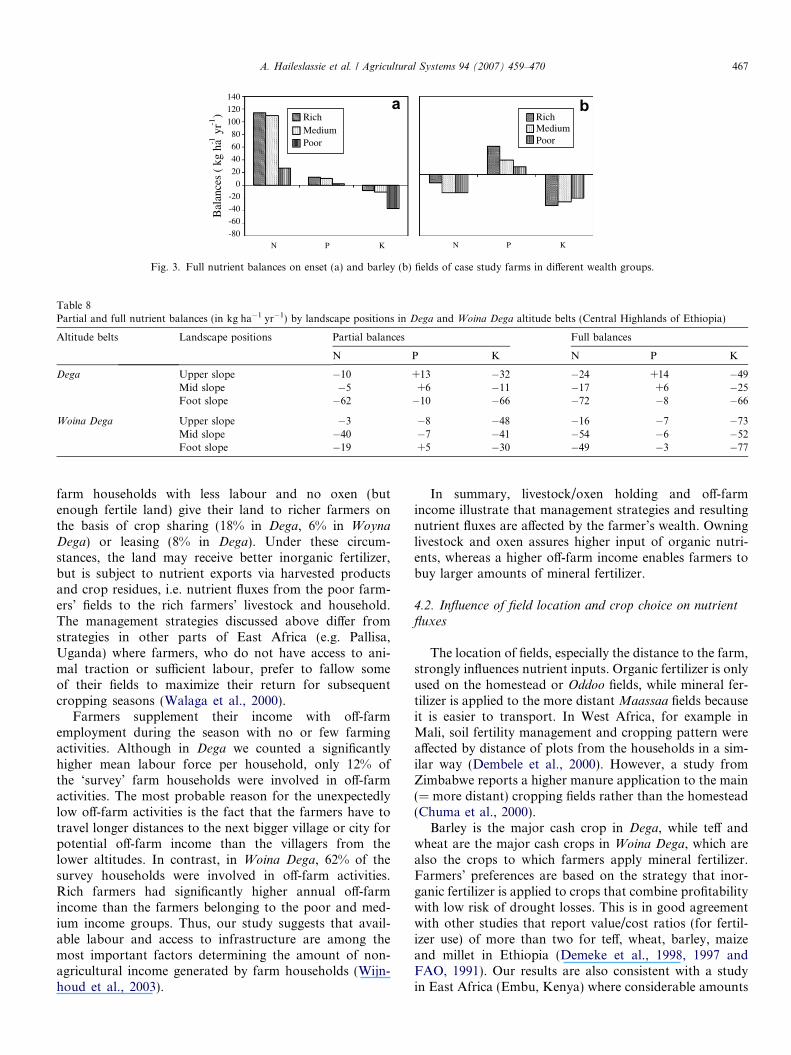
tive partial balance for all nutrients. In contrast, potatofields and meadows showed strongly negative partial bal-ances for N, P and K. The full N balance was positive onlyfor enset. Full P balances were positive for cereals, fallowsand enset. In most cases, K balances were strongly negativewith the highest losses estimated for potatoes(198 kg K ha�1 yr�1). In Woina Dega, the partial N bal-ances were only positive for maize (Table 6), while P bal-ances were negative for all crops, except for teff.Compared with Dega, the full balances in Woina Dega
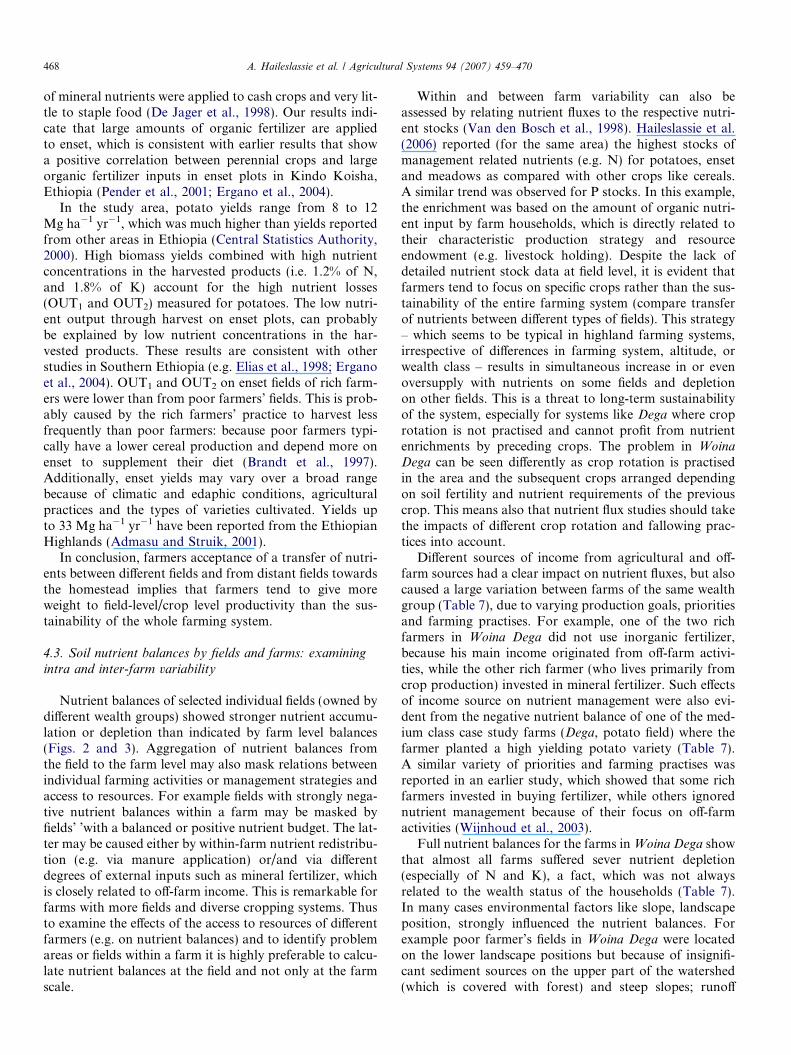
showed high depletion rates of N, P and K. We also calcu-lated full and partial nutrient balances for the case studyfarms (Table 7). In neither of the altitude belts did we finda significant correlation between wealth group and nutrientdepletion at farm level (Table 7). However, balances forselected fields showed contrasting results across wealthgroups (Figs. 2 and 3).
In Dega, meadows were mainly located in depressionsand the highest nutrient depletion occurred at the footslopes (for both partial and full balances, Table 8). In con-trast, farmers in Woina Dega use part of the foot slopes togrow teff and fertilize these plots. As a result, the magni-tude of nutrient depletion on the foot slope is low com-pared with the plots on the mid slope where barley andwheat plots are usually located, which receive less fertilizer.
4. Discussion and conclusions
4.1. Influences of resource capital and source of income on
nutrient fluxes
In this study, the effect of farm activities and access toresources on nutrient fluxes was assessed. We identified dif-ferences in spatial pattern of resource allocation withinfarms (i.e. different field and crop types) and betweenfarms. Based on our household survey, it became evidentthat farmers have different sources of off-farm income,which in some cases was unexpectedly high. The impacton nutrient management is that different wealth groupsalso have different financial resources to replenish nutrientsthrough the addition of manure or fertilizer. In addition,crop choice and diversification strategies as well seem tobe affected by access to resources, which we conclude fromdifferences in types and number of crops selected by farm-ers belonging to different wealth groups (Fig. 1). The choiceof crops directly influences nutrient flows e.g. via nutrientcontent and amount of crop yield and crop residues(=OUT1 and OUT2).
Grazing lands are common property in both studyareas. The same holds true for fallow and croplands (afterharvest), which are treated as grazing lands without accessrestrictions. Farmers who own land but no livestock areforced to bear higher costs of maintaining soil fertility com-pared with farmers owning livestock. Furthermore, in bothstudy areas livestock is a source of cash income, which canbe used to buy inorganic fertilizer, as discussions with
T N L B W M T B m F F F F F F R re
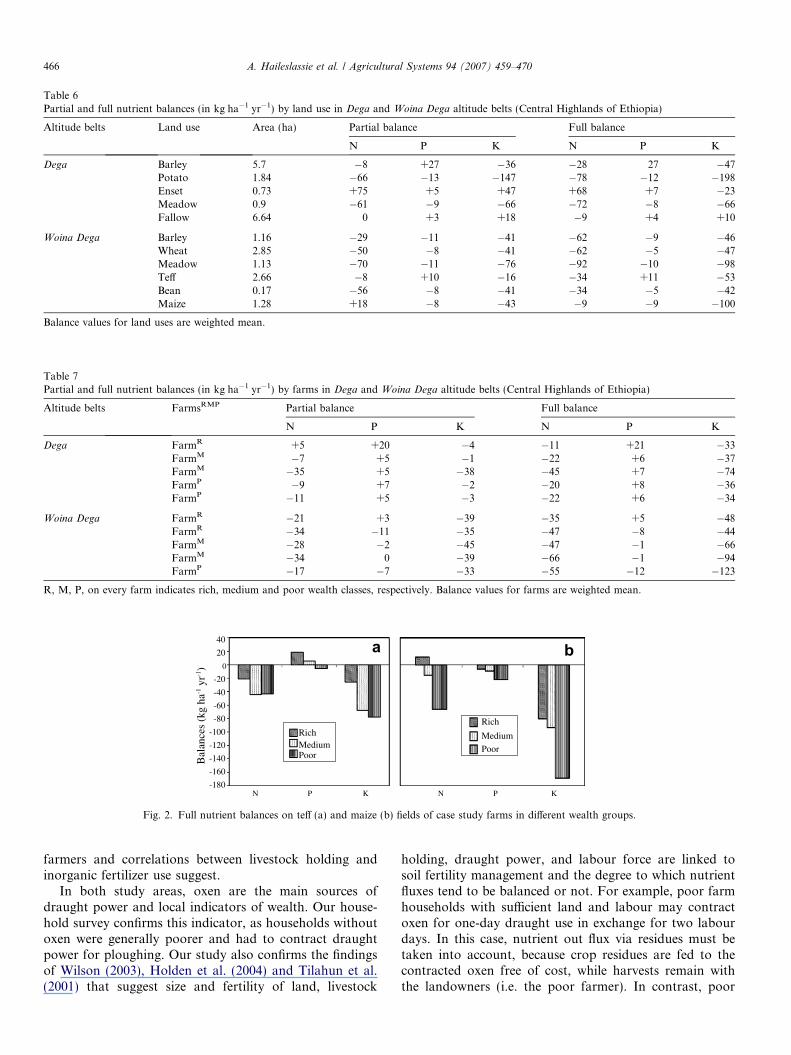
Table 6Partial and full nutrient balances (in kg ha�1 yr�1) by land use in Dega and Woina Dega altitude belts (Central Highlands of Ethiopia)
Altitude belts Land use Area (ha) Partial balance Full balance
N P K N P K
Dega Barley 5.7 �8 +27 �36 �28 27 �47Potato 1.84 �66 �13 �147 �78 �12 �198Enset 0.73 +75 +5 +47 +68 +7 �23Meadow 0.9 �61 �9 �66 �72 �8 �66Fallow 6.64 0 +3 +18 �9 +4 +10
Woina Dega Barley 1.16 �29 �11 �41 �62 �9 �46Wheat 2.85 �50 �8 �41 �62 �5 �47Meadow 1.13 �70 �11 �76 �92 �10 �98Teff 2.66 �8 +10 �16 �34 +11 �53Bean 0.17 �56 �8 �41 �34 �5 �42Maize 1.28 +18 �8 �43 �9 �9 �100
Balance values for land uses are weighted mean.
Table 7Partial and full nutrient balances (in kg ha�1 yr�1) by farms in Dega and Woina Dega altitude belts (Central Highlands of Ethiopia)
Altitude belts FarmsRMP Partial balance Full balance
N P K N P K
Dega FarmR +5 +20 �4 �11 +21 �33FarmM �7 +5 �1 �22 +6 �37FarmM �35 +5 �38 �45 +7 �74FarmP �9 +7 �2 �20 +8 �36FarmP �11 +5 �3 �22 +6 �34
Woina Dega FarmR �21 +3 �39 �35 +5 �48FarmR �34 �11 �35 �47 �8 �44FarmM �28 �2 �45 �47 �1 �66FarmM �34 0 �39 �66 �1 �94FarmP �17 �7 �33 �55 �12 �123
R, M, P, on every farm indicates rich, medium and poor wealth classes, respectively. Balance values for farms are weighted mean.
-180
-160
-140
-120
-100
-80
-60
-40
-20
0
20
40
N P K N P K
Bal
ance
s (k
g ha
-1 y
r-1)
RichMediumPoor
Rich
Medium
Poor
a b
Fig. 2. Full nutrient balances on teff (a) and maize (b) fields of case study farms in different wealth groups.
466 A. Haileslassie et al. / Agricultural Systems 94 (2007) 459–470
farmers and correlations between livestock holding andinorganic fertilizer use suggest.
In both study areas, oxen are the main sources ofdraught power and local indicators of wealth. Our house-hold survey confirms this indicator, as households withoutoxen were generally poorer and had to contract draughtpower for ploughing. Our study also confirms the findingsof Wilson (2003), Holden et al. (2004) and Tilahun et al.(2001) that suggest size and fertility of land, livestock
holding, draught power, and labour force are linked tosoil fertility management and the degree to which nutrientfluxes tend to be balanced or not. For example, poor farmhouseholds with sufficient land and labour may contractoxen for one-day draught use in exchange for two labourdays. In this case, nutrient out flux via residues must betaken into account, because crop residues are fed to thecontracted oxen free of cost, while harvests remain withthe landowners (i.e. the poor farmer). In contrast, poor
-80
-60
-40
-20
0
20
40
60
80
100
120
140
N P K N P K
Bal
ance
s (
kg h
a-1 y
r-1) Rich
MediumPoor
RichMediumPoor
a b
Fig. 3. Full nutrient balances on enset (a) and barley (b) fields of case study farms in different wealth groups.
Table 8Partial and full nutrient balances (in kg ha�1 yr�1) by landscape positions in Dega and Woina Dega altitude belts (Central Highlands of Ethiopia)
Altitude belts Landscape positions Partial balances Full balances
N P K N P K
Dega Upper slope �10 +13 �32 �24 +14 �49Mid slope �5 +6 �11 �17 +6 �25Foot slope �62 �10 �66 �72 �8 �66
Woina Dega Upper slope �3 �8 �48 �16 �7 �73Mid slope �40 �7 �41 �54 �6 �52Foot slope �19 +5 �30 �49 �3 �77
A. Haileslassie et al. / Agricultural Systems 94 (2007) 459–470 467
farm households with less labour and no oxen (butenough fertile land) give their land to richer farmers onthe basis of crop sharing (18% in Dega, 6% in Woyna
Dega) or leasing (8% in Dega). Under these circum-stances, the land may receive better inorganic fertilizer,but is subject to nutrient exports via harvested productsand crop residues, i.e. nutrient fluxes from the poor farm-ers’ fields to the rich farmers’ livestock and household.The management strategies discussed above differ fromstrategies in other parts of East Africa (e.g. Pallisa,Uganda) where farmers, who do not have access to ani-mal traction or sufficient labour, prefer to fallow someof their fields to maximize their return for subsequentcropping seasons (Walaga et al., 2000).
Farmers supplement their income with off-farmemployment during the season with no or few farmingactivities. Although in Dega we counted a significantlyhigher mean labour force per household, only 12% ofthe ‘survey’ farm households were involved in off-farmactivities. The most probable reason for the unexpectedlylow off-farm activities is the fact that the farmers have totravel longer distances to the next bigger village or city forpotential off-farm income than the villagers from thelower altitudes. In contrast, in Woina Dega, 62% of thesurvey households were involved in off-farm activities.Rich farmers had significantly higher annual off-farmincome than the farmers belonging to the poor and med-ium income groups. Thus, our study suggests that avail-able labour and access to infrastructure are among themost important factors determining the amount of non-agricultural income generated by farm households (Wijn-houd et al., 2003).
In summary, livestock/oxen holding and off-farmincome illustrate that management strategies and resultingnutrient fluxes are affected by the farmer’s wealth. Owninglivestock and oxen assures higher input of organic nutri-ents, whereas a higher off-farm income enables farmers tobuy larger amounts of mineral fertilizer.
4.2. Influence of field location and crop choice on nutrient
fluxes
The location of fields, especially the distance to the farm,strongly influences nutrient inputs. Organic fertilizer is onlyused on the homestead or Oddoo fields, while mineral fer-tilizer is applied to the more distant Maassaa fields becauseit is easier to transport. In West Africa, for example inMali, soil fertility management and cropping pattern wereaffected by distance of plots from the households in a sim-ilar way (Dembele et al., 2000). However, a study fromZimbabwe reports a higher manure application to the main(= more distant) cropping fields rather than the homestead(Chuma et al., 2000).
Barley is the major cash crop in Dega, while teff andwheat are the major cash crops in Woina Dega, which arealso the crops to which farmers apply mineral fertilizer.Farmers’ preferences are based on the strategy that inor-ganic fertilizer is applied to crops that combine profitabilitywith low risk of drought losses. This is in good agreementwith other studies that report value/cost ratios (for fertil-izer use) of more than two for teff, wheat, barley, maizeand millet in Ethiopia (Demeke et al., 1998, 1997 andFAO, 1991). Our results are also consistent with a studyin East Africa (Embu, Kenya) where considerable amounts
468 A. Haileslassie et al. / Agricultural Systems 94 (2007) 459–470
of mineral nutrients were applied to cash crops and very lit-tle to staple food (De Jager et al., 1998). Our results indi-cate that large amounts of organic fertilizer are appliedto enset, which is consistent with earlier results that showa positive correlation between perennial crops and largeorganic fertilizer inputs in enset plots in Kindo Koisha,Ethiopia (Pender et al., 2001; Ergano et al., 2004).
In the study area, potato yields range from 8 to 12Mg ha�1 yr�1, which was much higher than yields reportedfrom other areas in Ethiopia (Central Statistics Authority,2000). High biomass yields combined with high nutrientconcentrations in the harvested products (i.e. 1.2% of N,and 1.8% of K) account for the high nutrient losses(OUT1 and OUT2) measured for potatoes. The low nutri-ent output through harvest on enset plots, can probablybe explained by low nutrient concentrations in the har-vested products. These results are consistent with otherstudies in Southern Ethiopia (e.g. Elias et al., 1998; Erganoet al., 2004). OUT1 and OUT2 on enset fields of rich farm-ers were lower than from poor farmers’ fields. This is prob-ably caused by the rich farmers’ practice to harvest lessfrequently than poor farmers: because poor farmers typi-cally have a lower cereal production and depend more onenset to supplement their diet (Brandt et al., 1997).Additionally, enset yields may vary over a broad rangebecause of climatic and edaphic conditions, agriculturalpractices and the types of varieties cultivated. Yields upto 33 Mg ha�1 yr�1 have been reported from the EthiopianHighlands (Admasu and Struik, 2001).
In conclusion, farmers acceptance of a transfer of nutri-ents between different fields and from distant fields towardsthe homestead implies that farmers tend to give moreweight to field-level/crop level productivity than the sus-tainability of the whole farming system.
4.3. Soil nutrient balances by fields and farms: examining
intra and inter-farm variability
Nutrient balances of selected individual fields (owned bydifferent wealth groups) showed stronger nutrient accumu-lation or depletion than indicated by farm level balances(Figs. 2 and 3). Aggregation of nutrient balances fromthe field to the farm level may also mask relations betweenindividual farming activities or management strategies andaccess to resources. For example fields with strongly nega-tive nutrient balances within a farm may be masked byfields’ ’with a balanced or positive nutrient budget. The lat-ter may be caused either by within-farm nutrient redistribu-tion (e.g. via manure application) or/and via differentdegrees of external inputs such as mineral fertilizer, whichis closely related to off-farm income. This is remarkable forfarms with more fields and diverse cropping systems. Thusto examine the effects of the access to resources of differentfarmers (e.g. on nutrient balances) and to identify problemareas or fields within a farm it is highly preferable to calcu-late nutrient balances at the field and not only at the farmscale.
Within and between farm variability can also beassessed by relating nutrient fluxes to the respective nutri-ent stocks (Van den Bosch et al., 1998). Haileslassie et al.(2006) reported (for the same area) the highest stocks ofmanagement related nutrients (e.g. N) for potatoes, ensetand meadows as compared with other crops like cereals.A similar trend was observed for P stocks. In this example,the enrichment was based on the amount of organic nutri-ent input by farm households, which is directly related totheir characteristic production strategy and resourceendowment (e.g. livestock holding). Despite the lack ofdetailed nutrient stock data at field level, it is evident thatfarmers tend to focus on specific crops rather than the sus-tainability of the entire farming system (compare transferof nutrients between different types of fields). This strategy– which seems to be typical in highland farming systems,irrespective of differences in farming system, altitude, orwealth class – results in simultaneous increase in or evenoversupply with nutrients on some fields and depletionon other fields. This is a threat to long-term sustainabilityof the system, especially for systems like Dega where croprotation is not practised and cannot profit from nutrientenrichments by preceding crops. The problem in Woina
Dega can be seen differently as crop rotation is practisedin the area and the subsequent crops arranged dependingon soil fertility and nutrient requirements of the previouscrop. This means also that nutrient flux studies should takethe impacts of different crop rotation and fallowing prac-tices into account.
Different sources of income from agricultural and off-farm sources had a clear impact on nutrient fluxes, but alsocaused a large variation between farms of the same wealthgroup (Table 7), due to varying production goals, prioritiesand farming practises. For example, one of the two richfarmers in Woina Dega did not use inorganic fertilizer,because his main income originated from off-farm activi-ties, while the other rich farmer (who lives primarily fromcrop production) invested in mineral fertilizer. Such effectsof income source on nutrient management were also evi-dent from the negative nutrient balance of one of the med-ium class case study farms (Dega, potato field) where thefarmer planted a high yielding potato variety (Table 7).A similar variety of priorities and farming practises wasreported in an earlier study, which showed that some richfarmers invested in buying fertilizer, while others ignorednutrient management because of their focus on off-farmactivities (Wijnhoud et al., 2003).
Full nutrient balances for the farms in Woina Dega showthat almost all farms suffered sever nutrient depletion(especially of N and K), a fact, which was not alwaysrelated to the wealth status of the households (Table 7).In many cases environmental factors like slope, landscapeposition, strongly influenced the nutrient balances. Forexample poor farmer’s fields in Woina Dega were locatedon the lower landscape positions but because of insignifi-cant sediment sources on the upper part of the watershed(which is covered with forest) and steep slopes; runoff
A. Haileslassie et al. / Agricultural Systems 94 (2007) 459–470 469
had enough energy to remove soil material from thoseplots. Consequently, erosion (=OUT5) on those plots washigher, accounting for high rates of N, P and K depletionon poor farm households’ in Woina Dega.
Smaling et al. (1996) suggested that the net flow ofresources should not be considered to be equal for variousfields belonging to a farm. Besides all the individual differ-ences in production goals and management strategies, weshowed that in the sense of (Giller et al. 1997) farmers’decisions of fertility management can be derived from bothsocio-economic and biophysical environments. Our resultsalso illustrate that the general view on homestead fields asnutrient enrichment zone and distant fields as nutrientdepletion zone is of little use, unless its context (wealthgroup, major sources of income, crop type, livestock, man-agement strategy, etc.) is explicitly defined.
4.4. Importance of the present results to explore the
advantages and limitations nutrient balances at larger scales
The process of nutrient depletion that limits the produc-tivity of African smallholders is spatially and temporallyheterogeneous (Beyene et al., 2006). Causes of variabilityin soil fertility management (nutrient balance) at differentscales of analysis are both biophysical and socioeconomic(Tittoell et al., 2005). Variability at regional scale is deter-mined by climate and dominant soil types, presence of andaccess to markets, while variability between different farmtypes is associated with the landscape and differences in soilfertility management between poor and wealthy house-holds (Elias et al., 1998). As shown above, resource avail-ability and the pattern of resource allocation to differentfields cause within farm variation, which is determined byhousehold wealth and depends on households’ prioritiesand production strategies (Tittoell et al., 2005). The emerg-ing questions here are: (i) to which degree is it possible tocapture these processes and driving forces by studies car-ried out at different spatial scales and (ii) to which degreethe scale of observation has an impact on the calculation/results of nutrient fluxes and nutrient balances. Here wefocus on the perspective of how the field scale studiesmay help to explain nutrient balances at larger spatialscales.
In contrast to studies at the national and regional statescales, which identified homestead fields (Oddoo) as zonesof nutrient accumulation and distant fields (Maassaa) aszone of depletion (Haileslassie et al., 2005), results fromthis field scale study show that the nutrient balancesdepend on the crop grown and intensity of soil manage-ment practices. Oddoo fields allocated to potato and maizeplots were under sever nutrient depletion while soil nutri-ent stocks of Oddoo fields allocated to enset were main-tained or even increased (in the case of rich farmers).The magnitudes of nutrient imbalances at this scale werenot as large as those at higher spatial scales (Haileslassieet al., 2006).
Furthermore, our results show large variations in nutri-ent balances for cereals on Maassaa (e.g. barley, wheat andteff), which contrasted with regional scale studies thatalways showed distant fields as zones of depletion (Hailes-lassie et al., 2005). Finally, for some crops large differenceswere detected in the nutrient balances calculated for differ-ent altitudes (e.g. barley grown in Dega and Woina Dega).
Nutrient balances at national and regional level typicallyfocus on arable land and do not include potentially impor-tant fields that could serve as nutrient sinks (e.g. fallows,meadow) or processes (e.g. grazing or deposition of sedi-ments (Stoorvogel and Smaling, 1998)). In other words,redistribution of nutrients is barely considered, whichmay lead to the wrong conclusion that all nutrients thatare removed from the arable fields are leaving the system(Haileslassie et al., 2006). Despite their limitations, nutrientbalances at national and regional level are important tocreate awareness, identify hotspots of nutrient depletionand to select areas for detailed studies (e.g. Haileslassieet al., 2005; Smaling, 1993). We cannot therefore concludethat there is a ‘best’ scale for nutrient balance studies.However, if nutrient balances are to be used as an indicatorof sustainability, it is important that field scale nutrient bal-ances are made not only from fields where nutrients areexported but also from the fields where nutrients are accu-mulated. This requires a systematic landscape scaleapproach, where fields and farms are selected to representdifferent landscape units, instead of the classical approachwhere farms are the main focus and typically only arablelands are considered.
Acknowledgements
The German Catholic Academic Foreign Service(KAAD) supported this research through a scholarshipto Amare Haileslassie. We thank Farm Africa (Ethiopia),International Livestock Research Institute (ILRI) andDr. Demel Teketay for their invaluable support duringthe field mission.
References
Admasu, T., Struik, P.C., 2001. Enset (Ensete ventricosum (Welw.)
Cheesman) Kocho yield under different crop establishment methods as
compared to yields of other carbohydrate-rich food crops. Netherlands
Journal of Agricultural Science 49, 81–94.
Bekunda, M., Manzi, G., 2003. Use of the partial nutrient budget as an
indicator of nutrient depletion in Highlands of Southern Uganda.
Nutrient Cycling in Agroecosystems 67, 187–195.
Beyene, A., Gibbon, D., Haile, M., 2006. Heterogeneity in land resources
and diversity in farming practices in Tigray, Ethiopia. Agricultural
System 88, 61–74.
Bouyoucus, C.J., 1951. A calibration of the hydrometer method
for making mechanical analysis of soils. Soil Science 59, 434–
438.
Brandt, S.A., Spring, A., Hiebsch, C., Gebre, Y., Endale, T.,
Mulugeta, D., Gizachew, W., Shiferaw, T., Mccabe, T., Shigeta,
M., 1997. The Tree Against Hunger’’ Enset Based Agricultural
System in Ethiopia. American Association for Advancement of
Science, USA, Florida.
470 A. Haileslassie et al. / Agricultural Systems 94 (2007) 459–470
Bray, H.R., Kurtz, L.T., 1945. Determination of total organic and
available forms of phosphorus in soils. Soil Science 9, 39–46.
Brubaker, S.C., Jones, A.J., Lewis, D.T., Frank, K., 1993. Soil properties
associated with landscape position. Soil Science Society of America
Journal 57, 235–239.
Central Statistics Authority, 2000. Agricultural Sample Survey
1999/2000, vol. 1. Statistical Bulletin 227. CSA, Addis Ababa. pp.
25–54.
Chuma, E., Mombeshora, B.G., Murwira, H.K., Chikuvire, J., 2000.
The dynamics of soil fertility management in communal areas of
Zimbabwe. In: Hilhorst, T., Muchena, F.M. (Eds.), Nutrients on the
Move–Soil Fertility Dynamics in African Farming Systems. Inter-
national Institute for Environment and Development, London, pp.
45–64.
De Jager, A., Nandwa, S.M., Okoth, P.F., 1998. Monitoring nutrient
flows and economic performance in African Farming System (NUT-
MON) I. Concept and methodology. Agriculture, Ecosystems and
Environment 71, 37–48.
Dembele, I., Kone, D., Soumare, A., Coulibaly, D., Kone, Y., Ly, B.,
Kater, L., 2000. Fallow and field system in dry land Mali. In: Hilhorst,
T., Muchena, F.M. (Eds.), Nutrients on the Move–Soil Fertility
Dynamics in African Farming Systems. International Institute for
Environment and Development, London, pp. 83–101.
Demeke, M., Said, A., Jayne, T.S., 1997. Promoting fertilizer use in
Ethiopia: the implication for improving grain market performance,
input market efficiency and farm management. Ministry of Economic
Development and Cooperation, Addis Ababa.
Demeke, M., Kelly, V., Jayne, T.S., Said, A., Le Vallee, J.C., Chen, H.,
1998. Agricultural market performance and determinants of fertilizer
use in Ethiopia. Working paper number 10. Ministry of Economic
Development and Cooperation, Addis Ababa.
De Pauw, E., Bruggeman, H.Y., 1988. A Summary of the Agricultural
Ecology of Ethiopia. FAO, Rome.
De Willigen, P., 2000. An analysis of the calculation of leaching and
denitrification losses as practised in the NUTMON approach. Report
18, Plant Research International, Wageningen.
Elias, E., Morse, S., Belshaw, D.G.R., 1998. Nitrogen and phosphorus
balance of Kindo-Koisha farms in Southern Ethiopia. Agriculture,
Ecosystems and Environment 71, 93–113.
Ergano, K., Beyene, S., Melese, F., Onduru, D. and De Jager, A., 2004.
Monitoring nutrient flows and economic performance at Kindo-
Koisha district of Southern Ethiopia. Integrated nutrient management
to attain sustainable productivity increases in east African farming
systems (INMASP). Report No. Et-07. www.inmasp.nl/files/ (accessed
28.11.04).
FAO, 1983. Generalized Agro Climatic Map of Ethiopia. Ethiopian
Mapping Agency, Addis Ababa.
FAO, 1991. Results of fertilizer trials conducted on major cereal
crops. Working paper number 34, Ministry of Agriculture, Addis
Ababa.
FAO, 2005. Scaling Soil Nutrient Balances. FAO, Rome.
Fresco, L.O., Huizing, H., Van Keulen, H., Luning, H., Schipper, R.A.,
1990. Land Evaluation and Farming System Analysis for Land Use
Planning. FAO, Rome.
Giller, K., Candisch, G., Ehaliotis, C., Adams, E., Sakala, W.D.,
Mafongoya, P.l., 1997. Building soil nitrogen capital in Africa. In:
Buresh, R.J., Sanchez, P.A. (Eds.), Replenishing Soil Fertility in
Africa. ASSA, CSSA, SSSA, Wisconsin, pp. 151–192.
Haileslassie, A., Priess, J., Veldkamp, E., Teketay, D., Lesschen, J.P.,
2005. Assessment of soil nutrient depletion and its spatial variability
on smallholders’ mixed farming systems in Ethiopia using partial
versus full nutrient balances. Agriculture, Ecosystems and Environ-
ment. 108 (1), 1–16.
Haileslassie, A., Priess, J.A., Veldkamp, E., Lesschen, J.P., 2006.
Smallholders’ soil fertility management in the Central Highlands of
Ethiopia: implications for nutrient stocks, balances and sustainability
of agroecosystems. Nutrient Cycling in Agroecosystems 75, 135–146.
Henao, J., Baanante, C., 1999. Nutrient Depletion in Agricultural Soils of
Africa. International Food Policy Research Institute, USA.
Holden, S., Shiferaw, B., Pender, J., 2004. Non-farm income, household
welfare, and sustainable land management in a less-favoured area in
the Ethiopian Highlands. Food Policy 28 (4), 369–392.
Jones, A.J., Mielke, L.N., Bartles, C.A., Miller, C.A., 1989. Relationship
of landscape position and properties to crop production. Journal of
Soil Water Conservation 44, 328–332.
Pender, J., Gebremedhin, B., Benin, S., Ehui, S., 2001. Strategy for
Sustainable Agricultural Development in the Ethiopian Highlands.
International Food Policy Research Institute, Washington, DC.
Sanchez, P.A., 2002. Soil fertility and hunger in Africa. Science 129, 2019–
2020.
Schoorl, J.M., Veldkamp, A., Bouma, J., 2002. Modeling water and soil
redistribution in a dynamic landscape context. Soil Science Society of
American Journal 66, 1610–1619.
Smaling, E.M.A., 1993. An agro-ecological framework for integrated
nutrient management, with special reference to Kenya Ph.D. thesis,
Agricultural University of Wageningen, Wageningen.
Smaling, E.M.A., Fresco, L.O., 1993. A decision support model for
monitoring nutrient balances under agricultural land uses. Geoderma
60, 235–256.
Smaling, E.M.A., Fresco, L.O., de Jager, A., 1996. Classifying and
monitoring soil nutrient stocks and flows in African agriculture.
Ambio 25, 492–496.
Stoorvogel, J.J., Smaling, E.M.A., 1998. Research on soil fertility decline
in tropical environment: integration of spatial scales. Nutrient Cycling
in Agroecosystems 50, 151–158.
Tilahun, A., Takele, B., Endrias, G., 2001. Reversing the degradation of
arable land in the Ethiopian Highlands. Managing African Soils No.
23, International Institute for Environment and Development, Lon-
don.
Tittoell, P., Vanlauwe, B., Leffelaar, P.A., Rowe, E.C., Giller, K.E., 2005.
Exploring diversity in soil fertility management of smallholder farms in
western Kenya. I. Heterogeneity at region and farm scale. Agriculture
Ecosystems and Environments 110, 149–165.
Van den Bosch, H., Gitari, J.N., Ogaro, V.N., Maobe, S.A., Vlaming, J.,
1998. Monitoring nutrient flows and economic performance in African
farming system (NUTMON), Monitoring nutrient flows and balances
in three districts in Kenya. Agriculture, Ecosystems and Environment
71, 63–80.
Walaga, C., Egulu, B., Bekunda, M., Ebanyat, P., 2000. Impact of policy
change on soil fertility management in Uganda. In: Hilhorst, T.,
Muchena, F.M. (Eds.), Nutrients on the Move–soil Fertility Dynamics
in African Farming Systems. International Institute for Environment
and Development, London, pp. 29–44.
Walkley, A., Black, C.A., 1934. An examination of the Degtjareff method
for determining soil organic matter, and a proposed modification of
the chromic acid titration method. Soil Science 37, 29–38.
Wang, J., Fu, B., Qiu, Y., Chen, L., 2001. Soil nutrients in relation to
land use and landscape positions in the semi-arid small catchments
on the loess plateau in China. Journal of Arid Environments 48,
537–550.
Wijnhoud, J.D., Konboon, Y., Lefroy, R.D.B., 2003. Nutrient budget:
sustainability assessment of rain fed lowland rice- based system in
Northeast Thailand. Agriculture, Ecosystems and Environment 100,
119–127.
Wilson, R.T., 2003. The environmental ecology of oxen used for draught
power. Agriculture, Ecosystem and Environment 97, 21–37.