Wall Street's Farm Team
26
April 14, 2008 IBERIABANK CORPORATION IBKC/NASDAQ Continuing Coverage: The Little Bank that Could! Investment Rating: Market Outperform PRICE: $ 44.18 S&P 500: 1,328.32 DJIA: 21.34 RUSSELL 2000: 686.07 IBERIABANK is well positioned for the changes in interest rates and oil and gas prices. Hurricane devastation creates opportunities in the Gulf Coast region. Acquisitions in 2007 create challenges and opportunities for 2008. IBERIABANK is sheltered from sub-prime default threats. Experienced management provides strategic direction and consistent returns. Earnings are expected to rise in 2008. Our 12-month target price is $56.67. Valuation 2007 A 2008 E 2009 E EPS $ 3.27 $ 3.99 $ 4.40 P/E 13.5x 11.1x 10.1x CFPS $ 5.82 $ 5.65 $ 6.44 P/CFPS 7.6x 7.8x 6.9x Market Capitalization Stock Data Equity Market Cap (MM): $ 568.64 52-Week Range: $37.44 - $55.97 Enterprise Value (MM): $ 593.92 12-Month Stock Performance: -8.72% Shares Outstanding (MM): 12.87 Dividend Yield: 3.03% Estimated Float (MM): 10.80 Book Value Per Share: $ 38.70 6-Mo. Avg. Daily Volume: 42,883 Beta: 1.06 Company Quick View: Location: Lafayette, Louisiana Industry: Regional Banking Description: IBERIABANK is the second-largest bank holding company based out of Louisiana. Key Products & Services: Consumer and commercial loans and deposits Company Web site: www.iberiabank.com Analysts: Investment Research Manager: Daniela Fernandez de Cordova Lindsay Bofman Elizabeth Heinen Will Petter Kaitlin Snider Wall Street's Farm Team The BURKENROAD REPORTS are produced solely as a part of an educational program of Tulane University's A.B. Freeman School of Business. The reports are not investment advice and you should not and may not rely on them in making any investment decision. You should consult an investment professional and/or conduct your own primary research regarding any potential investment. BURKENROAD REPORTS
-
Upload
independent -
Category
Documents
-
view
3 -
download
0
Transcript of Wall Street's Farm Team

April 14, 2008
IBERIABANK
CORPORATION IBKC/NASDAQ
Continuing Coverage: The Little Bank
that Could!
Investment Rating: Market Outperform PRICE: $ 44.18 S&P 500: 1,328.32 DJIA: 21.34 RUSSELL 2000: 686.07
IBERIABANK is well positioned for the changes in interest rates and
oil and gas prices.
Hurricane devastation creates opportunities in the Gulf Coast region.
Acquisitions in 2007 create challenges and opportunities for 2008.
IBERIABANK is sheltered from sub-prime default threats.
Experienced management provides strategic direction and consistent
returns.
Earnings are expected to rise in 2008.
Our 12-month target price is $56.67.
Valuation 2007 A 2008 E 2009 E
EPS $ 3.27 $ 3.99 $ 4.40
P/E 13.5x 11.1x 10.1x
CFPS $ 5.82 $ 5.65 $ 6.44
P/CFPS 7.6x 7.8x 6.9x
Market Capitalization Stock Data
Equity Market Cap (MM): $ 568.64 52-Week Range: $37.44 - $55.97
Enterprise Value (MM): $ 593.92 12-Month Stock Performance: -8.72%
Shares Outstanding (MM): 12.87 Dividend Yield: 3.03%
Estimated Float (MM): 10.80 Book Value Per Share: $ 38.70
6-Mo. Avg. Daily Volume: 42,883 Beta: 1.06
Company Quick View: Location: Lafayette, Louisiana
Industry: Regional Banking
Description: IBERIABANK is the second-largest bank holding company based out of
Louisiana.
Key Products & Services: Consumer and commercial loans and deposits
Company Web site: www.iberiabank.com
Analysts: Investment Research Manager:
Daniela Fernandez de Cordova Lindsay Bofman
Elizabeth Heinen
Will Petter
Kaitlin Snider
Wall Street's Farm Team
The BURKENROAD REPORTS are produced solely as a part of an educational program of Tulane University's A.B. Freeman School of Business. The reports are not investment advice and you should not and may not rely on them in making any investment decision. You should consult an investment professional and/or conduct your own primary research regarding any potential investment.
BU
RK
EN
RO
AD
RE
POR
TS

IBERIABANK Corporation (IBKC) BURKENROAD REPORTS (www.burkenroad.org) April 14, 2008
2
STOCK PRICE
PERFORMANCE
Figure 1:
5-year Stock Price
Performance
Source: http://finance.yahoo.com. All figures as of April 14, 2008
INVESTMENT
SUMMARY
We give IBERIABANK a rating of Market Outperform. Our 12-month
target price is $56.67 per share, an increase of 28%, from April 14, 2008 at
a price of $44.18. We based our estimates on three different valuation
models: relative price to earnings ratio, price to book value ratio, and the
dividend discount model.
In forecasting the 12-month target price, we considered multiple economic
indicators and the firm’s corporate strategies and goals. Although the
banking industry is severely affected by current economic conditions,
IBERIABANK is better positioned in comparison to the industry average.
IBERIABANK is currently slightly liability sensitive and with falling
interest rates it enjoys increased profits from the spread on its fixed rate
loans. Additionally, IBERIABANK Corp. is not substantially invested in
construction loans, which have been a downfall for a large portion of
banks. IBERIABANK’s strict lending policy in other areas has shown
constant growth and profitability.
Ben Graham
Analysis
Ben Graham is considered the father of fundamental equity analysis. He
developed eight hurdles that can be used to assess the value and growth
potential of stocks. Based on the Ben Graham analysis the Company’s
stock is undervalued because it passes three of the first five hurdles. The
stock is not considered a growth stock because it does not pass any of the
last three hurdles. See Table 8 at the end of this report for a complete
analysis.
IBERIABANK Corporation (IBKC) BURKENROAD REPORTS (www.burkenroad.org) April 14, 2008
3
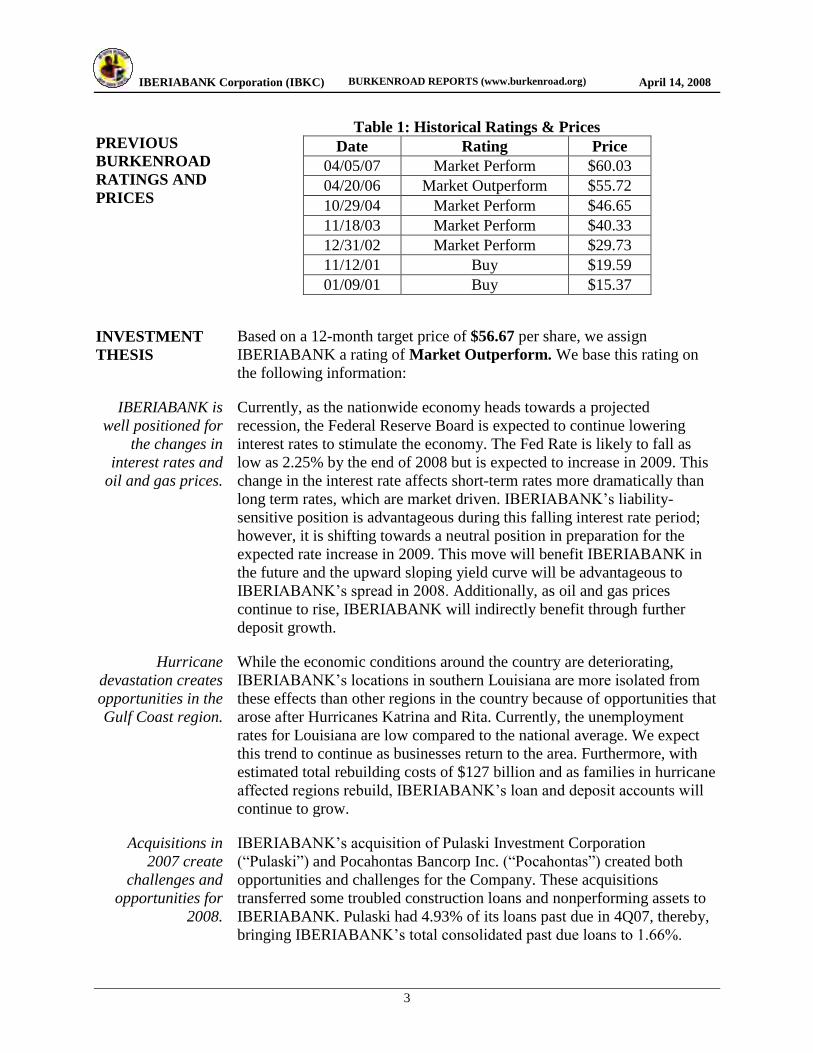
PREVIOUS
BURKENROAD
RATINGS AND
PRICES
Table 1: Historical Ratings & Prices
Date Rating Price
04/05/07 Market Perform $60.03
04/20/06 Market Outperform $55.72
10/29/04 Market Perform $46.65
11/18/03 Market Perform $40.33
12/31/02 Market Perform $29.73
11/12/01 Buy $19.59
01/09/01 Buy $15.37
INVESTMENT
THESIS
Based on a 12-month target price of $56.67 per share, we assign
IBERIABANK a rating of Market Outperform. We base this rating on
the following information:
IBERIABANK is
well positioned for
the changes in
interest rates and
oil and gas prices.
Currently, as the nationwide economy heads towards a projected
recession, the Federal Reserve Board is expected to continue lowering
interest rates to stimulate the economy. The Fed Rate is likely to fall as
low as 2.25% by the end of 2008 but is expected to increase in 2009. This
change in the interest rate affects short-term rates more dramatically than
long term rates, which are market driven. IBERIABANK’s liability-
sensitive position is advantageous during this falling interest rate period;
however, it is shifting towards a neutral position in preparation for the
expected rate increase in 2009. This move will benefit IBERIABANK in
the future and the upward sloping yield curve will be advantageous to
IBERIABANK’s spread in 2008. Additionally, as oil and gas prices
continue to rise, IBERIABANK will indirectly benefit through further
deposit growth.
Hurricane
devastation creates
opportunities in the
Gulf Coast region.
While the economic conditions around the country are deteriorating,
IBERIABANK’s locations in southern Louisiana are more isolated from
these effects than other regions in the country because of opportunities that
arose after Hurricanes Katrina and Rita. Currently, the unemployment
rates for Louisiana are low compared to the national average. We expect
this trend to continue as businesses return to the area. Furthermore, with
estimated total rebuilding costs of $127 billion and as families in hurricane
affected regions rebuild, IBERIABANK’s loan and deposit accounts will
continue to grow.
Acquisitions in
2007 create
challenges and
opportunities for
2008.
IBERIABANK’s acquisition of Pulaski Investment Corporation
(“Pulaski”) and Pocahontas Bancorp Inc. (“Pocahontas”) created both
opportunities and challenges for the Company. These acquisitions
transferred some troubled construction loans and nonperforming assets to
IBERIABANK. Pulaski had 4.93% of its loans past due in 4Q07, thereby,
bringing IBERIABANK’s total consolidated past due loans to 1.66%.
IBERIABANK Corporation (IBKC) BURKENROAD REPORTS (www.burkenroad.org) April 14, 2008
4
This acquisition also exposed IBERIABANK to the unsteady housing and
construction environment in Arkansas. Yet, relative to its peers, the
percentage of construction and development loans within IBERIABANK’s
total loan portfolio remains significantly lower. Despite these difficulties,
IBERIABANK continues to take aggressive action to remedy the situation
for 2008. The effects of this effort to resolve bad loans will result in an
overall growth in IBERIABANK’s earnings. Furthermore, the Pulaski
acquisition created an increase in non-interest income, shielding more of
IBERIABANK’s revenue from the deteriorating economic environment.
IBERIABANK is
sheltered from sub-
prime default
threats.
Prior to the Pulaski and Pocahontas acquisitions, IBERIABANK had no
exposure to sub-prime loans because of the Company’s strict lending
policy. However, with these acquisitions, IBERIABANK assumed a
higher level of marginal construction loans that it has worked diligently to
remove from the Company’s portfolio. Therefore, the Company is well
guarded from the threat of default on sub-prime loans during the poor
economic conditions in 2008.
Experienced
management
provides strategic
direction and
consistent returns.
An experienced management team continues to provide IBERIABANK
with strategic direction and consistent shareholder returns. IBERIABANK
avoids entering saturated markets. Management seeks expansion areas
with minimal banking presence and exploits opportunities in those regions.
In this way, IBERIABANK delivers personalized service and develops
relationships with its customers. This aspect coupled with
IBERIABANK’s ability to diversify product-wise and geographically,
contributes to IBERIABANK’s success and higher shareholder returns.
Earnings are
expected to rise in
2008.
IBERIABANK’s earnings are up 13% from 4Q06 to 4Q07. Deposits also
increased 1% and loans rose 4% in 4Q07 relative to the 3Q07 quarter.
Additionally, IBERIABANK’s shareholders have continued to receive an
annual increase in EPS of 9% over the past seven years. We expect these
increasing trends to continue. IBERIABANK’s stock price has gone up by
16% since 2003; however, its stock price fell by 20% between 4Q06 and
4Q07. This decrease in price can partly be attributed to the economic
slowdown and a bearish market. Yet IBERIABANK is well positioned for
2008. This outlook, accompanied with an expected rise in earnings, will be
reflected in the future stock price.
VALUATION Our twelve month target price of $56.67 was determined via three
different valuation methods: relative price to earnings ratio, price to book
value ratio, and DDM (see Table 2 below for further details).
Relative P/E The price/earnings per share method averages the current price/earnings
ratio for the Company’s peers and multiplies it by forecasted earnings per
share to project future stock prices. This relative valuation model relates
IBERIABANK to its peers and forecasts earnings. Therefore, we gave it a
weight of 50% for a target price of $50.60.

IBERIABANK Corporation (IBKC) BURKENROAD REPORTS (www.burkenroad.org) April 14, 2008
5
Relative Price/BV The price/book value method uses IBERIABANK’s forecasted book value
per share and relates it to the Company’s peers’ P/BV ratio. We found this
to be another tool that relates IBERIABANK’s future value to that of its
competitors. We gave it a weight of 30% for a target price of $60.60.
Dividend Discount
Model
The dividend discount model uses forecasted dividends and discounts
them to the present period. We found that IBERIABANK’s price per share
was most accurately projected through the dividend discount model.
Therefore, we gave it a weight of 20% for a target price of $65.94.
Table 2: Valuation
Valuation Model Target
Price Weight
Weighted
Valuation
Relative PE $50.60 50% $25.30
Relative BV $60.60 30% $18.18
DDM $65.94 20% $13.19
Target Price 100% $56.67
INDUSTRY
ANALYSIS
IBERIABANK Corporation operates in a competitive environment with
approximately 50 other banks positioned in the southeast area of the
United States. IBERIABANK primarily operates as a holding company
and has a thrift, also known as a savings and loan institution, as one of its
subsidiaries. The three main advantages of using a holding company
structure are an improvement in economies of scale, greater access to
capital, and the ability to spread gains—as well as losses—across each of
the holding company’s subsidiaries. Furthermore, through holding
companies, banks are able to enter and compete in different industry
segments through mergers and acquisitions. In addition to its status as a
holding company, IBERIABANK functions as a commercial bank with its
primary sources of revenues coming from the ability to grow deposits and
issue loans.
Most Influential
Macroeconomic
Factors
Among the most influential economic factors affecting the banking
industry is the Federal Funds Rate, the rate banks charge one another to
borrow funds overnight. The difference between this rate and the rate
banks charge customers is known as the spread and is where a bank can
make profits. The banking industry as a whole started slowing down in
August 2007 when the Federal Reserve began lowering interest rates.
However, the consequences of rate fluctuations on individual banks
depend upon whether the bank is asset or liability sensitive. Liability-
sensitive banks typically hold long-term assets and short-term liabilities.
When interest rates fall, liabilities cost less and asset values do not
decrease drastically. Therefore, liability-sensitive banks, like
IBERIABANK, benefit from falling interest rates.

IBERIABANK Corporation (IBKC) BURKENROAD REPORTS (www.burkenroad.org) April 14, 2008
6
Credit risk is also among the top economic factors influencing the banking
industry and can pose the most significant risk to a bank’s overall
performance. During an economic boom, banks tend to make loans to less
desirable candidates, known as sub-prime loans. The majority of sub-
prime loans are mortgage loans. When the economy slows down,
borrowers are more likely to default on the sub-prime loans, and
consequently, will increase a bank’s loan losses. IBERIABANK is well
positioned for the ensuing recession because it has no exposure to the sub-
prime loan division.
Currently, there is a dramatic excess of houses on the market. As a result
of the housing market downturn, commercial developers have difficulty
making payments to banks on their construction loans. Hence, banks with
a large percentage of their portfolio consisting of commercial construction
loans experience significant losses. IBERIABANK has relatively low
construction exposure within its portfolio.
The receding market also impacts consumer spending, which results in
fewer consumer loans. Economic forecasts predict that unemployment will
increase in 2008. The prolonged housing slump, rising gas prices, and
consumer sentiment about the slowing economy also greatly impact
consumer spending. As a result, bank revenues across the industry will
experience declines.
Competitive
Environment
The banking industry is an extremely competitive environment with many
barriers to entry. In addition to the strict regulatory environment imposed
by the Federal Reserve, a large amount of capital and a large customer
base are required to create a bank. In Louisiana, no bank holds more than
25% of the market share, and smaller regional banks compete with some
of the larger national banks. Furthermore, the industry is entering a period
of consolidation in which many banks are expanding through the
acquisition of smaller regional banks.
Within the industry, a bank’s customers function as the buyers and the
depositors; the credit market and the central bank, constitute the suppliers.
The buyers have little bargaining power, which is limited to their ability to
use another bank for similar products. The depositors as suppliers have no
bargaining power and must accept the interest rate or price the bank is
willing to pay. Similarly, the credit market and the central bank have
limited bargaining power because the product supplied, money, is
unlimited.
Banks find it difficult to compete based on prices. A bank loses customers
to competition by increasing interest rates as a means of improving profit
margins and because there is wide availability of comparable products.
Therefore, banks create a competitive advantage through diversification of

IBERIABANK Corporation (IBKC) BURKENROAD REPORTS (www.burkenroad.org) April 14, 2008
7
their product lines, innovative technology, and improved customer service.
Through its acquisitions over the past several years, IBERIABANK has
expanded the products and services it offers to customers.
Hurricane Katrina
and Hurricane Rita
Two and a half years after the storms, the banking industry in the Gulf
Coast region is still feeling the effects of the 2005 hurricane season.
Building loans for customers in the affected region continue to provide a
significant source of revenues. The Gulf Coast is also experiencing a
steady increase in population as people return to the area. This population
increase, accompanied by lower unemployment and a higher per capita
income, provides an advantage to banks along the Gulf Coast.
COMPANY
DESCRIPTION
IBERIABANK Corporation’s relationship-based approach to banking
began 121 years ago and gives the Company a strong foundation for
tomorrow.
History, Locations,
and Facilities
IBERIABANK Corporation (IBKC/NASDAQ) began its 121 year
history with the formation of Iberia Building Association, the first lending
institution in New Iberia, Louisiana, in 1887. At that time, Iberia Building
Association aimed at helping the working class purchase homes.
The Company remained relatively quiet until the 1980s when it entered a
period of acquisition and expansion that continues today. As the
Company’s operations began to evolve, so did its name. The renamed
Iberia Savings Bank acquired Acadia Savings & Loan in 1989 to build
deposit accounts, diversify product lines, and widen its customer base.
With this acquisition and the many that followed, Iberia Savings Bank was
able to open more branches throughout Acadia and Lafayette Parishes.
When Iberia Savings Bank demutualized and began issuing public stock in
1995, ISB Financial was created as its holding company. Its current
moniker, IBERIABANK, was adopted in 1997. From the Company’s
headquarters in Lafayette, IBERIABANK operates fifty branches in the
Acadiana region, Baton Rouge, New Orleans, and northern Louisiana.
Additionally, the recent acquisitions of Pulaski Investment Corporation,
the holding company for Pulaski Mortgage Company and Lenders Trust,
Pulaski Bank and Trust, and Pocahontas Bancorp., the holding company
for First Community Bank, expanded the bank’s presence into Arkansas,
Oklahoma, Mississippi, Missouri, and Texas and allowed IBERIABANK
to enter title insurance and trust management sectors. IBERIABANK
Corporation currently has approximately 150 combined offices with over
1400 employees.

IBERIABANK Corporation (IBKC) BURKENROAD REPORTS (www.burkenroad.org) April 14, 2008
8
Figure 2: Branch Locations
Source: SNL Financial
Products IBERIABANK transformed from a small company providing mortgages to
farming communities into a fully inclusive commercial bank for private
and commercial clients. IBERIABANK offers a wide array of deposit and
lending products and services. These include checking and savings
accounts, commercial, consumer, and mortgage loans, brokerage and
insurance services, credit cards, online banking, and a variety of
investment vehicles. Many of these investment products are available
through Iberia Financial Services, a subsidiary of IBERIABANK.
Figures 3 and 4 indicate the composition of IBERIABANK’s deposits and
loan portfolios. According to these charts, certificates of deposit make up
the majority of the Company’s deposits. Additonally, the commericial loan
segment is the largest in IBERIABANK’s loan portfolio.
Figure 3: Deposit Composition
Source: www.sec.gov

IBERIABANK Corporation (IBKC) BURKENROAD REPORTS (www.burkenroad.org) April 14, 2008
9
Figure 4: Loan Portfolio Composition
Source: www.sec.gov
Strategy Over three decades of acquisition and expansion, IBERIABANK has
broadened its presence throughout much of Louisiana and the surrounding
area. This steady expansion helps IBERIABANK accomplish its mission
to provide exceptional value-based client service. More convenient
locations allow the Company to better serve its client base—the backbone
of its corporate strategy.
This corporate strategy hinges on exceptional customer service and the
ability to exceed clients’ expectations. The relationship-based approach
relies on local decision making and proximity to the client. IBERIABANK
delivers fast results, allowing the client more time for the things that
matter most in life. In addition to a comprehensive financial product line,
IBERIABANK offers customized products and services that are tailored to
fit individual client needs. More importantly, IBERIABANK’s long-term
strategy is to improve profitability and reduce risk. The ultimate goal of
this strategy is to increase the stock price by showing consistently
increasing earnings.
Finally, IBERIABANK also focuses its strategy towards gaining market
share in Louisiana and entering new markets. It continually strives for
growth that is consistent with high performance. The Company plans to
accomplish its goal through continued expansion via acquisitions and the
development of its new branches while still maintaining its focus on the
importance of building and maintaining client relationships. This strategy
keeps shareholders’ interests in mind.
Competitors IBERIABANK is ranked fifth in market share among 160 institutions in
Louisiana. The bank holds the number one market share in the Acadiana
region, specifically in Lafayette and Iberia. IBERIABANK also has the
second largest market share in the northeastern region of Louisiana. As a
member of the banking, lending, and insurance industries,

IBERIABANK Corporation (IBKC) BURKENROAD REPORTS (www.burkenroad.org) April 14, 2008
10
IBERIABANK's top competitors are JPMorgan Chase & Company and
MidSouth Bancorp Inc. Other regional competitors include Capital One
Financial Corporation, GS Financial Corp., Hancock Holding Company,
Teche Holding Company, and Whitney Holding Corp.
Latest
Developments
Although the end of 2007 witnessed an uncooperative interest rate
environment, IBERIABANK was able to continue its project of expansion
through acquisitions and new branch development.
In February 2007, IBERIABANK completed the acquisitions of Pulaski
Investments Corp., the holding company for Pulaski Mortgage Company
and Lenders Trust, for $130.8 million and Pocahontas Bancorp Inc., the
holding company for First Community Bank, for $75.4 million. In April
2007, Pulaski Bank merged with First Community Bank to become
“Pulaski Bank and Trust Company,” a federal stock savings bank
headquartered in Little Rock, Arkansas.
These acquisitions give IBERIABANK exceptional opportunities for
growth. IBERIABANK has diversified its operations by acquiring high-
quality credit card operations and the largest independent title insurance in
Arkansas and Louisiana. Moreover, the acquisitions allow IBERIABANK
to cater to a broad customer base because different industries drive each
state’s economy: Louisiana’s economy is based on oil, natural gas, and
fishing, while Arkansas’ economy excels in manufacturing, food products,
and electrical equipment. A positive impact of these acquisitions is
reflected in IBERIABANK’s rise in quarterly earnings, which can be
attributed in great part to solid loan and deposit growth in the new
branches.
Additionally, IBERIABANK is following up on its largest branch
expansion, which began in 2005. In a 15-month period, the Company
opened 14 new branches in Baton Rouge, Houma, Elmwood, LaPlace,
Prairieville, Slidell, Covington, Broussard, Monroe, and New Orleans,
Louisiana. The main goal is to continue to help clients rebuild their homes
and businesses after hurricanes Katrina and Rita. The Louisiana population
is increasing as people return after the hurricanes; in 2007, the state gained
50,000 new residents. The population rebound will help the bank
accomplish its growth strategy through geographic expansion and client
growth.

IBERIABANK Corporation (IBKC) BURKENROAD REPORTS (www.burkenroad.org) April 14, 2008
11
Figure 5: Number of Branches
Source: www.fdic.gov.
PEER
ANALYSIS
IBERIABANK’s primary peers were selected based on comparable
business drivers, products and services rendered, target customers, and
location. The following information and data indicates IBERIABANK’s
position among its peers: MidSouth Bankcorp Incorporated, Teche
Holding Corporation, and Whitney Holding Corporation. According to the
data below, IBERIABANK’s higher P/E ratio and lower Dividend Yield
places it as a growth company among its peers.
Table 3: Peer Ratio Comparison
Company Ticker
Symbol
Stock
Price
Market
Cap. P/E
Div.
Yield ROA P/B
Whitney Holding Corp. WTNY 22.03 1,460M 10.05 5.4% 1.42% 1.18
MidSouth Bancorp Inc. MSL 21.50 142.82M 16.37 1.3% 1.06% 2.06
Teche Holding Corp. TSH 34.50 76.31M 11.53 3.9% 0.95% 1.11
IBERIABANK Corp. IBKC 44.18 578.47M 13.75 3.0% 1.02% 1.13
Source: http://finance.yahoo.com. All figures as of April, 14, 2008
MidSouth Bancorp
Incorporated
(MSL/AMEX)
MidSouth targets local individuals and small-to mid-cap businesses
through its 33 locations throughout Louisiana, eastern Texas, and along
the I-10 corridor. MidSouth Bancorp Inc. is the holding company for
MidSouth Bank. In addition to providing standard retail services,
MidSouth Bank also provides real estate mortgages and commercial,
consumer, construction, and short-term business loans. Real estate
mortgages comprise 40% of its loan portfolio and commercial loans
account for an additional 30%.
Teche Holding
Corporation
(TSH/AMEX)
Teche, the fourth-largest publicly traded bank in Louisiana, operates 20
locations throughout southern Louisiana. Teche Holding Corp. serves as
the holding company for Teche Federal Bank, which offers conventional
retail services and an array of loan options to its individual and
commercial clientele. Over 50% of Teche’s loan portfolio consists of
residential mortgages.
IBERIABANK Corporation (IBKC) BURKENROAD REPORTS (www.burkenroad.org) April 14, 2008
12
Whitney Holding
Corporation
(WTNY/NASDAQ)
Whitney Holding Corp. is the holding company for Whitney National
Bank, with over 140 locations in Alabama, Florida, Louisiana, Mississippi,
and Texas. Whitney meets the needs of its individual and small business
clients through a variety of banking and financial products and services
including, but not limited to, commercial and retail services, mortgages,
and loans. Whitney has expanded from its commercial base to include
international banking, investment, trust, and consumer services. Real
estate and construction loans account for 44% of Whitney’s loan portfolio.
MANAGEMENT
PERFORMANCE
AND
BACKGROUND
IBERIABANK completed a significant overhaul of its senior management
team in the late 1990s. The new team is characterized by noteworthy
banking understanding that persisted through the challenges of the
Louisiana energy crisis in the 1980s. As IBERIABANK continues its rapid
expansion, management's experience is expected to lead the bank in a
promising way.
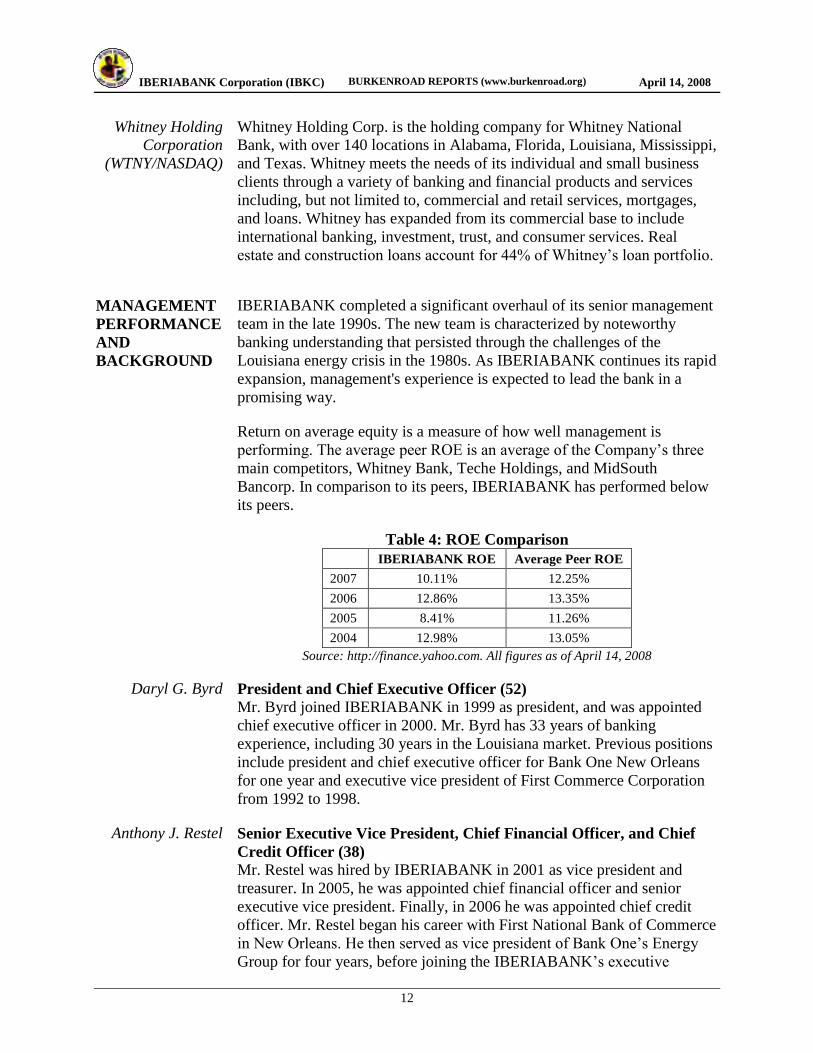
Return on average equity is a measure of how well management is
performing. The average peer ROE is an average of the Company’s three
main competitors, Whitney Bank, Teche Holdings, and MidSouth
Bancorp. In comparison to its peers, IBERIABANK has performed below
its peers.
Table 4: ROE Comparison
IBERIABANK ROE Average Peer ROE
2007 10.11% 12.25%
2006 12.86% 13.35%
2005 8.41% 11.26%
2004 12.98% 13.05%
Source: http://finance.yahoo.com. All figures as of April 14, 2008
Daryl G. Byrd President and Chief Executive Officer (52)
Mr. Byrd joined IBERIABANK in 1999 as president, and was appointed
chief executive officer in 2000. Mr. Byrd has 33 years of banking
experience, including 30 years in the Louisiana market. Previous positions
include president and chief executive officer for Bank One New Orleans
for one year and executive vice president of First Commerce Corporation
from 1992 to 1998.
Anthony J. Restel Senior Executive Vice President, Chief Financial Officer, and Chief
Credit Officer (38)
Mr. Restel was hired by IBERIABANK in 2001 as vice president and
treasurer. In 2005, he was appointed chief financial officer and senior
executive vice president. Finally, in 2006 he was appointed chief credit
officer. Mr. Restel began his career with First National Bank of Commerce
in New Orleans. He then served as vice president of Bank One’s Energy
Group for four years, before joining the IBERIABANK’s executive
IBERIABANK Corporation (IBKC) BURKENROAD REPORTS (www.burkenroad.org) April 14, 2008
13
management team. At IBERIABANK, he implemented the bank's asset
liability management system, established critical processes to provide
short-term and long-term forecasting, and launched a derivative financing
program for the Company’s clients.
Michael J. Brown Senior Executive Vice President (43)
Mr. Brown has worked with IBERIABANK since 1999. He worked for
seven years as senior executive vice president and chief credit officer. He
gave up the latter position in 2006 when he was chosen to manage all of
the Company’s markets, which include Louisiana, Arkansas, Tennessee,
and Oklahoma. Mr. Brown is also responsible for the Company’s wealth
management. Prior to joining IBERIABANK, he served as chief credit
officer for Bank One’s Louisiana commercial operations.
John R. Davis Senior Executive Vice President (46)
Mr. Davis has been responsible for mergers and acquisitions/finance and
investor relations since 2001. He is also the director of financial strategy,
mortgage and title insurance companies. He has served IBERIABANK
since 1999 when he entered as chief strategic planning officer. Before
joining IBERIABANK’s team, he held a similar position in Crestar
Financial in Richmond, Virginia. He also worked from 1993 to 1997 as
senior vice president of First Commerce Corporation in New Orleans.
Michael A. Naquin Senior Executive Vice President (46)
Mr. Naquin has served IBERIABANK since 2004. He serves as senior
executive vice president for each of the banks and is the director of retail,
facilities, and treasury management. Prior to joining IBERIABANK, he
held different senior roles at Bank One, including commercial banking
manager for Arizona and California from 2002 to 2004.
Management
Incentives
IBERIABANK maintains a performance-based compensation program for
its senior executive officers. This is to ensure that the financial interests of
the management and shareholders are aligned. The performance is
measured by an independent consultant and management is rewarded
accordingly. For the quarter ending December 31, 2007, management did
not receive an annual bonus, primarily as a result of the overall poor
performance in the banking industry and management’s not reaching all of
its set goals for the period.
Board of Directors IBERIABANK’s board of directors comprises a well rounded group of
individuals, most of whom are independent of the Company. The chairman
of the board is William H. Fenstermaker, who is also the chairman and
chief executive officer of F. H. Fenstermaker and Associates Incorporated.
Additionally, the board includes a lawyer, a CPA, multiple other company
presidents, vice presidents, and CEOs. Daryl G. Byrd, president and CEO
of IBERIABANK Corporation and IBERIABANK, and Pulaski Bank sits
on the board as well.
IBERIABANK Corporation (IBKC) BURKENROAD REPORTS (www.burkenroad.org) April 14, 2008
14
SHAREHOLDER
ANALYSIS
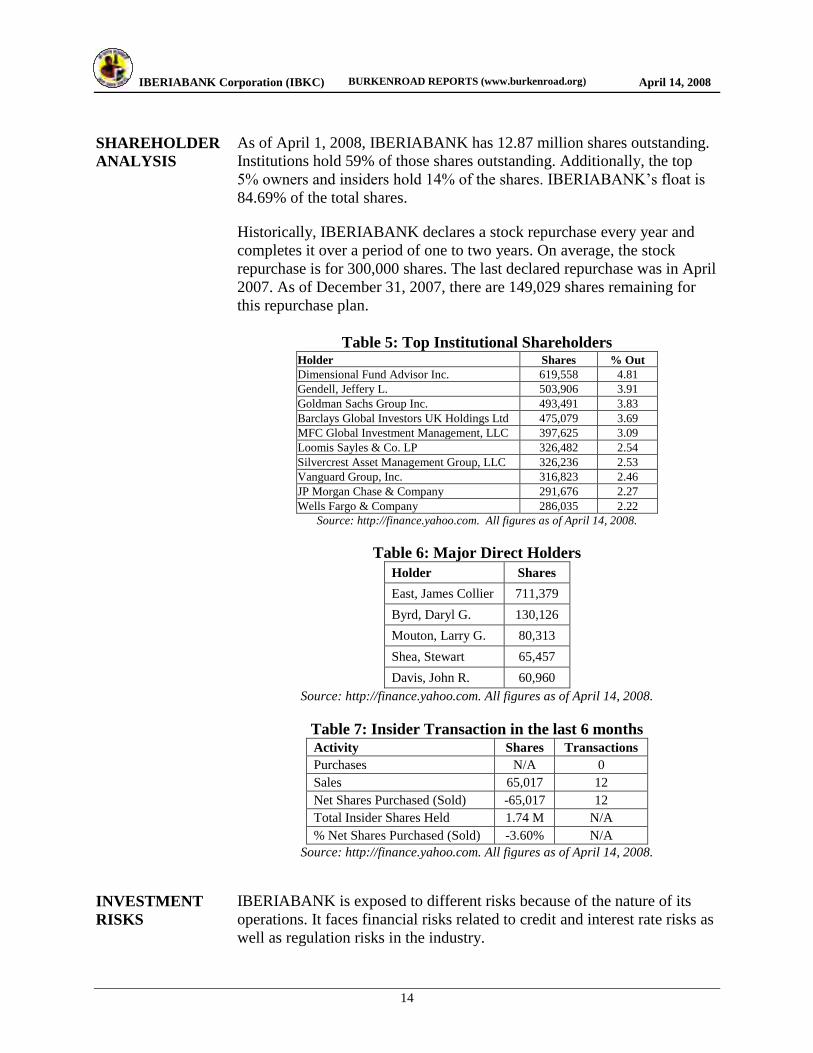
As of April 1, 2008, IBERIABANK has 12.87 million shares outstanding.
Institutions hold 59% of those shares outstanding. Additionally, the top
5% owners and insiders hold 14% of the shares. IBERIABANK’s float is
84.69% of the total shares.
Historically, IBERIABANK declares a stock repurchase every year and
completes it over a period of one to two years. On average, the stock
repurchase is for 300,000 shares. The last declared repurchase was in April
2007. As of December 31, 2007, there are 149,029 shares remaining for
this repurchase plan.
Table 5: Top Institutional Shareholders Holder Shares % Out
Dimensional Fund Advisor Inc. 619,558 4.81
Gendell, Jeffery L. 503,906 3.91
Goldman Sachs Group Inc. 493,491 3.83
Barclays Global Investors UK Holdings Ltd 475,079 3.69
MFC Global Investment Management, LLC 397,625 3.09
Loomis Sayles & Co. LP 326,482 2.54
Silvercrest Asset Management Group, LLC 326,236 2.53
Vanguard Group, Inc. 316,823 2.46
JP Morgan Chase & Company 291,676 2.27
Wells Fargo & Company 286,035 2.22
Source: http://finance.yahoo.com. All figures as of April 14, 2008.
Table 6: Major Direct Holders
Holder Shares
East, James Collier 711,379
Byrd, Daryl G. 130,126
Mouton, Larry G. 80,313
Shea, Stewart 65,457
Davis, John R. 60,960
Source: http://finance.yahoo.com. All figures as of April 14, 2008.
Table 7: Insider Transaction in the last 6 months Activity Shares Transactions
Purchases N/A 0
Sales 65,017 12
Net Shares Purchased (Sold) -65,017 12
Total Insider Shares Held 1.74 M N/A
% Net Shares Purchased (Sold) -3.60% N/A
Source: http://finance.yahoo.com. All figures as of April 14, 2008.
INVESTMENT
RISKS
IBERIABANK is exposed to different risks because of the nature of its
operations. It faces financial risks related to credit and interest rate risks as
well as regulation risks in the industry.
IBERIABANK Corporation (IBKC) BURKENROAD REPORTS (www.burkenroad.org) April 14, 2008
15
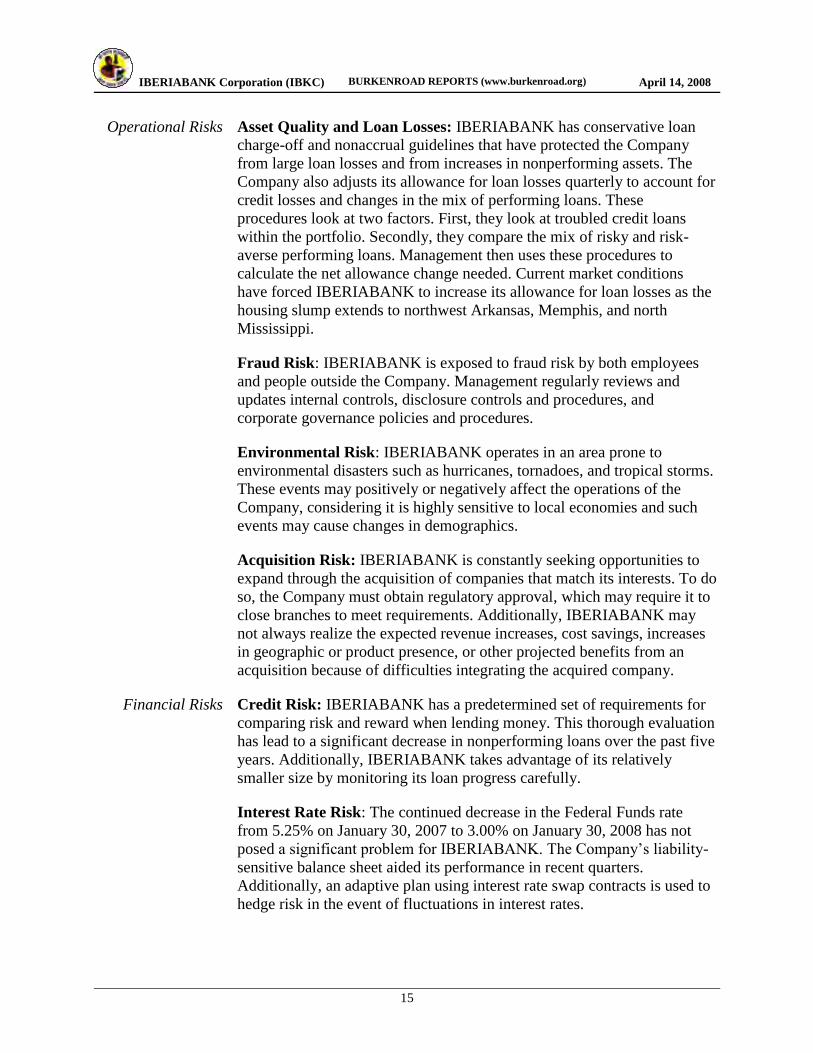
Operational Risks Asset Quality and Loan Losses: IBERIABANK has conservative loan
charge-off and nonaccrual guidelines that have protected the Company
from large loan losses and from increases in nonperforming assets. The
Company also adjusts its allowance for loan losses quarterly to account for
credit losses and changes in the mix of performing loans. These
procedures look at two factors. First, they look at troubled credit loans
within the portfolio. Secondly, they compare the mix of risky and risk-
averse performing loans. Management then uses these procedures to
calculate the net allowance change needed. Current market conditions
have forced IBERIABANK to increase its allowance for loan losses as the
housing slump extends to northwest Arkansas, Memphis, and north
Mississippi.
Fraud Risk: IBERIABANK is exposed to fraud risk by both employees
and people outside the Company. Management regularly reviews and
updates internal controls, disclosure controls and procedures, and
corporate governance policies and procedures.
Environmental Risk: IBERIABANK operates in an area prone to
environmental disasters such as hurricanes, tornadoes, and tropical storms.
These events may positively or negatively affect the operations of the
Company, considering it is highly sensitive to local economies and such
events may cause changes in demographics.
Acquisition Risk: IBERIABANK is constantly seeking opportunities to
expand through the acquisition of companies that match its interests. To do
so, the Company must obtain regulatory approval, which may require it to
close branches to meet requirements. Additionally, IBERIABANK may
not always realize the expected revenue increases, cost savings, increases
in geographic or product presence, or other projected benefits from an
acquisition because of difficulties integrating the acquired company.
Financial Risks Credit Risk: IBERIABANK has a predetermined set of requirements for
comparing risk and reward when lending money. This thorough evaluation
has lead to a significant decrease in nonperforming loans over the past five
years. Additionally, IBERIABANK takes advantage of its relatively
smaller size by monitoring its loan progress carefully.
Interest Rate Risk: The continued decrease in the Federal Funds rate
from 5.25% on January 30, 2007 to 3.00% on January 30, 2008 has not
posed a significant problem for IBERIABANK. The Company’s liability-
sensitive balance sheet aided its performance in recent quarters.
Additionally, an adaptive plan using interest rate swap contracts is used to
hedge risk in the event of fluctuations in interest rates.

IBERIABANK Corporation (IBKC) BURKENROAD REPORTS (www.burkenroad.org) April 14, 2008
16
Regulations The Federal Deposit Insurance Corporation and the Federal Reserve
regulate the banking industry, and the Office of Thrift Supervision
regulates the thrift industry. New regulations are common in the banking
industry and include such regulations as the Sarbanes-Oxley Act of 2002.
This act specifies that top executives are personally responsible for the
accuracy and timeliness of their company’s financial data. Furthermore, it
adds an increased stress on upper management and additional accounting
and information technology costs. These regulations are mandated by the
government with the possibility of an investigation, hefty fines, or even
being shut down if banks do not comply.
FINANCIAL
PERFORMANCE
AND
PROJECTIONS
When preparing our valuation, we made several assumptions about the
industry and the future economic environment. Additional assumptions
were made based on relevant historical trends that we believe provide a
more accurate forecast.
Interest rates to
decrease in 2008,
banks benefit.
The Federal Reserve is expected to continue lowering interest rates
throughout 2008. Based on this information, IBERIABANK will continue
to benefit from the decreasing interest rate because of its liability-sensitive
position. The falling interest rates also caused the yield curve to shift to a
more favorable position for the banking industry. This change allows for
an increase in IBERIABANK’s spread.
The
macroeconomic
outlook is
favorable.
While the majority of the United States experienced a decline in market
stability in the beginning of 2008, the Gulf Coast region prospered and
continued with remarkable growth. We expect this trend to carry on
throughout 2008 and into future years. Another trend we anticipate to
continue is the increase in crude oil prices. Both trends will benefit
IBERIABANK’s earnings.
Interest rates and
the economic
environment are
key revenue
drivers.
Several key revenue drivers for IBERIABANK include interest rates, the
yield curve, and the overall economic environment of the Gulf Coast
region. To develop forecasts for the economic environment, we used
historical data on population, per capita income, unemployment, and the
consumer price index from the FDIC website.
SITE VISIT Our team had the opportunity to visit IBERIABANK’s downtown New
Orleans location in February 2008. At this visit, we spoke with Anthony
Restel, the senior executive vice president, chief credit officer, and CFO.
We discussed the current economic situations and how IBERIABANK is
positioning itself for the future. Specifically, Mr. Restel spoke of how
IBERIABANK is beginning to shift from a liability-sensitive to a neutral
position in order to prepare for the future rate changes. He also mentioned
that IBERIABANK will benefit from the rising oil and natural gas prices
because the Company is an indirect beneficiary of that industry.

IBERIABANK Corporation (IBKC) BURKENROAD REPORTS (www.burkenroad.org) April 14, 2008
17
Additionally, when questioned about his opinion on the Pocahontas and
Pulaski acquisitions, Mr. Restel recognized that although there are current
difficulties in the transition period, the acquisitions will prove to be
beneficial to the shareholders in the long run. The Company is taking
aggressive action to remedy the problems caused by the construction loans
obtained through the Pulaski acquisition.
We found the meeting informative, and it was a great opportunity to get an
inside perspective of IBERIABANK’s strategy and operations.
SOURCES OF
INFORMATION
We based our research on several different sources. The foundation of our
report is based on IBERIABANK’s financial reports and press releases. In
addition, we obtained valuable information from Mr. Anthony Restel,
IBERIABANK’s CFO, during our site visit, and from Mr. John Davis,
investor relations, during three conference calls we arranged.
We also spoke with the CEO of a similar regional bank. He talked about
the current situation in the banking industry and provided guidance on
how to analyze a bank’s financial statements. Based on this information,
we looked at different government and state databases, particularly at the
Federal Reserve Bank of Atlanta, to prepare our forecasts. Finally, we
reinforced our research by consulting Yahoo! Finance, InvestextPlus,
Hoovers, and Bloomberg.

IBERIABANK Corporation (IBKC) BURKENROAD REPORTS (www.burkenroad.org) April 14, 2008
18
BEN GRAHAM
ANALYSIS
Earnings per share (ttm) 3.27$ Price: $44.18
Earnings to Price Yield 7.40%
10 Year Treasury (2X) 7.10%
P/E ratio as of 12/31/03 21.6
P/E ratio as of 12/31/04 22.0
P/E ratio as of 12/31/05 22.8
P/E ratio as of 12/31/06 16.5
P/E ratio as of 12/31/07 14.3
Current P/E Ratio 13.5
Dividends per share (ttm) 1.32$ Price: 44.18$
Dividend Yield 2.99%
1/2 Yield on 10 Year Treasury 1.78%
Stock Price 44.18$
Book Value per share as of 12/31/07 38.99$
150% of book Value per share as of 12/31/07 58.48$
Interest-bearing debt as of 12/31/07 893,770$
Book value as of 12/31/07 498,059$
Current assets as of 12/31/07 868,488$
Current liabilities as of 12/31/07 436,146$
Current ratio as of 12/31/07 2.0
EPS for year ended 12/31/07 3.27$
EPS for year ended 12/31/06 3.57$
EPS for year ended 12/31/05 2.24$
EPS for year ended 12/31/04 3.01$
EPS for year ended 12/31/03 2.74$
EPS for year ended 12/31/07 3.27$ -8%
EPS for year ended 12/31/06 3.57$ 59%
EPS for year ended 12/31/05 2.24$ -26%
EPS for year ended 12/31/04 3.01$ 10%
Stock price data as of April 14, 2008
IBERIABANK (IBKC)
Table 8Hurdle # 1: An Earnings to Price Yield of 2X the Yield on 10 Year Treasury
YES
Hurdle # 2: A P/E Ratio Down to 1/2 of the Stocks Highest in 5 Yrs
NO
Hurdle # 3: A Dividend Yield of 1/2 the Yield on 10 Year Treasury
YES
Hurdle # 4: A Stock Price less than 1.5 BV
YES
Hurdle # 5: Total Debt less than Book Value
NO
Hurdle # 6: Current Ratio of Two or More
NO
Hurdle # 7: Earnings Growth of 7% or Higher over past 5 years
NO
Hurdle # 8: Stability in Growth of Earnings
NO

IBERIABANK Corporation (IBKC) BURKENROAD REPORTS (www.burkenroad.org) April 14, 2008
19
IBERIABANK (IBKC)Annual and Quarterly EarningsIn thousands
Period ended 2005 A 2006 A 2007 A 31-Mar E 30-Jun E 30-Sep E 31-Dec E 2008 E 31-Mar E 30-Jun E 30-Sep E 31-Dec E 2009 E
Interest and dividend income:
Loans, including fees 108,492$ 132,771$ 213,239$ 56,031$ 56,337$ 57,815$ 58,549$ 228,731$ 60,704$ 61,943$ 63,041$ 64,628$ 250,316$
Mortgage loans held for sale, including fees 709 992 4,440 1,006 1,006 1,006 1,006 4,025 1,006 1,006 1,006 1,006 4,025
Investment securities:
Taxable interest and dividends 21,698 26,920 36,869 9,265 9,886 9,831 9,878 38,860 10,330 11,701 11,628 11,672 45,331
Tax-exempt interest 2,494 2,034 3,668 1,010 1,078 1,072 1,077 4,236 1,126 1,276 1,268 1,272 4,942
Other investments 1,855 2,575 4,030 996 996 996 996 3,984 1,046 1,046 1,046 1,046 4,184
Total interest income 135,248 165,292 262,246 68,308 69,303 70,720 71,506 279,836 74,213 76,972 77,989 79,625 308,798
Interest expense: 0.0312
Deposits 36,597 58,116 104,297 22,855 22,614 22,459 22,112 90,040 22,901 23,608 24,796 25,381 96,686
Short-term borrowings 3,395 3,911 15,938 2,946 2,764 2,657 2,624 10,991 3,118 3,398 4,315 5,171 16,002
Long-term debt 10,458 11,743 18,492 5,837 5,626 5,416 5,206 22,085 4,885 4,453 4,021 3,589 16,948
Total interest expense 50,450 73,770 138,726 31,638 31,005 30,532 29,942 123,117 30,904 31,459 33,132 34,141 129,636
Net interest income 84,798 91,522 123,520 36,670 38,298 40,188 41,564 156,720 43,309 45,513 44,857 45,484 179,162
Provision for loan losses 17,069 (7,803) 1,525 2,349 2,412 2,423 2,484 9,668 2,546 2,559 2,623 2,637 10,365
Net interest income after provision for loan losses 67,729 99,325 121,995 34,321 35,886 37,764 39,080 147,051 40,762 42,954 42,234 42,847 168,797
Noninterest income: 1.35 1.27 1.44 1.26 1.31 0.84 0.98 1.07 1.07 1.07 1.07 1.07 1.07
Service charges on deposit accounts 13,427 13,167 19,964 5,172 5,212 5,212 5,217 20,813 5,631 5,621 5,616 5,596 22,463
ATM fee income 2,709 3,429 4,934 1,209 1,419 1,209 1,419 5,255 1,287 1,511 1,287 1,511 5,596
Gain on sale of loans, net 2,497 745 16,744 4,186 4,186 4,186 4,186 16,744 2,500 2,500 2,500 2,500 10,000
Title income 17,293 4,323 4,323 4,323 4,323 17,293 4,421 4,421 4,421 4,421 17,682
Broker commissions 4,054 5,487 1,618 1,699 1,784 1,873 6,974 1,967 2,065 2,168 2,277 8,477
Gain on sale of property 826 99 132 Gains (losses) on sale of investments, net (39) (4,083) 1,113 Income from bank owned life insurance 1,979 2,085 3,530 913 913 913 913 3,652 933 933 933 933 3,733 Trading gains and settlements on swaps 1,330 (136)
Other income 4,742 2,624 7,533 1,242 1,242 1,242 1,242 4,966 1,269 1,269 1,269 1,269 5,077
Total noninterest income 26,141 23,450 76,594 18,663 18,993 18,868 19,173 75,697 18,008 18,320 18,194 18,507 73,029
Noninterest expense:
Salaries and employee benefits 33,973 40,023 79,672 18,544 23,020 22,054 21,587 85,204 20,165 25,032 23,982 23,474 92,654
Occupancy and equipment 8,319 9,445 20,035 4,273 5,603 5,756 5,977 21,609 4,640 6,085 6,250 6,491 23,466
Amortization of acquisition intangibles 1,207 1,118 2,198 493 493 493 493 1,972 493 493 493 493 1,972
Franchise and shares tax expense 3,161 2,991 3,380 827 827 827 827 3,309 827 827 827 827 3,309
Communication and delivery 3,107 3,118 6,142 1,675 1,500 1,739 1,535 6,449 1,759 1,575 1,826 1,611 6,772
Marketing and business development 1,766 2,124 3,039 729 811 613 1,014 3,166 759 845 638 1,056 3,299
Data processing 1,837 2,678 5,819 1,192 1,505 1,554 1,684 5,935 1,216 1,535 1,585 1,718 6,054
Professional services 2,103 3,973 925 1,252 1,058 1,118 4,353 953 1,290 1,090 1,151 4,484
Printing, stationery and supplies expense 992 1,007 2,152 529 629 552 568 2,277 560 665 584 601 2,410
Other expenses 10,076 8,520 14,618 2,724 3,278 3,463 5,854 15,319 2,855 3,435 3,629 6,135 16,053
Total noninterest expense 64,438 73,127 141,028 31,913 38,918 38,108 40,656 149,595 34,228 41,782 40,905 43,557 160,473 Income before income tax expense 29,432 49,648 57,561 21,071 15,962 18,524 17,596 73,153 24,542 19,492 19,524 17,796 81,353
Income tax expense 7,432 13,953 16,250 5,963 4,517 5,242 4,980 20,702 6,945 5,516 5,525 5,036 23,023
Net income 22,000$ 35,695$ 41,311$ 15,108$ 11,445$ 13,282$ 12,616$ 52,451$ 17,596$ 13,976$ 13,999$ 12,760$ 58,330$
Earnings per share - basic 2.40$ 3.80$ 3.39$ 1.18$ 0.90$ 1.05$ 0.99$ 4.12$ 1.39$ 1.10$ 1.10$ 1.00$ 4.59$
Earnings per share - diluted 2.24$ 3.57$ 3.27$ 1.15$ 0.87$ 1.01$ 0.96$ 3.99$ 1.33$ 1.05$ 1.05$ 0.96$ 4.40$
Basic shares 9,155 9,401 12,203 12,762 12,725 12,695 12,683 12,716 12,690 12,695 12,705 12,715 12,701
Diluted shares for calculating EPS and CFPS 9,813 9,993 12,641 13,119 13,135 13,153 13,184 13,148 13,233 13,257 13,285 13,312 13,270
2008 E 2009 E
IBERIABANK Corporation (IBKC) BURKENROAD REPORTS (www.burkenroad.org) April 14, 2008
20
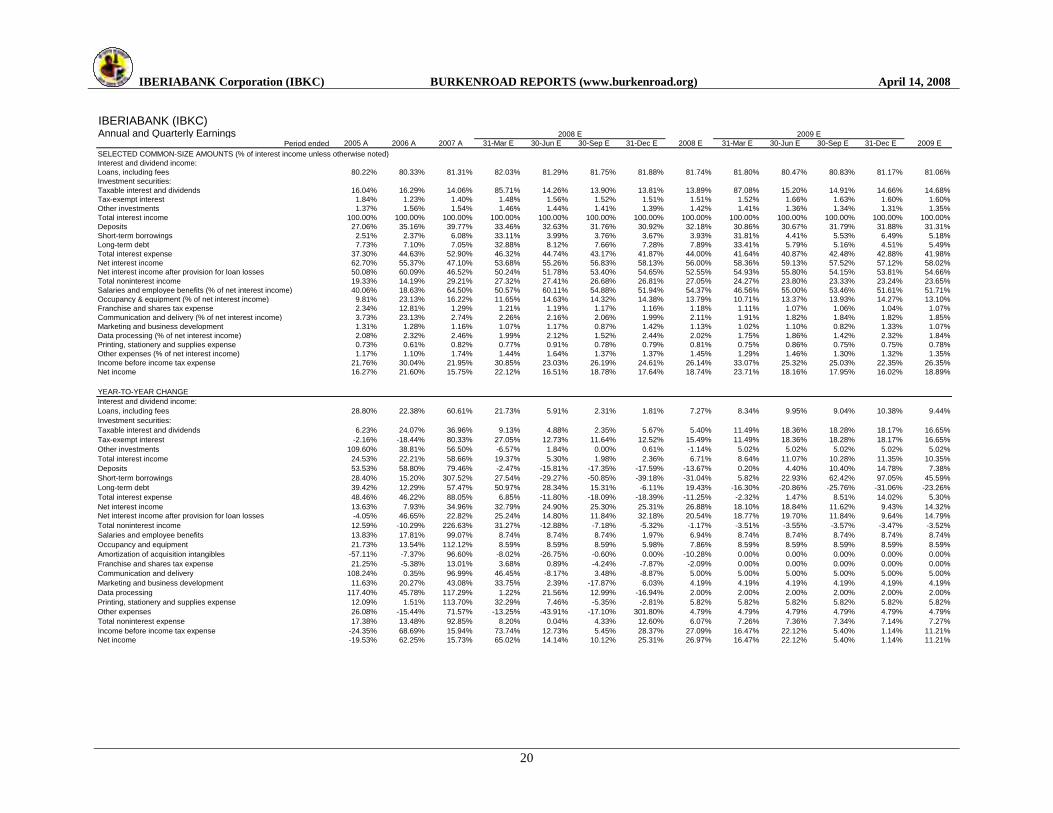
IBERIABANK (IBKC)Annual and Quarterly Earnings
Period ended 2005 A 2006 A 2007 A 31-Mar E 30-Jun E 30-Sep E 31-Dec E 2008 E 31-Mar E 30-Jun E 30-Sep E 31-Dec E 2009 E
SELECTED COMMON-SIZE AMOUNTS (% of interest income unless otherwise noted)
Interest and dividend income:
Loans, including fees 80.22% 80.33% 81.31% 82.03% 81.29% 81.75% 81.88% 81.74% 81.80% 80.47% 80.83% 81.17% 81.06%
Investment securities:
Taxable interest and dividends 16.04% 16.29% 14.06% 85.71% 14.26% 13.90% 13.81% 13.89% 87.08% 15.20% 14.91% 14.66% 14.68%
Tax-exempt interest 1.84% 1.23% 1.40% 1.48% 1.56% 1.52% 1.51% 1.51% 1.52% 1.66% 1.63% 1.60% 1.60%
Other investments 1.37% 1.56% 1.54% 1.46% 1.44% 1.41% 1.39% 1.42% 1.41% 1.36% 1.34% 1.31% 1.35%
Total interest income 100.00% 100.00% 100.00% 100.00% 100.00% 100.00% 100.00% 100.00% 100.00% 100.00% 100.00% 100.00% 100.00%
Deposits 27.06% 35.16% 39.77% 33.46% 32.63% 31.76% 30.92% 32.18% 30.86% 30.67% 31.79% 31.88% 31.31%
Short-term borrowings 2.51% 2.37% 6.08% 33.11% 3.99% 3.76% 3.67% 3.93% 31.81% 4.41% 5.53% 6.49% 5.18%
Long-term debt 7.73% 7.10% 7.05% 32.88% 8.12% 7.66% 7.28% 7.89% 33.41% 5.79% 5.16% 4.51% 5.49%
Total interest expense 37.30% 44.63% 52.90% 46.32% 44.74% 43.17% 41.87% 44.00% 41.64% 40.87% 42.48% 42.88% 41.98%
Net interest income 62.70% 55.37% 47.10% 53.68% 55.26% 56.83% 58.13% 56.00% 58.36% 59.13% 57.52% 57.12% 58.02%
Net interest income after provision for loan losses 50.08% 60.09% 46.52% 50.24% 51.78% 53.40% 54.65% 52.55% 54.93% 55.80% 54.15% 53.81% 54.66%
Total noninterest income 19.33% 14.19% 29.21% 27.32% 27.41% 26.68% 26.81% 27.05% 24.27% 23.80% 23.33% 23.24% 23.65%
Salaries and employee benefits (% of net interest income) 40.06% 18.63% 64.50% 50.57% 60.11% 54.88% 51.94% 54.37% 46.56% 55.00% 53.46% 51.61% 51.71%
Occupancy & equipment (% of net interest income) 9.81% 23.13% 16.22% 11.65% 14.63% 14.32% 14.38% 13.79% 10.71% 13.37% 13.93% 14.27% 13.10%
Franchise and shares tax expense 2.34% 12.81% 1.29% 1.21% 1.19% 1.17% 1.16% 1.18% 1.11% 1.07% 1.06% 1.04% 1.07%
Communication and delivery (% of net interest income) 3.73% 23.13% 2.74% 2.26% 2.16% 2.06% 1.99% 2.11% 1.91% 1.82% 1.84% 1.82% 1.85%
Marketing and business development 1.31% 1.28% 1.16% 1.07% 1.17% 0.87% 1.42% 1.13% 1.02% 1.10% 0.82% 1.33% 1.07%
Data processing (% of net interest income) 2.08% 2.32% 2.46% 1.99% 2.12% 1.52% 2.44% 2.02% 1.75% 1.86% 1.42% 2.32% 1.84%
Printing, stationery and supplies expense 0.73% 0.61% 0.82% 0.77% 0.91% 0.78% 0.79% 0.81% 0.75% 0.86% 0.75% 0.75% 0.78%
Other expenses (% of net interest income) 1.17% 1.10% 1.74% 1.44% 1.64% 1.37% 1.37% 1.45% 1.29% 1.46% 1.30% 1.32% 1.35%
Income before income tax expense 21.76% 30.04% 21.95% 30.85% 23.03% 26.19% 24.61% 26.14% 33.07% 25.32% 25.03% 22.35% 26.35%
Net income 16.27% 21.60% 15.75% 22.12% 16.51% 18.78% 17.64% 18.74% 23.71% 18.16% 17.95% 16.02% 18.89%
YEAR-TO-YEAR CHANGE
Interest and dividend income:
Loans, including fees 28.80% 22.38% 60.61% 21.73% 5.91% 2.31% 1.81% 7.27% 8.34% 9.95% 9.04% 10.38% 9.44%
Investment securities:
Taxable interest and dividends 6.23% 24.07% 36.96% 9.13% 4.88% 2.35% 5.67% 5.40% 11.49% 18.36% 18.28% 18.17% 16.65%
Tax-exempt interest -2.16% -18.44% 80.33% 27.05% 12.73% 11.64% 12.52% 15.49% 11.49% 18.36% 18.28% 18.17% 16.65%
Other investments 109.60% 38.81% 56.50% -6.57% 1.84% 0.00% 0.61% -1.14% 5.02% 5.02% 5.02% 5.02% 5.02%
Total interest income 24.53% 22.21% 58.66% 19.37% 5.30% 1.98% 2.36% 6.71% 8.64% 11.07% 10.28% 11.35% 10.35%
Deposits 53.53% 58.80% 79.46% -2.47% -15.81% -17.35% -17.59% -13.67% 0.20% 4.40% 10.40% 14.78% 7.38%
Short-term borrowings 28.40% 15.20% 307.52% 27.54% -29.27% -50.85% -39.18% -31.04% 5.82% 22.93% 62.42% 97.05% 45.59%
Long-term debt 39.42% 12.29% 57.47% 50.97% 28.34% 15.31% -6.11% 19.43% -16.30% -20.86% -25.76% -31.06% -23.26%
Total interest expense 48.46% 46.22% 88.05% 6.85% -11.80% -18.09% -18.39% -11.25% -2.32% 1.47% 8.51% 14.02% 5.30%
Net interest income 13.63% 7.93% 34.96% 32.79% 24.90% 25.30% 25.31% 26.88% 18.10% 18.84% 11.62% 9.43% 14.32%
Net interest income after provision for loan losses -4.05% 46.65% 22.82% 25.24% 14.80% 11.84% 32.18% 20.54% 18.77% 19.70% 11.84% 9.64% 14.79%
Total noninterest income 12.59% -10.29% 226.63% 31.27% -12.88% -7.18% -5.32% -1.17% -3.51% -3.55% -3.57% -3.47% -3.52%
Salaries and employee benefits 13.83% 17.81% 99.07% 8.74% 8.74% 8.74% 1.97% 6.94% 8.74% 8.74% 8.74% 8.74% 8.74%
Occupancy and equipment 21.73% 13.54% 112.12% 8.59% 8.59% 8.59% 5.98% 7.86% 8.59% 8.59% 8.59% 8.59% 8.59%
Amortization of acquisition intangibles -57.11% -7.37% 96.60% -8.02% -26.75% -0.60% 0.00% -10.28% 0.00% 0.00% 0.00% 0.00% 0.00%
Franchise and shares tax expense 21.25% -5.38% 13.01% 3.68% 0.89% -4.24% -7.87% -2.09% 0.00% 0.00% 0.00% 0.00% 0.00%
Communication and delivery 108.24% 0.35% 96.99% 46.45% -8.17% 3.48% -8.87% 5.00% 5.00% 5.00% 5.00% 5.00% 5.00%
Marketing and business development 11.63% 20.27% 43.08% 33.75% 2.39% -17.87% 6.03% 4.19% 4.19% 4.19% 4.19% 4.19% 4.19%
Data processing 117.40% 45.78% 117.29% 1.22% 21.56% 12.99% -16.94% 2.00% 2.00% 2.00% 2.00% 2.00% 2.00%
Printing, stationery and supplies expense 12.09% 1.51% 113.70% 32.29% 7.46% -5.35% -2.81% 5.82% 5.82% 5.82% 5.82% 5.82% 5.82%
Other expenses 26.08% -15.44% 71.57% -13.25% -43.91% -17.10% 301.80% 4.79% 4.79% 4.79% 4.79% 4.79% 4.79%
Total noninterest expense 17.38% 13.48% 92.85% 8.20% 0.04% 4.33% 12.60% 6.07% 7.26% 7.36% 7.34% 7.14% 7.27%
Income before income tax expense -24.35% 68.69% 15.94% 73.74% 12.73% 5.45% 28.37% 27.09% 16.47% 22.12% 5.40% 1.14% 11.21%
Net income -19.53% 62.25% 15.73% 65.02% 14.14% 10.12% 25.31% 26.97% 16.47% 22.12% 5.40% 1.14% 11.21%
2008 E 2009 E

IBERIABANK Corporation (IBKC) BURKENROAD REPORTS (www.burkenroad.org) April 14, 2008
21
IBERIABANK (IBKC)Annual and Quarterly Balance SheetsIn thousands
Period ended 31-Dec-05 A 31-Dec-06 A 31-Dec-07 A 31-Mar E 30-Jun E 30-Sep E 31-Dec E 31-Dec-08 E 31-Mar E 30-Jun E 30-Sep E 31-Dec E 31-Dec-09 E
Assets
Cash and cash equivalents:
Cash and due from banks 66,697$ 51,078$ 93,263$ 90,240$ 92,119$ 90,575$ 89,259$ 89,259$ 92,975$ 92,646$ 90,011$ 80,757$ 80,757$
Interest-bearing deposits in banks 60,103 33,827 29,842 35,024 35,753 35,154 34,643 34,643 36,085 35,958 34,935 31,343 31,343
Total cash and cash equivalents 126,800 84,905 123,105 125,264 127,871 125,729 123,902 123,902 129,061 128,604 124,946 112,100 112,100
Investment securities:
Available for sale, at fair value 543,495 558,832 745,383 794,706 788,809 792,558 797,636 797,636 873,101 834,288 806,804 815,411 815,411
Held to maturity 29,087 22,520 59,494 64,111 65,235 65,533 65,938 65,938 69,560 69,655 69,855 69,744 69,744
Mortgage loans held for sale 10,515 54,273 57,695 57,695 57,695 57,695 57,695 57,695 57,695 57,695 57,695 57,695 57,695
Loans, net of unearned income, less allowance 1,880,434 2,204,080 3,391,754 3,506,386 3,599,887 3,617,018 3,707,226 3,707,226 3,800,637 3,819,429 3,914,276 3,936,215 3,936,215
Premises and equipment, net 55,010 71,007 122,452 123,839 125,208 126,585 127,968 127,968 129,358 130,756 132,161 133,573 133,573
Goodwill and acquisition intangibles 93,167 92,779 231,177 230,684 230,191 229,698 229,205 229,205 228,712 228,219 227,726 227,233 227,233
Other assets 114,084 114,640 185,898 188,364 189,128 189,534 189,927 189,927 190,601 191,013 191,430 191,858 191,858
Total assets 2,852,592$ 3,203,036$ 4,916,958$ 5,091,050$ 5,184,024$ 5,204,349$ 5,299,497$ 5,299,497$ 5,478,725$ 5,459,658$ 5,524,893$ 5,543,829$ 5,543,829$
Liabilities and stockholders' equity
Liabilities:
Deposits:
Noninterest-bearing 350,065$ 354,961$ 468,001$ 487,933$ 491,684$ 491,684$ 492,157$ 492,157$ 531,214$ 530,267$ 529,793$ 527,899$ 527,899$
Interest-bearing 1,892,891 2,067,621 3,016,827 3,196,618 3,257,442 3,274,606 3,297,383 3,297,383 3,466,499 3,472,882 3,484,879 3,480,394 3,480,394
Total deposits 2,242,956 2,422,582 3,484,828 3,684,551 3,749,126 3,766,290 3,789,540 3,789,540 3,997,713 4,003,149 4,014,672 4,008,293 4,008,293
Short-term borrowings 745 202,605 436,146 416,146 456,146 466,146 546,146 546,146 536,146 536,146 616,146 666,146 666,146
Long-term debt 250,212 236,997 457,624 441,437 425,250 409,063 392,876 392,876 359,602 326,328 293,053 259,779 259,779
Other liabilities 95,110 21,301 40,301 40,836 41,001 41,089 41,175 41,175 41,321 41,410 41,500 41,593 41,593
Total Liabilities 2,589,023 2,883,485 4,418,899 4,582,970 4,671,523 4,682,588 4,769,737 4,769,737 4,934,781 4,907,032 4,965,372 4,975,811 4,975,811
Stockholders' equity:
Common stock of $1 par Value 11,802 12,379 14,800 14,800 14,800 14,800 14,800 14,800 14,800 14,800 14,800 14,800 14,800
Additional paid-in-capital 190,655 214,483 361,746 362,868 363,998 365,137 366,285 366,285 367,441 368,605 369,779 370,961 370,961
Retained earnings 150,107 173,794 197,911 208,593 215,536 224,236 232,185 232,185 245,017 254,131 263,168 270,861 270,861
Unearned Compensation (9,594)
Accumulated other comprehensive income (5,629) (3,306) 5,725 5,725 5,725 5,725 5,725 5,725 5,725 5,725 5,725 5,725 5,725
Treasury stock (73,772) (77,799) (82,123) (83,906) (87,558) (88,137) (89,235) (89,235) (89,040) (90,636) (93,951) (94,329) (94,329)
Total stockholders' equity 263,569 319,551 498,059 508,080 512,501 521,761 529,760 529,760 543,943 552,626 559,521 568,018 568,018
Total liabilities and stockholders' equity 2,852,592$ 3,203,036$ 4,916,958$ 5,091,050$ 5,184,024$ 5,204,349$ 5,299,497$ 5,299,497$ 5,478,725$ 5,459,658$ 5,524,893$ 5,543,829$ 5,543,829$
2008 E 2009 E
IBERIABANK Corporation (IBKC) BURKENROAD REPORTS (www.burkenroad.org) April 14, 2008
22
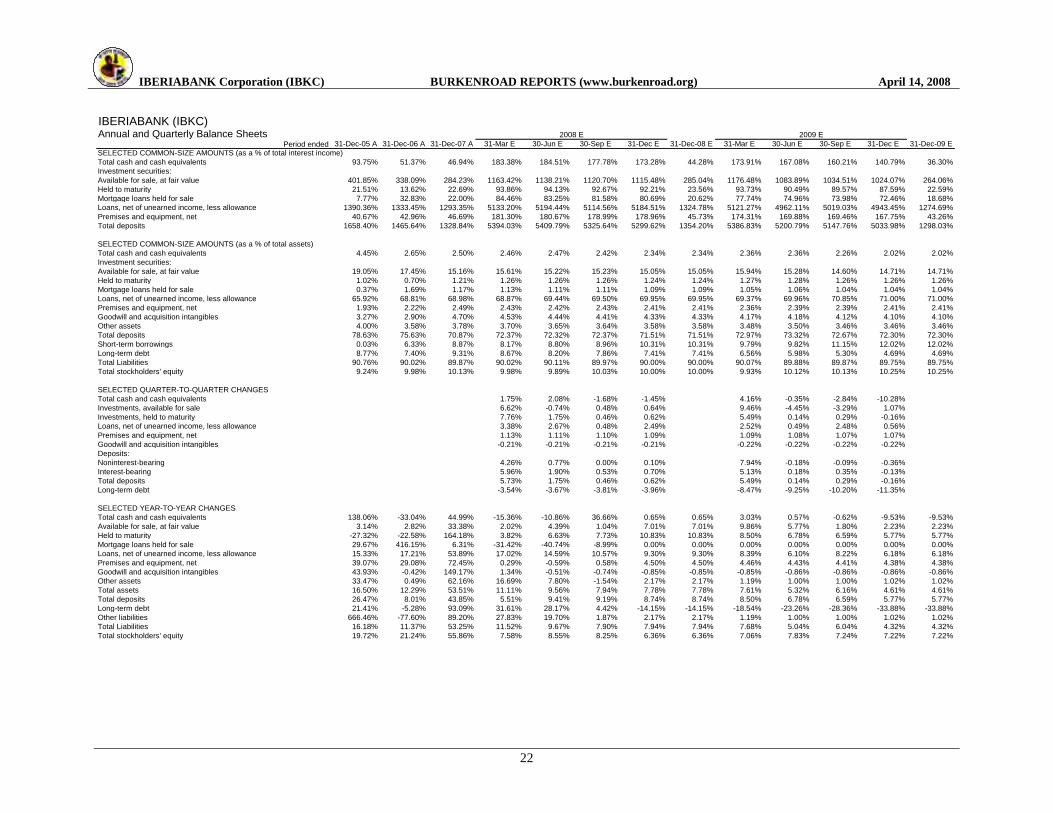
IBERIABANK (IBKC)Annual and Quarterly Balance Sheets
Period ended 31-Dec-05 A 31-Dec-06 A 31-Dec-07 A 31-Mar E 30-Jun E 30-Sep E 31-Dec E 31-Dec-08 E 31-Mar E 30-Jun E 30-Sep E 31-Dec E 31-Dec-09 E
SELECTED COMMON-SIZE AMOUNTS (as a % of total interest income)
Total cash and cash equivalents 93.75% 51.37% 46.94% 183.38% 184.51% 177.78% 173.28% 44.28% 173.91% 167.08% 160.21% 140.79% 36.30%
Investment securities:
Available for sale, at fair value 401.85% 338.09% 284.23% 1163.42% 1138.21% 1120.70% 1115.48% 285.04% 1176.48% 1083.89% 1034.51% 1024.07% 264.06%
Held to maturity 21.51% 13.62% 22.69% 93.86% 94.13% 92.67% 92.21% 23.56% 93.73% 90.49% 89.57% 87.59% 22.59%
Mortgage loans held for sale 7.77% 32.83% 22.00% 84.46% 83.25% 81.58% 80.69% 20.62% 77.74% 74.96% 73.98% 72.46% 18.68%
Loans, net of unearned income, less allowance 1390.36% 1333.45% 1293.35% 5133.20% 5194.44% 5114.56% 5184.51% 1324.78% 5121.27% 4962.11% 5019.03% 4943.45% 1274.69%
Premises and equipment, net 40.67% 42.96% 46.69% 181.30% 180.67% 178.99% 178.96% 45.73% 174.31% 169.88% 169.46% 167.75% 43.26%
Total deposits 1658.40% 1465.64% 1328.84% 5394.03% 5409.79% 5325.64% 5299.62% 1354.20% 5386.83% 5200.79% 5147.76% 5033.98% 1298.03%
SELECTED COMMON-SIZE AMOUNTS (as a % of total assets)
Total cash and cash equivalents 4.45% 2.65% 2.50% 2.46% 2.47% 2.42% 2.34% 2.34% 2.36% 2.36% 2.26% 2.02% 2.02%
Investment securities:
Available for sale, at fair value 19.05% 17.45% 15.16% 15.61% 15.22% 15.23% 15.05% 15.05% 15.94% 15.28% 14.60% 14.71% 14.71%
Held to maturity 1.02% 0.70% 1.21% 1.26% 1.26% 1.26% 1.24% 1.24% 1.27% 1.28% 1.26% 1.26% 1.26%
Mortgage loans held for sale 0.37% 1.69% 1.17% 1.13% 1.11% 1.11% 1.09% 1.09% 1.05% 1.06% 1.04% 1.04% 1.04%
Loans, net of unearned income, less allowance 65.92% 68.81% 68.98% 68.87% 69.44% 69.50% 69.95% 69.95% 69.37% 69.96% 70.85% 71.00% 71.00%
Premises and equipment, net 1.93% 2.22% 2.49% 2.43% 2.42% 2.43% 2.41% 2.41% 2.36% 2.39% 2.39% 2.41% 2.41%
Goodwill and acquisition intangibles 3.27% 2.90% 4.70% 4.53% 4.44% 4.41% 4.33% 4.33% 4.17% 4.18% 4.12% 4.10% 4.10%
Other assets 4.00% 3.58% 3.78% 3.70% 3.65% 3.64% 3.58% 3.58% 3.48% 3.50% 3.46% 3.46% 3.46%
Total deposits 78.63% 75.63% 70.87% 72.37% 72.32% 72.37% 71.51% 71.51% 72.97% 73.32% 72.67% 72.30% 72.30%
Short-term borrowings 0.03% 6.33% 8.87% 8.17% 8.80% 8.96% 10.31% 10.31% 9.79% 9.82% 11.15% 12.02% 12.02%
Long-term debt 8.77% 7.40% 9.31% 8.67% 8.20% 7.86% 7.41% 7.41% 6.56% 5.98% 5.30% 4.69% 4.69%
Total Liabilities 90.76% 90.02% 89.87% 90.02% 90.11% 89.97% 90.00% 90.00% 90.07% 89.88% 89.87% 89.75% 89.75%
Total stockholders' equity 9.24% 9.98% 10.13% 9.98% 9.89% 10.03% 10.00% 10.00% 9.93% 10.12% 10.13% 10.25% 10.25%
SELECTED QUARTER-TO-QUARTER CHANGES
Total cash and cash equivalents 1.75% 2.08% -1.68% -1.45% 4.16% -0.35% -2.84% -10.28%
Investments, available for sale 6.62% -0.74% 0.48% 0.64% 9.46% -4.45% -3.29% 1.07%
Investments, held to maturity 7.76% 1.75% 0.46% 0.62% 5.49% 0.14% 0.29% -0.16%
Loans, net of unearned income, less allowance 3.38% 2.67% 0.48% 2.49% 2.52% 0.49% 2.48% 0.56%
Premises and equipment, net 1.13% 1.11% 1.10% 1.09% 1.09% 1.08% 1.07% 1.07%
Goodwill and acquisition intangibles -0.21% -0.21% -0.21% -0.21% -0.22% -0.22% -0.22% -0.22%
Deposits:
Noninterest-bearing 4.26% 0.77% 0.00% 0.10% 7.94% -0.18% -0.09% -0.36%
Interest-bearing 5.96% 1.90% 0.53% 0.70% 5.13% 0.18% 0.35% -0.13%
Total deposits 5.73% 1.75% 0.46% 0.62% 5.49% 0.14% 0.29% -0.16%
Long-term debt -3.54% -3.67% -3.81% -3.96% -8.47% -9.25% -10.20% -11.35%
SELECTED YEAR-TO-YEAR CHANGES
Total cash and cash equivalents 138.06% -33.04% 44.99% -15.36% -10.86% 36.66% 0.65% 0.65% 3.03% 0.57% -0.62% -9.53% -9.53%
Available for sale, at fair value 3.14% 2.82% 33.38% 2.02% 4.39% 1.04% 7.01% 7.01% 9.86% 5.77% 1.80% 2.23% 2.23%
Held to maturity -27.32% -22.58% 164.18% 3.82% 6.63% 7.73% 10.83% 10.83% 8.50% 6.78% 6.59% 5.77% 5.77%
Mortgage loans held for sale 29.67% 416.15% 6.31% -31.42% -40.74% -8.99% 0.00% 0.00% 0.00% 0.00% 0.00% 0.00% 0.00%
Loans, net of unearned income, less allowance 15.33% 17.21% 53.89% 17.02% 14.59% 10.57% 9.30% 9.30% 8.39% 6.10% 8.22% 6.18% 6.18%
Premises and equipment, net 39.07% 29.08% 72.45% 0.29% -0.59% 0.58% 4.50% 4.50% 4.46% 4.43% 4.41% 4.38% 4.38%
Goodwill and acquisition intangibles 43.93% -0.42% 149.17% 1.34% -0.51% -0.74% -0.85% -0.85% -0.85% -0.86% -0.86% -0.86% -0.86%
Other assets 33.47% 0.49% 62.16% 16.69% 7.80% -1.54% 2.17% 2.17% 1.19% 1.00% 1.00% 1.02% 1.02%
Total assets 16.50% 12.29% 53.51% 11.11% 9.56% 7.94% 7.78% 7.78% 7.61% 5.32% 6.16% 4.61% 4.61%
Total deposits 26.47% 8.01% 43.85% 5.51% 9.41% 9.19% 8.74% 8.74% 8.50% 6.78% 6.59% 5.77% 5.77%
Long-term debt 21.41% -5.28% 93.09% 31.61% 28.17% 4.42% -14.15% -14.15% -18.54% -23.26% -28.36% -33.88% -33.88%
Other liabilities 666.46% -77.60% 89.20% 27.83% 19.70% 1.87% 2.17% 2.17% 1.19% 1.00% 1.00% 1.02% 1.02%
Total Liabilities 16.18% 11.37% 53.25% 11.52% 9.67% 7.90% 7.94% 7.94% 7.68% 5.04% 6.04% 4.32% 4.32%
Total stockholders' equity 19.72% 21.24% 55.86% 7.58% 8.55% 8.25% 6.36% 6.36% 7.06% 7.83% 7.24% 7.22% 7.22%
2008 E 2009 E
IBERIABANK Corporation (IBKC) BURKENROAD REPORTS (www.burkenroad.org) April 14, 2008
23
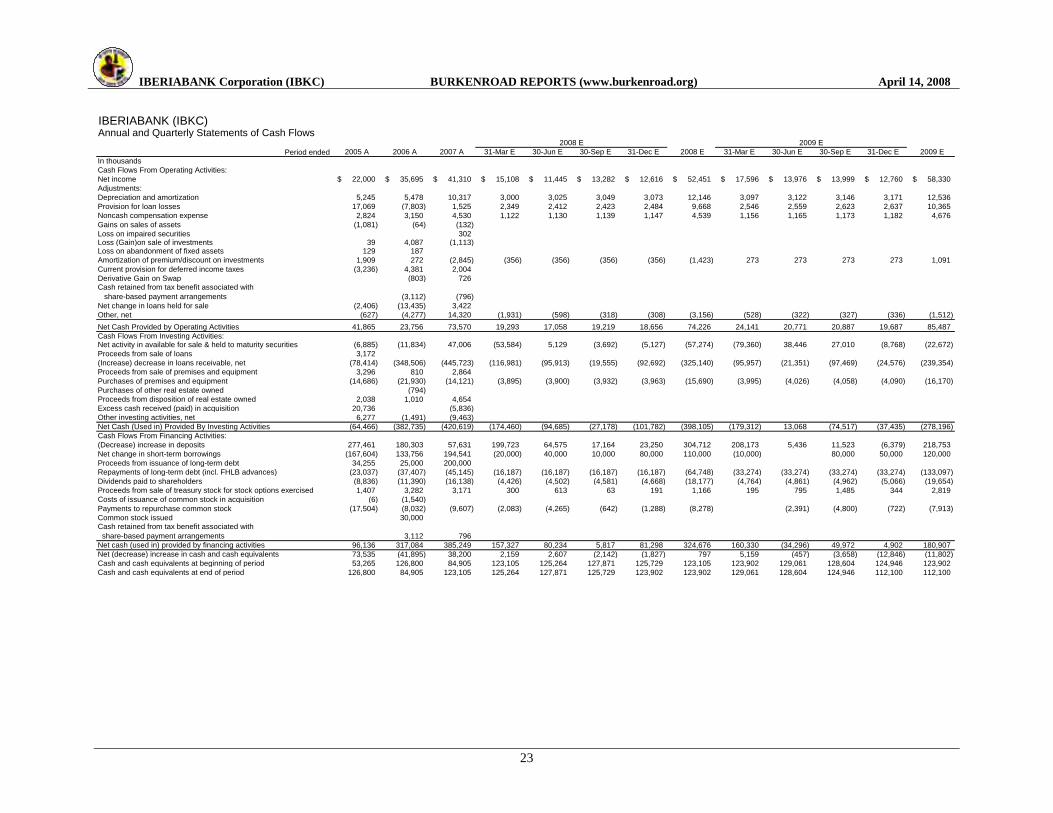
IBERIABANK (IBKC)Annual and Quarterly Statements of Cash Flows
Period ended 2005 A 2006 A 2007 A 31-Mar E 30-Jun E 30-Sep E 31-Dec E 2008 E 31-Mar E 30-Jun E 30-Sep E 31-Dec E 2009 E
In thousands
Cash Flows From Operating Activities:
Net income 22,000$ 35,695$ 41,310$ 15,108$ 11,445$ 13,282$ 12,616$ 52,451$ 17,596$ 13,976$ 13,999$ 12,760$ 58,330$
Adjustments:
Depreciation and amortization 5,245 5,478 10,317 3,000 3,025 3,049 3,073 12,146 3,097 3,122 3,146 3,171 12,536
Provision for loan losses 17,069 (7,803) 1,525 2,349 2,412 2,423 2,484 9,668 2,546 2,559 2,623 2,637 10,365
Noncash compensation expense 2,824 3,150 4,530 1,122 1,130 1,139 1,147 4,539 1,156 1,165 1,173 1,182 4,676
Gains on sales of assets (1,081) (64) (132)
Loss on impaired securities 302 Loss (Gain)on sale of investments 39 4,087 (1,113) Loss on abandonment of fixed assets 129 187
Amortization of premium/discount on investments 1,909 272 (2,845) (356) (356) (356) (356) (1,423) 273 273 273 273 1,091
Current provision for deferred income taxes (3,236) 4,381 2,004
Derivative Gain on Swap (803) 726 Cash retained from tax benefit associated with
share-based payment arrangements (3,112) (796)
Net change in loans held for sale (2,406) (13,435) 3,422
Other, net (627) (4,277) 14,320 (1,931) (598) (318) (308) (3,156) (528) (322) (327) (336) (1,512)
Net Cash Provided by Operating Activities 41,865 23,756 73,570 19,293 17,058 19,219 18,656 74,226 24,141 20,771 20,887 19,687 85,487
Cash Flows From Investing Activities:Net activity in available for sale & held to maturity securities (6,885) (11,834) 47,006 (53,584) 5,129 (3,692) (5,127) (57,274) (79,360) 38,446 27,010 (8,768) (22,672)
Proceeds from sale of loans 3,172
(Increase) decrease in loans receivable, net (78,414) (348,506) (445,723) (116,981) (95,913) (19,555) (92,692) (325,140) (95,957) (21,351) (97,469) (24,576) (239,354)
Proceeds from sale of premises and equipment 3,296 810 2,864
Purchases of premises and equipment (14,686) (21,930) (14,121) (3,895) (3,900) (3,932) (3,963) (15,690) (3,995) (4,026) (4,058) (4,090) (16,170)
Purchases of other real estate owned (794)
Proceeds from disposition of real estate owned 2,038 1,010 4,654
Excess cash received (paid) in acquisition 20,736 (5,836)
Other investing activities, net 6,277 (1,491) (9,463)
Net Cash (Used in) Provided By Investing Activities (64,466) (382,735) (420,619) (174,460) (94,685) (27,178) (101,782) (398,105) (179,312) 13,068 (74,517) (37,435) (278,196)
Cash Flows From Financing Activities:
(Decrease) increase in deposits 277,461 180,303 57,631 199,723 64,575 17,164 23,250 304,712 208,173 5,436 11,523 (6,379) 218,753
Net change in short-term borrowings (167,604) 133,756 194,541 (20,000) 40,000 10,000 80,000 110,000 (10,000) 80,000 50,000 120,000
Proceeds from issuance of long-term debt 34,255 25,000 200,000
Repayments of long-term debt (incl. FHLB advances) (23,037) (37,407) (45,145) (16,187) (16,187) (16,187) (16,187) (64,748) (33,274) (33,274) (33,274) (33,274) (133,097)
Dividends paid to shareholders (8,836) (11,390) (16,138) (4,426) (4,502) (4,581) (4,668) (18,177) (4,764) (4,861) (4,962) (5,066) (19,654)
Proceeds from sale of treasury stock for stock options exercised 1,407 3,282 3,171 300 613 63 191 1,166 195 795 1,485 344 2,819
Costs of issuance of common stock in acquisition (6) (1,540)
Payments to repurchase common stock (17,504) (8,032) (9,607) (2,083) (4,265) (642) (1,288) (8,278) (2,391) (4,800) (722) (7,913)
Common stock issued 30,000 Cash retained from tax benefit associated with
share-based payment arrangements 3,112 796
Net cash (used in) provided by financing activities 96,136 317,084 385,249 157,327 80,234 5,817 81,298 324,676 160,330 (34,296) 49,972 4,902 180,907
Net (decrease) increase in cash and cash equivalents 73,535 (41,895) 38,200 2,159 2,607 (2,142) (1,827) 797 5,159 (457) (3,658) (12,846) (11,802)
Cash and cash equivalents at beginning of period 53,265 126,800 84,905 123,105 125,264 127,871 125,729 123,105 123,902 129,061 128,604 124,946 123,902
Cash and cash equivalents at end of period 126,800 84,905 123,105 125,264 127,871 125,729 123,902 123,902 129,061 128,604 124,946 112,100 112,100
2008 E 2009 E

IBERIABANK Corporation (IBKC) BURKENROAD REPORTS (www.burkenroad.org) April 14, 2008
24
IBERIABANK CORP.Ratios
2005 A 2006 A 2007 A 31-Mar E 30-Jun E 30-Sep E 31-Dec E 2008 E 31-Mar E 30-Jun E 30-Sep E 31-Dec E 2009 E
Performance Measurements
Gross interest margin 5.88% 6.36% 7.63% 1.63% 1.60% 1.61% 1.60% 6.44% 1.60% 1.64% 1.65% 1.66% 6.56%
Net interest margin 3.68% 3.52% 3.60% 0.87% 0.88% 0.92% 0.93% 3.61% 0.93% 0.97% 0.95% 0.95% 3.80%
Loan interest margin 6.02% 6.47% 6.75% 1.60% 1.56% 1.58% 1.57% 6.31% 1.59% 1.60% 1.61% 1.62% 6.42%
Other interest and dividends margin 4.21% 4.70% 5.07% 1.24% 1.28% 1.27% 1.27% 5.06% 1.27% 1.41% 1.45% 1.47% 5.59%
2.08% 2.89% 3.57% 0.74% 0.70% 0.69% 0.67% 2.80% 0.68% 0.68% 0.71% 0.73% 2.80%
Interest expense on short-term borrowings 2.17% 3.70% 4.27% 0.69% 0.63% 0.58% 0.52% 2.40% 0.58% 0.63% 0.75% 0.81% 2.79%
Interest expense on long-term debt 4.31% 4.87% 5.26% 1.30% 1.30% 1.30% 1.30% 5.19% 1.30% 1.30% 1.30% 1.30% 5.19%
Gain on sale of loans/Average loans available for sale 19.10% 3.77% 22.26% 7.26% 7.26% 7.26% 7.26% 29.02% 4.33% 4.33% 4.33% 4.33% 17.33%
Efficiency Ratio 58.1% 63.6% 70.5% 57.7% 67.9% 64.5% 66.9% 64.4% 55.8% 65.5% 64.9% 68.1% 63.6%
Provision for loan losses ratio 1.01% -0.40% 0.06% 0.07% 0.07% 0.07% 0.07% 0.28% 0.07% 0.07% 0.07% 0.07% 0.28%
Loans to Deposits ratio 83.8% 91.0% 97.3% 95.2% 96.0% 96.0% 97.8% 97.8% 95.1% 95.4% 97.5% 98.2% 98.2%
Earning assets to interest-bearing liabilities 117.72% 114.61% 109.55% 109.96% 109.87% 110.08% 110.07% 110.07% 110.89% 111.11% 111.14% 111.44% 112.25%
Non-interest expense to average assets 2.55% 2.54% 3.66% 0.67% 0.80% 0.77% 0.81% 3.04% 0.66% 0.79% 0.77% 0.81% 3.04%
Non-interest revenue to total revenue 23.6% 20.4% 38.3% 33.7% 33.2% 31.9% 31.6% 32.6% 29.4% 28.7% 28.9% 28.9% 29.0%
Equity to Assets Ratio 9.3% 9.4% 9.8% 10.1% 9.9% 10.0% 10.1% 10.0% 10.0% 10.0% 10.1% 10.1% 10.0%
Financial Risk (Leverage) Ratios
Total debt/equity ratio 9.82 9.02 8.87 9.02 9.12 8.97 9.00 9.00 9.07 8.88 8.87 8.76 8.76
Total LT debt/equity ratio 0.95 0.74 0.92 0.87 0.83 0.78 0.74 0.74 0.66 0.59 0.52 0.46 0.46
Tier 1 Leverage Ratio 3.38% 2.97% 2.22% 1.79% 1.75% 1.73% 1.70% 1.74% 1.64% 1.63% 1.62% 1.60% 1.62%
Total debt ratio 0.91 0.90 0.90 0.90 0.90 0.90 0.90 0.90 0.90 0.90 0.90 0.90 0.90
Profitability/Valuation Measures
Gross profit margin 70.21% 68.07% 70.37% 68.71% 65.33% 63.43% 60.96% 70.73% 62.70% 59.81% 57.04% 54.82% 65.33%
Book value per share 43.93$ 53.26$ 83.01$ 84.68$ 85.42$ 86.96$ 88.29$ 88.29$ 90.66$ 92.10$ 93.25$ 94.67$ 94.67$
Return on assets 0.86% 1.22% 1.06% 0.31% 0.23% 0.26% 0.25% 1.05% 0.33% 0.26% 0.26% 0.24% 1.09%
Return on equity 9.23% 13.06% 10.80% 3.08% 2.32% 2.65% 2.45% 10.50% 3.35% 2.62% 2.59% 2.32% 10.86%
Dividend payout ratio 40.16% 31.91% 39.06% 29.30% 39.33% 34.49% 37.00% 34.66% 27.07% 34.78% 35.45% 39.70% 33.69%
2009 E2008 E
Interest expense on deposits as a % of deposits

BURKENROAD REPORTS RATING SYSTEM Market Outperform: This rating indicates that we believe forces are in place that would enable this
company's stock to produce returns in excess of the stock market averages over the next 12 months.
Market Perform: This rating indicates that we believe the investment returns from this company’s
stock will be in line with those produced by the stock market averages over the next 12 months.
Market Underperform: This rating indicates that while this investment may have positive
attributes, we believe an investment in this company will produce subpar returns over the next 12
months.
BURKENROAD REPORTS RATING SYSTEM
CPFS is calculated using operating cash flows excluding working capital changes.
All amounts are as of the date of the report as reported by Bloomberg or Yahoo Finance
unless otherwise noted. Betas are collected from Bloomberg.
Enterprise value is based on the equity market cap as of the report date, adjusted for long-
term debt, cash, and short-term investments reported on the most recent quarterly report date.
12-month Stock Performance is calculated using an ending price as of the report date.
The stock performance includes the 12-month dividend yield.
2007-2008 COVERAGE UNIVERSE AFC Enterprises Inc. (AFCE) McMoRan Exploration Co. (MMR)
Amerisafe Inc. (AMSF) MidSouth Bancorp Inc. (MSL)
Callon Petroleum Company (CPE) NATCO Group Inc. (NTG)
Cal-Maine Foods Inc. (CALM) Parkway Properties Inc. (PKY)
Carbo Ceramics Inc. (CRR) PetroQuest Energy Inc. (PQ)
CLECO Corporation (CNL) Pool Corporation (POOL)
Conn’s Inc. (CONN) Powell Industries Inc. (POWL)
Craftmade International Inc. (CRFT) Rollins Incorporated (ROL)
Crown Crafts Inc. (CRWS) RPC Incorporated (RES)
EastGroup Properties Inc. (EGP) Sally Beauty Holdings (SBH)
Energy Partners Ltd. (EPL) Sanderson Farms Inc. (SAFM)
EnergySouth Inc. (ENSI) SEACOR Holdings Inc. (CKH)
First M&F Corporation (FMFC) Shaw Group Inc. (SGR)
Frozen Food Express (FFEX) Stone Energy Corp. (SGY)
Gulf Island Fabrication Inc. (GIFI) Superior Energy Services Inc. (SPN)
Hibbett Sports Inc. (HIBB) Team Incorporated (TMI)
Hornbeck Offshore Services Inc. (HOS) Teche Holding Company (TSH)
IBERIABANK Corp. (IBKC) Tuesday Morning Corp. (TUES)
ION Geophysical Corp. (IO) W&T Offshore (WTI)
Marine Products Corp. (MPX) Willbros Group Inc. (WG)
Peter Ricchiuti Pamela Shaw Karla Timmons
Director of Research Senior Director of Accounting Abe Topham
BURKENROAD REPORTS BURKENROAD REPORTS Associate Directors of Research
Tulane University Tulane University BURKENROAD REPORTS
New Orleans, LA 70118-5669 New Orleans, LA 70118-5669 Tulane University
(504) 862-8489
(504) 865-5430 Fax
(504) 865-5033
(504) 865-5430 Fax
New Orleans, LA 70118-5669
(504) 862-8489
[email protected] [email protected] (504) 865-5430 Fax

Wall Street's Farm Team
The BURKENROAD REPORTS are produced solely as a part of an educational program of Tulane University's A.B. Freeman School of Business. The reports are not investment advice and you should not and may not rely on them in making any investment decision. You should consult an investment professional and/or conduct your own primary research regarding any potential investment.
Named in honor of William B. Burkenroad Jr., an alumnus and a longtime supporter ofTulane’s business school, and funded through contributions from his family and friends,BURKENROAD REPORTS is a nationally recognized program, publishing objective, high quality investment research reports on public companies in our region. Students at Tulane University’s A. B. Freeman School of Business prepare these reports.
Alumni of the BURKENROAD REPORTS program are employed at a number of highly respected financial institutions including: ABN AMRO Bank (Chicago), Aegis Value Fund (New York), AG Edwards & Co. (St. Louis), AIM Capital Management (Houston), Alpha Omega Capital Partners (Richmond), American General Investment Management (Houston), Banc of America Securities (Charlotte, Houston-New York-Dallas-San Francisco), Bancomer (Mexico City), BankOne Capital (Dallas, New Orleans) Barclays Capital (New York), Barings PLC (Budapest), Bear Stearns (Dallas, New York), Bearing Point (Alexandria), Bessemer Trust (New York), Blackrock Financial Management (New York), Boston Consulting Group (Prague) Burnham Securities (Houston), Cadaret, Grant, and Co., California Board of Regents (San Francisco), Cambridge Associates (Boston), Capital Management (New York), CBA Securities (Stamford), Cadaret, Grant & Co. (Syracuse),Central Bank of Turkey, Chaffe & Assoc. (New Orleans) CIBC/Oppenheimer (New Delhi-New York), Citadel Investment Group (Chicago), Citibank (Jakarta-New York-Stamford), Citigroup Private Bank (New York) City National Bank (Cleveland), Cornerstone Resources (New York) Credit Suisse First Boston (Boston, Dallas, Houston, New York), Dain Rauscher Wessels (Austin, San Francisco), Deutsche Banc Alex Brown (Houston-New York), Duquesne Capital Management (New York) Entrust (New York), Financial Models Inc. (New York), First Albany (Albany, Houston), Fiduciary Trust (New York), Fitch Investors Services (New York), FleetBoston (Boston), Forex Trading (New York), Franklin Templeton (San Mateo), Fulcrum Global Partners (New York), Gintel Asset Management (New York), Goldman Sachs (Houston, London, Memphis, New York, San Francisco), Gomez Advisors (Boston), Grosever Funds (Washington D.C.), Gruntal & Co., (New York), GunnAllen Financial (New York) H & R Block Financial (Austin), Hancock Investment Services (Baton Rouge), Hanifen Imhoff Inc. (Denver), Healthcare Markets Group (Houston), Hibernia Southcoast Capital (Houston, New Orleans), Howard Frazier Barker Elliott, Inc., (Houston) Howard Weil Labouisse Friedrichs (New Orleans), Innovus (New Orleans) Invesco (Denver), J.P. Morgan Chase Securities (Houston, New York), J. W. Genesis (Boca Raton), Jefferies & Co. (Dallas, Houston, London, New Orleans), Johnson Rice & Co. (New Orleans), KBC Financial (New York), Keystone Investments (Boston), Knight Securities (Jersey City), Legacy Capital (New Orleans), Lehman Brothers (Chicago, Houston, New York), Liberty Mutual (Boston), McDonald Investments (Cleveland), Mercer Partners (New York), Merrill Lynch (New York), Miramar Asset Management (San Francisco), Morgan Keegan (Memphis), Morgan Stanley (New York), Needham & Co. (New York), New York Stock Exchange (New York), Oppenheim Bank (Cologne, Germany) Pheonix Capital (San Francisco), Piper Jaffray & Co. (Minneapolis) Professional Advisory Services (Vero Beach), Quarterdeck Investment Services (Washington, D. C.), RBC Dominion Securities (Houston, Atlanta), Raymond James (St. Petersburg, Florida), Related Companies (New York), Restoration Capital (New York) S. G. Cowen & Co. (New York-San Francisco), Salomon Smith Barney (London-New York, New Orleans), Sanford Bernstein & Co. (New York), Second City Trading LLC (Chicago), Scudder Kemper Investments, (New York), Simmons & Co. (Houston), Smith Barney (San Francisco), SWS Securities (Dallas), Spear, Leeds & Kellogg (New York), Stewart Capital LLC (New Orleans), Susquehanna Investment Group (Chicago), Thomas Weisel Partners (San Francisco), TD Securities (New York), Tanaka Capital Management (New York), Texas Employee Retirement System (Austin), The GulfStar Group (Houston), Tivoli Partners (New York), Turner Investment Partners (Philadelphia), UBS PaineWebber (New York), UBS Warburg (New York), Value Line Investments (New York), Vardon Capital (New York), Vilquest, Inc. (Mandeville), Wachovia Securities (Charlotte, Houston, New Orleans, Palm Beach, San Francisco), Wells Fargo Capital Management (San Francisco) Whitney National Bank (New Orleans) and William Blair & Co. (Chicago) Zephyr Management (New York).
To receive complete reports on any of the companies we follow, contact:Peter Ricchiuti, Founder & Director of Research
Tulane UniversityA.B. Freeman School of Business
BURKENROAD REPORTSPhone: (504) 862-8489Fax: (504) 865-5430
E-mail: [email protected] visit our web site at www.burkenroad.org
BU
RK
EN
RO
AD
RE
POR
TS
Printed on Recycled Paper