A Feasibility Study of Dynamical Assimilation of Tide Gauge ...

Chinese Journal of Oceanology and Limnology
Vol. 29 No. 3, P. 664-673, 2011
DOI: 10.1007/s00343-011-0179-3
Nutrient and chlorophyll a anomaly in red-tide periods of
2003�2008 in Sishili Bay, China*
HAO Yanju (郝彦菊)1, 2, 3, TANG Danling (唐丹玲)1, 2, **, YU Long (喻龙)4,
XING Qianguo (邢前国)1
1 Yantai Institute of Coastal Zone Research, Chinese Academy of Sciences, Yantai 264003, China
2 Research Center of Remote Sensing and Marine Ecology/Environment (RSMEE), LED, South China Sea Institute of
Oceanology, Chinese Academy of Sciences, Guangzhou 510301, China
3 Graduate University of Chinese Academy of Sciences, Beijing 100049, China
4 Monitoring and Forecasting Center of the Oceanic Environment of Yantai, Yantai 264003, China
Received Jun. 10, 2010; revision accepted Jul. 25, 2010
© Chinese Society for Oceanology and Limnology, Science Press, and Springer-Verlag Berlin Heidelberg 2011
Abstract Sishili Bay is the most important aquiculture and tourism area for the city of Yantai, China;
however, red tides occurred frequently and have caused huge economic losses in this bay in recent years.
To gain a better understanding of the local ecological environments in the bay, we conducted this researd
between 2003 and 2008 to analyze variations in nutrients and chlorophyll (chl-a) during high frequency
red tide period (May to September). The results show that the chl-a concentration increased from 2.70
in 2003 to 7.26 mg/m3 in 2008, while the concentration of total inorganic nitrogen (TIN) and silicate
(SiO3-Si) increased lineally from 5.18 and 1.45 μmol/L in 2003 to 18.57 and 9.52 μmol/L in 2008,
respectively, and the annual phosphate (PO4-P) varied between 0.15 and 0.46 μmol/L. Special attention
was given to a red tide in August 2007 occurred when water temperature was high and nutrient concentrations
increased sharply because of a heavy rainfall. Overall, the results show the revealed P limitation in Sishili
Bay, and reveal that red tides were caused by eutrophication from terrestrial inputs and local warm weather,
particularly during rainy periods. Therefore, to control red tide, greater efforts should be made to reduce
sewage discharges into Sishili Bay, particularly during rainfall seasons.
Keyword: chl-a; TIN; PO4-P; red tide; frequency; Sishili Bay
1 INTRODUCTION
Coastal bays are regions of strong land-ocean
interaction. The rapid progress of aquiculture and
the circumlittoral economy have greatly influenced
coastal environments in China, resulting in ecological
imbalance, decreased biodiversity, and rapid
reduction of biological resources in estuaries and
coastal bays (Turner and Rabalais, 1994; Poder
et al., 2003; Philippart et al., 2007). Anthropogenic
nutrient loading from terrestrial systems usually
causes eutrophication and increased occurrence of
red tides. Indeed, red tides have become a serious
ecological problem worldwide in recent years
(Anderson, 1994, 1995; Zhou et al., 2001; Sarkar,
2005), including in China (Tang et al., 2004, 2006;
Yu et al., 2007a, 2007b; Wang et al., 2008; Wei
et al., 2008).
* Supported by the CAS/SAFEA International Partnership Program for
Creative Research Teams (Nos. KZCX2-YW-T001 and KZCX2-YW-
213), the Chinese Academy of Sciences (No. KZCX2-YW-226), and the
National Natural Science Foundation of China (Nos. 40976091 and
31061160190)
** Corresponding author: [email protected], http:/lingzis.51.net
Sishili Bay is one of the most important areas of
aquiculture in north China, and the main aquiculture
and tourism area for Yantai, a rapidly developing
city in China. Sishili Bay has been influenced
extensively by anthropogenic activities, especially
the local sewage input (Wang et al., 1995; Ye et al.,
2006). Red tides have occurred frequently in this
bay area in recent years, which has resulted in great
damage to aquiculture and tourism in Yantai.
Most previous studies of Sishili Bay have evaluated
the distribution of environmental parameters during
specific times. The results of these studies have

No.3 665HAO et al.: Nutrients, chl-a and red tide in Sishili Bay
provided information regarding the substantial
eutrophication that has occurred in the bay area
(Ji, 1994; Zhao et al., 2000a, 2000b; Shan et al.,
2001; Wu et al., 2001; Ye et al., 2006). Other studies
have considered cultivation and oceanographic
processes and the carrying capacity for scallop
culture (Yang et al., 1999; Zhang et al., 2001;
Zhou et al., 2002a, 2002b, 2006). However, there
is no clear information regarding variations in
environmental parameters in Sishili Bay, particularly
during periods of high frequency red tides, and the
long-term trends in nutrients and their association
with red tides in this area are still not well
understood.
In the present study, in-situ ecological and
environmental data obtained for Sishili Bay from
2003 to 2008 are analyzed and summarized.
The results presented here may provide a better
understanding of ecological environmental variations
and their connection with red tide events in this bay
area in recent years.
2. STUDY AREA AND METHOD
2.1 Sishili Bay
Sishili Bay is a half-closed water area located
in the north of the Yellow Sea, east of Yantai, China
at 37.42°�37.63°N, 120.35°�120.63°E (Fig.1a). The
bay covers an area of 280 km2 and has a 20 km
coastline, joining Zhifu Bay to the north-west and
bordering Yangma Island in the south-east (Fig.1b)
(Zhou et al., 2006; Liang et al., 2007). In Sishili Bay,
the tidal range is 1.66 m and the water temperature
is about 23.3�27.4°C in summer and 2.5�3.0°C
during winter (Wu et al., 2001). The water depth of
Sishili Bay is less than 15 m, with an average depth
of 8�9 m. There is no thermal stratification in the
bay, and very little difference in hydrographic
parameters between the surface and bottom water
(less than 1°C between surface and bottom water).
There is usually a high frequency of red tides in
Sishili Bay from May to September (Communiqués
of Marine Environmental Quality of Yantai).
There are three important districts along the coast
of Sishili Bay: Zhifu, Laishan and Muping Districts
in Yantai. In addition, there is an estuary of
Guangdang River and an outlet of the Xin�anhe
Sewage Plant along the coast (Fig.1b). Since 2003,
most residential and industrial sewage from the
Laishan District has been treated by the Xin�anhe
Sewage Plant, which discharges 5�6 tons of sewage
into Sishili Bay every day. Additionally, the seriously
polluted water in Guangdang River has also been
treated by the Xin�anhe Sewage Plant since March,
2005.
From 2002 to 2007, the total population of the
three aforementioned districts has increased, while
the city�s total output values and per capita Gross
Domestic Products have also increased (Table 1).
With that gain, Yantai�s discharge of municipal
sewage increased from 2002 to 2007 (Table 1). The
suspension aquaculture activity in the bay has also
increased in the last two decades (Zhou et al., 2006),
and the total mariculture of the three districts was
about 1.03×10⁵ tons in 2007 (Table 1). These changes
can also have an impact on the ecological environment
of Sishili Bay.
2.2 Method of environmental observation
Environmental and biological parameters were
measured in the surface layer of the sea water at six
survey stations (Fig.1b) every May, June, July,
August and September from 2003 to 2008. There
were two cruises during each month and the monthly
mean values of all parameters evaluated during the
cruises were calculated.
The physical parameters of sea water were
measured in-situ, while the chemical parameters
Fig.1 Location of Sishili Bay and the study area
a, The location of Sishili Bay (small box); b, Sishili Bay map with the
six survey stations (black triangles)
N
40º
30º
N
110º 120º
Bohai Sea
YantaiSishili Bay
Weihai
Yellow Sea
Qingdao
N b
a
37.60º
37.55º
37.50º
37.45º
121.35º 121.40º 121.45º 121.50º 121.55º 121.60º 121.65º
Zhifu Bay
Qianqikuang
Qianquanzhai Sishili BayYangma Island
Xin' anhe Sewage Plant
Guangdang River
130ºE
E
Zhifu District
Muping District

666 Vol.29CHIN. J. OCEANOL. LIMNOL., 29(3), 2011
were measured in the lab according to the standard
methods (SOC, 1998). Briefly, samples for chemical
analysis were filtered through cellulose filters (pore
diameter 0.45 μm), after which the nitrate nitrogen
(NO3-N) was determined by the zinc cadmium
reduction method, the nitrite nitrogen (NO2-N) was
determined by the naphthyl ethylenediamine
spectrophotometric method, the ammonia nitrogen
(NH4-N) was determined by the hypobromite
oxidation method, the total dissolved inorganic
nitrogen (TIN) was calculated as TIN = NO3-N + NO2-
N + NH4-N, the dissolved phosphate (PO4-P) was
determined by the phosphorus molybdenum blue
spectrophotometric method, and the dissolved silicate
(SiO3-Si) was determined by the sodium molybdenum
blue spectrophotometric method. Samples for chl-a
determination were filtered using Whatman GF/F
filters, after which the chl-a collected on the
GF/F filters was extracted with 90% acetone and
then measured using a TU-1810 ultraviolet visible
spectrophotometer. Phytoplankton samples were
collected using a type III plankton net for shallow
water (the pore diameter was 0.077 mm). The
samples were then kept in 5% formaldehyde liquor,
after which they were analyzed according to the
method described by Utermöhl (1958). Observations
were made under an Olympus light microscope at
magnifications of 100�400, and the phytoplankton
abundance was expressed as cells/m3.
The precipitation data for May to September
during 2003 to 2008 were obtained from the Weather
Bureau of Yantai. Economic data for the coast of
Sishili Bay (Table 1) were obtained from the
Communiqué of Marine Environmental Quality of
Yantai and Statistical Yearbook of Yantai (http://
www.soshoo.com/).
3. RESULT
3.1 Environmental characteristics during high
frequency red tide periods
In Sishili Bay during May to September (the
period of high frequency red tides), water temperature
ranged from 12.28°C (May 8, 2006) to 27.07°C
(Aug. 23, 2007), while the annual averages ranged
from 21.07°C (2003) to 22.36°C (2007) (Fig.2a).
The highest water temperatures (25.22�27.07°C)
were observed in August (Fig.2a). The monthly pH
of Sishili Bay did not change greatly, ranging from
7.88 to 8.36 during 2003 to 2008 (Fig.2b). The
salinity decreased linearly from 32.22 (2003) to
30.80 (2008), with the highest values being observed
in May and the lowest being observed in August or
September (Fig.2c). The annual mean precipitation
in Yantai increased linearly from 98.36 mm (2003)
to 168.58 mm (2008), with the highest values being
observed in July and August (Fig.2d).
The temporal changes in dissolved oxygen (DO)
and chemical oxygen demand (COD) in Sishili
Bay were as uniform as the precipitation in Yantai
from 2003 to 2008 (Fig.2e, f). The annual mean
values of DO increased linearly from 7.72 mg/L
(2003) to 9.33 mg/L (2008), while the annual mean
values of COD increased from 0.95 mg/L (2003) to
1.39 mg/L (2008), with the highest value (1.59 mg/L)
being observed in 2007. Based on the COD values,
the sea water in Sishili Bay was within the First
Class of National Seawater Quality Standards for
China (≤2.00 mg/L, GB3097-1997).
The concentrations of TIN, PO4-P and SiO3-Si
changed every month and every year (Table 2,
Fig.3). NO3-N, NO2-N, and NH4-N accounted on an
average for 77.63%, 5.41%, and 16.96% of the TIN,
Table 1 Economic status of main areas along Sishili Bay coast during 2002�2007
Year
Yantai City Zhifu, Laishan and Muping Districts
Municipal Sewage
(10K** tons)
Total output values
(10K Yuan)
Per capita GDP*
(10K Yuan)
Population
(10K people)
Cultured animals
(10K tons)
Cultured plants
(10K tons)
Industrial
wastewater
(10K tons)
2002 11 367 11 150 000 1.71 130.50 10.00 0.47 2 045
2003 11 955 13 160 000 � 132.39 � � �
2004 12 269 16 310 200 2.51 � 10.93 0.43 1068.57
2005 12 470 20 124 609 3.09 136.06 10.72 0.52 819.19
2006 12 649 24 057 483 3.46 137.66 10.62 0.41 912.64
2007 14 445 28 799 576 4.13 137.82 9.75 0.51 1 012.29
Mean annual
increase
5.01% 20.92% 19.43% 1.03% -1.61% 5.06% -6.22%
* Per capita GDP indicates per capita Gross Domestic Product
** �K� means �one thousand�

No.3 667HAO et al.: Nutrients, chl-a and red tide in Sishili Bay
respectively. The annual mean TIN, SiO3-Si, molar
N/P and Si/P increased linearly from 2003 to
2008 (Fig.3a, c, d, & e); however, no changes in
the annual mean PO4-P were observed (Fig.3b). The
atomic N/P ratios were usually higher than the
Redfield Ratio of 16 (Table 2). The PO4-P value
showed that the nutrient level was within the First
Class of National Seawater Quality Standards for
China, and that the TIN was also within the First
Class of National Seawater Quality Standards for
China, except for 2008, when it was within the
Second Class (Table 2).
The mean TIN, PO4-P and COD of the
2003�2008 values were high along the coast,
especially near the estuary of Guangdang River and
the outlet of the Xin�anhe Sewage Plant (Fig.4).
3.2 Biological parameters during high frequency
red tide periods
Diatoms were the dominant phytoplankton in
Sishili Bay, and the community structure of the
species was relatively invariant from 2003 to 2008
(Table 3) during periods of high frequency red tides.
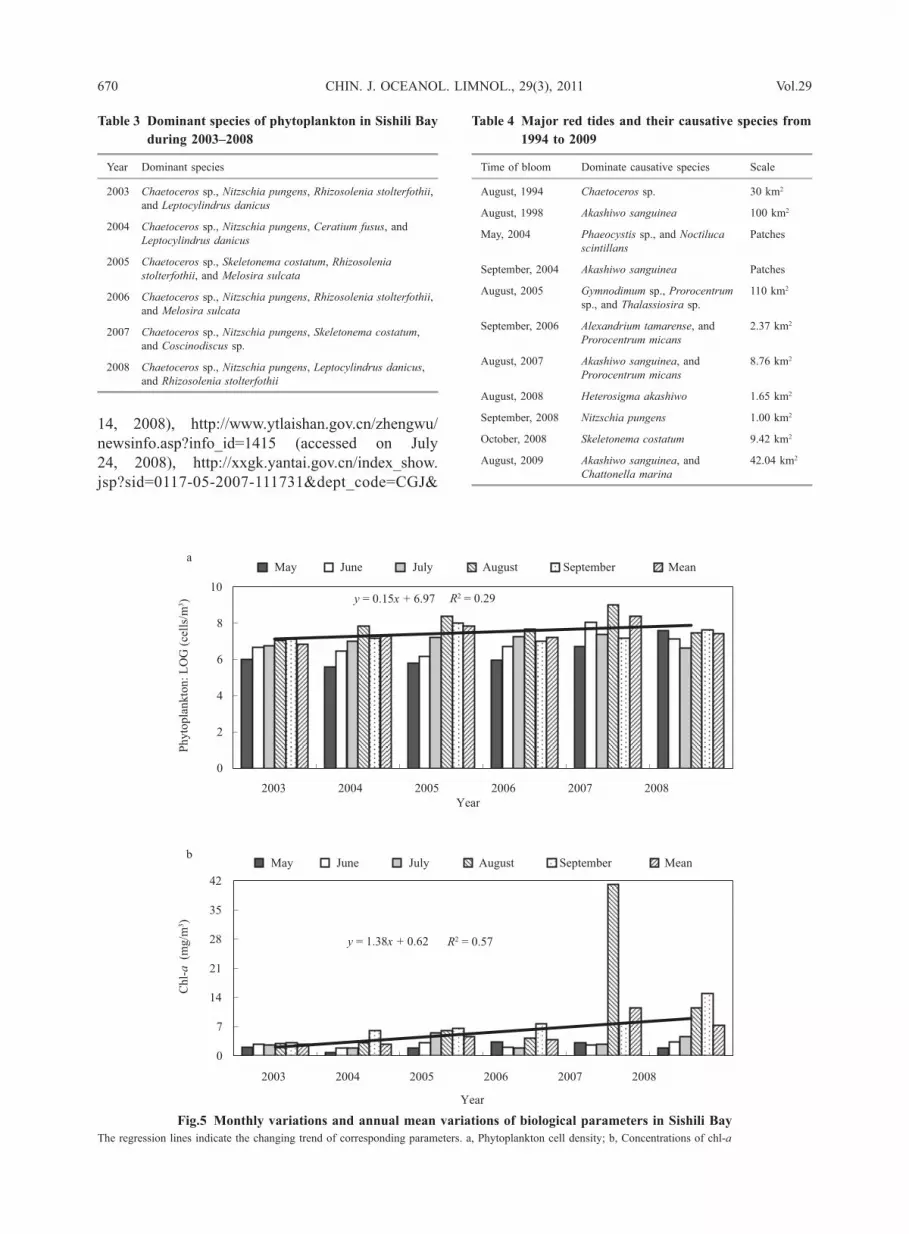
The phytoplankton cell density was usually high in
August (Fig.5a), and a high chl-a usually appeared
in September. A sharp peak in chl-a was observed in
August 2007 (Fig.5b) when a red tide occurred.
The annual mean phytoplankton cell density
increased slightly during 2003�2008 (Table 2,
Fig.5a), while the annual mean concentration of
chl-a linearly increased with a regression coefficient
of R2 = 0.57 (Table 2, Fig.5b). The mean concentration
of chl-a during the period of high frequency red
tides from 2003 to 2008 was highest along the
coast near the outlet of the Xin�anhe Sewage Plant
(Fig.5).
3.3 Red tides during 2004 to 2009
Red tides occur along the shore in Sishili Bay
almost every year, and they have occurred with
increasing frequency in recent years. Indeed, nine
red tides have been observed from 2004 to 2009
(Table 4).
From August 26 to September 7 in 2007, a red
tide caused by Akashiwo sanguinea and Prorocentrum
micans occurred along the shore from the Guangdang
River bayou to Yangma Island. During the temporal
process of this red tide, the respective values of TIN,
PO4-P, SiO3-Si and COD in the surface layer of
water increased from 3.54 μmol/L, 0.10 μmol/L,
Fig.2 Variations in monthly mean and annual mean of environmental parameters in Sishili Bay
Regression lines showing the changing trend of corresponding parameters. a: water temperature; b: pH; c: salinity; d: precipitation in Yantai City;
e: concentrations of DO; f, concentrations of COD
a
2003 2004 2005 2006 2007 2008Year
Wat
er t
emp
erat
ure
(°C
)
12
16
20
24
28b
7.6
7.8
8
8.2
8.4
2003 2004 2005 2006 2007 2008Year
pH
c
y = -0.28x + 32.38R2 = 0.95
2003 2004 2005 2006 2007 200829
30
31
32
33
Year
Sal
init
y
d
y = 14.79x + 64.52R2 = 0.49
2003 2004 2005 2006 2007 20080
100
200
300
400
Year
Pre
cip
itat
ion
(m
m)
e
y = 0.35x + 7.36R2 = 0.92
6
7
8
9
10
11
2003 2004 2005 2006 2007 2008Year
DO
(m
g/L
)
May June July August September Mean f
y = 0.01x + 0.92R2= 0.74
0
0.5
1
1.5
2
2003 2004 2005 2006 2007 2008
Year
May June July August September Mean
May June July August September Mean May June July August September Mean
May June July August September Mean
May June July August September Mean
CD
O (
mg
/L)

668 Vol.29CHIN. J. OCEANOL. LIMNOL., 29(3), 2011
Fig.3 Variation in monthly and annual mean values of nutrients
Regression lines show the changing trend of corresponding parameters, the arrows indicate the especially high or low value in August 2007 when there
was a red ride. a, TIN; b, PO4-P; c, SiO3-Si (no data available for May 2003, May 2004, or 2005); d, Molar N/P ratio; e, Molar Si/P ratio (no data available
for May 2003, May 2004, or 2005)
a
y=1.93x+2.87 R2=0.60
0
8
16
24
32
2003 2004 2005 2006 2007 2008Year
TIN
(µ
mol/
L)
May June July August September Mean
b
0
0.2
0.4
0.6
0.8
1
1.2
2003 2004 2005 2006 2007 2008Year
PO
4-P
(µ
mol/
L)
May June July August September Mean
c
y=2.17x−0.52 R2=0.79
0
5
10
15
20
25
2003 2004 2005 2006 2007 2008Year
SiO
3-S
i (µ
mo
l/L
)
May June July August September Mean
d
y=11.60x+3.39 R2=0.33
0
70
140
210
2003 2004 2005 2006 2007 2008Year
Mola
r N
/P
May June July August September Mean
May June July August September Mean
0
50
100
150
2003 2004 2005 2006 2007 2008Year
Mo
lar
Si/
P
e
200
250
y=9.47x−8.23 R2=0.88

No.3 669HAO et al.: Nutrients, chl-a and red tide in Sishili Bay
7.06 μmol/L and 1.89 mg/L on August 23 to
51.50 μmol/L, 2.34 μmol/L, 25.47 μmol/L and
4.12 mg/L on August 30, and then decreased to
7.57 μmol/L, 0.067 μmol/L, 6.74 μmol/L and
1.69 mg/L on September 13 when the red tide
disappeared (Fig.7). The temporal change in chl-a
concentration and cell density of phytoplankton
showed the same trends as nutrients, while the
salinity showed an opposite changing trend (Fig.7).
4. DISCUSSION
4.1 Ecological status during red tides periods
In Sishili Bay, the highest nutrients and COD and
lowest salinities were always observed together with
the highest precipitation and water temperature. In
addition, high concentrations of nutrients and COD
were observed along the coast. The high nutrient
concentrations coincident with rainy months indicate
that high levels of nutrients and COD were loaded
from terrestrial sources during the rainy season.
The ecosystem of Sishili Bay is influenced by
frequent human activities and land-based pollution,
including domestic sewage and industrial wastewater
(Table 1). As a half-closed bay, there is no major
freshwater input to the Sishili Bay. Additionally, the
only river draining into the bay (Guangdang River)
was dammed in March, 2005, although it was not
completely controlled until 2008 (http://news.
qq.com/a/20080714/000587.htm (accessed on July
Table 2 Annual averages of nutrients, chl-a and phytoplankton in surface water of Sishili Bay from 2003 to 2008
YearNH4-N
(μmol/L)
NO2-N
(μmol/L)
NO3-N
(μmol/L)
TIN*
(μmol/L)
PO4-P*
(μmol/L)
SiO3-Si**
(μmol/L)N/P Si/P
chl-a
(mg/m3)
Phytoplankton
(cells/m3)
2003 2.87 0.31 2 5.18 0.31 1.45 16.71 4.68 2.70 7.20×10⁶
2004 1.47 0.48 5.5 7.44 0.29 2.46 25.66 8.48 2.73 2.00×10⁷
2005 1.71 0.16 8.24 10.11 0.15 � 67.4 � 4.64 7.21×10⁷
2006 1.2 0.92 5.99 8.1 0.32 10.06 25.31 31.44 3.84 1.69×10⁷
2007 0.8 0.59 6.89 8.28 0.46 12.95 18 28.15 11.50 2.42×10⁸
2008 1.72 0.69 16.15 18.57 0.17 9.52 109.23 56 7.26 2.61×10⁷
Mean 1.63 0.52 7.46 9.61 0.28 7.29 34.32 26.04 5.44 6.40×10⁷
* Quality standards of seawater from GB3097-1997: TIN, China first class (μmol/L) ≤14.28, second class (μmol/L) ≤21.43; PO4-P, China first class
(μmol/L)≤0.483 9, second class (μmol/L) ≤0.967 7
** The data shown are the mean SiO3-Si values of June, July, August, and September
a b
c
37.60º
37.55º
37.50º
37.45º
121.35º 121.40º 121.45º 121.50º 121.55º 121.60º 121.65º
37.60º
37.55º
37.50º
37.45º
121.35º 121.40º 121.45º 121.50º 121.55º 121.60º 121.65º
121.35º 121.40º 121.45º 121.50º 121.55º 121.60º 121.65º
37.60º
37.55º
37.50º
37.45º
EE
E
N
N N
0.2450.2650.275
0.2450.2650.275
6.4
7.6
7.6
8.4
Fig.4 Spatial distributions of nutrients and
COD (�□� is the location of the estuary
of Guangdang River; �*� is the location
of the Xin�anhe Sewage Plant)
a, TIN (μmol/L); b, PO4-P (μmol/L); c, COD (mg/L)
670 Vol.29CHIN. J. OCEANOL. LIMNOL., 29(3), 2011
Table 3 Dominant species of phytoplankton in Sishili Bay
during 2003�2008
Year Dominant species
2003 Chaetoceros sp., Nitzschia pungens, Rhizosolenia stolterfothii,
and Leptocylindrus danicus
2004 Chaetoceros sp., Nitzschia pungens, Ceratium fusus, and
Leptocylindrus danicus
2005 Chaetoceros sp., Skeletonema costatum, Rhizosolenia
stolterfothii, and Melosira sulcata
2006 Chaetoceros sp., Nitzschia pungens, Rhizosolenia stolterfothii,
and Melosira sulcata
2007 Chaetoceros sp., Nitzschia pungens, Skeletonema costatum,
and Coscinodiscus sp.
2008 Chaetoceros sp., Nitzschia pungens, Leptocylindrus danicus,
and Rhizosolenia stolterfothii
Fig.5 Monthly variations and annual mean variations of biological parameters in Sishili Bay
The regression lines indicate the changing trend of corresponding parameters. a, Phytoplankton cell density; b, Concentrations of chl-a
Table 4 Major red tides and their causative species from
1994 to 2009
Time of bloom Dominate causative species Scale
August, 1994 Chaetoceros sp. 30 km2
August, 1998 Akashiwo sanguinea 100 km2
May, 2004 Phaeocystis sp., and Noctiluca
scintillans
Patches
September, 2004 Akashiwo sanguinea Patches
August, 2005 Gymnodimum sp., Prorocentrum
sp., and Thalassiosira sp.
110 km2
September, 2006 Alexandrium tamarense, and
Prorocentrum micans
2.37 km2
August, 2007 Akashiwo sanguinea, and
Prorocentrum micans
8.76 km2
August, 2008 Heterosigma akashiwo 1.65 km2
September, 2008 Nitzschia pungens 1.00 km2
October, 2008 Skeletonema costatum 9.42 km2
August, 2009 Akashiwo sanguinea, and
Chattonella marina
42.04 km2
14, 2008), http://www.ytlaishan.gov.cn/zhengwu/
newsinfo.asp?info_id=1415 (accessed on July
24, 2008), http://xxgk.yantai.gov.cn/index_show.
jsp?sid=0117-05-2007-111731&dept_code=CGJ&
b
R2 = 0.57
0
7
14
21
28
35
42
2003 2004 2005 2006 2007 2008
Year
Ch
l-a (m
g/m
3)
May June July August September Mean
a
y = 0.15x + 6.97 R2 = 0.29
0
2
4
6
8
10
2003 2004 2005 2006 2007 2008
Year
Ph
yto
pla
nk
ton
: L
OG
(ce
lls/
m3)
May June July August September Mean
y = 1.38x + 0.62

No.3 671HAO et al.: Nutrients, chl-a and red tide in Sishili Bay
columncode=CGJXXGKMLNJ (accessed on July 3,
2008), in Chinese). However, large volumes of local
sewage run into the coastal zone of Sishili Bay
through the channel of Guangdang River during
raining days. As a result, high nutrient and COD
concentrations are still found near its estuary, even
though the river has been dammed.
In most marine environments, nitrogen appears
to be the limiting factor of primary production;
accordingly, the concentration of TIN, PO4-P and
molar N/P ratio can control the pattern and function
of the ecosystem of a bay, as well as alter the
structure, production, and biomass of phytoplankton
(Balode et al., 1998; Lenton and Watso, 2000;
Leonardos and Geider, 2004; McQuatters-Gollop
et al., 2007). However, more N than P entered Sishili
Bay from terrestrial sources during rainfall events,
as indicated by the increasing trend of TIN
concentrations during precipitation. The molar
N/P ratios were much higher than 16/1 in Sishili
Bay, suggesting a comparative N-abundance and
P-limitation status (Redfield, 1958).
Phytoplankton biomass and chl-a are usually
controlled by nutrient loading (Lenhart et al., 1997;
Cadee and Hegeman, 2002; Vermaat et al., 2008). In
Sishili Bay, high chl-a concentration zones were
distributed along the coast and the outfalls coincident
with high nutrient concentrations. The changing
trend of chl-a, nutrients and precipitation were also
coincident, indicating that the chl-a concentration
was influenced by nutrient loading from terrestrial
sources during rainfall.
However, phytoplankton blooms can be influenced
by other factors in addition to nutrient concentrations,
such as sea surface temperature (McQuatters-Gollop
et al., 2007; Loebl et al., 2008). In Sishili Bay, the
changing trend of chl-a lagged behind that of water
temperature by one month, except in 2007, showing
that high water temperature tends to increase the
concentration of chl-a. High water temperature may
favor algal growth in Sishili Bay.
Aquaculture and nutrients input can also influence
phytoplankton (Cadee and Hegeman, 2002; Philippart
et al., 2007); for example, cultured scallops can
strongly reduce chl-a concentrations (Dame et al.,
1991; Phelps, 1994; Kohata et al., 2003). As one of
the most intensive culture areas in China, Sishili Bay
is influenced by cultured organisms, such as scallops
and kelp (Zhang et al., 2001; Cadee and Hegeman,
2002; Zhou et al., 2002b). Cultured scallops can
remove up to 45% of the suspended matter from the
water column every day, which would benefit the N
and P flux (Zhou et al., 2002b, 2006). Therefore, the
temporal change of nutrients in Sishili Bay is also
influenced by cultivated organisms.
4.2 Red tides associated with nutrients
It has been suggested that scallop aquaculture in
Sishili Bay with high anthropogenic nutrient loadings
would be ecologically advantageous (Zhou et al.,
2006), but eutrophication might be a result of urban
Fig.7 Temporal variations of water parameters during the red tide in 2007
Fig.6 Spatial distributions of chl-a concentration (mg/m3)
�□�is the location of the estuary of Guangdang River; �*� is the location
of the Xin�anhe Sewage Plant
37.60°
37.55°
37.50°
37.45°
121.35° 121.45° 121.55° 121.65°
N
E
3
3
3.4
3.4
3.8 4.6
0
10
20
30
40
50
60
70
Aug. 23 Aug. 30 Sept. 2 Sept. 13
DIN
, S
iO3-S
i, s
alin
ity
, o
r
Ch
l-a
0
2
4
6
8
10
Ph
yto
pla
nk
ton
: L
og
(ce
lls/
m3),
PO
4-P
, o
r C
OD
DIN (µmol/L)
Salinity
Chl-a (mg/m3)
SiO3-Si (µmol/L)
phytoplankton:
LOG (cells/m3)
COD (mg/L)
PO4-P (µmol/L)

672 Vol.29CHIN. J. OCEANOL. LIMNOL., 29(3), 2011
effluent and agricultural runoff to Sishili Bay. Indeed,
the annual N and P inputs into the bay are estimated
at 1910 and 150 tons, respectively (Wu et al.,
2001).
Phytoplankton blooms are usually associated
with eutrophication (Riegman et al., 1992; Johnsen
and Sakshaug, 2000; Graneli et al., 2008). Algal
species that can compete successfully for available
growth-limiting nutrient(s) have the potential to
become dominant and form blooms (Graneli et al.,
2008). In Sishili Bay, red tides only occur under
certain circumstances, such as good weather
immediately after rainfall, abundant nutrition, and a
suitable N/P ratio. P-limitation has a greater effect
on eutrophication than N-limitation in Sishili Bay
(Ji, 1994; Wu et al., 2001; Ye et al., 2006; Liang
et al., 2007). For example, in August 1998 and
May 2004, the N/P ratio in Sishili Bay was 10 and
3.4 when algal blooms occurred (Ye et al., 2006).
Conversely, in August 2007, there were remarkably
low atomic N/P and Si/P ratios even though there
was abundant precipitation and a high influx of
N and Si nutrients into the bay. These low ratios
were attributed to the very high concentration of
PO4-P that was observed.
In August 2007, there was heavy rainfall in Yantai
of over 200 mm before the occurrence of the red
tide, which resulted in formation of a mass of sewage
water that exceeded the managing capability of the
Xin�anhe Sewage Plant. As a result, sewage entered
the bay directly with rainwater. This influx of sewage
coupled with the weak water body exchange in
Sishili Bay prevented the contamination from being
diluted and diffused to the open sea in time, resulting
in local eutrophication. In addition, the high water
temperature in Sishili Bay likely stimulates the
growth of phytoplankton. During the periods before
and after the red tide (before Aug. 25, and after Sept.
8) in 2007, the chl-a concentration and phytoplankton
abundance were at normal levels that were coincident
with the low concentrations of TIN, PO4-P, SiO3-Si,
and COD. The nutrient concentrations returned to
normal levels when the bloom ended because the
nutrients were consumed by the algae.
5. CONCLUSION
In Sishili Bay, the highest nutrient concentrations,
chl-a concentration, and phytoplankton cell density
were coincident with the highest water temperature
and the maximum precipitation in August. The molar
N/P ratios showed comparative P-limitation in Sishili
Bay during the periods of high frequency red tides.
Both high concentrations of nutrients and chl-a
presented along the coast of Sishili Bay, indicating
that the high nutrient loadings were from terrestrial
resources and entered the bay in response to rainfall
runoff.
Red tides coincided with the sharp increase in
nutrient concentrations, especially PO4-P in Sishili
Bay. Suitable high water temperature and precipitation
appeared to be the original cause of the red tides.
Therefore, greater efforts should be made to reduce
sewage discharges into Sishili Bay during rainfall
periods, especially during the period of high
frequency red tides.
References
Anderson D M. 1994. Red tides. Scientific American, 271:
62-68.
Anderson D M. 1995. Toxic red tides and harmful algal
blooms: A practical challenge in coastal oceanography.
Reviews of Geophysics, 33: 1 189-1 200.
Balode M, Purina I, Bechemin C, Maestrini S Y. 1998. Effect
of nutrient enrichment on the growth rates and
community structures of summer phytoplankton from
the Gulf of Riga, Baltic Sea. Journal of Plankton
Research, 20: 2 251-2 272.
Cadee G C, Hegeman J. 2002. Phytoplankton in the Marsdiep
at the end of the 20th century: 30 years monitoring
biomass, primary production, and Phaeocystis blooms.
Journal of Sea Research, 48: 97-110.
Dame R F, Dankers N, Prins T C, Jongsma H, Smaal A.
1991. The influence of mussel bed on nutrients in the
western Wadden Sea and eastern Scheldt estuaries.
Estuaries, 142: 130-138.
Graneli E, Weberg M, Salomon P S. 2008. Harmful algal
blooms of allelopathic microalgal species: The role of
eutrophication. Harmful Alga, 8: 94-102.
Ji L. 1994. Analysis of the causation if red tide in Sishili
Bay of Muping. Marine Information, 12: 18-19. (in
Chinese)
Johnsen G, Sakshaug E. 2000. Monitoring of harmful algal
blooms along the Norwegian coast using bio-optical
methods. South African Journal of Marine Science, 22:
309-321.
Kohata K, Hiwatari T, Hagiwara T. 2003. Natural
water-purification system observed in a shallow coastal
lagoon: Matsukawa-ura, Japan. Marine Pollution
Bulletin, 47: 148-154.
Lenhart H J, Radach G, Ruardij P. 1997. The effects of river
input on the ecosystem dynamics in the continental
coastal zone of the North Sea using ERSEM. Journal of
Sea Research, 38: 249-274.
Lenton T M, Watso A J. 2000. Redfield revisited 1. Regulation
of nitrate, phosphate, and oxygen in the ocean�, Global
Biogeochemical Cycles, 14: 225-248.
Leonardos N, Geider J R. 2004. Responses of elemental and
biochemical composition of Chaetoceros muelleri to
growth under varying light and nitrate: phosphate supply
ratios and their influence on critical N:P. Limnology and
Oceanography, 49: 2 105-2 114.

No.3 673HAO et al.: Nutrients, chl-a and red tide in Sishili Bay
Liang A P, Zhang T, Liu W. 2007. Red tide forcasting method
for Yantai Sishili Bay waters. Journal of Yantai
University (Natural Science and Engineering Edition),
20: 304-308. (in Chinese with English abstract)
Loebl M, Colijn F, Beusekom J E E. 2008. Increasing nitrogen
limitation during summer in the List Tidal Basin
(Northern Wadden Sea). Helgoland Marine Research,
62: 59-65.
McQuatters-Gollop A, Raitsos D E, Attrill M, Edwards M,
Lavender S, Mee L. 2007. A new long-term chlorophyll
dataset reveals a regime shift in North Sea phytoplankton
biomass unconnected to nutrient levels. Limnology and
Oceanography, 52: 635-648.
Phelps H L. 1994. The Asiatic clam (Corbicula fluminea)
invasion and system-level ecological change in the
Potomac River Estuary near Washington DC. Estuaries,
17: 614-621.
Philippart C J M, Beukema J J, Cadee G C, Dekker R,
Goedhart P W, Iperen J M, Leopold M F, Herman P M
J. 2007. Impacts of nutrient reduction on coastal
communities. Ecosystems, 10: 95-118.
Poder T, Maestrini S Y, Balode M, Lips U, Bechemin C,
Andrushaitis A, Purina I. 2003. The role of inorganic
and organic nutrients on the development of
phytoplankton along a transect from the Daugava River
mouth to the Open Baltic, in spring and summer 1999.
Ices Journal of Marine Science, 60: 827-835.
Redfield A C. 1958. The biological control of chemical
factors in the environment. Scientific American
Magazine, 46: 205-222.
Riegman R, Noordeloos A A M, Cadee G C. 1992. Phaeocystis
blooms and eutrophication of the continental coastal
zones of the North-Sea. Marine Biology, 112: 479-484.
Sarkar R R, Pal S, Chattopadhyay J. 2005. Role of two toxin-
producing plankton and their effect on phytoplankton-
zooplankton system � A mathematical study supported
by experimental findings. Biosystems, 80: 11-23.
Shan Z X, Zheng Z H, Xing H Y, Liu Y H, Jin Y, Liu X B.
2001. Monitoring and Aanalysis to the environment of
culture waters of Sishili Bay. Shandong Fisheries, 18:
37-40. (in Chinese with English abstract)
SOC. 1998. The Criterion of Marine Monitoring. State
Oceanic China. Ocean Press, Beijing. (in Chinese)
Tang D L, Kawamura H, Dien T V, Lee M A. 2004. Offshore
phytoplankton biomass increase and its oceanographic
causes in the South China Sea. Marine Ecological
Progress Series, 268: 31-41.
Tang D L, Di B P, Wei G, Ni I H, Oh I S, Wang S F. 2006.
Spatial, seasonal and species variations of harmful algal
blooms in the South Yellow Sea and East China Sea.
Hydrobiologia, doi: 10.1007/s10750-006-0108-1. 568:
243-253.
Turner R E, Rabalais N N. 1994. Coastal eutrophication near
the Mississippi River delta. Nature, 368: 619-621.
Utermohl H. 1958. Toward the improvement of the quantitative
phytoplankton method. Mitteilungen-Internationale
Vereiningung fur Limnologie, 9: 1-38.
Vermaat J E, McQuatters-Gollop A, Eleveld M A, Gilbert A
J. 2008. Past, present and future nutrient loads of the
North Sea: Causes and consequences. Estuarine, Coastal
and Shelf Science, 80: 53-59.
Wang S F, Tang D L, He F L, Yasuwo F, Rhodora A. 2008.
Occurrences of harmful algal blooms (HABs) associated
with ocean environments in the South China Sea.
Hydrobiologia, 596: 79-93.
Wang X E, Xu Z F, Zhou X J. 1995. Benthic animal survey
in Yantai inshores. Chinese Journal of Ecology, 14: 6-
10. (in Chinese with English abstract)
Wei G F, Tang D L, Wang S F. 2008. Distribution of
Chlorophyll and Harmful Algal Blooms (HABs): A
review on space based studies in the coastal environments
of Chinese marginal seas. Advances in Space Research,
41: 12-19.
Wu Y L, Zhou C X, Zhang Y S, Pu X M, Li W H. 2001.
Evolution and causes of formation of Gymnodimum
sanguineum bloom in Yantai Sishili Bay. Oceanologia et
Limnologia Sinica, 32: 159-167. (in Chinese with
English abstract)
Yang H S, Zhang T, Wang J. 1999. Growth characteristics of
Chlamys farreri and its relation with environmental
factors in intensive suspended-culture areas of Sishiliwan
Bay, Yantai. Jounal of Shellfish Research, 18: 71-76.
Ye M J, Sun H C, Gao H D, Lin Y, Qu G L. 2006. Production
and feature of nutrition at Sishili Bay in Yantai and its
analysis. Environmental Monitoring in China, 22: 88-
91. (in Chinese with English abstract)
Yu J, Tang D L, Oh I S, Yao L J. 2007a. Response of harmful
algal blooms to environmental changes in Daya Bay,
China. Terrestrial, Atmospheric and Oceanic Sciences,
18: 1 011-1 027.
Yu J, Tang D L, Wang S F, Lian J S, Wang Y S. 2007b.
Changes of water temperature and harmful algal bloom
in Daya Bay in the northern South China Sea. Marine
Science Bulletin, 9: 26-33.
Zhang T, Yang H S, Wang P, He Y C, Zhang F S. 2001. The
factors affecting meat condition and growth rate of
Farreri�s scallop Chlamys (Azumapecten) farreri in
Sishiliwan Bay, Yantai. Marine Fisheries Research, 22:
25-31.
Zhao W H, Jiao N Z, Zhao Z X. 2000a. Distribution and
variation of nutrients in the Yantai Sishili Bay cultivated
water. Marine Sciences, 24: 31-34. (in Chinese with
English abstract)
Zhao W H, Jiao N Z, Zhao Z X. 2000b. Forms of nitrogen
in the Yantai Sishili Bay cultivated water. Oceanologia
et Limnologia Sinica, 31: 53-59. (in Chinese with
English abstract)
Zhou M J, Zhu M Y, Zhang J. 2001. Status of harmful algal
blooms and related research activities in China. Chinese
Bulletin of Life Science, 13: 54-59. (in Chinese with
English abstract)
Zhou Y, Yang H S, He Y C, Zhang F S. 2002a. Nitrogen and
phosphorus excretion and its ecological effect by several
bivalves and fouling animals. Oceanologia et Limnologia
Sinica, 33: 424-431. (in Chinese with English abstract)
Zhou Y, Yang H S, Zhang F S. 2002b. Physio-ecological
characteristics of scallop Chlamy farreri measured by
biodeposition method in situ: scope for growth and C,
N and P budgets. Journal of Fishery Sciences of China,
9: 161-166. (in Chinese with English abstract)
Zhou Y, Yang H S, Liu S L, Yuan X, MaoY Z, Liu Y, Xu X,
Zhang F S. 2006. Feeding and growth on bivalve
biodeposits by the deposit feeder Stichopus japonicus
Selenka (Echinodennata : Holothuroidea) co-cultured in
lantern nets. Aquaculture, 256: 510-520.
Copyright © 2022 FDOKUMEN