![Turning Back [updated 6.5.2015]](https://static.fdokumen.com/doc/165x107/6335f35102a8c1a4ec01fd86/turning-back-updated-652015.jpg)
Small Scale Industrialization under Globalization: Is the Tide Turning Around?
26
23 M.H. BALA SUBRAHMANYA Small-scale Industrialisation under Globalisation Is the Tide Turning Around? Introduction Small-scale industries (hereafter SSI) play a significant role in the economic development of nations (Deo, 2013). However, the role that SSI plays in both developed and developing economies has been undergoing remarkable transformation since the early 1990s. is is primarily due to the intensification of globalisation—the opportunities as well as the challenges emerging out of it, specific to SSI (Ibid.). Empirical evidence reveals that globalisation has impacted small and medium enterprises (SMEs) in different economies differently (Smeral, 1998; Acs et al., 2001; Asiedu and Freeman, 2007; Abdullah et al., 2009; Vladimirov et al ., 2013). But the competitiveness of SMEs of least developed countries (LDCs), which may not have adequate capabilities to handle challenges, might deteriorate relatively as well as absolutely (Awuah and Amal, 2011). SSI development has been one of the major planks of India’s economic development strategy since Independence. An exclusive institutional framework and a host of policies and programmes had emerged for the protection and promotion of SSI since then (Bala Subrahmanya, 1998). As a result, SSI contribution to employment, industrial production and total exports grew considerably over the period. By 1990, SSI accounted for 35 per cent of the gross value of output in the manufacturing sector and over 40 per cent of the total exports from the country, apart from providing employment to around 12 million people (Ministry of Industry, 1991). . . . . . . . . . . . . . . . . . . . . . . . . . . . . . . . . . . . . . . . . . . . . . . . . . . . . . . . . . . . . . . . .
Transcript of Small Scale Industrialization under Globalization: Is the Tide Turning Around?

23M . H . B a l a S u B r a H M a n y a
Small-scale Industrialisation under Globalisation
Is the Tide Turning Around?
Introduction
Small-scale industries (hereafter SSI) play a significant role in the economic development of nations (Deo, 2013). However, the role that SSI plays in both developed and developing economies has been undergoing remarkable transformation since the early 1990s. This is primarily due to the intensification of globalisation—the opportunities as well as the challenges emerging out of it, specific to SSI (Ibid.). Empirical evidence reveals that globalisation has impacted small and medium enterprises (SMEs) in different economies differently (Smeral, 1998; acs et al., 2001; asiedu and Freeman, 2007; abdullah et al., 2009; Vladimirov et al., 2013). But the competitiveness of SMEs of least developed countries (lDCs), which may not have adequate capabilities to handle challenges, might deteriorate relatively as well as absolutely (awuah and amal, 2011).
SSI development has been one of the major planks of India’s economic development strategy since Independence. an exclusive institutional framework and a host of policies and programmes had emerged for the protection and promotion of SSI since then (Bala Subrahmanya, 1998). as a result, SSI contribution to employment, industrial production and total exports grew considerably over the period. By 1990, SSI accounted for 35 per cent of the gross value of output in the manufacturing sector and over 40 per cent of the total exports from the country, apart from providing employment to around 12 million people (Ministry of Industry, 1991).
. . . . . . . . . . . . . . . . . . . . . . . . . . . . . . . . . . . . . . . . . . . . . . . . . . . . . . . . . . . . . . . .

546 . . . . . . . . . . . . . . . . . . . . . . . . . . . . . . . . . . . . . . . . . . . . . . . . . . . . . . . . . . . . . . . . . . IndIan Economy SIncE IndEpEndEncE • Um a K apIl a (Ed.)
However, with the beginning of 1990s, the policy environment for SSI has undergone dramatic changes due to national macroeconomic policy reforms covering that of SSI, coinciding with that of international policies. as a result, there were indicators to argue that SSI performance has suffered initially, in the 1990s (Bala Subrahmanya, 2004). Since then, both policies and competitive environment for SSI have changed further. against this backdrop, this paper attempts to examine the following three sets of research questions (rQs):
rQ1: What are the major policy changes that have occurred, nationally as well as internationally, which have implications for SSI performance? What kind of an impact they have made on the SSI so far?
rQ2: How has Indian SSI responded to these policy changes and performed since 1991? How far the SSI has been able to cope with the emerging challenges and exploit the growing global opportunities?
rQ3: What are the current policy focus and its implications for SSI? How far will it enable the sector to overcome its challenges and enhance its competitiveness in the future?
In this paper, official definitions of an SSI unit pursued from time to time by the Government of India (GoI) under the Industries Development & regulation (IDr) act, 1951 (till Micro, Small and Medium Enterprises (MSME) Development act, 2006, was enacted) are followed. Prior to 2006 an SSI unit was defined as one having original investment in plant and machinery, whether held on ownership terms or on lease/hire purchase basis, not exceeding ` 100 million (Ministry of SSI, 2006).
Globalisation and Domestic Economic Reforms: Implications and Impact on the SSI
Since the beginning of 1990s, policy changes have been taking place at three different levels—global, national and sectoral, which have implications for SSI functioning and performance in India. The first and the foremost development is the ‘globalisation’ process at the international level. Globalisation refers to the worldwide phenomenon of technological, economic, political, and cultural exchanges among nations, organisations and private individuals. These exchanges, which have led to interdependencies at all levels (national, firm and private individual levels), are complex and multifaceted (Fischer, 2003).

547Sm all Sc ale InduStr IalI Sat Ion under .. . • m.H. B al a SuBr aHm anya
. . . . . . . . . . . . . . . . . . . . . . . . . . . . . . . . . . . . . . . . . . . . . . . . . . . . . . . . . . . . . . . . . .
Since the early 1990s, we are moving away from a world where national economies were relatively self-contained entities, isolated from each other by barriers to cross-border trade and investment towards a world where barriers to cross-border trade and investment are tumbling, and perceived distance is shrinking due to advances in transportation and telecommunications technology. Globalisation has resulted in the integration of economies and has prompted a rapid increase in the movement of products, capital and labour across borders (abdullah et al., 2009). Globalisation allows firms to sell their products and services to consumers beyond the borders of their country of origin. Globalisation is literally removing the boundaries to potential customers in a worldwide market.
But the question is what drives the globalisation of business? Three forces drive this globalisation of business (acs et al., 2001). The first is the explosive growth in low-cost technology connecting people and locations. Better information processing and communications technology creates a greater awareness of international economic opportunities. It also lets firms divide their production processes more and spread it over a wider geographical region, beyond the national borders. a second driving force behind the globalisation of business is the steady dismantling of the trade barriers the world erected just before and during the Great Depression of the 1930s. a third force motivating the globalisation of business is the widespread economic restructuring and liberalisation that followed the fall of socialism in russia and Eastern Europe.
International trade and foreign direct investment (FDI) are two important aspects of globalisation (asiedu and Freeman, 2007). reduced trade barriers can affect SSI in the international market as well as in the domestic market in two different ways. a steady increase in world exports can pose new challenges to some SSI, while creating new opportunities for some others (particularly, the innovative ones) in the international market (acs et al., 2001). Similarly, a steady increase in domestic imports (particularly raw materials and intermediates) can generate more competition to some SSI, while enabling access to new technologies (capital goods) to the local SSI and thereby contribute to the building of their competitiveness.
The formation of World Trade Organization (WTO) in 1995 accelerated the process of scaling down trade barriers through a steady

548 . . . . . . . . . . . . . . . . . . . . . . . . . . . . . . . . . . . . . . . . . . . . . . . . . . . . . . . . . . . . . . . . . . IndIan Economy SIncE IndEpEndEncE • Um a K apIl a (Ed.)
reduction of tariff and non-tariff restrictions on imports. India, as a member of the WTO substantially reduced its quantitative and non-quantitative restrictions by 1 april 2001 (Ministry of Finance, 2002). This would have made Indian industry, particularly SSI, to face much stronger international competition (Planning Commission, 2002). The process of removal of quantitative and non-quantitative restrictions across countries had led to freer movement of goods between countries including India. as a result, world exports grew in constant dollar terms at an average rate of 4.58 per cent during 1990-2005 as against the average rate of 2.97 per cent during 1975-1990 (Ministry of Finance, 2007). The reduction of restrictions on the movement of goods between countries and the subsequent increase in world exports would have benefited multinational corporations (MnCs) more than SSI.
The other dimension of trade is domestic imports, which can be broadly classified under (i) raw materials & intermediates, and (ii) capital goods. India’s import of raw materials and intermediates [excluding petroleum, oil and lubricants (POl)] grew (in constant dollar terms) by 9.39 per cent per annum during 1990-2005 as compared to 2.20 per cent per annum during 1970-1990, whereas the import of capital goods increased (in constant dollar terms) by 6.84 per cent per annum during 1990-2005 as compared to 6.06 per cent per annum during 1970-1990 (Ibid.). an increase in the former would have posed more competition, whereas an increase in the latter might have proved beneficial to the SSI in the domestic market.
While import liberalisation would have contributed to the growth of both kinds of imports, it was the phasing out of Phased Manufacturing Program (PMP) in the 1990s (Bala Subrahmanya, 2009), which would have specially encouraged both domestic large firms and newly entered MnCs to import both raw materials and intermediate goods rather than procure them from the domestic-market-based SSI. Perhaps, this would explain why the import of raw materials & intermediates grew faster than that of capital goods. But the liberalisation of capital goods imports would have benefited SSI as much as large firms by enabling them to acquire sophisticated technologies from abroad. In fact, there has been a significant shift away from Indian made technologies towards foreign made technologies in the machinery industry of Bangalore, in the era of liberalisation (Bala Subrahmanya et al., 2014).
In economic terms, FDI is probably the most important and possibly the most visible aspect of globalisation in many regions (Deo, 2013).
549Sm all Sc ale InduStr IalI Sat Ion under .. . • m.H. B al a SuBr aHm anya
. . . . . . . . . . . . . . . . . . . . . . . . . . . . . . . . . . . . . . . . . . . . . . . . . . . . . . . . . . . . . . . . . .
Since 1991 till 2006, on an average, 68 countries across the world have introduced more than 100 favourable regulatory changes to FDI (unCTaD, 2006). as a result, global FDI inflow increased initially marginally from 21.7 per cent per annum during 1986-1990 to 22.0 per cent per annum during 1990-1995 and considerably to 40.0 per cent per annum during 1995-2000. Global FDI inflows grew by 31.60 per cent in 2004 and by 27.40 per cent in 2005 (Ibid.). The sectoral and industrial pattern of global FDI inflows reveals that it has been shifting towards services accompanied by a decline in the share of FDI in natural resources and manufacturing. The services sector, which accounted for about 2/5 of the total FDI inflows in the late 1980s, accounted for about 3/5 of the total by the late 1990s and after. The shift towards services is more pronounced in the case of developing and transition economies (Ibid.).
The global upswing in FDI inflows has been experienced by Indian economy as well: the FDI inflow to India increased (in constant uS dollars) by 31.94 per cent per annum during 1991-2005 (nCaEr, 2009). Further, the shift in FDI inflows towards services sector has been observed, though not to the same extent, in the Indian context as well: while manufacturing industry accounted for a majority of the FDI inflows in the 1990s, its share declined to about 41 per cent by 2005 (nCaEr, 2009; rao and Dhar, 2011). Whereas the share of services sector (including financial services, consultancy, housing and real estate, construction, hotel and tourism, etc.) increased from less than 20 per cent in the 1990s to about 40 per cent of the total FDI inflows during 2000-2009. What is more significant is that FDI in manufacturing sectors has penetrated not only metro cities but also small cities, thus generating linkages with suburban and rural regions of India (nCaEr, 2009).
Globally, FDI has the potential for negative displacement/competition effects as well as positive knowledge spill over and linkage effects on the survival of new business start-ups and existing small firms (Deo, 2013). There are at least three channels through which FDI can affect the performance of domestic firms: competition, labour market and linkages (asiedu and Freeman, 2007). The product market competition from MnCs might affect local firms but, at the same time, the ‘learning by competition’ analogy applies: the pressure to survive may speed up the adoption of new technologies and thereby enhance the productivity of domestic firms. This is substantiated by the experience
550 . . . . . . . . . . . . . . . . . . . . . . . . . . . . . . . . . . . . . . . . . . . . . . . . . . . . . . . . . . . . . . . . . . IndIan Economy SIncE IndEpEndEncE • Um a K apIl a (Ed.)
of Bangalore-based machinery industry SMEs, which went for acquiring external technologies due to ‘competition-related factors’ much more than to overcome ‘technological obsolescence’ in the era of globalisation (Bala Subrahmanya et al., 2014).
In the labour market, the entry and operations of MnCs might attract more productive workers towards them and thereby lowering of the employee pool available to domestic firms and possibly reducing average productivity levels (asiedu and Freeman, 2006). This has been empirically observed in the context of auto component manufacturing SMEs in Bangalore. Fresh technically qualified degree and diploma holders treat SMEs as ‘training centres’ in the initial part of their career and subsequently join large enterprises including MnCs for better remuneration. as a result, the turnover rate of skilled and semi-skilled employees in SMEs is relatively high and therefore they are forced to hire these employees more than ‘optimally.’ The skill accumulation made in the course of innovations carried out by SMEs is lost to MnCs in due course of time. as a result of all these, innovations undertaken by the SMEs had a positive impact on employment growth but not on productivity growth (Bala Subrahmanya, 2010).
MnC presence, however, can have a positive effect on the performance of domestic firms. The linkages between MnCs and domestic firms create business opportunities and enhance the technological know-how and productivity of domestic firms (Javorick, 2004). This is because MnCs often outsource parts of their production to domestic firms or utilise local firms as suppliers of services and raw materials, thus creating business opportunities for domestic firms. also, MnCs tend to provide training, equipment and technology to their local suppliers (asiedu and Freeman, 2007). The strong forward and/or backward linkages of major FDI receiving sectors have been observed in the Indian economy. The sectors with strong backward and forward linkages include construction, fuels, chemicals and metallurgical industries; the sectors with strong backward linkages include electrical equipment, drugs and pharmaceuticals, food processing, textiles, among others; service sectors, telecommunications and consultancy services have strong forward linkages (nCaEr, 2009).
at the micro level, auto component SMEs, which are subcontractors of automobile MnCs located in Bangalore, are able to receive product- related and purchase process assistance from the latter, which facilitated

551Sm all Sc ale InduStr IalI Sat Ion under .. . • m.H. B al a SuBr aHm anya
. . . . . . . . . . . . . . . . . . . . . . . . . . . . . . . . . . . . . . . . . . . . . . . . . . . . . . . . . . . . . . . . . .
the former to carry out technological innovations and improve their economic performance. The higher the degree of assistance, the higher will be the levels of innovations and economic performance. Thus subcontracting relationship with MnCs has proved beneficial to local SMEs as a means of technological innovations and enhanced economic performance (Kumar and Bala Subrahmanya, 2010).
at the domestic industry level, the de-reservation of industries reserved exclusively for public sector enterprises (PSEs) has led to the shrinkage of industrial space reserved for PSEs, whereas industrial de-licensing and removal of restrictions on FDI has substantially enlarged the scope for private investments, both domestic and foreign (Bala Subrahmanya, 2009). PSEs form an important and reliable market segment for SSI. This is due to the continued operations of two policy measures for SSI promotion, among others, even in the period of globalisation: (i) purchase preference policy: about 360 items manufactured by SSI are reserved for exclusive purchase to be made by government departments and PSEs, and (ii) price preference policy: Price preference up to 15 per cent over the lowest quotation of the large-scale units will be given to the products of SSI by government departments and PSEs, if the product quality is comparable (DCMSME, 2014). Both the policies have to be implemented by the PSEs. Given this, the number of PSEs, its composition in terms of profit making and loss making, and their total turnover would make a difference to the performance of SSI.
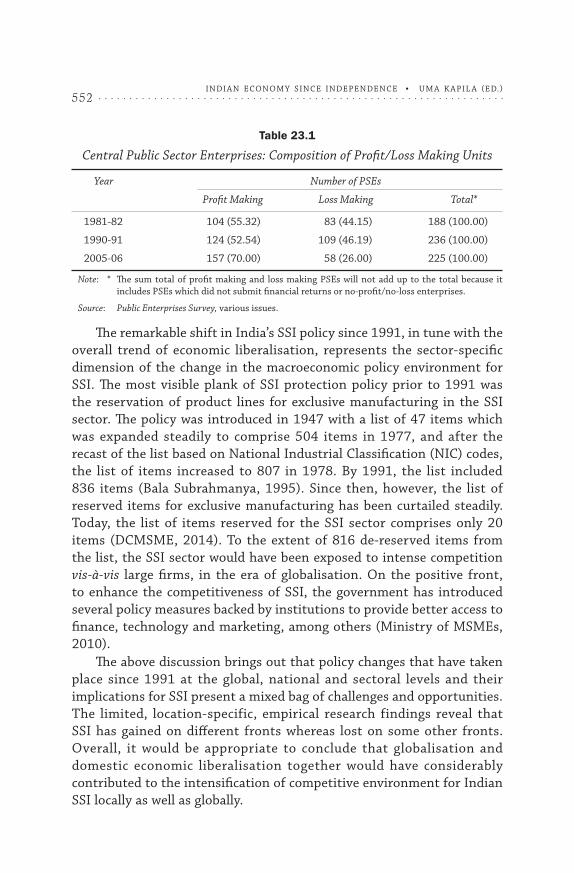
While the total number of central PSEs increased in 1990-91 compared to 1980-81, it has decreased marginally between 1990-91 and 2005-06, whereas the proportion of profit making enterprises in total PSEs has gone up and the proportion of loss making PSEs has declined considerably after 1990-91 (Table 23.1). This is attributed to the introduction of memorandum of understanding (Mou) system, among others. Mou have enhanced not only commercial profitability but also have enhanced operational efficiency of the central PSEs (Seema Gupta et al., 2003). a detailed analysis of the performance of central PSEs concluded that central PSE performance has improved in the liberalisation period compared to the pre-liberalisation period (Singh and Chittedi, 2011). The better central PSE performance in the liberalisation period would have only benefited the SSI.
552 . . . . . . . . . . . . . . . . . . . . . . . . . . . . . . . . . . . . . . . . . . . . . . . . . . . . . . . . . . . . . . . . . . IndIan Economy SIncE IndEpEndEncE • Um a K apIl a (Ed.)
Table 23.1
Central Public Sector Enterprises: Composition of Profit/Loss Making Units
Year Number of PSEs
Profit Making Loss Making Total*
1981-82 104 (55.32) 83 (44.15) 188 (100.00)
1990-91 124 (52.54) 109 (46.19) 236 (100.00)
2005-06 157 (70.00) 58 (26.00) 225 (100.00)
Note: * The sum total of profit making and loss making PSEs will not add up to the total because it includes PSEs which did not submit financial returns or no-profit/no-loss enterprises.
Source: Public Enterprises Survey, various issues.
The remarkable shift in India’s SSI policy since 1991, in tune with the overall trend of economic liberalisation, represents the sector-specific dimension of the change in the macroeconomic policy environment for SSI. The most visible plank of SSI protection policy prior to 1991 was the reservation of product lines for exclusive manufacturing in the SSI sector. The policy was introduced in 1947 with a list of 47 items which was expanded steadily to comprise 504 items in 1977, and after the recast of the list based on national Industrial Classification (nIC) codes, the list of items increased to 807 in 1978. By 1991, the list included 836 items (Bala Subrahmanya, 1995). Since then, however, the list of reserved items for exclusive manufacturing has been curtailed steadily. Today, the list of items reserved for the SSI sector comprises only 20 items (DCMSME, 2014). To the extent of 816 de-reserved items from the list, the SSI sector would have been exposed to intense competition vis-à-vis large firms, in the era of globalisation. On the positive front, to enhance the competitiveness of SSI, the government has introduced several policy measures backed by institutions to provide better access to finance, technology and marketing, among others (Ministry of MSMEs, 2010).
The above discussion brings out that policy changes that have taken place since 1991 at the global, national and sectoral levels and their implications for SSI present a mixed bag of challenges and opportunities. The limited, location-specific, empirical research findings reveal that SSI has gained on different fronts whereas lost on some other fronts. Overall, it would be appropriate to conclude that globalisation and domestic economic liberalisation together would have considerably contributed to the intensification of competitive environment for Indian SSI locally as well as globally.
553Sm all Sc ale InduStr IalI Sat Ion under .. . • m.H. B al a SuBr aHm anya
. . . . . . . . . . . . . . . . . . . . . . . . . . . . . . . . . . . . . . . . . . . . . . . . . . . . . . . . . . . . . . . . . .
In the process, less competitive ones would have suffered whereas more competitive ones would have gained. Further, a considerable number of SSI enterprises would have responded to the emerging competitive environment by enhancing their competitiveness, by taking advantage of the market forces on the one hand, and policy intervention, on the other, wherever appropriate. The overall growth performance and contribution of SSI to the national economy in the era of globalisation have to be analysed against this backdrop.
SSI Performance in the Globalisation Era
The SSI sector in India comprises two sub-sectors: registered and unregistered. The registered SSI sector comprises factories registered under Indian Factories act, 1948, and those registered with the District Industries Centres (DICs) in the states and union territories of India, among others. The unregistered SSI, on the other hand, includes non-factory enterprises and those which are not registered with the DICs, among others (Ministry of MSMEs, 2012).
The Ministry of MSMEs, GoI, provides two kinds of data on the SSI: (i) annual time-series data on the number of enterprises, employment, output and exports, for the SSI sector and country as a whole, and (ii) comprehensive data on the number of enterprises, employment, value of output, number of exporting enterprises, value of exports, value of raw materials, value of energy inputs, value of gross value added, etc., industry-wise and state-wise, based on the census for the registered sector and based on a sample survey for the unregistered sector (Ministry of MSMEs, 2013). The first SSI Census was conducted in 1972/73, followed by the second Census in 1987/88, and the third Census in 2001/02. The fourth Census, conducted in 2006/07, was broader in coverage as it included medium enterprises as well (DCSSI, 1992; Ministry of MSMEs, 2012).
Given the above, the performance of SSI can be evaluated based on (i) aggregate annual time-series data for the SSI sector as a whole and (ii) aggregate census-based data for the registered SSI sector. Based on the former, the compound average growth rate (CarG) is calculated for units, employment, output and exports (both at 2004/05 prices) for the pre-liberalisation period (1973/74-1989/90) as well as the liberalisation period (1990/91-2006/07). Subsequently, the annual growth rates of number of units, employment, output and exports (both at 2004/05

554 . . . . . . . . . . . . . . . . . . . . . . . . . . . . . . . . . . . . . . . . . . . . . . . . . . . . . . . . . . . . . . . . . . IndIan Economy SIncE IndEpEndEncE • Um a K apIl a (Ed.)
prices) of SSI are graphically presented and the trend lines are set, for the pre-liberalisation period as well as the liberalisation period. The slope of the trend lines for each of the variables for both the periods is estimated by means of regression analysis, using time as the explanatory variable for the four dependent variables (units, employment, output and exports, respectively). Further, a t-test is conducted to ascertain whether the annual growth rates of units, employment, output and exports experienced in the liberalisation period are significantly different from that of the pre-liberalisation period.
The registered SSI sector represents a more developed/modern segment of the SSI, as it primarily includes factories and those registered with the DICs. Therefore, examining its growth performance and contribution to the national economy (based on census data) might be more meaningful. Therefore, registered SSI performance has been examined in terms of (i) growth of units, exporting units, employment, values of output and exports (both at 2004/05 prices), (ii) relative contribution of registered SSI to national income, organised sector employment and total exports, (iii) degree of internationalisation, (iv) growth of ancillarisation, and (v) growth of sickness, from 1987/88 to 2001/02 and from 2001/02 to 2006/07.
Performance of the SSI Sector: Pre-liberalisation Period versus Liberalisation Period
The growth performance of SSI units, employment, output and exports for the pre-liberalisation period and for the liberalisation period (Figure 23.1) as well as for the decades from the 1970s to 2000s is presented in Table 23.2. The growth rate of SSI, on an average, has declined considerably in terms of units and even employment, but has improved marginally in terms of output and exports, in the liberalisation period compared to the pre-liberalisation period. The decade-wise performance provides more insights. The growth of SSI units declined in the 1980s compared to that of the 1970s, and it declined further in the 1990s but remained steady in the 2000s compared to that of the 1990s.
The growth of SSI employment, similar to that of SSI units, declined in the 1980s compared to that of the 1970s, and it declined further in the 1990s but improved marginally in the 2000s compared to that of the 1990s. The growth of output, unlike units and employment, improved marginally in the 1980s compared to that of the 1970s, but declined sharply in the 1990s and improved remarkably in the 2000s compared

555Sm all Sc ale InduStr IalI Sat Ion under .. . • m.H. B al a SuBr aHm anya
. . . . . . . . . . . . . . . . . . . . . . . . . . . . . . . . . . . . . . . . . . . . . . . . . . . . . . . . . . . . . . . . . .
to the earlier decades. The growth of exports, unlike units, employment and output, has remained, more or less, steady all through the pre-liberalisation and liberalisation periods. although the growth of exports declined in the 1980s compared to that of the 1970s, it improved modestly in the 1990s but declined marginally in the 2000s compared to that of the 1990s. On the whole, it may be appropriate to conclude that while SSI growth suffered in terms of units and employment, in terms of output, SSI has improved, and in terms of exports it could hold on to its ground to a large extent, in the liberalisation period relative to the pre-liberalisation period. The question is why this has happened. The possible reasons could be the following:
Table 23.2
Growth Performance of SSI: Pre-Liberalisation versus Liberalisation
Period Units Employment Output Exports
Pre-liberalisation 1973/74-1989/90 9.67 7.14 3.66 12.09
liberalisation 1990/91-2006/07 4.06 4.34 4.34 12.62
1970s 1973/74-1980/81 11.19 8.66 3.36 13.95
1980s 1980/81-1989/90 8.51 5.97 3.89 10.66
1990s 1990/91-2000/01 4.06 4.21 0.11 12.87
2000s 2000/01-2006/07 4.06 4.56 11.78 12.20
Source: Ministry of MSMEs.
Figure 23.1
SSI Growth Performance in the Pre-Liberalisation and Liberalisation Periods
14
12
10
8
6
4
2
0
Co
mp
ou
nd
Ave
rage
Gro
wth
Rat
es(%
)
Units Employment Output Exports
SSI Growth: Units, Employment, Output & Exports
1973/74-1989/90 1990/91-2006/07

556 . . . . . . . . . . . . . . . . . . . . . . . . . . . . . . . . . . . . . . . . . . . . . . . . . . . . . . . . . . . . . . . . . . IndIan Economy SIncE IndEpEndEncE • Um a K apIl a (Ed.)
1. new SSI units might not have come up as significantly in the liberalisation period as compared to the pre-liberalisation period due to the threat of competition. This would have affected directly SSI employment generation as well (Bala Subrahmanya, 2007).
2. Those new SSI units that have come up in the liberalisation period might be much more capital-intensive than those that have come up in the past. Even some proportions of the existing SSI units might have modernised themselves, to rely less on labour. This was one of the objectives of technology upgradation and modernisation achieved by some of the machinery SMEs in Bangalore (Bala Subrahmanya et al., 2014).
3. Those SSI units which lacked access to basic infrastructural facilities and which could not strengthen their competitiveness would have exited from the market, thereby affecting SSI employment and output initially.
4. a significant proportion of existing SSI units might have strengthened their competitiveness through technology up-gradation and modernisation, among others, particularly to take advantage of the developments in the global market (Ibid.).
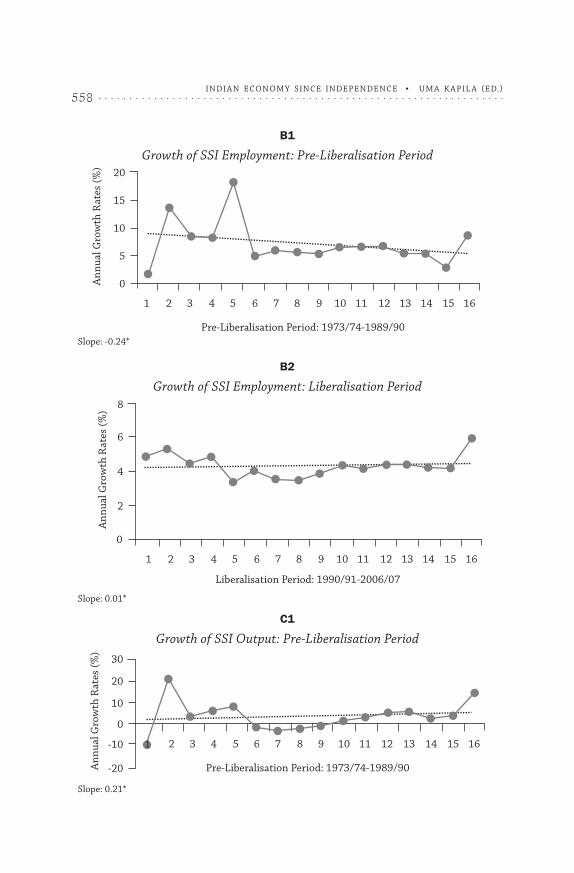
To further probe the impact of globalisation on the growth of SSI units, employment, output and exports, linear least square lines have been fitted based on the time series data for the annual growth rates of the four variables for the two periods of time: 1973/74-1989/90 and 1990/91-2006/07. The results are displayed in graphs from a to D, in Figure 23.2. none of the estimated slopes (except for the slope of the growth of SSI units in the pre-liberalisation period) is statistically significant implying that there is no consistent trend in the performance of SSI either in the pre-liberalisation period (excluding SSI unit growth) or in the liberalisation period. Further, we carried out paired t-tests for the annual growth rates of units, employment, output and exports for the pre-liberalisation period (1973/74-1989/90) and the liberalisation period (1990/91-2006/07) to ascertain whether the growth trends of the four variables in the liberalisation period are different from those of the pre-liberalisation period. The results of t-test analysis (carried out with stata 11 software) are presented in Table 23.3.

557Sm all Sc ale InduStr IalI Sat Ion under .. . • m.H. B al a SuBr aHm anya
. . . . . . . . . . . . . . . . . . . . . . . . . . . . . . . . . . . . . . . . . . . . . . . . . . . . . . . . . . . . . . . . . .A
nn
ual
Gro
wth
Rat
es(%
) 25
20
15
10
5
0
1 2 3 4 5 6 7 8 9 10 11 12 13 14 15 16
Pre-Liberalisation Period: 1973/74-1989/90
1 2 3 4 5 6 7 8 9 10 11 12 13 14 15 16
Liberalisation Period: 1990/91-2006/07
An
nu
alG
row
thR
ates
(%) 4.15
4.1
4.05
4
3.95
3.9
Figure 23.2
The Influence of Globalisation on SSI Units, Employment, Output and Exports
A1
Growth of SSI Units: Pre-Liberalisation Period
Slope: -0.41 (Significant at 0.01 level)
A2
Growth of SSI Units: Liberalisation Period
Slope: 0.00*
558 . . . . . . . . . . . . . . . . . . . . . . . . . . . . . . . . . . . . . . . . . . . . . . . . . . . . . . . . . . . . . . . . . . IndIan Economy SIncE IndEpEndEncE • Um a K apIl a (Ed.)
B1
Growth of SSI Employment: Pre-Liberalisation Period
Slope: -0.24*
B2
Growth of SSI Employment: Liberalisation Period
Slope: 0.01*
C1
Growth of SSI Output: Pre-Liberalisation Period
Slope: 0.21*
An
nu
alG
row
thR
ates
(%) 20
15
10
5
0
1 2 3 4 5 6 7 8 9 10 11 12 13 14 15 16
Pre-Liberalisation Period: 1973/74-1989/90
1 2 3 4 5 6 7 8 9 10 11 12 13 14 15 16
Liberalisation Period: 1990/91-2006/07
An
nu
alG
row
thR
ates
(%)
8
4
2
0
6
2 3 4 5 6 7 8 9 10 11 12 13 14 15 16
Pre-Liberalisation Period: 1973/74-1989/90An
nu
alG
row
thR
ates
(%)
30
20
10
-10
-20
0
1

559Sm all Sc ale InduStr IalI Sat Ion under .. . • m.H. B al a SuBr aHm anya
. . . . . . . . . . . . . . . . . . . . . . . . . . . . . . . . . . . . . . . . . . . . . . . . . . . . . . . . . . . . . . . . . .
C2
Growth of SSI Output: Liberalisation Period
Slope: 1.06*
D1
Growth of SSI Exports: Pre-Liberalisation Period
Slope: 0.35*
D2
Growth of SSI Exports: Liberalisation Period
Slope: -0.30*
Note: * Statistically not significant.
1 3 4 5 6 7 8 9 10 11 12 13 14 15 16
Liberalisation Period: 1990/91-2006/07
An
nu
alG
row
thR
ates
(%) 60
20
0
40
-202
1 2 3 4 5 6 7 8 9 10 11 12 13 14 15 16
Pre-Liberalisation Period: 1973/74-1989/90
An
nu
alG
row
thR
ates
(%) 60
40
20
0
-20
1 2 3 4 5 6 7 8 9 10 11 12 13 14 15 16
Liberalisation Period: 1990/91-2006/07
0An
nu
alG
row
thR
ates
(%)
35
15
5
-5
25
30
20
10

560 . . . . . . . . . . . . . . . . . . . . . . . . . . . . . . . . . . . . . . . . . . . . . . . . . . . . . . . . . . . . . . . . . . IndIan Economy SIncE IndEpEndEncE • Um a K apIl a (Ed.)
Table 23.3
Paired t-Test Results for the Growths of SSI Units, Employment, Output and Exports
.ttest uG == luG
paired t test
variable obs Mean Std. Err. Std. Dev. [95% conf. Interval]
uG 16 9.712611 .7616405 3.046562 8.089213 11.33601
luG 16 4.0622315 .0100133 .040053 4.040972 4.083658
diff 16 5.650296 .7662769 3.065108 4.017016 7.283577
mean (diff) = mean (uG-luG) t = 7.3737 HO : mean (diff) = 0 degrees of freedom = 15
Ha : mean (diff) < 0 Ha: mean (diff) 1 = 0 Ha: mean (diff) > 0 Pr (T < t) = 1.0000 Pr (|T| > |T| = 0.0000 Pr (T > t) = 0.0000
.ttest EG == lEG
paired t test
variable obs Mean Std. Err. Std. Dev. [95% conf. Interval]
EG 16 7.201541 .90867871 3.947149 5.098254 9.304828
lEG 16 4.344354 01676878 .6707512 3.986936 4.701772
diff 16 2.857187 .9979979 3.991992 .7300045 4.984369
mean (diff) = mean (EG-lEG) t = 2.8629 HO : mean (diff) = 0 degrees of freedom = 15
Ha : mean (diff) < 0 Ha: mean (diff) 1 = 0 Ha: mean (diff) > 0 Pr (T < t) = 0.9941 Pr (|T| > |T| = 0.0119 Pr (T > t) = 0.0059
.ttest OG == lOG
paired t test
variable obs Mean Std. Err. Std. Dev. [95% conf. Interval]
OG 16 3.87089 1.73553 6.942119 .1716957 7.570084
lOG 16 4.924069 3.107289 12.42916 -1.69896 11.5471
diff 16 -1.053179 3.805329 15.22131 -9.164945 7.057687
mean (diff) = mean (OG-lOG) t = -0.2768 HO : mean (diff) = 0 degrees of freedom = 15
Ha : mean (diff) < 0 Ha: mean (diff) 1 = 0 Ha: mean (diff) > 0 Pr (T < t) = 0.3929 Pr (|T| > |T| = 0.7857 Pr (T > t) = 0.6071
Contd...

561Sm all Sc ale InduStr IalI Sat Ion under .. . • m.H. B al a SuBr aHm anya
. . . . . . . . . . . . . . . . . . . . . . . . . . . . . . . . . . . . . . . . . . . . . . . . . . . . . . . . . . . . . . . . . .
...contd...
.ttest XG == lXG
paired t test
variable obs Mean Std. Err. Std. Dev. [95% conf. Interval]
XG 16 12.88808 3.513771 14.05508 5.398652 20.3775
lXG 16 12.99107 2.376685 9.506738 7.925291 18.05686
diff 16 -.1029971 3.677881 14.71152 -7.942214 7.73622
mean (diff) = mean (XG-lXG) t = -0.0280 HO : mean (diff) = 0 degrees of freedom = 15
Ha : mean (diff) < 0 Ha: mean (diff) 1 = 0 Ha: mean (diff) > 0 Pr (T < t) = 0.4890 Pr (|T| > |T| = 0.9780 Pr (T > t) = 0.5110
Notes: 1. uG = Growth rates of SSI units from 1973/74 to 1989/90.
2. luG = Growth rates of SSI units from 1990/91 to 2006/07.
3. EG = Growth rates of SSI employment from 1973/74 to 1989/90.
4. lEG = Growth rates of SSI employment from 1990/91 to 2006/07.
5. OG = Growth rates of SSI output from 1973/74 to 1989/90.
6. lOG = Growth rates of SSI output from 1989/90 to 2006/07.
7. XG = Growth rates of SSI exports from 1973/74 to 1989/90.
8. lXG = Growth rates of SSI exports from 1990/91 to 2006/07.
The results indicate that the SSI growth performance in terms of annual growth rates of units and employment has declined in the liberalisation period compared to the pre-liberalisation period and is statistically significant. However, SSI growth performance in terms of annual growth rates of output and exports though has increased in the liberalisation period relative to the pre-liberalisation period, it is not statistically significant. The possible factors for the declined growth of SSI units and employment have been reasoned out adequately above. Given this, if there is no corresponding decline in terms of SSI output and exports, this itself would mean higher productivity, higher degree of internationalisation (penetration of international markets) and ‘enhanced competitiveness’ of SSI in India. Overall, it may be appropriate to conclude that there is no adequate evidence to indicate that globalisation is continuing to affect SSI performance adversely. against this backdrop, it is appropriate to examine the performance and contribution of registered SSI (based on census data) to Indian economy in the liberalisation period.
562 . . . . . . . . . . . . . . . . . . . . . . . . . . . . . . . . . . . . . . . . . . . . . . . . . . . . . . . . . . . . . . . . . . IndIan Economy SIncE IndEpEndEncE • Um a K apIl a (Ed.)
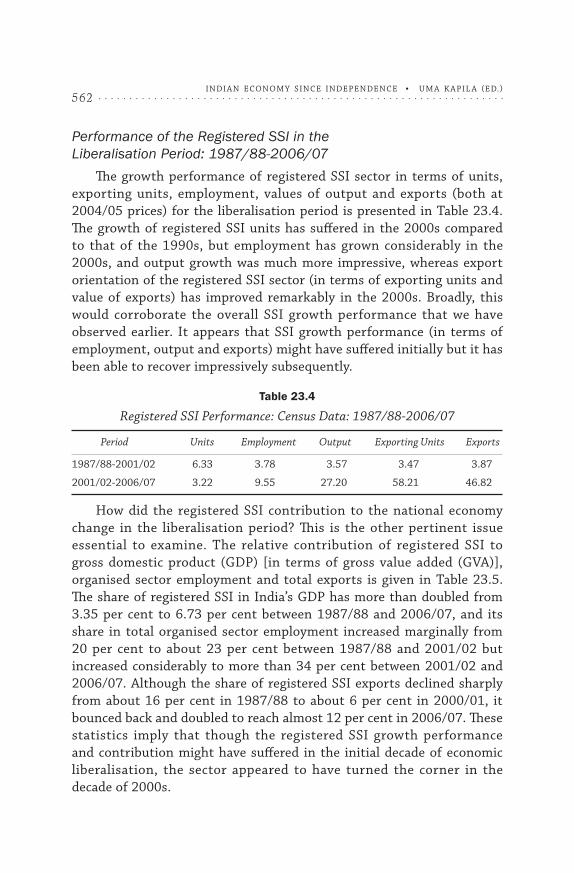
Performance of the Registered SSI in the Liberalisation Period: 1987/88-2006/07
The growth performance of registered SSI sector in terms of units, exporting units, employment, values of output and exports (both at 2004/05 prices) for the liberalisation period is presented in Table 23.4. The growth of registered SSI units has suffered in the 2000s compared to that of the 1990s, but employment has grown considerably in the 2000s, and output growth was much more impressive, whereas export orientation of the registered SSI sector (in terms of exporting units and value of exports) has improved remarkably in the 2000s. Broadly, this would corroborate the overall SSI growth performance that we have observed earlier. It appears that SSI growth performance (in terms of employment, output and exports) might have suffered initially but it has been able to recover impressively subsequently.
Table 23.4
Registered SSI Performance: Census Data: 1987/88-2006/07
Period Units Employment Output Exporting Units Exports
1987/88-2001/02 6.33 3.78 3.57 3.47 3.87
2001/02-2006/07 3.22 9.55 27.20 58.21 46.82
How did the registered SSI contribution to the national economy change in the liberalisation period? This is the other pertinent issue essential to examine. The relative contribution of registered SSI to gross domestic product (GDP) [in terms of gross value added (GVa)], organised sector employment and total exports is given in Table 23.5. The share of registered SSI in India’s GDP has more than doubled from 3.35 per cent to 6.73 per cent between 1987/88 and 2006/07, and its share in total organised sector employment increased marginally from 20 per cent to about 23 per cent between 1987/88 and 2001/02 but increased considerably to more than 34 per cent between 2001/02 and 2006/07. although the share of registered SSI exports declined sharply from about 16 per cent in 1987/88 to about 6 per cent in 2000/01, it bounced back and doubled to reach almost 12 per cent in 2006/07. These statistics imply that though the registered SSI growth performance and contribution might have suffered in the initial decade of economic liberalisation, the sector appeared to have turned the corner in the decade of 2000s.
563Sm all Sc ale InduStr IalI Sat Ion under .. . • m.H. B al a SuBr aHm anya
. . . . . . . . . . . . . . . . . . . . . . . . . . . . . . . . . . . . . . . . . . . . . . . . . . . . . . . . . . . . . . . . . .
Table 23.5
Registered SSI Contribution to GDP, Employment and Total Exports
Year GDP Organised Sector Employment Total Exports
1987/88 3.35 20.00 15.94
2001/02 na 22.65 5.90
2006/07 6.73 34.13 11.88
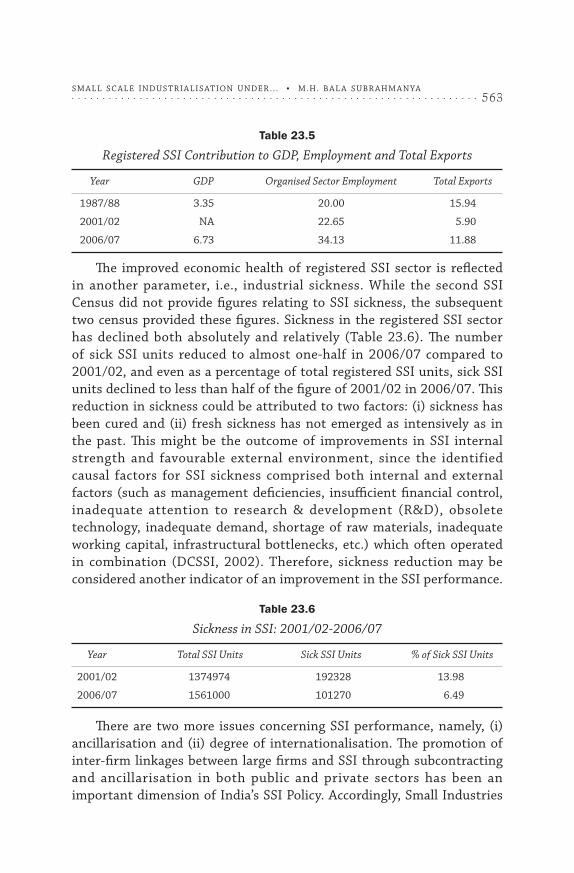
The improved economic health of registered SSI sector is reflected in another parameter, i.e., industrial sickness. While the second SSI Census did not provide figures relating to SSI sickness, the subsequent two census provided these figures. Sickness in the registered SSI sector has declined both absolutely and relatively (Table 23.6). The number of sick SSI units reduced to almost one-half in 2006/07 compared to 2001/02, and even as a percentage of total registered SSI units, sick SSI units declined to less than half of the figure of 2001/02 in 2006/07. This reduction in sickness could be attributed to two factors: (i) sickness has been cured and (ii) fresh sickness has not emerged as intensively as in the past. This might be the outcome of improvements in SSI internal strength and favourable external environment, since the identified causal factors for SSI sickness comprised both internal and external factors (such as management deficiencies, insufficient financial control, inadequate attention to research & development (r&D), obsolete technology, inadequate demand, shortage of raw materials, inadequate working capital, infrastructural bottlenecks, etc.) which often operated in combination (DCSSI, 2002). Therefore, sickness reduction may be considered another indicator of an improvement in the SSI performance.
Table 23.6
Sickness in SSI: 2001/02-2006/07
Year Total SSI Units Sick SSI Units % of Sick SSI Units
2001/02 1374974 192328 13.98
2006/07 1561000 101270 6.49
There are two more issues concerning SSI performance, namely, (i) ancillarisation and (ii) degree of internationalisation. The promotion of inter-firm linkages between large firms and SSI through subcontracting and ancillarisation in both public and private sectors has been an important dimension of India’s SSI Policy. accordingly, Small Industries

564 . . . . . . . . . . . . . . . . . . . . . . . . . . . . . . . . . . . . . . . . . . . . . . . . . . . . . . . . . . . . . . . . . . IndIan Economy SIncE IndEpEndEncE • Um a K apIl a (Ed.)
Development Organisation (SIDO) resorted to proactive promotion of ancillarisation through vendor development programmes and subcontracting exchanges as early as in the 1980s (DCSSI, 1989). In 1995, government introduced a scheme to encourage subcontracting exchanges by SSI associations (Bala Subrahmanya, 1998). The merits of subcontracting relationship, in addition to assured marketing, though to a lesser degree, covered technical assistance, finance, supply of raw materials and training (Sahu, 2007). Therefore, any growth of ancillarisation and subcontracting relationship between SSI and large firms would be advantageous to the performance of the former.
The second and third Censuses of SSI provide data on ancillary units but not the fourth Census. There was a considerable increase in the number of ancillary units between 1987/88 and 2001/02, and as a result, the percentage of ancillary units increased from <1 per cent to >5 per cent (Table 23.7). Since then, the number of ancillary units might have gone up further. But this figure takes into account only formal sub-contracting relationships, whereas a significant proportion of SSI in states like Karnataka (particularly, in cities like Bangalore) has informal sub-contracting relationships with large firms including MnCs (Bala Subrahmanya et al., 2001; Kumar and Bala Subrahmanya, 2010). The growing inter-firm linkages, formal as well as informal, would have benefited the economic performance of SSI. Empirical evidence in the context of Bangalore has revealed that SMEs, which have internal technical competence and obtain external support from their large enterprise customers, among others, are able to enhance their innovation performance and thereby their economic performance (Bala Subrahmanya, 2013a).
Table 23.7
SSI and Ancillarisation: 1987/88-2001/02
Year Ancillary Units Total SSI Units % of Ancillary Units
1987-88 3028 582368 0.52
2001-02 69848 1374974 5.08
2006-07 na 1561000 na
How does SSI respond to the growing global opportunities is another important issue having implication for its performance. With increasing global competition, falling barriers to international trade and improved international information and communication technology
565Sm all Sc ale InduStr IalI Sat Ion under .. . • m.H. B al a SuBr aHm anya
. . . . . . . . . . . . . . . . . . . . . . . . . . . . . . . . . . . . . . . . . . . . . . . . . . . . . . . . . . . . . . . . . .
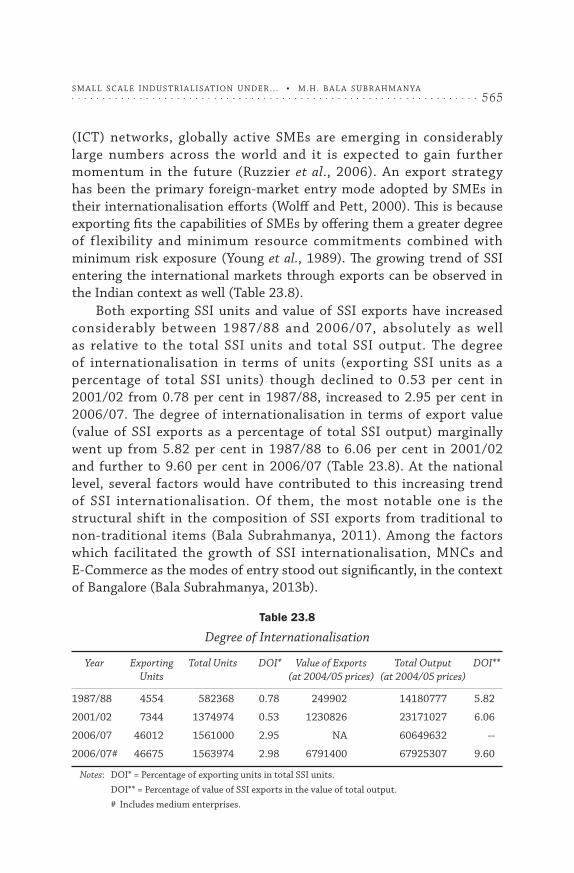
(ICT) networks, globally active SMEs are emerging in considerably large numbers across the world and it is expected to gain further momentum in the future (ruzzier et al., 2006). an export strategy has been the primary foreign-market entry mode adopted by SMEs in their internationalisation efforts (Wolff and Pett, 2000). This is because exporting fits the capabilities of SMEs by offering them a greater degree of flexibility and minimum resource commitments combined with minimum risk exposure (young et al., 1989). The growing trend of SSI entering the international markets through exports can be observed in the Indian context as well (Table 23.8).
Both exporting SSI units and value of SSI exports have increased considerably between 1987/88 and 2006/07, absolutely as well as relative to the total SSI units and total SSI output. The degree of internationalisation in terms of units (exporting SSI units as a percentage of total SSI units) though declined to 0.53 per cent in 2001/02 from 0.78 per cent in 1987/88, increased to 2.95 per cent in 2006/07. The degree of internationalisation in terms of export value (value of SSI exports as a percentage of total SSI output) marginally went up from 5.82 per cent in 1987/88 to 6.06 per cent in 2001/02 and further to 9.60 per cent in 2006/07 (Table 23.8). at the national level, several factors would have contributed to this increasing trend of SSI internationalisation. Of them, the most notable one is the structural shift in the composition of SSI exports from traditional to non-traditional items (Bala Subrahmanya, 2011). among the factors which facilitated the growth of SSI internationalisation, MnCs and E-Commerce as the modes of entry stood out significantly, in the context of Bangalore (Bala Subrahmanya, 2013b).
Table 23.8
Degree of Internationalisation
Year Exporting Total Units DOI* Value of Exports Total Output DOI** Units (at 2004/05 prices) (at 2004/05 prices)
1987/88 4554 582368 0.78 249902 14180777 5.82
2001/02 7344 1374974 0.53 1230826 23171027 6.06
2006/07 46012 1561000 2.95 na 60649632 --
2006/07# 46675 1563974 2.98 6791400 67925307 9.60
Notes: DOI* = Percentage of exporting units in total SSI units.
DOI** = Percentage of value of SSI exports in the value of total output.
# Includes medium enterprises.
566 . . . . . . . . . . . . . . . . . . . . . . . . . . . . . . . . . . . . . . . . . . . . . . . . . . . . . . . . . . . . . . . . . . IndIan Economy SIncE IndEpEndEncE • Um a K apIl a (Ed.)
In brief, the overall SSI growth performance indicators revealed that the growth pattern in the liberalisation period is not significantly different from that of the pre-liberalisation period, with the exception of the growth rates of units and employment. although the growth rates of SSI units and employment, more or less, steadily declined in the pre-liberalisation period, on an average, the growth rates of units and employment were much higher in the pre-liberalisation period compared to that of the liberalisation period, which did not exhibit any definite pattern of growth. although the average growth rates of output and exports are higher in the liberalisation period relative to the pre-liberalisation period, the differences in the annual growth rates between the two periods of time are not statistically significant.
However, the performance indicators of the registered SSI sector are more pronounced. although its growth rates (in absolute terms) were lower in the 1990s, it recorded a substantial recovery thereafter. Its contribution to national income and organised sector employment increased significantly. Further, there are indicators of its improved performance in terms of reduced sickness, improved linkages with large firms, and better penetration of the international market. Given the ‘encouraging’ performance of registered SSI, the key policy initiatives were introduced by the GoI subsequent to the Micro, Small and Medium Enterprises Development (MSMED) act, 2006, to strengthen the SSI/SME sector further, and its implications need to be examined.
Inferences and Conclusions (in the context of Recent Policy Initiatives)
Globalisation and domestic economic liberalisation have radically changed the economic environment for the operations of SSI in India since 1991. Increased imports and FDI inflow in the domestic market, increased exports in the global market, improved performance of the public sector despite curtailed space, de-reservation of the vast list of items reserved for exclusive SSI manufacturing represent the major dimensions of policy-related developments. as a result, new challenges as well as opportunities have emerged for Indian SSI. The performance of SSI has been evaluated against this backdrop.
The analysis of SSI performance indicates that SSI sector is undergoing transformation with an initial suffering and a subsequent recovery, and the recovery is more pronounced in the case of registered SSI. Its performance in terms of employment generation, output growth

567Sm all Sc ale InduStr IalI Sat Ion under .. . • m.H. B al a SuBr aHm anya
. . . . . . . . . . . . . . . . . . . . . . . . . . . . . . . . . . . . . . . . . . . . . . . . . . . . . . . . . . . . . . . . . .
as well as export growth, its relative contribution to national GDP, organised sector employment and total exports are considerable and significant, particularly in the early 2000s. There are further indicators of improved economic health of SSI in the form of (i) reduced industrial sickness, (ii) improved linkages with large firms, and (iii) increasing degree of internationalisation, with its resultant benefits. This lends credence to the observation made earlier that,
irrespective of the degree of support extended by the government and irrespective of the amount of efforts put in by SSI and their associations, India is going to experience the emergence of SSI sector, which is qualitatively superior, technologically vibrant and internationally competitive, in the next five to ten years because the ‘inefficient ones’ are likely to vanish gradually (Bala Subrahmanya, 2004).
However this could be largely true with respect to the registered SSI, which accounted for just about 6 per cent of the total MSMEs in 2006/07, whereas the remaining 94 per cent of the enterprises belonged to the unregistered sector (GoI, 2010).
The unregistered SSI would predominantly comprise micro enterprises, particularly confined to rural India, operating with obsolete technology, limited access to institutional finance, and limited marketing/management expertise. Given this, how to transform the huge unregistered SSI into the registered SSI and how to enhance the competitiveness of the overall SSI are the two foremost challenges confronted by the policy makers.
The shift in the SSI policy emphasis from protection to promotion of competitiveness began with the introduction of an exclusive policy for SSI in 1991 (Ministry of Industry, 1991). Since then, the policy support in the 1990s and early 2000s has been largely to enable the SSI to overcome the key challenges to their performance and growth, namely, finance, technology and marketing, among others (Bala Subrahmanya, 2004). Since 2005/06, several major policy initiatives have been taken by the GoI to promote SSI competitiveness, which are as follows (Ministry of MSMEs, 2010):
• ThepromulgationofMSMEDAct 2006,which clubbedmicroand small enterprises with medium enterprises and provided a common legal framework, for their integrated development and enhancing competitiveness.
• As part of the NationalManufacturing CompetitivenessProgramme (nMCP), 10 specific initiatives were taken in

568 . . . . . . . . . . . . . . . . . . . . . . . . . . . . . . . . . . . . . . . . . . . . . . . . . . . . . . . . . . . . . . . . . . IndIan Economy SIncE IndEpEndEncE • Um a K apIl a (Ed.)
2007/08 to enhance the competitiveness of the entire value chain of the MSME sector.
• LimitedLiabilityPartnership (LLP)Act,2008,was introducedto enable early corporatisation of MSMEs and tap the capital market for fund raising. accordingly, SME platforms are created in Bombay Stock Exchange (BSE) and national Stock Exchange (nSE) in 2012 (Ministry of MSMEs, 2013).
• To develop a roadmap for the development and promotionof MSMEs, a Task Force was created by the Prime Minister of India in 2009 (GoI, 2010). The Task Force, which comprised, among others, six specific theme-based sub-groups (on credit, marketing, infrastructure/technology/skill development, exit policy, labour and taxation) submitted its report in 2010 suggesting (i) immediate policy measures, (ii) medium-term institutional measures, and (iii) legal and regulatory structures to create a conducive environment for entrepreneurship and growth of MSMEs.
• TheWorkingGrouponMSMEsGrowthfor12thFiveYearPlan(2012-2017) made recommendations on six thematic verticals: (i) finance, including credit, (ii) infrastructure, (iii) technology, (iv) marketing and procurement, (v) skill development and training, and (vi) institutional structure. The Working Group reinforced the recommendations made by the Task Force earlier (Ministry of MSMEs, 2012).
• The Inter -Min i s te r i a l Commit tee for Acce le rat ingManufacturing in Micro, Small and Medium Enterprises made recommendations on (i) the promotion of start-ups, (ii) facilitating operation and growth (covering credit, technology and marketing), (iii) closure and exit, and (iv) labour laws and regulations (Ministry of MSMEs, 2013).
These policy initiatives are clear and consistent, aimed at transforming the ecosystem for the MSME sector by influencing their (i) birth (encouraging start-ups), (ii) operations and growth (by simplifying laws and regulations, and facilitating their access to credit, better technology and dynamic markets, apart from skilled labour and reliable infrastructure), and (iii) orderly and easy exit. Thus, the emerging focus of India’s MSME policy aims at covering the entire life cycle of MSMEs to ensure a healthy, vibrant and competitive MSME sector. To conclude, the ‘appropriate policy information diffusion and

569Sm all Sc ale InduStr IalI Sat Ion under .. . • m.H. B al a SuBr aHm anya
. . . . . . . . . . . . . . . . . . . . . . . . . . . . . . . . . . . . . . . . . . . . . . . . . . . . . . . . . . . . . . . . . .
effective penetration of policy support’ amongst the MSMEs can have a desirable impact on the competitiveness, particularly, of registered SSI, slowly and steadily in the years to come.
Referencesabdullah, H., S. azis and M.K. Mat (2009). “Globalisation: How it affects Small & Medium
Enterprises?” Working Paper, universiti Teknologi Mara, Selangor.
acs, Z.J., r.K. Morck and B. yeung (2001). “Entrepreneurship, Globalisation and Public Policy”, Journal of International Management 7: 235-51.
asiedu, E. and J. Freeman (2007). “The Effect of Globalisation on the Performance of Small and Medium Enterprises in the uS: Does Owners’ race/Ethnicity Matter?” Paper presented at the AEA Conference in Chicago, January 5-7, 2007.
awuah, G.B. and M. amal (2011). “Impact of Globalisation: The ability of less Developed Countries’ (lDCs’) firms to Cope with Opportunities and Challenges”, European Business Review 23(1): 120-32.
Bala Subrahmanya, M.H., Z. Hussain and a. Chand (2014). “External Technology acquisition of SMEs in the Machinery Industry of Bangalore”, Asian Journal of Innovation and Policy 3(1): 50-71.
Bala Subrahmanya, M.H., M. Mathirajan, P. Balachandra and M.n. Srinivasan (2001). Research & Development in Small Scale Industries in Karnataka, research Project report, Department of Science and Technology, new Delhi.
Bala Subrahmanya, M.H. (2013a). “External Support, Innovation and Economic Performance: What Firm level Factors Matter for High-tech SMEs? How?” International Journal of Innovation Management 17: 1-26.
———. (2013b). “Internationalisation Motivation, Pattern and Process of Indian SMEs: Why? How? How Fast?” Paper presented at the Workshop on Internationalization of Business Groups: Illustrations from China and India, 5-6 December 2013 held at national university of Singapore.
———. (2011). “Small Scale Industry Development for Export Promotion: India’s Experience under liberalisation”, in Keshab Das (ed.), Micro and Small Enterprises in India: The Era of Reforms. new Delhi: routledge India, Chapter 3, pp.46-66.
———. (2010). “auto SMEs in Bangalore: Does Innovation Promote Employment and labour Productivity?” Economic and Political Weekly 45: 59-66.
———. (2009). Industrial Policy & Management, ISTE-WPlP learning Material Series. Bangalore: Indian Society for Technical Education, Working Professionals learning Project.
———. (2007). “Development Strategy for Indian SMEs: Promoting linkages with Global Transnational Corporations”, Management Research News 30: 762-74.
———. (2004). “Small Industry and Globalisation: Implications, Performance and Prospects”, Economic and Political Weekly 39: 1826-34.
———. (1998). “Shifts in India’s Small Industry Policy”, Small Enterprise Development 9(1): 35-45. March.
———. (1995). “reservation Policy for Small Scale Industry: Has it Delivered the Goods?” Economic and Political Weekly 30: M 51-M 54.
DCMSME (2014). http://www.dcmsme.gov.in/policies/preseve.htm
DCSSI (1989). Annual Report 1988-1989. new Delhi: Ministry of Industry, Government of India.
DCSSI (1992). Report on the Second All India Census of Small Scale Industrial Units, 1987/88. new Delhi: Ministry of Industry.
570 . . . . . . . . . . . . . . . . . . . . . . . . . . . . . . . . . . . . . . . . . . . . . . . . . . . . . . . . . . . . . . . . . . IndIan Economy SIncE IndEpEndEncE • Um a K apIl a (Ed.)
———. (2002). Small Scale Industries in India: An Engine of Growth. new Delhi: Ministry of SSI, Government of India.
Deo, S. (2013). “The Impact of Globalisation on Small Business Enterprises (SBEs)”, 26th Annual SEAANZ Conference Proceedings, 11-12, Sydney 2013.
Fischer, S. (2003). “Globalisation and Its Challenges”, The American Economic Review 93(2): 1-30.
Government of India (2010). Report of the Prime Minister’s Task Force on Micro, Small and Medium Enterprises. new Delhi.
Gupta, Seema, P.K. Jain and S.S. yadav (2011). “Impact of Mou on Financial Performance of Public Sector Companies in India”, Journal of Advances in Management Research 8: 263-84.
Javorick, B. (2004). “Does Foreign Direct Investment Increase the Productivity of Domestic Firms? In Search of Spill-overs through Backward linkages”, American Economic Review 94(3): 605-27.
Kumar, r.S. and M.H. Bala Subrahmanya (2010). “Influence of Subcontracting on Innovation and Economic Performance of SMEs in Indian automobile Industry”, Technovation 30(11/12): 558-69.
Ministry of Finance (2002). Economic Survey 2001-02. new Delhi: Government of India.
———. (2007). Economic Survey 2006-07. new Delhi: Government of India.
Ministry of Industry (1991). Policy Measures for Promoting and Strengthening Small, Tiny and Village Enterprises. new Delhi: Government of India.
Ministry of MSMEs (2010). Micro, Small and Medium Enterprises in India: An Overview. new Delhi: Government of India, new Delhi.
———. (2012). Report of The Working Group on Micro, Small & Medium Enterprises (MSMEs) Growth for 12th Five Year Plan (2012-2017). new Delhi: Government of India.
———. (2013). Recommendations of the Inter-Ministerial Committee for Accelerating Manufacturing in Micro, Small & Medium Enterprises Sector. new Delhi: Government of India.
nCaEr (2009). FDI in India and its Growth Linkages. Study report, new Delhi.
Planning Commission (2002). Tenth Five Year Plan (2002-2007), Vol. 2. new Delhi: Government of India.
rao, K.S.C. and B. Dhar (2011). “India’s FDI Inflows: Trends and Concepts”, Working Paper no: 2011/01. new Delhi: Institute for Studies in Industrial Development.
ruzzier, M, r.D. Hisrich and B. antoncic (2006). “SME Internationalisation research: Past, Present and Future”, Journal of Small Business and Enterprise Development 13(4): 476-97.
Sahu, P.P. (2007). “Subcontracting in India’s Small Manufacturing Enterprises: Problems and Prospects”, Working Paper no: 2007/01. new Delhi: Institute for Studies in Industrial Development.
Singh, J. and K.r. Chittedi (2011). “Performance of Public Sector Enterprises in India: a Macro-level analysis”, IUP Journal of Managerial Economics IX(3): 7-25.
Smeral, E. (1998). “The Impact of Globalisation on Small and Medium Enterprises: new Challenges for Tourism Policies in European Countries”, Tourism Management 19(4): 371-80.
unCTaD (2006). World Investment Report 2006. Geneva.
Vladimirov, Z., r.S. Ganeva and K. Ganev (2013). “Significance of Globalisation-specific Factors for SME Competitiveness: a Conceptual Model and an Empirical Test”, Business Systems Review 2: 1-25. July-December.
Wolff, J.a. and T.l. Pett (2000). “Internationalization of Small Firms: an Examination of Export Competitive Patterns, Firm Size, and Export Performance”, Journal of Small Business Management 38: 34-47.
young, S., J. Hamill, C. Wheeler and J.r. Davies (1989). International Market Entry and Development. Englewood Cliffs, nJ: Prentice-Hall.