What factors drive successful industrialization? Evidence and ...
Upload
khangminh22Category
view
8download
0
/Asia's Next Giant /
South Korea and'/" Late Industrialization
Alice H. Amsden ",' .. :
OXFORD UNIVERSITY PRESS New York Oxford

Oxford University Press Oxford New York Toronto
Delhi Bombay Calculla Madras Karachi Petaling Jaya Singapore Hong Kong' Tokyo
Nairobi Dar es Salaam Cape Town Melbourne Auckland
and associated companies in Berlin Ibadan
Copyright © 1989 by Oxford University Press, Inc. -=- .
first published in 1989 by Oxford University Press. Inc., 200 Madison Avenue. New York. New York 10016
First issued as an Oxford University Press paperback. 1992
Oxford is a registered trademark of Oxford Ui,iversity .Press
All rights reserved. No part of this publication m:ty be reproduced. stored in a retrie.al system. or tranSJniued. in any form or by any means.
electronic. mcchariical, photocopying. recording. or otherwise. without the prior permission of Oxford University l'ress, Inc.
Library of Congress Cataloging·in·Publication Data
Amsden. Alice H. Asia's next giant. Bibliography: p, Includes index.
I. Korea (South)-Industrics. 2. Industry and state-Korea (South) �. Korea (South)-Economic
conditions-1960- . 4. Korea (South)-Economic policy-196{)- . I. Title.
HC467.A629 1989 338.09!H9'5 88-36231 ISBN 0·[9·505852'0
2468 10753 I Printed in the United States of America

Preface
This book seeks an answer to the puzzle of why South Korea has grown so much faster than most developing countries, even those that have gone through what is called. "late industrialization." Late industrialization applies to a subset of developing countries that began the twentieth -century in an economically backward state based on raw materials, and dramatically raised national income per capita by selectively investing in industry. Included are South Korea, Taiwan, Brazil, Turkey, India, and Mexico. This book also treats Japan as a late-industrializing country, which makes the list all the more. heterogeneous. Diversity notwithstanding, all late industrializ.ers ha0e in common ind1L5trialization on the basis of learning, which has condi;.,. tioned how they have behaved. These countries industrialized by borrowing foreign technology rather than by generating new prod-, ucts or processes, the hallmark of earlier industrializing nations. "
South Korea's growth is a classic example of late indu'strialization, and embodies all of the elements common to these countries. It has' involved a high degree of state intervention to get relative prices "wrong" in order to overcome the penalties of lateness, the growth of large diversified business groups (even in Taiwan) to transcend the hardships of having to compete without the advantages of noveJ; technology, _ the emergence of salaried managers responsible for exploiting the borrowed technology (the private entrepreneur in large companies playing a much reduced role compared to earlier times), and a focus on shopfloor management to optimize technology transfer. All these factors allowed Korea to be _ among the first countriesto penetrate world markets on the basis of low wages rather than a technological edge. England succeeded during the First Industrial' Revolution on the basis of invention) and leading firms in Germany and .the United States at a later time captured market share from England on the basis of innovation.
But Korea has succeeded far beyond the non-East Asian late industrializers. This book will examine in detail the factors that Contributed to its success. It will analyze the crucial role of government not only in subsidizing certain industries �o stimulate growth, but in

vi PREFACE
setting stringent performance standards in exchange for the subsidies. In other countries-in Turkey and India, for example-subsidies have been dispensed primarily as giveaways. In Korea the "wrong� prices have been right because government discipline over business ; has enabled subsidies and protection to be less than elsewhere and ':'<:: more effective. If the big business groups of Korea have been loaned \ long term capital at negative real interest rates, the government has :i demanded that they use the borrowed capital productively, not spec- . ulatively. If they have been allowed to sell in protected domestic'" markets, they have had to produce and sell in the export market:._ Discipline over business as well as labor provided the starting poine, for high growth rates of productivity, which allowed Korea to bor- \ row extensively in international capital markets without overextend:_' ing itself financially. The Big Push into heavy industry was financed primarily with overseas loans, but at the beginning and end of the period 1973 to 1979, the ratio of foreign debt to GNP was virtually unchanged.
The book will also examine why the power of the state to disci- •. pline big business was greater in Korea-and Japan and Taiwan as_ · well-than in other late-industrializing countries. Although the historical and cultural factors that, in turn, drove th� Korean state to act in a relatively disciplined fashion are too complex to be considered in detail, they include meritocracy· in the civil service, militarism, raw material scarcity, and not least of all, a hyperactive student movement that mobilized popular support to keep the government honest. Appropriately enough in an industrialization based On learning, the role of students should not be minimized, either as conscience of the industrialization process or as key resource.
A country like Korea can serve as a useful model from which other aspiring industrializing countries can learn. What is required, however, is an empirically relevant theory of both the general paradigm of late industrialization and its special variants-particularly as found in South Korea. It is toward the development of such a theory that this book is dedicated.
Company-level research for the present volume was undertaken initially in conjunction with a project sponsored by the Productivity Division, Department of Economic Development, of the World Bank, entitled "The Acquisition of Technological Capability in Newly Industrializing Countries." I am indebted to the bank for financial assistance. I also benefited from discussions with participants on the project, and the following people were particularly helpful: Carl Dahlman, Linsu Kim, Sanjaya Lall, Francisco Sercovich, Simon Tei-

Preface vii
tel, and Larry Westphal. Linsu Kim and I were collaborators on this project and to him lowe an especially large debt of gratitude for his insights into Korean management, and to the distinction between learning through copying and imitating and learning through apprenticing with foreign firms.
Additional financial support wa� provided by the Division of Research of the Harvard Business School. I am grateful to Dean John McArthur, Jay Lorsch, and Ray Corey for· their consistent help. I also wish to thank tbe following people at the school for stimulating discussions: the late William Abernathy, Kim Clark, Therese flaherty, Jai Jaikumar, George Lodge, Earl Sasser, Bruce Scott, Richard Rosenbloom, and Lou Wells. Alfred D. Chandler, Jr. provided unstinting guidance and personal encouragement.
My field work in Korea benefited from the assistance and cooperation of many individuals in different capacities. Mong Joon Chung was particularly helpful in facilitating my research at the Hyundai group. I am especially indebted to the following people for helping me to understand the dynamics of shopfloor management: K. S. Choi, Shipbuilding Division, Hyundai Heavy Industries, and S. B. Hong and Y. S. Chough, Pohang Iron and Steel Company. Sun Shik Min of Harvard Business School provided excellent research assistance, as did Choon Heng Leong for an earlier draft. Young-Ki Kim Renaud taught me the basics of the Korean language at Harvard College.
This book benefited from initial editing by Marilyn Shephard, and was also improved by helpful comments from Herbert J. Addison. Jean Smith and Aehyung Kim oversaw final efforts in completing the manuscript. The people in the Word Processing Center at Harvard Business School, some of the world's best typists, bore the brunt of the work.
.
Finally, I am deeply indebted to the following people for intellectual as well as personal support: Richard Bensel, David Cole, Takasni Hikino, Richard R. Nelson, Myra Strober, Lance Taylor, and Raymond Vernon. The book is dedicated to my mother, Regina Scharer Hoffenberg, and to the memory of my father, the late Julius William Hoffenberg.

Contents
Tables and Figures 1. Industrializing through Learning 3
The Case of Korea 3 Learning: A New Mode of Industrialization 3 The Relative Speeds of Industrializations 5 . Korea as a Special Case of Late Industrialization 8· The State II The Process of Catching Up 18 Overcoming Technological Ignorance: From Rent·Seeking to
Investing 20 Plan of the Book 23
PART I The State and Business: History and Policies 25
2. A History of Backwardness 27 The Retarding Effects of a Weak State 27 The Yi Dynasty 29 The Contradictions of l'Vtodernization 31 The Cold War 35 Aid and the Origins of the Diversified Business Group 38 Three Contending Views 42 Conclusion . 52 Appendix 2·1
·' 52
3. The ABCs of ,Japanese and Korean Accumulation 55 Competitive Advantage in Korea versus in Japan 55 The Emergence of an International Division of Labor 57 The Model of Accumulation 63 Trade Policies 64 Investment Policy 72 Conclusion 76 Appendix 3·1 78
4. The Dynamics of Growth 79 The Three Facets of Growth 79 The Government as Entrepreneur 79

x CONTENTS
Government Short-Run Economic policies 93 The Key to Recovery: High Productivity 107 The Growlh-productivity Dynamic of Late
Industrialization 109 Conclusion 1 12
5_ The Spiraling of Market Power 115 Monopoly, Competition, and Liberalization: An
Overview 1 15 Macket Concentration 120 Corporate Strategy Toward Diversification 125 Discipline of Monopoly Power 129 Conclusion 136
6. Getting Relative Prices ·Wrong": A Summary 139 Failure of the Market Paradigm 139 The Insufficiency of the Schumpeterian Alternative 140 The Historical Record: Deliberately Getting Relative Prices
·Wrong" 141 When ·Wrong" Is Right 145 The Disciplinary Mechanism 145 Developmentalism: A Research Agenda 147 Competition in Late Industrialization and the Growth
Dynamic 149 The Diversified Business Group 151 The Growth·Productivity Dynamic in Late
Industrialization 152 ·Wrong" Prices, Right Direction? 153 Conclusion 155
PART II Professional Management and Human Resources 157
7. The Rise of Salaried Engineers: Automobile Manufacturing 159 The Salaried Engineer and Firm Differentiation 159 The Small· and Medium·Size Firm 161 The Modern Industrial Enterprise 164 Learning at the Hyundai Motor Company (HMC) 175 Japan's Influence on Korea's Small- and Medium·Size
Firm 180 The Subcontracting Network of the Hyundai Motor Company
(HMC) 184 Subcontracting: A Summary 187
8. The Paradox of "Unlimitecj" Labor and Rising wages 189 Labor in Late Industrialization 189 Labor Supply 190
Contents
The Rate of Pay 195 The Reasons Behind Rising Real Wages 198 . The Skills of the New Labor Aristocracy of Lilte
Industrialization 208 Conclusion 212
9. The Boom in Education 215 Late Industrialization and the Level of Education 215 The Ambiguities of Korea's Outstanding Investments in
Educqtion 217 The Educational Level of Production Workers 221 The Educational Level of Managers and Engineers 225 Inexperience 227 Rewards for the Elite 229 Foreign Technical Assistance 231 The Chaebol as Young Manufacturers 235 Conclusion 238
. PART III The Dynamics of Dynamic Comparative Advantage 241 10. The Switch in Industrial Leadership 243
Nonlinear Diversification 243 The Textiles Industry 247 Textiles Manufacture Versus Cement-Making 262 The Hyundai Cement Company 266 Conclusion 268
11. TheWorld's Largest Shipbuilder 269 The Competitive Challenge 269
, Government Assistance to Shipbuilding 274 Foreign Technical Assistance 276 The Acquisition of Design Capability 278 Hyundai Engine and Heavy Machinery Manufacturing Com-
pany,l,.td. 279 Intermarginal Changes 280 Organization 286 Summary: Survival of the Fittest 290
12. The Triumph of Steel 291 An Unpropitious Start 291 POSCO's Founding 293 Profitability and Subsidization 296 The Competition 298 Foreign Technical Assistance and the Nature of Steel·Making
Technology 302 Prioritization 304 Summary: The Shopfloor Focus 314 Cross-Subsidization 316
Xi

xii CONTENTS
13. From Learner to Teacher 319 Back-Door Competition 319 From Learner to Teacher 320 Labor Relalions 324
Epilogue 327
Bibliography 331
Name Index 353
Subjecl Index 359

Tables and Figures
Tables
3. 1 Basic Macro Indicators, 1962-1984 56 3.2 Decomposition of Gross National Product Growth Rate� 1962�
1984 57 3.3 Percent Share of Heavy and Chemical Industry and of Light
Industry in Manufacturing Output and Merchandise Exports. 197 1-1984 58
3.4 Export of Manufactures and the Exchange Rate, 1 960-1965 67
3 .. 5 The Coerciveness of Export Targeting: Responses to· question, What'has been the effect of export targets fixed for your firm?, 1974-1976 69
3.6 Proportions of Foreign Trade (Exports Plus Imports) to National Product 7 1
3.7 Savings, Investment, and Consumption. as Percent of Gross National Product, 1962-1984 75
3.8 Cost of Foreign Capital, 1 966-i983 76 3.9 Direct Foreign Investment (DFI). 1965-1985 77 4.1 Gross Profits, Export Expansion. and Loans by Industry, 1971-
1982 86-87 4.2 Profitability of Light anq. . Heavy Industry: Average Rate of
Return on Investment,. 1972-1984 89 4.3 Public Sector Resource Balance. 1977-198 1 90 4.4 Sources of Current Account Imbalances in Current Market
Prices, 1963-1 982 9 1 4.5 Foreign Loans and Investment, 1959-1983 92 4.6 International Comparison of Government Expenditures 93 4.7 External Debt and Debt Service. 1962-1984 95 4.8 Monetary I ndicators, 1 961-1984 97 4.9 Average Periodic Rates of Change in Inflation and It$
Determinants, 1964-1984 1 0 1

xiv TABLES AND FIGURES
4.10 Inflation, Productivity, and Wages in Manufacturing, 1965-1984 102
4.11 Average Debt/Equity Ratio in Manufacturing, 1961-1984 104
5.1 Combined Sales of Top Ten Chael>ol, as Percent of GNP, 1974-1984 116
5.2 International Comparison of Percent Share of Investment in Gross Domestic Product, 1973 and 1983 119
5.3 Structure of Manufacturing Industry: 1970, 1977, and 1982 121
5.4 Comparison of Simple Average Three-Firm Concentration Ratios for Korea, Japan, and Taiwan 122
5.5 Percent Change in Concentration of Economic Power of Business Groups, 1974-1982 . 122
5.6 Percent Aggregate Concentration Rate by Shipment of the Largest Companies in Korea, Japan, and Taiwan, 1970-1982 123
7.1 Percent Distribution of Manufacturing Value-Added by Firm Size, 1973 162
7.2 Percent Growth Rates of Output and Total Factor Productivity by Size of Firm for Manufacturing Sector, 1967-1979 164·
7.3 Percent Distribution of 200 Largest Manufacturing Firms in Korea, Japan, Germany, and United States by Industry 165
7.4 Managerial Resources by Industry, 1983 166 7.5 Background of Top Managers, 1962-1978 168 7.6 Managerial Resources in the Manuf�cturing Sector, 1960-
1980 171 7.7 Managerial Hierarchy, 1984 172 7.8 Elements of a Technological Capability 174 7.9 Size Distribution of Manufacturing Firms by Number of
Employees, 1958-1983 182 8.1 Comparison of Real Nonagricultural Wage Increases in Seven
Late-Industrializing Countries, 1970-1984 196 8.2 Average Earnings in Korean Manufacturing, 1955-
1980 197 8.3 Rate of Wage Increase in Korea for Production and
Professional, Technical, and Managerial Workers, 1965-1984 199
8.4 Percent Change in Labor Productivity and Wages in Manufacturing, 1965-1984 201
8.5 Comparison of Manufacturing Wage Differences by Sex, 1980 204
8.6 Hours of Work in Manufacturing, 1976-1985 205 8.7 Wage Increases in Selected Sectors of Manufacturing, 1965-
1971 207

Tables and Figures xv
8.8 Wage Dispersion among Manufacturing I ndustries in Selected Countries, 1973 and 1982 207
8.9 Status of Training and Education at the Pohang Iron and Steel Corporation (POSCO), 1 968-1984 211
9. 1 Estimated Percent of Total Population Enrolled in School, Selected Countries, 1830- 1954 2 17
9.2 Indicators of Human Capital in Seven Late-Industrializing Countries 2 1 8
9.3 Education Level of WOI:k Force, 1946- 1983 222 9.4 Labor Shortage by Occupation, 1 984 225 9.5 Relative Monthly Earnings by Occupation, 1971-1984 230 9.6 Relative Monthly Earnings by Education, 1975-
1984 230 9.7 Comparison of Relative Occupational Wage Structure in Korea
with that in the United States 231 9.8 Cases of Approved Technology Licensing Agreement by
Country, 1962-1983 233 9.9 Capital Goods Imports from the United States and Japan,
1973- 1984 234 . .
10.1 Technology-Related Functh,ms, "D" Company, 1984 249 10.2 Learning Curve Estimates for Firm "D," 1955- 1981 250 10.3 Wage Differences in Manufacturing Industries: 1970, 1974,
1978, and 1981 25 1 10.4 Labor Productivity in'''L'' Company, 1977-1986 252 10.5 Capacity Additions in "L" Company. 1963-1984 254 10.6 Average Capital/Labor Ratios in Korean Textiles and Cement
Industries, 1966-1979 256 10.7 Pe.letration Level of the Open-End Rotor, 1975-1 983 257 10.8 Share of Obsolete Machines in the Textile Industry,
1982 258 10.9 Proprietary Transfers of Technology in Korea, by Sector and
Plan Period, 1 962- 198 1 263 10 . 10 Hyundai's Involvem.ent in Plant Erections 267 ILl Percentage of New Ship Orders Placed, 1974-1984 270 1 1 .2 Annual Shipbuilding Orders and Completions Worldwide,
1974- 1984 270 .
1l.3 Principal Shipbuilder's Production, 1973-1986 272-73 1 1.4 Value Chains of the Shipbuilding Industry, 1983 272 1l.5 Comparison of Number of Graduates from the Department
of Naval Architecture. Seoul National University and University of Tokyo, 1940-1977 274
1 1 .6 Capital, Labor Hours, and Amount of Bulk Material for 60,000 Deadweight Ton Bulk Carriers, 1979-1986 284
1 1 . 7 Comparison of Distribution of Employment in Shipbuilding, Korea and Japan, 1978 288

xvi TABJ...ES AND FIGURES
12.1 Capacity Additions and Plant Specifications of POSCO, 1970-1988 294
12.2 Cost of Producing Cold-Rolled Coil in Efficient Integrated Steel Firm, Five Countries, 1985 298 '
12.3 Efficiency Measures of Steel-Making, 1985 300 12.4 Dependence on Foreign Engineering at POSCO 309 12.5 Quality Competitiveness of Korean Steel Products Relative to
Japanese Products, 1986 311 '
Figures
2.1 Average Percent Annual Rate, of Change in the Volume of Production, Heavy and Light Manufacturing, 1953-1958 41
4.1 Relationship Between Exports and Real Effective Exchange Rate 106-7
5.1 Degree of Diversification and Coordination of the Modern Industrial Enterprise 124
7.1 The Multidivisional Structure 169 11.1 Inspection Acceptance Ratio 283 11.2 Labor Hours per Compensated Gross Registered Tonnage,
1980-1986 285 , 12.1 Comparison of Cost per Ton Shipped of Hot-Rolled Steel,
1973-1985 299 12.2 Learning Curves for Blast Furnaces 303 12.3 Comparison of Manhours per Ton Shipped of Hot-Rolled
Product, 1973-1985 307 12.4 Capital and Labor per Unit of Output. POSCO, 1973-
1984 308 12.5 Quality of Wire Rod at POSCO as Measured by the Reject
Rate 312 12.6 Quality of Plate at POSCO as Measured by the Reject
Rate 312 12.7 Quality of Hot Coil at POSCO as Measured by the Reject
Rate 313 12.8 Quality of Cold-Rolled Coil at POSCO as Measured by the
Reject Rate 313

Asia's Next Giant


CHAPTER ONE
Industrializing through Learning
THE CASE OF KOREA
This is a book about Korea and how it came to be a major factor in the world economy. But it is also a book about the industrialization process that Korea followed. This process, which will hereafter be referred to as late industrialization, has profound implications for a range of other countries that are also struggling to compete in tht; world of international business. Korea's success in this struggle can thus be seen both as a fascinating story in itself and as an example from which others may learn. It is also an example of a new way of industrializing that challenges long-held assumptions of generations of economic thinkers.
LEARNING: A NEW MODE OF INDUSTRIALIZATION
The First Industrial Revolution in Britain, toward the end of the eighteenth century, and the Second Industrial Revolution in Germany and the United States, approximately 100 years later, shared the distinction of generating new products and processes. By contrast, economies that did not b.egin industrialization until about the twentieth century tended to generate neither, their products and processes being based on older technology. Economies commencing industrialization in the twentieth century transformed their productive structures and raised their incomes per capita on the basis of borrowed technology. They produced using processes conceived by unallied economic and political units. The means by which they managed to compete will be referred to here as learning. 1
The nature and role played by technical knowledge, therefore, separates the industrial revolutions iIi England, Germany, and the United States, on the one hand, from the industrialization that oc-
I Gerschenkron (1962) explored the costs and benefits of backwardness. but he did not systematically examine catching up as a process of learning how to compete.
3

4 ASIA'S NEXT GIANT
cuned in twentieth-century agrarian societies. If industrialization first occurred in England on the basis of invention, and i� it occurred in Germany and the United States on the basis of innovation, then it occurs now among "backward" countries on the basis of learning.
The paradigm of late industrialization through learning generalizes to a diverse assortment of countries with different growth records: Japan (although in many respects it is unique among lateindu.strializing countries) , South Korea, Taiwan, Brazil, India, possibly Mexico, and Turkey. (This list might be expanded, but one cannot add to it the city-states of Singapore and Hong Kong, because neither began from the agrarian or raw material base that is typically taken to be the starting point of industrial transformation.) Growth rates differ among late-industrializing countries, but in all cases industrialization has come about as a process of learning rather' than of generation of inventions or innovations. Learning, moreover, has been based on 'a similar set of institutions. This book explores the nature of these institutions in general and suggests why Korea has performed so successfully. The conventional explanation for why countries like Korea, Japan, and Taiwan have grown relatively fast is that they have conformed to free-market principles. In fact, the fundamentals of their industrial policies are the same as those of other late industrializers. In all cases key prices do not reflect true scarcities. Instead, it is argued in the chapters that follow, Korea has had an outstanding growth record because the institutions on which late industrialization is based have been managed differently.
Industrialization on the basis of learning rather than of invention or innovation is not unique to the twentieth century. The global process of industrialization has always tended to be combined and uneven, with leaders and laggards, forerunners and followers. If England pioneered on the basis of invention in the eighteenth century, Continental Europe and the United States pursued on the pasis of learning in the nineteenth. If Germany were itself an innovator in the nineteenth century, it also studied the examples of early England and other emulators such as France and the Netherlands. The United States in the nineteenth century has been described as both borrower and initiator (Rosenberg, 1972). While many American and German firms were innovative leaders, most -were followers.
Nevertheless, a process of industrialization whose central tendency among leading firms is learning rather than invention or innovation of significantly novel technology is a distinct phenomenon and deserves treatment as such. For individual firms the absence or presence of new technology generation is decisive in determining the basis on which they compete internationally. Innovators are aided in
Industrializing through Learning 5
the conquest of markets by novel products or processes. Learners do not innovate (by definition) and must compete initially on the como. bined b�sis of low wages, sta..��jiJb1iaies--(bi6acl.ly� cor\$.u·\.ied ':�o· include a·wide variety oTg()veinment supp.orts) .... ndillcremental pro� ductivity and quality improvements related to existing pr<IQucts. In turri, differeritmodes of cOIllpeting are associated with differences in firms' strategicfocus.
The corporate office. inclusive of research and development functions. tends to be the strategic focus of companies that compete on the basis of innovation. This is because it is at the administrative level that new technology gets developed and marketed. Critical significance is attached to the organization and operation of research and development because here are created the profit-making oppor-tunities that drive the entiie company.
.
The shopfloor tends to be the strategic focus of firms that compete on the basis of borrowed technology. The shopfloor is the focus because it is here that borrowed technology is first made operational and later optimized. Because products similar to those that the company produces are internationally available, the strategic focus is necessarily found on the shopfloor, where the achievement of incremental, yet cumulative, improvements in productivity and product specification are essential to enhance price and quality competitiveness.
Beginning in the 1960s, learners have moved rapidly into the mature markets developed by innovators. The high level of productivity of long-established innovators has been contested by learners' lower wages, higher subsidies, as well as intense efforts to raise productivity incrementally. Total costs in many industries appear to have run neck and neck (see the discussions of cotton textiles, ships, and steel in later chapters). International competition has heated to a degree that may be unprecedented.
THE RELATIVE SPEEDS OF INDUSTRIALIZATIONS
While the most successful twentieth-century industrtalizers have invited inquiry abput their rapid growth and structural change, the nineteenth-century European emulators have drawn attention to their
.• \ slowness. In the words of David Landes. \j In this effort to study and emulate British techniques. the na-
tions of western Europe were favored by a number of advantages. To begin with, they had behind them an experience of Qrganized and increasingly effective political behavior .... Similarly, their supply of capital and standard of living were sub-

6 ASIA'S NEXT GIANT
stantially higher than in the "backward" lands of today. And with this went a level of technical skill that, if not immediately adequate to the task of sustaining an industrial revolution, was right at the margin. . . . In short. if they were in their day "underdeveloped," the word must be understood quite differently from the way it is today . . .. Nevertheless, their Industrial Revolution was substantially slower than the British.
Why the delay? Surely, the hardest task would seem to have . been the original creative acts that produced coke smelting, the mule, and the steam engine. In view of the enormous economic superiority of these innovations, one would expect the rest to have followed automatically. (Landes, 1969.pp. 125-6)
Why indeed the delay? And why was it that industrialization beginning iIi the late nineteenth century and then following World War II appears to have progressed far faster than that of the Napoleonic War period?2 Part of the answer lies in the advancement of science, which is worth discussing here briefly. Th�_�Qy�p.ceme.QU?.f.!�c:nce underlies the distinction between industri,alizing by inventioI} in the First Industrial Revolution and industrializing by-innovation in Jhe'
Second; Scientific advancement also had an electrifying effect on the growth rates of twentieth-century latecomers .
. As the terms are typically used, invention and innovation are intimately connected. because innovation presupposes invention in a, logical sense. In textbook treatments of new technological developments, invention is associated with the idea and comes first, followed by innovation or the application of the idea to commercial uses. Invention and innovation are regarded here. however, not as abstract stages, one preceding the other in new technological discoveries. but rather as descriptions of particular historical periods, inv,ention preceding innovation in an intergenerational sense. As characteristics of two distinct time periods, one key difference between the two lies in their degree of scientific content . . The scientific content of the inventions of the First Industrial Rev
olution moved the world far beyond the mysticism of the Middle Ages toward a transparent understanding of how mechanical devices worked, but discoveries occurred primarily by observation. trial. and error. The Second Industrial Revolution. however, represented a discrete giant step forward insofar as technological change began to occur, far more than previously, on the basis of theory and experimentation (Bernal, 1965).
2 Maddison (1982) provided time series data on trends in output and per capita income. His research suggests that both variables greW faster in sequentially later industrializers.

Industrializing through Learning 7
The application of science to production provided the basis for the stream of German and American innovations that lowered the �ritish flag. For three interrelated reasons, the advancement of science also made it far easier for technology to be transferred, and so science had a profound effect on the "backward" countries: ( 1 ) Although technology remained (and still remains) idiosyncratic even in basic industries, higher scientific content increased its codifiedness or explicitness. making it more of a commodity and hence more technically and commercially accessible and diffusible from country to country.s (2) The application of science in the fields of transportation, communications, and management improved the means of technology transfer. Technical assistance, not being dependent on the know-how of a particular person, can now be dispatched over longer distances to larger numbers of people more quickly and anonymously. (3) The crowding out of art by science on the shop floor has dealt a blow to the skilled craftsworker.4 The rise in the scientific content of technology has made operations far ,easier to transfer to a group of latter-day learners among whom all-around mechanical skills are scarce.
The impact of the advancement of science on the "backward" regions was ambiguous. however. Despite the benefits, it created a far wider gap in relative income levels and technological capabilities than existed previously between nations, and it also strengthened the hand of the stronger nations over the weaker. In any event, taking all factors into consideration, the speed with which late learners in the twentieth century have industrialized may not be any greater than that of the European emulators in the early nineteenth century. What is decisive is how one dates the onset of industrialization and how one decides when a country can legitimately be described as, industrialized.
If one dates the start of industrialization in the European emulators from, say,' 1776, when the new economic order in Britain was given theoreticaf recognition by Adam Smith; and if one dates the closing of the gap between Europe and England frorp, say, 1 850 to 1 873--or about ninety years later-after which England began to be overtaken; then Korean industrialization. dating from the time Korea was opened by foreign imperialists, does not appear especially fast. Korea's industrialization can be said to have begun in the 18705, when the 1 ,OOO-year-old Yi dynasty began to shatter as a conse-
, A view of technology as idiosyncratic is developed at length by R. R. Nelson and Winter (1982). See also a piece by R. R. Nelson (1987) specifically related to "backward" countries.
• That technological change deskills workers (below the management level) is argued by Braverman (1974). For a critique of his argument. see Kelley (1986).

8 ASIA'S NEXT GIANT
quence of Japanese intrusion, much as the Tokugawa regime in Japan had been shaken by the appearance of Admiral Perry only two decades earlier. Then followed a delay in the onset of industrialization in Korea of about ninety years, until the 1960s, when Korea's growth rate accelerated. Moreover, the revolutionary period of Korean industrialization continues, in that rapid growth and structural change are still in full swing and Korea has not yet come anywhere close to ca,tching up with the most advanced countries. Even in mature industries, labor hours required per unit of output in the late 1970s were far higher in Korea than in Japan, by a scalar that averaged roughly 2.8.5 In the mid-1980s, Korea's share of industrial activity arising from its own R&D laboratories was minuscule. In any event, Korea's growth rates only surpass · all records if industrialization's start is assumed to be the point of acceleration in the 19605.
Nevertheless, why late industrialization was slow in starting in Korea can be explained by the same set of factors that explain why lateindustrializing countries progressed faster than the European emulators once their industrialization got under way. The institutions of late industrialization that underscore its success, and whose absence is responsible for delay, are the following: an interventionist state, large diversified business groups, an abundant supply of competent salaried managers, and an abundant supply of low-cost, well-educated Jabor. These institutions are the focal point of later chapters.
KOREA AS A SPECIAL CASE OF LATE INDUSTRIALIZATION
In late-industrializing countries, the state intervenes with subsidies lkliberately to distort rel.;ztive prices in orlkr to stimulate economic activity. This has been as true in Korea, Japan, and Taiwan as it has been in Brazil, India, and Turkey. In Korea, Japan, and Taiwan, however, th�.,. state has exercised discipline over subsidy recipients. In· exchange for subsidies, the state has imposed performance standards on private firms. Subsidies have not been giveaways, but instead have been dispensed Ot), the principle of recipro.city. With more disciplined firms, subsidies and protection have been lower and more effective than otherwise . . .
Below the level of the state, the agent of expansion in all late-indus-
S The industries included in this calculation are cotton tex.tiles, paper. rubber tires, caustic soda. cement. iron castings. and ball bearings. The e·ngineering method was used to calculate productivity. which involves computing required labor hours per unit of output. The study was undertaken by Han'guk Saengsansong Cent'a (Korea Productivity Center. 1985). For a comparison of productivity levels and growth rates in Korea and Japan. calculated as output divided by employment, see C. K. Kim, Yoo. and Whang ( 1 984). .

Industrializing through Learning 9
trializing countries is the modern industrial enterprise, a type of enterpris� that Chandler (1977) described as large in scale; multidivisional in scope, and administered by hierarchies of salaried managers. Evert' in Taiwan, an economy with a reputation for small-scale enterprise, the large-size firm (often a government enterprise) spearheaded industrialization in the early stages of growth (as will be discussed in Chapter 7). In Korea, the modern industrial enterprise takes the form of diversified business groups, or chaebol, whose size and diversity are similar to those of the zaibatsu, japan's prewar big business groups. Diversified business groups are common to all lateindustrializing countries, but those in Korea are especially large. The Fortune list of 500 international private non-oil-producing firms in 1986 included ten from Korea and only seven from all other developing countries combined (Fortune, 1987). The size of the chaebol and their broad diversification into non related products have allowed them to survive the hardships of late industrialization, to penetrate the lower end of numerous foreign markets, and to supplant the need for multinational firms to undertake major investments in targeted industrie,s. Whereas Korea has depended heavily on foreign loans, it has enth�ained almost no direct foreign investment outside the labor-intens'iV�' sectors.6
Salaried engineer: are a key figure in late industrialization because they are the gatekeepers 0 foreign technology transfers. The protagonist of industrialization has shifted from the entrepreneur in the late eighteenth century, to the corporate manager in the late nineteenth, to the salaried engin�er in the late twentieth. 'Squeezed between the state on ,the one hand and the salaried engineer on the other, the private entrepreneur's usefulness in the multidivisional enterprises of late industrialization appears much reduced when measured br the standards of the entrepreneurial h istories of advanced countries.
Salaried engineers have performed especially well in Korea because society has invested heavily in education, from the primary level on up. In terms of sheer quantity, enough engineers have been trained to ensure that sufficient numbers pursue the career intended by their education. A large number of engineers has meant competition among them for the best jobs and the fastest promotions, thereby driving up produc�ivity.
While a strategic focus on the shopfloor may be a tendency in late
6 The chaebol themselves have already, begun to invest overseas as a way to jump over foreign tariffs, provide parts for their exports (in, for example, the case of automobiles), tap into high technology (in, for example, the case of electronics), and obtain raw materials (sbe Maeil Kyongje Sinmun, 1986e, 1 986h). According to data from the Ministry of Fiqance, investments overseas by Koreans totaled $738.5 million as of March 3 1 , 1987,43% of which 'was in North America.

10 ASIA'S NEXT GIANT
industrialization, this tendency may be stronger, depending on the country. Chapter 7 highlights three outstanding points in Korea's case. First, Korean firms have shown a preference for hiI'ing engi- , neers over administrators. Beginn�ng in the early 1960s, while .the number of managers of all types increased modestly, the number of engineers grew far more quickly. Second, even as managerial capitalism in Korea has spread, overhead has been kept in check. The ratio of white-collar workers (excluding clerks) to blue-collar workers remained constant between 1960 and 1980, even declining slightly. Korean firms have not created huge overheads; instead they have appointed managers to production positions on the shop' floor, which is where the competitive advantage of late-industrializing countries lies. Third, the number of layers of management has been kept quite small in Korea. Engineers at the plant level keep in dose contact with the ranks.
Turning now to production workers, late industriaLizations have exceptionally well-educated work forces by comparison with earlier industriaLi: zations. Moreover, the wages of these workers have generally been' prevented from rising rapidly by a conspini.cy of forces: political repression, an unlimited labor supply at the onset of growth, an absence of international opportunities to migrate, and the insignificance of a class of skilled crafts-persons, who were the organizers of trade unions in earlier periods. Korea, however, like Japan before it, has set a number of world records in the area of labor, which has made its work force unusually productive.
On the one hand, Korea appears to have the longest work wee�, in the world, a throwback to the work week in effect in the harsh factory system under Japanese colonialism. On the other hand, Korea's real-wage growth rate may exceed that of any previous industrial revo� lution (with Japan's a close second) and that of any contemporary one. High average real-wage increases have acted as an inducement to workers to produce, and to managers to acquire more technological capabil� ity. In addition, Korea's work force is highly segmented, which has energized a new labor aristocracy. Korea has the dubious distinction of having one of the highest gender wage gaps, an honor shared by' Japan. On average, Korean women earn less than half of what men earn. Korea; like Japan; also has one of the largest manufacturing wage dispersions between light and heavy industry, allowing both types of manufacturing activity to coexist.
All of these institutions are discussed in detail in later chapters. In each case there is a common thread that binds ,Korea, Japan, and Taiwan with other late-industrializing countries. In contrast, there is a distinct pattern in all three cases that makes their relatively fast

IndustrIalizing through Learning 11
growth rates more comprehensible. Rather than introducing each institution of late industrialization in more detail, however, a further introduction to the institution of the state only is presented here because the state's role in late industrialization is especially controversial.
THE STATE
The first step toward understanding how "backward" cOl,lOtries in the twentieth century eventually expanded is to ask how they fell behind relative to the industrialized world in the first place. The development process is enormously complex, but one can say as a first approximation that ( 1 ) the onset of economic expansion has tended to be delayed by weaknesses in a state's ability to act and (2) if and when industrialization has accelerated, it has done so at the initiative of a strengthened state authority.
The reasons why some countries in the twentieth century have found themselves behind others in income and wealth can be grouped tentatively into four categories: natural resource endowment, population, market forces, and institutional factors. The natural resource explanation for backwardness can be dismissed out of hand. The association between resource endowment and per capita income is visibly weak, Korea and Japan being cases in point. The attribution of underdevelopment to excess population is now also pretty well discredited. Population explosions are currently believed not to haye led to failure to industrialize but rather to have emerged as a consequence· of such failure.7
There remain, therefore, two major contending views-the market and the institutional. The market explanation for economic development poses as the grand mover and shaker of the past 200 years of economk progress. Nevertheless, whereas no one could possibly deny the overreaching role that the market has played in speeding growth, one must distinguish between the market and the. market mechanism. The former refers to the means to satisfy supply� and demand. The latter refers to rules for allocating resources. Ali industrializations have made use of the market. However, defianceof the market mechanism does not explain why late industrializers delayed so long in starting to expand, nor can adherence explain why they eventually succeeded in growing.
The economic histories of "backward" countries are quite varied,
7 The argument that rapid rates of population increase are the consequence of failure to develop was most cogently put by Myint (1964).

12 ASIA'S NEXT GIANT
yet the archetypal late industrializer in the twentieth century was at one time or another a colony of one of the Great Powers (japan is unique as a learner among the potentates), Colonial histories differ, but the typical economic regime of a colony was quite exemplary from the viewpoint of competitive theory. Basically. colonies followed policies of free trade and exploited their comparative advan� tage in the agricultural commodities markets. Their growth. therefore, could not be said to have been stunted by failure to be guided by the market mechanism,s Indeed, it could be said to have been stunted by failure to follow interventionist policies, namely, throwing up trade barriers and providing subsidies to promote local industry.
This leads to the final explanation, one related to institutions, not. least of all the state. Quite simply, industrialization was late in coming to "backward" countries because they were too weak to mobilize forces to inaugurate economic development and to fend off a wave of foreign aggression begun in the second half of the nineteenth century. Their weakness, moreover, arose from internal social con:' ·· flict-ethnic, racial, regional, or class. Such conflict precluded arrogating enough power to a central authority to prevent foreign intervention, invasion, or the catastrophic loss of statehood altog�ther.
States in modern history have always intervened to spur economic activity. Even the First Industrial Revolution, whose guiding principle was laissez-faire. is now being reassessed by historians with this axiom in view.9 The British government intervened to maintain law and order and to minimize the flight of technological capability to foreign lands, albeit ftat-footedly (Henderson, 1954). In the second phase of intervention, that associated with the Second Industrial Revolution in Germany and the United States, state intervention intensified because the economies of Germany and the United ·States were required not merely to industrialize but also to catch up. We can think of infant industry protection as the primary characteristic
8 Reynolds argued that under colonial regimes of free trade, the "backward" regions grew at a fairly rapid clip, although to be sure, there were exceptions to the rule. According to Reynolds, "Against the view that 'life began in 1950: . , . the Third World has a rich record of prior growth, beginning for most countries in the 1850- 1914 era," (Reynolds, 1985, p. 4). In anticipation of the obvious objection, that developing countries are still desperately poor, Reynolds wrote, "Certainly people in Western Europe and the United States are much better off than ·people in Sri Lanka [I he example he used), though not as much better off as the World Bank Table suggests . . . conversion from the local currencies to U.S. dollars at official exchange rates exaggerates the actual difference in consumption levels" (p. 40).
9 See, for example, Taylor (1 972).

Industrializing through Learning 13
of this era. Analytical coherence has been provided by writers like List ( 1 856) arid Sombart ( 1933) . 10
To catch up in the twentieth century has required sti11 heavier doses of government support because backwardness has been relatively greater. The instruments of intervention have been cumulative. Not only have states in late-industrializing countries intervened by protecting infant industries. T�ey also ,have intervened by providing private investors with a battery of incentives that. simplified. boil down to subsidies. The tariff epitomizes the age of infant industry protection. The subsidy, which includes tariff protection and financial incentives, epitomizes the struggle to industrialize after the Second World War.
As Gerschenkron (1962) has pointed out, backward countries are fortunate to have a backlog of technologies to draw upon. Yet Gerschenkron failed to give equal weight to the proposition that the more backward the country, the harsher the justice meted out by market forces. The inherent conflicts of the market apply to all users. rich and poor alike. BUt the conflicts are sharpest among the least wetl endowed. Countries with low productivity require low interest rates to stimulate investment. and high interest rates to induce people to save. They need undervalued exchange rates to boost exports. and overvalued exchange rates to minimize the coSt of foreign debt repayment and of imports-not just imports of raw materials, which rich and poor countries alike require, but also of intermediates and capital goods, which poor countries alone are unable to produce. They must protect their new industries from foreign competition, but they require free trade to meet their import needs. They crave stability to grow, to keep their capital at home. and to direct their investment toward long-term ventures. Yet the prerequisite of stability is growth.
Under such disequilibrating conditions. the state's role in late in.dustrialization is to mediate market force,li. The state in late industrialization has intervened to address the needs of both savers and jnvestors. and of both exporters and importers. by creatmg multiple prices. Some Interest rates are higher tpan others. Importers ana �rters face different prices for foreign currency. Insofar as the state in late industrialization has intervened to establish multiple pnces
1n the same market, the state 'cannot be said to have gotten relative prices "ris:ht," a,! dictated by supply and demand. In fact, the state
10 The extent of tariff protection in the United States is the least appreciated. McCraw ( 1986). however. argued that protection rather than free trade tends to be the rule in American history.

14 ASIA'S NEXT GIANT
in late industrialization has set relative prices deliberately "wrong" in order to create profitable investment opportunities.
Korea is no exception to this general rule. Chapter 3 examines accumulation in Korea at the industry level, a departure from typical practice because most studies of government intervention in lateindustrializing countries tend to be highly aggregative. The industry focus of Chapter 3 is cotton spinning and weaving, Korea's leading sedor in the 1960s. Even in a relatively labor-intensive sector like cotton textiles, the government intervened to protect local industry from Japanese competition, intervention taking the form of tariffs, quotas, export subsidies. subsidized credit, .and so forth. As later chapters indicate. subsidization rose further in the heavy industries.
Korea, therefore, provides supporting evidence for the proposition that economic expansion depends on state intervention to create price distortions that direct economic activity toward greater investment. State intervention is necessary even in the most plausible case's of comparative advantage. becaus� the chief asset of backwardnesslow wages-is counterbalanced by heavy liabilities. Where Korea differs from most other late industrializ.ing countries is in the discipline its state exercises over private firms.
'
Discipline by the state over private enterprise was part and parcel of the vision that drove the state to industrialize. Park Chung Hee, who presided over Korean industrialization from 196 1 until his assassination in 1 979, revealed the vision in 1963 in a book modestly entitled The Country, the Revolution, and I. Park's ideas were influenced by the "revolutionaries" Sun Vat Sen, Kemal Pasha, Nasser, and the Meiji rulers, From the Meiji, the only unreservedly successful of the revolutionaries, Park learned the importance of indigenizing foreign ideas, of crowning a political hierarchy with an emperor (the I of the Revolution), and of allowing "miIlionaires who promoted the reform" to enter the central stage, "thus encouraging national capitalism" (Park, 1963� p. 1 20). Tpe millionaires were envisioned by Park to have created large-size plants to realize econo� mies of scale. He saw the government's role as one of overseeing the millionaires to avoid any abuse of power. . . ..
The discipline exerted by the state, and the rise of big business, were interactive. Big business consolidated its power in response;: to the government's performance-based incentives. In exchange 'for . stunning performance in the areas of exports, R&D, or new product introduction, leading firms were rewarded with further licen�es to' expand, thus enlarging the scale of big business in general. In exchange for entering especially risky industries. the government rewarded entrants with other industrial licenses in more lucrative sec-

Industrializing through Learning 15
tors, thus furthering the development of the diversified business group in particular.
Discipline may be thought of as comprising two interrelated dimensions: (a) penalizing poor performers; and (b) rewarding onl}' good ones. Evidence of the former has taken two guises in Korea. First, in industries weakened at various times by over-expansion (some heavy industries, construction, shipping), firms have been subject to rationalization, as discussed in Chapter 5. Second, discipline has taken the form of refusal on the part of the government to bail out relatively large scale, badly managed, bankrupt firms in otherwise healthy . industries. The bail-out process has been highly politicized insofar as the government has typically chosen close friends to do the taking over of troubled enterprises (the production facilities of troubled enterprises are never allowed to rot). This corruption notwithstanding, when the victim of bankruptcy has appeared to be poorly managed, the government has deserted it. ·
One finds evidence of the government's cold-bloodedness towards poorly managed firms in distress in a variety of otherwise prosperous industries. For example, a company named Shinjin had a larger market share in the Korean automobile industry in the 19605 than Hyundai Motors. Shinjin's owner, however, could not survive competition from Hyundai's "Pony" and the oil shock in the 19705. The company went bankrupt and the government, as banker, transferred Shinjin's holdings to Daewoo Motors. Another early automobile manufacturer, Asia Motors, was also abandoned (Amsden and Kim, 1985). In the cement industry, the largest producer in the 1970s went bankrupt because it tried to optimize an old technology rather than switch to a new one. Its production facilities were transferred by the government to a chaebol, the Ssangyong group, owned by one of the ruling party's elders. The Taihan group. a pioneer in the electronics industry, had an ailing consumer electronics division which failed. Eventually the government oversaw its transfer to Daewoo Electronics. Construction firms such as Kyungnam (merged into the Daewoo group) and Samho (acquired by Daelim Engineering) are typical cases of firms that although they once enjoyed government support, were abandoned after .going bankrupt-when other firms in their industry were prospering-for reasons which observers generally agree were related to incompetence. A badly managed chaebol of considerable size that the government recently punished with dismemberment was the Korea Shipbuilding and Engineering Company. The Kukje-ICC group has also been pilloried .
Of greater importance to the credibility of the disciplinary process in Korea than punishing poor performers, however, has been insur-

1 6 ASIA'S NEXT GIANT
ing that the government's friends-most of whom have undoubtedly been bailed out. on at least one occasion-have generally performed well. This dimension of discipline has been critical because so much of Korean industria,lization has involved rewarding the same small set of government friends with favors for expansion. The chapters that follow, therefore, concentrate on providing evidence that repeated support by the government to a small set of big business groups was exchanged, de facto, for good performance. Good performance is evaluated in terms of production and operations management rather than financial iQdicators. Evidence comes from fairly detailed case studies of approximately thirty-five enterprises in the textile, cement, paper, steel, shipbuilding, general machinery, automobile, and construction industries. Several subsidiaries within a business group were studied (five in the case of Hyundai, three in the case of Samsung) to analyze, among other issues, whether repeated patronage by the government was justified on efficiency grounds.
The sternest discipline imposed by the ,Korean government on virtually all large size firms-no matter how politically weli connectedrelated to export targets. There was constant pressure from govern: ment bureaucrats on corporate leaders to sell more abroad-with obvious implications for efficiency. Pressure , to meet ambitious export targets gave the Big Push into heavy industry its frenetic character. Additionally, firms have been subject to five general controls in exchange for government support.
First, the government has owned and controlled all commercial banks. One of the first acts of the government of Park Chung Hee was to nationalize the banking system. (The government of Syngman Rhee had denationalized it a decade earlier to appease American pressures.) Although pressures to liberalize in the 19805 led the government to privatize commercial banks, ' thereby strengthening aggregate economic concentration and income inequality, the government maintained its control over commercial banking. I I Governm�nt
I I I Korea has a reputation for relatively equitable income distribution; yet the statistics on income distribution published by the Korean government and the Korea Development Institute in the 1980s are improbable. (See for example, the figures contained in a paper by Suh and Y. H. S. Cheong, 1986.) They purport to suggest that the size distribution of income in Korea is still highly equitable by comparison with the developing countries. (For early results on income distribution in Korea, see Chenery and Ahluwalia, 1 974.) Yet these findings are counterintuitive, because Korea's rate of aggregate economic concentration and wage inequalities are among the highest in the world (suggested in later chapters). Official measures of income distribution also ignore the "informal sector," which is huge. (See an unpublished paper prepared for the World Bank by Bhalla, 1979.) The statistical findings by the Korean government and Korea Development Institute of relatively equitable income distribution partly arise from the fact that income is fairly equitably distributed in agriculture, and even

Industrializing Ihrough Learning 1 7
control of the purse has helped orient the chaebol toward accumulating capital rather than toward seeking rents.
Second, in luring firms to enter new industries with the plums of protection and subsidies, the government has imposed discipline by limiting the number it has allowed to enter (although usually to not fewer than two firms per industry). This has ensured the realization of scale economies and the rise of the mammoth business groups that the government foresaw as necessary to build basic industry. In the 19605 and 1 970s, the government became premier entrepreneur by using its industrial licensing policies to determine what, when, and how much to produce in milestone investment decisions. 12
Third, discipline has been imposed on "market-dominating enter;.' prises" through yearly negotiated price controls, in the name of curbing of monopoly power. At the end of 1 986, as many as 1 10 commodities were controlled, including flour, sugar, coffee, red pepper, electricity, gas, steel, chemicals, synthetic fibers, paper, drugs, nylon stockings, automobiles, and televisions. 13
Fourth, investors have been subject to controls on capital flight, or the remittance of liquid capital overseas. Legislation passed in the ' 1960s (T'ukpy61 pojen kaching ch6b6lpop) stipulated that any illegal overseas transfer of $1 million or more was punishable with a minimum sentence of ten years' imprisonment and a maximum sentencc . of death. In the 1 980s, the degree of compliance with the law has ' fallen into doubt.14 Nevertheless. in the two preceding decades, its , ' harsh terms are believed to have been a credible deterrent to private
in the 19805 agriculture accounted fOT about 30% of employment. A study by Choo ( 1 987) indicated that income distribution is more equitable for agricultural households than for nonagricultural households (both worken and self-employed), See also the discussion in Chapter 2 on the distribution of wealth.
12'ln the 19805 the government "liberalized" industrial Iic;ensing 'but still exerted control over who could enter new or old industries, or expand capacity. by means of the following measures: ( I ) the Korean Antitrust Law. which prohibits firms from controlling more than 40% of the assets of their subsidiaries (this measure is designed to control the chaebol's ability to expand/diversify); (2) credit controls. which set ceilings on debt-equity ratios and/or debt-sales ratios (to control further the chaehol's ability to expand/diversify); (3) a ban On large firm's entry imo industries designated for small- arid medium-size firms; (4) a ban on large firm's entry into industries which supply large firms; and (5) a ban on expansion in. or entry into. industries subject to government "rationai'ization,"
13 Kyongje Kihoekwon ( 1 986). I. Still. a bankrupt shipping magnate was believed to have cOlpmitted suicide in
1987 for fear of being prosecuted under the law's terms. See BK ( 1 987a). K. M. Kim ( 1 987) discussed the extent of capital flight and legislation to ,control it. Kim said Morgan Guarantee figures on capital flight are exaggerated because they include direct foreign investments by Koreans. but that it is unthinkable that capital Hight does not exist.

18 ASIA'S NEXT GIANT
investors who might otherwise have used public subsidies to buik� . personal fortunes abroad. '
Fifth, the middle classes have been taxed, and the lower classes have received almost nothing in the way. of social services. This has enabled a persistent deficit in the government account to reflect longterm investments.
It is unclear whether the strong economic measures taken by the Korean state could have been taken under political democracy, although Japan, the etatist European countries, and recent events in Korea all suggest that such measures and political democracy are compatible. What is dear is that, without a strong central authority, ' a necessary although not sufficient condition, little industrialization may be expected ' in "backward" countries. Even getting relative prices" "right" according to textbook theory would require a state strong enough to battle whoever stood to suffer from a loss of government support.
THE PROCESS OF CATCHING UP
Landes ( 1969) mentioned labor supply only briefly in his analysis of catching up, and he certainly did not view abundant labor as Europe's competitive asset in industrialization. To the contrary, he saw the attainment of competitiveness by learners in the nineteenth century as being burdened by low labor costs. He argued that after industrialization gained momentum in Britain, the same abundant supply of impoverished rural laborers that had made possible Europe's prefactory industry began to act as "a deterrent to mechanization and cOilcentration" (p. 1 39). For Gerschenkron ( 1 962) as well, labor did not lend a competitive advantage to late developers because a suitable labor force did not exist: ". , . industrial labor, in the sense of a stable, reliable, and disciplined group that has cut the umbilical cord connecting it with the land and has become suitable for utilization in factories, is not abundant but extremely scarce in a backward country" (p. 9).
The creation of competitiveness on the basis of an abundant, relatively well-educated labor supply is the key difference of latter-day twentieth-century learning, In the nineteenth century, the United States and Germany caught up with Britain on the basis of innovation, not on that of cheaper labor. As we shall see in a later chapter, even when Japan penetrated deeper into world markets after the turn of the century, its cheap labor was but one of several assets it used' to gain market share. Therefore, the conquest of world markets, beginning in the mid 1960s, by late-industrializing countries on the almost exclusive basis of low wage rates represents a new phe-

Industrializing through Learning 19
nomenon. a truly new international division of labor. Nevertheless, firms have still had' to be subsidized in order to compete. even before any attempts to move beyond the light manufactures, and certainly after. '
After a country invests in labor-intensive manufactures, the next logical step, from both a technical and demand-side point of view, is to invest in heavy industry. Subbranches of heavy industry prosper even in small countries, as evidenced by the composition of industry in Austria, Belgium, and Switzerland. (The only advanced country that does not appear to have some heavy industry is Denmark.) Yet the heavy industries have drawn criticism from economic historians and advisors alike for being an irrational symbol of liberation from backwardness and a violation of comparative advantage.
Symbolism apart, the real significance of the heavy industries for late industrialization lies in the turning point they represent for the unit of production and the basis on which this unit competes. First, with the heavy industry sector comes the' modern industrial enterprise, and hence salaried management. The salaried management of the cotton spinning and weaving industry in Korea is far less professional than that of the heavy industries. Second, with the heavy industry sector comes a new mode of competition-4lligopoly. Of equal significance, ,the transition from light to heavy industry involves a transition from competing on the basis of cheap labor to competing on the basis of modern facilities and skills. given whatever labor costs made entry possible. It usually follows that the target of competition is directed away from low-wage firms to firms that are also competing on the basis of modern facilities and skills, whatever their initial entry costs. Such firms tend to be found mainly in advanced countries. For late industrializers, therefore, the transition from light to heavy industry involves a transition from competing against firms from other low-wage countries to competing against firms from highwage ones that have access to vasdy more experience and technical expertise.
Complicating the process of catching up for late-industrializing countries is the fact that the progression from light to heavy industry has not be;en undertaken by the same set of firms. In Korea, leading firms ' in the light industries did not become the leading firms in the more technically complex industries, with the exception of electronics. The production of black-and-white television sets allowed big , chaebol like the Samsung and Lucky-Goldstar groups to advance from assembly to higher value-added activities in consumer electronics, and from there (Q computer electronics. Nevertheless, electronics prod!lcts accounted for a small share of total exports---{)nly 10% in 1976 (before the rise of heavy manufactured exports) and only 1 1 % in

20 ASIA'S NEXT GIANT
1984, afterward (Bank of Korea, various years [a]). Korea's major exports from 1965 to 1 975 were apparel, cotton textiles, and miscellaneous manufactures. In the case of cotton spinning and weaving, there were almost no technical or managerial linkages to newer industries. The cotton textiles firms that benefited internally from international competition in the form of exposure to better management techniques and improved production processes did not serve as the organizational building blocks for the economy's more skilland capital-intensive pursuits. None of the leading chaebol evolved from a base in cotton textiles (although one had a baSI:! in worsteds). With profit-maximizing horizons that were short term, entrepreneurs who were conservative, and managers who were oriented more toward the art than the science of production, cotton textiles firms did not become the agents of further industrialization.
Catching up, therefore, was an involuted process, as discussed in Part I I I of this book. The dynamic driving comparative advantage involved a discontinuity, the leading sector of the 1960s not providing the initiative for diversification in the 1970s. It was also the diversified business group that tended to penetrate new industries, not the �pecialized single-product firm, making the dynamics of dynamic comparative advantage all the more different from the textbook case (see Chapter 1 0).
OVERCOMING TECHNOLOGICAL IGNORANCE: FROM RENT-SEEKING TO INVESTING
Whatever the time period and whatever the firm structure, learners rely heavily on foreign know-how to narrow the gap. If they are to be at all successful at learning, they visit international expositions, attend conferences and lectures, read technical journals, hire experienced workers, visit overseas plants, engage foreign technical assis- . tants, consult machinery suppliers, and buy, borrow, beg, and steal foreign designs . . The form of technology acquisition has tended to change, however, as technology itself has become more science�based and as the firm has come to be viewed less as a means to earn · a livelihood and more as a means to earn a profit. The central ten-
.
dency has shifted from the absorption of foreign technology through copying and self-teaching to the adoption of foreign technology through investing in foreigri licenses and technical assistance. The former mode of technology acquisition may be called imitation, and . the latter, apprentice�hip (see Amsden and Kim, 1 985b).
In Korea, massive imports of foreign licenses and assistance have been viewed as a means to attain technological independence, and thus as part of a larger effort, in both the public and private spheres,

Industrializing through Learning 2 1
to avoid foreign control. Indusirlalization has occurred almost exclusively on the basis of nationaIly owned rather than foreign-owned enterprise. Foreign technical assistance has been purchased in preference to depending on foreigners to run Korean plants. Whether in Korea's shipyards, steel mills, machinery works, automobile plants, or electronics factories, the credo has become, "Invest now in inhouse technological capability-even if outside expertise is cheaper� to reap the rewards of self reliance later." .J
To understand how Korea attained competitiveness, it is necessary to understand the nature of the technological backlog that Korea, and other late learners like it, borrowed. This is most easily accomplished by drawing a comparison between Korea and a still earlier industrializer, Germany, during the stage of its catching up. Veblen has written on imperial Germany, the forerunner not just of Korea but also of Japan. He drew a comparison between Germany's assimilation of foreign technology and England's borrowing from Continental Europe during the period of Tudor rule. According to Veblen,
The necessary technological proficiency of Germany was of a kind to be. readily acquired; much more so than the corresponding technological proficiency acquired by the English in Tudor times by borrowing from the Continent. In this earlier English case what had to be borrowed and assimilated was · not only a theoretical knowledge and practical insight into the industrial arts to be so taken over, but a personal habituation and the acquisition of manual· skill on the part of the workmen employed; a matter that requires not only insight but long-continued training of large numbers of individuals-apprenticeship . . . . (1915, p. 187) 15
By contrast, Veblen also argued,
The technology which Germany borrowed in the nineteenth century is a different affair in respect of the demands which it makes on the capacities and attention of the community into which it is introduced. It is primarily an affair of theoretical knowledge, backed by such practical insight . into its w.orking conditions as may be necessary to the installation of the mechanical equipmept. In all this there is little of an obscure, abstruse or difficult kind, except for such detailed working out of technological applications of theory as caIl for the attention of expert specialists. (p. 188)
15 In the next four paragraphs, all page references are to Veblen.

22 ASIA'S NEXT GIANT
Like the Germans before them, Korean firms were generally not taxed by the need for their operatives to acquire manual skills. Few worker apprenticeships existed in Korea, and formal vocational training did not commence immediately even in some of the largest firms; Although the chaebol sent vast numbers of employees abroad for training, the incidence was greatest at the upper end of the job hierarchy�although inclusive of foremen: And whereas large numbers of technical assistants from abroad consulted in Korea, including operatives with specialized skills, little effort was made to have them settle in Korea. A far graver problem for Korea than for Germany, however, was the acquisition of theoretical knowledge. The problem for Germany, according to Veblen, was minor. and was soon manifested by Germany's success at innovating. Korea, on the other hand, lacked theoretical knowledge at the world frontier, not only in the machinery-building sector, which Veblen dwelt on, but also in the continuous-process industries and, to an acute degree, in electronics. The benefits of backwardness notwithstanding, therefore, the shift of the world technological frontier in the century after Germany industrialized left Korea relatively further behind, and made it more difficult for Korea to solve what even for Germany was the most intransigent problem of technology transfer: the detailed working out of technological applications of theory.
The problem of technology transfer, however, cannot be seen merely in technical terms. Socially, it touched on the tribulation common to all early capitalist development: of getting adventurers in the field of business to take technology seriously. According to Veblen, what contributed to the triumph of manufacturing over finance as the dominant mode of profit-making in Germany was that, "These German adventurers in the field of business, being captains of industry rather than of fi"nance, were also free to choose their associates and staff with a view to their industrial insight and capacity rather than their astuteness in ambushing the community'S loose change" (p. 194). The German production engineers who were hired advanced the notion that industrialization depended on technical competence. Veblen stated,
The responsible staff and corps in these industries, being men who had come through the schools instead of through the country store and the pettifogger's law office, were not incapable of appreciating that range of theoretical and technical knowledge that is indispensable to the " efficient conduct of modern industry; and so the German industrial community was as surely and unresistingly drawn in under the rule of the technological expert as the American at about the same period [the late nine-

Industrializing through Learning
teenth century] was drawn in under the rule of the financial strategist. (pp. 1 95-6)
23
It would be an exaggeration to say that the industrial community in Korea became "surely and unresistingly" drawn in under the rule of the technological expert, because, by world standards, there were no experts in Korea. Nevertheless, like their German counterparts. the production engineers who were the gatekeepers of technology transfer came through the schools. And in a society hungry to catch up. with a steadfast faith in the value of education, the practical knowledge that these professionals wielded went a long way toward winning them influence and esteem. The industrial community in Korea, therefore, became "surely and unresistingly" drawn in under the rule, if not of the expert, then of the technological trainee. Once the entrepreneurs recognized that government subsidies could make
. manufacturing activity profitable, and that Korean engineers could build ships that floated and steel that bore weight, they increasingly turned their attention away from speculating toward accumulating capital.
Symptomatic of the passionate desire to organize and hasten the process of catching up, the Koreans pushed ahead with forming a native cadre of engil)eers and technicians. The number of schools in both Germany and Korea was large, unusually so by contemporary standards. The plain fact of the matter is that Korea was a successful. learner partly because it invested heavily in education, both formal . and foreign technical assistance (see Chapter 9).
The preponderance of foreign technical assistance came from Japan, a fact that gave Korea an edge over other late-industrializing countries that were culturally and geographically further afield than Korea from Japan. Japan may not have been as close to the world technological frontier as the United States, or as generous in transferring its proprietary know-how, but it emerged as the world's premier producer, arid communicated to Korea both the most efficient production techniques and a seriousness about the manufacturing function.
PLAN OF THE BOOK
This book is divided into three . parts. Part 1 surveys Korean history and the origins of state policies that led to the successes of Korean late industrialization. Part 2 examines the ways that Korean management and the work force were transformed into major factors in the growth of Korean industry. Part 3 discusses the creation of comparative advantage in several industries and the reasons why one only kept pace with expansion while the others drove it.


PART I
The 'State and Business : History
and Policies


CHAPTER TWO
A History of Backwardness
THE RETARDING EFFECTS OF A WEAK STATE
This chapter examines how late industrialization in Korea was retarded by a state too weak to intervene and stimulate capital expenditures. It also takes the position that when industrialization began to accelerate, it did so in response to government initiatives and not . to the forces of the free market. Finally, it will argue that these processes can be thought of as general propositions applicable to similar countries.
From 1876, when Japan coerced Korea to open its doors to foreign trade, until 1961, when Korean army officers seized control in a coup d'etat, the question of state power overarched Korean history. 1 In the interregnum, Korea had to debate its destiny with not just one but two occupying powers, Japan and the United States. It swallowed a heavy dose of the bitter pill of foreign domination, the realpolitik of all latter-day twentieth-century learning. Therefore, in this and the next chapter the concern is with the friction that enabled Korea to emerge after ninety years of so-called "modernization" with at least some of its skin still intact, though only half its original size and not yet possessed of a full stomach.
This chapter generally follows a chronological order, one objective being to provide a summary of modern Korean history. Within each discrete historical episode, however, the organizing theme is the state. The period of rule under the late Yi dynasty is discussed first to establish a benchmark for later contrast with strong centralized rule. Then the two occupations are considered for the purpose of assessing what has come to be called "modernization," which took place in the period of statehood denied. Finally, .the regimes of Syngman Rhee and General Park Chung Hee are introduced in relation to their two major antagonists, the student movement and the U.S. AID admin-istration. ' .
I In the 1980s. the legitimacy of state power had become the burning issue.
27

28 THE STATE AND BUSINESS
Little in this history is in any way 'pI:emonitory of Korea's later success, except that resistance to foreign domination in Korea beginning in the 1870s was immediate and unusually obstreperous, and the country's hyperactive student movement maintains this tradition a century later.2 The years 1876- 1910 were memorable for the spectrum of reform movements they stirred.3 At the beginning of the period, the Yi dynasty gave its last gasps of repentance, and at the end of the period, there was outright insurrection. Of a population of roughly 1 2 million, the number of insurgents killed in, say, 1907-1908, was estimated by Japan at over 14,000 (C. 1. E. Kim, 1962). Betwixt and between, some movements expressed themselves as peasant rebellions, demanding egalitarianism as well as liberation from foreign influence. Other movements were led by Western-educated intellectuals who called for the withdrawal of foreign' concessions, the scrutiny of royal accounts, the creation of schools. and freedom of speech and press. To be sure, visions about statehood were convoluted by class. Though the foreign aggressor was uniyersaJly hated, the privileged elites collaborated with it to avoid social change. and the impoverished rural masses tolerated it in the absence of better alternatives. Nevertheless. in Korea, nationalism found an ideal climate in which to grow. Whereas many other colonies were pieced together from geographical units that were racially, tribally. or religiously distinct. Korea had existed for centuries as a nation with an unusual homogeneity of language, etfmicity, and culture. Although it took almost a century before the idea ,of the nation-state was to triumph over the previous reality, these early reform movements are noteworthy-in spite of their short-term failure-for a vision of Korea that was ultimately responsible for pushing industrialization through.
An abortive attempt by Japan to invade Korea had occurred in
" For a n account b y Korean authors o f Korean resistance to Japanese rule. see Ahn et al. (1980). W. K. Han ( 1977) analyzed the rise of Korean nationalism as a response to foreign invasion.
.
S Comparing student militance in two Japanese colonies. Korea and Taiwan. Tsurumi wrote.
In Taiwan. student demonstrations against favoritism toward Japanese classmates had also surfaced from time to time. but although serious incidents occurred in individual schools. these never became a stepping stone to city-wide student protest. and anti-Japanese defiance in Taiwan never knew the country-wide solidarity shown by Korean students. ( 1984. p. 307-8)
For some accounts of the period 1876- 1910. see Conroy (1960), who. argued that Japanese colonialism was not motivated by economics; and Shoichi (1970) who argued that it was, See also Chen ( 1968). Duus ( 1984). Juhn ( 1965). H. H. Kim (1980). C. S. Lee ( 1963). B, B. Weems ( 1964). and C. N. Weems Jr. ( 1954). Koh (1966) presented an historical comparison of the cotton industry in Japan and Korea.

A History of Backwardness 29
1592-1598. Just two years later, in 1600, the Tokugawa regime came to power in Japan. For the next '276 years; Japan witnessed the rise of commerce and a more productive agrarian system, while Korea celebrated its victory over Japan in relative quiescence. When Japan reappeared on Korean shores in 1876, less than a decade after the imperialist had itself become the unwitting host of foreign intruders, Korea encountered a much more formidable foe. Hastily, Japan assumed the role of precocious colonialist, extorting trade treaties from Korea even before either country had a central bank, despite the fact that the Meiji had to suppress the Satsuma rebellion at about the same time it had to suppress a rebellion in the Korean army.4 Consequently, a decisive difference would determine the subsequent course of Korean history-the greater degree of centralized state power.
THE YI DYNASTY
According to Pallais, an historian of the period,
Although prime responsibility for Korea's eventual subjugation to Japan must be attributed to foreign imperialism, Korea's capacity to .adapt to the demands of the modern world in the late nineteenth century was hindered by those factors responsible for the extraordinary stability of the Vi dynasty ( 1392- 1 9 10). This stability was in large measure the result of a �tate of equi- . librium produced by the interrelationships between a monarchical, bureaucratic, and centralized government structure a,nd an aristocratic 'and hierarchical social system. The yangOOn elite, which had many of the attributes of an aristocracy, maintained itself by legal and de facto inherited status, privileges, lCj.ndholding, officeholding (in the central bureaucracy), and utilization of Corifucian orthodoxy for the legitimization of sfatus and economic interests. King and aristocrat were both mutually antagonistic and mutually supporting; each was dependent on the other for the continuation of his place in the political and social struc-ture. ( 1 975, pp. 4-5)
.
Typically law and order are extolled as preconditions for growth, and what Pallais called attention to is the precondition of a strong state for law and order:
The balance of power between monarchy and aristocracy was an asset for the maintenance of stability, but it was a liability
• Kublim (1959) presented an early overview of the context ill which Japan colo· nized,

30 THE STATE AND BUSINESS
when Korea was faced with the need to expand central power to mobilize resources for defense and development. . . . One of the main problems for the traditional Korean state as it moved toward the twentieth century was, therefore, overcoming the limitations on central authority in order to build national strength in the face of threatening challenges from the outside world. ( 1975. p. 5)
Palla is went on to say that later peasant rebellions and threats of foreign invasion in the l 860s created a sense of urgency about the need for reform. but the traditional system was incapable of allowing a major shift in the balance of power toward strong central and monarchical leadership. Furthermore, the challenge to the privileges of the upper classes gave rise to a react\on of the privileged against reform, and thus a reversion to limited monarchy.
The balance of power between state and aristocracy pirouetted on an impoverished peasantry, the state empowering the landlords to tax the peasantry, and the landlords protecting the state and providing it with a share of its revenues-but not a large enough share to accumulate a surplw,.5 The upshot was entropy:
In the late Yi dynasty, the problems of revenue shortage and peasant unrest were both caused primarily · by the aristocra�ic landowning class's monopoly over the land and free-floating resources of the country. One of the main reasons for the weakness of the central government was its inability to tax land effectively to meet its needs in a time of domestic crisis and foreign challenge. . . . The existence of a centralized bureaucratic structure-as opposed to a decentralized or feudal political order-was no guarantee of greater centralized control over land and the tax revenues accruing therefrom. (Pallais. 1 975, p. 58)
So weak was Korea's state in the Asian context that it had maintained a tributary relationship with the Ming dynasty of China since 1 392. One result was the decline of local industry. The needs of the royal household were increasingly met with the imports of luxury goods that were obtained in exchange for tribute in China. Production in government factodes declined as a consequence and then declined still further as a result of the employment of slaves or handicraft workers who were required to render compulsory services without adequate compensation. Farmers mairitained household industries solely to meet their own needs and to fulfill tributary obligations to landlords. Although independent artisans produc\'!d
5 w. K. Han (1977) examined the relationship between the state. the yangban system, and the "exploited classes."

1\ History of Backwardness 31
handicrafts for other's use, the high degree of subsistence that characterized the economy meant little market activity. When Japan arrived to trade in the 1870s, a money economy had not yet spread throughout Korea. Soon the Japanese yen became the accepted currency, replacing barley and rice as the medium of exchange.s
Another result of subjugation was the adoption of a Confucian system of class relations and beliefs, which, if rich in its own terms, was a deterrent to capitalist enterprise. Koreans may not have been drawn into capitalist enterprise kicking and screaming, but they were conditioned by Confucianism to accord it low status. Further, the ability of Korean manufacturers to compete against Japanese goods was complicated by a primitive distribution system. Internal trade was carried on by itinerant peddlers, since there were few retail stores in small villages and towns.
The itinerant merchants used advanced accounting methods, yet bulls or humans provided the only means of conveyance by which they could transport goods. They were outcompeted when the Japanese began using more modern transport. In the cities proper, merchants were granted monopoly rights by officials in return for an agreement to supply needed merchandise at nomihal prices. Consequently, merchants grew accustomed to monopoly rights to trade certain categories of goods in certain geographical areas. They sought to preserve their local monopolies to counter the threat of foreign competition, rather than to study the new methods of merchandising introduced by foreign traders. Because the opening of ports was forced upon the Korean government, it could not impose its own protective duties. "At any rate, it is doubtful whether any high ranking government official was aware of the implications of tariff duties on domestic commerce and industry" Ouhn, 1965, p. 46).
First unable to compete against Japanese goods, Korea lost more and more ground to its interloper. The monarchy was forced to rely On China to suppress a peasant uprising in 1894, which gave Japan a pretext under which to increase its military presence. Ja'pan declared Korea a protectorate after routing Russia in war in 1905. Finally, with the defeat of insurgents and the dissolu�ion of the Korean army, Japan formally annexed Korea amidst American indifference in 1910 .
THE CONTRADICTIONS OF MODERNIZATION
The judgment on japan's contribution to Korea's subsequent success has gone through several iterations, although the facts have by and
6 Cole and Park ( 1983) gave a brief history of Korean financial development under Japan.

32 THE STATE AND BUSINESS
large remained the same. The accounts of colonialism written before 1920 are enthusiastically favorable, praising Japan for uplifting a population that lacked "dignity, intelligence, and force."? This image of enlightenment was tarnished, however, by stormy demands of an estimated 2 million Koreans for independence in 19 19, inspired by President Wilson's "Fourteen Points" (Baldwin, 1969). Whatever glint remained in the image was altogether obliterated in the 1930s when Japan engulfed Korea in its war efforts. However, the critiques of colonialism by Korean scholars in the early postwar period tend to be overdrawn, the whole detestable episode swathed in the blackest of colors. After the Korean economy began to expand in the 1960s, the verdict was handed down in English-language publications that Japanese colonialism had been a "modernizing" force: 8
Japanese colonial rule cannot be seen as an unrelieved disaster. It is true that, during the period of colonial rule, . . . many Koreans experienced an absolute, not just a relative, decline in their standard of living. And yet, for all the hardships imposed on the Korean people, Japanese colonial rule laid some of the key ' foundations for Korea's later entrance into modem economic growth. (Mason et aJ. , 1980, p. 75)
The Japanese dismantled the institutions of 1 ,000 years of dynastic rule and accomplished overnight, in 1910, what the dynastic rulers had failed or neglected to achieve in centuries: the abolition of slavery, the codification of civil law, and more.9 The Japanese also created a modem infrastructure In the areas of finance, transportation, and commerce. Nevertheless, Japanese colonialism was far more successful in smashing old foundations than in establishing new ones;
7 These were the views of George Kennan, confidante of Theodore Roosevelt, as qu�ted in Grajdanzev ( 1 944). Grajdanzev puzzled over why the early views of Japanese colonialism were so favorable. For the period 1910- 1945, see Y. Chang ( 1 97 1 ), de Brunner ( 1 928), H. Kim (197 1 ), H. K. Lee (1936), Y. K. Lee et al ( 197 1), Miwguchi ( 1 979), Nakamura ( 1 974), and E. Kim and Mortimore ( 1977). For overviews
. see S. P.-S. Ho (984) and Toshiyuki and Yuzo ( 1984). For statistical approaches, see S.-C. Suh ( 1978) and Ban ( 1 97 1 ). Amsden ( l987a) provided an overview on theories of imperialism.
S The general literature on modernization is voluminous. From an economic perspeqive, the classic work is that by Rostow ( 1960). For a critique, see Baran and Hobsbawm ( 1 961) and Fishlow ( 1 965). From a sociological perspective see Levy ( 1966). For a critique, see A. G. Frank ( 1969).
9 Other reforms included separation of the royal household from affairs of state. outlaw of all forms of discrimination against commoners, abolition of the Confucianoriented national exams, the adoption of a new tax system based on payments in cash rather than kind, separation of judicial functions from the executive departmentS, institution of an independent coun system, legalization of remarriage by widows. and removal of a ban on early marriage. Juhn (1965) presented a brief summary.

A History of Backwardness 33
Paradoxically, , in a late industrializer like Korea, colonialism removed the old blockages to industrialization but created new ones in its wake.
Korea\ intrinsic weakness first manifested itself as a failure to compete against foreign goods. After japan withdrew in 1945, Korea was no more able to compete on the basis of its manufactures than it had been before. I ndeed, a quantum shift in the world technological frontier had left Korea relatively further behind. The japanese had followed in the footsteps of Korean intellectuals and Christian missionaries in emphasizing formal education. In fact, investments in education, 'even at the university level, were unusually high by colonial standards, but they were motivated by policies designed to assimilate Koreans into Japanese society as the lower elements, policies that lent the colonial interlude its nasty character. Education at the higher levels was altogether lacking in the technical fields, except in agronomy , and medicine, and because of discrimination in hiring, Korean academia had few productive outlets. 10 japanese corporations in Korea discriminated against Koreans at the managerial and even at the supervisory level. If, therefore, as is sometimes contended, the technical and managerial literacy rate rose as a consequence of japanese manufacturing enterprise, it must have levitated. I I As for Korean capitalists, they existed at the fringes, unable for the most part to compete against japanese goods.
Between 1910 and 1920, industry in Korea was altogether discriminated against by Japan in favor of agriculture. Then, after the 19i9 uprising, a wafer-thin stratum of Korean capitalists was deliberately cultivated to further collaboration. With minimal assistance, an entrepreneurial class emerged, drawing its members from the yangban and from the commoner class. The new entrepreneurs were numerous enough to increase the variety of the indigenous elite, from landlord and scholar before the occupation to landlord, businessman, and intellectual after it.12 In 1938, however, Korean paid-up capital as a share of total ,paid-up capital in industry equaled only 12.3%. Moreover, the paid-up capital of the average Japanese corporation was more than six tim'es as large ' as that of the average
10 For an overview of colonial education in Korea. see Tsurumi ( 1984)" I J Mason et al. ( 1 980) suggested a process of "Iearning-by-watching." but this seems
a farfetched notion of modernization. Moreover. in the area of technical and managerial skills. it would have been difficult even to "watch," since many cognitive skills, particularly in large-scale organizations. are not practiced out in the open. However, Koreans may have learned more in the banking sector at the managerial level than they did in manufacturing. See Moskowitz (1979). 12 Eckert ( 1 986) presented the interesting case of a large-scale Korean enterprise in textiles that survived into the period of postcolonial rule.

34 THE STATE AND BUSINESS
Korean firm (Grajdanzev, 1944). This size distribution reflected the fact that when, in the 19305, Japan roared into heavy industry in Korea in preparation for war, it did so on the basis of zaibatsu capc ita\. By 194 1 70% of total Japanese investment in industry in Korea was accounted for by six zaibatsu groups (Ewing, 1973). Korean managers were altogether excluded from such enterprises, and with few exceptions, large-scale enterprise was not under Korean ownership. Therefore, when the Korean economy was resuscitated in the 1950s, it bore some unique features but many familiar marks of colonial distortion. There was overcapacity in textiles and light manufactures and undercapacity in basic industry. There were a large number of small-size firms but a hiatus in the large-size category. The skeletons of Japanese-owned corporations in basic industry, which the Korean government inherited, were plentiful but ill managed and technically problematic to operate.
The contradictory quality of modernization under Japanese colonialism was especially vivid in agriculture, which, being both the object of Japanese aggression and the heart of Korean economy and society, became a battleground. The Japanese colonial government's objective was to raise land-tax revenues. Toward this end, it had created a ponderous bureaucracy and carried out a land reform after 1910. The bureaucracy, while highly centralized, reached down to every village in the form of a police force and an agricultural extension service. As for the land reform, it replicated the agrarian structure existing in Japan in the late-nineteenth century. The state collected taxes from a landlord class, and landlords collected rents from their tenants. On the one hand, this reform represented a giant step forward insofar as it substituted the market for brute force as a mechanism by which to induce higher productivity. 'On the other hand, the establishment of property rights and the dispossession of the peasantry created acute distress. The same system in Japan was less exploitative because an urban labor market imposed a ceiling on rural rents. In Korea, however, with no urban alternative the peasantry was squeezed to the bone (see the appendix to this chapter).
During World War II, an estimated 10% or more of the Korean population was earning its bread abroad. More · than I million Koreans were working in Japan, about 1 million were settled in Manchuria, some 200,000 were in the Russian Far East, and about 100,000 were in other countries, primarily China (Grajdanzev, 1944). Both hunger and politics were responsible for emigration. Koreans had lived in the frontier area of Manchuria and in the Russian Far East for centuries; but after 1905 many more had fled there as rebels. By 1945, more politically conscious by far, the insurgents were key fig-

A Hislory of Backwardness 35
ures in the postwar struggle for the state.13 The Korean popul�tion in China was divided between Japanese camp followers and resisters trying to reach the Chinese army to fight against Japan. The Koreans who were living in Japan proper were chiefly unskilled workers, miners, and agricultural laborers who had been drafted for employment in wartime Japan . .
The end result o f Japanese colonialism i n Korea was a society that was unable to support itself and totally at odds. Peasant opposed landlord, and those who resisted Japanese colonialism opposed those who collaborated. Under these conditions, the machinery of modern government that Japan had bequested was a useless inheritance. With a distended police force accustomed to domestic repression, and a minuscule army incapable of national defense. Korea once again fell victim to the Great Powers.
THE COLD WAR
The events that transpired .between August 1945. when Japan retreated from Korea. and June 1950, when the Korean War began, were as complex as the underlying issues. The power and ideological struggles of the Cold War were visited upon a nation that was itself divided, although political polarities at the national and international levels were often not synonymous. According to B. Cumings, who looked under a microscope at the period 1945- 1947,
.
Communism in Korea in 1945 did not signify a deeply held world view, or adherence to an authority residing iii the" Kremlin, or commitment to Marxist internationalism. It was a specifically Korean communism. Its adherents could scarcely be distinguished from nationalists and conservatives .in their bel�ef in the uniqueness of the Korean race and its �raditions and /he necessity to preserve both, or in their understanding that a unique Korea required unique solutions. What did distinguish Left from Right was ( 1 ) a commitment to a thoroughgoing extirpation of
13 B. Cumings (1981) wrote:
By 1945 as much as 1 1 .6% of the Korean population was outside Korea. most of it in Japan and Manchukuo. and that fully 20% of all Koreans were either residing abroad or in a province other than their native one. This massive redeployment of population produced severe dislocations of Korean society because population mobility had historically been very low. In this period. Korean peasants first became uprooted from their villages and entered industry or urban life. or both, in Japan. Manchukuo, and northern Korea. As mentioned earlier. much of this uprooted population returned to their native homes after liberation to participate in the politics of postwar Korea. (p. 490)

36 THE STATE AND BUSINESS
Japanese influences in Korea, with all that this implied for Korean society and for Koreans who had profited from colonial rule; (2) a commitment to mass politics and mass organization and to the social equality that this implied; (3) a commitment to the reform of Korea's "feudal" legacy, feudalism being a code for gross inequalities in the allocation of resources, particularly land. ( 198 1 , p. 86)
These were the politics of the Korean People's Republic, with a network of affiliated trade union, peasant, student, and people's committees spread throughout the Korean peninsula. It was the government of the People's Republic that both the Russian and American armies confronted when their occupation of Korea began.
Both ' superpowers responded ultimately by establishing political outposts in Korea, but their initial reactions to the new government were opposite. Russia recognized the Republic almost immediately and within -nine months of the liberation from Japan in the North, "landlordism had disappeared, the land had been redistributed, major industries had been nationalized, radical reform had eliminated the worst abuses of the colonial factory system and had estabiished formal equality for women" (B. Cumings, 198 1 , p. 382). Thereafter Russian policy was oriented toward ensuring that the political faction in power in the North was amenable to Russian influence, although that faction was perhaps the least distinguished and capable of all the possible political groupings. The United States did not recognize the People's Republic, causing it to be destroyed amidst a bloody uprising in 1 946, after which point an American alliance was formed with political sympathizers. The rest, as they say, is history. Cold War politics played themselves out, ending irrevocably in war ( 1950-1 953) and the division of Korea into two geographically and ideologically separate parts. If, however, one is to understand the ensuing course of industrialization in what is now South Korea, one must understand three key American policies.
.
First, the American occupation forces chose to work through the most conservative political faction, the Korea Democratic Party (KDP). Insofar as the KDP had little grassroots support in its organization, the American forces also relied on Korean civil servants and police who had served under the Japanese. 14 The KDP was self-described
. as a party of "patriots, notables, and various circles of the intellectual stratum." It stood for the promotion of world peace and national culture, the enhancement of the livelihood of the working masses, and rational reorganization of the land system. According to
11 This point is stressed in a critical account of the United States' policy in Korea in the 1940s and 1 9505 by H. C. Park ( 1986).

A History of Backwardness 37
B . Cumings, "the reason for this befogged and cryptic agenda for Korea's future is not hard to find: a group did not win popularity in Korea in 1 945 by urging the maintenance of landlordisul, private ownership of industry, little or no punishment for collaborators, and the continuation in power of those Koreans who had influence under Japanese" ( 198 1 , p. 97).
Although the KDP subsequently lost power, its significance lies in the fact that it safeguarded the last survivors of the yang-ban class, who resurfaced after the convulsions of war as the elite of the new order. Although, for the most part, the landlord class vanished by the end of the 1 950s, some of the same individuals who were privileged xangban became privileged politicians, government bureaucrats, educators, and industrialists. This lent a continuity to postwar change. The weak Korean state of the 1 870s was supplanted by the strong one of the 1960s, and the art of statehood may have been rooted in a 'class culture transmitted without interruption across generations. Moreover, the anticommunism of the KDP set the standard for future regimes. When the military junta took power in May 1961 , it claimed that Korea was on the "verge of subversion by the communists," that only the Korean armed forces were capable of preventing communism from taking root among the people, and that only through their timely action was the country saved from a communist coup (S. Han, 1974, p. 1 78). Notwithstanding the military junta's pervasive intervention in the economy, an act that might otherwise be associated with socialistic tendencies, anticommunism has been the dominant political ideology guiding Korean industrializa-tion.
"
Second, the American occupation forces groped toward land reform in response to v"iolent peasant dernands, to the Soviet example in the North, and to the need to build commitment to a war that pitted kith and kin against one another (M. H. Choi, 1960). The agrarian reform of the Japanese was pushed one stage further, and land was redistributed to the tiller. Although land-to-the-tiller in Korea never enriched the peasantry or overflowed the state tax coffers, its long-run effects were major. Reform redirected idle capital away from land speculation to manufacturing and uprooted a class that had not proved itself progressive. It relieved the bottleneck in food supply, which in turn dampened inflationary pressures. 15 It created a far more equitable income distribution. Finally, it cleared the field for strong centralized state power.
15 Although land reform caused "temporary dislocations in agricultural produclion; it begat a highly productive system once peasants were provided with capital. fertilizer. and other inputs to pursue scientific farming (see Ban. Moon. and Perldns. 1980).

38 THE STATE AND BUSINESS
As a consequence of land reform, Korea has enjoyed a reputation among developing countries as one with a relatively equitable income distribution (World Bank, 1983) . This reputation has become increasingly undeserved as industrialization has advanced. Korea has unusually high levels of aggregate economic concentration and of wage inequality by international standards. 16 Land reform fell far short of the demands of the People's Republic for an "act of destruction willed against a whole ruling class," (B. Cumings, 198 1 , p. 69), and anticommunism alone did not amount to much of an agenda for Korea's future. Nevertheless, land reform did respond to the ancient cry for egalitarianism. 17 When Korea was an overwhelmingly agrarian country, land reform undoubtedly contributed to greater equity in the size distribution of income. In the late 19305, 3% of all farm households had owned over two thirds of all land, whereas ten years later, fewer than 7% of all households were landless (Ban et aI. , 1980). In conjunction with ail expanding education system, growing urban employment, and the rags-to-riches fables of a few hard-driving industrialists, land reform provided industrialization with a plausible vision, a Korea of equal opportunity.
Third, to fight the Korean War, the Americans buttressed the Korean army. At the beginning of the war, the Korean military was not much more than a small constabulary. At the war's end, it numbered 600,000 men-the fourth largest army outside the Soviet bloc. It had modern heavy equipment and an officer corps of significant proportions (H. B . Lee, 1968). After biding its time in the 1950s and blinking at the student revolution that brought a decade of political incompetence to a close, the military would open a new chapter on both growth and state power in the 196 1 coup. Here was the ultimate Spite from Pandora's box.
AID AND THE ORIGINS OF THE DIVERSIFIED BUSINESS GROUP
The 1950s paralleled the millennium of dynastic rule that ended in 1 876 in that more energy was spent plundering the existing surplus
16 The process of measuring equality in Korea is vexed by institutional fac�ors. Inequality in Korea is likely to be understated for three reasons: ( I ) The value of real estate and other assets, which tends to appreciate with inflation, rose more rapidly in the 1970s than wages. Because this value is excluded from income and these assets tend to be owned by higher income earners, the treatment of such assets is likely to result in the understatement of inequality. (2) The equivalent of the United States' Internal Revenue Service in Korea sometimes includes and sometimes excludes from the calculation of personal income, capital gains, rent, and interest payments. Such income is also taxed differently from wage income. (3) It was possible until 1988 to open bank accounts in Korea under an assumed name.
17 Brandt (1986) has a discussion of egalitarianism in postwar Korea.

A History of BacKwardness 39
than producing more, the surplus itself arriving in the alluring form of U.S. foreign aid for war reconstruction. The average annual inflow of aid from 1 953 through 1958 was $270 million excluding military assistance, o'r roughly $12 per capita' per year. Tl1i� was ne�rly 15% of the average annual groSS national product (GNP) and over 80% of foreign exchange (Cole and Lyman, 197 1). To maximize aid' inflow, macroeconomic policies featured low interest rates, an overvalued exchange rate, a deficit budget financed by borrowing from the Central Bank when taxes and aid-generated revenues were insufficient, and Central Bank financing of commercial bank credit to the private sector. Such policies inevitably produced an internal financial gap between government transactions and private transactions, and an external financial gap between import demand and foreign exchange supply. The state, under the leadership of Syngman Rhee and other "patriots, notables, and various circles of the intellectual stratum," then allocated aid entitlements in exchange for political campaign contributions. When campaign contributions ran into diminishing returns with respect to votes (at one time the number of political parties was estimated at 344), elections were rigged or the constitution was amended.
The windfall gains from aid provided a basis for the emergence of an altogether new entrepreneurial element, less conservative in outlook than Korea's older textiles industry ahd far more growth oriented than its small-scale sector. During the period when venality was pervasive (the First Republic, 1948-1960), political connections led to an uneven distribution of the spoils. Fortunes, therefore, were amassed, the "gravy train" starting with sales of Japanese property at below-market prices. Favored firms, whatever their origins, were allocated hard currency to import scarce materials-grains and fertilizers-that they then resold on the domestic market at monopoly prices. They were given loans at subsidized interest rates. They were granted tax exemptions, and they were awarded preferential contracts for large-scale government projects (K. D. Kim, 1976). The magnitude of fraud is indicated by the size of the loans that the most favored firms received, "loans" on which they paid neither interest nor principal. A Government Audit Report, prepared in 196 1 after the First Republic's fall, suggests that total outstanding loans equaled about $ 140 million (or about half of the average yearly grant aid in the 1950s) . 18
According to the Government Audit Reporton I llicit Wealth, the
18 According to the Government Audit Report, quoted in C, Ii. Park ( 1963), total outstanding principal on loans in 1961 was W48.574, 1 22,OOO, and interest was W I O,27 1 ,000,000, Using the real effective exchange rate for 1962 (because the won was devalued twice in 1961). as calculated by Y. C. Park (1985), the interest and principal on these loans in dollars was about ,$ 140 million,

40 THE STATE AND BUSINESS
industries to which these enterprises thriving on venality belonged included textiles, paper, housing. mining, fertilizer. Hour, alcohol, glass, pottery, livestock, construction, warehousing, and trade. This is a wide range of industries, and while textiles is represented. it is underrepresented in proportion to its weight in total output (the textiles industry accounted for approximately 20% of manufacturing value added in the 1950s). 19 The point is that the cradling of enterprises in illicit wealth was not industry specific. These subsidized entrepreneurs were generalists, devoted to moneymaking in whatever industry the opportunity arose. They drew their members from all social classes, although they tended to be better educated and much more likely to have descended from the gentry than were their social peers (Jones and Sakong, 1980). In this respect they provided a link with the past. Their novelty lay in the fact that they skated over the stage of incremental growth that was characteristic of small-scale enterprise, operated with a different logic of investment from that of traditional cotton spinning and weaving firms, and formed crack troops to penetrate new industries.
Thus, as the high-aid era drew to a close, the embryo of a new social, economic, and political force had been conceived. The 1950s had witnessed a decrease in the size of agricultural enterprises and the death knell of the nobility, along with an increase in the size of industrial enterprises and the tentative groping toward a symbiotic relationship between the state and the progenitors of large diversi-. tied business groups (chaebol). The rise of the chaebol, moreover, relit some of the glimmer of economic activity that had been characteristic of the 1930s. By international comparison, the growth rates Korea attained during the high-aid era were superlative. As indicated in Figure 2. 1 , between 1953 and 1958 the average annual rate of change in the volume of production of both heavy and light manufactures was the highest in Korea of al1 36 countries for which U.N. data were available.2o
U.N. data, however, exclude North Korea. which was growing roughly three times faster than the South (Cole and Lyman, 197 1). What's more, the growth rates that the South chalked · up were un-· sustainable. By 1959 the economy was deeply depressed, partly the effect of conservative macroeconomic policies and partly the effect of the winding down of aid and of the reconstruction boom. With
19 This represents value in 1975 constant market prices, as reported by the Korea Development Bank (1984). 20 The data are in real, rather than nominal, terms but are bound to contain substantial margins of error, since they are among the earliest attempts of the United Nations at international growth comparisons.

20.0
18.0
16.0
Q 1 4.0 '2 ::I 0
1 2.0 1\1 :; c: 1\1 :E 10.0 :E Q ::; 8.0 ;!.
6.0
4.0
2.0 "United States".
-2.0
- 4.0
- 6.0
Ceylon • - 8.0
A History of BaCkwardness
1 953-1958 Korea •
41
Yugoslavia
Venezuala • Philip lines Japan
Me�lco
• • India and Pakistan
• Weel Germany
Paru Spain
• Greece • Luxemburg • Portugal . Chlnal(Talwanj • Finland • AU9�la • France
• Fed. of Malasla. \ Netherlands .ltaly
Oenmark "-e 0 I 8r:'11 Sweden '\ . � cean a
• . . " . Argentina
Canada /. Be�lum " 'Union 01 South Africa
United Klngllom Norway
% Heavy Manufacturing
• West Berlin" •
Colombia •
Burma
Figure 2.1 Average Percent Annual Rate of Change in the Volume of Production, Heavy and Light Manufacturing, 1953- 1958. Source: United Nations ( 1960).
tariff protection and subsidized credit, the textiles industry had achieved in half a decade what it had failed to achieve in half a century of political discrimination-modern plants of international scale to undertake integrated spinning and weaving. The growth rate of textiles output, however, turned negative at the end of the 1950s as firms added to their capacity to take advantage of cheap U.S. credit (Y. B. Kim, 1980). "Thus, by the early 1 9GOs, U.S. officials had become extremely gloomy about the prospects of Korean development" (Mason et aI., 1980, p. 195).

42 THE STATE AND BUSINESS
THREE CONTENDING VIEWS
Out of the corruption, paralysis, underachievement, and bitter disappointment of the 1950s came three conflicting views about how Korea: should. proceed, one associated with students and intellectuals, one articulated by U.S. aid advisors, and the one that was ultimately to prevail-that of the Korean military. The issue of economic development was foremost and, although submerged under politics, its failure underly the turmoil that brought the decade to a close.
The Students
In April 1960. a high-school student protesting crooked elections ' was slain by police and his body was thrown into the sea. The atrocity provoked youth- and student-led demonstrations throughout the country. The president, Syngman Rhee, called on the army to intervene, but the army remained passive. The American government did likewise, disgusted with Rhee and disturbed by his intransigence toward Japan that obstructed the formation of a greater Pacific alliance. Within days, the Second Republic fell.· According to H .. 8. Lee,
The April Revolution was a giant social revolt. The suffering and revolting self that had been emerging in the latter part of the decade of the 1950s was now given its full play. The students began revolting against the Liberal Government, but their success touched off a general revolt in the society. The people revolted against the government. The young revolted against the old. In many schools, students revolted against their teachers. In some government ministries, junior civil servants revolted against senior civil servants. In a more serious vein, some eight lieutenant colonels openly revolted against some generals, requesting that the army be cleared of corrupt elements. ( 1 968, p. 1 19)
.
There was nothing revolutionary about the outcome. of the April events, though. They provoked an election that voted into power a party little different in outlook, age, and background from the previous regime. Thus the protests continued. Among the protesters, however, were radical reformists who had been silenced under Rheetrade unionists, whose activities had been circumscribed by a staterun labor federation (Ewing, 1973); socialists, teachers, and unemployed intellectuals, whose ranks had been decimated during the Korean War; al).d students, spearheaded by the Student League for . National Unification (Minjok T'ongil Yongmaeng) of Seoul National

A History of .Backwardness 43
University. Although the alliance of radicals and moderate reformists could trace its antecedents back to the early reform movements of the late nineteenth century, its vision of economic development was still undefined, consisting of little more than vague demands for full employment and more aggressive policies to eliminate poverty. The radical view of how Korea should proceed, however, focused its attack On imperialism. The radicals, in particular, opposed a blanket technical agreement, in the offing between South Korea and the United States, that gave the United States the right to "continuous observation and review" of the way U.S. financial and technical assistance was being administered. The radicals were joined in their opposition to this agreement by nonreformist politicians who termed it "shameful" and organized mass demonstrations against it (S·. Han, 1974, p. 1 83).
The United States
The economic policies that the United States espoused in Korea showed consistency over time, the tumultuo�s events of the 1940s and 1950s merely reinforci that central tendency. The lesson that the United States dr w f the uph vals in Kore d for stability before gr w , a this e heart of Amer-ican short- and medium-term oeconomic policies toward Korea. Long-term goals were perceived in terms of the law of comparative advantage, the objective being to reduce Korea's dependence on aid. For the purpose of developing a sound economy, aid was dispensed on the principle of static efficiency, that is, bu�!iling -infrastructttre, natural resource-pr�si��aciU��nd li��(!.!l.dusti:.}LQQ��e ��sis of small-scale enterpnse. [hIS polIcy rc:'flected lIttle of the KeyneSIan revolution then sweeping American universities. Economic advisors in Korea, for the most .part, were not academics; rather they were affiliated with the U.S. military and with international aid organizations. The policies that the United States advocated were based on traditional market theory and were precursors to those of the World Bank and of the International Monetary Fund (IMF).
The immersion of international organizations like the IMF and the World Bank in the industrialization of latter-day twentieth-century learners is unique in the history of emulation. So, too, is the amount of foreign aid to which ' Korea has had access. Therefore, it is of interest to explore the extent to which, if at all, these policies and aid shaped Korean industrialization, one of the more successful cases to emerge from the Cold War era.
By and large, the Rhee administration staunchly opposed the U.S. policy package. The rancor between the two countries exceeded what

44 THE STATE AND BUSINESS
could reasonably be expected from a corrupt aid recipient, a frugal -aid donor. and the inherent indignity of the aid relationship. According to one observer. "The most touchy subjects of controversy between the two governments, among many less crucial that cannot all be cited, were Rhee's insistence on an unrealistic exchange rate and the pleading by the United States for a comprehensive stabilization program with proper budgetary methods and restrictive monetary and credit policies" (Reeve, 1963, p. 122). Corruption apart, Rhee's position was that a stabilization package comprising devaluation, a balanced budget, tight money, and high interest rates would make growth all but impossibk.
The U.S. fear of inflation flared at the time of occupation. although there was no reversion to the hyperinflation of the war years after a sharp increase in prices durjng the first quarter of 1946 (Bloomfield and Jensen, 195 1 ) . Nevertheless, as the Ko-rean War approached, the U.S. Secretary of State, Dean Acheson, fired off a "missile" .to the Korean Ambassador that read:
It is the judgment of this government that the financial situation in Korea has already reached critical proportions and that, un- . less this progressive inflation is curbed in the none-too-distant future, it cannot but seriously impair Korea's ability to utiiize effectively the economic assistance provided . . . . Government expenditures have been vastly expanded by bank overdrafts without reference to limits set by an approved budget. Tax collections have not been increased. aid goods have been underpriced, and governmental subsidies have been expanded . . .
Unless the Korean Government is able to take satisfactory and effective measures to counter these inflationary forces, it will be necessary to reexamine, and perhaps to make adjustments in, the . . . Administration's assistance program in Korea. (April 7, 1 950) 21
-
Nevertheless, hyperinflation did not materialize during the Korean War either. Price increases slowed with good harvests, and "the relative movements of prices and money supply from mid- 1950 to mid- 1953 support the proposition that money was used mainly for transaction purposes . . . " (Cole and Park, 1983, p. 222). Between 1 953-1955 and 1960- 1962, the GNP deflator averaged only 16.7%, despite an unbalanced budget and heavy lending by the Central Bank. However, the United States had engineered a massive devaluation of 300% immediately after the Korean War, another devaluation in "1955, and two devaluations in 1 961 (Cole and P<irk, 1983; Krueger, 1979). The
2 1 This document is reproduced in Tewksbury ( 1950).

A History of Backwardness 45
u.s. government's concern with fiscal and monetary restraint was ingrained, spilling over to long-run measures beginning in the early 1 950s. In the words of two advisors from the Federal Reserve,
The fact that the sizable long-term investment program being currently carried on by Government Agencies . . . has been financed by bank credit expansion has contributed very materially to the present inflation. . . . At the present moment . . . everything must be done to discourage further long-term lend" ing until the budgetary situation is normalized. (Bloomfield and Jensen, 1 95 1 , pp. 49-50) The casus belli became Rhee's contention that U.S. aid did little to
promote long-run growth. In fact, if aid-financed imports of food, beverages, and manufactures are classified as consumer goods; ifcrude materials, fuels, and chemicals are classified as intermediate goods and raw materials; and if machinery and transport equipment are classified as capital goods, then capital goods accounted for a very small share of total imports-3.4% in 1953 and 1 1 .7% in 1960. Even though consumer goods, during the same period, declined in importance-from 70.4% of total imports in 1 953 to 35% in 1960-this was only because the share of intermediate goods and raw materials had risen to 50% of the total (Krueger. 1 979). and the Rhee government protested that intermediate goods and fuels were largely designated for light industry.
In the half decade following the end of World War II. the aim of project aid had been to develop capital projects
which would ultimately make the provision of further assistance unne<;essary. Emphasis was given in planning to the expansion of electric power-generating facilities, expanded tungsten production, the development of new anthracite coal fields, rehabilitation of the fishing industry, the production of chemical fertilizers and the expansion of the railway system. (U .S. House of Representatives, 1954, p. 1 2)
This is a quotation from an inva,luable rep�rt of a u.s. congressional subcommittee that took the trouble to visit Korea and conduct field interviews on the eve of a new development program; with only six years to go before the Korean military coup. What did the subcommittee discover about postwar Korea?
In terms of physical capital, the subcommittee discovered the evidence of Japan's unassailable contribution to growth, and yet.a dearth of large-scale enterprise:
Manufacturing activity is more highly developed than is generally appreciated. With the exception of Japan, the proportion of

46 THE STATE AND BUSINESS
total Korean output derived from manufacturing, prior to the invasion in 1950, was higher than in any other Asian country, and a considerable variety of fabricated products was produced, although the scale of enterprise was in general, quite limited. (p. 196) 22
In terms of human capital, however, "there is a serious deficiency in technical and supervisory personnel"; although in the business com- . munity "managerial skills appear to be available, but far too much [sic] of these skills is diverted to unproductive trading and speculation" (p. 38). As for the contribution of U.S. aid to skill formation,
It was apparent that not sufficient attention has been given under the aid program to training Korean personnel in various technical and managerial fields vital to the rehabilitation program. Experience gained in the military training program under United States supervision indicates that the Koreans are quick to absorb and apply technological knowledge if they are given the opportunity . . . . The need for greatly expanded civilian training programs for Korean personnel is particularly pressing when the reluctance of the Japanese to train Koreans for jobs above the most menial level is considered. (pp. 38-9)
Nevertheless, technical backwardness is not likely to have dimin-ished greatly under the new U.S. aid development program initiated in 1954- 1955. Of fifty·one new projects, most focused on small-scale enterprise in light manufacturing (Mason et aL, 1 980); furthermore, of the few large-scale projects attempted in basic industry, most ran into snags. U.S. influence on technical and managerial literacy in the civilian sector, therefore. was bipolar. In the area of quality control, and particularly in the construction indust!'y, it had an unambiguously positive effect on civilian subcontractors, as discussed in Chapter 9. Technology transfer. however, was problematic in large-scale projects and served as a bad example for local managers.
Confoundipg the problem .of corruption in technology transfer on the part of aiC;l recipients was a lack of unified administration among aid donors. The Audit Report to the U.S. Congress described the administrative arrangements of aid projects as "complex and confusing" and contrary to "sound management principles." The consequence was delay and technical bungling. Following are three examples:
In telecommunications,
22 Page references in this and the next paragraph are to U.S. House of Representatives (1954).

A History of Backwardness 47
A primary cause for these planning difficulties was the rapid rotation of supervisory personnel without adequate overlap of replacements. A contributory cause was . . . the use of military personnel inexperienced in domestic communication systems. (98)2.'1
In a large machinery shop (the Pusan Iron Works) ,
A considerable portion of the machinery ordered for this project }:lad been delivered . . . but . . . was in storage at the plant site and in customs warehouses. The delay in releasing the equipment was attributed to financial difficulties of the plant and to the need for technical assistance in layout and installation. (p. 112)
In a waste-silk processing plant, a small-scale project,
This project illustrates the lack of thorough technical studies resulting in the omission of several features essential for competent plant construction. (p. 1 1 3)
On net, the impact of u.s. occupation on Korean indusirialization was probably similar to that of Japan, as characterized by the U.s. congressional subcommittee: "modernizing but distorted and unbalanced." The difference between them was that the Japanese colonial administration had enacted a model of centralized state management in Korea that was in. tune with the historical stage of development in which both Japan and Korea found themselves, whereas the liturgy of U.S. economic advisors was private ownership and decentralized control. The corruption of the Rhee regime had strongly reinforced the conviction supporting the latter approach.
The U.S. authorities argued forcefully for privatization of the banking sector (although that sector later proved the most powerful tool for shaping the course of industrial activity after subsequent nationalization by· the military). The U.S. authorities contended that private ownership would subject banks to fewer political pressures and induce them to act more responsibly. A report prepared by consultants from the Federal Reserve Bank of New York emphasized this viewpoint:
The importance for Korean economic and financial welfare of getting the ownership and control of these banks into private hands is so great . . . that it is to be hoped that special efforts
. will be made by those in charge of vested property disposal to
2' Page references are to the 1957 Audit Report.

48 THE STATE AND BUSINESS
seek out responsible private interests who would be willing to purchase these shares. (Bloomfield and Jensen, 195 1 , p. 73)
The government initiated action in 1954 to divest itself of shareholdings in commercial banks that it had acquired from former Japanese owners, but it was unsuccessful in several auction attempts.
In 1957, however, the government succeeded in- selling its shares to a relatively small number of large stockholders, "mainly wealthy . businessmen who were prospering from high profits on government-controlled import licenses" (Cole and Park, 1983 , p. 53). The government also introduced strong deflationary measures. By . 1960 unemployment was estimated at one fifth the total labor force. Per capita income, according to U.N. estimates, was less than $100, roughly the same as that in India, one quarter that of Japan, and twO thirds that of Taiwan (United Nations, 1961) : Furthermore,
Delays [amounting to six years] in putting [an] admittedly costly domestic fertilizer plant into production contributed significantly to the chronically large excess of imports over exports, since long-established intensive cultivation in South Korea demand(ed] huge quantities of chemical fertilizer to maintain the fertility of the soil . The value of exports remained exceedingly low. (Reeve, 1963, p. 1 26) .
Despite all these failures of the U.S. aid administration, the agreement giving the United States wide latitude to "observe" and "review" Korea's economic policies was overwhelmingly approved by the National Assembly on the deathbed of the Second Republic (S. Han, 1 974). .
The Military
Over twenty-five years after the coup d'etat of May 196 1 , the U.S. government was still a powerful force in Korean affairs, as was the military, although General Park Chung Hee, who had presided over the coup and :over the Golden Age of growth, had been assassinated in 1 979. Moreover, the student movement remained hyperactive. Therefore, while the military'S view about how Korea should proceed was the one that prevdiled, the other two poles of dissent had survived. On the one hand, the student movement kept afire demands for democracy, civil rights, higher wages, egalitarianism, eradication of poverty, and protection of the small-scale firm. On the other hand, the United StateS continued to stand in relation to Korea the way water stands in relation to fish.

A History of Backwardness 49
The U.S. government and the Korean military shared a fundamental obsession with anticommunism and a commitment to private enterprise. Thus, when 5,000 troops crossed the Han River and entered Seoul on May 16, 196 1 , the United States looked on blankly. Both countries needed one another in the geopolitical vortex of the postwar period, yet the United States decidedly held the upper hand. Although Korea could threaten to withhold payments on the huge foreign debt that it would soon amass, the U.S. government could threaten to close world markets to Korea's exports, the lifeblood of its economy; to reduce subsidies to Korea's defense budget; and to subject Korea and its statesmen to all the pressures that were at the disposal of the global hegemonic power. Nevertheless, as will be discussed in the next chapter, in the mealy matter of economic growth, Korea charted an independent course.
The military's only claim to government was its ability to create a sustainable mechanism to raise national income. In the general election immediately after the coup, Park Chung Hee had defeated the opposition candidate only by a slim margin. In the general election two years' later, the last for at least another two decades, he won a landslide victory because growth had accelerated in the intervening years. Growth, therefore, took precedence over other claims, income distribution most certainly included. In Park's words,
The economic, social and political goals we set after the revolution are: promotion of the public welfare, freedom from exploitation, and the fair distribution of an income among the people. ICis obvious that these goals cannot be reached overnight. They are, nevertheless, the fundamental aims of the economic order towards which we must move.
Before these goals can be achieved, we must see to it that after more than a decade of stagnation, our poor economic power is greatly strengthened and that the heretofore shrunken or undeveloped power of productivity is fully utilized. We must take a great leap forward toward economic growth. . . . It is urgently necessary to have an economic plan or a long-range development program through which reasonable allocation of alI " our resources is feasible. (C. H . Park, 1962, p . 224)
If the lesson that the United States learned from the Korean upheavals was the need for stability before growth, then the military learned that causality ran in the opposite direction, from growth to stability. Inflation in Korea during the period 1962- 1979 averaged 18.4%-lower than that in Latin America but higher than that in India, China, Taiwan, Hong Kong, Singapore, Japan in its fast-growth

50 THE STATE AND BUSINESS
phase. or still earlier learners in theirs.24 This is not to suggest that government policy in Korea during the high-growth period was reckless; after all, the government was not unaware that hyperinflation and bankruptcy of foreign exchange reserves are the ingredients of countercoups. Rather, the policy was risky. As will be argued in the following chapters, however, risk was mitigated by leaving as little as possible to chance and the vagaries of the market. .
Within the first 1 00 days of its assumption of power, the military had announced its intention to launch the first five-year development plan. By the time Park's book, Our Nation's Path, was sent to press in February 1962 and still another of his books, The Country, The Revolution and I, was published one and a half years later, the twin pillars of the military's strategy to industrialize had been devised. The scaffold was still missing, little mention being made of exports, but there was clarity on the critical roles of both large-scale enterprise and long-range planning. However, apologies and rationales for supplanting market forces by state power were put forth in terms of both roles. In the case of large-scale enterprise,
One of the essential characteristics of a modern e.conomy is its strong tendency towards centralization. Mammoth enterpriseconsidered indispensable, at the moment, to our country-plays not only a decisive role in the economic development and elevation of living standards. but further, brings about changes in the structure of society and the economy. . . . Where the appalling power of mammoth enterprise is concerned, only with private profit under a self-assumed assertion of contribution to national development, there is no free competition. . . . Therefore, the key problems facing a free economic policy are coordination and supervisory guidance, by the state, of mammoth economic strength. (C. H. Park, 1962, pp. 228-229)
In the case of planning,
The economic planning or long-range development program must not be allowed to stifle creativity or spontaneity .of private enterprise. The overall national development program may necessitate, for the rational operation of the economy, reluctantly imposed administrative controls over the regional relocation of various industries and planning for investment. Yet we should
21 Data on inflation in Korea are presented in Table 3.1 . Data on inflation in other countries are from International Monetary Fund, Internationnl Financial S/aI�lics, various years. For data on inflation in Japan, 1905-1970. see Ohkawa and Rosovsky, 1973. Learners in the nineteenth century for the most part experienced mild price declines (see, for example, Landes, 1969).

A History of Backwardness
utilize to the maximum extent the merits usually introduced by the price machinery of free competition, thus avoiding the possible damages accompanying a monopoly system. (C. H. Park, 1963, pp. 224-5)
51
Although the U.S. aid advisors in Korea had tried earlier to formulate their own development plan-a task they subcontracted to a private Washington-based consulting firm-the plan's object, to terminate aid, led to its rejection by the Rhee forces. In 1958, however, Rhee had established an Economic Development Council, staffed by many "young foreign-educated intellectuals," fed on the ideas of planning that were then sweeping the economic development profession from .the universities (H. B. Lee, 1968, p. 90). It was this concept of national planning, if not the identical plan, that later (nspired the military rulers.
Park, whose principal hobby was said to be the study of Korean and world history, compared the Korean "revolution" under his leadership in 1963 to the Meiji reform, the modernization of China under Sun Yat�Sen, Kemal Pasha's development of Turkey, and Nasser's revolution in Egypt. Park's discussion of Japanese modernization is interesting both for what it says and for what it does not say. What it omits, even elliptically, is any reference to the nuts and bolts of the Japanese model-export strategy, investment policy, exchange rate regime, and so on. That these influenced Korean policymakers is. indisputable, but they came later. What Park's discussion includes is an analysis of japan's industrialization, not as a matter of policy but as a matter. of relations between the state, social classes, and ideology. According to Park's reading of history, the causes of the modernization of Japan were as follows:
.
I . The Meiji reform had as its ideological basis a nationalistic patriotism.
2. Thereby they succeeded in Japanizing foreign thoughts that came in volume, and guarding the reform tasks undergoing then
. repeated domestic ordeals from foreign invasion. 3. By eliminating the influence of feudal lords and directly connect
ing the emperor with the energetic middle class, a progressive atmosphere to overcome feudalism was created.
4. Millionaires who promoted the reform were allowed to enter the central stage, both politically and economically, thus encouraging national capitalism. An imperial system was thus established with the emperor at the apex of the pyramid of political and economic forces, and with the nobility serving as elder statesmen of the nation.

5;2 THE STATE AND BUSINESS
Park concluded by saying, "The case of the Meiji imperial restoration will be of great help to the performance of our own revolution. My interest in this direction remains strong and constant" (C. H. Park, 1963, pp. 120- 1).
This, then, may be said to have been Park's vision for Korea's industrialization when he marched across the Han, no doubt casting himself in the role of emperor. The vision could not be implemented in the absence of a strong state. In 1 96 1 , however, the field was clear for the assumption of state power. The landed nobility had been destroyed; the peasantry was less rebellious as a result of a land reform; and the "captains of industry" were beholden to the state for their regeneration. Only workers and students remained as opponents to military rule. Industrial workers, however, were still only a small portion of the population. As for the students, their role in an industrialization based on learning became pivotal. The Hang;ul generation, the first generation of students since the nineteenth century to escape education under the Japanese, came off the streets and into the modern factories of the 1970s as managers. In Chapter 3, attention turns to the model of accumulation that bound these social forces together.
CONCLUSION
The Korean state was able to cons9lidate its power in the 1 960s because of the weakness of the social classes. Workers were a small percentage of the population, capitalists were dependent on state largesse, the aristocracy was dissolved by land reform, and the peasantry was atomized into smallholders. The behavior of the Korean state became influenced by two forces outside the dass structure: the student movement and the American occupation forces (first the U.S. army, then the U.S. aid administration). The student movement kept the new government relatively honest. The American occupation forces drove the Korean military tQward developmentalism, the only, realistic course to reduce dependence on American support.
It is to industrialization policies that attention is now turned.
APPENDIX 2-1
Colonial Agriculture
From Japan's perspective, Korea was a valuable asset by dint of its agricultural resources. This is not to say that a food supply was the only motive for Japanese aggression. Raw materials in the northern part of Korea, geopolitics, nationalism, and the Korean market were also contributory factors. Moreover, Japanese imperialist policy shifted

A His lOry of Backwardness 53
over time. Rice riots in Japan led to an emphasis on agriculture in Korea, while protests by Japanese farmers over declining farm prices prompted a policy reversal (Duus, 1984). After 1930, industrialization in Korea was stressed as Japan began its conquest of Manchuria. Nevertheless, the exploitation of agriculture was the major endeavor of the Japanese colonial administration, and Korea was even singled out for a special role in this regard: to serve as a colony for Japanese settlers. Japanese settlers were slated not only to supervise and guide the improvement of Korean agriculture, they were also to set up farms and work the land with their own hands. This added dimension of imperialism was abs�nt in Taiwan, where the mosquito frus" trated foreign settlement, and in fact, "the differences between Taiwan and Korea cannot be overemphasized" (Moskowitz, 1974, p. 78). However, Japanese farmers never became a significant proportion of total Japanese settlers. The myth of a sparsely populated Korea dissipated, and the Japanese population as a percent of the total population in Korea never amounted to as much as 3% (T. H. Kwon et aL, 1 975). Nevertheless, the settler mentality endured and created far fewer opportunities for Koreans in business and the civil service and far more abusive race relations than might otherwise have been the case.
.
In the first year of annexation, Japan initiated a cadastral survey to determine the size, value, and ownership status of every plot of land. By 1919 the survey had been completed and a new, ,less re� gressive tax' system had taken effect. The new agrarian structure implanted in Korea in the interim was very similar not only to the one that existed in late nineteenth-century Japan but also to the one that Japan instilled in early twentieth-century Taiwan (see Amsden, 1985). Superficially, it resembled the one that had been in effect for a thousand years, whereby the state collected taxes from landlqrds and landlords collected rents from tenarits. Moreover, although Korean specialists are divided on this point, the same individuals who were last landlords under the old system most likely became landlords under the new one; now, however, the landlords worked in conjunction with former bureaucrats, Confucian scholars, and the Japanese (Cumings, 1974). Japanese landlords-both corporate and individual-may have possessed as much as 50% of Korea's total available land (see the estimates of Ho, 1984, and of Grajdanzev, 1944). Nevertheless, in key respects, the new agrarian structure was quite distinct.
.
Under the precapitalist system, peasants had traditional rights to their land and were unlikely to lose it. Under the new system, they had no rights at all. On the other hand, under the precapitalist system, landlords lived by virtue of their political domination, and the resolution of disputes between landlord and peasant depended di-

54 HIE STATE AND BUSINESS
rectly on force. Under the new system, landlords lived by virtue of their property rights ; their land was alienable, and disputes, in theory, were resolvable by law.
Some appreciation of the differences between these two agrarian systems is gained by looking at the major problems associated with the dynastic agrarian structure and the advantages of tenar;tcy. Formerly, the economic surplus largely went to a parasitic landlord class. Taxes were paid by the landlords to the monarchy, but only enough· to sustain it, not enough to allow it to invest. By and large, the landlords used the surplus for political consumption-to buy patronage and to build their military strength. The peasantry, �oreover; was not dependent on the market .. and therefore was not forced to be efficient. If peasants were lucky enough to accumulate a surplus, they were not driven to invest it in improvements. By contrast, the new system represented a radical improvement insofar as it introduced the market as a stimulant for increased productivity. Tenants were exploited to the maximum. In the presence of population pressures there was competition to acquire tenants' leases, and rents escalated. Neither did Korean peasants enjoy the alternative open to Japanese peasants-industrial employment-an alternative that might otherwise have set a ceiling on rents and acted as a further stimulant to efficiency. Instead, exploitation of the . . Korean peasantry increased, while the colonial administration's cadastral survey expanded tax collections and discouraged landlords from investing in tax evasion.
In light of the foregoing, one would expect Japan's agricuftural policies in Korea to have resulted in a decline in the welfare of the masses, a deterioration in income distribution, and a rise in output; in fact, this is what occurred. The index of rice consumption fell from 100 in 1915- 1 9 1 9 to only 56 in 1934- 1 938. A similar decrease in consumption index characterized millet, barley, and beans. In 1932 the rice available per member of a landlords' family was 1 1 .43 koku; the comparable figure for tenants was only 0.4 1 . Meanwhile, between 19 10 and 1 94 1 , agricultural output rose at an average annual rate of 2.3% (S. C. Suh, 1978). Over time, the social composition of the agricultural population shifted toward tenancy. Tenants accounted for 37.7% of the agricultural p,opulation in 1918 but for as much as 53.8% in 1932. In the late 19305, less than 3% . of farm households owned about two thirds of the cultivated land area (Grajdanzev, 1 944; see also references in footnote 5).
There appears to be generai 'agreement that from the perspective of economic development, Japanese imperialism was less effective in Korea than in Taiwan. For comparisons in agriculture and in education, see Ho ( 1984) and Tsurumi ( 1 984), respectively,

CHAPTER THREE
The ABCs of Japarlese and
Korean Accumulation
COMPETITIVE ADVANTAGE I N KOREA VERSUS IN JAPAN
This chapter is concerned with how acceleration in Korean investments and exports was activated. Exploiting its low-wage advantage ' to gain entry to international trade, Korea scored breathtakingly rapid increases in output. Table 3 . 1 shows that during the first two fiveyear plans, 1 962- 1 966 and 1967-1 97 1 , the real growth rate of GNP , averaged 9% per annum. In the period 1972- 1979, growth was still ' higher, 1 0% on average each year. A decomposition of GNP growth rates is presented in Table 3.2. It is evident that exports and investment, the subjects of this chapter. led overall economic activity. Consumption grew only modestly. The real growth rate of exports; deflated by the U.S. wholesale price index, averaged a phenomenal 40% in the period of the first two five-year plans (Table 3. 1). Between 1972 and 1 979 (the year of Park's assassination), the export growth rate averaged 28%, all the more remarkable because during this period the industrial composition of output and exports in Korea was radically transformed. In 197 1 the share in merchandise exports of heavy manufactures was only about 1 4%. The share had increased to 38% by 1979, and by 1984 to 60%, roughly the same share as heavy manufactures in total merchandise output (Table 3.3).
Korea is evidence for the proposition that if and when late industrialization arrives, the driving force behind it is a strong interven- " tionist state. The need to intervene is greater than in the past be- , cause the curses of backwardness are greater. The relativity of this proposition is illustrated by examining Japan's foray into world trade in cotton textiles (spinning and weaving) in the first third of the twentieth century. Cotton textiles continue to serve as the illustrative
55

56 , THE STATE AND BUSINESS
Table 3.1 Basic 'Macro Indicators, 1962- 1984
GNP Real Growth Change Export Export Effective Ratio, Tenns
Rate in GNP Growth Growth Exchange Current of Year (%) Deflator Rate" Rateb RateC Account/GNP Trade <
1 962 2.2 13.5 3 1 .7 3 1 .0 1 1 2.0 -2.0 NA 1 963 9. 1 28.3 6 1 . 1 6 1 .6 1 34.4 -3.7 1 1 1 .3
1 964 9.6 30.0 37.9 37.6 106.3 -0.8 1 12.5 1965 5.8 6.3 45.8 43.0 9 1 .6 0.3 1 14.3 1966 12.7 14.2 42.9 38.3 96.1 -2.7 127.7 1 967 6.6 15.8 34.0 33.7 107.9 -4. 1 132.2 1968 1 1 .3 15.9 45.1 4 1 . 5 1 1 5.2 -7.4' 137.7 , 1969 1 3.8 14.6 35.4 30.3 120. 1 -7.3 132.6 1970 7.6 15.7 34.0 29.3 124.2 -7. 1 133.8 1971 8.8 13.4 28.5 24.3 120.7 -8.7 132.7 1972 5.7 16.4 47.9 4 1 .7 1 09.4 -3.5 1 32. 1 1 973 1 4 . 1 1 3.4 95.9 73.2 92.4 -2.3 1 25.4 , 1 974 7.7 29.5 37.5 ' 15.7 93.6 - 10.9 102. 1 1975 6.9 25.8 10.8 1 .4 93.5 -9.0 92. 1 1976 14. 1 20.5 56.2 49.2 1 03.4 - 1 . 1 105. 1 1977 12.7 1 5.8 28.6 2 1 . 1 103.9 0.0 1 1 2.4 1978 9.7 2 1 .9 26.5 17.4 1 0 1 .0 -2.2 1 1 7.8 1979 6:5 2 1 . 1 15.7 2.8- 1 1 0.7 -6.4 1 1 5.3 1980 -5.2 25.6 17. 1 2.6 100.0 -8.7 100.0 1 98 1 6.2 1 5.9 20.1 10.0 1 03. 1 -6.9 97.9 1982 5.6 7.1 1 .0 - 1 .0 1 06.9 '-3.7 102.2 1983 9.5 3.0 1 1 . 1 9.8 100.2 -2.1 103. 1 1984 7.6 4.0 13.5 10.9 97.8 - 1 .7 105.3
'GNP. gross national product; NA. not available. In nominal U.S. dollars.
b Export value deflated by U.S. wholesale price index.
c 1980= 100. SOUTC": Bank oC Korea and International Monetary Fund.
case when discussion turns to the Korean economy in the 1950s and , 1960s. Cotton textiles accounted for over 20% of manufacturing valueadded and became Korea's major export item.
Unlike Korea, Japan as a colonizer had been able to rely on more competitive weapons than merely low wages to capture market share in cotton textiles from Lancashire during the 1900-1930 period. ' Korea, twenty years later, had only low wages with which to compete against Japan, and low wages in the absence of governmt:nt support proved insufficient to stimulate export activity. In the 19508 Washington actually thwarted Korea's efforts to export by prohibiting U.S.
1 Lancashire was the home of cotton textiles manufacture in what was then the, . world's leading producer, Great Britain.

The J\BCs of Japanese and Korean Accummulation 57
Table 3.2 Decomposition of Gross National Product Growth Rate, 1962-1984 (Real Growth Ratesa)
Year GNP C G X M NFl
1962 2.2 5.7' 6.9 0.9 1 2.5 32.0 1 1 .9 1963 9. 1 3.3 76.0 4.8 7.4 2704 4.8 1964 9.6 5.6 - 16.7 -3.6 23.6 -25.6 -3.8 1965 5.8 7.8 3.6 6.8 40.7 13. 1 17.2 1966 12.7 7.2 75.0 1 1 .5 52.3 57.7 7 1 .0 1967 6.6 9.3 16.6 10.2 35.7 34.8 64.6 1968 1 1 .3 1 1 .4 42.4 13. 1 4 1 .6 45.9 3.3 1969 1�.8 1 1 .0 3 1 .2 1 2.2 31 .9 24.7 3.6 1970 7.6 1 1 . 1 0.9 6.7 22.9 10.0 -55.9 1 97 1 8.8 IDA 6.3 10.7 20.5 20.4 - 1 17.0 1972 5.7 5. 1 - 10.2 2.9 36.6 0.9 - 164.4 1973 \4. 1 9.2 3 1 .5 1 .7 55.3 36.7 336.7 1974 7.7 7.6 29.9 10. 1 -2.8 16.9 69.3 1975 6.9 5.6 1 .7 4.3 15.9 0. 1 127.4 1976 14. 1 8.3 16.3 5.9 4 1 .6 27.0 - 1 14.7 1977 12.7 6.8 23.2 9. 1 22.6 23.4 1 ,3 10.4 1 978 9.7 9.9 22.8 13.0 19.9 29.0 - 13.0 1979 6.5 8.9 19.7 0. 1 -3.8 8.6 -49.8 1980 -5.2 -0.8 -23.7 6.8 9.7 -7.3 -334.0 1981 6.2 304 2.2 2.2 17.3 5.3 50.9 1982 5.6 4.6 5.0 2.2 6.2 2.3 0.7 1983 9.5 6.6 13.7 4.7 13.8 1 1 . 1 6.9 1984 7.6 5.7 1 1 .9 2.3 8.1 ' 6.8 25.8
'Growtll rates are calculated from data in won and corrected by tile GNP deHator: C. consump-tion; I. investment; G, government spending; X. eKports; M. imports; Nfl. net factor income.
Source: Bank of Korea.
imports of Korean-made textiles that embodied American aid-financed raw cotton. By the conclusion of this chapter we begin to understand better why investf!1ent and exports in Korea rose so fast beginning in the 1960s, their acceleration a function of strong state support as well as of discipline.
THE EMERGENCE OF AN INTERNATIONAL DIVISION OF LABOR
As the basis of industrialization in the world has shifted over time from invention to innovation to learning, what has also shifted is the basis on which less industrialized countries have entered world markets to compete. What we have come to take for granted as the international division of labor-in which low-wage countries hold a commanding position in products characterized by labor-intensive

U1 r:tJ
Table 3.3 Percent Share of Heavy and Chemical Industry and of Light Industry in Manufacturing Output and Merchandise Exports. 1971.,.,.1984
Industry Share 1 971 1972 1 973 1974 1975 1976 1 977 1978 1979 1980 1981 1982 1983 1984
Heavy and ehemkal a 40.5 39.7 42.6 49.9 47.5 49.5 50.7 53.0 54.9 56.3 57.7 58.3 59.3 6 1 .9 industry b 1 3.7 2 1 . 1 23.6 33.2 25.9 28.8 3 1 .6 33.2 37.7 39.9 42. 1 49.2 54.3 59.7 Chemical e 56.2 52.2 44.8 46.9 54.3 48. 1 43.8 39.6 4 1 .0 49.3 46.9 45.0 42.2 39.2
d 14.2 14.7 10.2 12.9 13.2 1 1 . 1 10.2 8.5 9.8 1 1 .6 9.5 9.5 9.8 10.7 Basic Metal e 14.5 15 .4 1 9.7 18.1 13.3 14.5 1 5.2 14.7 16.0 16.6 16.7 16.4 16.2 17.0
(iron. steel. non- d 26.5 34.2 33.4 38.8 28.1 27.4 3 1 .3 27.1 3 1 .8 36.6 34.9 30.5 26.9 22.8 ferrous metals)
Mach. and lrans. e 29.4 32.4 35.5 34.9 32.4 37.4 4 1 . 1 45.7 43.0 34. 1 36.4 38.6 4 1.6 43.8 equipment d 59.4 5 1 . 1 56.4 48.3 58.8 6 1 .5 58.4 64.3 58.4 5 1 .8 55.6 59.9 63.4 66.5
Light industry a 59.5 60.3 57.4 50. 1 52.5 50.5 49.3 47.0 45. 1 43.7 42.3 4 1 .7 40.7 38. 1 b 86.3 78.9 76.4 66.8 74. 1 7 1 .2 68.4 66.8 62.3 60. 1 57.9 50.8 45.7 40.3
aln total manufacturing output.
b In total merchandise export.
<Of output in heavy and chemical industry.
·Of export in heavy and chemical industry. Heavy includes consumer electronics.
Si1UTtIJ: Economic Planning Board.

The ABCS or Japanese and Korean Accummulalion 59
production techniques. and high-wage countries dominate in the remainder of industry-is a recent phenomenon. dating approximately from the end of World War II.2 Obviously. other things being equal, low wages contribute to profitability. Yet in few industries before World .War II did low wages confer a decisive lead. Since this war, moreover, low wages have given a decisive lead only to a limited number of countries.
It is clear that lower wages were not responsible for England's emergence as the first industrialized nation. For roughly a century Britain sustained a lead over European countries, which had decidedly lower living standards. because of its higher productivity. At one level a product of the social climacteric. higher productivity in Britain derived directly from the inventions that gave the First Industrial Revolution its character and established the direction of the long wave of technological change that ensued. Labor-saving processes in Britain outcompeted less mechanized techniques in lowerwage countries that failed to import the superior but costly techniques. When, moreover, the United States and Germany caught up with Britain and then overtook it, they did not do so on the basis of lower wages in conjunction with parity in "best practice" technique. In fact, wages in the United States were higher than in Britain. and at the end of the nineteenth century even Germany did not have access to as abundant labor reserves as did Britain. Moreover, Germany was not especially efficient in those industries that were most labor ini:ensive. Dispersed home production and low productivity were common in clothing and textiles even after the turn of the century (Landes, 1969). Therefore it was neither in the.area of textiles nor in the area of the least mechanized trades that Germany and the United' States developed strength. Rather they contrived to overtake England as innovators, by operating in a new set of "basic" industries, employing a new set of firm structures, and, interrelatedly, utilizing a new set of production methods.
The international division of labor as we know it began at the turn of the twentieth century with improvements in communications, transportation, and technology transfer. The shape it took. however, was decided not by the United States or by Germany but rather by Japan, whose state underwrote large-scale investments in foreign technology by private firms. Writing in 1 935, Hubbard expressed sentiments that might have applied to the world economy thirty years later:
2 Little appears to have been written directly on the pre-World War II international division of labor. but there are empirical studies of changes in trade patterns over time. See. for example. Amsden (1986) and Maizels ( 1963); for the period 1700- 1914
. see Woodruff ( 1973); for the period 1850-1950 see Ashworth (1952).

60 THE STATE AND BUSINESS
The emergence of Eastern countries as large-scale industrial producers, their entrance into international markets, the loss of these markets to the manufacturing countries of the West, and the reaction of the latter in the form of trade restrictions in colonial territories have caused a substantial addition to th,e world's economic problems of today.
The more immediate problems relate to the progress of Japan, who, by reducing her costs of production to a level hitherto unknown, has extended her trading operations in every quarter of the globe and invaded and captured markets, which, .in the past, had been the cherished preserves of the exporting countries of the West. ( 1938, p. xvii)
The Japanese thrust caJ'!'le largely in cotton textiles and with catastrophic effect. From 1 885 to 1 913, British annual sales of yarn in China fell from 20 million to 2 million pounds. In 1 9 1 3 Japan sold 1 56 million pounds of yarn to China, and Japan's total exports of yarn and thread were worth well over twice Germany's and about 40% of England's (Great Britain, 1 928; Orchard, 1930). By 1929, japan's share of world exports of cotton piece goods was 22%; by 1 935, it was 44% (Hubbard, 1 938).
In the study just cited, Hubbard was at pains to demonstrate that Britain's woes were not attributable simply and solely to japan's lower wages. Instead, Japan's rise as an international competitor was shown as reflecting its status as a young industrial power-a colonizer, not a colony. Consequently, the penetration of world markets by Japan circa the 1 920s differed from that of other Asian late-industrializing countries forty years hence, which ploughed into world markets having only just sh�d their colonial skins.
Hubbard did concede that unskilled female cotton operatives in Japan earned one sixth the British rate, and at the other extreme, skilled male metal workers earned one half. With regaid to the former class, however, "it must pe noted that the female workers in Japan are mainly young girls under 20, and that if their wage rates are compared with those of young leamers in the British cotton trade, the discrepancy between the two rates is not very marked" ( 1 938, p. 1 1 3).3 As for productivity, the .difference petween Japan and the United Kingdom was unclear, although cotton mills in the United States used one third the labor used in Japan. Together with other evidence, from a parliamentary investigation in�o global competitiveness, Hubbard was led to argue that B ritain's 10$s of market share
S Page references in this paragraph and the next are to Hubbard ( 1938). See also Pearse ( l929).

The ABCs of Japanese and Korean Accummulalion 61
was not attributable to a low-wage interloper. Rather, japan's strength lay in the following:
l . Group control over the industry by the Japan Cotton Spinners' Association and various other trade associations in order to check overproduction and uneconomic competition.
2. Large [and integrated] manufacturing units, working two shifts a day and equipped with ring spindles [the most modern technology] and, to a considerable extent, also with automatic looms.
3. Shipping subsidies and low shipping costs. 4. Concentration of raw-cotton imports in the' hands of a few large
trading concerns, and the system of bulk purchase, whereby the spinner is often able to obtain his raw cotton at the lowest possible cost.
5. Great efficiency in marketing the finished product resulting from maintenance of closer contact with customers, and from intimate cooperation between the manufacturing and mercantile sections of the industry. (p. 8 1 )
To Hubbard's list must be added the quality of japanese management. The proportion of university graduates in total employment was far higher in the japanese than in the Lancashire textile industry. Ironically, japan even sent large numbers of managers for training in the Manchester Technical School (Yonekawa, 1 984).
Centralized purchase of cotton during World War I had allowed the zaibatsu to reap windfall gains. They used these to purchase modern machinery such as ring spindles. "Lancashire, with 27% of all spindles in the world has . . . only 10% of the rings and japan, with 7% of the total has also 10% of the rings" (Hubbard, 1938, p. 109). Once the zaibatsu had reequipped their factories with the best machinery and had rationalized the process flow, "japan's vast reservoir of cheap labour could be converted from a potential into a real asset and Japanese competition in world markets became a factor to be reckoned with" (Hubbard, 1 938, p. 109).
There is no evidence that Korea challenged the advanced countries, particularly Japan, on any basis other than lower wage rates when it began exporting textiles in the 1960s. This is true even though, as will be suggested in Chapter 10, it would be simplistic to ignore the managerial setting in Korea that made lower wages operationally meaningful. Nevertheless, of the five strengths of Japan vis-a-vis Britain cited above, Korea may have achieved parity with Japan on only the first, the least developmental-cartelization. Moreover, Japan's penetration of foreign markets benefited from three additional factors to which only advanced, not backward, learners have been

62 THE STATE AND BUSINESS
privileged. These factors made Japan a privileged twentieth-century learner.
1 . The preponderance of Japanese manufactured exports was destined not for more but for stilI less industrialized countries. Before World War I, China took 90% of Japan's exports of cotton manufactures, mostly yarn, while Korea took japan's inefficiently produced piece goods (Koh, 1966; Mitsubishi Economic Research Bureau, 1 936). Then the crippling effect of war on shipping gave Japan the greater Asian market. In 1 929 as much as 82% of Japan's manufactured exports was sold to its poorer neighbors. By 1957 this percentage had fallen only modestly, to 71 % (Amsden, 1 986). Japan, therefore, entered world markets through a back door, so to speak. Exporting to the colonies, its own and Europe's, was a downhill struggle compared with exporting to the metropolitan heartlands, which Korea and the other Asian late� industrializing countries were forced to do. As the colonies industrialized, Japan stayed one giant step ahead of them and provided sequentially more of their sophisticated imports. By contrast, Korea exported progressively more sophisticated manufactures to the metropolitan heartlands and posed an ()ver greater threat to their established industries and employment.
2. Japan was sufficiently industrialized in the 1920s and 1 930s to pursue a "beggar-thy-neighbor" exchange rate policy to expand its exports, against the wishes of the advanced countries, which wanted an appreciated yen. On the other hand, the Korean government in the 1950s and 1960s was hard pressed to keep its currency overvalued in order to lower the costs of machinery imports, against the wishes of the advanced countries, which wanted a depreciated won. Both learners, being resource poor, were highly dependent on imported raw materials to su.stain their industries, not least of all cotton spinning and weaving. But Japan was freer than Korea to depreciate and to give its exports a boost, because it was almost self-sufficient in intermediate inputs and capital goods, including t�xtiles machinery. Imports of machinery by Japan accounted for 8.3% of its total imports in 1 929, down to 6.4% six years later (Mitsubishi Economic Research Bureau, 1 936, p. 537). Imports of machinery by Korea, on the other hand, accounted for 16% of its total imports in 1965, up to 29% six years later (Bank of Korea, various years [a]).
3. Japan's penetration of world markets before World War II differed from that of latter-day learners insofar as japan's economy was sui generis, none other like it at the time combining quite the same size and degree of backwardness and modernity. At one

The ABCS of Japanese and Korean Accummulation 63
time it looked like Japan might encounter serious competition from China and India, but for various reasons this never materialized. In 1899 the value of India's total manufactured exports exceeded that of japan's; by 1 9 1 3 export values were equal; by 1929 Japan's manufactured exports exceeded those of India and the margin widened thereafter (Amsden, 1986). By contrast, Korea was one of a large set of postcolonial exporters with roughly the same factor endowments. As Korea industrialized and as its wages rose, countries with still lower wages provided more of a threat than a market.4 The market environment of the international division of labor had grown more competitive.
From this perspective, low wages were an ambiguous blessing. They helped a learner like Korea to enter world markets, but they went hand in hand with backwardness. Backwardness, moreover, imposed heavy costs in the form of low domestic purchasing power, low productivity, an almost total reliance on imports for inputs, low savings, and high interest rates. These costs made it harder both to enter world markets in the initial instance and to progress up the ladder of technological complexity, realizing value less on the basis of cheap labor and more on the basis of skills.
Attention is now turned to the hodgepodge of policies that the military regime of Park Chung Hee constructed to offset these costs of backwardness, and to mediate the confliqing demands of interest groups inside Korea.
THE MODEL OF ACCUMULATION
Just as a strong state in Korea was the outcome not of policy choice but of a long process of social change, . so too were the particular policies that the military regime pasted together in the early 1960s to form a model of accumulation that was rooted in the past. At the heart of the model were subsidies offered by the state to private enterprise in exchange for higher output of exports and import sub- <
stiLUtes. The wheeling and dealing, horsetrading, and tra'fficking that characterized this process were reminiscent of the reciprocity that characterized relations between the state and the privileged class�� under dynastic rule. The critical difference lay in the tip of the bal- "
• Some newly industrializing countries, particularly Brazil. Argentina, and India, have exported large shares of their manufactured exports downstream, to developing countries. This has not been true of Korea, however, although it is trying to export more to Asian countries, and it exported as much as 1 0% of its manufactured exports to the Middle East during the oil boom. For a discussion of South·South trade, see Amsden ( 1986).

64 TI-IE STATE AND BUSINESS
ance of power toward the state. However clumsy at first, the state , ,used its power to disciplipe not just workers but the owners and ... managers of capital as welL A larger surplus was extracted, and this , was invested rather than consumed.
.
Another tradition; which carried over from the 1950s to the 1960s, was the extraordinary degree to which a supposedly sovereign state was subject to intervention by the international aid establishment in its economic policymaking. While those European allies of the United . States that reindustrialized after World War II were also the benefactors not merely of aid but also of advice from American aid administrators, nOne was as politically unstable as Korea, nor was any other the locus of still another shooting war. These coincidences in Korea prolonged and intensified intervention accompanied by aid through the mid- J 960s. Even after aid ceased, intervention continued in tandem with military support. In the 1 960s, the United States placed enormous pressure on Korea to accord diplomatic recognition to Japan. This was viewed at the time, by businessmen and students in Korea, as suicidal both for infant industry and for cultural integrity (Cole and Lyman, 1 97 1 ). In desperation, the Park regime turned to the World Bank and to the IMF as a way to multilateralize its international dependence. Yet these Bretton Woods institutions also ad,:ocated policies that put stability before growth, if somewhat less forcefully than had U.S. aid advisors during the period in question.
At the time of the military coup, inflation was down momentarily due to a strong stabilization package adopted in 1957, but GNP was stagnant. The military regime divided its attention to minister to two influential groups: cotton textiles firms, which like their Japanese counterparts had organized themselves into a powerful lobby-the Spinners' and Weavers' Association of Korea-demanding relief from excess capacity; and the progressive "millionaires," or chaebol, ih disfavor with the public and press for having accumulated illicit wealth. Out of ministrations to influential groups, and insistence of U.S. aid advisors on stability before growth and fiscal conservatism, came Korea's accumulation model. Attention is focused below on the trade and investment policies that emerged from this mod�l.
TRADE POLICIES
Cotton spinning and weaving is one of Korea's oldest industries. The Kyongsong Spinning and Weaving Company, founded in October 19 1 9, was possibly Korea's first major national capitalist enterprise (Eckert, 1986). After the Korean War, cotton spinning and weaving received the "lion's share" of foreign aid to all industry in Korea.

The ABCs of Japanese and Korean Accummulation 65
Considering aid as having financed both productive facilities and raw cotton, spinning and weaving may have accounted for over 10% of total aid (]. B. Kim, 1 966).
The cotton textile industry was represented by a cartel, the Spin\ ners' and Weavers' Association of Korea. According to J. B. Kim in his 1 966 doctoral thesis, "the Korean cotton-manufacturing industry belongs to the category of oligopoly in the conventional sense." Roughly 15 integrated cotton spinners and weavers dominated the industry and recognized "mutual interdependence" with respect to pricing (p. 1 3). By 1957 the industry had achieved "complete import substitution." allowing the government to prohibit textile imports (Y. B. Kim, 1980, p. 208). /
The performance of the industry was mixed. In terms of efficiency, performance was high. Labor productivity increased sharply in the period 1954- 1963. almost trebling in the spinning sector and' nearly doubling in the weaving sector (]. B. Kim, 1966). Business, however, was problematic. By the early 1960s, the industry was suffering from excess capacity. The operating rate in 1961 was 66% in cotton yarn and 50% in cotton cloth (Bank of Korea. 1 963). According to J. B . Kim, textiles firms took advantage of subsidized loans from the aid establishment in the 19505 and created capacity ahead of demand. Capacity was still in excess supply in the early 1 9605. There was little export activity, however, despite excess capacity and despite the provision of export incentives, which had begun in the early 1950s.5 Nor did it prove possible to increase exports merely by devaluing the won against foreign currencies. The major effect of devaluation was worsening of the business climate by the increase in price of imported inputs, which fueled inRation.
The Korean won was devalued by 50% in 196 1 , from 65 to 100 won for the dollar in January and from 100 to 130 won for the dollar in February (Frank et al., 1975). The result was disastrous. According to the Economic Planning Board,
The textile industry, as were many others, was also hard hit by the revisions in the exchange rate, as well as overproduction ca- \ pacity. This can be illustrated by observing the cotton textile industry. representing the largest portion of the entire industry, which is 99% dependent upon industry imports for the neces- I sary supply of raw cotton. . . . The price index of raw cotton increased by 1 1 .5% in January of 1 96 1 from the level of December 1960; reached 287.9 in February 196 1 , a 29.5% increase
5 One is now led to think that export incentives were part of a "liberalization" package in the mid-196Qs. This is clearly incorrect insofar as export incentives started much sooner, although they started small. (Frank et al.. 1975).

66 THE STATE AND BUSINESS
over the level of the previous month; and pressed even higher to 292.0 in March and to 299.8 in April, a level which was generally maintained throughout the remainder of the year. These increases in the price of raw cotton affected in turn the production . costs of all cotton products and the price of cotton yarn. ( 1962, p. 49)
The crisis precipitated by devaluation provoked the military government to interv·ene with an expansionary economic package, which exacerbated inftation even further.
In addition to business problems due to devaluation, there were further impediments to exporting. According to a survey of members of the Spinners' and Weavers' Association, two of the more serious impediments were old plants and equipment and weak marketing channels. U.S. export restrictions presented a third obstacle: "Before 1960 the Korean cotton-manufacturing industry could not export manufactured cotton products, with a few exceptional cases; and after 1960, the industry could not earn free foreign exchange to the extent that it exported" (J . B. Kim, 1 966, p. 48).6 This was stipulated in an agreement between the Korean and U .S. governments under Title I of the (U.S.) Agriculture Trade Development and Assistance Act, renewable yearly. The agreement prohibited "the resale of transshipment to other countries or the use for other than domestic purposes" of agricultural commodities supplied as U .S. aid (J. B . Kim, 1966, p. 48).7 Thus, while the U.S. aid administration in Korea preached the theory of free trade, in practice Washington fru.strate� the adoption of competitive exporting. "
The volume of eXpOrts from Korea barely budged in 1960- 1 962, but bounded in 1 963, 1964, and thereafter (see Table 3.4). What seems to have turned the tide was a sharp rise in subsidies to exporters. These were Park's answer to the textile industry's woes. The relative magnitude of subsidies is shown in Table 3.4 as part of the export-effective exchange rate. This exchange rate reflects how liberally a government wishes to reward exporters, although it is biased downward because it does not include subsidized long-term loans, and longterm capital subsidies were extremely important tn Korea tn certain industries and firms . . The value of manufactured exports was higher in 1963-
6 One exceptional case was noted by the Cotton Spinners' and Weavers' Association in a book on its forty-year history. In it the United States is reported to have allowed one of the Association'S members to export cotton products to Hong Kong in 1957, but only if their value did not exceed $2 million (Taehan Pangjik Hyophoe, 1987, p. 251).
? Textiles firms became able to export only after they procured raw cotton with freely earned foreign exchange, around 1965.

The ABCs of Japanese and Korean Accummulation 67
Table 3.4 Exports of Manufactures' and the Exchange Rate, 1960- 1 965
Variable 1960 1961 1962 1963 1964 1965
Expons (mil. U.S. $) 4. 1 5.7 9.6 38.6 57.7 106.4 Manufactured exports as 12.5 13.9 17.5 44.5 48.4 60.8
percent of total export Official exchange rate 62.5 127.5 130.0 1 30.0 2 14.3 265.4
(won/dollar) Export effective exchange 1 47.6 150.6 1 5 1 .5 189.4 281.4 304.6
rateb Individual items as percent
of total manufactured exports
Processed food 36 2 1 1 4 Textiles 25 29 4 1 Lumber and plywood 07 1 0 1 4 Metal and steel products 1 0 2 1 1 3 Other 22 19 18
"Manufactures arc defined as Standard Industrial Trade Classification codes 6 . 7 . and 8.
bThe number of units of local currency actually paid or received for a $ 1 .00 international trans· action. Surcharges. tariffs, the impliCit interest foregone on guarantee deposits. and any other charges against purchases of goods and services abroad are included. as are rebates. the value of import replenishment rights. and other incentives to earn foreign exchange for sales of goods and services abroad.
Source: For exports. Economic Planning Board. 1967. For eXChange rates. Frank, Kim. and West· phal. 1975. For product breakdown, Hong. 1975.
1964 than in all previous years combined since the Japanese defeat in 1945, notWithstanding the increasing overvaluation of the won in 1963- 1964 amidst high inflation. The expon effective exchange rate rose from 1 5 1.5 won per dolJar in 1962 to 1 89.4 in 1963, at the same time as exports rose; The government again devalued the won by 50% in May 1964 (after the United States made the release of food aid contingent on devaluation). Exports increased further, but so did subsidies. as indicated by the gap between the official and exporteffective exchange rates. The gap between the two would have been even wider if subsidies to capital had been included.
Overvalued exchange rates were favored by the textile industry because the disadvantage of higher export prices (and presumably lower export demand) was dwarfed by the advantage of reduced input costs, since even an export-oriented industry like textiles still ' catered primarily to the domestic market. The share of exports to total demand in textiles production was 4.8% in 1963. 15.0% in 1966, and 47.2% in 1 973 during the golden age of Korean cotton spinning and weaving (Y. B. Kim. 1980. p. 1 08). The subsidy, however. ad-

68 THE STATE AND BUSINESS
dressed both the supply- and demand-side issues. According �o a history of the Korean textile industry,
The government implemented numerous export promotion measures including preferential loans for operation and facility expansion, tax and tariff exemptions, wastage allowances, and other social overhead and administrative supports. It could be said that the textile industry was more effective in taking advantage of such benefits, since it had strong business organizations and more large-scale enterprises than other [light] industries. (Y. B. Kim, 1 980. p. 232)
Underlying the competitiveness and dependence on subsidies of cotton spinners and weavers is their labor cost, position, which has been analyzed by Woo ( 1 978). Woo compared labor costs per bale of cotton in japan and Korea in the late 1960s. Although his findings are sensitive to the exchange rate and also to the accuracy of data on wages and productivity, he found that labor costs in japan and Korea ran neck and neck in the late 1 960s. Had other costs been considered, the overall position of Korean producers would probably have appeared even less favorable. Subsidies to exporters �n late industrializing countries have often been seen as a necessary evil to offset the higher-than-world-price that exporters have to pay for their imported inputs as a consequence of exchange rate "distortion." In fact, however, international' cost comparisons such as the one undertaken by Woo ( 1 978) suggest that subsidies in Korea were necessary not because of "distortions" but because the Koreans could not, initially, compete against the Japanese, even in industries such as cotton spinning and weaving in which the least developed, most labor-intensive countries supposedly have a comparative advantage. (Appendix 3-1 suggests how the Korean cotton textiles industry ultimately weaned itself from subsidies.) ,
By january 1965, exports had become a fixed idea for Park, and he had already begun to talk in terms of global competitiveness. He explained in hi� "State of the Nation Message" on january 16, 1 96? :
To go with increased 'production, the government has set as another major target-increased exports . . . . In a country which depends heavily on imported raw materials for its industries, export is the economic lifeline. . . . For many years, Korea ex- , ported only $20 million to $30 million worth of goods a year . . . [mostly] tungsten. But in the past few years, the government and people awoke from sleep and strove. Exports began to expand rapidly . . . . Last year, our exports exceeded 'the $ 1 20,000,000 mark. Although there is still a gap in the balance of payments, this much is true: that we have acquired the self-

The ABCs Of Japanese and Korean Accummulalion 69
confidence that we, too, can successfully compete with others in the international export race. (Bum-shik, 1970, pp. 305-6) .
Thereafter, the Park regime increasingly made exports a compul-sion rather than a choice for the private sector. In addition to subsidization, a strong element of coercion underlay Korea's phenomenal export ·performance. The extent to which exports were a reaction to . pressure rather than to subsidies, let alone the "right" relative prices, may be gauged from the survey responses of exporters to the question, What has been the effect of export targets fixed for your firm? As Table 3.5 indicates, in the year, say, 1976, 37% of respondents said the effect of export targets on their firm was positive, 10% said these targets had no effect, and as many as 53% listed negative effects.
If overseas sales were not always profitable. however, as suggested
Table 3.5 The Coerciveness of Export Targeting: Responses to question, What has been the effect of export targets fixed for your firm? 1974- 1976
1974 1975 1 976
Number Number Number of of of
Reponse Firms Percent Firms Percent Firms Percent
Contributed to a more rapid increase of production 48 42 48 32 58 37
Made no difference to the growth of production 1 6 1 4 24 16 15 10
Caused the firm to divert sales from the domestic to export markets 23 20 22 1 5 28 1 8
Reduced the profitability of the .firm - 8 7 1 7 12 14 9
Led to price cutting. unprof-itable sales condition. and other forms of competi-tion adverse to the firm 6 5 16 I I IS 10
Led to spme unprofitable exports 5 4 12 8 8 5
Raised unit costs due to the employment of inexperi-enced personnel or for other reasons 8 7 1 1 7 16 10
Led to some deterioration of product quality 1 I 2 I I 1
Total number of resp0l!ses' 1 1 5 100 1 52 100 155 1 00
'One-hundred and· five firms replied 10 this question. some more than once. and SOme only for one or two yeaTS.
s";',« : Adapted from Rhee. Ross-L.arson, and Purse.1I ( 1984).
70 THE STATE ANO BUSINESS
by the negative responses of exporters, then the government compensated the losers by inflating the returns on domestic sales. It did so by imposing trade barriers on imports. The existence of trade barriers has been demonstrated in some detail by Luedde-Neurath:
For almost two decades now Korea has attempted to promote its image as a market economy with a relatively liberal attitude towards imports. This stands in marked contrast, however, with the views held by most foreign businessmen who attempt actually to ' penetrate the Korean market.. Their familiarity with the "nuts and bolts" of the Korean import regime leads them to characterize it as essentially restrictive and full of hidden obstacles. ( 1986, p. 89)
Krueger, a student of the Korean economy who did much to promote Korea's image as a market economy, has observed,
One final aspect of the import regime deserves mention-the tariff structure and attempts to alter it. One of the remarkable aspects of Korea's trade-and-payments regime over the period since 1 953 has been the remarkable stability of the tariff structure. (1979, p. 140)
Thus, together with quantitative import restrictions and government export incentives, tariffs provided Korean pusiness with abundant government support. At the same time the labor-intensive industries especially came under intense pressure for immediate export gratification.
Export Dependence ,
Exports as a percent of GNP rose steadily from less than 5% in th';7 1 950s to approximately 35% in the 1980s. In tandem, imports as � pe-rcent of GNP rose, although at a slower rate. By' international standards, Korea became ultradependent on foreign trade. Table 3.6 presents the proportions of foreign trade (exports plus imports) to national produCt during the course of economic development in seven European countries, the United States, Canada, Japan, and Korea. The evidence suggests that none of the Great Powers, whatever their stage of development, ever had anywhere near as high a 'de pen:. dence on trade as did . Korea. Imports and exports of commodities j as a percent of gross domestic product in Japan were never more \ than 35.5%, and they were much lower in the nineteenth century ( and in the 1950s. ./
Korea's high trade coefficient is quite similar to that of three relatively small economies-Hong Kong, Singapore, and Taiwan (World

Table 3.6 Proportions of Foreign Trade (Exports Plus Imports) to National Product (Commodities at Current Prices)
Pre-World GNP per GNP Early Phase War I 1 920s 1950s· 1 980s Capita Billion Country Date % Date % Date % Date % Date %a Population b $ 1 984 $ 1984
United Kingdom 1 837-45 2 1 .6 1 909-1 3 43.5 1 924-28 38. 1 1 957-63 30.4 1 98 1-85 43. 1 56.5 $ 8,570 484. 1 (GNP)
France (physical 1845-54 1 8.0 1905-1 3 53.7 1 920-24 5 1 .3 1957-63 4 1 .2 1 98 1-85 39.8 54.9 9,760 536.3 product)'
Germany (net 1 872-79 36.7 1910- 1 3 38.3 1925-29 3 1 .4 1 955-59 35. [ 1 98 1-85 5 1 .2 6 1 .2 1 1 , 130 680.9 total uses) d
Italy (GNP) 1 861-70 20.6 1 9 [ 1 - 13 28. 1 1925-29 26.3 1957-63 25.0 1 981-84 45.7 5.0 6,420 365.8 Denmark (GDP) 1870-79 45.6 1 9 [0-14 6 1 .6 192 1-29 57.3 1957-63 52.6 1 98 1-85 56.2 5. 1 1 1 , 1 70 57. 1 Norway (GOP) 1865-74 55.5 1905- 14 69.2 1920-29 63.5 [947-56 77.4 198 1 -85 66.7 4.1 1 2,940 57.5 Sweden (GOP) 1861-70 27.7 [9 1 1- 13 40.3 1 92 1-30 3 1 .9 [957-63 36.5 1 98 1-85 57.5 8.3 1 1,860 98.9 United States 1 834-43 1 2.9 1904-13 1 1 .0 1919-28 10.8 1954-63 7.9 198 1-85 14.9 236.7 15,380 3642.5
(GOP) Canada (GNP) 1 870-80 30.9 1 9 1 1 - 1 3 32.2 1 926-29 4 1 .5 1956-60 3 1 .2 1 98 1-85 48.7 25. 1 1 3,280 333.7 Japan (GOP) [878-87 1 0.3 1 908- 1 3 29.5 1918-27 35.5 1950-56 18.8 1981 -85 24 .. 0 1 20.0 10,630 1 275.8
Japanese Occupation· 1 9505 1 9605 1 970s
Date % Date % Date % Date % ,-r-Korea (GNP) 1929 69.6 1955 8.8 1961-70 23.6 197 1 -80 53.9 1 981-84 69.2 40.6 2, 1 1 0 85.6
1936-38 75.0 1 958-60 9.0
• All with respect to GNP except for France, which is with respect to GDP. bin lI)iIIions, 1980 for most countries,
<Value-added in agriculture and manufacturing.
d Sum of expenditures on private consumption, government consumption. and net domestic capital formation.
:::! ·Sum of agricultural and industrial production only, as adapted from dat;o in the appendix of Grajdanzev, 1944.
GN P, gross naiional product.
Sourct: Trade figures excluding the 1980s: United Kingdom through Japan, Kuznets ( 1966); Korea, Grajdanzev ( 1944) for the Japanese Occupation and IMF ( 1 986) for other years. Population and trade figures for the 1 980s from IMF (1986). GNP and GNP per capita from World Bank ( 1986).

72 THE STATE AND BUSINESS
Bank, 1986). Yet Korea's high trade ratio cannot be understood as merely a response to its small domestic market. By world standards, Korea is not a small country. In the 1 980s its population exceeded 40 million people and its GNP exceeded $80 billion. (Norway is a far smaller country, yet Norway's dependence on foreign trade was slightly lower than Korea's.) Rather, Korea's high trade dependence is a matter of history and politics. Under Japanese rule, Korea had been a highly export-oriented country, although exports were overwhelmingly agricultural. According to Table 3.6, in 1936-1 938 imports and exports as a share of national product amounted to as much as 75%. Ironically, in the 1960s exports were viewed by the military regime as a deliverance. Park's speeches are full of references to rising self-sufficiency with every extra dollar of export earnings, and the antithesis of self-sufficiency was implicitly defined as continued reliance on U.S. largesse. Once exports got under way, moreover, their benefits became addictive. Exports of labor-intensive manufactures began to eat away at the cancer of underemployment, transforming Korea's domestic political environment. In the five years from 1965 through 1969, employment in the manufacturing sector expanded by 50%. In 197 1 the industrial sector employed 100% more people than it had in 1963 (Bank of Korea� various years). And ultimately, exports opened the floodgates to foreign credit, to which attention is now turned.
INVESTMENT POLICY
Out of Park's remonstrations with millionaires came the crux of Korea's investment policies. One month after the 1 96 1 coup, the military regime passed the Law for Dealing with Illicit Wealth Accumulation, and with great theatrics, arrested profiteers under the First Republic and threatened them with confiscation of their assets. Instead of becoming victims of martial emasculation, however, the millionaires were "allowed to enter the central stage" like the Meiji millionaires before them, albeit in a kneeling position. The government exempted most businessmen from criminal prosecution and eschewed confiscating their property. In exchange, businessmen were required to pay off their assessed obligation by establishing new industrial firms in basic industries and by donating the shares to the government, the latter condition rarely being fulfilled (jones and SaKong, 1980). Within days, however, an alliance had been formed between business and government that laid the basis for subsequent industrialization.
.
There was one exception to the new government's decision to eschew confiscation: Five months after the coup, the military nation-

The ABCs of Japanese and Korean Accummulation 73
alized the banks. This proved a critical move in the long run, allowing the government to determine where, when, and how much to invest in which industries. Nationalization, however, was a hollow gesture at the time. The banks were almost bankrupt, and the question of how they were to raise funds became a paralyzing source of conflict between officials of Korea and the United States.
The military was in favor of borrowing from abroad and keeping domestic interest ' rates low in order to increase investment. To stimulate lending to Korea, the government amended the Foreign Capital Inducement Law in 1 9�2 and provided government guarantees to lenders, which eliminated the risks of default and of exchang� . rate depreciation. Control over credit guarantees, together with nationalization of the banks, extended the government's reign over all capital flows with the exception of the unofficial "curb" market. Credit was then allocated on a discretionary basis.
Whereas subsidized credit for working capital was available to any exporter, long-term capital at favorable interest rates was allocated only to targeted firms and industries. For example, in the industries examined in detail in later chapters (i.e., cement, steel, shipbuilding, machinery), the government favored certain firms over others to become industry leaders through industrial licensing-cum-subsidized credit allocation; In the cement industry, the chaebol belonging to a{ party eider, the Ssangyong group, was allowed to acquire nearly half)' of cement-making capacity by the 1980s, and was then blessed with licenses for capacity expansions despite the existence of a more ex-\, perienced cement company (the Tongyang Corporation) dating t� the Japanese colonial period . In the steel industry the small minimills of Japanese colonial vintage were discriminated against in credit allocation iri favor of a newly created state-owned integrated enterprise, the Pohang Iron and Steel Company (POSCO). In shipbuild-
. ing, seven small experienced shipbuilders were dwarfed and in some cases bankrupted by the government's assistance to the Hyundai group. In the machinery buiiding sector, all three leading chaebolthe Hyundai, Samsung, and Daewoo groups-were favored over a slew of smaller long-standing firms.
Nevertheless, total foreign debt to underwrite long-term domestic investment grew by only 15% in 1963 and 19648 as the International Monetary Fund and the U.S. government, on the one hand, and the military regime, on the other, attempted to smooth their ideological differences over interest rates. .
The foreign contingent was in favor of keeping dorriestic interest rates high in order to mobilize private savings and thus to minimize
• See Bank of Korea, various years (b).

74 THE STATE AND BUSINESS
Korea's foreign debt exposure. The military partly conceded to these demands. After "being pressed strongly by the United States government as well as the International Monetary Fund," the military obtained approval from the National Assembly for higher interest rate ceilings in August 1 965 and pushed through an approximate doubling of interest rates at the end of September (Cole and Lyman, 1 97 1 , p. 179). Korean business groups strongly opposed the move, but the response of private savers was wildly enthusiastic. Total time and savings deposits increased by 25% in one month, tripled in one year, and doubled again the following year (K. S. Kim, 1 967). Household savings as a p'ercent of GNP increased from (1.1 8% in 1965 to 4. 15% in 1 966 (see Table 3.7). Nevertheless, household savings as a percent of GNP declined sharply in the following year, as Table 3.7 also indicates, and behaved unsystematically with respect to the interest rate thereafter. Moreover, domestic savings were never anywhere near sufficient to satisfy investment demand. Therefore, interest rate "liberalization" (it lasted for only seven years) did not do much to finance industrial expansion. What it did do was increase, government liquidity and placate aid advisors, which gave Korea the green light to borrow abroad.
A regime of multiple interest rates arose, therefore, quite similar in principle to the multiple exchange-rate regime that export subsidies created. The cost of borrowing at home far exceeded the cost' , of borrowing abroad. This afforded the government the opportunity to discriminate in favor of particular industries and firms. As Table 3.8 illustrates, the real cost of borrowing abroad was negative (in most of the 1960s and 1 970s). To qualify as a regular customer of the government for long-term subsidized credit, objectively necessary, if not sufficient, conditions had to be met even in new import- " substitution industries: Big firms and small firms, young firms and old firms, chaebol and nonchaebol had to export.9 Investment an� trade policies became intima�ely bound.
Finally, one may note that, in addition to tariff protection, Korea reinforced its defenses against Japan as a further form of support. Once Korea had accorded Japan diplomatic recognition, it made it more difficult for Japanese companies to invest in Korean industry. , Since the end of the Japanese occupation, direct foreign investment in the form of equity ownership by foreigners of production facilities in Korea has been: minimal. Foreign direct investors have been welcomed to enter the light manufacturing export sector, whereas
9 Not all import-substitution industries had to begin exporting at once. In some, the government took a long-range view, For automobiles, see, for example. Amsden and Kim. 1985a,

Savings. Investment. and Consumption. as Percent of Gross National Product, 1 962- 1 984
Household Public and and Private Deficit of Difference
Gross Fixed General Private Nonprofit the Nation Between Capital Increase Total Government Corporations' Institutions' . Total on Current I n vestment ( I )
Formation in Stocks Investment Savings Savings Savings Savings Account and Savings (4) Year ( I ) (2) (3) = ( I ) + (2) (4) (5) (6) (7) = (4)+ (5) + (6) (8) (9) = (7} - (3)
1962 1 3.95 -0.90 13.04 4.63 7.91 -0.97 1 1 .58 1 .86 -1 .47 1963 1 3.94 4.43 1 8.38 4.41 7.76 3.45 15.63 4.05 -2.75 1 964 1 1 .56 2.97 14.53 4.61 7.00 3.61 15.22 0.84 0.69 1965 14.60 0. 1 0 14.70 5.83 8.07 0. 1 8 14.09 -0. 16" -0.61 1 966 19.96 1 .66 2 1 .62 5.68 7.72 4.15 17.56 2.72 -4.06 1967 2 1 .25 0.66 2 1 .9 1 6.83 8.]6 1 .38 1 6.36 4 . 18 -5.55 1 968 25.54 1 .20 26.74 8. 1 7 8 . 1 9 3.06 1 9.43 7.73 -7.3 1 1969 26.74 3.29 30.02 7.36 '· 7.97 7.45 22 .. 78 7.73 -7.25 1 970 25.60 2.39 27.98 7.62 7.67 3.51 1 8.80 7.59 -9. 1 8 1 97 1 2 1 .52 3.61 25. 13 5.57 7.53 3. 17 16.27 8.73 -8.86 1972 20.00 2.22 22.22 3.64 8.72 5.70 18.06 3.48 -4. 16 1973 23.38 2.30 25.68 3.99 I Ll7 8.98 24. 14 2.29 -1 .54 1 974 25.31 6.34 3 1 .65 2.25 1 1 .36 7.04 20.65 1 0.93 - 1 1 .00 1 975 25.50 4.53 30.02 3.76 9.81 6.61 20. 18 9.05 -9.84 1 976 24.09 1 .54 25.62 6.05 10.21 8.8 1 25.07 1 .09 -0.55 1 977 26.66 1 .08 27.75 5. 1 I 10.68 12.30 28.09 -0.03 0.34 1978 30.81 0.38 3 1 . 1 9 · 6. 1 7 9.94 13.28 29.40 2 . 17 - 1 .78 1979 32.77 2.88 35.65 6.74 9.75 12.29 28.78 6,43 -6.87 1980 3 1 .9 1 -0.66 3 1 .26 5.67 1 0.29 6.63 22.59 8.67 -8.67 1981 28.85 0.29 29. 15 6. 12 9.34 6.96 22.42 6.91 -6.73 1 982 30.27 -3.27 27.00 6. 1 8 9.69 7.23 23.09 3.77 -3.90 1 983 . 3 1 .84 -4.07 27.77 7.46 1 0.28 7.89 25.63 2.09 -2. 14 1 984 30.95 -0.97 29.98 7.64 1 0.43 9.93 28.00 1 .68 - 1 .98
-.,] (Jl • Negative value equals surplus.
S(JIJT«: Bank of Korea.

I I I I I
I V
V
76 THE STATE AND BUSINESS
Table 3.8 Cost of Foreign Capital, 1966- 1983 (Annual Averages)
Unit: % 1 966- 1 970 1 97 1 - 1 975 1976- 1 980 1 98 1-1983
Domestic bank lending rate' 24.4 1 7.0 18.0 12.5 (curb market interest rate) (54.2) (40. 1 ) (4 1 .3) (30.6)
Foreign interest rateb 6A 7.9 1 1 .5 1 1 . 1 Foreign inflation rate
(GNP deflator)< 4.9 8A 5.9 4 . 1 Exchange rate depreciation d 5. 1 7.B 5.5 10. 1 GOP d�/lator (rate of change):
Korea� 1 4.6 IB.7 19.7 9.9 Real foreign interest Tate
( 1 1 - I ll) 1 .5 -0.5 5.6 7.0 Interest rate differential between
home and f<;lreign markets (I - II - IV) 1 2.9 1 .3 1 .0 -8.7
Real private c<lst of borrowing abroad (II + IV - V) -3. 1 -3.0 -2.7 1 1 .3
GN p. gross national product. • DiscounlS on bills on deposit money bank. (three.year moving ayerages).
hUBOR (90 days). London Inter·Bank Offered Rate
'AYe"age of Japan and United States . .
" Bank of Korea standard concentralioll rale (three·year moving ayerage.).
, 'Three·year mOYillg averages,
Sourr..: Bank of Korea. M,)1IIMy Bulleli". yarious issues. as cited by Y. C. Park ( 1985),
they have been discouraged from investing in import-substitution sectors such as pharmaceuticals and heavy industry (B. Y. Koo, 1981 ). In the late 1 970s, direct foreign investment as a percent of gross domestic product was lower by almost half in Korea than in Argentina, Brazil, and Mexico-approximating 3% (Westphal, Kim, and Dahlman, 1 985). In the 1980s, the government began to encourage direct foreign investment in the high-technology industries, but even as the absolute quantity of direct foreign investment increased, it amounted to a lower percentage of GNP in 1985 than in 1965 (see Ta�I� . 3.9). Korea has industrialized on 'the basis of national enter. pfise, and in almost all years since 1 965, direct foreign investment as a percent of total foreign capital inflow has fallen below 5% (Amsden, 1988).
CONCLUSION
The success of Japan, South Korea, and Taiwan has been attributed by many economists to "liberalization," or the freeing of markets from

The ABCs of Japanese and Korean Accummulation 77
Table 3.9 Direct Foreign Investment . (DFI), 1965-1985
Year DFl " Percent of GNP
1965 1970 1975 1976 1977 1979 1980 198 1 1 982 1983 1984 1985
20,671 13,642
169,398 72, 160 65,915
107,3 1 2 140,'751 145,327 1 87,79 1 267,753 4 19,049 531 ,720
• Approval basis. Unit = current $1.000. Source: Ministry. of Firlance.
0.73 0.16 0.8 1 0.25
. 0. 18 0. 17 0.25 0.23 0.28 0.36 0.52 0.65
government control. From what we have just read, however, this view must be seriously qualified. Liberalization did indeed occur in Korea circa 1965 insofar as the exchange rate was devalued, commercial lending rates were raised, and certain imports were decontrolled. As Fischer ( 1 970) observed, however, while we expect "big events" to have "big impacts." this reasoning is fallacious. The . effect of liberalization on the economies of Japan, South Korea, and Taiwan may be likened to the effect of the Spanish Armada on European history. At one time the Armada's defeat was believed to have turned the tide of world history. Now its overall effect is recognized as minor� It nei�her divided Christendom (this having already been accomplished) nor prevented the flow of species to Spain (the flow reaching its peak after. the Annada's defeat) nor shifted colonial supremacy to England (whose colonial efforts slumped immediately after 1588) (Mattingly. 1959, as cited by Fischer, 1970).
To be sure, liberalization in its political guise forced Korea to extend diplomatic relations to Japan, thereby raising the tempo of competition. But in exchange for greater competition, the Korean government fortified the domestic market with tariffs and quantitative restrictions and enacted legislation to protect domestic industry from direct foreign investment. Certainly liberalization also resulte'(f in an increase in real commercial lending rates for at least seven years ( 1965-1972). But in exchange for higher domestic interest rates, the exchange rate and domestic inflation were allowed to render the real cost of borrowing abroad negative. Finally, liberalization proba:'

78 THE STATE AND BUSINESS
bly exerted upward pressure on the price of foreign exchange. But in return for devaluation. exporters were rewarded with handsome subsidies.
In all, liberalization amounted to nothing more than a footnote to the basic text of Korean expansion. To attribute the role of equilibrator in such expansion to the market mechanism rather than to the government's dual policy of discipline and support is to misrepresent a fundamental property of the most successful cases of late industrialization.
APPENDIX
The competitiveness of Cotton Spinning and weaving
Exports of cotton textiles spearheaded Korea's export drive. Yet such exports appear to have been dependent on subsidies. unable to stand alone without government support. Under these circumstances they were unsustainable. The government could not forever use foreign aid or borrow abroad to underwrite them. Four developments put the textile industry in the black: ( 1 ) Foreign loans helped finance investments in modern plant and equipment. which raised productivity, (2) productivity increased through learning-by-doing,. as will " be discussed in Chapter 10, (3) dependence on imported raw materials declined due to a technological breakthrough overseas, the discovery of synthetic fibers, and (4) wages rose rapidly in Japan. which reduced japan's competitiveness in textile exports (Statistics Bureau, various years). As early as August 1962, a nylon-manufacturing planT' came on-stream in Korea with capacity to supply domestic manufac- I turers. The Hanguk Nylon Factory (now Kolon Nylon) was the first of several companies in the synthetic fiber industry. Like the others, it was privately owned but the recipient of government support in \ the form of subsidized credit and tariff protection. The import SUb:-]'· stitution of synthetic fibers made the textile industry more productive and less vulnerable to devaluations of the exchange rate. According to Y. B. Kim, "During the period from 1962 to 1970, the production structure of Korea's textile industry was altered to more . closely resemble that of developed countries" ( 1980, p. 236). The} industry accomplished this by import substituting chemical fibers, and by reducing the ratio of natural fiber yarns and fabrics in total textile production. "Cheaper manmade fibers resulted in improved pro!iuctivity and quality, which in turn increased the demand both in home an� overseas markets" (1980, p. 226). ,
What is noteworthy is that government intervention to make even cotton spinning and weaving profitable far exceeded what usually qualifies as "infant industry protection."

CHAPTER FOUR
The Dynamics of Growth
THE THREE FACETS OF GROWTH
Late industrialization is characterized by three facets of growth, as Korea exemplifies. The first relates to diversification, or entrepreneurial decisions concerning penetration of new industries--which ones to penetrate, when, and with what size investment. The second relates to stabilization, or short-run macroeconomic policies to maintain the level of economic activity. The third relates to the growth momentum itself. Once under way, growth gains a momentum whose properties are distinct, depending on the presence or absence of new technological discoveries: This chapter is divided into three parts, each devoted to one of these facets of growth.
THE GOVERNMENT AS ENTREPRENEUR
The Government as Planner
The defining characteristic of entrepreneurship is planning, or deciding what, when, and how much to produce. Entrepreneurship becomes especially meaningful from a social standpoint when planning involves it new product or process. In Schumpeter's often-quoted conception ( 1938), the fundamental function of the entrepreneur is innovation. Innovation, in its classic definition, is absent in late-industrializing countries, yet entrepreneurship is present: Entrepreneurs in late-industrializing countries introduce products or processes that, while not path breaking, are novel in the context of the learning environment. , According to this definition, entrepreneurship in Korea has had two identities, one associated with the small firm. the other with the large one. In the case of.the former, the entrepreneurial function of planriing still remains privatized. The initiative to undertake minor investment projects with relatively small capital requirements ap-
79

80 THE STATE AND BUSINESS
pears to rest with the private entrepreneur. In such cases, the private entrepreneur is also responsible for the coordinating function, or for arranging all necessary inputs for the completion of a project, including the capital. In the contrasting case of big business, the entrepreneurial function of planning has primarily fallen to the state. So, too, has the coordinating function, insofar as the state has con':trolled all capital other than short- or medium-term credit available at high interest rates in the "curb" market.
Virtually every study bearing on the subject of industrialization in Korea has in some sense recognized that big businesses have had to come to terms with the expanded role of the state. Thus, Jones and Sakong ( 1980) argued that the crowning function of the private entrepreneur is "lenticular," meaning "the pure Schumpeterian function of combination," and the functions the entrepreneur must combine or coordinate include that of dealing with the government. All in all, Jones and Sakong explained, the functions of entrepreneurship include the following:
1 . Perception of a new economic opportunity, including a. new products b. new processes of production c. new markets
2. Evaluation of the profitability of a new opportunity 3. Gaining command of financial resources 4. Plant design , technology, and construction supervision 5. Recruiting and training of new personnel 6. Relationship with government 7. Relationship with suppliers and purchasers ( 1980, p, 8 1 )
The point, however, is not that the entrepreneur i n Korea must spend a great deal of time �'dealing" with the government, among other important tasks. Rather, it is that almost all important tasks are themselves transformed as a consequence of government intervention.
The initiative to enter new manufacturing 'branches has come primarily from the public sphere. Ignoring the 1950s, when economic policy in Korea was for all practical purposes under foreign control (see the discussion in Chapter 2), every major shift in industrial dr� versification in the decades of the 1960s and 1 970s was instigated by the state. The state masterminded the early import-substitution proF ects in cement, fertilizers, oil refining, and synthetic fibers-the las,t greatly improving the profitability of the overexpanded textiles industry. The government also kept alive some unprofitable factories inherited from the colonial period, factories that eventually provided key personnel to the modern general machinery and ship-

The Dynamics of Growth 81
building industries, which the state also promoted. The transformation from light to heavy industry came at the state's behest, in the form of an integrated iron and steel mill, which the state pushed for in the early 1 960s (too early, it seems) and then presided over from the late 1960s onward (see Chapter 12) . The government played the part of visionary in the case of Korea's first colossal shipyard (see Chapter I I) , and it was responsible for the Big Push into heavy machinery and chemicals in the late 1970s. It also laid the groundwork' for the new wave of import substitution that followed heavy indus- . trialization and that carried the electronics and automobile indus- .
tries beyond the simple stage of assembly. The government enacted the automobile industry protection law as far back as 1962, as part of its first five-year economic development plan. In conjunction with this decision, it promoted the oil-refining industry. Thus, major milestones in Korea's industrialization have been decided by the state.
Unilateralism on the part of the government probably reached its apex at the time of the second five-year plan, in 1967, after which government and business gradually worked more closely together. The second five-year plan was prepared · by the government amidst exuberance over the economy's good performance and confidence in the government's planning function. The Economic Planning' Board (EPB) used an input-output planning model, supplemented by in- . dustry studies. These inqustry studies really amounted to project studies that provided profiles on projects in the manufacturing sec- . tor for the government to promote by using its industrial, trade, and credit policies. The fact that iriitiative, at the time, lay almost exclusively with the government is indicated by the finding that when businessmen began to come to the EPB for approval of projects that were not on the Jist, there was debate in the EPB about whether to consider them, even those that complemented social objectives. I
The Example of Electronics
The driving force of the government behind industrial change was .
still apparent in the mid-1 970s, and for that matter, in the mid-1980s. Even in the case of the electronics industry, where developments were wholly contingent on acquisition by the private sector of technical skills, the fourth five-year plan of 1977- 198 1 set the pace of progress.
The government had been promoting the domestic electronics in-
I This view of the Economic Planning Board was expressed by Larry Westphal, an advisor to the Board at the time, in a ·lecture in February 1987 at the Harvard Institute for International Development.

82 THE STATE AND BUSINESS
dustry as Qne Qf the natiQn's key sectQrs for almQst two. decades. As early as January 28, 1969, the ElectrQnics Industry PrQmotiQn Law was enacted to stimulate investments in assembly operations Qf black-. and-white televisions. · The intent of the fQurth five-year plan was to push this activity forward, beyond the assembly stage. According to the plan,2
The electronics industry will change structurally from assemblytype production to one which mainly produces the basic CQmponents and parts. In the meantime, product quality will be improved.
The electronics industry will be promoted as a major export industry through the development of new technology products and the expansion of overseas sales activities.
On the basis of prQduct life cycles and comparative. advantage, 57 items including semiconductors, computers, and related items have been selected as strategic products. [italics added]
As traditionally defined, semiconductQrs and computers hardly fell within Korea's area of comparative advantage, certainly nQt in 1 976, when per-capita income in Korea was only $459, about the same as Guatemala's (World Bank, 1978). The fQurth five-year plan, therefQre, accelerated the import substitution of such goods.3
To promQte higher value-added products embodying a greater level of skill and technolQgy, the government took the following steps, above and beyond its usual incentive measures, which included arranging fQreign loans totaling $22 1 .6 million:
I. It established an industrial estate for the production of semicQn-ductors and computers. ,
2. To promote "the importation of advanced technology and to accelerate technical progress," it established a research institute in this industrial estate for product development, the Electronics and TelecQmmuni<:atiQn Research Institute (ETRI). A fund of $60 million was created for the purpQse.
3. It protected the dQmestic market against foreign competitiQn. In the cQmputer field. it passed legislatiQn in 1983 to restrict impQrts of computers and peripherals in both the low and medium ends of the market. The law prohibited the impQrt of mQst microcom" puters. some minicomputers, and selected mQdels of disk drives, :
2 References to the Plan are from Chungbu (1976). l The government gave the same type of support to the development of color TVs
in the late 19705 that it had given to the development of black-and-white TVs in the late 19605. See Y. B. Kim ( 1979).

The Dynamics of Growth 83
printers, terminals, and tape drives (Harvard Business School, 1985).4
4. It restricted direct foreign investment in electronics. It did, however, view joint ventures favorably, and most of the major business groups in the computer field-Hyundai, Daewoo, LuckyGoldstar, and Samsung-formed them.
In the field of semiconductors, the government was still taking the lead in the 1980s (for better or worse). According to Electronics, an American trade magazine,
In South Korea, people in the industry call it the Blue House Project, after the official residence of President Chun 000. Hwan whose advisers convinced him two years ago that the only way to crack the world semiconductor market would be to orchestrate a massive development project involving every important Korean company in the business.
That's just what is happening now, and the goal is to position Korean chip-makers as major players in the world industry by 1 99 1 . . . . The impetus came from the president, and the muscle behind the program--called the VLSI Project-is coming from commitments by three of the largest Korean conglomerates [Hyundai, Goldstar, and Samsung]. ( 1987)
This VLSI project is one of many high-priority "national projects" involving collaboration between private sector R&D labs and public sector research institutes, to which the 'government allocates organi� zational capability and subsidized credit. In 1983 some 182 research projects of 1 3 1 industrial firms were selected as national R&D projects, and the government contributed about $28 million to these projects. In addition, seven special projects in semiconductors and bioengineering were funded with an additional $40 million (World Bank, 1987). To stimulate R&D generally, the government sets a lower tariff rate on equipment imported for R&D purposes. This provision is important for technology-intensive firms, and tells something about the extent to which the machinery sector is protected in . general (fairly well). The government also allows firms to set aside a percentage of profits in a reserve fund that is exempt from taxation for a fixed period, for eventual investment in R&D. Venture capital corporations have been established by the government to lend to technology-oriented start-up firms. Through its procurement policy,
• In 198'7 the government abolished import tariffs on personal computers. Never-theless, like automobiles, imported computers appear tp be subject to other taxes.
.

84 THE STATE AND BUSINESS
the government has also promoted the development of an indigenous electronic switching system for eventual incorporation in tile domestic public telecommunications network.
Given that the quintessential function of the entrepreneur is to decide what and when to produce, as well as how much, the govern
. me nt's leadership, even in an industry like electronics, makes it necessary to redefine the entrepreneurial concept as affected by government influence in the private sphere.
The LOcuS of Initiative
In late-industrializing countries, the developmental state may be expected to take more initiative to diversify than the private sector does for two reasons:
First, such a state tends to get involved with national as well as corporate planning. If the formulation of development plans is undertaken fairly regularly, as more than a token exercise, the state can gain an overview of the economy that the individual entrepreneur lacks.s This overview, and the ability to plan projects with external linkages simultaneously, places the government in a more advantageous position to diversify than the private sector. The fiveyear plan is practically a general property of late industrialization. I t became characteristic of Indian economic development in the 1950s. With the exit of U.S. aid advisors in 1960, Japan adopted its "GrowthDoubling Plan." Korea's first five-year plan was inaugurated in 1962, just after the military coup (see Chapter 2).
Planning in Korea is taken fairly seriously and formula�ed in a "top-down" fashion. According to one observer,
In the preparatiOri of the five-year development plans, which are the most crucial skeletons of midterm policies, the EPB takes the init.ial step by , preparing and issuing preliminary guidelines in terms of major policy targets and directions, together with macroeconomic projections for both the international and domestic environment of the economy during the plan period a'nd beyond. . . . Individual ministries then formulate their own sectoral plans in ,accordance with the guidelines. . . . It is noteworthy . . . that policy proposals prepared by the ministries are seldom open to the public for discussion and popular reaction. , . . The lack of consensus-building in the policy-making pro-
5 Nath ( 1962) argued that the government is in a better position to plan than the private sector not'
because it is better at planning but because it has an overview of the economy.

The Dynamics of Growth
cess reflects a "top-down" approach to government policy formulation. (Whang, 1986, pp. 5-9)
85
Second, the initiative to diversify, particularly into more capitalintensive investment projects, tends to fall to the state because these projects require more comprehensive incentive packages to make them financially attractive to private firms. Private firms in Korea contributed very little of their own capital to most investment projects. By law, 30% of a plant's total cost� had to be self-financed. In practice, however, internal financing in 1963- 1973 accounted on average for only 20% of total financing (compared with 32.5% for Japan [1954-1967) and 65% for the United States [1947-1963]) (Lim, 1981). In 1983 the manufacturing sector in Korea is said to have financed only 9.9% of its busil'l:ess through retained earnings and capital increases (BK, 1984). The remainder of capital was highly subsidized and was greater the more capital intensive the industry. Differences in subsidization by industry are suggested in Table 4 . 1 . The loan to value-added ratio tends to be mUch higher in the more capital-intensive pursuits. .
Finally, initiative tends to fall to the state because of the structure of profit rates. The interindustry structure of profit rates is less favorable the more capital intensive the industry. One may expect, therefore, . a reluctance on the part of private investors to rush into capital-intensive industries without strong government direction and support.
profitability in Different Industries
,Table 4 . 1 presents data for Korea on gross rates of return. Gross 'rate of return is defined as the ratio of non labor share in valueadded to capital stock, the capital stock being defined as physical assets plus net working capital. Manufacturing is broken down into four areas, two labor intensive; two capital intensive. The data support three interrelated conclusions. First, the most labot-intensive industries have the highest profit rates. Second, the youngest industries (group II) have the lowest profit rates. Capital-intensive industries are subdivided into two groups. Group I comprises those capitalintensive industries that underwent import substitution in the 1950s (or early 1960s) . Group II comprises those that underwent import substitution later. Group II industries have the lowest rates of return. Third, the capital-interisive industries have the highest export growth rates, besides having t.he highest overall rares ofsubsidization (measured by the loan to value-added ratio).

�
Table 4.1 Gross Profits, Export Ex'pansion, and Loans by Industry, 1 97 1 - 1 982
Per-Worker Fixcd Gross Ratc of Return Rate of Increase
Assets ' on C�pital LoanlValue-Added (VA) Ratio During 1 971-1 982
Industry 1971 1982 1963-71 1972-78 1979-82 1963-71 1972-78 1979-82 VA pwFA Exports
All manufacturing 1 . 1 4 9.27 32.3% 37.5% 37.4% 1 .9 1 .5 1.4 37.2 8. 1 24.6
Ratio to All-Manufacturing Average
Very labor intensive
Clothing and footwear 0.3 0.2 1.5 1 .6 3.6 0.6 0.7 0.7 1 .3 0.7 0.7 Electronic and telecommuni-
cationsb 0.4 0.4 1 .4 1 .3 1.2 0.5 0.4 0.7 2.3 1 .0 1 .9 Miscellaneous manufactures < 0.4 0.4 1 .3 1 .3 1 . 1 0.4 0.6 0.6 1 .0 1.2 0.5 Nonmetallic mincralsd 0.9 0.4 0.6 I . l 1 .2 0.7 0.6 0.5 3.0 0.5 6.9
Moderately labor intensive
Machinery (medium) 0.4 0.4 0.8 1 . 1 1 .0 0.3 0.4 0.6 7.3 1 . 1 Miscellaneous chemicals 0.5 0.6 1 .7 1 .7 1 .3 0.3 0.4 0.5 0.6 1 .0 1.4 Metal products 0.4 0.6 1 . 1 1.3 0.9 0.4 0.5 0.8 2.2 1 .5 3.5 Electrical machinery 0.8 0.7 1 .3 1 .2 ' 1 . 1 0.6 0.6 0.7 1 .2 0.9 1 .8 Textiles 1 .0 0.7 0.9 0.8 0.9 1.0 1 .2 1 . 1 0.9 0.7 1.0 Wood products 0.7 0.9 l . l 1.0 1 .0 1 .4 1 .9 2.0 0.5 1 .3 0.2

III -.J
Capital intensive Group I f
Synthetic fibers 1.8 1 .9 1 . 1 1 .0 1.4 1 . 1 1 .4 1 .3 0,5 1 .0 3.5 Rubber tires l . l 1 . 1 1 .2 1 .2 1 .2 0.9 1 . 1 0.9 1 .8 1 .0 6.5 Glass and products 2.5 1 .2 0.7 1 .3 0.8 1 .0 0.6 0.9 0.6 0.5 1 .3 Pulp and paper 1.6 1 .5 1 .2 1 . 1 0.9 0.7 1 .0 1 . 1 0.8 1.0 5.7 Sugar refining 3.7 3.3 1 .5 1 .8 1 .9 0.9 0.8 1 . 1 1 . 1 0.9 8.7 Petroleum products 1 1.6 6. 1 1 .0 1 . 1 1 .5 1 .6 0.7 0.9 0.7 0.5 0.4 Cement 5.1 5.8 1 .0 0.9 0.7 1 .8 1.3 1 .2 0.4 1 .2 2.2
Group liS Shipbuilding 1 .5 1 .3 0.4 0.6 2.7 1 .6 1 . 1 9.6 0.9 8.4 Automobiles and parts 1 .4 1 .3 0.7 0.7 1 .3 1 .2 1 .6 0.9 1 .0 4.9 Machinery (large) 0.7 1 .7 0.9 0.4 0.8 1 .0 2.9 2.9 2.7 2.0 Nonferrous metals 0.8 1 .8 1.0 0.8 1.2 1 .2 1 .6 0.7 2.3 0.6 Industrial chemicals 4.7 1 .9 1 .0 0.9 1 .4 1 . 1 1 .2 0.7 0.4 2.7 Iron and steel products 1.5 4. 1 0.8 0.7 1 .7 2.0 2.0 3.8 2.8 5.0
-Per worker fixed assets (pwFA) in million won.
bRadios and TV., phonogrnphs and tape recorders, other telecommunications equipment, household electrical appliances, and electronic parts and components for 1982 data. Data for 1971 exclude electronic parts and components.
<Includes precision instruments'(watches and optical instruments), leather products, plastic products, and furniture.
d Includes glass and cement.
e Excludes synthetic fiber yarns. .
fCapital-intensive industries are divided' into groups, depending on their age. Group I industries tended to be established, or "import-substituted," before Group 11
industries. SGross rates of return for 197 1- 1 973 are not presented because the industries in question were for the most pan nonexistent. The available data refer to small firms and are not comparable with data for the later periods .
• Source: Bank of Korea. Finandal SUlJemenls Analysis; Korea Traders Association, Foreip Tr/Uk Sl4tislics, as quoted in Hong and Park (1986).

88 THE STATE AND BUSINESS
These general findings are lent support by data in Table 4.2, on . return on investment (ROI) over time for light and heavy industry. Between 1972 and 1 984, the light industries had higher profitability than the heavy industries in �lmost every year.
.
One may infer from all this that as the capital-intensive industries showed themselves increasingly capable of exporting, they became more attractive for the government to promote. Their long gestation periods and relatively low profitability through adolescence, how- · ever, rendered them relatively less desirable investments to· the pri· vate firm. The initiative to diversify, therefore, fell to the state. In the 1 960s and 1970s, the government was obsessed with the question of how fast Korea could grow. Private investors were preoccupied with the question of how much money they could make. Although profit maximization and growth maximization are not, in theory, antithetical, neither are they necessarily synonymous.
Cooperation and the Overall Profit Rate
Over time, entrepreneurship has become less a monopoly of the state and more a joint venture between the state and .big business. Evidence is provided by a series of anecdotes in a thesis on the chaebol (S. K. Kim, 1987). Two factors strengthened the willingness and ability of big business to be a more active partner with the state in the diversification effort: ( I ) The modern industrial enterprises acquired more technical and business experience. Their opinions then gained more respect in terms of decisions about which industries to enter, when, and on what scale. (2) The modern industrial enterprises came to appreciate not just the high risks of entering the heavy industries but also the high rewards.
Tables 4. 1 and 4.2 indicate a convergence in profitability between the light and heavy industries as well as a high overall level of Profitability. Inclusive of subsidies, high profitability has been a key characteristic of Korean industrialization�ven if profitability does not ap- . pear initially :as high as in the advanced countries. The high profit rates eventually earned in the import-substitution heavy industries created great hopes of substantial profit rates in later projects. Thus, the diversified business groups were 'animated to be first-movers in new industries, bringing them slightly closer to being true entrepreneurs. Chapters 1 0, I I , and 1 2 examine just how they moved.
The Government as Investor
Not just in Korea but also in Japan and Taiwan, it has been alleged that "government budgets have generally been maintained near bal- ·

Table 4.2 Profitability of Light and Heavy Industry; Average Rate of Return on Investment, 1972-1984
1972 1973 1974 1975 1976 1977 1978 1979 1980 1981 1982 1983 1984
Heavy industry 7.92 1 0.06 12.45 9.34 9.41 8.96 9.69 9.32 7.36 9. 1 1 8.56 9.20 9.75 Light industry 1 1 .00 1 5.30 9.45 9.65 1 1 .50 1 1 .57 13.80 12.50 1 1 .40 1 1 .28 9. 13 10.15 9.52
SlJUrce: Bank of Korea, .yarious years.
�

90 THE STATE AND BUSINESS
Table 4.3 Public Sector Resource Balance, 1977-19B 1 (% of Gross National Product)
Current revenue" Tax revenue Transfer from other levels
of government Current expenditures b Current balance Gross fixed investment . Overall balance (- deficit)
Central Government: 1977- 1981 (actual)
2 1 .0 16.3
16.3 4.1 1.8 3.0
" Includes nonfinancial public enterprises other than communica-tions.
.
b Plan figures. for current revenues and expenditures are not strictly comparable owing to differences in the consolidation of subacCounts in the budget.
S""rce: Economic Planning Board.
ance, often with large surpluses on the current account . . ." (Sachs, 1987, p. 8). Evidence in Table 4.3 substantiates this claim. Table 4_3 shows a surplus in the "public sector resource balance." Nevertheless, the number.s in Table 4.3 are inconsistent with other numbers that indicate a persistent deficit in government accounts. Surplus or balance in the public sector budget appears to reflect not thriftiness on the part of the government, but discretion over how the public sec� tor budget is defined.6 Table 4.4, however, provides unambiguous evidence that the Korean government's investment in and operation of public-sector enterprises have tended to outstrip its saving. In other words, the government has spent far more than it has collected, and the deficit has been financed by borrowing. Table 4.4 presents data on the public sector's current account imbalances as a percentage of GNP. In sixteen of the twenty years spanning 1 963 through 1982, public sector investment exceeded public sector saving. In eight of eleven years in the period 1972 through 1982, the government's deficit/GNP ratio exceeded that of the private sector. Heavy public borrowing is suggested in Table 4.5. Between 1967 and 1979, the public sector accounted for about one third of all foreign loans. Then, in
6 Even public sector resource balance data are often inconsistent and highly sensitive to decisions about which items are or are not to be included in the accounts. For example. the source that Sachs cited on the public sector budget for 1982 is the World Development Report. Table 5.26, 1986. According to this source. �e budget showed a deficit of as much as 4.3% for the same year (Aghevli anc:I Marquez-Ruarte. 1985).

The Dynamics of Growth 91
Table 4.4 Sources of Current Account Imbalances in Current Market Prices. 1963-1982 (Unit: Billion Won)
Public Sector
Government-Private Invested Sector Government Corporations Subtotal A/GNP D/GNP
Year (A)" (B)' (q' (0 = B + C) (%) (%)
1963- 197 1 1963 - 1 1 .67 . 14.34 - 16.06 -2.02 -2.4 -0.4 1964 -3.39 23.26 . - 13.79 9.47 -0.5 1.3 1965 -27.88 36.49 - 16. 1 5 20.34 -3.5 2.5 1966 -65.20 38.82 - 1 5.14 23.68 -6.3 2.3 1967 -70.89 5 1 .26 -54.39 -3. 1 3 -5.5 -0.2 1968 - 1 36.63 57.03 -36. 19 20.84 -8.3 1 .3 1969 - 1 10.80 29.98 -63.73 -33.75 -5. 1 - 1 .6 1970 - 195.55 60.91 -63. 12 -2.2 1 -7.3 -0. 1 197 1 - 179. 19 42.81 - 130.3 1 -87.50 -5.4 -2.7 1972-1978 1972 35.80 -9. 16 -200.51 -209.67 0.9 -5.2 1973 51 .3 1 24.86 - 107.94 -83.08 1.0 - 1 .6 1974 -422.54 -36.09 -223.50 -259.59 -5.8 -3.5 1975 -337. 19 - 1 29.29 -482.24 -6 1 1 .53 -3.4 -6.2 1976 -20.73 329.49 -455.95 - 1 26.46 -0.2 - 1 .0 1977 472.45 · 18.08 -749.27 -73 i . l9 2.8 -4.3 1978 -281 .57 448.27 - 1 ,031 .84 -583.57 - 1 .2 -2.5 1979- 1982 1979 - 1.675.45 493.3 1 - 1 , 1 70.45 -677. 14 -5.8 -2.3 1980 -2.381 .04 20.81 - 1 ,344.91 - 1 ,324. 10 -,6.9 -3.9 198 1 - 1 ,513.67 5.89' - 1 ,869.06 - 1 ,863. 17 -3.6 -4.4 1982 489.47 - 1 24.05 -2.260.19 -2.384.24 1 .0 -5.0
• A, B, and C refer to balance after investment from savings is subtracted in each sector.
Source: Bank of Korea, E""""",ic S/Qristi€s Yearbook. various years, as cited by Y. C. Park, 1985 . . Figures for savings and investment of government-inyested corporations, which include nonfinan-cial operations of Federations of Agriculturid and Fisheries Cooperatives, obtained from Bank of Korea's flow of funds tables.
the economic contraction of 1 980- 1983, its share rose to over half of the total. Nevertheless, the dividing line . between a public and private loan is not always clear-cut, particularly in large-scale projects where the government and the chaebol closely interact. Thus, the government's share of foreign borrowing may be understated.
Most of the government's deficit has been accounted for by public corporations. This is in spite of the fact that almost all major investments in heavy industry with the exception of integrated ironmaking and steelmaking are in private corporations. Public corporations, however, have been important in infrastructure projects....-electricity,

92 THE STATE AND BUSINESS
Table 4.5 Foreign Loans and Investment, 1959-1983 (Unit: Million U.S. Dollars)
Direct " Loans (I)" Foreign
Investment Total Period Public Commercial (II)" 1 1 1 =' 1 + 11
1959- 1961 4.4 4.4 1962-1966 1 1 5.6 175.6 16.7 307.9
(37.5) (57.0) (5.4) 1967-1971 810.8 1,354.7 96.4 2,261 .8
(35.8) (59.9) (4.3) 1972-1976 2,388.9 3,043.9 556.0 5,988.8
(39.9) (50.8) (9.3) 1977- 1 979 2,529.5 4,793.7 328.8 7,652.0
(33. 1 ) (62.6) (4.3) 1980- 1 983 6,246.5 4,434. 1 404.1 1 1 ,084.7
(56.4) (40.0) (3.6)
• Actual basis. Figures in parenthesis are percent of total.
SaUtee: Economic Plallning Board, Handbook of Ko"an Ecan011f1·. 1983, as quoted in Y. C. Park ( 1985).
gas, railroads, highways, irrigation, and the Seoul and Pusan subway systems-and investments in infrastructure have been massive.
A balanced budget suggests that a government spends relatively little on social services. It should not be thought, however, that be�" cause the Korean government has persistently spent more than it has collected, it has spent a lot on social services.7 It has spent on long-"
term investment, not on short-term consumption. The propensity of the Korean government to invest rather than to consume is clearly perceived when international comparisons of government spending are drawn. Table 4.6 provides data on government spending for Korea and for other East Asian and Latin American countries. The first column of Table 4.6 presents data on the government's sha�e of to� tal expenditures relative to GNP. The second shows its share as a percentage of fixed investment only. The Korean government is noteworthy for its relatively low share of total expenditures and high share of fixed investment; most countries demonstrate the reverse pattern.
7 According to D. G. Kim (1986), the government spends oply 20% of its budget on social services and as much as 35% on defense. Yoo (1983, p. 1 33) stated that in the 19705. the Korean government spent approximately 6% of GNP on defense, the . highest figure for any country outside the socialist bloc.

The Dynamics of Growth 93
Table 4.6 International Comparison of Government Expenditures
Country
Latin America Argentina Brazil Chile Mexico Peru Venezuela Colombia
East Asia Korea Taiwan Thailand Philippines
Government Expenditures as Percent of GNP, 1982
2 1 .6 2 1.8 37.6 31 .7 18.0 29.6 14.0
19.5
19.9 12.2
GNP, gross national product.
Government Expenditures as Percent of
Fixed Investment [year(s)]
19.6 (1978- 1980) 22.8 ( 1980) 12.9 ( 1 978....: 1980) 29.4 (1978) 14.8 ( 1 978-1 979) 36.3 ( 1 978-1980) .
8.9 ( 1 978-1980)
22.8 ( 1978- 1980) 32.4 ( 1978- 1 980) 12.8 ( 1978-1979) 10.9 (1978)
SouTees: Expenditures as percent of GNP are from World Development Rep"'t, various years. Expen· ditures as percent of fixed investment are from Shon (1984).
GOVERNMENT SHORT·RUN ECONOMIC POLICIES
If the Korean economy has outperformed the late learners of Latin America, the reason cannot be said to lie in short-term austerity measures to manage external shock, because the response of the Ko� rean government to external shock was not to batten down the hatches. During the twenty-five years after the 1 961 coup, the growth of the Korean economy, though spectacular, was regularly interrupted by . internal and external shocks. What with two oil crises, global depres� sion. and an intensification of international competition. 'the 1970s were difficult years -in which to industrialize. Nevertheless. external shocks did not derail the Korean economy from its fast-growth track. The government borrowed its way out of balance·of-payments difficulties and sustained fast growth. Aggressive borrowing coupled with bailouts of financially troubled fir{Ils created a supportive environment for big business. The tack most often taken by the economy after economic downturns was a resurgence of exports and rapidly resumed expansion.
Here. three stabilization exercises in response to threats of growth interruption are discussed.s The account builds to the stabilization
8 The- following discussion of' stabilization is based on a longer study of Korea's short·run macroeconomic policies and attempts at liberalization. See Amsden (1987b) or, in the Korean language. Amsden ( 1 988) . .

92 THE STATE AND BUSINESS
Table 4.5 Foreign Loans and Investment, 1959-1983 (Unit: Million U.S. Dollars)
Direct Loans (I) ' Foreign
Investment Total Period Public Commercial (II)" III = I + ll
1959- 1961 4.4 4.4 1962-1966 1 15.6 1 75.6 16.7 307.9
(37.5) (57.0) (5.4) 1967- 197 1 810.8 1 ,354.7 96.4 2,26 1 .8
(35.8) (59.9) (4.3) 1972-1976 2,388.9 3.043.9 556.0 5,988.8
(39.9) (50.8) (9.3) 1977-1979 2.529.5 4.793.7 328.8 7.652.0
(33.1) (62.6) (4.3) 1980-1983 6,246.5 4.434. 1 404 . 1 I l .OB4.7
(56.4) (40.0) (3.6)
• Actual basis. Figures in parenthesis are percent of total.
Source: Economic Planning Board. Handbook of /(orean ECUlUJrrlY. 1983. a, quoted in Y. C; Park (1985).
.
gas, railroads, highways, irrigation, and the Seoul and Pusan subway syslems--and investments in infrastructure have been massive.
A balanced budget suggests that a government spends relatively little on social services. It should not be thought, however, that be� cause the Korean government has persistently spent more · than it has collected, it has spent a lot on social services.7 It has spent on long-
.
term investment, not on short-term consumption. The propensity of the Korean government to invest rather than to consume is dearly perceived when international comparisons of government spending are drawn. Table 4.6 provides data on government spending for Korea alld for other East Asian and Latin American countries. The first column of Table 4.6 presents data on the government's share of total expenditures relative to GNP. The second shows its share as a percentage of fixed investment only. The Korean government is noteworthy for its relatively low share of total expenditures and high share of fixed investment; most countries demonstrate the reverse pattern.
1 According to D. G. Kim ( 1986). the government spends o!lly 20% of its budget on social services and as much as 35% on defense. Yoo (1983, p. 1 33) stated that in the 1970s. the Korean government spent approximately 6% of GNP on defense, the . highest figure fOr any country outside the socialist bloc.

The Dynamics of Growth 93
Table 4.6 International Comparison of Government Expenditures
Country
Latin America Argentina Brazil Chile Mexico Peru Venezuela Colombia
East Asia Korea Taiwan Thailand Philippines
Government Expenditures as Percent of
GNP, 1982
2 1 .6 2 1 .8 37.6 31 .7 1 8.0 29.6 14.0
19.5
19.9 12.2
GNP, gross nalional product.
Government Expenditures as Percent of
Fixed Investment [year(s)]
19.6 (1978-1980) 22.8 (1980) 12.9 (1978-'1980) 29.4 (1978) 14.8 ( 1978- 1979) 36.3 (1978-1 980) .
8.9 (1978-1980)
22.8 (1978-1980) 32.4 (1978-1980) 12 .8 (1978-1979) 10.9 (1978)
Sources: EKpenditures as percent of GNP are from World Dff1J.lopmznl Report. various years. Expen. ditures as percent of fixed investment are from Shon (1984).
GOVE;RNMENT SHORT-RUN ECONOMIC POLICIES
If the Korean economy has outperformed the late learners of Latin America, the reason cannot be said to lie in short-term austerity measures to manage external shock, because the response of the Ko- . rean government to external shock was not to batten down the hatches. During the twenty-five years after the 1961 coup, the growth of the Korean economy, though spectacular, was regularly interrupted by internal and external shocks, What with two oil crises, global depres- '. sion, and an intensification of international competition, 'the 1 970s were difficult years ,in which to industrialize. Nevertheless, external shocks did not derail the Korean economy from its fast-growth track: The government borrowed its way out of balance-aI-payments difficulties and sustained fast growth. Aggressive borrowing coupled with bailouts of financially troubled finns created a supportive environment for big business. The tack most often taken by the economy after economic downturns was a resurgence of exports and rapidly resumed expan� .. sion.
Here, three stabilization exercises in response to threats of growth interruption are discussed.s The account builds to the stabilization
8 The' following discussion of' stabilization is based on a longer study of Korea's short-run macroeconomic p'olicies and attempts at liberalization. See Amsden ( l987b) or, in the Korean language. Amsden (1988).

94 Tim STATE AND BUSINESS
exercise of 1 979- 1984, formulated as a Comprehensive Stabilization Plan (CSP) by the military dictatorship that came to power in 1980 . . In all three stabilization exercises, the Korean government can be described as having accommodated the private sector rather than having been austere, austerity typically being the mood of the stabilization exercises recommended by the Bretton Woods institutions. In studies sponsored by the World Bank ( 1 987 and Leipziger, 1988), liberalization in Korea in the 1980s is rationalized as a medicine for , the economic diseases supposedly caused by government intervention in the 1970s. Yet the premise of economic disaster is nowhere substantiated. An impartial reading of Korea's history in this period suggests that some of the country's state bureaucracies were suffering from wear and tear as the volume of transactions increased. But most economic indicators, including the current account and debt/GNP ratio, imply that just before the second energ;y crisis, the economy was performing rather well, a Big Push into heavy industry notwithstanding.
Debt Financing
Korea has used f9reign credit for two purposes: to finance its longterm investments and to borrow its way out of balance-of-payments crises in order to maintain its long-term growth trend. Korea's ex� ternal debt position from 196 1 to 1984' is shown in Table 4.7.
Throughout the period of the first two five-year plans, th� debtJ GNP ratio rose rapidly. As discussed in Chapter 3, the Foreign Capital Inducement Law was amended in 1962 to provide guarantees that eliminated the risks of default and of exchange rate depreciation. The foreign debt/GNP ratio rose from 40% in 1963 to 7% in ' 1965 . In September 1965, a monetary reform was undertaken in which deposit and lending rates at banking institutions were more than doubled, increasing the attractiveness of lending to Korea. The foreign debUGNP ratio rose to 14% in 1 967. Then it more than doubled in four years, reaching 30% in 1 97 1 .
Among other. effects of the monetary reform, Korean borrowers were encouraged by the cost differentials between domestic and foreign interest rates. The divergence between domestic and foreign borrowing rates ranged from 4.4% to 1 8% during 1965�1 970 (Y. C. Park, 1985). Because the real private cost of borrowing abroad was typically negative (see Table 3.8), investment as a share of GNP rose from 15% in 1965 to 30% in 1969. The share of savings rose at a faster rate as income expanded and as domestic interest rates increased, but reached its peak at a lower level than investment in the same period, 23% in 1969 (see Table 3.7).
As in Latin America in the 19705, no limits on foreign borrowing

The Dynamics of Growth 95
Table 4.7 External Debt and Debt Service, 1963- 1984
Total Debt Service Foreign Long-Term Debt Debt as % of
Debt Debt Total Service as Service Current (million as % of Debt as % of as % of Transactions
Year u.s. $) Total % of GNP GNP Exports' Receiptsb
1963-1971 1963 157 85.99 4.06 0.05 2.30 1 . 1 1964 177 94.35 5.29 0. 15 4 . 17 2.4 1965 206 98.54 6.81 0.46 8.00 4.8 1966 392 98.21 10.26 0.34 5.20 2.9 1967 645 89.77 13.62 0.72 10.15 5.3 1968 1 , 199 92.58 20.07 0.77 9.47 5.2 1969 1 ,800 89.22 24.07 1.20 1 3.68 7.8 1970 2,245 83.39 25.48 2.84 28.34 18. 1 197 1 2,922 83.6 1 30.06 3.28 28. 16 19.7 1972-1978 1972 3,589 82. 1 7 33.95 3.87 24.40 18.4 1973 4,260 83.54 3 1 .55 4.35 17.87 14.2 1974 5,937 79. 13 32.01 3.25 13.33 1 1 .2 .1975 8,456 7 1 .5 1 40.55 3.38 14 .01 1 2.0 1976 10,533 7 1 .09 36.73 3.50 12.85 10.6 1977 · 12,648 70.63 33.79 3.58 13 .33 10.2 1978 14,871 74.08 29.71 4. 16 16.38 12. 1 1979-1984 1979 20,500 67.80 3 1 .75 4.03 1 7.68 13.3 1980 27,365 61 .22 44.68 4.81 17 . 13 13.1 198 1 32,490 63.80 48.34 5.53 1 7.98 13.8 1982 37,295 6 1 .94 52.65 6.23 2 1 . 1 5 15.5 1983 40,094 70.58 53.23 6.18 20.07 15.0 1984 43,100 73.55 53. 16 6.74 20.75 17.3
GNP, gross national product .
• Merchandise exports.
bReceiplS from visible and invisible foreign transactions. Sources; Bank of Korea and Economic Planning Board.
were enforced by the ·government, and a rapid increase in debt service resulted, exports notwithstanding. The debt service ratio (as a percent of merchandise exports) rose from 14% in 1 969 to 28% in 1 970 (see Table 4.7). It was in the period 1966- 1 97 1 , and later during two stabilization periods, that the big buildup of foreign debt occurred, and not as a consequence of government investment in heavy industry during the 1970s. Foreign debt in 1 966- 197 1 was u�ed to finance exports, to finance imports of capital goods in the light-manufacturing sector, to finance the beginning of import substitution in heavy industry (fertilizers and cement), and to finance

96 THE STATE AND BUSINESS
investments in infrastructUl e (the share in GNP of transponation, communications, electricity, gas, and water more than doubled between 1964 and 1970) (Economic Planning Board, 1 984).
'
The First Stabilization
The increase in the debt service ratio prompted the IMF, in a standby agreement, to require the Korean government to issue a letter of intent to limit foreign capital movements to oTie- to three-year loans (Frank et aI., 1975), Consequently, the, growth rate of foreign debt slowed by 25% and 30% in 1970 and 197 1 , r�spectively, and investment fell. There was also a lull in the growth rate of exports, stability in the real effective exchange rate notwithstanding. Whereas the real growth rate of exports averaged 36% in 1968-1969, it averaged 27% in 1 970- 197 1 . Simultaneously, there was a sharp contraction in monetary expansion (T3,ble 4.8). The growth rate of M2 declined from 6 1 % in 1969 to 27% in 1970. All these factors contributed to a decrease in the growth rate of GNP-from 13 .8% in 1969 to 7.6% in 1970 (see Table 3 . 1 ) .
To stimulate exports, the government introduced a devaluation of 12% in 1 97 1 . The immediate effect was a sharp increase in the won cost of debt financing. This created severe short-term financial problems for firms that had borrowed abroad. Rather than allow troubled enterprises to go bankrupt (the borrowers tended to be the mote progressive as w.el\ as the politically best connected firms), the government bailed them out.
The bailout was specified in a Presidential Emergency Decree an-� nounced on August 3, 1972. This Decree had two immediate objec-! tives: to revive economic activity by stimulating investment demand \ and ·to relieve the interest burden of overextended firms (Cole and Park, 1983). To stimulate investment, the government redticed over." all interest rates of banking institutions. The time deposit rate was lowered from 17.4% to 1 2.6% and the rate on loans up to one year fell from 19% 'to 1 5 .5%. To alleviate the interest burden of overexl tended companies, the government redistributed income from lenders to borrowers in the unofficial capital market, or curb market. All . loan agreements between licensed business firms and lenders in the I curb market were nullified and replaced by new agreements as oL August 2, 1972. These allowed lenders the option to switch theit-loans into shares of the borrowing firms. By 1973 the economy was:.. more than back on track. GNP recorded an unprecedented increase of 14. 1%. The main factor behind the recovery was exports. They grew by an astounding 73%.

The Dynamics of Growth 97
Table 4.8 Monetary Indicators, 1961- 1984
Broad Money Domestic Inflation M l " M2b CreditC Discount Rate
Year % Increase % Increase % Increase Rated in CPI"
1961- 1971 1961 14.5 27.2 4 1 .6 10.22 6. 1 1963 6.3 8.8 19.7 1 0.22 20.0 1964 1 6.7 14.3 8.8 10.50 29.8 1965 34.2 52.7 40. 1 . 28.00 14.7 1966 29.7 6 1 .0 30.5 . 28.00 1 1 .2 1967 44.5 6 1 .7 78.2 28.00 1 0.8 1968 44.6 72.0 84.8 23.00 10.4 1969 4 1 .7 6 1 .4 59.2 22.00 12.4 1970 22. 1 27.3 26.5 19.00 1 6.2 1971 1 6.4 20.8 3 1 . 1 16.00 13.5 1972- 1978 1972 45.1 33.8 30.1 1 I .oo 1 1 .5 1973 40.6 35.9 3 1 .7 1 1 .00 3.2 1974 29.5 24.5 54.2 1 1 .00 24.5 1975 25.0 28..2 32.2 14.00 25.2 1976 30.6 33.5 2 1 .7 14.00 1 5.3 1977 40.7 39.7 23.6 14.00 10.2 1978 24.9 35.0 45.9 1 5.00 14.5 1979- 1984 1979 20.7 24.6 35.6 15.00 18.3 1980 1 6.3 26.9 4 1 .9 16.00 28.7 1981 4.6 25.0 3 1 .2 1 1 .00 2 1 .3 . 1982 45.6 27.0 25.0 5.00 7.3 1983 1 7.0 15.2 15.7 5.00 3':4 1984 0.5 7.7 1 3.2 5.00 2.3
a M I := currency in circulation + deposit money.
• M2 = M I + quasi-money (time and savings deposits).
' Defined as the Bank of Korea's claims on government, on government agencies, and on the private sector. "The rate of discount for commercial bills of prime enterprises .
• CPI, consumer price hldex.
Sourte: Bank of Korea.
The stabilization of 197 1- 1 972, unlike the two stabilizations that fol1owed it, was not triggered by an external shock. Rather, it was precipitated by the IMF's concern about Korea's debt buildup and credit worthiness--<:all it external interference. Consequently, it differed from succeeding stabilizations in that it did not involve a sharp increase in foreign borrowing. Nevertheless, three characteristics of the 197 1':"' 1972 stabilization were later to repeat themselves: a devak uation, a cut in domestic interest rates, and a bailout of financially troubled firms.

98 THE STATE AND BUSINESS
Although maxi-devaluations came to characterize later stabilizations, the midi-devaluation (neither large nor small) of 197 1 was unusual insofar as it led to a year-on-year depreciation of the real effective exchange rate, which depreciated still further in 1972 and 1973 . . One effect of the exchange rate depreciation seems to have been a rise in prices through the import of foreign inflation. The GNP deflator in 1972 was 1 6.4% (see Table 3 . 1 ) . Therefore, although informal price controls had been in effect throughout the 1960s, the August 3, 1972 Decree called for an across-the-board price freeze, in emulation of the Nixon price freeze of a year earlier. After the freeze was lifted, fewer blanket controls over prices remained in effect, and in 1 975 the declared purpose for price controls became to restrairi monopoly power, as noted in Chapter 1 .
The Second Stabilization
Not only was the economy back on track by 1 973. but investments to diversify the economy were in full swing. Nevertheless, steel had just begun to be poured, and the first very large crude carrier had just begun to be constructed when the price of oil beg-dn to rise sharply. The first oil crisis presented a severe threat to growth because the economy was wholly dependent on oil imports. had recently diversified into energy-intensive industries, and was highly vulnerable to fluctuations in world demand. The oil price increase caused a 26% deterioration in the terms of trade.
The government responded .in January ,974 with measures to maintain over",lI growth. A policy decision was taken to absorb fully the oil price increase. and that decision contributed in 1 974 to a 62% rise in imports (Economic Planning Board, 1984). Domestic credit was expanded by over 40%. Investment as a sh�re of GNP increased from 26% to 32% between 1973 and 1974, while the savings share of GNP declined by only 3.5%. The current accoUnt deficit jumped by a factor of 5 to 1 1 %, an historical high, despite a growth in exports of 16% (see Table 3. 1) . To finance the deficit, the government both borrowed abroad and depleted its foreign reserve holdings, which fell by 3.5% in a year. Between 1 973 and 1974, Korea's total foreign debt rose by 42%. Total debt as a percent of GNP rose from 32% in 1 974 to 40% in 1975 (see Table 4.7).9
9 In both 1973 and 1974. foreign loans as a percent of total capital inflow were lower than usual because of a temporary surge in direcf foreign investment. In 1973 and 1974, direct foreign investment in total capital inflow averaged 14.8% compared with 7% for the period 1964-1972 and 4.3% for the period 1975-1983 (Economic Planning Board, 1 984). With respect to loans, in 1974 and 1975 commercial loans grew in importance relative to public loans. This differed from the borrowing behavior of the preceding stabilization in 1971-1972 and the succeeding one in 1979-1982.

The Dynamics of Growth 99
The country reaped the rewards of borrowing and of running down its reserves in the form of positive growth-7.7% in 1974 and 6.9% in 1975--at a time when most other non-oil-producing countries were plunged into depression. By 1976 fast growth had resumed, and GNP grew by 1 4.4%. Although investment as a share of GNP declined, exports grew by a staggering 49.2% (see Table 3. 1 ).
Output continued to soar after 1976- 1977, buoyed by domestic investment in heavy industry and in related infrastructure. The growth rate of output reached 1 2.7% in 1977. In 1978, the year before the second energy crisis struck, it equaled 9.7%, a rate just above the average for 1964-1972. The current account deficit, moreover, remained healthy until oil prices again began their ascent. As a percent of GNP it equaled only - 1 . 1 in 1976 and -2.2 in 1978. In 1977 the current account even showed a small surplus. the first in Korea's recorded history, as remittances from the Middle East increased (see Table 3. 1 ). Thus. amidst the Big Push into heavy industry in 1977-1979 and just before the second enerr;y crisis in July 1979, the Korean economy was in good shape.
Determination of the Pace of Industrialization
We may pause here to make a general observation about the pace of industrialization in Korea (industrialization involving both the growth rate and the diversification of output). It may be said that to whatever extent possible, the government ·controlled the pace of indus� trializatjgn, rather than allowing market forces to do so. The incentives it offered private firms had a decisive influence on both the timing of new investments and their scope. Nor is there any reason on theoretical grounds to believe that the market mechanism is a better arbiter than the state of the critical decision of how rapidly to grow, especially in the presence of unemployment arid of the possibility of foreign borrowing. The idea of letting the market mechanism, rather than the government, decide the pace 'of industrialization is not particularly compelling from the point of view of efficiency.
In competitive theory. the market is recognized as the supreme arbiter of the rate of capital accumulation and hence of growth.IO If the rate of savings exceeds the rate at which firms are willing to invest, interest rates are predicted to fall, thereby stimulating more investment. Even ignoring the Keynesian criticisms of this "investment" behavior, ultimately the rate of investment abstracted from its most immediate determinants depends on the capability of entrepre-
10 The best critic of this view is Gers'chenkron (1962). Gerschenkron gave careful historical examples of credit mobilization at the national level that suggested that the rate of investment is an institutionally determined variable.

100 .
TI·IE STATE AND BUSINESS
neurs to assume risk. This capability combines both willingness and ability to do so, including the willingness and ability to borrow. As such, there is nothing sacrosanct about a market-determined investment rate, because it will depend .on the tastes of whoever is responsible for investment decisions. Efficiency considerations do not necessarily enter the question. In the long run, the investment rate is a social variable. Other things being equal, a rate of return of, say. 1 5% may be considered inadequate compensation for risk in one country but adequate compensation in another.
Relying on the market mechanism to determine the pace of industrialization presumably has one merit over state intervention: The rate of inflation may be lower. In theory, rising prices are expected to discourage investment, either by reducing profits or by increasing risk. Whatever the relationship between inflation and investment in theory, in practice inflation did accompany Korea's push into heavy . industry under government leadership in the late 1970s. The following discussion examines its effect.
Inflation
Although inflation in the late 1970s was below the 1974- 1975 level, it was high by post-Korean-War standards.
· It was up from 16% in 1 977 to 22% in 1978 and l �79 (see Table 3 . 1 ) . The average rate of inflation in Korea in the period 1962- 1969 was 1 7.3%. In the period 1970- 1979 it was 19.3%. The pursuit of fast growth was not restrained in the interest of price stability. In fact, a relatively high · rate of inflation was toierated by the standards of most backward countries, save those in Latin America.
Table 4.9 suggests some of the determinants of inflation in the late 19705. One was agricultural prices, which accelerated due to exceptionally poor harvests. Another was monetary policy, which was ' fairly· accommodating of the high level of economic activity. M2 grew at a faster rate than in 1974- 1 975, · although both M2 and bank credit grew less than in the period 1965- 1 973. The most significant rate of change, however, was that of manufacturing wages (see Table 4. 10).
Manufacturing wages rose especially rapidly in 1976- 1978 due to an unusual circumstance. The Middle East boom drained the m9st energetic able-bodied men from the labor force in unprecedented . numbers. According to data from the Ministry of Labor, between 1977 and 1979 roughly 292,600 male workers migrated overseas, equaling almost 27% of the male manufactuTing work force. The rate of wage increase of managerial, technical, and administrative workers also began to rise (although throughout Korea's high growth period, wage increases of production workers on the average ex-

The DynamicS of Growth 101
Table 4.9 Average Periodic Rates of Change in Inflation and in Its Determinants. 1964- 1984 (Percent) (Arithmetic Averages)
1965- 1974- 1976- 1978- 1980-1973 1975 1977 1979 1981 1982 1983 1984
Inflation Consumer price index 1 1 .55 24.77 12.70 16.41 25.01 7.19 3.42 2.27 Wholesale · price index 8.78 34.30 10.60 1 5.21 29.64 4.65 0.24 0.7 1 PV I " 1 4.35 27.20 18. 13 2 1 .29 22.02 8.49 3. 13 2.99
DeterminantS Manufacturing wages 20.45 3 1 . 1 6 35.25 3 1 .48 2 1 .39 14.86 12.00 8.32 Agriculture prices 1 2.56 34.86 22.22 22.57 26.07 0.31 3.36 -0.08 Price of imported
materials (won) 1 1 .98 27.92 1 .58 16.35 37.55 1 .33 1 .22 4.0 1 Price of imported oil . 18.84 1 35 . 18 6.05 2 1 .91 72. 16 2.51 -6.56 0040 Price of non-oil
materials 1 1 .60 18 . 10 0.40 14.77 25.55 0.68 5.72 5.85 M2b 46.44 26.55 33.07 33.04 26.61 .28. 15 19.52 10.74 BaR)<. credit 42.99 42.54 23.34 40.54 35.82 25. 1 1 1 5.99 1 3.08
' Denotes the non.agriculture GNP de8ator. 10M2 = currency in circulation + deposit money + quasi-money (time and savings deposits).
Source: Corbo and Nam, 1986.
ceeded those of higher level employees, as Chapter 8 indicates). For the first time, the rate at which nominal wages was rising exceeded the rate at which productivity was rising, and therefore, income' was being redistributed to labor.
Institutional Wear and Tear
Inflation in 1 976-1978, although high, coincided with fast growth, historically high savings rates, high real wage increalies. and a . low current account deficit. Yet it coincided with institutional wear and tear that was soCially destabilizing.
The expression of discontent was greatest among the educated classes, the period of the Big Push of 1 977- 1979 having been relatively free of protest action by labor. The lowest paid workers may have been unconvinced by the government's constant reminders that they had never had it so good. The highest paid workers may have been oppressed by long work hours and the chaebol's interference in almost every aspect of their lives. But the wave of strikes that swept over Korea in 1979 occurred only after; not before, the second oil price increase, when wages in some firms fell into arrears. Moreover, the strikes occurred during the breakdown of state power in the months between the assassination of President Park Chung

2
Table 4.10 Inflation, Productivity, and Wages in Manufacturing, 1 965- 1984 (Rates of Change in Percent) (Arithmetic Averages)
1965-1973 1974-1975 1976-1977 1978 1979 1980 198 1 1982 1983 1984
Consumer price index 1 1 .6 24.8 12.7 14.5 18.3 28.7 2 1 .3 7.2 3.4 2.3 Wholesale price index 8.8 34.3 10.6 1 1 .6 18.8 38.9 20.4 4.7 0.2 0.7 Total wage Na 21 .6 3 1 .2 34.3 34.7 36.6 19. 1 20.0 14.7 1 1 .3 8.2
Rb 9.8 5. 1 19.5 20.2 18.3 -9.6 - 1 .3 7.5 7.9 5.9 Production workers N 18.3' 27.7 29.1 35.3 38.9 18.2 21 .7 14.1 10.8 10.0
R 12.5' 2.9 16.4 20.8 20.6 - 10.5 0.4 6.9 7.4 7.7 Technicians N 24.1 ' 30.8 3 1 .4 34.5 30.3 1 3.9 13.8 20.0 8.5 7.4
R 18.3' 6.0 18.7 20.0 12.0 -14.8 -7.5 1 2.8 5. 1 5. 1 Managers N 22.5' 35.4 �·26.9 33.0 38.2 8.6 12.5 8.4 10.5 7.1
R 16.7' 10.6 14.2 18,5 19.9 -20.1 -8.8 1 .2 7 . 1 4.f Labor productivity 13.0 10.5 1 0.6 1 1 .5 15.4 10.5 16.9 7.2 13.0 10.( Unit labor COS[d 7.7 18.8 2 1 .4 20.5 1 1 .4 1 1 . 1 10.0 -0.8 -·1.5 - u
·Nominal.
"Real (nominal minus CPI). '1973 and 1974 only.
• Rate of increase of nominal wage indexllabor productivity index.
Source: Office of Labor Affairs (until 1980) and Ministry of Labor; Bank of Korea.

The Dynamics of Growth 103
Hee in October 1979 and the assumption of power by General Chun 000 Whan in M),iy 1980.
For the educated classes, the final years of the Big Push meant inflation, which reduced real returns to moonlighting, and escalating real estate prices, which disappointed dreams of home ownership in a housing market with few rental properties. With their own interests in jeopardy, the educated classes' criticisms of the government grew more vocal. The speculation that underlay escalating real estate prices was interpreted as one of several signs of misfiring of state policy. Land speculation was read as one manifestation of the misuse of subsidized loans for unproductive rather than for productive ends. A much-publicized crash program that improved rural housing but disrupted urban construction and cement exports was taken as being indicative of arbitrary and undisciplined government. The financial structure of firms was also believed to have become precarious due to high debt equity ratios. I I
Disaffection · with economic policy among the educated classes focused on the machinery branch of the heavy industries, although that branch accounted for no more than 10% of total loans to the manufacturing sector in the period 1 975-1982 (Y. C. Park, 1985). HOWeV(T, it was in this machinery sector that the government-business recipe for entering heavy industry became distorted. In some machinery subbranches, particularly electrical generating equipment, excess capacity emerged because building to achieve econc;>mies of scale went to extremes, and too many Jirms were licensed to enter each manufacturing subbranch.
1ndiscriminate licensing in some machinery subbranches had several possible explanations: ( 1 ) the government indulged in multiple licensing in the interests of national defense, (2) the government's administrative machinery was in need of revision to handle a larger and more complex volume of transactions, or (3) the government lost control to the chaebol, could not rcfuse them licenses, and abused its disciplinary device of credit allocation .. For their part, the chaebol were drawn into the machinery sector by oligopolistic rivalry, subsidized credit, and the lure of riches. Either the government had to revamp its licensing procedures and regain control over the chaebol or it had to renounce control over credit allocation, thereby losing
I I Behind-the-scenes bailouts inake the reported bankruptcy rate an unreliable in· dicator of insolvency. Debt/equity ratios, however, have been taken as evidence of financial cliffhanging (Cho and Cole. 1 986). Yet. debt/equity ratios in the manufac· turing sector rose by only 13.5% between 1974-1975 and 1976-1977. In the period of accelerated investments in heavy industry, 1977-1979. debt/equity ratios remained almost constant at around 370, well below the level prevailing in Japan, 466 (Table 4. 1 1 shows Korea's average debt/equity ratios during 196 1 - 1 984).

104 THE STATE AND BUSINESS
Table 4.1 1 Average Debt/Equity Ratio in Manufacturing, 196 1 - 1984
Year Ratio Year Ratio
1961 136 1973 272 1962 .' 154 1974 316 1963 92 1975 339 1964 101 1976 365 1965 94 1977 367 1966 l i B 1978 367 1967 151 1979 377 1968 201 1980 488 1969 270 1981 451 197 1 328 1982 386 1972 3 l.3 1983 360
1984 340
Source: Bank of Korea. Financial SlaItmmt AnalJ'lu. various years.
an effective means by which to achieve economies of scale and competitive firm performance simultaneously.
In April 1979, the Park government itself set machinery. in motion to reduce inflation and to reform administnltive procedures by announcing the Comprehensive Stabilization Plan. The plan, however, was postponed by the second round of oil price increases in July and by assassination in October. Commodity price increases had led to a 13% deterioration in the terms of trade between 1979 and 1 980 .
.The deficit in the current account jumped from -2.2% of GNP in . .1978 to -8.7% of GNP two years later. In 1980 the growth rate of GNP turned negative for the first time since the end of the Korean War.
The Third Stabilization
Both short-term and long-term factors appear to have been responsible for recovery, which was fairly rapid. In 1 980 the GNP growth rate had been -5.2; by 198 1 it was 6.2, below Korea's previous trend but above the growth rates of the Latin American late-industrializing countries and that of India. In 1 980 the GNP deflator had been 25.6%; by 1982 it had fallen to 7. 1 % (see Table 3 . 1 ) . The international environment became favorable, and the global economy began to grow faster, inflation falling sharply. Korea's terms of trade
. improved even at a time when the terms of trade of other lateindustrializing countries continued to deteriorate.

The Dynamics of Growth 105
Nevertheless, stabilization policy between mid- 1979 and the end of 1982 exhibited no major departure from past practice. When private investment fell , and private savings fell even more, the tasks of borrowing and beefing up investment were assumed by the government. The deficit of state enterprises nearly doubled between 1980 and 1982 (see Table 4.4). Korea's total external debt grew by 59% from 1979 to 198 1 . Total external debt as a percent of GNP had been 32% in 1979, the last year of the Big Push, and increased to 48% in 1981 (Table 4.7). The stance of monetary policy varied from contractionary to expansionary, depending on whether inflation or the decline in economic activity was momentarily worse. The monetary authorities, however, acted to lower interest rates and hence the cost of borrowing. The intention was to avert insolvency and to mitigate inflation by reduCing the cost of working capital (see Table 4.8). Many firms faced financial crises, and their debt/equity ratios rose sharply (see Table 4 . 1 1). Only one major chaebol, however, went bankrupt, suggesting massive behind-the-scenes bailouts.
Exchange rate policy in all three stabilizations was one of fairly sharp devaluation. In the stabilizations associated with the two energy crises, however, the exchange rate quickly appreciated after being devalued. It will be recalled that the exchange rate was a source of intense conflict between the Korean government and the United States aid administration in the 1950s and the 1960s, the former favoring depreciation of its real value, the latter, like the Bretton Woods institutions, arguing in favor of nominal devaluation. Figure 4 . 1 suggests its relative opaqueness, exports and the real effective exchange rate showing little relationship to one another. The real effective ' exchange rate and exports move together systematically in either direction in only four time periods: 1966- 1968, 197 1-1974, 1978-1979, and 1982- 1983, although these years do not share any distinct characteristics. The rest . of the time between 1966 and 1983 the growth'· rate of exports appears to have been influenced by other factors.
The second type. of growth policies discussed thus far, relating to stabilization, may be summarized as foHows: .To the extent that other growth policiesfavoring heavy state subsidization of new industries have been su,ccessful, they have enabled the government to act vigorously within the context of short-term macroeconomic policies to maintain the growth momentum in the face of external shocks. This the government has done by borrowing abroad and by resorting to. fairly unorthodox measures:. driving down interest rates, allowing the exchange rate to appreciate after devaluation, and not allowing all but a trivial number of leading enterprises to go bankrupt. The Korean government may discipline private firms �ore than other governments in late-industrializing countries. But it also provides them with staunch support.

100
20
0�--------�--------------�------��--��-4
- 10·����-L�����--�����-L���--�� � � � � � � � ro n n � u � n n n � oo �
A. Growth Rate of Exports and Index of REER
80
60
_ 20L-����-L����������-L������ 63 64 65 66 67 68 69 70 71 72 73 74 75 76 77 78
B. Growth Rate of Exports and Rate of Change of REER
106

The Dynamics of Growth 107
THE KEY TO RECOVERY: HIGH PRODUCTIVITY
Despite a rapid appreciation of the exchange rate after 1980, exports rebounded and led the economy back to prosperity. Exports grew by 17% in 1980 and by 20% in 1981 (see Table 3. 1). Behind the rise in exports lay a highly productive manufacturing sector. ' Ultimately, rising productivity was the critical factor in a rapid return� to growth. A stunning fact about Korean industrialization is that at the beg' inning and end of the period of massive foreign borrowing to finance heavy industry, the debt/GNP ratio remained more or less constant, falling slightly from 34% in 1972 to 32% in 1979 (see Table 4. 7). Evidently, the economy was using its credit productively to generate high levels of output.
The growth rate of labor productivity in manufacturing averaged 13.5% in 1978-1979, 13.7% in 1980-1981 , and 1 1 .5% in 1983- 1984 (Table 4. 10). The rise in output per worker had more to do with ,an increase in productivity than with changes in the employment rat�. Although the nonfarm unemployment rate rose to a peak of 7.5% in 1980 (up from 4� 7% in (978), it fell steadily thereafter, to 4.9% in 1985. The average annual growth of nonfarm 'employment, moreover, although slower than it had been previously, was nonetheless substantial: 4.9% in 1979-1985 compared with 8.5% in 1976-1978 and 6.9% in 1970- 1975 (Economic Planning Board, various years). 12 .
In part productivity increased as exports rose and as excess capacity became utilized, allowing exports to rise still further. In part it increased as capital-intensive investments in heavy industry began to fructify, and firms fine-tuned their operations (as illustrated in
12 The layoff policies of the chaebol may have had something to do with the behav· ior of the unemployment rate and the maintenance of employment. Although Kore, doesn't have a permanent employment system similar to japan's, there is still socia and political pressure on wrger firms to avert wyo/fs, and the diversified business group! are able to transfer labor among affiliates. As the structure of industry shifted froff light to heavy manufactures. and as the share in total employment accounted for b, large firms and the chaebol rose (although less than their share in sales or shipments) employment possibly held steadier.
Figure 4.1 Relationship between Exports and Real Effective Exchange Rate (REER). The index of REER is the inverse of column 5, Table 3'. 1 . An increase in the index indicates a depreciation in the won. Thus, the two variables presented in the figure are expected to move in the same direction. SOUTce: Bank of Korea and International Monetary Fund. Key: 0 growth rate of exports
+ REER

108 THE STATE AND BUSINESS
Chapters 1 1 and 12). In part it increased as the new political regime pursued the same agenda and tactics as the old one �nd forced chaebol in sectors characterized by overexpansion and "excessive competition" to amalgamate, to specialize, or to exit (Korea Exchange Bank, 1980). Industries subject to reorganization included automobiles, heavy electrical equipment, electronic switching systems, diesel engines, copper smelting, and power-generating equipment (see the discussion in Chapter 5).
Rising productivity diminished the costs of the economic contraction that workers had to bear. True enough, real wages fell in 1980 and 198 1 , and the growth rate of real wages only recovered in 1988 the height it had achieved in 1978. Nevertheless, even as inflation abated, workers continued to deQland high nominal wage increases, and real wages in 1982 and 1983 increased at an average- annual rate of over 7%. Because productivity was rising fairly fast, and workers were at least enjoying some real gains, wages began to increase more in line with unit labor costs. The nominal growth rate of unit labor costs declined steadily from 1979 and was negative in 1982- 1984 (Table 4. 10).
Added Austerity
At a time when the economy was already assured recovery and price increases were already well below historical levels (the CPI was 7.2% in 1982 compared with 1 1 .6% in 1965- 1973), the government departed from past practice and, in concert with the IMF, tightened the fiscal and monetary screws. The stated objective was to prepare the macroeconomic environment for the structural liberalizations that were supposed to be under way. An adjustment program was formulated that was supported by a standby arrangement with the Fund. The program envisioned a sharp deceleration in the growth of external debt and a substantial improvement in its maturity structurelong-term debt as a percentage of total debt had fallen from 74% in 1978 to 62% in 1982 (Table 4.7). To achieve these objectives, the government included in the program a steep reduction in both the public sector deficit and the ra�e of credit expansion, as well as . a real depreciation of the currency. The public sector deficit fell by about 3 percentage points between 198 1 - 1983 and 1983- 1984; the rate of credit expansion was cut by more than half, to about 13%; and the real effective exchange rate was depreciated by about 7% in 1983 and remained stable thereafter.
The effects of such extreme austerity were wide ranging. In terES of distribution effects, austerity probably took its highest toll in ag-

The Dynamics of Growth 109
riculture because, in the budget crunch of 1983- 1984, a prime target of revenue saving was agricultural price supports. Between 1982 and 1985 there was a m'ass exodus from agriculture (roughly 600,000 people), even larger than the migration associated with the 1980 harvest failure (about 85,000). The last wave of migrants, however, was believed to have consisted of relatively older people, unequipped to enter the urban labor force and unaccounted for in the unemployment statistics (Castaneda and Park, 1986). In 1984- 1985 there were sit-down strikes by young farmers to protest the government's price and import policies. Between 1979 and 1983 impor.ts of grains rose by 28%, whereas during the 1970s they had remained fairly stable (Economic Planning Board, 1984) , 13
Two other changes are less certain to have emerged from austerity. First is the question whether austerity reduced inflation. The GNP deflator fell from 7. 1 % in 1982 to almost nil in 1985- 1986. Yet the decisive drop in prices came earlier, before austerity became trenchant, when the prices of oil and non-oil imports fell like stones (see Table 4.9). Second is the question whether price stability encouraged an increase in private savings. By 1987 Korea had passed a milestone. Domestic savings exceeded domestic investment. 14 Yet the extent to which a decline in inflation was responsible for such' saving behavior is unclear, Private savings also reached what in the late 1970s was an historic high, at a time when inflation as well was at an historic high. Savings behavior, therefore. may be more responsive to factors other than the direction and rate of price change. Whatever the true causality between the Comprehensive Stabilization Plan. savings. and inflation. this much is clear: Austerity cannot claim chief responsibility for the restoration of rapid growth in Korea. It is also unrepresentative of twenty-five previous years of short-run macroeconomic policy.
THE GROWTH:PRODUC11VITY DYNAMIC OF LATE INDUSTRIALIZATION
We come to the 'last facet of growth to be considered. the growthproductivity dynamic of late industrialization, It is easier to understand this dynamic now that we have a sense 9f how late industrialization starts. how it spreads to new industries, and how it is shielded from external shocks. The objective is to go further and to understand theoretically a dynamic between growth and productivity that
13 For a discussion of farmers' protests. see J. S. Suh (1986); In 1985 the real income of the farmer. relative to that of the urban worker, was worse than in 1965. 1970. and 1975. although slightly better than in 1980 (Moon. 1987).
14 See Han'guk Kyiing-je Sinmun ( 1987).

1 10 THE STATE AND BUSINESS
appears to drive late industrialization forward. It is suggested below that. subject to institutional constraints, . high growth rates of output generate high growth rates of productivity, and vice versa. There is circular and cumulative causality. Once started. a momentum builds between growth and productivity that drives industrialization forward. This is what we observe in countries like Japan, Korea; and Taiwan. whose economies have followed an upward spiral.
In countries whose industrializations date to earlier historical periods and whose leading firms are at the world technological frontier. we tend to see another growth dynamic at play. or at least we are conditioned by economic theory to see such a dynamic, It is a dynamic that runs from technological change at the world frontier to high productivity. and from high prOductivity to high growth. In such a growth relationship there is no reverse causality. Growth does not generate high productivity or technological change. although technological change generates high productivity and growth.
One-way · causality characterizes the theoretical models of most economists. and so the general case. There exists a contrasting model associated with the work of Verdoorn and Kaldor that does express cumulative causality between increases in output and productivity . 15 Like the conventional growth model. it also presumes to describe a general case. Its explanatory power. however. may be greatest when applied specifically to late-industrializing countries and the learning process. and it is this application that is attempted below.
The conventional growth model takes the form.
t=! (XI > X2 • . • • • x,,)T (4. 1 )
where growth (g) is a function of factor inputs (il . . • in) and technological change (1). which is represented as a scalar and residual (dots indicate growth rates). The weakness of this formulation lies in its failure to explain its key component. technological change itself. 16 Technological change is taken as being exogenously determined. and not much in the way of theory is given to explain what underlies it. By implication. productivity is also left unexplained because it depends on technological change. Moreover. this formulation implicitly incorporates the view that productivity depends not just on technological change but on a particular type of technological � change, the epochal breakthrough. While it is true that epochal breakthroughs probably occur erratically and are, therefore. best left ·
15 For this literature. see KaldoT (1967; 1 978). and Journal of Post Keynesia� Economics. (1983). 16 For a critical review article on growth models and growth accounting. see R. R. Nelson (1981) .

The Dynamics of Growth 1 1 1
undetermined within the economic system, there is more to productivity than epochal breakthroughs.
The conventional growth model is inappropriate fOT lateindustrializing countries because it throws away valuable information. The information it discards is the source of productivity increases. Although productivity changes remain a mystery in advanced countries, where productivity increases come from in lateindustrializing countries is quite obvious. They do not depend upon "creative genius"; they are plucked from the world technology shelf. First, increases in productivity come from imports of foreign technology. Second, they come from operating foreign technology on a scale sufficient to minimize unit costs. Third, they come from learning how to use foreign technology imports efficiently.
One may go one step further and suggest that all three of these determinants of productivity are collapsible into one variable, the growth rate of output. Ignoring for. the moment the institutional setting, it can easily be appreciated that if foreign technology is embodied in plant and equipment,. then to raise productivity by importing technology will depend on the rate of investment in new plant and equipment. The faster output is rising, the faster one may expect investment to rise, and hence technology imports to rise. If growth and investment are low, the import of foreign technology will also be low. Similarly,' it will be easier to realize scale economies embodied in imported foreign technology when output is growing .. When output is growing, income is also growing, and hence the size of the market is expanding, making it easier to reach minimum efficient scale. Finally, how efficiently foreign technology is used will depend on the experience of the user. The faster output is rising, the faster experience accumulates. In other words, leaming-by-doing, which is one critical aspect of learning in general, depends on cumulative output.
If growth depe�ds on productivity, then as just stated, productivity also depends On growth. The growth-productivity momentum is a closed loop. Once growth starts and invades newer and newer industries, it gathers momentum by triggering increases in productivity. The loop in which productivity depends on growth takes the form,
p = g(Xl, X2, . . • , xn) (4.2)
where productivity <P) is a function of growth (g) and growth decomposes into three growth effects, Xl , X2, • • • , xn• The three growth effects are investment-embodying technology new to the user, economies of scale, and learning-by-doing.
Asjust formulated, the growth-productivity dynamic is highly me-

1 I2 THE STATE AND BUSINESS .
chanica!. While it is fairly easy to imagine how the government might intervene to great advantage to keep the growth momentum going, in reality higher productivity does not automatically follow from higher growth. In one scenario, higher growth may simply lead to higher prices. In another, it may generate gross inefficiency. The translation of high growth rates of output into high growth rates of productivity depends on what happens inside the unit of production. Closing the loop between growth and productivity. therefore. involves an analytical shift, a change in the center of gravity from the state to the other key institution of industrialization. the firm. 17
CONCLUSION
This chapter examined three aspects of growth: diversification and entrepreneurship. short-run stabilization, and productivity. In the case of entrepreneurship, by historical standards the big businesses ' of late industrialization have curtailed the role of the private 'entrepreneur. On the one hand, as discussed in this chapter, the state has usurped the domain of the traditional private entrepreneur·by making milestone decisions about what. when, and how much to produce. On the other hand. as discussed in la�er chapters. the salaried managers have carried the burden of implementing investment decisions because it is they who hold the technical expertise. The private entrepreneur of late industrialization is a pale reflection of the heroic figure of the past. .
As for short-run stabilization. the way it has been managed by the state has been critical in late industrialization, which has been subject to sharp and recurrent external shocks. The management of stabi�zation by the state in Korea has been contrary to what has typically been the prescribed medicine of the Bretton Woods institutions. Rather than soften external shocks with austerity measures, the Korean government has been wont to adopt expansionary policies an9 borrow its way out of balance-of-payments difficulties. It has beeih able to do so because heavy foreign borrowing has been balanced by \ large productivity increases. Therefore, despite massive foreign bor�' rowing to finance diversification. the debt/GNP ratio even fell slightly in Korea by the end of the Big Push into heavy industry in 1 979.
I? This suggests that Equation 4.2 should be estimated at the firm level. Chenery. Robinson, and Syrquin ( 1986) measured it instead at the most aggregate level. which may explain why their findings of a positive association between the growth of output and productivity were not stronger. There are severe statistical problems irivolved in measuring Equation 4.2. It is difficult to separate the three growth effects and to exclude the temporary impact of business cycles. For a discussion of measurement problems. see Journal of POJI Keyne,ian Economics. Spring 1983.

The Dynamics of Growth 1 13
Finally, the productivity increases of late industrialization ill-fit the standard growth model, whereby productivity growth induces output growth but output growth does not induce higher productivity, higher productivity being driven by breakthroughs at the world technological frontier independent of the growth rate of output. Productivity in late industrialization, by contrast, has nothing to do with breakthroughs at the world frontier. Instead it depends on how rapidly foreign technology is borrowed (which depends on the investment rate), whether foreign technology is utilized at the appropriate scale .(which depends on how fast the market is growing), and how efficiently foreign technology is employed (which depends on experience related to cumulative production). In short, the growth rate of output may be hypothesized to depend on higher productivity and, in closed-loop fashion, higher productivity also depends on the growth rate of output.
On the one hand, this cumulative relationship between productivity and growth underscores the importance of government intervention to keep the growth momentum going. On the other hand, the fact that productivity has little to do with imminent events at the wor� technological frontier and much to do with production capability-investing in foreign designs, producing at the appropriate scale, and learning-by-doing-:-highlights the importance of firm-level management practices. The next chapter, therefore, opens an extended discussion of the firm and its human resources.


eHAPTER FIVE
The Spiraling of Market Power
MONOPOLY. COMPETITION. AND LIBERALIZATION: AN OVERVIEW
Big business as well as the state shouldered the burden of carrying Korea in to basic and high-tech industry. Beginning in the 1880s, big, oligopolistic firms became a general property of industrialization. Oligopoly, or a relatively small number of firms in control of the output of a single industry, is one meaning attached to the term market power. The term has, however, another meaning. This meaning relates' to the tendency of big business to diversify into more than one industry, giving rise to high aggregate concentration. According to an account of industrialization in the United States, "The large modern corporation typically is not confined to a single industry but embraces many lines of business and its opera,tions extend to all parts of the earth . . . " (Mueller, 1 982, p. 427). Thus, a general property of the industrialization beginning in the late nineteenth century is high aggregate concentration along with industry concentration, the former referring to the accountability by a relatively smail number of firms for a large share of national product.
The countries that industrialized still later through learning took high aggregate economic concentration even further, in the form of the diversified business group-zaibatsu in Japan, chaebol in Korea. A volume describing the proceedings of the International Conference on Business History testifies to the generalness of this form of business in late industri;'llization :
In developing countries such as South Korea, Taiwan, the Philippines, Thailand, India, Brazil and Argentina . . . industrial groups which resemble japan's former zaibatsu have sprung up since the Second World War. (Yasuoka, 1 984, p: xi) I
I For information on Taiwan's business groups, see Chou (1988).
115

1 16 THE STATE AND BUSINESS
Table 5.1 Combined Sales of Top Ten Chaebol� as Percent of GNP,. 1974- 1984
Groups 1 974 1 975 1976 1977 1978 1979 1 980 1981 1982 1983
1 4.9 4.3 4.7 7.9 6.9 8.3 8.3 ' 10.5 10.4 U .8 2 7.2 7.5 8. 1 12.5 1 2.9 1 2.8 16.3 1 9 . 1 19.0 2 1 .2 3 9.0 9.8 1 l .3 1 6.0 16.9 1 7 .6 23.9 27.6 27.4 30.5 4 10.3 1 1 .4 1 2.9 1 8.2 20.7 22. 1 30.1 35.2 35.6 38.7 5 1 1 .6 1 2.8 14.5 1 9.8 22.9 24.6 35.0 4 1 .3 42.2 46.7 6 1 2.7 14 . 1 16. 1 2 1 .3 24.7 26.6 38.2 44..9 46.0 5 1 .0 7 13.5 15.3 1 7.5 22.8 26.4 28.5 4 1 .0 48.0 49.2 54.2 8 14.3 1 6.2 1 8.4 24.0 27.7 30.3 43.6 50.9 52.2 57.1 9 'i4.7 16.7 19.3 25.2 ' 28.9 3 1 .6. 46.0 53.3 55.1 59.8
10 1 5 . 1 17. 1 19.8 26.0 30. 1 32.8 48. 1 55.7 57.6 62.4
·(Aggregale net sales of Ihe larsesl len business groups/GNP) )( 100 for each year. Source:Seok Ki Kim (1987).
1984
1 2.0 24.0 35.8 . 44.3 . 52.4 56.2 59.4 62.1 64.S 67.4
The extreme degree of diversification and concentration represented by the diversified business group is notable when one compares the chaebol with, say, General Mo�ors and General Electric before World War II. These two American giants were highly diver.sified, but largely in related products (however remotely related). The leading Korean chaebol, by contrast, comprise major divisions that have no relation to one another whatsoever: consumer electronics and petrochemicals in the case of the Lucky-Goldstar group; finance and heavy machinery in the case of Hyundai; consumer electronics, heavy machinery, finance, and entertainment in the case of Samsung; and so on. What is more, while prewar General Motors and General Electric were larger in absolute size than Samsung or Hyundai, they never accounted for as high a share of total g�oss national product. As Table 5. 1 sh?ws, i? 1984 th.e three larges� chael bol alone accounted for a staggenng 36% of natIOnal product In Ko-; � �
Big business raises two sets of issues: its economic performance and its social effects. Concerning its social effects, they appear similar whatever the mode of industrialization. In Germany, the appear
. ance of big business was associated with the trusts, gold and iron, an imperial style in politics and economics, and the rise of centralized state power.2 In Japan, the modern industrial enterprise was associated with heavy industry, fascism, and war:
The whole period of military hegemony and fascism was very favorable to business. Industrial output rose from 6 billion yen
2 See the account by Stern ( 1977). On the trusts see Maschke .( 1 969).'
The Spiraling of Market Power 1 17
in 1930 to 30 billion yen in 194 1 . The relative positions of light and heavy industry were reversed. The four great zaibatsu firms, Mitsui, Mitsubishi, Sumitomo; and Yasuda, came out of the Second World War with total assets of more than 3 billion yen, compared with only 875 oiillion in 1930. (Moore, 1966, pp; 30 1-2)
In Korea, too, the rise of the diversified business group has been inseparable from the thunderous social change accompanying the decline of agrarian society, ushered in by the army and the state, with which it is associated.
Concerning economic performance, the supposed benefits of bigness have inspired a fair amount of skepticism. The major economic rationale for bigness is economies of scale.3 Yet the case for economies of scale , applies to plant size, not firm size. The major economic rationale for big diversified firms is economies of scope. That is, given fixed inputs, it can be demonstrated theoretically that producing a greater rather than a smaller variety of products may be cheaper under certain circumstances.4 Yet the case for economies of scope has also come under attack. Writing about the world's beleaguered hegemonic power, the United States, Adams and Brock argued,
The case for large firm size . . . rests upon alleged efficiencies of management rather than technology. Efficiency, it is said, is enhanced by spreading administrative expenses over multiplant operations; , by eliminating duplication of officials, services, ahd record systems; by providing sophisticated statistical, research, and other staff services that would be ruinously expensive for smaller firms; by hiring more competent executives" more talented legal departments, and more effective lobbyists; by obtaining credit on more advantageous terms; and so forth. Some of these economies . . . reflect advantages of bargaining power; however profitable they may be to the particular firm they do not benefit the community at large. ( 1986, pp. 33-4)
Moreover, it is argued that the diseconomies of scope tend to overwhelm the economies. Adams and Brock quote a professor at Harvard Business School, Steven C. Wheelwright, as saying, "Companies always thought, 'Our people can manage their way out of the problems [that] size and complexity create.' But the evidence is that they can't" ( 1 986, p. 1 53). The authors came to a related conclusion:
� While the principle of economies of scale is demonstrated repeatedly in the commonplaces of everyday life, its significance in [he profit-making sphere is still open to debate among economists. For two interesting discussions, see Gold ( 1981) and Buzacott et al. ( 1982). '
4 On economies of scope, see Bailey and Friedlaender (1982) and Spence (1983).

1 18 THE STATE AND BLJSINESS
By most objective standards, America's corporate giants have not performed very well over the last fifteen years. They have lost markets to the Japanese and the newly industrializing c�untries. They have lagged in innovation. The quality of their products has often been inferior and unreliable. And, taken together, America's five hundred largest industrial corporations have failed to generate a single new job since 1 970. ( 1986, p. xi)
These arguments about bigness miss the point. America's corporate giants may not have performed well over the last fifteen years, and they have certainly lost markets to Japan and to late-industrializing countries like Korea. Yet the economies of Japan and late-industrializing countries are also dominated by corporate giants. Economies of scope, moreover, may benefit one firm at the cost of another, but society at large can still benefit if size improves the international competitiveness of the aggrandizer. The point, therefore, is that nothing can be said a priori about the effect of bigness on performance. Instead, how well big business performs depends on how well it is coordinated and on the context in which it functions. '
In general, the chaebol's economic performance has been impressive even if its social effects have been sinister, the popular perception being that while the chaebol benefited from public subsidies, they have nOl shared their wealth (and their derived power) with the rest of society. In terms of economic performance, during the period from, say, 1962 through 1 979, the chaebol may not have maximized every possible source of efficiency or minimized every possible scrap of waste. Yet they never intended to. As profit-maximizing firms, their objective was to grow, not to pare costs to the bone. Korea has one of the highest investment rates in the world. In 1 983 the share of investment in GDP was 3 1 percent, a rate less than in Singapore, which reached a staggering 48%, but greater than in Japan (29%), India (2 1 %), Mexico ( 17%), and so on (see Table 5.2). Moreover, as output in Korea has increased, so, too, has productivity, contributing to the eradication of national unemployment and acute poverty. As already noted, Korean industry was productive enough to allow Korea's debtlGNP ratio to remain unchanged at the beginning and end of the Big Push into heavy industry, in 1973-1 979. And while international comparisons of productivity that include late industrializing countries are statistically problematic, the most careful attempts show Korea well in the lead. According to estimates of Chenery et al. ( 1986), total factor productivity as we�l as output grew faster in Korea's highly concentrated economy than in that of almost any other country studied.
We may take aggregate indicators of output, productivity, and investment as evidence for the time being of outstanding performance
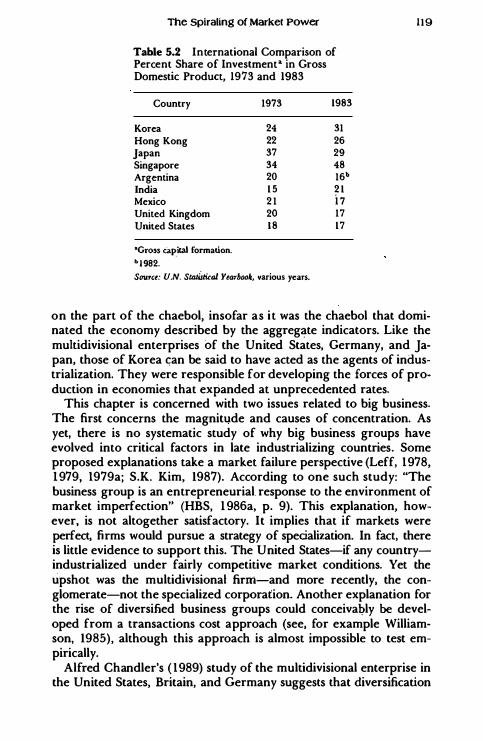
The Spiraling of Market power
Table 5.2 International Comparison of Percent Share of Investment' in Gross Domestic Product, 1973 and 1983
Country
Korea Hong Kong Japan Singapore Argentina India Mexico United Kingdom U niled States
'Gross tal'ital formation.
b1982.
1973
24 22 37 34 20 1 5 2 1 20 18
Source: U.N. Stmistit:al Yearbook, various years.
1983
31 26 29 48 16b 2 1 i 7 17 17
119
on the part of the chaebol, insofar as it was the chaebol that dominated the economy described by the aggregate indicators. Like the multidivisional enterprises of the United States, Germany, and Japan, those of Korea c;an be said to have acted as the agents of industrialization. They were responsible for developing the forces of production in economies that expanded at unprecedented rates.
This chapter is concerned with two issues related to big business. The first concerns the magnitude and causes of concentration. As yet, there is no systematic study of why big business groups have evolved into critical factors in late industrializing countries. Some proposed explanations take a market failure perspective (Leff, 1978, 1 979, 1979a; S.K. Kim, 1987). According to one such study: "The business group is an entrepreneurial. response to the environment of market imperfection" (HBS, 1 986a, p. 9). This explanation, however, is not altogether satisfactory. It implies that if markets were perfect, firms would pursue a strategy of specialization. In fact, there is little evidence to support this. The United States-if any countryindustrialized under fairly competitive market conditions. Yet the upshot was the multidivisional firm-and more recently, the conglomerate-not the specialized corporation. Another explanation for the rise of diversified business groups could conceivaQly be developed from a transactions cost approach (see, for example Williamson, 1985), although this approach is almost impossible to test empirically.
Alfred Chandler's ( 1989) study of the multidivisional enterprise in the United States, Britain, and Germany suggests that diversification

120 THE STATE AND BUSINESS
by business is an integral part of expansion whatever the country. We take this historical proposition as a starting point -for understanding the rise of the big business group in Korea. From this stylized fact two further questions arise which are the subject of speculation in the first part of this chapter: Why did the chaebol exceed most multidivisional firms in diversifying so broadly; and why, despite a high degree of diversification, does coordination appear tigh� ter in the chaebol than in, for instance, the American conglomerate?
The second major issue with which this chapter is concerned relates to discipline. As stated in Chapter 1 , a defining characteristic of Korean industrialization has been not merely support but also discipline of big business by the government. Yet discipline has by no means been flawless. In this chapter we wish to air some of the limitations. In particular, we wish to focus on the government's waning ability to control a particular type of business activity, whatever its ability to control the overall performance of business to produce goods and services efficiently. The particular type of business activity with which we are concerned is the one that typically is anticipated to arise from a high degree of market power: namely, monopolistic abuses such as creating scarcities, price gouging, and ruining smaller competitors. The time period with which we are especially concerned is the 1980s, following the assassination of Korea's iron-fisted ruler, Park Chung Hee. It was in this time period that the new military dictatorship adopted a policy of "liberalization", one intent of which was to mitigate monopolistic abuses by strengthening freer markets as a particular form of discipline over big. business.
MARKET CONCENTRATION
High levels of economic concentration exist in Korea at both the industry and the aggregate levels. Table 5.3 provides data on industry structure. The data ' for 1982 cover 2,260 commodities and suggest that only about 1 8% of all commodities that year, or 30% of all shipments, were produced under what are typically considered to be competitive conditions-that is, a three-firm concentration ratio. of less than 60% (or a combined market share of the top three produc: ers of less than 60%). The remainder of commodities was produced by either monopolies, duopoiies, or oligopolies (see Table 5.3 for definitions).
Table 5.3 also suggests that over time, the share of shipments produced under a competitive structure declined, while the share of the remainder of shipments shifted among the three types of noncompetitive market configurations_ Comparing 1982 with 1970, the percent share of shipments produced under monopolistic conditions in-

The Spiraling of Market Power 121
Table 5.3 Structure of Manufacturing Industry: 1970, 1977. and 1982
Year Monopoly Duopoly Oligopoly Competitive Total
1970 No. of 442 279 495 276 1 ,492 Commodities (29.6) (IS.2) (33.2) (I S.5) ( 100) (% share) Shipments" 1 10 204 43S 498 1 ,252 (% share) (8.S) ( 16.3) (35.1) (39.8) ( 100)
1977 No. of 667 425 674 343 2.2 19 Commodities (3 1.6) (20. 1 ) (32.0) ( 16.3) ( 100) (% share) Shipments" 2,264.0 1 ,536 4.7 16 5.404 13,920 (% share) ( 16.3) ( 1 1 .0) (33.9) (38.S) ( 100)
19S2 . No. of 533 25 1 1 ,071 405 2,260 Commodities (23.6) ( I l . l ) (47.4) ( 1 7.9) ( 100) (% share) Shipments· 5,649 3.275 24,967 15,4S 1 49,372 (% share) ( 1 1 .4) (6.6) (50.6) (3 1 .4) ( l 00)
·BilIion won.
Concentration ratios (CR): Monopoly (one-firm CR accounts for a market share of more thall 80%). Duopoly (two-firm CR accounts for a market share of more than 80%). Oligopoly (three-firm CR accounts for a market share of more thall 60%). Competitive (three-firm CR accounts for a market share of less than 60%).
Source: Compiled from the Census of Manufacturing data base; Economic Planning Board, by· K. U. Lee et aI., (1986).
creased (having peaked in 1977). Duopoly proved to be a nonviable arrangement, and its percent share of shipments decreased. The share accounted for by oligopoly. however, rose by 15 percentage points., from 35% in 1970 to over 50% in 1982.
Korean industry is even more highly concentrated than that of Jap,an. This is suggested in Table 5.4. which compares the average three-firm concentration ratios of Korea, Japan, and Taiwan (or the average shares of the top three producers in all manufacturing industries).5 Furthermore, in that higl1 degrees of concentration at the level of individual industries are complemented by ultrahigh degrees of concentration at the level of the entire manufacturing sector, the whole may even be greater than the sum of the parts. In short, Korea has acquired one of the world's most concentrated economies.
5 Nevertheless, Taiwan probably has a higher level of economic concentration than Korea in " upstream" industries like petrochemicals, shipbuilding, and steel, in which typically a government monopoly presides (Amsden. 1989).

122 THE STATE AND BUSINESS
Table 5.4 Comparison of Simple Average Three-Firm Concentration Ratios for Korea, Japan. and Taiwan
Country (year) Average share (percent) a
Korea (1981) Japan (1980) Taiwan ( 198 1 )
62.0 56.3 49.2
• Average share of top three producers in all manufacturing industries.
Source: K. W. Lee, et a!. (1986).
Measured by sales. the ten largest diversified business groups accounted for a phenomenal 67% of total sales in 1984 (see Table 5. 1 ) . Sales. of course, exaggerate the chaebol's share of manufacturing activity because they include inputs purchased from other firms. Nevertheless. concentration measures in terms of sales may give an accurate picture of the chaebol's command over the economy insofar as the development of a subcontracting system in Korea has rendered many of the chaebol's suppliers mere satellites (see Chapter 7). In terms of shipments. which are a close approximation of valueadded. the percentage accounted for by the chaebol is also impressive (see Table 5.5). In 1982 the top ten diversified business groups accounted for as much as 30.2% of manufacturing activity (but only 1 2.2% of employment).
Table 5.6 compares aggregate economic concentration measured
Table 5.5 Percent Change in Concentration of Economic Power of Business Groups." 1974-1982
Shipment Employment
1974 1977 1982 1974 1977
Top 5 business groups NA 15.7 22.6 NA 9. 1 Top 10 business groups NA . 2 1 .2 30.2 NA 12.5 Top 15 business groups NA 25.6 33.9 NA 14.4 Top 20 business groups 24.6 29.3 36.6 13.5 17.4 Top 25 business groups NA 3 1 .9 3S.8 NA 18.9 Top 30 business groups NA 34.1 40.7 NA 20.5
NA. not available .
• Manufacturing sector only.
1982
8.4 ' 12.2 14.5 1 6.0 17. 1 l S.6
Source: Compiled from the Census of Manufacturing �ta base, Economic Planning Board, as ciled in Lee et a!. (1986).

The Spiraling of Markel Power 123
Table 5.6 Percent Aggregate Concentration Rate by Shipment of the Largest Companies in Korea, Japan, and Taiwan,. 1970-1982
Korea Japan Taiwan
Year Top 50 Top 100 Top 100 Top 59 Top 1 00
1970 33.8 44.6 NA NA NA 1975 NA NA 28.4 15.8 2 1 .7 1977 35.0 44.9 NA 15.2 22.4 1980 NA NA 27.3 1 6.4 2 1 .9 1982 37.5 46.8 NA NA NA
NA. not available.
"Manufacturing sector only. It is unclear how company as distinct from 17usineu group is defined. Source: K. U. Lee et a\. ( 1986).
in shipments for the largest companies (not business groups) in Korea, Japan, an� Taiwan. Aggregate economic concentration is by far the highest in Korea. more than twice as high as in Taiwan and approximately 1 .7 times as high as in Japan.
Countries that �ave industrialized since the � 8805 share high aggregate economic concentration because huge firms tend to diversify. Chandler ( 1989) called such firms "modern industrial enterprises" and noted their synchronous emergence in the 1880s in the United States, the United Kingdom, and Germany. They emerged slightly later in Japan and considerably later in Korea because both countries industrialized later. We return again to Chandler's model of the mod'ern industrial enterprise because it provides a l;>enchmark to examine big business in late-industrializing countries. Here we are interested in one aspect of Chandler's model, the one that relates to diversification. For Chandler, diversification is a defining characteristic of the modern industrial enterprise, although there is considerable variation among the members of the family, which include the chaebol, zaibatsu, and American conglomerates. There is variation in the degree of diversification, measured roughly by the relat-
. edness of products and t�e degree of centralized management coordination, in terms of financial and human transfers among firms within a single corporate group. In the standard case, diversification tends to be restricted to related products. The firms that produce these products also tend to be centrally managed, as evidenced by the rise of managerial hierarchies-another defining characteristic of the modern industrial enterprise-and by the multidivisional organizational structure-still another. Thus, in a graph with degree of diversification on the vertical axis and degree of coordination (of both financial and human resources) on the horizontal, the modern in-

124
Degree 01 diversification (unrelatedness
of products)
+
THE STATE AND BUSINESS
American conglomerate Diversified business gro!.lpzaibatsu, chaebol
Modern industrial enterprise (with multidivisional structure)
+ Degree of coordination
(management of affiliates)
Figure 5.1 Degree of Diversification and Coordination of the Modern Industrial Enterprise.
dustrial enterprise falls in the lower right-hand corner (see Figure 5 . 1 ).
Although diversification in the United States has typically conformed to the pattern just noted�iversification into related products only, under fairly tight coordination-the United States has also been characterized by what has come to be called conglomeration. According to Chandler,
The large, diversified [modern industrial] enterprise had grown primarily by internal expansion-that is, by direct investment of plant and personnel in industries related to its original line of products. It moved into markets· where the managerial, technological, and marketing skills and resources of its organization gave it a competitive advantage. The conglomerate, on the other hand; expanded entirely by the acquisition of existing enterprises, and not by direct investment into its own plant and personnel, and it often did so in totally unrelated fields. ( 1 977, p. 48 1 )
Conglomerates are known to be coordinated to the degree that they have central budgeting. Nevertheless, there is little, if any, transfer of people across affiliates (Mueller, 1 982). In terms of Figure 5. 1,

The Spiraling of Market Power . 125
therefore, the conglomerate occupies the space in the . upper lefthand corner.
We come now to the diversified business groups in Korea and Japan. We note first that they are far from homogeneous, showing significant variations among themselves. The new and old zaibatsu differ in degree of diversification, and the prewar zaibatsu and postwar keiretsu differ in degree of coordination.6 Among the chaebol. too. there are variations in the extent of diversification, depending on the overall size of the business group. Moreover, the tendency of the chaebol bdore 1980 was to grow by internal investment; thereafter its tendency has been to grow by acquisition.7 These variations notwithstanding, there is a si�gle theme. The big business groups of both Korea and Japan are more diversified than the modern industrial enterprise described by Chandler. and they are more coordinated than the American conglomerate. Thus, in terms of Figure 5. 1 , the zaibatsu and the chaebol belong in the northeast quadrant, exhibiting high degrees of both diversification and coordination. This corporate structure---m.ore widely diversified than the motkrn industrial enterprise and more centrally coordinated than the conglomerate-appears ·
to be typical in late industrialization. Two questions follow: Why do business groups in late industrializing countries tend to diversify so widely, and how do they manage to stay closely coordinated?
CORPORATE STRATEGY TOWARD DIVERSIFICATION
As Chandler pointed out. whatever the national character of industrialization, whether driven by borrowing technology or by creating. it, large corporations diversify into related business activities-where related refers to skills or markets-through vertical or horizontal integration. In Korea. the Hyundai group branched out vertically from construction to cement manufacture and shipbuilding, and from shipbuilding to shipping and steel structures. The Samsung group diversified horizontally in entertainment with a broadcasting company, a daily 'newspaper, and a hotel. The Hanjin group includes tourism industry business--an airline. a bus line. and a travel agency.
6 See Hirschmeier and Yui ( 198 1 , pp. 1 32-42, 222-36. and 257-60). 7 From 198 1 . when the Fair Trade Act was passed, until June 1986. there were
1 , 136 reported cases of chaebol beginning to own new businesses. Among these the number of horizontal integrations (intraindustry) was 324 (28.5% of the total). that of vertical integrations was 2 1 5 ( 19.9%), and that of diversifications into other industries (interindustry) was 597 (52.6%). The methods of expansion included acquiring stocks. establishing new companies. merging, acquiring management participation. and acquiring business rights. Acquiring stocks accounted for 45.7% of all cases; establishing new companies accounted for 19.8% (Donga llbo, 1986).

126 .THE STATE AND BUSINESS
The KIA group makes vans and the machine tools that are used in their manufacture. The Doosan group makes bottling equipment and owns a bottling franchise. The impulse to diversify into related businesses is illustrated by a statement made by the chairman of the LuckyGoldstar group, which reported 1984 sales of $9.2 billion. According to the chairman,
My father and I started a cosmetic cream factory in the late 1940s. At the time, no company could supply us with plastic caps of adequate quality for cream jars, so we had to start a plastic business. Plastic caps alonc .. were not sufficient to run the plastic-molding plant, so we added combs, toothbrushes, and soap boxes. This plastics business also led us to manufacture electrical ' and electronic products and telecommunication equipment. The plastics business also took us into oil refining which needed a tanker-shipping company. The oil-refining company alone was paying an insurance premium amounting to more than half the total revenue of the then largest insurance company in Korea. Thus, an insurance company was started. This natural step-bystep evolution through related businesses resulted in the LuckyGoldstar group as we see it today. For the future, we will base our growth primarily on chemicals, energy, and electronics . . Our chemical business will continue to expand toward fine chemicals and genetic engineering while the electronics business will grow in the direction of semiconductor manufacturing, fiber optic telecommunications, and eventually, satellite telecommunications. (Harvard Business School, 1 985b)
The impulse to diversify into related businesses is illustrated by the lower right-hand corner of Figure 5. 1 , t!1e area occupied by the modern industrial enterprise, or multidivisIonal firm.
Nevertheless, after the initial mpve into related businesses, the extent of diversification among firms differs. In the case of innovators, , say those in the United States, the tendency has been to build on expertise, whether technological or marketing, and hence to diversify further only into related fields. On the other hand, in the case of firms with no expertise, for example those of late-industrializing countries, or of firms with expertise �hose rate of return is narrowly bounded, the tendency has been to diversify into unrelated areas.8 A large chaebol like Lucky-Goldstar has diversified in part because local in-
8 In the United States. diversification into unrelated businesses occurred mainly when industry growth dp.dined: "The creators of the first conglomerates embarked on strategies of unrelated acquisition when they realized that their own industries had little potential for continued growth" (Chandler, 1977: 4&1). Typical industries C'mploying this strategy were textiles and ocean shipping.

The Spiraling of Markel Power 127
puts were in short supply, and it needed to become its own supplier. In other cases market size was too small to specialize; or too risky to do so. The supposed relationship mentioned earlier between its plastic injection-molding operation and its oil refinery is farfetched. The so-named backbone of the group---chemicals (Lucky) and electronics (Goldstar)-is more like disconnected vertebrae.
Assuming an equal desire on the part of all firms to diffuse risk, the above suggests that quite possibly learners in late-industrializing countries tend to diversify widely because their level of experience in particular industries does not enable them to develop related products or processes, or to grow by moving into a higher quality niche in their existing markets. Instead, they are constrained to diversify widely and often to expand laterally. They compete on the basis of price and reliability at the bottom end and at the middle layers of many altogether unrelated markets. The choice between a competitive strategy of price versus one of high quality product differentiation is mused upon by the chairman of the Daewoo group, one of the most meteoric of chaebol and one that relied more than most on acquisitions in order to grow (because it started late) :
Up to the present, I have succeeded, to a certain degree, in building new businesses and increasing employment opportunities. I have. done this through hard work and by turning around troubled companies. I believe that these accomplishments demonstr<J.ted to the Korean people the possibility of succeeding with almost any business in Korea. Looking back, however, I feel I could have concentrated on developing a Korean company which producdd the best quality product in the world, rather than diversifying to various fields [wishful thinking?]. When we have spun off the present collection of companies [the chairman plans to free each of Daewoo's affiliated companies from equity control by the parent corporation by 1 990], I shall resign as chairman of Daewoo and ·start a new venture. And the product I am going to develop will be the best quality product in the world from Korea, like those of japan's Sony or Germany's Leica. (Harvard Business School, 1 985a; my italics)
One leaves as speculation the zaibatsu's and chaebol's location in the northeast quadrant .in Figure 5 . 1 as a function of their status as learners.
.
Diversifying widely is a big gamble, especially when diversifications occur in rapid successioQ as they did in most Korean business groups. How, then, did the chaebol manage to grow so fast and yet prosper?
First, as latecomers, they bought the industry-specific technical expertise they needed from foreigners. Second, they borrowed abr-oad

128 THE STATE AND BUSINESS
with credit guarantees and subsidies from the government. This helped them to grow very large, with high debt equity ratios, yet maintain their family ownership structure. By contrast, in the business histories of advanced countries, the family form of ownership is diluted for want of finance to grow. Third, as they grew, the chaebol's finances and status rose, and they were able to hire the most experienced salaried managers. Family firms in advanced countries have had much trouble recruiting the best salaried managers, who prefer to work for firms that are not owned by families so that their chances of rising to the top are greater. In Korea, promotion opportunities were greatest in the chaebol, the remainder of firms being even more family oriented.
Fourth, in the mid- 1980s most chaebol were still nurtured by firstgeneration owners who had personally witnessed their sales growth as it progressed from thousands to billions of dollars and who also held an intimate knowledge of the human resources of their entire group.9 As will be demonstrated in later chapters, a new subsidiary would most likely be established by a task force typically formed at the group level and comprising qualified managers, engineers, and even supervisors from existing companies within the group. In the case of Hyundai, for example, managers from its construction arm were transferred to its shipbuilding arm to aid in project management. Later, engineers from its shipbuilding arm, who had a knowledge of anticorrosion, were loaned to its automobile affiliate where a new paint operation was coming on stream. Such transfers increased the capability to diversify and were facilitated by a central "brain" and a uniform group culture. Within a very short time, therefore, the business groups in Korea were multiproduct yet still under family management, with salaried managers in command at the industry level and with a capability to enter new industries quickly.
Under conditions of rapid growth and a succession of diversifications and capacity expansions, Korean management appears to have accumulated experience in the areas of feasibility studies, task force formation, purchase of foreign technical assistance, training, equipment purchase, new plant design and construction, and operation start-up. This experience became an invaluable competitive asset in the absence of proprietary technology because it allowed the chaebol to be Korea's first movers in many industries. lnvestment costs were also kept to a minimum, which enabled new affiliates to start operations with a relatively light financial burden. This control over costs complemented the group strategy of competing in a wide range of industries on the basis of price.
9 See the study by Hattori ( 1 984-) on the family structure of the chaebol.

The Spiraling of Market Power 129
The group coordination pattern just described influenced the conduct of risk diffusion, which became more than simply a strategy of investing in unrelated industries. It meant shifting people and money around the group to increase the pr�babiIity that risk-diffusing projects would earn profits. It meant converting ailing acquisitions into moneymakers. Group coordination implied a more proactive approach to averting risk and financial loss. 10 In general, one may venture to guess that the ffToup's ability to enter new industries rapidly and cost effectively became a major economy of scope.
DISCIPLINE OF MONOPOLY POWER
Oligopolistic Competition
Korea's economy may be highly concentrated, but its leading firms appear to engage in intense competition with one another in overseas 'as well as in domestic markets. The. Economic Planning Board controls most prices, so only firins supplying differentiated products have a chance to compete on price. However, big business competes primarily on the basis of nonprice factors, as do oligopolists in other countries.
The specific non price factors that the chaebol compete on are characteristic of a particular type of oligopolist-the learner. First, learners compete to get additional favors and industrial licenses from the government. They do so by wining and dining bureaucrats, by preparing investment packages that meet planners' specifications, 'and by distinguishing themselves on the basis of their achievements (like introducing products novel to Korea, winning Korea's equivalent of the Deming Award for quality, exporting Korean-made steel to Japan and Korean-made cars to the United States, etc.). \I Second, they compete to get foreign technical licenses on the best terms from the
10 As of April I, 1987, 32 chaebol were reported to have 3.474 billion won in crossinvestments among their subsidiaries. Such investments amounted to 43.9% of their net assets (Maeil Kyiingje Sinmun, 1987a). I I For example, in the case of general trading companies (GTCs):
The government's primary objective in establish,iog Korean GTCs was to promote exports, and it has used all sorts of means to increase the ex ports of Korean GTCs. As a stick. the government annually increased the minimum requisite export amount that a Korean GTC must reach to' retain its GTC title, As a carrot, the government created a variety of prizes, citations, and medals. More important, it provided low-cost financing for each dollar exported, which often more than compensated for losses incurred in export transactions. These government measures, together with the competitive spirit of the management, encouraged Korean GTCs to vie fiercely against each other to increase the export amount. (D. S. Cho, 1987, p. 57) ,
.

130 THE STATE AND BUSINESS
foremost international firms. Third, they compete in the labor market for the best college recruits and the most experienced skilled craftspersons, supervisors, managers, and engineers (see the discussion in Chapter 8). Fourth, they compete in the marketplac;:e on the basis of quality and delivery. In the case of the automobile industry, domestic price is not a competitive factor because it is set by the government according to liter capacity. But the two major automobile companies compete-in the local market and abroad-on the basis of gas mileage, appearance, safety, service, and resale value (Amsden and Kim, 1 985a). The spirit of competition between the two major automobile makers is such that one of them does not allow anyone driving the other's car to enter its parking lot.
The likelihood of intense competition also rises in the presence of uncertainty and multiproduct oligopolists. When it is unclear which markets will grow the fastest, and when demand is rising rapidly in a number of markets, multiproduct oligopolies will be inclined to compete vigorously in all of them to maintain parity in terms of, say, sales at the group level. Overall size could be considered critical for raising finance, attracting the best labor, winning the most favorable foreign licenses, and so on. Parity is particularly important when group affiliates are subject to central coordination. If resources can be shifted throughout the group, higher profits in one market may improve
' competitiveness in all. Finally, when the government dispenses largesse according to criteria that are corrupt but performance oriented, competition becomes almost a certainty.
Countervailing Power
Government policy was almost completely in harmony with the strategy of the chaebol to grow through diversification. Yet a consequence was a spiraling of market power. To curb the "appalling power of mammoth enterprise," policies were first conceived in the spirit of democratic pluralism (Park, 1962, p. 228).
The ' intention to curb monopoly power by protecting the interests of diverse social groups (one interest group being small- and mediumsize firms) was articulated by Park when he still ruled by popular vote:
It is thought in many quarters, both capitalist and communist. that large-scale industries are unconditionally the best. But we cannot ignore the fact that there are many industrial fields where small and medium businesses may have independept domains. The present stagnation of these smaller businesses suggests they could be stimulated to increase their productivity through

The Spiraling of Markel power 131
prompted coordination of, management, and assistance rendered by the state and improvement of techniques, so that the income ratio of these businesses would not be less than that of the bigger enterprises. ( 1962, pp. 226-7)
With respect to consumers, Park wrote,
It is desirable that the state should give special attention to possible dangers to the public interest presented by some industries which face no competition to prevent their trespassing on the interests of the consumers. The state may grant some form of consumer groups a kind of admonitory voice over industrial operations. ( 1 962, p. 236) 12
Park even hinted at encouraging the growth of trade unions:
To protect against the mounting power of big enterprises, employes should be allowed, with the reasonable backing of the state, to have equality with management. Special measures should be worked out so that skilled laborers and others can utilize their creativity individually and collectively to contribute to the improvement of industry. By so doing, the state will be able to protect the interests of the employed and rally strongly the voluntary support of workers for the improvement and expansion of industry. ( 1962, p. 26)
However, none of these countervailing forces to big business ever gathered much strength under Park. Even when he pursued a strategy of socializing big business by pressllring leading companies to sell equity to the public, Korea's stock market remained moribund, and the chaebol remained closely held family concerns (see Chapter 4). 13
The frenzy of activity surrounding the building of heavy industry in the late 1970s characterized a shift in power toward big business, because as subsidies sweetened, restricting entry became more difficult. Takeovers in the 1980s of smaller firms by the chaebol became endemic. The newspapers were filled with exposes of monopolistic abuses. The crisis surrounding the second oil shock and President Park's assassination led to an attempt by the government of Chun Doo Hwan, therefore, to restructure and liberalize the economy.
12 Consumer advocacy groups are weak in Korea. as they are' in other late
industrializing countries. but see Sobija Poho Danche Hyopiiihoe (1987) and Tachan Chubu Kiillop Yonhaphoe (l987), ,
13 As late as "984, the Securities Supervisory Board was still attempting to upgrade the auditing and accounting practice� of firms'in order to strengthen the stock market (Chiinggwon Kamdogwon, 1984). The stock market only began to boom in the late 19805,

132 THE STATE AND BUSINESS
Restructuring
A period of restructuring app�ars to characterize most industrial expansions, each in its own form, for example, the merger movement at the turn of the century in the United States or the capacity reductions in Germany and Japan in the 19205. By compa'rison, the reorganization of heavy industry in Korea in 1979-1982 seems relatively superficial because only a few industries were permanently affected. After much delay, the shipping industry was rationalized by a drastic reduction in the number of firms from about sixty to fifteen (World Bank, 1987). 14 The heavy electrical equipment industry witnessed a merger of major chaebol (Hyosung, Kolon, and Ssangyong), as did the fertilizer industry. But another move in heavy electrical equipment was temporary-a nationalization that was soon rescinded, An attempt to reduce capacity in the automobile industry through merger was also short-lived and abortive. As the Korean and world economies recovered and prosperity returned (eventually even to fertilizers and petrochemical producers), restructuring became as redundant as capacity , had temporarily been. Restructuring was also limited in scope in the sense that the industries affected had accounted for only a small share 6f total .investments in the 1 9705. The machinery industry was the most vexed by excess capacity and by restructuring, yet the technology of adding capacity in the machinery sector is such that investments had accounted for only 1 0% of total investments during the Big Push (Y. C. Park, 1985, quoted in Amsden, 1987} . ' 5
The form that restructuring took under Chun Doo Hwan was in keeping with the spirit of state intervention practiced under Park Chung Hee (although the firms involved did not all acquiesce under Chun Doo Hwan). In exchange for the favors they' had received, the big firms were rounded up and forced to merge. The World Bank observed, "It is clear from these cases that government has bypassed
14 Reorganization of financially troubled firms had dragged on in the late 1980s, es.peciaUy in the shipping and construction industries, H. y, Song (1987) stressed ,the inequity of reorganization, since healthy firms are often forced to acquire ailing ones (and the taxpayer is forced to pay for all parties' mistakes), An article in Han'g;uk Ilbo (1986a) noted that reorganization resulted in higher levels of aggregate economic concentration. The government was reluctant to let ailing firms go bankrupt because commercial banks would have gone bankrupt simultaneously. In 1986 there were fifty-six firms under government reorganization (Donga Ilbo, 1986a).
15 The machinery industry is typically given as an example of the failure of state intervention. presumably because the industry suffered from excess capacity beginning in late 1979. Nevertheless, the troubles of the industry after 1979 were as much a function of the world recession and the "teething" associated with developing a skillintensive sector as they were a function of government blunders. By as early as 1986, the machineJ'y industry in Korea was booming. See Donga Ilbo, 1986b, 1 986c; Maeil Kyongje Sinmun, 1986b, 1986c.

The Spiraling of Markel Power ·· 133 ) / competitive solutions in most of its restructuring operations" (World Bank, 1987, vol. I , p. 50). On the other hand, American forms of regulation did not play a major role in restructuring. The enactment of a Monopoly Regulation and Fair Trade Act along the lines of American antitrust legislation appears to have been out of character and has not been vigorously enforced.
Although the number of corporations designated by the government as dominating their respective markets increased from 105 in 1981 to 216 in 1985, no more than to were accused of having abused their power. Out of 1 , 172 applications for "corporate integration," or horizontal merger, all but 2 were approved (K.-U. Lee et a!., 1986). The act, moreover, did not include a restrictive clause on conglomerate integration because "there was a concern that such policies would harm enterprises that had fallen on hard times since the recession beginning in 1979." Further, as expressed by Lee et aI. , "the problem of the concentration of economic power is very complicated and difficult to solve by the Monopoly Regulation Act alone" ( 1986) . 16
Instead of regulation, liberalization was the means by which the new military rulers and economic advisors hoped to discipline big business and reverse the institutional legacy of two decades of state controls. In this reversal they were aided by the World Bank, which supplied Korea with a restructuring loan. Liberalization was supported in bits and pieces by the Federation of Korean Industries, the mouthpiece for big business. Basically, big business wanted trade barriers to remain, except on agricultural goods, but it also wanted privatization and freedom from government controls in financial ' markets. I? At first, liberalization affected direct foreign investment, trade barriers, industrial licensing, state credit allocation, public enterprise, price supports, and price fixing. Ultimately, zeal was confined to two major areas-trade and finance. At U.S. prodding, the
16 For earlier studies of monopoly regulation in Korea, see K. U. Lee and Kim ( 1981); K. U. Lee ( 1 984); K. U. Lee and J. H. Lee (1 985); and K. U. Lee and S. S. Lee (1985) .
. 17 In 1987 the Federation of Korean Industries lobbied for fewer government controls. Its representatives complained that it took 530 days and sixty-two steps to establish a new firm. Firms allegedly had to spend 0.77% of sales (33.4% of profit) on "tax-like" expenditures (official contributions such as defense tithes, donations to government-related organizations, charities, etc.). The government, according to the Federation, regulates prices, production volumes, inventories, and labor-management relations (Han'guk Ilbo, 1 9a6b). The Federation of Korean Industries, along with four other federations representing business, wanted Korea's new constitution to minimize government interference. in the .economy [as well as to support infant and growth industries, to promote harmonious labor relations, and to deny labor the right to participate in management decision-making (Maeil Kymgje Sinmun, J986d)). There appears to be no study 011 industrial licensing in Korea, but for a review of government regulation of licensing, see Donga [Ibo ( 1987).

134 THE STATE AND BUSINESS
government liberalized imports; to compensate the chaebol, the government rewarded big business with freer financial markets.
Trade Liberalization
To assess the openness of Korean trade after liberalization is as hard as assessing godliness in a reformed heretic. As the World Bank pointed out,
the automatic approval concept-whereby import items are transferred from a restricted to a nonrestricted list-is imperfect: [It) suggests more openness than it actually measures because items so designated may still be sl,lbject to some other possible administrative review procedures, such as the Special Law mechanism. Thus, the conventional "AA ratio" is biased upwards. (World Bank, 1987, vol. 1, p. 63)
Nevertheless, the World Bank believed that Korea had, in fact, liberalized trade: "Korea's liberalization program is very much on track, and government merits unequivocal high marks for its effective implementation." ( 1 987, vol. 1 , p. 74)
The United States disagreed. It took a lively interest in the matter in 1987 by virtue of a $7 billion U.S. trade deficit with Korea, which simultaneously ran a $7 billion trade deficit with Japan. The U.S. government pressured the Korean government to liberalize imports, which Korea did only by increasing imports from Japan (Korea Traders Association, 1987; Amsden and Min, 1989). According to a U.S. Embassy report. the extent to which Korea liberalized was fictitious:
Use of the word "liberalization" in reference to Korea's shifting items off its restricted list is somewhat misleading in the first place. At the time of their "liberalization," duties on the 104 items "liberalized at U.S. request" averaged 33%, with none subject to duties of less than 20%, and many subject to duties of 30%, 40%. or 50%. Generally, other NTB's [nontariff barriers] (e.g., the rule that only Korean cosmetics manufacturers can import cosmetics) remained in place. ( 1986, p. 3)
Besides. of the 104 items that both sides agreed were "liberalized," the total value, according to the U.S. Embassy, was only 6% of the f?owth in Korean exports to the United Stat!'!s in a three-year period.
Financial Liberalization
In exchange for whatever trade liberalization actually occurred, the big business groups won critical concessions from the government in

The Spiraling of Market power 135
the area of finance. (The United States also px:essured Korea to liberalize its financial system.) First, the government reduced regulation of nonbank financial intermediaries (NBFls), · many of which had long been controlled by the big business. groups. [According to one study, the chaebol had "controlling interest in some NBFIs such as insurance companies and investment and finance companies" (Y. J. Cho and Cole, 1986, p. 14).] As a consequence of deregulation, the share of total deposit liabilities held by NBFls increased from 27% in 1 980 to 42% at the end of 1984 (Ministry of Finance, quoted in World Bank, 1987, vol. 1 , p. 89). Second, the government began to denationalize commercial banks in 1981 by divesting its shares. It also restricted single shareholders of nationwide commercial banks (except for joint venture banks) to 8% of total ownership, to prevent the banking industry from being controlled by big business groups.
Shortly thereafter, it became clear that the government had by no means altogether relinquished administrative control over the ban�� ing system. 18 It had also become clear that the big business groups had not been prevented from taking equity control. Cho and Cole remarked in a footnote in their study of financial liberalization : 19
While an effort was made to limit concentration of ownership by the private purchasers of these shares, it is widely believed that the large conglomerate groups . . . succeeded in gaining control of individ ual banks. ( 1986, p. 14f)
.
With increased deposits in the nonbank financialintermediaries under chaebol ownership, and with their new major interests in national banks, the Korean big business groups became more like the zaibatsu. They also became more liquid. They used their new financial resources for at least two purposes: to buy state enterprises that were being privatized and to buy financially troubled firms, sometimes at the gov�rnment's instigation.2o One group, Sunkyong, was catapulted into the league of the Big Ten chaebol as a result of the privatization of a public oil refinery. In the 19805, the chaebol grew almost exclusively through acquisitions (S. K. Kim, 1987).
The result of such buyouts was a rise in economic concentration.
18 According to the World Bank. "Government still has strong leverage over firms, primarily because financial liberalization has not yet produced real banking autonomy" (World Bank. 1987. mimeo. vol. 2. p. 82).
19 Son ( 1987) discussed how the chaebol circumvented legislation to limit their holdings of bank equity to not more than 8%. Son also gave figures on the extent of private ownership of m�or commercial banks. local banks. life insurance companies. and securities firms.
20 For example. the government forced the Ssangyong group to acquire a bankruPl textile-machinery manufacturing company employing about 400 workers in the interests of preserving the textile machinery indus.try in KOI:ea. ,

136 THE STATE AND BUSINESS
As indicated in Table 5.3, the relative value of shipmel).ts produced under competitive market conditions declined between 1977 and 1982, whereas it had held fairly steady throughout the rise of heavy industry in the 1970s.21 The increase in concentration was especially sharp at the aggregate level. As Table 5. 1 indicates, the share of manufacturing output of the largest business groups rose from 32.8% in 1979, the year of the second energy crisis and the end of the Big Push, to 67.4% in 1984. This increase in aggregate concentration was about the same in percentage points as between 1974 and 1979, when one would have expected concentration to rise as a consequence of capitalintensive investments. LiberaLization, therefore, contributed to a rise, not to a decline, in economic concentration. Nor should this have been unexpected. It is difficult to achieve equity through market forces in the presence of large agglomerations of economic power.
CONCLUSION
The big business groups in Korea were the product of a harmony of interests between . the state and private enterprise. Priv<ite busi�ess groups, driven by what may have been a lack of technological capability to expand into higher quality niches. diversified widely into the bottom end and middle level of many markets; fairly dose coordination of financial and labor flows among group members allowed this. The state supported such diversification because it promised to provide the clout necessary for Korea to penetrate deep into world markets and to compete against the big business groups of Japan (which provided a model that the Korean president consciously followed). Such harmony has stood at the heart of "Korea, Inc."
By the mid 1980s, the top ten chaebol accoun�ed for almost 70% of GNP, yet out of the interstices of ultra high aggregate economic concentration has come rapid increases in GNP and productivity. As noted in earlier chapters, productivity rose against a · backdrop. of government discipline of big business, in the form of pressures to export, price cQntrols, restrictions on capacity expansions and entry into certain markets. prohibitions on sending speculative capital overseas, and sweeping financial controls. An additional backdrop to rising productivity was provided by competition, which was stimulated by fast growth, rivalry among the big business groups, and oligopoly rather than monopoly at the industry level. Learners-cumoligopolists competed for governme.nt favors, the most favorable foreign licenses, and the best managers, engineers, and workers.
In the 1980s, however, the government's forcefulness and .credi-21 it is unlikely that the rise in concentration between 1977 and 1982 was confined
to 1978. the year before stabilization and liberalization began.

The Spiraling of Market Power 137
bility declined and the private business groups augmented their power, prompting popular demands for reform. The response on the part of the government of Chun Doo Hwan was market " liberalization."
Nevertheless, big business grew even bigger and concentration increased further as a result of liberalization measures in Korea. As indicated in Table 5 . 1 , aggregate economic concentration doubled in less than five years after liberalization was introduced in 1979. The ownership (if not the control) of commercial banks fell from government hands- into those of the private sector. As the World Bank observed in a footnote in one of its reports: "There are, perhaps surprisingly, some similarities between Korea's and Chile's reforms. In both cases, big conglomerates bought major intere'sts in the national banks" ( 1987, p. 82f).
In the presence of large concentrations of market power, reliance on the market mechanism for reform appears to produce some perverse results, not just in Latin America but also in the Far East.


CHAPTER SIX
Getting Relative Prices "Wrong": A Summary
FAILURE OF THE MARKET PARADIGM
Korea is an example of a country that grew very fast and yet violated the. canons of conventional economic wisdom. There are many ways t!l analyze industrial expansi�,-.but-mo.st can be g!'EHR�� into one of two grand approaches-market oriented or institutiongCHt is well recognized among economis'fs·�lhar·tlie·maryei::-Or1ented approach represents a coherent body of economic "laws" or tendencies. Although these laws have largely been formulated to explain resource allocation or economic efficiency, rather than economic growth, they are considered sufficiently dynamic to analyze. industrial expansion. So deep is the belief in the explanatory power of these laws, so firmly held the conviction that if, and only if, they are free to operate will industrial expansion succeed, that any departure from them, whether in theory or practice, tends to be discredited, .dismissed, disregarded, or disbelieved. If industrial expansion succeeds, success is typically interpreted as being a validation of market principles and the institutions financially supporting them. If it fails, failure is seen as a result of the violation of market principles, perpetrated by perverse institutions.
.
In Korea, instead of the market mechanism allocating resources and guiding private entrepreneurship, the government made most of the pivotal investment decisions. Instead of firms operating in a: competitive market structure, they each operated with an extraordinary degree <>f market contro!; protected from foreign competition. Nevertheless; most economists who recognize these realities greet them ; with an unfailing faith in market laws. They suppose that while state \ interference in Korea is pervasive, the economy operates with a set of relative prices that is not greatly distorted. In fact, ·Iittle evidence, supports this presumption. As was explained in Chapter I and illustrated in Chapter 3, not only has Korea not gotten relative prices right, it has deliberately gotten them "wrong."
139

140 THE STATE AND BUSINESS
�o� is Korea an isolated case. I t is part of a general group of countries that I have termed late indwlrializers. These are countries that either just before or during the twentieth century began to grow from agricultural economies to industrial ones at what are now considered to be rapid rates. In Asia, the group includes Japan, Korea, and Taiwan (although not the city-states of Hong Kong and Singapore, which never transformed themselves from an agrarian basel� Beyond Asia, other late industrializers are Brazil, Turkey, India, Mexico, and possibly Argentina. There is, of course, disparity in the
. economic record even among them, and what makes Korea espe-cially interesting is its sterling performance. Just as their growth rates differ, so do the institutions of these emulating countries. Nevertheless, in broad respects the institutions of late industrializers have ex: hibited the same central tendencies, to the extent that an economiC paradigm can ' be identified that is institutional in character and categorically distinct from the market model. It is suggested here, therefore, that the economies of these late-industrializing countries behave according to economic laws that constitute a new paradigm.
THE INSUFFICIENCY OF THE SCHUMPETERIAN ALTERNATIVE
There is nothing unique in offering an alternative to the venerable market model. The Schumpeterian view of industrial expansion is one such alternative, and it has commanded the respect of many economists to the degree that it is regarded by them as more than an appendage to traditional theory. Nevertheless, the Schumpeterian world view pertains .to a set of socioeconomic conditions that originated in the Second Industrial Revolution. It was these historically specific conditions that inspired Schum peter's ideas. These conditions were defined by the rise of the modern industrial enter-
. prise-what Chandler calls the multidivisional firm--operating largescale plants on the basis of managerial hierarchies. Simultaneously, the conditions included a transition from invention, which is definedhere as the haiImark of the Fi��t
-I-;'-d;Jstiial Revoliiti6n;' t� '-
innovalion. defined here as the hallmark of the Sec()nd� At the, . time "Scniimpeter was Writi'ng; fechniCal ciiscovedes h�d -cea�eci to be the property of individual inventors owning and managing small-scale firms and had begun to be commercialized on a massive scale by big business.
Late industrialization shares some of the conditions of industrialization in Schum peter's period. It is also characterized by multidivisional firms operating large-scale plants on the basis of managerial hierarchies. Furthermore, big business, although organizationally

Getting Relalive Prices ·Wrong" 141
distinct, is no less the dominant force that it was in the economiC expansions that rocked Germany and the United States starting in the 1880s. However, what is conspicuously absent from late industrialization is innovation. Late industrialization, as defined in the foregoing chapters, is devoid of innovation and occlirs on the basis of learning. Learning involves bor'rowing, adapting, and improving upon foreign designs. The Schumpeterian model provides insights into the process of late industrialization, but it cannot penetrate a process of industrial expansioI:! in which the dynamic of new technical discoveries is missing. Thus, while there is nothing unique in offering an alternative to the venerable market model, the alternative that is offered here to explain late industrialization differs from any offered before.
THE HISTORICAL RECORD: DELIBERATELY GETTING RELATIVE PRICES "WRONG"
In honor of one crucial difference between the two paradigms-the ' market oriented and the institutional-Qne may use the terms marhet conforming and marltet augmenting to describe their respective overarching policies. In the context of late industrialization, market conformance refers to the minimum amount of government intervention necessary to get relative prices right. In "backward" countries some government intervention is believed to be necessary to correct existing market distortions, and proponents of the traditional view hold such distortions responsible for the delay in grOWth. The government is supposed to intervene only to liberalize markets from its own controls. Thus, Korea's economic success is attributed to a series of liberalizations introduced just prior to "takeoff." In or around 1965, the Korean won was devalued, interest rates were raised, tariffs were lowered, and taxes were increased (similar reforms were introduced in Taiwan).
As Fischer has noted, "A big event must have big results, we think. But this is the fallacy of identity" (1970, p. 223). The view that growth followed liberalization is based on such a fallacy. The events como"� prising liberalization occurred, but in conjunction with other polio, cies, so that the logic driving Korean industrialization was not th� , freeing of markets. The historical record looks different depending on which paradigm one chooses. The historical interpretation set out in the foregoing chapters is the one that is summarized, below.
The histories of late-industrializing countries differ. Those of Ja- . pan and Korea, for example, differ to the degree that one was the other's colony; But even among former colonies, there are differ-

142 THE STATE AND BUSINESS
ences. The involuntary "modernization" of Korea by Japan, although subject to exaggeration, has possibly given Korea an edge over other backward countries in terms of physical infrastructure in basic industry. Nevertheless, all late-industrializing countries that are former colonies tend to share the characteristic of a long history during which their economies were subject to free trade and to the pursuit of static comparative advantage, usually agricultural. From this perspective, the delay in growth in late-industrializing countries arose not from distorted prices but rather from the exemplary play of market forces. Growth began to accelerate when the central authority, once too weak to defend itself against foreign aggression, be- . came strong enough to mediate market forces to advantage. In Ko� rea, this transformation from weak state to strong state took almost a century. At the end of that period, and of foreign rule, South Korea had been separated from its northern half and was soon ruled by an oversized army, both the consequences of the Cold War.
Come the 1950s, Korea benefited from U.S. aid, even though most of it was designated for consumption and the aid designated for projects was subject to poor administration on both sides. The Ko- . rean economy was also routinely subject to interference from U.S. I aid advisors, who put stability before growth when a century of Ko� rean history suggested the precondition of growth for stability. The military government that seized power in a coup in May 196 1 , therefore, inherited a depressed economy, pardy as a consequence of tough stabilization measures imposed in the late 19505. The new government began by nationalizing all banks-aid advisors having persuaded Syngnian Rhee to denationalize the banking system in the 1950s-and introducing emergency measures to stimulate the economy. These measures rekindled inflation (to around 30%) and were hostilely received by the aid administration. The liberalization reforms may be seen as an appeasement in reaction to threats by aid advisors to withhold food assistance until Korea deflated.
This period in Korea's history has been mined for information on the origins of Korea's economic miracle. Few studies, however, have descended to the industry level where more detailed information exists. In Chaptet 3, we examined this period in Korea's history through the lens of its leading sector, cotton spinning and weaving.
In this industry one sees what for Korea at the time were integrated, large-scale firms employing management techniques that were modern by the standards of other industries. Firms were organized into a cartel that wielded substantial political power. However, in the early 1960s, the industry was suffering from excess capacity, not necessarily because import substitution had outgrown its "easy" stage

Getting Relative Prices ·Wrong" 143
but because most textiles firms had built excess capacity to take ad- i vantage of subsidized U .S. aid-related loans in the 19505. " . J
An analysis of the cotton textile industry sheds light on some longstanding debates in development economics. One debate relates to the role that aid advisors and the Bretton Woods institutions played in persuading Korea (and Taiwan) to orient their economies toward what were considered to be more market-conforming export activity. In this regard, it is noteworthy that cotton spinners and weavers were prohibited by U.S . .law from exporting until the mid-1960s. Congress did not want countries receiving U.S. -subsidized raw cotton to export cotton products. Thus, .the United States can hardly be credited with consistent support of export-oriented growth.
Another debate relates to the market-conforming paradigm, which says that countries need only get relative prices right and follow their comparative advantage in order to export. Pre-World War 11 history provides no example of an emulator that used relatively low wages as the exclusive entree into world markets. Neither Germany nor the United States overtook Britain on such a footing. They overtook it on the basis of superior technology and organization. As for Japan, it invaded Lancashire's markets for textiles in the 1920s on the basis of better trading companies to procure raw cotton, more modern equipment. and a more integrated process flow, as well as on the basis of lower wages. Beginning with Korea and Taiwan, lateindustrializing countries were the first to attempt to penetrate world export markets with little more competitive advantage than low wages. As such, they represented a truly new international economic order.
However, analysis of Korean cotton-spinning and weaving firms suggests that they found low wages insufficient as a basis on which to compete against Japan. Even in a relatively labor-intensive industry like cotton textiles, which indisputably gave the comparative adyantage to low-wage. "backward" countries, firms appear to have re.quired subsidies to begin to compete in world markets. The Korean government offered generous subsidies to stimulate exports, including subsidized long-term loans to targeted industries and firms that . are not included in calculations of the "effective exchange rate." This rate, therefore, understates the true degree of government support. The Korean government offered generous subsidies first as a response to the political demands of the spinners' and weavers' cartel, later as an article of faith in an industrialization strategy.
The subsidy serves as a symbol of late industrialization, not just in . Korea and Taiwan but also in Japan, .the Latin American countries, . 'and so on. The First Industrial Revolution was built on laissez-faire, the Second on infant industry protection. In late industrialization,

144 THE STATE AND BUSINESS
the foundation is the subsidy-which includes both prot�ction and financial incentives. The allocation of subsidies has rendered the ' government not merely a banker, as Gerschenkron ( 1962) conceived it. but an entrepreneur, using the subsidy to decide what, when, and how much to produce. The subsidy has also changed the process whereby relative prices are determined.
Industrial expansion depends on savings and investment, but in "backward" countries especially, savings and investment are in con-. flict over the ideal interest rate. high in one case, low in the other. In Korea and other late-industrializing countries, this conflict h�s been mediated by the subsidy. Throughout most of the twenty-five years of Korean industrial expansion, ·long-term credit has ' been allocated by the government to selected firms at negative real interest rates in order to stimulate specific industries. The high real interestrate policy that started in 1965-in the spirit of liberalization--ended in 1 972 with a return to low real interest rates. However. even duri�g those seven years, domestic savings were never sufficient to meet investment demand. The government, therefore, armnged long-term international credit for favored firms at rates far below those obtainable domestically. Thus, the government est(l.blished multiple prices for loans, only one of which could possibly have been "right" according to the law of supply and demand. Moreover, the most criticalprice-that for long-term credit-was wildly "wrong" in a capitalscarce country. its real price, .due to inflation. being negative. l
As for the foreign exchange rate, another key relative price in economic expansion, it has also been deliberately distorted by late industl'ializers. which need a high rate to export and a low rate to repay foreign debt and to import raw materials and producer goods that cannot yet be produced domestically. In Korea, exchange rates were not grossly distorted, but they did succeed in stimulating exports only when they operated in conjunction with other policies. Exports have been heavily subsidized and coerced, so inside the range of reasonableness. the relative, price of foreign exchange has been altogether irrelevant. According to a survey of exporters in the mid;-1970s that was conducted under the aegis of the World Bank, over half of the respondents claimed that export quotas had a negative overall effect on their firms. Exporters, however, were compensated for having to export by being allowed to sell in the domestic market
I Multiple exchange rates and multiple interest rates are possible, in principle, in the neoclassical general equilibrium model (see Arrow and Hahn, 1971). The strictures in the text. however, are directed against the IMF's and World Bank's policy prescriptions in which multiple interest rates and exchange rates are anathema. and which insist on a single, unique exchange rate or interest rate, presumably on the ground that this is the "equilibrium" rate.
.

Gelling Relative Prices ·Wrong" 145
at inflated prices. Such prices were distorted due to protection. Thus, tariff barri�rs and nontariff barriers have comprised a key ingredient in Korea's industrial policy. Even imports "liberalized" in the mid-1980s are subject to an average tariff rate that may approximate 30%.
WHEN "WRONG" IS RIGHT
Although Korea industrialized on the basis of relative prices that deviated sharply from free-market equilibria, such prices were less "distoJ'!:ed" and provided big business with fewer bonanzas than prices in India, Turkey, and the Latin American late-industrializing countries. Why?
If one believes that Korea began to grow rapidly in the 1960s as a result of "liberalization," then its adoption of relatively freer prices must be attributed to an embrace of market theory by Korean policymakers, coached by foreign experts. Yet an examination of cottoo textiles suggested that the policy regime that Korea eventually adopted evolved out of a complex process in which the interests of opposing groups were reconciled, not out of theoretical conviction. One dimension of this conflict was a .strong enough government to impose performance standards on the interest groups receiving public support. The insis�ence on performance standards by the government: induced a level of productivity, and willingness to invest on the parti' of the private sector, that made greater price "distortions" unneces-i: sary, and the ample price "distortions" that did exist more effective.i'
Therefore, it may be said that growth has been faster in Korea not because markets have been allowed to operate more freely but because the subsidization process has been qualitatively superior: recip-rocal in Korea, unidirectional · in most other cases.
.
THE DISCIPLINARY MECHANISM
Economic paradigms are largely defined by th�- 'internal mechanism that is built into them to exert discipline over firm behavior. In the case of the market paradigm, discipline is dispensed by the invisible hand. With the subsequent erosion of competitive market structures that were consistent with the market paradigm, Schumpeter analyzed a new basis for competition, a new mechanism to discipline firm behavior. He recognized such a disciplinarian in technological change. It was the creative gales of new technological discoveries that uprooted old monopolies and increased productivity, not steadily but in great spurts.
There is no mechanism in the market-augmenting paradigm that

146 THE STATE AND BUSINESS
is equivalent to the invisible hand or to technological change. To the extent that oligopolists the world over compete, oligopolists in lateindustrializing countries also compete, although the dimensions that they compete along relate to their status as learners. However, there is no neat mechanism in the market-augmenting paradigm that can be relied on to drive firms to be productive, because growth itself does not happen automatically. Growth in late-industrializing countries depends on government intervention to augment supply and · demand.
Few aspiring emulators of the Korean expansion appreciate just how diverse subsidies have been, just how pervasive protection is, and just how encouraging government support continues to be in Korea, including bailouts and expansionary rather than contractionary policies in times of external shock (see the discussion in Chapter 4). With such discretionary power under the control of mere mortals, two questions arise: What mechanism will discipline subsidy recipients? And no less pertinent, What mechanism will discipline the donor of subsidies, the awesome state itself?
All paradigms have their hidden premises, a large number of firms confronting one another in the same industry in the case of the market-conforming paradigm, an undulating stream of new technological discoveries in the case of Schum peter's. Although the marketaugmenting paradigm does not have an automatic disciplinary device, it nonetheless has a premise on which industrial expansion depends. The premise of late industrialization is a reciprocal relation between the state and the firm. This does not simply mean close cooperation, which is sometimes the way business-government relations in Korea and Japan are simplistically depicted. Nor, does it simply mean that sometimes the government wields the carrot and at other, unrelated times, the stick. It means that in direct exchange for subsidies, the state exacts certain performance standards from firms. The more reciprocity that characterizes state-firm relations in these countries, the higher the speed of economic growth.
Reciprocity in Korea was in no way free of corruption. No business in Korea could survive for the past forty years if it challenged the government politically. None could make it big if it did not support the government financially. Yet for all the venality, the evidence presented in later chapters suggests that beginning in the 19605, the government's favorite pets-the big business groups that came to account for so large a share of GNP-were outstanding performers
/fr()m .,the production and operations perspective. What with export ; . ,�a!get�-an objective, transpa��':tL�riterion by which firm perfor
mance is easily judged-;::-priCe controls, restrictions on capacity expansions, limits on market- entry, prohibitions on capital flight, re-

Gelling Relative Prices ·Wrong" 147
�'!ip.!�_ on tax evasion, and government control over the banking system, the big business groups had to deliver.
The presence of discipline in Korea and its absence elsewhere does not reflect differential abilities among policymakers. It reflects differences in state power. The state in Korea was able to consolidate its strength with respect to both business and labor for what appear to be historical reasons. In the early 1960s there were no financiers to challenge the government's power because the state-owned bariking system of the colonial period was renationalized; the business community was as weak as the financial community and beholden to the state for largesse; the working classes were small in number; and the countryside, .through a land reform, was devoid of large landholders. I n other late-industrializing countries such landholders challenge the state's authority or seduce it into rent-seeking. It is no ' coincidence that growth has been especially fast in Japan, Korea, and Taiwan, countries which all have reciprocal subsidy systems and which all have had land reforms.
Finally, it bears emphasizing that Korea has g'row'n very rapidly and has done so on the basis of nationally owned firms. Even the first liberalization that the Korean economy underwent-in the mid-1960s-was notable for its omission of market-conforming measures that would have allowed an inflow of direct foreign investment. Korea, at the time, was too fearful of Japanese compe�ition to open its doors to foreign equity ownership. There are fewer multinationals in Korea than in almost any other late-industrializing country, possibly even I ndia. This has almost certainly made it easier for the state to discipline private sector firms, not least of all in the buildup of a domestic science and technology capability.
DEVELOPMENT ALlSM: A RESEARCH AGENDA
1.t is frustrating to model builders in "backward" countries to learn that Korea's succeSs rests heavily on a strong state (one that is capable of implemeriting its own policies). It is frustrating because countries are "backward" mostly because their state is weak , an argument taken up in the first two chapters. The beauty of the market-conforming paradigm supposedly lies in its minimalist requirements of state activity. In principle, it promises industrial expansion if the state is strong enough merely to provide enough political stability for longterm investments, to point prices in the right direction, and then to exit.
Nevertheless, it would be altogether ahistorical to think that getting relative prices "right" requires any less strength on the state's part than getting them "wrong." "Backward" countries in search of

148 THE STATE AND BUSINESS
!l model to guide them do not present themselves as a tabula rasa. They have entrenched interest groups that would be hurt if relative prices were "freed" of distortions. Devaluations hurt firms by raising the cost of imported inputs. Upward adjustments in interest rates hurt iiwestors. Equating of revenues and expenditures in the government budget threatens the livelihood of social welfare recipients, and so on. Whether one attributes the acceleration of growth in Taiwan and Korea to getting relative prices right or wrong, either outcome required strong state management. which is precisely what ' "backward" countries lack.
T\1.e policies that comprise the market-augmenting paradigm are heterogeneous, in keeping with the diverse tasks that states must perform to accelerate growth. In "backward" countries, the level of international competition, the technology gap, the investment barriers and savings deficiencies, are all so problematic. that; without government intervention, little ever gets done to address these hur- ' dies. The art is to get something done with intervention. A strong state is as dysfunctional as a weak one if it uses its power only to enrich itself. What, then, will discipline the state?
A disciplined (or developmental) state refers to one that advances capital rather than accumulating it, or at least does not allow its own enrichment to derail the development effort, as in Korea. The rise of developlJlentalism, as well as the relationship between it and democracy, eludes easy explanation (unenlightened much by the classical economists who focused on "rent-seeking" by private business, not the state). External threat. militarism, and few raw materials may have predisposed the Korean and Taiwan states to industrialize, but a state like Chiang Kai-Shek's refused to spend a dime on economic development until Taiwan demonstrated its economic potential (and retaking the Mainland proved fanciful) ' (Amsden, 1985). What remains to be analyzed in Korea's case is why. led by the student movement, the population has revolted at a low threshold of tolerance against states that overly abuse their power.
The relationship between developmental ism and democracy is complex, because reciprocity in the allocation of subsidies requires a strong state vis a vis business. not necessarily labor. What awaits systematic analysis is how much labor repression is critical for rapid growth. This question is intriguing in Korea's case because, as discussed in Chapter 8, average real wages have risen faster in ,Korea than in all other late-, and possibly earlier, industrializing countries.

Getting Re[atlve Prices "Wrong"
COMPETITION IN LATE INDUSTRIALIZATION AND THE GROWTH DYNAMIC
[49
Partly as a consequence of the theorocentric interpretations that many Western economists gave of Japanese economic growth, recognition of a unique economic paradigm in late industrialization was slow in coming. A major study undertaken by Kazushi Ohkawa and Henry Rosovsky was reasonable enough in its objective: "To fit japan's experience into an historical growth model of the type familiar to economists" ( 1973, p. 1) . A volume on "Asia's new giant," edited for the Brookings Institution, went further: "We gently suggest that Japanese growth was not miraculous: it can be reasonably well understood 'and explained by ordinary economic causes".J:P.il�rkk._and R9!�sky, 1976, p. 6; my italics) . A spin-off-fromUl'e--Brookings study went" �ven f�rther . . After noting th{oli�opolistic �!�c:t,ic�uJl�_Japanese mdustnal pohcy had encouraged;-it--conchrdeo : "We cannot detect any compensating gains" (Caves and Uekusa, 1976, p. 157) . The message was that Japan might have grown even faster had it conformed to the market model. Yet this message is doctrinaire and misleading-the former because there is no evidence that Japan could have performed better had it allowed the free play of market forces; the' latter because there is no evidence that free market forces could hav� achieved what Japan achieved.
Recognition that japan's political economy was different from that inherited from either the First or Second Industrial Revolutions came from a political scientist, Chalmers Johnson, who wrote a history of MITI ( 1 982). Johnson, however, explored japan's uniqueness from the political angle and saw the economic side of political economy as mer�ly-eo!lfoqp.iQg to the traditional market norms.2 UnderstandabJY-'lmpervious �9 the issue of whether Japan had gotten r�lative prices right or-wrong, Johnsori associated market conformance with productivity and competition:
The third element of the [Japanese] model is the perfection of market�conforming methods of state intervention in the economy. hi implementing its industrial policy, the state must take care to preserve competition to as high a degree as is compatible with its priorities . . . . One dear lesson from the Japanese case is that the state needs the market, a�c! priva�e._e.m�rprise needs the state; OIlce both sides-recognfzed this, cooperation was possible, and high-speed growth occurred. ( 1982, p. 3 1 8)
2 But see Johnson (1988) on th� obtus�ness of economists regarding the realities of Japan's politica[ economy.

150 TI-IE STATE AND BUSINESS
What Johnson took as evidence of market conformance was an industrial-licensing policy that favored oligopoly over monopoly. In Korea, too, most markets are oligopolistic rather than monopolistic (in terms of both shipments and number of commodities), few taking the extreme of either a single seller or of many. From this perspective, the relationship between the market-augmenting and marketconforming paradigms is complementary (see Table 5.3).
Nevertheless, one need not understand competition and produc..: tivity in late-industrializing countries in terms of industry structure. One may understand more about them in terms of lateness. In fact, markets in most advanced countries are oligopolistic. Competition in these countries, however, may be less intense than in Japan or Korea. One must, therefore, probe deeper than industry-level market structure to comprehend the competitive behavior of Japanese and Korean oligopolists. When one does, one recognizes the existence of a distinctive firm structure-the diversified business group-and a distinctive growth dynamic-that of cumulative causality between productivity and output.
The market-augmenting paradigm of late industrialization may now be extended as follows, by way of summarizing the discussion in Chapters 4 and 5 . The government initiates growth by using the subsidy to distort relative prices. Then big business implements state policy. The role of small firms varies by industry, but basically the process of industrialization through learning involves the subordination of small firms to large ones in subcontractual relationships (until a turning point is reached when the state begins to support small-scale firms in the hopes of stimulating innovation). Oligopoly at the industry level and high aggregate economic concentration equip leading firms with the market power to survive the hardships of late entry. Two behavioral patterns are associated with high concentration in the learning context. First, once growth gets underway, there is little reason for the big business groups to collude and every reason for them to compete in a wide array of industries in order to maintain parity with one another in their overall size. Competition tends to be a consequence of growth, not a cause of it. Second, high concentration permits high rates of investment embodying foreign technology, the realization of scale economies, and the cumulation of output in a small subset of firms, thereby facilitating learning-by-doing. Growth contains the seeds to increase productivity, and increased productivity raises output further in an upward spiral.
To understand variations in growth rates among late-industrializing countries, therefore, one must explore two key institutions: the reciprocity between big business and the state (as discussed earlier);

Getting Relative Prices 'wrong" lSI
and the internal and external behavior of the diversified business group, as summarized below.
THE DIVERSIFIED BUSINESS GROUP
The diversified busil)ess group is found in Japan, Korea, India, Taiwan, Brazil, Turkey, and other late-industrializing countries. Of course, not all diversified business groups in late-industrializing countries perform equally well, their degree of success being partly due to environment. Not all states are as solicitous of big business as are Japan or Korea. Nor are they as stern with it. The diversified business group is a variant of the modern industrial enterprise that is found in every industrialized country and that is multidivisional, comprised of large-scale production units, and managed hierarchically. Yet the diversified business group in late-industrializing countries is unique in that it is more diversified in unrelated products than the modern industrial enterprise on the one hand, and more centrally coordinated than the conglomerate on the other (in terms of intra-group flows of both human and financial capital). Its broad diversification and central coordination were explained in Chapter 5 as functions of lateness. Korea's business groups may have diversified widely because they had no technical expertise to build upon in related products or in higher quality product niches. Their widely diversified structures complemented their strategy to compete at the ' bottom end of many markets. In their diversification efforts, they had the full support of the government because the government's vision of industrialization fixated on bigness, and bigness and diversification overlap.
The chaebol were able to manage their diverse holdings by virtue of their ability to borrow abroad and buy industry-specific technical expertise from foreigners. This allowed them to grow very large, at first "organically," and at the same time remain under the control of their original family founders. The chaebol soon became the most progressive firms and attracted the best-salaried supervisors, managers, and engineers. A' continuity in ownership and control con-
' tributed to a uniform group culture and a centralized knowledge of. group resources. Both facilitated the intragroup transfer of money and personnel. An economy of scope arose in the fonn of the capability to diversify. Entering new industries at minimum cost and at lightning speed raised the firm's ability to compete in many markets. With state subsidies and a diversified structure, the chaebol became willing and able to undertake risk.
Government controls in commodity markets in Korea largely pre-

152 THE STATE AND BUSINESS
eluded the chaebol competing against one another on price. Like other oligopolists, they tend to compete on non price variables-quality, delivery, location. They also competed on those specific nonprice variables peculiar to learners: the best foreign technical licenses, the best labor, and most of all, the fattest state subsidies. By building 'a meritocratic element into its system of awarding subsidies, the state extracted from the chaebol-an institution of possibly unprecedented market power-a growth rate of output and productivity that · may also have been unprecedented.
However one wishes to explain such results, one cannot do so by "ordinary economic causes." The forces of supply and demand, of course, do not cease whatever the paradigm, but the institutions that manage them are subject to change.
.
THE GROWTH-PRODUCTIVITY DYNAMIC IN LATE INDUSTRIALIZATION
The 1970s in Korea witnessed rapid increases in output as well as a transformation of Korea's industrial structure. GNP grew at an average annual rate of 9%, and exports grew by a phen�menal 28% (deflated by the U.S. wholesale price index). The heavy industries increased their share of manufacturing output from 40% in 197 1 to , 56% in 1980. Their share of manufactured exports over the same period tripled. To finance investments in the heavy industries, Korea borrowed abroad. Total debt rose from $4.3 billion to $20.5 billion during the Big Push. Nevertheiess, total debt as a percent of GNP remained constant at the beginning and end of the Big Push, from 34% in 1 972 to 32% in 1979. Korea's economy was sufficiently productive that a big increase in debt did not result in a heavier debt burden.
.
The productivity of the new industrial sectors may be understood partly as having been a function of their rapid growth. In response to the state's market-augmenting policies, firms invested more in new plant and equipment that embodied technology from abroad. This investment may be expected to have raised output per person employed. As firms expanded further in response· to a growing market for their output, they also became more capable of importing the best foreign technology from the viewpoint of economies of scale. So productivity may be expected to have increased further. Finally, as the cumulative output of firms increased (at first under the tutelage of foreign technical assistance, later under local management); and as firms repeated the same task again and again and discovered process improvements, they may be expected to have raised productivity as a consequence of learning-by-doing. Initially. learning-by-doing

GeHing Relative Prices ·Wrong" 153
may not have taken the form of fine-tuning. It may only have been of the type where, at the plant level, the production process was brought under control and, at the group level, the capability to diversify and to execute projects was advanced. Yet, with any luck; a firm was able to repeat a successful process and to continue to raise productivity interactively with growth, the one triggering the other.
In theory then, we have a dynamic that is quite Q.istinct because industrializing on the basis of foreign technology rather than innovation is also quite distinct. In the case of the former, not only does higher productivity generate higher growth; higher growth also generates higher productivity by means of learning-by-doing, economies of scale, and investments embodying ·foreign designs. The growthproductivity dynamic in late industrialization is a closed loop involving the cumulative causality of productivity and output. As such, it differs from the dynamic that supposedly drives economic growth in the market model, a model that is focused on new technical discoveries, and one in which higher productivity generates higher growth, but higher growth does not generate higher productivity.
One may conclude by saying that the market-augmenting paradigm comprises a set of institutions and associated patterns of behavior, and that Korea has been a prime example of those patterns and institutions at work. Out of a highly politicized process of resource allocation, there has arisen a diversified economic base and a fast growth rate of output. Given rapid rates of industrial expansion:' " and out of a high degree of market power at the industry and aggregate levels, intense competition among leading producers and rapid increases in productivity have arisen. One may object to the implied perversities of such relationships, ' for fast growth is an unexpected consequence of government intervention, high productivity is an unexpected effect of fast growth, and competition is an unexpected outcome of monopoly. Nevertheless. perversity has a long tradition ' in economic theory, The Schumpeterian paradigm teases innovation out of monopoly ,power. The market-conforming paradigm turned moral philosophy on its head with the proposition that society benefits the most when each individual indulges in the most selfish behavior. What could be more Hegelian?
"WRONG" PRICES. RIGHT DIRECTION?
Although Korea distorted its relative prices, it could still be said to have conformed to the market mechanism in pursuing its comparative advantage through international trade. Can one argue, therefore, that distortion of relative prices is acceptable so long as economic activity is directed toward exports? Korea provides a near-

154 THE STATE AND BUSINESS
perfect laboratory to study this question, because its growth has been exceptionally fast and its share of exports in national product has possibly been higher than that of any country in recorded history (see Table 3.6). Nor is the positive association between economic growth-meaning industrial expansion-and exports-meaning manufactured exports-limited to Korea. According to Feder,
Empirical comparisons of countries tend to demonstrate that developing countries with favorable export growth records have generally enjoyed higher rates of growth of national income than other developing countries. ( 1 986, p. 72)
The implied causality of the regression findings inclines one °to examine the relationship between exports and economic growth in historical context, to explore causality further. Korea's export history falls into two phases, an early one from roughly 1 965 to 1 975 centered on labor-intensive manufactures (cotton textiles, apparel, plywood, wigs, and consumer electronics), and a hiter one from, say, 1976 onward centered on more skill- and capital-intensive manufactures (ships, steel, machinery, automobiles, and computer electronics). Assuming causality in the regression findings, the exporter of light manufactures ought to have prepared the ground for heavy manufacturing. One may expect two types of externalities from export activity, economic and technomanagerial. With respect to the latter, Feder wrote,
An argument can be made for significant intersectoral externalities. These follow from the beneficial effects of export activities on other sectors in the economy through the development of efficient and internationally competitive management, the intro- °
ductiono of improved production techniques, the training of skilled workers, and the spillover consequences of scale expansion. (1986, p. 273)
The first externality, economic in nature, appears to have been strongly positive in Korea. The foreign exchange earned by exporting light manufactures almost certainly improved Korea's credit ratings, which helped it to raise capital abroad to finance its heavy industry investments and to service ·its loans. The employment and income generated by light manufactured exports, higher than what would probably have existed in their absence, created a boom that secured the military government's power and emboldened it to proceed with its plans to develop industry beyond the light manufacturing stage.
Contrary to Feder's belief, though, technomanagerial externalities in Korea were far less apparent. In the case of cotton spinning and

Getting Relative Prices ·Wrong" 155
weaving, unambiguously Korea's leading sector at the time, there were almost no technomanagerial externalities. Since all this is the subject of a later chapter, here the point to note is that there was no natural progression in any tangible, organizational sense from cotton spinning and weaving in particular and light manufactures in general to more complex industrial activity. The initiative to progress came from the government in the form of subsidies to further import substitution. Imp0t:t s.llPstitution then 'permitte(i a diversifica��n of-expOrt 'actiytty-:-sometimes immediately, as in the case of steel and' ships; s()metimes with a ten-year lag, as in the case of chemicals and machinery, and sometimes with a twenty-year delay, as in the case of automobiles.3
The argument that relative prices in Korea were distorted but in the right direction, that is, toward exports, is therefore itself distorted. Prices were distorted in all directions in Korea-both for import substitutes and for exports-and often for one and the same product in the two categories.
'
CONCLUSION
The market-conforming paradigm rests on two pillars: marginal productivity theory and the law of comparative advantage. Marginal productivity theory is the formal expression of getting relative prices right, which as just suggested. is the antithesis of what actually hap- , pens in late-industrializing countries. The second pillar-the law of comparative advantage (or relative costs)--expresses the idea that specialization enhances economic growth. However, it is argued in the following chapters that this second pillar cannot bear the weight of the facts of late industrialization either. The principle of specialization is fundamentally at variance with the logic of late industrialization-to diversify into more industries in order to catch up. It is to the realities of catching up at the firm level that attention returns.
3 In decomposing the Korean growth rate into its constituent parts-exports, im· port substitutes. and domestic demand-Westphal ( 1978) and K. S. Kim and Roemer ( 1979) trivialized the importance of import-substitution activity because of the way they defined import substitution and ignored quality. Instead of defining import substitution as a stream of activities, corrected for quality changes. they defined it as a one-time event. For example. import substitution of automobiles would have been counted as such in only one year. when automobiles began to be assembled from knockdown kits with a very small total value. Moreover. if an automobile engine had been manufactured since the Korean War in a backyard garage. even when its quality was later improved to supply the domestic automobile industry and motors ceased to be imported, the transaction would still have been recorded as an ,expa{lsion in do-mestic demand. not as import substitution. '

I .

PART II
Professional Management and
Human Resources


CHAPTER SEVEN
The Rise of Salaried Engineers:
Automobile Manufacturing
THE SALARIED ENGINEER . AND FIRM DIFFERENTIATION
T.his chapter will look at the salaried engineer in Korea's late industrialization with respect to two extreme typologies: the small- and medium-size firm and the huge diversified business group. Between the two lies the specialized big business--'-principalIy in publishing, pharmaceuticals, and cotton spinning and weaving. These firms will be discussed in a separate chapter within the context of the cotton textile industry.
Since the late nineteenth century, industrialization has been executed by the salaried manager, including and increasingly the salaried engineer. As Chandler wrote:
Large industrial enterprises with their teams of managers . . . appeared suddenly and simultaneously in the United States and Europe in the last decades of the nineteenth century [and a little later in Japan, only because Japan was later to industrialize]. They came in industries with much the same characteristics, and they continued to compete and to grow in much the same m�mnero The enterprises that became major players did so by making a threefold investment in facilities and personnel. They made an investment in facilities and personnel in the new technologies of production large enough to achieve the cost advantages of the economies of scale and scope. They created national and international marketing and distribution networks that took over the functions of existing commercial intermediaries-the wholesalers, suppliers and distributors. Most essential of alI, they re-· cruited the managers necessary to 'coordinate the new processes of production and distribution. ( 1989: pp. 2-3)
159

160 MANAGEMENT AND HUMAN RESOURCES
As a consequence af this threefold investment, the modern industrial enterprise evalved into. an institutian that camprises large-scale J aperating units, is multidivisianal-producing many related products-and is hierarchical-key decisions are made by salaried managers who. occupy various consecutive layers af authority and gradually supersede owner-managers as chief executives.
There are, however, notable differences in the way firms are man-aged. As Chandler reminded us:
There were striking differences amang different nations in the numbers and size of tJ)ese large integrated enterprises, in the ways in which they were managed, and the industrial sectors in which they were lacated. ( 1989, p. 8)
A defining characteristic of late industrialization is the abundant supply of managers salaried from the start af accelerated growth. They do nat have to. pass thraugh the ranks af praductian workers as they did in past industrializations, but ariginate in the universities. As for the distinctive features of Karean (and Japanese) salaried managers, they have been a key factor in economic expansion, but they have not driven overhead costs through the roof. Despite rapid industrialization, the ratio of managers to production workers in Korea has remained relatively constant, engineers have grown in number relative to administrators, and the number of levels in the managerial hierarchy has been kept in check. These features of Karean management suggest themselves as major factors underlying Korea's successful industrial growth.
This chapter looks at one of Karea's proudest industries-automobile making-to begin examining a general hypothesis ·about shapfloar management that is carried further in later chapters. The hypothesis is that leading firms in late industrializing countries, if they are to penetrate warld markets, must adapt unusually pra-active productian and aperatians management palicies. By pro-active we mean policies that assign high-quality managers to. the shopfloar and inspire initiative an the Pflrt of such managers to develap the skills af the wark farce and to imprqve pracess performance. Otherwise the gap in productivity levels with leading firms in advanced countries will not be bridged while the advantage in wage levels narrows.
The rise of the modern industrial enterprise in the 1880s witnessed a cantinuation in the existence of small-scale firms. What has happened with each sequential industrialization is that the diversity of the firm papulatian has increased. Technalagical change has transformed all industries, but some have been made more capital intensive, others more complex in terms of the number of stages in the production process or the difficulty of process control. The re-

The Rise of Salaried Engineers 161
suIt has been a far greater range among firms than in previous periods with respect to size, integration, capital intensity, and the employment of managers. This appears to hav� encouraged the emergence .of subcontracting systems.
Another theme of this chapter, therefore, is relations between big and small business through subcontracting. The small-scale firm has been a relatively unimportant element in Korea's growth. As a subcontractor,. however, the small scale firm is becoming pivotal. It is through subcontracting relations that Korea's management system is being ' generalized.
THE SMALL- AND MEDIUM-SIZE FIRM
The definition of small- and medium-size firms is not fixed and relates variously to assets, sales, and employment. In terms of number of employees, the threshold of small- and medium-size firms in late industrializing countries varies from 50 to.500. In Korea, the threshold is typically 300, yet a firm producing a single product and employing 1 ,000 workers is commonly thought of as medium-size or even small by comparison with a large chaebol. However defined, the category is a catchall, comprising firms ranging from a handful of high-tech start-ups to thousands of backyard shops employing only family workers_
Its conceptual fuzziness notwithstanding, the small- and mediumsize-firm sector has given rise to conjectures that are central to the topic of late industrialization. One theory concerns the extent to which small-scale capitalism can serve as the basis for achieving rapid economic expansion. An affirmative answer has been given by visionaries ranging from Proudhon to Ghandhi in the past and by scholars of methods of appropriate technology and flexible specialization at present. I Another conjecture regards the extent to which small- and medium-scale firms can provide the germ from which large-scale firms can grow. David Anderson has attempted to measure such germination, and his answer is as follows:
The shares in employment expansion in the large industry group, attributable to the growth of small firms through the size distribution . . . [are]: Korea 40%, Taiwan 53%, Turkey 45%, Colombia 70%, Philippines 42%, and India 67%. ( 1982, p. 925)
Korea stands out because it falls at the bottom of the list. Taiwan commands attention because it has been idealized as a model of
I Sabel ( 1 982) and Sa�el and Zeitlin (i985) examined the alternatives to mass production, past and present. A landmark in the literature on productive small-scale enterprise is by Piore and Sabel (1984).

162 MANAGEMENT AND HUMAN RESOURCES
Table 7.1 Percent Distribution of Manufacturing Value-Added' by Firm Size, 1973
Country 1-9
Korea 5.8 Taiwanb 4.4 Hong Kong 7.4 Brazil 3.4 Turkey' 1 1 .7 Peru 4.0 Japand 8.7 Canadad 2.0 Czechoslovakia 0.2 Austria 0.8 United Kingdom 15.7· United Statesd 2.4
'Cenerally. value·added in producers' values. 'Value-added in factor values, 197 1 .
' 1970. d Net value-added in factor values.
< 1-99.
Number of Workers 10'-99 100-499 500 or more
1 3.8 27.7 52.7 16.7 22.5 56.4 30.2 32. 1 30.2 23.7 36. 1 36.6 10. 1 27.5 48.4 23.9 46.4 25.7 28.4 24.9 37.9 2 1 . 1 37.4 39.3
5.4 1 8.2 76. 1 2 1 .5 36.2 41 .5
24.4 60.0 18.3 30.5 48.7
Source: All countries ex.cept Taiwan: United Nations (1979). Taiwan: Executive Yuan. TM Reporl of Indwlrial and Ct»nmncial Census of Taiwan and FuJUen, Dill';cl of tI .. Republic of CMna, 1971, quoted in S. Ho (1980).
fast-growth-cum-small-scale capitalism.2 Big business is presumed to be negligible in Taiwan, while the - facts that its state is as strong as Korea's and that its real-wage increases are lower are ignored. In reality, large state enterprises in the early phases of development in Taiwan accounted for over half of industrial output, and even though their share declined over time, they were first movers in cement, iron and steel, shipbuilding, fertilizers, heavy machinery, machine tools, b�nking and insurance, and so on (Amsden, 1 985). One could say, therefore, that in terms of value-added, large firms in Taiwan provided the - basis for the growth of small firms, not vice versa (Amsden, 1989). _
Table 7. 1 provides some supporting evidence. The data show how value-added is distributed among -firms of different size in different countries. The data for Taiwan are from a 1 97 1 industrial census; the data for the remaining countries were compiled by the United Nations for a special survey of world industry in 1 973. About that time both Korea a�d Taiwan were enjoying rapid economic expan-
• See, for example, Lau ( 1986).

The Rise of Salaried Engineers 163
sion and were on the point of deepening their industrial structures. What is interesting is that of all the developing countries for which data are published, Taiwan has the highest share of manufacturing value-added in firms with 500 or more workers, 56.4%:'1 There can be no simple equation, therefore, of Taiwan's economic success and that of small-scale capitalism.
One practical problem confounding research on the smaJI- and medium-size-firm sector is empirical. Because the sector is so heterogeneous and fraught with firms that are in a constant state of flux, it is a challenge even to gather data to describe it. There are at least five classes of measurement problems:
1 . If small- and medium-size firms have exceptionally high rates of bankruptcy, and if data are collected only on existing firms, then the tendency is to overstate how weJI firms in this sector are per-forming. ·
.
2. It is hard to collect any data on existing firms because tax evasion tends to be high. BhaJIa ( 1 979) ·uncovered an informal sector in Korea that had escaped government statistical notice; he estimated that the sector contained half to two thirds as many workers as the formal sector.
3. Comparisons of the productivity levels in smaJI- and medium-size firms on the one hand and large firms on the other are meaningless from the standpoint of relative performance, since the two firm sets rarely produce the same products.
4. Assessing relative performance from productivity growth rates is . misleading because of a statistical artifact between large and small
firms, although much seems to have been made of such findings in .Korea. Table 7.2 presents data on productivity growth rates by firm size for 1967-1979. The data show large firms (with 500 or more workers) performing worse than smal\- and medium-size firms in almost every size range except that of 200 to 499 workers. The problem is that the 200 to 499 size range accounts for almost half the total value-added of all small- and medium-size firms in the period in question (see the last column in the table). Moreover, productivity- growth rates are biased toward small firms because the base from which they grow is relatively small.
5. Growth rates of output and labor productivity in the .small- and medium-size firm need to be corrected for poor-quality product. Poor quality hounded attempts to develop a subcontracting system in Korean industries like electronics, shipbuilding, and automobiles. According to a survey conducted by the Korean Auto-
• To the extent that the "informal sector" is excluded from the data, differences across countries may be misleading.

164 MANAGEMENT AND HUMAN RESOURCES
Table 7.2 Percent Growth Rates of Output and Total Factor Productivity by Size of Firm for Manufacturing Sector, 1967- 1979
No. of Labor Capital Total Factor Percent of Workers Output Productivity Productivity Productivity Value·Added'
5-9 I Ll 12 .8 4.9 7.8 1 .5 10-19 13.9 ' 1 1 .5 5.2 7.6 2.0 20-49 20. 1 l l .5 6.0 8.0 4.4 50-99 22.7 1 1.7 4.5 6.8 6.4
100- 199 25.8 12.5 4. 1 7.6 9.3 200-499 22. 1 8.6 0.7 2.4 18.2 500 or more 27.6 1 1 .0 2.3 4.0 58.2
Total 24.0 12.3 2.6 5.0 100.0
' 1 976.
Source: Site of firm: C. K. Kim ( 1 981). All other data: Economic Planning Board (various years).
mobile Industry Association in 1 976, only 1 0% of a sample of 1 ,200 pans and components supplied by small-scale firms approxiinated international standard. As much as 60% was far below it. (C. K. Kim and Lee, 1980).
GeneraJly speaking, the smaJl- and medium-size firm cannot be credited with developing the forces of pl'oduction in lateindustrializing countries, even in Taiwan. Nevertheless, the modern industrial enterprise in several key sectors in Korea would have been hard pressed to expanc;i without it, as suggested below.
' THE MODERN INDUSTRIAL ENTERPRISE
Korea provides yet another example of a country that supports Chandler's theses about the modern industri�1 enterprise. For instance, Chandler found that the world's largest industrial enterprises tend to be clustered in the same set of industries-food, chemicals, oil, primary metals, and machinery-and have been so arrayed ever since the late nineteenth century. The same industry pattern prevails in Korea, as Table 7 .3 suggests, although in general, the incidence of large finus in textiles tends to be greater in Korea and in machinery smaller than in more advanced cou.ntries. Chandler also found that the activities of the world's largest industrial enterprises in capital-intensive industries are "monitored and coordinated by a small ' team (or perhaps an individual) of full-time executives who plan and allocate resources for the operating units and the enterprise as a

'The Rise of Salaried Engineers
Table 7.3 Percent Distribution of 200 Largest Manufacturing Firms' in Korea, Japan. Germany, and United States, by Industry
Percent Distribution
1.65
Industry, Standard Koreab Japan Germany< U nited States� Industrial Classification ( 1 983) ( 1973) (1973) ( 1973)
20. Food 14.5 9.0 6.0 12:1 21. Tobacco 4. 1 0.0 3.0 1 .7 22. Textiles 12.8 5.5 2.0 1 .7 23. Apparel 1 .7 0.0 0.0 0.0 24. Lumber 0.6 0.5 0.0 2.2 25. :Furniture 0.0 0.0 0.0 0.0 26. Paper 1 .7 5.0 1 .0 5.0 27. Printing 0.6 1 .0 3 .0 0.5 28. Chemicals 16.3 17.0 15 . 1 14.9 29. Petroleum 2.9 6.5 4.0 12 . 1 30. Rubber 4.1 2.5 1 .5 2.8 31 . Leather 0.6 0.0 0.5 0.0 32. Stone, Clay. Glass 4. 1 7.0 7.5 3'.9 33. Primary Metal 1 1 .6 13.5 9.5 10.5 34. Fabricated Metal 1 .2 2.5 7.0 2.8 35. General Machinery 2.9 8.0 14.6 9.4 36. Electrical Machinery 10.5 9.0 10.5 7.2 37. Transport Equipment 9.8 1 0.0 7 . 1 10.5 38. Instruments 0.0 2.5 1 .0. 2.2 39. Miscellaneous 0.0 0.5 � 1 0.5
100.0 100.0 '100.0 1 00.0
• Ranked by sales.
b 172 firms. Some of the industrial categori�s were adjusted 10 conform with the SIC breakdown.
' 199 firms.
d ISl lirms.
S""" U$: Korea: Economic Planning Board ( 1 985); Japan. Germany. and the United States: Chan· dler (1987).
whole" (1989, p. �). So. t60, in Korea. managerial capitalism has arisen. as indicated in Table 7.4.
The first column in Table 7.4 provides data on the number of administrative employees per 1 00 operatives. or the ratio of indirect to direct labor. This number may be taken as a proxy for the density of management. By and large, managerial resources tend to be greatest in the same industries in which large firms are clustered-food, chemicals. oil, and machinery. especially transpqrt equipment: The textiles industry, however, which according to Table 7.3 comprises a sizeable fraction of large firms, has a low ratio of administra!ors to operators. Thus managerialism does not necessarily characterize all

166 MANAGEMENT AND HUMAN RESOURCES
Table 7.4 Managerial Resources by Industry, 1983
Administrative Family Workers! ·Industry, Standard Employees/ 100 Administrative
Industrial Classification 100 Operatives' Employees'
Food 30.0 1 1 .0< Tobacco 17.0 O.O� Textiles· 9.3 16.S· Apparelb S.7 20.4 Lumber 14.2 32.1 Funiiture 12.2 37.5 Paper 20.S 12.0 Printing 34.0 14.5 Chemical 44.0 3.7 Petroleum 46. 1 2.6 Rubber 7.3 6.2 Leather 12. 1 IS.S Stone, Clay, Glass IS.5 13,6 Primary Metal 23.0 4.4 Fabricated Metal 19.3 14,3 Machinery 22.6 12.2 Electrical Machinery 17 ,7 4.5 Transport Equipment 31 . 1 2.9 Instruments 15.6 9.3 Miscellaneous 10.9 17.9
• Figures for administrative and family workers refer to males only to avoid inflating the administrative and family categories with female clerical workers. See discussioll in text.
b Adjusted for the fact that many female administrative employees in these industries are . front-line supervisors. Adjustment takes the form of inflating the number of male ad· ministrators in these industries by the ratio of males to lotal administrators in the allmanufacturing average .
• < Average of food and beverages.
d A government monopoly exists in the tobacco industry . . < Excludes shoes.
Sour,,: .Economic Planning Board (198!» .
large firms; rather, it characterizes those that operate in capi�l' intensive industries. In the labor-intensive sectors, or in sectors subject to capital widening,4 expansion occurs with little change in the proportions of capital and labor used in the production process, and consequently little change iri the· production process itself. Therefore, the same equipment . and labor (say, sewing machines and seamstresses) replicate themselves on an extended scale with little need for an abundance of managerial resources. By contrast, in the capital-intensiwe industries, or in industries that are subject t� capital .
4 The distinction between capital widening and deepening originated with Hawtrey (1937). See· further discussion in Chapter 10,

The Rise of Salaried Engineers 167
deepening, expansion occurs with an increasing proportion of capital to labor and therefore continuous changes in the production process itself. Chandler wrote,
In the capital-intensive industries, the throughput [production time] needed to maintain minimum efficient scale requires not only careful coordination of flow through the processes of production but also of the flow of inputs from the suppliers and the flow of outputs to the retailers and final consumers.
Such coordination did not and indeed could not happen aU7 tomatically. It demanded the constant attention of a managerial team or hierarchy. The potehtial economies of scale and scope are characteristics of a technology. The actual economies of scale or of scope, as measured by throughput [or yields], are organizational. Such economies depend- on knowledge, skill, experience and teamwork-on the organized human capabilities essential to exploit the potential of technological progress. ( 1989, pp. 14-15)
Finally, Korea has begun to conform to the international pattern of a decline in the importance of "family capitalism" and a rise in the importance of decision-making by salaried managers (although the family founder remains the highest decision maker). The second column of Table 7.4 presents data on the ratio of family workers to administrative employees. The ratio may be taken as a very rough approximation of tJ:1e relative importance of family versus salaried managers. The lower the ratio, the less important family management. According to the chart, the ratio tends to be lowest in those industries that use capital-intensive production processes and that harbor large-scale firms. Family capitalism appears to be least prominent where modern technology and large _ capital investments are greatest.
Korea's modern industrial enterprise remains under tight family ownership and control, typically under the ownership and control of the original founder, who occupies the position of president.5 As suggested in Chapter 4, however, the president does not exercise the fundamental function of the entrepreneur-that of deciding what, when, and how much to produce. In Korea's version of the modern industrial enterprise (i.e., chaebol), the government performs that function, particularly in the formative years of Korean industriali- _ zation, the 1960s and 1 970s. The functions of chaebol presidents, therefore, have been limited to three areas. First, presidents have made strategic decisions for the group about which initiatives of the
� See the discussion of the family structure of the chaebol in Hattori ( 1984).

168 MANAGEMENT AND HUMAN RESOURCES
government to follow and by how much. Second, they have exercised power over the purse, to the extent of deciding how to shift ' funds among group members. Third, they have exhorted their work forces to work harder and have made key personnel decisions, in-
. eluding which top managers to hire.
TOp Management
Top managers of modern industrial enterprises in Korea who are not related familially to the president are recruited from diverse sources. Tamio Hattori, in a 1984 study of Korean management during the period 1962 to 1978, examined 556 cases of recruits into the ranks of top managers and discovered the following breakdown: The most important sources of top managers were the government, financial institutions, and public enterprises. Relatively unimportant were the media, academia, politics, the military, and the Korean Central Intelligence Agency. Altogether unimportant was the law profession (see Table 7.5).6
Figure 7. 1 presents Chandler's organizational chart for the typical
Table 7.5 Background of Top Mariagers: 1962-1978
Background
Government Finance Public Enterprise Media Academia Military and Korea Central . Intelligence Agency Politics Law Religion Cultural Others Unknown
Total
Percent of Total
23.0 1 2.4 9.9 7.4 5.7
5.2 4. 1 0.7 0.2 0.2 �.7
25.4
100.0
• Refers to a sample of 556 recruits among the largest diversified busine$S grou ps. Sourc.: Hattori ( 1984).
6 It is rumored that the chaebol employ a lot of retired military personnel either as . a favor to the government or to obtain favors from it. The figure on the nU\TIber of recruits with military backgrounds, therefore, may be understated, or the rumor may be false.

�
Vice President Financial Staff
r -Treasurer
I fi ll l . �" �.. .{:-� �.. .�() ..
� # � _0 .� as '" v <l;q,"'- ;;} :::,tQ � �
I
;+; "t'(1 ��. 'b ('0 � il', � 3) "'Il
�.;. cf 11 ".;>� 3) 19(1 . �. ��. � �
Vice President Advisory Stall
I I I I I I I T ·r----'- ), 11 �
I - .() � � .... .;>" $.;>, �6 <. .() 't. "t'OJ-$. '"d<il- �1i>. ""$-6 �c. �'" 19", �.;>, 1!>"'<lQ �<ll ��_ (' 11 1!>1!>�. :o� '1i> "? iI}.... "... 19� . _ � $? $, -� .., �o .. "",
-Explosives Films Fibers Finishes Plastics Chemicals
-.L - I _ I _I -.L 1 mn / I I I / I rnn !TIn rrm / 7 I I 7 . I
l;-' t;' �.. "," Q �() l;-' t;. b' >-"," Q � � q,,§ Q,'o c,� Q:-'I:i � ,'Ii '?-V Q,'§ q,'o �'Ii Q:-'I:i �,'Ii
� � � � � � � � � � � � Figure 7.1 The Multidivisional Structure. SouTce: Chandler--(i988): p. 50i.
"
I General Office
1 T
Division Office
t Functional
Office
1

170 MANAGEMENT AND HUMAN RESOUHCES
modern industrial enterprise. The structure for the c�aebol is similar in principle to that of the world norm but different in kind. The chaebol's structure, like that presented in Figure 7. 1 , is multidivisional, but its general office tends to be relatively small (like those of American conglomerates). In fact, some large Korean firms do not have any general office, secretariat, or staff to serve the president and his retinue. Among 2 1 8 large firms surveyed by the College of Business Administration, Seoul National University (SNU), as many as 30% had none (Seoul National University, 1 985).7 Among the 200 or so firms (large and small) that did have general offices, the functions that they undertook on a regular basis were limited. Most functions were undertaken centrally only when the need arose, in which case managers operating at the group or company level were pulled together to form a temporary task force. Such task forces, for' ex-
, ample, executed decisions about entering new industries (see the discussion in Chapter 5) ,
A small or nonexistent general office is a key characteristiC of the Korean modern industrial enterprise and is indicative of how decision-making power is distributed between owners and salaried managers. Decisions at the top tend to be made by owners autocratically, rather than bureaucratically. Most decisions, however, are not made at the top. According to SNU's survey, salaried managers made decisions about production, R&D, and marketing, and these managers were assigned where their skills were needed most: to the shop floor; the plant, or the company level, respectively.s Firms concentrated over half their efforts on production and R&D (which in the mid, 1980s typiCally concerned the absorption of foreign technology), with marketing taking up much of the remainder of their time. .
The Distribution of Managers
This picture of the distribution of power-showing strategic and financial decisions in the hands of a single individual or family, and decentralized decision-making in other areas-is lent support by statistics on the growth and composition of Korean management. Table 7 .6 provides data on manufacturing employment in the period 1960 through 1 980, broken down into six categories: engineers, man-
7 Furthermore, roughly 80% of a sample of 280 small firms had none. The survey of Seoul National University was conducted in 1984. It covered approximately 500 firms. depending on the survey question. The definition of small· and medium-size firm varies by question but usually refers to firms employing 500 workers or less. See Seoul National University (\985).
8 It is assumed for simplicity that middle and top managers differentiate themselves by their assignment either to the company or to the group level, respectively.

The Rise of Salaried Engineers
Table 7.6 Managerial Resources in the Manufacturing Sector; 1960-1980
Employment Category 1960 1970 1980
Engineers 4,425 16,252 44,999 Managers 3 1 ,350 47,166 69,585 Sales 5,025 27,778 68,'7 16 Service 13,660 22,740 49,522 Clerical 17,330 ' 143,849 356,362 Production 404,'735 1 , 1 88,406 2,206,85 1
Total 479,975 1 ,44'7,520 2,'797.030
Administrative b/prod uction 0. 1 3 0. 10 0.10 Administrative, clerical! ·
production . . 0. 1 8 0.22 0.27
·Include. transportation and communication workers in the manufacturing sector,
blncludes engineers, managers, sales. and service workers.
Sr)Urce: Korea Institute for Educational Development (1983),
171
Increase 1 980/1960
10.2 2.2
13;7 3.6
20.6 ...M
5.8
agers, sales, service, clerical and production workers. The data show that between 1960 and 1 980 there was an increase in the absolute number of engineers, managers, sales, and service employees (call them white-collar workers, excluding for .the moment the clerical category). Nevertheless, the ratio of white-collar to blue-collar, or produqion, workers declined from 0. 1 3 in i 960 to 0. 1 0 in 1980. This is a rather stunning fact. It suggests that even as Korean firms l£arned, diversified, and evolved into modern industrial enterprises, complete with managerial hierarchies, they tended to keep their overhead expenses in check. To use the terminology of the classical economists and Marx. they maintained a more or less stable or even declining ratio of "unproductive" to "productive" workers.
By contrast, Seymour Melman pointed out that "the businessmen [sic] charged with administering the manufacturing firms of the United States have devoted increasing resources to administration functions of their firms since the turn of the twentieth century" ( 1 95 1 , p. 89).9 Melman's observation applies equally well to many European countries. In the period 1978-1 985, there was an "alarming increase" in the number of white-collar workers in the United States, coupled with a decrease in the blue-collar category-+21% and -6%, respectively (Thurow, 1 987).
If one includes 'clerical staff among white-collar workers in the 9 See also the study of Delehanty ( 1986). In part. the ratio of managers to workers
may be in check in late industrializing countries because of the availability of infol'mation technology. which may conserve oli managers.

172 MANAGEMENT AND HUMAN RESOURCES
Korean data, then between 1 960 and 1 980 the ratio of white-' to , blue-collar workers also rose, from 0. 1 8 to 0.27. Nevertheless, the fact that the increase in the white- . to blue-collar ratio in Korea was ' accounted for by a rise in clerical workers has acted to contain manufacturing costs, not to inflate them. Most clerical workers in Korea are women with vocational or secondary high-school degrees. They handle a wide variety of bookkeeping functions that in higher-wage countries now tend to be computerized. Discrimination against women workers in Korea is so severe that not only are they paid far less than men (see Chapter 8), they are also induced to quit paid employment when they marry. Thus, clerical workers represent a variable cost that does not rise. with seniority.
Furthermore, although both the number of managers and the number of engineers in Korea both rose absolutely between 1960 and 1 980, the latter increase was far greater than the former. The number of engineers increased tenfold, that of managers by a factor of only 2.2 (see Table 7.6). The ratio of managers to engineers fell from 7.0 in 1960 to 1 .5 in 1 980. This suggests an orientation toward production in Korean manufacturing firms rather than toward sales or fi- ' nance, although in certain industries sales include technical people who are tied closely to production. Insofar as Korea competes in world markets on the basis of its manufacturing capabilities, it invests its money where its competitive advantage lies.
The number of levels in the managerial hierarchies of larger firms has also been kept in check. Table 7.7 indicates that larger firms have a greater number of departments and sections than do smaller· firms. Their management is more extensive. They also tend to have.
Table 7.7 Managerial Hierarchy, 1984
No. of No. of No. of No. of No. of Levels Subordinates!
Workers Departments' Sections' BlAb in Hierarchies Section Chief
0-99 2.90 (1 16) 5 . 1 5 ( 1 20) 1 .78 5.55 (120) 6.02 ( 121 ) 100-200 3.67 (87) 7.68 (79) 2.09 �7 (87) 8.90 (83) 200-300 4.92 (65) 10.60 (65) 2.15 37 (68) 1 1 .81 (67) 300-500 6.43 (4 1 ) 14.73 (41 ) 2.29 6. 3 (41 ) 10.90 (42) 500- 1 ,000 10.93 (60) '22.60 (60) 2.07 7.48 (60) 10.81 (58)
1 ,000-2,000 1 6.35 (60) 43. 1 0 (58) 2.64 7.25 (61 ) 14.95 (58) 2,000-5,000 2 1 .00 (42) 57.60 (40) 2.74 8.2 1 (43) 15.05 (4 1 ) 5,000 or more 54.62 ( I3) 156. 15 ( 13) 2.86 7.23 { I 3) 9.69 ( 13)
• Parentheses .. efer to number of firms in sample.
"Column 3/column 2 Source: Seoul National University (1985).

The Rise of Salaried Engineers 173
a large number of subordinates per section chief. Nevertheless, they have only marginally more managerial layers. In fact, firms with 200 to 300 workers have more levels of hierarchy than firms with over 5,000. The compactness of the hierarchical structure suggests that engineers who have' entered the manufacturing sector in increasing numbers in Korea since 1960 have kept in close touch with the ranks.
Korea's modern industrial enterprises tend to recruit their middle managers openly, through competitive examinations. Out of SNU's sample of 208, recruiting experiences by large firms, only 14% were closed (Seoul National University, 1 985). (The comparable figure for small- and medium-size enterprises was 47%.) This is not to suggest that the recruiting process is altogether democratic. ,Most chaebol admit no women at all into the ranks of managers, and they conduct a first screening of male candidates against the criteria of quality of their university and personal recommendations. This tends to restrict chaebol manager recruitment to the elite. Among the elite, however, what could be called open recruitment exists and is based on candidates' "industrial insight and capacity." 1 0
Elements of Technological Capability
The learning that falls on the shoulders of production managers is broken down into three different types of teChnological capability in Table 7.8. The first, production capability, refers to the skills involved in optimizing the operation of established plants. The second, investment capability, refers to the skills involved in executing new projects. The third, - innovation capability, refers to the skills necessary to create new products or processes. This classification scheme is not perfect. For example:, some skills in Table 7.S are more important in certain industries than in others. Also, the distinction between innovation capability and production and investment capability is artificial. (Learning how to operate a plant optimally, for example, requires a large number of small innovations to achieve marginal improvements. Introducing a new innovation requires a process that is fully under control.) Nevertheless, Table 7.8 conveys the breadth of elements that the typical firm confronts in acquiring technological capability. The point is that the management patterns just described facilitated the acquisition of such technological capability. Those patterns included a minimum of hierarchy separating managers and workers, a hi'gh incidence of engineers at the plant level in total managerial resources, and more emphasis on managers' training and education than on their political pull.
10 The term is Veblen's ([ 1915) 1965, p. 1 94), quoted in Chapter 1 .

174 MANAGEMENT AND HUMAN RESOURCES
Table '1.8 Elements of a Technological Capabiiity
Production CapabilUy'
Production management-to oversee operation of established facilities Production engineeringb-to provide information required to optimize operation
of established facilities. including the following: 1. Raw material control: to sort and grade inputs. seek improved inputs 2. Production scheduling: to coordinate production processes 'across products and
facilities ' 3. Quality control: to monitor 'conformance with product standards and to upgrade
them 4. Trouble·shooting to overcome problems encountered in course of operation 5. Adaptations of processes and products: to respond to changing circumstances
and increase productivity Repair and maintenance of physical capital-according to regular schedule and when
needed Investment Capability
Manpower training-to impart skills and abilities of all kinds Preinvestment feasibility studieS'-to identify possible projects and ascertain pros
pects for viability under alternative design concepts Project execution-to establish or expand facilities. including the following: 1. Project management: to organize and oversee activities involved in project exe-
cution � 2. Project engineering: to provide information needed to make technology pera-tional in particular setting. including the following: a. Detailed studies: to make tentative choices among design alternatives b. Basic engineering: to supply core technology in terms of prOCess flows. ma
terial and energy balances. specifications of principal equipment. plant layout c. Detailed engineering: to supply peripheral technology in terms of complete
specifications for all physical capital. architectural and engineering plans. con- •
struction and equipment installation specifications 3. Procurement: to choose. coordinate. and supervise hardware suppliers and ton
struction contractors 4. Embodiment in physical capital: to accomplish site preparation. construction.
plant erection. manufacture of machinery and equipment 5. Start-up of operations: to attain predetermined norms
Innovation Capability
Basic research-investigation to gain knowledge for its own sake . Applied research-investigation to obtain knowledge with specific commercial im- .
plications Development-translation of technical and scientific knowledge into concrete new
processes. products. and services through detail-oriented technical activities • . including experimental testing
• ActivitH:s listed refer to the operation of manufacturing plants. but similar activities pertain to the operation of other types of productive facilities as well. "This usage of the term departS from conventional usage in tljat the lerm is used far more broadly to include all of the engineering activities related to the operation of existing facilities. In this usage. the term encompasses Jmldut:t <ksigrz and tiulnufacluring engin4eTing as these terms are generally used in reference to industrial production. See the entries under these headings in the MtGrGw·Hill Eru;y<kiptdilJ of Sdmtt GM Tech7lOIDgy (New York: McGraw-Hili Book Company. 1977).
Souru: Westphal. Kim. and Dahlman (1985).

The Rise of Salaried Engineers 175
Analysis of the acquisition of technological capability will be presented now for the Korean automobile industry to suggest the significance of the management patterns just described. The time is the summer of 1985. The company is Hyundai Motors. It is operating under great strain because it has just expanded its capacity and is positioning itself to enter the U.S. market.
LEARNING AT THE HYUNDAI MOTOR COMPANY (HMC)
The Technology HMC began operations, based on foreign licenses and technical agreements with Ford, as an assembler of the Cortina passenger car in 1967. Then the Long-Range Automobile Industry Promotion Plan promulgated by the Korean government in 1974 induced Hyundai to construct integrated automobile manufacturing facilities. Hyundai adopted a policy of obtaining technology from several sources rather than from a single one (sometimes it turned to two different sources for the same technology). From 1974 to 1 976, HMC acquired technologies for engine block design, transmissions, and rear axles from Japan; for factory construction, layout, and internal combustion engines from England; and for car designs from Italy. Eighteen technology transfers took place before introduction of the first HMC model, the "Pony." The experience that allowed HMC to absorb these technologies was gained through its technical assistance from Ford. Production know-how; though, came from Japan (Amsden and Kim, 1985a).
The next phase of HMe's technological development began in 1979 when" exports appeared on its agenda partly in response to the government's machinery-ex port-promotion policy. HMC established its own engineering center. To meet the quality standards of major car markets, HMC also licensed more than 30 different technologies from Japan, England, and the United States, although with mixed results. In 1982, HMe's cars met European Economic Community requirements on emission controls, noise levels, and safety, but they fell short of the more stringent U.S. standards. The Pony failed to meet 12 of 35 U.S. safety requirements, among them the ability to absorb adequately head-on and side collisions (BK, Dec. 1983).
When the Korean and world economies were severely depressed in the early 1 980s, HMC pushed ahead with a project to design and produce a subcompact car embodying world frontier technology and aimed at export markets. Toward this end, HMC sold 1 0% of its equity to Mitsubishi (5% to the Japanese group's automobile subsidiary and 5% to its trading arm). Mitsubishi's role in Hyundai, however, is limited to technical assistance for engines and transmissions. Not only does Hyundai retain all managerial control, but it also re-

176 MANAGEMENT AND HUMAN RESOURCES
serves the right to import parts and technology from Mitsubishi's competitors and to compete directly in Mitsubishi's own markets, if J it can.
The Plant Level In the summer of 1 985, managers of different departments at HMC described their problems in a way that is reproduced here as faith� fully as possible. The manager of HMC's Machine Tool Department (MTD) reported that HMC began making its own machine tools in 1978:
The department employs 3 17 people, including 175 workers, 58 . derks, and 84 engineers with college degrees. It has begun to make machining centers, about five a month. Controls are from Fujitsu Fanuc. The MTD gets technical assistance from SNK of Sweden. It has a foreign license with SNK that covers blueprints, specifications, and supervision. The MTD sends designers and inspectors to SNK for instruction. They send foremen \. and electricians to MTD. The MTD also has a short-term rela- . tionship with Cincinnati Milacron (CM). MTD relies on CM for some jigs and fixtures. The MTD has just started a CAD/CAM I I team, but i t i s not yet at the software stage. The MTD mainly manufactures materials-handling equipment. The ideas come from the workers. The breakdown of capital equipment in HMC's new plant expansion is roughly as follows: 50% of capital equipment comes from Japan; 25% comes from Korean machinery builders; and 25% comes from the MTD. The MTD's equipment is for materials handling on the line as well as for the . engine and transmission plant.
. .
According to one of the managers of HMC's assembly operations, the assembly line at Okazaki, Japan, which is Mitsubishi Motor's headquarters, is about 1 .5 times faster than the line at HMC. The rated capacity of HMC's new assembly line is about 60 cars per hour. Right now, however, HMC is operating only at about 85% of rated capacity. Following is the manager's explanation of th.e prob- . lem:
There are three main problems. First, there are shortages of parts from subcontractors. Mando, Inc., for example, one of the Hyundai group's subsidiaries and major suppliers, is sometimes · late with deliveries. Second, there are problems with Production Control. It keeps changing the sequence of lot production in order to accommodate changes in the schedule of the Sales De-
Ii Computer-aided design/computer.aided manufacture.

The Rise of Salaried Engineers 177
partment. Third, there is a lot of downtime of machinery, particularly in the body shop. The welding machines Qf the Machine Tool Division sometimes break down. There are also too many kinds of machines in the body shop, some from one supplier, some from another, some from the MTD. Maintenance is a problem.
In addition, the manager of the body shop said that there were some problems with local machinery and that the design of the line needed Improvement:
There are too many stations, and the materials-handling system sometimes jams. Every station has to be finished before the line proceeds. The company is going to have to change the line in the body shop, and improve the jigs and fixtures. By comparison with Okazaki, there are more workers per job at HMC. There are approximately 2.5 more workers per job. There are also more subassemblies on the line. The number of tasks per station is also greater. HMC is forced to do a lot in-house becaus.e the quality of parts is so low. For example, it might take 10 seconds . to tighten a screw at HMC compared with only 5 seconds at Okazaki. Several factors are involved. The screw is worse. The main parts do not match each other, hole for hole. The material is of poor quality. The design of the screw is poor, and the skills of the workers are inferior. There are no time-and-motion studies [done at] most parts suppliers:
A manager in the purchasing department confirmed that there were machinery problems in the press and body shops. Downtime was about 85%, due to new facilities and testing:
In the old facility, downtime is much less. Many small robots are made by the workers. There are small study groups of workers on each line. All have long experience at each station. If there are no absentees among the line people, then these workers [can] become floaters and develop new machinery. Absenteeism is very low at HMC.
The industrial engineers in the Methods Engineering Department have a high education level and high sta.tus in the plant. They are the people responsible for developing new production methods. They are then supposed to teach the foremen what to do. Members of the Methods Engineering Department are always traveling throughout the plant. If there is a problem a foreman cannot shoot, then the methods engineering people are asked to help. They are the people who get rid of the bottlenecks. The workers on the line are always working, they have

178 MANAGEMENT AND HUMAN RESOURCES
no time to think about new methods. The boss of the production line gives orders and controls. He has no time to think either.
The attitude at HMC is that everybody has to cooperate, to choose to work or to leave. According to a manager in the Production Engineering Department, when people work, they work hard-in spite of the fact that the government does not like to see HMC fire a worker:
If a worker is lazy, there is peer pressure. A few years ago, there were a lot of lazy workers. Now, everybody works hard. School and society teach them that they must work hard., The education level of workers is now higher. Workers obey fellow workers and supervisors. Workers and supervisors work together. About half of all supervisors are college graduates; about half are not. Young supervisors are all college graduates. A supervisor with a high-school degree has to have long experience.
Basically, inspection is done by workers themselves, of their I own work. Workers at the next station also check the previous station'S quality. There is also a big Quality Department. There ' is someone from the Quality Department at all major work stations. who [will] work together with the workers. Every five or six stations on every line has its own quality circle. Quality circles meet once a week, on average. HMC is trying to build a good quality circle movement. It cannot yet do as well as the Japanese. This is because workers do not yet haye enough experience; they are not all experts in their jobs. They have to do . more work than Japanese workers to improve quality. Quality circles set plans about how to achieve improvements in opera- " tions. Then they check actual progress against their goals. Sometimes they make the same mistake five times. They should do research to make and set their targets. Sometimes their problems prove too difficult to solve themselves. They have to call on the Methods Engineering Department. They have job rotation. The plant manager likes to do job rotation for learning purposes. Rejected cars become workers' teachers. HMC has introduced a new computerized system that allows a particular part to be traced right back to the worker responsible, or to the supplier.
The Engineering Center is responsible for design. HMC gets its platform designs from Italian designers and (now) designs the remainder of its cars. The Engineering Center was established at a fairly early stage in HMC's existence and has grown ' steadily. It is managed by a graduate from Seoul National University. (The plant manager graduated from the Korea Naval

The Rise of Salaried Engineers 179
Academy and has been a vice-president of HMC for a long time.) I t started with the Pony, and now its engineers are trying to design everything, including all parts. The Engineering Center is located in the same plant as the rest of HMC. People from production departments and people from the Engineering Center meet every day. They always have discussions. Designers come to the site because the Engineering Center has no experience, they are not exper'ts. Even if designers are right, they have to meet the workers. When a new type of car [the Excel] got started, the Engineering Center worked especially close with production. This is easily done since they are stationed in the same plant.
Subcontracting
The foregoing suggests a relatively high educational level of shopfloor management, from the ranks of industrial engineers and supervisors down to the workforce. The pro-activeness of management in attempting to raise productivity and quality is also evident, even if the effects were not immediately positive. For example, the effort on HMC's part to build some of its own on-line equipment had its problems at the time of our visit. But this initiative promises to give HMC tighter control over its process and costs in the long run. The emphasis on quality is also evident, although quality control circles were not yet functioning smoothly. Nowhere is pro-activity more apparent, however, than in H MC's efforts to forge a subcontracting network, to which attention is now turned.
One of Chandler's main points about the modern industrial enterprise is that the ones that succeed do so by tailoring their organizational structures to their competitive strategies. In the case of General Motors (GM), Chandler wrote: "It . . . successfully creat[ed] a general office [in the 1 920s] to coordinate, appraise. and set broad goals and policies for the numerous operating divisions" ( 1 962, p. 1 30). Vertical integration-()ne' competitive strategy that Chandler mentioned-was closely connected with the expansion of CM's general office: "The corporation acquired a general office to administer the many operating divisions that Durant [CM's founder] had collected in his strategy of vertical integration and constant expansion" ( 1 962, p. 1 62). Significantly, in the almost 50 pages that Chandler devoted to a discussion of strategy and structure in GM, he made no mention of a subcontracting strategy. GM subcontracted little possibly because it was an innovator, and few outside jirms were familiar with the parts that it required.
If one were to compare the strategy and structure of General Mo-

180 Y MANAGEMENT AND I-IUMAN RESOURCES , f
'r6;� in the 1 920s with that of Hyundai Motors (HMC) in the 1 980s, one would notice some similarities, even though GM was by far the'
larger of the two companies. (In 1 927 it was already building over 1 .3 million cars per year, while in 1986 HMC was building only 1 68,000.) Like eM, H MC initially pursued a policy of vertical integration. Key parts and components were made in-house, by firms within the Hyundai group (for exampl�, brakes and transmissions), Like GM, HMC also began to build a general office. The office was not positioned at the group level because the Hyundai group was diversified into a larger number of unrelated industries that was eM. Instead, it was located 'at the company level, but it played an analo� gous role to CM's general office on a much smaller scale. Nevertheless, it appears that H MC subcontracted to a far greater degree than
: did General Motors. As eM's volume rose, it increasingly integrated its operations, whereas HMC increasingly consolidated its subcontracting network as its volume rose.J2
As will be discussed shortly, HMC e�panded its managerial su�port staff at the company level to provide its subcontractors wit" technical assistance. Thus. the establishment of a subcontracting ne •
work did not altogether preempt the need for an in-house managerial support staff. Nevertheless, it probably reduced the size that such a support staff would have had to assume in the absence of subcontracting. One can say, therefore, that for all the similarities between eM and HMC in their youths, this was a significant difference in their development. GM emphasized an organizational structure whose, epicenter was the general office and that had a complementary strat-. egy of integration. HMC deemphasized the importance o(a general office and of integration to the extent that it pursued a strategy 'of subcontracting.
HMC emphasized a strategy of subcontracting for two reasons. First, to subcontract was cheaper than to integrate. Subcontracting arose in recognition of the limited financial resources and technological capability of a learner. Second., the government pressured HMC to patronize the small-scale firm in the interest of wealth sharing. I n its role as a learner and patron o f the satellite firm, HMC was consciously following in the footsteps of the Japanese automobile industry of approximately thirty years earlier.
JAPANS INFLUENCE ON KOREA'S SMALL· AND MEDIUM·SIZE FIRM
The marked resemblance between the chaebol and the zaibatsu leads one to ask whether small- and medium-size firms in Korea and Ja-
1 2 For information on GM. see Chandler (1964). Information on HMC was provided by HMC.

The Rise of Salaried Engineers 181
pan are also alike. It turns out that they exhibit both similarities and differences.
A striking difference concerns export behavior. In the early stages of Japanese industrialization, small-scale firms were the principal exporters. In the 1 920s, ·
Despite the strategic importance of the modern zaibatsu enterprises, medium and smaller factories employed the overwhelming majority of Japan's industrial workers. Even more important, the zaibatsu firms produced primarily for the domestic market, but the medium and smaller enterprises concentrated on production for export. With a few exceptions such as rayon, silk yarn, and cotton textiles, where large enterprises were also strong exporters, medium and smaller manufacturers of sundries such as bicycles, pottery, enamelware, canned goods, hats, silk textiles, and so forth were contributing from 50% to 65% of all of Japan's exports. And they were losing money doing it. (Johnson, 1 982, p. 98)
In 1 953, smaller factories in Japan employed 70.9% of all workers in manufacturing industries and accounted for 54% of value-added in output. They were estimated to be responsible for approximately 60% of all exports (Asia, 1 957).
No comparable export figures are available for Korea, but it appears tha,t, contrary to the historical pattern in Japan, small firms in Korea serve the domestic market, and large firms export. According to Samuel Ho, who in 1 980 wrote about small-scale enterprises (SSEs) in both Korea and Taiwan, "because most SSEs produced primarily for the domestic market, the export promotion policies did not in general directly affect the small-enterprise sector" (emphasis added) ( 1 980, p. 88). Youngil Lim's analysis of data from the Small and Medium Industries Bank in Korea suggests that its clients typically export between 1 0% 'and 20% of their output, whereas in the aggregate; Korea's exports amount to approximately 35% of output (198 1 ). In a study of over 500 small- and medium-size firms in the machinery sector, Jae Won Kim fou-nd that approximately 60% did not export at all ( l983). Small- and medium-size firms in Korea appear to" be marginal exporters despite the fact that they account for a large share of employment, as do small firms in Japan. Table 7.9 indicates, however, that theiI,' employment share is decreasing. Korea's small- and medium-size firms (with fewer than 500 workers) employed as much as 88% of the work force in 1 958, down to only 63% in 1 983 .
As for similarities, although small-scale firms in Japan have been better able than their Korean counterparts to take shelter behind monopoly legislation, small-scale firms in both countries have faced government discrimination during the heydays of heavy industry and

00 II,)
Table 7.9 Size Distribution of Manufacturing Firms by Number of Employees, 1958- 1983
No. of Employees
5-9 10-99
100-499 500 or mOre
Total
1958
44,064 (16.79) 1 29,720 (49.44)
55,557 (21 . 17) 3 1 .086 {I 1 .85)
262,385
1963
60,564 (14.99) 1 67,607 (41 .49) 84,418 (20.90) 89,392 (22.13)
403,944
SImT<tS: Korean Reconstruction Bank and Economic Planning Board.
No. of Firms (% of Year's Total)
1969 1973
103,620 (12.47) 74,729 (6.44) 235,804 (28.38) 259,291 (22.34) 2 15,862 (25.98) 3 18,982 (27.48) 273,758 (32.94) 505.827 (43.58) �3 1 ,0 13 . 1 , 160,802
1978 1 983
69,731 (3.30) 90,261 (4.07) 479,259 (22.67) 660,366 (29.78) 635,81 6 (30.08) 639, 1 19 (28.83) 927, l l9 (43.86) 825,487 (37.23) 2 , 1 13,903 2,2 17,216

The Rise of Salaried Engineers 183
rapid growth.l3 The mastermind behind japan's fast-growth strategy, Hayato Ikeda, had to resign as prime minister after his "slip of the tongue" in the Diet about not caring if a few small businessmen were driven to suicide (Johnson, 1982, p. 2 14). No politician in Korea ever resigned over abuse of the small-scale sector, but only because democracy, not discrimination, was less evident than in Japan.
The most striking similarity between the smaIl- and- medium-scale sector of Japan and that of Korea is subcontracting involvement in the automobile, shipbuilding, machinery, and electronic industries. Being older and operating in a larger domestic market, the Japanese subcontracting system in the automobile sector is more highly articulated than is Korea's, and it involves several layers of subcontractors. However, the two systems closely resemble one another. This is not surprising, since they are directly linked through technology transfer and both operate on the basis of a just-in-time (jIT) inventory system. 14
The philosophy behind JIT is that production with minimum inventories forces firms to be efficient and quality conscious; if, in the absence of inventories, efficiency and quality are low, then delivery dates c;lnnot be met. Furthermore, interviews with Korean automobile parts suppliers suggest that excess stocks do not disappear from the shelves of automakers only to reappear on those of their suppliers. The finished goods and work-in-process inventories of autoparts suppliers in Korea appear to be low: Profit margins are themselves too low to support' more. Hence, inexperienced suppliers in Korea have had to learn in a very pressured and disciplined environment. Although the big auto.mobile companies in Korea provide some technical assistance to suppliers, the big companies' expertise is itself
13 (n Japan, a law in 1925 allowed small- and medium-size firms to cartelize in order to remain in business wi.thout resorting to "dumping." Although this privilege was withdrawn in 1948 by the Supreme Commander of the Allied Powers, MITI introduced a law in the Diet as soon as the occupation ended in 1952 that enabled MITI to create cartels among small businessmen as exceptions to the Antimonopoly Law (johnson, (982). Very recent legislation in Korea is likewise intended to help smalland medium-size firms to cartelize. Some such firms also enjoy high market shares naturally. One-quaner of Jae Won Kim's sample of 500 machine shops had market shares of over 60% 0. W. Kim, 1983). Yet by Japanese standards, cartelization and monopoly among small- and medium-size firms in Korea is underdeveloped. For data on discrimination against small- and medium-size firms in credit allocation, see Y. J . Cho and Cole ( 1986). K. E. Lee (1984) looked at other forms of discrimination against them.
14 Toyota's JIT system of "kanbans" does not operate in HMC, but HMC has adopted another system of just-in-time. For a discussion of the Japanese manufacturing system, including JIT, see Schonberger (1982). For a discussion of the JIT system at Toyota, see Ohno ( 1984) and Cusumano (1985).

184 MANAGEMENT AND HUMAN RESOURCES
limited. Hence, technology has had to be acquired by suppliers witp minimum know-how, deliveries have had to be met with minimum inventories, and profit margins have had to be preserved in a business setting of intense competition.
What follows is an account of interviews with subcontractors in Korea's automobile industry that parallel the interviews, presented earlier, with Korea's largest automobile pFime contractor, HMC. IS
THE SUBCONTRACTING NETWORK OF THE HYUNDAI MOTOR COMPANY (HMC)
I n 1 985. a manager in HMC's Parts Supply Department, call him Mr. Shin, said that HMC subcontracts about 40% of value-added in a standard car. The following paraphrases Mr. Shin's comments:
Of this 40%, a " large" share is subcontracted to "independent" suppliers within the Hyundai group [e.g., Hyundai Precision Industriies, and Mando, Inc.). The Korean government prohibits prime contrac/ tors from owning equity in subcontractors, but a company like Man . , Inc. is a legal entity within the Hyundai empire. (Mando, I nc. was divested by HMC to comply with the law.) The remainder of the 40% comprises small parts and components that are supplied by 1,85 small- and medium-si1.e firms.
In 1980--198 1 , HMC eS,tablished the Parts Development Department (PDP). This department was modeled on the vendor development department of H MC's competitor in Korea, the Daewoo Motor Corporation. Tiu Daewoo Motor Corporation organized its vendor tkvelapment department in ' 1966 at the suggestion of its Japanese technoloffY StltppLier, the Toyota Corporation, to raiSe the technical standards and quality of inexperienced vendors. The parts suppliers of HMe were tiny and had no technology. It became HMC policy to bring them up to a hig�er standard. The Parts DeveloplJ1ent Department employs 1 50 engineers with college degrees. Typically, a group of three to ten engineers is formed and'9ispatched to a supplier. The group first studies the supplier's line, from receiving to inspection. It looks for bottlenecks to determine what parts of the line are responsible for delays. It examines jigs and ' fixtures to assess quality.
All parts suppliers that received assistance from the PDP made a giant step forward. They were taught how to clean house. They were taught the importance of visual control so that there were no hidden
15 The names of subcontractors and the types of products are disguised. In all, twelve subcontractors were interviewed, six of HMC and six of its competitor, the Daewoo Motor Corporntion (DMC). DMC is a joint venture between the Daewoo group and General Motors. (The DMC interviews are neit reported.) ,

The Rise of Salaried Engineers 185
work stations. They were taught how to make their process a straight line. They were taught the basics.
The PDP got to know a lot about its suppliers. It would receive drawings from HMC's engineering center, study the drawings, and then choose a parts maker. Discussions would then begin with the supplier about how to improve the drawings and how to manufacture the parts at low cost and high quality.
Myongdo Industrial Co. (MIC)
According to Mr. Chung, former quality control manager at HMC, and currently plant manager at MIC:
The M yongdo Industrial Co. (MIC) has 170 employees in twO plants. Most work is in the larger plant located in Ulsan, close t.o HMC. The president of MIC owns 90% of the equity of MIC, and the number-two man owns 10%. MIC makes pistons.
HMC has two piston suppliers, but MIC supplies 1 00% of its output' to HMC. Almost all suppliers have the same relationship with HMC. MIC maintains about two days' inventory. It has problems with its vendors. Sometimes the steel they supply does not have the correct porosity. Each month, MIC receives an order from HMC for the following month and a forecast for the following two months (MIC also gets an annual sales forecast). For purposes of planning, it adds 1 0% variability to demand. Although HMC's monthly requirements are fixed, daily requirements fluctuate. , MIC negotiates with H MC on price. HMC knows everything about
MIG's finances. Regular negotiations are held over' the price of existing parts. In the case of new parts, the two companies calculate the cost of construction. Then H MC tests the part, and they renegotiate. Prices are fixed until there is a change in material prices.
MIC gets some financial assistance from HMC. In the case of a new investment at �IC, HMC gives it advance payment. HMC also gives it credit to buy new machinery from Hyundai Heavy I[ldustries. Most of MIG's finance, however, comes from the Small and Medium Industrial Bank.
MIC -gets technical assistance from HMC. When MIC starts to make a new part, HMG's people work together with MIG's. But HMC can'not give specialized technical assistance because it does not have the know-how. MIC had to ask a Japanese equipment maker to supervise it for a while.
MIC gets assistance for quality control from HMC. HMC taught it about inspection standards and how to develop quality. MIC and HMC meet to discuss quality. Usually HMC people don't come to MIG's factory unless there are problems with quality. In the case of

186 MANAGEMENT AND HUMAN RESOURCES

The Rise of Salaried Engineers 187
Sodaemun Company
According to the general manager, the Sodaemun Company has been making automobile parts and components for more than 10 years. It has five factories with a total of 240 employees. The factory in question is located in Ulsan, close to HMC. The company makes steering equipment parts and, on average, delivers to HMC once a day. It sells to HMC and to the Korean military. It also sells to Hyundai Heavy Industries. The company, however, is very dependent on HMC.
Sodaemun has no "special" ties with HMC. Nor does it receive financial assistance from HMC. I t does, however, receive credit for new tooling. Often, the people from Sodaemun and from HMC get together to discuss technical problems associated with new designs. HMC's product development department, however, provides only the basic designs. Sodaemun does all the detail engineering. It also does cost breakdowns for new designs, which it gives to HMC for negotiation. HMC reimburses Sodaemun for tooling costs, sometimes by giving it' a lump sum payment, sometimes by folding costs into unit price. Whatever the case, costs are never computed to include design work, prototypes, and samples. Moreover, there is a time lag between development and mass production, which HMC fails to consider. Sodaemun has lost money on some models.
SUBCONTRACTING: A SUMMARY
Subcontracting in late industrialization requires sufficient output volumes by prime contractors to enable suppliers to specialize. 16 In the automobile industry in Korea, this condition began to take hold in the 1980s, and a subcontracting system arose that was a microcosm of Korea's industrial economy. The system was hierarchical, but like Korea's factory system, without many layers, and like its economy at large, manipulated from the top by the government. The effects of subcontracting were also like those of other parts of Korea's economic system, more desirable from the viewpoint of economic growth and efficiency than from the viewpoi�t of equality.
The major piece of legislation from the government to stimulate subcontracting carne in 1 982, when global economic depression in-
16 Subcontracting may be greater where prime contractors are locally owned firms. In the case of Daewoo Motors, for example. in which General MotoTS holds a 50% stake, subcontracting existed, but possibly on· a smaller scale th,lO in HMC. The scale was smaller because DMC imported more parts than did HMC. Moreover. instead of SUbcontracting to local firms, DMC formed join! ventures in Korea with CM's American suppliers, such as Delco Remy, that had established operations in Korea.

188 MANAGEMENT AND HUMAN RESOURCES
tensified competition from Japan. The Small- and Medium-Industry Systemization Law appealed to the better sense of big business by empowering the Minister of Commerce and Industry to reserve certain industrial spheres for small- and medium-size subcontractors (Article 5). The law also forbade prime contractors from swallowing up subcontractors through stock ownership. Additionally, the government undertook responsibility to provide more financial and tax incentives to enable subcontractors to modernize their factories and . to acquire technical assistance. It introduced a scheme to reduce the risks they faced in commercializing new technologies. Finally, it provided guidelines on fair trade practices, for example, on the frequency of payments and the length of subcontracting contracts. These guidelines ' were enforced by a large bureaucracy in the Economic Planning Board. Subcontracting surged ahead after 1 982.
In terms of equality between big and small business, Korea's subcontracting system, like japan's, has left much to be desired. As a consequence of prime contractors' operating procedures, the day-today working environment of subcontractors is stressed. As a conse,t quence of prime contractors' market power, the profit margins 6f subcontractors are squeezed. In terms of growth and efficiency, however, Korea's subcontracting system has been an ideal vehicle q.y which to spread the progressive practices of the modern . industrial enterprise to the remainder of the productive economy.
SUbcontracting has acted as a transfer mechanism in three respects. First, prime contractors have imposed on-time, on-spec l7 de; livery conditions on subcontractors. Second, the production systems of subcontractors have become extensions of those of prime contra�tors, including the just-in-time inventory management system. Third, salaried managers themselves have been transferred to supplier firms, which has tended to raise the overall t;ducational level of Korean business. Cn Korea managers of even small- and medium-size subcontractors are well educated. In the machinery sector, for example, of a sample of 441 subcontractors in 1983, as many as 73% employed college-educated managers (j. W. Kim, 1 983). In part, such high educational attainments in the small- and medium-scale sector reflect Korea's high investments in education. In part, they reflect the interpenetration of prime contractors and subcontractors through the .exchange of personnel. Subcontracting has tended to generalize the practices of salaried management, and the efficiency of salaried management has become one of Korea's competitive strengths.
17 On-spec refers to deliveries that conform to predetermined quality standards.

CHAPTER EIGHT
The Paradox of "Unlimited" Labor and
Rising Wages
LABOR IN LATE INDUSTRIALIZATION
By the standards of both contemporary and earlier industrializations, real 'average wage increases in Japan, and in Korea especially, are possibly unprecedented. Late industrialization is characterized by a labor supply that is almost unlimited, an absence of a cadre of skilled workers who could provide trade union leadership, and a lack of opportunity for mass international migration. All these factors have favored a low rate of wage increase. Yet real average wages appear to have risen, even if only desultorily, in most late-industrializing countries. They have risen sharply in Korea and Japan.
The rapid rate of wage increase in Korea and Japan during their periods of ultrafast growth has lent the industrializations in these . countries a particular character. The low level of real wages has underscored the international competitiveness of both economies. The rapid rise of real wages has driven the more prudent firms to invest in greater technological capability for the future. The combination of low wage level" and fast wage increase has contributed to the dynamism of Korean and Japanese growth.
The reasons for such wage behavior are in part unique and in part extreme variants of properties that are general to late industrialization. The unique factors include an ultralong workday and an espe- . cially high real income per farming family in Korea and Japan. The general property of the labor market of late industrialization that takes a particularly strong form in Korea and Japan is segmentation, by manufacturing industry and sex.
This chapter examines the forces behind the operation of the labor market and real wage increases in Korea. Because scarcity and supply and demand cannot alone explain the operation of Korea's
189

190 MANAGEMENT·AND HUMAN RESOURCES
labor market, the chapter ends with a discussion of the imperatives of technology and the skill set of late industrialization that have driven : big business to pay more.
ihe argument is as follows. In industries in which the technology transfer problem was fairly complicated and in which Korea lacked experience, workers were paid relatively high wages not because of a shortage of particular skiils but in order to induce them to exercise their intelligence and make imported technology work. The wage rate in Korea was driven up especially fast by the exigencies of learning because the learning experience in Korea was especially intense. The learning experience was especially intense because it was undertaken by local rather than foreign firms, happened in a great spurt, and occurred in large, bureauc;ratic enterprises. Business was also pressured by government to share its wealth with labor.
LABOR SUPPLY
Countries that have industrialized since World War 11 , by comparison with either England, the European emulators, or the United States:" have done so on the basis of far larger labor reserves, or what Lewis ' ( 1 954) called an unlimited supply. Greater labor reserves may be in� ferred from differences in population growth rates, international migratory flows,. ;md obstacles to labor organization. I (They cannot be inJerred from unemployment rates because these are statistically unreliable.)
Population According to Kuznets' ( 1 966) estimates for countries that are currently industrialized, the growth rate of population from the mid-. 1 700s and onward was rarely more than 1 .5%. One exception was the population' of the United States, which grew very fast because of inward migration. The population of Japan, on the other hand, was
' There was rlot .always overpopulation and excess labor in what is known today as' the Third World. At f,rst, the Americas were short of a voluntary work force and depended on European migration and slavery; the foreign plantations and mines in remote parts of Africa and Asia experienced severe labor shortages and relied on stale coercion. Both slavery and coercion. explain why a high-wage economy failed io develop in the face of lahar scarcity:
.
Sometimes the pressure was applied directly, and the administrative power of the colonial government or indigenous rulers was used to direct labor to the mines and plantations. More frequently. the pressure was applied indirectly, by imposing a poll tax or a hut t3X, which obliged the' indigenous people in the subsistence economy to come out and work in the mines and plantations so that they could pay their taxes. (Myinl. 1 964. p. 6 1 ) .

The Paradox of ·Unlimiloo" Labor and Rising wages 191
abundant throughout the period of industrialization despite a very low population growth rate. From 1 869 to 1940 the Japanese population is estimated to have grown at only about 1 % per annum; after the war it grew by only about 1 . 1 % (Patrick and Rosovsky, 1976). By contrast, in developing regions (excluding Latin America), the population growth rate steadily increased from about 1 .5% in the 1940s to about 1 .7% in the 1 9505. In Latin America the average annual population growth rate was 1 .9% in the 19305, 2.3% in the 1 940s, and 2.7% in the 1 950s (Sanches-Albornoz, 1974), In the 1960s, population growth rates averaged 2.4% in "low income" countries, 2.5% in "middle income" countries (which include Korea ·and other lateindustrializing countries), and 1 .0% in industrialized ones (World Bank, 1 979) . All told , the typical colonial pattern produced abundant surplus labor. Minimal investments in health and sanitation by the colonial authorities enabled the population to grow; minimal investments in industry and agriculture dampened demanq for labor's services; hence, the ultimate "distortion" of excess populatipn brought about by colonial rule.
Given Korea'S traditional high population density and inequitable income distribution, a scarcity of labor never existed, even in the mines and plantations of the Japanese colonialists. During the colonial period the labor market behaved as one would expect; between 19 10 and 1 940, real wages fell (Grajdanzev, 1944).2 Further evidence of excess reserves came during World War II when 2 million Koreans were drafted to work in japan's least remunerative ind�stries, with no perceptible impact on Korean production. Although land reform in late- 1 940s Korea was labor absorbing, by 1 960, one year before the military coup, it was estimated that perhaps one-fifth of the industrial and agricultural work force-2 million people-were unemployed (Reeve, 1963).
International Migration
By comparison with countries that industrialized relatively early in world history, japan's industrialization marked a turning point after which countries experienced not only faster growth rates of population as they industrialized but far fewer opportunities to send their surplus populations abroad. Since the end of World War II, capital has become more mobile internationally, while labor has become far less so.
Permanent emigration from Korea is said to have begun in the eighteenth century when . people in the northeastern part of the
2 In Taiwan, by contrast, they appear to have risen. See Ho ( 1984).

192 MANAGEMENT AND HUMAN RESOURCES
country strayed into Manchuria. I t reached a rate of 60,000 a year by the early nineteenth century and continued under economic and political duress during the period of Japanese rule (8. Kim. 1 982a). When industrialization got under way, however, annual emigration was generally well under 10% of the natural increase in population. Fewer than half a million Koreans emigrated permanently in the two decades following 1 962 (8. Kim, 1982a).3
The overall permanent migration from Korea and from the rest of the developing world has . been relatively modest because of restrictive immigration policies in the developed countries. According to Kuznets,
The significance of intercontinental, and presumably international, migration in the growth of countries of origin and of destination in the nineteenth and early twentieth centuries lends importance to the failure of Asia, Africa, and much of Latin America to participate-even before World War I-and to the sharp decline in these flows after World War I. Perhaps it merits specific notice that Japan. which entered the phase ' of modern economic growth well before the twentieth century, could not fully participate in the emigration toward the more developed areas. ( 1 966, p. 56)
The contrast between 'present-day ,migration and that of the period from the second half of the nineteenth century to the end of World War I is striking. An estimate of European migration during the period 1 85 1-1920, when the population of all of Europe was far smaller than that of the developing world today, puts the number at· more than 40 million. About half of those who migrated did so in the last three decades of the nineteenth century-a number equivalent to over 40% of Europe's natural population increase during those ' years (Woodruff, 1 973).
.
Obstacles to Labor Organization
By comparison' with countries that achieved industrial transformation earlier in world history, countries that have industrialized since World War II have generally tended to do so in the absence of a
3 Temporary emigration, or contract·labor migration, was initiated by the Korean government in 1963 when roughly 250 coal miners and later some 1 ,000 nurses were sent to the German Federal Republic. Then. in the late 19605, approximately 25,000 construction workers migrated to Vietnam. Finally, beginning in 1974, the boom in the Middle East drew tens of thousands of Koreans to overseas construction sites. Annual migration to the Middle East skimmed the supply of able·bodied men arid drove up wages at home. But the Middle Eastern migratory flow proved ephemeral (Han'guk /lbo, 1986c; Chasm [lbo, 1986).

The Paradox of "Unlimited" Labor and Rising wages 193
coherent trade union movement or of a parliamentary labor party. The weakness of trade union activity is partly tied to the demise of the skilled crafts, which says something additional about the skill base of late industrialization. Whereas skilled labor in earlier industrializing countries was at the vanguard of worker protest movements and trade union organization, a property of late industrialization is a relatively small role for the same type of manual skilled labor in any capacity-be it labor leader or scarce resource. Discussion here is restricted to the first, that of labor organizer.
In early-industrializing countries, the extreme difficulties of effective general unionization---due to rapidly increasing population, gre-dt labor mobility, very low real incomes, sharp economic fluctuations, and a hostile law-were chipped away by the class of skilled workers. In England, "Effective trade societies were first confined to the skilled handicraft workers-the 'aristocracy of labour' .. (Mathias, 1969, p. 364). In Germany,
.
At least some part of the developing working class in the second and third quarter of the nineteenth century would have been former artisans (using the term in a broad sense) who, although their earnings may have been higher in the factory, felt that their skill had been degraded and suffered a sense of deprivation. This kind of former artisan resentment contributed to the foundation of a labour movement, particularly of the Lassallian sort. (Kemp, 1 985, p. 105)
In the United States, The experience of the post-Civil War decades clearly indicated the great difficulties trade unions confronted to sustain themselves in the face of periodic business depressions, bitter employer resistance, and hostile public authorities. To cope with these problems, Gompers and his associates . . . argued that unions had to "perfect" their organization and establish themselves on a "permanent" basis by providing their members with unemployment ben,efits, burial insurance, sick pay, and strike benefits. . . . This mode of organization was far easier to establish with unions that represented skilled rather than unskilled workers. (Shefter, 1986, pp. 259-0)
. The part played by the artisan in late industrialization has depended on the counry. In Japan, the role of artisans resembled more that of early industrializers than that of late. ones. According to Sumiya,
Manpower for Japanese industrialization came essentially from two groups. The first and major source was children of former

194 MANAGEMENT AND HUMAN RESOURCES,
samurai, craftsmen, and peasants who migrated to the cities. They (children] were employed as apprentices and became modern
, factory workers after training. Craftsmen themselves were the second source of factory la
bor. Since training of skilled workers was urgently needed for industrialization, the skills of traditional craftsmen were used whenever possible, while many were retrained to become skilled workers. ( 1974, p. 33)
As for unionization, Sumiya traced its origins to those Japanese who had gone to work in California in the 1 890s and there formed a group patronized by Samuel Gompers. On returning to Japan, the group helped establish a union among 'iron workers and then railway engine drivers and printing workers. Sumiya wrote,
These unions not only were American-type craft unions in organization, . . . but also followed the AFL example; . . . [They] demonstrated not only the considerable increase in the number of industrial workers resulting from the growth of the factory / production system but also ,the sense of unity that emerged among ' , workers' in the same craft or trade based on common interest shared and communicated as they moved from shop to shop. " ( 1974, pp. 38-9)
In India, handicrafts had been highly developed at the time of foreign intrusion, but the artisan failed to play the role of uniolt orgaJ:lizer because the sequence of industrialization differed from that in England, Germany, or the United States. Instead of modern ma� chines displacing artisans directly and driving them to organize in defense, the displacement was indirect due to colonialism. In India, as in other late learners, industries that could use modern technol: ogy did so by way of import substitution, not by the destruction of artisanal production, which expired in the face of coercion and como' petitive imports from more advanced countries long before the arrival of factory production. The British Crown legislated the decrep:itude of the handloom weaver in India in the interests of the East India Company, and then free trade furnished the final blow (Bagchi, 1982); The Governor-General of East India, and later Marx, Wrote about the bones of the hand loom weavers bleaching in the Indian countryside. When a modern textiles industry eventually emerged in India (in the last quarter of the nineteenth century), its victims were competitive imports, not skilled artisans, whose fortunes had long ago declined.
The sequence of events was somewhat different in Korea, because at the time of colonialism's arrival handicrafts were far less !level-

The Paradox of "Unlimited" Labor and Rising Wages 195
oped than they had been in I ndia when the British arrived. When, after the Korean War, production with modern machinery finally commenced on a sizeable scale, surviving crafts that required traditional skills were accorded low status. Many skilled trades that hadn't been beaten down-furniture manufacture, tailoring, and tanningbegan to be undertaken in the "informal sector." From special surveys, it seems that the informal sector was about 8 million people in 1979, or as much as one half to two thirds the size of nonagricultural employment (Bai, 1 982; Lindauer, 1 984). The application of surviving crafts in the informal sect.or has meant the following: ( I ) Such crafts were still frequently the pursuit of the self-employed rather than of the paid employee. (Of the estimated 8.3 million persons in the informal sector in 1 979; roughly one third were either self-employed-2 million people-or family workers-half a milIion people.) (2) The remaining two thirds were regular, temporary, or daily workers, many of whom were low paid and had the lowest status. In either case, no material for labor leadership emerged from the informal sector . .
In the formal sector, the technological changes that modern machinery had undergone by the time it began to be used, and the employment norms of paid labor that arose in tandem, created only moderate demand for traditional skills, as discussed shortly. A new "labor aristocracy" was established, but its skill base was nontraditional. This new labor aristocracy, moreover, was helped rather than hurt by modern machinery and, if for no other reason, played a negligible role in trade union growth in the 1950s through 1 980s.
THE RATE OF PAY
Under conditions of repression, unlimited labor supply, absence of international migration, and weak grouping of skilled workers, one would expect at most stability-if not decline-in real wage rates. Yet average real wages in manufacturing have tended to rise somewhat in late-industrializing countries. In Korea, they have positively soared. Table 8. 1 compares real wages in Korea, Brazil, Argentina, Mexico, India, Turkey, and Taiwan in the period 1 970-1984. The 1970s were a period of rising real wages in all these countries, but in Korea wages rose spectacularly. The index of real wages in Korea increased from a base of 1 00 in 1 970 to 238 in 1979.4
• Industrialization. of course. began before 1970 in all these countries. but . wage increases were faster in Korea than in India. Brazil, or Taiwan also during the earlier period. Taking 100 as the base in 1957, the wage index in 1969 reached 77 in Brazil. 123 in India. and 156 in Korea. (Korea: see Richardson and Kim, 1986; Brazil: Souza, 1978; India: Lucas. 1986.)

196 MANAGEMENT AND HUMAN RESOURCES
Table 8. 1 Comparison of Real Nonagricultural Wage Increases in Seven Late-Industrializing Countries," 1 970- 1 984
Year Koreab Brazil< Argentina Mexico Turkey Indiad Taiwan
1970 100 1 00 100 ' 100 100 100 1 97 1 102 1 10 105 103 1 00 100 1972 104 1 1 4 99 104 99 100 1973 1 19 1 1 9 1 07 104 98 106 107 1974 1 30 1 19 126 107 96 97 98 1975 1 3 1 127 124 1 14 1 16 1 10 1 10 1976 154 . 129 80 123 122 120 126 1977 187 134 76 125 146 1 16 1 38 , 1978 219 142 77 122 147 124 1 5 1 1979 238 134 87 121 155 130 163 1980 227 1 30 100 1 16 124 166 1 9t H 225 1 18 91 1 19 1 30 1 7 1 1982 241 1 1 5 79 1 17 129 180 1983 261 97 97 86 130 1 88 1 984 276 84 1 12 83 1 1 1 19 1
• Base � 1 00. Deflated b y consumer price indeK. � 'Real earnings manufacturing sector.
< Average wages for skilled workers in construction. Data are from the Central Bank. � d Rupees per hour for industrial workers.
Sourc.: Korea: Richardson and Kim ( 1986). Brazil, Argentina, and Mexico: Paldam and Riveros ( 1987). I ndia: Lucas ( 1986). Taiwan: Council for Economic Planning and Development (various years). Turkey: Institute of Statistics (various years).
Korea's wage behavior appears to be unrivaled in earlier industrial revolutions, although japan's is almost as impressive. Of course, crosssectional and intertemporal comparisons are by no means conclusive because of the universal fragility of wage data-the more distant the' past and the less legitimate the political regime, the less 'reliable the data-and because of differences in the length of the time period considered-the shorter the time horizon (only two gecades in Korea's case), the less the certainty that one is observing a secular trend. Overall, howeyer, the average rate of real wage increases in Korea's post-World War II industrialization appears to be faster than that of earlier vintages.
In the case of England, Lindert and WiIliamson (1983) used new data and new methods of data manipulation to show that in the seventy-year period spanning 1 78 1 to 185 1 , their "best guess" of the increase in the real full-time earnings of all British workers was , 155%. 99% in the case of blue-collars workers. In their most pessimistic scenario, the gains were 1 00% and 62%, respectively. However rosy Lindert and Williamson's "best guess" estimate, it pales by compari-

The Paradox of ·Unlimited" Labor and Rising wages
Table 8.2 Average Earnings in Korean Manufacturing, 1955- 1980 (in Thousand Won/Annum)
Real Earnings
Index Nominal Number % Change from
Year Earnings ( 1975 = ( 00) Previous Year
1955 1 5 40.3 1958 24 44.2 3.2" 1963 40 47.0 1.3" j966 67 47.9 0.6" 1967 82 52.7 1 0.0 1969 129 66.4 13.0' 1970 1 59 70.6 6.2 1971 190 74.3 5.2 1972 2 1 6 75.6 1 .8 1973 267 90.6 19.9 1974 347 94.8 4.6 1975 459 100.0 5.5 1976 587 1 10.9 10.9 1977 759 130.1 17.3 1978 1 ,050 157.5 2 1 . 1 1979 1 ,378 174.7 10.9 1980 1 .759 1 73.2 -0.9
"The computed average annual percent change over relevant interval.
Source: All data are originally from the Mining and Manufacturing Survey or Cen' sus. Collection of these data has been the responsibility of various agencies. includ· ing. in chronological order: Bank of Korea. Korean Reconstruction Bank. and Eco· nomic Planning Board. For the years 1970- 1979. the data are from the tabulations of Ihe Small and Medium Industry Handbook (,1980). as cited by Lindauer (1984).
197
son with Korea's. Table 8.2 presents a longer profile on real wages in Korean manufacturing, from 1955 through 1 980 (and on average, manufacturing workers in Korea are among the lowest paid in the country [Richardson and Kim, 1986)). By comparison with English data, the following is striking: White it took English workers seventy years to raise their real earnings by rough 1 50%, Korean manufacturing workers achieved a comparable gain in about 20 years (from 1955 to 1 976). In just one decade, 1969-1 979, real wages in Korea rose by more than 250%. . .
.
The long-run trend in real earnings of workers in the United States, England, and the European emulators nas been estimated by Brown ( 1986). The' most authoritative source for comparative purposes, Brown's data are for the period 186(}""1 9 1 3 for five countries: France, Germany, Sweden, the United Kingdom, and the United States. Among the five countries, real average wages (expressed in compos-

198 MANAGEMENT AND HUMAN RESOURCES
ite units of consumables) grew fastest in the United States. Taking, therefore, the U.S. index at its trough and peak-approximately 45 in 1865, just after the Civil War, and about 1 30 in 1913, just before World War I-real wages increased in the United States by a factor of almost 3 in roughly fifty years. In Korea, however, real wages increased even faster: As indicated in Table 8.2, real earnings quadrupled from trough to peak in roughly half as much time, twentyfive years.
japan's best wage data are divided into two subperiods, 1900-1935 and 1 950-1968, and refer to workers in manufacturing establishments of thirty or more production workers (Minami, 1973). Ignoring gender differences, real wages for all production workers rose from about 1 20 yen in 1 900 to abou t 430 yen in 1935, or by a multiple of 3.6 in thirty-five years. After World War II they rose even faster, following labor unrest in 1947"':1949 and the onset of the prosperous postwar international division of labor. Real wages rose by a factor of 2.7 in eighteen years, from approximately 400 yen in 1950 to about 1 200 yen in 1968. Again, however, real wages in Korea rose even faster-by a scalar of 4.3 between 1955 and 1980 and by one of 3.6 between 1966 and 1980. Wage rates in Korea, moreover, are understated in comparison with those of Japan. Whereas Korean data are restricted to firms with over ten workers, Japanese data are restricted to firms with over 30. Yet smaller firms in Japan are believed to have begun paying lower wages than larger firms after the 1920s (Minami, 1973, pp. 172-3).
.
THE REASONS BEHIND RISING REAL WAGES
When a price increases, one is inclined to think that scarcity is involved. Yet one cannot explain Korea's wage behavior simply by supply and demand analysis. Indirect labor, which includes managers, engineers, and technicians, is supposedly the scarcest type of labor in backward countries. Thus, one would expect late industrializers to experience �bundance and scarcity of direct and indirect labor, respectively, the wages of the latter modestly pulling up the overall average, if at all. The pattern of wage increase in Korea, however; flies in the face of expectation. As Table 8.3 indicates, in four subperiods from 1965 to 1 984, the rate of wage increase was higher for production workers than it was for professional, technical, or managerial employees in spite of the excess supply that is �elieved to have characterized both labor markets, especially the one for production workers.
In the late 19705, Korea supposedly reached a "turning point" (Bai, 1982), its supply of surplus labor vanishing, with the outflow of

The Paradox of 'Unlimiled" Labor and Rising wages . 199
Table 8.3 Rate of Wage Increase in Korea for Production and Professional, Technic-ell, and Managerial Workers, 1965- 1984
Period
1965-1970 1 97 1 - 1 974 1975- 1 979 1980- 1984
Wage Increase Rate
Production Workers
12.8 7. 1
16.8 5.3
Professional, Technical, and Managerial Workers
6.6 6.1
15.3 2.5
Source: 1965-1979. Bai ( 1982); 1 980- 1 984. Minislry of Labor ( 1985).
workers-mainly to the Middle East-amounting to as much as 27% of the male mal,lufacturing work force (Ministry of Labor, various years). Table 8.3 confirms that wages increased in the late 1970s especially fast. Nevertheless, such scarcity proved short-lived with the collapse of the Middle Eastern construction market and a slowdown in Korea's growth rate.5 Thus, in the twenty years spanning 1965 through 1 984, a tight labor market was the exception to the rule. yet real wages rose persistently.
The wage question in Korea is further complicated by the fact that. although all workers experienced some increase in real wages, the increase was unevenly distributed across firms of different size. industries of different 'capital intensity, and workers of different sex. The lowest paid workers. say in light manufactures in the informal sector and textiles in the formal one, have continued to receive what even Korea's state-dominated labor federation has admitted are little more than s1,lbsistence wages, whereas workers with comparable levels of experience and education in the heavy industries are among the highest paid.6 Thus, firm behavior toward labor has become increasingly differentiated, a reflection of a high degree of differentiation among firms in terms of size, capital intensity, organization, and management (see Chapter 7).
The behavior of real wages in Korea therefore must be examined not merely in terms of supply and demand, but also in terms of institutions and history. To arrive at the explanation for why real wages have risen more rapidly in Korea thari·· iri other· jate�lndust.riaJ� izing countries. · the following areas are explored: the fast rate of capital accumulation; the low base from which wages in Korea have risen; the structure of Korean agriculture- a consequence of land • 5 Unemployment of college graduates was especially sharp in the late 1960s and 1980s (Donga !lbo, 1987).
6 For a discussion of the subsistence nature of Korean wages. see J. C. Lim ( 1986).

200 MANAGEMENT AND HUMAN RESOURCES
reform in the late 1 9405; the unrivaled length of the work week; and market segmentation-by gender, firm size, and industry. Before proc;eeding, one may note the striking extent to which the factors operative in Korea that help one to understand its rapid wage increases also tend to have been operative in Japan during its period of rapid wage gains. Nevertheless, the factors operating in both countries are not obviously "cultural" and confound any simple explanation for market behavior related to "the Orient."
The Demand Side
If Korea experienced faster real wage increases than did other lateindustrializing countries, this is partly because its GNP grew faster. A rapid rate of capital accum4lation provided the basis for rapid wage increases. Nam ( 1 980) estimated an equation to explain the rate of change of nominal manufacturing wages in Korea during the period 1 96&--1 977. He included variables to represent the demand for labor (the rate of GNP over the previous year), the supply of labor (the lagged change in manufacturing employment), and inflation (the lagged change in prices). The strongest explanatory variable is the demand for labor, or the previous year's change in GNP.
The period in question, 1 96&--1 977, was the Golden Age of Korea's industrial expansion. Output, exports, and productivity were all growing rapidly. Not surprisingly, wages also rose. Even if the government did not intervene directly in wage determination, employers were under strong pressure from the government to share their gains with labor. However, as Table 8-4 suggests, beginning in 1 965 the rate of real wage increase tended to stay. below the rate of labor productivity growth (except in 197&--1979 and 1982). The wage strategy of big business amounted to gain sharing.
Nevertheless, ambiguity surrounds the determination of the impact of fast growth on �eal wage increases.7 In Brazil, for example, it seems that the impact is weak. The average annual growth rate of the Brazilian economy during the period 1950-1975 was as much as 6.7%. Yet while real wages increased for the majority of the period, they did so very slowly (Paldam and Riveros, 1987; Souza, 1 978). Growth in Taiwan has equalIe� that in Korea but wages have lagged.
7 Nam's equation fails to explain why wages rose, notwithstanding the inclusion of a variable intended to meamre labor supply. According to Nam, "the fit of the wage equation to the data is not excellent," although a similar model provided better correlation with the inclusion of a dummy variable for the period 1970--1977 (1980, p. 79). Norton and Rhee ( 1980) estimated a wage equation with a dummy variable, GNP, and a price deflator (but no supply effect) and got an R2 of 0.88.
.

" Table 8.4 Percent Change" in Labor Productivity and Wag.es in Manufacturing. 1 965-1984
Percent Change
1965-1973 1974-1975 1976-1977 1978-1979 1980 1981 1982 1983 1984
Total wage Nominal 2 1 .6 3 1 .2 34.3 " 35.6 19.1 20.0 14.7 1 1 .3 8.2 Real" 9.8 5.1 19.5 19.2 -9.6 -1 .3 7.5 7.9 5.9
Labor productivity 13.0 18.8 10.6 1 3.4 10.5 16.9 7.2 1 3.0 10.0
21 Nominal minus consumer price index_ SOUTceS: Office of Labor Affairs (until 1980) and Ministry of labor; Bank of Korea.
Q

202 MANAGEMENT AND I-IUMAN RESOURCES
The Supply Side
Korea's Low wage Base Korea�s wages grew fast but they started from an exceptionally low base. In a symposium in the mid- 1 960s on wage trends in developing countries, it was asked why the Far East had experiericed no structural inflation similar to Latin America's. Three answers were forthcoming, all of which hinted at the extreme poverty characteristic of Far Eastern economies at the time. 1 . "The backwardness of these countries-even by the standards of
developing regions-means that the industrial labor force tends to be unorganized and in no position to force wage rises when the cost of living increases . . . " (Smith, 1 967, p. 27).
2. Because of the small size of the industrial sector, industrial expansion does not place excessive demands on agricultural output.
3. The marginal product of labor in agriculture tends to be low because of high population density, so rural-urban migration does not reduce agricultural output. Inhabitants per square kilometer in 1960 were 109 in South Central Asia, 86 in Europe 7 1 in East Asia, 48 in Southeast Asia, 1 4 in Southwest Asia, 1 1 in Central and South America, 1 0 in the Soviet Union, 9 in North America, and 8 in Africa (Smith, 1967, p. 27).8
Thus, from a low wage base in Korea, it was easier for employers to remain internationally competitive and yet raise wages, if only to improve the physical stamina and psychic motivation of their workers.
Land Reform and Small-Scale Agriculture Rapid increases in productivity (and thus "implicit" wages) in Korean agriculture, acted to drive up wages in modern industry. The "implicit" wage of male workers in agriculture exceeded the average wage in manufacturing until the late 1 960s (Ban et aI., 1980). According to Bai's ( 1982) estimates, the male wage rate in agriculture exceeded that in modern industry until at least the mid- 1970s. In the mid-1980s, 'the average income of a rural family exceeded that of an urban family (BOK, Yearbook).
it is misleading, however, to use the term, agricultural wage rate,
8 One might add that neither of two tendencies operating toward a high wage level in Africa and Latin America operated in the Far East. In Africa, the relatively high pay scales of European civil servants in the British and French colonial services were adopted by locals during the period after independence (Amsden, 1 97 1). In laborscarce Latin America, early European settlers earned European pay scales. By contrast, Korea experienced almost no inward migration from advanced countries, and the pay scales of japanese colonial administrators may have become only'a dim memory after the chaos that terminated japanese 'rule and the Korean War. '

The Paradox of ·Unlimlted' Labor and Rising wages 203
because Korean agriculture employed few proletarians. Instead, the agrarian reform of the late 1 940s invested land in the tiller, so a tenure system of small-scale family farms evolved, which required few hired hands except at harvest. Given sharp increases in agricultural productivity as a consequence of government support, ruralurban migration and downward pressure on manufacturing wages can be assumed to have been less massive than it would otherwise have been. The labor retentiveness of Korean agriculture by comparison with less egalitarian land tenure systems is suggested by international comparisons of the share of agricultural employment in total employment. Despite the limited availability of arable land, Korean agriCulture's share of the labor force in 1 980 was as high as 34%, compared with, say, 30% in land-rich Brazil. The Korean share was even higher than that in Taiwan, although both countries had experienced land ·reforms (World Bank, 1 982). Consequently, both a lower-than-otherwise flow of rural-urban migrants and a higherthan-otherwise rural household · income buttressed manufacturing wage rates.
Women Workers Nonetheless, one can still say that Korea has industrialized (and continues to do so) with unlimited labor reserves. To the question of how agriculture may preserve a society of family farms yet provide industry with enough labor to keep wages at a socioeconomic subsis-· tence level, Lewis provided this answer: "There are the wives and daughters of the household. . . . The transfer of women's work from the household to commercial employment is one of the most notable features of economic development" ( 1 954, p . 404).
Not only has Korea set world records with its growth rate in wages, it has also outcompeted other countries in its discrimination against women workers, although in some years ( 1 984, for example), this dubious distinction fell to Japan. As Table 8.5 indicates, in 1 980 the male-female wage gap was greater in Korea than in any other country for which data are available from the International Labor Organization.
Almost 60% of the male-female wage gap in Korea has been attributed to differences in human capital between the sexes. It is estimated that 27.6% of the gap is due to differences in education and 31 .8% to differences in experience (traditionally, women have been forced to leave paid employment when they marry). Thus, ". . . part of the wage differential between the sexes in South Korea seems to be rooted in 'before labor market discrimination' in addition to . . . 'labor market discrimination,' . . . but both are closely interrelated" (J. W. Lee, 1983, p. 67). There are virtually no women in manage-

204 MANAGEMENT AND HUMAN RESOURCES
Table 8.5 Comparison of Manufacturing Wage Differential by Sex.· 1980
Country % Country %
Sweden 89.3 Belgium 69.4 Burma 88.8 U.K. 68.8 Denmark 86. 1 Syria 68.8 Norway 8 1.9 Ireland 68.7 Netherlands 80. 1 Greece 67.8 EI Salvador 78.9 Switzerland 67.7 Australia 78.6 Egypt 63.1 France 75.4 Luxembourg 6 1 .2 Finland 75.4 Cyprus 50.2 West Germany 72.7 Japan 48.2 . New Zealand 72.4 South Korea 44.5
• Female/male average wage x 100. Hourly wages except' for Burma (monthly). Adults only for United Kingdom.
Source: (nternotional Labor Office, 1 98 1 , as quoted in J. W. Lee (1983).
rial or even entrepreneurial positions in the primary manufacturing sector (Grootaert, 1986).
The human capital explanation for the gender wage gap would lead one to expect discrimination to recede as women invested in more education and acquired more experience. Yet such is not the case:
During the past few decades. gender inequality in educational opportunities at all levels of schooling has . . . continuously decreased. . . . The participation in the labor force of those with secondary and tertiary education increased at a much faster rate for women than for men with [a] decreasing proportion of primary school graduates . . . . Moreover, the proportion of women in [the],25-29 age group, who have the burden of childbearing and childrearing, has increased, which suggests improved women's labor-force attachment. . . . In contrast, the male-female earnings gap remains large, without reduction. (Y. H. Kim, 1970, p. 4)
Korea's outstanding r�al wage increases and unrivaled gender wage disparities are related to one another insoiar as an unlimited supply of women workers has allowed Korea's bifurcared wage structure to achieve dual ends. One end is. the maintenance of international competitiveness in labor-intensive industries. which employ primarily females. The other is the entry into more skill-intensive pursuits on the basis of a relatively well-paid, highly motivated, male labor aristocracy.

The Paradox of ·Unlimiled" Labor and Rising Wages 205
Table 8.6 Hours of Work in Manufacturing, 1976- 1985
Country
South Africa
Argentina Mexico Puerto Rico United States
Hong Kong Israel Japan Korea Malaysia
Belgium France Germany
'
Norway Sweden United Kingdom
Average Workweek (hrs)
47.0
45.6 46.0 38.0 40. 1
47 . 1 38.7 46.0 53.3 48.4
34.3 40. 1 4 1 .2 38.1 37.8 4 1 .5
Source: International Labor Office ( 1986).
The Length of the Workweek In the length of its workweek, Korea has set still another world record. For all persons employed in manufacturing in 1984, 73% of men and 62% of women worked at least fifty-four hours per week (Grootaert, 1 986). By contrast, in other countries the average for persons employed in manufacturing was much lower (see Table 8.6).
The length of Korea's workweek can be . understood historically against the backdrop of the length of the prevailing international workweek, particularly that of Japan. In turn, the length of japan's workweek can be traced back to work hours in Europe at the time Japan was "opened" by the West.
It was, of course, in the 1 870s that Japan began to industrialize, and Japan was undoubtedly influenced by the prevailing length of the workday in Western countries. By the turn of the century, moreover, "la semaine Anglaise" and the workweek in the United States were short by the standards of Continental emulators, which were most likely to have served as models for Japan. In 1908 the British Board of Trade found that a sixty-hour workweek was standard in all Gerinan trades except printing. In France, . the Factory Act of 1 900 had provided for the reduction of the maximum workday for all classes of workers to ten hours, but there was no legal require-

206 MANAGEMENT AND HUMAN RESOURCES
ment of any rest day. These long hours, moreover, prevailed until the end of World War I (Brown, 1 968).
During the colonial period, Japan directly transferred a long workweek to Korea. The colonial factory system was harsh, and Korean workers grew accustomed to a workweek similar to what then prevailed in Japan and say, Germany at the turn of the century. According to one contemporary account,
The men in large-scale enterprises in 1 939 [in Korea] worked on an average of 10 hours a day, and women and children 1 0 hours and 1 5 minutes, and 1 0 hours and 20 minutes, respectively . . . . With respect to holidays, the usual arrangement is two rest-days a month, though in 193 1 , an investigation of enterprises with 1 0 workers and more revealed that 35% of these . enterprises had no rest-days whatsoever. (Gr<tidanzev, 1 944, p . 1 84)
These work hours exceed those that have won Korea its reputation for industriousness, and they were expended in a period of falling, not rising, real wages. . . What is extraordinary about Korea is that long work hours have
continued to persist. This may be understood in terms of both the weakness of organized labor to shorten hours for a given wage rate and labor's willingness to take advantage of rapid industrial expansion through higher wages for endless toil.
.
Segmentation Upward pressure. on wage rates came especially from large-scale firms in basic industry. Table 8.7 shows the origins of Korea's segmented labor market. The rate of wage increase during the labor-abundant period 1965 to 1971 varied according to industry, ranging from a low of 1 75% in rubber products to a high of 415% in petroleum and coal products. The upshot was a large dispersion in manufacturing wages.
Yet another world record that Korea holds is the degree of wage dispersion in the manufacturing sector. As Table 8.8 indicates, in both 1973 and 1982 the standard deviation of wages (in logs) was greater in Korea than in thirteen other countries examined, Japan taking second place. Nor has such manufacturing wage dispersion become more compressed in Korea over time (Richardson and Kim, 1986). The capital-intensive industries have continued to pay more than textiles, wood" and miscellaneous manufacturing. Wage dispersion also varies across firm size, especially when one ' disaggregates . by gender.
The dispersion in interindustry wages is largely accounted for by

The Paradox of "Unlimited" Labor and Rising wages 207
Table 8.7 Wage Increases in Selected Sectors of Manufacturing .. 1965- 1971
Food Textile
Sector
Wood and cork Paper Leather Rubber Chemicals Petroleum, coal products Basic metals Machinery Electric machinery Transportation equipment
Average
Percent Increase 1971 over 1965
336 227 222 288 2 15 175 354 4 15 222 208 363 313
269
'Calculated from figures published in Sonop Saingsan YU1IOO ("Annual Report on Current Industrial Production Survey") (Seoul: Economic Planning Board. , 1972, pp. 68-81).
Source:, Ewing ( 1973).
Table 8.8 Wage ,Dispersion among Manufacturing Industries in Selected Countries, 1973 and 1982
Standard Deviation of Log Wages
Country 1973 1982 .
Bolivia .204 . 168 Canada .225 .239 France . 143 . 1 26 Germany . 1 37 .141 Japan .2 16 .263 Korea .349 .314 Mexico . 147 . 1 55 Norway .075 . 107 Poland . 126 .097 Sweden .067 .081 USSR . 1 1 7 . 101 United Kingdom .087 . 140 United $tates .206 .241 Yugoslavia . 126 . 1 20
Source: Krueger and Summers ( 1986).

208 MANAGEME�r AND HUMAN RESOURCES
blue-collar workers. According to J. W. Lee, "The interindustry dif· ferentials among white-collar workers are lower than among bluecollar with only a few exceptions" ( 1983, p. 172). In part, blue-collar workers earn different wage rates in different industries because they have different marginal products, those in the capital-intensive in· dust�ies probably being higher. However, it is unclear why capital-intensive firms pay a wage rate equal to their workers' marginal product rather than paying the all-manufacturing average.
Wage 'dispersion by industry and by firm size is present in most countries that are now industrialized or that are in the process of becoming so. In the former, segmentation arose in response to a complex of factors, including trade union pressures (see Osterman [ 1984] for references). I n the latter-Korea being the case in pointtrade union pressures were weak, but political ones were strong. The Korean government routinely intervened in industrial relations (see the reference to the complaints of the Federation of Korean Industries in Chapter 5, footnote 17). In its populist posture, the government was undoubtedly respo�sible for narrowing the wage gap between managers and production workers �as indicated in Table 8.3). Populism took other forms besides higher rank-and-file wages, one example being a ban on color televisions to reduce social stratifica· tion. The fear was always one of a resurgence of political unrest and labor militance (in the 1960s labor affairs were placed under the jurisdiction of the Korea Central Intelligence Agency). In addition, big business began to pay high for reasons to do with efficiency, to which attention is now turned.
THE SKILLS OF THE NEW LABOR ARISTOCRACY OF LATE INDUSTRIALIZATION
To understand the rise of segmented labor markets in a late-industrializing country like Korea, one must understand the labor policies of the modern industrial enterprise-in Korea's case, the diversified business group. The reason that the diversified business groups may have paid their blue-collar workers above the all-manufacturing average was that the skills of such workers were in scarce supply because they tended to be firm specific. In the case of male workers, one year of "inside" experience (with the same employer) tended to raise wages on average by about 10%, whereas one year of "outside" experience (with a different employer) raised them on average by only about 3.8% (]. W. Lee, 1 983) . The interesting question then becomes what firm-specific "skills" were being rewarded.

The Paradox of "Unlimited" Labor and Rising wages 209
One must start by understanding differentiation among firms. The finns to emerge in the basic industries-shipbuilding, steel, and so on-were different in almost every respect even from modern largescale enterprises in colton textiles, Korea's leading sector (see the discussion in Chapter 10) . They were different if for no other reason than that their profitability depended on the exploitation of technologies for which they had virtually no operational first-hand experience.
Experience in textiles dated back to the Japanese colonial period, so expansions and modernizations in the 1 950s exposed textiles entrepreneurs to few problems. By contrast, even the huge fixed-capital investments in the continuous-process industries that relied initially on turnkey technology transfers-<ement, fertilizers, oil refining, and steel--aeated for managers the problem of trying to bring under control a process that the foreign experts themselves understood only imperfectly. Neophytes that they were, Korean managers could never hope to manage in a tight, "Taylorist," top-down fashion, at least not initially, because no one at the top knew enough about the process to do so. Under these conditions, it WaS imperative to rely on motivated workers, even if these workers possessed little more than formal schooling, to exercise the most fundamental skill of allintelligence. In all of the new capital-intensive industries--continuous-process and especially fabrication-assembly operations and job shops of jumbo proportions-production workers were motivated with relatively high wage rates, first to get the product out the door, and later . to improve quality. In short, they were motivated to adopt a reasonably scientific approach to problem solving in a milieu whose technology was tacit, implicit, and not yet procedurized.
For the purpose of gaining an appreciation of the skills of the new labor aristocracy, which were being rewarded with high wage increases during late industrialization, one may examine the personnel policies of one of Korea's premier producers, the state-owned Pohang Iron and Steel Company (POSCO).
The Personnel Policies of the Pohang Iron and Steel Company (POSCO)
POSCO maintains a three-tier wage structure. Managers are the highest paid and then come blue-collar workers, who are divided into two categories: "regular" and "contracted out." In 1 984, contracted-out workers numbered 8,700 or 24% of a total work force of 25,700. Contracted-out workers are confined to menial tasks such as

210 MANAGEMENT AND HUMAN RESOURCES
relining, cleaning, packing, preparing ingot molds, scarfing, and treating slabs. POSCO is estimated to save about 1 5% in wages by contracting this work rather than delegating it to regular employees (PaineWebber, 1 985). Regular employees are well paid by Korean standards-about twice the manufacturing average, depending on the annual bonus-although POSCO claims that it never faced a labor shortage. In addition, POSCO provides its regular workers with paternalistic perks: a kindergarten-through-university school system from which new workers are recruited; a medical dispensary, including a room for surgery; five daily commuter trains "free" of charge to employees; about $50 per month lunch allowance, and more.
Thus, the internal wage structure of production workers at POSCO reflects the external one at the national level. Production workers are divided into high-paid and low-paid categories that are analogous to those of the permanent and transitory employees in Japan. "
In exchange for relati�ely high pay and the job security that comes with employment in a company that is expanding rapidly, POSCO expects attentiveness from its workers throughout their long hours on the job. A century ago, steelmaking !"equired strenuous physical effort on the part of production workers as well as proficiency in the art of steelmaking on the part of master steelmakers (earlier, ironpuddling would have been considered a skilled craft). The category of master steel maker or "saint technician" still survives in pasco, but largely as a vestige of the past. After a decade of operation, only one master technician and five submasters exist. Instead, steelmaking or ironmaking for production workers involves process monitoring and control as well as auxiliary operations such as overhead crane driving. POSCO has approximately 425 job categories, and the largest number of workers can be found at data-collectirm stations positioned at well " defined set points in the process. Workers check sensors for temperatures in different process zones, note the chemical compositi�n of gases, and register flow rates. For this, however, they must have a " fairly good understanding of the physical and chemical reactions involved in ironmaking and steelmaking-in order to ensure high quality-since steel production is not all in closed-loop control and the acceptable limits of materials change.
To increase productivity pasco provides its workers with extensive training. In a single year, 1984, 9,924 workers out of 23,700 received training in one form or another (see Table 8.9). Of interest even beyond the quantity of training, though, is the curriculum. The aim is to instill in all workers a general knowledge of POSCO's operations and operating principles. Only to a lesser extent is training oriented toward building in-depth specialized skills.

The Paradox of ·UnlimUed" Labor and Rising Wages · 2 1 1
Table 8.9 Status o f Training and Education a t the Pohang Iron and Steel Corporation (PaSCO), 1968-1984
Number of Employees
Total Training and (1968-1984)
Education 1968-1979 1 980-1984 (percent)
General training Job Instruction b 17,246 6,343 19.4 Manager 863 2,045 2.4 Site Supervisor 2MI 1 ,736 3. 1 Subtotal 20,149 10,125 24.9
Specific training Steelmaking 2,5 1 7 3,205 4.7 Computer 2,259 1 .8 Sales 160 0. 1
Subtotal 2,5 1 7 5,624 6.6
Language 4,738 2,435 5.9 Quality control 1 ,368 19,962 17.5 Trainer and PWI 1 ,343 1 ,538 2.4 Irregular education 10,244 16,922 22.3 Consigned education 4,239 3,325 6.2 Job training (out of
company) 5,081 7,324 10.2 Others 1 1 ,769 3,886 1 2.8
Total trained 61 ,448 60,331 100'
'Sums to more than 100 due to rounding. bCompany orientation.
Sourct: POSCQ.
The' "general training" referred to in Table 8.9 involves two to three weeks' introductory education for new recruits. designed to familiarize them with the company's organizational structure, management system. and production system and to build occupational "morale, mentality , and . attitude." "Specific training" in steelmaking refers to specialized education programs that encourage operation and mainten,arice technicians to promote or to diversify their on-thejob training by learning more theoretical and practical knowledge in the field of their specific job. "Irregular education" refers to occasiomil education prograrn,s for employees who need particular training for special occasions; for example. for new facilities or systems, new quality controls and production scheduling. and so on. Overall, a good deal of training involves general instruction, including train. ing iii quality control, computer literacy. foreign languages. and the training of trainers.
.

212 MANAGEMENT AN D HUMAN RESOURCES
A normal workweek at POSCO consists of fifty-six hours (eight times seven): forty-five regular hours and eleven overtime hours for which no premium is paid. Every worker is entitled to only one day of leave per month, plus one day for each year with the company. In 1 977 labor turnover at POSCO was 4.4%, below the national average of approximately 5. 1 % in manufacturing. In 1 984 labor turnover had fallen to only 1 .2%, weIl below the national average of approximately 5.4% (Ministry of Labor, 1985). Absenteeism in POSCO is not a problem. In 1984 absenteeism was only 0.07% of labor days. Low absenteeism and turnover are believed to be essential for high productivity. Although the overwhelming majority of POSCO's 23,700 workers cannot be described as possessing highly developed craft skills, steelmaking remains something of an art and learning its technology makes in-house experience invaluable.
POSCO operates with the motto, "Resources are limited, but human creativity is unlimited." Limited resources, or scarcity, therefore, does appear to have influenced POSCO's wage policy by driving it to pay more than average to attract the "best" workers. "Best" should be understood in a general sense, however, rather than with reference to specific skills.
CONCLUSION
W!! have repeatedly suggested that a firm's history conditions its behavior. In particular, firms that industrialize late, on the basis of learning, tend to behave differently from those that date from the nineteenth century and that expanded over the years on the basis of commercializing new processes-cum-products. Yet there is a convergence of behavior in at least one critical respect-the advent of labor market segmentation. Taking the example of the steel industry, it appears that integrated steelmakers in a late-industrializing country like Korea, no less than in a country like the United States, tend to pay relatively high wages by their respective all-industry average,
Segmentation, however, does not imply that in both types of firms the management of workers converges in other respects. There appear to be significant differences in the way labor is managed in the two sets of firms. Moreover, at least some such differences seem to derive from structural distinctions in the learning and innova�ng mode.
In the case of the learner, as exemplified in this chapter by POSCO; the absence of experience (or skills) in steelmaking on the part of its work force-both manual and managerial-forced the adoption of management practices that' minimized the costs of such a shortfall. Such practices may be simply stated as follows (and are presented in detail in later chapters); First, there was a tendency for management

The Paradox of ·Unlimlted" Labor and Rising Wages ' 213
to be very clear and specific about job descriptions and workers' responsibilities (see the discussion in Chapter 1 2). Even before pasco poured any steel, it practiced steelmaking in an open field, workers shouting orders to one another so that there was no uncertainty about tasks. This procedurization and intense attempt to overcome the variabilities of a foreign technology paid off in tight process control, which ultimately facilitated process im provements and higher quality. Second, lack of experience on management's part forced a greater reliance on worker inputs and participative labor relations. Even befOfe quaiity control circles were officially formed, work groups were established in pasco to facilitate vertical and horizontal networks of communication. Finally, inexperience coupled with unfamiliarity with an imported technology directed management's attention to the shop floor. pasco put its best managers on the line and formed decentralized "technostations" to provide line managers with ongoing technical assistance. Overall, this approach opened the door to sustained productivity improvements, making relatively high wage increases also sustainable.
Turing to the mode of industrialization based on innovation in the United States, one cannot, of course, generalize across firms in all industries. There does, however, appear to be a pattern in the behavior of leading firms in the traditionally high"paying sectors-steel, autos, machinery, petrochemicals, and others-that suggests a different approach to managing labor from the one just described. For one, the residue of skills (and bargaining power) on the part of the work force often contributed to work rules that lent" a rigidity to the. production process and intensified labor-management hostility. A legacy of skills on the part of the work force may have hurt productivity more than a base case of no skills at all. For another, the tendency of innovators in advanced countries to compete globally on the basis of new products and labor-saving machin�ry often meant, in practice, a second order of importance accorded to incremental productivity improvements on the shop floor. Implicitly, firms were managed as . though higher wages alone would generate the worker response necessary to realize higher productivity. Such a strategy, however, has increasingly proved unsustainable, particularly under competition from learners.


CHAPTER NINE
The Boom in Education
LATE INDUSTRIALIZATION AND THE LEVEL OF EDUCATION
,One reason Japan, Taiwan, and Korea appear to have industrialized , rapidly is that they have invested relatively heavily in education. I A well-educated work force, both white- and blue-collar, is a general property of late industrialization. distinguishing it from earlier industrial change. Late industrialization is premised on the learning of production processes and proc�dures that are characteristic of more advanced economies. Thus, formal education of the work force and the apprenticeship of firms to foreign technical assistants (rather than the apprenticeship of workers in particular crafts) lie at the heart of. late industrial expansion.
One cannot quantify historical differences across countries in foreign technical assistance. Yet, with greater codification of knowledge, improvements in transportation and communication, and widening in the information gap between backward and advanced countries over time, it is very likely that more recent industrializations have experienced more thoroughgoing technology transfer. Korea may have grown especially fast among late-industrializing countries because it received the preponderance of its technical assistance from Japan, whose mindset was that of a learner and whose industrial competitiveness was waxing, whereas India and the Latin American countries received most of their technical assistance from Britain and the United States, respectively, inventors and innovators whose industrial systems were in need of reform.
This chapter. therefore, is devoted to both formal education and foreign technical assistance, and ends with a firm-level illustration of
I Y. C. Kim and KOllg (1983) studied the contribution of education to economic development in Korea, as did Y. B. A. Kim ( 1975). J. I. Yoon and Park (1977) examined the issues surrounding the"education budget in the critical years of the late 19705.
215

2 16 MANAGEMENT AND HUMAN RESOURCES
interaction between the two. Learning is explored in the second manufacturing affiliate of the Samsung Group, Cheil Wool Company, founded in 1954.
Despite the obvious importance of education, however, it is hard to see how the relationship between education and industrialization in Korea can be said to have obeyed a kind of Say's law, the: supply of educated pets�1),.gsl.,rcteating-its- own demand. The quality of education--ril--Korea was sometimes strained and education itself ap�' pears as a passive rather than an active agent in the industrialization process. Educated unemployment was massive until the government introduced its subsidies in the 1960s, and the industrialization process in general has been short on college graduates spontaneously forming their own companies. It has been long on the bureaucracies in business and government driving up the returns to education by placing heavy demands (sometimes erratic) on the supply of salaried managers, which, in turn, has generated heavy demands for more educational services on the part of the population, which has enabled the bureaucracies to expand further, and so on. Bureaucracy and mass education appear to go hand-in-hand.
The evidence that sequentially later industrializations have been characterized by higher levels of mass education is particularly striking at the university level. In 1903 there were 5 students in British universities or university colleges per 10,000 population and 7.87 in Germany per 10,000 (Musgrave, 1967, p. 83). In 1985 the comparable figure for Korea was 2 1 7.5 students (Ministry of Education, 1984). In 1 899 the number of boys in public secondary schools per 1 ,000 population was only 4.3 in Birmingham (England) and 1 0.0 in Berlin (Germany) (Musgrave, 1967, p. 8 1 ). In 1 984 the comparable figure for Korea, including both sexes, was 20.0 (Ministry of Education, 1 984). Table 9 . 1 provides evidence that sequentially later industrializations have been characterized by greater access to higher levels of education. Table 9. 1 is based on data collected by Easterlin ( 1 965) and relates to the estimated percentage of the total population enrolled . in schools below the college leveL The estimates are subject to conceptual and measurement bias, most notably to variations in the proportion of school-age population to the total. Nonetheless, the rough orders of magnitude are revealing. First, they suggest that the Second Industrial Revolution, in the United States and Germany, involved a more educated population than did the First Industrial Revolution, in England. Second, they show that, in 1 954, Japan and Korea were about to begin massive industrialization with more educated populations than that of either Germany or the United States eighty years earlier. The latest data available for purposes of comparison are for 1954. Already in that y.ear, Japan was educating

The Boom in Education
Table 9.1 Estimated Percent of Total Population Enrolled in School, Selected C9untries, 1 830- 1954
Country
England and Wales
Germany United States
Argentina Mexico Brazil Japan South Korea India
1830
9
17 15
' Inc1.udes North Korea and date i s 1938.
SOU".: Easterlin (1981a).
Percent of Population in School
1850 1 87S' 1887 1928
12 15 16 16
16 17 1 8 1 7 1 8 1 9 22 24
7 14 5 9 3 7 13
4' 2 4
217
1954
15
13 22
16 12 9
23 1 7 7
a larger fraction of its population than was either the United States or Germany at the close of the nineteenth century. In 1954, one year after the end of the Korean War, Korea was in the process of vastly expanding its educational system, with as much as 1 7% of its population already enrolled in school
THE AMBIGUITIES OF KOREA'S OUTSTANDING INVESTMENTS IN EDUCATION
Clearly. late-industrializing countries tend to promote greater accessibility to education than was customary' in earlie\ periods of industrial expansion. What is noteworthy here is the relative preeminence of Korea, by contemporary standards. in this area of social progress. Table 9.2 provides. data on human resources in seven late-industrializing countries. Even among late-industrializing countries, Korea tends to excel in most indices of elhtcation, standardized for population size: secondary students as a percent .of eligible secondary-age students, scientists and engineers per capita, and so on. Korea scores higher in most educational indicators than even Singapore, which adopted a highskill growth strategy before Korea.
In the 1960s, Korea compared favorably with other developing countries in terms of overall level of educational attainment (although not necessarily in t�rms of the proportion of population enrolled in either primary, secondary, or higher education). In both 1960 and 1965, Korea's overall educational attainments exceeded what one would have expected from its per capita GNP (Harbison, Ma-

l\J O'J
Table 9.2 Indicators of Human Capital in Seven Late-Industrializing Countries
Country
Indicator Year or Period Korea Singapore Argentina
Secondary students as percent of 1965 29.0 45.0 NA secondary age population 1978 68.0 57.0 46.0
Postsecondary students as percent 1965 5.0 9.9 NA of eligible postsecondary age 1978 9.0 8.8 18.0 population
Postsecondary students abroad as 1970 2.0 NA 1.0 percent of a\l postsecondary 1975- 1 .7 12.5 0.3 students 1977
Engineering students as percent of 1978 26.0 40.8 14.0 postsecondary age population
Scientists and engineers in thou- Late 19605 6.9 NA 1 2.8 sands per million population Late 1970s 22.6 5.2 16.5
Scientists and engineers in R&D 1974 NA NA 323 per million population 1976 325 263 3 1 1
1978 398 317 313
NA. not ayail�ble.
"1975.
Brazil Mexico Turkey India
NA 1 7.0 16 29.0 17.0 37.0 34 30.0 NA 3.0 4.4 4.0 10.0 9.0 7.7 9.0
1 .0 1 .0 NA 1 .0 0.7 1 .0 3.2 0.3
1 2.0 14:0 1 7.6
5.6 6.6 NA 1.9 5.9 6.9 15.9 3.0
75 10 1 NA 58 NA NA 222 46
208 NA NA NA
StmTce: Adapted from Westphal, Kim, and Dahlman ( 1985) for Argentina. Brazil. India. Korea. and Mexico. United Nauons, SIIJ/UtUa/ Yearbook (yarious years) for Singapore and Turkey.
.

The Boom in Education 2 1 9
ruhnic, and Resnick, 1970), and the nation's educational resources were perceived to be both plentiful and well balanced.
A barometer of the importance that a society attaches to education is the relative status and salary it accords to the teaching profession. The status of teaching in Korea's militaristic society is relmively high, as suggested by a comparison of teachers' pay and that of military officers. In 1983 the starting base salary of elementary school teachers was about equal to that of captain in the armed forces. College and university teachers' starting base salary in 1983 exceeded that of the rank of army major (W. S. Yoon, 1 986). In 1984 the average monthly salary of teachers (539,000 won/month) was below the average of managers (63 1 ,700 won/month) but above the average of all professional. technical, and technically related workers (432.000 won/month) (Ministry of Labor, 1 985).
Korea. therefore, is both a general case of a well-educated late industrializing country and a special case of an exceptionally welleducated one. One might infer from these facts that education in Korea has acted as a determinant of economic development. driving the economy to the heights of per capita income achievable by a high level of formally educated human resources. This inference, however, is overly deterministic. particularly when one recogniz�s the flaws in Korea's educational system. All that glitters is not gold.
The counterpart of large enrollments is large classes. so the quality of Korean education has been called into question. Moreover, a look at the content of what is taught in the classroom suggests that formal schooling has largely served the purpose of political socialization, not technical preparation for industrialization. According to One account,
What distinguishes the curriculum of Korean schools from that of countries whose attempts at development have . failed is not its emphasis on science and technology. The major difference seems to be that Korean education places a heavy stress on moral education and discipline. (McGinn et a1.. 1980, p. 228)
Furthermore, the elitism of Korea's educational system is emphasized in a cultural interpretation of Korean development:
The desire of the government to indoctrinate, and of parents to obtain the validating credentials which would enable their offspring to exploit opportunities denied most Koreans under the Japanese, generated strong pressures to expand the educational system. Though not to be faulted, such enthusiasm has been a mixed blessing . . . . Education may be free, but books and services are not, eliminating most of the poor in rural areas. Enter-

220 MANAGEMENT AND HUMAN RESOURCES
ing numbers are high, but attrition is high also. Hence, although education is legally open to all, increasingly as one goes up the educational ladder, the system serves the select few. Yet, simul� taneously, even at the highest level, the numbers of students are many in relation to the available faculty. The consequence is didactic lecturing rather · than discussion, and authoritarian methods to control great numbers of potentially disruptive students. All this smacks of the Japanese colonial past. Uacobs, 1985, p. 269)
As suggested in Chapter 2, the view that the Japanese colonial education system left a stock of human resources that served as the foundation for later industrialization is overdrawn. Literacy in Korea may have been higher than the colonial norm, but there was little in the nation's school curriculum that matched that of the universally admired developmental education of Meiji Japan. 2 I� Japan itself, the goal had been to
produce not only a diverse labor force with the necessary knowledge and skills to handle various levels of technical work but a . core of scientists and engineers who could actually perfect and advance the current state of technology. Korea's colonial government, on the other hand, was interested mainly in ensuring the existence of a labor force in Korea that possessed the rudi, mentary education required to carry out orders from factory managers who were for the most part Japanese . . . . The Japanese had shown little interest in developing even industrial education for Koreans beyond the most elementary level. (Eckert, 1 986, pp. 29�7)
.
Nor did the United States aid administration do much to correct the deficiency in industrial education. Between 1 952 and 1 96 1 , aid to technical education totaled a mere $5 million. A history of U.S. educational assistance to 1 966 reads as follows:
The major part of the [vocational high schools] were vocational in name only :as they lacked both equipment and the instructors qualified to demonstrate practical work skills, As a result, these schools became a refuge for students unable to pass examinations for the academic schools, or who lacked funds. (Dodge, 1 97 1 , p. 1 03, quoted in McGinn et aI., 1980)
2 Han'guk Kyoyuksa YOnguhoe (the Association for the Study of the History of Education) has published a book that forcefully makes this point (1972). A study by G. E. Han ( 1973) examined the inAuence of Confucianism and nationalism on Kore.an education during the Japanese colonial period.

The Boom in Education 221 : /
As for the educational "portfolio of investments," balanced across different levels, it too has been imperfect, At times Korea has tended to produce a surplus of trained personnel at the middle and higher educational levels. This is not unexpected in emulators that have caught up rapidly, an historical case in point being Germany. The German state in · the late nineteenth century poured resources into education to spur economic development, and one consequence was an oversupply of educated labor power:
By the I 890s, there were signs that these Hochschulen were producing too many engineers. . . . There · was also a large number of unemployed lawyers . . . . By 1 890 the Kaiser was afraid that the expansion of secondary facilities would create an academic. proletariat. (Musgrave, 1 967, p. 84).
In Korea, as well, heavy investments in education created temporary excess supply and fears by the military of social unrest.
Educated unemployment in Korea began "perhaps as early as 1953:' and a decade of aid did little to ;;tlleviate the problem (McGinn et aI., 1980, p. 95). In 1 960 it was reported that 9,000 of 15,000 college graduates were unable to find jobs (J. E. Kim, 1973). Further, when · the military government initiated serious economic planning in 1963, it discovered an excess of high-level personnel. Park's government attempted to curtail enrollments in higher education in 196 1 arid again in 1968. Through the 1960s, Korea was an exporter of edu- · cated persons. As late as 1 972, only 60% of graduates in engineering and related sciences were estimated to have found employment, and long-range forecasts indicated continued oversupply (McGinn et al., 1980). When the government iaunched its drive into heavy industry,
educated unemployment was relieved, but only temporarily. The government imposed a tight college quota system in the 1 970s to dampen enrollments. The quota was later modified to increase enrollments and, along with slower growth, contiibuted in,the 1980s to a rise in educated unemployment (Ca�taneda and Park, 1 986).
Rather than Korea's economic development responding spontaneously to educational attainments, the 1950s and 1960s seem to have produced · a corps of managers and engineers who were part of a
. nationally directed industrialization.
THE EDUCATIONAL LEVEL OF PRODUCTION WORKERS
The educational attainments of Korea's work force are indicated in Table 9.3. The gains over time are most striking at the lower levels of schooling. Illiteracy, defined as absence of any schooling whatso-
I ever, declined from about 40% of the work force in 1946 to virtually

222 MANAGEMENT AND HUMAN RESOURCES
Table 9.3 Education Level of Work Force, 1946-1983 (Percent of All Workers)
Year All S�cto�s' Manufacturing
1946 No schooling Primary Secondary College Totalb
1963 No schooling Primary Secondary College Total
1970 Primary and No schooling Secondary CollegeC Total
1980 Primary and No schooling Secondary CollegeC Total
1983 Primary and No schooling Secondary CollegeC Total
NA, not available.
39.6 53.0
7.4
99.0
5.5 53.0 33.9
7.6 1 00.0
67 .... 26.4 6. i
100.0
49. 1 43.0
7.8 100.0
4 1 .2 48.6 10.2
100.0
NA
NA
50. 1 42.0
7.7 100.0
30.7 61.4 7.8
100.0
23.8 65.7 10.5
100.0
"In 1946 and 1963, sectors inclUde mining, manufacturing, commerce, service, and agriculture. Thereafter, sectors also il.clude electricity, construction, transporlation. and finance.
.
bAli tolais include a small amount of unknown.
< Includes graduate work.
S"",t8: 1946 and 1963: Ewing (1973). 1970, 1980, and 19B!: Castaneda and Park (1986).
nil by 1963, although some of the poorest worKers are still barely educated. Among these are factory girls, some of whom attend night school to learn to read and write (Commission of the Churches on International Affairs, 1 979). The share of the work force with secondary schooling rose from 7.4% in 1946 to almost 50% in 1 983, and in the manufacturing sector educational attainments were even higher. As Table 9.3 indicates. only one quarter of manufacturing workers had less than a secondary education in the early 1 980s.

The Boom in Education 223
In the field of technical education, progress has been slower, and Korea probably performs no better in this area than do other late-industrializing countries. The problem is characterized by one expert who uses the term confusion to describe Korea's system of vocational training (K. W. Lee, 1983, p. 12). Confusion reigns in two areas: At which level should technical education be provided, high school or junior college? Who is to assume responsibility for funding, the public or private sector?
In terms of training level, the first area of confusion was generally understood at the time of the fourth five-year plan ( 1 977-1981) . Technical vocational high schools would foster broadly educated technicians to support scientists, engineers, and other professionals. Technicians would be supported by skilled and semiskilled workers who would be trained at vocational training centers, both inside and outside factories. This structure, however, became otiose as values changed and technical workers aspired to become college graduates. Vocational high schools transformed themselves into junior colleges; junior colleges, in turn, tried to emulate full-fledged colleges in their instructional programs (K. W. Lee, 1983). The identities of high school and college technical training, therefore, became blurred.
The second area of training strategy confusion concerned finance. An amendment to the Vocational Training Law at the time of the fourth five-year plan imposed a penalty on firms that employed over 300 workers and failed ' to provide in-plant training (firms were to. provide in-plant training as a matter of principle or pay a levy in exceptional cases). Yet the amendment has three weaknesses: The quality of in-plant training is uncertain because trainees are not subject to compulsory skill tests, most programs go no further than providing workers with elementary skills, and the levy that is assessed is not high enough, so that firms find it less costly to be fined than to train.3
The crux of the problem of training lies in the partial demise of skilled craftspersons. They still perform critical tasks in Korea, such as the following (the skills listed here are some of the skills subject to trade tests):
Piping Welding High-pressure gas handling Mechanical drawing Auto maintenance Architectural carpentering Surveying
Electrical repair External wiring Electrical welding Chemical analysis Rock drilling Radio operating Precision finishing
3 See the discussion by S. Kim (1982b, pp. 18-24).

224 MANAGEMENT AND HUMAN RESOURCES
Watch repair Printing Type casting
Forest seeding Textile fabric finishing Embroidering
Yet the quasi-derogation of even these skills is reflected in the relatively short duration of most training courses for craftspersons. Furthermore, craft skills have never really constituted a bottleneck to industrialization, although experienced craftspersons have been in scarce supply in certain areas and time periods.
At the start ,of the First Industrial Revolution, a typical apprenticeship lasted from five to seven years. A traditional apprenticeship system, covering anywhere from forty to seventy trades, endured in Germany well into the second half of the nineteenth century (Samuel and Thomas, 1 949). Thereafter, ,
The German secondary schools, especially the six-year Realschule, . . . served the labor force at this level excellently by ' giving a broad "modern" education of a liberal nature, fitted to the needs of future salesmen or technicians: The latter, after practical experience, attended centralized technical schools ora very specialized nature full-time, and one would have expected this second' part of their education and ,training to have built soundly on the theoretiCal foundations of the first part. (Musgrave, 1 967, p. 87)
Technical training in Korea is nowhere near as comprehensive. According to K.W. Lee's analysis of skill formation in a representa: tive big business group in the automobile industry, of 9 1 1 newly recruited production workers below the university level, 27% were given minimum in-plant training, 38% were poached from other firms, about 10% had acquired their skills in a vocational training center (typically a one-year program). and only 2 1 % had attended vocational high school. Skills being taught in the vocational training centers springing up in the 1970s were s,ufficientIy simple that the centers had no trouble graduating thousands of craftspersons each year (graduation depended on passing a trade test). Approximately 125,000 and 1 30,000 crafts persons passed trade tests in 1 976 and 1979, respectively, two peak years (Ministry of Labor, 1 980). Vocational high schools have been relatively inconsequential. Of approximately 2 million high school students in Korea in 1 984, only 9.6% were en� rolled in technical courses (Ministry of Education, 1 984).
On the other hand, the deskilling process in industry has not advanced to the point where the demand for skills is wholly satisfied. "Experienced and skilled" workers have become especially scarce over time. Table 9.4 reports the 1984 findings of a survey on labor scar-

The Boom in Education
Table 9.4 Labor Shortage by Occupation, 1984
Occupation
Engineers Managers Skilled" Clerical Sales Unskilled Temporary None Other
Percent Shortage
Small and ' Medium Firms Large Firms
14. 1 1.8
39.4 1 . 1· 2.2
17.3 3.2
20.9
100.0
17.7 1 .4
40.5 1 .4 4.7
17 .7 0.5
14.4 -..l.!! 100.0
"The dired Korean lranslation ;5 skilled and e><perienced workers.
Source: Seoul National University: 1985.
225
city in the manufacturing sector conducted by the School of Business Administration at Seoul National University. According to the findings. neither engineers nor managers were found to be the scarcest resources (Table 9.4 suggests that by 1 984 managers were one of the least scarce resources). Rather, "experienced and skilled" workers appeared to be in shortest su pply, particularly in the textile and apparel industries, although neither harbors large numbers of "skilled" workers as traditionally defined. Experience is the key in these lower paid industries.
Reluctance on the part of the private sector to train is assumed by the Korean government to run contrary to the public interest. In response to its concern with' how to increase training, therefore, the government's expert on technical education has advised a course that is characteristically Korean. He recommended that the government devise "a strong incentive system to help motivate business enterprises to voluntarily provide in-plant training for their workers" (K. W. Lee, 1 983, p. 28).
THE EDUCATION LEVEL OF MANAGERS AND ENGINEERS
On the whole, Korea's cadre of managers and engineers is very well educated. Even owner-managers-across the spectrum of company size-have generally been found to hold advanced degrees (see the discussion in Chapter 7).
The employment of salaried managers with university degrees.

226 MANAGEMENT AND HUMAN RESOURCES
however, is a fairly recent phenomenon in the history of world industrialization. In the early stage of the Second Industrial Revolution in Germany, for example, the old pattern still prevailed whereby managers at the top (inc!usive of owner-managers) knew their business inside out and had a keen sense of technical factors gained solely through long first-hand experience. By the end of the nineteenth century, a new pattern had emerged:
For instance, Alfred Krupp was rarely in Essen; he traveled the world on sales trips, tried to influence governments, or engaged in the politics of industry. Men like August Thyssen, Hugo Stinnes, and Krupp VOn Bohlen, son-in-law of Alfred Krupp, were financiers-businessmen, who left highly qualified technicians to run their works. In the 1980s, Lowthian Bell spoke of the German class of "scientific men . . . who seem to devote themselves almost entirely to industrial science." At the Union Works, Dortmund, the managers at this time were reported to have "the usual German technical training," be familiar with English, and to be regular readers of English engineering and metallurgical journals; the two leading chemists and the head draughtsman had attended Polytechnics, though to an English manager of a Bavarian engineering works, such men lacked practical experience. (Musgrave, 1967; pp. 80-1 )
I t was the latter pattern that characterized the earliest stages of Korean industrialization. Managers and engineers work themselves up through the company, but the lowest rank from which they start is first-line supervisor, a management position . They do not work themselves up from the ranks of production worker.
The Second Industrial Revolution in the United States underwent a transition similar to Germany's, and with considerable social conc flict:
One source of ideological and actual conflict within the industrial system was between technical graduates and intermediafe managers, for�men, and top executives who had made their way to the top by personal skill rather than by formally attained qualifications or credentials. The uneducated did hire the educated, but often, like Thomas A. Edison, bragged about how they were hiring (at low salaries) men with high pretensions and only marginally useful abilities. (Calvert, 1967, p. 1 47)
The tension between school and shop coincided with other major changes. First, the college curriculum was transformed to admit the

The Boom In Education 227
discipline of engineering as a legitimate science.4 Second, the transition from employing experience to employing education planted the seeds for a new way of innovating, through research and development (R&D). Despite Edison's convictions, the salaried engineers soon proved their worth. Not only did they raise shop-Hoor productivity, but they innovated as well. A person like Alexander Holley, chief engineer at Carnegie Steel who proselytized the virtues of technical education, was the epitome of the educated as well as innovative manager (McHugh, 1980).
In Japan, the university-trained engineer-manager appears to have arrived earlier in the trajectory of industrialization than in either Germany or the United States. The trajectory in Japan was itself different because, as in still later industrializing countries, it was consummately defined by catching up, not by a backlog of experience and inventiveness. After the Meiji Restoration, the new state found itself in urgent need of all kinds of modern skills and knowledge, and, according to Eisuke Daito, turned to three sources: First, the Meiji entrepreneurs tried to depend on the small number of people who had somehow acquired Western business practices and technologies for themselves, but these were in short supply. Second, many promising young men were sent abroad or' went on their own to learn how commercial and manufacturing businesses were conducted in advanced countries. Third, foreign experts and advisors were brOl-!ght into Japan. "To gain independence from foreign experts, ministries and newly formed government enterprises often set up training programs of their own," but these were costly and could be carried out only by a profitable government-owned enterprise. Private firms "had to recruit well-trained people in one way or another from outside or attract personnel of such high caliber and determination that little internal instruction seemed necessary." Yet the pre"ailing social climate put "official above private life," and so private-sector "employers could not attract university graduates." I t was only after the turn of the century that the graduate recruitment situation began to change rapidly (Daito, pp. 1 55-8).
INEXPERIENCE
One-hundred years after the Meiji Restoration, Korea relied on the same sources as Japan had relied on to relieve it of ignorance-a small number of experienced personnel, overseas training, and foreign experts. However, private firms in later industrializing coun-
4 See the discus.sion of the relationship between education and private industry in Noble ( 1977).

228 MANAGEMENT AND HUMAN RESOURCES
tries differe� from those in Meiji Japan in being able to rely on university graduates-who could ultimately replace the foreign experts-at an earlier stage of industrialization. Private firms in Korea appear to have had access to a relatively plentiful supply of such graduates early on.
Nevertheless, the inexperience of university-trained managers presented acute problems. The n;,tivete of these managers was com� pounded by the inexperience inherent in the process of late industrialization-the import of foreign technology. In innovating firms, experience is developed pari passu with new technical development. In firms that must catch up, this development process is absent. Alexander Holley, in his capacity as a founder of the American Institute of Mining Engineers, not only proselytized the virtues of technical education but also those of practical knowledge: "In the chasm between science and art," he stated in one speech, "how much effort and treasure, and even life, are swallowed up year by year" (McHugh, 1 980, P 268).
Although modern industrial enterprises in Japan and Korea followed similar paths to overcome the inexperience of their managers, these paths were not necessarily identical ones. According to Daito,
Since universities [in Japan] offered minimal vocational train- . ing, new recruits were assigned to positions at the bottom. of managerial hierarchies and were trained mainly on the job. Vacancies above the bottom level were filled not by the hiring of qualified men on the open market but by internal recruitment, promotion from within, and transfer. Decision making on promotions depended heavily on seniority as well as competence. ( 1986, p. 1 67)
Similar procedures of hiring, on-thejob training, and promotion have been followed in Korea insofar as new university recruits have tended to be assigned to the lowest managerial positions and promotion has depended heavily on seniority.5 Newly recruited managers in diversified business groups tend to be trained first at the group level, in short courses that are oriented toward exposing them to company culture.6 They are then assigned to operating affiliates where they are trained both on the job and in outside courses. Managers in Korea are sent to courses offered by the Korea Bureau of Standards (on quality control), by the Korea Advanced Institute of Science and Technology (on technology management), and others. Managers are sent to overseas COUFses as well, sometimes for formal education,
� For a discussion of seniority practices in Korea, see S. Kim. (1982b.) a See the discussion by J. H. Park (1987) on groupwide training of managers.

The Boom in Education 229
sometimes to acquire in-plant experience. The key difference with Japan is that top positions in Korea are sometimes filled not by internal promotion but by recruitment of experienced personnel from outside the firm (as discussed in Chapter 5).7
Employers in Japan expected young engineers to plunge into the shop to deal with technical difficulties and problems of factory management. The engineers, Daito reported, took over several .functions from the foremen and tried to control such factors as "manufacturing costs, product quality, inventory levels, intensity of work, and so on in greater detail than ever before." Their offices were near the shop floor because "their main duty was to maintain a high operating ratio of expensive equipment, some of which had been imported from advanced countries, and their technical knowledge had to be supplemented by practical experience on the shop floor" (Daito, 1986, p. 173). As we shall see in later chapters, the acquisition of experience by Korean managers w<!-s also a two-pronged process, involving the application of formal techniques to shop floor control (although not necessarily at the foreman's expense, whose power in Korea probably never equaled what it once was in Japan), supplemented by informal shop floor experience. In the shipbuilding industry, which is examined in Chapter I I , even the first 'Crop of managers in the most modern yard strove to standardize operating procedures whiie simultaneously learning more about how ships were built through close contact with the ranks. The imperative to work closely with the ranks was echoed. in general. in an organizational structure that tended to comprise relatively few layers of managerial hierarchy and indeed relatively few managers (see the discussion in Chapter 7).
REWARDS FOR THE ELITE
A jaundiced view of the educated engineer-manager, held by practical people of antiintellectual persuasion like Thomas Edison. has never become thematically dominant in Korean industrial culture. By and large, managers and especially engineers are well respected. They have performed a critical function, of putting imported technologies and machinery into operation. The respect they have commanded is reflected in their remuneration. The wage differential in Korea between managers on the one hand (including engineers) and production workers on the other has been large, as suggested in Table 9.5. On average, in the period 1971 through 1984 managers earned about four times more than production workers.
' This, however, was also true of Japanese firms circa the 19205, the period Daito described, before the entrenchment of permanent employment practices.

230 MANAGEMENT AND HUMAN RESOURCES
Table 9.5 Relative Monthly Earnings' by Occupation, 1971- i984
Earnings (won/month)
Clerical Production Year Technicians Managers Workers Salesmen Service Men Workers
1 97 1 280 428 243 140 107 lOa
1973 253 406 206 1 5 1 99 100 1975 266 458 2 15 1 23 104 lao
1977 271 ' 439 206 1 3 1 lOa 100 1979 256 436 176 107 97 100 1981 230 367 1 63 96 lOa 100 1983 24 1 343 155 129 1 0 1 100
• Figures include regular pay. overtime, and special earnings (bonus payments),
SOOT": Ministry of Labor, Yt4Tbook of Labor Statistics, 1972- 1985, as cited in Castaneda and Park ( 1986).
The gap in earnings between managers and production workers reflects a large gap in earnings related to educational leveL Higher education in Korea tends to be well rewarded and s() is in great demand. This is suggested by data in Table 9.6. Between 1975 and 1 984, college and university graduates earned about three tim.es the salaries of primary school graduates and about one and one-half times those of high school graduates.
International wage comparisons of managers and production workers are difficult to draw because of intercountry variation in the indirect component of managerial salaries (bonuses, stock options.
Table 9.6 Relative Monthly Earnings' by Education, 1 975- 1984 (Men Only) (Primary School = 1 00)
Earnings (won/month)
Colleges, Junior High Middle Primary Year University College School School School
1975 306 200 154 109 100 1976 330 2 1 9 156 1 1 0 100
1978 30 1 205 147 106 100
1 980 256 170 127 lOa 100
1 982 252 1 6 1 1 26 100 100
1984 240 145 1 2 1 lOa lOa
• Figures include regular pay, overtime, and special earnings (bonus).
SOOTC': Ministry of l.abor, Ye4rbook of Labor SI4tistics, 1976-1985, as cited in Castaneda and Park ( [986).

The Boom in EducatiOn 231
Table 9.7 Comparison of Relative Occupational Wage Structure in Korea with that in the United States (Production Workers = 100)"
Country (,lear) Technicians Managers Clerical Sales Service Production
United States ( 1977) 160 179 109 1 17 5 1 100 South Korea ( 1980) 246 395 162 89 100 100
'Index = 100.
SO'Ilr,,: J. W. Lee (1983).
cars) and the wide dispersion in salaries among managers. By comparison with Brazil, the wage gap between managers and production workers in' Korea is narrow (according to Souza, by 1975 the pay of a general manager in the manufacturing industry in Brazil had come to be 162 times as large as that of an unskilled laborer [ 1 978]). On the other hand, by comparison with middle managers in the United States and undoubtedly Japan, Korea's wage gap is wide (see Table 9.7 for a comparison between Korea and the United States). In the case of returns to education, the well-educated in Korea probably earn a premium by the standards of most developing countries. The rate of return to primary education tends to be greatest in most developing countries, whereas the rate of return to higher education tends to be greatest in Korea (Psacharopoulos, 1985).
Korea's supply of managers and engineers is abundant by the standards of most developing countries. One is surprised, therefore, that its managerial-production worker wage differential is sizeable. It appears to be sizeable partly because of segmentation in the market for managers and engineers. On the demand side, the big chaebol tend to hire only the top graduates from the best universities, thereby driving up their price. On the supply side, most university graduat�s prefer .to be employed in big companies, which seems to induce smaller firms to bid up wages to attract managerial recruits.
FOREIGN TECHNICAL ASSIST ANCE
Korea may have the dubious distinction among late learners of having been occupied militarily not just by one but by two world powers-Japan and the United States. Yet in terms of technology transfer. Korea possibly got the best of both worlds. In 1945 through 1965. technology transfers through tied aid came mainly from the United States, whiCh was then at the height of its' technological supremacy. In the case of military-related projects from the United States. technology transfers also had the virtue of not being subject

232 MANAGEMENT AND HUMAN RESOURCES
to profit-maximizing goals on the part of the teacher. After 1965, Korea relied primarily on technology transfers from Japan, which was itself in the process of becoming the world's premier producer.
American process technology in individual manufacturing projects may have been unrivaled, but the process of technology transfer itself was flawed. Technology transfer as it related to the disbursement of (oreign aid was discussed in Chapter 2. It was characterizedby delays and technical bungling, as a consequence of confusing administrative arrangements and the use of inexperienced military personnel on civilian projects. The military-related technology, however, appears to have been better communicated, so not only the Korean army but also civilian subcontractors to the American forces, like the Hyundai Construction Company, acquired high operating standards. According to Hyundai Construction, which now ranks among the world's top five international contractors, the contribution of the U .S . military to its technological development was four-fuhl: -
1 . Hyundai and other construction firms learned how to prepare a bid in the international format, as required by American military procurement.
2. Hyundai and other construction firms learned Western specifications and were forced to upgrade the quality of their construction work, as required by U.S. federal regulations concerning subcontractors.
3. Hyundai and other construction firms acquired construction management and quality control techniques.
4. Hyundai in particular, because of its experience in automotive repair, obtained war surplus construction equipment that allowed it to mechanize o'perations.
However, with the termination of U.S. aid and its tied provisions, Japan soon became Korea's major technical assistant, supplying it through diverse channels. Technical assistance arrived in Korea from Japan in the form of foreign licenses. Typically a foreign license transferred proprietary technology from firm to firm. The foreign technical assistance accompanying a foreign license varied in comprehensiveness and could cover anything from a blueprint to details on standard operating procedure to a turnkey plant. Table 9.8 provides data on cases of foreign licenses and reveals that their number increased dramatically in 1977-1981, during Korea's foray into heavy industry. The source of licenses was overwhelmingly Japan, accounting for 56% of the total; about the same share that the United States held as Japan's source of technology imports between 1950 and 1970 (Ozawa, 1 974, p. 26).
.

The Boom In Education 233
Table 9.8 Cases of Approved Technology-Licensing Agreement by Country, 1962- 1983
Country 1962-197 1 1972-1976 1977-1981 1982-1983 Total
United .Slates 74 90 301 144 609 (23. 1 °) Japan 214 280 629 363 1 ,476 (56. 1) West Germany 10 13 70 34 1 27 (4.8) England 5 16 49 27 97 (3.7) France 1 6 40 26 73 (2.8) Other 14 29 1 32 74 249 (9.5)
Total 3 18 434 1 ,22 1 668 2,631 ( 100.0)
a Figures in parentheses denote composition ratios.
SOU".: Ministry of Finance .
. Emulation in Japan and ' Korea does not parallel that of nineteenth-century European emulation. Although Europe abounds with stories of the British expatriate entrepreneur-engineer migrating to the Continent to teach, there are few if any stories of Europeans traveling to England to learn. By contrast, Japan, and Korea thereafter, sent thousands of managers and engineers to foreign countries to learn. Korea sometimes even sent skilled workers abroad to study on the shop floor.The total human outflow is undocumented, typically occurring as a subpart of a technical license, but company histories, some to be presented in later chapters, suggest that the numbers were large and the experience was critical. OVerseas apprenticeship telescoped years in the classroom into months on the factory floor.
The data in Table 9.8 are typically taken as representative of Korea's technology imports, but they understate the extent of foreign technical assistance. They understate it because they exclude informal transfers from machinery suppliers and independent consultants. Instruction from machinery suppliers is an ideal form of technology transfer from the viewpoint of learners, because it is provided as part of a purchase of a capital good and is therefore less restrictive than if provided by a competitor. Capital goods are a major means through which both production processes and procedures are transmitted across countries. In the case of assembly line equipment in the electronics industry, for example, Japanese exports to Korea . influenced Korea's adoption of a certain type of assembly line, the free flow or. worker-paced line, believed by Japanese suppliers to enhance productivity by comparison with a direct drive or moving assembly line, on the model of Henry Ford's (Harvard Business School, 1986d). Table 9.9 provides data on Korea's capital goods imports from two

234 MANAGEMENT AND HUMAN RESOURCES
Table 9.9 Capital Goods Imports from the United States and Japan, 1973-1984
Imports (% of total)
1973 1974 1975 1976 1977 1 978 1979 1980 198 1 1982 1983
All machinery .
United States 26.4 20.8 24.9 20.4 22.7 1 7.5 2 1 .0 23.8 25.6 29.4 Japan 52.5 55.3 49.6 45.9 54.1 6 1 .0 49.6 49.2 44.3 37.7
General machinery' United States 12.6 16.4 . 18.9 18.4 17.0 14. 1 15.5 17.5 23.9 24.7 28.4 Japan 65.8 65.4 52.8 43.5 55. 1 59.7 49.5 53.4 45. 1 40.2 49.7
' Excludes specialized industrial machinery.
SOUTU: Korean Machinery Builders' Association.
major sources, Japan and the ' United States. Throughout the 1 9705, Japan's share of Korea's capital goods imports far exceeded' that of the United States. By the mid- 1980s, Japan's share averaged approx· imately one half of the total, that of the United States only about one quarter. In importing the preponderance of its capital equipment from Japan, therefore, Korea was indirectly importing japanese production practices.
Informal technology transfers were also facilitated by independent consultants. However, while the British entrepreneur-engineer who starred in the nineteenth-century tale of technology transfer to Continental Europe settled abroad as a resident teacher (Henderson, 1954), the equivalent figure is largely absent in Korea. Few expatriates live and work in Korea as employees of even the largest firms. They are considered too expensive to hire. Instead, the star of technology transfer to Korea is the short-term independent consultant. Typically such a figure is Japanese, either retired or still in the permanerit employment of a Japanese enterprise, consulting in Korea on an ad hoc basis. The figure appears in almost every leading Korean firm, in diverse industries: a retired engineer from Mitsubishi Motors in Hyundai Motor's Ulsan automobile assembly plant; a university professor in its shipyard; a computer specialist in Samsung Electronics; a textile engineer in a large cotton spinning and weaving mill, and so on. The independent consultant from japan has constituted a gold mine for Korean industry. As an independent, the consultant is free from many of the constraints on teaching that characterize firm-tofirm transfers. As a japanese, the memories of backwardness and catching up are still fresh, the possibilities of success are communicable, and the knowledge conveyed has in recent years become stateof-the-art expertise. Access to such technical assistance placed Korea
1984'
25.7 52.1

The Boom in Education 235
in an enviable position. Other late-industrializing countries further afield from Japan culturally and geographically have lacked such a resource to draw on.
THE CHAEBOL AS YOUNG MANUFACTURERS
The process whereby the chaebol reoriented their activities away from rent seeking and toward profit maximizing contains the seeds to understanding an important part of the process of economic development in general. Rent seeking refers to what the classical economists meant by buying cheap and selling dear, or earning profits on alienation. By creating scarcities and speculating, rent seekers realize windfall gains. The realization of windfall gains, however, is neither easy nor effortless. A few are rewarded but many are ruined. Economic activity, therefore, may be inclined to move toward profit maximizing, depending on whether capital accumulation can be shown to be profitable.
Two factors in Korea worked toward the creatiori · of profitable inveslment opportunities. The first was discussed in Chapter'3, namely the state, which subsidized diversification into new industries. The second was suggested above, namely education and apprenticeship, or the creation of a cadre of foreign technical assistants and university-trained managers and engineers. Once the entrepreneurs saw that the managers were capable of managing, that the engineers were capable of producing products that worked, capital investment became a viable option. A long-run approach to learning evolved gradually and laid the groundwork for the replacement of the foreign expert. One illustration of this process is presented below.
CheiJ Wool Affiliate of the samsung Group
Today the Samsung group is regarded as one of the most tightly managed chaebol, with "a compulsive emphasis on efficiency and quality. Little in the background of the company's founder, however, presaged such a management approach.
The chairman of Samsung, P. C. Lee, was, like most other Korean entrepreneurs, the scion of a riCh landowning family. (According to Jones and Sakong, "It was primarily the larger holders who produced entrepreneurs . . . very few entrepreneurs have risen from the poor masses" [ 1980, p. 228]). Yet unlike most entrepreneurs, Lee was not we�l educated. ("Korean business leaders are extraordinarily well educated, in both an absolute and a relative sense" [Jones and Sakong. 1 980, p 23 1].) Lee dropped out of high school and then enrolled in college in Japan, but dropped out of that, too. Neverthe-

236 MANAGEMENT AND HUMAN ,RESOURCES
less, he made a lot of money during World War II and later during the Korean War by buying cheap and selling dear. Then he turned his attention to amassing a fortune at the cost of contributions to Syngman Rhee's political campaigns. His activities in the post-Korean-war period were divided between "trade" and the manufactur- , ing of daily necessities. Samsung's first manufacturing affiliate was Cheil (meaning first) Sugar Company ( 1953), followed by Cheil Wool (1954). The 1950s also witnessed Samsung's acquisition of companies, in the insurance business-life, fire, and marine.
After the roundup of businessmen in the aftermath of the military coup of 196 1 , Lee's illicit wealth was estimated at about 19% of the national total (C. 1.. Kim, 1980, quoted in Jones and Sakong). Lee, however, was exonerated in 1963 after payment of a fine. Then in 1964 he founded the Han'guk Fertilizer Company, one of the largest pr�jects of the period. Whereas it took over seven years for tht: U.S. aid administration to complete a fertilizer plant in the 1 950s (see Chapter 2), Samsung's plant was completed in record time, commencing production in early 1967 after only thirty months. Even before production began, however, Lee appears to have succumbed once again to the attractions of speculation. It was discovered that saccharin, a commodity then in heavy demand in Korea, was being smuggled into the country by Han'guk disguised as a raw material for fertilizer production. After a presidential investigation, Lee "donated" 5 1 % of Han'guk shares to the government. Undaunted, Lee followed the government's lead in establishing a string of new companies in the 1960s (a daily newspaper, a broadcasting company, a papermaking company to supply the newspaper, a department store; a real estate development and construction company, a university, a hospital, and Samsung Electronics-which began assembling blackand-white color TVs in response to the government's promotion of ,the electronics sector). Cheil Wool Company, however, "became very profitable as it gradually replaced foreign-made woolen textiles and became the backbone of today's Samsung group." s
The choice 'of the Samsung group to enter the worsted subbranch of the textiles industry was clever insofar as it placed Cheil Wool in a, relatively protected market niche (none of the major chaebol ' ventured into the highly competitive area of cotton spinning and weaving). CheiJ's production of worsted in 1957 amounted to 1 ,750,000 pounds, or 43% of total national output. Nevertheless, worsteds were riskier than either cottons or woolens because they required more sophisticated production processes and quality control. To meet both requirements, Cheil bought top-quality machinery; hired the best-
8 Jones and Sakong, 1980, pp. 352-3, These authors gave further details about the life of P. C, Lee.
' ,

The Boom in Educ!ltion . 237
salaried managers, and relied on extensive foreign technical assistance. Lee's background became less and less important as a determinant of Cheil Wool's operating procedures.
Cheil purchased modern equipment in 1956 from a West German textiles machinery manufacturer and paid extra to have West German engineers come to Cheil to assemble the machinery and to supervise start-up. Cheil also dispatched five engine�rs to West Germany, England, and Australia to be trained and to observe a modern plant in operation. Cheil was successful to the extent that a decision was taken to expand capacity in the early 1960s despite excess capacity at the industry level. (In 196 1 the worsted industry was estimated to be operating at only 45.9% of capacity [Bank of Korea, 1962].) CheiI increased spinning capacity by 50% without having to resort to foreign technical assistance. It also began to produce "topmaking" wool, for which it did require foreign expertise (again inviting West German equipment manufacturers to assemble and start up the new machinery ' and again dispatching local engineers overseas for training). Cheil attributes the fact that it could expand its capacity when other worsted manufacturers were experiencing overproduction to the superior quality of its product.
In 1963, about the time the military regime began to push exports, Cheil entered a second stage of technology development in order to penetrate foreign markets. It tightened its quality control system and, interrelatedly, improved its process. It did so gradually; making errors along the way. For example, Cheil engineers (who numbered only 2% of the work force when Cheil was founded, later 6%) recognized after a visit to textile plants overseas that advanced countries were using double-apron drafting whereas' Cheil was using only a single system. Double drafting was more efficient and produced higher quality fabrics. In 1967, therefore, Cheil engineers attempted to develop a double-apron system on the basis of available literature, catalogs obtained from foreign manufacturers, and imitation of foreign models. They failed, and then sought technical assistance from their West German machinery supplier. In 1965, Cheil became the first company in Korea to have high enough quality standards to obtain the right to use the "all wool" trademark. In 1969 it became the first company in Korea's tex6le industry to win an "Invention Award" from the government. In the late 1960s, it patented seven minor process improvements.
Investments to improve quality coincided with an improved management system in the Samsung group. All new managers were recruited and trained at the group level. They were then dispatched, at the company's discretion, to affiliates. Interaffiliate communication was facilitated by the closeness of graduates of the same training class, and aU affiliates were ensured of professional management.

238 MANAGEMENT AND HUMAN RESOURCES
The Samsung group began to attract the best high school and college graduates and to become one of the most prestigious companies for which to work.
Some strategic decisions from top management concerned with longrun growth carne relatively late in Cheil's history, however. Only in the 1 980s did Cheil begin to integrate vertically, by establishing joint ' ventures in Australia to rear sheep and to manufacture woolen tops for smoother operations, and by acquiring an apparel-making plant . in Korea. As late as 1 979, twenty-five years after its founding and in response to government pressure, Cheil established a central R&D laboratory (the R&D budget for 1 983 was $ 1 .7 million). It was only in 1 970 that Cheil established an in-house training institute, although ahead of government legislation making it compulsory to do so. The 1970s were devot.ed largely to producing enough output to meet escalating domestic and overseas demand.
Nevertheless, even at the very onset of operations, Cheil showed a belief in its ability to sl'rvive, and planned for the long term. This is illustrated by its policy toward technology transfer. In 1955, just after the end of the Korean War and one year after Cheil's founding, Cheil unpackaged its foreign technical assistance. In addition to buying technical assistance from its machinery supplier, Samsung independently hired an experienced Japanese textiles engineer as advisor. The advisor developed a master engineering plan with a long-range time horizon. The master engineering plan envisioned Cheil's first plant to have a 30,000 worsted spindle capacity, which was believed at the time to be the optimal size, although only 5,000 spindles were initially installed. Consequently, as Cheil expanded and reached 30,000 capacity twenty years after establishment, no subsequent engineering was necessary until a strategic decision was taken to open a second plant.
Here, then, is a brief example of one of the earliest subsidiaries of a leading chaebol practicing pro-active production and operations management in order. to absorb. foreign knowhow. The quality of management i,s rather high despite rent-seeking and technical ignorance at the top. Such quality may be attributed in large measure to the education of salaried managers in the broadest sense-acquired from Korea's own school system and from technology transfers from abroad.
CONCLUSION
The view that a high-level of education is a key determinant of in- . dustrialization is borne out in Korea to the extent that a well-educated population in general, and a plentiful supply of trained engi-

The Boom In Education 239
neers in particular, appear to have been critical inputs into the industrialization process (but note that Brazil grew by over 6% per annum for more than twenty years without much emphasis on education). However, the role played by education in economic development ought not to be deified. Although education was highly supportive in Korea's development, its quality was modest and its role was .largely passive.
.
Of equal importance with formal education was foreign technical assistance. Formal education builds the human capital of the individual. Foreign technical assistance builds the technological capability of the firm. Moreover, as the next chapter suggests, late industrialization, in Korea especially, has been largely a process of big business groups diversifying into new industries on the basis of their technological capability rather than individual entrepreneurs acting as independent agents of further industrial change on the basis of their personal" experience and education. It is to this intragroup dynamic of creating comparative advantage that attention is now turned.


PART III
The Dynamics of Dynamic
Comparative Advantage


CHAPTER TEN
The Switch in Industrial Leadership
NONLINEAR DIVERSIFICATION
Korea has diversified from less to more complex industries in a nonlinear fashion. Diversification may be thought of synonymously with realization of comparative advantage, or better yet, creation · of dynamic comparative advantage, although the term dynamic comparative advantage is conceptually fuzzy. Korea can be said to have diversified in a nonlinear fashion because it experienced no simple transition from less to more skill- and capital-intensive industries. Part I II contains a discussion of what the dynamics of dynamic comparative advantage actually are in late industrialization.
This chapter sugg�sts that cotton spinning and weaving, Korea's leading sector in terms of production volume, did not serve as the springboard for further industrialization in any organizational sense. Insofar as the diversified business group acted as the agent of expansion, it had its origins in tlie government's more managementintensive, early import substitution projects, not a labor-intensive industry like cotton textiles. Chapter 1 1 , within the context of the shipbuilding industry .in the acutely competitive decade of the 19705, examines the hypothesis that the diversified business group provides a multitude of capa�iUties and a protective cover to latecomers wishing to enter world ttade. Chapter 1 2 examines the hypothesis that climbing the ladder of comparative advantage is 'a matter of creating competitiveness, usually with government assistance, rather than stepping into it. The evidence comes from Korea's integrated ironand steel-maker, the centerpiece of basic industry and a public en-terprise. ,
According to a "law" of economic development, there are stages of comparative advantage in the export activity (and underlying production trends) of developing countries; the stages running from
243

244 DYNAMIC COMPARATIVE ADVANTAGE
less to more skill- and · capital-intensive. I The law holds that economic activity typically begins with, say, cotton textiles or even more labor-intensive goods and progresses in stages to more complex capital- and skill-intensive products, in step with the fledgling country's accumulation of greater stocks of capital and human resources.
Korea has obeyed this law to the extent that the progression of its ' structural diversification shows no significant deviations from the expected pattern. Korean industry graduated from less to more com- . plex, there being no great leaps to sophistication. One notices the expected pattern even in the growth trajectories of leading firms. Almost aU started with small plants and only later moved to the very large: Almost all started with simple production processes (manual versus automated process controls; general purpose versus special purpose tools) and only then moved to the more challenging. Korean industrialization is very much a progression to technologically more complex industries, although the "less complex" industries are. not all labor-intensive.
Nevertheless� no matter how solid the empirical support for the "law" of stages of comparative advantage, the concept of dynamic comparative advantage remains as fuzzy as ever. This is because the law of stages of comparative advantage suffers from the same shortcoming that afflicts all stages theories: It fails to specify the mechanism by which progress fram one stage to another is realized. It is, moreover, the · mechanism of graduating from one industry to another that constitutes the dynamics of comparative advantage.
There are, in fact, two presumed paths of expansion that are -implicit in the law of stages of comparative advantage. One path involves a succession of entrepreneurs responding to market signals, flanked by salaried managers if need be, aU supported by the formal education system, as the driving force behind diversification into new industries. Nothing, however, could be further from the truth in Korea. As Jones and SaKong have pointed out;
A high peq::ent of the expansion of industrial output has come from existing rather than new firms. . . . . What has to b,e explained is not how new entrepreneurs were found, but how old firms grew, and why ne}\' firms were so much larger than the . old. ( 1980, xxxii, p. 170)
The relative unimportance of the new entrepreneur is possibly extreme in Korea, as the reference to Anderson's ( 1982) stu�y in Chapter 7 indicates. Nevertheless, the ubiquity of the diversified business group
I Stages of comparative advantage have been measured empirically by Balassa (1981 , 1984). Chenery et al. (1986) attributed a lawlike quality to Balassa's empirical findings.

'The Switch in Industrial Leadership 245
in all late industrializ�tions leads one to think that the budding entrepreneur is the exceptional rather than general pattern. That growth has largely taken the form of intraenterfrrise expansion suggests a wholly different dynamic of comparative advantage from what is typically presumed.
.
The second path of expansion that is implicit in the law of stages of comparative advantage involves the spin-off firm. In this growth path new industries are formed supposedly by entrepreneurs or managers from existing industries, who break away to form more specialized enterprises. Stigler ( 195 1 ) referred to this as a process of vertical disintegration. Rosenberg ( 1 976) documented this process of disintegration in the case of the United States, when for example, specialized textile machinery manufacturers broke away from the textile manufacturing branch. From a late-industrializing country like Taiwan is the example of its machine tool industry, which spawned several specialized parts producers (Amsden, 1977).
Nevertheless, this second growth path does not fully characterize late industrialization in Korea either. For one, the spin-'off firm has not been terribly important. According to Jones and SaKong, "Growth in value added is due first to expansion of existing firms, second to entry of offspring firms, and only to a minor extent to net entrance of new entrepreneurs (emphasis added)" ( 1980, p. 1 76). Moreover. however secondary the importance of the spin-off firm, what is noteworthy is the complete unimportance of Korea's leading secttJr in early growth, cotton spinning and weaving, as an industry that spun off sequentially more complex industrial activity.
The cotton textiles industry (defined in this chapter to include the spinning of fibers and the weaving and finishing of fabrics) accounted for as much as 20% of GNP in the 19508 (the mar:iufacture of apparel accounted for another 7%). It was considered the most modern industry at the time.2 After the 1 960s, even as light manufacturing declined in importance-from approximately 60% to 40% of GNP-cotton textiles maintained a , share of about 12% of total output. In the 1 9805 cotton textiles remained Korea's largest export. Nevertheless, despite the ,undisputed leade�ship of the cotton spin-
"In the pre·liberation period, when most of the modern industries were transplanted from Japan, this industry (te){tiles) utilized the most contemporary production and management inethods, and its output value and employment contribution led other industries. During the period of the reorganization of Korean industries after the liberation of 1945 and during the reconstruction of the war·damaged industries in the 19505, the textile industry was instrumental in the recovery and moderrtization of production facilities. '
With the beginning of formal economic development efforts in the 19605, the industry was transformed into Korea's leading export industry," (Y. B. Kim, 1980, p'. 190)

246 DYNAMIC COMPARATIVE ADVANTAGE
ning and weaving industry in Korea, it never acted as an agent of further industrialization: It transferred little know-how to new industries, it transferred few people to new industries, and it extended no organizational linkages to them. With possible unanimity, no chaebol can claim cotton spinning and weaving as the focus of its · group's activities. historically or otherwise. The closest exception to the rule is the Samsung group, which had a major subsidiary in the worsted industry; but worsted textiles are more up-market than cot- · ton textiles and are produced under a less competitive market structure.
There being no significant linkages between cotton textiles and newer industries. the dynamics of comparative advantage are less straightforward-or 'less linear-than the stages theory would suggest. Instead of emerging from the leading sector of cotton spinning and weaving, the diversified business group in the Korean model (and one suspects in the model of most other late industrializing countries) emerged directly or indirectly from the government's early import-substitutiot). projects in basic industry. (See the discussion in Chapter 2 on the birth of the chaebol.) Such basic industries. or heavy industries as they are often called, included sugar refining, large construction projects, 'cement making, fertilizer manufacture, and oil refining.
The point to note about these heavy industries is that they differ from cotton spinning and weaving and other "light" industries. They are both more capital- and skill-intensive. They rely heavily on salaried managers to control a production process that is more science-based and less of an art. Hawtrey referred to the differences between the two types of industries as capital widening a!ld capital deepening:
The process by which the, capital equipment of a community is increased may take two forms, a "widening" and a "deepening." The widening of the capital equipment means the extension of productive capacity by the flotation of new enterprises. ' or the expansion of existing enterprises. without any change in the amount of capital employed for each unit of labour. The deepening means an increase in the amount of capital employed for each unit of labour.
The latter involves an increase in the period of production and a change in the structure of production. The former involves no change in either. ( 1937, p. 3 1 ) Insofar as expansion i n the heavy industries involves a change in
the structure of production, the learning process underlying suc,h expansion is more taxing than the process of expansion in the light

The Switch in Industrial Leadership 247
manufactures7 Expansion under conditions of capital-deepening requires greater technological capability and a different skill mix on the part of management and labor. Productivity gains are realized differently and the whole process of competition is distinct. Such te�hnological capability, skill mix, and mode of productivity growth and competition provide the basis for diversifying into new industries.
To understand the differences between the light and heavy industries, this chapter compares the learning process in cotton spinning and weaving (by examining two representative integrated spinners and weavers 3) with the learning process in one of the first heavy industries to emerge in Korea, cement-making. Whereas the textile industry failed to act as an agent of further industrialization, at least two of the biggest chaebol used the cement industry as a stepping stone to more complex economic pursuits. We conclude this chapter with a discussion of how managerial capability in the Hyundai Cement Company was diffused within the Hyundai group. Through a comparison of the learning process in cotton textiles and cement we can appreciate the importance of the early import substitution activities that the government encouraged, the life cycle of a leading sector, and something of the dynamics of comparative advantage.
THE TEXTILES INDUSTRY
D and L were founded during Korea's colonial period by Japanese textiles firms that are still prominent in Japan today-Kanebo and Toyo, respectively. The present owner of D was one of the few Koreans to receive training in textiles en:gin�ering during the Japanese occupation. He learned his 'craft working in a textiles plant established by a Korean entrepreneur in Manchuria. When the Japanese fled Korea, the government entrusted the man in question to manage the plant, and in 1955 he bought the plant from the government. Thus, D's history under the same management spans roughly forty years. Similarly, L, founded in 1 935, was confiscated by the Korean government after World War II and sold to the Korean man who had managed it under the Japanese. L's history under the same management, therefore, ,spans roughly half a century.
'The tale of Korea's leading sector is told in this chapter through the histories of two firms, disguised by request, here referred to as "0" and "L." They were chosen for their ordinariness. Although more technologically advanced than many of Korea's
'small weavers, 0 and L are roughly comparable, in level of advancement, to any of the twenty or so large·scale integrated manufacturers that comprise the membership of Korea's cotton spinning and weaving cartel. In the early 19805, 0 employed 3,500 workers and' was among the largest of the integrated spinners and weavers. During the same period, L employed 2,500 workers and was in the medium-size range of the larger firm set,

248 DYNAMIC COMPARATIVE ADVANTAGE
The accumulation of experience, however, was disrupted by both the Second World War and the Korean War. As a result of the latter, the cotton textiles industry lost about 70% of its production facilities (Y. B . Kim, 1 980). However, it rapidly recovered with foreign aid and with government patronage. In 1953 one of L's current plants was rebuilt on a turnkey basis with U.N. funding by two leading textiles machinery manufacturers, British Platt and Japanese Howa. D's facilities were also modernized after 1955 with the help of both foreign loans and machinery suppliers.
Beginning in the 19�Os, export demand favored synthetic fabrics, and the growth of the textiles industry was spurred by government support for a domestic chemical fiber industry. Both D and L responded to export incentives by developing fabrics of polyester and cotton blends. In 1963, L received the President's Industrial Award for its contribution to the development of polyesterlcotton (PIC) blended fabrics; it was the first Korean firm to do so. With government subsidies and with minimal foreign technical assistance from Japanese synthetic fiber manufacturers, L had no trouble developing such blends in-house. Thereafter. however, its investments in new product development diminished rapidly. Throughout the 19605 and 1970s, L's product line was highly stable and standardized. It included only PIC blends of carded and combed yarn, and poplin, shirting, duck, and gray fabrics-although these basics were manufactured in large varieties.
D developed PIC blends in 1968 by the same devices as those used by L: subsidized in-house efforts and minimal foreign technical assistance. Thereafter, though, D's investments in product development were somewhat greater than L's. It added a few new product lines in the 1970s and 1980s, sometimes with, sometimes without, foreign technical assistance. In the case of sanitized yarn, the most specialized of D's products, foreign technical assistance was forthcoming from both independent consultants and machinery sup� pliers. But D's in-house efforts at product development, although greater than L's, were stilI small. Table 1 0. 1 provides a breakdown by technology-related functions of the time spent on each function in 1984 by D's professional and technical staff. The two functions that relate to product development:"'-product engineering and R&Dabsorbed only 1 . I % of D's total technology-related efforts.
Furthermore, a shift in output from the home to the international market left both company modes of technology acquisition unchanged. Machinery suppliers and independent consultants, mainly from Japan, continued to be the primary source of know-how. These suppliers were selected after visits by firm presidents and by only one or two technical staff people to foreign textiles plants and ma- '

The Switch in Industrial Leadersl:llp
Table 10.1 Technology-Related Functions, "0" Company, 1984
Equivalent "Person Year,"
Year Function Function Undertaken
Plant maintenance 1955 Repair 1955 Quality control 1955 Testing 1955 Process engineering 1962 Product engineering 1962 Plant expansion 1967 Technical information
services 1972 Research & development 1976
Total
'Sum of listed items exceeds 100 because of rounding.
SQlJTCt: 0 Company.
Professional and Technical Staff
. Involved, 1984
720 370
8 7 5 5
3 1 3
6 12
1 ,436
249
Percent
50.0 26.0
0.5 0.5 0.5 0.3
22.0
0.4 0.8
100'
chinery builders. Until as recently as the late 1970s, the ring-spinning frame and the shuttle loom were the basic technologies procured. Suppliers of this equipment provided technical assistance on layout, start-up, and maintenance for capacity expansions that in-· volved a new plant or a new vintage of the same basic technology. When a new variant of the same basic product line was involved, machinery suppliers also provided advice on production methods. D's and L's own engineers managed the task independently only when capacity expansions involved the same vintage of technology they had used before.
Learning-by-Doing
In the late 1 960s, Japanese textiles firms began to lose world market share to competitors from Korea, Taiwan, Singapore, and Hong Kong. The textiles exports of these four economies combined were already 82% as great as those of Japan in 1970. By 1 976 they had exceeded japan's export share by a factor of 1 .4 (Yamazawa, 1 982). Further, Korean and Japanese nominal wages in the cotton-spinning industry had risen at approximately the same rate between 1 945 and 1 975 (Woo, 1 978, p. 194). Therefore, Korea's further incursions into Japan's textiles market were not underwritten by a slower rate of wage increase, but rather by more rapidly rising labor productivity (Woo, 1978. p. 1 94). Labor productivity in the Korean cotton textiles in-

250 DYNAMIC COMPARATIVE ADVANTAGE
Table 10.2 Learning Curve Estimates for Firm "D," 1 955- 198 1-Regression: In(UV) =' I n(A) - B x In(�V)
2 -B (Learning
Industry Period -B R Rates)
Spinning 1955-1 968 -.384 .0000 .78 .766 1 968- 1981 -.507 .0000 .82 .703 1955-1981 -.45 1 .0000 .91 .7 1 6
Weaving 1 955-1968 -.500 .0002 .69 .707 1968-1981 -.5 1 1 .0003 .68 .702
L, employment; V, value·added. Sour,,: D Company.
dustry rose as a consequence of investments in foreign-made equipment, in Japanese technical assistance, and in learning-by-doing.
Estimates of a learning curve for: company D are presented in Table 1 0.2. D's learning history is divided into two periods: 1955-1968, the years when a new plant came on-stream; and 1 968-198 1 , the years when a new spinning technology-the open-end rotor-was imported. Ignoring momentarily any differences in the rate of learning between the two subperiods, what is striking about the estimates is how low they are by conventional standards (the lower the percentage, the faster the rate of learning or the rate at which labor inputs decline per doubling of output). Learning curves were first estimated during World War II in the American airframe industry (Yelle, 1979). The typical learning rate was found to be about 85%, compared with learning rates in the 70% range for D's spinning and weaving operations.
These results are consistent with the fact that cotton spinning and weaving are relatively labor-intensive operations-rates of learning tend to be especially sensitive to labor's skill and motivation and to management's artfulness in smoothing and improving the production process. Each of these factors is examined het;e in turn.
The Role of Young Female Labor
Notwithstanding the fact that the technology for making textiles is highly embodied in machinery, and that the machinery itself is relatively standardized, textiles manufacture remains an an. The young women who worked in Korea's textiles mills could not have been replaced by those who worked on the assembly lines in its electronics plants without causing an immediate fall in productivity. Through-

· The Switch in Induslrial Leadership 251
Table 10.3 Wage Differences in Manufacturing Industries: 1 970. 1974, 1978, and 1981
Wage Differences
Industry 1970 1974 1978 198 1
Average wage 100 100 100 100 Food I I 1 .0 106, 1 I I S,3 121 .7 Texliles 78.6 8S.3 74.6 79,3 Wood products 102.9 96.3 101 .5 96.2 Paper . 129.7 120,2 1 34.5 124.6 Chemicals 123.S l IS.7 1 13.6 1 15 . 1 Nonmetallic minerals 104.5 1 16.3 127 . 1 1 14.6 Steel 143.9 160.1 IS0.7 1 38.4 Machinery 109.9 101 .9 109.2 107.7 Other 73.7 73.8 76.2 78.3
Source: F. Park (1983).
put time and quality in textiles manufacture depend on the skills of operators in mending yarn breaks and repairing fabric imperfections. Yet • . although the Korean trade union movement has been especially active in the cotton textiles branch, the wages in the textiles industry have been consistently 15% to 25% below the all-industry average (see Table 1 0.3), According to J. J. Choi.
.
Factory production of textile goods represents the largest and oldest manufacturing industry in Korea; cotton textile manufacture especially constitutes its core. It was in this branch, therefore. that large textile mills were represented by one of the most well organized employers' associations, . . . and that the unionized workers staged some of the largest strikes . '. . in the midst of the Korean War and . , . in the Syngman Rhee era. ( 1 983. p. 441 )
The labor unrest that swept over Korea beginning in the late 1 970s wa� particularly acute in textiles (Commission of the Churches on International Affairs, 1 979; Pallais, 1986). not least of all in company D,
The long and short of the labor strategies of both D and L was their intent to avoid any acceleration in wage increases and to raise productivity by means of both quality control cirdes (QCCs) and paternalism.
QCCs were viewed as an important vehicle for raising worker commitment and output because neither D nor L offered its workers any formal training. Introduced to D and L by Japanese consultants in the early 1970s. QCCs were studied further, in the case of D. by

252 DYNAMIC COMPARATIVE ADVANTAGE
its president, who traveled to Japan.under the auspices of the Korea Management Association. Then still more was learned about QCCs from the Korean Standards Association. The. rate of wage increase . in all Korean industries began to accelerate at this time, and the '
government made vocational training in large-size firms compulsory. Like many other textiles firms, however, D and L exempted themselves from this legislation. They provided their workers instead with primary school-and sometimes even secondary school--'education , a compromise that the government found acceptable.
According to D, the establishment of primary schools on company premises had the effect of sharply reducing labor turnover. Although full-time workers were required by law to be 16 years or older, many of D's workers were younger, with barely any formal schooling. With the provision of formal schooling, D's factory girls became better workers; thus paternalism came to operate round the clock. Factory girls slept and ate in company-owned dormitories, spent nine and one-half hours on the job, and devoted evenings to study in company-owned night schools.
The Role of "Hands On" Management
Year-to-year productivity changes in the L Company are presented in Table lOA. Ignoring for the moment the data that relate to the new technology of open-end spinning, Table l OA presents company' figures on labor productivity and machine productivity for ring
Table 10.4 Labor Productivity in ilL" Company, 1977-1986
I..abor Productivity Machine Productivity
Ring Open-end Spinning Spinning
Year (kg/man·8hr) (kg/man·8hr)
1977 52.39 1978 55.87 1979 56.97 137.06 1980 56.37 157.39 198 1 59.52 178.82 1982 6 1 .60 177.54 1983 66.68 199.75 1984 70. 12 178. 13 1985 7 1 .05 214.38 1986 78.49 210.30
Weaving (m/man·8hr)
216.22 2 18. 17 203 . 14 1 83.02 1 87.68 199.43 1 99. 1 1 1 86. 15 196.49 224.05
Ring Open-end Spinning Spinning
(kg/sp·8hr) (kg·sp·8hr)
0. 199 0. 199 0.203 0.91.3 0.204 1 .073 0.206 1 .076 0.2 10 1 .089 0.2 14 1 . 107 0.222 1 . 1 86 0.221 1 .250 0.225 1 .259
kg, kilogram: m. meter: sp. spindle: mach. machine; 8 hr, 8 hours.
Source: L Company.
Weaving (mlmach·8hr)
36. 1 1 36.28 36.54 36.04 36.01 35.1 1 ' 34.78 34.34 34.73 35.38

The Swlich in Industrial Leadership 253
spinning and weaving for the years 1 977 through 1986. Although capital investments in L were not altogether constant during this period, they could not have had much of an impact on productivity behavior. As indicated in Table 10.5, between 1977 and 1984 L added only 3,024 nng-frame spindles and 162 looms to its capacity. whereas its existing stock of ring-frame spindles and looms equaled up to 120,000 and 1 ,200, respectively. Table l OA indicates that productivity in weaving stayed practically constant. but that labor productivity rose more than machine productivity and labor productivity in ring spinning rose by .a factor of 1 .5 in a decade-even though ring spinning was an old process.
These productivity improvements stand as a monument to L's technical staff. In 1 983 as much as 59.7% of L's staff of engineers had held their current jobs for more than five years, and 36. 1 % had more than ten years' experience. To raise productivity, the accumulated skills of these managers were deployed throughout the pro�uction process.
First, they were deployed in maintaining and repairing machinery, tasks that required a lot of know-how, given the age of L's capital stock. Second. they were deployed in devising optimal machineryoperating conditions for the manufacture of different types of yarns or fabrics, a task that required a lot of know-how. given a large number of "changeovers" (i.e .. resetting of machinery conditions for production lots of different types of yarn or fabric). Changeovers were· frequent because L produced a large variety of the same product in order to minimize risk. Third. they were deployed in mixing different types of cotton and synthetic fibers to achieve an optimal blend. Better maintenance. smoother runs, and better mixing .all contributed to reduce breaks; reduction in breaks, in turn, reduced labor requirements. Break reduction depended, too, on the selectioll of machinery settings. Slower running machines. which might lower machine productivity, often meant higher output per worker and lower energy requirements. Better maintenance and synchronization of machines also allowed loading and unloading of large.r size bobbins, which further reduced labor requirements.
Structural Stagnation
The 1970s were a Golden Age for the Korean cotton textiles indus. try. with profits, output, and learning-by-doing all rising rapidly and an average annual real output growth rate of 20% (World Bank, 1 987). Nevertheless • . although the cotton textiles industry was enjoying incremental productivity improvements and earning lots of money. it was engaging in short-sighted profit-maximizing behavior. Year

tv Table 10.5 Capacity Additions in "L" Company, 1963-1984 U1 "'" Technical Assistance
Date Invesunent Technology Machinery Supplier (Engineers) Major New Product
Sep., 1963 Spindles, 10.000 Ring frame Platt (U.K.) 5. British Sep., '.966 Looms. 100 Shuttle Howa Uapan) 2, japanese Jul:, 1967 Spindles, 10,000 Ring frame Howa Uapan.> 2, Japanese Nov., 1967 Spindles, 1 1,200 Ring frame Howa. Platt 2. Japanese
2, British Oct .• 1970 Spindles, 2,000 Ring frame Platt None Jan., 197 1 Spindles. 10.176 Ring frame PIau 2, British
Looms, 305 Shuttle Enshu Uapan) 2, Japanese Mar., 1973 Spindles 7,344 Ring frame Howa None Aug., 1973 Looms, 206. Shuttle Enshu None May, 1974 Spindles, 30,072 Ring frame Platt None
Looms, 94 Shuttle Enshu, Picarol 1 , Belgian (Belgium)
Apr., 1975 Spindles, 10,365 Ring frame Platt None Looms, 100 Shuttle Enshu None
Aug., 1977 Looms, 1 1 2 Shuttle Picarol, Enshu I , Belgian . Oct .• 1979 Spindles, 840 Open end Ingolstadt I, German Open-end spun yarn
(Germany) for weaving Apr., 1983 Looms, 50 Shutdeless Ishikawa Oapan) 3, Japanese Sep., 1983 Ring frames, 3,024 Ring frame Howa None
Samwhan Platt' Dec., 1984 Spindles, 1 , 1 52 Open end SchlafhorSl 2, German Open-en<l spun yarn
(Germany) for knitting
'This firm is a joint venture between a Korean firm and PlaIt (U.K.). SOUTC", L Company.

The Switch in Industrial Leadership 255
after year it produced the same mix of standardized products at the low end of the quality range. As a result, its competition increasingly came from lower-wage countries that were trying to enter this market segment, rather than from higher-wage countries that were trying to exit from "it. Such a short-run strategy was unsustainable since Korean wage rates were rising fast. Because product-mix constancy enabled textiles firms to operate with an unchanged process, little qualitative improvement in skills was needed. Therefore, even though the textiles industry experienced some intermarginal improvement in skills as a consequence of learning-by-doing, no inframarginal improvements occurred in the form of shifts in its skill set. An unchanging process also created little need for foreign technical assistance, which meant firms were denied the opportunity to ratchet-up their know-how. However, such stability in learning was made tolerable by the relatively labor-intensive technology of textiles manufacture.
The nature of the production process technology of spinning and weaving enabled textiles firms to grow rapidly by adding capacity in small increments. Thus workers were not induced to learn new skills, because as the firms enlarged their operating capacity, their process technology did not change. As Table 10.5 shows, L added to its capacity eighteen times in twenty-one years. Yet each increment to capacity embodied roughly the same ratio of capital to labor (or what is sometimes called capital widening). After ten years of intense in- . vestment activity from 1972 to 1983, the share of labor costs in L's total manufacturing costs was slightly higher, not lower. In D, labor's share in the same period remained almost constant. The aggregate industry capital labor ratio ranged from only 1 .72 million won per worker in 1966 to 3.55 million won per worker in 1 977-1979 (see Table 10.6).4 Such a low capital labor ratio suggested minimal change in the production process.
In pait, each iQcrement in capacity embodied roughly the same ratio of capital to labor because the technology employed by textiles firms in Korea remained fairly stable for a long stretch of time. As indicated in Table 10.5, from 1 963 to 1977 L used the same basic technology to spin-the ring frame-and from 1963 to 1983 it used the same basic technology to weave-the shuttle loom. Even though the global diffusion of a substitute for the ring frame, the open-end rotor, began in the 1970s, neither L nor D introduced the rotor until 1979 or slightly thereafter, and then only on a trial basis. The openend rotor was a radical innovation because it simplified certain aux-
4 Whereas fixed assets per worker had increased by 8. 1 % during 19� 1- 1982 in all manufacturing, fixed assets per worker had increased by only 5.67% in the textiles industry (Hong and Park. 1986).

256 DYNAMIC COMPARATIVE ADVANTAGE
Table 10.6 Average Capita!'/Labor Ratios in Korean Textiles and Cement Industries, 1966-1979 (in Million Won per Worker)
Period Textiles Cement
1966 1.72 27.72 . 1967- 197 1 2.29 32.06
1972- 1976 3.20 48. 1 2 1977-1979 3.55 49.18 1966-1979 2.84 4 1 . 1 6
'C·ros, capital ,tock i n million, i n real prices. Level of aggregation: textiles: Korea Standard Industrial Classi· fication (KSIC) 321 ; cement: KSIC 36921.
S ... "" Computed from Korea Development Institute. Korean Industry Capital Stock Calculations. 1982.
iliary steps in the process flow that formerly required high labor and capital inputs. Yet the adoption of the open-end rotor was slower in Korea than in any major competing country. Antonelli ( 1 986) calculated the penetration level of the open��nd rotor in twenty-eight countries during the period 1975-1983, and some of his data are presented in Table 1 0.7. They show that whereas the rotor's penetration levels in 1 983 were 9.88% ita Hong Kong, 6.76% in Singapore, and 2.83% in Taiwan, penetration in Korea was only 0.72%.
Table 10.7 Penetration Level" of the Open-End Rotor, 1975-1983
Country 1975
Korea 0.08 Hong Kong 5.33 Singapore 4.21 Taiwan 0.39 �ndia 0.00 Mexico 0.5 1 Argentina 0. 1 1 Brazil 0.50 Japan 1 .83 United States 0.88 United Kingdom 1 . 19 Germany 1 .36
1983
0.72 9.88 6.76 2.83 0.02 1 .20 2.15 1 . 14 2.72 2. 15 4.29 4.58
• Measured as ratio of open�nd rotors to ring spindles. One rotor is equivalent to two spindles.
Source: Data from International Textiles Manufacturers' Federation. as prepared by Antonelli (1986).

The Switch in Industrial Leadership 257
This constancy in Korea's textiles industry technology implied a constancy in its set of textiles skills.
The textiles industry in general was slow to introduce new technology because to do so would have represented a radical departure from past investment practice. In the 1960s and 1970s, the investment practice in the textiles industry was to minimize capital expenditures per unit of labor, with two corollaries: First, such capitalminimizing meant substituting existing for new equipment, where pos�ible, even at the expense of quality. Whereas, over time, both D and L introduced more advanced generations of shuttle looms and ring spinners, they stopped short of introducing the latest generations that featured greater automation and computerized processmonitoring control. By 1986 both D and L lagged behind less-experienced firms in newer industries in their rate of introduction of computerized process-monitoring controls. In 1985, L had invested in applying electronic sensors to some of its weaving machinery, because that investment promised quick returns, but it had not made the same investment in its spinning machinery, because the payback period was too long. It also had decided against investing in special machinery-automatic levelers and high-caliber yarn clearers-to control quality.
Second, capital minimizing meant running existing machinery for as long as possible. Both D and L stressed that a lot of its technically outmoded equipment was highly profitable to use. In 1986 th� average age of L's looms was 12.9 years, and the age of its ring frame spindles averaged 1 8.2 years. Figures produced by the Ministry of CQmmerce and Industry (MCI) in 1982 caused alarm because they revealed a high degree of machinery obsolescence in the textiles sector. The MCI defined obsolescence as over ten years old for looms and spinning and knitting machines, and over seven years old for dyeing and sewing machines. Using these definitions, MCI estimated that more than ,*0% of Korea's spinning machinery and more than 50% of its looms and dyeing machines were obsolete (see Table 10.8).
The Difficulties of Diversification
The unchanging skill base of the textiles industry made it difficult to "upscale" and all but impossible to act as agent of further industrialization through diversification into new industries.
According to the 1967 census of manufacturing. 1 50 establishments in all of manuf�cturing employ,ed more than 500 employees. Of those large establishmet:\ts, 29% were in the textiles sector (which accounted for roughly 14% of GNP at the time) (Economic Planning Board. 1967). Thus, at one time cotton spinners and weavers were

258 DYNAMIC COMPARATIVE ADVANTAGE
Table 10.8 Share of Obsolete" Machines in the Textile Industry, 1982
Total Number % Obsolete Type of Machine Number (A) Obsolete (B) (BfA)
Spinning 4,246.246 1 ,740.92 1 4 l .0 Loom 187.827 94,578 50.4 Dyeing 7.576 3,853 50.9 Knitting 75.4 18 33.767 44.8 Sewing 169.759 53,570 3 l .6
'Obsolete spinning machines. looms, and knitting machines are over ten years old; obsolete dyeing machin!," and sewing machines are over seven years old based on their depreciation period.
SooTce: Ministry of Commerce and Industry.
the cream of the country's manufacturing establishments in term� of size and modern management. Yet none of the veterans in the cot.ton textiles industry in the 1 950s and " 1 9605 became the leading chaebol of the 1 970s and 1 980s. Most of the chaebol did profit " in one way or another from the textiles boom-by trading in textiles or by entering the related fields of synthetic fibers, apparel, and in one case (that of Cheil Wool) worsteds. But among the top sixty-five chaebol in 1 984 (ranked by sales), only five at any time had a major focus in cotton textiles. The largest among these five, Chungnam Spinning, ranked only fortieth among the total top business groups (S. K. Kim, 1987).
Furthermore, companies like D and L on the one hand, and the Samsung group's Cheil Wool subsidiary on the other, differed sharply in their ability to use textiles as a springboard to other manufacturing activities (see the discussion on learning by Cheil Wool in Chapter 9). The Samsung group looked outward for its industrial competence, to fresh university graduates and the experienced engineers of competitors, whereas D and L looked inward. The Samsung group was a generalist in manufacturing skills, whereas D and L were spe- " cialists in textiles.
The capability of the chaebol to diversify into newer and more complex industries is taken for granted, but diversification depends on skills-in preinvestment feasibility studies, in project execution, in training. and in production-that the managerial resources of companies like D and L did not possess. Instead. D's and L's managerial know-how derived from their long-term accumulation of experience on-the-job. the thread of expertise extending back to the time of Japanese management." Company presidents at D and L did complain about the lack of "internationalism" on the part of their technical people. Even on D's Board of Directors. only one of nine

The Switch in Industrial Leadership 259
members had had any formal education outside Korea. Few salaried managers at either company could speak or read a foreign language. This impeded diversification.
When L's future in the cotton textiles industry became clouded with competitors from lower-wage countries, L attempted-unsuccessfully-to diversify into yachts, construction, and computer software. The company's diversification into yachts was misguided because Korea had few internal waterways and because Taiwan posed as a formidable competitor in international markets. Its diversification into the construction sector failed because its engineering and project coordination know-how were minimal and competition was fierce. Its diversification into computer software failed because it had little firsthand experience with either business or process computers and was unable to mobilize sufficient technical talent at a time when venture capital was pouring into the computer software field. Because L's annual sales in the early 1980s were as much as $85 million, and it had had a long time to accumulate capital and to develop credit channels, it cannot be said that L's failures at diversification were caused by capital shortages.s
In the case of D, it attempted instead to diversify into related fields, forming a joint venture with a Japanese apparel manufacturer and a Japanese synthetic fiber manufacturer. In addition, it established a wholly owned subsidiary to produce knitted fabrics as a way to diversify its yarn output and to supply its joint venture with knitted as well as woven fabrics. It also formed a trading company with the intention of distributing its own exports. Nevertheless, a decade after its joint venture was founded, less than 5% of D's total sales was accounted for by garments. Instead, yarns rose in importance to almost 80% of sales, with woven fabrics accounting for the remainder. The problem associated with integrating into quality apparel were of two types: ( 1 ) Wholly owned apparel subsidiaries found it difficult to
5 Many economists in Korea and in the World Bank attribute part of the decline in the textile industry to government IIltervention (see, for example, World Bank, 1987). They argue that the government allegedly discriminated against the textile industry in its allocation of subsidized credit to build up the heavy industries. In fact, there is no evidence that the tex�les industry was starved of capitill-to the contrary. According to the findings of Hong and Park (1986), the textiles industry received aboveaverage subsidized bank loans in 1974-1979 and 1980-1982 and average subsidized bank loans in 1971-1973. Hong and Park calculated loan to value-added percentages in twenty-three industries and in all of manufacturing for the period 1971-1982. They then calculated the ratio of the percentage in each industry to the alI-manufacturing average. In 1971-1973, the ratio for the textiles industry was 1.0, implying a loan to value-added percentage equal to the all-manufacturing average. In 1 974-1979 and 1980- 1992, however, the ratio was above the all-manufacturing mean: 1.2 and 1 . 1 . respectively (see Table 4.2).

260 D'r'NAMIC COMPARA TIYE ADY Aj\/TAGE
compete against high-fashion houses, especially those in Hong Kong. (2) Prestigious foreign joint-venture partners were hard to find because Korean spinners and weavers had little to offer, being neither especially low cost nor particularly innovative in product development.
The Uncertainties of Upscaling
Those weaknesses in managerial resources that prevented D and L from acting as agents of further industrialization also undermined their ability to meet low-wage competition by "upscaling," that is, by moving into a higher-quality market niche in the textiles sector. Therefore, one of the first steps L took, when threatened by competition in the mid- 1980s, was to recruit an engineer with a master's degree in textiles engineering from Seoul National University, Mr. Kim. Textiles engineering is one of the oldest engineering disciplines taught in Korean universities, and between 1963 and 1980, 5.8% of a total of roughly 100,000 university graduates with engineering degrees had majored in textiles engineering (Ministry of Education, various years). Most graduates, however, were believed to be unable to find jobs in the textiles sector, and Kim considered him-self lucky to be working for L.
.
According to Kim, there were some weaknesses in L's capability, productivity being lower than in Japan, but he believed that there were also some strengths and that progress was being made. · In a 1977 study by the Korea Productivity Center, which measured productivity by the number of hours of labor needed to produce .one unit of output, labor hours were found to be 2.2 times higher in the Korean than the Japanese textiles industry (Han'guk Saengsansong Cent'a, 1979). Kim said that there were many causes for this.
The first cause of L's lower relative productivity was its reluctance to invest in new m.achinery. L was hesitant despite the dramatic productivity increases it had realized from the small amount of new technology it h.ad introduced. As indicated in Table. 10.4, the introduction of the open-end rotor in 1979 had led to an immediate jump in productivity above the level of the previous technology on the order of 2.4 in labor and 4.5 in capital. Altq.ough learning-by-doing continued to increase productivity on ring-spinning technology, it could not substitute for buying the new. According to Kim, L was slow to invest in new technology because the company was conservative. It adopted a wait-and-see attitude and followed the lead of other members of the industry's cartel. Nevertheless, L had begun to invest more in spite of obstacles to its "learning." It was building a new plant because an old one had burned down and it was equipping it

The Switch In Industrial Leadership 261
with the latest technology-open-end rotors and shuttleless looms. L's transition to shuttleless looms in 1983-1984 had been very difficult. The company sent its best engineers to Japan to learn new operating methods, and Japanese machinery suppliers stayed at L for about a month.
Productivity was higher in Japan, according to Kim, because of better repair and maintenance. L's .experienced engineers could operate the new machinery, but they could not repair it because it contained printed circuit boards and electrical parts that were unfamiliar to them. They didn't know enough Japanese or English to read the user manuals provided by machinery suppliers. In addition, most of the old-timers were resistant to the new machinery so that, in 1984, L had begun selecting young boys for training in electronics and repair. New machinery was worth maintaining, but Kim concluded that maintenance went against the grain at L. It was regarded as a waste of time and expensive because wages had to be paid for the duration of the time machinery was down. Furthermore, the Japanese maintained their machinery better because it was newer, and therefore the variable wage component in total costs was lower.
Kim said that L was just beginning to learn theoreticaJ know-how. The company began to document every process, and it had introduced a computer in 1 985 for the purpose of furthering statistical quality control. The capability of every machine had to be determined in order to decide whether to accept new orders for higher quality yarns and fabrics. While the old-timers were good at mixing, they had used a fixed combination of cottons, changing the mix only slightly from one material to another. Because fine fabrics required more complex mixing, Kim wrote a computer simulation program for mixing raw cotton. However, even though he had consulted a University of Texas program, which he then modified to suit L's conditions, his program failed. Kim concluded that' mixing remained an art and that the old-timers were indispensable.
Royalties paid by the textiles sector for foreign technical assistance rose dramatically in 1978- 1979, indicating an attempt on the part of the industry to upgrade. Of total royalties for the penod 1962-1983, almost 90% were incurred after 1976. By the late 1970s-early · 1980s, almost all of the textiles industry's proprietary imports for foreign technical assistance were related to product rather than to process: 40.6% of technical assistance was designated for new products and 37.5% was designated for product improvements (Federation of Korean Industries, 1984). However, Kim suggested that in spite of this industry trend, a company like L was reluctant to invest in product development because it was still more profitable to operate at the bottom end of the market.

262 DYNAMIC COMPARATIVE ADVANTAGE
TEXTILES MANUFACTURE VERSUS CEMENT-MAKING
Like the textiles industry in Korea, the cement industry originated during the Japanese colonial period. During the post-Korean-War era, it underwent first import substitution and later export promotion (a decade behind textiles). The cement industry also resembled the textiles industry in that it produced relatively standardized products and learned in an intensely competitive milieu. Nevertheless, the ways each industry created value and competed were quite distinct because of sharp differences in capital and skill intensity.
As indicated in Table 10.6, the average 'capital labor ratio in 1966-1 979 was 4 1 . 16 million won per worker in the cement industry compared with 2.84 million won per worker in textiles. In 1980 the percentage of college graduates in total employment was lower in textiles than in most manufacturing industries: 0.8% compared with the all-manufacturing average of 8. 1 % (Economic Planning Board, 1983). Differences in skill intensity are also suggested by international data that compare across industries the number of engineers per 1 ,000 persons engaged. According to a 1 970 study, data for the United States show that the manufacture of textiles involved seven engineers per 1 ,000 persons engaged, whereas the manufacture of glass, stone, and clay products involved as many as nineteen (Zymelman, 1980). Data for other countries also show that cement-making generally demands three times more engineers per 1 ,000 persons engaged than does textiles. The difference in technical and managerial resources of the two industries and the difference in management approaches that these resources entail-more scientific in the case of cement, more artistic in the ·case of textiles-underscore the difference in the ability of the two industries to diversify. Whereas no integrated cotton spinners and weavers transformed themselves into major diversified business groups, two cement firms (of a total of nine) later became chaebol affiliates: the first was the manufacturing facility of Korea's largest chaebol, the Hyundai group (see the discussion below), and the other, which accounts for almost 50% of cement output, ·'became the major component of the seventh largest chaebol, the Ssangyong group (whose first manufacturing affiliate was in the soap industry).
Differences in skill and capital intensity in the textiles and cement industries reflected different modes of learning, competing, and realizing value in three respects:
1. Foreign technical assistance was far lower in the textiles industry than in that of cement. This is indicated in Table 10.9, which presents data on proprietary transfers of technology by industry for the period 1962-198 1. Both royalty payments and value-added

tv OJ (.oJ
Table 10.9 Proprieury Transfers of Technology in Korea, by Sector and Plan Period, 1 962-1 98 1
Percent Distribution of Cumulative Values
Foreign Investment Licensed Technology
Approvals Amount Approvals Royalty Distribution by: Granted Invested Granted Payments
Sector, 1962-1 98 1 Food, beverages, tobacco 2.6 3.6 2.5 1 . 1 Textiles, apparel, leather 9.7 7.2 1 .6 1 . 1 Pulp, paper products 0.4 0.1 O.S 1 .5 Pharmaceuticals 2.0 1 .6 2.9 0.4 Synthetic fibers, resins 14.4 30.9 2.7 4.5 Petroleum refining, other chemicals 1 . 1 8.2 18.7 36.S Cement, ceramic products 3.2 1 .6 3.0 2.4 Basic metals 9. 1 6.7 9.7 1 1 .4 Nonelectrical machinery 17.2 8.9 3 1 .6 2 1 .3 Electrical machinery 24.8 22.4 19.5 1 2.3 Transport equipment 1 .0 5.0 3.0 3.3 Other manufacturing 1 4.4 3.9 4.0 3.7
Total manufacturing 1 00.0 100.0 100.0 100.0
Plan Period
1962-1966 2.0 2.5 1 .6 0.1 1967- 197 1 20. 1 6.7 14.2 2.7 1972- 1976 56.4 47.3 22.5 18.4 1977-1981 2 1 .5 43.5 6 1 .S � Total 1962-1981 100.0 100.0 1 00.0 1 00.0
Aggregate cumulative total cases 693 1 ,249 1 ,840 565
'Value is included in olher chemicals.
Production
Value-added
24.0 19.0 2.5
2.8 20.2
5. 1 7.1 2.3 9.3 5.3 2.3
100.0
4.4 1 1 .5 28.3 55.8
1 00.0
156,351
'Values used 10 compule percentages arc in millions of U.S. dollars: al current prices for amounts invested and paid and at constant 1975 prices for value-added. Total mar not reconcile due to rounding.
.
SQurce: Westphal. Kim and Dahlman ( 1985).

264 DYNAMIC COMPARATIVE ADVANTAGE
for each industry are cumulative. The data suggest that the textiles industry (defined to include apparel and leather) accounted for 19.0% of manufacturing value-added in 1962....:. 198 1 , but for · only 1 . 1 % of total royalty payments. By contrast, the cement industry (defined to include ceramics) accounted for 5. 1 % of valueadded and 2.4% of royalties. The intensity of foreign technical assistance may be represented by the ratio of royalty payments of value added: the higher the rati�all it the t(ansfer ratio-the greater th.e intensity. In nei�her the textiles nor cement industry was the transfer ratio as high as in, say, petrochemicals or machinery. But it was far lower in textiles than in cement, 0.059 and 0.47 1 , respectively.
The textiles industry's relatively low transfer ratio meant that foreign technical assistance left the breadth of know-how of individual managers almost unchanged. A defining characteristic of foreign technical assistance for capacity expansions in the heavy industries, cement inc,uded, has been the training of large numbers of administrative and technical personnel overseas, both on-thejob and in formal cburses. The results of such overseas training have tended to include a sharp rise in the familiarity of engineers, front-line supervisors, and sometimes even skilled workers with state-of-the-art production processes. By contrast, foreign technical assistance in the textiles industry involved very little overseas training. On two occasions in the 1960s, L sent five or six. engineers to Japan in preparation for new plant or major capacity expansion. But such training all but ceased in the 1 970s. Overall, the effects of this lack of internationalism were that the professionalism of managers remained at a low level and that the lack of either an international outlook or a means for communication persisted. These effects contributed to a failure on the part of textiles firm's to branch out into other manufacturing industries.
2. Divergent learning paths in textiles and cement firms were reinforced by differences in the content of the foreign technical assistance that was provided not just abroad but also on-site in Korea. The cement industry's transfer ratio was high .partly because cement firms spent a lot on "software," that is, the detailed instructions that cement process specialists provided on how to operate a cement mill. This constituted the starting point for the industry's systematic in-house approach to experimentation in order tc . find the optimum operating conditions. By contrast, textiles firms spent far less on software because their standardized e.quipment did not warrant it. Instead, to achieve optimum production conditions, textiles firms relied almost entirely on the accumulated

The Switch In Industrial Leadership 265
experience and intuitive know-how of their technical staff. Thus, the relatively uncodified technology of cement-making gave rise to a more procedurized mode of learning, whereas the explicit technology of textiles manufacture gave rise to a mode of learning premised more on art than on science. Such a learning mode was difficult to transfer to other manufacturing industries.
3. Although both textiles and cement firms competed largely on the basis of price, they competed differently: Capital costs were the more important determinant of price in the cement industry, whereas in textiles labor costs were the more important determinant of price.
Capital costs per unit of output in the cement industry depended on three dimensions of the production process-technology, scale, and process automation. The industry's cost-minimizing strategy, therefore, became one whereby firms adopted "state-of-the-art" technology, larger scale, and greater process automation. The cement industry leader of the 1960s, which failed to introduce a new generation of technology and instead followed a strategy of fine tuning an existing one, was taken over ty the Ssangyong Cement Company during a period of severe price competition in the mid- 1 970s. In 1986 Ssangyong Cement operated a total of sixteen kilns in three plants, one of the kilns the world's largest. During the course of its twenty-year history, it introduced three new generations of technol� ogy: a wet process in the early 1960s, a dry process in the late 1960searly 1 970s, and a new dry process in the late 1970s. During the same time period, the scale ofits kilns increased by a factor of 7. Its earliest kilns had a yearly capacity of roughly' 400 TMT (thousand metric tons) its next generation of kilns had an annual capacity of roughly 1 ,300 TMT, and the kilns installed in the late 1970s-eady 19805 had an annual capacity of 2,800 TMT. As scale increased, more automated .process controls were appended. Ssangyong installed a semicomputerized process�monitoring system in its largest plant. By 1986 a newer plant of a competitor had become fully computerized.
As technology, process automation. and scale changed, capital-intensity changed pari passu. As indicated in Table 10.6, the capital labor ratio in the cement industry rose from 27.72 million won in
. 1966 to 32.06 million won in 1967- 1971 to almost 50 million won in 1977- 19?9. A change in the capital labor ratio signaled a change in the production structure, or what Hawtrey called capital deepening, and with such change came pressure on cement firms to learn different skills. The introduction of new vintages of technology demanded adaptations in investment and in production capability. As the scale of

266 DYNAMIC COMPARATIVE ADVANTAGE
operations increased, production and 'quality know-how had to adjust, because technical parameters did not change linearly and the introduction of computerized process controls induced more vigor- ' ous efforts to monitor quality.
We turn now to a discussion of how managerial capability in the Hyundai Cement Company was diffused within the Hyundai group.
THE HYUNDAI CEMENT COMPANY
The Hyundai group accumulated its first fortune in the construction industry, having been founded by C. Y. Chung, a man of modest means and little formal schooling. [Most Korean entrepreneurs are well educated, from rich backgrounds (Jones and Sakong, 1980).]
Chung impressed the U.S. military authorities in Korea after World War 11 largely with a brother who spoke fluent English. Hyundai Construction began repairing bridges. paving roads, and building army barracks, simple dams, and reservoirs, using "appropriate , technology" specified by the Corps of Army Engineers. Although Hyundai began working for the military in 1947, its first bulldozer was deployed as late as 195 1 . With the start of the Korean War and in its aftermath, however, construction projects became more technologically complex and also more lucrative. Between 1963 and 1966, for example, military projects accounted for 26% of Hyundai's total construction revenue but for almost 77% of its total profits.
Even when U.s. aid began to wind down in the mid- 1960s, Hyundai proved sufficiently confident about the future to petition the government for a license to establish its own cement-making affiliate. Cement-making never became one of Hyundai's major enterprises. The mill that it established was uncharacteristically small, in fact one of the smallest in Korea. The mill, however, was critical for Hyun� dai's internal development and was a first for Hyundai in two respects: It was its first manufacturing affiliate and it was its first attempt to construct an industrial plant. For both reasons and with an eye toward the , future, Hyundai attempted to involve itself as much as possible in all aspects of project execution.
To maximi�e involvement, Hyundai unpackaged technology transfer, much as D and L had done. Technology transfer in the. case of a cement mill, however, is a much more complex procedure than in the case of a textiles plant. The latter mainly concerns the import of standardized pieces of stand�alone equipment, whereas in a cement mill, all parts are integrated and are less standardized individually: Hyundai, therefore, signed a technical consulting service agreement with George A. Fuller Company of the United States, a

The Switch in Industrial Leadership . 267
Table 10.10 Hyundai's Involvement in Plant Erections
First Second Initial Plant Expansion Expansion
1964 1968 1974
Basic engineering Allis Chalmers Fuller Fuller Detailed engineering Allis Chalmers Fuller Fuller. Hyundai Procurement Allis Chalmers Hyundai Hyundai Supervision Allis Chalmers Hyundai Hyundai Construction Hyundai Hyundai Hyundai Start-Up Allis Chalmers Fuller, Hyundai · Fuller, Hyundai
Source: Amsden and Kim, 1985b.
cement-plant process manufacturer, which provided general engineering advice on the overall project (it was incumbent on Hyundai to deal only with American suppliers because finance had been arranged through U.S. aid). On the Fuller Company's advice, Hyundai signed a contr,act with another American cement-plant process manufacturer, Allis Chalmers, for all project-related services except construction, but including a performance guarantee.
Hyundai's success at technology assimilation is suggested in Table 10. 10. In the initial plant erection, the only function Hyundai undertook was construction, under Allis Chalmer's supervisiori. Then in an expansion four years later in 1968, Hyundai undertook the functions of procurement and supervision as well as construction, and even collaborated on start-up with Fuller. By 1974 the only function Hyundai did not engage in was basic engineering, which is typically left to cement-plant process specialists by all cement-makers, no matter how experienced.
The assimilation of cement-making technology was the basis for Hyundai's successlul bid, ten years later, on a turnkey cement plant export to Saudi Arabia worth as much as $208 million. As for manufacturing capability, Hyundai used its cement plant as a laboratory to train its managers with backgrounds in construction, before assigning them to other manufacturing affiliates. Trainees gained experience in inventory management, quality and process control, capacity planning, and so on, thus spreading basic production skills throughout the Hyundai organization. After Hyundai Cement, the next manufacturing affiliate in the group was founded in 1967 and named Hyundai Motors. Twenty years later it became the first independent auto maker from a late-industrializing country to export globally. The first president of Hyundai Motors was a former president of Hyundai Cement.

268 DYNAMIC COMPARATIVE ADVANTAGE
CONCLUSION
The dynamic · of dynamic comparative advantage in Korea is one wherein growth emanates primarily from the diversified business group, secondarily from the spin-off firm, and only insignificantly from the specialized, independent entrepreneur. Moreover, the biggest Korean business groups of the 1970s and 1980s cannot trace their lineage to a specialization in the leading sector of the 1 950s and 19605, cotton spinning and weaving. In this respect the progression from labor-intensive to capital- and skill-intensive industry in Korea was nonlinear. The chaebol have their antecedents not in cotton spinning and weaving but in the simpler import-substitution heavy industries that the government encouraged on the periphery of the light manufactures.
This dynamic attests to the importance of early import-substitution activity. The importance of such activity stems from the fact that even the simple heavy industries like cement have qualitatively different technologies-and hence, modes of competition-from those of the labor-intensive pursuits like cotton spinning and weaving. The heavy industries expand by capital deepening, or a rise in the capital! labor ratio, rather than capital widening, or a multiplication of production units with the same ratio of capital to labor and hence production processes and skills. Capital deepening requires a relatively large cadre of salaried managers, who approach production more like a science than an art. It is on the basis of this science that the big business groups diversified into an ever-widening range of new industries.
Diversification into shipbuilding and steel will be considered in the next two chapters.

CHAPTER ELEVEN
The World's Largest Shipbuilder
THE COMPETITIVE CHALLENGE
Hyundai Heavy Industries (HHI), a subsidiary of the Hyundai Group, began building its first ship, a very large crude carrier, in March 1973.1 Less then a decade later, HHI had become the world's largest shipbuilder, with cUrflUlative deliveries exceeding 1 0 million deadweight tons (DWT) by 1984. South Korea's share of world orders for new ships vied with Japan's, having reached 17.4% by the mid-1980s-a 15 percentage point increase over ten years (see Table l l . l). Japan had led the way in building mammoth shipyards since World War II. Outfitted with up-ta-date capital equipment, it was able ta undermine the supremacy af European and American shipbuilders. Japanese shipbuilding companies, moreover, were of relatively long standing, predating World War II (Shiba, 1986 ; Vogel, 1985). What was unique abaut H HI, in comparison with its Japanese counterparts, was its rise to power on the basis of a complex, "greenfield" yard without any prior experience in shipbuilding. This chapter will explain the learning that underlay HHI's ascent.
By comparison with the Pohang Iron and Steel Company (POSCO) discussed in the next chapter, HHI's investment in a shipyard at Mipo Bay was relatively small-$900 million versus $3.6 billion for POSCO. Nevertheless, in several technical respects and in almost all economic ones, H Hl's investment was the most difficult of the two to manage. Whereas POSCO was oriented to the domestic market and enjoyed excess home demand for its steel for over a decade after its founding, HHI was premised on exporting but awoke to an acute and protracted worldwide shipbuilding depression. As indicated ill Table 1 1 .2 , between 1 974 and 1976 the annual volume of
I Shipbuilding was first organized as a department within the Hyundai Construction Company. In 1973 the Hyundai Shipbuilding and Heavy Industries Company was founded. In 1978 this company changed its name to Hyundai Heavy Industries. HHI pTOduces both ships and heavy machinery and equipment.
269

270 DYNAMIC COMPARATIVE ADVANTAGE
Table 11 . 1 Percentage of New Ship Orders Placed, ]974- 1984
European Economic
Year Japan South Korea Community Comecon
1974 38.4 2.8 27.0 2.9 1976 56.0 2.5 10.6 10.0 1978 43.2 3.7 14.9 1 1 .5 1980 52.7 9.0 12 . 1 4.2 1982 49.7 9.6 13.5 9.4 1984 55.9 17.4 10.0 2.5 1986 37. 1 · 18.9 8.9 8.2
Source; Lloyd's Register of Shipping (various years). ·
Rest of World
28.9 2 1 .0 26.7 22.0 17.8 14.2 26.9
ship orders placed worldwide fell by over 50% and had not recovered by the mid- 1980s. Hyundai's production volume over the same period grew fitfully rather than steadily (see Table 1 1 .3).
It was thus against a gloomy international ba,ckground of excess capacity and cutthroat price coin petition that HHI learned how to build ships. Demand shortfalls drove HHI to alter its product mix away from very large crude carriers (VLCCs) to smaller higher-value ships, as ·well as to branch out into offshore structures, to diversify into steel structures and industrial plants, and to integrate forward in order to stabilize demand-all the while struggling to rearn the ABCs of shipbuilding proper. Diversification h�lped to offset the losses HHI sustained in shipbuilding. HHl's hedging activities were supported by membership in the Hyundai group, possibly Korea's larg-
Table 1 1.2 Annual Shipbuilding Orders and Completions Worldwide, 1974- 1984 (in ] ,DOD Gross Tons)
Annual Volume Annual Year of Orders Placed Completions
1974 28,370 33.541 1976 12,937 33,922 1978 8,026 18,194 1 980 18,969 13,101 1982 1 1 .232 16,820 1984 16,1)00' 18 ,000'
• Estimates.
Source; Lloyd's Register of Shipping (various years).

The World's Largest Shipbuilder 271
est chaebol. This chapter is therefore concerned with the creation of competitive advantage in a particular context, that of the diversified business group.
Japan was HHl's main competitor. As the world slump in shipbuilding sharpened, japan's share of new orders rose from roughly 40% in 1974 to roughly 56% ten years later, largely at the expense of the United States, Europe, and to a lesser extent Brazil. Then its share fell back to 37% in 1986 (see Table 1 1 . 1 ).2 Although Japanese yards, like Korean yards, were menaced by excess capacity, they were able to retain their share of a smaller global volume amidst greater world competition by dint of their low costs and efficiency. With respect to demand conditions, Japan had a clear edge over Korea. The world leader in shipbuilding had a far larger domestic merchant marine than did Korea, and Japanese shipping companies tended to buy Japanese-made ships. By contrast, Korean shipping companies tended to import their fleets in the form of used vessels with favorable finance terms and fast delivery. In the early 1980s, about 80% of Korea's demand for ships was satisfied by imports (Korea Exchange Bank, 1983). Although the Korean government did operate a public procurement system, the Japanese system was far more comprehensive, enabling Japan to stabilize demand for locally built ships (Chung, 1982). With respect to costs, just as the total costs of POSCO and of the Japanese integrated steel mills ran neck ·and neck in the late 1970s and early 1980s (see the discussion in Chapter 1 2), the total costs of HHI and of japan's "Big Seven" shipbuilders appear to have been fairly evenly matched.
International cost data on shipbuilding in the early 1980s for all Korean shi'pyards, not just HHI, suggest a 2.8% rate of profit in Korean yards (Harvard Business School, 1986b). (See Table 1 1 .4 on the shipbuilding industry's cost breakdown.) The data, however, are too crude to indicate anything definitive about profitability. Rather, they are useful only to the extent that they provide some support for the overall picture: on the one hand, similarity in total costs between Korea and Japan, and on the other, dissimilarity in the relative shares of cost elements-labor and materials and componentsin the total. The share of labor costs in total costs in 1983 was about 2.5 times higher in Japan than in Korea, a difference of the same order of magnitude as in the steel industry. Assuming wage rates in the shipyards and steel mills of Japan and Korea also differed by
2 The decline in Japan's share appears to be due to the appreciation of the yen. In lhe first quarter of 1987, Korea for the first time surpassed Japan in orders for new ships (New York Times. 1987).

272 DYNAMIC COMPARATIVE ADVANTAGE
Table 1 1.3 Principal Shipbuilder's Production, 1 973-1.986 (in Gross Tons)
Company 1973 1974 1975 19.76 1977
Hyundai 126,000 45 1 ,700 5 12,000 573,500 505,568 Korea 2,980 2,980 75,400 52,450 76,322
Shipbuilding & Engineering Corporation
Daewoo Samsung
S(JUrtt: Ministry of Commerce and Induslry.
1978
614,790 1 16,694
roughly the same order of magnitude. labor productivity in Japanese shipyards was about 1 .6 times as great as in Korean yards.s
Labor procluctivity in shipbuilding is largely a function of the degree of equipment automation. the skill level of operators. the quality of ship designs. and throughput time (time taken for raw materials to be converted into final product). From the outset of operations. learning at HHI was driven by the imperative to reduce throughput time in order to meet delivery schedules. Meeting delivery schedules was no easy matter. however. because the process flow involved a large number of discrete operations and varied with the type of ship under construction. A large shipyard is tantamount to a giant job shQP: The number of job descriptions and the number of components and sub-
Table 1 1 .4 Value Chains of the Shipbuilding Industry." 1983
We,stern Europe Japan
Materials and components 70.0% 63.0% Labor 36,0 30.0 General and aqministration 5.0 5.0 Design cost 0.1 0.1 Commission 1 .0 1 .0 Corporate overhead NA NA
Total 1 12. 1 99. 1
NA. nol available.
, Percentages of 1983 ship prkes for medium-sized bulk carriers.
Source: Harvard Business School ( 1986b). '
,Korea
70.0% 1 2.0 3.0 0.2 1 .0
.!.!.:L 97.2
3 It is difficult (0 make interfirm wage comparisons because of differences in senio'rity, and skills. Starting salaries .in POSCO and HHI in 1985, however. were approximately the same for:what ap
,pear to be roughly comparable skills.

The World's Largest Shipbuilder 273
Table 1 1.3 (continued)
1979 1980 1981 1982 1983 1984 1985 1986
383,763 5 18,565 907,040 861 ,206 864,782 1 ,320,904 1 ,423,378 1 ,262,478 103,060 60,448 1 37,655 186,988 129,573 152,781 1 24,484 1 86,535
2 1 ,500 148,329 128,270 57 1 ,800 13,858 52,000 1 26,000 73,400 123,974
929,600 722,101 273,074 378,100
assembly operations are far greater than in a continuous-process in-. dustry like steel. To gain firmer control over its process, to ensure more timely delivery of both inputs and outputs, to reduce costs. and to achieve parity with Japanese shipyards on all fronts. HHI decided to develop basic design capability in-house and to produce its own engines and core electrical equipment.
The guiding sl9gan becaine "our own ships, our own engines, our own designs." Forward vertical integration to offset demand fluctuations, backward vertical integration to produce key inputs, and the acqu�sition of basic design capability to meet delivery schedules, all combined to propel HHI's learning. Like the Hyundai Group itself, the strength of Hyundai Heavy Industries came to rest on its total capabili-ties.
.
The government's role in helping HHI create comparative advan- . tage exemplified government industrial policy in general. The total capabilities on which HHI depended for its competitiveness enabled industrial policy to horse-trade discipline on the one hand and support on the other in the context of the diversified business group. Initially discipline over HHI was largely imposed by the sheer size of operations: HHI had to export to survive and the government licensed other Korean firms to enter shipbuilding as competitors. Support was provided in exchange for risk taking: Shipbuilding may
, have been relatively unprofitable, but the industrial plant unit of HHI was given a temporary monopoly over steel structures, which required massive yard space to construct and were highly profitable. Support was also provided as the need arose. The government, for example, ordered Korea's crude oil deliveries to be carried by the Hyundai group's newly created merchant marine as a way to strengthen stagnating demand for HHI's ships, once HHI had dem::: onstrated its capability in shipbuilding. Support was also forthcoming in anticipation of comparative advantage: Government patronage of shipbuilding has a long history in Korea that intensified at

274 DYNAMIC COMPARATIVE ADVANTAGE
HHI's birth, and which continued into the R&D phase of HHI's activities.
It is to the government's extensive support that attention is first turned before examining the emergence of HHl's total capabilities.
GOVERNMENT ASSISTANCE TO SHIPBUILDING
The history of the Korean shipbuilding industry until the time of HHl's founding is one of slow progress characterized by scattered government attempts to accelerate growth. Evidence of the government's early interest to developing a shipbuilding industry is its establishment of a department of naval architecture at Seoul National University (SNU) in 1946, at Pusan National University in 1950, and at Inhas University in 1954. The number of naval architecture graduates from these universities, however, was only a fraction of those from the University of Tokyo. Table 1 1 .5 provides evidence of this and also of the fact that the number of naval architecture graduates who still continued to work in the shipbuilding industry was tar higher in the case of the University of Tokyo than of SNU-57% in the former. versus 23% in the latter for the period 1950- 1977 (although the number at SNU rose to 36% in 1970-1977).
The reasons why so few Korean graduates in naval architecture continued to work in the field before 1970 are the same reasons why government efforts to develop the shipbuilding industry were sporadic. The absence of a local steel industry made shipbuilding a questionable growth pole · (although in theory cheap steel was avail-
Table 1 1 .S Comparison of Number of Graduates from the Department of Naval Architecture (NA), Seoul National University and University of Tokyo, 1940- 1977
Number of Graduates, Number of Graduates, Seoul National University' University of Tokyob
Graduation Still Working Still Working Period Total in Shipbuilding Total in Shipbuilding
1940-1949 0 0 556 220 1950-1959 180 I I 381 227 1960-1969 153 27 34 1 234 1970-1977 174 63 3 16 221
Total 435 101 1 ,594 902
i1 Privale communication. "Directory of Alumni of the Depanmcn! of Naval Architecture of the University of Tokyo.
Source: Hyundai Heavy Industries.

The World's Largest Shipbuilder 275
able from Japan), and the absence of sufficient domestic technological capability hampered attempts to build any other than s'mall-size vessels. Together, these shortcomings rendered shipbuilding a slowgrowth industry, which caused both the government and naval architects to look elsewhere for more promising ventures, which reinforced slow growth, and so on.
From 1 945 to 1968, the government demonstrated its commitment to shipbuilding (and to the Korean navy) by owning and operating Korea's then largest shipyard, the Korea Shipbuilding and Engineering Corporation (KSEC). KSEC was originally founded by the Mitsubishi group in 1937 as an instrument of the Japanese government's war policy. From the 1950s (when it employed about 500 people) until the time HHI began building ships, KSEC was Korea's largest and technologically most advanced shipbuilder. The government's patronage of KSEC indirectly benefited HHI because HHI recruited a large number of experienced engineers from KSEC. The' government patronized shipbuilding in the 1960s by helping yards to convert from building wooden to building steel vessels. (The share of steel vessels in total tonnage increased from 8.2% in 1962 to 92. 1 % in 1 97 1 V As a way to upgrade shipbuilding quality, the government funded a Korea Shipbuilding Society project to develop a series of standard model ship designs. KSEC, Seoul National University, and Pusan National University collaborated in the project and developed sixty standard designs that were made available to all builders in the c;:ountry.
When HHI arrived on the scene, th� ievel of technological capability that KSEC had accumulated was still rather low. Two years before HBTs founding, KSEC had built a ship three times larger than the largest ship it had ever built before. Although the ship it built was quite small'(a tanker one fourteenth the size of HHI's first tanker) and the duration of KSEC's accumulated experience was quite long (over thirty years), KSEC still had to resort to a foreign license for technical assistance.
The reasons behind HHI's relative success are complicated. The government's supportive role in the establishment of HHI is not al- . together known, but its influence is generally recognized as having been decisive. First, analogous to the government's battle with the Bretton Woods institutions to create a large-scale steel mill, the government waged the fight against the, international aid agencies to create a large-scale shipyard . ..Neither project relied on aid, but both depended on international finance, hence the blessing of the IMF and--U;;-World Bank, both of whiCh influenced private overseas
" These data were provided by the Ministry of Commerce and Industry.

276 DYNAMIC COMPARATIVE ADV�TAGE
lending. Second, the government raised overseas credit for HHI directly and indirectly, the latter by guaranteeing HHI's own foreign loans. Third, the government provided extensive subsidies for infra� structure, much as it had done in the case of POSCO. Fourth, the government provided extensive financial guarantees to help HHI win its first order. Fifth, as will be discussed shortly, the government provided HHI (and other shipbuilders) with continuous support extending beyond start-up, although the visibility of the government's hand diminished (as had been true of POSCO) with the, arrival of foreign technical assistance and with the initiation of production. ,
FOREIGN TECHNICAL ASSISTANCE
While KSEC existed for some thirty years with virtually no foreign technical assistance, HHI was nursed on it. HHI's foreign technical assistance came in four forms: dockyard designs from a Scottish naval architecture firm, A&P Appledore; ship designs and operating instructions from a Scottish shipbuilding firm, Scotlithgow; experi� enced European shipbuilders who worked as employees of HHI for the first three years of operations; and production know-how from the Kawasaki Shipbuilding Company of Japan.
The A&P Appledore technology transfer began in 1972 and involved the dispatch of over seventy engineers from HHI to Scotland for instruction in how to lay out a yard. What was to become HHI, the Department of Shipbuilding in the Hyundai Construction Company, coordinated the technology transfer. Dispatchees to Scotland were mostly new recruits, naval architects recruited ' from the construction and machinery building sectors. A&P Appledore designed the layout of the yard and provided drawings, and the Hyundai Construction Company supervised civil engineering and the actual physical labor involved.
HHI won its first order for two 260,000 DWT VLCCs from a Greek shipowner, George Livanos, on the condition that it build an exact ' repLica of a ship that had been built in Scodithgow's shipyard. Scotlithgow provided HHI with detailed drawings because HHI was required by Livanos to procure the identical equipment from the same sources as had the Scottish firm' and to mimic every detail of design. For example. HHI bought over thirty cranes from the same suppliers in Europe that Scotlithgow had patronized. Angle bars were. bought in England, steel was sourced from Japan, and Scotlithgow reviewed each size and thickness of plate to be used.
Fabrication and welding began when steel plate arrived at HHI in April ' 1973, with only one of seven drydocks completed. At this point, HHI employed five experienced European shipbuilders. for periods

The World's Largest Shipbuilder 277
ranging from two to three years--one for personnel training, one for production planning, one for hull construction and production, one for machineu and electrical installation, and an experienced Danish shipbuilder was even appointed HHI president.
HHI learned general work procedures from the Kawasaki Shipbuilding Company of Japan. In fact, as a consequence of its full order backlog in 1974, Kawasaki subcontracted HHI to build two tankers and provided the company with the ships' proven designs. The Japanese shipbuilders trained HHI engineers and technicians both on-site and in Japan: A total of 200 people were sent to Japan for training. 40 a month, and Japanese foremen were stationed at HHI to help. As a consequence of working on-site with Japanese ship-. builders, HHI learned how to read blueprints, coordinate drawings to the job, and install machinery.
The Kawasaki ships were both to be 232,000 DWT tankers, very similar in design to the VLCC HHI had constructed for Livanos. HHI's first twelve ships, therefore, were also VLCCs, of two or three different types that were among the easiest to build. Next, HHI was fortunate, in a depressed market, to receive orders for a series of twenty-four multipurpose cargo vessels from different sources, all of the same basic design. Once again, the design had originated in a Scottish shipyard, Govan. which was going out of business during the time that HHI was collecting famous designs for different types of ships. When the Hyundai group's representative in London read in a British newspaper that Govan was going bankrupt, he contacted the company and bought its designs at a bargain price. Soon afterward, HHI received an order for four container vessels, and then for nine more containers. The virtue of receiving multiple orders for the same type of standardized ships was twofold: ( 1 ) It enabled HHI to take advantage of scale and to build in series. which promoted significant cost economies (Harvard Business School, 1986b). (2) It greatly facilitated learning-by-doing.
In time. foreign technical assistance and learning-by-doing advanced HHI's shipbuilding know-how. Nevertheless, when the Kawasaki order was complete and the experienced European shipbuilders employed by HHI departed, HHI could not be said to have been in control of its process. This was evidenced by repeated delays in deliveries. Early learning was slower at HHI than at a company like the Pohang Iron and Steel Company because of the differences between steel-making and shipbuilding technology. In steel-making. the process is highly embodied in capital equipment. In shipbuilding, the process is highly embodied in people. Consequently, no matter how great foreign technical assistance, when assistance reached its limit, the nontrivial matter remained of mastering an uncoditled technology in-house.

278 DYNAMIC COMPARATIVE ADVANTAGE
THE ACQUISITION OF DESIGN CAPABILITY
Despite the fact that HHI built its first ship with the tested designs and proven capital equipment of an experienced European shipbuilder, replication was not 100% successful. Scotlithgow only had enough capacity to build half a ship at a time. Consequently, it built. VLCCs 'in two parts, and HHI had to do likewise. But when HHI put the two halves together, they didn't fit. This prompted the establishment of a design office employing 300 people, in order to modify the mistakes that delayed deliveries. Nevertheless, problems in hull construction delayed the launching of HHl's first ship from October 1973 to February 1974. Then problems in machinery installation (outfitting) delayed delivery until October. This was in spite of the fact that everyone was working overtime, the length of the working day running in some instances from 6 a.m. one day to 3 a.m. the following day. Learning-by-doing notwithstanding, Livanos' second ship was also delayed. The contract deadline was passed at the timt; of the project launch, and by the time of completion, the market for ships having collapsed, Livanos refused delivery. Up to the contracted time of delivery, the total exposure of ship buyers is only about 15% of the ship's price. In bad markets, then,fore, it is not unheard of for ship buyers to refuse delivery-either by holding builders to contract in the event of delayed deliveries or by delaying delivery by finding minor defects. Delivery was refused again when HHI was late in delivering two VLCCs to the Japan line, and refused a third time when it was late in delivering two others to Hong Kong Inc.
It was at this juncture that the Hyundai group vertically integrated forward and founded the Hyundai Merchant Marine Company. HMMC had two purposes: first and foremost, to provide shipping services to Hyundai's newly founded general trading company; second, to absorb HHl's undelivered vessels. On August 3 1 , 1976, all of HHI's undelivered vessels were sold to HMMC. HHI's strategy of forward integration had been largely undetwritten by the government. As owner of Korea's oil refinery, the government dictated that all crude oil deliveries to Korea be carried in Korean-owned vessels, namely those of HMMC.
.
There were no additional instances of undelivered vessels after the five just mentioned, but there were still repeated delays. As the market worsened, HHI'.s marketing people traveled the world 'over looking for orders. By chance, they won the two contracts mentioned earlier for a total of twenty-four multipurpose cargo vessels of the same design. However, these ships posed two design problems. First, they were small (23,000 DWT), whereas HHI's yard and

The World's Largest Shipbuilder 279
experience were geared for larger vessels. Second. although the basic design of the two vessels was the same, the two ship buyers involved wanted distinctive modifications. The first problem led to the purchase of basic designs for smaller vessels from Govan. The second problem led to more in-house design activity both to achieve desired modifications and to control costs. Design modification became necessary for cost control because a change in the machinery (including engine) for the purpose of sourcing less expensive parts meant a change in the design encasing that machinery.
Little by little, HHI acquired capability in design modifications, but it still lacked capability in basic design-making lines, estimating volume and weight, calculating DWT displacement and speed of engine. and so on. Consequently, it started out buying basic designs from European consulting firms. HHI managers discovered, though, that consulting firms took no responsibility for reaching rated capa-city, and if rated capacity were not reached, delivery was delayed, each day in arrears incurring a heavy penalty. To avoid such delays, HHI decided to invest in a basic design capability, even though most shipyards do not possess such a set of skills. In 1978 HHI increased the size of its design department from 300 to 500 people, a fairly heavy overhead. By 1983 the number of designers totaled 900, and HHI had dispensed with buying designs from outside except for special-purpose vessels. Three years later, HHI calculated that it would cost $200,000 to buy basic designs outside whereas it cost $300,000 to make them in-house, but in the long run, in-house capability was expected to be cheaper.
HYUNDAI ENGINE AND HEAVY MACHINERY MANUFACTURING COMPANY, LTD.
HHI took the strategic decision to invest in an engine shop at the same time that it invested in a basic design capability. The company had been sourcing its engines from Japan, which built marine engines under license from a handful of longstanding European firms. But, according to D. S. Cho and Porter ( 1986), Japanese engine manufacturers charged higher prices to foreign shipbuilders than to Japanese ones. Consequently, to provide HHI with an alternative to high-priced Japanese engines. the Hyundai Engine and Heavy Machinery Manufacturing Company (HEMCO) was founded in 1978. HHI had decided to take a big risk and invest in an engine shop in order to compete, in the long run, against integrated shipbuilders. In the short run, such an investment was deemed necessary td ensure more reliable delivery of engines and to save costs. At the time, however, depressed demand made it certain that no ship buyer would

280 DYNAMIC. COMPARATIVE ADVANTAGE
purchase a ship with an untried engine. HHI, therefore, decided to make a ship of its own design, with its own engine, for its own sister firm, Hyundai Merchant Marine.
. . .
Building a marine engine is a microcosm of building a ship, and the broad outlines of HEMCO's learning process were similar to those observed at HHI: infusions of foreign technical assistance, the dispatch of large numbers of trainees overseas, sequential import-substitiJtion of parts and components (vertical integration), attempts to develop a local subcontracting network (a marine engine has approximately 20,000 parts), and diversification. Emerging on the scene in 1 978, just in time for the second energy crisis. and supplying a derived demand, HEMCO learned in an environment even more ravaged by depression than that faced by HHI five years earlier. In 1986 HEMCO had capacity to build 120 to 150 sets of diesel engines a year. It had, however, only 50 sets on order, so even though engines had originally been intended to comprise 80% of total capacity, it diversified and used half of its capacity to build other machines. .
HEMCO's development was different from that of HHI, however. Whereas eight years after its founding HHI was easily as price competitive as Japanese shipyards, · eight years after its founding HEMCO's engines were still overpriced relative to those of Japan. This stemmed largely from the fact that HEM CO continued to import key components from Japan: its fuel injection pump, turbo chargers, and electronic control equipment, all of which amounted to about 25% to 30% of the value of an engine. In addition, HEMCO surpassed HHI, from the outset of operations, in paying close attention to production and quality standards. This was an imperative imposed on it by its mode of technology transfer. HEMCO built brand name engines under rigorous supervision from its licensers, B&W of Denmark and MAN, Sulzer, and SEMT Pielstick of West Germany · (the same licensers used by Japanese engine manufacturers). HEMCO followed detailed instructions in drawings and built strictly in accordance with standards. By contrast, HHI's relations with its foreign licensers �were more distant, and it had to tailor its own standards and quality controls. We turn now to a discussion of this process and of its development at HHI.
INTERMARGINAL CHANGES
Quality
According to J. B. Park, the first person to hold the position of manager of HHI's Department of Quality Control (Qq. HHI's priority at the outset of operations was to keep to schedule and to build ships that could float: . ,

The World's Largest Shipbuilder 281
Quality was of secondary importance. I didn't recognize at first what quality was. I thought it was only delivering a ship that satisfied a client, not building a ship that conformed to predetermined specifications. But, I tried to keep an open mind. I failed at first, and quality defects were pointed out by the coast guard, by classification societies, and by QC representatives of the ship owner. So my policy became one of not repeating the same mistake.
In accordance with my policy, I tried to develop feedback between production departments and QC. At first workers didn't work very hard. But soon people became ' very busy. Every
. morning production people would speak on the microphone to, workers about the Saemaul movement,5 urging them to work harder. The general manager of the yard thought that quality was a waste of time, so I worked with section chiefs (assistant managers). I noticed variations in quality across different pro'duction sections, so I called a joint meeting in order to compare performance. Then ' I called two more meetings in which I presented a monthly evaluation of quality differences. At the fourth meeting, I made section chiefs undertake their own monthly evaluations and then' compete against each other.
When I visited Seoul in 1 975, I heard about quality control circles (QCCs) and was surprised .to learn that the kind of activity that I had started at HHI was also going. on outside. Although QCCs operated in Hyundai Motors, located in the same town as HHI, I didn't investigate quality control at this sister firm. Because ships were custom-built while cars were a market product, I believed that quality meant something different in the two cases. I learned about QCCs from the Korean Standards Association. Then I incorporated outside theory into HHI practice.
In 1973 the QC Department began to establish quality standards and procedures. Park consulted the standards and procedures of ship classification societies and of Japanese and European shipyards, but workers and managers at HRI found it difficult to meet strange regulations. One problem was that workers were inexperienced and afraid. When cutting plate, they wanted to leave extra material. Another problem was that experienced foremen who were recruited
. from smaller shipyards had their own standards and procedures. To' achieve uniformity, a small training center was established early in HHI's history and foremen were sent there for one to three months.
5 The Saemaul movement was begun by President Park Chung Hee to build commitment to economic development among the Korean people, It consists of an ideology and community-level investment projects.

282 DYNAMIC COMPARATIVE ADVANTAGE
The training center received feedback from inspection stations, and inspection stations fed information to the line.
In 1978-1979 HHI launched an intensive campaign to improve quality. The QC Department revised all its standards and issued a new worker quality manual. Every production department had to conform to the same standards and was linked to procurement. Statistical quality control (SQC) was introduced in the hull production department for the purpose of learning where and by whom errors were committed. The big campaign included reeducation and retraining. HHI's Training Center was expanded, and qualifications' were set for welders, fitters, pipers, and painters. Certificates of qualification were canceled if poor workmanship was discovered. Technical assistance was extended to 100 of HHl's subcontractors, and incoming inspection standards were raised.
HHI began to tabulate data for a yardwide quality measure: the ratio of total acceptances by foreign inspectors to total work applications (requests for work approval) to foreign inspectors. The higher the ratio, the higher the quality conformance (see Figure I Ll). Quality measures show considerable improvement after 1 978. The slowdown in the rate of improvement in 1982-1983 is attributed to what the QC Department called "quality dumping." Analogous to competition in the steel industry after the second energy crisis, quality dumping referred to competition from Japanese shipyards, which raised quality standards while holding prices constant. By 1983, HHI had succeeded in winning three quality assurance certificates: from L1oyds, Det Norske Veritas. and the American Bureau of Ships. These certificates testified that HHl's quality standards met international specifications.
Time and Motion Studies and Cost Control
The 1978- 1979 campaign to ratchet up quality was part of a larger initiative at HHI to raise productivity and reduce unit costs. The initiative was t�ken in response to heightened competition, both foreign and local. Further deterioration in world demand for ships had sparked foreign competition (sec; Table I L2), and H HI was threatened domestically by the specter of new Korean entrants into the shipbuilding sector. HHI's opportunity to reduce unit costs through better control of flows of information and materials was provided by the internalization of both the basic design function and the manufacture of engines. With its own designs and engines, HHI could tighten its production system.
"
Greater control over costs was approached from two directions: the systematization of material flows and time studies of individual

1001-(%)
90
80
"
/ I\,) �
Inspection Acceptance Ratio
(96,2) (96.1) (95.1) (9�.2) 94.2 94.6 . 94.8 (90� �(94.11 94
� (92.0) 194.6) (92.3) (83.81
1978 1979 1980 1981 1982
97 94.2 (91.1)
1983
(96.8)
Oultlliing---_ Hull---
Total----
(97.2) �96.1 :::-94.3 / P'(9S.0)
(92.8)
1984 1985
Figure 11.1 Inspection Acceptance Ratio (Quality Measure Used by Hyundai Heavy Industries). Outfitting is upper line. Hull is lower line. Source: Hyundai Heavy Industries.

284 DYNAMIC COMPARATIVE ADVANTAGE
jobs along with job sequencing. Both functional areas were subsumed under the Production Engineering Department (PED). which from the outset of operations had modeled work organization along the lines of Japanese rather than of European shipyards. Although both had provided HHI with technical assistance, in European practice skilled workers wielded greater discretion over their job content and methods. Because Korean shipyards, like Japanese before them, were short of experienced skilled workers during their early years of operation. the Japanese pl�actice of centralized definition of job content and methods was followed instead. Centralized job definition happened gradually, and full definition awaited the accumulation of experience . .In 1979 the PED began to define work content and methods and to set work standards on the basis of time and motion studies. Standard work hours were determined vessel by vessel, and each'job was given a set of work instructions that included information on installation procedures (standard or nonstandard). a list of materials required for the unit job, and installation drawings complete with the position of the pieces, the coding, and the specifications. Additionally, the PED worked with foreign consultants and redefined job sequences to maximize preoutfitting efficiency (i.e., the installation of machinery, pipes, and electrical connections into the hull of the ship before the blocks comprising the hull were assem-bled).
. .
The success of the PED's efforts in the functional area of job content and methods is indicated in Table 1 1 .6 and in Figure 1 1 .2. Between 1980 and 1986, the index of labor hours for a typical vessel (compensated gross registered tonnage) declined from 100 to as little as 66 in 1983. Although the rate of decline then tapered off in 1983- 1985, with unusually strict standards of quality being imposed by Japanese . yards, labor requirements per representative vessel by mid- 1986 were almost half of what they had been six years earlier.
Materials savings were also considerable. As table 1 1 .6 suggests, steel input per ton of output and steel pipe per ton of output each
Table 1 1.6 Capital, Labor Hours, and Amount of Bulk Material for 60,000 Deadweight Ton Bulk Carriers. 1979-1986
.
Capital Bulk Material Year Labor Hours (Machinery) Steel Pipes
1979 1 ,000,000 (increase) 12,OOOlton 330lton 1986 550,000 9,l00iton 250/ton
Source: Hyundai Heavy Industries.

I\J OJ Ul
Worker Hours/C.G.R.T. (Launc� Base) '88.4.15
100% . ,oo� � --n----66 65 i1--- �'--... 50 - 55
� . o Year 1980 1981 1982 1983 1984 1985 1988
Figure 1 1.2 Labor Hours per Compensated Gross Registered Tonnage. 1980-1986. SouTce: Hyundai Heavy Industries.

286 DYNAMIC COMPARATIVE ADVANTAGE
decreased by a quarter of their original levels. When HHI first started building ships, it had no cost-accounting system. It had a very primitive numbering system to code materials and very poor interdepartmental information flow. Delays in delivery were blamed on the hull production department, which in turn blamed the steel-cutting department. The steel-cutting department blamed delays on steel deliveries at the same time that steel inventories were overflowing. With the decline in ship prices in 1 978, HHI began work on a "system development system"-a set of rules to budget and control materials. The company relied solely on common sense at first; later it consulted other shipbuilders and computer systems specialists. It also increased its own computer services department to 300 people. Those people vetoed the idea of introducing a fully computerized on-line system for materials control on the grounds that control of materials touches on all production and cost-control systems. The systems spe� cialists believed that because 'the situation at HHI was constantly changing-organization was shifting and work procedures were altering-material control required constantly evolving rules to remain flexible.
ORGANIZATION
Chaebol Membership
HHI's formative years were filled with intense activity aimed at both mastery of the art and science of shipbuilding and a strategy of integrating and diversifying to offset heavy financial losses from the nose dive in world ship demand. HHI was able to advance on both fronts simultaneously through the support it received as a member of one of Korea's largest diversified businesi> groups. Organizational structure, in several respects, abetted HHI's strategy of becoming internationally competitive as a fully integrated shipbuilding company. First, although HHI had no . specialized experience in shipbuilding proper, the Hyundai group had experience in technically related fields4specially construction-and engineers . 'were dispatched to HHI to transfer their know-how. The top-ranking Korean manager of HHI was form'erly a high-level manager of the Hyundai Construction Company (HC), and when HHI ran into problems keeping to schedule, engineers from HC were mobilized. In addition, Hyundai Construction provided HHI with many of its fro�t-line supervisors, managed the construction of the Mipo dockyard, and helped supervise feasibility studies. Hyundai Motors dispatch.ed engineers to help in the struggle to reduce throughput time

The World's Largesl Shipbuilder 287
and also provided technical assistance in assembly line and training techniques. Hyundai Cement sent people to work in production control. All in all, as HHI managers pointed out, "a lot of people joined." The possibility of mobilizing such personnel enabled HHI to act quickly and to avoid the delays of recruiting fresh talent in the market.
Second, group affiliation enabled HHI to recruit the best people outside the Hyundai enclave. The Korea Shipbuilding and Engineering Company claims to have lost one third of its most experienced people when HHI came on stream. HHI could afford to pay higher salaries and to offer better opportunities for promotion than could KSEC or most other shipyards. Turnover was even greater in Korea's seven medium-size shipyards than it was at KSEC. In 1979 only 4% of employees in these yards had been with the same company for longer than four years, and 55% had a tenure of under one year (Korean Shipbuilding' Association, 1980).
Third, HHI's group affiliation made possible the simultaneous accomplishment of intermarginal and inframarginal tasks-of finetuning operations and improving quality while constantly expanding in large chunks through integration and diversification. The inframarginal tasks were undertaken at the group level by people from group subsidiaries with experience in executing new investment projects. The intermarginal tasks of learning to produce, and then learning to produce better, were undertaken at the level of the operating unit by people with industry-specific know-how.
Fourth, group membership allowed HHI to take a long-run approach to profit maximization. The fall in demand for HHI's ships was offset by the rise in demand for the Hyundai groups' automobiles and electronics. The financial backing of a large diversified business group allowed HHI to adopt a long-run approach to learning, in the form of acquiring a capability to design and to undertake R&D. In the case of R&D, HHI's welding research activities began in 1 978 and then were integrated and substantially expanded during the following five years until a Welding Research Institute was opened in November 1 983. According to an international shipbuilding trade journal,
The main purpose of the Institute is to research, develop and manage new welding technologies, monitor quality control, provide information to welders in the shi'pbuilding and offshore sections of the complex and find solutions to welding problems. Welding research activities are oriented toward high productivity levels, which reduce manhours and costs while maintaining quality standards. The Institute's researchers are endeavoring to

288 DYNAMIC COMPARATIVE ADVANTAGE
increase the proportion of automatic welding with special emphasis on the future possibility of using robotic systems. (ShiPping World and Shiplruilder, 1985, p. 56 1)
In October 1984, HHI inaugurated the Maritime Research Institute, "one of the most well-equipped institutes of its kind in the Far East. . . . The research staff of approximately 100 are gaining experience · in naval architectural matters as the yard continues to be involved in virtually every ship design" (Shipping World and Shiplruzlder, 1985, pp. 56 1 , 565).6
Production Organization
Like the' management of Korea's modern industrial enterprises in general, the management of HHI was "lean." As Table 1 1 .7 points ·out, in the fifth year after HHI's founding, the share of engineers and technicians in total employment was only 10.8%, compared with, 19.8% in Japanese shipyards. Administration in HHI accounted for' 7.6% of total employees compared with 14.2% in shipyards in Japan. As in the case of the Pohang Iron and Steel Company, HHl's project management system decentralized control to compensate for a sparseness of experienced staff. Primary responsibility for ship completions was taken by line managers.
An effective project management system was key to HHl's success because the dockyard grew to vast proportions, necessitating inventive conttols over information' flows. Employing 25,000 workers (roughly 14,000 in shipbuilding), HHl's dockyard was 1 ,400,000 me-
Table 1 1.7 Comparison of Distribution of Employment in Shipbuilding, Korea and Japan, 1978
Engineers, Technicians Administrators Direct Labor
(%) (%) (%) Total No.
Hyundai Heavy Industries (Korea) 10.8 7.6 8 1 .6 21 ,586
Total Korea' 1 1 .2 9.4 79.4 34,702 Total Japan 19.8 14.2 66.0 164,006
"Excludes all small shipyards. In 1978. neither Daewoo's nor Samsung's shipbuilding facilities had rome on-str.eam.
Source: Korea Shipbuilding Association (1980).
6 The progenitor of HHl's M,aritime Research Institute was established earlier. in the mid-1970s. with an initial staff of only 10 engineers. -
The World's Largest Shipbuilder 289
ters in area and comprised seven drydocks, four graving docks for ship repair, three quays, four goliath cranes, and facilities to build not merely merchant ships but also naval vessels, industrial machinery and equipment, industrial plants, onshore and offshore steel structures, and steel towers. Shipbuilding itself required complex coordination because of the large number of materials and tasks that had to be timed and sequenced. Complicating such coordination was the fact that HHI built ships in series.
Given its membership in a business group that originated as a construction firm, HHI adopted a project management system typical of construction sites, whereby construction managers move from project to project, taking full responsibility for overseeing the project on which they are working at the moment.? This new project management system took effect at HHI during a period when many of the problems this system is designed to address began to surface. Although late deliveries had ceased to be a problem by 1983, the economic downturn elevated the importance of good client relations. Good client relations were "by far the most important objective" HHI wanted to achieve, and its managers believed that its new management system would help them achieve it by improving the flow of information from builder to buyer. In addition, as HHI developed basic design capability and began to build more sophisticated and specialized vessels, the buyers to whom it catered became more discriminating, and quality control became more demanding. The merit of the new system was that it allowed quality standards to be tailored to the requirements of specific ships.
Apart from liaisoning with owners and customizing quality standards, the project manager was responsible for troubleshooting, for expediting and reviewing the production planning department's master schedule, for reviewing problem production procedures and getting assistance from the most qualified designers/engineers, for proposing minor budget revisions, and for following up a project with documentation.
7 K. S. Choi, vice president, Shipbuilding Division, was responsible for devising HHl's new project management system (PMS). According to Choi, it is difficult to specify precisely the degree to which Japanese practice influenced HHI, with respect to either HHI's old system or its new one. In some Japanese shipyards, a project coordinator may be responsible for all seven phases of shipbuilding. But unlike the practice in most Japanese yards, whose project coordinators are highly experienced, HHI's project coordinators have the backing of their own technical group, whose size varies depending on the complexity of the ship being built. Once HHI decided on its new PMS, Choi was influenced by a manual on project control prepared in 1·983 by a Norwegian, Sven R. Hed.

290 DYNAMIC COMPARATIVE ADVANTAGE
SUMMARY: SURVIVAL OF THE FITfEST
In the discussion just completed, HHI's success and survival in the shipbuilding industry was attributed to its diversified structure. Therefore, if something like the law of survival of the fittest operates, other successful shipbuilders in Korea ought to have a strategy and structure similar to (or, in the same terms, better than) HHI's. In fact, they do: Two other major shipbuilders are members of Korea's two largest chaebol, the Samsung and Daewoo groups. However, the fourth and oldest shipbuilder, the Korea Shipbuilding and Engineering Company, deserves further mention because although it is a chaebol member, it declared bankruptcy in the spring of 1987.8 •.
Three points about KSEC's behavior are p�rtinent. First, the government sold KSEC in 1 968 to a shipping magnate who owned one of the largest commercial shipping fleets in Korea. Thus, from the start of its expansion under private ownership, KSEC, like HHI, . protected itself from demand vagaries by being vertically integrated .
forward. Second, KSEC had an extensive backward vertically integrated network, supplying it with certain key components and parts. Third, KSEC diversified: It not only built ships but also repaired them and built machinery and rolling stock as well. In 1983 the ratio of nonshipbuilding exports to total exports was 33% for HHI, 26% for Daewoo's shipbuilding affiliate, and over 45% for KSEC (Han- . 'guk Kyongje Sinmun. June 1984). By 1984 KSEC had become Korea's thirty-eighth largest diversified business group, with thirteen subsidiaries (including one of Korea's seven medium-size shipyards) (S. K. Kim, 1987).
Nevertheless, one may infer from KSEC's financial failure that the group of which it was a part was not large enough or diversified enough into unrelated products, or aggressive enough in marketing ships. It represents a case in the annals of the creation of competitive advantage in which long industry-specific experience and know-how did not compensate for the staying power that derives from membership in a fina,ncially and managerially cohesive huge group. .
Such membership, however, may be an insufficient condition for survival. In 1989 Daewoo Shipbuilding was suffering from depressed demand and labor strife, with no relief in sight from the Daewoo group, whose automobile, consumer electronics, al}d computer divisions were also ailing. Whether politics or economics will guide the government's response to Daewoo remains to be seen,
$ The government will not allow KSEC to go bankrupt, but may revive it under new management (Han'gv.k Kyiingje Sinmun, Apr. 1987).

CHAPTER TWELVE
The Triumph of Steel
AN UNPROPITIOUS START
The technical skills and economic resources necessary to produce sted efficiently were .absent in Korea when the government decided to promote an integrated iron- and steel-making facility. With the experience of India and Turkey in mind, a World Bank study team in the 1960s "expressed the view that an integrated steel mill in Korea was a premature prpposition without economic feasibility" (Pohang Iron and Steel Co. Ltd. , 1 984, p. 23). A study of the trade regime in eflect in Korea in 1968 concluded that most of the steel being made was "prominent among the inefficiently produced import-competing products . . . " (Westphal and Kim, 1982). Thus, Korea faced several challenges in entering the steel business (in addition to those associated with World Bank hostility) : Integrated iron� and steel-making is highly capital intensive, but Korea lacked capital. Costs are sensitive to scale, but Korea's domestic market was small and the largest nearby market, Japan, lodged the world's most efficient steel producer. Korea lacked iron ore resources and was located far from the main sources of supply. Finally, Korea lacked steel-making skills. As is typical of many matu�ndustries, the steelmaking process is embodied in the equipment The process technology is well diffused (except for very high qual ty specialty steels) and can easily be imported at arm's length from machinery suppliers and from technical consultants. Nonetheless, the nature of the process necessitates complex engineering. For example, of a sample of nineteen industries in the United States in 1970, iron and steel ranked tenth in engineering intensity (measured by number of engineers in total employment) (Zymelman, 1980).
In spite of all these obstacles, the Pohang Iron and Steel Company, Ltd., familiarly referred to as POSCO, became one of the lowestcost steel-makers' in the world. An ironic indicator of the speed of it� progress was a joint venture it entered into with United States Steel (USX) in 1 986 for the purpose of modernizing USX's Pittsburg, California, plant. At that time POSCO was supplying half of the capital
291

292 DYNAMIC COMPARATIVE ADVANTAGE
requirements, or $180 million, for the modernization-providing the PittCal cold-rolled sheet facility with hot-bend coil, undertaking basic design of the facility's modernization jointly with USX, and training American managers and workers in operations and maintenance. Thus, less than twenty years after its founding, POSCO was exporting technology.
The dynamics of comparative advantage suggested by Korean steelmaking, therefore, are those of overcoming obstacles to create ad� vantage, of rejecting the current endowment of resources as arbiter of how income is to be earned in the future. Creating competitiveness in late industrialization amounts to taking the risk of deciding what skills, on the part of individuals, 'and what technological capabilities, on the part of firms, are both possible and profitable to learn. Then competitiveness depends on investing heavily in learning.
The risk of pressing ahead with an integrated iron and steel millat $3.6 billion, Korea's largest single investment to date-was assumed entirely by the state. POSCO has been a state-owned enterprise, although privatization is probably on the agenda. Not only the first integrated iron and steel complex in Korea, but also the second, is under POSCO's management, challenging the now fashionable view that state enterprise is invariably inefficient. pasco represents a microcosm of Korean public policy in two respects: It is both supporter ' and disciplinarian of the private companies that patronize it. It is a supporter insofar as it provides high-quaiity steel at low prices. It is a disciplinarian insofar as it serves as a standard of an excellently managed enterprise. That pasco itself is excellently managed may reflect the industrial environment in which it operates: most of the bigger businesses in Korea are also well managed, at least in the production and operations management sense. There may be a general tendency for public enterprises to mirror the management standards of the private sector at large.
Generally, creating competitive advantage through learning rather than innovation is less risky because the learner has both a model and a teacher lO, guide it. In pasco's case, its model and its teacher was the Nippon Steel Company of Japan (which also commenced life as a state-owned enterprise) , Yet creating advantage through learning is tenuous in one respect: The learner faces more competition than the innovator. The innovator protects its competitive position with a new product or low-cost process. The learner has nothing to protect it but lower wages, and these become increasingly insignificant as a competitive weapon the more skill and capital intensive the sector. The creation of competitiveness in steel was a watershed in Korean industrial history because it represented a major . sector in which competitiveness depended on higher productivity (not lower wages) in a struggle against experienced producers from more (not

The Triumph of Steel 293
less) advanced countries. In .POSCO's case, its model and teacher was also its major competitor, the formidable Japanese steel-producing giants.
The fight to raise productivity in the Korean steel industry is the subject of this chapter.
POSCO'S FOUNDING
The government created the Pohang Iron and Steel Company, Ltd., in 1968; five years later POSCO began production in the southwest city of Pohang with an annual capacity of 1 .03 million metric tons. After several expansions (in a total of four phases, with the last phase divided into two stages), the mill reached an annual capacity of 9. 1 million metric tons of crude steel in 1 983 (see Table 12 . 1 ). Because steel is liberally consumed by industries such as shipbuilding, automobiles, and construction, the founding of POSCO signaled Korea's turn to heavy industry.
The history of the Korean steel industry dates back to 1941 when Japan established two steel mills in southern Korea as a way to support its war efforts in China and Manchuria. These mills were severely damaged during the Korean War (1950-1953), so that until the late 1 960s the industry comprised roughly 109 facilities-predominantly rolling mills, several steel-making minimills, and a few iron�mdking installations. Most of these firms suffered from obsolete plants and equipment. According to a 1967 study prepared for the prime minister by the Office of Planning and Coordination, of a total of thirty-seven steel-making furnaces (mostly electric), thirtyone were outmoded (dating to the 1940s), six were modern (dating to the 1 950s), and none was contemporary (dating to the 1960s) (Korea Advanced Institute of Science, 1976). Furthermore, even though there were three small blast furnaces in existence (60 cubic meters in size compared with 1 ,660 cubic meters in POSCO's first phase), due to accidents and mismanagement none was operating. Quality was poor, and there was a market imbalance between the steel shapes that were being supplied and those that were being demanded.
Therefore, when the government set about founding an integrated iron . and steel works, it chose not 0 build on any existing structure (although many experienced stee workers were later recruited by POSCO). Instead, the governmen founded POSCO as a wholly new entity. The government's failure 0 assign steel-making to one of the emerging chaebol remains a my ery. Some say it was because no chaebol was willing at the time to u ertake the risk involved (although later the top business groups 10 . ied hard for the rights to POSCO's second integrated facility at Kwangyang in 1986).

Table 12.1 Capacity Additions and Plant Specifications of POSCO. 1970-1988
I\l <0 Phases at Pohang Phases at Kwangyang "'" Items n III IV-I IV-2 I . 11
Periods or construction Apr. 197.0- Dec. 1973- Aug. 1976- Feb. 1 979- Sep. 198 1 - Mar. 1985- Nov. 1986-Jul. 1973 May 1976 Dec. 1978 Feb. 1981 May 1983 Jun. 1987 Dec. 1988
Capacity (1,.000 ton/year) 1,.030 2,6.0.0 5,5.00 8,5.0.0 9,1.0.0 2,7.0.0 5,4.0.0
S Sinter piant Spec. DL type 13.om DL type 2.o4m DL type 400m DL type 4.oOm DL type 4.o0m DL type 4.o.om
P Cap. 1 ,322,.0.0.0 TtY 2,197,000 TrY 4,292,.0.0.0 TrY 4,292,.00.0 TrY 4,426,.000 TtY 4,426,.0.0.0 TrY
E Coke oven Spec. 68 Ovens 1.06 ovens 146 ovenS 15.0 ovens 75 OVens 132 ovens 132 ovens C Cap. 584,.0.0.0 TtY 912..000 TrY 1,552,.0.0.0 TN 1,552,.0.0.0 TrY 733,.0.0.0 TrY 1,43.0,.000 TrY 1,43.0,.0.00 TN I Blast rurnace Spec. 1 .66.om 2.55.om 3.795m 3,795m II Relining) 3,800m 3.8.o0m F Cap. 1.0 1 1 • .0.00 TtY 1.697.000 TtY 2.752,.00.0 TtY 2.752,.0.0.0 TrY 2,84.0 • .0.0.0 TrY 2,84.0,.0.0.0 TrY I Steel·making Spec. 100 tonslheat 1.0.0 tOllsiheat 3.0.0 tOllsiheat 3.0.0 tonsiheat 25.0 tonsiheat 25.0 tonslheat C x 2 x l x 2 x l x 2 x I A Cap. 1 • .032.000 TtY (2,00.0,0.0.0 TtY') 3.3.00,000 TtY (6,5.0.0.00.0 TtY) 2,784,.0.0.0 TN (5,568,.0.0.0 TtY) . T 1 Continuous casting Spec. 4 strand x 2 strand x 2 2 strand " 2 2. strand " 1 0 1 machine machine machine machine N Cap. 1 ,.026,00.0 TrY (3,844,.0.00 TN) 2,7.0.0,.0.0.0 TN (5,400,.0.00 TN)
Hot-strip mill Spec. RF 150 tonJhour RF 150 tonlhour RF 15.0 tonlhour RF 25.0 tonlhour RF 300 ton/hour RF 300 ton/hour 0 x l x l x l x 3 x 2 x l F . Cap. 606,5.00 TN (775,500 TN) ( 1 ,410,.000 TN) 3,3 1 1 ,.0.0.0 TrY 2,66.0,.000 TN (4,433,00.0 TN)
'Co�d-strip mill Spec. TCM, CGL TCM, CAL P Cap. 7 1 1,00 TN 1,000,0.0.0 TrY L Plate mill Spec. RF 1.0.0 ton/hour RF 235 ton/hour A x I x l N Cap. 336,.000 TN 1,243,.0.0.0 TN T Wire ro,f mill Spec. 2 strand I strand S Cap. 446,.000 TN 35.0,.0.0.0 TrY
Spec., Specification; Cap., capacity . • ( ) = capacity after expansion. S"""'t: POSCO.

The Triumph of Steel 295
Others say it was because the government did not want to give a monopoly to any one chaebol over an input that impinged on both the country's security and the competitiveness of major downstream industries. Nor did the government recruit the leadership of POSCO from the major import-substitution projects in chemicals that were begun in the 19605, projects that took the form of joint ventures between the government and foreign partners. Instead, the government appointed as POSCO's president a competent retired army general and friend of President Park Chung Hee, Tae Joon Park, a man with a track record of having turned around the governmentowned Korea Tungsten Corporation. 1
The government first tried to finance entry into steel-making in 196 1 , then again in 1 962 (wid} a group of German steel-makers), and still again in 1967 (with an international consortium that included the World Bank). All efforts collapsed in disagreement over scale-the Korean government driving for a multiple of the capacity that its foreign collaborators were willing to entertain. All efforts had the virtue, however, of providing the . Korean participants with an understanding of the economics and geopolitics of steel-making (Korea Advanced Institute of Science, 1976). Finally, finance was forthcoming in the form of reparations from the Japanese government for "36 years of hardship under Japanese rule" (Pohang Iron and Steel Co. Ltd., 1984, p. 1 8). The engineering consultant to POSCO was designated the "Japan Group" and consisted mainly of Nippon Steel and, to a minor extent, Nippon Kokkan Steel.
Two points about the technical assistance that the Japan Group provided are noteworthy. First, according to POSCO, the Japan Group, in the name of friendship and economic development, was very enthusiastic about providing assistance at the time. Second, while steel mills in other developing countries had suffered from secondrate technology at the hands of the only source of finance available to them,2 POSCO was fortunate to raise capital in a country that boasted ' the most efficient steel-making process. Concerning scale, POSCO's President Park "persuaded the Japanese that a larger fourstage plant was necessary with a capacity of 9.1 million tonnes-not
I Much has been made of POSCO's militarylike qualities-its strong leadership, the discipline and regimentation of its workers, and so on. Nonetheless, although Korea's military may be assumed to keep a sharp. eye on the country's only integrated ironand steel-making capacity, POSCO has no stronger leadership or greater worker regimentation than some of the chaebol. Moreover, the internal organization of POSCO is not drawn along administrative lines that are generally associated with the military (see Mintzburg, 1979). JUther, POSCO's organization is said to reflect that of its mentor, the Nippon Steel Company of Japan.
2 See, for example, La1l ( 1987) on Indian steel.

296 DYNAMIC COMPARATIVE ADVANTAGE
the 2.6 million tonne figure that was the basis of the first plan received from Nippon Steel's technical cooperation department" (PaineWebber, 1985, p. 2-1) .
Construction of Pohang began on April 1 , 1970, and the plant was dedicated on July 3, 1973, two months before the first worldwide energy crisis.
PROFITABILITY AND SUBSIDIZATION
According to a report by PaineWebber directed to the American fi- · nancial community, POSCO was a profitable venture from the beginning of its operations:
Quite remarkable is the fact that POSCO has been profitable every year since it began production in 1973. In fact. in recent years, the company has had to resort to the use of accelerated depreciation and other accounting conventions to hold down reported profits. . . . This profit record is all the more remarkable when considering,
-Major start-up and training costs have been incurred over this period.
-POSCO has provided steel at bargain price levels to both its domestic and foreign customers ( 1985. pp. 1-2).
Three factors appear to have underscored POSCO's apparent profitability:
l . Korea's labor costs per ton shipped were lower than those of any major competitor. In 1973, labor costs per ton shipped of hotrolled product were $7.06 at POSCO, $23.83 in Japan, $27.06 in the United Kingdom, $32.86 in Germany, and $37.83 in the United States (PaineWebber, 1985). Obviously POSCO's advantage largely reflected its far lower wage rates. Furthermore, over time, increases in POSCO's labor productivity (which will be discussed shortly) offset increases in its wage rates, enabling the fledgling firm to keep'labor costs per ton shipped more or less constant.
2. POSCO incurred relatively low construction costs. For a capitalintensive investment like steel, construction delay is extremely expensive. POSCO managed to complete construction of the first phase of its mill to a mere twenty�seven months with major construction work subcontracted to Korea's leading constructio,n firms. Of a total of twenty-seven facilities, twenty-three were completed ahead of schedule (Korea Advanced Institute of Science, 1976). In fact, delays in the construction of a hot-strip mill led to a crash project in which, with round-the-clock construction, workers

The Triumph of Steel 297
completed five months of work in two months, laying down 700 cubic meters of concrete daily (Pohang Iron and Steel Co. Ltd ., 1984). When construction on the first phase of the Pohang mill was completed in June 1 973, work on the second phase began almost at once, in December. A comparison study by the Korea Steel Association indicated that construction costs per metric ton of integrated mills after the oil crisis were the following: $ 1 ,750 for Brazil, $820 for the United States, $700 for the European Economic Community, $590 for Japan, and roughly $400 for POSCO.3
3. POSCO's profitability was shored up by government subsidization of costs of capital and investments in infrastructure-roads, har� .
..
.
bors, and electricity generation. According to the Korea Advanced Institute of Science (KAIS), the Korean government supported the establishment of POSCO through various measures, as enacted in the Iron and Steel Industry Promotion Law of January 1 , 1970. It provided POSCO with access to long-term lowinterest foreign capital for the purchase of equipment and for the erection of a port building, water supply facilities, an electricitygeneration station, roads, and a railroad line. Korea's electricity charges are among the highest in the world, but POSCO is selfsufficient in 80% of its electricity requirements. The government also provided POSCO with discounted user rates for many government services, such as a discounted railroad rate of 40%, port rate of 50%, water-supply rate of 30%, and gas rate of 20%. KAIS has estimated that the government spent a minimum of 13.3 billion won ($42 million at the nominal 1970 exchange rate) just for the "massive supporting facilities" of POSCO (Korea Advanced Institute of Science, 1976, p. 87).
Under conditions of heavy subsidization to a degree that is often underestimated by outside analysts, corporate profitability figures have little meaning. What becomes clear, however, is that even after adding in subsidies to poseo's costs, poseo was operating with a cost structure that was neither less nor more favorable than
' that of japan, the world's
premier producer. To remain competitive, POSCO had to compete on the basis of higher productivity and match Japan's incremental productivity improvements.
3 Specifically, $400 per ton for phases I and II, $160 per ton for phase III, and $427 per ton for phase IV. The Mitsubishi Research Institute ( 198 1) provided similar estimates in a study based on data in Fukunishi et a!. (1980). Construction costs were not defined in either of these studies, but presumably included interest charges as well as direct costs (labor and materials).

298 DYNAMIC COMPARATIVE ADVANTAGE
THE COMPETITION
International cost comparisons of efficient integrated steel mills for both hot- and cold-rolled steel (POSCO's major products · are hot rolled) show pasco's total costs running neck and neck with those of Japan and of West Germany (see Figure 12 . 1 and Table 1 2.2). Figure 12 . 1 indicates that throughout the period 1973-1984, the margin of cost differences between pasco, West Germany, and Japan was negligible. Table 1 2.2 gives a detailed breakdown of costs as well as input prices for cold-rolled coil in the integrated steel mills of five countries in 1984. In this case, Korea's costs are slightly above those of Japan (due, in part, to the short-run movement of exchange rates).
.
The explanations for cost differences between Japan and Korea in cold-rolled coil may be grouped into two sets: those related to finance (depreciation. interest, and taxes) and those related to prices.
Table 12.2 Cost of Producing Cold-Rolled Coil in an Efficient Integrated Steel Firm. Five Countries, 1 985
United West South Item . States Germany Japan Korea Brazil
DollaTs per too of finished product Operating costs 403.00 324.00 286.00 270.00 274.00
Labor 129.00 70.00 63.00 25.00 26.00 Iron ore 67.00 47.00 44.0Q 48.00 24.00 Scrap 1 8.00 1 1 .00 Coal or coke 50.00 48.00 52.00 55.00 68.00 Other energy 24.00 22.00 15.00 24.00 27.00 MisceJla
'neolls 1 15.00 1 26.00 1 l2.00 ! la.oo 129.00
Depreciation 24.00 24.00 29.00 77.00 27.00 _
Interest 12.00 1 5.00 27.00 14.00 80.00 Taxes 7.00 l.00 5.00 1 .00 3.00
Total costs 446.00 364.00 347.00 362.00 384.00 Addendum Input prices
Labor (dollars per man-hour) 22.50 1 1 .90 1 1 .70 2.85 2.90
Iron ore (dollars per ton) 40.00 26.00 24.25 25.00 1 2.50
Coal (dollars per ton) 55.00 58.00 59.50 59.00 60.00 Exchange rate (national
unit per dollar) 2.90 240 800 8,500
Note: Costs are based on 90% utilization/capacity.
Sot/Tee: Barnell and C,'andall (1986).

Percent
II,) 18
1 00 , i i , 100
50
•
Great Britain ; �i
I 1 . ,
•. ,'1- . 1 I so
.... � -J_ .. ,.. .. $(" ."., . 'f'rC'l+7""' "�'\ r · - '\,.. .. t!1, Fee 'l' .- . =Ij� Jo r ' J_� .. _�' .... ,, _ _ , . .. � __ .. . - . a u . . . . . . ... e O:;:." � .,7 ...
- 50 I, ! '.'!�!,'I I , ,!J!.'.!'." , I • i,_,!.1 1 If " 1, , 'l!..'..!!' ( ' I! " !!� " tI" '�!l I I I ' �!l!l! " (" �'!.�!''' '!I'.!!�l! ' rI "�'!\!!' , . 1 , '�'1�!'1I" !'!�lf."'h'�'"I -50
Figure 12.1 Comparison o f Cost per Ton Shipped o f Hot-Rolled Steel (percent difference from Pohang Iron and Steel Co. Ltd .• Korea). 1973-1 985. Source: PaineWebber.

300 DYNAMIC COMPARATIVE ADVANTAGE
Table 12.3 Efficiency Measures of Steel-Making, 1985"
United West Efficiency Measures States Germany Japan Korea Brazil
Man hours peT ton 5.75 5.85 5.35 8.20 9.00 Yield to finished
product (percent)b 78 80 89 82 80 I ron ore per ton
of finished product 1 .67 1 .81 1 .81 1 .92 1 .92
' Derived from data in Table 12.2.
'Yield defined as output per unit of input. Saurce: Barnett and Crandall ( 1986).
yields, and productivity.4 Turning to the second set of explanations, the degree to which japan's competitiveness depends on productivity and on yields, rather than on factor prices, may be inferred from the data presented in Table 12.2. As this table suggests, the prices of two inputs, iron and coal, are roughly the same per ton in Japan and Korea; Yet the costs of iron Ore and coal per ton of steel are lower in Japan, suggesting higher yields. Similarly, labor productivity is higher in Japan: Wages are about four times greater in Japan than in Korea, but labor costs per ton of steel are only 2.5 times greater. Table 12.3 presents efficiency measures corresponding to the data in Table 12.2. As suggested by asymmetrical differences in wage rates and wage costs, labor hours per ton of steel are lower in Japan. The most common measure of overall yield, final product per unit of crude steel, is also higher.
'
The monetary magnitudes associated with var�ations in yields in the steel industry can be illustrated with a simple example, using data from Table 1 2.2 and focusing on the overall yield of final product per unit of crude steel. Assume that the value of a lost unit of final product represents a lost sale.5 Assume that the value of a lost sale is equal (cons.ervatively) to the unit costs of the least efficient producer. The least efficient producer in Table 1 2.2 is the United States, with unit costs of $442. In the case of a company like P�SC�, therefore, with an annual capacity of 9. 1 million tons, a 1 % increase
4 In terms of yields. or what may be called process or organizational productivity, output (01' by-product) per unit of input depends on the performance of all factors combined. For example. yield with respect to finished product per unit of crude steel depends on the quality of raw materials embodied in the crude steel that is about to be converted. as well as on the performance of the labor and capital involved in the process steps whereby crude steel is actually converted into final product. To express productivity. in terms
'of output per unit of input at this processing stage, input must
be defined to include all factors. Such a productivity measure we refer to as a yield. 5 This further assumes that a unit of steel produced is equal to a unit of steel shipped.

The Trtumph of Steel 301
in yield raises output by 91 ,000 tons. At a "price" of $442 per ton, a 1 % improvement in yield offsets a loss in revenue by $40.1 millionnot an inconsequential saving.
Ignoring finance-related costs, the fact that Japan has defended its market share in the steel industry on the basis of superior productivity and yields has forced POSCO to invest in human and material capital to keep pace with japan's technological progress. As will be discussed shortly, yields depend on labor skills, on process engineering, and on both the age of capital equipment and the vintage of technology embodied in it. Accordingly, POSCO has religiously reinvested its profits to upgrade its capital stock-prompting the acquisition of investment capability-and it has emphasized labor training and process improvements. In so doing i t has embarked on a learning trajectory different from thQse of the labor-intensive industries (e.g., textiles) that preceded it.
POSCO has competed in both the international and domestic markets against steel from the integrated mills of the advanced countries as well as from Brazil and Taiwan. In the case of steel sold to local consumers who will market their final product domestically, imports are subject to'a 25% duty. However, Korean steel consumers receive duty drawbacks if they reexport the imported steel in a more processed form (such consumers include numerous minimills, which account for roughly 35% of Korea's steel output and a sizeable share of POSCO's shipments). In the case of its minimill market, POSCO faces direct competition from abroad because it enjoys no tariff protection. A 1 983 study of hot-rolled steel and its end users indicated that 26.5% of hot-rolh!d product was exported, 39.5% was sold to local consumers that were eligible for duty drawbacks, and only 34% was sold to consumers that would have had to pay a "25% duty had they imported steel (PaineWebber, 1985).
Despite excess home demand for steel throughout most of its history·, POSCO has exported in order to accomplish the following: Ensure long runs and full-capacity utilization for all types of steel, earn hard currency to repay its foreign debt, take advantage of the government's export subsidies, and drive a stake in the intenlational market in anticipation of future capacity expansions. POSCO has set itself an export target of 30%. In 1974 and 1975, however, when production was first getting under way, and then again in 1982, its ratio of exports to total shipments exceeded 40%; its major export markets are Japan and the United States.6
6 1n 1984 the Korean government and the U.S. Trade Represen�tive reached an agreement that limits Korean steel exports to 1 .9% of the U.S. market. The agreement imposes no product mix restrictions with the exception of slabs, which are limited to 50,000 net tons per year. POSCO's ratio of exports to total shipments averaged 28% between 1973 and 1984.

302 DYNAMIC COMPARATIVE ADVANTAGE
FOREIGN TECHNICAL ASSISTANCE AND THE NATURE OF STEEL·MAKING TECHNOLOGY
For the initial installation of Pohang, POSCO imported technology related not only to investment capability (preinvestment feasibility studies. manpower training. project execution). but also to production capability (process engineering, production control) . The Japan Group provided both preliminary and master engineering reports. although POSCO had enough experience from earlier failures in project proposals to write the project plan. Lacking deeper capabilities in the area of engineering investment analysis. POSCO signed a contract with the Broken Hills Proprietary Corporation (BHP) of Australia to review and evaluate the engineering reports prepared by the Japan Group and also to advise it on signing procurement contracts for individual plants (almost all with Japanese plant exporters). Then POSCO hedged by engaging the services of a Korean steel specialist living in Japan to review the work of both BHP and the Japan Group (Korea Advanced Institute of Science. 1976).
POSCO ordered sixteen plants with facilities t9 cover the full spectrum of integrated steel mill activity. A railway system within the plant was even included. All contracts but one were given to Japanese companies (the exception was a hot-rolling plate mill awarded to Voest-Alpine, an Austrian firm.) Plant exporters supplied credit and were · responsible for basic design and start-up in accordance with the Japan Group's master engineering plan. Plant exporters were also responsible for civil engineering and building construction designs. The Japan Group. however, instructed POSCO in process engineering for each plant and in overall inventory management, production scheduling, and maintenance. It also supervised . all construction, POSCO being responsible only. for the actual physical labor involved. In short. the initial installation was accomplished almost entirely on a turnkey basis.
The distinguishing characteristic of this turnkey transfer was the degree to which: POSCO actively participated in it. POSCO engineers worked closely with their counterparts in the Japan Grouplearning what was being taught to them. assimilating- what was not being taught to them directly. The single most distinct feature of this participation was the dispatch of a large number of engineers and front-line supervisors for overseas training. Even before operations had commenced, 597 POSCO personnel had received training on or off the job in Japan and Austria in a total of eleven fields. among them iron-making and steel-making. This afforded a tremendous accumulation of experience and know-how and set a precedent for overseas training that continues today (see Table 8.9) . . Simulta-

OUlpul per InpUI
2.0
1.8
1 .. 6
1 .4 1 .2
1.0
0.8 0.6
The Triumph of Steel
Learning Curve� for Blast Furnaces
1.99 2 O· 1.89 ���..-- - - .. - . � 1 .84 . . _ •• -.. (550 TID) " <"\\_ 1.78 .' 1.66 �'11" 1 73 / . \�", . 1 6 · 1.58 ·0 .4 /
• - 1.59 _J.:- - - -;:-58
1 27 1.54 _<-- 1.54 /' • _ - -- 1.45 /': .� .......... 1.33 \. ...
p' .....-- - - -- I BF
1 .03 ,,/1.05 ... ... ... 0.79 ,..-
0.57
2 3
Monl�s in operalion
-- - FBF - · - 2BF - ' - - 3BF
303
Figure 12.2 Learning Curves for Blast Furnaces. I BF, 2BF. and 3BF refer to first, second. and third blast furnaces, respectively. I"BF refers to foundry cast furnace. Output is in metric tons per day. Source: POSCo.
neously, the training of personnel on site at Pohang was taken with great seriousness. Before operations commenced, steel workers rehearsed their jobs in an open field, shouting orders to one another.
By a1l accounts, the first technology transfer was successful, a tribute to both the students and teachers involved. When operations finally started-the first molten iron poured forth on June 9; 1973-they did so smoothly, and within a short amount of time showed considerable improvement. The operating rate (production divided by rated capacity) for the la�t half of 1 973 w�s 44.5%, or roughly 90% if prorated over the entire year. In 1974 it reached 1 14%, indicating that rated capacity had been exceeded. The operating rate of the first basic oxygen furnace (BOF) was 44% in 1973 and 1 12% in 1 974. The first blast furnace produced 0.67 ton/day/cubic meter within one month of operation; within six months its output had more than doubled to 1 .5& T/D/m3. (see. Figure 12 .2).
Capital De�pening
Technology transfer, however, and its accompanying in-house investments in learning was not a one-shot transaction. Whereas cac pacity expansion in the textiles industry tended to involve capital widening-that is, small, divisible additions embodying the same

304 DYNAMIC COMPARATIVE AnV ANTAGE
technology and capital/labor ratio---<apadty expansion in the steel industry tended to involve capital deepening, or large. indivisible additions embodying new technology and a higher capital/labor ratio (Hawtrey. 1937). Under conditions of capital deepening. POSCO was continuously confronted with process changes. Simultaneously, it broadened its product line. inducing further changes in process. Unlike the textiles industry, creating value in the steel industry involved dynamic learning.
Phase I presented a challenge even after start-up because of the large number of stages in the process flow. POSCO had to learn how to operate a sintering plant. a coke oven. a blast furnace. a basic oxygen furnace. an ingot-casting facility, and a plate mill (see Table 12 . 1 ) . Each stage demanded a different set of technical skills. Overall productivity depended on the following: the correct mixture and qu.ality of raw materials. the balancing of capacities, the scheduling of material flows. and the relieving of bottlenecks.
In phase II POSCO added a larger sintering plant. more coke ovens. a bigger blast furnace. a basic oxygen furnace. and for the first time, continuous casting and a cold-strip mill. Most facilities were enlarged still further in phase III-and the larger the facility. the more difficult the process control. Continuous casting capacity . was not expanded, but a wire rod mill. a silicon steel mill. and a billet mill were added for the first time. Again. in phase IV continuous casting and cold-strip capacity were increased, and in the second stage of phase IV all major facilities were stripped and relined (with Japanese technical assistance).
Along with its process changes, POSCO's product mix grew more sophisticated. In addition to hot-rolled strip products, POSCO added wire rod, plate. billet. electrical. and cold-rolled and galvanized steel sheets. In 1985. about 4% of the value of the products that POSCO sold could be descrjbed as high grade (wire rope, high-carbon steels. railroad rails, and silicon steel). In addition. 7% could be called special steels. These require a higher level of process engineering and quality control ;than do basic steels. However, local demand for such steels is limited; accord'jng to POSCO this is the reason that higher grade steels do not comprise a larger percentage of total output.
PRIORITIZATION
From the time of the founding of POSCO to the time of the second energy crisis ( 1 978-1979), POSCO's priority was to increase volume, given excess demand for steel in the horne market. It did this by increasing productivity and yields and by expanding capacity. After

The Triumph of Steel 305
the second oil crisis, while capacity continued to expand priority emphasis shifted to improving product quality and introducing new products. In the discussion that follows, P9SCO's learning is described in two sections because it falls ,into two periods.
Productivity and Yields
To raise productivity (both labor and capital), POSCO attempted to minimize downtime, stabilize operations, and improve the performance of each piece of equipment. To minimize downtime POSCO adopted preventive maintenance of equipment. Stable operations depended on joint effort, and thus it worked at improving a broad set of skills. The degree to which operations were stabilized may be inferred from data on operating rates. Because a high operating rate suggests control over a process (at least enough control to prevent output from slipping below a specified level), the higher the operating rate the more stable the operation. Operating rates suggest a repetitive cycle of improvement, addition of new capacity, improvement, and so on. After POSCO added new capaci�y, operating rates tended to exceed rated capacity, indicating an above-avehge degree of process control (PaineWebber, 1985).
These early attempts at process control were not aided by computerized process-monitoring control systems. Despite the fairly widespread us� of �uch systems in modern integrated steel mills in other countries, POSCO decided against their introduction in its first two phases of expansion. It believed computerization would confound the accumulation of operating experience. Therefore, it developed process engineering know-how through manual process-monitoring control. AU data were collected and analyzed by hand. POSCO did not introduce a process computer until 1975, and then only in a select number of plants. Only in phase III were, process computers introduced generally. As for b)lsiness computers, they didn't appear until 1974. They were introduced in production control functions beginning in 1975, but a decade later POSCO was still invQlv$!d in "totalizing" its computer system.
To improve the performance of each piece of equipment, POSCO provided training to its workers. As suggested in Table 8.9, the amount of training that POSCO has provided to all grades of employees is extraordinary. Between 1968 and 1979, training courses of one fonll' or another involved roughly 61 ,400 workers. Approximately 4,200 people were trained outside the company, 1 ,5 1 3 overseas. In 1984 alone, 9,900 workers had received training, some 1 ,000 of them in computer applications. POSCO also runs technical training schools

306 DYNAMIC COMPARATIVE ADVANTAGE
in the town of Pohang, and in 1986 it established an engineering college that it hopes will evolve along the lines of MIT.
The significant improvement of labor productivity over time is depicted in Figure 1 2.3. Employee hours per ton shipped dropped from 32.65 in 1975 to 9.62 in 1984. By comparison, the average Japanese integrated steel mill is estimated to have used 10.8 employee hours per ton in 1 975 and 6.5 per ton in 1 984.7 Therefore, despite Japanese gains, the gap in labor productivity between Korea and Japan has narrowed (PaineWebber, 1 985). Total factor productivity growth is difficult to estimate for pasco because of measurement problems with capital (as mentioned earlier, pasco artificially increased the value of its capital stock in 1982 to take advantage of accelerated depreciation) . To illustrate the extent to which capital productivity has increased in conjunction with labor productivity, adjusted estimates of capital per unit of output are plotted against labor per unit of output over time (Figure 1 2.4). The closer the plots lie to the origin, the better both productivities. Figure 1 2.4 shows that the capital/output ratio was relatively low in 1973-1976, rose in 1977-1980 (with new investments in capital equipment), and then returned to its lower level in 198 1 . Over the whole period, the labor/output ratio generally declined.
To raise yields, pasco concentrated on reducing rejects (as will. be discussed shortly) and increasing the quantity and quality of continuous casting. In the belief that continuous casting,was technically too difficult to operate at the start, it was not introduced until phase II . Then it was omitted in phase III and expanded only in phase IV, after the phase II operation had proved successful (Kwangyang will use 100% continuous casting). By 1985. pasco was right on target: It had attained the expected yield of final steel product to crude steel (88.5%) given its continuous casting ratio (5 1 .3%).
To meet rising demand at home (and to continue to serve the export market at a 30% target), POSCO expanded capacity •. first at Pohang and then, beginning in 1 985, at Kwangyang (another small village chosen a� a steel mill site because of its good harbor). Foreign technical assistance continued through all four phases at Pohang. But POSCO progressively import substituted all the elements of investment capability initially supplied by the Japan Group. As percents of incremental output, foreign engineering fees and labor hours declined steeply over the four phases (see Table 1 2.4), despite the fact that each increment in capacity was larger than the previous one.
? Estimated at 90% operating rate for comparability with Japan.

� "-I
100 I I \ I 100
50 West Germany
• : Great Britain
. , / ! . , . ... . ' ' \. ' , ' i ' ,\
, 1 50
f ' :\ e�..; .. I - - - . • " : • l�N • �\ l A.� .. * !\ � I Percent 0 ... a _" .. J' . . \ �\ _� � ' ., IJ v ' \ .. -:r� :=Y( .. 'W -o
-50 L� ....... . I -· .. · .. ·1"··········1 I -50
(" " ,l" . ,; I ,." ,I,)" ,\,." ,I" I.," ')" \ " " " " ' " ,)) • • , I •• ,"" I " . " I" ' " \.! I" . " " , I " " ! " . I . , I , ,, , , I " ')' \ ' ) ! ) 1 1,) ) . I " I),I,)I" \,,,), I,)I • . I, •••. I -100 100 , ft.ft , ft . . ._-- ._.- ._-- ._-- . ft__ 1980 1981 1982 1983 1984 1985 Figure 12.3 Comparison of Man Hours per Ton Shipped of Hot-Rolled Product (percent difference from Pohang Iron and Steel Co. Ltd .• Korea). 1973-1 985. SInf,Tce: PaineWebber.

308
'5 Q. '5 g .l! Q. ., 0
DYNAMIC COMPARATIVE ADVANTAGE
Capital and Labor Per Unit 01 Output, 1973-1984
. 78
.385 -
.35 "-
· 80 .316 - 0 77
0 79 .28 -
.245 -
e 81 .21 t-
, 0 76
. 175 � 8 83E
. 1 4 � 8 S4E 0 74 I I I I I I � j I I � �
.004'.00481.00561.0064 .0072 .0081 .00881.0096 .01041.0 1 121.0121.01281.0136
Labor/Output
Figure 12.4 Capital and Labor per Unit of Output, POSCO, 1 973- 1984. Source: POSCO
On the basis of participating in plant erections and . in operating the integrated mill established in phase I, POSCO acquired capabilities to undertake the following engineering tasks in phase II :
Preliminary engineering planning ' . Preparation of prQCurement specifiqttions for auxiliary facilities (power
transmission and distribution systems) Preparation of common specifications for general. technology Review and evaluation of manufacturers' specifications Preparation of civil engineering and building construction design Preparation of testing and start-up plans

The Triumph of Steel 309
Table 12.4 Dependence on Foreign Engineering at POSCO
Phase I Phase II Phase 1 lI Phase IV
A: Payments to foreign finns for engineering services ($ millions) 6.3 1 5.98 7.01 0.38
B: Foreign engineering hours involved 1 19,070 64,200 491 NA
C: Incremental capacity (million tons) 1 .03 1 .57 2.9 3.6
NC: $/ton $6.13 $3.81 $2.42 $0. 1 1 B/C: Hourslton 0. 1 1 6 0.041 0.0002
SOUT": Derived from data from POSCO. ,
The Japan Group, however, reviewed all of POSCO's engineering work both during this phase and through phase III .
. In phase III , the extent of local participation in project execution became even larger, although the master engineering plan continued to be the responsibility of the Japan Group. The Japan Group also assisted POSCO in establishing its computerized processmonitoring control system. New contracts with foreign consultants Were entered into for speCialty steels and for more advanced training. However, POSCO undertook all remaining engineering tasks itself. By the time of phase IV, the Japan Group's only function was to evaluate POSCO's own master engineering plan.
The technical assistance that POSCO has received for its Kwangyang mill has also been massive, but with two new twists. Most technology has come from Europe, Japanese steel makers being increasingly reluctant to transfer know-how to their erstwhile student. Most assistance has also been provided by plant exporters, and with the exception of evaluation, POSCO has executed all the tasks previously undertaken by the Japan Group (in addition to fiQancing two thirds of the new mill with retained earnings). Within little over a decade, therefore, it can be said that POSCO learned enough and earned enough to reproduce itself.
Quality
In its second stage of learning ( 1978-1986), competing against a highwage country like Japan took on a new dimension for POSCO. On the one hand, both an excess supply of steel in the world market and tighter measures to conserve the use of ene�gy made customers'

310 DYNAMIC COMPARATIVE ADVANTAGE
quality requirements far stricter than international standards hitherto existing. On the other hand, Japanese steel mills began to engage in what POSCO called quality dumping, or raising quality while keeping the price of steel constant. To compete, POSCO had to increase the quality of its products.
According to Sang Bok Hong, manager of POSCO's Quality Control Department, there was "not one word in the contract with the Japan Group about quality, although quality is the heart of steelmaking know-how." This did not mean that the Japan Group provided POSCO with no quality control know-how whatsoever-it taught POSCO about quality indirectly, by teaching it how to make steel that met international standards. What Hong meant was that there were no quality guarantees in the contract and no explicit stipulation about instruction in how to improve quality.
Training apart, POSCO placed quality on its own agenda as early as 1973 when quality control circles were formed at the outset of operations. POSCO also established a quality control (QC) department, which functioned in practice, and launched a Zero Defect campaign, which existed in theory. The job of the QC department was sevenfold: systems analysis, laboratory work, mechanicil testing, product design, investigation of the chemical and mechanical properties of different steels, monitoring of quality results across departments (steel-making, iron-making, etc.), and evaluation of quality. POSCO had not systematically collected data on reject rates until 1976, but in 1979 quality began to receive far more attention. Statistical quality control was furthered by the introduction of process computers, and investments in more sophisticated equipment enabled better testing and inspection. The" Zero Defect campaign began to be taken seriously, and selected people were sent to Japan to learn more about the movement. POSCO workers began to be paid for suggestions that reduced defects. "
By 1 977 POSCO had as yet undertaken no R&D. Technical problems were solved either by the QC department. by technosections within producti�n departments (to be discussed shortly), or by the Japan Group. Spurred by the second energy crisis and the need to introduce process and product improvements to reduce energy requirements, an R&D center was established in 1977. R&D expenditures between 1977 and 1 986 averaged 0.70% of sales (or roughly 1 6.2 million dollars in 1985 when sales equaled $2.3 billion). In 1985 R&D employed 260 people: 148 researchers (12 with PhD's) and 1 12 technicians. The POSCO R&D department generally sets its own research agenda but also works on projects proposed to it by production departments. Major projects have included making the blast furnace an oil-free operation, reducing the consumption of refrac-

The Triumph of Steel 3 1 1
tories for steel-making, and improving the tundish for continuous casting. The R&D center's own agenda aims to consolidate technological know-how by 1990, to systematize know-how between 1991 and 1996, and to create new technology between 1996 and the year 2000.
New product introduction thus has involved the QC department, R&D, and technosections within production departments. Of the total of 432 steel grades that POSCO is aiming to establish as its fully conceivable product spectrum, 399, or 92.4%, were already being produced in 1986. An examination of quality measures of selected POSCO products makes possible the placement of an upper bound
. on the firm's technological attainments because its latest technologi-cal effort concerned quality. Both external and internal sources of information on quality were utilized: interviews with users of POSCO steel conducted by Mitsubishi Research Institute (MRI) and reject rates from POSCO itself. The two sources correspond fairly closely and show a mixed picture: quality equal to japan's for some products but not others, and variations in quality along different dimensions for products whose quality is not yet under control.
The MRI survey results are presented in Table 12 .5. According to users interviewed by MRI, Korean wire rod was equal in quality to Japanese wire rod. Figure 1 2.5, which presents POSCO's data on reject rates for wire rod, confirms the achievement over time of a defect rate that approximates zero. By contrast, user interviews suggest quality problems for plate, hot coil, and cold coil. Consistent with this finding, Figures 1 2.6 through 1 2.8 show reject rates for these . products and indicate the persistence of quality problems. In the case of plate POSCO claims that the reject rate rose as customers
Table 12.5 Quality Competitiveness of Korean Steel Products Relative to Japanese Products, 1 986
Manufactur-Delivery Dimension Finish ability Weldability Durability
Wire rod OK" OK OK OK OK OK Concrete bar OK OK OK OK OK OK Angle OK OK OK OK OK OK Construction plate OK OK OK OK OK OK Shipbuilding plate NG OK OK OK NG OK Hcit coil for pipe NG NG OK NG OK NG Cold coil for car NG OK NG NG OK OK
'OK, as good as Japanese; NO, less satisfactory than Japanese.
SIJUT<e; User itlleTViews, 1986, Mitsubishi Research Institute.

The Quality of Wire Rod
Wlr, Rod Reject Rale .--. , Plant
1.0 �
% \� O.,�
---. Yeal 1980 I 1981 I 1982 I 1983 I ,984 l 1885 I
1 Planl 0.18 I 0.31 I 0.25 I 0.'8 I 0.'5 .I 0.13 .I Figure 12.5 Quality of Wire Rod at POSCO as Measured by the Reject Rate. Source: POSCO.
plale Reject 1818
3.0
2.0
%
1.0
Year 1973
1 Planl 2 Plant
1974 1975
The Quality of Plate
.--. , Planl · 11- --. 2 Pianl
l---�, �'x- . ./'"
I I .�---.--/. / , . �. .-. i I ' .
, I
1976 1977 1978 1979 1980 '98' · 1982 ,8i13 1984 ,!Ie 0.19 0.86 1 .141 1.42 '.79 1.72 1.40 1 ,37 1 .36 0.S7 .
0.75 1.97 '.92 1.85. 1.38 1 .42 '.33
Figure 12.6 Quality of Plate at POSCO as .Measured by the Reject Rate. Source: POSCO.
312

1 %
Hot Coli Reject Rate
2.0
1.0 -
Year 1973
1 Plant
2 Plant
1974 1915
The Quality of Hot Coil
•
.--. 1 Plant 1I- - .,. 1I 2 Ptant
�.--� . -� 1978 1977 1978 1979 1980
2.21 1.31 1.07 1 .23 1.40
! .- ...... 11- --11 I --.
1981 1982 1983 1984 1985
1.88 1 .26 0.33 0.46 0.34
1.12 " .02 0.88 0.73 0.64
Figure 12.7 Quality of Hot Coil at pasco as Measured by the Reject Rate. Source: POSCO.
. The Quality of Cold Rolled Coli
Reject Rate .--. 1 Plant --. • 3.0r
.�- - -. 2 Plant
2.0 . 1\ '10 "'. .
1.0 � JX_ -- ___ JC II ... I -.... I .... JC�---JC .... .... I .... I .... Jl_ ... ,I -'II
Year 1 978 1979 1980 1981 1982 1983 1984 1985
1 Plant 1.70 1.27 2.14 1 . 1 1 1.28 Ul 3.45
2 Plant 0.92 0.63 0.87 0.38 0.19 1.13 1 .0
Figure 12.8 Quality of Cold-Rolled Coil at pasco as Measured by the Reject Rate. Source: pasco.
313

314 DYNAMIC COMPARATIVE ADVANTAGE
began to demand greater thickness (Figure 1 2.6). The reject rate of hot coil rose beginning in 1978 with the introduction of new products (Figure 12.7). The reject rate of cold coil, on the other hand, went out of control as automobile industry customers demanded better surface quality (Figure 1 2.8).
SUMMARY: THE SHOPFLOOR FOCUS
In a critical study of the Indian steel industry, Lall ( i987) argued that, "it was the interplay of managerial, organizational and technological factors which determined the [negative] outcome." The organizational and managerial issues in Korea's steel industry are especially intriguing, because POSCO is a state enterprise without any organizational history and withQut any of the benefits of membership in a diversified business group.
The nature of steel-making technology helped POSCO organize production without the group-level administrative support that the operating units of the chaebol enjoyed. WhUe technological complexity characterizes th� internal process flow of steel-making, the external linkages between steel-makers and feeder firms are relatively few. By comparison with, say, shipbuilding or automobile manufacture, steel-making depends on few supplier relationships. Steel production is dependent on tight internal coordination but not on the timely arrival of parts and components from multiple vendors. To make steel, POSCO has had to purchase raw materials, market its final product, and execute approximately 425 jobs. In each case, POSCO has taken steps to simplify its organizational exposure. It has formed a joint venture with a coal-mining firm in the United States to ensure a steady supply of raw material, although this investment probably has not been cost effective. It has distributed its own steel domestically but has relied on the general trading companies of the chaebol for overseas distribution. To reduce internal transactions it has subcontracted roughly 8,700 lower skilled jobs (as discussed in Chapter 8). By comparison with many of the operating units of the chaebol, therefore, POSCO has enjoyed relative organizational insularity.
Even more than the chaebol, however, POSCO was confronted initially with the task of building an organization of committed workers and managers. The argument that it has succeeded in doing so is lent support by its low turnover rates. As Chapter 8 noted, turnover for all POSCO employees due to quit rates fell from 4.4% in 1 977 to 1 .7% in 1 98.0 and to a mere 1 .2% in 1984 (PaineWebber, 1 985, pp. 7- 13) . These quit rates are well below the all-manufacturing average for Korean industry. POSCO, however, has not created

The Triumph of Steel 315
commitment by playing up the fact of i� public ownership. To the contrary-most POSCO managers denied'thatiIi� even a state enterprise. In fact. POSCO's status is both quasi-governmental and private in orientation. The company is a dosed corporation and its stock is not traded on any exchange. Currently POSCO's ownership is held 30% by the government, 40% by the Korea Development Bank (government owned), and 30% by private commercial banks (which. however, are government controlled). Government approval is required on all management appointments and top policy management. As stated in Chapter 8. when POSCO was first founded the creation of a team of committed managers was aided by the educated unemployment that exis�ed at the time, and POSCO workers are highly paid by Korean standards.
Nevertheless, although POSCO exploited its technology in a way that allowed it to operate outside the protective umbrella of a big business group, it organized production in the same way as the leading chaebol, which used a strategy that allowed them to compensate for their status as inexperienced learners: They gave power to managers directly involved in production. The twenty-seven different facilities that POSCO had to manage in phase I and the multiple stages in the process flow that had to be stabilized put a tremendous strain on an evolving management team that included newly returned trainees from overseas. To overcome these organi�ational weaknesses, POSCO gave a l�t·of power to the line. Each plant manager of a new facility was appointed as a counterpart to the corresponding consultant from the Japan Group, and worked closely with the responsible machinery ·supplier as well. The plant manager did overall planning and also participated in procurement, specification, construction management, test operation, and start-up. He (aU managers are males), therefore had a total familiarity with the process of his plant at the outset of production. In the initial phases of growth, moreover, the best people were assigned to the line. Even shift foremen were experienced engineers with college degrees. Additionally, POSCO emphasized on-the-job operations training for all its technical managers. Newly recruited engineers with university backgrounds were required to work on all three shifts in order to become familiar with every operation. On-the-job training in steel-making lasted for six months; in iron-making it lasted for one year. The staff of the quality control department had to work in the plant for three months.
Only gradually were engineers gathered into centralized departments: a master engineering planning department, a construction department, an R&D center, and others. But greater centralization notwithstanding, each production department retained its own fif-

316 DYNAMIC COMPARATIVE ADVANTAGE
teen- to twenty-engineer "technosections." These technosections were important because they embodied a cross section of production and investment capability. production capability was derived from providing technical assistance to operations managers; investment capability was derived from working with foreign technical assistants on successive capital expansions. Housed under the same roof, both skills fed one another.
CROSS-SUBSIDIZATION
When Y. S. Chough, the first plant manager of POSCO's number one blast furnace, was asked how POSCO managers learned to make steel, he responded:
Total devotion. There were a lot of educated l!nemployed, and everyone wanted to learn. To learn, I had to make everything clear in every detail. We had to be in a position of preparedness to encounter the unknown. It was no use if information was known only to me. We had to concentrate everyone to one point. I always gave them tasks, homework. We would meet with the Japan Group. Then we would have a meeting of Koreans until late at night.
Determination alone, however, did not overcome the lack of capital, raw materials, markets, skills, .and technology necessary to make steel. The planning that created Korea's comparative advantage in steel took two forms, both of which transcended market forces: political intervention by the gover�ment and a long-run approach to profit maximization by POSCO. .
Political intervention by the government occurred in two market contexts: ( 1 ) The government intervened to raise capital. After failing to raise capital of the desired sum in the international market, the government arranged capital in political horse-trading with J'k, pan. (2) The government intervened in POSCO's product market by a growth strategy that ensur�d a high level of home demand for . steel. Although :exports were encouraged, steel was primarily an import-substitution industry. Therefore, to ensure sufficient home demand to realize the ambitious scale at which the government wished POSCO to operate, a Big Push was necessary into the steel-consumi�g industries. This Big Push was a major source of government assistance to POSCO.8
8 POSCO's principal domestic Customers are minimills, which themselves serve the heavy industries-major shipbuilders and heavy equipment manufacturers-and two automobile makers. All three industries-shipbuilding, heavy machinery, and automobiles-can trace their origins to government support in one form or another.

The Triumph of Steel 317
In turn, fast growth crea.ted a stimulating environment in which to learn. It made possible two types of learning-oy-doing: one associated with the acquisition of investment capability and the other associated with the acquisition of production capability. High demand allowed POSCO to run "full and steady," and steady made the acquisition of production-related skills more straightforward. Rising demand also enabled POSCO to undertake capacity expansions in rapid succession, thereby accelerating the acquisition of project execution skills and technological knowledge of the steel-making process. Finally, rising demand and the prospect of establishing a second integrated steel complex provided the government with a measure of discipline oyer POSCO managers. Every manager queried stated the pressure he felt to perform well in order to secure the contract for the seqmd steel mill and the possibility of a promotion.
As POSCO expanded, it in turn increased the demand for the products of upstream industries. Its demand was of two types: it needed consumables for day-to-day operation (for example, refractories, spare parts, and abrasives), it needed capital goods. Thus, POSCO could meet government requirements for higher local content in consumption for capacity expansions. In 1977 POSCO bought about 44% of its consumables from local suppliers. By 1984 this figure had risen to 75%. The percentage of capital goods purchased locally for capacity expansions (ratio of localization) has also increased steadily over time. During the course of Pohang's four growth phases, the localization ratio rose from 12.5% to 15.5% to 22.6% to 35. 1 %. For the two phases of Kwangyang, the ratios are currently expected to be 50% and 56%. respectively. Furthermore, with each capacity expansion, local firms supplied more complex capital goods. In phase I of Pohang, locai fir�s supplieq. simple materials; in phase II. steel structures; in phase III , single elements of equipment; in phase IV, unit facilities (power-receiving and distribution facilities and unloaders). In phase I of Kwangyang. local capital goods suppliers are building auxiliary plants (a power-generating plant and an autom�ted warehouse). In phase II they are reaching the point of supplying major plants (a raw materials handling plant, a sintering plant).
Government subsidization of electricity afforded POSCO a cost advantage relative to minimills, and POSCO, in turn, subsidizedminimills by providing them with steel at prices below those prevailing internationally (with the exception of the European "spot" mar- . ket). According to PaineWebber ( 1985), the August 1985 price of hot-rolled coil in South Korea for domestic usage was $264 per metric ton. In comparison, the August 1985 "spot" price of hot-rolled coil WaS $342 per ton in the United States (list price was $524 per

318 DYNAMIC COMPARATIVE ADVAl'ITAGE
ton). $285 per ton in Europe at the French/German border. $346 in East Canada. and $358 for "big buyers" in Japan.
POSCO's technique for mediating market forces and creating competitive advantage in the labor market took the form of paying wage rates well above the going norm, thus accelerating the advent of a skill base also well above average. In the market for technology. foreign know-how at POSCO was rapidly supplanted by in-house investments in skill. Conceived in violation of static cQmparative ad� vantage, the company might have followed an alternative path-,-acquiring production, investment, and innovation capability separately, in linear progression. the easiest first and the most difficult last. in a chain of static comparative advantage defined for different skill elements of a single product. analogous to one �hat is typically defined for many products. Instead, pasco invested in acquiring different elements of steel-making skill more or less simultaneously. Linearity was present to the extent that POSCO first began to learn how to make steel, then how to expand steel-making capacity. and lastly how to innovate new steel products and processes. But the acquisition of investment and production capability occurred almost simultaneously. Indeed. certain elements of investment capability were acquired before POSCO turned attention to fine tuning its production skills. Sizable investments in R&D. moreover. occurred not long thereafter. The time interoal between POSCO's founding and its initial investmmt in R&D was barely half a decade. By contrast. twenty-seven years elapsed between the time the United States Steel Corporation was founded in 1901 and its establishment of a central R&D laboratory in 19289 (Chandler. 1989). By historical standards, pasco's learning has been less of a linear progression than a broad, frontal sweep.
• The United States Steel Corporation was formed from a merger of several existing steel companies. many of which began making steel in the 18708. Therefore. the lag between the commencement of steel production and the establishment of a central R&D laboratory was far longer than twenty-seven years.

CHAPTER THIRTEEN
From Learner to Teacher
BACK-DOOR COMPETITION
Late-industrializing countries such as Japan and Korea appear to challenge existing economic powers such as the United States precisely in those areas in which the challengers excel by virtue of their recent histories as learners. Consequently, this book concludes with the major lessons that the learning paradigm of late industrializing offers to countries wishing to reindustrialize. In addition to illuminating the path of late industrializers, the paradigm's reRection also suggests where innovators might change their rules of behavior to compete in a world that now includes a generation ·of latecomers reared on the learning tradition.
The competition in the late twentieth century between Japan, the quintessential learner, and the United States, the greatest economic power, unmistakably parallels a competitive relationship of the past. The United States has been challenged by Japan just as Great Britain was challenged a century earlier by the United States-on a new competitive front, using a new institutional framework. Neither Great Britain nor the United States could be said to have been attacked on its own turf, in its. own area of preeminence-inventiveness in the case of Great Britain, innovation in the case of the United States.
Great Britain's inventiveness went unchailenged long after its economy had succumbe,d to competition from abroad. In the late nineteenth century, although England was responsible for pathbreaking inventions such as chemical dyes, it was Gennany that gained dominance in the international dye-making industry. At the same ,time, and assuming Nobel Prize laureates in chemistry, physics, and physiology/medicine may reasonably be considered an indicator of inventiveness, Great Britain prevailed in that arena until at least 1960 (United States Department of Commerce, various years).
Today, U.S. innovativeness probably remains preeminent even as Japan continues to take market share from it in high�technology in-
319

320 DYNAMIC COMPARATIVE AnV ANT ..... GE
dustries. 1 In terms of Britain's former province and one, component of innovation-inventiveness-the United States is now indisputably master at the world technological frontier (forty of sixty-two Nobel Prizes in chemistry, physics, and physiology/medicine in 1 976- 1 985 ' were awarded to Americans; only one was awarded to a Japanese) (United States Department of Commerce, various years). Moreover, in terms of the other component of innovation-the commercializa" tion of inventions-the United States probably remains supreme. Nevertheless, although the United States was first in bringing to market such high-technology products as semiconductors, audio equipment like videocassette recorders and stereos, robots, flexible manufacturing systems, computer numerically controlled machine tools, and continuous casting in steel-making, Japan took leadership in the areas of production and growth. At the micro level, American industry appears less capable than does its Japanese equivalent of producing high-quality products efficiently and bringing new generations of the 'same product to market quickly. These are precisely the areas in which learners, lacking novel technology, have built their competitive advantage and excel. The macroeconomic consequence is a weaker than otherwise association between innovation and growth.
Thus, where challenge comes from a new paradigm, the new paradigm, to be contained, must be understood by its own logic rather than by the logic of the paradigm that it is upstaging. It is therefore to a summary of the lessons of late industrialization that attention is now turned.
FROM LEARNER TO TEACHER
The most elementary lesson from late industrialization is that Japanese competition is not a unique, culturally specific phenomenon. There exists a much larger set of countries that include Japan, Korea, India and Brazil, each having similar institutions that have evolved in response to the exigencies of industrializing late through learning. These institutions include an interventionist state that deliberately distorts relative prices to stimulate economic growth, business groups that diversify widely to compete initially at the lower end of many markets, a strategic focus on shopfloor management, ' where respected engineers strive to achieve incremental productivity and quality improvements, and a politically and economically weak labor movement (motivated in Korea by high real wage increases).
Culture and history en�er into this paradigm by determining how well it operates in particular countries. As already suggested in sev-
I See, for example, Brooks ( 1985. p. 334),

From Leamer 10 Teacher 321
eral chapters, the paradigm operates especially well in Japan and Korea because the state in both countries is willing and able to exact performance standards from big business in exchange for trade protection and subsidies. Moreover. although the modern industrial enterprise and managerial hierarchies are dominant in the industrial sectors of all late-industrializing countries, Korea and Japan have been unusually successful in keeping overhead in check by allocating responsibility to engineers rather than to administrators. and in stressing the importance of shop floor management. The essential features of the learning paradigm. however, are shared by enough late-industrializing countries that the world economy can expect the arrival of more like Japan. Moreover, most European countries have spent much of their industrial lives as learners. trying to catch up with either England or the United States. They. too. share many of the institutions of late industrialization. because these institutions are first and foremost a function of catching up. Therefore. if the. United Kingdom and the United States have found it difficult to adopt some of these characteristics of their erstwhile followers. it is not because the institutions of these followers are especially exotic, as they believe them to be. Rather, it is because their own institutions are the exception to the general rule.
There appears to exist, therefore. a discontinuity along the continuum connecting innovating and learning, and ,it is unidirectional. It stops innovators from becoming learners rather than the reverse. Successful learners appear to slide easily into the role of innovator, propelled forward by large investments in R&D and habituated to scanning the world for new technology and mastering it in-house. Innovators, however, appear to find it difficult to cultivate the role of learners, because of neglect of the shopfloor and of other innovators as sources of new ideas, as well as hostility toward the state.
In the- following .. references to "late-industrializing countries" are restricted to Korea and the other high performers. Japan and Taiwan. References to innovators are restricted to the leading firms against which the high-performing learners have had to compete. The contest has occurred so far in mature industries or in the mature segments of high-tech industries that the innovators established. The innovators; country tends to be the United States because the mass-production industries that American firms created to compete against Britain at the turn of the century have been more susceptible to competition from late-industrializing learners than the engineering-intensive industries that German firms pioneered.
The deep ideological commitment of the United States to the market mechanism is widely recognized. In a 1965 book that comes-close to predicting the U.S. economy'S subsequent declin�, Shonfield ob-

322 DYNAMIC COMPARATIVE AnV ANTAGE
served "The hostility to public initiative has deep roots in American traditional mythology" (pp. 298-9). What is less recognized is just how deep the ideological commitment of late-industrializing countries like Japan and Korea also is to the free market. The Korean president who .masterminded industrialization under state initiative in the 1960s and 1970s apologizes in his autobiography for introducing planning and for intervening to control the necessarily "mammoth" big businesses of industrial growth (C. H. Park, 1963). Moreover, a commitment to market ideology in Korea was reinforced by the continuous monitoring of the Korean economy by the Bretton Woods institutions. It was stiffened further with neoclassicism by Korean graduate students returning from economics de� partments in American universities.
What distinguishes the United States from Korea is not economic ideology. Rather, the difference lies in how the two states define free market in practice. Because the productive forces in Korea have never been developed according to free market principles, Korea's workable definition of the free market is loose, satisfied by the existence . of private property and intense rivalry among the big business groups. The divergence between theory and practice has been disguised by" two rites of liberalization (in the early 1960s. and then in the early 19805), which left, in practice if not in theory, the fundamental relations between business and government and the institutions of economic growth unchanged. The United States, on the other hand, adheres to a much more orthodox definition of the market, despite its having been one of the most protectionist countries in the past. Ignoring its own history, the United States credits the free market with having developed the productive forces. The limits to the influence of this ideology in the United States are few. Nevertheless, late industrialization suggests that four aspects of the market mechanism have become dysfunctional and are in need of rethinking.
The first relates to allowing private rates of return rather than social rates of return to determine investment behavior. Proponents of the market view place unconditional faith in the capital market profit rate in making decisions about how much should be invested in which projects. They believe that because this rate is determined . by market forces it is inviolate. Yet there is nothing sacred about it. It reflects the sociopsychic view of financiers about what rate of re-_, turn they require in order to accept risk. Late-industrializing coun- I tries tend to operate with social rates of return that are much lower I than the capital market profit rates that are in effect in innovating ; countries. Consequently, late-industrializing countries are prone tii-' invest more, run a trade surplus, and thereby outcompete innovating countries in an ever-widening range of industries, many of which are interrelated and benefit (suffer) from each other's growth (de-

Prom Leamer to Teacher 323
cline). In a global economy where learners abide by social discount rates, innovative economies would be ousted from one industry after another if they left their investment decisions wholly to capital markets.
The second area in need of rethinking relates to two intersecting ideals of classical liberalism-that the state acts in the best interests of the entire nation and not those of any' one group, and that the pursuit by firms other than monopolies of their private interests redounds to the benefit of society at large. These ideals have been lurne4 inside out in late industrialization. Even in a democracy like Japan (and certainly in what was once a dictatorship like Korea), the state has acted unabashedly in favor of business. At the same time, the state has acted on the premise that the interests of business, even nonmonopolistic business, do not necessarily overlap with those of society at large. Hence, the support of business by the state on the one hand, and the discipline of business by the state on the other. Nevertheless, the United States persists with the two liberal market ideals that together are self-defeating: Business cannot be singled out for support, yet the economy must coast on the accomplishments of business.
-
The third aspect of the market mechanism that is in need of rethinking relates to productivity, The growth models of the market paradigm equate higher productivity with technOlogical change, and then take technological change as exogenously determined. As suggested in earlier chapters, these models are irrelevant for learners because they make productivity improvements exclusively dependent on innovation, whereas learners by definition do not innovat.e. In practiCe, and in the theory of the economics of late industrialization developed in earlier chapters, thl! growth rate of output increases as the growth rate of productivity increases, and in closedloop fashion, depending on institutional constraints, the growth rate of productivity increases as the growth rate of output increasesthrough investme-nts that embody foreign designs, economies of scale, and learning-by-doing. While the closed-loop growth-productivity dynamic describes economic behavior in late-industrializing countries especially well, its applicability also extend� to innovators. The dynamic has the virtue of drawing attention to the dependence of productivity improvements on institutions, firm size, managerial hierarchies, learning-by-doing, and so on, not just myopically on R&D, or on high wage levels that are insufficient in themselves to motivate high productivity among the workforce.
The fourth aspect of the market paradigm that is espeCIally 111 need of rethinking relates to the law of comparative advantage, or the idea that countries should specialize in a limited number of in-. , dustries, the choice depending on resource endowment. The law ra-

324 DYNAMIC CQMPAR/\ TIVE ADVANTAGE
tionalizes the tendency of many American firms t� wi�hdraw from competition. in "mature" industries (say, consumer electronics or steel, each of which requires significant amounts of production labor), once these markets are challenged by countries industrializing late.
Withdrawal, however, may be defeatist rather than discrete. The experience of late-industrializing countries suggests a wide latitude for improvement in such industries, in terms of productivity, quality, and service. Cumulative incremental improvements may prove decisive in winning over competitors in the areas of delivery, price, and product performance.
The potential of the mature industries is also suggested by the investments of learners in R&D. In 1983- 1984, for example, the standard deviation across industries from the. national mean of industrial R&D as a percent of sales was almost identical in the United States, Japan, and Korea (standardized for absolute mean differ, ences). But the inter-industry pattern of deviation from the national . mean differed. In Japan and Korea, R&D in most mature industries (food, textiles, chemicals, and nonferrous metals) fell below the allindustry average but by less than it did in the United States, and R&D in most machinery branches exceeded the all-industry average but by more than it did in the United States (World Bank, 1987). This gives some indication that in comparative terms, R&D in mature industries in the United States is lackluster.
The rate of innovation worldwide appears to be accelerating. mak� ing growing segments of high-tech service and manufacturing industries "mature" overnight. Countries unwilling or unable to compete in mature industries may discover specialization in high-tech too limiting, particularly since the social returns to investments in high-tec� are higher when the new technology is applied in mature sectors.
LABOR RELATIONS
Of all the characteristics of late industrialization, labor relations show the least consistericy across �ountries. Repression of labor dissidents and hostility toward trade unions are quite general among lateindustrializing countries, but contentiousness and ad versa rial ism between management and labor differ in degree and ' kind.
The Korean government has a policy with respect to every conceivable aspect of economic development except labor relations. Responsibility for labor relations within the government bureaucracy has largely been left to the Korea Central Intelligence Agency or to. the police. Economists who have worked for the government, particularly for the dictatorship that came to power in 1980, have limited their labor policy to calls for wage restraint. ,

From Learner to Teacher 325
Korea's big diversified business groups have also treated the function of labor relations differently from other functions such as production. marketing, finance, and so on. These other functions have largely been arrogated to salaried managers, whereas that of labor relations has been retained under the personal control of the owner/ chief executive. The personnel function in general, and the labor relations function in particular, are almost nonexistent as a staff responsibility. whether at the group or subsidiary level. Whatever professionalism creeps into the exercise of this function in Korea comes indirectly through the production function, in the form of quality control circles. Otherwise, labor relations are left to the charisma and paternalism of group chairmen to energize or smooth.
Paternalism fn Korea since the military coup in 196 1 has witnessed almost three decades of relatively peaceful labor relations. The causality between paternalism and peace is unclear because both operated in conjunction with state repression of labor, on the one hand, and rapid increases in real wages, on the other. Moreover, labor peace in the 1970s and 1980s in Korea was in keeping with international practice. The 1970s and 1980s were decades of relatively quiescent labor relations worldwide. In the United States, labor relations were quiescent despite the failure of real earnings to rise beginning in 1973 and despite the local upheavals associated with plant closings.
Nevertheless, the labor peace that has characterized both Korea and the United States may be misleading from the viewpoint of each country's capability to compete, assuming that labor peace is vital to sustaining competitiveness. In Korea, labor peace has been interrupted by explosions of unrest, as workers have demanded not merely better working conditions but also greater democracy at the workplace (as well as at the national level). In the United States, labor peace has been accomplished in conjunction with a decline in the growth rate of productivity. Although the causes of this productivity decline extend beyond labor relations. there is undoubtedly some connection between the two.
The entry of the late-industrializing countries into the world economy has resulted in an intensification of competition across markets. Competition has increased as the flow of technology across international borders has increased and the once gargantuan gulf in technological capabilities among nations has narrowed. With the notable exception of Japan, late-industrializing countries, including Koreaand many of the early-industrializing countries as well-have a long way to go before their labor relati9ns can be described as conducive to sustained economic . development. Yet, as the technological gap narrows further, one may venture to guess that competitiveness will increasingly depend on the achievement of such labor relations and of industrial peace.


Epilogue
Unlike earlier Olympic games, those held in Seoul in 1988 signified more for their host than a hollow gesture. In Korea's case the Olympics created a glare of international publicity that illuminated the intensity of domestic struggle for political change, and helped extract concessions from a government on its best behavior. The monetary rewards which the Koreans calculated as a by-product of hosting the Olympics were multiplied immeasurably by the political benefits: the 'emergence of relatively free elections for political officeholders.
The advent of a modicum of political democracy in Korea casts Korean industrialization in a new light. In the past it was easy to admire Korean industrialization from an economic angle. And while many Koreans also wished to have their industrralization praised from the standpoint of income equality, the case for a high degree of income equality in Korea has become uneasy. Until very recently, Koreans were not subject to financial disclosure and could hold bank accounts under assumed names. If for no other reason, this distorted the most careful attempts to calculate the distribution of wealth, . a distribution that became all the more suspect with the entrenchment of Korea's .mammoth diversified business groups, many bf whose private owners paid no income taxes.
Now, however, one must respect Korean indu.strialization not only for its economic success but also for its political transformation. Economic success on the basis of strong government intervention, heavy industry, and big business is evidently compatible with political democracy. Indeed, one can make the case that the concentration of large groups of workers under one roof, and the priming of large numbers of students-cum-salaried managers, furthered political mobilization. The implications are twofold for what in the economics · profession has come to be called the "new political economy" or the "new institutional economics": economic success in Korea challenges their assumption, based on psychological "laws," that government intervention degenerates into "rent seeking." Now free elections in Korea ·also challenge their related assumption that more government intervention results in less democracy. Korea supports the proposition that the reverse may be true, or that the degree of government intervention and the degree of democracy may be uiuelated.
In Korea's practical world of policy making, democratization holds
327
328 EPILOGUE
other implications. The near future in Korea is almost sure to be marked by intensified pressure from the United States for liberalization, particularly if Korea remains a trade surplus nation. In exchange for access to its home market, the United States wants access for its exports in the Korean market, and the freedom to enter Korea's financial markets to buy into Korean prosperity.
Greater liberalization is inevitable, but is being pushed independently by many Korean economists on grounds of efficiency. Past industrialization on the basis of learning, however, suggests that there is no simple equation between freer markets and greater efficiency. Moreover, liberalizing financial institutions in the presence oflarge conglomerations of economic power, as represented by the chaebol, has created greater inequality, not greater efficiency. Aggregate economic concentration in Korea more than doubled since financial liberalization began in 1979. Under conditions of high degrees of mo. . nopoly power, it may be preferable to keep major financial decisions in the government's hands. This is especially true now that the government is popularly elected.
The Olympics also witnessed Korea in the process of ariother transition: from learner, or borrower of foreign technology, to creator of new products and processes. Of course, this transition is in its infancy, and may be no easier to achieve than political democracy. But one can only be impressed by the large amounts of money that the Korean economy is currently investing in R&D and technical education. Between 1976 and 1986 the number of engineering graduates with higher degrees increased sev.enfold. R&D as a percentage of GNP was .39 percent in 1970. By 1986 it had reached 2.0 percent, . even as GNP soared. It is planned to reach 2.8 percent in 1990 and around 5 percent in th� year 2000.
R&D in Korea has received two stimuli, one from the government and one from the institutions created by leading firms to import foreign technology. In the case of the government, rapidly rising wage rates in the 1970s alerted officials to the importance of thinking long term. The Tech�ology Development Promotion Act of 1972 had lit. tle immediate effect on private R&D expenditures, but in 1978-1979, almost like clockwork, the biggest chaebol opened an R&D laboratory in their major industries, and then the smaller enterprises followed suit. As the government reformed tax credits and sweetened its incentives, the number of centralized corporate R&D laboratories rose from 3 in 1967, to 14 in 1 976, to 52 in 1980, to 1 38 in 1984.
The foundations for such laboratories were often the technical offices created to facilitate the ·transfer of designs and production processes from overseas. I n the case of the Ssangyong Cement Company, for example, its R&D laboratory began by testing the qualities

Epilogue . 329
of the cement Ssangyong was producing. Then the firm built a prototype of a mill to learn the optim�m cement process to import from abroad. Now it has begun to experiment not merely with how to optimize cement making but also with how to develop ceramics.
The establishment of technical offices themselves were evidence that technology import is not a passive process. To be successful, technology transfer requires imaginatic;m and investments in the capability to improve and adapt. In the future, therefore" we may expect leading firms in Korea to continue practicing the high art of learning, as they scan the world frontier for new technologies and plan long-term expansion. japanese and now Korean economic history. however, also teaches that we may expect not merely imitation and copying from learners-the longstanding stereotype. We may also expect creativity, because learning itself turns out to be a highly creative process.


Bibliography
English Language Works Cited Adams, W. and J. W. Brock. 1986. The Bigness ClJl7lplex; Industry, Lab()7, and
Government in the American Ecorwmy. 'New York: Pantheon. Agarwala, P. N. 1986. "The Development of Managerial Enterprises in In- ,
dia." In Development of Managerial Enterprises" K. Kobayashi and H. Morikawa (Eds.) .. Tokyo: University of Tokyo Press.
Aghevli, B. B., and J. Marquez-Ruane. 1985. "A Case of Successful Adjustment: Korea's Experience during 1980-84." Washington, D.C.: International Monetary Fund.
Amsden, A. H. 197 1 . International Firms and the Labour Market in Kenya. London: Frank Casso
__ . 1977. "The Division of Labor Is Limited by the Type of Market: The Taiwanese Machine Tool Industry." World Development 5 (3):2 17� 33. I
__ . 1 985. "The State and Taiwan's Economic Development." In Bringing the State Back In, P. B. Evans, D. Rueschemeyer, and T. Skocpol (Eds.). Cambridge, England: Cambridge University Press.
__ 1986. "The Direction of Trade-Past and Present-and the 'Learning Effects' of Exports to Different Directions." Journal of Development Economics 23:249-74.
__ 1987a. "Imperialism." In New Palgrave Dictionary of Political Ecorwmy. New York: Macmillan.
__ 1987b. "Republic of Korea." Stabilization and Adjustment Policies and Programmes, Country Study No. ]4; Finland: World Institute for Development Economics Research of the United Nations University.
__ 1989. "Big Business and Urbanization in Taiwan: The Origins of . Small and Medium Size Enterprise and Regionally D�centralized Indus
try." Mimeo, �assachusetts Institui.e of Technology, Cambridge. __ , and L. Kim. 1985a. "The Role of Transnational Corporations in the
Production and Exports of the Korean Automobile Industry." Working paper 9-785-063, Division of Research, Harvard Business School, Boston.
__ ' . 1985b. "The Acquisition of Technological Capability in South Korea.;' Mimeo, Development Research Department, Productivity Division, World Bank, Washington, D.C.
__ , and S. Min. 1989. "The Limited Ability of the United States to Export Manufactures to South Korea." Mimeo, Harvard Business School, Boston.
Anderson, D. 1 982. "Small Industry in Developing Countries: A Discussion of Issues." World Development 10 ( 1 1 ):913-48.
Antonelli, C_ 1986. "Technological Expectations and the International Dif-
331

332 BIBLIOGRAPHY
fusion of Process Innovations: The Case of Open End Spinning Rotors." Mimeo, Politecnico di Milano, Milan.
Arrow, J. K., and F. H. Hahn. 197 1 . General Competitive Analysis. San Francisco: Holden-Day.
Ashworth, W. 1 952. A Short History of the International Ecorwmy, 1850-1950. London: Longmans, Green.
Asia Kyokai. 1957. The Smaller Indmtry in Japan. Tokyo: Asia Kyokai. Bagchi, A. K. 1982. The Political Economy of Underdevelopment. Cambridge,
U.K. : Cambridge University Press. Bai. M.-K. 1982. "The Turning Point in the Korean Economy." The Devel
oping Economies 20: 1 17-40: Bailey. E. A . • and A. F. Friedlaender. 1982. "Market Structure and Multi
product Industries." Journal of Economic Literature 20: 1 024-48. Balassa. B. 198 1 . · "A Stages Approach to Comparative Advantage." In The
Newly Industrializing Countries in the World Economy, B. Balassa (Ed.). New York: Pergamon.
__ . 1984. "Comparative Advantage in Manufacturing Goods: A Reappraisal." Discussion paper. Report No. DRD90,. Economics and Research Staff. Development Research Department. World Bank, Washington, D.C.
Baldwin. F. 1969. "The Ma'rch First Movement: Korean Challenge and japanese Response." Dissertation, Columbia University. New York.
Ban, S. H. 197 1 . "The Long-Run Productivity Growth in Korean Agricultural Development, 19 10- 1968." Dissertation, University of Minnesota, Minneapolis.
__ , P. Y. Moon. and D. H. Perkins. 1980. Rural Development. Cambridge, Mass. : Harvard University Press (for Council on East Asian Studies. Harvard University).
Bank of Korea. 1963. Review of Korean Economy in 1 962. Seoul: Bank of Korea.
__ . Various years (a). Economic Statistics Yearbook. Seoul: Bank of Korea.
.
__ . Various years (b). Quarterly Economic Review. Seoul: Bank of Korea. Baran. P .• and E. J. Hobsbawm. 1961 . "The Stages of Economic Growth."
Kyklos 14:234-42. Barnett. D. F .• and R. W. Crandall. 1986. Up from the Ashes: The Growth of the
U.S. Minimill�Steel Sector. Washington. D.C:: Brookings Institute. Bernal, J. D. 1965. The Scientific and Indmtrial Revolutions. Vol. 2 of Science
in History. Cambridge. Mass. : MIT Press. Bhalla, S. S. 1979. "Aspects· of Income Distribution (and Employment) in
South Korea." Employment and Rural Development Division. World Bank, Washington, D.C.
Bloomfield, A. I., and J. P. jensen. 195 1 . Banking Reform in KllTea. New. York: Federal Reserve Bank.
Bohn. R. E . • and R. jaikumar. 1986. "The Dynamic Approach: An Alternative Paradigm for Operations Management." Mimeo" Harvard Business School, Boston.
Brandt, V. 1986. �·Korea." In Ideology and Competitiveness: An Analysis of Nine

Bibliography 333
Ccrnntries, G. C. Lodge and E. F. Vogel (Eds.). Boston: Harvard Business. School Press.
Braverman, H. 1974. Labor and Monl)jJoly Capital. New York: Monthly Review Press.
Bresnahan, T. F. 1 987. "Competition and Collusion in the American Automobile Industry. The 1955 Price War."Journal of Industrial Economics 35 (4):457-82.
Brooks, H. 1985. "Technology as a Factor in U.S. Competitiveness." In U.S. Competitiveness in the }'Vorld Economy, B. R. Scott and G: C. Lodge (Eds.). Boston: Harvard Business School Press.
Brown, E. H. P. 1986. A Century of Pay. London: Macmillan . de Brunner, S . E . 1928. Rural Korea. New York: International Missionary
Council. .
Bum-Shik, S. 1970 (comp.). Major Speeches by Korea's Park Chung Hee. Seoul: Hollym.
Business Korea. 1 983. "Revving Up for a Rough Ride." December. __ . 1 984. "Business Concentration in Korea: A Critical View." July. __ . 1985. "Where is the Edge?" August. __ . 1986. "Technology Transfer: Targets and Tactics." February. __ . 1987a. "Chairman's Death Makes Waves." May.
-
-_. 1987b. "Exports Continue to Fuel Growth." June. -_. 1987c. "Samsung's Transition." June. __ . 1987d. "In Search of the Linkage Effect." January. Buzacott, J. A., et al. (Eds.). 1982 . Scale in Production Systems. New York:
Pergamon. Calvert, M. A. 1967. The Mechanical Engineer in America, 1830-1910. Balti
more, Md.: Johns Hopkins University Press. Castaneda T., and F.-K. Park. 1986. "Structural Adjustment and the Role
of the Labor Market." Mimeo, Korea Development Institute and World Bank, Washington, D.C.
Caves, R. E., and M . . Uekusa. 1976. Industrial Organization in Japan. Washington, D.C. : Brookings Institute.
Chandler, A. D. Jr. 1962. Strategy and Structure; Chapters in the History of the American Industrial Enterprise. Cambridge, Mass.: MIT Press.
__ . 1964. Giant- Enterprise: Ford, General Motors, and the Automobi� Industry. New York: Harcourt, Brace and World.
__ . 1977. The Visible Hand: The Managerial Revolution in American Business. Cambridge, Mass. : Belknap.
__ . 1 988. The Essential Alfred Chandler; Essays Toward a Historical Theory of Big Business. ' T. K. McCraw (Ed.). Boston: Harvard University Pres�.
__ . 1989. Scale, Scope, and Organizational Capability. Mimeo, Harvard Business School, Boston.
Chang, Y. 197 1 . "Colonization as Planned Change: The Korea Case." Modern Asian Studies 5: 16 1-86.
Chen, I .-te. 1968. "Japanese Colonialism in Korea and Formosa: A Comparison of Its Effects upon the Development of Nationalism." Dissertation, University of Pennsylvania, Philadelphia.
-

334 BIBLIOGRAPHY
Chenery, H., and M. S. Ahluwalia. 1974. Redistribution with Growth. Oxf!)rd, England: Oxford University Press.
__ , S. Robinson, and M. Syrquin. 1986. Industrialization and Growth: A Cumparative Study. New York: Oxford University Press (for World Bank).
Cho, D. S. 1987. The General Trading Company Concept and Strategy. Lexing7 ton, Mass.: .Lexington Books.
__ , and M. E. Porter. 1986. "Changing Global Industry Leadership: The Case of Shipbuilding." In Cumpetition in Gwbal Industries, M. E. Porter (Ed.). Boston: Harvard Business School Press.
" Cho, Y. J., and D. C. Cole. 1 986. "The Role of the Financial Sector in Korea's Structural Adjustment." Mimeo, Korea Development Institute and World Bank, Washington, D.C.
Cho, Y. S. 1963. UnderdeveltJped Areas with Special Reference to South Korean Agric-ulture. Berkeley, Calif.: University of California Press.
Choi, J . J. 1983. "Interest Conflict and Political Control in South Korea: A Study of the Labor Unions in Manufacturing Industries, 196 1-80." Dissertation, Political Science, University of Chicago.
Choi, M. H. 1960. "A Review of Korea's Land Reform." Korean Quarterly 2 ( 1):55-63.
.
Chou, T.-C. 1 988. "The evolution of Market Structure in Taiwan." Revista Internazionaie di Scienze Economiche e Commerciali 35 (2): 17 1-94.
Chung, M. J. 1982. "Status of the Korean Shipbuilding Industry." Paper presented at International Forum on Industrial Plann"ing and Trade Policies, Seoul, June.
Cole, D. C., and P. N. Lyman. 197 1 . Korean Development: The Interplay of Politics and Econumics. Cambridge, Mass.: Harvard University Press.
__ , and Y. C. Park. 1983. Financial Development in Korea, 1945-1978. Cambridge, Mass.: Harvard University Press (for Council on East Asian Studies, Harvard University).
Commission of the Churches on International Affairs. 1979. "Human Rights in the Republic of Korea." Background Information Occasional Publication I, New York. N.Y.
Conroy, H. 1960. The japanese Squeeze of Korea: 1868-1910. Philadelphia: University of Pennsylvania Press.
Corbo. V., and S.-W. Nam. 1 986. "Controlling Inflation: Korea's Experience." Mimeo, Korea Development Institute and World Bank, Washington, D.C. :
Council for Economic Planning and Developme�t, Republic of China. Various years. Taiwan Statistical Data Book. Taipei: Council for Economic Planning and Development.
Cumings. B. 198 1 . The Origins of the Korean War. Princeton, N. J.: Princeton University Press.
Cumings, B. G. 1974. "Is Korea a Mass Society?" Occasional Papers on Korea. No. I. Seattle: University of Washington Press.
Cusumano, M. A. 1985. The japanese Autumobile Industry. Cambridge, Mass.: Harvard University Press (for Council on East Asian Studies. Harvard University).
Daito, E. 1986. "Recruitment and Training of Middle Managers in Japan,

Bibliography 335
1900-1 930." In Develc;pment of Managerial Enterprise, K. Kobayashi and H. Morikawa (Eds.). Tokyo: University of Tokyo Press.
.
Deane, P. 1 965. The First Irulustrial Revolution. Cambridge, Mass.: Cambridge University Press.
Delehanty, D. E. 1968. Nonproduction Workers in U.S. Manufacturing. Amsterdam: North Holland Press.
Dickens, W. T. 1986. "Wages, Employment and the Threat of Collective Action by Workers." Working Paper No. 1 856, National Bureau of Economic Research, Cambridge, Mass.
Dodge, H. W. 197 1 . "A History of U.S. Assistance to Korean Education, 1953- 1966." Dissertation, George Washington University, Washington, D.C.
Dornbusch, R., and Y. C. Park. 1 986. "The External Balance of Korea." Mimeo, Korea Development Institute and World Bank, Washington, D.C.
Duus, P. 1984. "The Economic Dimensions of Meiji Imperialism: The Case of Korea." In The japanese Colonial Empire, 1895-1945, R. H. Myers and M. R. Peattie (Eds.). Princeton, N.].: Princeton University Press.
Easterlin, R. A. 198 1a. "Why Isn't the Whole World Developed?" journal of Economic History 4 1 : 1� 19.
__ . 198 1 b. "A Note on the Evidence of History." In Education arul Economic Development, C. A. Anderson and M. J. Bowman (Eds.). Chicago: Aldine.
Eckert, ]. C. 1986. "The Colonial Origins of Korean Capitalism: The Koch'ang Kims and the Kyongsong Spinning and Weaving Company, 1 876-1945." Dissertation, University of Washington, Seattle.
Economic Planning Board. 1962. Economic Suroey. Seoul. __ . 1 966. Report on Mining arul Manufacturing Suroey. Seoul. __ . 1985. Report on Industrial Census, Vol. 1 , 1983. Seoul. __ . Various years. Major Statistics of Korean Economy. Seoul. Electronics. 1 987. "Korea Aims for the Top in VLSI by 199 1 ." April 2. Ewing, G. O. 1973. "Labor Unions in Rapid Economic Development: Case
of the Republic of Korea in the 1960s." Dissertation, University of Wisconsin, Madison.
Feder, G. 1986. "Growth in Semi-industrial Countries: A Statistical Analysis." In Irulustrializo.tion arul Growth: A Comparative Siudy, H. Chenery, S. Robinson, and M. Syrquin (Eds.). New York: Oxford UniverSity Press (for World Bank).
Fischer, D. H. 1970. Historian's Fallacies. New York: Harper and Row. Fishlow, A. 1965. "Empty Economic Stages?" Economic Journal 75 (297): 1 12-
25. Fortune. 1987. "The International 500." August .
. Frank, A. G. 1969. "The Sociology of Development and the Underdevelopment of Sociology. In Latin America: Underdevelopme,nt or Revolution?, J. Petras and M. Zeitlin (Eds.). New York: Fawcett.
Frank, C. R., K. S. Kim, and L. Westphal. 1975. Foreign Trade Regimes and Economic Develc;pment: South Korea. New York: National Bureau of Economic Research. (Distributed by Columbia University Press.)

336 BIB\.-IOGRAPHY
Fukunishi, A., et al. 1980. "Competitive Relations between Japan and the Asian NICs in Materials Industries." In Amazing Korea: Rapid IruJ:u:itrialiwtion of Asian C()Untries and Japan's Response, H. Omura (Ed.). Tokyo: NlRA.
Gerschenkron, A. 1962. Economic Backwardness in Historical Perspective. Cambridge, Mass.: Harvard University Press.
Gold, B. 1981 . "On Size, Scale, and Returns: A Survey." journal of Economic Literature 29:5-33.
Gorz, A. (Ed.). 1976. The Division of Lab()Ur: The Lab()Ur Process and Class Struggle in Modern Capitalism. Atlantic Highlands. N.J.: Humanities Press.
Government-General of Chosen. 1920-192 1 . Annual Report on Reforms and Progress in Chosen, 1920-21. Tokyo.
Grajdanzev, A. 1944. Modern Korea. New York: John Day (for Institute of Pacific Relations).
Great Britain, Committee on Industry and Trade. 1 928. Survey of Textile Industries. London: Her Majesty's Stationery Office.
Grootaert, C. 19,86. "The Labour Force Participation of Women in ,the Republic of Korea: Evolution and Policy Issues." Mimeo, World Bank,
'Washington, D.C. Han, S. 1974. The Failure of Democracy in South Korea. Berkeley, Calif.: Uni
versity of California Press. Harbison, F. H., J. Maruhnic, and J. R. Resnick. 1970. Quantitative Analyses
of Modernization and Development. Industrial Relations Section, Princeton University, Princeton, N .J.
Harvard Business School. 1985a. "Daewoo Group." Case Study 9-385-01 4. , Harvard Business School Case Services, Boston.
.
__ . 1985b. "Goldstar Co., Ltd." Case Study 9-385-264. Harvard Business School Case Services, Boston.
__ . 1 986a. "Business Groups in Developing Countries." Case Study 0-386- 178. Harvard Business School Case Services, Boston.
__ . 1986b. "Hyundai Heavy Industries and the Shipbuilding Industry." Case Study 9-385-2 12. Harvard Business School Case Services, Boston.
__ , 1 986c. "Korea's Computer Strategy." Case Study 9-685-070. Harvard Business School Case Services, Boston.
__ . 1 986d. "Samsung International, Inc." Case Study 0-686-123. Rev. 81 86. Harvard Business School Case Services, Boston.
Hattori, T. 1984. 'The Relationship between Zaibatsu and Family Structure: The Korean Case." In Family Business in tlte Era of Industrial Growth: Its Ownersltip and Management, A. Okochi and S. Yasuoka (Eds.). Tokyo: University of Tokyo Press.
Hawtrey, R. G. 1937. Capital and Employment. London: Longmans. Hayes, R. H. 1985. "Strategic Planning-Forward in Reverse?" Harvard Business
Review November/December, pp. 1 1 1-19. Henderson, W. O. 1954. Britain and Industrial Europe, 1 750-1870; St1Uiies in
British Influence on tlte Industrial Revolution in Western Europe. 2nd ed. Leicester, England: Leicester University Press. ,
Hirschmeier, J. , and T. Yui. 1 98 1 . The Development of japanese Business 1 600-1980. 2nd ed. London: George Allen.

Bibliography 337
Ho, S. 1980. "Small-Scale Enterprises in Korea and Taiwan." Working Paper No. 384, World Bank, Washington, D.C.
Ho, S. P.-S. 1984. "Colonialism and Development: Korea, Taiwan, and Kwantung." In The Japanese Colonial Empire .I895-1945, R. H. Myers and M. R. Peattie (Eds.). Princeton, N.] . : Princeton University Press.
Hong, W. 1 975. Factor Supply and Factor Intensity of Trade in Korea. Seoul: Korea Development Institute.
__ , and Y. C. Park. 1986. "Financing Export-oriented Growth in Korea." In Pacific Growth and Financial Interdependence. A. H. H. Tan and
. B. Kapur (Eds.). Sydney: Allen and Unwin. Hubbard. G. E. 1938. Eastern Industrialization and Its Effect on the West. Lon
don: Oxford University Press (for Royal Institute of International Affairs).
Institute of Statistics. Various years. Statistical Yearbook of Turkey. Ankara: Institute of Statistics.
International Cooperaiion Agency, Fiscal Years 1954-1956. 1957. U.S. Assistance Programs for Korea. Audit Report to the Congress of the United States.
International Labor Office. 1986. Yearbook of Labor Statistics. Geneva: International Labor Office.
International Monetary Fl,lnd. Various years. International Financial Statistics. Washington. D.C.: International Monetary Fund.
Ito. S. 1984. "Ownership and Management of Indian Zaibatsu." In Family Business in the Era of Industrial Growth: lis Ownership and Management, A. Okochi and S. Yasuoka (Eds.). Tokyo: University of Tokyo Press.
Jacobs. N . 1985. The Korean Road to Modernization and Devell>fJment. Urbana,
III.: University of Illinois Press. Johnson, C. 1982. MITI and the Japanese Miracle: The Growth of Industrial
Policy, 1 925-1975. Stanford, Calif.: Stanford University Press. ___ 1988. "The Japanese Political Economy: A Crisis in Theory," Ethics
and International Affairs 2:79-98. .
Jones, L., and 1. Sakong. 1980. Government, Business, and Entrepreneurship in Economic Development: The Korean Case. Cambridge. Mass.: Harvard University Press (for· Council on East Asian Studies, Harvard University).
Journal of Post Keynesian Economics. 1983. "Symposium: Kaldor's Growth Laws." 5:341-44.
Juhn, D. S. 1965. "Entrepreneurship in an Underdeveloped Economy: The Case of Korea, . 890-1940." Dissertation, George Washington University, Washington, D.C.
Jun. W. 1 987. "The Experience of Technology Development in Korea: The Case of the Eleqronics Industry." Paper presented at Indian Seminar on Technology Development, sponsored by U.S. AID and Confederation of Engineering Industries of India. Korea Institute for Economics and Technology, April 27-May 1 . Seoul.
Kaldor, N. 1967. Strategic Factors in Economic Development. Ithaca, N.Y:: Cornell University Press.
__ . 1978. "Causes of the Slow Rate of Growth in the U.K." In Essays in Economic Theory. London: Duckworth.

338 BIBLIOGRAPHY
Katz, D. F. 1986. "Efficiency Wage Theories: A Partial Evaluation." Working Paper No. 1906, National Bureau of Economic Research, Cambridge, Mass.
Keesing, D. B. 1 967. "Outward-looking Policies and Economic Development." Economic Jourru:zl 77:303-20.
Kelley, M. E. 1 986. "Programmable Automation and Skill Questions: Rei�terpretation of the Cross-National Evidence." Human Systems Management, November.
Kemp, T. 1985. 1ndustrialiwtion in Nineteenth-Century Europe. London: Longmans.
Kim, C. I. E. 1 962. "Japan's Rule in Korea (1905- 1 91 0): A Case Study." Proceedings of the American· Philosophical Society 1 06.
Kim, C. J. 1982. "The Role of Technology in Economic Development: The Korean Case." In Business Laws in Korea: Investments, Taxation, and Industrial Property. Seoul: Pan-mun Book.
__ . 1987. "The High Technology Industrial Drive of' the Republic of Korea." B.S. Thesis, Massachusetts Institute of Technology, Boston.
Kim, C. K. 1 98 1 . "Industrial Policy and Small and Medium Industries in Korea." Working Paper No. 19, Korea International Economics Insti-tute, Seoul. -
__ , and C. H. Lee. 1 980. "Ancillary Firm Development in the Korean Automotive Industry," -Korea International Economics Institute. Seoul.
Kim, E., and D. Mortimore. 1 977. Korea's Response to Japan: The Colonial Period 1910-1945. Kalamazoo, Mich.: Western Michigan University Press.
Kim. H. 197 1 . "Land Use Policy in Korea: With Special Reference to the Oriental Development Company." Dissertation, University of Washington, Seattle.
Kim, H. H. 1 980. The Last Phase of the East Asian World Order: Korea, Japan, ' and the Chinese Empire, 1860-1882. Berkeley, Calif. : University of California Press.
Kim, J. B. 1 966. "The Korean Cotton Manufacturing Industry." Dissertation, University of California, Berkeley.
Kim, J. E. 1973. "An Analysis of the National Planning Process' for Educational Development in the Republic of Korea, 1 945-70." Dissertation, University of Pittsburgh.
Kim, J. W. 1983. "Subcontracting, Market Expansion and Subcontracting Activities Pr<?motion-The Case of Korea's Machinery Industry," Working Paper 8305, Korea Development Institute, Seoul.
Kim, K.-D. 1976. "Political Factors in the Formation of the Entrepreneurial Elite in South Korea." Asian Survey 16 (5):465-77.
__ . 1985. "The Distinctive Features of South Korea's Development." Mimeo, Department of Socioiogy, Seoul National University.
Kim, K. S. 1 967. "An Appraisal of the High Interes.t Rate Strategy in Korea." Paper presented at Williams College, Williamstown, Mass _
__ . 1985. "Industrial Policy and Industrialization in South Korea: 1 96 1 -1982." Lessons on Industrial Policy for Other Developing Countries, Working Paper 39, January, Kellogg Institute, University of Notre Dame. Notre Dame, Ind.

Bibliography 339
___ , and M. Roemer. 1979. Growth and Structural Transformation. Harvard East Asian Monograph. Cambridge, Mass.: Harvard University Press.
Kim, K. Y. 1984. "American Technology and Korea's Technological Development." In From Patron to Partners: The Development of U.S.-Korea Business and Trade Relation.r, K. Moskowitz (Ed.). Lexington, Mass.: Lexington Books.
Kim, S. 1 982a. "Contract Migration in the Republic of Korea." Working Paper MIG WP 4, International Labour Office, International Migration for Employment Branch, Geneva.
" ___ . 1982b. "Employment, Wages and Manpower Policies in Korea: The Issues." Working Paper Series 82-04, Korea Development Institute, Seoul.
Kim, S. J. 1983. "Evaluation of and Reform Proposals for Promotion Policies in the Korean Machinery Industry." Working Paper Series 83-06, Korea Development Institute, Seoul.
Kim, S. K. 1987. "Business Concentration and Government Policy: A Study of the Phenomenon of Business Groups in Korea, 1945- 1985." Dissertation, Harvard Business School, Boston.
Kim, Y. B. 1 980. "The Growth and Structural. Change of the Textile Industry." In Macroeconomic and Industrial Droelopment in Korea, C. K. Park (Ed.). Vol. 3 of Essays on the Korean Economy. Seoul: Korea Development Institute.
Kindleberger, C. P. 1967. Europe's Postwar Growth: The Role of Labor Supply. Cambridge, Mass.: Harvard University Press.
"
Koh, S. J. 1966. Stages of Industrial Droelopment in Asia: A Comparative History of the Cotton Industry in Japan, India, China, and Korea. Philadelphia: University of Pennsylvania Press.
Koo, B. Y. 198 1 . "Role of Foreign Direct Investment in Recent Korean Economic Growth." Working Paper No. 8 104, Korea Development Insti-tute, Seoul. .
Korea Advanced Institute of Science. 1976. Technological Behavior of the Petrochemical, Metallurgical and Electronics Industries in Korea. Phase Three Report, Korean Science Technology Policy Instruments Project, Proe gram in Science, Technology and Society, Seoul.
Korea Development Bank. 1984. Industry in Korea. Seoul: Korea Development Bank.
Korea Exchange Bank. 1980. "Adjustment of Korea's Heavy and Chemical Industry Investment." Monthly Review 14: 1-2 1 .
__ . 1 983. The Korean Economy, Review and Prospects. 5th ed. Seoul: Korea Exchange Bank.
.
Korea Institute for Educational Development. 1983. "Study on the Demand and Supply of Science and Engineering Manpower at Master's and Ph.D. Levels." Mimeo, Seoul.
Korea Institute for Industrial Economics and Technology. 1982. The Heavy Machinery Industries of Korea: Problems and Prospects, Final Report. Mimeo, Seoul.
Korea Shipbuilding Association. 1980. "A Seminar on the Technology and Productivity Improvements in Shipbuilding." Mimeo, Pusan.
Korea Traders Association. 1987. "How to Increase U.S. Exports to Korea.

340 BIBLIOGRAPHY
Report of a Survey of Korean Business Executives." Seoul: Korea Traders Association.
Krueger, A. B., and L. H. Summers. 1986a. "Reflections on the Inter-industry Wage Structure." Discussion Paper No. 1 252, Harvard Institute of Economic Research, Cambridge, Mass.
__ . 1986b. "Efficiency Wages and the Wage Structure." Working Paper No. 1952, National Bureau of Economic Research, Cambridge, Mass.
Krueger, A. O. 1 979. The Devel�tal Role of the Forti?:" Sector and Aid. Cambridge, Mass.: Harvard University Press.
Kublim, H. 1959. "The Evaluation of Japanese Colonialism." In Comparative Studies in Society and History. Vol. 2.
Kubo, Y., J. de Melo, and S. Robinson. 1 986. "Trade Strategies and . Growth Episodes." In Industrialization and Growth, H. Cherney, et al. (Eds.). New York: Oxford University Press (for World Bank).
Kuznets, S. 1966. Modem Economic Growth. New Haven, Conn.: Yale University Press.
Kwon, T.-h., et al. 1975. The Population of Korea. Seoul: Population and Development Studies Center, Seoul National University.
Lall, S. 1987. Learning to Industrialize: The Acquisition of Technological Capability in India. London: Macmillan.
Landes, D. S. 1 969. The Unbound Prometheus, Technological Change and Industrial Development in Western Europe from 1 750 to the Present. Cambridge, England: Cambridge University Press.
Lau; L. J. (Ed.). 1986. Models of Development: A Comparative Study of Economic Growth in· South Korea and Taiwan. San Francisco: Institute for Contemporary Studies.
Lebergott, S. 1966. "Labor Force and Employment, 1800-1960." In Output, Employment, and Pmductivity in the U.S. After 1800. Vol. 30 of Studies in Income and Wealth. Proceedings of Conference on Research on Income and Wealth. New York: National Bureau of Economic Research.
Lee, C. S. 1963. The Politics of Korean Nationalism. Los Angeles: University of California Press.
Lee, H.-B. 1968. Korea: Time, Change and Administration. Honolulu: East-West Center Press.
Lee, H . K. 1936. Land Utilization and Rural Economy in Korea. Chicago: University of Chicago Press.
Lee, J. 1987. "Market Performance in an Open Developing Economy: Technical and Allocative Efficiencies of Korean Industries." Journal of Irulustrial Economics 35:8 1-96.
Lee, J. W. 1983. "Economic Development and Wage Inequality in South Korea." Dissertation, Harvard University, Cambridge, Mass.
Lee, K.-U., S. Urata, and I. Choi. 1986. "Recent Developments in Industrial Organizational Issues in Korea." Mimeo, Korea Development Institute and World Bank, Washington, D.C.
Lee, K.-W. 1983. "Human Resources Planning in the Republic. of Korea: Improving Technieal Education and Vocational Training." Staff Working Paper No. 554. World Bank, Washington, D.C.

Bibliography 341
Lee, Y. K., et al. (Eds.). 1 97 1 . History of People Living in Korea under Japanese Occupation. Seoul: Minjung Seokwan.
Leff, N. H. 1 978. "Industrial Organization and Entrepreneurship in Developing Countries: The Economic Groups." Economic Development and Cul-tural Change 4:661-75. .
__ . 1979a. "Entrepreneurship and Economic Development: The Problem Revisited." Journal of Economic Literature 17:46-64.
__ . 1979b. " 'Monopoly Capitalism' and Public Policy in Developing Countries." Kyklos 32 (4) :718-38.
'
Leipziger, D. M. (Ed.). i988. "Korea: Transition to Maturity." Special Issue, World. Devel�t 16 ( 1 ) .
Levy, M. J. Jr. 1966. Modernization arul the Structure of Society. Princeton, N .]. : Princeton University Press.
Lewis, W. A. 1 954. "Economic Development with Unlimited Supplies of Labour." In The Economics of Underdevel&pment, A. N. Agarwala and S. P. Singh (Eds,). London: Oxford University Press.
Lim, Y. 1981 . Government Policy and Private Enterprise: Korean Experience in Industrialization. Korea Research Monograph No. 6, Institute of East Asian Studies, University of California, Berkeley.
Lindauer, D. L. 1984. "Labor Market Behavior in the Republic of Korea: An Analysis of Wages and Their .Impact on the Economy." Staff Working Paper No. 641 , World Bank, Washington, D.C.
Linden, P., and J , G. Williamson. 1983. "English Workers' Living Standards during the Industrial Revolution: A New Look." Economic History Review 36: 1-25.
Lipsey, R. E., and 1. B. Kravis. 1985. "The Competitive Position of U,S. Manufacturing Firms." Banca Nationale del Lavoro Quarterly Review' 153: 127-54.
List, F. 1 956. National System of Political Economy. Philadelphia: J. B. Lippincott.
Lloyd's Register of Shipping. Various years. Shipping Economist. London. Lucas, R. E. B. 1986. "An Overview of the Labor Market in India." Devel
opment Research Department, Economics and Research Staff, Discussion Report No. DRD1 53, World Bank, Washington, D.C.
Luedde-Neurath, R, 1986. Import Controls and Export-oriented Development: A Reassessment of the South Korean Case. Boulder, Colo.: Westview.
Maddison, A. 1982. Phases of Economic Devel�t. Oxford, England: Oxford University · Press.
Maizels, A. 1963. Industrial Growth and World Trade. Cambridge, England: Cambridge University Press.
Mansfield, E., et al. 197 1 . Research and Innovation in the Modern Corporation. New York: W. W. Norton.
" Marx, K., and F. Engles. 196 1 . On Colonialism. London: Lawrence and Wishart.
Maschke, E. 1969. "Outline of the History of German Cartels from 1873 to 19 14." In Essays in European History 1 789-1914, W. H. Crouzet, 'et a!. (Eds.). New York: St. Martins.
342 BIBLIOGRAPHY
Mason, E. S., et al. 1980. The EconlYmic and Social Modernizaticm of the Republic of Korea. Cambridge, Mass.: Harvard University Press (for Council on East Asian Studies, Harvard University).
Mathias, P. 1969. The First Industrial Revolution. New York: Charles Scribner. McCraw, T. K. 1 986. "Mercantilism and the Market: Antecedents of Amer
ican Industrial Policy." In The Politics of Industrial Policy, C. E. Barfield and W. E. Schambra (Eds.). Washington, D.C.: American Enterprise Institute for Public Policy Research.
'
McGinn, H. F., et al. 1 980. Education and Develofrment in Korea. Cambridge, . , Mass. : Harvard University Press (for Council on East Asian Studies, Harvard University).
McHugh, J. 1 980. Alexander Holley and the Makers of Steel. Baltimore; Md.: Johns Hopkins University Press.
McKenzie, F. A. 1920. Korea's Fight for FreedlYm. London: Simpkin, Marshall. Melman, S. 195 1 . "The Rise of Administrative Overhead in the Manufac
turing Industries in the United States 1899- 1947." Oxford EconlYmic Papers NS 3:62-1 12.
Minami, R. 1973. The Turning Point in Economic Development: japan's Experience. Economic Research Series No. 14, Institute of Economic Research, Hitotsubashi University, Tokyo.
Ministry of Education. Various years. Statistical Yearbook of E{lucation. Seoul: Ministry of Education.
_" __ . Various years. Educational Annals. Seoul: Ministry of Education. Ministry of Labor. Various years. Yearbook of Labour Statiftics. Seoul: Ministry
of Labor. .
Ministry of Science and Technology. 1987. Introduction to Science and Technology. The Republic of Korea. Seoul: Ministry of Science and Technology.
__ '
_. Various years. Handbook. Seoul: Ministry of Science and Technology. Mintzberg, H. 1979. The Structuring of Organizations. Englewood Cliffs, N.J :
Prentice Hall. Mitsubishi Economic Research Bureau. 1 936. Japanese Trade and Industry:
Present and Future. London: Macmillan. '
Mitsubishi Research Institute. 1 986. Case Studies on the Trend of japan-Korea Internaticmal Division of Labor in the 1980s. Tokyo: NIRA.
Mizoguchi, T. 1 979. "Economic Growth of Korea under the Occupation: Background of Industrialization of Korea." jou.rnal of EconlYmics 20 (1): 1-19.
.
Mody, A. 1986. "Recent Evolution of Microelectronics in Korea and Taiwan: An Institutional Approach to Comparative Advantage." Mimeo, AT&T Bell Laboratories, New Jersey.
Moore, B. Jr. 1966. Social Origins of Dictatorship and Democracy. Boston: Beacon Press.
Moskowitz, K. 1974. "The Creation of the Oriental Development Company: Japanese Illusions Meet Korean Reality." In Occasional Papers on Korea, No. 2, J. B. Pallais (Ed.). Joint Committee on Korean Studies of American Council of Learned Societies ,and Social Science Research Council, University of Washington, Seattle.

Bibliography 343
__ . 1979. "Current Assets: The Employees of japanese Banks in Colonial Korea." Dissertation, Harvard University, Boston.
Mueller, W. F. 1982. "Conglomerates : 'A Nonindustry." In The Structure of American Industry, W. Adams (Ed.). 6th ed. New York: Macmillan.
Musgrave, P. W. 1967. Technical Clw.nge in the Labour Force and Education: A Study of the British and German Iron and Steel Industries 1 860-1964. Oxford, England: Pergamon.
Myers, R. 1:1., and M. R. Peattie (Eds.). 1984. The japanese Colonial Empire 1895-1945. Princeton, N .J. : Princeton University Press.
Myim, H. 1 964. The Economics of the Developing Countries. New York: Praeger. Nahm, A. (Ed.). 1973. Korea under japanese Colonial Rule: Studies of the Policy
and Techniques of Japanese Colonialism. Kalamazoo, Mich. : Center for Korean Studies, Western Michigan University.
Nakagawa, K. 1986. "Government and Business in japan: A Comparative Approach." In Government and Business, K. Nakagawa (Ed.). Tokyo: University of Tokyo Press.
Nakamura;]. 1. 1974. "Incentives, Productivity Gaps, and Agricultural Growth Rates in Prewar japan, Taiwan and ,Korea." In japan in Crisis, B. S. Silberman and D. H. Harootunian (Eds.). Princeton, N.J : Princeton University Press.
Nam, S. W. 1 980. "The Dynamics of Inflation." In Macroeconomic and Industrial Development in Korea, C. K. Park (Ed.). Vol. 3 of Essay.! on the Korean Economy. Seoul: Korea Development Institute.
Nath, S. K. 1962. "The Theory of Balanced Growth." In Economic Policy for Development, 1. Livingstone (Ed.). Middlesex, England : Penguin.
Nelson, R. L. 1959. Merger Movements in American Industry. New York: Na-tional Bureau of Economic Research.
'
Nelson, R. R. 198 1 . "Research on Productivity Growth and Productivity Differences: Dead Ends and New Departures." j{fUrnai of Economic Literature 19: 1029-64.
__ . 1987. "Innovation and Economic Development, Theoretical Retrospect and Prospect." In Technology Generation in Latin American Manufacturing Industries, J. M. Katz (Ed.). New York: St. Martin's.
__ , and S. G. Winter. 1982. An Evolutionary Theory of Economic Change. Cambridge, Mass.: Belknap.
Nw York Times. 1987. "japan's Neighbors in Asia Benefit from Rise of Yen." August 24, p. lAo
Noble, D. F. 1977. America by Design: Science, Technology and the Rise of Corpora.te Capitalism. Oxford, England: Oxford University Press.
Norton, R. D., and S. Y. Rhee. 1980. "A Macroeconomic Model of Inflation and Growth." In Macroeconomic and Industrial Development in Korea, C. K. Park (Ed.). Vol. 3 of Essays on the Korean Economy. Seoul: Korea Devel-opment Institute.
'
Ohkawa, K., and H. Rosovsky. 1973. japanese Economic Growth: Trend Acceleration in the Twentieth Century. Stanford, Calif.: Stanford University Press.
Ohlin, G. 1967. Population Control and Economic Development. Paris: Development Centre of Organization for Economic Cooperation and Development

344 BIBLIOGRAPHY
Ohno, T. 1984. "How the Toyota Production System Was Created." In The Anatomy of Japanese Business, K. Sato and Y. Hoshino (Eds.). Armonk, N.Y: M. E. Sharpe.
Orchard, J. E. 1930. Japan's Economic Position. New York: McGraw-Hili. Organization for Economic Cooperation and Development. 1970. Inflation:
The Present Problem. Report by the Secretary General, Paris. Osterman, P. (Ed.). 1984. Internal Labor Markets. Cambridge, Mass. : MIT
Press. Ozawa, T. 1974. Japan's Technological Challenge to the West, 1950-1974; Mo
tivation and Accomplishment. Cambridge, Mass.: MIT Press. PaineWebber. 1985. POSCO; Korea's Emerging Steel Giant. World Steel Dy
namics Core Report, V, New York. Paldam, M., and L. A. Riveros. 1987. "The Causal Role of Minimum Wages
in Six Latin American Labor Markets." Report No. DRD270, Economics and Research Staff, Development Research Department, World Bank, Washington, D.C.
Pallais, J. B. 1975. Politics and Policy in Traditional Korea. Cambridge, Mass.: Harvard University Press.
__ . 1986. Human Rights in Korea. Asia Watch Report, Washington, Di.C. Park, C. H. 1962. Our Nation's Path: Ideolo{!;Y for Social Reconstruction. Seoul:
Dong-A. __ . 1963. The Country, the Revolution and I. Translated by L. Sinder. Seoul:
No publisher. Park, Y. C. 1985.· .. Korea·s Experience with External Debt Management." In
International Debt and the Developing Countries, . G. Smith and J. Cuddington (Eds.). Baltimore, Md.: Johns Hopkins University Press.
Parker, W. N. 1984. Europe, America, and the Wider World: Essays on the Ecl)nomic History of Western Capitalism. Vol. 1 of Europe and the World Economy. Cambridge, England: Cambridge University Press.
Patrick, H., and H. Rosovsky. 1976. "japan's Economic Performance: An Overview." In Asia's New Giant: How the Japanese Ecorunny Works, H. Patrick and H. Rosovsky (Eds.). Washington. D.C.: Brookings Institute.
Pearse, A. S. 1929. The Cotton IndUstry of Japan and China. Manchester, England: International Cotton Federation.
Piore, M. J., and C. F. Sabel. 1984. The Second Industrial Divide. New York: Basic Books.
Pohang Iron and; Steel Co. Ltd. 1984. POSCO: A Graphic History. Pohang, South Korea: ' Pohang Iron and Steel Co. Ltd.
Psacharopoulos,'·G. 1 985. "Returns to Education: A Further International Update and I,!,plications." Journal of Human Resources 20:583-604,
Reeve, W. D. 1963. The Republic of Korea; A Political and Economic Study. London: Oxford University Press.
Reynolds, L. 1985. Economic Growth in the Third World, 1850-1980. New Haven, Conn.: Yale University Press.
Rhee, Y. W., B. Ross-Larson, and G. ,Pursell. 1984. Korea's Competitive Edge: Managing the Entry into World Markets. Baltimore, Md.: Johns Hopkins University Press.
Richardson, R., and B. Y. Kim. 1986. The Structure of Labor Markets in LDCs:

Bibliography 345
Overview for South Korea, 1 953-1984. Discussi.on Paper. Rep.ort ND. DRDI62. ECDnDmics and Research Staff. Devel.opment Research Department. WDrid Bank, WashingtDn. D.C.
RDsenberg, N. 1972. Technology and American Econoniic Growth. New Y.ork: M. E. Sharpe.
__ ._. 1976. Perspectives on Technology. Cambridge. England: Cambridge University Press.
R.ost.ow. W. W. 1960. The Stages of Economic Growth: A Non-Communist Manifesto. Cambridge, England: Cambridge University Press.
Sabel, C. F. 1 982. Work and Politics. Cambridge, England: Cambridge University Press.
__ I and J. Zeitlin. 1985. "Hist.orical Alternatives t.o Mass Pr.oducti.on: PDlitics, Markets. and Techn.ol.ogy in Nineteenth Century �ndustrializati.on." Past and Present 108: 133-76.
Sachs. J. D. 1 987. "Trade and Exchange Rate PDlicies in Gr.owth-.oriented Adjustment Pr.ograms." IMF-IBRD Symp.osium .on Gr.owth-.oriented Adjustment Pr.ograms, Washington. D.C., February 25-27.
Samuel. R. H . • and R. H. Th.omas. 1 949. Education and Society in Modern Getmany. LDndon: Rutledge & Kegan Paul.
Sanches-AlbDrnDz, N. 1974. The Population of Latin America: A History. Berkeley, Calif. : University .of CalifDrnia Press.
Scherer, F. M. 1986. "On the Current State .of Knowledge in Industrial Organization." In Mainstreams in /ruJ,ustrial Organiwtion. B.ook I. Theory and International Aspects, H. W. de Jong and W. G. Shepherd (Eds.) . Dordrecht, Holland: Kluwer.
Schonberger. R. J 1982. Japanese Manufacturing Techniques. New York: Free. Press.
Schumpeter. J. A. 1938. The Theory of Economic Development. Cambridge, Mass.: Harvard University Press.
Scott. B. R. 1985. "NatiDnal Strategies: Key tD International CDmpetition." In U.S. Competitiveness in the World Economy, B. R. SCDtt and G. C. LDdge (Eds.). BDston: Harvard Business SchDDI Press.
Shefter, M. 1986. "Trade UniDns and PDlitical Machines: The Organization and DisDrganization .of the American WDrking Class in the Late Nineteenth Century," In Working-Class Formations: Nineteenth-Century Patterns in Western Europe and the United States, I. KatznelsDn and A. R. ZDlberg (Eds.). PrincetDn, N.J. : Princet.on University Press.
Shepherd, W. G. 1 986. "On the CDre CDncepts .of Industrial Economics." In Mainstreams in Industrial Organization. BDDk I. Theory and International Aspects, H. W. de Jong and W. G. Shepherd (Eds.). DDrdrecht, HDlland: Kluwer.
Shiba, T. 1986. "A CDmparative Study .of the Managerial Structure .of TWD Japanese Shipbuilding Firms: Mitsubishi Shipbuilding and Engineering CD. and Kawasaki pDckyard CD . • 1896-1927." in Development of Managenal Enterprise, K. K.obayashi and H. Morikawa (Eds.). TDkYD: University .of TokYD Press.
Shipping World and Shipbuilder. 1985. "SDuth KDrea." LondDn. NDvember. Shoichi, F. 1 970. "Capitalism. InternatiDnal PDlitics and the EmperDr Sys-

346 BIBLIOGRAPHY
tem." In The Emergence of Imperialjapan: Self Defense or Calculated Aggressioo?, M. Mayo (Ed.). Lexington, Mass. : D. C. Heath.
Shonfield, A. 1965. Modern Capitalism: Th£ Changing Balance of Public and Private Power. London: Oxford University Press.
Short, R. P. 1984. "The Role of Public Enterprises: An International Comparison." In Public Enterpri.fe in Mixed Economies: Some Macroeconomic Aspects, R. H. Floyd, O. S. Gray, and R. P. Short (Eds.). Washington, D.C.: International Monetary Fund.
Smith, A. D: (Ed.). 1967. Wage Policy Issues in Economic Development. London: Macmillan.
Sombart, W. 1933. The History of the Economic Institution of Modern Europe. New York: F. S. Crafts. '
Souza, P. R. 1978. "Wage Disparities in the Urban Labour Market." CEPAL Review, January-June, pp. 199-224.
Spence, M. 1983. "Reviewing Contestable Markets and the Theory of Industry Structure." journal of Ecooomic Literature 2 1 :98 1 -90.
Standing, G. 1978. Labour Force Participation and Devel<1Jment. Geneva: International Development Office.
Statistics Bureau. Various years. japan Statistical Yearbook. Tokyo: Statistics Bureau.
Stern, F. 1 977. Gold and Iron: Bismarck, Bleiehroder and the Building of the German Empire. New York: Knopf.
Stigler, C. 195 1 . "The Division of Labor Is Limited by the Extent of the ·Market." journal of Political Econcmy, June.
Suh, S.-C. 1978. Growth and Structural Change in th£ Korean Economy, 1919-1940. Cambridge, Mass.: Harvard University Press.
Suh, S. M. , and Y. H. S. Cheong. 1 986. "Structural Adjustment and Social Welfare in Korea." Mimeo, Korea Development Institute and World Bank, Washington, D.C.
Sumiya, M. 1974. "The Emergence of Modern Japan." In Workers and EmplcryeTS in japan, K. Okochi, B . Karsh, and S. B. Levine (Eds.). Princeton, N.J.: Princeton University Press.
Taylor, A. J. 1972. Laissezjaire and State Intervention in Britain. London: Macmillan (for Economic History Society).
Tewksbury, D. G. 1950. Source Materials on Korean Politics and Ideologies. New York: Institute of Pacific Relations.
Thurow, L. C. 1.987. "Economic Paradigms and Slow American Productivity Growth." Mimeo, Massachusetts Institute of Technology, Cambridge.
Toshiyuki, M., and Y. YUlO. 1984. "Capital Formation in Taiwan and Korea." In The japanese Col&nial Empire, 1895-1945, R. H. Myers and M. R. Peattie (Eds.). Princeton, N.J: Princeton University Press.
Tsurumi, E. P. 1984. "Colonial Education in Korea and Taiwan." In The japanese Colordal Empire, 1895-1945, R. H_ Myers and M. R. Peattie (Eds.). Princeton, N.J . : ·Princeton University Press.
United Nations. 1960. Pa.tterns of Industrial Growth, 1938-58. New York: U.N. Department of Economic and Social Affairs.
___ 1979. The 1973 World Programme of Internatipnal Statistics. Sum11UtrJ of Datafrom Selected Countries. New York: U nited Nations.

Bibliography 347
--. 1982. International Migration Policies and Programmes: A World Survey. . ST/ESKJSER.A/80. New York: United Nations.
__ . Various years. Statistical Yearbook. New York: United Nations. United States Department of Commerce. Various years. Statistical Abstract of
tile United States. Washington, D.C.: Government Printing Office. United States Embassy. 1986. "Has the United States Been Negotiating Im
proved Korean Market Access for Japan?" Mimeo, Seoul, United States House of Representatives. 1954. Relief and Rehabilitation in Ko
rea. 83rd Congress, 2nd Session, House of Representatives 2574. Washington, D.C. : Government Printing Office.
Veblen, T. 1 965. Imperial Germany and Industrial Civilization. 1915. New York: Viking.
Vogel, E. 1985. "Shipbuilding: High-Priority Basic Industry." Comeback. New York: Simon and Schuster.
Weems, B. B. 1964. Reform, RebellWn and the Heavenly Way. Tucson, Ariz. : University of Arizona Press.
Weems, C. N. Jr. 1.954. The Korean Reform and Independence Movement. Dissertation, Columbia University, New York.
Westphal, L., and K. S. Kim. 1982. "Korea." In Development Strategies in Semiindustrial Countries, B . Balassa, et al. (Eds.). Baltimore, Md.: Johns Hopkins University Press.
__ , L. Kim, and C. J. Dahlman. 1985. "Reflections on the Republic of Korea's Acquisition of Technological Capability." In International Technology Transfer: Concepts, Measures, and Comparisons, N. Rosenberg and C. Frischtak (Eds.), New York: Praeger.
Westphal, L. E. 1978. "The Republic of Korea's Experience with Export Led Industrial Development." World Development 6 (3):347-:82.
Whang, I.-J. 1986. "Korea's Economic Management for Structural Adjustment in the 1980s. " · Korea Development Institute and World Bank, Washington, D.C.
Williamson, O. E. 1985. The Economic Institutions of Capitalism. New York: Free Press.
.
Woo, K. D. 1 978. "Wages and Labor Productivity in the Cotton Spinning Industries of Japan, Korea and Taiwan." Developing Economies 16: 1 82"": 98.
Woodruff, W. 1.973. "The Emergence of an International Economy, 1 700-1914." In The Emergence of Industrial Societies. Vol. 2 of The Fontana Economic History of Eurape, C. M. Cipolla (Ed.). Fontana: Collins.
World Bank. 1987. Korea: Managing the Industrial Transaction. Vols. 1 and 2. Washington, D.C.: World Bank.
__ . Various years. World Development Report. Washington, D.C.: World Bank.
.
Yamazawa, I. 1 982. "Renewal of the Textile Industry·in Developed Countries and World Textile Trade." HitotsubashiJournal of Economics 24:25-42.
Yaslloka, S. 1 984. "Introduction." In Family Business in the Era of Industrial GT.owth: Its Ownership and"Management, S. Yasuoka (Ed.). Tokyo: University of Tokyo Press.

348 BIBLIOGRAPHY
Yelle, L F. 1979. "The Learning Curve: Historical Review and Comprehensive Survey." Decision Sciences 1 0:302-28.
Yonekawa, S. 1984. "University Graduates in Japanese Enterprises I;lefore the Second World War." Business History 26: 1 93-2 18.
Yoo, J. H. 1983. "Korea's Experience and Prospects." In Northeast Asia and the United States: Defense Partnerships and Trade Rivalries, R. F. Kosobudo (Ed.). Chicago: Chicago Council on Foreign Relations.
Young-Hwa, K. 1986. "Education and Male-Female Earnings Inequality in the Structured Labor Market: A Case Study of Korea." Dissertation, Stanford University, Stanford, Calif.
Zymelman, M. 1 980. Occupational Structures of Industries. Washington, D.C.: World Bank.
Korean and Japanese Works CUed Ahn, B. J., et .al. 1980. Han'guk kilndae minjok undongsa [The History of tIle
Korean National Movements in Modern Ages). Seoul: Dol pegae. Amsden , A. H. 1988. Han'gukil; kyOngjehalchlm: Angjlmggwa chaejojongch'aek
(Wider Country Study, Republic of Korea). Seoul: Srsayongasa Publi�hers. Cho, K. J. 198 1 . Han'guk chabonjuiii songnip saron [Discourses on the Formative
History of Korean Capitalism). Rev. ed. Seoul: Taewangsa. Choi, H . J . 1 986. "Han-Mi t'ongsang kkolkkiinroun macharum" ["Korea
U.S. Trade: 'Troublesome Frictions' "]. Tonga Ilbo [Dong-A Daily), December 16.
Choo, H. J. 1987. "Sodiik punbae" ["Income DiSEribution"]. In Han'guk kymgje ui iron kwa hyUnsil [Theories and Facts of the Korean Economy), S. Cho, H. J. Choo, et al. (Eds.). Seoul: Seoul National University Press.
CJwson Ilbo (Cho-Sun Daily). 1 986. "Haeoe konsol suju choeak" ["The 'Worst Overseas Construction Order' "]. July 25.
__ . 1987. "Mi, sijang kaebang punya-byol hy6psang yogu" ["U.S. Asked Market-oriented Sector-Specific Negotiation"]' July 2 1 .
Chungang ILbo (Choong-Ang Daily). 1 986. "Unhaeng poyu pusH ch'i/-ekwon samnyon sihan chongni" ["Bad Debts of Commercial Banks To Be Cleared within Three Years"]. February 24.
Chuilgbu, H. 1976. Cke sach'a o-gaenyiin kyongje kyeMek, 1977-81 (Government of the Repub#c of Korea, Economic DeveLQj»nent Plan, 1977-1981). Seoul.
Chiinggwon Kaindogwon [Securities Supervisory Board]. 1984. Chabon sijang changgi palcMn panghyang (Long-Term DevelQj»nent Plan for Securities Market). Seoul: Chiinggwon Kamdogwon.
Donga Ilho (Dong-A Daily). 1986a. "Chejo6p s6lbi t'uja kyongjaeng" ["Competition for Capacity Expansion in Manufacturing -Industry"]. March 3.
__ . 1986b. "Kukche kyey6\ sagae kiop chongni" ["Clearing of 4 Subsi-diaries of Kook-Je ICC Group"]. June 27. .
__ . 1986c. "Chejoop kadongyul chilsipgu-nyon irae ch'oego" ["The Highest Operating Ratio of Manufacturing Industry since 1979"]. July 12.
__ . 1986d. "Taegi6p munobal hwakchang yojon" ["On-Going Expansion by Chaebol"]. July- 28.

Bibliography 349
1986e. "CMnja Opkye umji s3 yangji toetta" ["Electronics Industry Turns from Dark to Bright Side"). August 30.
__ . 1986f. "Chaebol kurup chikcMp sangho ch'ulcha kumji" ["Ban on Chaebols' Cross-Investment") . September 3 . .
__ . 1986g. "ChOngni nun hajiman cMngsanghwa ka munje" ["Impending Problem of Recovery after Rationalization"). September 22.
__ . 1986h. "Ch3nja, sinbal tung ilbu 6pchong iUyok nan" ["Hard to Find Workers in 'Such Industries as Electronics, Shoe, Etc."]' Decem-ber 18 . ,
__ . 1987. "Taejol sir6p k'ugye nunda" ["Unemployment of College Graduates Greatly Increases"). July 15.
Federation of Korean Industries. 1984. "Sanop kisul kaebal chosa" ["Industrial Technology Development Survey"). Seoul.
Han, G. E. 1973. Han'guk sasang kwa kyoyuk [Ken-ean Ideology and Education]. SeQul: Ilchogak. "
Han, W. K. 1977. Han'r;uJt t'ongsa [The History of K,Orea}. Seoul: Ulyu Munhwasa.
Han'guk cholgang yonhap [Korea Steel Association). 1980. Ch'olgang pogoso [Steel Report}. Seoul: Korea Steel Association, October.
Han'guk Ilbo [Han-Kook Daily}. 1986a. "Chaebol kyongjery6k chipchung man kasokhwa" ("Acceleration of Economic Concentration by Chaebol"). November 16. '
__ . 1 986b. '''Haeun opkye i-dan'gye chongni ch'aksu" ["Start of Second Round Rationalization of Shipping Industry"]' December 4.
__ ._. 1986c. "K6nsol opkye orhae haeoe sujuaek isipok lalla nomchi mothal tut" ["The Overseas Construction Order of This Year Is Expected to Be Less Than $2 Billion"). December 17.
__ . 1987. "Kiop sollip e obaek sam sip i\ kollinda" ["It Takes 530 Days to Establish a Firm"). August 6.
Han'guk Ky!$ngje Sinmun {Korea Economic Daily}. 1987. "Muyok oe korae hasun put'o taep'ok chayuhwa'" ("Large Scale Liberalization of Noncommodity Transactions") . July 1 I .
Han'guk kyoyuksa yonguhoe [Association for Study of History of Education). 1972. Han'guk kyoyuksa [History of Korean Education}. Seoul: Education Publishers',
Han'gu� .. Saengsansong Cent'a [Korea Productivity Center). 1985. Uri nara sanop ui saengsansong hyonhwang kwa apuro ui kwaje. [Situation of Productivity Level in Korea's In;dustry and Future Task}. Seoul: Korea Productivity Center.
Hattori, T. 1 984. "Kodoseichoki ni akenu Sangyo no Keisei: Kankoku no Zirej, 1 962, 78" [The Formation of Industrial Elites in the Era of Rapid Growth: The Case of Korea, 1 962-78). In Hatten Tlljyokoku no Business Leadership {Business Leadership in Developing Countries}. Tokyo: Asia Keizai Kenkyu zyo.
Kim, C. K., J. S. Yoo, and K. C. Whang. 1984. Han'guk Taeman Ilbon ui Chejoijp saengsangSOng puns3k {The Analysis of Manufacturing Productivity in Korea, Taiwan, and Japan]. Seoul: Hangyang University. Institute for Economic Research.
Kim, C.-L. 1 964. "!?uj6ng ch'ukchae ch'ori chOnmalso" ["Report on the Re-

350 BIBLIOGRAPHY
verse Policy toward Illicit Accumulation of Wealth'l Sindon:ya, December.
Kim, D. G. 1986. "Chaejongui Ky6ngjiksonggwa hy'oyuls6ng" ["Inflexibility and Efficiency of Fiscal Policy"]. In Han'guk kyangje samsip samjeui insik [Rec{)gnition of 33 Issues of the Korean Economy}. Seoul: Taechakyo Ch'ulpanbu.
Kim, H. K. 1985. "Kyongje kaebal kwa kukka iii yokhal e kwanhan yongu" ["A Study of Economic Development and the Role of the Government). In Han'guk chabonJuui wa kukka [Korea Capitalism and Nation], J .-J. Choi (Ed.). Seoul: Han-Wool.
Kim, K. M. 1987. "Chujok: oehwa top'i" ["Investigation: Capital Flight"}. Sin Tonga, June.
Kim, S. 1976. Nodong konggilp kwa siriip kujo [lAbor Force Belw.vioT and Unemployment in Korea]. Seoul: Korea Development Institute.
Kim, S. W. 1986. ["Shipbuilding Industry Endeavors to Lose Weight"]. In Maeil Kyi5ngje Sinmun [Daily Economic News], October 3.
Kim, Y. B. A. 1975. Uri naTa kyqyuk 1li suyo hyongt'ae mit kyangje si5ngjang kiyOdo (Oemand Pattern and Contribution to Economic Development). Seoul: Korea Development Institute.
__ . 1979b. Han'guk 1li kalla TV kongiip (flU! Korean Color TV Industry]. Seoul: Korea Development Institute.
Kim, Y. C., and E. B: Kong. 1983. Kyqyuk ili kyongje palchOn e taelw.n kiyo {Contribution of Education to ECD!W1llic Development}. Seoul; Korea Education Development Institute.
Kim, Y. H . 1970. Han'guk nodong undongsa [History of Korea's Labor Movement]. Seoul: Ilchogak.
Korea Advanced Institute of Science and Technology. 1985. Chungso kiiip ill l'onghan tae-Mi kisul Jryomnyok pangan e kwanhan yongu [A Study on the Strategies for Importing U.S. Technologies through Small- and Medium-sized Firms by Enhancing Korea-U.S. Technological Cooperations). Seoul: KAIST.
__ . 1986. Uri nara kwahak kisul kaebal sisiltem chOngae kwajOng kwa chiinmang fA Study on the Science and Technolol!J Development System iT! Korea and Its Future Direction}. Seoul: KAIST.
'
Korea Development Institute. 1983. 80 nyondae nosa kwan'g;ye palchOn wihan kandamehoe pogoso [Symposium Report on Korea's Management-Labor Relations in the 1 980s]. Seoul: Korea Development Institute.
Kwahak Kisulch'O [Ministry 'of Science and Technology]. 1986. Kwahak Kisul yongam [Science and Technology Yearbook]. Seoul: Ministry of Science and Technology.
Ky6ngje Kihoekwon [Economic Planning Board. 1986. KosiJe 86-7 Ho, "1986 Hyondo Sijangch'6k saiipcha Ch'iJung" [Notification of 86-7, "Designation of Market-dominating Enterprises for the Year 1986"1.
Lee. J. J. 1986. SaniJp yuhyi5ng-byOl kisul lUubal kwajOng ?nit clWngch'aek kWf11'e [The Process of Technolol!J Development by Industry and Its Policy ImplicOr lions]. Seoul: Korea Economic Institute.
Lee, K. E. 1984. Han'guk kyongje wa chungso kiOp [The Korean Economy and Small and Medium Sized Firms]. Seoul: Ka-Chi.
Lee, K. U. 1984. "Uri nara chejo6p iii sijang kujo" ["Market Structure of

Bibliography 351
Korean Manufacturing Industry"]. In Han'guk kaebal yan'gu [KClTea Development Studies]. Seoul: Korea Development Institute.
__ , and J. K. Kim. 1981 . Han'guk chejoiip ui sa:niip chipchung punsok [Analysis of Concentration of KClTean Manufacturing Industry]. Seoul: Korea Development Institute.
__ , and Le�, J. H. 1985a. "Kiop kyorhap kwa kyongjeryok chipchung" [Corporate Mergers and Economic Concentration"). I n Han'guk kaebal yongu [Korea Devel,*",ent Studies]. Seoul: Korea Development Institute.
__ and S. S. Lee. 1985b. Kiiip kyOThaP kwa kyongjeryok chipchung [Corporate Mergers and Economic Concentration}. Seoul: Korea Development Institute.
Lee, T. Y. 1987. Opchong-Uyol yiingu kaebal t'uja hyonhwang mit saniJp kisul chiwon chedo chOkchungsong kDmt'o [R&D Investment Uy Industry and the Appropriateness of KClTea's Technology Development}. Seoul: Korea Institute for E;conomics and Technology.
Lim, J. C. 1986. "Imgiim kwa nodong chukon" ["Wage and Working Conditions]. In Han'guk kyongje samsipsam kwaje iii insik [Recognition of 33 Issues of the Korean Economy). Seoul: Seoul National University Press.
Maeil Kyongje Sinmun [Daily Economic News}. 1986a. "Samjung kosok ui haeoe konsol" ["Overseas Construction among Three Problems"]. February 25.
__ . 1986b. "Chadongch'a pup'um taegiop chamyobum: yumang opchong pusang ddara" ["Boom of Large Firms' Entry to Automobile Parts Industry As the Industry Shows Bright Future"]. August 1 .
__ . 1986c. "Mi sobisii nongsanmul p'oham kaebang yogu" ["U.S. Asks to Open Service and Agriculture Market"]. August 12.
__ . 1986d. "Mi yogu p'ummok chogi kaebang k6mt'o" ["Earlier Import Liberali:.:ation Is under Consideration for Items that U.S. Asked to Liberalize"). November 7 .
__ . 1 986e. "Kuknae kii>p haeoe t'uja kW6njang" ["The Korean Government Recommends Foreign Direct Investments by Korean Firms"). November 20.
__ . 1 986f. "Han'guk, chungjangbi kiji-ro kakkwang" ["Korea Becomes Manufacturing Base for Heavy Machinery"). November 22.
__ . 1986g. "Kaehwagi match6n kigye kongop" ["Booming of Machinery Industry"]' December 2.
__ . 1986h. "Taegi6p haeOt� t'uja kanghwa" ["Increase of Foreign Direct Investment by Large Firms"). December 18.
__ . 1987a. "Chos6n sasa sonjong chOnmunhwa" ("Four Shipbuilding Companies Agreed to Speciali:.:e in Type of Ship"). July 18.
__ . 1987b. "Mingan chudo 'kyongje silmyon twi-bat'ch'im" ["Support for Private-led Economy"). July 22.
' __ . 1987c. "Chaebol ta hoesa ch'ulcha samjo sach'onch'ilbaek sasipok" . ["The Volume of Cross Investment by Chaebol Amounts to 3474 Billion Won"). July 27.
__ . 1987d. "Chosiin suju segye ilwi" ["Shipbuilding Order, the Largest , in the World'l August 1 .
Moon, P. Y . 1987. ["Agriculture and Rural Sector")' In Han'guk ky6ngje iii

352 BIBLIOGRAPHY
iron kwa hyonsil [Theories and Facts of the Korean Economy}, S. Cho, H. J. Choo, et al. (Eds.). Seoul: Seoul National University Press.
Park, F. 1983. "Saniippyoi imgum kyokch'(ii t'uks6nggwa byo\1hwa" ["Characteristics and Changes in Wage Differences Between Industries]. In Han'guk kyongjeji {Korea Development Review], volume 5 ( 1 ), Spring.
Park, F. · K. and S. I. Park. · 1984. Han'guk ui imgilm kujo (Wage Stiucture in Korea). Seoul: Korea Development Institute.
Park, H. C. 1985. Han'guk chabonjum nodong munje {Korea's Capitalism and Labor.Problems]. Seoul: Dolbegai.
__ . 1986. Han'guk kyongje kujoron (Study of the Structure of the Korean Economy). Seoul: Il-Wol-Seo-Gak.
Park, ] . H. 1987. "Chaebol kurup chonghap yonsuwon solIip rosi," ["Rush in Establishment of Group-Level Training Center by Large Business Groups"). In Maeil KyOngje Sinmun [Daily Economic News], July 20.
Park, W. H. 1987. Han-Il kisul punop iii saeroun chOn'gae [New Technological Collaboration between Korea and Japan]. Seoul: Korea I'nstitute for Eco- . nomics and Technology.
Raj, M-K. 1984. Nodong kYOngjehak [Labor Economics]. Seoul: Kyungmoosa. Seoul National University (College of Business Administration). 1985. Han
'guk kiiip ui hyonhwang kwa kwaje [Current Situation and Task 'to Be Done by Korean Firm.S]. Seoul: College of Business Administration, Seoul National University.
Sobija Poho Danch'e Hyopiiihoe [Association of Organizations for Consumer Protection]. 1987. Sobija poho chedo wa pihae kuje [Regulation for Consumer Protection and Recovery of Damage). Seoul: Association of Organizations for Consumer Protection.
Son, H. K. 1987. "Chlp'yo ka malhaniin pin�u ky6kch'a iii silt'ae" ["The Realities of the Gap between the .Poor and the Rich Revealed by Indicators"j . Sin Tonga, February.
Song, H. Y. 1987. "Pusil kiun pusil ki6p chOngni" ["Rationalization Aggravated More Firms). In Wolgan Chasm [Cho-Sun Monthly], July.
Song, Y. M. 1987. "Pusil kiop chongni iii naemak" ["Inside Story of Bailout of Failing Firms" ). In Wolgan Chason [Cho-Sun Montltty], July.
Suh, ]. S. 1986. "Han yqngnong hugyeja iii chukiim kwa nongch'on hy6nsil" ["Death of a Successor of Agricultural Business and the Present Condition of Rural Community"). Sin Tonga, June.
Taehan Chubu K;ii1l6p Y6nhaphoe [Association of Housewife Clubs, forthcoming). 198·7. Kobal sarye chip (Complaint Cases). Seoul: Association of Housewife Clubs.
Taehan Pangjik Hyophoe [Spinners and Weavers Association of Korea)' 1987. Panghyiip sasim-nyon sa {The 40-Year History of Spinners and Weavers Association of Korea]. Seoul: Spinners and Weavers Association of Korea.
Yoon, J. I. and ] . Y. Park. 1977. Kyoyuk chaejong iii hyiinhwang kwa munje kyoyuk pi punsok yongu (Present Situation and Problem of Education Budget]. Seoul:. Han'guk kyoyuk kaebalwon.
Yoon, W.-S. 1 986. "Kyosa ui chiwi: ch6u-nun twitjOn ch'obOl-iin minch'Op" ["Teacher's Status: Mistreatment"). Wolgan ChasOn, July.
Yun, S. C. 1 982. Kisul ch'ukchOk-kwan iron [Theory of Technology Accumulation and Management]. Seoul: I1-Shin�Sa.

Name Index
Adams, W., 1 17':"18 Aghevli, B. B., 90n Ahluwalia, M. S., 160 Ahn. B. J., 28n Amsden. A. H., 32n. 53, 59n, 62. 63,
63n, 74n. 93n. 12 1n, 130. 132. 134. 175. 202n. 245. 267
Anderson. D .• 161. 244 Antonelli C .• 256 Arrow. J. K .• 144n Ashworth. W .• 59n
Bai. M.-K . • 195. 199, 202 Bailey. E. A., 1 17n Balassa. B . • 244n Baldwin. F . • 32 Ban. S. H .• 32n. 37n. 202 Bank of Korea, 20, 56. 57, 62. 65. 72.
73. 75. 76, 87. 89. 9 1 , 95. 97, 102, 104. 197. 201. 202, 237
Baran, P., 32n Bame!!. D. F., 298n. 300 Bemal. J. D . • 7 Bhalla. S. S .• 16n Bloomfield. A. I. . 44, 45. 48 Brandt, V .• 38n Braverman.. H., 7n Brock, J. W . • 1 17-18 Brooks. H . • 320 Brown, E. H. P., 197. 206 de Brunner. S. E . • 32n Bum-shik. S., 69 Business Korea, 85. 175 ·8uzacott. J . A., 1 17n
Calvert. M. A., 226 Castaneda. T., 1 09. 22 1 . 222; 230 Caves, R. E .• 149
Chandler. A. D .• Jr . • 9. 1 19, 123. 124, 125. 126n. 140. 159. 160. 1 64. 165. 167. 169. 179. 180n, 3 18
Chang. Y . • 32n Chen. I.-te. 28n Chenery. H .• 16n. 1 12n. 1 18. 244n Cheong. Y. H. S . • 16n Cho. D. S .• 1 29n. 279 Cho. Y. J.. 103n. 135. 1 83n Chao. Y. S .• 17n Choi. J. J.. 25 1 Choi. K. S . • 289 Choi. M. H . • 37 Chosen llbo, 192n Chou, T. C . • 1 15n Chough. T. S .• 316 Chun Doo Hwan. 83, 13 1 . 132, 1 37 Chung. C. Y . • 266 Chiinggwon Kamdogwon (Securities
Advisory Board). 1 3 1 n Cole. D . C., 3 1n. 39, 40. 44. 48. 64. 74,
96. 103n. 135. 183n Commission of the Churches on Inter-
national Affairs. 222. 251 Conroy. H., 28n Corbo. V .• . 101 Council for Economic Planning and
Development. Taiwan. 196 Crandall. R. W., 298n. 300 Cumings. B .• 35. 35n. 36. 37. 38. 53 Cusumano. M. A . • 183n
Dahlman. C. J.. 76. 1 74n. 2 18 Daito. E., 228. 229 Delehanty. D. E . • 17ln Dodge� H. W . • 220 Donga 1100 (Dong-A Daily). 125n; 132n.
133n. 199n Duus. P .• 28n. 53
353

354 NAME INDEX
Easterlin, R. A .• 217 Eckert. J. C . • 33n. 220 Economic Planning Board (Kyongje
Kihoekwon). 17n. 58. 65':'66, 67. 90. 92, 95. 96, 98. 98n, 107, 109. 1 2 1 •
. 122, 164, 165, 166. 1 82. 1 97. 207. 257. 262
Edison. Thomas A . • 226, 229 Ewing. G. 0., 34, 42. 207. 222 Executive Yuan, Taiwan, 162
Feder, G., 154 Federation of Korean Industries, 261 Fischer, D. H., 77, 141 Fishlow, A . , 32n Frank. A. G., 32n Frank, C. R.. 65, 65n, 67 Friedlaender. A. F . • 1 17n Fukunishi. A . • 297n
Gerschenkron. A .• 3n. 13. 18, 99n, 144 Gold, B, 1 17n Gompers, Samuel, 193, 194 Grajdanzev, A ... 32n. 34, 53. 54. 7 1 ,
19 1 , 206 Great Britain. 60 Grootaert, C., 204. 205
Hahn. F. H .• 144n Han. G. E . • 220n Han, S., 37, 43. 48 Han, W. K., 28n, 30n Han'guk /lbo (Han-Kook Daily), 1 32n.
192n Han'guk KyJngje SinmulI (Korea Eco·
ntmlic Daily), 109n, 290n Han'guk Kyoyuksa Yonguhoe (Associ
ation for the Study of History of Education), 220n
Han'guk Saengsansong Cent'a (Korea Productivity Center). 8n. 260
Harbison, F. H., 217 Harvard Business School, 83, 1 19. 126,
127. 233, 271, 272 Haltori, T., 128n, 167n. 168 Hawtrey, R. G., 166n. 246 Hayes, R. H., 324 Henderson, W. O., 12. 234 Hirschmeier. J., 125n Ho, 5 . • 162. 181
Ho, S . P.-S., 32n, 53, 54, 191n Hobsbawm, E. J. , 32n Holley, Alexander, 227, 228 Hong, S. B., 310 Hong, W., 87. 255n Hubbard, G. E., 59-61 Hyundai Heavy Industries, 274, 283,
284, 285
Ikeda, Hayato, 1 83 Institute of Statistics. Turkey, 196 International Labor Office, 204, 205 International Monetary Fund, 56, 7 1
Jacobs N., 220 Jensen, J. P., 44, 45. 48 Johnson, C., 149, 149n, 181 , 1 83, 183n Jones, L., 40, 72, 80, 235, 236, 236n,
244, 245, 266 Juhn, D. S., 28n, 31 , 32n
Kaldor, N., l IOn Kelley, M. E., 7n Kemp, T .• 193 Kim. B. Y., 195n, 196, 197, 206 Kim, C. I. E., 28 Kim, C. K., 8n, 164 Kim, C. L., 236 Kim, D. G., 92n Kim, E., 32n Kim, H., 32n Kim, H. H., 28n Kim, J. W .• 18 1 . 1 83n Kim, J. ·B . • 65, 66 Kim, J. E . • 221 Kim. J. K . • 133n Kim. J . W . • 188 Kim, K. D .• 39 Kim. K. M., 17n Kim, K. S . • 67, 74, 1 55n. 291 Kim, L., 74n, 76, 130, 174n, 175. 2 18.
267 Kim. S., 192, 223n, 228n Kim. S. K., 88, 1 16, 1 19. 135, 258 Kim, Y. B . • 4 1 , 65, 67, 68, 78, 82n,
245. 248 Kim, Y. B. A., 2 1 5n Kim, Y. C., 2 1 5n Kim. Y. H .• 204 Koh, S. J.. 28n. 62

Name Index 355
Kong. E. B., 2 15n Koo, B. Y., 76 Korea Advanced Institute of Science,
293, 295, 296, 297, 302 Korea Deveiopment Bank, 40n Korea Development Institute, 256 Korea Exchange Bank, 108, 271 Korea Institute for Educational Devel-
opment, 1 7 1 Kor,ean Machinery Builders' Associa
tion (KMBA), 234 Korean Reconstruction Bank, 182, 197 Korea(n) Shipbuilding Association,
287, 288 . Korea Traders Association, 87, 134 Krueger, A. B., 207 Krueger, A. 0., 44, 45, 70 Kublim, H., 29n Ktiznets, S., 7 1 , 192 Kwon, T. H., 53 Kyongje Kihoekwon. See Economic
Planning Board
Lall, S., 295 Landes, D. S., 5, 6, 18, 50, 59 Lau, 1. J., 162n Lee, C. H., 164 Lee, C. S., 28n Lee, H. B., 38, 42, 5 1 Lee, H . K., 32n Lee, ]. H., 133n Lee, J . W., 203, 204, 208, 209, 231 Lee, K. E., 1 83n Lee, K. U., 1 2 1 , 122, 123, 133, 133n Lee, K. W., 1 22, 223 Lee, P. C.; 235-36 Lee, S. S., 133n Lee, Y. K., 32f1 Leff, N. H., 1 19 Leipziger, D. M., 94 Leyy, M. J., ]r., 32n Lewis, W. A., 190, 203 Lim, ]. C., 199n tim, Y., 85, 1 8 1 Lindauer, D. L., 195, 197 Linder!, P., 196 List, F., 13 lJqyd's Register of Shipping, 270 Lucas, R. E. B., 195n, 196 Luedde-Neurath, R., 70 Lyman, P. N., 39, 40, 64, 74
McCraw, T. K." 13n McGinn, H. F., 2 19, 220, 221 McHugh, J., 227, 228 Maddison, A., 6n Maeil Ky6ngie Sinmun (Daily Economic
News), 9n, 129n, 132n Maizels, A., 59n Marquez-Ruarte, ]., 90n Maruhnic, J.. 2 17- 19 Maschke. E., 1 16n Mason, E. 5., 32, 33n. 4 1 , 46 Mattingly, G., 77 Melman, S . • 17 1 Min, S., 134 Minami, R., 198 Ministry of Commerce and Industry,
258, 272, 275n Ministry of Education, 216, 224, 260 Ministry of Finance, 77, 1 35, 233 ' Ministry of Labor, 102, 199, 201 , 2 12,
2 19, 224, 230 Mintzburg, H., 295n Mitsubishi Economic Research Bureau,
62 Mitsubishi Research Institute, 3 1 1 Mizoguchi, T., 32n Moon, P. Y., 37n, 109n Mortimore, D., 32n Moskowitz, K., 33n, 53 Mueller, W. F., 1 15, 124 Musgrave, P. W . • 216, 221, 224, 226 Myint, H., l i n, 190n
Nakamura, J. l., 32n Nam, S. W., 101 , 200, 200n Nasser. Gasmal Abdel, 14, 51 Nath, S . K . , 84n Nelson, R. R., 7n, l iOn New York Times, 271n Noble, D. F., 227n Norton, R. D., 200n
Office of Labor Affairs, 102, 201 Ohkawa, K., 50n, 149 Ohno, T., 183n Orchard, J. E., 60 Osterman, P., 208 Ozawa, T., 232
PaineWebber, 296, 299, 30 1 , 305, 306, 307, 3 14, 3 17

356 NAME INDEX
Paldam, M., 196, 200 Pallais, J. B., 29-30, 251
. Park, Chung Hee, 39n, 49, 50-51, 52, 1 30-31 , 322. See also Subject Index: Park Chung Hee, and Park regime
Park, F • . -251 Park, F.-K., 109, 221, 222, 230 Park, H. C., 36n Park, J. H., 228n Park, J. Y., 2 15n Park, Tae Joon, 295 Park, Y. C., 3 1n, 39n, 44, 48, 76, 87, . 9 1 , 92, 94, 96, 103, 132, 255n Pasha, Kemal, 14 Patrick, H., 149, 191 Pearse, A. S. , 60n Perkins, D. H., 37n Piore, M:J., 16In Pohang Iron and Steel Co. Ltd.
. (POSCO), 21 1 , 291 , 294, 295, 303, 297, 299, 308, 309, 3 12, 313. See also same entry in Subject Index
Porter, M. E., 279 Psacharopoulos, G., 231 Pursell, G., 69n
Reeve, W. D., 44, 48 Resnick, J. R., 2 19 Reynolds, L., 12n Rhee, S. Y., 200n Rhee, Y. W., 69n Richardson, R., 195n, 196, 197, 206 Riveros, L. A., 196, 200 Robinson, S., 1 12n Roemer, M�, 155n Rosenberg, N., 4 , Rosovsky, Herlry, 50n, , 149, 191 Ross-Larson, B., 69n Rostow, W. W., 32n
Sabel, C. F., 161n Sachs, J. D., 90 SaKong, I., 40, 72, 80, 235, 236, 236n.
244. 245, 266 Samuel. R. B., 224 Sanches-Albornoz, N., 191 Schonberger, R. J., 1 83n Schum peter, R. A., 79 Seoul National University, 170, 170n,
172n, 173, 225
Shefter, M., 193 Shiba, T .• 269 Shipping World and Shipbuilder, 288 Shoichi, F . • 28n Short. R. P., 93 Small and Medium Industry Hand-
book, 197 .
Smith, A. D . • 202 Smith. Adam, 7 Sobija Poho Danch'e Hy6piiihoe (Asso
ciation of Organizations for Consumer Protection). l3 1n
Sombart, W., 13 Son. H. K. , 135n Song. H. Y., 132n Souza, P. R., 195n. 200. 231 Spence, M., 1 17n Statistics Bureau, 78 Stern. F .• l l6n Suh, J. S . • 16n, 109n Suh. S.-C., 32n, 54 Sumiya. M., 193-94 Summers. L. B., 207 Sun Yat Sen. 14, 5 1 Syrquin, M . , l l2n
Tachan Chubu KOllOp YOnhaphoe (Association of Housewife Clubs), 131n
Taehan Pankjik HyOphoe (SpinneTS . and Weavers Association), 66n
Taylor, A. J., 12i1 Te�ksbury, D. G., 44n Thomas, R. H., 224 Thurow, L. C . • 171 Toshiyuki, M., 32n Tsurumi. E. P., 28n. 33n, 54
Uekusa. M., 149 United Nations, 4 1 , 1 19, 162, 2 1 8 United States Department of .Com-
merce, 320 United States Embassy. 134 U.S. House of Representatives, 45, 46n
Veblen, Thorstein, 21-22. 22-23, 173n
Vogel, E., 269

Weems, B. B., 28n We�ms, C. N., Jr., 28n
Name Index
Westphal; L., 67. 76, 1 55n. 174n. 218,
Yamazawa, I.. 249 Yasuoka, S., l l5 Yelle. L. F., 250 Vonekawa. S., 61 Yoo, j. H., 92n Yoo. J. S., 8n Yoon, J. I., 2 15n Voon. W. S., 2 19 .
Yui. T .• 1 25n YUZD. Y., 32n
263. 291 Whang. I.-j.. 85 Wheelwright, S. C., 1 1 7 Williamson, J. G . • 196 Williamson. O. E . • 1 1 9 Winter, S . G . • 7 n Woo, K . D . • 68, 249 Woodruff. W . • 59n. 192 World Bank. 38, 70. 7 1 . 72. 82. 83,
132, 132-33, 134, 135, 1 37. 191, 259
Zeitlin. J., 161 n ZymeIman, M., 262, 291
357


Subject lndex
Accumulation model, Korean, 63-64 investment policy in, 72-76 trade policies in. 64-72
Agr;uian structUl::�.Jilpanese' revision ,,"":,' ' ", , ' of. 53-5� I Agriculture. K�n..See also Land Re-form. Korean
and chemical fertilizer, 48 and income distribution. 146 and Japanese colonialism. 34. 52-54 mass exodus from (1982':'85). 109 and wages, 202-3
Allis Chalmers, 267 Appledore, A&P (Scottish shipbuild
ers). 276 Apprenticeship
technology acquisition, 20 worker, 2 1 , 22. 224
Argentina direct foreign investment in. 76 government expenditures in. 93 human capital indicators in, 2 18 investment by. 1 19 and late industrialization. 140 school population of, 2 17 wage increases in. 196 workweek length in. 205 ZDihatsu-like groups in. 1 15
Army. Korean. See Military. Korean Artisans, 193-95. See also Labor orga
nization; Skilled labor or craftsworkers
Asia Motors. 15 Austerity measures
in early 19805 Korea. 108-9 and stabilization measures. 93. 94
Automobile industry. in Korea comparison with GM. 179-80 HMC. 175-80 and import-substitution, 81 . 155 just-in-time inventory of. 183-84
res.tructuring of. 132 subcontracting in. 179-88 shopfloor management and learning
in. 175-79
fBail-outs in Korea. 15. 96. 97, 105 J" Balance-of-payments difficulties. Ko
rean response to. 93. 94. See aho Exchange rate
Banks and banking. Korean denationalization of. 135 nationalizatio� of. 16-17. 72-73.
142
J' U.S. for privatizatio(l of. 47-48
. Big ��n:�:i:::s �:�::;��c?e�ri;��
. dustrial enterprise . . ... .. ' .. , e�onomic Jlerformance of. 1 1 7-: )9 al),d late i�dusidali:i�tio'ri;' f40�1 in market-augmenting paradigm.
150 i9' Park's view. 14
,,\/fole of (Korea). 1 15 , �ial effects of. 116-17 Vspecialized (Korea). 159
and state diScipline. 14-17. 63-64. 120. 129. 1 45-47. See also Discipline of business
state in harmony with (Korea). I30. 136. 151
Big Push into heavy industry. vi debt from. 152 and economic performance. 94. 99.
1 18 export targets in, 16 and inflation, 100 and POSCO. 316 and protest action. 101 state role in. 8 1
359

360 SUBJECT INDEX
Blue-collar workers proportion of. in Korea and U.S."
17 1-72 and wage dispersion (Korea), 208
Borrowing, foreign. Set Foreign borrowing by Korea
Brazil, v agricultural labor force in, 203 .direct foreign investment in, 76 diversified business groups in, 151 and education, 239 firm size and value-added in, 162 government expenditures in, 93 and growth-wage relation, 200 human capital indicators in. 2)8 and late industrialization through
learning, 4, 140, 320 as POSCO competitor, 301 school population of, 217 shipbuilding by, 27 1 steel costs and efficiency in, 297,
298, 300 subsidies in, 8 wage increases in, 196 zaibatsu-like groups in, 1 15
Britain (England, United Kingdom) educated populations of, 2 16, 217 firm size and value-added in, 162 First Industri�1 Revolution in, 3 government intervention in, 12 Hyundai technology from, 175 and invention, v, 4, 59. 3 19-20 vs. Japan in t,extiles market, 60-61 Korean technOlogy from, 233, 276
,steel labor-cost in. 296 textile plant rebuilt by, 248 trade unions in. 193 Veblen on, 2 1 wages in (1781-1851) , 196, 197
Broken Hills Proprietary Corporation (BHP), 302
Budgets, government (Korea/Japan! Taiwan), 88, 90
Business, diversification of. See Diversification by business '
Business, and liberal market ideals, 323_ See also Big busi,ness; Entrepreneurs '!ond entrepreneurship
Business. small- and medium-size. See Small- and medium-size firms. Korean
Capital, foreign. See Direct foreign investment in Korea;' Foreign borrowing by Korea
Capital deepening, 166-67, 246-47. 265, 268, 303-4
Capital flight, controls on, 17,-- 18 Capital goods, technology transfers by,
, / 233 Y Capital-intensive industries, Korea'n .
See also Heavy industry div�rsification into, 85 managerialism in, 166-67 profitability data on. 85, 87 and steel-making, 291 and wage dispersion, 206, 208
Capital Widening, 166, 246, 255, 268, 303-4
, Catching-up process, 28-20. See also f Learning. in
,
late industrialization
\ ement industry, Korean, 87, 262-66 " government favoritism in, 73
Hyundai Cement Company, 266-67, 287
Central Intelligence Agency, Korean, labOr'affairs under, 208. 324,
Centralized management coordination,
V 123-25, 129
Chaebol (diversified business groups in Korea). 9. 40. 64, 151. See also Diversified business groups; Modern industrial enterprise
advantage to members of. 286-87. 290
'
as agents of industrialization, 1 19, 243
antecedents of, 246, 268 and cement industry (vs. textiles) • .
247. 262 competition among. 129-30. 151-52 and colton textiles, 236, 246; 258 and countervailing forces, 131 diversification of. 120. 125. 127-28,
130 and economic concentration. 1 15.
1 1 6,, 122. 136 ' economic performance of, 1 11�-20 functions of presidents in. 167-68 government favoritism toward, 73 and inequality. 328 and labor bureaucracy. 208-9 and labor relations. 324-25 layoff policies of. 107n

Subject Index 361
and machinery-industry licensing. 103
managerial recruitment by. 173 mergin'g among. 142 and POSCO. 314 and R8cD. 328 social effects of. 1 18 and state. 88. 1 52 and steel making (POSCO). 293. 295 structure of. 170 in workers' lives. 1 0 1 a s young manufacturers, 235-38
Cheil Sugar Company. 236 Cheil Wool Company. 235-38. 258 Chile, government expenditures in. 93 China
Japanese and British textiles in. 60 Koreans in (WWII), 34-35 as potential compe!itor for Japan. 33
Chungnam Spinning. 258 Class differences in Korea. and libera
tion movements. 28 Cold War. and Korea. 35-38. 142 Colombia
government expenditures in. 93 large to small firms in. 161
Colonialism. See aLso Japanese colonialism in Korea
and Indian artisans, 194 and Japan vs. other late industrializ
ers. 60 and labor supply. 191 and late industrialization. 12
Communism. in Korea. 35 / and a}1ticommunism. 49
Comparative advantage. See��y� namics of comparative advantage
/ ' diversincation as. 243 dynamics of. 244-'45. 246. 268. 292 for HijJ. 273 and KJ}ean electronics. 82 and Korean exports. 1 53 of Korean steel"making. 316
\ and market-conforming paradigm. ). 143. 155 ( and specializati�n. 323-24
,,--stages of. 243-44 and U.S. aid to Korea. 43
Competition. See also Market mechanism or forces
by chaebol. 129-30, 151-52 and growth. 150
and Korean market-augmenting paradigm. 153
Competition, oligopolistic, 129.,..30. 1 50 Comprehensive Stabilization Plan
(CSP). 94. 104. 109 Computer industry, Korean. 82-83 Computer systems
at HHI. 286 and POSCO. 305, 3 10
Concentration. See Economic concentration
Confucianism and Korean capitalism. 3 1 and yangban elite. 29
Conglomerates. 124-25. See also Chaebol; Diversified business groups
Consultants and HHI, 279, 284 for POSCO. 309 technology transfer through, 234.
248 Consumers. Park on. 131 Contradictions of modernization. 31-
35 Corruption. See Profiteering and illicit
wealth; Rent seeking Cost control. at HHI. 282. 284-86
Votton textile industry. Korean. 55-56. 142-43. 245-46
and chaebol (diversified business groups). 236. 243. 246. 258
"0" as firm in. 247-50, 25 1-52. 255. 257. 258. 259. 260
difficulties of diversification from. 257-60
factors in success of. 78 female laborers in. 250-5 1 . 252 government intervention in. 14. ,64-
68. 78 hands-on management in. 252-53 and Korean trade policies. 64-68 and Korean War. 248 "L" as firm in. 247-49. 25 1. 252-55.
257, 258-59. 260-61 and newer industries. 20 as oligopoly. 65 quality control circles in. 25 1-52 shott-run strategy of. 20. 253, 255-
57 vs, technology-transfer industries,
209 uncertainties of upscaJing in/260-61

362 SUBJECT INDEX
Cotton textile industry. Korean (com.) U.S. import from prohibited. 56-57.
66. 1 43 wages in. 249. 25 1
Country. the Revolution, and I. The (Park autobiography). 14. 50. 322
Coup d'etat off May 1961, 37. 48. 49. 52. 64, 142
Craftsworkers. 7, 193-95. See also Labor organization
Credit. foreign. See Foreign borrowing by Korea
Credit. government control of. 73. See also Banks and banking. Korean
Credit allocation. and machinery industry. 103-4
Cultural explanations for market behavior. 200. 320
Current account. Korean. 75. 90. 91 deficit in (1978-80). 104 and GNP. 56 and oil crisis. 98. 99
Daelim Engineering Company. 15
Daewoo Electronics.· and Taihan group. 1 5
Daewoo group. 73 diversification by. 127 joint ven'lUres by. 83 in shipbuilding. 272-73. 290
Daewoo Motor Corporation and Shinjin. 15 vendor development department of,
184 Debt. Korea. foreign. See Foreign bor
rowing by Korea; Foreign debt. Korean
Debt equity ratios. Korean of chaebol. 128 high level of. 103; 104
Debt financing. in Korea. 94-96 Debt/GNP ratio. Korea. vi. 94,-96. 107.
1 18, 1 52 Democracy. in Korea
and industrial expansion. 148 and Korean government measures.
18 and Korean industrialization, 148.
327 students for. 48. 148
Democratic pluralism. and policy toward chaebol, 130-31
Denmark. HEMCO technology from. 280
'
Devaluations. Korean in 1960s. 65-66. 67. 77 in 1971. 96. 97. 98 U.S.-engendered. 44
Direct foreign investment in Korea. 9. 74. 76. 77. 147
Discipline of business (Korea). vi. 14-18. 63-64. 120, 129. 145-47. See also Market-augmenting paradigm; State
. through co.untervailing power. 130-3 1
and HH1. 273 through liberalization, 1 20. 133-36.
1 37 and monopoly power, 129-37 through oligopolistic competition.
1 29-30 and productivity, vi. See also Produc
tivity through restructuring, 132-34
Diversification (Korea), 1 19-20, 123-25
corporate strategy toward, 125-29 difficulties of (textile industry), 257-
60 government role in. 80, 84-85, 88 by KSEC, 290 , and late industrialization, 239 nonlinear. 243 requirements for, 258 ,
Diversified business groups. v, 39-4 1 . 150, 15 1-52. See also Modern industrial enterprise
chaebol as, 9, 40, 15 1 . See also Chaebol in late industrialization, 151 . 244-55
Division of labor, international, 18-19. 57, 59-63
Doosan group, 126 Duopolies, in Korea, 120-21 Dynamic of late industrialization, 109-
12, 1 13, ISO, 152-53, 323 Dynamics of comparative advantage,
244-45. 246. 268, 292
Economic concentration (Korea), 1 15, 1 16, 120-25, 146
through buyouts. 1 35-36 and market mechanism, 134c-37,
328

Subject Index 363
Economic Planning Board (EPB). 8 1 . 84. 1 29'
'
Economie,s of scale. 1 17. 167 in growth dynamic. 152. 153 as growth effect. I I I and specialization. 324
Economies of scope. 1 17. 167 diversificatiori as. 151 group coordination as. 129
Education in Korea. 2 15. 2 16. 217-2 1. 238-39
imperfections of. 146-47. 219-20 and, inexperience of managers. 227-
29 '
investmem in. 23. 147. 22 1 . 328 and investment opportunities. 235 under Japanese rule. 33 and literary. 147. 221-22 among managers and engineers.
225-27' pasco engineering college. 306 pasco school system and general
training. 2 10. 2 1 1 among production workers. 221-25 and reward structure. 229-31 and status of teaching. 219 in textile firms. 252
Efficiency. and freer markets. 328. See also Liberalization
Electronics industry. Korean, 19-20. 8 1-84
Energy crisis. See Oil crises. Korean response to
Engineers. 9-10. See also Managers. sa-,Iaried; Shopfloor management
education level of (Korea). 225-26 German. 22 at HHI. 2S8-89 at HMe. 177, IS4 and Korean management. 10, 160,
171, 172 in Korean textile firms, 253, 260,
261 and late industrialization, 9-10. �20 at POseo, 3 15-16 on shop floor in Japan. 2�9 wage level of (Korea). 229-31
England. See Britain Entrepreneurs and entrepreneurship.
v. 9 '
in dynamics of comparative advantage, 244-45
functions of, SO
government as, 79-80. 84, 144 and investment rate, 99- 100
Entrepreneurship in Korea. 79-81 and electronics. 8 1 -84 large landowners as source of.
235 '
and locus of initiative. 84-85 and new diversified group, 39-41 and state, 17. 80-84, 1 12 state-business cooperation in. S8
EPB (Economic Planning Board), 8 1 . 84. 129
Equality and inequality. in Korea. 38. 328
'
European countries, as learners, 32 1. See also Western Europe
Exchange rate Japanese, 62 fand late industrializers, 144. �45
\ xcharige rate. Korean, ,56 \ devaluation of. 65-66, 67, 77 "
in 197 1-; 98 , r·:�·��p6::�5:'-106; .. 1,�.�;�i4� ---,---�-and liberalization, 77-78 multiple, 74 and 19805 austerity program. 108 in stabilizations, 105 and subsidies. 66. 67. 143
Expertise, and diversification. 126. See . L" also Engineers; Managers, salaried V Expon dependence. Korean, 70-72
\ ,..-Exports V and exchange rate. 105. 106. 107,
144 a9d growth, 154 Japanese, 62 -andslages'of compa.r�tille advan-. ·
tage. 243-44 �xpOrts, Korean
\; in accumulation model. 63 cotton textiles as" 56-57. 66. 143,
245 and exchange rates, 105. 106. 107.
144 government compulsion for. 69 government su!Jsidies for. 67-68, 74 growth rate of. 55, 56. 57, 58. 66-
67, 70, 7 1 . 96. 107 historical phases of. 154 as Park goal. 68-69 by pasco. 301 and relative prices. 153-55

364 SUBJECT INDEX
�ports. Korean (continued) /and smaller firms. 181 Export targets. 16. 147 External debt. Korean. See Foreign
/- debt. Korj!an Externalities. from Korean export ac
tivity. 154-55
Fallacy of identity. 141 Family ownership structure. 128. 167 Federation of Korean Industries. 1 3.3.
208 Female laborers. See Women. Korean Finandal liberalization. 134-36 Firm. and growth-productivity loop.
1 12, 1 13 Firms, large. See Big business; Chafbol;
Diversified business groups; Modern industrial enterprise
Firms. small- and medium-size. See
Small- and medium-size firms. Korean
First Industrial Revolution. See Industrial Revolution. First
Five-year pJan(s). 84 first. 84 . fourth. 81-82, 223 second, 81 technology transfers in periods of,
2�3 Foreign aid to Korea. See also Interna
tional Monetary Fund. in Korea; World Bank. in Korea
for cotton spinning and weaving, 64-65
intervention with. 64 by U.S .• 38-39. 43. 45. 46-47. 52.
64. 67 .
Foreign borrowing by Korea cost of. 74. 76, 7�. and debt financing. 94-95 and debt/GNP ratio. vi. 94-96. 107.
1 I8, 152 for electronics. 82 and government investment, 90-91 and HHI. 276 and oil crisis. 98 for textile industry. 78
Foreign (external) debt. Korean. 95 and austerity program, 108 and Big Push. vi growth of
in 1962-71. 94 in 1979-81. 105 and oil crisis. 9(1
, and stabilization (1970-71). 96 and U.S . • 49
Foreign exchange. Korean. fro-m light manufactures. 151 '
Foreign exchange rate. Korean. See
Exchange rate. Korean \!Foreign investment. direct, in Korea,
74. 76. 77. 147 Foreign licenses (Korea>. -232-33. See \ . also Technology transfer; and indi
vidual indwtries
Foreign loans. See Foreign borrowing by Korea
Foreign tec�l1ology or technical assistance. See Technology transfer
Free market. See Market mechanism or forces
General' Electric. and concentration, 1 I 6
General Motors and concentration. 1 16 Hyundai compared with._ 179-80
General trading companies (GTCs). , 129n Germany
apprenticeship system in. 224 big business in. 1 16 capacity reductions in (1920). 132 . catching-up process in. 2 1-22. 23 education in. 2 16. 2 17. 22 1 financiers-businessmen in. 226 Second Industrial Revolution in. 3.
4. 12 trade unions in. 193
Germany. West ("Germany" in con-temporary time period)
and Cheil wool. 237 HEMCO technology. from. 280 Korean technology fr' . . • 233 steel costs and effiden.'! in. 296.
298. 299. 300 GNP. Korean. 55. 56. 57
and stabilization policies. 96. 99 f and trade ratio. 72
�Goldstar. See Lucky-Goldstar group Govan (Scottish shipyard). 277. 279 Government. See State

Subject Index 365
Government Audit Report on lIIidt Wealth, 39-40
Government budgets, balancing of (KorealjapanfI'aiwan), 88, 90
Government spending, for Korea vs. other countries, 92. 93
Great Britain. See Britain Gross National Product, Korean. See
GNP, Korean Gross rate of return, for various Ko
rean industries, 85-87 Growth, economic
and democracy vs. dictatorship, 148 in dynamic of late industrialization,
109-1 2, 1 13, 146, 150, 323 and exports, 154 through innovation vs. learning, 4-5
Growth effects, I I I ' Growth in Korean economy, 55-57
in dynamic of late industrialization, 152-53
during high-aid era, 40-41 and nationally-owned firms, 147 as post-coup goal, 49 and profit maximization, 88 stabilization policies for, 93-94, See
also Stabilization policies, Korean
Handicrafts, 193-95 Han'Cuk Fertilizer Company, 236 Han'guk Nylon Factory, 78 Hangul generation, 52 Hanjin group, diversification by, 125 Heavy industry, 246
and big business, 131 Big Push into, vi , 16, 81 . See also Big
Push into heavy Industry as capital widening vs. capital deep
ening, 246-47, 268 and catching-up process, 19-20 disaffection in machinery branch of,
103 foreign d" as financing for, 95-96 growth 01, '}5, 58
'
increased share to, 152 investment and productivity in, 107-
8 '
and japanese occupation. 34 POSCO as turn toward. 293 ROI of; 88, 89 state promotion of, 81
Hierarchical structure, in Korean ... r. firms, 172-73 'l History of Korea, modern, 27-29
/'during Cold War, 35-38 \ and contradiction
,
S of modernization. 31-35
and legacy of Yi dynasty, 29-31
military regime policies in, 63-64 new business group rises, 39-41 and U.S. aid, 38-39
Hong Kong firm size and value-added in, 162 high-fashion houses in, 260 investment by, 1 1 9 and late industrialization through
learning, 4, 140 and textiles, 249 trade coefficient of, 70, 72 workweek length in, 205
, (HUman capital \ education as, 239
\ indicators of (seven countries), 218 in Korea, 46
J.!yosung (chaebol). 132 \.I Hyundai (group), 73 , cement firm in. 262 diversification by, 1 16. 125, 128 HHI helped by. 270-71, 286-87 joint ventures by, 83 subsidiaries in studied. 16 total capabilities as strength of, 273 and VLSI Project, 83
Hyundai Cement Company, 266-67 and HHI, 287
Hyundai Construction Company and HHI, 269n, 276, 286 and U.S. military. 232, 266
Hyundai Engine and Heavy Machinery Manufacturing Company (HEMCO). 279-80
Hyundai Heavy Industries (HHI), 269-74
cost control at, 282. 284-86 arid design capability, 273, 279 foreign technical assistance for, 276-
77, 278 Hyundai group mobilized fpr, 286-
87 ' and Korean government, 273-76 nonshipbuildirig to total exports ra-
tio for, 290 ' problems of, 277, 278-79, 281, 289

366 SUBJEcr INDEX
Hyundai Heavy Industries (HHI) (cemt.) project management at. 288-89 quality control at. 280-82. 283. 289 . R&D by, 287-88
Hyundai Merchant Marine Company. 279�80. 278
Hyundai Motor Company (HMC), 1 75-79
founding of. 267 GM compared with. 179-80 and HHI. 286 QCCs in. 281 and Shinjin. 1 5 subcontracting by. 179, 180. 184-87
Hyundai Precision Industries, 184
Illicit wealth. See Profiteering and illicit wealth
IMF. See International Monetary Fund. in Korea
Imitation. 20. 329 Imports. Korean
barriers to, 145 and liberalization. 77, 145 restrictions on. 70
Import substitution, and Indian handi· crafts, 194
Import substitution. Korean. See also Diversification; Subsidies. Korean
in accumulation model, 63 and automobile industry. 85. 1 55 and diversifiea··b;J-si�e�s g��up, 243.
246 and electronics. 82 foreign debt as financing for. 95-96 government role in. 80 importance of early efforts in. 268 measurement bias in. 155n . new wave of, 81 and profitability, 88 and steel industry. 316 subsi<iies for, 155
Income per capita. in Korea. 48 Income distribution, Korean. 16- 17n
and agricu1turelland reform. 38, 146 and post-coup goals. 49
India. v and democracy-expansion relation.
148 diversified business groups in. 1 5 1 and five-year plan. 84 human capitai indicators in. 218
investment by. l l8. 1 19 and Korea (income). 48 and labor organization. 194 large and small firms in. 161 and late industrialization through
learning, 4, 140, 320 and multinationals. 147 as potential competitor for Japan, 63 school population of, 217 and steelmaking. 291 , 314 subsidies in, vi, 8 technical assistance to. 215 wage increases in, 196 zaibatsu-like groups in, 1 1 5
Industrial enterprise. modern. See Modern industrial enterprise
Industrialization. See also Late indus-trialization
catching-up process in. 18-20 and concentration, 1 15 relative speeds of, 5-8 and salaried manager, 1 59 state role in, 1 1-18
Industrialization. Korean, 7-8 and Japanese colonialism, 33-34
Industrial' policy. See State Industrial Revolution, First, 3, 4
apprenticeship in, 224 and education. 216 guided by laissez-Caire principles, 12.
143 invention in, v. 4, 6. 59 vs. late Industrialization through
learning. 4-5 scientific content of. 6
Industrial Revolution, Second, 3, 4 and education, 216, 226 inCant industry protected in, 143 innovation in. 6. See also Innovation vs. late industrialization through
learning, 4-5 and Schumpeterian view, 140 scientific content of, 6-7 state intervention in, 12-13
lnfl"tion, in Korea. 100-101 . 102 and Big Push, 103 Far East vs. Latin America, 202 and growth/stability relation, 49-50 and 19605 policies, 142 and 19805 austerity program, 109 and U.S. occupation. 44
Informal sector. in Korea, ISS Infrastructure, Korean

Subject Index 367
from colonial past, 32, 142 financing of, 95-96 and government subsidizes for HHI,
276 and government for POSCO, 297
Innovation, 6-7 and catching-up process, 18, 59,
328-29 and earlier industrializing nations, v,
4 and entrepreneurship, 79 and GM subcontracting, 179 and lack of theoretical knowledge,
22 and late industrialization, 141 and learning, 321 and Schumpeter, 140 U.S. superiority in, 3 19-20
Innovation capability, 1 73, 174 Institutional wear and tear, and Ko
rean stabilization. 10 1-4 Interest rates
and industrial expansion, 144 multiple. 145 state intervention in. 1 3
Interest rates, Korean, 73-74. 96, 97, 144
vs. foreign ( 1965-70). 94 liberalization of, 77. 144 multiple. 144
International aid to Korea. See Foreign aid to Korea; International Monetary Fund. in Korea; World Bank, in Korea
International division of labor. 18-19, 57. 59-63
International Monetary Fund (IMF). in Korea, 64
and austerity meas·ures. 108 and interest rates; 73. 74 and Korean debt buildup. 96, 97 and Korean shipbuilding, 275-76 and U.S. policies. 43
Intraenterprise expansion, 245. See also Diversification
Invention; 6. 3 1 9-20 and earlier industrializing nations, v,
4 and United States, 320
"Invention Award" from Korean government, 237
Inventory systems. just-in-time, 813 Investment
government vs. market determina-tion of. 99-100
and industrial expansion, 144 ' international comparison of, 1 19 private vs. social rates of return on,
322-23 Investment. Korean, 72-76
and chaebol diversification. 128 and oil crisis, 98 state and private' roles in. 85
Investment capability, 173, 174 Iron and Steel Industry Promotion
law (january 1 . 1970), 197 Italy, Hyundai technology from, ) 75
Japan. See also Korea-Japan compari-sons
and bigness, 1 18 capacity reductions in ( 1920). 1 32 and cheap labor. 18 and debate on industry options, 324 distribution of large firms by indus-
try in, 165 diversified business groups in. 125.
1 5 1 . See also Zaibo.lsu economic concentration in, 1 22, 123 and education, 2 15, 216-17, 220,
227 firm size and value-added in, 162 and free market. 149. 322 and government budgets. 88 "Growth-Doubling Plan" of, 84 growth-productivity dynamic in. 1 10 inexperienced engineers in, 229 and international division of labor.
59-63 and international migration, 191.
192 investment by. 1 18. 1 19 Korean diplomatic recognition to,
64, 74, 77 labor supply in, 193-94 and land reform. 147 as late industrializer. v. 4. I I , 12,
140. 320 and liberalization policies, 76-77 military hegemony period in, 1 16-
17 population of. 1 90-91 and Rhee. 42 and salaried managers, 159, 160

368 SUBJECT INDEX
Japan (lorninued) steel costs and efficiency in, 296,
297, 298, 299, 300 subsidies in, 8 textile industry of, 249, 261 trade d.ependence of, 71 and U.S. innovation, 319-20 wage dispersion among industries in.
206, 207 wage increases in, 78, 189, 196, 198 wages sex differential in, 204 and wages vs. technology/organiza
tion, 143 Western interpretation of growth in,
149 workweek length in, 205 �jbatsu of, 9, 61 , 1 1 5. See also Zai
batsu
Japanese colonialism in Korea, 29, 32-33. 34-35. 53
and agriculture. 53 and history of textile firms ("D" and
"L") history. 247 and Korean education, 220 and Korean homogeneity. 28 and Korean steel. 293, 295 and workweek, 10, 206
Japanese influence on Korea in relation to HEMCO components,
280 in relation to HHI marine engines.
279 in relation to Hyundai technology
and equipment, 1 75, 176 in Korean history. 8, 27, 28-29, 31-
35 and Korean investment. 74 and Korean Left. 35-36 and Park on modernization. 51 in quality control circles, 251-52 as shipbuilding cot,npetitor. 271, 282,
284 in smaller firms, 180-83 in steel competition. 297. 306, 307.
3 1 1 , 317-18 subsidies needed for competition
with, 68, 143 through technical assistance. 23, 232,
233. 234. 261. 276. 277. 295-96. 302. 306. 309. 310. 3 15. 316
textile plant reb}(jlt. 248 on workweek length. 205. 206
Johnson, Chalmers, 149 .
Just-in-time (jIT) inventory system, 183
Kanebo Company, 247 Kawasaki Shipbuilding Company. 276.
277 KeiTttsu, 125 Keynesian economics. and U.S. poli-
cies. 43 KIA group, 126 Kolon (dllJebo/). 132 Kolon Nylon. 78 Korea, North. See North Korea Korea, South. 3
and debate on industry options. 324 distribution of large firms by indus-
try in, 165 firm size and value-added in. 162 and free market, 322 Golden Age(s) in. 48, 200, 253 government expenditures in. 93 human capital indicators in. 218 investment rate of. 1 19 as late industrializer. 4. 8-1 1. 146.
320. See also Late industrializing countries
learner-to-creator transition of, 328-29
Olympic Games in. 327. 328 size of. 72 workweek in. 10. 205-6, 212
Korea Democratic Party (KDP). 36-37
Korea-:Japan comparisons colony-colonizer. 141 competition vigor. 145-46 discrimination against women. 203 economic concentration, 121-22 education. 215. 2 16-17. 220. 227 exchange rate policy. 62 exports. 61 . 62 and Hyundai quality circles. 178 income, 48 inflation. 49-50 and Japan as sui generis. 62-63 lah9r costs. 68 land reform. 147 managerial recruitment. 229 productivity. 8. 10, 260, 261 . 300 self-financing. 85 shipbuilding, 269. 271-72. 274.
289n

Subjeci Index 369
small- and medium-size firms. 180-' 83
state discipline. 147 steel-making, 296. 297. 298-300 subsidies. 8-9. 143 wage dispersion among industries.
206. 207 wage increases. J89. 196. J98. 200.
249 wages sex differential. 204 '
Korea-Japan relationship. See Japanese colonialism in Korea; Japanese influence on Korea
Korean agriculture. See Agriculture. Korean; Land reform. Korean
Korean big business; See Big business; Cluubol; Diversified business groups; Modern industrial enterprise
Korean diversified business groups. See Cluubol
Korean education. See Education in Korea
, Korean exports. See EX,ports. Korean Korean government intervention. See
�' State. Korean Korean history. modern. See History of
Korea. modern /Korean industrialization. See Late in
dustrialization in Korea Korean infrastructure. See Infrastruc-
ture. Korean' Korean military. See Military, Korean Korean People's Republic. 36. 38 Korean salaried managers. See Man-
agers. salaried. in Korea Korean Standards Association. 252.
281 '
Korean state. See State. Korean Korean technology transfer, See Tech
nology transfer to Korea Korean-U.S. relation. See United States
relationship with Korea Korean wages. See Wages. Korean Korean War
and cotton textiles industry. 248 and Hyundai Construction. 266 and l(.orean steel mills. 293
Korea Shipbuilding and Engineering Company. 15. 275. 287. 290
Kukje-ICC group. IS Kwangyang steel facility. 293. 294.
306. 309. 317 '
Kyongsong Spinning and Weaving Company. 64
Kyungnam Company. 15
Labor and government subsidy policy. vi
�trikes by. 101 '\fabor. skilled. See Skilled labor or . crafts workers
Labor aristocracy. in Korea. 195 , as male. 204
at Pohang Iron and Steel. 209-1 2 '
and wage segmentation. 208-9 fbor costs. in K,orea. 102. 108
\ bor-intensive industries and managedalism. 166 and need to subsidize. 14. 68. 142-
43 profitability data on. 85. 86 textiles as. 301
Labor market and Korean wages. 206-9 of late industrialization. 1 89-90 segmentation of. 206-9. 2 12
Labor organization (trade unions) lack of. in Far East. 202 and late industrialization. 320 obstacles to. 192-95 Park on. 13 1 in textiles industry (Korea). 251 and wage dispersion (Korea). 208
Labor policies. See Personnel policies. Korean
Labor productivity. Korean. See also
Productivity. Korean in cotton textiles, 249-50, 252-53 growth rate of. 102. 107 of POSCO, 296 of POSCO vs. Japan. 300 in shipbuilding. 272
Labor relations. 324-25 Labor supply
and catching-up process. 18-19 and international migration, 191-92 in Korea, 191 , 1 98-99 and obstacles to labor .,>rganization.
192-95 and population. 190-91
Land reform. Korean under American occupation. 37-38 in Japan and Taiwan. 54. 147 and state power, 52. 147

370 SUBJECT INDEX
Land reform, Korean (cominued) and wages, 202-3
Late industrialization in Korea, 4, BI I, 146, 320
controlling pace of, 99-100 and diversification, 239. See auo Di
versification and state, 27, 99- 100, 147. See auo
State, Korean Late industrializing countries, v, 3, 5,
140 and bigness, 11 B creating of competitiveness in, 292 and democracy vs. dictatorship, 148 difference in histories of, 141-42 and diversification/coordination, 125 diversified business groups in, 1 5 1 ,
244-45. See also Diversified business groups
and education, 10, 215, 216, 227-2B. See abo Education in Korea
facets of growth in, 79 factors promoting, 8. and five-year plan, 84 and free market-efficiency relation,
328
government intervention in, 146 growth-productivity dynamic of,
109-12, 150, 152-53, 323 and intemational lending organiza
tions. 43 labor in, 189, 20B-9. See also Labor
supply .
and labor relations. 324-25 . through learning. v, 3-l?, 141, 150.
See auo Learning, in late industrialization
learning paradigm of, 320:-2 1 and liberal market ideals. 323 oligopolistic compe�tion in. 150 and reindustrialization, 3 1 9 and ;salaried managers, 160. See auo
Managers. salaried and Schumpeterian view. 140-41 small- and medium-size firm in,
16 1-64. See abo Small- and medium-size firms, Korean
social rates of return in, 322-23 and specialization, 155 state role in, 1 1- 14, 55. See·auo State subcontracting in, 187 theory of, vi wages in, 195. See 000 Wages
Latin America and debt. 94 inflation in. 202 population growth in, 191 subsidies in, 143 technical assistance to, 2 1 5
La w for Dealing with Illicit Weaith Accumulation. 72
Learning. See Investment capability; Production capability; Productivity; Shopfloor management; Technology transfer; and indiuiduol industries
Learning. in late industrialization, v, 3-5
and competitiveness. 292 and firm's behavior, 212 vs. innovation, 141 and Korean student movement, vi and Korean wages, 190 and market-augmenting paradigm,
150 and output growth, 1 i 1 and technical assistance, 20
Learning-by-doing, 1 52-53 at HHI, 277, 27B and POSCO, 3 1 7 in textile industry, 249-53
Learning curves for blast furnaces. 303 for textile company ("D"), 250
Liberalization, 76-7B, 94, 120, 1 3 1 , 133-34, 137, 1 4 1
and austerity, 108 . current pressures for. 32B
financial, 134-36 as ineffective. 147 and interest rates, 77. 144 as reaction to aid threats. 142 result of, 136 and theory vs. practice, 322 trade, HI4
Liberal market ideals, 323 Loans, foreign. See Foreign borrowing
by Korea Localization ratio, of POSCO, 3 1 7 Lucky-Goldstar group. 1 9
diversification by, 1 16, 1 26-27 joint ventures by, 83 and VLSI Project, 83
Machine productivity, in "L" company, 252-53. See also Productivity

Subject Index 371
Management, shopftoor. See Shopftoor management
Managerial hierarchy, in Korean firms, 172-73
Managers, salaried, v, 9, 159-6 1 . See also Engineers
and heavy industry, 19, 246 inexperience of, 227-28, 229 in Japanese textile industry, 61 and modern industrial enterprises,
164-67 promotion of, 228-29 technological capabilities of, 17�74
Managers, salaried, in Korea, 9-10 and chaebol diversification, 128 in Cheil Wool, 238 education level of, 225-26 at H HI, 28S-89 inexperience of, 227 and lower wages, 6 1 numbers of, 170-71 at POSCO, 2 13, 315 promotion of, 22S-29 in supplier firms, 188 in textile firms, 259 in top management, 168-70 wage level of, 229-31
Mando, .Inc., 176, 184 Maritime Research Institute, 288 Market-augmenting paradigm, 1 4 1 ,
145, 148, 150, 153 and discipline mechanism, 145-46
Market concentration. See Economic concentration
Market-conforming paradigm, 139, 141 , 145, 147, 153, 155
discipline in, 145 and exports (Koreaffaiwan), 143 hidden premises of, 146 and moral philosophy, 153 and Western views of Japan, 149-50
Market explanation for economic development, 1 1-12'
Marketing, of Japanese textiles, 6 1 Market mechanism o r forces, 4 , 1 1
and agriculture under Japanese, 34
'
and backward countries, 12, 1 3 and dynamics o f comparative advan, tage, 244
dysfunctional aspects of, 322-24 with economic concentration, 137 and efficiency, 99
and Korean "liberalization," 78 and late industrializers, 4 and pace of industrialization, 99-
100 and state role in industrialization,
13-14 U.S. commitment 10, 321-22
Medium-size firms, Korean, 161-64 Japan's influence on, 180-84
Meiji reform and rulers, 14, 5 1-52 Mexico, v
direct foreign investment in, 76 government expenditures in, 93 human capital indicators in, 2 1 8 investment by, 1 18, 1 19 and late industrialization through
learning, 4, 140 ' school population of, 217 wage dispersion ",mong industries in,
207 wage increases in, 196 workweek length in, 205
Migration of workers, international from Korea to Far East, 34 from Korea to Mid-Ea�t, 100, 192n,
198-99 restriction of, and labor supply, 10,
191-92 Military, Korean, 38, 48-52
and April Revolution, 38, 42 Military coup of May 1961, 37, 48, 49,
52, 64, 142 Mitsubishi
at end of WWII, 1 1 7 and Hyundai, 175, 176, 177
Mitsubishi Research Institute (MRI), 3 1 1
Modern industrial enterprise, 9, 123-24, 125, 140, 160, 164
and diversified business group, 1 5 l . See also Diversified business groups
in Korea, 164-68. See also Chaebol organizational chart for, 16,8-70 and small-scale firms, 160
Modernization, contradictions of, 3 1-35. See also Industrialization
Monetary indicators, Korean, 96, 97 , Monetary reform, Korean, 94
Monopolies, in Korea, 120-21 Monopoly power. See also Big business
HHI given temporary, 273 and inequality, 328 and price controls (Korea), 17

372 SUBJECT INDEX
Monopoly Regulation and Fair Trade Act, 1 33
Multidivisional firms, 140. See also Modern industrial enterprise
Multinational corporations, in Korea, 147. See also Direct foreign investment in Korea
Nationalism, growth of, in Korea, 28 Nationalization
of Korean banks, 1 6- 17, 72-73, 142 of Korean heavy electrical equip
ment industry, 132 Nippon Kokkan Steel, 295 Nippon Steel Company, Japan. 292,
295. 296 North Korea
growth of, 40 reform$ in, 36
NTBs (nontariff barriers), 134, 145
Oil crises, Korean response to, 93. 98-99, 101 . 104. 131 , 304-5, 310
Oligopolistic competition, 1 29-30, 150 Oligopoly, 1 15. See. also Big business
in heavy industry, 1 9 in Koreil, 65, 120-21 in late-industrializing countries.
145-46 and market-augmenting paradigm,
150 and market conformance paradigm.
150 Olympic games in Seoul ( 1988), 327.
328 Organizational structure
of GM and Hyundai, 179-S0 HHI advantage from, 286 manage�ial hierarchy (Korea). 172-
73 of modern industrial enterprise,
16S-70 Our Na!iO'/i's path (Park). 50 Overhead, in Korean industry, 10
Paradigm, proper understanding of, 320
Park Chung Hee, and Park regime, 14, 27, 48, 49, 50-52
assassination of, 104, 120, 131 and banking system, 16 Comprehensive Stabilization Plan of,
94, l04, 109 on democratic pluralist policies,
130-31 and' exports, 68,..69, 72 and free market, 322 and higher education, 22 1 and model of accumulation. 63 restructuring under, 132 and Saemaul movement. 2Sin subsidies by, 66 and Tae Joon Park, 295
Paternalism in Korea, 325 of cotton textile firms, 252 and POSCO, 2 1 0
Pay rate. See Wages Peasantry, Korean
under Japanese colonialism, 34, 53-· 54
and Park's ambitions, 52 Personnel policies, Korean
and labor aristocracy. 20S-�. neglect of, 325 at Pohang Iron and Steel, 209- 1 2
Peru firm size and value-added in, 162 government expenditures in, 93
Philippines government expenditures in, 93 large to small firms in, 161 zaibatsu-like groups in, 1 15
Planning entrepreneurship as, 79-S0 in Korea, 79-80, 84-85 Park on, 50-51 and Rhee, 51
Pohang Iron and Steel Company, Ltd. (POSCO). 73, 291-93, 316-18
capacity additions (phases) of. 293, 294, 304, 317
as capital deepening, 303-4 competition for, 298-301 founding of, 293-96, 303 HHI compared with, 269, 277 insularity of, 3 14 'operating rates of, 303 organizational efforts of, 314-16 personnel policies and success of.
209-12, '314 plant specifications of, 294 priorities of, 304-5

Subject Index 373
productivity and yield as aim of, 305-9
profitability of, 296-97 quality as aim of, 309-14 subsidization of, 297, 301 technical assistance to, 295-96,
302-3, 306, 309 Population, and labor supply, 190-91 President's Industrial Award, 248 Price controls, in Korea, 1 7 Prices. See also Relative prices
real estate, 103 state intervention in, 13
Private enterprise and planning (Park), 50 and U.S.lKorean military, 49
Production capability, 173, 174 Production Engineering Department
(PED) of HHI. 284 Production orientation, in Korean
manufacturing, 172. See also Shopfloor management
Productivity and capital deepening, 246-47 in dynamic of late industrialization,
109- 12. 1 13. 150. 323 and engineers, 10 in japan (textile mills), 261 in japan vs. Britain (textile mills). 60 of large vs. smalVmedium-size firms,
163 and late industrialization, 5, 8 and market paradigm. 323 measurement bias in. 1 12n in shipbuilding, 272 and U.S. labor management. 213
Productivity. Korea of automobile industry, 176-79 in dynamic of later industrialization.
5. a. 1 52-53 and government subsidy policy. vi growth of. 1 18-19 of POSCO. 296. 297, 305-9 and POSCO absenteeism/turnover
rate. 2 1 2 of POSCO vs. japan, 300 of shipbuilding industry, 282-86 and stabilization programs. 1 07-8 of textile industry. 78. 249-50, 25 1,
252-53, 260 through welding R&D (HHI), 287
Profitability and Korean industrialization, 88
in various Korean industries, 85-88. 89
Profiteering and illicit wealth chaebol in disfavor for. 64 entrepreneurs subsidized by, 39-40 of Lee. 236 Park regime's prosecution of. 72
Profit maximization long-run approach to (HH1). 287 short-run approach to (Korean tex
tile industry). 253. 255-57 Project management, at HHI. 288-89 Protest
April Revolution (1960). 42-43 as disciplining of state, 148 and Korean stabiliZation policies,
101 Public sector resource balance. 90
Quality control at HH1, 280-82. 283, 289 at Hyundai, 178, 1 79 in Korean textile firm (UL"), 26 1 at POSCO, 309-14 and U.S. influence. 46 .
Quality control circles (QCCs) in cotton textile industry, 251-52 and HHI, 281 at HMC. 178 and personriel function. 325 at POSCO, 310
Quality dumping, 282, 310 Quit rates, at POSCO, 212, 314
Rate of return, gross, for Korean industries, 85-87
Ratio of localization, of POSCO, 317 R&D (research and development), and
education, 227 R&D, in Korea, 328-29
by Cheil Wool, 238 for electronics, 83 and government incentives, 14, 328 and government subsidy policy, vi at HHI, 287 indus�rial activity form, 8 iI)vestment in. 328 by POSCO, 3 1 0- 1 1 , 318 in textile firm ("D"), 248. 249
Real Effective Exchange Rate (REER), 105, 106, 107

374 SUBJECT INDEX
Reform by Japanese in Korea, 32 land, 37-38, 146-47, 202-3 in 1876-1910 period, 28
R�lative prices and exports, 69, 153-55 and margil!al productivity theory,
155 and market conformance, 141. 147-
48 and subsidies, 144 as "wrong" (distorted), v, 13-14, 18,
139, 145, 155, 320 Rent seeking, 20-23, 235. See also Dis
cipline of business; Profiteering and illicit wealth
and government intervention, 16-17. 327
by state or business, 145-47 Research and development. See R&D,
and education; R&D, �orea Restructuring, 132-34 Return on investment (ROl), for light
and heavy 'industry, 88, 89 Rhee, Syngman, and Rhee administra-
tion, 39, 42, '43-44 antagonists of, 27 and banking. 16, 142 corruption of, 43-44, 47 and Lee, 236 and planning. 51 and U.S. aid, 39, 43, 45
Saemaul movement, 281 Sa1a�ed managers. See M;inagers, sa-
laried '
Samho Company, 15 Samsung �Iectronics, 236 Samsung group, 19, 73
Cheil Wool affiliate of, 235-38, 246, 258
diversification by, 1 16, 125 as generalist in manufacturing skills,
258 joint ventures by, 83 management system in, 237-38 in shipbuilding, 272-73, 290 subsidiaries of studied, 16 and VLSI Project, 83
Saudi Arabia, cement plant export to, 267
Savings • .and industrial expansion, 144
Savings, Korean and inftation decline, 109 and interest rate increase. 74, 75, 94 and oil crisis, 98
Schumpeterian view of industrial expansion, 140-4 1, 146, 153
and discipline, 145 Scientific advancement, and invention
vs. innovation, 6 '
Scientific content, and technology transfer, 7
Scotlithgow (Scottish shipbuilder), 276, 278
'
Second Industrial Revolution. See Industrial Revolution. Second
Segmentation of labor market. 212 and Korean wages, 206-9
Self reliance. and technical assistance, 2 1
Shinjin company, 15 Shipbuilding industry
complexity of, 272-73, 289 in Japan, 27 1-72 refusal of delivery in, 278 vs. steelmaking, 272-73, 277 worldwide volume of. 269-70
Shipbuilding industry in Korea, 87 government assistance to, 80-81,
273-76 government favoritism in, 73 by Hyundal Heavy Industries. 269-
89. See aI.ro Hyundai Heavy Industries
and imPort substitution. 155 Shocks, Korean response to, 93, 146 Shopftoor management, v. 160. See also
, Engineers; Productivity; and specific industries
in cement, 262-67 competitive advantage in, 4-5. 10 in cotton textile mills (Korea). 253,
260':"61 at Hyundai Motors, 176-79 in new-technology industries (Ko-
rea), 209, 212-13 and overhead, 321 in POSCO, 2 12- 13. 305-9, 3 14-16 in U.S., 213
Short-run profit-maximizing behavior, in Korean cotton tex!iles industry, 20, 253, 255, 257
Short-run stabilization policies, Korea. See Stabilization policies, Korean

Subject Iridex 375
Singapore education and human capital in,
2 17, 218 investment by, 1 18, 1 19 and late industrialization through
learning, 4, 140 and textiles, 249 trdde coefficient of, 70, 72
Skilled labor or craftsworkers and art vs. science, 7 and Korean shipyards, 284 late industrializers' lack of, 193 as male (Korea). 204 scarcity of (Korea). 2,24-25 and U.S. labOr management, 2 13 and vocational training (Korea).
223-24 and wage dispersion (Korea), 208-9
Small- and Medium-Industry Systemization Law, 188
Small- and medium-size firms, Korean, 161-64. See also Subcontracting
cartelization of, 1 83n government discrimination against,
18 1-82 '
and Hyundai subcontracting, 180 Japan's influence on. 180-84
Social discount rates, 322-23 Social services, in Korea, 18, 92 South Korea. See Korea, South Specialization, and late-industrializing
countries. 32g-24 Spinners' and Weavers' Association of
Korea, 64. 65 survey of. 66
Spinning of cotton. See Colton textile industry. Korean
Spin-off firm, 245 Ssangyong Cement Company, 262, 265
R & D by, 328-29 Ssangyong group. 15, 73; 132 Stabilization policies, Korean, 93-94.
109 and austerity, 108-9 debt tinancing, 94-96 and determining pace of industriali-
zation, 99-100 and first stabilization. 96-98. and inflation, 100-101 , 102, 108-9 institutional wear and tear from,
101-4 productivity as key in, 107-8 and second stabilization. 98-99
and third stabilization, 104-6 Stages theories, 244, 246 State (government). 1 1-18
discipline of business by, 14-18, 63-64. 120, 129. 145-47. See also Discipline of business; Rent seeking
as entrepreneur, 79-80. 84, 144 and growth-productivitY dynamic.
1 12. 1 13, 150 hostility toward in United States, 321 and liberal market ideals, 323 vs. market mechanism, 13- 14, 99-
100 and relative prices, v, 13-14, 18,
147-48, 320 subsidies from, 8-9, 143-44. See abo
Subsidies in Taiwan, 162
State (government), Korean, 146 and accumulation model, 63-64 big business in harmony with. 130,
1 36, 15 1 and chaebol, 88, 152 consolidation of power by, 52 and democratization, 327-28 and entrepreneurship, 17, 80-93.
1 12 and HHl/shipbuilding, 273-276 industrialization pace determined 'by,
99-100 Industrialization retarded by, 27 intervention by, 14-18 investment by, 72-76, 88, 90-92 and Japanese occupation, 47 and land reform. 37 "liberalizatibn" policies of, 76-77 vs. market mechanism, 78 Park on, 50 and POSCO, 292, 315, 316. 3 17 protest as disciplining of, 148 stabilization policies of, 93-109 subsidies from. v-vi. 235. See abo
Subsidies, Korean and wage determination, 200 and "wrong" relative prices, v, 13-
14, 18, 139, 145, 155, 320 and Vi dynasty (Pallais), 29-30
Statistical quality control (SQC), 282, 310
Steel industry, shipbuilding compared with, 273, 277
Steel industry in Korea, 87, 291 costs for, 296, 297, 298, 299. 300

376 SUBJECT INDEX
Steel industry in Korea (continued) government favoritism in, 73 history of, 293 and import substitution, 1 55 minimills, 73, 301 , 3 16n Pohang Iron and Steel, 291-318. See
also Pohang Iron and Steel Company, Ltd.
shipbuilding dependent on, 274 wage differ.ence for, 251
Students, Korean, vi, 52 vs. military/U.S., 42, 48 protests by, 42-43, 52, 148
Subcontracting, 161 . See also. SmaIl-and medium-size firms, Korean
by Hyundai Motors, 179, 180, 184-87
by Japanese firms, 183 in Korean industry, 183-84, 187-88 in late industrialization, 187 and POSCO "contracted-out" work
ers, 209- 10, 314 Subsidies. 143-44. 146
to exporters in late industrializing countries. 68
and ideal interest rate. 144 in late-industrializing countries. 8-9.
1 3 i n market-augmenting paradigm.
150 Subsidies. Korean. v-vi. 143
in accumulation model, 63 and capital flight controls, 17-18 and diversification, 127-28 and exports. 66-68, 74. 78 for HHI, 276 .
and investment opportunities, 235 for POSCO, 297, .30 1 progress from, 1 55
Sunkyong group, 135 Synthetic fiber industry. 78
Taihan group. 15 Taiwan, v, vi. 140
agricultural labor force in, 203 .diversified business groups in. 1 5 1 economic concentration in. 12 1 , 122,
123 and education, 215 ·firm size and value-added in. 162 and government budgets. 88 government expenditures in, 93
and Japanese colonialism. 53 and Korea (income), 48 land reform in. 149 large-size firm in, 9 large and small firms in, 161-63 and late industrialization. 4, 1 1 and liberalization policy, 76-77 market-conformance pressures on,
143 as POSCO competitor, 301 reforms in, 141 state discipline in, 146-47 state management needed in, 148 subsidies in, 8, 143 and textiles, 249 trade coefficient of, 70, 72 vertical disintegration in, 245 wage increases in, 196 wages as advantage of. 143 as yacht competitor, 259 .zaibatsu-like groups in. 1 15
Tariffs, Korean, 70, 145, 301 Taxation, in Korea, 18. See also Bud
gets, government Technical assistance. Ste Technology
transfer Technical expertise, and heavy-indus-
try competition. 19 .
Technical training. Korea. See Training for Korean workers; Vocational training, in Korea
Technological capability, elements of. 173-74
Technology Development Promotion Act (1972), 328
Technology and technological change of cement firm (Ssangyong), 265 Cheil Wool acquisition of, 237 in growth model. 1 10 and Japanese education, 220 and Korean/Japanese wage rise, 189 and range of firms, 160-61 as Schumpeterian discipline. 145
Technology trallsfer (technical assistance), 20, 329
business appreciation of, 22-23 in dynamic of late industrialization,
152, 153 by Germany vs. England, 2 1-22 imitation vs. apprenticeship in, 20 and late industrializing countries,
2 15 from POSCO to USX, 292

Subject Index 377
and productivity. I I I and salaried managers. 9 and science. 7 transfer ratio for. 264
Technology transfer to Korea. 20. 2 1 . 22, 23. See also Japanese influence on Korea
for cement industry. 262. 263. 264. 266-67
to Cheil Wool. 238 for electronics. 82 and HEMCO standards. 280 for HHI. 276-77. 278 for HMC. 175 from independent consultants. 234.
248 from machinery suppliers. 233-234.
248-49 through overseas learning. 233 for POSCO. 295-96. 302-3, 306.
309 by sector and plan period. 263 for textile industry. 6 1 . 248. 249.
255-57, 261 . 263-64 from u.s .. 23 1-33. 234. 266 and wages. 190. 209
Terms of trade. Korean. 56 deterioration and.improvement of
( 1979-82). 104 Textile industry. See also Cotton textile
industry. Korean ' and cement iridustrY, 262-64 Cheil Wool in. 236-3B factors in success of. 78 vs. steel industry. 304 and synthetic fibers, 248 wages in, ,207
Thailand government expenditures. 93 zaihal.lu-like groups in, 1 1 5
Time and motion studies. at HHI, 2B2. 284
Tokugawa regime, of Japan. 8, 29 Tongyang Cement Corporation. 73 Top management in Korea. 1 6B-70 Toyo-Company, 247 Toyota 'Corporation. and Daweoo Mo
tors, 1 84 Trade associations. Japanese, 6 1 Trade liberalization. 134. See also Lib
eralization Trade policies. Korean. 64-70
" export dependence of, 70-72
Trade unions. See Labor organization Training for Korean workers. See also
Education in Korea; Vocational training. in Korea
abroad. 22. 302, 305 at HHI. 227. 282 at Hyundai Cement. 267 at POSCO. 2 1 0-1 1 . 301 . 302-3.
305-6 U.S. aid for. 46
Turkey, v diversified business groups in. 151 firm size and value-added in. 162 human, capital indicators in, 2 1 8 large to small firms in, 1 6 1 and late industrialization through
learning. 4. 140 and steelmaking, 291 subsidies in. vi. 8 wage increases in, 196
Turnover rates, at pasco, 2 1 2, 314
Underdevelopment. and population, 1 1
Underemployment, and exports. 72 Unemployment in. Korea
among educated, 216, 22 1 . 3.15 in 1960, 48 in 1 978-85. 107
Unions. See Labor organization United Kingdom. See Britain United States
conglomeration in, 124 and debate on 'industry options, 324 distribution of large firms by indus-
try in. 165 diversification in, 1 1 5. 1 24. 126 education-uneducated conHict in,
226-27 firm size and value-added in. 162 Hyundai technology from, 1 75 and innovation, v. 7. IB, 59, 3 19-20 and interest rates. 73-74 investment by, 1 19 am;! Japanese annexation of Korea,
3 1 labor management in, 2 1 3 labor relations in. 325 and market mechanism. 321-22 merger movement in. 1 32 modern industrial enterprise in. 1 23 population of. 190-91 school population of. 2 1 7

378 SUBJECf INDEX
United States (continued) Second Industrial Revolution in, 3,
4, 1 2 self-financing in, 85 shipbuilding by. 271 steel costs and efficiency in. 296.
297. 298. 300 steel prices in, 3 17-18 trade dependence of, 71 trade unions in. 193 vertical disintegration in, 245 wages in. 59. 197-98. 207, 231 and wages vs. technology/organiza-
tion. 143 white-collar vs. blue-collar workers
in. 1 7 1 workweek length in, 205
United States relationship with Korea aid, 38-39. 43, 45. 46-47, 52, 64, 67 economic policies. 43-44 educational assistance, 220 and Korean cotton-textile exports,
56-57. 66. 143 and Korean exchange rate. 105 and Korean history. 27 and Korean liberalization, 1 35 and Korean military, 49 and liberalization, 328 and occupation. 36-39. 47 radical opposition to (Korea), 43 steel-coal joint venture, 314 steel export restrictions. 301 n technical agreement, 43 technology transfer. 231-33. 234,
266 United States Steel (USX). and
POSCO, 291-2. 318
Vertical disintegration, 245 Vertical integration�
by Cheil Wool. 238 and GM, 179 " by Hyundai group, 125, 278 and Hyundai Motors, 180 by KSEC, 290
VLSI Project. 83 Vocational training. in Korea, 223-25.
See also Training for Korean workers "
as compulsory, 252 and universities, 228
Voest-Alpine steel firm. 302
Wage dispersion, 10, 206-9 Wages
as comparative edge, 143. 292 in early industrializers. 196-98 international comparison of, 230-3 1"
and international division of labor, 59, 60-61
"
in Japan, 78. 189, 196, 198. 204, 206, 207
in Japan vs. Britain, 60 in late industrializers, 5. 10, 195
Wages. Korean, 10, 1 89, 195, 196. 197. 198-200
and agricultural sector, 202-3 and demand for labor, 200-201 and educational level, 229-3 1 fall and growth of ( 1980s), 108 growth of (1976-78). 100-101 .
102 inequity of, 146 vs. Japan (steelmaking). 300 and length of workweek. 205-6 and low wage base, 189. 202 and paternalism/peace, 325 at POSCO, 209-10. 2 1 2, 296. 3 18 and R&D. 3"28 and segmentation. 206-9, 2 1 2 and state intervention. 208 and technology transfer. 190. 209 in textiles industry, 249, 251 and women workers. 10. 1 72. 203-4 and world markets, v, 56, 61 , 63
Welding Research Institute. 287-88 "Western Europe
Industrial Revolution in. 5-6 steel prices in, 3 18 and U.S. aid (Korea compared with).
64 workweek length in. 205-6
White-collar workers in "Korean industry. \0 proportion of. in Korea and U.S . •
17 1-72 Windfall gains. 235
from aid. 39-40" See also Profiteering and illicit wealth; Rent seeking
Women. Korean discrimination against, 10, 172, 203-
4 as workers, 203-4. 208. 222
in textile mills. 250-51, 252 Workers. attitude of. at Hyundai. "
178

. SubJecl Index 379
Workers. migration of. See Migration of workers. international .
Work force Korean. 10 Middle East migration of (Korean).
100 Workweek length. 205-6
Korean. 1 0. 205. 206 at POSCO, 212
World Bank, in Korea, 64 . See also BTeUm Woods inslitulUms
and Korean shipbuilding, 275-76 on Korean steelmaking. 291 and liberalization, 133 survey by, 144 and U.S. policies, 43
World War I, and Japan in Asian market, 62
World War II , and zaibatsu, 34, 1 17
Yangban class entrepreneurs from, 33 and KDP, 37
Yi dynasty, 29-31
Zaibatsu (japan), 9. 61 . 115 diversification of. i25, 127 and Korean industrialization, 34 and medium/small. enterprises, 181 WWlI success of, 1 17
Zero Defect campaign, at POSCO, 310
Copyright © 2022 FDOKUMEN