Comparisons of Curative Effects of Chlorophyll fromSauropus ...
Upload
khangminh22Category
view
3download
0
J. Agr. Sci. Tech. (2015) Vol. 17: 1873-1886
1873
Relationship between Chlorophyll and other Features in
Durum Wheat (Triticum turgidum L. var. durum)
Using SPAD and Biplot Analyses
E. Kendal1
ABSTRACT
The aim of this study was to evaluate Genotype×Environment Interaction (GEI) of
chlorophyll meter readings (SPAD) of ten durum wheat cultivars, using data obtained
from multi-environment trials during two years, at eight locations. Stability and genotypic
superiority for SPAD reading was identified using ANOVA and GGE biplot analysis.
Furthermore, the interrelationships among SPAD reading and other yield components
and cultivars-by-traits, environment-by-traits, and cultivars-by-environment were
studied using scatter, ranking, and comparison of biplot techniques. Substantial
variations were found among SPAD reading, yield components, and quality criteria as
related to each other, environment, and cultivars. There were positive correlations among
SPAD reading with GY, some quality criteria [Protein Content (PC); Wet Gluten (WG),
Vitreous Kernels (VIT)], and yield components [stalks m-2 (SS); ear m-2 (ES); Plant
Height (PH), Length of Spike (LS)], while Maturation Time (MT) had negative
correlation with SPAD. Also, there was relationship among SPAD and SC (Semolina
Color) and SDS (Mini Sedimentation) with obtuse angles (< 900), but the correlation was
not significant. The GGE biplot indicated that Kızıltepe environment (E6) and Eyyubi
cultivar (G3) were the best in terms of SPAD reading. The GGE biplot provided useful
information for experimentation of SPAD readings of cultivars when grown under multi-
environment. Moreover, SPAD should be considered as the preferred tool, when the
breeder is looking for the best and useful tool to determine flag leaf chlorophyll content.
Keywords: Chlorophyll, Cultivar-environment interaction, GGE biplot, Wheat.
_____________________________________________________________________________ 1 Department of Crops and Animal Production, Kiziltepe Vocational Training High School, Artuklu University,
Kiziltepe, Mardin, Turkey, e-mail: [email protected]
INTRODUCTION
Durum wheat (Triticum durum Desf.) is
produced in some special agro-ecological
zones of Turkey. Generally, it has been well
adapted to Aegean, Mediterranean, and
southeastern Anatolian regions and some
part of central Anatolia (Feldman, 2001).
Southeastern Anatolian region is particularly
known as gene center of durum wheat, due
to Karacadağ basin (Ozkan et al., 2011).
Durum wheat has been cultivated with high
yield and best quality in southeastern
Anatolian region. But, based on
meteorological data, the conditions are
changing from part to part of this region,
with different soil type and altitude.
Although a lot of study has been made in
this region on yield, yield components, and
quality criteria, there are no adequate studies
examining the physiological properties
(Ozlem, 2014).
Durum wheat is adapted to regions having
dry climate, with difference in day and night
temperature throughout the growing period,
characteristic of Mediterranean climates
where drought is the main abiotic stress
limiting crop production (Bozzini, 1988).
Also, it is widely grown under rain-fed
environment, where dryness and heat stress
ordinarily occurs and effect the grain
formation period (Simane et al., 1993). The
____________________________________________________________________________ Kendal
1874
effects of dryness stress on the yield and
other traits of durum wheat at different
growth phases have been the topic of many
studies (Javed et al., 2011). However, there
are few studies on the relations between
chlorophyll and yield components of wheat
cultivars, especially in those dry
environments, under irrigation conditions.
High chlorophyll content is a desirable
characteristic because it shows a low degree
of photo inhibition of the photosynthetic
process in the Mediterranean, thus,
decreasing carbohydrates losses affecting
cereal development (Farquhar et al., 1998).
Spectral reflectance has also been
improved to forecast the concentration of
different leaf pigments such as chlorophyll
and carotenoid. Changes in photosynthesis
more nearly parallels change in chlorophyll
content; all changes happen throughout the
grain filling stage which affects the grain
weight (Guendouza and Maamarı, 2012). A
portable field chlorophyll meter (SPAD) has
been broadly used in the last years,
practically to control the relationship
between chlorophyll content with yield
components (Peltonen et al., 1995).
Moreover, SPAD values correlated with
diverse photosynthetic parameters, such as
foliar structure (Araus et al., 1997). These
simple devices can be used in practical
breeding programs at early generations when
a large number of genotypes must be
screened (Schuhwerk, 2011).
A positive relation between SPAD reading
and grain protein content has been found in
durum wheat under rainfed conditions
(Rharrabti et al., 2001). Bavec and Bavec
(2001) reported that the relationships
between SPAD reading and grain yield at
the heading stage were significant, and Jiang
et al. (2004) found similar results for the
middle of the grain filling period in winter
wheat. One of the necessary conditions for
breeding of cultivars with high chlorophyll
content is the presence of genetic diversity
for that trait. Genetic variability for
chlorophyll content exists in winter wheat
(Le Bail et al., 2005), wheat landrace (Hede
et al., 1999), hexaploid and octaploid wheat
amphipods (Yan and Rajcanw, 2002), and
durum wheat (Giunta et al., 2002; Yildirim
et al., 2010), as measured by chlorophyll
meter readings (SPAD).
Plant breeders have been attempting to
develop genotypes with superior grain yield,
quality, and other desirable characteristics
over a wide range of different environmental
conditions. Genotype by Environment
interaction (G×E) makes it difficult to select
the best performing and the most stable
genotypes. G×E refers to the differential
ranking of genotypes among locations or
years. It is an important consideration in
plant breeding programs because it impedes
progress of selection in any given
environment (Yau, 1995). Furthermore,
identification of the genotypes with the
highest chlorophyll content across a number
of environments would be useful to breeders
and producers (Ilker et al., 2011). The aim
of this study was to determine chlorophyll
content of durum wheat cultivars by SPAD
readings, and investigate the relationship
among chlorophyll content, grain yield,
yield components, and quality criteria in
three sub-regions of southeastern Anatolia
region, using the GGE-biplot methodology.
MATERIALS AND METHODS
Plant Material and Experimental
Design
Ten durum wheat cultivars (Table 1) were
evaluated in two rain-fed (Diyarbakir, Hani),
one irrigated (Diyarbakir) and one
supplementary irrigated (Kızıltepe) location
in 2010-2011, and two rainfed (Diyarbakir,
Hazro), one irrigated (Diyarbakir), and one
supplementary irrigated (Kızıltepe) location
in 2011-2012 growing season (Table 2). The
experiment was conducted in a randomized
block design with four replications. The
seeding rate was 450 seeds m-2
. Plot size
was 7.2 m-2
(1.2×6 m) consisting of 6 rows
spaced 20 cm apart. Sowing was done by
Wintersteiger drill. The fertilization rates
used for all plots were 60 kg N ha-1
and 60
Chlorophyll and other Features in Durum Wheat _________________________________
1875
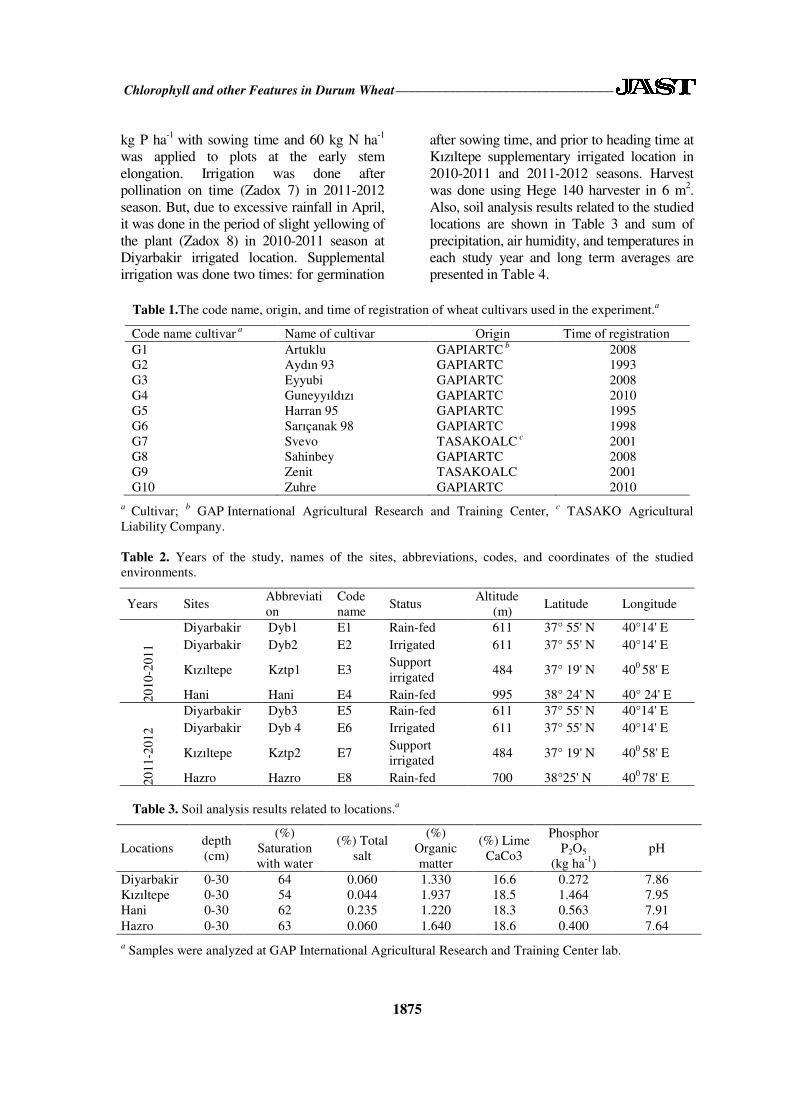
Table 1.The code name, origin, and time of registration of wheat cultivars used in the experiment.a
Code name cultivar a Name of cultivar Origin Time of registration
G1 Artuklu GAPIARTC b 2008
G2 Aydın 93 GAPIARTC 1993
G3 Eyyubi GAPIARTC 2008
G4 Guneyyıldızı GAPIARTC 2010
G5 Harran 95 GAPIARTC 1995
G6 Sarıçanak 98 GAPIARTC 1998
G7 Svevo TASAKOALC c 2001
G8 Sahinbey GAPIARTC 2008
G9 Zenit TASAKOALC 2001
G10 Zuhre GAPIARTC 2010
a Cultivar;
b GAP International Agricultural Research and Training Center,
c TASAKO Agricultural
Liability Company.
Table 2. Years of the study, names of the sites, abbreviations, codes, and coordinates of the studied
environments.
Years Sites Abbreviati
on
Code
name Status
Altitude
(m) Latitude Longitude
20
10-2
01
1
Diyarbakir Dyb1 E1 Rain-fed 611 37° 55' N 40°14' E
Diyarbakir Dyb2 E2 Irrigated 611 37° 55' N 40°14' E
Kızıltepe Kztp1 E3 Support
irrigated 484 37° 19' N 40
0 58' E
Hani Hani E4 Rain-fed 995 38° 24' N 40° 24' E
20
11-2
01
2
Diyarbakir Dyb3 E5 Rain-fed 611 37° 55' N 40°14' E
Diyarbakir Dyb 4 E6 Irrigated 611 37° 55' N 40°14' E
Kızıltepe Kztp2 E7 Support
irrigated 484 37° 19' N 40
0 58' E
Hazro Hazro E8 Rain-fed 700 38°25' N 400 78' E
Table 3. Soil analysis results related to locations.a
Locations depth
(cm)
(%)
Saturation
with water
(%) Total
salt
(%)
Organic
matter
(%) Lime
CaCo3
Phosphor
P2O5
(kg ha-1
)
pH
Diyarbakir 0-30 64 0.060 1.330 16.6 0.272 7.86
Kızıltepe 0-30 54 0.044 1.937 18.5 1.464 7.95
Hani 0-30 62 0.235 1.220 18.3 0.563 7.91
Hazro 0-30 63 0.060 1.640 18.6 0.400 7.64
a Samples were analyzed at GAP International Agricultural Research and Training Center lab.
kg P ha-1
with sowing time and 60 kg N ha-1
was applied to plots at the early stem
elongation. Irrigation was done after
pollination on time (Zadox 7) in 2011-2012
season. But, due to excessive rainfall in April,
it was done in the period of slight yellowing of
the plant (Zadox 8) in 2010-2011 season at
Diyarbakir irrigated location. Supplemental
irrigation was done two times: for germination
after sowing time, and prior to heading time at
Kızıltepe supplementary irrigated location in
2010-2011 and 2011-2012 seasons. Harvest
was done using Hege 140 harvester in 6 m2.
Also, soil analysis results related to the studied
locations are shown in Table 3 and sum of
precipitation, air humidity, and temperatures in
each study year and long term averages are
presented in Table 4.
____________________________________________________________________________ Kendal
1876
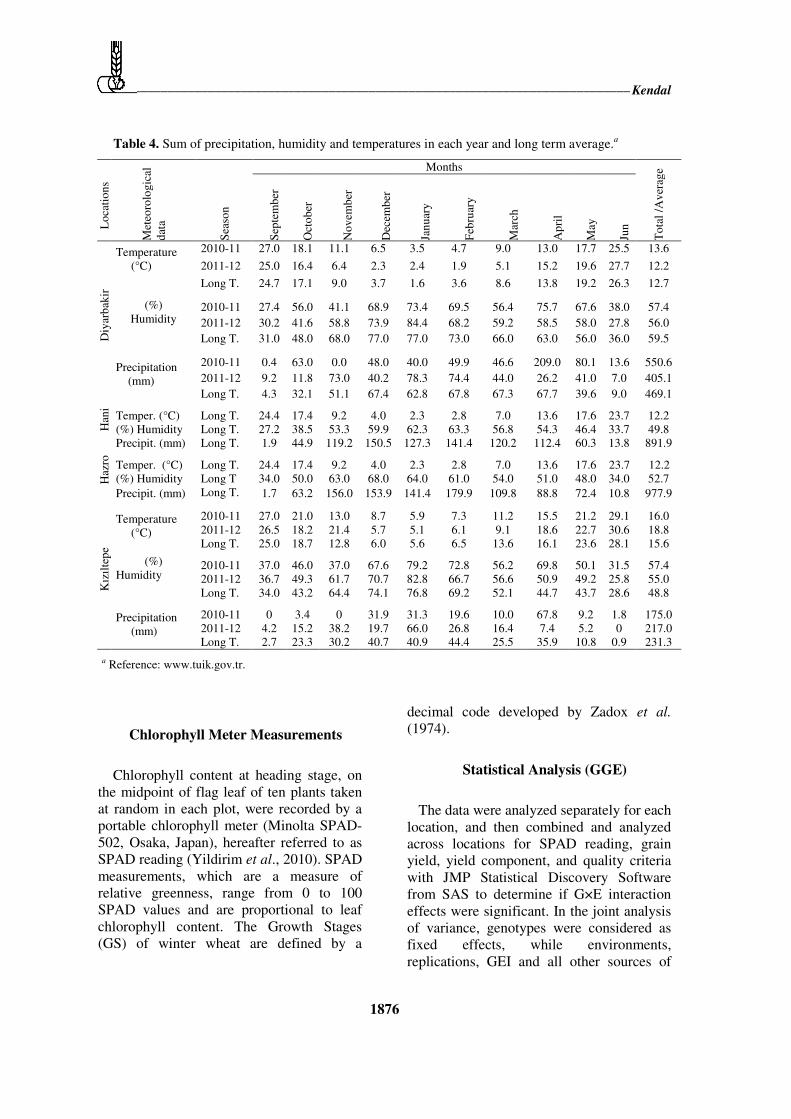
Table 4. Sum of precipitation, humidity and temperatures in each year and long term average.a
Lo
cati
on
s
Met
eoro
log
ical
dat
a
Sea
son
Months
To
tal
/Av
erag
e
Sep
tem
ber
Oct
ob
er
No
vem
ber
Dec
emb
er
Jan
uar
y
Feb
ruar
y
Mar
ch
Ap
ril
May
Jun
Diy
arb
akir
Temperature
(°C)
2010-11 27.0 18.1 11.1 6.5 3.5 4.7 9.0 13.0 17.7 25.5 13.6
2011-12 25.0 16.4 6.4 2.3 2.4 1.9 5.1 15.2 19.6 27.7 12.2
Long T. 24.7 17.1 9.0 3.7 1.6 3.6 8.6 13.8 19.2 26.3 12.7
(%)
Humidity
2010-11 27.4 56.0 41.1 68.9 73.4 69.5 56.4 75.7 67.6 38.0 57.4
2011-12 30.2 41.6 58.8 73.9 84.4 68.2 59.2 58.5 58.0 27.8 56.0
Long T. 31.0 48.0 68.0 77.0 77.0 73.0 66.0 63.0 56.0 36.0 59.5
Precipitation
(mm)
2010-11 0.4 63.0 0.0 48.0 40.0 49.9 46.6 209.0 80.1 13.6 550.6
2011-12 9.2 11.8 73.0 40.2 78.3 74.4 44.0 26.2 41.0 7.0 405.1
Long T. 4.3 32.1 51.1 67.4 62.8 67.8 67.3 67.7 39.6 9.0 469.1
Han
i
Temper. (°C) Long T. 24.4 17.4 9.2 4.0 2.3 2.8 7.0 13.6 17.6 23.7 12.2
(%) Humidity Long T. 27.2 38.5 53.3 59.9 62.3 63.3 56.8 54.3 46.4 33.7 49.8
Precipit. (mm) Long T. 1.9 44.9 119.2 150.5 127.3 141.4 120.2 112.4 60.3 13.8 891.9
Haz
ro
Temper. (°C) Long T. 24.4 17.4 9.2 4.0 2.3 2.8 7.0 13.6 17.6 23.7 12.2
(%) Humidity Long T 34.0 50.0 63.0 68.0 64.0 61.0 54.0 51.0 48.0 34.0 52.7
Precipit. (mm) Long T. 1.7 63.2 156.0 153.9 141.4 179.9 109.8 88.8 72.4 10.8 977.9
Kız
ılte
pe
Temperature
(°C)
2010-11 27.0 21.0 13.0 8.7 5.9 7.3 11.2 15.5 21.2 29.1 16.0
2011-12 26.5 18.2 21.4 5.7 5.1 6.1 9.1 18.6 22.7 30.6 18.8
Long T. 25.0 18.7 12.8 6.0 5.6 6.5 13.6 16.1 23.6 28.1 15.6
(%)
Humidity
2010-11 37.0 46.0 37.0 67.6 79.2 72.8 56.2 69.8 50.1 31.5 57.4
2011-12 36.7 49.3 61.7 70.7 82.8 66.7 56.6 50.9 49.2 25.8 55.0
Long T. 34.0 43.2 64.4 74.1 76.8 69.2 52.1 44.7 43.7 28.6 48.8
Precipitation
(mm)
2010-11 0 3.4 0 31.9 31.3 19.6 10.0 67.8 9.2 1.8 175.0
2011-12 4.2 15.2 38.2 19.7 66.0 26.8 16.4 7.4 5.2 0 217.0
Long T. 2.7 23.3 30.2 40.7 40.9 44.4 25.5 35.9 10.8 0.9 231.3
a Reference: www.tuik.gov.tr.
Chlorophyll Meter Measurements
Chlorophyll content at heading stage, on
the midpoint of flag leaf of ten plants taken
at random in each plot, were recorded by a
portable chlorophyll meter (Minolta SPAD-
502, Osaka, Japan), hereafter referred to as
SPAD reading (Yildirim et al., 2010). SPAD
measurements, which are a measure of
relative greenness, range from 0 to 100
SPAD values and are proportional to leaf
chlorophyll content. The Growth Stages
(GS) of winter wheat are defined by a
decimal code developed by Zadox et al.
(1974).
Statistical Analysis (GGE)
The data were analyzed separately for each
location, and then combined and analyzed
across locations for SPAD reading, grain
yield, yield component, and quality criteria
with JMP Statistical Discovery Software
from SAS to determine if G×E interaction
effects were significant. In the joint analysis
of variance, genotypes were considered as
fixed effects, while environments,
replications, GEI and all other sources of
Chlorophyll and other Features in Durum Wheat _________________________________
1877
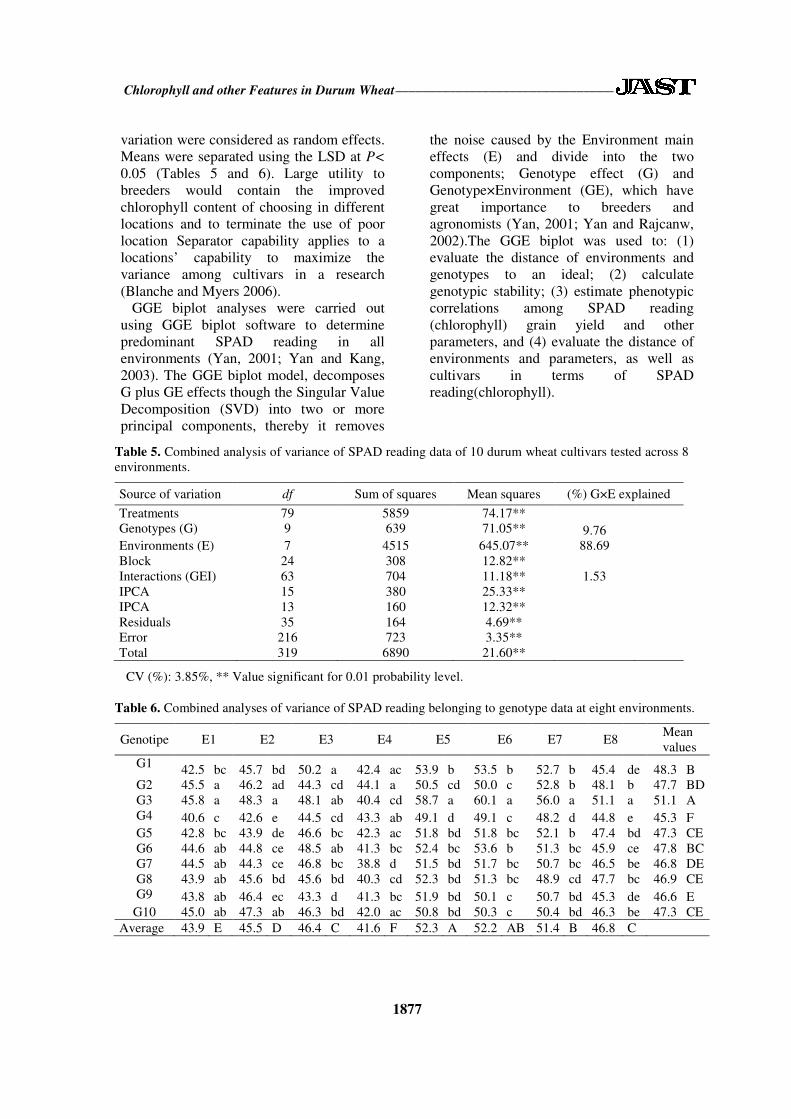
Table 5. Combined analysis of variance of SPAD reading data of 10 durum wheat cultivars tested across 8
environments.
Source of variation df Sum of squares Mean squares (%) G×E explained
Treatments 79 5859 74.17**
Genotypes (G) 9 639 71.05** 9.76
Environments (E) 7 4515 645.07** 88.69
Block 24 308 12.82**
Interactions (GEI) 63 704 11.18** 1.53
IPCA 15 380 25.33**
IPCA 13 160 12.32**
Residuals 35 164 4.69**
Error 216 723 3.35**
Total 319 6890 21.60**
CV (%): 3.85%, ** Value significant for 0.01 probability level.
Table 6. Combined analyses of variance of SPAD reading belonging to genotype data at eight environments.
Genotipe E1 E2 E3 E4 E5 E6 E7 E8 Mean
values
G1 42.5 bc 45.7 bd 50.2 a 42.4 ac 53.9 b 53.5 b 52.7 b 45.4 de 48.3 B
G2 45.5 a 46.2 ad 44.3 cd 44.1 a 50.5 cd 50.0 c 52.8 b 48.1 b 47.7 BD
G3 45.8 a 48.3 a 48.1 ab 40.4 cd 58.7 a 60.1 a 56.0 a 51.1 a 51.1 A
G4 40.6 c 42.6 e 44.5 cd 43.3 ab 49.1 d 49.1 c 48.2 d 44.8 e 45.3 F
G5 42.8 bc 43.9 de 46.6 bc 42.3 ac 51.8 bd 51.8 bc 52.1 b 47.4 bd 47.3 CE
G6 44.6 ab 44.8 ce 48.5 ab 41.3 bc 52.4 bc 53.6 b 51.3 bc 45.9 ce 47.8 BC
G7 44.5 ab 44.3 ce 46.8 bc 38.8 d 51.5 bd 51.7 bc 50.7 bc 46.5 be 46.8 DE
G8 43.9 ab 45.6 bd 45.6 bd 40.3 cd 52.3 bd 51.3 bc 48.9 cd 47.7 bc 46.9 CE
G9 43.8 ab 46.4 ec 43.3 d 41.3 bc 51.9 bd 50.1 c 50.7 bd 45.3 de 46.6 E
G10 45.0 ab 47.3 ab 46.3 bd 42.0 ac 50.8 bd 50.3 c 50.4 bd 46.3 be 47.3 CE
Average 43.9 E 45.5 D 46.4 C 41.6 F 52.3 A 52.2 AB 51.4 B 46.8 C
variation were considered as random effects.
Means were separated using the LSD at P<
0.05 (Tables 5 and 6). Large utility to
breeders would contain the improved
chlorophyll content of choosing in different
locations and to terminate the use of poor
location Separator capability applies to a
locations’ capability to maximize the
variance among cultivars in a research
(Blanche and Myers 2006).
GGE biplot analyses were carried out
using GGE biplot software to determine
predominant SPAD reading in all
environments (Yan, 2001; Yan and Kang,
2003). The GGE biplot model, decomposes
G plus GE effects though the Singular Value
Decomposition (SVD) into two or more
principal components, thereby it removes
the noise caused by the Environment main
effects (E) and divide into the two
components; Genotype effect (G) and
Genotype×Environment (GE), which have
great importance to breeders and
agronomists (Yan, 2001; Yan and Rajcanw,
2002).The GGE biplot was used to: (1)
evaluate the distance of environments and
genotypes to an ideal; (2) calculate
genotypic stability; (3) estimate phenotypic
correlations among SPAD reading
(chlorophyll) grain yield and other
parameters, and (4) evaluate the distance of
environments and parameters, as well as
cultivars in terms of SPAD
reading(chlorophyll).
____________________________________________________________________________ Kendal
1878
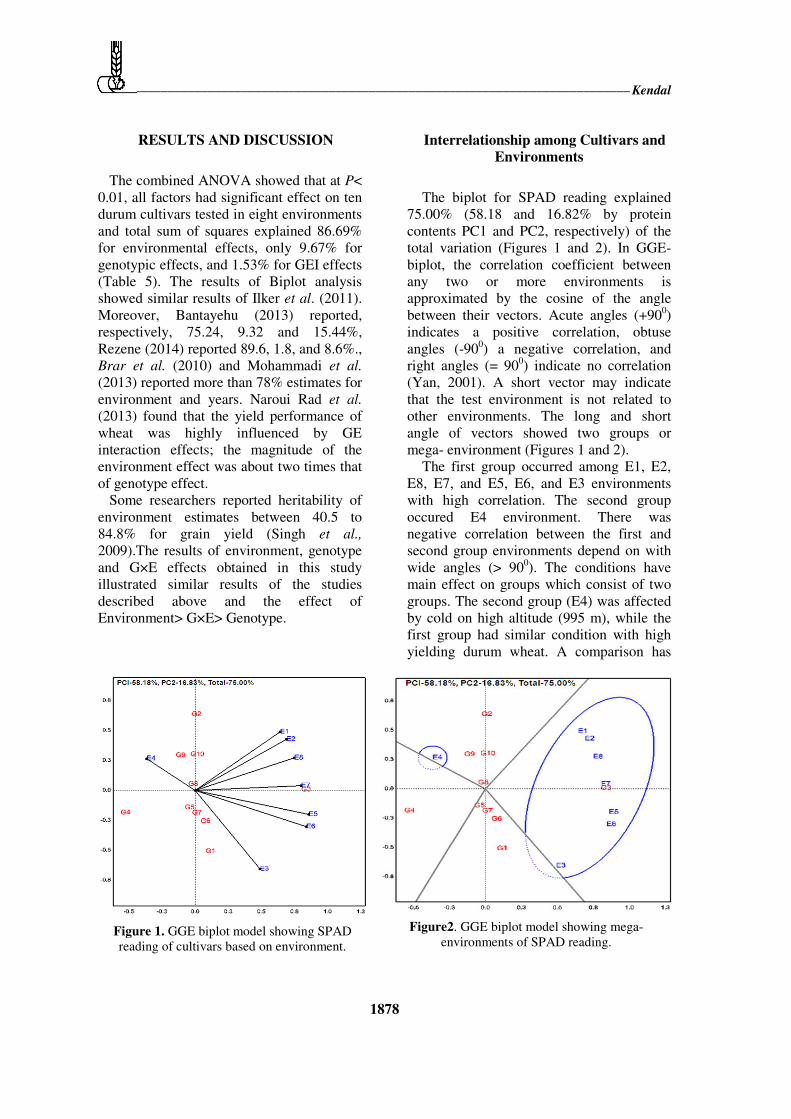
Figure 1. GGE biplot model showing SPAD
reading of cultivars based on environment.
Figure2. GGE biplot model showing mega-
environments of SPAD reading.
RESULTS AND DISCUSSION
The combined ANOVA showed that at P<
0.01, all factors had significant effect on ten
durum cultivars tested in eight environments
and total sum of squares explained 86.69%
for environmental effects, only 9.67% for
genotypic effects, and 1.53% for GEI effects
(Table 5). The results of Biplot analysis
showed similar results of Ilker et al. (2011).
Moreover, Bantayehu (2013) reported,
respectively, 75.24, 9.32 and 15.44%,
Rezene (2014) reported 89.6, 1.8, and 8.6%.,
Brar et al. (2010) and Mohammadi et al.
(2013) reported more than 78% estimates for
environment and years. Naroui Rad et al.
(2013) found that the yield performance of
wheat was highly influenced by GE
interaction effects; the magnitude of the
environment effect was about two times that
of genotype effect.
Some researchers reported heritability of
environment estimates between 40.5 to
84.8% for grain yield (Singh et al.,
2009).The results of environment, genotype
and G×E effects obtained in this study
illustrated similar results of the studies
described above and the effect of
Environment> G×E> Genotype.
Interrelationship among Cultivars and
Environments
The biplot for SPAD reading explained
75.00% (58.18 and 16.82% by protein
contents PC1 and PC2, respectively) of the
total variation (Figures 1 and 2). In GGE-
biplot, the correlation coefficient between
any two or more environments is
approximated by the cosine of the angle
between their vectors. Acute angles (+900)
indicates a positive correlation, obtuse
angles (-900) a negative correlation, and
right angles (= 900) indicate no correlation
(Yan, 2001). A short vector may indicate
that the test environment is not related to
other environments. The long and short
angle of vectors showed two groups or
mega- environment (Figures 1 and 2).
The first group occurred among E1, E2,
E8, E7, and E5, E6, and E3 environments
with high correlation. The second group
occured E4 environment. There was
negative correlation between the first and
second group environments depend on with
wide angles (> 900). The conditions have
main effect on groups which consist of two
groups. The second group (E4) was affected
by cold on high altitude (995 m), while the
first group had similar condition with high
yielding durum wheat. A comparison has
Chlorophyll and other Features in Durum Wheat _________________________________
1879
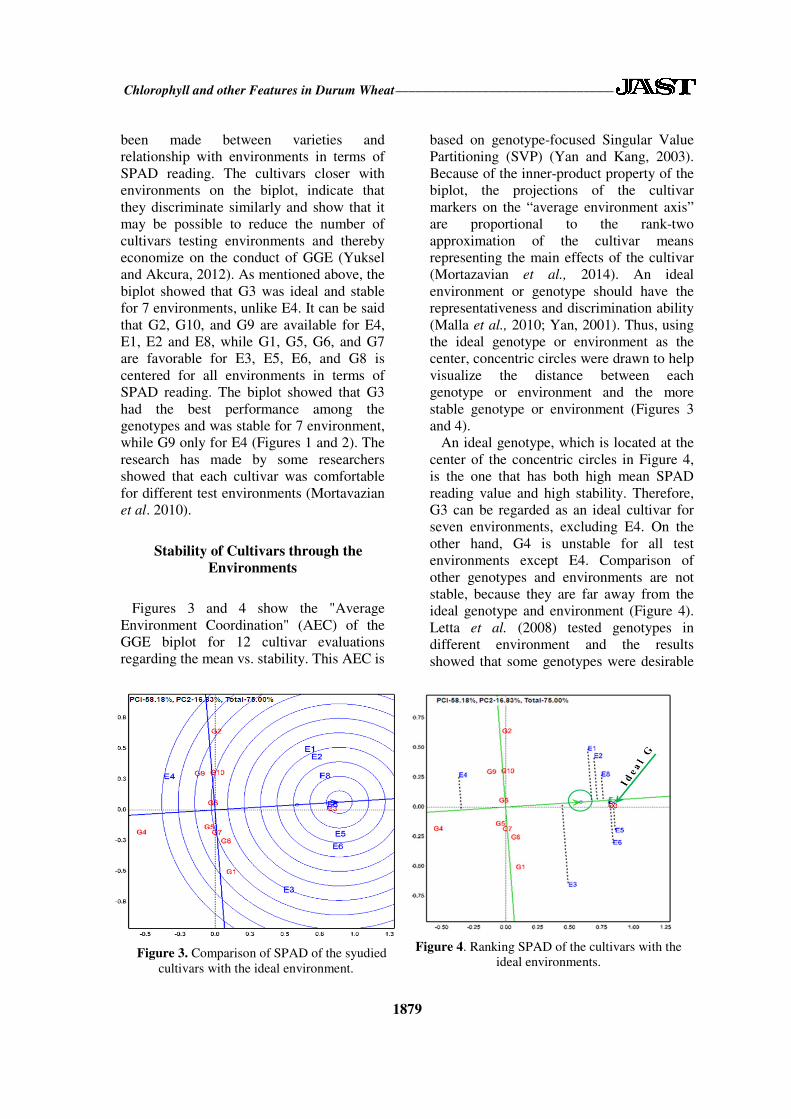
Figure 3. Comparison of SPAD of the syudied
cultivars with the ideal environment.
Figure 4. Ranking SPAD of the cultivars with the
ideal environments.
been made between varieties and
relationship with environments in terms of
SPAD reading. The cultivars closer with
environments on the biplot, indicate that
they discriminate similarly and show that it
may be possible to reduce the number of
cultivars testing environments and thereby
economize on the conduct of GGE (Yuksel
and Akcura, 2012). As mentioned above, the
biplot showed that G3 was ideal and stable
for 7 environments, unlike E4. It can be said
that G2, G10, and G9 are available for E4,
E1, E2 and E8, while G1, G5, G6, and G7
are favorable for E3, E5, E6, and G8 is
centered for all environments in terms of
SPAD reading. The biplot showed that G3
had the best performance among the
genotypes and was stable for 7 environment,
while G9 only for E4 (Figures 1 and 2). The
research has made by some researchers
showed that each cultivar was comfortable
for different test environments (Mortavazian
et al. 2010).
Stability of Cultivars through the
Environments
Figures 3 and 4 show the "Average
Environment Coordination" (AEC) of the
GGE biplot for 12 cultivar evaluations
regarding the mean vs. stability. This AEC is
based on genotype-focused Singular Value
Partitioning (SVP) (Yan and Kang, 2003).
Because of the inner-product property of the
biplot, the projections of the cultivar
markers on the “average environment axis”
are proportional to the rank-two
approximation of the cultivar means
representing the main effects of the cultivar
(Mortazavian et al., 2014). An ideal
environment or genotype should have the
representativeness and discrimination ability
(Malla et al., 2010; Yan, 2001). Thus, using
the ideal genotype or environment as the
center, concentric circles were drawn to help
visualize the distance between each
genotype or environment and the more
stable genotype or environment (Figures 3
and 4).
An ideal genotype, which is located at the
center of the concentric circles in Figure 4,
is the one that has both high mean SPAD
reading value and high stability. Therefore,
G3 can be regarded as an ideal cultivar for
seven environments, excluding E4. On the
other hand, G4 is unstable for all test
environments except E4. Comparison of
other genotypes and environments are not
stable, because they are far away from the
ideal genotype and environment (Figure 4).
Letta et al. (2008) tested genotypes in
different environment and the results
showed that some genotypes were desirable
____________________________________________________________________________ Kendal
1880
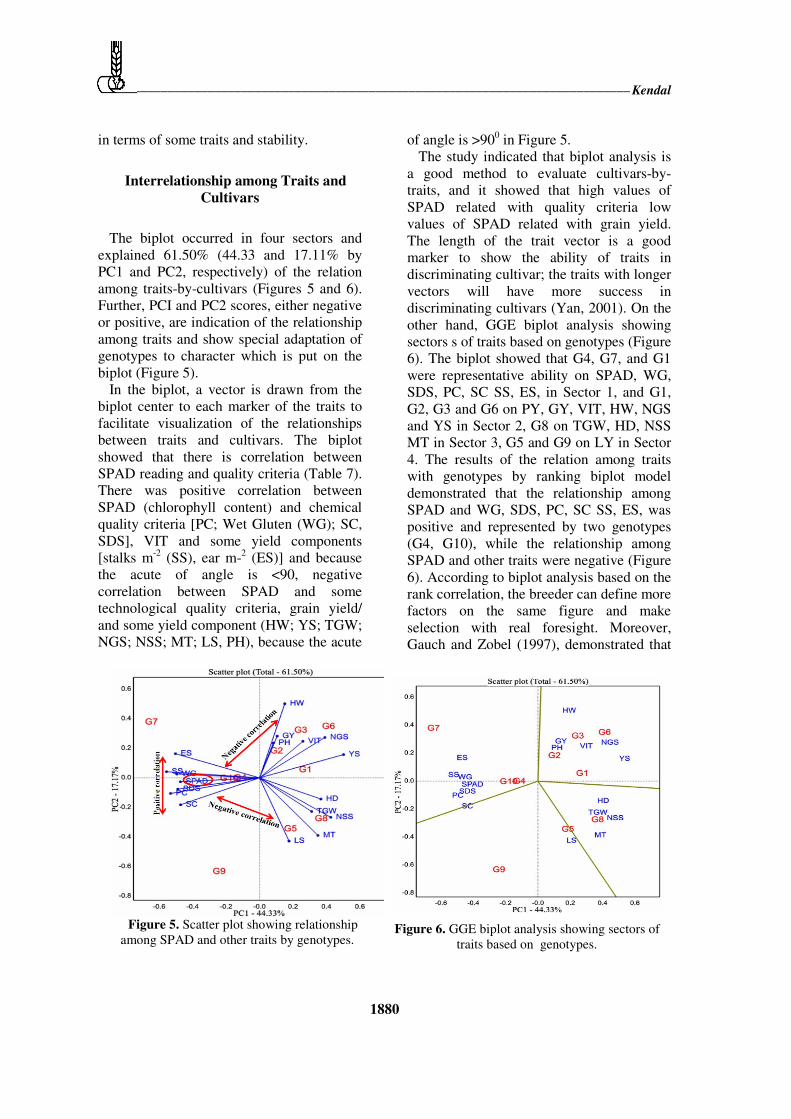
Figure 5. Scatter plot showing relationship
among SPAD and other traits by genotypes.
Figure 6. GGE biplot analysis showing sectors of
traits based on genotypes.
in terms of some traits and stability.
Interrelationship among Traits and
Cultivars
The biplot occurred in four sectors and
explained 61.50% (44.33 and 17.11% by
PC1 and PC2, respectively) of the relation
among traits-by-cultivars (Figures 5 and 6).
Further, PCI and PC2 scores, either negative
or positive, are indication of the relationship
among traits and show special adaptation of
genotypes to character which is put on the
biplot (Figure 5).
In the biplot, a vector is drawn from the
biplot center to each marker of the traits to
facilitate visualization of the relationships
between traits and cultivars. The biplot
showed that there is correlation between
SPAD reading and quality criteria (Table 7).
There was positive correlation between
SPAD (chlorophyll content) and chemical
quality criteria [PC; Wet Gluten (WG); SC,
SDS], VIT and some yield components
[stalks m-2
(SS), ear m-2 (ES)] and because
the acute of angle is <90, negative
correlation between SPAD and some
technological quality criteria, grain yield/
and some yield component (HW; YS; TGW;
NGS; NSS; MT; LS, PH), because the acute
of angle is >900 in Figure 5.
The study indicated that biplot analysis is
a good method to evaluate cultivars-by-
traits, and it showed that high values of
SPAD related with quality criteria low
values of SPAD related with grain yield.
The length of the trait vector is a good
marker to show the ability of traits in
discriminating cultivar; the traits with longer
vectors will have more success in
discriminating cultivars (Yan, 2001). On the
other hand, GGE biplot analysis showing
sectors s of traits based on genotypes (Figure
6). The biplot showed that G4, G7, and G1
were representative ability on SPAD, WG,
SDS, PC, SC SS, ES, in Sector 1, and G1,
G2, G3 and G6 on PY, GY, VIT, HW, NGS
and YS in Sector 2, G8 on TGW, HD, NSS
MT in Sector 3, G5 and G9 on LY in Sector
4. The results of the relation among traits
with genotypes by ranking biplot model
demonstrated that the relationship among
SPAD and WG, SDS, PC, SC SS, ES, was
positive and represented by two genotypes
(G4, G10), while the relationship among
SPAD and other traits were negative (Figure
6). According to biplot analysis based on the
rank correlation, the breeder can define more
factors on the same figure and make
selection with real foresight. Moreover,
Gauch and Zobel (1997), demonstrated that
Chlorophyll and other Features in Durum Wheat _________________________________
1881
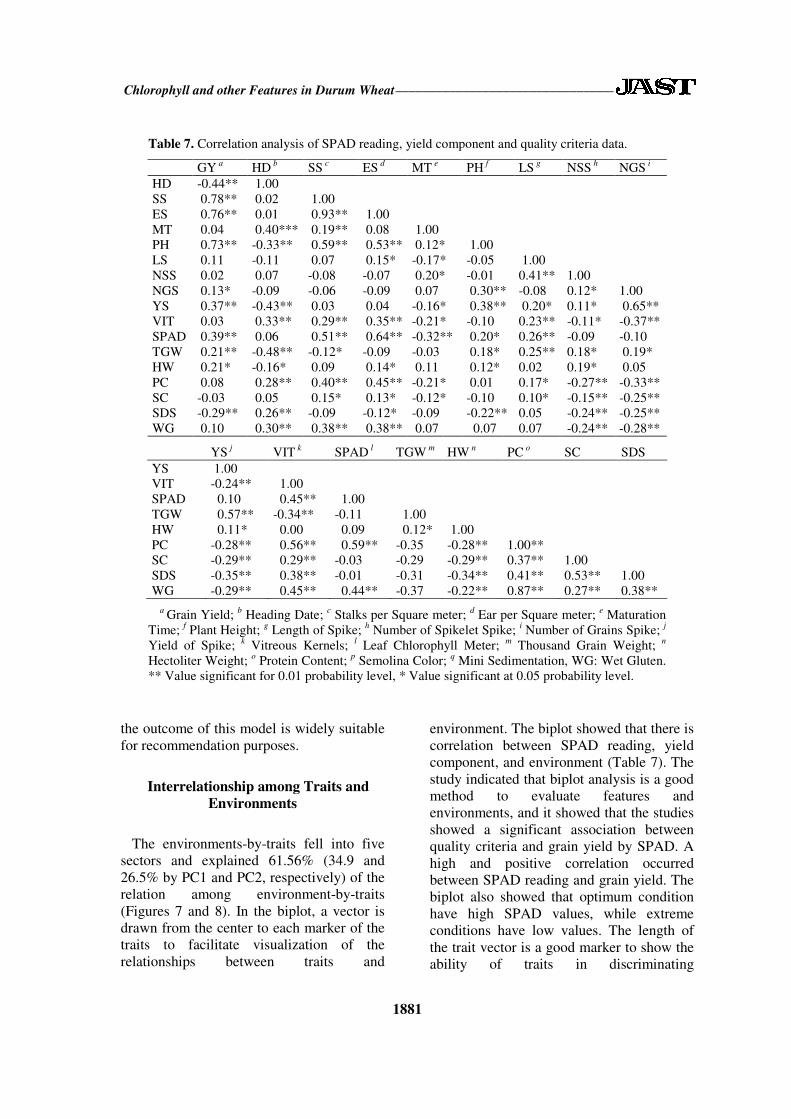
Table 7. Correlation analysis of SPAD reading, yield component and quality criteria data.
GY a HD
b SS
c ES
d MT
e PH
f LS
g NSS
h NGS
i
HD -0.44** 1.00
SS 0.78** 0.02 1.00
ES 0.76** 0.01 0.93** 1.00
MT 0.04 0.40*** 0.19** 0.08 1.00
PH 0.73** -0.33** 0.59** 0.53** 0.12* 1.00
LS 0.11 -0.11 0.07 0.15* -0.17* -0.05 1.00
NSS 0.02 0.07 -0.08 -0.07 0.20* -0.01 0.41** 1.00
NGS 0.13* -0.09 -0.06 -0.09 0.07 0.30** -0.08 0.12* 1.00
YS 0.37** -0.43** 0.03 0.04 -0.16* 0.38** 0.20* 0.11* 0.65**
VIT 0.03 0.33** 0.29** 0.35** -0.21* -0.10 0.23** -0.11* -0.37**
SPAD 0.39** 0.06 0.51** 0.64** -0.32** 0.20* 0.26** -0.09 -0.10
TGW 0.21** -0.48** -0.12* -0.09 -0.03 0.18* 0.25** 0.18* 0.19*
HW 0.21* -0.16* 0.09 0.14* 0.11 0.12* 0.02 0.19* 0.05
PC 0.08 0.28** 0.40** 0.45** -0.21* 0.01 0.17* -0.27** -0.33**
SC -0.03 0.05 0.15* 0.13* -0.12* -0.10 0.10* -0.15** -0.25**
SDS -0.29** 0.26** -0.09 -0.12* -0.09 -0.22** 0.05 -0.24** -0.25**
WG 0.10 0.30** 0.38** 0.38** 0.07 0.07 0.07 -0.24** -0.28**
YS j VIT
k SPAD
l TGW
m HW
n PC
o SC SDS
YS 1.00
VIT -0.24** 1.00
SPAD 0.10 0.45** 1.00
TGW 0.57** -0.34** -0.11 1.00
HW 0.11* 0.00 0.09 0.12* 1.00
PC -0.28** 0.56** 0.59** -0.35 -0.28** 1.00**
SC -0.29** 0.29** -0.03 -0.29 -0.29** 0.37** 1.00
SDS -0.35** 0.38** -0.01 -0.31 -0.34** 0.41** 0.53** 1.00
WG -0.29** 0.45** 0.44** -0.37 -0.22** 0.87** 0.27** 0.38**
a Grain Yield;
b Heading Date;
c Stalks per Square meter;
d Ear per Square meter;
e Maturation
Time; f Plant Height;
g Length of Spike;
h Number of Spikelet Spike;
i Number of Grains Spike;
j
Yield of Spike; k Vitreous Kernels;
l Leaf Chlorophyll Meter;
m Thousand Grain Weight;
n
Hectoliter Weight; o Protein Content;
p Semolina Color;
q Mini Sedimentation, WG: Wet Gluten.
** Value significant for 0.01 probability level, * Value significant at 0.05 probability level.
the outcome of this model is widely suitable
for recommendation purposes.
Interrelationship among Traits and
Environments
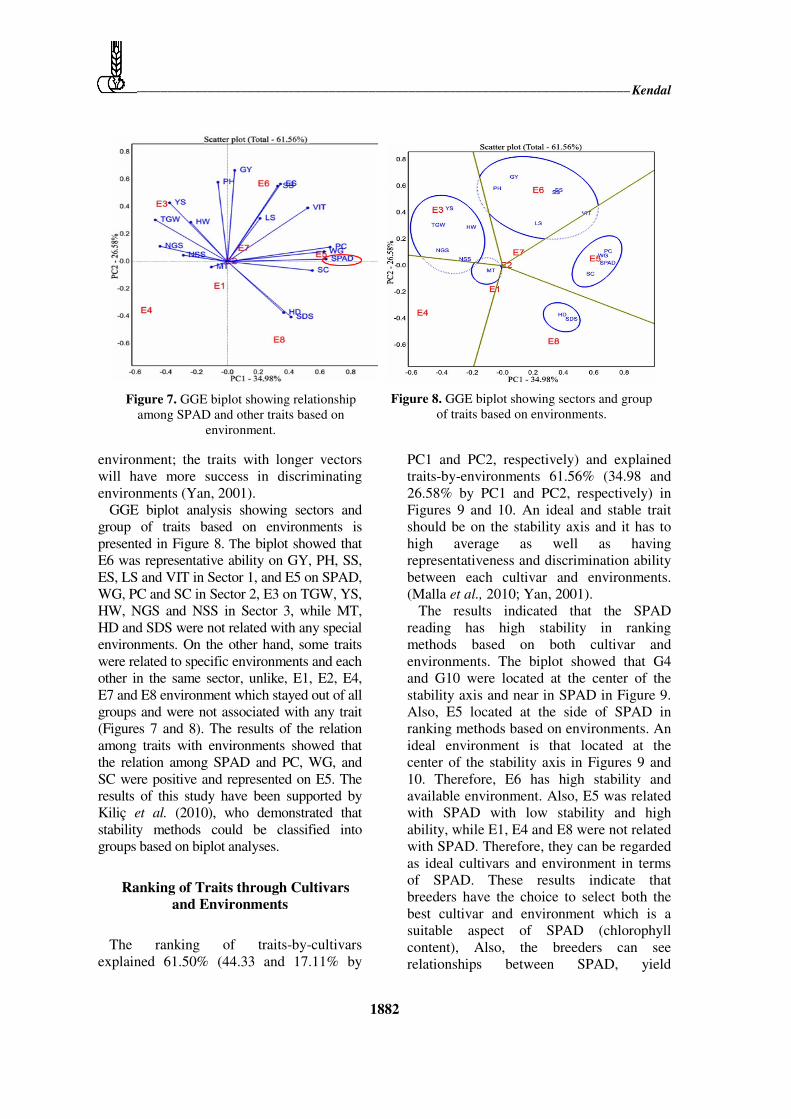
The environments-by-traits fell into five
sectors and explained 61.56% (34.9 and
26.5% by PC1 and PC2, respectively) of the
relation among environment-by-traits
(Figures 7 and 8). In the biplot, a vector is
drawn from the center to each marker of the
traits to facilitate visualization of the
relationships between traits and
environment. The biplot showed that there is
correlation between SPAD reading, yield
component, and environment (Table 7). The
study indicated that biplot analysis is a good
method to evaluate features and
environments, and it showed that the studies
showed a significant association between
quality criteria and grain yield by SPAD. A
high and positive correlation occurred
between SPAD reading and grain yield. The
biplot also showed that optimum condition
have high SPAD values, while extreme
conditions have low values. The length of
the trait vector is a good marker to show the
ability of traits in discriminating
____________________________________________________________________________ Kendal
1882
Figure 7. GGE biplot showing relationship
among SPAD and other traits based on
environment.
Figure 8. GGE biplot showing sectors and group
of traits based on environments.
environment; the traits with longer vectors
will have more success in discriminating
environments (Yan, 2001).
GGE biplot analysis showing sectors and
group of traits based on environments is
presented in Figure 8. The biplot showed that
E6 was representative ability on GY, PH, SS,
ES, LS and VIT in Sector 1, and E5 on SPAD,
WG, PC and SC in Sector 2, E3 on TGW, YS,
HW, NGS and NSS in Sector 3, while MT,
HD and SDS were not related with any special
environments. On the other hand, some traits
were related to specific environments and each
other in the same sector, unlike, E1, E2, E4,
E7 and E8 environment which stayed out of all
groups and were not associated with any trait
(Figures 7 and 8). The results of the relation
among traits with environments showed that
the relation among SPAD and PC, WG, and
SC were positive and represented on E5. The
results of this study have been supported by
Kiliç et al. (2010), who demonstrated that
stability methods could be classified into
groups based on biplot analyses.
Ranking of Traits through Cultivars
and Environments
The ranking of traits-by-cultivars
explained 61.50% (44.33 and 17.11% by
PC1 and PC2, respectively) and explained
traits-by-environments 61.56% (34.98 and
26.58% by PC1 and PC2, respectively) in
Figures 9 and 10. An ideal and stable trait
should be on the stability axis and it has to
high average as well as having
representativeness and discrimination ability
between each cultivar and environments.
(Malla et al., 2010; Yan, 2001).
The results indicated that the SPAD
reading has high stability in ranking
methods based on both cultivar and
environments. The biplot showed that G4
and G10 were located at the center of the
stability axis and near in SPAD in Figure 9.
Also, E5 located at the side of SPAD in
ranking methods based on environments. An
ideal environment is that located at the
center of the stability axis in Figures 9 and
10. Therefore, E6 has high stability and
available environment. Also, E5 was related
with SPAD with low stability and high
ability, while E1, E4 and E8 were not related
with SPAD. Therefore, they can be regarded
as ideal cultivars and environment in terms
of SPAD. These results indicate that
breeders have the choice to select both the
best cultivar and environment which is a
suitable aspect of SPAD (chlorophyll
content), Also, the breeders can see
relationships between SPAD, yield
Chlorophyll and other Features in Durum Wheat _________________________________
1883
component, and quality criteria. A study conducted in similar environments
supported that Diyarbakir irrigation
condition provided the best environment in
terms of SPAD chlorophyll, also, there was
high correlation between grain yield and
SPAD values (Yildirim et al., 2010).
CONCLUSIONS
Results of the study indicated that biplot
analysis clearly discriminated between
cultivars with wide adaptation and those
showing a specific adaptation in wide
environment or specific environment. The
relationship between SPAD readings, quality
criteria, grain yield, and some yield
component were positive. The coefficients
between SPAD reading, TGW, HW and
some other yield component were negative.
The GGE biplot indicated that E6
(Diyarbakir irrigation) was ideal
environment in terms of SPAD reading. G3
(Eyyubi) was the best cultivar in terms of
SPAD reading. The statistical model GGE
biplot provides useful information for
experimentation of SPAD readings of
cultivar when grown under multi-
environment. It identifies clearly the ideal
and representative environment for
experimentation and underlines the effect of
specific traits for each cultivar on SPAD
reading performance and stability across
environments. If the strategy of a breeding
program is to develop flag leaf chlorophyll
content in specific or wide environments, it
can be possible to concentrate on local
adaptation to upgrade SPAD readings for
environment. However, the choosing of
SPAD should be based on the available
device, when the breeder is looking for the
best and useful device.
ACKNOWLEDGEMENTS
The author wishes to thank Sinan
Aydogan for biplot analyses program and
director of GAP International Agricultural
Research and Training Center.
REFERENCES
1. Araus, J.L., Amaro, T., Zuhair, Y. and
Nachit, M. 1997. Effect of Leaf Structure
and Water Status on Carbon Isotope
Discrimination in Field-grown Durum
Wheat. Plant Cell Environ., 20: 1484-1494.
2. Bavec, F. and Bavec, M. 2001. Chlorophyll
Meter Readings of Winter Wheat Cultivars
and Grain Yield Prediction. Comm. Soil Sci.
Plant Anal., 32: 2709–2719.
3. Bantayehu, M., Esmael J. and Awoke, Y.
2013. Additive Main Effect and
Multiplicative Interaction Analysis and
Clustering of Environments and Genotypes
in Malting Barley. Afr. J. Agri. Res., 8(18):
1896-1904.
4. Blanche, S. B. and Myers, G. O. 2006.
Identifying Discriminating Locations for
Cultivar Selection in Louisiana, Crop Sci.,
46: 946-949.
5. Brar K. S., S. Pritpal, V. P. Mittal, S.
Paramjit, M. L. Jakhar, Y . Yadav, M. M.
Sharma, U. S. Shekhawat, C. Kumar 2010.
GGE Biplot Analysis for Visualization of
Mean Performance and Stability for Seed
Yield in Taramira at Diverse Locations in
India. J. Oilseed Brassica 1(2):66-74.
6. Bozzini, A. 1988. Origin, Distribution and
Production of Durum Wheat in the World:
Durum: Chemistry and Technology. G.
Fabriani and C. Lintas, eds. Am. Assoc.
Cereal Chem. St. Paul, MN.
7. Farquhar, G., Barbour, M. M. and Henry, B.
K. 1998. Interpretation of Oxygen Isotope
Composition of Leaf Material. In: “Stable
Isotopes: BIOS”, (Ed.): Griffiths, H.
Scientific Publishers, Oxford, PP. 27–62.
8. Feldman, M. 2001. Origin of Cultivated
Wheat. In: “The World Wheat Book”, (Eds.):
Bonjean, A. P. and Angus, W. J. Andover,
England, PP. 3-58.
9. Gauch, H. G. and Zobel, R.W. 1997.
Identifying Mega-environments and
Targeting Genotypes. Crop Sci. 37: 311-
326.
10. Giunta, F., Motzo, R. and Deidda, M. 2002.
SPAD Readings and Associated Leaf Traits
in Durum Wheat, Barley and Triticale
Cultivars. Euphytica, 125: 197–205.
____________________________________________________________________________ Kendal
1884
11. Guendouza, A. and Maamarı, K. 2012.
Grain-filling Chlorophyll Content Relation
with Grain Yield Component of Durum
Wheat in a Mediterranean Environment. Afr.
Crop Sci. J., 20(1): 31 - 37
12. Hede, A. R., Skovmand, B., Reynolds, M.
P., Crossa, J., Vilhelmsen, A. L. and Stølen,
O. 1999. Evaluating Genetic Diversity for
Heat Tolerance Traits in Mexican Wheat
Landraces. Genetic Res. Crop Evol., 46: 37–
45.
13. Ilker, E., Geren, H., Unsal, R., Sevim, I., A.
Tonk, F. and Tosun M. 2011. AMMI-Biplot
Analyses of Yield Performances of Bread
Wheat Cultivars Grown at Different
Locations. Turkish J. Field Crop., 16(1): 64-
68.
14. Javed, N., Ashraf1, M., Akram, N.A. and
Al-Qurainy, F. 2011. Alleviation of Adverse
Effects of Drought Stress on Growth and
Some Potential Physiological Attributes in
Maize by Seed Electromagnetic Treatment.
Photochem. P. Biol., 87(6): 1354-1362.
15. Jiang, D., Dai, T., Jing, G., Cao, W., Zhou,
G., Zhao, H. and Fan, X. 2004. Effects of
Long-term Fertilization on Leaf
Photosynthetic Characteristics and Grain
Yield in Winter Wheat. Photosynthetic, 42:
439–446.
16. Kilic, H., Akcura M. and Aktas, H. 2010.
Assessment of Parametric and Non-
parametric Methods for Selecting Stable and
Adapted Durum Wheat Genotypes in Multi-
environments. Not. Bot. Hort. Agrobot.
Cluj., 38(3): 271-279.
17. Le Bail, M., Jeuffroy, M. H., Bouchard, C.
and Barbottin, A. 2005. Is It Possible to
Forecast the Grain Quality and Yield of
Different Varieties of Winter Wheat from
Minolta SPAD Meter Measurements?
European J. Agron., 23: 379–391.
18. Letta, T., Egidio, M. G. and Abinasa, M.
2008. Stability Analysis of Quality Traits in
Durum Wheat (Triticum durum Desf.)
Varieties under South Eastern Ethiopian
Conditions. World J. Agric. Sci., 4: 53-57.
19. Naroui Rad M. R., Abdulkadir, M., Rafii, M.
Y. Jaafar, H. Z. E., Naghavi M. R. and
Farzaneh, A. 2013. Genotype×Environment
Interaction by AMMI and GGE Biplot
Analysis in Three Consecutive Generations
of Wheat under Normal and Drought Stress
Conditions. Australian J. Crop Sci. (AJCS),
7(7): 956-961.
20. Malla, S., Ibrahim, A. M. H., Glover, K. D.
and Berzonsky, W. A. 2010. Combining
Ability for Fusarium Head Blight Resistance
in Wheat (Triticum aestivum L.). Comm.
Biometry Crop Sci., 5: 116.126.
21. Mohammadi, M., Karimizadeh, R.,
Noorinia, A. A., Ghojogh, H., Hosseinpour,
T., Khalilzadeh, G. R., Mehraban, A.,
Roustaii, M. and Hasanpor Hosni, M. 2013.
Analysis of Yield Stability in Multi-
environment Trials of Barley (Hordeum
vulgare L.) Genotypes Using AMMI Model.
Curr. Opinion Agric., 2(1): 20-24.
22. Mortazavian, S. M. M., Nikkhah, H. R.,
Hassani, F. A., Sharif-al-Hosseini, M.,
Taheri, M. and Mahlooji, M. 2014. GGE
Biplot and AMMI Analysis of Yield
Performance of Barley Genotypes Across
Different Environments in Iran. J. Agr. Sci.
Tech., 16: 609-622.
23. Ozkan, H., Willcox, G., Graner, A.,
Salamini, F. and Kilian, B. 2011.
Geographic Distribution and Domestication
of Wild Emmer Wheat (Triticum
dicoccoides). Genetic Res. Crop Evol.,
58(1): 11-53.
24. Ozlem, O. 2014. Turkish wheat landraces:
Population Structure and Function. Emir. J.
Food Agric., 26(2): 137-148.
25. Peltonen, J., Virtanen, A. and Haggren, E.
1995. Using a Chlorophyll Method to
Optimize Nitrogen Fertilizer Application for
Intensively-managed Small-grain Cereals. J.
Agron. Crop Sci., 174: 309-318.
26. Rezene, Y. 2014. GGE and AMMI Biplot
Analysis for Field Pea Yield Stability in
SNNPR State Ethiopia. Int. J. Sust. Agri.
Res., 1(1): 28-38.
27. Rharrabti, Y., Villegas, D., Garcia Del
Moral, D. F., Aparicio, N., Elhani, S. and
Royo, C. 2001. Environmental and Genetic
Determination of Protein Content and Grain
Yield in Durum Wheat under Mediterranean
Conditions. Plant Breed., 120: 381–388.
28. Schuhwerk, D. 2011. Field-screening of
Durum Wheat (T. durum Desf.) for Drought
Tolerance. Department of Crop Science,
University of Natural Resources and Life
Science, Vienna, Wien.
29. Simane, B., Struik, P. C., Nachit, M. and
Peacock, J. M. 1993. Ontogeny Analysis of
Yield Components and Yield Stability of
Durum Wheat in Water-limited
Environments. Euphytica, 71: 211-219.
Chlorophyll and other Features in Durum Wheat _________________________________
1885
30. Singh, M. M., Shekhar R. R. and Dixit, R.
K. 2009. Genetic Variability and Character
Association in Indian Mustard (Brassica
juncea). J. Oilseed. Res., 26: 56-57.
31. Yan, W., Hunt, L. A., Sheng, Q. and
Szlavnics, Z. 2000. Cultivar Evaluation and
Mega-environment Investigation Based on
the GGE Biplot. Crop Sci., 40: 597-605.
32. Yan, W. 2001. GGE Biplot: A Windows
Application for Graphical Analysis of Multi-
environment Trial Data and Other Types of
Two-way Data. Agron. J., 93: 1-11.
33. Yan, W. and Hunt, L. N. 2001.
Interpretation of Genotype×Environment
Interaction for Winter Wheat Yield in
Ontario. Crop Sci., 41: 19.
doi:10.2135/cropsci2001.41119 x-12
34. Yan, W. and Rajcanw, I. 2002. Biplot
Analysis of Test Sites and Trait Relations of
Soybean in Ontario. Crop Sci., 42: 11-20.
doi:10.2135/cropsci2002.0011--17
35. Yan, W. and Kang, M. S. 2003. GGE Biplot
Analysis: A Graphical Tool for Breeders,
Geneticists, and Agronomists. CRC Press,
Boca Raton, 213 PP.
36. Yan, W. and Tinker, N.A. 2006. Biplot
Analysis of Multi-environment Trial Data:
Principles and Applications. Can. J. Plant
Sci., 86: 623-645.
37. Yau, S. K. 1995. Regression and AMMI
Analyses of Genotype×Environment
Interactions: An Empirical Comparison.
Agron. J., 87(1): 121-126.
38. Yildirim, M., Kılıc, H., Kendal E. and
Karahan T. 2010. Applicability of
Chlorophyll Meter Readings as Yield
Predictor in Durum Wheat. J. Plant Nutr.,
34(2): 151-164.
39. Yuksel, S. and Akcura, M. 2012. Pattern
Analysis of Multi-environment Yield Trials
in Barley (Hordeum vulgare L.). Turk. J.
Agric. For., 36: 285-295.
40. Zadox J. C., Chang, T. T. and Konzak, F. C.
1974. A Decimal Code for Growth Stages of
Cereals. Weed Res., 14: 415–421.
.Triticum turgidum L)رابطه بين كلروفيل و ديگر ويژگي هاي گندم دوروم
var. durum) ده از اعداد ا استفاب SPAD و تجزيه باي پالت
ا. كندال
چكيده
پژوهش حاضر با هدف ارزيابي برهمكنش ژنوتيپ و محيط در مورد اعداد قرائت شده از دستگاه
محيطي در طي -كالتيوار گندم دورم با استفاده از آزمون هاي چند 10) براي SPADكلروفيل سنج (
با استفاده از تجزيه SPADاري و برتري ژنتيكي در مورد دوسال در هشت منطقه مختلف اجرا شد. پايد
و ديگر SPAD شناسايي شد. افزون بر اين، رابطه هاي بين اعداد GGEواريانس و تجزيه باي پالت
) و صفات آنها در محيط هاي cultivars-by-traitsاجزاي عملكرد و صفات كالتيوارها (
-cultivarsكالتيوارها در محيط هاي مختلف () ، و عملكرد environment-by-traitsمختلف(
by-environment با استفاده از نمودار پراكنش، درجه بندي، و مقايسه در روش باي پالت مطالعه (
، اجزاي عملكرد، و ضوابط SPADشد. نتايج حاكي از تغييرات چشمگير در مورد ارتباط اعداد
هاي مطالعه شده بود. همچنين، همبستگي مثبتي بين كيفيتي با يكديگر و محيط هاي مختلف و كالتيوار
با وزن دانه و برخي ضوابط كيفيتي ( محتواي پروتئين،گلوتن تر، دانه شيشه اي SPADاعداد
____________________________________________________________________________ Kendal
1886
vitreous kernels و اجزاي عملكرد ( ساقه در متر مربع، خوشه در متر مربع، بلندي گياه، طول (
بين رابطه منفي داشت. نيز، SPADصول با خوشه) وجود داشت در حالي كه زمان رسيدن مح
SPAD و رنگ سموليناSC) (رنگ آرد ) و آزمون ته نشينيSDS رابطه اي با زاويه منفرجه ( كمتر (
نشان داد كه GGEدرجه) وجود داشت ولي اين رابطه معني دار نبود. تجزيه داده ها با باي پالت 90از
) Eyyubiمشخص شده و كولتيوار ايوبي ( E6كه با نماد ) Kızıltepeشرايط محيط منطقه قزل تپه (
اطالعات مفيدي GGEبهترين بودند. تجزيه داده ها با باي پالت SPAD) از نظر اعداد G3با نماد(
محيطي فراهم كرد. به -در كولتيوارهاي كشت شده در آزمون هاي چند SPADبراي بررسي اعداد
SPADگراني كه مقدار كلروفيل برگ پرچم را تعيين ميكنند، اين قرار، مي توان گفت كه براي بهنژاد
ابزار بهتر و مفيدي است.
Copyright © 2022 FDOKUMEN