EFFECTS OF TEMPERATURE, SALINITY, IRRADIANCE AND DIURNAL PERIODICITY ON GROWTH AND PHOTOSYNTHESIS IN...
11
MOVEMENT IN ODOXTELLA 339 McLachlan.J. 1973. Growth media—marine./n Stein. J. [Ed.) Handbook ojPhyralogxcalMfthodi. Cambridge University Press. London, pp. 25-52. Nuitsch. W. 1974. Movements. In Stcwan. W. D. F. [Ed.| A/^o/ PhyUology and Biofhrmulry. University of California Press. Berkeley, pp. 864-93. Pickett-Hcaps. J. D. 1972. Cell division in Cosmarium botrylu. J. Phycol. 8:343-60. 1981. CrII Dix'ision in the Drsmid C/nj(mum. 16mm sound, color film; Cytographics, 107 Timbcrlane, Boulder, Colo* rado. Pickett-Hcaps, J. D, & Fowke, L. C. 1970. Mitosis, cytokinesis and cell elongation in the desmid Ctoilerium littoraU.J. Phycol. 6:189-215. J. Phycol, S2. 339-348 (1986) EFFECTS OF TEMPERATURE. SALINITY, IRRADIANCE AND DIURNAL PERIODICITY ON GROWTH AND PHOTOSYNTHESIS IN THE DIATOM NITZSCHIA AMERICANA: LIGHT-SATURATED GROWTH* Richard L. Miller^ and Daniel L. Kamykou'ski Department of Marine. Earth, and Atmospheric Sciences, North Carolina State University. Box 8208 Raleigh, North Carolina 27695-8208 ABSTRACT Thf physiological rrsponsrofan eshiarine doneo scbia americana Fryxell was measured under exf>eri- tnental conditions of temperature and salinity uhich rep- resent the average range of these variables in the Cape Fear River Estuary, S'orth Carolina. The influence of temperature (10. 15. 20, 25, SO^ C) and salinity (8. 15. 20, 26, 32%c)on specific growth rates, /i, and parameters of photosynthesU'irradiance cun'es, a and P_n., were mea- sured during maximum and minimum rates of diurnal photosynthesis usingaxenicsemi-continuous batch mltures ^naintained at an irradiance saturating for photosynthesis (HO nE'm''-s~'). There was an increase in fi with in- creasing temperature up to a broad optimum (25 ± 2.5*' C), above which M gradually declined. At the predicted optimum temperature of 25" C, fi increased as a linear function of salinity. Both light-limited (a) and light-sat- itrated (P^J rates of photosynthesis increased as salinity decreased. The effect of temperature on a and P^^ was complex and dependent on salinity. P^, exhibited a diur- "o/ periodicity, whereas estimates of a were not signifi- cantly different betu<een sampling periods. Growth effi- ciency oftsl, americana, calculated as the ratio beturen specific growth rates and rates of gross photosynthesis, increased with an increase in salinity with a maximum at the predicted optimum temperature and salinity of 25"C ^nd 32%D, suggesting an uncoupling between photosyn- thesis and growth at nonoptimum growth conditions, ^fy index words: growth^ Nitzschia americana: pho- fosynthesis; physiological responses p 23 April 19R6. " Prcsrni address and address for reiirint*: U.S. C>n>l<igiral Sur- ety. WRD. 3-15 Middleficld Road, MS 496. Menio Park, Califor- nia 94025. Since light is the primary driving force of pho- tosynthesis, studies designed to model phytoplank- ton productivity are usually based on a mathematical expression of photosynthesis as a function of irra- diance. The photosynthesis-irradiance relationship (P-1 curves) often can be adequately described by an empirical equation that contains only two parame- ters (Jassby and Platt 1976), For example, for low light levels, the initial linear dependence of photo- synthesis on irradiance (light-limited) is defined by the slope, a. which represents basic photochemical processes of the photosyntbetic light reactions: at sufficiently high light levels, the photochemical re- actions become saturated and phytoplankton pro- duction can be described by a constant asymptotic value defined as the photosynthetic potential or ca- pacity, Pm,,. Pm« characterizes enzymatic processes of the dark reactions of photosynthesis and gener- ally exhibits a dependence on various environmental factors such as temperature (Jorgensen 1968. Cloem 1978, Harrison and Platt 1980). light history (Bear- dall and Morris 1976. Prezelin 1981). nutrients (Curl and Small 1965. Parsons et al. 1977). and on bio- logical factors such as diel periodicity in cellular ac- tivity (Prezelin and Matlick 1980, Harding et al. 1981). Because a represents basic photochemical re- actions, it should be independent of environmental factors; however, recent research (Harris 1973, Yoder 1979. Harding et al, 1981) suggests that a is no less variable than Pm,, and may be coupled to environmental conditions. Therefore, phytoplank- ton physiological responses to various environmen- lal factors presumably can be examined by describ- ing mathematically the effects of these factors on the magnitude and variability of a and P ^ , (Jassby and Platt 1976. Platt and Jassby 1976).
Transcript of EFFECTS OF TEMPERATURE, SALINITY, IRRADIANCE AND DIURNAL PERIODICITY ON GROWTH AND PHOTOSYNTHESIS IN...
MOVEMENT IN ODOXTELLA 339
McLachlan.J. 1973. Growth media—marine./n Stein. J. [Ed.)Handbook ojPhyralogxcalMfthodi. Cambridge University Press.London, pp. 25-52.
Nuitsch. W. 1974. Movements. In Stcwan. W. D. F. [Ed.| A/ o/PhyUology and Biofhrmulry. University of California Press.Berkeley, pp. 864-93.
Pickett-Hcaps. J. D. 1972. Cell division in Cosmarium botrylu. J.Phycol. 8:343-60.
1981. CrII Dix'ision in the Drsmid C/nj(mum. 16mm sound,color film; Cytographics, 107 Timbcrlane, Boulder, Colo*rado.
Pickett-Hcaps, J. D, & Fowke, L. C. 1970. Mitosis, cytokinesisand cell elongation in the desmid Ctoilerium littoraU.J. Phycol.6:189-215.
J. Phycol, S2. 339-348 (1986)
EFFECTS OF TEMPERATURE. SALINITY, IRRADIANCE AND DIURNALPERIODICITY ON GROWTH AND PHOTOSYNTHESIS IN THE DIATOM
NITZSCHIA AMERICANA: LIGHT-SATURATED GROWTH*
Richard L. Miller^ and Daniel L. Kamykou'ski
Department of Marine. Earth, and Atmospheric Sciences, North Carolina State University. Box 8208Raleigh, North Carolina 27695-8208
ABSTRACT
Thf physiological rrsponsrofan eshiarine doneoscbia americana Fryxell was measured under exf>eri-tnental conditions of temperature and salinity uhich rep-resent the average range of these variables in the CapeFear River Estuary, S'orth Carolina. The influence oftemperature (10. 15. 20, 25, SO^ C) and salinity (8. 15.20, 26, 32%c)on specific growth rates, /i, and parametersof photosynthesU'irradiance cun'es, a and P_n., were mea-sured during maximum and minimum rates of diurnalphotosynthesis usingaxenicsemi-continuous batch mltures^naintained at an irradiance saturating for photosynthesis(HO nE'm''-s~'). There was an increase in fi with in-creasing temperature up to a broad optimum (25 ± 2.5*'C), above which M gradually declined. At the predictedoptimum temperature of 25" C, fi increased as a linearfunction of salinity. Both light-limited (a) and light-sat-itrated (P^J rates of photosynthesis increased as salinitydecreased. The effect of temperature on a and P^^ wascomplex and dependent on salinity. P^, exhibited a diur-"o/ periodicity, whereas estimates of a were not signifi-cantly different betu<een sampling periods. Growth effi-ciency oftsl, americana, calculated as the ratio beturenspecific growth rates and rates of gross photosynthesis,increased with an increase in salinity with a maximum atthe predicted optimum temperature and salinity of 25"C^nd 32%D, suggesting an uncoupling between photosyn-thesis and growth at nonoptimum growth conditions,
^fy index words: growth^ Nitzschia americana: pho-fosynthesis; physiological responses
p 23 April 19R6." Prcsrni address and address for reiirint*: U.S. C>n>l<igiral Sur-
ety. WRD. 3-15 Middleficld Road, MS 496. Menio Park, Califor-nia 94025.
Since light is the primary driving force of pho-tosynthesis, studies designed to model phytoplank-ton productivity are usually based on a mathematicalexpression of photosynthesis as a function of irra-diance. The photosynthesis-irradiance relationship(P-1 curves) often can be adequately described by anempirical equation that contains only two parame-ters (Jassby and Platt 1976), For example, for lowlight levels, the initial linear dependence of photo-synthesis on irradiance (light-limited) is defined bythe slope, a. which represents basic photochemicalprocesses of the photosyntbetic light reactions: atsufficiently high light levels, the photochemical re-actions become saturated and phytoplankton pro-duction can be described by a constant asymptoticvalue defined as the photosynthetic potential or ca-pacity, Pm,,. Pm« characterizes enzymatic processesof the dark reactions of photosynthesis and gener-ally exhibits a dependence on various environmentalfactors such as temperature (Jorgensen 1968. Cloem1978, Harrison and Platt 1980). light history (Bear-dall and Morris 1976. Prezelin 1981). nutrients (Curland Small 1965. Parsons et al. 1977). and on bio-logical factors such as diel periodicity in cellular ac-tivity (Prezelin and Matlick 1980, Harding et al.1981). Because a represents basic photochemical re-actions, it should be independent of environmentalfactors; however, recent research (Harris 1973,Yoder 1979. Harding et al, 1981) suggests that a isno less variable than Pm,, and may be coupled toenvironmental conditions. Therefore, phytoplank-ton physiological responses to various environmen-lal factors presumably can be examined by describ-ing mathematically the effects of these factors onthe magnitude and variability of a and P^, (Jassbyand Platt 1976. Platt and Jassby 1976).
340 RICHARD L. MILLER AND DANIEL L. KAMYKOWSKI
CTGP ETQP
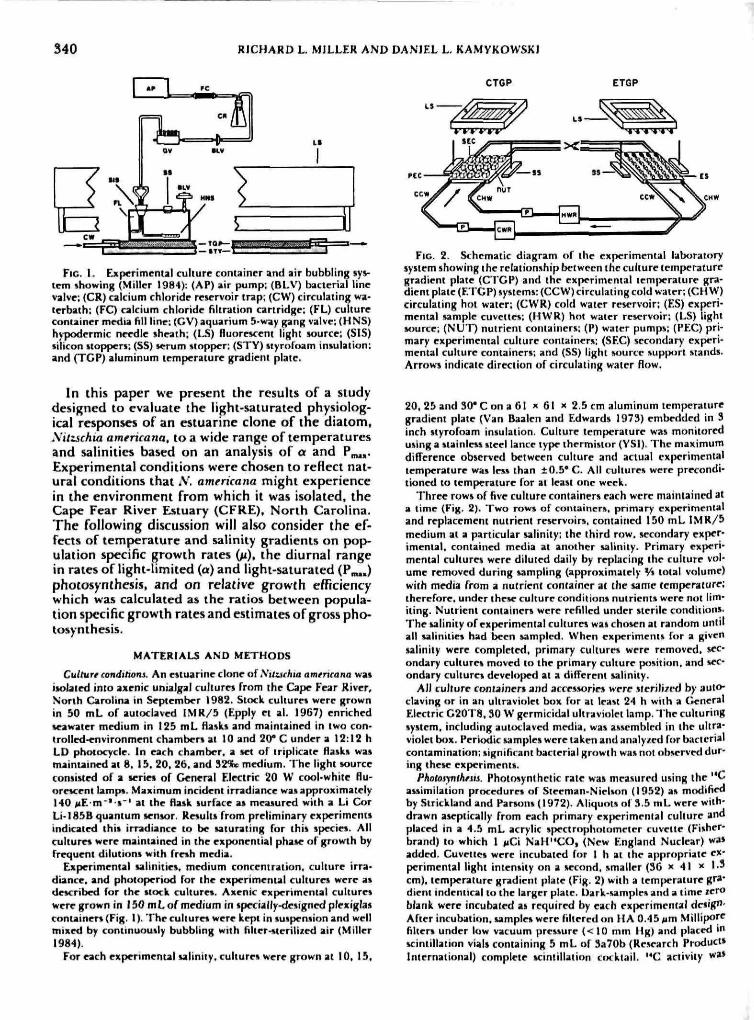
Fic. I. Experimental culture container and air bubbling sys-tem showing (Miller 19B4): <AP) air pump: (BLV) bacterial linevalve; (CR) calcium chloride reservoir trap; (CW) circulating wa-terbath: (FC) calcium chloride filtration cartridge: (FL) cultureconuiner media fill line; (GV) aquarium 5-way gang valve: (HNS)hj-podermic needle sheath; (LS) tluorescent light source: (SIS)silicon stoppers; (SS) »erum stopper: (STY) styrofoam insulation:and (TCP) aluminum temperature gradient plale.
In this paper we present the results of a studydesigned to evaluate the light-saturated physiolog-ical responses of an estuarine clone of the diatom,Xitzschia americana, to a wide range of temperaturesand salinities based on an itnalysis of a and Pn^,.Experimental conditions were chosen to reHect nat-ural conditions that .V. americana might experiencein the environment from which it was isolated, theCape Fear River Estuary (CFRE), North Carolina.The following discussion will also consider the ef-fects of temperature and salinity gradients on poph-ulation specific growth rates {p), the diurnal rangein rates of tight-limited (a) and light-saturated (P^,)photosynthesis, and on relative growth efficiencywhich was calculated as the ratios between popula-tion specific growth rates and estimates of gross pho-t(jsyn thesis.
MATERIAt^ AND METHODS
Culture conditions. An rstuarinc clone of XitL\rhia americana wasisolated into axenic unialgal cultures from the Cape Fear River,North Carolina in September 1982, Slock cultures were grownin 50 mL of auioclaved IMR/5 (Epply ei al. 1967) enriched«eawater medium in 125 mL flasks and maintained in two con-troUcd-environment chamber* at 10 and 20* C under a 12:12 hLD photocycle. In each chamber, a lei of iriplicaic flasks wasmainuined at 8. 15. 20, 26. and 32%6 medium. The tight sourceconsisted o( a lerie* of General F.lectric 20 W cool-whitp (lu-orewreni lampt. Maximum incident irradiance was approximately140 f*E m ' »"' ai the flask surface a» measured with » Li CorLi-185B quantum Knsor. Renulu from preliminary experimentsindicated thi> irradiance to be uturating for this species. Allcultures were maintained in the exponential phase of growth byfrequent dilutions with fresh media.
Experimental salinities, medium concentration, culture irra-diance. and photoperiod for the experimental cultures were aideKribed for the tiock culturen. Axenic experimental cultureswere grown in 150 mL of medium in specially-designed plexiglaicontainers (Fig. I). The cullurei were kcpi in suspension and wellmixed by contmuou«ly bubbling with filter-^terilijcd air (Miller1984).
Foreach experimental salinity, cultures were grown at 10. 15.
FIG. 2. Schematic diagram of the experimental laboratorysystem showing ihe relationship between the culture temperaturegradient plate (C'l'CP) and thr rxpcrimeniat lempcraturr gra-dient plate (ETCP) systems: (CCW) circulating cold water: (CHW)circulating hot water; (CWR) cold water reservoir: (F.S) cxprri-mcntal sample cuvettes: (HWR) hot water reservoir: (LS) lightsourer; (NUT) nutrient containers: (P) water pumps; (PEC) pri-mary experimental culture containers: (.SEC) sccondarj' experi-mental culture containers; and (SS) light M)urce support stands.Arrows indicate direction of circulating water flow.
20, 25 and 30*C on a 61 " dl x 2.5 cm aluminum temperaturegradient plate (Van Baalcn and Edwards 1973) embedded in 3inch styrofoam insulation. Culture temperature was monitoredusing a stainless steel lance type thermistor (VSI), The maximumdifference observed between culture and actual experimentaltemperature was less than ±0.5' C All cultures were precondi-tioned to temperature for at least one week.
T hree rows of five culture containers each were maintained ata lime (Fig. 2). Twa row* of coruainers, primary experimentaland replacement nutrient reservoirs, contaitied 150 mL IMR/&medium at a particular salinity; the third row, secondary exper-imental, contained media at another *aliniiy. Primary experi-mental cultures were diluted daily by replacing the culture vol-ume removed during sampling (approximately V» total volume)with media from a nutrient container at the same temperature;therefore, under theur culture conditions nulrients were nut lim-iting. Nutrient containers were refilled under sterile conditions.The salinity of experimental cultures was chosen at random untilall salinities h;id been sampled. When experiments for a givensalinity were completed, primary cultures were removed, sec-ondary cultures movrd to ihr primary culture p«isition, and sec-ondary cultures developed al a difTcrrnt salinity.
All culture containers and accessories were sterili/rd by auto-claving or in an ultraviolet box fur at iraM 24 h wiih a GeneralElectric G20r8, 30 W grrmicidal ultraviolet lamp. "I hr culiuringsystem, including auttK.liivrd media, was assrmbird in the ultra-violet box. Periodic samples were lakrn and analyzed for bitctcrialcontamination; significant bacterial growth wa¬ ob^erveddur-ing these experiments.
Photosynthem. Photmyniheiic raic was measured using the "Cauimilation procedures of Steeman-NieUon (1952) as modifiedby Strickland and Parson* (1972). Aliquot* ol 3.5 mL were with-drawn aseptically from each primary exjxrrimental culture andplaced in a 4.5 mL acrylic spectrophotomrtrr cuvetle (Fisher-brand) to which 1 jiCi Nair 'CO, (New England Nuclear) wasadded, CuvelCts were incubated (or I h ai the appropriate ex-perimental light intensity on a sccnnd. smaller (30 x 41 x 1-3cm), tem(>erature gradient plate (Fig. 2) with a tem(>erature gra*[Jient indrntidl to the larger plate. Uark-umptrs and a lime tcroblank were incubated as rwjuired by each ex[)erimrntal design-Afirr incubation, samples were fillrrrd on 11A 0.45 ^m Millip"r'filter* under low vacuum prc»ure (< 10 mm llg) and placed mscintillation vials containing 5 mL ctf 3a70b (Research Product*lnicrnalional) complete scintillation cixktail. '*C activity ^'^
S\ AMERICAS'A LIGHT-SATURATED GROWTH 341
measured in a Beckman Tricarb 300C scintillation counter usingthe samples channel ratio lor quench correction (Pugh 1970).Light-sample '*C activity was corrected for dark-sample and time?cro blank activity. Total CO, was measuretl with an Oceanog-raphy International model 0524 carbon analyzer system. Pho-tosynthrtic rates were calculated using the equation of Stricklandand Parsons (1972) and were normalized to cell counts (pgC-cell ' -h" ' ) . Since these estimates are based on short-term (1 h)incubations, they are assumed to approximate rates of gross pho-tosynthesis (Ryther 1954, Thomas 1964).
Cfll counts. Aliquots of 3 mL were preserved in 2% NaAc-bufferetl formalin and cells counted on a hemacytometcr ac-cording to Guillard (1973) or using a Coulter Counter Model ZBelectric particle counter with a 100 nm aperature tube.
Chlorophyll fluoTficencf. In vivo chlorophyll a fluorescence ^•asmeasured in the absence (FM) and presence (FDCMU) of 3-<3,4-dichlorophcnyl)-l,l-dimethylurca (DCMU) in a Turner DesignsModel 10 fluorometer- After measuring FM fluorescence, 5 nLDCMU was added to each sample yielding a final concentrationof approximately 0.4 vM. Samples were placed in the dark for 5min prior to FDCMU fluorescence measurements to allow fordark adaptation and DCMU saturation in all cells (Cuiien andRcngcr 1979).
The relationship between FDCM U fluorescence and cell countswas established for cultures grown at 8,20, and 32%(k Conversionfactors were calculated for each set of experimental conditionsfrom linear least squares regression analysis assuming 0.0 inter-cepts. All regression models were significant {P < O.OI) and ac-counted for an average 89% of total variation. The regressioncoefficients, at conversion factors, from each analysis were pooledand evaluated as a function of temperature and salinity, includinginteractive eflects. The resultant expression;
CF - 685.93 - I3.17T + 6.2S - 0.108TS (I)
where CF is the cell counts per unit FDCMU fluorescence, T isthe experimental temperature C C), and S is the exfierimentalsalinity (Sw), w,is highly significant [P < 0.01, r» - 0.79) and wasused to transform all FDCMU data to cell counts.
Poputatton grou-th rntn. Population growth rates were estimatedUsing cell counts and in vivo chlorophyll a fluorescence data (Brandet al. 19a I). The specific growth rate, (d"'), was calculated usingthe equation;
n- \/i In!(C. + AC)/Co) (S)
where i is the time, C is the initial cell count or fluorescencevalue, and AC the change in cell numbers or sample fluorescence.Specific growth rates presented below represent the mean max-imum growth rate calculated using at least three independent
Offl.
ronditioiu. Three general types of "C uptake ex-periments were conducted; (1) diurnal variability studies of max-imum light-saturated photosynthesis; (2) experiments to evaluatethp cITects of various treatment combinations on parameters ofphotosynthesis-light intensity curves; and (3) error analysis ofphotosynthesis-light intensity parameters.
Maximum and minimum diurnal rates of light-saturated pho-tosynthesis were determined for eacji experimental temperature-Wlinity combination. Photosynthesis samples were taken at 0630.0800,0930. HOC, 1230, 1400, 1530. and 1700 hand incubated" 140 ME m * * - ' (loo's 1). Dark samples were taken at 0630and 1700 h. Estimates of dark-sample '*C uptake for the remain-'fg lampling periods were estimated assuming a linear response.Chlorophyll fluorescence was measured at 0630, 1030.1400, and'700 h. Linear least square* regression analyses provided esti-•"aies of chlorophyll fluorescence as a function of titnr and wereUsed to normalize rate* of photosynthesis to DCMU-enhanccdfluorescence.
Photosynthr»i»-light intensity (P-l) cur\'es were derived for threeConsecutive days using samples incubated during times estimated
for maximum and minimum diurnal rates of photosynthesis- Sam-ples from each primary experimental culture were incubated for1 h at 0. 8, 16, 24, 53, 72. and 100^ I using neutral densityscreens to provide three samples each in the light-limited andlight-saturated portion of P-1 curves, as well as an estimate ofdark '*C uptake. Aliquots for measuring chlorophyll fluorescenceand occasional cell counts were taken during the midpoint ofeach '*C incubation.
The functional relationship between photosynthesis atid light-intensity data was described mathematically by the hyperbolictangent equation suggested by Jassby and Platt (1976):
where P (pgC cell"'-h-') is the '*C assimilation at 1ight-l. P_ .(pgC Celt"' h~') is the maximal rate of assimilation at saturatinglight, and a (pgC cell ' h ' ' (^E m-» s"')"'> is the initial slopeof the curve at low light intensities. This model was chosen be-cause it consistently Bt the data better (minimum residual ium ofsquares) than other semi-empirical models (see L-ederman andTctt 1981). P«,u and a were estimated simultaneously using acomputer nonlinear least squares regression procedure (Statis-tical Analysis System 1982) employing the DUD method (Ralstonattd Jennrich 1979) of parameter estimation.
Sampling variability associated wiih the photosynthesis pro-cedure was estimated using cultures grown at 8. 20, and 32%>.The sampling design was similar to photosynthesis-light intensityexperiments, varying only in the incubation light intensities.Triplicate samples were incubated at two light intensities chosenat random from 8. 16. or 24*)S I (light-limited) and from 53. 72,or 100^ I (light-saturated). Dark-sampln were taken wiih eachset of primary culture samples.
RESULTS AND DISCUSSION
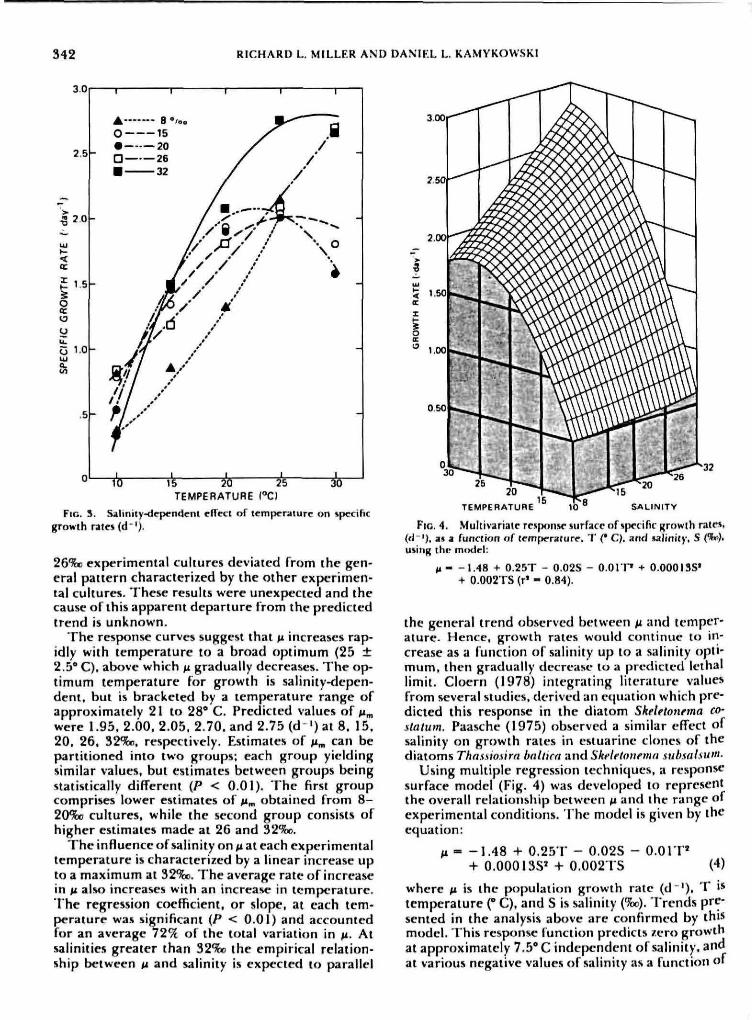
Population growth rates. Salinity-dependent specificgrowth rates, /i. o^Sitischia amfricana as a functionof temperature are presented in Figure 3. At eachexperimental salinity, the effect of temperature onmean growth rate was quantified using least squaresregression analysis. Mean growth rates were calcu-lated as the average of at least three independentestimates. Relative variation was low with a maxi-mum coefficient of variation of <\Q%, The tem-perature response of ^ can be described by either asecond-order polynomial (15, 20, 32%D) or by anexponential function (8, 26'S»). All regression modelsand coefficients were highly significant (P < O.OI)with a minimum r ' value of 0.92 (32%o). Within therange of 10-25* C. M at \b%c can be described byan exponential function (r' = 0.91), The rate con-stants at 8. 15, and 269to translate into a Q,o valueof 3,22, 1,97, and 1.86 respectively. These resultssuggest that the growth response of .V. amencana isrelatively more sensitive to temperatures at the low -er experimental salinities. Experimental culturescould not be maintained at 30** C and 8%o. Assuminga zero growth rate at 30* C, the curve at 8%3 wouldtherefore exhibit a maximum between 25 and 30*C. The resulting response function would be similarto the second-order polynomials derived for 15, 20,and 32%o data with the exception of a sharper de-cline beyond the predicted maximum growth rate,Mm. The temperature response of ^ at 26%c is incon-sistent with the general quadratic trend predicted.Thoughout data analysis, the observed response of
342 RICHARD t.. MILLER AND DANIEL L. KAMYKOWSKI
3,00
15 20 25TEMPERATURE CC)
FIG. 3. Saliiitty-tlependent effect of temperature on specificgrowth rair* (d' ' ) .
26%) experimental cultures deviated from the gen-eral pattern characterized by the other experimen-tal cultures. These results were unexpected and thecause of this apparent departure from the predictedtrend is unknown.
The response curves suggest that M increases rap-idly with temperature to a broad optimum (25 ±2.5* C). abt3ve which fx gradually decreases. The oj>-timum temperature for growth is salinity-depen-dent, but is bracketed by a temperature range ofapproximately 21 to 28' C. Predicted values of Mmwere 1.95. 2.00. 2.05. 2.70. and 2.75 (d ') at 8. 15.20. 26, 32*Xw, respectively. Estimates of n^ can bepartitioned into two groups; each group yieldingsimilar values, but estimates between groups beingstatistically different (P < 0.01). The first groupcomprises lower estimates of n^ obtained from 8-2O%o cultures, while the second group consists ofhigher estimates made at 26 and 32%o.
The influence of salinity on fi at each experimentaltemperature is characterized by a linear increase upto a maximum at 32%c. The average rate of increasein n also increases with an increase in temperature.The regression coefficient, or slope, at each tem-perature was significant (P < 0.01) and accountedfor an average 72'>5 of the total variation in ti. Atsalinities greater than 32%o the empirical relation-ship between n and salinity is expected to parallel
TEMPERATURE SALINITY
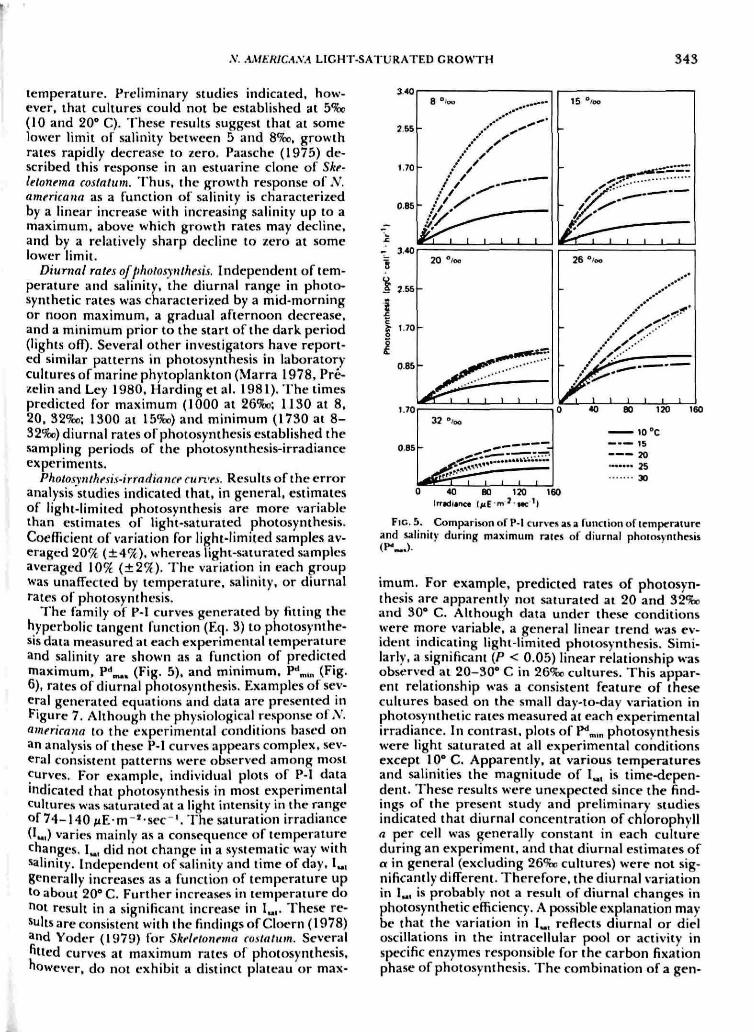
FIG. 4. Multivariatc rcsjKinM- Mir(acc of specific growth rate*.(d-'J, 2<t a function of temperature. 'V C C). and salinity. S (%p)i
i thr model:
- -1.48 + 0.25T - 0.02S - 0.0 I P+ 0.002TS (r* - 0.84).
0.00013S»
the general trend observed between fi and temper-ature. Hence, growth rates would continue to in-crease as a function of salinity up to a salinity opti-mum, then gradually decrease to a predicted lethallimit. Cloern (1978) integrating literature valuesfrom several studies, dt-rived an equation which pre-dicted this response in the diatom Skehtonema co-ilatum. Paasche (1975) observed a similar effect ofsalinity on growth rates in estuaritie clones of thediatoms Thassiosirn bttltirn and Skeletoiiema suhsaisu'ti.
Using multiple regression techniques, a responsesurface model (Fig. 4) was developed to representthe overall relationship between M and the range ofexperimental conditions. The model is given by theequation:
M= -1.48 + 0.25T - 0.02S - O.OIT"+ 0.00013S' + 0.002TS (4)
where fi is the population growth rate (d"'). T i*temperature (" C), and S is siilinity (%o). Trends pre-sented in the analysis above are confirmed by thiSmodel. This response function predict5 zero growthat approximately 7.5*0 independent of salinity, atidat various negative values of salinity as a functioti ot
.V. .\MF.RrCA\A LIGH I-SATURATED GROWTH 345
temperature. Preliminary studies indicated, how-ever, that cultures could not be e.stablished at 5%o(10 and 20° C). These results suggest that at somelower limit of salinity between 5 and 8^^. growthrates rapidly decrease to zero. Paasche (1975) de-scribed this response in an estuarine clotic of Skf-letonema costaium. Thus, the growth response of .V,americann as a function of salinity is characterizedby a linear increase with increasing salinity up to amaximum, above which growth rates may decline,and by a relatively sharp decline to zero at somelower limit.
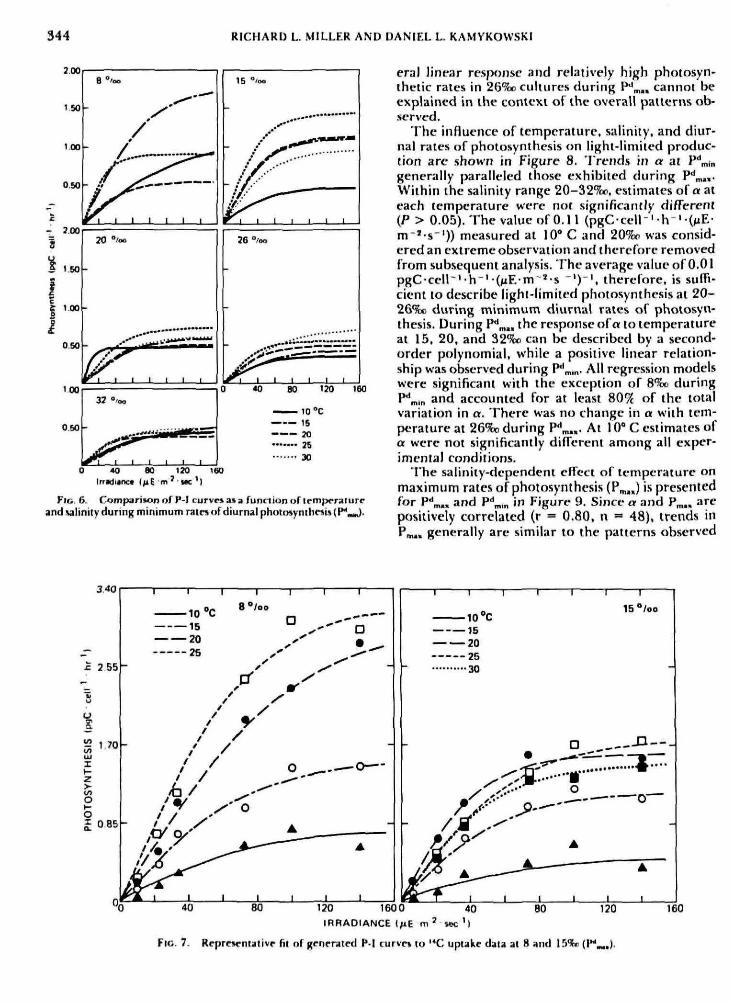
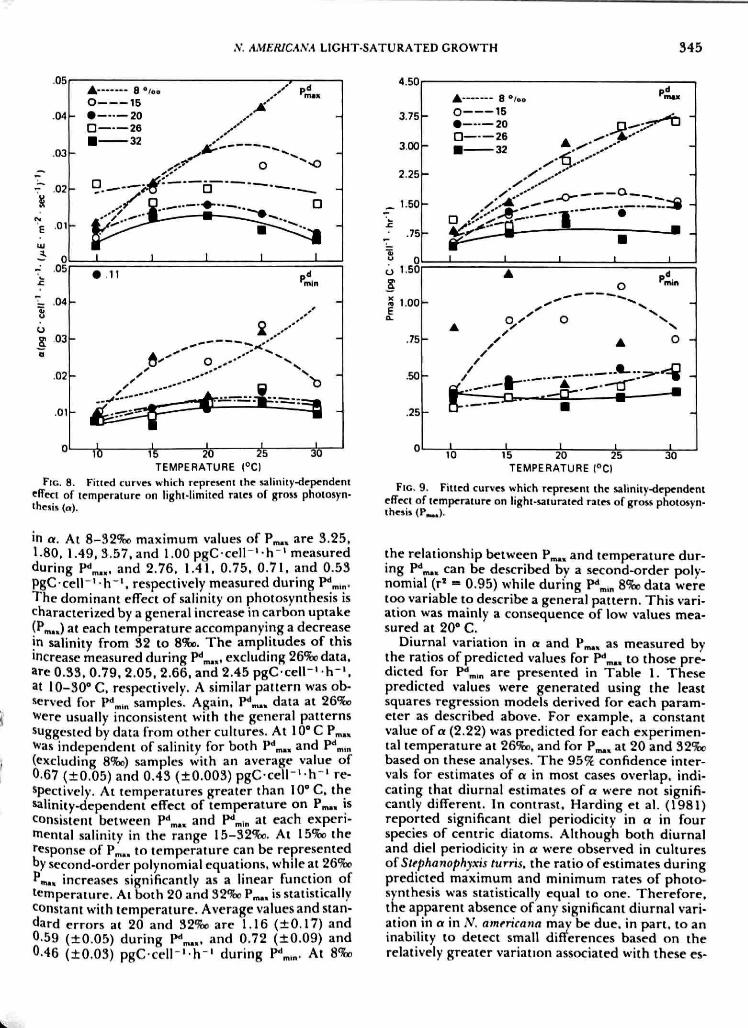
Diurnal rates of photosynthesis. Independent of tem-perature and salinity, the diurnal range in photo-synthetic rates was characterized by a mid-morningor noon maximum, a gradual afternoon decrease,and a minimum prior tcj the start of the dark period(lights off). Several other investigators have report-ed similar patterns in photosynthesis in laboratorycultures of marine phytoplankton (Marra 1978, Prc-zelinand Ley 1980, Harding et al. 1981). The timespredicted for maximum (1000 at 26%o; 1130 at 8,20, 32%o; 1300 at \5%o) and minimum (1730 at 8-32%D) diurnal ratesof photosynthesis established thesampling periods of the photosynthesis-irradianceexperiments.
Photosynthesis-irradianct'cuii-es. Results of the erroranalysis studies indicated that, in general, estimatesof light-limited photosynthesis are more variablethan estitiiaies of light-saturated photosynthesis.Coefficient of variation for light-limited samples av-eraged 20% (±4*;^), whereas light-saturated samplesaveraged 10^ {±2%). The variation in each groupwas unaffected by temperature, salinity, or diurnalrates of photosynthesis.
The family of P-I curves generated by fitting thehyperbolic tangent function (Eq. 3) to photosynthe-sis data measured at each experimental temperatureand salinity are shown as a function of predictedmaximum, P"*^, (Fig. 5), and minimum. P*' ,n (Fig.6), rates of diurnal photosynthesis. Examples of sev-eral generated equations and data are presented inFigure 7. Although the physiological response of ,V.Americana to the experimental conditions based onan analysis of these P-I curves appears complex, sev-eral consistent patterns were observed among mostcurves. For example, individual plots of P-I dataindicated thai photosynthesis in most experimentalcultures was saturated at a light intensity in the rangeof 7 4 - 1 4 0 M E m ' sec ', The saturation irradiance(L,) varies mainly as a consequence of temperaturechanges. 1 , did noi change in a systematic way withsalinity. Indcpcndrnt of salinity and time of day, !„,generally increases as a function of temperature upto about 20° C. Further increases in temperature donot result in a significant increase in !„,. These re-sults are consistent with the findings of Clocrn (1978)and Yodt-r (1979) for Skelrtimemn costotum. Severalfitted curves at maximum rates of photosynthesis,however, do not exhibit a distinct plateau or max-
3.40
t.7O
0.S5
- 3,40
B 2.5S
0.65
1.70
OSS
20
32
15
26
40 80 120 160
10 "C—-— 15
»
30
40 BO 120 160
FIG. 5. Comparison of P-| curvesas a funaion of temperatureand salinity during maximutn rates of diurnal photosynthesis( P - )
imum. For example, predicted rates of photosyn-thesis are apparently not saturated at 20 and 32S»and 30° C. Although data under these conditionswere more variable, a general linear trend was ev-ident indicating light-limited photosynthesis. Simi-larly, a significani (P < 0,05) linear relationship wasobserved at 20-30* C in 26%r cultures. This appar-ent relationship was a consistent feature of thesecultures based on the small day-to-day variation inphotosynthetic rates measured at each experimentalirradiance. In contrast, plots of ?**„,„ photosynthesiswere light saturated at all experimental conditionsexcept 10* C, Apparently, at various temperaturesand salinities the magnitude of I«, is time-depen-dent. These results were unexpected since the find-ings of the present study and preliminary studiesindicated that diurnal concentration of chlorophylla per cell was generally constant in each cultureduring an experiment, and that diurnal estimates ofa in general (excluding 26%! cultures) were not sig-nificantly different. Therefore, the diurnal variationin I«, is probably not a result of diurnal changes inphotosynthetic eifficiency, A pt)ssible explanation maybe that the variation in !„, reflects diurnal or dieloscillations in the intracellular pool or activity inspecific enzymes responsible for the carbon fixationphase of photosynthesis. The combination of a gen-
344 RICHARD L. MILLER AND DANIF.L L. KAMVKOW.SKI
2.00
150
VOO
0.50
- 2.00
1
5 VW
II
1.G0 -
O.SO -
100
0.60-
1 I 1 I t I
20
32 *>'«,
15
76
40 BO 120 160
lD'C15
— - 2026
0 40 80 120 160Irradiinc* l>iE m ' Mc ' )
Flo. 6. Comparison of P-l curvr* a» a funnion o pand wlinily during minimum mte* of diurnal phoio*ynihf*i*
eral li/it-nr rcsponsr and rc]ativfly hi^h photosyn-thciic rates in 2(5%o cuUiircs <luring l*^ ., catinot beexplained in the context of the overall patterns ob-served.
The influence of temperature, salinity, and diur-nal rates of photosynthesis on light-limited produc-rion arc- shown in Figure 8. lrends in a ai !"„,„generally paralleled those exhibited durinf^ PVM-Within the salinity range 20-32%^, estimates of a ateach temperature were nor significanriy different(P > 0.05). ThevalueorO.i l (pgCcell ' h '(MF--m - ' s ' ) ) measured at 10* C and 20%f. was consid-ered an extreme observation and therefore removedfrom subsequent analysis. The average value of 0.01pgC-cell~'-h"' '(^E-m^'-s ' ' ) " ' , therefore, is suffi-cient to describe light-limited photosynthesis at 20-26%o during minimum diurnal rates of photosyn-thesis. During P^^,, the response ofa to temperatureat 15. 20. and 32%o can be described by a second-order polynomial, while a positive linear relation-ship was observed during P^ .n. All regression modelswere significant with the exception of 8%t. duringP' .n and accounted for at least S07i of the totalvariation in n. There was no change in a with tem-perature at 26%:i during P**^,. At 10" C estimates ofa were not significantly different among all exper-imenlal conditions.
The salinity-dependent effect of temperature onmaximum rates of phoiosynlhcsis (P,^,J is presentedior P**™, and P\,n i'' Figure 9. Since a and P^., arepositively correlated (r = 0.80. n = 48), trends inPm.. generally are similar to the patterns observed
3.40
J 1 I I I L40 80 120 1600
IRRADIANCE I^
40 80 120 160
Fio. 7. Representative fit of generated P-I curve* xo '*C uptakr data at 8 and 1 5 ^ (l"«,)-
.V. .AMF.RICAXA LIGHT-SATURATED GROWTH 345
Ul
.5
z."3u(J
a
.us
.04
.03
,02
,01
0,05
,04
,03
:02
.01
0
A- 8 »/»,0 15
- • 20• 26• 32
^'— ^^^
1 1
• .11
-
-
r 1
10 15
*
D—•--.
1
^
,20
0
1
t
25
-
^ —
D
; ^ . -
1
-
-
•
30TEMPERATUREicivircnMiunc \ \J\
Fro. 8. Fitted curves which represent the salinity-dependent1 light-limited rates of gross phoiosyn-of temperature on
thesis (a).
in a. At 8 - 3 2 ^ maximum values of P^., are 3,25,1.80, 1.49. 3.57. and 1.00 pgC cell"* h"' measuredduring P^^.,, and 2.76, 1.41. 0,75. 0.71, and 0.53PgC cell"' h" ' , respectively measured during P*'™, .The dominant effect of salinity on photosynthesis ischaracterized by a general increase in carbon uptake(Pm.J at each temperature accompanying a decreasein salinity from 32 to 8%o. The amplitudes of thisincrease measured during P^™., excluding 26%odata,are 0.33, 0.79, 2,05. 2,66, and 2.45 pgC cell"' h" ' .at 10-30* C, respectively. A similar pattern was ob-served for P ' in samples. Again. P^^, data at 26%oWere usually inconsistent with the general patternssuggested by data from other cultures. At 10" C P.^,Was independent of salinity for both P''^.. and P' in(excluding 8%o) samples with an average value of0.67 (±0.05) and 0,43 (±0,003) pgC-cell-'-h"' re-spectively. At temperatures greater than 10" C, thesalinity-dependent effect of temperature on P^,, isconsistent between P*^« and P*' in at each experi-mental salinity in the range 15-32*?E«. At 15%o theresponse of P^,, to temperature can be representedby second-order polynomial equations, while at 26%Pf*m«, increases significantly as a linear function oftemperature. At both 20 and 32%o P.^. is statisticallyconstant with temperature. Average values and stan-dard errors at 20 and Vl%o are 1.16 (±0.17) and0 59 (±0.05) during I* ™«, and 0.72 (±0,09) and046 (±0.03) pgC c e l l ' h - ' during P'Un- At 8%o
3.75
3,00
2.25
1.50
» 0o 1-50g™ 1.001-
.76
SO
.25-
A 8-/OO
O 15• 20D 26
• ^ iA
/
1 1
o
---
•
1
••t
o>
A
•
-
dmtn
N
0 -
—•
1
10 15 20 25TEMPERATURE ("Cl
30
Fic. 9. Fitted cur\es which represent the salinity-dependenteffect of temperature on light-saturated rates of gross photosyn-thesis (P_«).
the relationship between P ^ , and temperature dur-ing P** , can be described by a second-order poly-nomial (r» = 0.95) while during P'^.^ 8^0 data weretoo variable to describe a general pattern. This vari-ation was mainly a consequence of low values mea-sured at 20* C.
Diurnal variation in a and P ^ , as measured bythe ratios of predicted values for P m« to those pre-dicted for P^ , are presented in Table 1. Thesepredicted values were generated using the leastsquares regression models derived for each param-eter as described above. For example, a constantvalue of a (2.22) was predicted for each experimen-tal temperature at 26%o, and for P^ , at 20 and 32'Xrbased on these analyses. The 9 5 ^ confidence inter-vals for estimates of a in most cases overlap, indi-cating that diurnal estimates of a were not signifi-cantly different. In contrast, Harding et al. (1981)reported significant diel periodicity in a in fourspecies of centric diatoms. Although both diurnaland diel periodicity in a were observed in culturesoi Stephanophyxis turris, the ratio of estimates duringpredicted maximum and minimum rates of photo-synthesis was statistically equal to one. Therefore,the apparent absence of any significant diurnal vari-ation in a in ,V. americana may be due. in part, to aninability to detect small dirferences based on therelatively greater variation associated with these es-
346 RICHARD L. MILLER AND DANIEL L. KAMYKOWSKI
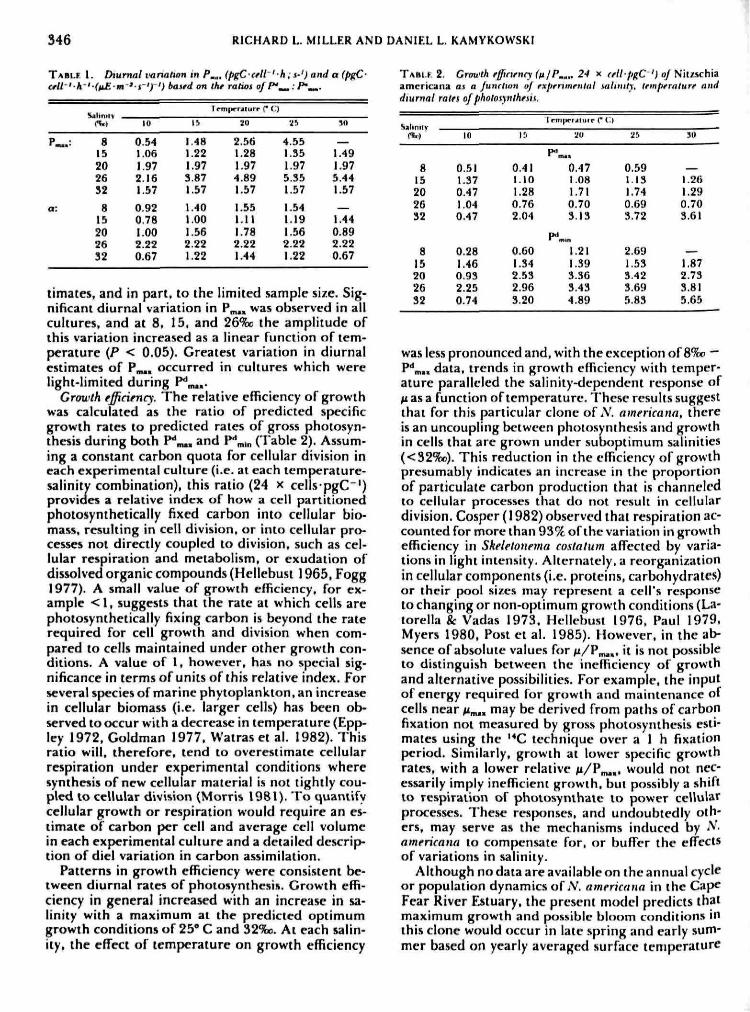
TABLF. I. Diumat i-anation in P^.,(pgC-cell 'h:i-')anda(pgC-cell 'h'-(nEm *i-')-') baied on thr ralws of P^^.p-^.
b1 imr tIrmiiri'JIiirr (* <J)
10 ir. •iO 2% 90
2036S2
8\^2Q26Si
0.5-11.061.972.16L57
0.920.781.002.220.67
1,481.221.973.871.57
1.401 00L562.221.22
2.561.281.974.891.57
1.55l . t l1.782.221.44
4 551.351.975.351.57
1.541.191.562.221.22
t.491.975.441.57
1.440.892.220.67
timates. and in part, to the limited sample size. Sig-nificant diurnal variation in P ^ , was observed in allcultures, and at 8, 15, and 26%D the amplitude ofthis variation increased as a linear function of tem-perature {P < 0.05). Greatest variation in diurnalestimates of P^ , occurred in cultures which werelight-limited during P^™,.
Growth efficiency. The relative efficiency of growthwas calculated as the ratio of predicted specificgrowth rates to predicted rates of gross photosyn-thesis during both P^^, and P* ,n (Table 2). Assum-ing a constant carbon quota for cellular division ineach experimental culture (i.e. at each temperature-salinity combination), this ratio (24 x cells pgC"')provides a relative index of how a cell partitionedphotosynthetically fixed carbon into cellular bio-mass, resulting in cell division, or into cellular pro-cesses not directly coupled to division, such as cel-lular respiration and metabolism, or exudation ofdissolved organic compounds (Heltebust 1965, Fogg1977). A small value of growth efficiency, for ex-ample <1 , suggests that the rate at which cells arephotosynthetically fixing carbon is beyond the raterequired for cell growth and division when com-pared to cells maintained under other growth con-ditions. A value of 1, however, has no special sig-nificance in termsof units of thi.s relative index. Forseveral species of marine phytoplanklon. an increasein cellular biomass (i.e. larger cells) has been ob-served to occur with a decrease in temperature (Epp-ley 1972, Goldman 1977, Watras et al. 1982). Thisratio will, therefore, tend to overestimate cellularrespiration under experimental conditions wheresynthesis of new cellular material is not tightly cou-pled to cellular division (Morris 1981). "Fo quantifycellular growth or respiration would require an es-timate of carbon per cell and average cell volumein each experimental culture and a detailed descrip-tion of diel variation in carbon assimilation.
Patterns in growth efficiency were consistent be-tween diurnal rates of photosynthesis. Growth effi-ciency in general Increased with an increase in sa-linity with a maximum at the predicted optimumgrowth conditions of 25" C and 32%o. At each salin-ity, the effect of temperature on growth efficiency
2. Grmt'th effmenry (n/P.,.. 2-t x rellpgC '} oj Nilz.schiaamericana m a Junrlmn of rxprrimfuUil utlnnty, (rmprralurr anddiurnal rates o h
Imijirtjtulc C i'.t
10 • j j 31)
815202632
0.511.370.471.040.47
815202632
0.281.460,932.250.74
0.411.101.280,762,04
0.601,342.532.963.20
0.471.081.710.703.13
1.211.393.363.434.89
0.591.131.740.69S.72
2.691,533.423.695.83
1.261.290,703.61
1.872.733.815.65
was less pronounced and. with the exception of 8%o "P''^., data, trends in growth efficiency with temper-ature paralleled the salinity-dependent response of/I as a function of temperature. These results suggestthat for this particular clone of A', americnna, thereis an uncoupling between photosynthesis and growthin cells that are grown under suboptimum salinities(<32%o). This reduction in the efficiency of growthpresumably indicates an increase in the proportionof particulate carbon production that is channeledto cellular processes that do nol result in cellulardivision. Cosper (1982)observed that respiration ac-counted for more than 939f: of the variation ingrowthefficiency in Skelelonema coslatum afTecied by varia-tions in light intensity. Alternately, a reorganizationin cellular cotnponents (i.e. proteins, carbohydrates)or their pool sizes may represent a cell's responseto changing or non-optimum grow th conditions (La-torella 8c Vadas 1973, Hellebust 1976. Paul 1979,Myers 1980, Post et al. 1985). However, in the ab-sence of absolute values for M/Pm«. '* is not possibleto distinguish between the inefficiency of growthand alternative possibilities. Forexatnple, the inputof energy required for growth and maintenance ofcells near^^ , may be derived from paths of carbonfixation not measured by gross photosynthesis esti-mates using the '''C technique over a I h fixationperiod. Similarly, growth at lower specific growthrates, with a lower relative M/P^ . , , would not nec-essarily imply inefficient growth, but possibly a shiftto respiration of photosynthate to power cellularprocesses. Ihese responses, and undoubtedly oth-ers, may serve as the mechanisms induced by N.americana to compensate for, or buffer the effectsof variations in salinity.
Although no data are available on the annual cycleor population dynamics of S. nmerknna in the CapeFear River Estuary, the present model predicts thatmaximum growth and possible bloom conditions inthis clone would occur in late spring and early sum-mer based on yearly averaged surface temperature
X .iMERICASA LIGHT-SATURATED GROWTH 347
and salinity daia (Copt'Iand ei al. 1974, Welch andParker 1979). Several studies (Hobbie 1971. Cope-land ctal. 1974, 1979) have documented ihat severalspecies of Xilischia were a numerically importantcomponent of the phytoplankton community. Be-cause the present study does not incorporate theeffects of other factors that may modify a species'population dynamics (i.e. zooplankton grazing,species-species interactions), field data may be re-quired, in addition to the present model, to ade-quately describe the occurrence and growth of .V.americana in the CFRE.
In summary, a comprehensive analysis was re-quired to characterize the physiological response of^'ituchia americana to environmental conditionsknown to occur in an estuarine environment. Thepresent study indicates that an estuarine clone of^ittsrhia nmericana under light-saturated growthconditions, exhibits significant physiological flexi-bility to maintain relatively high growth rates undervarious environmental conditions that it may ex-perience in the Cape Fear River Estuary, North Car-olina. Parameters of growth and photosynthesis-ir-tadiance models exhibit complex patterns ofresponse to various environmental conditions. Byneglecting possible time-dependent variations in aand P^.,, and changes in relative growth eflficiencyas a function of environmental conditions (i.e. tem-perature and salinity), production models may suffersignificant errors in describing the population dy-namics of natural phytoplankton communities.
Bcardall, J. & Morris, 1. 1976. 'I'hc concept of light intensityadapution in marine phytoplankion: Some Pxi>crimcnis wiihPharodarlylum trirornulxim. Mar. Bwi. (Brri) 37:377-87.
Brand. L, E..'Ouilbrd. R. R. L. Sc Murphy. L. 1981. A methodffir ihe rapid and [jrcciw determination of ac'climaird phy-toplanklon rrprndiulion rales./ Plonk. Rrs. 3:193-201.
Clorrn.J. K. 1978. Empirical nuydcl of SkfUionrmti ro\lnlum pho-tosynthrlic raic with application* in ihc San Francisco Bayestuary, .^(/r. Wnler Resourcf;. 1:267-74.
Copcland. B. J.Birkhcad. W. S. frHodson. R. 1974. Ecologicalmonitorinn in ihc area of the Brunswick Nuclear Power PlanI,1971-1973. Re}JtJrt to the Carolina Power and Light Com-pany. 71-4, 181 pp.
Copcland, B. J.. Hodion. R. G, Se Monroe, R.J. 1979. Larvaeand |XMtlarvae in ihe Ca[Jr Fear River Estiiar>, N.C. duringoperation of the Brunswick Stram F.leciric Plant. 1974-1978.Report to the Carolina Power and Light Company. 79-3,209pp.
^ p c r , E. 1982. F-fTecl of variation in light intensity on theefficiency of growth of Skrlrtonrma foslnlum (Bacillariophy-ceac) in a cycloitat./ Ph\rol. 18:360-8.
CulIen,J.J.& Rc-nger, E, H. 1979, CtHitinuou* measuremem ofthe DCMU-induced flimrescence response of natural phyiO'plankton population*. MOT. Bml. iBfrl.) 53:13-20.l, H. & Small. L. F. 1965. Variations in photosynthetic av*imilati<in nitio& in natural marine phytoplankton commu-nities. Limno/. Offfinogr. 10:67-73.l y . R. W. 1972, Temperature and phytoplankton growthin ihewa. Fiih. Bull. 70:1063-85.ey. R. W., Holmes R. W. & Strickland. J. l>. H. 1967. Sink-ing rates of marine phytoplankton measured with a fluorom-eter.y, Exft Mar. Bwi Erol. 1:191-208.
Fogg. G. E. 1977. Excretion oforganic matter by phytoplankton.Limnol. Ocfanogr. 22:576-7.
Goldman, J. C. 1977, Temperature effects on phytoplanktongrowth in continuou.s culture. Ltmnol. Ocranof^. 22:932-6.
Guillard, R. R. L. 1973. Methods for mitToHagcllates and nan-noplankton./n Stein.J. }t..[Ed.\Hnndhooko/Ph\rotopctilMrlh'Otis: Cxilturr Mrlhnds and Grmi-lh Mrasurrmrnls. CambridgeUniversity Press, New York. pp. 69-85.
flarding. L. W.. Meeson. B. W.. Prezelin. B. B. & Sweeney, B,W. 1981. Diel periodicity in photosynthesis of marine phy-toplankton. A/fir. BioL fflrr/.>61:95-iO5.
Harris. C- P. 1973. Diel and annual cycles of net plankton pho-tosynthesis in Lake Ontario. / Fish. Rfs. Board, Can. 30:1779-87.
Harris<m, W. G. & Platt, T. 1980. Variations in avsimilationnumber of coastal phytoplankton: Effects of environmenulco-variates.y. Plank. Rrs. 2:249-60.
Hellebust.J. A. 1965, Excretion of some organic compounds bymarine phytoplankton./.imurt/, Oernnogr. 10:192-206.
1976. Effect of salinity on photosynthesis and mannitolsynthesis in ihe green flagellate Platymonai surnea. Can. J.Bo/. 54:1735-41.
Hobbie. J. E. 1971. Some ecological measurements of the CapeFear River F-stuary. Reptirt to the Carolina Power and LightCompany. 25, 107 pp.
. A. D. &: Ptatt. 'I'. 1976. Mathematical formulations ofthe relationship between photosynthesis and light for phy-toplankton. Limnot. OeranogT. 21:540-7.
Jorgcnsen. E, G. 1968, The Adaptation of Plankton Algae. ILAspects of the 'I emperature Adaptation of SkeUumftna fos-inlum. Phpioi Planla. 21:423-7.
Latoreila, A. H. 8c Vadas. R. L. 1973. Salinity adaptation b>-DunalirUn trriolrcta. I. Increases in carbonic anhydrase activ-ity and evidence for a light-dependent Na*/H* exchange./ Phyfol. 9:273-7.
Lcdcrman. T. C. & Tett. P. 1981. Problems in modeling thephotosynthesis-light relationship for phytoplanlton. Bol. Mar.24:125-34.
Marra.J. 1978. Effect of short-term %'ariations in light intensityon photosynthesis of a marine phytoplankter: A laboratorysimulation study. Mar. Bioi. (fl W.) 46:191-202.
Miller, R. L. 1984. The physiological ecology of an estuarinrclone of the marine diatom ,Vi/yrA(«? amrncona. Ph.D. ihrsisNorth Carolina State University, 186 pp.
Morris, I. 1981. Photosynthesis products, physiological sute andphytoplankton growth. In Platt, T. |F.d.l Phj-iiological Base*of Phytoplankton Ecolng\. Can. Bull. Ft\k. Aquat. Sa, 210:83-102.
Myers, J. 1980. On the algae: thoughts about physiology- andmeasurements of efficiency. ?ri Fafkowski, P, C. (EdlPnmoryProduclitity m Ihf Sra. Plenum Press. New York, pp. 1-16.
Paasche, E. 1975. The influence of salinity on the growth ofsome plankton diatoms from brackish water. Sorw. J. Bol. 22:200-15.
Parsons, T. R.. Takahashi. M. & Hargrave. B. 1977. BiolopralOetanographic Proffi.\r\. Pergamon Press, New York, 323 pp.
Paul. J. S. 1979. Osmoregulation in the diatom Cytindrolhecaunt/ormii.J. Phycol. 15:280-4.
Platt. T. & Jassby. A. D. 1976. The relationship between pho-tosynthesis and light for natural assemblages of coastal ma-rine phytoplankton./ Phyrol. 12:421-30.
Post, A, F., Dubinsky, Z.. Wyman, K. & Falkowski. P. G. 1985.Physiological responses of a marine planktonic diatom totramitlonn in growth irradiance. Afar. Ecol. Prog. Set. 25:141-9.
Prcielin. B. B. 1981. Light reactions in photosynthesis./n Platt.T. |Ed.| Physiological Bases of Phytoplankton Ecology, Can.Bull-Fuh. Aquai Sn. 2\0:\-A^.
Prezelin.B. B.&Ley.A.C. 1980. Photmytuhesis and chlorophylla fluorescence rhythms or marine phytoplankton. Mar. Btoi.<Brr/,) 55:295-307.
Prezelin. B, B. A:Matlick, H. A. 1980. Time-course of photoad-aptation in the photosynthesis-irradiance relationship of a

348 RICHARD L. MILLER AND DANIEL L. KAMYKOW.SKI
tc exhibitinffphoKnynthctic pcrjddicity.Afdr. Biot.{Bfri) 58:85-96.
Pugh. P. R. 1970. Liquid stiniillation couritinR of '•C-diatommaterial on filler papcn For UMT in productivity studies. Ltm-vol. OrranogT. 15:652-55.
Raifton. M. L. & Jcnnrirh, R. I. 1978. DUD. a dcnvative-rrrealgorithm for nonlinear least «]uare». TffhnomrtTus 1:7-14.
Ryihcr, J. H. 1954. The ratio of photosynthesis to respirationin marine plankton algae and its effect on the measurementof productivity, Dffp-Sfa Res. 2:134-39.
SAS Institute Inc. 1982. SAS Uxfrt GuuU: Stalutics. Cary, NorthCarolina. 584 pp.
Stremann-Nielien. E. 1952. The uw of radioactive carbon ('*C)for measuring organic production in the sea.y. Cott\. P^rm.Int. ExploT. Mrr 18:117-40.
Strickbnd.J.D. H &ParMins,T. R. 1972. A Practical Handbookof Seawaier Analysis- Bulletin t67, Fnh. He\. Board Can.,Ottawa. 311 pp.
Thoma*. W, H. t964. An pxprrimrntal rvwluation of the '*Cmethod for measuring phyiopiankton production using cul'turcs of Pwrnltrlla pnmolnfa Butcher. fiiA. Bull. 63:273-92.
Van Baalcn.C.i: Edwards. P, 1973. Light-lem|>erature gradientplaie. tn Stein, J. R, | Ed.| tlnmllumk of Phycolopcnl Methodi:Cullurr Mfihotii and Growth Mfasurrmfnls. Cambridge Uni-venity Pres*. New York. pp. 267-73.
Watras, C. J.. Chisholm. S. W. fr Anderson, H. M. 1982. Reg-ulation of growth in an esiuarine clune of Gunyaulax lamaf-fnsis Lebcjur: Salinity-dependent temperature responses. J.Exp. Mar. Biol. Erot. 62:25-37.
Welch, J. M. & Parker. B. B. 1979. Circulation and hydrody-namics of the lower Cape Fear River. North Carolina. NOAATechnical report, NOS 80, 108 pp.
Yoder.J. A. 1979. Effect of temperature and light-limited growthand chemical composition of SkfUlonrma coHaliim (Bacillar-iophyceae)./ PhyroL 15:362-70.
J. Pkyot. M. 348-352 (1986)
COMPARATIVE ELECTROPHORETIC ANALYSIS OF TWOBINLJCLEATE DINOFLAGELLATES'
D. fean Whitten and Barbara A. Hoyhome^
Department of Biologj.-, Univcrsiiy of Nebraska at Omaha, 60th and Dodge, Omaha, Nebraska 68182
ABSTRACT
Although two clonal isolates of two different binucleatedinojlagehates Peridinium balticum (Lei-nnder) Letn-mermann and Glcnodinium foliaceum Stein share anumber of unique biochemical and ultroitructural attri-butes, compa ratiir a nalysisfor sixteen iM>zyme systems showsthat these isolates are quite distinct from each other. Ofthe 129 different tsozyme bands obserx'ed, only 28 werecommon to both organisms. These results support the con-tention based on plate tabulations that these two isolatesshould be placed in different genera and suggest thatdespite certain general biochemical and ultrastructuralsimilarities that the isolates differ significantly at the bio-chemical and genetic irt'el.K and perhaps exhibit differentadaptations between host and endosymbinnt.
Key index words: binucleate dinojlagetlaies: rhemosys-tematics; endosymbiotic hypothesis; Glenodinium foli-aceum: Peridinium bahicum
Two different binucleate dinoHagellates have beenstudied extensively during tbc past two decades. Thefirst reported, Glenodinium foliaceum Stein (Dodge1971), has a varied taxonomic history and has pre-viously been included in two other genera: Phyllo-
p t986* AddreM for reprini
dinium (Conrad 1926), and Peridinium (Biccheler1952). However, it bas more recently been returtiedto the genus Glenodinium (Prager 1963, Dodge andCrawford 1969). The second binuclt-ate dinotlagcl-late reported \s Peridinium balticum (Lcvander) Letn-mermann (Tomas et al. 1973).
Peridinium balticum and G. foliaceum do have dif-ferent plate tabulations (Biecbclcr 1952). Also, P-balticum is almost spherical, while G. foliaceum is sodorsovcntrally compressed that it has a concave shape(Steidinger and Cox 1980). Many ultrastructural andbiochemical studies of binucleate dinotiagcllates ap-pear to have used the same two clotial isolates (UTF.X1563 and UTF.X 1688).
Tbc two isolates sbare a number of ultrastructuralsimilarities. In both organisms, a single invaginatin?membrane separates the cell into two cytoplasmicregions. One region contains a typical dinokaryoticnucleus, eyespot, and other organdies, but no cblo-roplasts. *T be other region contains the chloroplastJand a eukaryotic-like supernumerary nucleus thatdivides amitotically (Dodge 1971, Tomas and COT^1973, Jeffrey atid Vc-sk 1976, Tippit and Pickctt-Hcaps 1976). In both isolates, the cbloroplasts areultrastructurally different from typical dinofla(?el'late cbloroplasts and are considered to be more Hk*those found in chrysopbytcs, phaeopbytcs, orchloromonads (Tomas and Cox 1973, Dodge 1975*