Rational power series, sequential codes and periodicity of sequences
Periodicity of atmospheric phenomena occurring
in the extreme South of Brazil
Fernando D. Campello*, Jaci M.B. Saraiva, Nisia Krusche
Fundacao Universidade Federal do Rio Grande, Rio Grande, Brazil
Received 25 July 2003; revised 1 December 2003; accepted 9 December 2003
Abstract
Spectral analysis revealed oscillations associated to atmospheric phenomena in the extreme south
of Brazil. Cycles from 36 to 77 days, linked to Madden–Julian Oscillation, from 18 to 28 days,
related to the bipolar South Atlantic Convergence Zone-Subtropics mode and 10-day oscillations
due to the passage of frontal systems were detected.
q 2004 Royal Meterological Society. Published by Elsevier Ltd. All rights reserved.
Keywords: Atmospheric oscillations; Spectral analysis; South of Brazil; South Atlantic Convergence Zone;
Madden–Julian oscillation
1. Introduction
In several regions around the world, periodical phenomena are detected in time series of
atmospheric and oceanographic data through the use of spectral analysis techniques (Sultan
et al., 1995; Arabelos et al., 1997; Kamata et al., 2002), derived from Fourier’s spectral
analysis. It considers the decomposition of any sample of a discrete sign as a sequence of sine
and cosine waves with different amplitudes and phases (Stull, 1988). The study of the
disturbances with a certain periodicity is very useful because the more the periodicity of a
phenomenon is known, the morechances thereare topredict it and anticipateanomalies related
to it. However, there are only a few studies, such as Moller et al. (1996), which use spectral
analysis techniques to characterize atmospheric disturbances in the extreme south of Brazil.
It is known that the atmosphere has two important fluctuation modes in low
frequencies: inter-annual variations, such as the El Nino/Southern Oscillation (ENSO)
1530-261X/$ - see front matter q 2004 Royal Meterological Society. Published by Elsevier Ltd. All rights
reserved.
doi:10.1016/j.atmoscilet.2003.12.003
Atmospheric Science Letters 5 (2004) 65–76
www.elsevier.com/locate/issn/1530261X
* Corresponding author.
E-mail address: [email protected] (F.D. Campello).

phenomenon and intraseasonal variations, such as the 30–60 day Oscillation or the
Madden–Julian Oscillation (MJO) (Knutson and Weickmann, 1987). Both can cause
substantial changes in the circulation of mid-latitudes in the Southern Hemisphere (Kouski
and Kayano, 1994). Paegle et al. (2000) also cite a 22–28 day oscillation mode over the
South Atlantic Convergence Zone (SACZ) and the subtropical plains. Moreover,
propagation of synoptic scale systems has strong influence on the weather conditions in
the extreme south of Brazil (Nobre et al., 1986).
The region of study is located in the subtropical zone, south of Rio Grande do Sul State,
extreme south of Brazil. The area stretches over the estuary of the Lagoa dos Patos, where
there are three cities: Pelotas in the north, Rio Grande in the west, and Sao Jose do Norte,
in the east (Fig. 1). The landscape is of coastal and sedimentary plains, with low
topography. There are four well-defined seasons in the year. The estuary of the Lagoa dos
Patos has intense sea and lake traffic because it houses one of the largest fishing and
commercial ports in Brazil. Ships of all sizes navigate the estuary, loaded with fish, and
petrol and its derivatives, among other products. It also has great ecological importance
because it is used by several species of aquatic animals for reproduction and development
(Seeliger et al., 1997). Therefore, good knowledge of the atmospheric circulation patterns
in this region is important to help modelers to forecast unpleasant weather conditions,
which would cause accidents, and social and environmental damage.
The main objective of this study is to determine, through spectral analysis, the relevant
atmospheric cycles found over the extreme south of Brazil and their respective
periodicities. An effort is also done in order to link those cycles to well-known periodical
atmospheric phenomena that influence the study area, contributing to the understanding of
Fig. 1. Location of the area used in the study.
F.D. Campello et al. / Atmospheric Science Letters 5 (2004) 65–7666

the atmospheric circulation over this region. In Section 2, data and methodology used in
this study are described. Results of spectral analysis are shown and commented in Section
3. Finally, in Section 4, conclusions are presented.
2. Data and methods
Data used in this study come from three meteorological stations, two conventional
ones, located at the Fundacao Universidade Federal do Rio Grande (FURG), and at
Empresa Brasileira de Pesquisas Agrıcolas (EMBRAPA-UFPel); and an automatic one
located near the access channel from the Lagoa dos Patos (Praticagem), shown in Fig. 1.
Data provided by the conventional stations were collected from 1991 to 2000 and are
daily average values, calculated according to the regulations of the World Meteorological
Organization. Data provided by the automatic station were measured hourly during eight
months, from April to December 1999. The wind velocity sensors in this station are
located on a tower 25 m high, whereas the ones in the other stations are 10 m high. The
atmospheric pressure, the air temperature, the relative humidity, the precipitation rate, and
the zonal ðuÞ and meridional ðvÞ wind components were analyzed. At the conventional
stations, the total number of daily hours of direct insolation, namely the insolation rate,
was also analyzed.
The spectral analysis was carried out using Fast Fourier Transform (FFT). The Power
Spectral Density was estimated using Welch’s averaged periodogram method. This
method is based on multiple computation and averaging of the FFT of overlapping data
segments. Each of those segments was first detrended and then a Hanning window (50%
overlap) was applied. Emery and Thomson (1998) show the importance of using a window
to increase the number of degrees of freedom per espectral estimate, raising the statistical
reliability of the analysis. Trethewey (2000) discusses about the importance of window
overlapping and cites the 50% overlap as a commonly used value for the Hanning window
in order to prevent the occurrence of either missing or unequally weighted portions of the
time signal. A first analysis was carried out using the integral time series for each station.
Then, the annual cycle (FURG and EMBRAPA stations) was removed from the series and
a second analysis was done, looking at other not so clear periodicities.
3. Results and discussion
Spectral analysis applied to integral daily average series (FURG and EMBRAPA
stations) clearly showed the predominance of the yearly cycle, with a period of 365.3 days,
for the following variables: atmospheric pressure, air temperature, relative humidity,
insolation rate, and the zonal wind component. Both stations presented very similar
results. The meridional wind component and the precipitation rate showed different
behaviors from the other variables. For the first one, the annual cycle was present, but it
was weaker than other high frequency oscillations. The strongest energy observed for this
component occurred in much lower shorter than the annual one, related to the passage of
frontal systems, which will be analyzed later. For the precipitation rate, the annual cycle
F.D. Campello et al. / Atmospheric Science Letters 5 (2004) 65–76 67
was not found. The absence of strong energy related to the annual cycle in the series of
precipitation is a reflex of its behavior in the extreme south of Brazil. The precipitation rate
is relatively well distributed throughout the year, according to Diaz et al. (1998).
Moreover, Gonzales and Barros (1996) have shown that the extreme south of Brazil is
located in a transition zone between the summer regime (annual cycle, with a maximum in
the summer), observed towards to the north–northwest and a winter regime, where
precipitation is mainly caused by the passage of frontal systems and by cyclogenesis.
The lowest frequency analyzed for the daily average series was the annual one.
According to Stull (1988), because of unresolvable low frequencies (e.g. red-noise) one
should not consider frequencies of 3 or less as being reliable (it is important to have at least
three waves per sampling period). However, most meteorologists prefer to use at least five
or ten waves as the cut off. For this study, ten waves per sampling period were used (10
years), limiting the analysis to the annual oscillation. If the series used were longer (e.g.
more than 20 years), we would probably be able to detect the ENSO cycle (time interval of
about 3 years) in some of the variables, since some authors (Grimm et al., 1998) emphasize
that the ENSO phenomenon have strong influence over the region, specially on the
precipitation rate.
A second analysis was carried out after the removal of the annual cycles of FURG and
EMBRAPA series. It led to show other spectral peaks, dampened by the high energy of the
annual cycle. A semiannual cycle was present in the temperature spectra of both stations
(183 days at FURG and 190 days at EMBRAPA). Van Loon (1967) had already noticed a
semiannual oscillation for the same variable in the Southern Hemisphere, although for the
troposphere. He linked that cycle to differences in the seasonal heating and cooling trends
in middle and high latitudes, combined with the special circumstances of nearly equal
annual ranges of temperature in the middle troposphere. A 183-day cycle can also be
noticed in the precipitation rate of EMBRAPA station and a 130-day oscillation is present
in the zonal wind component for both stations. On the other hand, the meridional wind
component showed a 135-day cycle at EMBRAPA station only.
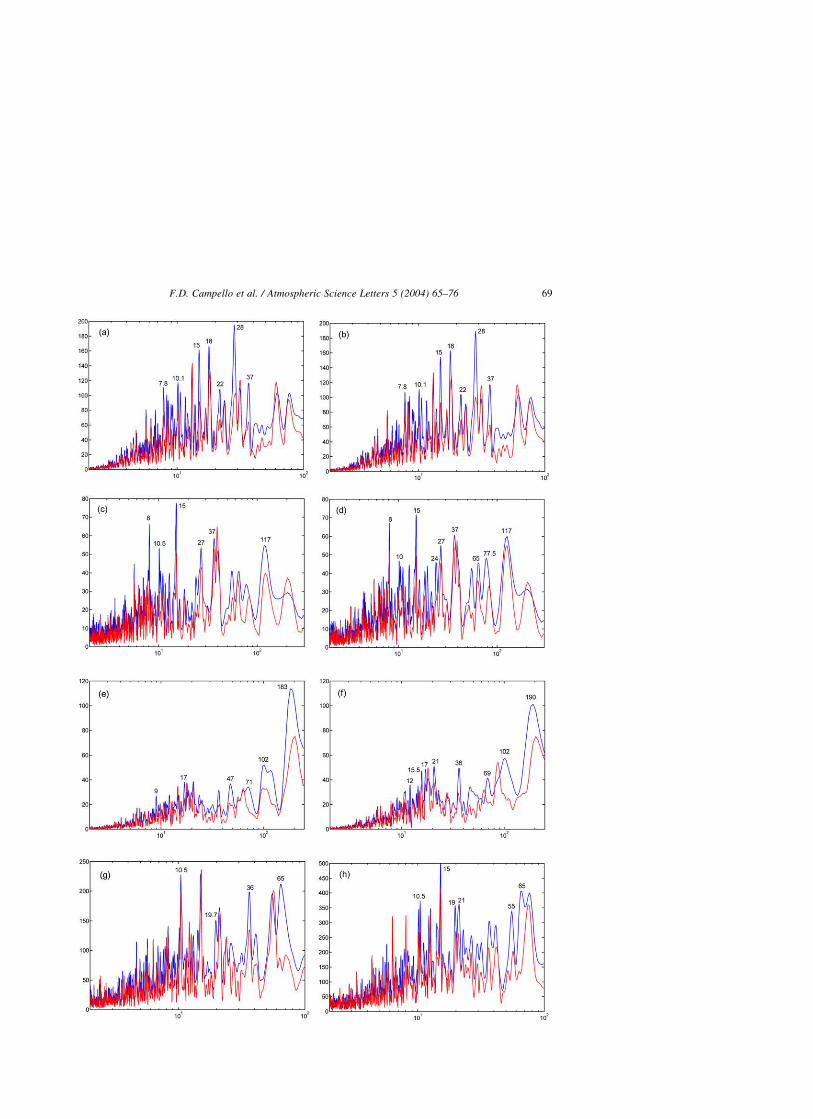
Fig. 2 shows the Power Spectral Densities, for atmospheric pressure, insolation,
temperature and relative humidity, obtained from the series without the annual cycle.
Spectra of those variables presented very small differences between stations. Atmospheric
pressure and insolation rate are the most similar ones and there is almost no difference
between FURG and EMBRAPA. It was already expected, since both stations are faraway
by just 60 km and most of the atmospheric phenomena recorded in the time series have a
spatial scale bigger than that distance. Fig. 3 shows the Power Spectral Densities for
meridional and zonal wind components and precipitation rate for both stations. The spectra
of those variables are less similar between the stations, although they still show many
coincident peaks. Local effects probably easily affect precipitation and wind, resulting in
some difference between station’s measurements. Considering all the charts, it is possible
Fig. 2. Power Spectral Density for some variables measured at FURG and EMBRAPA station from 1991 to 2000:
(a) atmospheric pressure, FURG; (b) atmospheric pressure, EMBRAPA; (c) insolation, FURG; (d) insolation,
EMBRAPA (e) temperature, FURG; (f) temperature, EMBRAPA; (g) relative humidity, FURG; (h) relative
humidity, EMBRAPA. Values in the abscissa are in days. Red line (in web version) denotes the 95%
confidence limit.
F.D. Campello et al. / Atmospheric Science Letters 5 (2004) 65–7668
F.D. Campello et al. / Atmospheric Science Letters 5 (2004) 65–76 69

to observe that temperature presented a strong energy related to lower frequencies, while
wind and precipitation showed stronger energy in higher frequencies.
Table 1 displays the significant spectral peaks found for each variable for the series
without the annual cycle. Atmospheric phenomena probably associated to each oscillation
are also shown. Most of the oscillations can be fitted in three different atmospheric
phenomena: the MJO (periods from 36 to 77 days), the bipolar SACZ-Subtropics mode,
suggested by Paegle et al. (2000) (periods from 18 to 28 days), and the frontal systems
Fig. 3. Power Spectral Density for some variables measured at FURG and EMBRAPA station from 1991 to 2000:
(a) meridional wind component, FURG; (b) meridional wind component, EMBRAPA; (c) zonal wind component,
FURG; (d) zonal wind component, EMBRAPA; (e) precipitation, FURG; (f) precipitation, EMBRAPA. Values in
the abscissa are in days. Red line (in web version) denotes the 95% confidence limit.
F.D. Campello et al. / Atmospheric Science Letters 5 (2004) 65–7670

Table 1
Significant spectral peaks for each variable (annual cycle removed)
Atmospheric phenomenon Variable Station Periodicity (days)
Semiannual Temperature FURG 183
EMBRAPA 190
Precipitation EMBRAPA 183
100–135 days (no phenomenon
associated)
Temperature FURG 102
EMBRAPA 102
Insolation FURG 117
Precipitation FURG 117
EMBRAPA 117
Meridional wind component EMBRAPA 135
FURG 130
Zonal wind component EMBRAPA 96, 130
Madden–Julian Oscillation Atmospheric pressure FURG 37
EMBRAPA 37
Temperature FURG 36, 47, 71
EMBRAPA 36, 46, 69
Relative humidity FURG 36, 65
EMBRAPA 55, 65
Insolation EMBRAPA 37, 55, 77
FURG 37
Precipitation FURG 40
Bipolar SACZ-Subtropics mode Atmospheric pressure FURG 18, 22, 28
EMBRAPA 18, 22, 28
Temperature FURG 17
EMBRAPA 17, 21
Relative humidity FURG 20
EMBRAPA 19, 21
Insolation FURG 27
EMBRAPA 19, 24, 27
Precipitation FURG 27
EMBRAPA 26
Meridional wind component EMBRAPA 24
Zonal wind component EMBRAPA 21.5, 23.7
Frontal systems (the 15-day cycle
is possibly not related
to frontal systems)
Atmospheric pressure FURG 7.8, 10.1, 10.5, 15
EMBRAPA 7.8, 10.1, 10.5, 15
Temperature FURG 9
EMBRAPA 12, 15.5
Relative humidity FURG 10.5
EMBRAPA 10.5, 15
Insolation FURG 8, 10.5, 15
EMBRAPA 8, 10, 13, 15
Precipitation FURG 6.5, 13.5, 15
EMBRAPA 4.5, 5.3, 8.4, 15
(continued on next page)
F.D. Campello et al. / Atmospheric Science Letters 5 (2004) 65–76 71
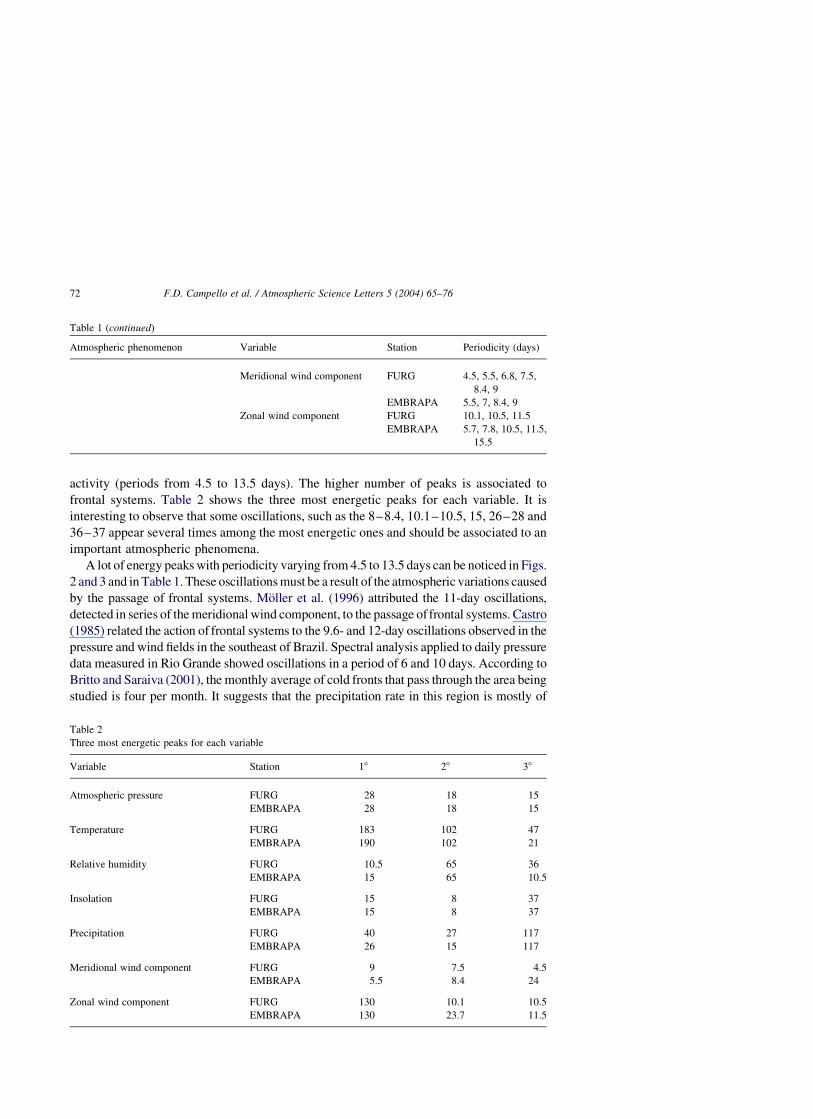
activity (periods from 4.5 to 13.5 days). The higher number of peaks is associated to
frontal systems. Table 2 shows the three most energetic peaks for each variable. It is
interesting to observe that some oscillations, such as the 8–8.4, 10.1–10.5, 15, 26–28 and
36–37 appear several times among the most energetic ones and should be associated to an
important atmospheric phenomena.
A lot of energy peaks with periodicity varying from 4.5 to 13.5 days can be noticed in Figs.
2 and 3 and in Table 1. These oscillations must be a result of the atmospheric variations caused
by the passage of frontal systems. Moller et al. (1996) attributed the 11-day oscillations,
detected in series of the meridional wind component, to the passage of frontal systems. Castro
(1985) related the action of frontal systems to the 9.6- and 12-day oscillations observed in the
pressure and wind fields in the southeast of Brazil. Spectral analysis applied to daily pressure
data measured in Rio Grande showed oscillations in a period of 6 and 10 days. According to
Britto and Saraiva (2001), the monthly average of cold fronts that pass through the area being
studied is four per month. It suggests that the precipitation rate in this region is mostly of
Table 1 (continued)
Atmospheric phenomenon Variable Station Periodicity (days)
Meridional wind component FURG 4.5, 5.5, 6.8, 7.5,
8.4, 9
EMBRAPA 5.5, 7, 8.4, 9
Zonal wind component FURG 10.1, 10.5, 11.5
EMBRAPA 5.7, 7.8, 10.5, 11.5,
15.5
Table 2
Three most energetic peaks for each variable
Variable Station 18 28 38
Atmospheric pressure FURG 28 18 15
EMBRAPA 28 18 15
Temperature FURG 183 102 47
EMBRAPA 190 102 21
Relative humidity FURG 10.5 65 36
EMBRAPA 15 65 10.5
Insolation FURG 15 8 37
EMBRAPA 15 8 37
Precipitation FURG 40 27 117
EMBRAPA 26 15 117
Meridional wind component FURG 9 7.5 4.5
EMBRAPA 5.5 8.4 24
Zonal wind component FURG 130 10.1 10.5
EMBRAPA 130 23.7 11.5
F.D. Campello et al. / Atmospheric Science Letters 5 (2004) 65–7672

frontal origin. Braga and Krusche (2000) showed that the predominant direction of wind
during the whole year is northeast, due to the influence of the Southern Atlantic Tropical
Anticyclone. However, the passage of frontal systems, due to the advance of the Polar
Migratory Anticyclone over the south of Brazil, causes an inversion in the direction of the
wind to the south quarter. These influences can be easily noticed in the spectra of wind and
precipitation rate, where there is a high number of significant peaks concentrated in periods
from 4.5 to 13.5 days. Thought, spectral analysis suggests that all variables seem to be much
affected by the passage of frontal systems.
Oscillations with longer periods than the described ones for frontal systems are also
observable in Figs. 2 and 3. A 15-day oscillation can be noticed in almost all variables,
except in meridional wind component. This oscillation sometimes presents high-energy
peaks and shows a period longer than those usually related to frontal systems. No well-
known atmospheric phenomenon was linked to the 15-day cycle in this study. It would be
interesting to have more research in order to check the origin of this apparently important
oscillation. Cycles with a bit longer periods, between 17 and 28 days, have also occurred in
several variables. High energies associated to periods from 26 to 28 days were found in the
pressure and precipitation spectra. Such oscillations should be related to a kind of bipolar
mode, with opposed signs in the South Atlantic Convergent Zone (SACZ) and in the South
Region in Brazil. This situation is suggested by Paegle et al. (2000), who found
oscillations between 22 and 28 days, with 22-day meaningful peaks, in data of outgoing
longwave radiation (OLR), in a bipolar SACZ-Subtropics mode.
In the same figures, cycles with periods between 36 and 77 days can be noticed.
These intraseasonal oscillations must be related to the MJO. Such oscillation is typical
of the tropical troposphere, propagates eastward, and happens in a large spectrum,
which can vary from 30 to 60 days (Knutson and Weickmann, 1987). However,
several authors have shown that MJO can cause substantial changes in the circulation
of mid-latitudes in the Southern Hemisphere (Grimm and Silva Dias, 1995).
Weickmann et al. (1985) noticed the presence of anticyclones and subtropical
cyclones associated with the anomalies of OLR caused by the MJO. These
anticyclones and cyclones would move along with the OLR anomalies and would
be responsible for affecting the circulation in mid-latitudes. Gonzales and Barros
(1996) carried out spectral analysis for precipitation rate series in several stations in
the east and in the northeast of Argentina. They have found oscillations with variable
periods between 23 and 45 days, which suggested to be related to MJO. In this study,
the 36/37-day oscillation seem especially important. It is not shown in the wind and
precipitation spectra only, in which there is a 40-day cycle (FURG station).
The results of spectral analysis applied to the Praticagem station series are shown in
Fig. 4, where the abscissa axes represent hours, but the number upon the peaks are
presented in days for easier comparison with the other stations. The daily cycle was not
removed from the series before the analysis. There are differences between the main
energy peaks at the automatic station series and at the conventional stations. These
differences are due to the period analyzed in this station (only 1999) and to the higher
sampling frequency. Larger differences are related to the presence of a strong daily cycle
in temperature and relative humidity and, with less intensity, in the zonal wind component.
The one-day oscillation observable in the zonal wind component is a result of the action
F.D. Campello et al. / Atmospheric Science Letters 5 (2004) 65–76 73
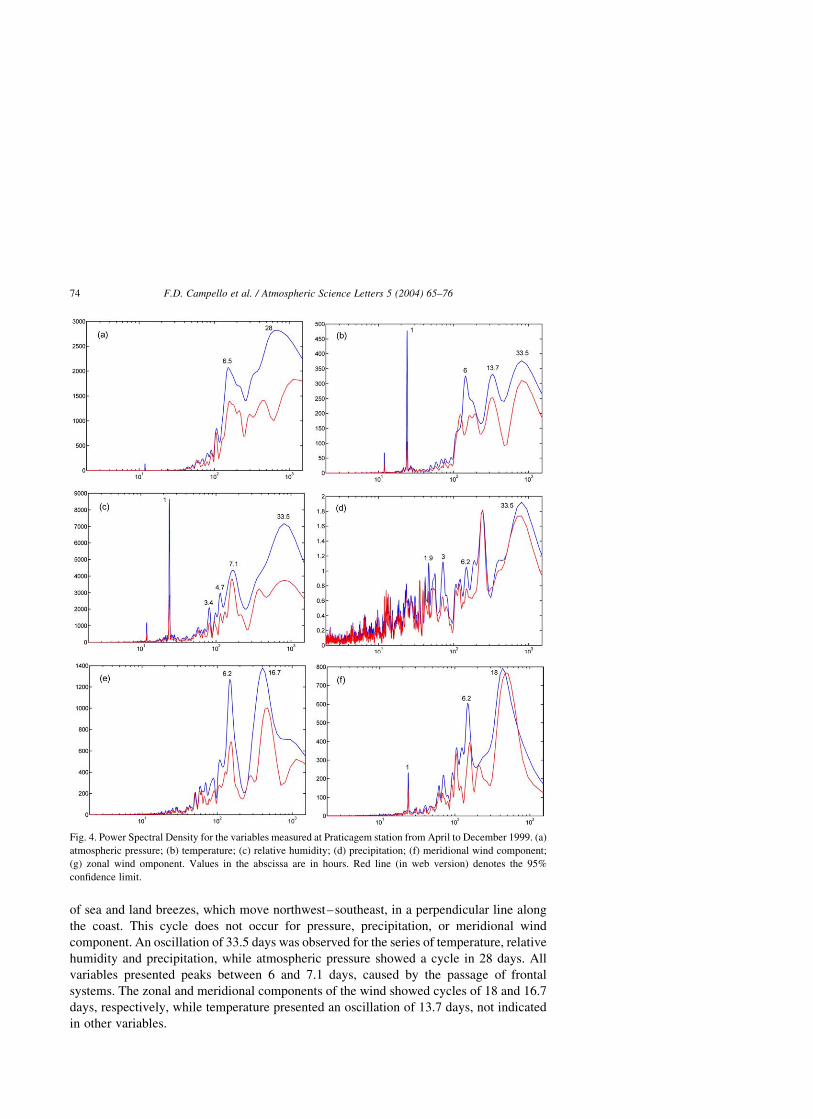
of sea and land breezes, which move northwest–southeast, in a perpendicular line along
the coast. This cycle does not occur for pressure, precipitation, or meridional wind
component. An oscillation of 33.5 days was observed for the series of temperature, relative
humidity and precipitation, while atmospheric pressure showed a cycle in 28 days. All
variables presented peaks between 6 and 7.1 days, caused by the passage of frontal
systems. The zonal and meridional components of the wind showed cycles of 18 and 16.7
days, respectively, while temperature presented an oscillation of 13.7 days, not indicated
in other variables.
Fig. 4. Power Spectral Density for the variables measured at Praticagem station from April to December 1999. (a)
atmospheric pressure; (b) temperature; (c) relative humidity; (d) precipitation; (f) meridional wind component;
(g) zonal wind omponent. Values in the abscissa are in hours. Red line (in web version) denotes the 95%
confidence limit.
F.D. Campello et al. / Atmospheric Science Letters 5 (2004) 65–7674

4. Conclusions
The main oscillations that affect the fields of atmospheric variables in the estuary of the
Lagoa dos Patos were detected by a spectral analysis technique. The main cycle for
pressure, temperature, relative humidity, insolation rate, and zonal wind component
corresponded to 365 days (annual), weaker in the wind meridional component and absent
in the precipitation. A new analysis, after the removal of the annual cycle of FURG and
EMBRAPA stations, emphasized new oscillations. Both stations presented similar results
for the spectral analysis of the same variable. Temperature and precipitation (EMBRAPA
station) showed semiannual oscillations and a 130-days cycle was present in the wind
series. Oscillations related to MJO (36–77 days), to a convective variability in the SACZ
region (17–28 days) and to the passage of frontal systems (4.5–13.5 days) were also
revealed. Moreover, a strong 15-day cycle, possibly not related to the frontal systems
influence became clear in the analysis and could be an object for future studies. Spectral
analysis for 1999 carried out with the data provided by Praticagem station showed
differences when compared to the other stations, due to the highest sampling frequency
and to the shorter period of data series. Nevertheless, like in the other stations, an
important oscillation of about 6.2 days, related to the frontal systems, was noticed for all
variables. Temperature, relative humidity and precipitation also revealed a 33.5-days
peak, probably linked to MJO.
Acknowledgements
The authors thank the Agencia Nacional do Petroleo for the financial support, and
EMBRAPA, and Praticagem for providing the data.
References
Arabelos, D., Asteriadis, G., Contadakis, M.E., et al., 1997. Atmospheric tides in the area of Thessaloniki.
J. Geodyn. 23, 65–75.
Braga, M.F.S., Krusche, N., 2000. Padrao de ventos em Rio Grande, RS, no perıodo de 1992 a 1995. Atlantica 22,
27–40.
Britto, F.P., Saraiva, J.M.B., 2001. Estudo da precipitacao associada aos sistemas frontais na cidade do Rio
Grande na estacao de inverno. Geografia em atos 1, 107–122.
Castro, B.M., 1985. Subtidal response to wind forcing in the South Brazil High during winter. PhD Thesis,
University of Miami, Florida, 211 pp.
Diaz, A.F., Studzinski, C.D., Mechoso, C.R., 1998. Relationships between precipitation anomalies in Uruguay
and Southern Brazil and sea surface temperature in the Pacific and Atlantic oceans. J. Clim. 11, 251–271.
Emery, W.J., Thomson, R.E., 1998. Data Analysis Methods in Physical Oceanography. Pergamon Press, New
York, 634 pp.
Gonzales, M.H., Barros, V.R., 1996. Aspectos estadisticos del ciclo anual de precipitacion y sus anomalias en
Argentina Subtropical. Meteorologica 21, 15–26.
Grimm, A.M., Silva Dias, P.L., 1995. Analysis of tropical–extratropical interactions with influence functions of a
barotropic model. J. Atmos. Sci. 52, 3538–3555.
F.D. Campello et al. / Atmospheric Science Letters 5 (2004) 65–76 75

Grimm, A.M., Ferraz, S.E.T., Gomes, J., 1998. Precipitation anomalies in Southern Brazil associated with El
Nino and La Nina events. J. Clim. 11, 2863–2880.
Kamata, Y., Matsunami, A., Kitagawa, K., Arai, N., 2002. FFT analysis of atmospheric trace concentration of
N2O continuously monitored by gas chromatography and cross-correlation to climate parameters.
Microchem. J. 71, 83–93.
Knutson, T.R., Weickmann, K.M., 1987. 30–60 day atmospheric oscillations: composite life cycles of convection
and circulation anomalies. Mon. Wea. Rev. 115, 1407–1436.
Kouski, V.E., Kayano, M.T., 1994. Principal modes of outgoing longwave radiation and 250 mb circulation for
the South American sector. J. Clim. 7, 1131–1143.
Moller, O.O. Jr., Lorenzzetti, J.A., Stech, J.L., Mata, M.M., 1996. The Patos Lagoon summertime circulation and
dynamics. Continental Shelf Res. 16, 335–351.
Nobre, C.A., Cavalcanti, I.F.A., Gan, M.A., et al., 1986. Climanalise, Boletim de monitoramento e analise
climatica: Numero especial. INPE, Sao Jose dos Campos, 124 pp.
Paegle, J.N., Byerle, L.A., Mo, K.C., 2000. Intraseasonal modulation of South American summer precipitation.
Mon. Wea. Rev. 128, 837–850.
Seeliger, U., Odebrecht, C., Castello, J.P., 1997. Subtropical Convergence Environments: The Coast and Sea in
the Southwestern Atlantic. Springer, Berlin, 308 pp.
Stull, R.B., 1988. An Introduction to Boundary Layer Meteorology. Kluwer Academic Publishers, Dordrecht, 670
pp.
Sultan, S.A.R., Ahmad, F., Elghribi, N.M., Al-Subhi, A.M., 1995. An analysis of Arabian Gulf monthly mean sea
level. Continental Shelf Res. 15, 1471–1482.
Trethewey, M.W., 2000. Window and overlap processing effects on power estimates form spectra. Mech. Syst.
Signal Process. 14, 267–278.
Van Loon, H., 1967. The half-yearly oscillations in middle and high southern latitudes and the coreless winter.
J. Atmos. Sci. 24, 472–486.
Weickmann, K.M., Lussky, G.R., Kutzbach, J.E., 1985. Intraseasonal (30–60 day) fluctuations of outgoing
longwave radiation and 250 mb streamfunction during northern winter. Mon. Wea. Rev 113, 941–961.
F.D. Campello et al. / Atmospheric Science Letters 5 (2004) 65–7676
Copyright © 2022 FDOKUMEN