Macrograzers strongly influence patterns of epiphytic assemblages in seagrass meadows
Studies on Lake Erie’s littoral algae; Host specificity and temporal periodicity of epiphytic diatoms
David F. Millie’ & Rex L. Lowe2T3 1 Department of Botany, Iowa State University, Ames, IA 50011, U.S.A. 2 Department of Biological Sciences, Bowling Green State University, Bowling Green, OH 43403, U.S.A. 3 University of Michigan Biological Station, Pellston, MI 49769, U.S.A.
Keywords: algae, diatoms, periphyton, Lake Erie, epiphytes, littoral zone
Abstract
Substratum specificity and temporal periodicity of the attached diatom flora upon three aquatic vascular plants and an artificial substratum were examined in three Lake Erie marshes. No qualitative or quantitative specificity for substrata was observed. Variability of diatom assemblage structure within replicate samples of a particular substratum type was as great as, or greater than, variability between substrata. Diatom assemblages upon dowel rod displayed a mid to late summer density maximum. Variability of density maxima upon natural substrata was attributed to different growth rates of the host macrophytes. Diatom assemblages within each sampling site possessed a distinct temporal periodicity indicating that factors affecting diatom growth are heterogeneous in distribution throughout Lake Erie’s littoral zone.
Introduction
The epiphytic algal flora plays an important role in shallow freshwater systems (Brock 1970; Allen 1971; Sheldon & Boylen 1975; Cattaneo & Kalff 1980). This assemblage is the base of most food webs in the littoral habitat and a source of dissolved and particulate organic matter to the water. Al- though attached algal assemblages are often the dominant producers in shallow lentic systems, little is known concerning their geographical distribu- tions, population dynamics, and microhabitat utili- zation (Wetzel 1975).
The question of whether an algal taxon, or group of taxa, is specifically associated with a particular substratum has long intrigued algal ecologists. Sev- eral studies (Prowse 1959; Edsbagge 1968; Rau- tiainen & Ravenko 1972; Ramm 1977; Eminson & Moss 1980) reported a definite host specificity by epiphytes. Eminson & Moss (1980) suggested this to be an expected occurrence due to dynamic bio-
logical, physical and chemical properties of macro- phytic substrata. Other researchers, however, dis- puted this theory of specificity (Cholnoky 1927; Fritsch 1931; Simonsen 1962; Main & McIntire 1974; Hutchinson 1975; M&tire & Moore 1977), noting that algal distribution is probably a response to physical factors rather than a phenomenon of host specificity. Host macrophytes, therefore, only provide potential surface area for colonization rather than interacting nutritionally with epiphytes (Main & McIntire 1974).
The western basin of Lake Erie has been the site of extensive phycological research. However, very little information exists concerning the littoral algal flora, especially the diatoms (Millie & Lowe 198 1). The intent of this study is to provide additional qualitative and quantitative information on host macrophyte-epiphyticdiatomspecificityfromthree Lake Erie marshes. The composition and temporal periodicity of the epiphytic diatom flora is also reported.
Hydrobiologia99, 7-18 (1983). OOIS-8158/83/0991-0007/$02.40. 6 Dr W. Junk Publishers, The Hague. Printed in The Netherlands.
8
Materials and methods
Sampling and counting procedures
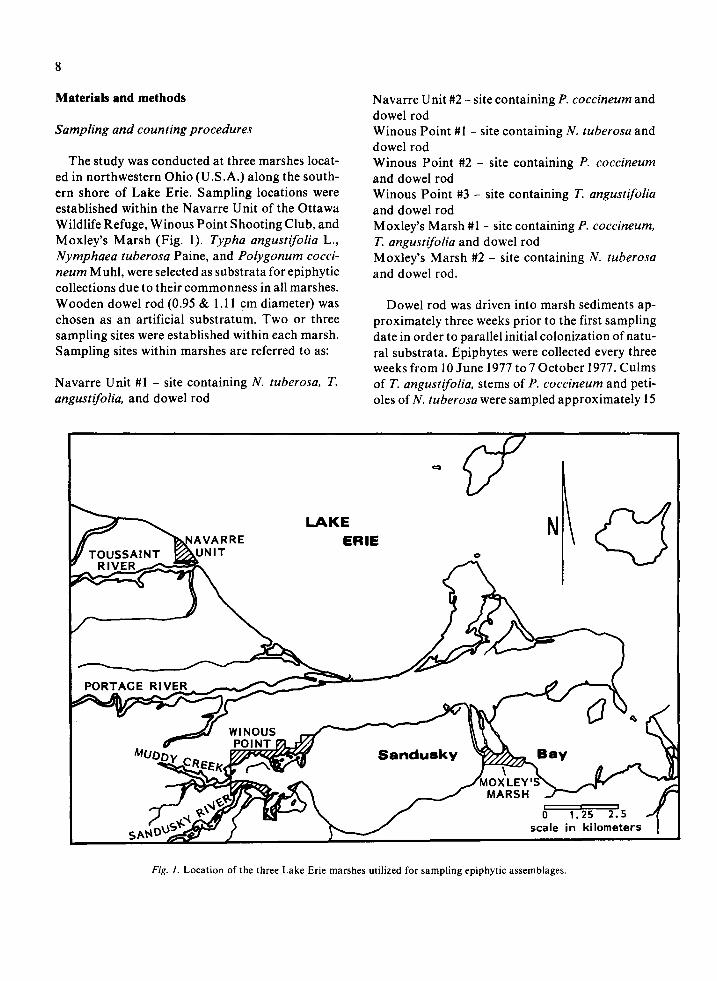
The study was conducted at three marshes locat- ed in northwestern Ohio (U.S.A.) along the south- ern shore of Lake Erie. Sampling locations were established within the Navarre Unit of the Ottawa Wildlife Refuge, Winous Point Shooting Club, and Moxley’s Marsh (Fig. 1). Typha angustifolia L., Nymphaea tuberosa Paine, and Polygonum cocci- neum Muhl, were selected as substrata for epiphytic collections due to their commonness in all marshes. Wooden dowel rod (0.95 & 1.11 cm diameter) was chosen as an artificial substratum. Two or three sampling sites were established within each marsh. Sampling sites within marshes are referred to as:
Navarre Unit #l - site containing N. tuberosa, T. angustifolia, and dowel rod
Navarre Unit #2 - site containing P. coccineum and dowel rod Winous Point #l - site containing N. tuberosa and dowel rod Winous Point #2 - site containing P. coccineum and dowel rod Winous Point #3 - site containing T. angustifolia and dowel rod Moxley’s Marsh #I1 - site containing P. coccineum, T. angustifolia and dowel rod Moxley’s Marsh #2 - site containing N. tuberosa and dowel rod.
Dowel rod was driven into marsh sediments ap- proximately three weeks prior to the first sampling date in order to parallel initial colonization of natu- ral substrata. Epiphytes were collected every three weeks from 10 June 1977 to7 October 1977. Culms of T. angustifolia, stems of P. coccineum and peti- oles of N. tuberosa were sampled approximately 15
Fig. 1. Location of the three Lake Erie marshes utilized for sampling epiphytic assemblages.
9
centimeters below the surface of the water to reduce the potential effects of wave action on epiphytic growth. A ten centimeter tube (internal diameter 1.75 cm) was used to prevent the loss of a large majority of loosely attached algae. The aerial por- tion of the macrophyte was cut and the tube slid over the cut culm, stem or petiole. The bottom portion of the macrophyte was cut and the tube sealed. Dowel rod was sampled in a similar manner. Samples were taken in triplicate whenever possible.
Diatoms were removed from the substrata by careful scraping and ‘cleaned’ by heating in nitric acid. Permanent slides for light microscopy were prepared with Hyrax Mounting Medium (I.R. 1.65). Diatoms were identified and enumerated through horizontal transects of the coverslips under a 100X apochromatic oil immersion objective( 1.32 N.A.). Five hundred diatom valves, rather than complete frustules, were counted per slide since the frustules of certain taxa separate more readily than others during the cleaning process (Camburn et al. 1978). Since substrata at each site were usually sampled in triplicate, the vector from which statisti- cal analyses were generated was usually based upon 1500 diatom valves.
Data analysis
Diatom standing crops were estimated with the formula:
Cells/ mm* = ((Valvesl2) (V,) (V,) (A))/ Asub
where V, is the ratio of the original volume of the algal sample to the aliquot of the original volume used in sample preparation, V, is the ratio of the volume of the cleaned diatom sample to the volume of the cleaned sample used in coverslip preparation, A is the ratio of the total area of the coverslip to that area scanned in counting and Asub is the area of the substrate sampled. Standing crops for each sam- pling site were compared by a factorial analysis (Snedecor& Cochran 1980) in terms of substratum type and sampling date.
The similarity of diatom assemblages, in terms of the relative abundance of the taxa, between sub- strata and between replicate samples of similar sub- strata, was estimated for each sampling date by Stander’s Similarity Index (SIMI) (Stander 1970):
SIMI (1,‘) = ~N,i N2i / (anti* ~N,i*)‘,’ i=l i=l i=l
where SIMI is the degree of similarity between the assemblages, Nli and N,i are the proportion of individuals represented by the ith taxon in assem- blages 1 and 2 respectively, and T is the total number of taxa. SIMI values range from zero to one. As the relative abundance of the common taxa in the two assemblages approach equality, SIMI values approach one. If the two assemblages share no common taxa, the value of zero results. Ninety- five percent confidence intervals for the calculated SIMI values were estimated using the computer simulation techniques presented by Johnson & Mil- lie (1982).
Diatom assemblage structure, in terms of percen- tage of taxa shared between substrata and between replicate samples of similar substrata, was estimat- ed for each sampling date by the Coefficient of Community (Whitaker & Fairbanks 1958):
CC=C/(A+B-C)
where CC is the degree of similarity between the assemblages, A is the number of taxa in the first assemblage, B is the number of taxa in the second assemblage, and C is the number of taxa in both assemblages. Like SIMI, Coefficient of Communi- ty values will range from zero to one; one indicating perfect similarity and zero indicating no similarity.
Temporal periodicity of diatom assemblages was estimated by the Succession Rate Index (SRI) pro- posed by Williams & Goldman (1975) and modified by Klarer (1978):
T SRI (1,2) = (C (F2 - F, / D)*)112
i=I
where SRI is the succession rate of taxa per day from one sampling date to the next, F, and F, are weighted logrithmic fractions of total diversity at- tributable to a single taxon from sampling times 1 and 2 respectively, D is the number of days between sampling date, and T is the total number of taxa. Regression equations were calculated from SRI values for each sampling site.
10
Results
Two hundred and fifty-two diatom taxa encom- passing 38 genera, 12 families, and 8 orders were identified. Thirty-five percent of all taxa observed were present in all three marshes. Thirteen percent of all taxa were limited to sampling sites within the Navarre Unit. Eleven and nine percent of all the taxa were limited to sampling sites within Winous Point and Moxley’s Marsh respectively.
Diatom standing crops varied between substrata within a sampling site, between sampling sites, and between sampling dates (see Millie 1979). General- ly, standing crops ranged from 2 X 10³ to 4 X 10⁴ cells/mm2 (Table 1). Diatoms epiphytic upon P. coccineum at Navarre unit #2 on 6 September reached the highest standing crop of any substra- tum and sampling site with 1.2 X 10⁵ cells/mm2. Standing crop maxima were also variable between substrata at all sites. Cell density upon dowel rod maximized in mid to late summer. Cell density upon N. tuberosa peaked in early to mid summer and decreased throughout the rest of the study pe- riod. Standing crops of P. coccineum and T. angus- tijiolia increased as the study progressed, maximiz- ing in early fall and late fall respectively.
Table 1. Density values of diatom assemblages epiphytic upon substrata at all sampling locations. Highest and lowest values observed throughout the study are presented. Values represent the mean cell densities of assemblages upon replicate samples within a substratum type. Substrata are referenced as NT = Nymphaea tuberosa, TA = Typha angustifolia, PC = Polygo- num coccineum, and DR = dowel rod.
Location Substratum Density (cells X 103 mm*)
Navarre Unit # 1
Navarre Unit #2
Winous Point #I
Winous Point #2
Winous Point #3
Moxley’s Marsh #I
Moxley’s Marsh #2
DR 0.6- 4.4 NT 0.7- 3.7 TA 0.5- 1.4 DR 5% 36.5 PC 3.5-120.0 DR 2.0- 16.5 NT 1.5- 30.5 DR 4.5- 21.0 PC 10.5- 24.5 DR 2.5- 37.5 TA 1.5- 42.0 DR 4.0- 19.6 TA l.O- 10.0 PC 4.0- 9.0 DR 10.5- 69.0 NT 4.0- 34.5
Table 2. Results of a factorial analysis performed on diatom densities of different substrata and sampling dates for each sampling location. Levels of significance are: - = no significant difference, + = significance at 0.05, -I+ = significance at 0.01, +++ = significance at 0.001.
Location Date Substratum Date * Substratum
Navarre Unit #I ++ Navarre Unit #2 ++ Winouw Point #I + - Winous Point #2 - - Winous Point #3 - Moxley’s Marsh #I - +++ Moxley’s Marsh #2 -
+++
++
A factorial analysis (Table 2) found standing crop in terms of substratum and sampling date to be of variable significance. Navarre Unit #l and Wi- nous Point #I produced statistically significant dif- ferences between standing crops in terms of date. Navarre Unit #l and Moxley’s Marsh #l produced significant standing crop differences in terms of substratum-day interaction. No diatom assemblage at any site exhibited significant substratum specific- ity throughout the entire study.
Stander’s Similarity Index values (SIMI) with their simulated confidence intervals and the Coeffi- cient of Community values for comparison of as- semblages epiphytic upon different substrata are presented in Tables 3 through 5. The highest SIMI value approached total equality with a value of 0.99 (Tables 4 & 5). The highest SIMI value obtained in comparisons of assemblages upon natural substra- ta was 0.98 (Tables 3 & 5). The lowest SIMI value obtained was 0.72 (Table 4). Coefficient of Com- munity values ranged from 0.15 to 0.72. For the most part, coefficient values at all sites ranged from 0.4 to 0.6. Moxley’s Marsh #2 possessed the lowest values ranging from 0.15 to 0.40.
The range of SIMI and Coefficient of Communi- ty values computed for comparisons of diatom as- semblages of replicate samples within a substratum type throughout the entire study are presented in Table 6. SIMI values computed for replicate sam- ples within substratum types were very similar to values computed for comparisons between substra- tum types. The range of Coefficient of Community values for replicate samples within a substratum type, however, was generally lower than values computed for comparisons between substrata.

Each sampling site within a marsh was character- tata var. schizonemoides (V.H.) Patr. exhibited a ized by a distinct diatom assemblage (Millie 1979). relative abundance ranging from 39 to 61%. Wi- Navarre Unit #l possessed no real dominant taxa at nous Point #3 showed a similar shift in taxa as the beginning of the study; Nitzschia palea (Kiitz.) Navicula mutica var. undulata (Hilse) Grun. be- W. Sm. and N. fonticola Grun. being the most came the most abundant on 7 October. Stephano- abundant forms. By fall, Navicula sp., N. cryptoce- discus subtilis, C. meneghiniana, and Nitszchiapa- phala Kiitz., and Nitzschia palea had become the lea had previously been the dominant taxa dominant taxa. Navarre Unit #2 displayed a more throughout the summer and early fall. Winous distinctive shift in species composition with Nitz- Point #2 showed little change throughout the study schia capitellata Hust., Gomphonema parvulum as the centrics, S. subtilis, C. meneghiniana, and the Ktitz., and Stephanodiscus subtilis (Van Goor) keel-pennate forms, Nitzschiapalea and N. capitel- A. Cleve being the most abundant taxa in early lata, dominated the assemblage on all sampling summer. Melosira distans var. alpigena Grun. and dates. Nitzschia parvula var. terricola Lund ap- Cyclotella meneghiniana Ktitz. became the domi- peared to exhibit some substrate specificity, as, on 7 nant forms by August. Nitzschia fihformis (W. October, a high relative abundance of this taxon Sm.) Hust. and N. fonticola were the dominant was observed only upon dowel rod. Moxley’s taxa in the fall. Winous Point #l possessed an as- Marsh #I was characterized by a distinct shift in semblage dominated by the centric diatoms Ste- taxa. The early summer dominants Achnanthes phanodiscus minutus Grun. ex Cleve 8z Moll, Ste- minutissima Ktitz. and Gomphonema parvulum phanodiscus subtilis, and Cyclotella meneghiniana, gave way to a fall assemblage dominated by Nitz- until the last sampling date when Navicula tripunc- schia amphibia Grun. and N. frustulum var. perpu-
11
Tuble3. Stander’s Similarity Index (SlMI) and Coefficient of Community values for comparison of diatom assemblages epiphytic upon substrata at sampling sites within the Navarre Unit of the Ottawa Wildlife Refuge. Nine-five percent confidence intervals forSIM1 values are presented in parentheses. Substrata are referenced as: NT = Nymphaea tuberosa. TA = Typha angusrifolia, PC = Polygonum coccineum, and DR = dowel rod.
Navarre Unit #I Sampling date
10 June 1977
2 July 1977
23 July 1977
13 August 1977
6 September 1977
7 October 1977
Navarre Unit #2 Sampling date
10 June 1977 2 July 1977
23 July 1977 13 August 1977 6 September 1977 7 October 1977
Substratum
NT TA NT TA NT TA NT TA NT TA NT TA
Substratum
PC vs. DR PC vs. DR PC vs. DR PC vs. DR PC vs. DR PC vs. DR
SlMl Coeff. of Comm.
Substratum Substratum TA DR TA DR
0.89 (0.85-0.93) 0.80(0.74-0.86) 0.50 0.53 0.86(0.82-0.90) 0.49
0.79(0.72-0.86) 0.89 (0.84-0.94) 0.55 0.52 0.89(0.87-0.91) 0.52
O&5(0.78-0.92) 0.82(0.76-0.88) 0.67 0.66 0.84(0.79-0.89) 0.57
0.91 (0.86-0.96) 0.74(0.65-0.83) 0.61 0.46 0.75 (0.66-0.84) 0.53
0.98(0.95-1.00) 0.80(0.72-0.88) 0.52 0.49 0.76(0.67-0.85) 0.57
0.87(0.82-0.92) 0.88 (0.83-0.93) 0.62 0.50 0.76(0.68-0.84) 0.46
SlMl Coeff. of Comm.
0.89(0.85-0.95) 0.51 0.84(0.79-0.89) 0.57 0.93 (0.90-0.96) 0.53 0.81 (0.75-0.87) 0.53 0.78 (0.69-0.87) 0.44 0.91 (0.85-0.97) 0.45
12
sillu(Rabh.) Grun. In contrast, Moxley’s Marsh#2 exhibited little species change as A. minutissima dominated all substrates throughout the entire study. A change was observed in the less abundant taxa as G. parvulum was replaced by Nitzschia fonticola, N. filformis, and N. palea.
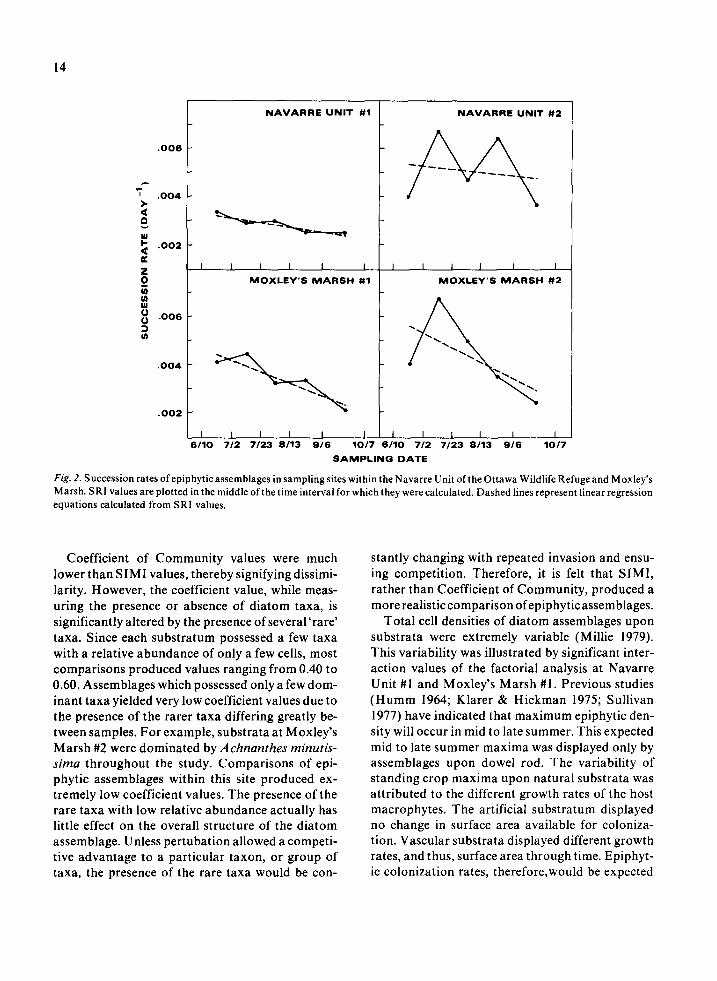
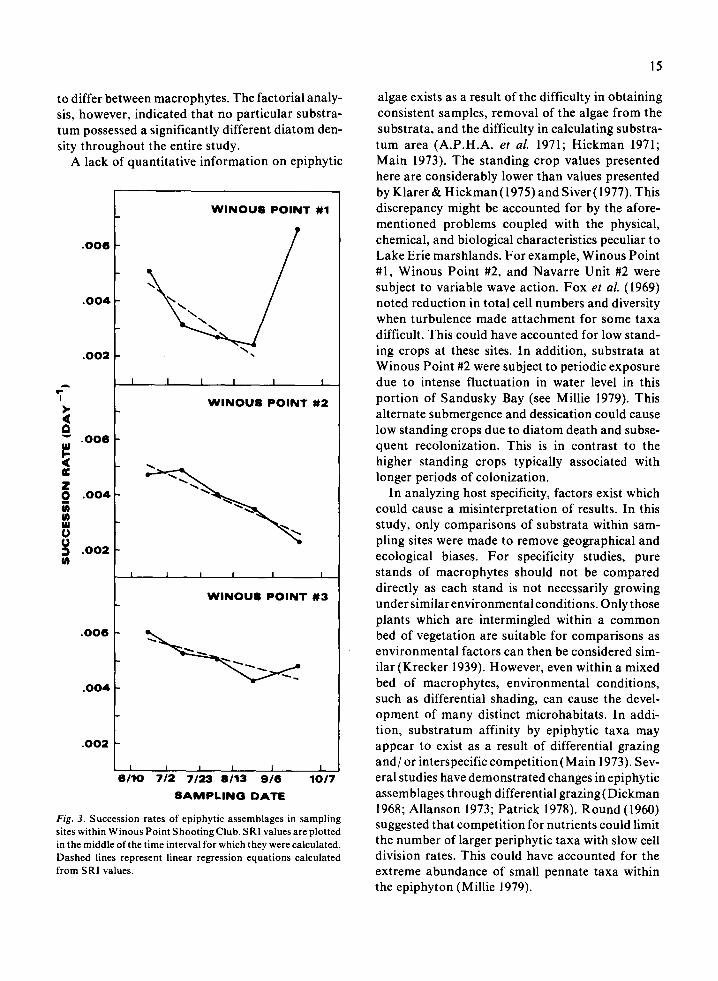
Succession rates for each sampling site are pres- ented in Figs. 2 and 3. Linear regression equations for each set of computed SRI values accompany corresponding graphs. These regression equations were not meant for the application of any statistical model to SRI values, but used only to indicate ‘trends’ of the SRI values for the time intervals (Jassby & Goldman 1974). Correlation coefficients between SRI and time values for Navarre Unit #I and #2, Winous Point #l, #2, and #3, and Moxley’s Marsh #I and #2 were -0.916 and -0.150, -0.901, -0.960 and -0.835, and -0.906 and -0.648 respec- tively.
Each sampling site possessed a distinct pattern in
the successional rate of its taxa. In almost all sites, the successional rate decreased throughout the en- tire study. Winous Point #1 possessed a decreasing successional rate from 10 June to 6 September. The rate then increased greatly for the time interval of 6 September to 7 October. Due to the large increase in rate for only this one time interval, the regression equation presented for this site only includes values from 10 June to 6 September (see below). Navarre Unit #2 possessed the most variable succession rate with no real increasing or decreasing ‘trend’ indi- cated by the computed SRI values. The regression equation for this site also indicated no distinct tem- poral pattern.
Discussion
Diatom assemblages colonizing different macro- phytes and dowel rod were not structurally differ-
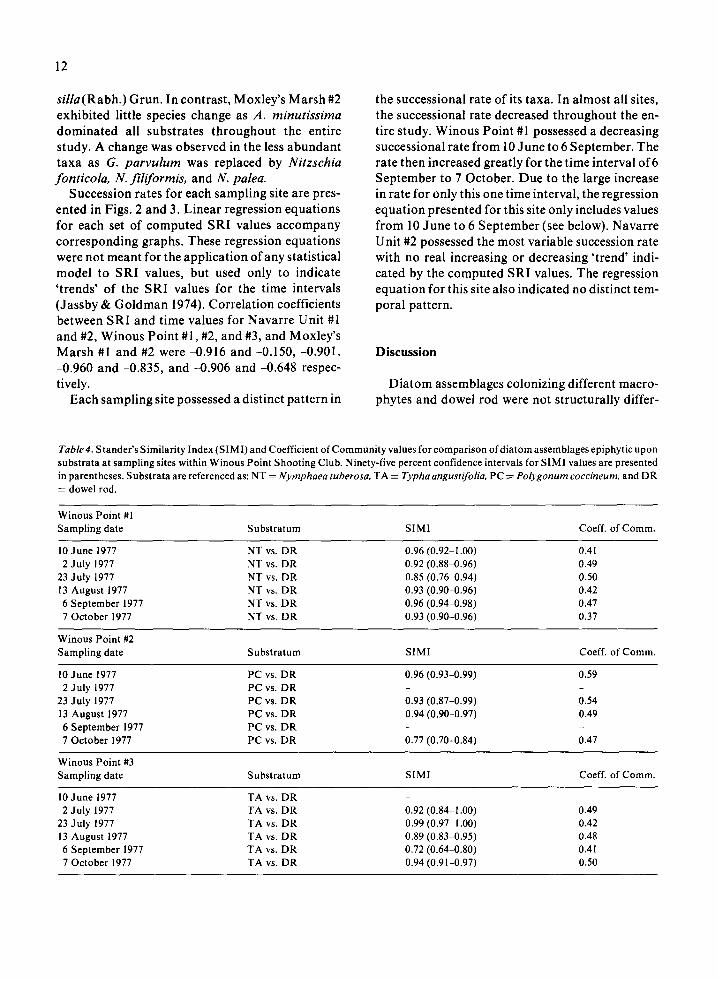
Table4. Stander’s Similarity Index (SIMI) and Coefficient of Community values for comparison of diatom assemblages epiphytic upon substrata at sampling sites within Winous Point Shooting Club. Ninety-five percent confidence intervals for SlMl values are presented in parentheses. Substrata are referenced as: NT = Nymphaea tuberosa, TA = Typha angustifolia, PC = Polygonum coccineum, and DR = dowel rod.
Winous Point #I Sampling date
IO June 1977 2 July 1977
23 July 1977 13 August 1977
6 September 1977 7 October 1977
Winous Point #2 Sampling date
IO June 1977 2 July 1977
23 July I977 13 August 1977
6 September 1977 7 October I977
Winous Point #3 Sampling date
IO June 1977 2 July I977
23 July 1977 13 August 1977
6 September 1977 7 October 1977
Substratum
NT vs. DR NT vs. DR NT vs. DR NT vs. DR NT vs. DR NT vs. DR
Substratum
PC vs. DR PC vs. DR PC vs. DR PC vs. DR PC vs. DR PC vs. DR
Substratum
TA vs. DR TA vs. DR TA vs. DR TA vs. DR TA vs. DR TA vs. DR
SIMI Coeff. of Comm.
0.96 (0.92-I .OO) 0.41 0.92 (0.88-0.96) 0.49 0.85 (0.76-0.94) 0.50 0.93 (0.90-0.96) 0.42 0.96 (0.94-0.98) 0.47 0.93 (0.90-0.96) 0.37
SIMI Coeff. of Comm.
0.96 (0.93-0.99) 0.59
0.93 (0.87-0.99) 0.54 0.94 (0.90-0.97) 0.49
0.77 (0.70-0.84) 0.47
SIMI Coeff. of Comm.
0.92 (0.84-I .OO) 0.49 0.99 (0.97-I .OO) 0.42 0.89 (0.83-0.95) 0.48 0.72 (0.64-0.80) 0.41 0.94 (0.9 I-0.97) 0.50

13
Table5. Stander’sSimilarity Index (SIMI) and Coefficient of Community values for comparison of diatom assemblages epiphytic upon substrata at sampling sites within Moxley’s Marsh. Ninety-five percent confidence intervals for SIMI values are presented in parentheses. Substrata are referenced as: NT = Nymphaea tuberosa, TA = Typha angustifolia, PC = Polygonurn coccineum, and DR = dowel rod.
Moxley’s Marsh #l Sampling date
10 June 1977
2 July 1977
23 July 1977
13 August 1977
6 September 1977
7 October 1977
Moxley’s Marsh #2 Sampling date
10 June 1977 2 July 1977
23 July 1977 13 August 1977
6 September 1977 7 October 1977
Substratum
TA PC TA PC TA PC TA PC TA PC TA PC
Substratum
NT vs. DR NT vs. DR NT vs. DR NT vs. DR NT vs. DR NT vs. DR
SIMI
Substratum PC
0.98 (0.96-I .OO)
0.88 (0.83-0.93)
0.85 (0.80-0.90)
0.96 (0.94-0.98)
0.92 (0.88-0.96)
0.94 (0.91-0.97)
DR
0.90 (0.86-0.94) 0.92 (0.89-0.95) 0.88 (0.83-0.93) 0.79 (0.71-0.87) 0.85 (0.78-0.92) 0.85 (0.78-0.92) 0.97 (0.95-0.99) 0.96 (0.94-0.98) 0.90 (0.86-0.94) 0.94 (0.91-0.97) 0.87 (0.81-0.93) 0.98 (0.84-0.94)
SlMl
0.99 (0.98-I .OO) 0.96 (0.93-0.99) 0.93 (0.90-0.96) 0.88 (0.83-0.93) 0.79 (0.70-0.88) 0.93 (0.90-0.96)
Coeff. of Comm.
Substratum PC DR
0.56 0.72 0.64
0.55 0.57 0.59
0.63 0.58 0.54
0.48 0.5 1 0.50
0.58 0.5 1 0.60
0.57 0.42
Coeff. of Comm.
0.30 0.22 0.26 0.15 0.40 0.29
Table 6. Stander’s Similarity Index (SIMI) and Coefficient of Com- munity values for comparison of diatom assemblages of replicate sam- ples within a substratum type. Highest and lowest values observed throughout the entire study are presented.
Location Substratum SIMI Coeff. of Comm.
Navarre Unit - Ottawa Wildlife Refuge Nymphoea 0.75-0.94 0.40-0.60
Typha 0.71-0.97 0.47-0.63 Polygonurn 0.63-0.95 0.42-0.67 Dowel Rod 0.77-0.92 0.43-0.55
Winous Point Shooting Club Nymphaeu 0.68-0.99 0.37-0.55
Typha 0.77-0.98 0.39-0.59 Po!vgonum 0.76-0.97 0.37-0.65 Dowel Rod
Moxley’s Marsh N.kamphoea 0.50-0.99 0.29-0.55 Typha 0.72-0.98 0.36-0.61 Po!vgonum 0.80-0.97 0.37-0.60 Dowel Rod 0.85-0.97 0.51-0.57
ent. Variability of diatom assemblages within a substratum type was a great as, or greater than, variability of assemblages between substrata. This qualitative and quantitative similarity of assem- blages agreed with Simonson’s (1962) hypothesis that diatom colonization is random.
The structure of diatom assemblages within and between substratum types was analyzed by Stand- er’s Similarity Index and Coefficient of Communi- ty. The similarity index of assemblages between substrata was consistently greater than 0.80. Al- though 0.72 was the lowest index computed, this value is still rather high in similarity on the basis of the index scale of zero to one. The interpretation of SIMI, however, is highly variable between studies. Since no specific limitation can be made concerning the degree of similarity, only a general assumption can be implied. The 95% confidence intervals, therefore, presented a more realistic range of the structural similarity between the two assemblages (Johnson & Millie 1982).
14
.006
7 .004
i t d . 002
E ii 3 : .006
2
,004
f
NAVARRE UNIT #‘I
I I I I I I
MOXLEY’S MARSH 61
I I I I I I I I I I I I 3110 712 7123 8113 916 IO/7 6110 712 7123 8113 916 1017
SAMPLING DATE
NAVARRE UNIT #2
m --a ---- -. MOXLEY’S MARSH #2
Fig. 2. Succession rates of epiphytic assemblages in sampling sites within the Navarre Unit of the Ottawa Wildlife Refuge and Moxley’s Marsh. SRI values are plotted in the middle of the time interval for which they were calculated. Dashed lines represent linear regression equations calculated from SRI values.
Coefficient of Community values were much lower than SIMI values, thereby signifying dissimi- larity. However, the coefficient value, while meas- uring the presence or absence of diatom taxa, is significantly altered by the presence of several‘rare’ taxa. Since each substratum possessed a few taxa with a relative abundance of only a few cells, most comparisons produced values ranging from 0.40 to 0.60. Assemblages which possessed only a few dom- inant taxa yielded very low coefficient values due to the presence of the rarer taxa differing greatly be- tween samples. For example, substrata at Moxley’s Marsh #2 were dominated by Achnanthes minutis- sima throughout the study. Comparisons of epi- phytic assemblages within this site produced ex- tremely low coefficient values. The presence of the rare taxa with low relative abundance actually has little effect on the overall structure of the diatom assemblage. Unless pertubation allowed a competi- tive advantage to a particular taxon, or group of taxa, the presence of the rare taxa would be con-
stantly changing with repeated invasion and ensu- ing competition. Therefore, it is felt that SIMI, rather than Coefficient of Community, produced a more realistic comparison of epiphytic assemblages.
Total cell densities of diatom assemblages upon substrata were extremely variable (Millie 1979). This variability was illustrated by significant inter- action values of the factorial analysis at Navarre Unit #l and Moxley’s Marsh #I. Previous studies (Humm 1964; Klarer & Hickman 1975; Sullivan 1977) have indicated that maximum epiphytic den- sity will occur in mid to late summer. This expected mid to late summer maxima was displayed only by assemblages upon dowel rod. The variability of standing crop maxima upon natural substrata was attributed to the different growth rates of the host macrophytes. The artificial substratum displayed no change in surface area available for coloniza- tion. Vascular substrata displayed different growth rates, and thus, surface area through time. Epiphyt- ic colonization rates, therefore,would be expected
to differ between macrophytes. The factorial analy- sis, however, indicated that no particular substra- tum possessed a significantly different diatom den- sity throughout the entire study.
A lack of quantitative information on epiphytic
.006 -
.004 -
.002 -
WINOUS POINT #l
. . ..I \
.002 -
t ’ 1 I I I I
WINOUS POINT #3
*Oo6 1 \
.004 -
.002 -
I I I I I I 6110 712 7123 0113 S/6 1017
SAMPLING DATE
Fig. 3. Succession rates of epiphytic assemblages in sampling sites within Winous Point Shooting Club. SRI values are plotted in the middle of the time interval for which they were calculated. Dashed lines represent linear regression equations calculated from SRI values.
15
algae exists as a result of the difficulty in obtaining consistent samples, removal of the algae from the substrata, and the difficulty in calculating substra- tum area (A.P.H.A. et al. 1971; Hickman 1971; Main 1973). The standing crop values presented here are considerably lower than values presented by Klarer& Hickman( 1975) and Siver( 1977). This discrepancy might be accounted for by the afore- mentioned problems coupled with the physical, chemical, and biological characteristics peculiar to Lake Erie marshlands. For example, Winous Point #I, Winous Point #2, and Navarre Unit #2 were subject to variable wave action. Fox et al. (1969) noted reduction in total cell numbers and diversity when turbulence made attachment for some taxa difficult. This could have accounted for low stand- ing crops at these sites. In addition, substrata at Winous Point #2 were subject to periodic exposure due to intense fluctuation in water level in this portion of Sandusky Bay (see Millie 1979). This alternate submergence and dessication could cause low standing crops due to diatom death and subse- quent recolonization. This is in contrast to the higher standing crops typically associated with longer periods of colonization.
In analyzing host specificity, factors exist which could cause a misinterpretation of results. In this study, only comparisons of substrata within sam- pling sites were made to remove geographical and ecological biases. For specificity studies, pure stands of macrophytes should not be compared directly as each stand is not necessarily growing under similar environmental conditions. Only those plants which are intermingled within a common bed of vegetation are suitable for comparisons as environmental factors can then be considered sim- ilar (Krecker 1939). However, even within a mixed bed of macrophytes, environmental conditions, such as differential shading, can cause the devel- opment of many distinct microhabitats. In addi- tion, substratum affinity by epiphytic taxa may appear to exist as a result of differential grazing and/ or interspecific competition (Main 1973). Sev- eral studies have demonstrated changes in epiphytic assemblages through differential grazing( Dickman 1968; Allanson 1973; Patrick 1978). Round (1960) suggested that competition for nutrients could limit the number of larger periphytic taxa with slow cell division rates. This could have accounted for the extreme abundance of small pennate taxa within the epiphyton (Millie 1979).

16
Temporal periodicity was measured by the Suc- cession Rate Index. This index was originally devel- oped to utilize algal biomass in determining succes- sion(Jassby&Goldman 1974; Williams&Goldman 1975). Klarer (1978) and this study, however, util- ized cell numbers in place of biomass. Diatom taxa with large biomass were rare among the epiphyton. If biomass had been utilized for determination of succession rate, larger rare taxa would be overem- phasized while smaller more abundant taxa would be underemphasized. Thus, in conditions where small taxa dominate the assemblage, cell numbers present a more realistic interpretation of the succes- sion rate (Klarer 1978). In addition, since no speci- ficity for substrata by epiphytes was observed, cell counts for all substrata within a sampling site were pooled for each sampling date. Subsequent com- parisons between sampling dates for each site util- ized this pooled data.
Successional patterns in diatom assemblages were variable between sampling sites indicating the factors dictating succession in Lake Erie’s littoral zone to be heterogeneous in distribution. This dis- continuity caused the establishment of many uni- que diatom assemblages throughout the littoral area. Regression equations of SRI values indicated a decreasing trend in the succession rate of taxa at most sampling sites. Epiphytic assemblages, there- fore, became more stable as the study progressed.
Navarre Unit #2 and Winous Point #l possessed the greatest fluctuations in succession rates. The extremely low correlation coefficient between SRI and time values at Navarre Unit #2 indicated no overall increase or decrease in succession rate. The large increase in succession rate for only the last time interval at Winous Point #I was due to the sudden emergence of Navicula tripunctata var. schizonemoides (V.H.) Patr. as a dominant taxon (Millie 1979; Millie & Wee 1981). If the regression equation had been calculated with the final SRI value included, an erroneous increasing succes- sional trend for the entire study would have been indicated. Therefore, the exclusion of the last SRI value in calculating the regression equation at this site is justified.
The information presented here by no means completely lays to rest the question of whether ma- crophytic specificity by epiphytes exist. Although not observed in any of the marshes analyzed here, it is feasible that specificity by epiphytes does occur in
nature. If an epiphytic taxon would evolve a physi- cal and/or nutritional specificity for a particular type of substratum, it would be expected to occur in systems which possess stable physical and chemical conditions. Marine and oligotrophic freshwater systems, for the most part, possess more consistent physical and chemical parameters than instable eu- trophic freshwater systems, such as Lake Erie. Therefore, the lack of host specificity by epiphytes from the system studied here is not unexpected.
Summary
1. Epiphytic diatom assemblages were not structu- rally different between substrata. Variability of diatom assemblages within replicate samples of a particular substratum was as great as, or great- er than, variability between substrata.
2. Stander’s Similarity Index produced a more realistic comparison of epiphytic assemblages than did Coefficient of Community.
3. Diatom standing crops upon different substrata were not significantly different within a sam- pling site throughout the entire study.
4. Diatom assemblages upon dowel rod displayed an expected mid to late summer density maxi- mum at all sites. The variability of density max- ima observed upon natural substrata was attrib- uted to different growth rates of the host macro- phytes.
5. The discrepancy between the range of standing crop values presented and other published litera- ture was attributed to problems in obtaining accurate samples from epiphytic assemblages and characteristics endemic to the sampling sites investigated.
6. Each sampling site possessed a distinct diatom flora and successional pattern illustrating the heterogeneity of Lake Erie’s littoral habitat.
Acknowledgements
The authors wish to express their thanks to the United States Fish and Wildlife Service, Winous Point Shooting Club, and Edward Moxley for al- lowing use of their marshlands. We thank Bruce E. Johnson, Bowling Green State University, and Ti- mothy J. Bliss, Iowa State University for assistance
17
in computer programming. D.F.M. is especially indebted to Dr. James H. Peck, University of Ar- kansas, Karen I. Getman and Dr. James L. Wee, Iowa State University, Dr. John C. Kingston, Uni- versity of Minnesota at Deluth, and Dr. David M. Klarer, Ohio Department of Natural Resources for their advice and encouragement.
This research was supported, in part, by grants from the Graduate College, Bowling Green State University, Bowling Green, Ohio 43403 and the Graduate College, Iowa State University, Ames, Iowa 50011.
References
Allen, H. L., 1971. Primary productivity, chemo-organotrophy, and nutritional interactions of epiphytic algae and bacteria on macrophytes in the littoral of a lake. Ecol. Monogr. 41: 97-127.
Allanson, B. R., 1973. The fine structure of the periphyton of Chara sp. and Potamogeton natans from Wytham Pond, Oxford, and its significance to the macrophyte-periphyton metabolic model of R. B. Wetzel and H. L. Allen. Freshwat. Biol. 3: 535-542.
American Public Health Association, American Water Works Association & Water Pollution Control Federation, 1971. Standard methods for the examination of water and waste- water. 13th ed. Am. Public Health Assoc. New York. 874 pp.
Brock, T. D., 1970. Photosynthesis by algal epiphytes of Utricu- laria in Everglades National Park. Bull. mar. Sci. 20: 952-956.
Camburn, K. E., Lowe, R. L. & Stoneburner, D. L., 1978. The haptobenthic diatom flora of Long Branch Creek, South Carolina. Nova Hedwigia 30: 149-279.
Cattaneo, A. & Kalff, J., 1980. The relative contribution of aquatic macrophytes and their epiphytes to the production of macrophyte bed. Limnol. Oceanogr. 25: 280-289.
Cholnoky, B. J., 1927. Untersuchungen uber die Gekologie der Epiphyton. Arch. Hydrobiol. 18: 661-705.
Dickman, M., 1968. The effect of grazing by tadpoles on the structureofaperiphytoncommunity. Ecology49: 1188-l 190.
Edsbagge, H., 1968. Some problems in the relationship between diatoms and seaweeds. Botanica mar. 11: 64-67.
Eminson, D. & Moss, B., 1980. The composition and ecology of periphyton communities in freshwaters. 1. The influence of host type and external environment on community composi- tion Br. phycol. J. 15: 429-446.
Fox, J. L., Odlaug, T. 0. & Olsson, T. A., 1969. The ecology of periphyton in western Lake Superior; Part I. Taxonomy and distribution. Wat. Res. Cen. Univ. Minn. Minneapolis. 127 PP.
Fritsch, F. E., 1931. Some aspects of the ecology of freshwater algae (with special reference to static waters). J. Ecol. 19: 233-272.
Hickman, M., 1971. The standing crop and primary productivi- ty of the epiphyton attached to Equisetum fluviatile L. in Priddy Pool, North Somerset. Br. phycol. J. 6: 51-59.
Humm, H. J., 1964. Epiphytes of the sea grass Thalassia testudi- num in Florida. Bull. mar. Sci. 14: 306-341.
Hutchinson, G. E., 1975. A treatise on limnology, Ill. Limnolog- ical botany. John Wiley & Sons, Inc., N.Y. 660 pp.
Jasby, A. D. & Goldman, C. R., 1974. A quantitative measure of succession rate and its application to the phytoplankton of lakes. Am. Nat. 108: 688-693.
Johnson, B. E. & Millie, D. F., 1982. Theestimationand applic- ability of confidence intervals for Stander’s similarity index (SIMI) in algal assemblage comparisons. Hydrobiologia 89: 3-8.
Klarer, D. M., 1978. Some studies on the plankton of the Dubh Lochan. Ph.D. thesis, Univ. Glasgow, Glasgow. 217 pp.
Klarer, D. M. & Hickman, M., 1975. The effect of thermal effluent upon the standing crop of an epiphytic algal com- munity. lnt. Revue ges. Hydrobiol. 60: 17-62.
Krecker, F. H., 1939. A comparative study of the animal popula- tion of certain submerged plants. Ecology 20: 553-562.
Main, S. P., 1973. The distribution of epiphytic diatoms in Yaquina Estuary, Oregon. Ph.D. thesis, Oregon State Univ., Corvallis. 111 pp.
Main, S. P. & Mclntire, C. D., 1974. The distribution of epiphyt- ic diatoms in Yaquina Estuary, Oregon (U.S.A.). Botanica mar. 17: 88-99.
Mclntire, C. D. & Moore, W. W., 1977. Marine littoraldiatoms; ecological considerations. In: Werner, D. (ed.) The biology of diatoms. Univ. Cal. Press, Berkeley, pp. 333-371.
Millie, D. F., 1979. The epiphytic diatom flora of three species of aquatic vascular plants common to three Lake Erie marshes. M.Sc. thesis, Bowling Green State Univ., Bowling Green, Ohio. 205 pp.
Millie, D. F. & Lowe, R. L., 1981. Diatoms new to Ohio and the Laurentian Great Lakes. Ohio J. Sci. 81: 195-206.
Millie, D. F. & Wee, J. L., 1981. Observations on the tube-dwel- ling diatom Navicula tripunctata var. schizonemoides (V.H.) Patr. using light and electron microscopy. Proc. Iowa Acad. Sci. 88: 74-78.
Patrick, R., 1978. Effects of trace metals in the aquatic ecosys- tem. Am. Scient. 66: 185-191.
Prowse, G. A., 1959. Relationships between epiphytic algal spe- cies and their macrophytic hosts. Nature 183: 1204-1205.
Ramm, G., 1977. Structure of epiphytic diatom populations of the Phytal of the Kiel Bight (Western Baltic). Nova Hedwe- gia 54: 379-387.
Rautiainen, H. & Ravenko, O., 1972. The epiphytic diatom flora of the benthic macrophyte communities on rocky shores in the southwestern Archipelago of Finland, Seili islands. No- va Hedwegia 23: 827-842.
Round, F. E., 1960. Studies on bottom living algae in some lakes of the English lake district. IV. The seasonal cycles of the Bacillariophyceae. J. Ecol. 48: 529-547.
Sheldon, R. B. & Boylen, C. W., 1975. Factors affecting the contribution by epiphytic algae to the primary productivity of an oligotrophic freshwater lake. Appl. Microbial. 30: 657-667.
18
Simonsen, R., 1962. Untersuchungen zur Systematik and Okol- ogie der Bodendiatomeen der westlichen Ostee. Int. Revue ges. Hydrobiol., Systemische Beihefte, I, Akademie Verlag, Berlin. 148 pp.
Siver, P. A., 1977. Comparison of attached diatom communities on natural and artificial substrates. J. Phycol. 13: 402-406.
Snedecor, G. W. & Cochran, W. G., 1980. Statistical methods. 7th ed. The Iowa State Univ. Press, Ames. 507 pp.
Stander, J. M., 1970. Diversity and similarity of benthic fauna off Oregon. M.Sci. thesis, Oregon State Univ., Corvallis. 72 PP.
Sullivan, M. J., 1977. Structural characteristics of a diatom community epiphytic on Ruppia maritima. Hydrobiologia 53: 81-86.
Wetzel, R. B., 1975. Limnology. W. B. Saunders Company, Philadelphia. 743 pp.
Whittaker, R. L Fairbanks, C., 1958. A study of the plankton copepodcommunities incolumbia Basin, southeastern Was- hington. Ecology 39: 46-65.
Williams, N. J. & Goldman, C. R., 1975. Succession rates in lake phytoplankton communities. Verh. int. Ver. Limnol. 19: 808-8 Il.
Received 9 October 1981; in revised form 5 July 1982; accepted 26 July 1982.
Copyright © 2022 FDOKUMEN