Phytoplankton size distribution and community structure: influence of nutrient input and sedimentary...
14
Phytoplankton size-distribution and community structure in relation to mucilage occurrence in the northern Adriatic Sea Cecilia Totti a, * , Monica Cangini b , Carla Ferrari c , Romina Kraus d , Marinella Pompei b , Alessandra Pugnetti e , Tiziana Romagnoli a , Silvana Vanucci f , Giorgio Socal e a Dipartimento di Scienze del mare, Universita ` Politecnica delle Marche, Via Brecce Bianche, 60131, Ancona, Italy b Centro Ricerche Marine, Viale Vespucci 2, I-47042 Cesenatico, Italy c Struttura Oceanografica Daphne, ARPAER, Viale Vespucci 2, I-47042 Cesenatico, Italy d Center for Marine Research, Rudjer Bos ˇkovic ´ Institute, G. Paliaga 5, 52210 Rovinj, Croatia e Istituto di Scienze Marine (ISMAR), CNR, Castello 1364, I-30122 Venezia, Italy f Dipartimento di Biologia Animale ed Ecologia Marina, Universita ` di Messina, Messina, Italy Available online 4 October 2005 Abstract The spatial and temporal variations of pico-, nano- and microphytoplankton abundance and composition were investigated over a 37 month period, focusing on the ecological role of different size classes of phytoplankton, and on the changes of the community structure that might occur during periods when large mucilage macroaggregates appear. Samples were collected monthly from June 1999 to July 2002 at 11 stations, along three transects covering the northern Adriatic basin. Highest abundances were observed in late-winter/spring for microphytoplankton (mainly diatoms), in spring–summer for nanophytoplankton, and in summer for picophytoplankton. The autotrophic component was more abundant in the summers of 2000 and 2002 (when large mucilage aggregates occurred) than in the summers of 1999 and 2001 (when a massive phenomenon was not observed). This increase was statistically significant for pico-, nano- and, among microphytoplankton, only for dinoflagellates. Blooms of picophytoplankton were often observed at the bottom layer during mucilage summers. The microphytoplankton community during mucilage phenomena was characterized by a species composition (Chaetoceros spp., Cerataulina pelagica , Pseudo-nitzschia delicatissima , P. pseudodelicatissima , Cylindrotheca closterium, Dactyliosolen fragilissimus ) comparable to that observed in summers without extensive mucilage occurrence. However, some species appeared with significantly higher densities in the summers of 2000 and 2002: Ceratium furca , C. closterium, Oxytoxum spp., Hemiaulus hauckii and Gonyaulax fragilis . Microscopic observation of aggregates revealed that the microphytoplankton species composition inside the aggregates was comparable to that observed in the water column, with an enrichment of opportunistic species such as C. closterium and P. delicatissima . The presence of mucilage aggregates affects the phytoplankton populations in the water column, even when aggregates are at early stages. It seems that there is a mutual relationship between phytoplankton and aggregates, i.e., several diatom and dinoflagellate species may contribute to the aggregate formation and enlargement, but mucilage aggregates themselves may also affect the phytoplankton populations, allowing the development of a rich diatom community and in general enhancing nanophytoplankton growth. D 2005 Elsevier B.V. All rights reserved. Keywords: Mucilage aggregates; Microphytoplankton; Nanophytoplankton; Picophytoplankton; Northern Adriatic Sea 0048-9697/$ - see front matter D 2005 Elsevier B.V. All rights reserved. doi:10.1016/j.scitotenv.2005.09.028 * Corresponding author. Tel.: +39 071 220 4647; fax: +39 071 220 4650. E-mail address: [email protected] (C. Totti). Science of the Total Environment 353 (2005) 204– 217 www.elsevier.com/locate/scitotenv
-
Upload
independent -
Category
Documents
-
view
2 -
download
0
Transcript of Phytoplankton size distribution and community structure: influence of nutrient input and sedimentary...

www.elsevier.com/locate/scitotenv
Science of the Total Environm
Phytoplankton size-distribution and community structure in relation
to mucilage occurrence in the northern Adriatic Sea
Cecilia Totti a,*, Monica Cangini b, Carla Ferrari c, Romina Kraus d, Marinella Pompei b,
Alessandra Pugnetti e, Tiziana Romagnoli a, Silvana Vanucci f, Giorgio Socal e
a Dipartimento di Scienze del mare, Universita Politecnica delle Marche, Via Brecce Bianche, 60131, Ancona, Italyb Centro Ricerche Marine, Viale Vespucci 2, I-47042 Cesenatico, Italy
c Struttura Oceanografica Daphne, ARPAER, Viale Vespucci 2, I-47042 Cesenatico, Italyd Center for Marine Research, Rudjer Boskovic Institute, G. Paliaga 5, 52210 Rovinj, Croatia
e Istituto di Scienze Marine (ISMAR), CNR, Castello 1364, I-30122 Venezia, Italyf Dipartimento di Biologia Animale ed Ecologia Marina, Universita di Messina, Messina, Italy
Available online 4 October 2005
Abstract
The spatial and temporal variations of pico-, nano- and microphytoplankton abundance and composition were investigated over
a 37 month period, focusing on the ecological role of different size classes of phytoplankton, and on the changes of the community
structure that might occur during periods when large mucilage macroaggregates appear. Samples were collected monthly from June
1999 to July 2002 at 11 stations, along three transects covering the northern Adriatic basin. Highest abundances were observed in
late-winter/spring for microphytoplankton (mainly diatoms), in spring–summer for nanophytoplankton, and in summer for
picophytoplankton. The autotrophic component was more abundant in the summers of 2000 and 2002 (when large mucilage
aggregates occurred) than in the summers of 1999 and 2001 (when a massive phenomenon was not observed). This increase was
statistically significant for pico-, nano- and, among microphytoplankton, only for dinoflagellates. Blooms of picophytoplankton
were often observed at the bottom layer during mucilage summers. The microphytoplankton community during mucilage
phenomena was characterized by a species composition (Chaetoceros spp., Cerataulina pelagica, Pseudo-nitzschia delicatissima,
P. pseudodelicatissima, Cylindrotheca closterium, Dactyliosolen fragilissimus) comparable to that observed in summers without
extensive mucilage occurrence. However, some species appeared with significantly higher densities in the summers of 2000 and
2002: Ceratium furca, C. closterium, Oxytoxum spp., Hemiaulus hauckii and Gonyaulax fragilis. Microscopic observation of
aggregates revealed that the microphytoplankton species composition inside the aggregates was comparable to that observed in the
water column, with an enrichment of opportunistic species such as C. closterium and P. delicatissima. The presence of mucilage
aggregates affects the phytoplankton populations in the water column, even when aggregates are at early stages. It seems that there
is a mutual relationship between phytoplankton and aggregates, i.e., several diatom and dinoflagellate species may contribute to the
aggregate formation and enlargement, but mucilage aggregates themselves may also affect the phytoplankton populations, allowing
the development of a rich diatom community and in general enhancing nanophytoplankton growth.
D 2005 Elsevier B.V. All rights reserved.
Keywords: Mucilage aggregates; Microphytoplankton; Nanophytoplankton; Picophytoplankton; Northern Adriatic Sea
0048-9697/$ - s
doi:10.1016/j.sc
* Correspondin
E-mail addre
ent 353 (2005) 204–217
ee front matter D 2005 Elsevier B.V. All rights reserved.
itotenv.2005.09.028
g author. Tel.: +39 071 220 4647; fax: +39 071 220 4650.
ss: [email protected] (C. Totti).
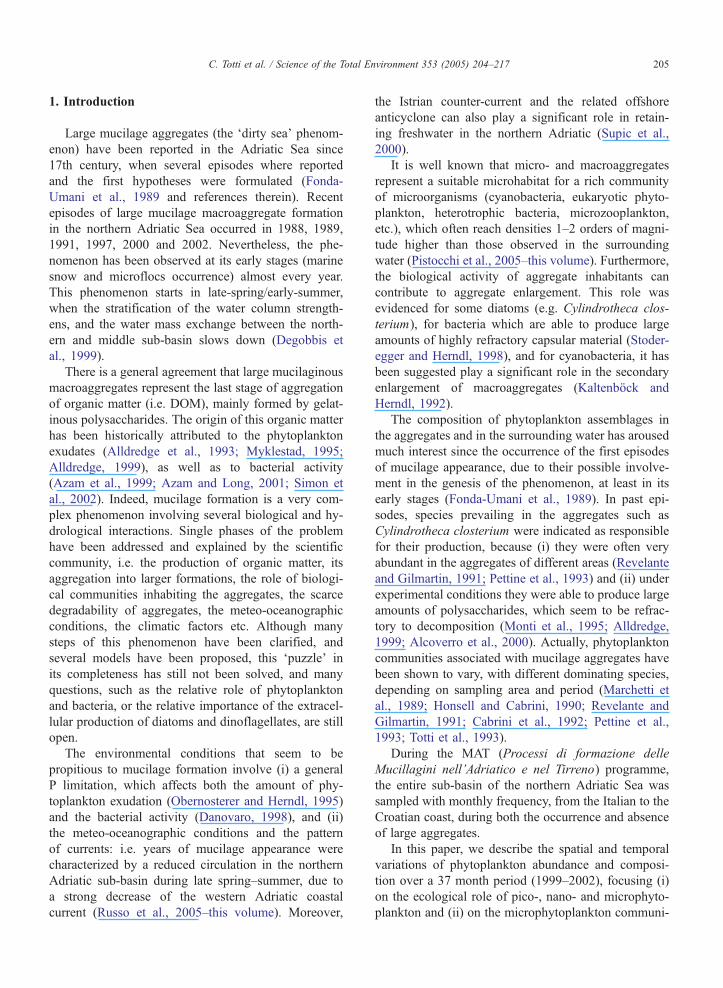
C. Totti et al. / Science of the Total Environment 353 (2005) 204–217 205
1. Introduction
Large mucilage aggregates (the ddirty seaT phenom-
enon) have been reported in the Adriatic Sea since
17th century, when several episodes where reported
and the first hypotheses were formulated (Fonda-
Umani et al., 1989 and references therein). Recent
episodes of large mucilage macroaggregate formation
in the northern Adriatic Sea occurred in 1988, 1989,
1991, 1997, 2000 and 2002. Nevertheless, the phe-
nomenon has been observed at its early stages (marine
snow and microflocs occurrence) almost every year.
This phenomenon starts in late-spring/early-summer,
when the stratification of the water column strength-
ens, and the water mass exchange between the north-
ern and middle sub-basin slows down (Degobbis et
al., 1999).
There is a general agreement that large mucilaginous
macroaggregates represent the last stage of aggregation
of organic matter (i.e. DOM), mainly formed by gelat-
inous polysaccharides. The origin of this organic matter
has been historically attributed to the phytoplankton
exudates (Alldredge et al., 1993; Myklestad, 1995;
Alldredge, 1999), as well as to bacterial activity
(Azam et al., 1999; Azam and Long, 2001; Simon et
al., 2002). Indeed, mucilage formation is a very com-
plex phenomenon involving several biological and hy-
drological interactions. Single phases of the problem
have been addressed and explained by the scientific
community, i.e. the production of organic matter, its
aggregation into larger formations, the role of biologi-
cal communities inhabiting the aggregates, the scarce
degradability of aggregates, the meteo-oceanographic
conditions, the climatic factors etc. Although many
steps of this phenomenon have been clarified, and
several models have been proposed, this dpuzzleT in
its completeness has still not been solved, and many
questions, such as the relative role of phytoplankton
and bacteria, or the relative importance of the extracel-
lular production of diatoms and dinoflagellates, are still
open.
The environmental conditions that seem to be
propitious to mucilage formation involve (i) a general
P limitation, which affects both the amount of phy-
toplankton exudation (Obernosterer and Herndl, 1995)
and the bacterial activity (Danovaro, 1998), and (ii)
the meteo-oceanographic conditions and the pattern
of currents: i.e. years of mucilage appearance were
characterized by a reduced circulation in the northern
Adriatic sub-basin during late spring–summer, due to
a strong decrease of the western Adriatic coastal
current (Russo et al., 2005–this volume). Moreover,
the Istrian counter-current and the related offshore
anticyclone can also play a significant role in retain-
ing freshwater in the northern Adriatic (Supic et al.,
2000).
It is well known that micro- and macroaggregates
represent a suitable microhabitat for a rich community
of microorganisms (cyanobacteria, eukaryotic phyto-
plankton, heterotrophic bacteria, microzooplankton,
etc.), which often reach densities 1–2 orders of magni-
tude higher than those observed in the surrounding
water (Pistocchi et al., 2005–this volume). Furthermore,
the biological activity of aggregate inhabitants can
contribute to aggregate enlargement. This role was
evidenced for some diatoms (e.g. Cylindrotheca clos-
terium), for bacteria which are able to produce large
amounts of highly refractory capsular material (Stoder-
egger and Herndl, 1998), and for cyanobacteria, it has
been suggested play a significant role in the secondary
enlargement of macroaggregates (Kaltenbock and
Herndl, 1992).
The composition of phytoplankton assemblages in
the aggregates and in the surrounding water has aroused
much interest since the occurrence of the first episodes
of mucilage appearance, due to their possible involve-
ment in the genesis of the phenomenon, at least in its
early stages (Fonda-Umani et al., 1989). In past epi-
sodes, species prevailing in the aggregates such as
Cylindrotheca closterium were indicated as responsible
for their production, because (i) they were often very
abundant in the aggregates of different areas (Revelante
and Gilmartin, 1991; Pettine et al., 1993) and (ii) under
experimental conditions they were able to produce large
amounts of polysaccharides, which seem to be refrac-
tory to decomposition (Monti et al., 1995; Alldredge,
1999; Alcoverro et al., 2000). Actually, phytoplankton
communities associated with mucilage aggregates have
been shown to vary, with different dominating species,
depending on sampling area and period (Marchetti et
al., 1989; Honsell and Cabrini, 1990; Revelante and
Gilmartin, 1991; Cabrini et al., 1992; Pettine et al.,
1993; Totti et al., 1993).
During the MAT (Processi di formazione delle
Mucillagini nell’Adriatico e nel Tirreno) programme,
the entire sub-basin of the northern Adriatic Sea was
sampled with monthly frequency, from the Italian to the
Croatian coast, during both the occurrence and absence
of large aggregates.
In this paper, we describe the spatial and temporal
variations of phytoplankton abundance and composi-
tion over a 37 month period (1999–2002), focusing (i)
on the ecological role of pico-, nano- and microphyto-
plankton and (ii) on the microphytoplankton communi-

C. Totti et al. / Science of the Total Environment 353 (2005) 204–217206
ty structure in summer periods, during the appearance
of large macroaggregates.
2. Materials and methods
2.1. Sampling
Sampling was carried out, on monthly basis from
June 1999 to July 2002, along three transects (A, B,
C) from the Italian to the Croatian coast, covering the
entire northern Adriatic basin. Several stations were
selected along the three transects, in order to repre-
sent the western, central and eastern areas of each
transect (Fig. 1): transect A (stations A3, A7, A11), B
(stations B3, B6, B10, B13, B15), and C (stations
C1, C4, C7, C12, C14). Water samples were collected
using a Rosette Multisampler coupled with Niskin
bottles, at selected depths (2 to 4 for each stations):
at the surface, near the bottom and 1–2 intermediate
depths, depending on the water column structure and
on the fluorescence profile (in stratification condi-
tions, base of mixed layer and maximum fluorescence
depth).
2.2. Pico- and nanophytoplankton
After collection, samples (500 ml) were preserved
by adding glutaraldehyde (0.5% final concentrations),
and stored in the dark at +4 8C until the slides were
prepared (within a few days from sampling). For nano-
phytoplankton, sub-samples (35–40 ml) were stained
with DAPI (4V,6V-diamidino-2-phenylindole) and fil-
tered at low pressure (b50 mm Hg) onto 2.0 Am pore
size (25 mm diameter) Nuclepore filters. For picophy-
toplankton, sub-samples (10–30 ml) were filtered (b50
mm Hg) onto 0.2 Am pore size (25 mm diameter)
Nuclepore filters. Filters (both for nanophytoplankton
and picophytoplankton) were then washed with 0.2 Amprefiltered seawater, and mounted on glass slides
(Kemp et al., 1993). Duplicate slides were prepared
for each sample. Slides were stored at �20 8C in the
dark until microscopic examination (within a few days).
Slides for nanophytoplankton enumeration were exam-
ined for DAPI (set filter: G365/FT395/LP420) and
chlorophyll fluorescence (set filter: BP450-490/
FT510/LP520) at �1000 using a Zeiss Axioplan epi-
fluorescence microscope. A minimum of 100–150 cells
per filter were counted. Nanophototrophs were distin-
guished from heterotrophs by their chlorophyll auto-
fluorescence, and their cell shape and flagella were
visualised by DAPI staining fluorescence (Sherr and
Sherr, 1993). Slides for picophytoplankton were ob-
served at �1000 using the same epifluorescence micro-
scope (set filter: BP450-490/FT510/LP520). Counting
for picophytoplankton was carried out on 20–30 ran-
domly chosen fields.
2.3. Microphytoplankton
Samples from transect B and C were preserved with
0.8% formaldehyde, prefiltered and neutralized with
hexamethylene-tetramine (Throndsen, 1978), and
stored in dark glass bottles. Samples from transect A
were preserved with Lugol’s solution buffered with
sodium acetate and stored in dark plastic bottles. Micro-
phytoplankton analysis was carried out at the inverted
microscope following the Utermohl method (Hasle,
1978). Counting was carried out at �400 magnification
along transects or in random fields of vision (Cordella
and Cavolo, 1988) to count a minimum of 200 cells.
This counting was then integrated with the count on the
whole sedimentation chamber with �200 magnifica-
tion, to have a more correct estimation of taxa, less
abundant, but having greater volume. During counting,
only autotrophic microphytoplanktonic fraction was
considered (i.e. cells which, at least in one dimension,
were greater than 20 Am), including nanoplanktonic
colonial species. Microphytoplankton taxa were finally
grouped into major classes, diatoms, dinoflagellates,
others; the latter group includes flagellates (mostly
euglenophyceans), coccolithophorids, and incertae
sedis having size N20 Am.
2.4. Mucilage aggregate sampling
During mucilage appearance, aggregates were also
sampled by scuba divers, using syringes or pump
(Giani et al., 2005–this volume). Samples for micro-
scopic observation were preserved by adding 1.6%
prefiltered neutralized formaldehyde. Mucilage samples
were then examined for a qualitative analysis of their
phytoplankton composition. In several samples, a rough
estimate of cell density within mucilage aggregates was
also carried out: a small volume of mucilage was
poured into a sedimentation chamber using a micropi-
pette and the cells were counted.
2.5. Statistical analysis
Statistical analyses were performed using Statistica
by Statsoft. Differences in the pico-, nano- and micro-
phytoplankton abundances were established among sea-
sons, years, summers with and without mucilage,
transects, western and eastern areas and depths, using
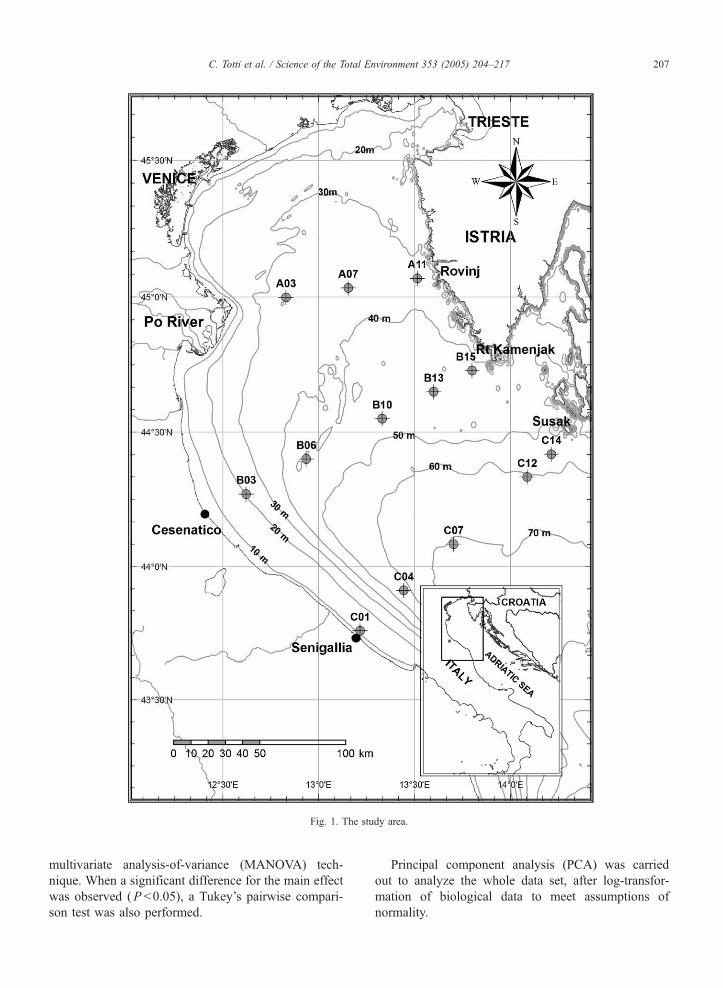
Fig. 1. The study area.
C. Totti et al. / Science of the Total Environment 353 (2005) 204–217 207
multivariate analysis-of-variance (MANOVA) tech-
nique. When a significant difference for the main effect
was observed (P b0.05), a Tukey’s pairwise compari-
son test was also performed.
Principal component analysis (PCA) was carried
out to analyze the whole data set, after log-transfor-
mation of biological data to meet assumptions of
normality.
Table
1
Meanvalues
andstandarddeviationsofmainenvironmentalparam
etersandphytoplanktonabundances(cellsl�
1)in
each
samplingstationduringtheentire
studyperiod:salinity(S),totalinorganic
nitrogen
(DIN
),orthophosphate(PO4),silicate
(SiO4),picophytoplankton(Pico),nanophytoplankton(N
ano),diatoms(D
iato),dinoflagellates(D
ino),other
microphytoplanktongroups(O
th)and
Totalmicrophytoplankton(Totalmicrophyto),n.a.(notavailable)
Stat
S(PSU)
DIN
(AM)
PO4(AM)
SiO4(AM)
Pico
Nano
Diato
Dino
Oth
Totalmicrophyto
Avg.
Std.
Avg.
Std.
Avg.
Std.
Avg.
Std.
Avg.
Std.
Avg.
Std.
Avg.
Std.
Avg.
Std.
Avg.
Std.
Avg.
Std.
A3
36.83
1.96
3.09
4.58
0.09
0.11
5.20
6.22
4.59EF07
5.97EF07
2.22EF06
2.73EF06
358,393
597,760
3203
6531
701
1844
362,297
600,691
A7
37.29
1.28
2.09
2.28
0.06
0.07
4.20
4.93
3.75EF07
3.68EF07
1.66EF06
1.45EF06
251,739
418,725
3114
6457
985
4754
255,838
423,701
A11
37.62
0.87
1.16
0.91
0.02
0.02
2.64
2.15
3.10EF07
2.49EF07
1.51EF06
1.55EF06
56,523
127,254
1612
2965
449
872
58,583
129,798
B3
35.67
3.47
4.14
5.96
0.08
0.06
4.95
6.49
3.19EF07
5.35EF07
1.52EF06
1.20EF06
851,739
2,350,004
2531
6591
––
854,270
2,354,258
B6
36.93
3.07
1.92
2.78
0.07
0.06
3.06
3.17
2.05EF07
2.07EF07
1.06EF06
8.97EF05
257,208
776,923
1668
3696
––
258,877
779,580
B10
37.90
0.86
0.87
0.83
0.05
0.03
1.66
1.21
1.97EF07
1.76EF07
7.39EF05
3.69EF05
67,914
347,581
909
1276
––
68,823
347,622
B13
37.91
0.69
0.69
0.57
0.05
0.02
1.68
1.11
1.98EF07
1.58EF07
7.32EF05
3.75EF05
25,692
39,347
1306
5454
––
26,997
39,893
B15
37.84
0.54
0.88
0.73
0.05
0.03
1.78
0.91
2.15EF07
1.64EF07
6.78EF05
3.03EF05
13,518
16,673
584
597
––
14,101
16,769
C1
35.07
3.10
6.16
7.37
0.08
0.07
n.a.
n.a.
n.a.
n.a.
n.a.
n.a.
1,216,258
2,073,804
17,500
18,344
11,030
2303
1,244,788
2,072,685
C4
37.85
0.92
1.18
1.20
0.07
0.04
2.42
2.43
1.62EF07
1.72EF07
1.39EF06
8.54EF05
85,207
161,058
4187
5396
3735
12,850
93,128
165,587
C7
38.29
0.49
0.80
0.94
0.06
0.03
1.71
1.20
1.29EF07
1.36EF07
1.13EF06
5.60EF05
38,155
83,549
3437
4339
1326
2165
42,918
85,125
C12
38.36
0.33
0.67
0.61
0.06
0.03
1.48
0.96
1.29EF07
1.44EF07
1.04EF06
4.83EF05
29,409
38,468
3065
3010
1038
1750
33,512
38,966
C14
38.40
0.32
0.68
0.94
0.05
0.02
1.32
0.81
n.a.
n.a.
n.a.
n.a.
35,426
46,091
3074
2980
1286
1769
39,786
46,036
C. Totti et al. / Science of the Total Environment 353 (2005) 204–217208
3. Results
3.1. Environmental parameters
A complete description of the physical and trophic
characteristics of the study area is reported in Russo et
al. (2005–this volume) and Degobbis et al. (2005–this
volume) while a synthetic characterisation of the sta-
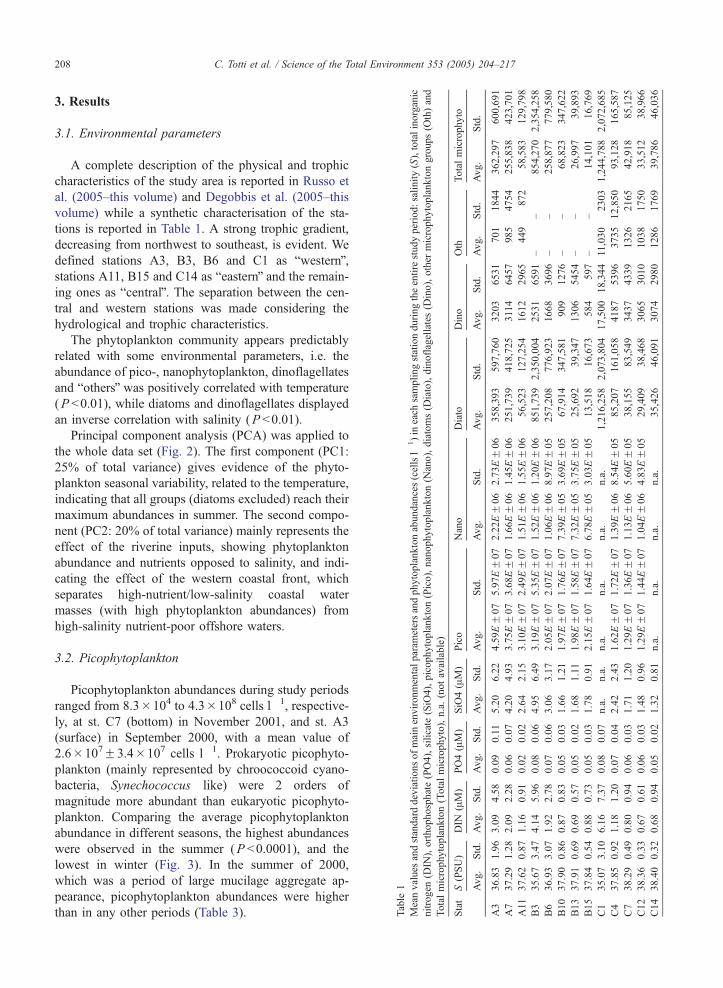
tions is reported in Table 1. A strong trophic gradient,
decreasing from northwest to southeast, is evident. We
defined stations A3, B3, B6 and C1 as bwesternQ,stations A11, B15 and C14 as beasternQ and the remain-
ing ones as bcentralQ. The separation between the cen-
tral and western stations was made considering the
hydrological and trophic characteristics.
The phytoplankton community appears predictably
related with some environmental parameters, i.e. the
abundance of pico-, nanophytoplankton, dinoflagellates
and bothersQ was positively correlated with temperature
(P b0.01), while diatoms and dinoflagellates displayed
an inverse correlation with salinity (P b0.01).
Principal component analysis (PCA) was applied to
the whole data set (Fig. 2). The first component (PC1:
25% of total variance) gives evidence of the phyto-
plankton seasonal variability, related to the temperature,
indicating that all groups (diatoms excluded) reach their
maximum abundances in summer. The second compo-
nent (PC2: 20% of total variance) mainly represents the
effect of the riverine inputs, showing phytoplankton
abundance and nutrients opposed to salinity, and indi-
cating the effect of the western coastal front, which
separates high-nutrient/low-salinity coastal water
masses (with high phytoplankton abundances) from
high-salinity nutrient-poor offshore waters.
3.2. Picophytoplankton
Picophytoplankton abundances during study periods
ranged from 8.3�104 to 4.3�108 cells l�1, respective-
ly, at st. C7 (bottom) in November 2001, and st. A3
(surface) in September 2000, with a mean value of
2.6�107F3.4�107 cells l�1. Prokaryotic picophyto-
plankton (mainly represented by chroococcoid cyano-
bacteria, Synechococcus like) were 2 orders of
magnitude more abundant than eukaryotic picophyto-
plankton. Comparing the average picophytoplankton
abundance in different seasons, the highest abundances
were observed in the summer (P b0.0001), and the
lowest in winter (Fig. 3). In the summer of 2000,
which was a period of large mucilage aggregate ap-
pearance, picophytoplankton abundances were higher
than in any other periods (Table 3).

0.00E+00
1.00E+07
2.00E+07
3.00E+07
4.00E+07
5.00E+07
6.00E+07
7.00E+07
cells
l-1ce
lls l-1
pico
0.00E+00
5.00E+05
1.00E+06
1.50E+06
2.00E+06
2.50E+06
3.00E+06
Spr Sum Aut Win
Spr Sum Aut Win
nano
Western Central Eastern
Fig. 3. Seasonal distribution (cells l�1) of picophytoplankton (pico
and nanophytoplankton (nano) over the entire study period at the
western, central and eastern stations (meanFSE). Note the differen
scales in the y axis.
Factor 1 (25%)
Fac
tor
2 (2
0%)
TEMP
SAL
DIN
PO4SIO4
PICONANO
DIATO DINOOTH
-0.8
-0.6
-0.4
-0.2
0.0
0.2
0.4
0.6
0.8
-0.8 -0.6 -0.4 -0.2 0.0 0.2 0.4 0.6 0.8
Fig. 2. Loadings of environmental and biological variables of the first
two extracted components (PCA). TEMP: temperature; SAL: salinity;
DIN: Dissolved inorganic nitrogen; PO4: phosphate; SIO4: silicate;
PICO: picophytoplankton; NANO: nanophytoplankton; DIATO: dia-
toms; DINO: dinoflagellates; OTH: other microphytoplankton groups.
C. Totti et al. / Science of the Total Environment 353 (2005) 204–217 209
Spatial distribution of picophytoplankton showed a
marked north–south gradient (Table 1), with signifi-
cantly lower abundances in the southernmost transect
C than in transects B (P b0.01) and A (P b0.0001).
The west–east gradient was less marked (Table 1):
western stations showed significantly higher densities
than the other stations of the transects (P b0.0001). On
average, in transects A and B, central stations showed
the lowest values, while an increase was again observed
toward the eastern stations.
Considering the vertical distribution, on average,
picophytoplankton abundances at surface layer (3.05F4.67�107) were significantly higher than those at inter-
mediate layer (2.44F2.69�107, P b0.05) and bottom
(2.26F2.25�107, P b0.005). However, in transect B
and C, during June–July of 2000 and 2002, blooms of
picophytoplankton densities were often observed at the
bottom layer (Table 2).
3.3. Nanophytoplankton
Phototrophic nanoplankton ranged from 1.8�104 to
1.5�107 cells l�1, respectively, at st. A3 (bottom) in
July 1999 and st. A3 (surface) in June 2000, with a
mean value of 1.3�106F1.5�106 cells l�1. As a
general role, in all transects, nanophytoplankton assem-
blages were dominated by very small cells (e.g. 2–3 Amin size), followed by larger cells (e.g. 3–5 Am in size),
and by nanophytoplankton 5–20 Am in size. Although
nanophytoplankton could not be taxonomically deter-
mined using epifluorescence microscopy, some details
(such as cell shape, dimensions, chloroplast shape/num-
ber and flagella) indicate that the smallest cells were
mainly represented by prasinophytes, whereas, among
cells 3–5 Am in size prymnesiophytes were abundant;
moreover, larger nanophytoplankton (i.e. N5 Am) were
represented mainly by cryptophytes, small diatoms, and
dinoflagellates. Nevertheless, most of the cells were
taxonomically unclassified.
Significantly higher nanophytoplankton abundances
were observed in spring and summer (Fig. 3), while
lower values were observed in autumn (P b0.0001). On
average, nanophytoplankton densities observed during
year 2000 were higher than those observed in other
years, the lowest being observed in 2001 (P b0.01).
Spatial distribution of nanophytoplankton densities
(Table 1) showed, on average, significantly higher
abundances at transect A (P b0.0001). Considering
the west–east gradient, significantly higher values
were observed at western stations (P b0.0001), while
at the central stations minimum values were generally
observed. The vertical distribution (Table 2) revealed
that, on average, a decreasing gradient between the
surface (mean value 1.79F1.96�106 cells l�1) and
bottom (9.04F7.03�105 cells l�1) was present
(P b0.0001).
3.4. Microphytoplankton
The total microphytoplankton abundances ranged
from 0.4�103 to 14.4�106 cells l- 1, respectively at
st. B15 (surface) in August 2000 and B3 (surface) in
January 2001, with mean values of 2.2F8.5�105 cells
)
t
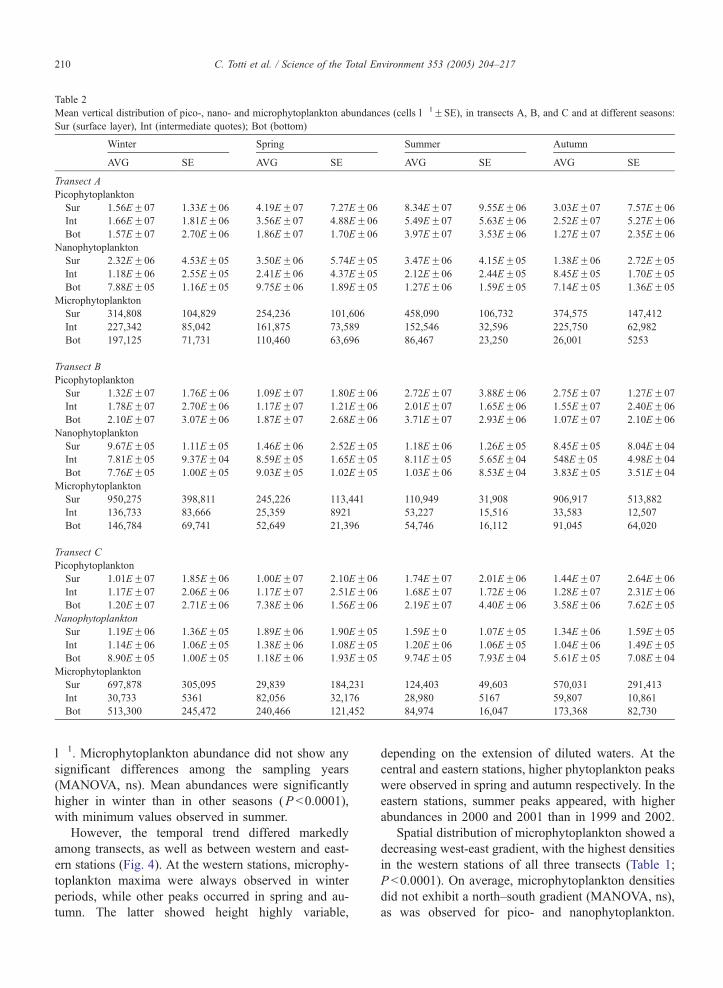
Table 2
Mean vertical distribution of pico-, nano- and microphytoplankton abundances (cells l�1FSE), in transects A, B, and C and at different seasons:
Sur (surface layer), Int (intermediate quotes); Bot (bottom)
Winter Spring Summer Autumn
AVG SE AVG SE AVG SE AVG SE
Transect A
Picophytoplankton
Sur 1.56EF07 1.33EF06 4.19EF07 7.27EF06 8.34EF07 9.55EF06 3.03EF07 7.57EF06
Int 1.66EF07 1.81EF06 3.56EF07 4.88EF06 5.49EF07 5.63EF06 2.52EF07 5.27EF06
Bot 1.57EF07 2.70EF06 1.86EF07 1.70EF06 3.97EF07 3.53EF06 1.27EF07 2.35EF06
Nanophytoplankton
Sur 2.32EF06 4.53EF05 3.50EF06 5.74EF05 3.47EF06 4.15EF05 1.38EF06 2.72EF05
Int 1.18EF06 2.55EF05 2.41EF06 4.37EF05 2.12EF06 2.44EF05 8.45EF05 1.70EF05
Bot 7.88EF05 1.16EF05 9.75EF06 1.89EF05 1.27EF06 1.59EF05 7.14EF05 1.36EF05
Microphytoplankton
Sur 314,808 104,829 254,236 101,606 458,090 106,732 374,575 147,412
Int 227,342 85,042 161,875 73,589 152,546 32,596 225,750 62,982
Bot 197,125 71,731 110,460 63,696 86,467 23,250 26,001 5253
Transect B
Picophytoplankton
Sur 1.32EF07 1.76EF06 1.09EF07 1.80EF06 2.72EF07 3.88EF06 2.75EF07 1.27EF07
Int 1.78EF07 2.70EF06 1.17EF07 1.21EF06 2.01EF07 1.65EF06 1.55EF07 2.40EF06
Bot 2.10EF07 3.07EF06 1.87EF07 2.68EF06 3.71EF07 2.93EF06 1.07EF07 2.10EF06
Nanophytoplankton
Sur 9.67EF05 1.11EF05 1.46EF06 2.52EF05 1.18EF06 1.26EF05 8.45EF05 8.04EF04
Int 7.81EF05 9.37EF04 8.59EF05 1.65EF05 8.11EF05 5.65EF04 548EF05 4.98EF04
Bot 7.76EF05 1.00EF05 9.03EF05 1.02EF05 1.03EF06 8.53EF04 3.83EF05 3.51EF04
Microphytoplankton
Sur 950,275 398,811 245,226 113,441 110,949 31,908 906,917 513,882
Int 136,733 83,666 25,359 8921 53,227 15,516 33,583 12,507
Bot 146,784 69,741 52,649 21,396 54,746 16,112 91,045 64,020
Transect C
Picophytoplankton
Sur 1.01EF07 1.85EF06 1.00EF07 2.10EF06 1.74EF07 2.01EF06 1.44EF07 2.64EF06
Int 1.17EF07 2.06EF06 1.17EF07 2.51EF06 1.68EF07 1.72EF06 1.28EF07 2.31EF06
Bot 1.20EF07 2.71EF06 7.38EF06 1.56EF06 2.19EF07 4.40EF06 3.58EF06 7.62EF05
Nanophytoplankton
Sur 1.19EF06 1.36EF05 1.89EF06 1.90EF05 1.59EF0 1.07EF05 1.34EF06 1.59EF05
Int 1.14EF06 1.06EF05 1.38EF06 1.08EF05 1.20EF06 1.06EF05 1.04EF06 1.49EF05
Bot 8.90EF05 1.00EF05 1.18EF06 1.93EF05 9.74EF05 7.93EF04 5.61EF05 7.08EF04
Microphytoplankton
Sur 697,878 305,095 29,839 184,231 124,403 49,603 570,031 291,413
Int 30,733 5361 82,056 32,176 28,980 5167 59,807 10,861
Bot 513,300 245,472 240,466 121,452 84,974 16,047 173,368 82,730
C. Totti et al. / Science of the Total Environment 353 (2005) 204–217210
l�1. Microphytoplankton abundance did not show any
significant differences among the sampling years
(MANOVA, ns). Mean abundances were significantly
higher in winter than in other seasons (P b0.0001),
with minimum values observed in summer.
However, the temporal trend differed markedly
among transects, as well as between western and east-
ern stations (Fig. 4). At the western stations, microphy-
toplankton maxima were always observed in winter
periods, while other peaks occurred in spring and au-
tumn. The latter showed height highly variable,
depending on the extension of diluted waters. At the
central and eastern stations, higher phytoplankton peaks
were observed in spring and autumn respectively. In the
eastern stations, summer peaks appeared, with higher
abundances in 2000 and 2001 than in 1999 and 2002.
Spatial distribution of microphytoplankton showed a
decreasing west-east gradient, with the highest densities
in the western stations of all three transects (Table 1;
P b0.0001). On average, microphytoplankton densities
did not exhibit a north–south gradient (MANOVA, ns),
as was observed for pico- and nanophytoplankton.

0.00E+00
5.00E+05
1.00E+06
1.50E+06 western
0.00E+00
5.00E+04
1.00E+05
1.50E+05central
0.00E+00
2.00E+04
4.00E+04
6.00E+04
8.00E+04eastern
Diato Dino Oth
cells
l-1ce
lls l-1
cells
l-1
Spr Sum Aut Win
Spr Sum Aut Win
Spr Sum Aut Win
Fig. 4. Seasonal distribution (cells l�1) of microphytoplankton over
the entire study period at the western, central and eastern stations
(meanFSE): Diato: diatoms, Dino: dinoflagellates, Oth: other micro-
phytoplankton groups. Note the different scales in the y axis.
C. Totti et al. / Science of the Total Environment 353 (2005) 204–217 211
Considering the vertical distribution, on average micro-
phytoplankton was significantly more abundant
(4.07F13.2�105 cells l�1) at surface layer (0–5 m)
than at other depths (P b0.01) (Table 2).
Microphytoplankton communities were dominated
by diatoms, while dinoflagellate abundance was 1–2
orders of magnitude lower. Peaks of the group bOthersQ
Table 3
Mean abundances and standard deviations (cells l�1) of phytoplankton size
study year, in all stations and depths: Pico: picophytoplankton; Nano: na
microphytoplankton groups; Total microphyto: total microphytoplankton
Year Pico Nano Diato
Avg. Std. Avg. Std. Avg.
1999 2.43EF07 1.83EF07 1.37EF06 6.44EF05 134,252
2000 4.59EF07 5.14EF07 2.22EF06 2.54EF06 136,917
2001 3.86EF07 4.22EF07 1.10EF06 8.66EF05 71,803
2002 3.75EF07 4.54EF07 1.24EF06 1.46EF06 100,829
appeared mainly in late summer and, to a lesser extent,
in spring. Abundances were significantly higher in the
transect C than in A and B (P b0.0001). The most
important species were Euglena sp., Syracosphaera
pulchra and Calciosolenia murrayi. Winter periods
were characterised by diatom blooms, mainly in the
western stations of all transects (generally with densi-
ties N106 cells l�1), regularly sustained by Skeletonema
marinoi (formerly S. costatum), which showed the
highest values between the end of January and Febru-
ary. Moreover, in winter 2002 we also observed a
diatom bloom due to Asterionellopsis glacialis, which
started in December and reached its maximum in Jan-
uary. Autumn peaks were generally observed at all
stations: dominating diatoms were Chaetoceros socialis
and other Chaetoceros species. Spring maxima were
generally due to Chaetoceros and Pseudo�nitzschia
species. Dinoflagellate increase was also observed in
autumn.
3.5. Summer phytoplankton communities
Comparing phytoplankton abundances in the sum-
mers of 2000 and 2002, when large mucilage aggre-
gates occurred, to those observed in the summers of
1999 and 2001, in which only early stages were ob-
served in the northern Adriatic Sea (marine snow,
macroflocs), higher values of autotrophic phytoplank-
ton were observed in 2000 and 2002 (Table 3), although
this increase was significant only for pico- (P b0.01)
and nanophytoplankton (P b0.0001). Among micro-
phytoplankton, only dinoflagellates exhibited signifi-
cantly higher abundances in dmucilageT summers than
in dnon mucilageT ones (P b0.001). In particular, sig-
nificantly lower dinoflagellate abundances were ob-
served in the summer 1999 than in other years. In
summer periods, all autotrophic components showed a
significantly decreasing north–south gradient, except
for microplanktonic dinoflagellates, which exhibited
the highest abundances along the transect C. Consider-
ing the vertical distribution during the summer period,
classes referred to summer periods (from June to September) of each
nophytoplankton; Diato: diatoms; Dino: dinoflagellates; Oth: other
Dino Oth Total microphyto
Std. Avg. Std. Avg. Std. Avg. Std.
375,149 1852 2099 986 3578 137,090 376,862
417,967 4273 8314 1349 5492 142,539 419,586
144,765 3033 5176 2455 11,004 77,291 147,753
232,237 4210 6874 661 2313 105,700 235,247

C. Totti et al. / Science of the Total Environment 353 (2005) 204–217212
significantly higher densities of picophytoplankton
were observed at the bottom, in transect B and C, in
comparison to the intermediate layer (transect B,
P b0.001) and to the surface and intermediate layers
(transect C, P b0.01). On the contrary, in transect A the
highest abundances were observed at surface.
The microphytoplankton composition during sum-
mer was characterized by a rich community of diatoms,
quite similar for all three transects, mainly represented
by Chaetoceros spp., Cerataulina pelagica, Pseudo-
Table 4
Result of 1-way MANOVA ( F-test and P) on microphytoplankton
species abundances (expressed as log cell density+1), between the
summers with (2000, 2002) and without (1999, 2001) the presence of
large aggregates
Taxa 1999, 2001 2000, 2002 F P
Asterionellopsis glacialis 2.83 4.29 0.92 N.S.
Bacteriastrum spp. 2.70 3.10 1.46 N.S.
Ceratium spp. 4.62 4.71 0.20 N.S.
Ceratium furca 1.44 2.27 6.72 *
Ceratium fusus 2.15 1.97 0.77 N.S.
Chaetoceros affinis 3.27 3.68 0.50 N.S.
Chaetoceros anastomosans 0.49 3.32 3.86 N.S.
Chaetoceros compressus 3.52 2.90 0.64 N.S.
Chaetoceros curvisetus 3.74 3.30 0.45 N.S.
Chaetoceros decipiens 3.01 3.02 0.00 N.S.
Chaetoceros insignis 2.16 3.11 3.04 N.S.
Chaetoceros lorenzianus 1.95 2.56 2.10 N.S.
Chaetoceros spp. 4.50 4.55 0.02 N.S.
Chaetoceros wighamii 0.00 3.37 1.77 N.S.
Cyclotella glomerata 0.00 3.10 2.00 N.S.
Cylindrotheca closterium 3.40 4.41 4.20 *
Dactyliosolen fragilissimus 4.00 3.96 0.02 N.S.
Dactyliosolen phuketensis 3.22 0.06 1.03 N.S.
Euglena spp. 1.57 2.22 2.42 N.S.
Gonyaulax fragilis 1.84 2.64 7.19 **
Guinardia flaccida 2.16 2.39 2.31 N.S.
Guinardia striata 3.25 2.33 6.92 **
Hemiaulus hauckii 2.16 2.54 8.70 **
Leptocylindrus danicus 3.06 3.51 1.08 N.S.
Leptocylindrus minimus 3.67 2.48 1.91 N.S.
Lioloma pacificum 1.68 0.00 2.93 N.S.
Oxytoxum spp. 2.31 2.97 5.83 *
Pleurosigma spp. 2.28 2.45 0.30 N.S.
Proboscia alata 3.16 3.08 0.43 N.S.
Prorocentrum compressum 1.42 2.05 0.93 N.S.
Prorocentrum micans 2.70 2.89 1.76 N.S.
Prorocentrum triestinum 2.16 1.93 0.57 N.S.
Pseudo-nitzschia dseriatacomplexT
0.42 2.87 3.87 N.S.
Pseudo-nitzschia
ddelicatissima complexT4.83 4.51 3.76 N.S.
Skeletonema marinoi 3.43 3.99 0.91 N.S.
Syracosphaera pulchra 3.03 2.56 4.92 *
Thalassionema frauenfeldii 2.59 2.72 0.13 N.S.
Thalassionema nitzschioides 3.60 3.48 0.19 N.S.
*P b0.05; **P b0.01. N.S., not significant.
nitzschia delicatissima, P. pseudodelicatissima, Cylin-
drotheca closterium and Dactyliosolen fragilissimus. In
this period, microplanktonic dinoflagellates reached
their annual maximum. Peaks were generally observed
in June, dominated by Prorocentrum micans and sev-
eral Oxytoxum spp., which were accompanied by other
species (at transect A Ceratium spp. and Dinophysis
spp., at transect B, Katodinium rotundatum and Toro-
dinium teredo, at transect C Dinophysis caudata).
No differences, in terms of species composition of
microphytoplankton, were observed among years with
mucilage occurrence and years without it. However,
some species displayed significantly higher abundances
in 2000 and 2002 (Table 4), and appeared to be char-
acteristic of mucilage periods (i.e. Cylindrotheca clos-
terium, Ceratium furca, Hemiaulus hauckii, Oxytoxum
spp. and Gonyaulax fragilis). On the contrary, the
coccolithophorid Syracophaera pulchra was signifi-
cantly less abundant in mucilage summers.
The microscopic examination of the aggregates
revealed a species composition comparable to that ob-
served in the water column samples, with a strong
enrichment of selected taxa, such as Cylindrotheca
closterium, Pseudo-nitzschia delicatissima, Gonyaulax
fragilis, Cyclotella sp., Cerataulina pelagica, Dacty-
liosolen fragilissimus. The relative importance of such
species showed some variations in relation to the station
where the aggregates were collected.
4. Discussion
The northern Adriatic basin is a highly complex
system, in which the spatial distribution and the sea-
sonal variability of phytoplankton are mainly driven by
the Po river discharge, coupled with the stratification/
mixing regime (Revelante and Gilmartin, 1976). Plank-
ton biomass typically shows a decreasing north–south/
west–east gradient (Fonda-Umani, 1996; Totti et al.,
1999), and the relative importance of the different
size classes varies according to the trophic gradient:
nano- and microphytoplankton tend to become domi-
nant in the coastal area, while nano- and picoplankton
dominate in the central part of the basin (Revelante and
Gilmartin, 1995; Heilmann and Richardson, 1999;
Vadrucci et al., 2002).
The subdivision of phytoplankton in the different
size classes (i.e. pico-, nano- and microphytoplankton)
is indeed an important tool which allows the interpre-
tation and explanation of many ecological responses,
such as the adaptability of phytoplankton to low or high
nutrient concentration, or the community structure in
different water column regimes (i.e. stratification or
C. Totti et al. / Science of the Total Environment 353 (2005) 204–217 213
mixing). However, this methodological approach may
be too simplistic and may hide other important infor-
mation such as the composition of the phytoplankton
assemblages, unless accompanied by taxonomical
observations. In fact, each size-class is extremely het-
erogeneous, which means that not only the size, but
also the taxonomic position contributes to significant
differences in abundances, as observed among the years
in the present study. On this point, there are several
other analyses which may be done, besides Utermohl
counting, to obtain additional information about size
class subdivision of phytoplankton (e.g. size-fraction-
ated HPLC chlorophyll analyses).
Autotrophic pico- and nanoplankton abundances
observed in this study fall within a range of values
previously reported for the northern Adriatic Sea
(Revelante and Gilmartin, 1988; Vanucci et al.,
1994; Del Negro et al., 1996; Fonda Umani et al.,
1999). Picophytoplankton abundance showed a
marked seasonality, with the highest abundances typ-
ically observed in summer, confirming previous obser-
vations (Kaltenbock and Herndl, 1992; Del Negro et
al., 1996; Vanucci et al., 1994). The high densities of
picoplankton observed in summer have been related to
their small dimensions, which influence the efficiency
of nutrient uptake in an oligotrophic environment.
Moreover, a seasonal response of cyanobacteria to
higher temperatures has also been reported (Whitton
and Potts, 1982).
Nanophytoplankton abundances were, on average,
almost one order of magnitude higher than those of
microphytoplankton, and the highest values were
recorded in spring–summer; moreover, nanophyto-
plankton assemblages were mainly represented by flag-
ellate forms (i.e. N80%). These findings are in
accordance with previous data on nanophytoplankton
(mostly derived from Utermohl counting) recorded in
the northern Adriatic Sea that show the nanoplankton
fraction as the most abundant of the phytoplankton
community all year around, with phytoflagellates repre-
senting the most important contributors to this fraction,
reaching higher densities in summer (Zoppini et al.,
1995; Totti et al., 2002a).
In the annual cycle of microphytoplankton, differ-
ent patterns have been recognized, depending on the
area. Winter bloom characterized the stations located
within the western coastal front of the northern Adria-
tic Sea, due to Skeletonema marinoi (formerly S.
costatum), a small colonial centric diatom with a
marked seasonal behaviour (Totti et al., 2002a; Ber-
nardi-Aubry et al., 2004). In January 2002, we ob-
served a delayed bloom of Asterionellopsis glacialis,
a seasonal diatom species which, since the early
1990s, has occurred typically in autumn after a period
of apparent disappearance from the plankton of the
northern Adriatic (Marzocchi et al., 1989; Totti et al.,
2002a). On the contrary, in the oligotrophic central
and eastern stations, the microphytoplankton followed
the seasonal trend generally observed in the open
middle Adriatic basin (Totti et al., 2000) and in the
Mediterranean Sea (Cushing, 1989), with two peaks
in spring and autumn. The occurrence of summer
peaks characterized mainly the eastern stations.
The autotrophic communities of the northern Adria-
tic Sea displayed significant differences, in terms of
abundances, between summer periods in which large
mucilage aggregates appeared and those in which the
phenomenon was observed only in its early phases (i.e.
occurrence of marine snow and macroflocs). Pico- and
nanophytoplankton, together with microplanktonic
dinoflagellates, had significantly higher densities in
dmucilageT summers, although a general increase in
density was observed even for diatoms. Summer
blooms of cyanobacteria have already been reported
during other mucilage episodes (Kaltenbock and
Herndl, 1992), and in the periods without the phenom-
enon (Vanucci et al., 1994). During the years of muci-
lage appearance, blooms of cyanobacteria were
observed under the pycnocline, at the bottom layer,
especially in transects B and C. The significantly higher
densities of picophytoplankton in ambient water during
dmucilageT summers would indicate that cyanobacteria
may enhance their growth rates in the presence of
mucus aggregates, beside fueling the mucoid matrix,
and thus supporting further aggregation of marine snow
(Kaltenbock and Herndl, 1992). The significantly
higher densities of nanophytoplankton found in
dmucilageT compared to dnon mucilageT summers are
likely to be associated with the increase in the avail-
ability of dissolved organic matter in the periods pre-
ceding mucilage appearance (Danovaro et al., 2005–
this volume). Mixotrophy, that is the capability of
autotrophic phytoplankton to exploit organic matter,
both via osmotrophic uptake and via phagocytosis, is
widespread in phytoplankton classes (Jones, 1994;
Raven, 1997). According to this criterion, most of the
nanophyplankton reported in this study can be consid-
ered mixotrophs, and an opportunistic behaviour of
nanoplanktonic assemblages able to acquire organic
nutrients during changes in the trophic conditions of
the system can be hypothesized (Lovejoy et al., 2000).
This hypothesis is further supported by results obtained
in a synoptic study, referred to the same campaign, but
limited to transect C and the years 1999 and 2000,

C. Totti et al. / Science of the Total Environment 353 (2005) 204–217214
where, besides nanophytoplankton, heterotrophic nano-
plankton and pico-eukaryotes were also investigated in
water samples (Vanucci, 2003). Nanophytoplankton
abundance exceeded that of heterotrophic nanoplankton
in both years and all year around (on average, by almost
one order of magnitude). The structure of these nano-
plankton assemblages was different from those reported
in other Mediterranean areas (e.g. in the oligotrophic
eastern Mediterranean Sea, Christaki et al., 1999; and in
the Aegean Sea, Mihalatou and Moustaka-Gouni,
2002). However, in addition to the significant increase
of nanophytoplankton, significant increases of both
heterotrophic nanoplankton and heterotrophic pico-
eukaryotes were found in the summer of 2000 with
respect to the summer of 1999. Moreover, the relative
increase observed in summer 2000 was higher for
heterotrophic than for autotrophic nanoplankton
(Vanucci, 2003). All these changes reflect modified
trophic pathways, which are able to optimise the ex-
ploitation of the available nutrient sources (Legendre
and Rassoulzadegan, 1995; Mousseau et al., 1996).
Simon et al. (2002), reviewing on microbial ecology
of organic aggregates in aquatic ecosystems, pointed
out that not only the aggregates but also their surround-
ings are sites and hot-spots of microbial processes, with
the plume of solutes leaking out of aggregates. There-
fore, it is likely that the increased enzymatic activity
during mucilage summers (Danovaro et al., 2005–this
volume) may enhance organic and inorganic matter
mobilization, which is successfully taken by phyto-
plankton capable of mixotrophy, thus contributing to
the growth of free-living microbial components.
Despite the higher densities observed in the sum-
mers of 2000 and 2002, the microphytoplankton popu-
lation in the water column, during mucilage
phenomena, was characterized by a species composi-
tion more or less comparable to that observed in sum-
mers when only early stages of the phenomenon
appeared. There are several recurrent taxa, which are
characteristic of the summer assemblages of the north-
ern Adriatic Sea, in the last 15 years, such as Ceratau-
lina pelagica, Chaetoceros spp., Pseudo-nitzschia
pseudodelicatissima, P. delicatissima, Dactyliosolen
fragilissimus, Prorocentrum micans and Cylindrotheca
closterium (Totti et al., 2002a; Bernardi-Aubry et al.,
2004). A few species appeared in the phytoplankton
community, with significantly higher densities in the
years 2000 and 2002, such as Hemiaulus hauckii, C.
closterium, Ceratium furca, Oxytoxum spp. and
Gonyaulax fragilis. The latter was observed with high
abundances in the water column only in the late spring–
summer periods of 2000 and 2002, and again with low
density in May–June 2001, otherwise it was never
observed during the study period. The possible involve-
ment of G. fragilis in mucus production has been
hypothesized by Pistocchi et al. (2005–this volume),
due to its very high concentrations in mucus aggregates,
and to the fact that this species may release high
amounts of extracellular polysaccharides under experi-
mental conditions (Pompei et al., 2003).
The phytoplankton assemblage in the mucilage
aggregates was comparable, in terms of species com-
position, to that observed in the surrounding water
column. Opportunistic species such as Cylindrotheca
closterium and Pseudo-nitzschia delicatissima reached
very high densities in the aggregates, probably benefit-
ing from the highly favourable microenvironment.
However, when comparing microbial assemblages of
aggregates with those of surrounding water, it should
be taken into account that a clear physical separation
between these two components, as they would be dis-
tinct compartments, is sometimes forced. In fact, when
water ambient is sampled using Niskin bottles, small
aggregates, microflocs, etc., which may be derived from
a partial break-up of mucilage aggregates, are sampled
with the surrounding water, affecting its analysis.
Phytoplankton assemblages associated to mucilage
aggregates differed in terms of the relative importance
of the species in all the reported episodes, and among
different areas as well. Pucher-Petkovic and Marasovic
(1987) reported several benthic diatoms as dominating
species in the aggregates during the episodes of 1983.
During phenomena of summer 1988, Honsell and Cab-
rini (1990) observed a rich diatom assemblage dominat-
ed by Pseudo-nitzschia spp. and Skeletonema costatum
and reported high amounts of Gonyaulax hyalina, a
species closely related to G. fragilis. In the very intense
episodes of 1989, dominating species in front of Seni-
gallia were Cerataulina pelagica, Leptocylindrus dani-
cus, Pseudo-nitzschia delicatissima, Cylindrotheca
closterium and G. fragilis (Totti et al., 1993), while in
the Gulf of Trieste Cabrini et al. (1992) reported Tha-
lassiosira sp., Pseudo-nitzschia sp., C. pelagica and L.
danicus. In the same period, Revelante and Gilmartin
(1991) observed high densities of Nitzschia longissima
and C. closterium in the aggregates in front of the Po
River delta. In the episodes of 1991, an almost mono-
specific population of C. closterium was observed in
aggregates originating from different areas of the Adria-
tic Sea (Pettine et al., 1993; Monti et al., 1993). Finally,
during the 1997 summer, Fornasiero (1998) found C.
pelagica, Dactyliosolen fragilissimus, Cyclotella sp.
and also benthic diatoms such as Nitzschia sigma,
Navicula spp. and Pleurosigma sp.

C. Totti et al. / Science of the Total Environment 353 (2005) 204–217 215
All these observations would indicate that the phy-
toplankton assemblages inhabiting the aggregates dis-
play high variability, as does any plankton population
in general, and have their own story and evolution as
do the phytoplankton of the surrounding water. Cylin-
drotheca closterium for example has been recognized
as a recurrent species appearing especially in aged
aggregates, often forming very dense and almost
monospecific populations. The aggregates represent a
microenvironment very suitable for the development
of a rich community of microorganisms (Simon et al.,
2002), which is separated from the surrounding water,
but which may interchange with it in terms of species
composition. A secondary development of diatoms in
the aggregates was already proposed by the bpioneerQscientists in the field (Steuer, 1903; Cori, 1905). The
presence of mucilage aggregates affects the composi-
tion of phytoplankton populations in the water col-
umn, even when aggregates are at early stages, and
there is a mutual connection between phytoplankton
and aggregates, i.e., several diatom and dinoflagellate
species may contribute to aggregate formation and
enlargement through the exudation process (Alldredge,
1999; Myklestad, 1995; MacKenzie et al., 2002), but
mucilage aggregates themselves may affect the phyto-
plankton populations, allowing the development of a
rich diatom community, as some phytoplankton spe-
cies take advantage of such peculiar and favourable
environment.
The composition of summer phytoplankton com-
munities observed during this study falls within a
more general change, which has occurred in the north-
ern Adriatic Sea since 1988. Historical data of phyto-
plankton time series of the northern Adriatic Sea (Totti
et al., 2002a) indicate a shift in the summer phyto-
plankton community from the decade 1978–1987, in
which dinoflagellate red tides were very common
(Regione Emilia Romagna, 1978-2003; Boni, 1983;
Boni et al., 1983; Artegiani et al., 1985; Pompei et
al., 1998; Totti et al., 1999) to the period 1988–2002
in which mucilage phenomena appeared, characterized
by a strong dominance of diatoms in summer, al-
though never reaching the level of blooms. This de-
cadal change also has a climatic match, as the
atmospheric pressure values in the January–March of
1988–2002 period were significantly higher than those
observed in the previous decade (Totti et al., 2002b),
and high pressure in winter has been significantly
correlated to mucilage occurrence and has been de-
scribed as one of the conditions necessary for the
mucilage phenomena (Crisciani et al., 1990), due to
its effect on water mass circulation.
Acknowledgements
The study was performed in the frame of the MAT
Project (Mucilages in the Adriatic and Tyrrhenian seas)
coordinated by Istituto Centrale per la Ricerca scienti-
fica e tecnologica Applicata al Mare (ICRAM) and
financed by the Italian Ministry of Environment.
References
Alcoverro T, Conte R, Mazzella L. Production of mucilage by the
Adriatic epipelic diatom Cylindrotheca closterium (Bacillariophy-
ceae) under nutrient limitation. J Phycol 2000;36:1087–95.
Alldredge AL. The potential role of diatom exudates in forming
nuisance mucilaginous scums. Ann Ist Super Sanita 1999;35:
397–400.
Alldredge AL, Passow U, Logan BE. The abundance and significance
of a class of large, transparent organic particles in the ocean. Deep
Sea Res 1993;40:1131–40.
Artegiani A, Azzolini R, Marzocchi M, Morbidoni M, Solazzi A,
Cavolo F. Prime osservazioni su un bbloomQ fitoplanctonico
lungo la costa marchigiana nell’anno 1984. Nova Thal
1985;7(3):137–42.
Azam F, Long RA. Sea snow microcosms. Nature 2001;414:495–8.
Azam F, Fonda Umani S, Funari E. Significance of bacteria in the
mucilage phenomenon in the northern Adriatic Sea. Ann Ist Super
Sanita 1999;35:411–9.
Bernardi-Aubry F, Berton A, Bastianini M, Socal G, Acri F. Phyto-
plankton succession in a coastal area of the NW Adriatic, over a
10-year sampling period (1990–1999). Cont Shelf Res 2004;24:
97–115.
Boni L. Red tides in the coast of Emilia Romagna (north-western
Adriatic Sea) from 1975 to 1982. Inf Bot Ital 1983;15(1):18–24.
Boni L, Pompei M, Reti M. The occurrence of Gonyaulax tamarensis
Lebour bloom in the Adriatic Sea along the coast of Emilia-
Romagna. G Bot Ital 1983;17(3–4):115–20.
Cabrini M, Fonda-Umani S, Honsell G. Mucilaginous aggregates in
the Gulf of Trieste (Northern Adriatic Sea) analysis of the phyto-
planktonic communities in the period June–August 1989. Sci
Total Environ 1992:557–68 [Suppl.].
Christaki U, van Wambeke F, Dolan JR. Nanoflagellates (mixotrophs,
heterotrophs and autotrophs) in the oligotrophic eastern Mediter-
ranean: standing stocks, bacterivory and relationships with bacte-
rial production. Mar Ecol Prog Ser 1999;181:297–307.
Cordella P, Cavolo F. Una proposta metodologica sul conteggio del
fitoplancton. G Bot Ital 1988;122(1):92.
Cori CJ. Sul fenomeno del bmar sporcoQ nel golfo di Trieste durante
l’estate del 1905. Osterreichische Fischerei-Zeitung, 1905, 1. In:
Fonda Umani S, Ghirardelli E, Specchi M, editors. Gli episodi di
bmare sporcoQ nell’Adriatico dal 1729 ai giorni nostri. Trieste7
Regione Autonoma Friuli Venezia-Giulia; 1905. p. 178.
Crisciani F, Ferraro S, Raichich F. Climatological aspects of the
occurrence of bmare sporcoQ (dirty sea) episodes in the northern
Adriatic during the period 1841–1990. Boll Oceanol Teor Appl
1990;8:289–98.
Cushing DH. A difference in structure between ecosystems in
strongly stratified waters and in those that are only weakly
stratified. J Plankton Res 1989;11(1):1–13.
Danovaro R. Do bacteria compete with phytoplankton for inorganic
nutrients? Possible ecological implications. Chem Ecol 1998;14:
83–96.

C. Totti et al. / Science of the Total Environment 353 (2005) 204–217216
Danovaro R, Armeni M, Luna GM, Corinaldesi C, Dell’Anno A,
Ferrari CR, et al. Exo-enzymatic activities and dissolved organic
pools in relation with mucilage development in the northern
Adriatic Sea. Sci Total Environ 2005;353:189–203.
Degobbis D, Malej A, Fonda Umani S. The mucilage phenomenon in
the northern Adriatic Sea. A critical review of the present scien-
tific hypotheses. Ann Ist Sup Sanita 1999;35:373–82.
Degobbis D, Precali R, Ferrari CR, Djakovac T, Rinaldi A, Ivancic I,
et al. Changes in nutrient concentrations and ratios during muci-
lage events in the period 1999–2002. Sci Total Environ
2005;353:103–14.
Del Negro P, Ramani P, Martecchini E, Celio M. Distribuzione
annuale del picoplancton in una stazione costiera del Golfo di
Trieste. In: Albertelli G, De Maio A, Piccazzo M, editors. Atti XI
Congresso AIOL, Genova; 1996. p. 747–56.
Fonda-Umani S. Pelagic production and biomass in the Adriatic Sea.
Sci Mar 1996;60(2):65–77.
Fonda-Umani S, Ghirardelli E, Specchi M. Gli episodi di bmare
sporcoQ nell’Adriatico dal 1729 ai giorni nostri. In: Fonda-
Umani S, Ghirardelli E, Specchi M, editors. Regione Autonoma
Friuli Venezia-Giulia, Trieste; 1989. 178 pp.
Fonda Umani S, Cauwet G, Cok S,Martecchini E, Pedronzani S. Short-
term chemical and biological properties of the water column in the
Gulf of Trieste: the example of late spring and late summer. In:
Hopkins TS, Artegiani A, Cauwet G, Degobbis D,Malej A, editors.
Ecosystems research report, 32 The Adriatic Sea; 1999. p. 237–50.
Fornasiero P. Popolamenti fitoplanctonici durante il bmare sporcoQ(mucillagini) nell’Adriatico settentrionale (settembre 1997). Tesi
di laurea 1998. Universita di Ancona.
Giani, M., Berto, D., Zangrando, V., Castelli, S. Chemical character-
ization of different typologies of mucilaginous aggregates in the
northern Adriatic Sea. Sci Total Environ 2005;353:232–46.
Hasle GR. The inverted microscope method. In: Sournia A, editor.
Phytoplankton manual. UNESCO Monographs on oceanographic
methodology. Paris7 UNESCO; 1978. p. 88–96.
Heilmann JP, Richardson K. The cell-size structure of phytoplankton
community related to hydrographic and chemical properties of the
northern Adriatic Sea. In: Hopkins TS, Artegiani A, Cauwet G,
Degobbis D, Malej A, editors. Ecosystems research report, 32 The
Adriatic Sea; 1999. p. 331–45.
Honsell G, Cabrini M. Il fitoplancton durante il bmare sporcoQdell’agosto 1988 nel Golfo di Trieste (Adriatico settentrionale).
Boll Soc Adriatic Sci 1990;72(5):1–11.
Jones RI. Mixotrophy in planktonic protists as a spectrum of nutri-
tional strategies. Mar Microb Food Webs 1994;8:87–96.
Kaltenbock E, Herndl GJ. Ecology of amorphous aggregations (ma-
rine snow) in the Northern Adriatic Sea. IV. Dissolved nutrients
and the autotrophic community associated with marine snow. Mar
Ecol Prog Ser 1992;87:147–59.
Kemp PF, Sherr BF, Sherr EB, Cole JJ. Handbook of methods in
aquatic microbial ecology. NY7 Lewis Publ.; 1993. p. 777.
Lovejoy C, Legendre L, Therriault JC, Tremblay JE, Klein B, Ingram
RG. Growth and distribution of marine bacteria in relation to nano-
phytoplankton community structure. DeepSeaRes2000;47:461–87.
Legendre L, Rassoulzadegan F. Plankton and nutrient dynamics in
marine waters. Ophelia 1995;41:153–72.
MacKenzie L, Sims I, Beuzenberg V, Gillespie P. Mass accumulation
of mucilage caused by dinoflagellate polysaccharide exudates in
Tasman Bay, New Zealand. Harmful Algae 2002;1:69–83.
Marchetti R, Iacomini M, Torri G, Focher B. Caratterizzazione pre-
liminare degli essudati di origine fitoplanctonica raccolti in Adria-
tico nell’estate 1989. Acqua Aria 1989;8:883–7.
Marzocchi M, Artegiani A, Solazzi A, Cavolo F, Morbidoni M, Sandi
A, Della Sala C. Variazioni annuali dei popolamenti fitoplancto-
nici e dei parametri ambientali nella baia di Portonovo Ancona
(1982–86). Nova Thal 1989;10(1):125–33.
Mihalatou HM, Moustaka-Gouni M. Pico-, nano-, microplankton
abundance and primary productivity in a eutrophic coastal area
of the Aegean sea, Mediterranean. Int Rev Hydrobiol 2002;87:
439–56.
Monti M, Dellavalle G, Welker C, Casaretto L, Cataletto B. Analisi
qualitativa degli aggregati mucillaginosi in una stazione del Golfo
di Trieste (luglio 1991). Biol Mar Suppl Notiz SIBM 1993;1:27–9.
Monti M, Welker C, Dellavalle G, Casaretto L, Fonda-Umani S.
Mucous aggregates under natural and laboratory conditions: a
review. Sci Total Environ 1995;165:145–54.
Mousseau L, Legendre L, Fortier L. Dynamics of size-fractionated
phytoplankton and trophic pathways on the Scotian shelf and at
the shelf break, Northwest Atlantic. Aquat Microb Ecol 1996;10:
149–63.
Myklestad SM. Release of extracellular products by phytoplankton
with special emphasis on polysaccharides. Sci Total Environ
1995;165:155–64.
Obernosterer I, Herndl GJ. Phytoplankton extracellular release and
bacterial growth: dependence on the inorganic N:P ratio. Mar Ecol
Prog Ser 1995;116:247–57.
Pettine M, Puddu A, Totti C, Zoppini A, Artegiani A, Pagnotta R.
Caratterizzazione chimica e biologica di mucillagini. Biol Mar,
Suppl Notiz SIBM 1993;1:39–42.
Pistocchi R, Cangini M, Totti C, Romagnoli T, Palamidesi S, Guerrini
F. et al. Relevance of the dinoflagellate Gonyaulax fragilis in
mucilage formations of the Adriatic Sea. Sci Total Environ
2005;353:307–16.
Pompei M, Ghetti A, Milandri A, Mazziotti C. Fioriture microalgali
ed evoluzione dei principali popolamenti fitoplanctonici nelle
acque costiere emiliano-romagnole dal 1982 al 1994. Atti Con-
vegno Evoluzione dello stato trofico in Adriatico: analisi degli
interventi attuati e future linee di intervento, 28–29 September
1995, Marina di Ravenna; 1998. p. 51–60.
Pompei M, Mazziotti C, Guerrini F, Cangini M, Pigozzi S, Benzi M, et
al. Correlation between the presence of Gonyaulax fragilis (Dino-
phyceae) and the mucilage phenomena of the Emilia-Romagna
coast (northern Adriatic Sea). Harmful Algae 2003;2:301–16.
Pucher-Petkovic T, Marasovic I. Contribution a la connaissance d’une
poussee extraordinaire d’algues unicellulaires (Adriatique Septen-
trionale). Centro 1987;1(3):33–44.
Raven JA. Phagotrophy in phototrophs. Limnol Oceanogr 1997;42:
198–205.
Regione Emilia Romagna. Eutrofizzazione delle acque costiere
dell’Emilia Romagna. Rapporto annuale; 1978–2003.
Revelante N, Gilmartin M. The effect of Po river discharge on
phytoplankton dynamics in the northern Adriatic Sea. Mar Biol
1976:259–71.
Revelante N, Gilmartin M. Some observation on eutrophication as-
sociated changes in phototrophic and heterotrophic pico- and
nanoplankton assemblages in northern Adriatic Sea. Rapp
Comm int Mer Medit 1988;31:217.
Revelante N, Gilmartin M. The phytoplankton composition and pop-
ulation enrichment in gelatinous bmacroaggregatesQ in the north-
ern Adriatic during the summer of 1989. J Exp Mar Biol Ecol
1991;146:217–33.
Revelante N, Gilmartin M. The relative increase of larger phytoplank-
ton in a subsurface chlorophyll maximum of the northern Adriatic
Sea. J Plankton Res 1995;17(17):1535–62.
C. Totti et al. / Science of the Total Environment 353 (2005) 204–217 217
Russo A, Maccaferri S, Djakovac T, Precali R, Degobbis D, Deserti,
M, et al. Meteorological and oceanographic conditions in the
northern Adriatic Sea during the period June 1999–July 2002:
influence on the mucilage phenomenon. Sci Total Environ
2005;353:24–38.
Sherr EB, Sherr BF. Staining of heterotrophic protists for visualisation
via epifluorescence microscopy. In: Kemp PF, Sherr BF, Sherr EB,
Cole JJ, editors. Handbook of methods in aquatic microbial
ecology. NY7 Lewis Publ; 1993. p. 224–7.
Simon M, Grossart HP, Schweitzer B, Ploug H. Microbial ecology of
organic aggregates in aquatic ecosystems. Aquat Microb Ecol
2002;28:175–211.
Steuer A. I Protozoi quali fattori di danno per la pesca in mare.
Osterreichische Fischerei-Zeitung, 1903 1 (1). In: Fonda Umani
S, Ghirardelli S, Specchi M, editors. Gli episodi di bmare sporcoQnell’Adriatico dal 1729 ai giorni nostri. Trieste7 Regione Auton-
oma Friuli Venezia-Giulia; 1989. p. 178.
Stoderegger K, Herndl GJ. Production and release of bacterial cap-
sular material and its subsequent utilization by marine bacterio-
plankton. Limnol Oceanogr 1998;43:877–84.
Supic N, Orlic M, Degobbis D. Istrian coastal countercurrent and its
year to year variability. Estuar Coast Shelf Sci 2000;51:385–97.
Throndsen J. Preservation and storage. In: Sournia A, editor. Phyto-
plankton manual. UNESCO Monographs on oceanographic meth-
odology; 1978. p. 69–74.
Totti C, Cavolo F, Marzocchi M, Solazzi A. Phytoplankton popula-
tions during dirty sea phenomenon in Northern Adriatic Sea
(summer 1989). Quad Ist Ric Pesca Maritt 1993;5(2):99–118.
Totti C, Ghetti A, Pariante R, Hopkins T. Biological coherence in the
western Adriatic coastal current: phytoplankton assemblages. In:
Hopkins TS, Artegiani A, Cauwet G, Degobbis D, Malej A,
editors. Ecosystems research report, 32 The Adriatic Sea; 1999.
p. 385–400.
Totti C, Civitarese G, Acri F, Barletta D, Candelari G, Paschini E,
Solazzi A. Seasonal variability of phytoplankton populations in the
middle Adriatic sub-basin. J Plankton Res 2000;22(9):1735–56.
Totti C, Cucchiari EM, Romagnoli T. Intra and interannual variability
of phytoplankton in coastal area of Senigallia (northern Adriatic
Sea) from 1988 to 2000. Biol Mar Medit 2002a;9(1):391–9.
Totti C, Marzocchi M, Cucchiari E, Romagnoli T, Barletta D, Arte-
giani A, Solazzi A. The winter diatom bloom of the northern
Adriatic Sea: long-term recurrence (1979–2001) and possible
relationships with climate. 2nd National Conference SINAPSI,
Climate variability and effects on the Mediterranean marine eco-
systems, Portonovo (Ancona) 13–15 May 2002; 2002b.
Vadrucci MR, Basset A, Decembrini F. Quantitative relationships
among phytoplankton body size classes and production process-
es in the north Adriatic coastal region. Chem Ecol 2002;18(1–2):
53–60.
Vanucci S. Do mucilage events influence pico- and nanoplankton size
and structure in the Adriatic Sea? Chem Ecol 2003;19:299–320.
Vanucci S, Acosta Pomar MLC, Maugeri TL. Seasonal pattern of
phototrophic picoplankton in the eutrophic coastal waters of the
northern Adriatic Sea. Bot Mar 1994;37:57–66.
Whitton BA, Potts M. The biology of cyanobacteria. In: Carr NG,
Whitton BA, editors. Botanical monographs. Blackwell Scientific
Publications; 1982. p. 515–42.
Zoppini A, Pettine M, Totti C, Puddu A, Artegiani A, Pagnotta R.
Nutrients, standing crop and primary production in the western
coastal waters of the Adriatic Sea. Estuar Coast Shelf Sci 1995;
41:493–513.