Intrusions into the lower stratospheric Arctic vortex during the winter of 1991–1992
17
JOURNAL OF GEOPHYSICAL RESEARCH, VOL. 99, NO. D1, PAGES 1089-1105, JANUARY 20, 1994 Intrusions into the lower stratospheric Arctic vortex during the winter of 1991-1992 R. A. Plumb, • D. W. Waugh, • R. J. Atkinson, • P. A. Newman, 2 L. R. Lait, 2 M. R. Schoeberl, 2 E. V. Browell, 3 A. J. Simmons,4 and M. Loewenstein • Abstract. Investigations of the kinematics of the lower stratospheric Arctic vortex during the winter of 1991-1992 using t-he contour advection with surgery technique reveal three distinct events in which there was substantial intrusion of midlatitude air into the vortex, in apparent contradictionof the view that the polar vortex constitutes an isolated air mass. Two of these events, in late January and mid-February, were well documented. They were predicted in high-resolution forecasts by the European Centre for Medium-Range Weather Forecasts, most clearly in experimentalforecastswith reduced diffusion. Direct confirmation of the presenceof the intrusions and of their calculated locations was provided by aerosol observations from the airborne differential absorptionlaser lidar aboard the NASA DC-8, taken as part of the secondAirborne Arctic StratosphericExpedition campaign;aerosol-richair of midlatitude origin was seen in the expected position of the intrusions. The reality of the February event was also confirmed by in situ measurements from the NASA ER-2. Such eventsmay be significant for the chemical processes taking place within the winter vortex. The intrusions were evidentlyrelated to the meteorology of the northern stratosphere during this winter and in particular to persistenttropospheric blocking over the northeasternAtlantic Ocean and western Europe and concomitant ridging into the lower stratosphericvortex in this region. Nevertheless, preliminary investigationshave indicated that such events are not uncommonin other northern hemispherewinters, although no such events were found in the southernhemisphereduring the Antarctic winter of 1987. 1. Introduction The perturbed chemistry within the stratospheric polar vortices has generated great interest in their dynamics. in particular, the question of the rate of transport into the vortices from midlatitudes is both important and unresolved. It has been argued from the observed structure of tracers in high stratospheric latitudes, from high-resolution models, and from trajectory calculations that the air inside the vortices is essentially isolated from the outside [Hartmann et al., 1989a, b; Mcintyre, 1989; Schoeberl et al., 1992] except during disruptionssuch as major warmings when the vortex breaks apart. Others, on the contrary, have argued that the vortex is a "flowing processor" with substantial exchange taking place [Tuck, 1989; Proffitt et al., 1989, 1990; Tuck et al., 1992]. High-resolution model simulations of a disturbed vortex [Juckes and Mcintyre, 1987; Juckes, 1989; Norton, 1993; Waugh, 1993] have shown that at least under certain circum- stances,the vortex edge remains extremely robust; outward 1Center for Meteorology and Physical Oceanography, Massachu- setts Institute of Technology, Cambridge. 2NASA Goddard Space Flight Center, Greenbelt, Md. 3NASA Langley Research Center, Hampton, Virginia. 4European Centre forMedium-Range Weather Forecasts, Read- ing, England. 5NASA Ames Research Center, Moffett Field, California. Copyfight 1994by the American GeophysicalUnion. Paper number 93JD02557. 0148-0227/94/93JD-02557505.00 breaking into a highly disturbed "surf zone" [Mcintyre and Palmer, 1983] may occur but without corresponding intru- sion of midlatitude air into the vortex. Although it is appar- ent that midlatitude air will be entrained into the vortex during periods of major disturbance, especially during and immediately following vortex breakdown events, most of these simulations give the impression of an isolated vortex during less disturbed periods. However, some of the simu- lations described by Juckes [1987] do show intrusion occur- ring, suggesting that the apparent isolation of vortex air may be dependent on circumstance. In this paper we describe three apparent intrusions into the Arctic vortex that occurred during the winter of 1991- 1992. (Analysis of transport out of the vortex is described in a separate paper [Waugh et al., this issue].) All three events are weakly apparent in National Meteorological Center (NMC) stratospheric analyses, though the resolution of these analysesand of the data on which they are based limits confidence in the reality of such features. However, in each case the reality of the intrusion was confirmed by high- resolution calculations of contour evolution using the tech- nique of contour advection with surgery (CAS) [Waugh and Plumb, 1993]. In these calculations, material contours ini- tially coincident with analyzed potential vorticity (PV) con- tours on a chosen isentropic surface are advected by the analyzed balanced winds on that surface. Sufficient resolu- tion of the contours as they evolve is maintained, and "surgery" of the contours to eliminate very small scales is applied, using the "contour surgery" procedures of Dritschel [1988, 1989]. The CAS technique has been applied 1089
-
Upload
johnshopkins -
Category
Documents
-
view
0 -
download
0
Transcript of Intrusions into the lower stratospheric Arctic vortex during the winter of 1991–1992

JOURNAL OF GEOPHYSICAL RESEARCH, VOL. 99, NO. D1, PAGES 1089-1105, JANUARY 20, 1994
Intrusions into the lower stratospheric Arctic vortex during the winter of 1991-1992
R. A. Plumb, • D. W. Waugh, • R. J. Atkinson, • P. A. Newman, 2 L. R. Lait, 2 M. R. Schoeberl, 2 E. V. Browell, 3 A. J. Simmons, 4 and M. Loewenstein •
Abstract. Investigations of the kinematics of the lower stratospheric Arctic vortex during the winter of 1991-1992 using t-he contour advection with surgery technique reveal three distinct events in which there was substantial intrusion of midlatitude air
into the vortex, in apparent contradiction of the view that the polar vortex constitutes an isolated air mass. Two of these events, in late January and mid-February, were well documented. They were predicted in high-resolution forecasts by the European Centre for Medium-Range Weather Forecasts, most clearly in experimental forecasts with reduced diffusion. Direct confirmation of the presence of the intrusions and of their calculated locations was provided by aerosol observations from the airborne differential absorption laser lidar aboard the NASA DC-8, taken as part of the second Airborne Arctic Stratospheric Expedition campaign; aerosol-rich air of midlatitude origin was seen in the expected position of the intrusions. The reality of the February event was also confirmed by in situ measurements from the NASA ER-2. Such events may be significant for the chemical processes taking place within the winter vortex. The intrusions were evidently related to the meteorology of the northern stratosphere during this winter and in particular to persistent tropospheric blocking over the northeastern Atlantic Ocean and western Europe and concomitant ridging into the lower stratospheric vortex in this region. Nevertheless, preliminary investigations have indicated that such events are not uncommon in other northern hemisphere winters, although no such events were found in the southern hemisphere during the Antarctic winter of 1987.
1. Introduction
The perturbed chemistry within the stratospheric polar vortices has generated great interest in their dynamics. in particular, the question of the rate of transport into the vortices from midlatitudes is both important and unresolved. It has been argued from the observed structure of tracers in high stratospheric latitudes, from high-resolution models, and from trajectory calculations that the air inside the vortices is essentially isolated from the outside [Hartmann et al., 1989a, b; Mcintyre, 1989; Schoeberl et al., 1992] except during disruptions such as major warmings when the vortex breaks apart. Others, on the contrary, have argued that the vortex is a "flowing processor" with substantial exchange taking place [Tuck, 1989; Proffitt et al., 1989, 1990; Tuck et al., 1992].
High-resolution model simulations of a disturbed vortex [Juckes and Mcintyre, 1987; Juckes, 1989; Norton, 1993; Waugh, 1993] have shown that at least under certain circum- stances, the vortex edge remains extremely robust; outward
1Center for Meteorology and Physical Oceanography, Massachu- setts Institute of Technology, Cambridge.
2NASA Goddard Space Flight Center, Greenbelt, Md. 3NASA Langley Research Center, Hampton, Virginia. 4European Centre for Medium-Range Weather Forecasts, Read-
ing, England. 5NASA Ames Research Center, Moffett Field, California.
Copyfight 1994 by the American Geophysical Union.
Paper number 93JD02557. 0148-0227/94/93JD-02557505.00
breaking into a highly disturbed "surf zone" [Mcintyre and Palmer, 1983] may occur but without corresponding intru- sion of midlatitude air into the vortex. Although it is appar- ent that midlatitude air will be entrained into the vortex
during periods of major disturbance, especially during and immediately following vortex breakdown events, most of these simulations give the impression of an isolated vortex during less disturbed periods. However, some of the simu- lations described by Juckes [1987] do show intrusion occur- ring, suggesting that the apparent isolation of vortex air may be dependent on circumstance.
In this paper we describe three apparent intrusions into the Arctic vortex that occurred during the winter of 1991- 1992. (Analysis of transport out of the vortex is described in a separate paper [Waugh et al., this issue].) All three events are weakly apparent in National Meteorological Center (NMC) stratospheric analyses, though the resolution of these analyses and of the data on which they are based limits confidence in the reality of such features. However, in each case the reality of the intrusion was confirmed by high- resolution calculations of contour evolution using the tech- nique of contour advection with surgery (CAS) [Waugh and Plumb, 1993]. In these calculations, material contours ini- tially coincident with analyzed potential vorticity (PV) con- tours on a chosen isentropic surface are advected by the analyzed balanced winds on that surface. Sufficient resolu- tion of the contours as they evolve is maintained, and "surgery" of the contours to eliminate very small scales is applied, using the "contour surgery" procedures of Dritschel [1988, 1989]. The CAS technique has been applied
1089

1090 PLUMB ET AL.' INTRUSIONS INTO THE ARCTIC VORTEX
920116 920120
920126 920128
Figure 1. Ertel potential vorticity on the 450 K isentropic surface at 1200 UT for several days in the period January 16-28, 1992, from NMC analyses. (No data were available for January 24.) Contours are plotted every 2 x 10 -6 K s -1 Pa -1 beginning at 2 x 10 -5 K s -1 Pa -1 North polar stereographic , ß
projection; 90øW is at bottom of figure.
to follow the evolution of material contours in both modeled
and analyzed wind fields by D. W. Waugh and R. A. Plumb (submitted manuscript, 1993), who demonstrated the accu- racy of small-scale features in the evolution despite the absence of comparable resolution in the advecting wind field. A similar approach has been independently used by
Norton (submitted manuscript, 1993) to investigate material contour kinematics in a high-resolution numerical model.
There is other evidence to confirm the reality of two of these events, those in late January and mid-February. As a part of the second Airborne Arctic Stratospheric Expedi- tions (AASE 2), the airborne differential absorption laser

PLUMB ET AL.: INTRUSIONS INTO THE ARCTIC VORTEX 1091
(a) b
(c) d
Exot. 2 ExDt. 3
Figure 2. Ertel potential vorticity on the 450 K isentropic surface at 1200 UT on January 24, 1992, from (a) ECMWF operational analysis, (b) operational ECMWF forecast, and (c) 8-day and (d) 5-day experimental ECMWF forecasts with weaker diffusion. Contours are plotted every 4 x 10 -6 K s -I Pa -I beginning at 2 x 10 -5 K s -I Pa -I , with shading between 2.4 x 10 -5 and 2.8 x 10 -5 K s -• Pa -I . See text for discussion.
(DIAL) lidar [Browell, 1989; Browell et al., 1993] on the NASA DC-8 aircraft obtained direct evidence of aerosol-rich
air of recent midlatitude origin inside the vortex, very close to the calculated location of the intrusions. Increased high- latitude aerosol loadings were also seen at this time in balloon-borne backscatter measurements [Rosen et al., i992]. Further support is provided by high-resolution fore- casts from the European Centre for Medium-Range Weather Forecasts (ECMWF) and especially from experimental fore- casts with reduced diffusion. The January event is described in detail from each of these perspectives in section 2.
The two events in mid-December and mid-February, which are clearly evident in the CAS calculations, are described in section 3. There is no independent observa- tional evidence for the December event, but the CAS results for February were supported by ECMWF forecasts, lidar aerosol observations, and in situ measurements of trace species from the NASA ER-2. We conclude in section 4 by discussing the dynamics of these events and their implica- tions for our understanding of the kinematics in and around the polar vortices.
2. Late January
2.1. NMC and ECMWF Analyses
Maps of Ertel PV on the 450 K isentropic surface from NMC stratospheric analyses for the period January 16-28 are shown in Figure 1. The corresponding ECMWF opera- tional analysis for 1200 UT on January 24 (for which the NMC analysis was unavailable) is shown in Figure 2a. The PV fields from the two sources differ considerably in smoothness. The ECMWF analyses are based on T106 truncations of the original T213-resolution model-level fields of temperature, vorticity, and divergence. Tuck et al. [1992] have argued that the localized "blobs" in the PV maps computed from these analyzed fields represent real features successfully captured by the analyses. However, at least some of these blobs appear to be indicative of the impact of isolated radiosonde observations (perhaps originating sev- eral analysis cycles earlier and advected and slowly diffused by the forecast model used in the data assimilation process). As will become evident in what follows (see also the remarks of Carver et al. [1993] and [Waugh et al., this issue]), such

1092 PLUMB ET AL.' INTRUSIONS INTO THE ARCTIC VORTEX
:ii!iii'•,•i.•:';• •.• •,•, .;5 .......... •ii :•-: :' :.:•i•:i•. •'4•i•!!•::- ..--:i- .... -:
'11• ..... ::-: :.::i:i •i•i• , '3'....•-:-:':-• \ '"":.:?:'.•3'" ?A?::•::,:, ..... :•iiii?'*•'"'"'"•?•i• ::•' ' ..... "t
......... ?...,7%.-.....-- ....., ......... ........... ::
920116
",,,
....... i:: .... :11' , :ii:•. '"'::•g"'"'"'":'"""":"••- '-••••".-:;;.-•/' Aii:.' .- •*-""'- ..:;?.....'•,.•:• ..... ' ........ -.-...?':-,.. 'ii_'•. '. I •'"' '•:•"••••••••':i:• , '•:":- •. •-"-,s•; ....... • .... '•""--•-•-..--••:----..:---:---I • ............... •"'"' "•"'•:"'•••:•••••:!:'. ........... ":"' ''''' "••'"'•' "'••••••.-'••••••;-•--• i \ .... ............. :* '' ' "' '•"'•• "•'•••••" ,,. ,' ....... -I
.,--' •,i?.'!;.•'-'-:::?-'•}.•-;;.... ' "-'!•:.::.::•:::::.... "::::!i::i::ii•iii•i:i-"i' ::::..:{•$; '--.. .,.- ½,::•i•..-.,,•..•i:.•:4.:.13•.%. ..... .... :-?:•:.....:.;:•:::..:..:.-:::'•.• -.,.
9201;82
.., ,, ?..•. i•:-•.,-'•..-,-.,....,.;•-•.;.5•
920120
920124
'. ::•::•??.::•:: "'-:. "-.-;:').....:i:•!":'i:'i. :• •i ,""-- •iii•-..'!--"ii:::::.' ;,- ::: ::. ..,,-,..:::.. :.•::..:. x:? ' ":'.Z' . .•. ':,' '-,?•:!:' :ii!i!::..
.... .: .i!•i•i: •;:-'%..' ..... '..i ...... •i '": ............ .,-' : .::::? •:...-.': ,3.!'•:::'- --'.-:....' (' '•. '-,,
920126 920128
Figure 3. High-resolution evolution of the vortex on the 450 K isentropic surface, January 16-28, 1992, as determined from CAS integrations. Material contours were initialized on January 16 at the location of potential vorticity contours (2.0, 2.2, 2.4, 2.6 ß ß -) x 10 -5 K s -• Pa -• from the NMC analysis at that time. Subsequently, the contours were advected with the daily analyzed 450 K balanced winds.
localized features are neither similar to nor for the most part spatially coincident with the filamentary structures produced by high-resolution forecasts and CAS calculations.
In the NMC analysis of January 16, the vortex was a single entity, though disturbed by planetary waves and with the suggestion of a substantial breaking event over eastern Asia.
By January 20 the vortex had become distorted by a strong ridge over the northeast Atlantic Ocean, a recurrent feature of this winter which was associated with persistent tropo- spheric blocking in the region. The ridge continued to develop through January 22, when the analyses suggest development of two distinct vortex centers and a small-scale

PLUMB ET AL.: INTRUSIONS INTO THE ARCTIC VORTEX 1093
920116 920120
/,:.. ............ . :.!::' '::::..:,:',:. :".':':'?:4::. .:::.:. : \ .......... ' ................. :':---:•:;::• ,.t'::::::.'•:i!?...':¾:.':!•::::..'-':<::;..:;::• '">";b:::,'' .......
>./ .... •....•..••.....•.•••••••••i:::::::....................................•..>•:...::'..::•...
920122 920124
........... :..:..:::½;•.:.. .',:-':-•!•.'-.. "':. "' :?-:"-'"'::i.• ...... '".--.".':•: .............
.... ' "....':;:•i::•::•..:' '"'.:%.• :•......" ':::;i::•.':..: '::::::::. ::•::!•.-".'i•:q•:•.-•::•:• ......... .:... "7%:.:' •...:.,...,• :.........:•.•:•:.: ':?:,:.
920126 920128
Figure 4. Like Figure 3 but using winds from ECMWF analyses in the CAS calculation.
feature inside the vortex (arrow on Figure 1) that is possibly indicative of inward transport of air from the vortex edge. However, bearing in mind the sparseness of the observa- tional network, the scale of this feature makes such an identification uncertain. The ECMWF analysis for January 24, shown in Figure 2a, also shows hints of an intrusion near 90øE. After January 24 the NMC analyses appear to show the vortex recovering its internal coherence while shedding material into middle latitudes of the eastern hemisphere.
2.2. ECMWF Forecasts
The intrusion described above was also evident in high- resolution ECMWF forecasts. Figure 2b shows the 450 K PV from an operational 8-day forecast, valid at 1200 UT on January 24, run at T213 resolution. This shows a strong intrusion of air into the vortex from northern Russia, across
the polar region, around the main (western) part of the vortex, and across northern Canada as far as northern

1094 PLUMB ET AL.: INTRUSIONS INTO THE ARCTIC VORTEX
Plate 1. Vortex structure on the 450 K isentropic surface at 1200 UT on January 22, 1992, from the CAS integration of Figure 3. The DC-8 flight track for this day is shown. (The part of the flight track that is shown here is that for which data are plotted on Plate 2; circles correspond to the hours marked on Plate 2.) The cross marks the location of Alert.
Hudson Bay. During this period some forecasts were run with an experimental version of the model, the most signif- icant difference from the operational model being reduced diffusion [Simmons, 1993]. The 8- and 5-day forecasts of 450 K PV, valid at 1200 UT on January 24, from these experi- ments are shown in Figures 2c and 2d, respectively. Note the greater penetration of the intruded air in these forecasts and the wrapping of edge air right around the western vortex center and across Greenland.
2.3. CAS Integrations
A CAS experiment was initiated with contours coincident with the 450 K NMC PV contours on January 16. These contours were advected for 10 days with the 450 K daily balanced winds determined from the NMC analyses. (Since the NMC analysis was missing for January 24, the NMC 12-hour forecast winds were used at this time.) Results of this procedure are shown in Figure 3. The first frame shows the initial condition for the experiment, taken from the January 16 analysis shown in Figure 1; note that the outer material contours, at the boundaries of the lightest gray shading, are outside the main vortex as defined by the region of maximum potential vorticity gradient in the analyses. In light of the results to follow, it will become evident that this initial condition is likely a low-resolution picture of a highly detailed structure; this initial error will of course be carried throughout the integration.
Compared with the analyses of Figure 1, the evolution of the material contours gives a rather different impression of the likely behavior of the vortex. Nevertheless, close com-
parison shows that the two are in fact remarkably consistent; e.g., note the agreement on January 26-28 (after 10-12 days of CAS integration) in depiction of the vortex air that has broken away over Siberia. Overall, the comparison is con- sistent with the presumption that the NMC analyses give a low-resolution picture of what the CAS results are describ- ing. The differences are marked, however, at smaller scales. In particular, a substantial intrusion begins in the CAS calculation over the northeast Atlantic after January 20. The vortex becomes increasingly divided but never completely split into two. Note that most of the air initially in the center of the vortex is now in the eastern part (near 40øE). Subse- quently (by January 22), what remains of the main vortex near 50øW appears to control the velocity field and to roll up, with the result that air from the eastern part is drawn back around the western center of the vortex along with intruded air from the north Atlantic. By January 24 the result of this transport is a vortex with a highly convoluted internal structure. Note that air originally in the vortex center is now around the outer edge; further inside is found the intruded air, strung right around the vortex just inside the main jet. Its location is similar to that of the intrusion in the experimental ECMWF forecasts of Figures 2c and 2d but with greater penetration. At the center of the re-formed vortex is air that was originally at its edge. Later (January 24-28), the in- truded air is mixed within the vortex, and much of what remains of the eastern center is ejected.
As a test of the sensitivity of the CAS results to the advecting wind field, the calculation was also done from the

PLUMB ET AL.' INTRUSIONS INTO THE ARCTIC VORTEX 1095
23
22
13-
d.,0K
8.5
?.o
8.15
8.0
4.0
3.5
l.O
425K
i .... ]_ _ •, _ ,• •, ,• , .• .• •., ,,, , • . , , 12 13 14 15 16 17 18 19 20
Time (hr UTC)
Plate 2. Cross sections of the vortex above the DC-8 flight track on January 22, 1992. (Top) Aerosol scattering ratio measured from the DC-8 lidar as a function of time (black = missing data), with the altitudes of the 400 K (dashed curve, bottom), 425 K, 450 K, 475 K (solid curve), and 500 K (dashed curve, top) isentropes superimposed. (Bottom) Vortex structure at 425,450, and 475 K as determined from the CAS integrations valid at 1200 UT. Plotted for each matedhal contour are the values of potential vorticity associated with each at the start of the calculation. Thus high values correspond to vortex air, and low values correspond to extravortex air. VS, visible scattering.
same initial condition but using daily winds from the EC- MWF analyses. Results are shown in Figure 4. Despite some minor differences, the results are very similar to those of Figure 3 even at fine scales and after 12 days of integration, with the ECMWF winds producing slightly more fine-scale structure and in particular a stronger intrusion. In fact, the similarity between the CAS results is much greater than that between the analyzed potential vorticity maps from the two sources.
2.4. Lidar Observations
On two occasions during this period, the NASA DC-8 flew under the western part of the vortex. Vertical profiles of aerosol scattering ratio from the airborne DIAL lidar [Brow- ell et al., 1993] provided a very direct discriminator between vortex and midlatitude air. By early winter, sulfate aerosol resulting from the eruption of Mount Pinatubo in June 1991 had spread all the way to the vortex edge, but little had penetrated the vortex at these altitudes. This is evident from the flight of January 22 from Bangor, Maine, and return, the track for which is superimposed on the CAS results for this date in Plate 1. The outbound track intersects the vortex
edge (as defined by the 450 K CAS results) at about 53øN, after which it heads generally westward beneath air at 450 K that the CAS results identify as originally from deep within the vortex. The track exits the vortex just west of Hudson Bay, after which the track turns south and then east, intersecting the vortex once more, briefly, over Hudson Bay before returning to Bangor.
Time-height cross sections of the aerosol scattering ratio for this flight are shown in the upper part of Plate 2, on which are superimposed several lower stratospheric isentropes above the aircraft as determined from NMC analyses for 1200 UT on January 22. This figure shows, above about 410 K, the marked contrast between air outside and inside the vortex (with high and low scattering ratios, respectively). Below 410 K there is little difference in scattering ratio inside and outside; this corresponds to the "bottom of the vortex" evident in other indicators [Tuck, 1989]. On the lower part of the figure is shown the distribution of matedhal contours along the flight track, as predicted by the CAS integrations for 1200 UT on January 22 on the 425, 450, and 475 K surfaces. These show the very high correspondence between vortex (extravortex) air, as located in the CAS integrations,

1096 PLUMB ET AL.: INTRUSIONS INTO THE ARCTIC VORTEX
Plate 3. Vortex structure on the 450 K isentropic surface at 0000 UT on January 24, 1992, from the CAS integration of Plate 2. The DC-8 flight track for this day is shown. (The part of the flight track that is shown here is that for which data are plotted on Plate 4; circles correspond to the hours marked on Plate 4.)
and low (high) aerosol scattering ratio. Vortex air is visible in the upper part of the figure as the deep region of low scattering ratios seen between about 1200 and 1700 UT, and again between about 1840 and 1930 UT, as the aircraft made a brief leg northward back under the vortex edge (see Plate 1). The feature around 425 K at 1330 UT, with elevated aerosol scattering ratios, occurred as the flight track almost exited the vortex at that time (cf. Plate 1).
A second flight, from Bangor to Moffett Field, California, took place 2 days later; the track for this event is superim- posed on the 450 K CAS results for 0000 UT on January 24 in Plate 3. This track penetrated much further into the vortex, crossing the outer ring of (originally) deep vortex air and going through the intrusion into the center of the western vortex over Baffin Bay, which the CAS results identify as a region occupied by air originally just inside the vortex edge. The track then turned west, back through the intrusion and the outer ring, and thence southwest to Moffett Field. Note the intersection near 60øN with the location of a filament of
vortex edge air in the CAS results. The lidar aerosol profile and isentropic surfaces above the
flight path for a portion of this flight are shown in Plate 4. The aerosol structure inside the western vortex now appears very different from that of Plate 2. After 2200 UT (the time of the first crossing of the vortex edge), the lidar data show a deep, clear region down to about 410 K, as was character- istic of that part of the vortex sampled 2 days earlier. A little further in (at about 2245 UT), however, the path encounters a region of enhanced aerosol all the way up to about the 500 K surface. The upper boundary of this region descends as
the track progresses further into the vortex but even at the deepest penetration around 0000 UT on January 24 was still no lower than about 435 K, which is significantly higher than in the vortex on January 22. From 0000 to 0200 UT, the picture on the exit from the vortex was very much like a mirror image of that seen on the inbound leg in the previous 2 hours. At 0200 UT, the data show a deep, aerosol-rich region as the path exited the vortex. This region was characteristic of the extravortex air except for the clearly visible region of aerosol-poor air between about 420 and 480 K above the aircraft from 0230 to 0300 UT.
The aerosol data appear to indicate the intrusion of aerosol-rich air into the western vortex up to the 500 K isentropic surface, and in fact the entire scenario described by Plate 4 is consistent with the CAS results of Plate 3. This is demonstrated in the lower part of Plate 4, which shows the structure from the 425,450, and 475 K CAS calculations for 0000 UT on January 24. There is remarkable correspondence with the aerosol data. The deep clear regions around 2215 UT on January 23 and 0145 UT on January 24 are coincident (to within about 50 km) with the ring of "deep vortex" air around the western vortex. The intrusion, which intersects the flight path at about 2240 UT on January 23 and 0050 UT on January 24 according to the CAS results, corresponds (to within the same error) to the aerosol-rich regions at 450 K. According to the 450 K CAS results, the interior of the western vortex is composed of air from near the original vortex edge, which is consistent with the lidar data showing the aerosol boundary to be close to 450 K in this region.
The aerosol-poor feature seen by the lidar just outside the

PLUMB ET AL.: INTRUSIONS INTO THE ARCTIC VORTEX 1097
475 /L__._J
'•'[ .......... • ..... ••, 425K ..
.... • , ß 'r , , .... , , • .,.. • , • •..•, ß ,. ß., , ; ;., : , ,22 23 24 25 26
Time (hr UTC)
Plate 4. Cross sections of the vortex above the DC-8 flight track on January 23-24, 1992. (top) Aerosol scattering ratio measured from the DC-8 lidar as a function of time, with the altitudes of the 400 K (dashed curve, bottom), 425 K, 450 K, 475 K (solid curve), and 500 K (dashed curve, top) isentropes superimposed. (bottom) Vortex structure at 425,450, and 475 K as determined from the CAS integrations at 0000 UT on January 24. Plotted for each material contour are the values of potential vorticity associated with each at the start of the calculation. Thus high values correspond to vortex air, and low values correspond to extravortex air.
vortex edge at 0230-0300 UT is also of considerable interest. The feature is in fact an almost-horizontal layer of air that had been ejected from the vortex. As Plate 4 shows, at 450 K this layer corresponds very closely to the filament seen in the CAS results which the flight path intersected near 60øN. The feature has a vertical thickness of less than 1 km, a vertical extent of about 4 km, and a horizontal extent of about 300 km. Note that although the CAS integrations located the filament very well, they failed to reproduce the observed tilt of the feature.
We also note here that the intrusion of aerosol-rich air into
high latitudes was observed by balloon-borne backscatter- sondes and reported by Rosen et al. [1992]. In particular, they showed a sudden increase in backscatter ratio between about 15 and 20 km altitude at Alert, Northwest Territories, Canada, during the period January 18-21, at which time the lower stratospheric vortex was over Alert. As shown in Plate 1, however, the intrusion passed over Alert, and the air being sampled was indeed from outside the vortex.
3. Other Events
3.1. Mid-December
The evolution of potential vorticity on the 450 K surface from NMC analyses for December 6-16 is shown in Figure 5. On December 8, the vortex is very distorted, with two well-defined centers, one over Baffin Island and the other over northern Russia near 100øE. A ridge pushes into the vortex north of Scandinavia. As in the January event de- scribed above, this ridge is the upward extension of a tropospheric block over NW Europe; in fact, the vortex structure is similar to that on January 22. The general pattern, however, is more mobile than in January. By December 10, the ridge has progressed about 60øE, and some of the vortex air in the center originally over Europe has apparently been ejected from the vortex. This analysis gives a hint of intrusion of air deep into the vortex at high latitudes near 80øE (arrow on Figure 5). The pattern continues to rotate eastward through December 12, with hints of an intrusion still present. By December 14-16, however, much

1098 PLUMB ET AL.: INTRUSIONS INTO THE ARCTIC VORTEX
911206 911208
911210
Figure 5. Ertel potential vorticity on the 450 K isentropic surface at 1200 UT for several days in the period December 6-16, 1991, from NMC analyses. Contours as for Figure 1.
of this structure has disappeared, the analyses showing an almost-circular vortex with no remarkable internal or edge features.
Results from a 450 K CAS integration, initialized with the NMC potential vorticity contours from December 6, are shown in Figure 6. As for the January event, the evolution of the main features of these material contours agrees very well with the NMC analyses, but additional fine-scale structure
which portrays a different picture of the vortex behavior is evident. On December 8, the vortex center over Bagin Island appears to be rolling up both midlatitude air from the ridge and, outside that, vortex air from the center over Russia in a manner very similar to that seen in January (the main difference being the larger size of the western vortex center in the December case). The capture of the eastern center is almost complete by December 14 except for a small

PLUMB ET AL.: INTRUSIONS INTO THE ARCTIC VORTEX 1099
..... .•? ..... •?..'.. •"!... "--::;•il ......
... '•; .
.... ,•: •ii!,•'.• •.•....'• ........ ... ..•••.. ,•, .•.,.. .. •?•....•....• .., .... ,,•:. : :•/ • .:.: . .•<:.,x..:. :. :•?;• ,• ....... ...-. ,,.,., ... / -'<•,,? ....... .: •:::::.:iii::,,:,::. =========================== .... ::•':':•':<:'? ::....:
..... ß .0..: •,. ...... :. ..:-:..•-. ,,.•,• ..... .. ,:., .. ........ I ':'?• ':•' i::. : ::- -'<e !" =============================== ':':?'::'::i ..... ..................... i': ...... '•S.::-'.":'%. :, '"?:'-?•"'""-":'?:--•:"•.' ..... :':':.•-.-"• .... I- .............. ::---::::::::::::::::::::::::::::::::::::::::::::::::::
911a14 911a16
Figure 6. Like Figure 3 but for the period December 6-16, 1991.
ejection into midlatitudes. Intruded air has by this stage been wrapped halfway around the vortex. As in the NMC analy- sis, the planetary-scale distortions of the vortex subside at this time, but unlike the NMC picture, the CAS results after December 14 show a vortex that has been subjected to substantial internal rearrangement, including the intruded air.
3.2. Mid-February
A third event, in many ways similar to the other two but more violent, occurred in mid-February. NMC analyses are shown in Figure 7. On February 13 the vortex had a pronounced wave 2 pattern, and it actually developed two distinct centers by February 16, with marked ridging near 0 ø

1100 PLUMB ET AL.: INTRUSIONS INTO THE ARCTIC VORTEX
920216
-....... i'•i'i '•i:111'i '.ill..i; :! ':': '[il [.• '•.';:•:! iliaill ii' • ..................... •L..?•L t_ • ::• ___•'l::•l:•.• ...... ':u•_• .....
92•
Figure 7. Like Figure 5 but for the period February 13-28, 1992.
and 180 ø longitude. This structure appeared to collapse by February 22. There is little evidence of any unusual behavior in these analyses except for hints of internal features near the pole on February 19 and 28 and of ejection of vortex air over eastern Siberia on February 25.
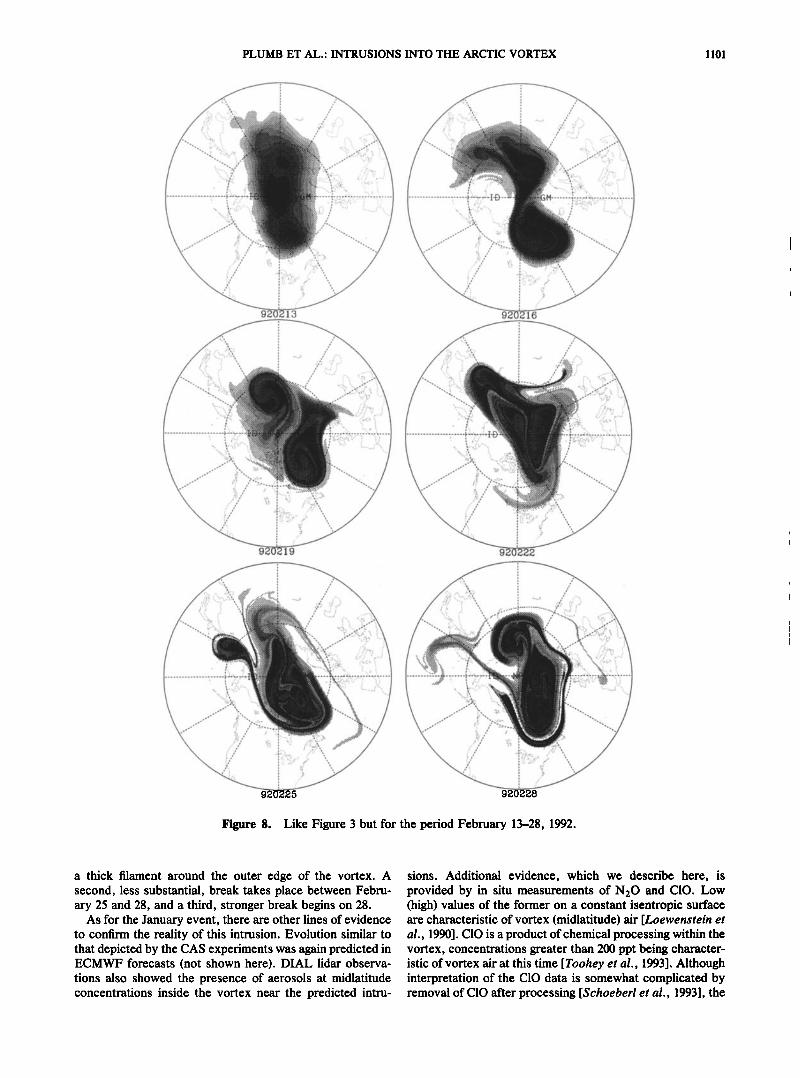
The CAS results for this period (Figure 8) suggest that the reason for the collapse of the wave 2 activity after February 16 was that the vortex actually broke apart, though the two almost equal parts never separated very far and soon merged
back into a single entity. This is evident on February 19, when the two parts are separated by a belt of intruded air. Following merger, the interior structure of the vortex is very convoluted by February 22 and becomes 'more so with time (note the rich interior structure on February 25 and 28). In addition, a large breaking event begins over eastern Asia after February 22: by February 25 a large vortex fragment has been almost cut off, in excellent agreement with the NMC analysis. Subsequently, this fragment is sheared out as
PLUMB ET AL.: INTRUSIONS INTO THE ARCTIC VORTEX 1101
Figure 8. Like Figure 3 but for the period February 13-28, 1992.
a thick filament around the outer edge of the vortex. A second, less substantial, break takes place between Febru- ary 25 and 28, and a third, stronger break begins on 28.
As for the January event, there are other lines of evidence to confirm the reality of this intrusion. Evolution similar to that depicted by the CAS experiments was again predicted in ECMWF forecasts (not shown here). DIAL lidar observa- tions also showed the presence of aerosols at midlatitude concentrations inside the vortex near the predicted intru-
sions. Additional evidence, which we describe here, is provided by in situ measurements of N•_O and C10. Low (high) values of the former on a constant isentropic surface are characteristic of vortex (midlatitude) air [Loe•venstein et al., 1990]. C10 is a product of chemical processing within the vortex, concentrations greater than 200 ppt being character- istic of vortex air at this time [Toohey et al., 1993]. Although interpretation of the C10 data is somewhat complicated by removal of C10 after processing [Schoeberl et al., 1993], the

1102 PLUMB ET AL.: INTRUSIONS INTO THE ARCTIC VORTEX
Figure 9. Vortex structure on the 450 K isentropic surface on February 17, 1992, from the CAS integration of Figure 8. The northbound leg of the ER-2 flight track is also shown.
critical features of interest here are evident in both species, and so classification of vortex/nonvortex air on this basis
seems secure.
The ER-2 flew near to the center of the main vortex on
February 17. The flight track is superimposed on the 450 K CAS results for this date in Figure 9; note the intrusion wrapped right around the main part of the vortex such that the flight track crosses it twice. This is evident from the 450 K CAS profile along the northbound flight leg, shown in Figure 10, one intrusion being just inside the vortex edge and
920217
450 •
400[, , , b8øø ••, 400
PT
ClO
c
100 N20 170,
i / , , ,
e 320 PV 240
•0 '5'5 •0 time
Figure 10. Time series along the northbound leg of the ER-2 flight of •b•ary 17, 1992 (time in kilos•conds UTC). •1ots are (a) potential temperature (•); (•) C10 mixing ratio (ppt by volume); (c) N20 mixing ratio (inverted; ppb by volume); (•) distdbution of the material cornours from (solid curve) th• 450 • CAS integration started on •eb•ary 13 and (dashed curve) the 450 • potentia] voRicity profile from the N•C analysis; and (•) lik• •igur• 10• but from a CAS calculation started 5 days earlier.
• lO
• 100
1ooo
1
• lOO
•',,•',,,,,,,,,,, , ,,,,,,,,;,x,\•'x••//I •"••
II]1,,,,,,,,,,,,, ,' ,,.', :,'. •.•:• •///',,,,,,,,,,, ' "..'•: ',; ',•".';• _-%.'X• I f/l/// r IllIll ' I I '. ' I ,., I •' \\\ \ '///,',,,,;•,, '•',•; -.L'•,'•,•,x,\\ll////.
r•.,, • x" . / ///////,• ..•x,.Nxxx _ / • x / , , • x - //./g.'////,.-•.-"•j•Xx x '' I • \ x..% •o0 • '• • •x -" ,•'//,'/////••x'xOxx_/ , \ , !, '- ..',,/11111 •'•x\\\b; .' ',"...",'• I I/\\• •' ))///\"' ,' : \ ', ,' ', \\\x._•J/13 '---' •
, , ','--T ..x,••/l , /-:-. o.-:--- -180 -90 0 90 180
(½) 9202•{5 • 27. 2; - <Z• (m)
....... . , , ..... ,'•,,, ,--:-, -,. ,
, ,.: _..., '"' ,, tllll I t II/ , \\ 'i N•,\ %\\\ % / ,,,,,,.,,,,,,,., .,,.,,,',,. •,,.,,, • / I I IlL'It",,,, / , ",,•'/ ,•. x.'_ , .' ,• •\\\\x\x•"x
:-----/////711/.""," '",'.'// ',,;,,',,--- ,' •////•.'.',,,. '.',,,:// ..',,\,,, ,-•.•A, ',,: ,\'•,ct•",q
/ t ,.... __ .. loOo X,,, •-o..:% -,, . • ....
-180 -90 0 90 180 LONOITUDE
Figure 11. Geopotential height (m) at 65øN, with zonal mean subtracted at each height. Data are from NMC analy- ses at 1200 UT on (top) December 8, 1991, (middle) January 20, 1992, and (bottom)February 16, 1992.
a second well inside. Note that these features are not evident
in the profile of NMC PV. Qualitatively, the same features are evident in the profiles of N20 and C10. (Associated with the intrusion are features in potential temperature 0 along the flight path (G. Morris, private communication, 1993). While the variation of N20 with 0 itself gives an N20 signal in the aircraft time series that is independent of horizontal trans- port, this is negligible for the first peak (in the negative of N20) and relatively small, though not insignificant, for the second.) Both traces show two strong peaks of CIO and the negative of N20 (note that the N20 scale is inverted on the figure), with two marked minima. The correspondence be- tween the two indicators leads us to associate the peaks (troughs) with vortex (extravortex) air. Thus these data appear to confirm the two crossings of an intrusion, in qualitative agreement with the CAS results. There is, how-

PLUMB ET AL.: INTRUSIONS INTO THE ARCTIC VORTEX 1103
ever, some discrepancy in the location of these features. This apparent error in the C AS results could be due to several factors, including errors in the analyzed winds and in the initial conditions (i.e., the PV analyses) used in the calculations. As an indication of the variability in CAS integrations initialized at different times, results for a calcu- lation started 5 days earlier are also shown in Figure 10 (bottom trace); this shows more fine-scale structure and slightly different locations of the intrusions, but otherwise the features are similar.
4. Discussion
4.1. Dynamics of the Intrusions
The meteorology of the three events (compare Figures 3, 6, and 8) shows many similarities, the most obvious of which is the strong ridging near the Greenwich meridian. Figure 11 shows longitude-height cross sections of geopotential height (minus its zonal mean) along 65øN in the early stages of these events. The upper stratosphere is dominated by the Aleutian anticyclone, evident as the zonal wavenumber 1 disturbance which, especially in the December and February cases, shows its characteristic westward tilt with height. In each case, however, there is an anticyclonic feature near 0 ø longitude in the troposphere which extends up to 10 mbar, without significant phase shift. This tropospheric anticy- clone was a recurrent feature of this winter; it reached peak amplitude at these times and was much weaker or absent during the intervening periods. It is the corresponding strato- spheric feature, the upward extension of a tropospheric anticyclone, that is manifested as the strong ridge in this region and that thus produces the marked disturbance to the lower stratospheric vortex that seems to have been crucial to the subsequent intrusions.
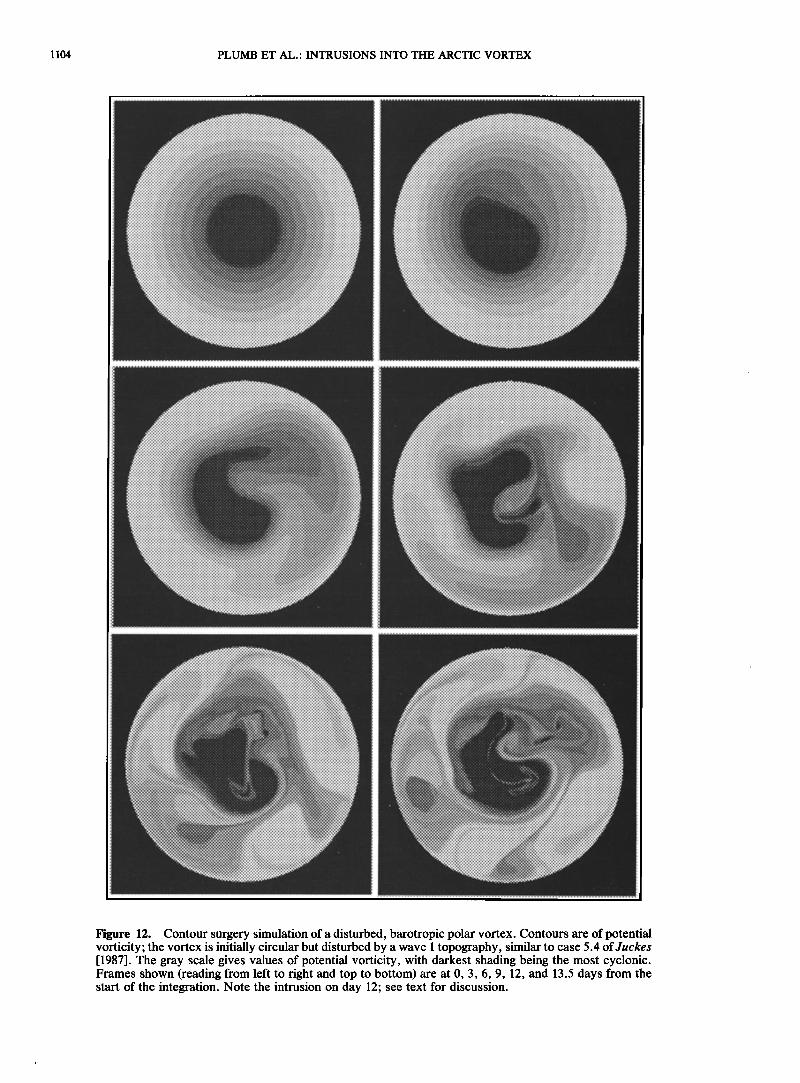
Juckes and Mcintyre [ 1987] and Polvani and Plumb [ 1992] have noted the strong asymmetry in wave breaking in their barotropic simulations of a disturbed vortex and attributed the uniquely outward breaking to the greater strain outside the vortex edge that is associated with jet curvature. Polvani and Plumb, in fact, found some examples of intrusion into the vortex but only during merger of two remnants of the vortex created during a major disruption. (Similar behavior is evident in a case shown by Juckes [1987].) Nakamura and Plumb [1993] found that weak breaking on an asymmetric jet is directed solely toward the nearer critical line but that breaking occurs both ways at sufficiently large amplitude. However, these distinctions are much more difficult to make in realistic, highly disturbed situations such as those de- scribed here than in simplified model flows. Some such features are nevertheless apparent in the events described here. The strong ridging noted above locally reverses the curvature of the jet, thus changing the local cross-jet sym- metry of the flow and perhaps favoring inward breaking in this region. More likely, however, these events may simply be so disturbed that the symmetry of the undisturbed vortex becomes meaningless. The high-resolution model results noted above may therefore give poor guidance. An example of the evolution of a vortex under a strong disturbance on the basis of a barotropic, hemispheric, contour surgery model [Waugh, 1993] is shown in Figure 12. This example uses the same approach and, in fact, topographic forcing very similar to that of Juckes and Mcintyre [1987] (its shape is slightly different, but its amplitude is the same), but the initial vortex
is weaker and becomes more disturbed. An almost identical
case was earlier shown by Juckes [1987], using a high- resolution pseudospectral model. The modeled vortex evo- lution shows many similarities with the three stratospheric events, most particularly the strong ridging followed by intrusion at day 12 of the integration.
The February event, while showing some of the same characteristics as the first two, appears even more disturbed. In fact, the CAS results indicate the vortex actually splitting on February 19 and then intrusion occurring during re- merger, somewhat like the example described by Polvani and Plumb [1992]. The splitting was transitory, and the two vortices were never separated by more than a thin filament of extravortex air. The NMC analyses, although showing the vortex developing two distinct centers at this time, do not show them separating, presumably because of inadequate resolution. Splitting of the polar vortex, especially during disturbed conditions in the Arctic, may be more common than analyses indicate, and in general the analyses may be giving an understated picture of the degree to which the polar vortices are disturbed.
4.2. Implications for Vortex Kinematics
One of the key questions about transport into the vortex concerns the quantity of extravortex air injected during these intrusions. In fact, it is ditficult to determine this with any precision because of ambiguity in defining the vortex edge during such disturbed conditions. The edge is sharp in many places but not continuously so, especially in regions of intrusion or extrusion. Moreover, when viewed at these high resolutions (either from these CAS results or from the high-resolution numerical simulations), the edge is fre- quently seen to have multiple structures in the form of filaments strung along the jet. On the basis of these integra- tions, therefore, it is ditficult to provide more than rough quantitative estimates. With this caveat, the vortex follow- ing each of these events appeared to include a few percent of intruded air, with perhaps as much as 5% for the January event. Over the course of the winter, therefore, the net intrusion of midlatitude air constitutes a modest fraction of
the vortex area, and it would be incorrect to conclude that the vortex is completely flushed by the intrusions. Never- theless, injection of midlatitude air into the chemically perturbed vortex might have been substantial enough to have a direct impact on vortex chemistry (apart from any indirect impact via temperature changes).
4.3. Other Years
We have concluded that the occurrence of these events
was a consequence of the large meteorological disturbances that influenced the lower stratospheric vortex during this winter. Nevertheless, the winter of 1991-1992 does not appear to have been unusually disturbed [Newman et al., 1993], and application of the CAS technique to NMC- analyzed winds in the lower stratosphere for other years suggests that the necessary conditions are not uncommon. Typically, we find between one and three intrusions occur- ring prior to vortex breakdown during northern winter. In each such event, the vortex was highly distorted in apparent association with a quasi-stationary tropospheric anticyclone.
We have also run similar calculations for the Antarctic
during September to December 1987, when (except for some possible very weak exceptions) no intrusion was seen until
1104 PLUMB ET AL.: INTRUSIONS INTO THE ARCTIC VORTEX
: =========================== ------------•'-"-'-'••' '" •'"•"'"'"'••:'"•-"•••'.:."i•'-'"-:-'::::':'::::::::::::: .... :::::':::::':::::::"--"'"•'••'• ............. : .......... -'-'-'•'"•"•':'. •, ß -'•••--'...:.:.-'..'i::::::::::::::::::::::: ß ..:.:.:.:.:.:.:.:.:.:.:.:.-.-.-.-.-.•.-.:••.:.•:.•..,.,• .......... •--•. •--c-...,.. --...;•..;..,:.:•::.:-.---..:.:.:.:.:.:.:.:.: .... :.:.:.:.:.:-.-.:.:.-.-..,:•..-....,....;..,.•:•-• ..:.:.:.:.:.:.:.:.:.:.:.:.: ..... :,.,.•..-:.•,.-•-...,:•-..,...:.,. -•:.-.:..-:.:•.:.:..-.:.:.:.:.:.:.:.:.. : =========================....`.`.•``.g`•:•.•....;i.::..:::::..::::::.::::.•*...•. .•"- -'-'. ß • ...':••..'.-"...-'..'•i:i.'.-':i:i:i:i:i:i.'.-':i:i::.. .:i:i:!:i:i:i:i:i:.:"'- :-'•.:'.'• ..::::i:i:i:i:i:iE:i:i:i:i:i:i:i::.' ......... -"" ' "•'""•:••:•••'.-'."!.:.:•i:::::::::::::::::::-':-"- ß .-:-:-:-.-:-:-:-:-.-:-.-'.'--...-:-:-:-'•:_-:-_•_•o .v.-.v.v.v.v.-.v.v.v.. -•.,-:-:.:-___- ::-.---'•.-:-:-:.-.v.v.-.v.-.-.-. .v.v.-.-.-::.:'.-.'..::.'.-.::• .-.v.v.v.v...v.-.-.v.v.v.-ø_-•r'ø'-ø-.-----'•'•'•'••'••..-;:.:;.-..-.:.:.:.:.:.:.:.:.:.:.:.. : .i:i:i:i:i:i:i:i:i:i:i:..".............`:•./:•:`.:.::i:i:•:•:•:•:•:•.•:•:•.•:•:•:•:•:i:i:i:i::.•.•..•.`` •'-'••-'•- .:..--.-'.:•i:i:i:5:i:i:i:i:i:i:i:i. ..i:•:i:5:i:i:i:i:i-:. ::..-:::•:• ::i:i:!:!:•:i:•:•:i:i:i:•:i:i:i:i:i:i:i:!:i:i. '""•"' "•' '•'•'•"•'-'-•----'-••:••iiii:•:i:!:i:i:i:i:i:i:: ß .:,:.:.:.:,:.:,:,.-,:,:,-e;.,,--:-•,,--,,,,_-•_;,_•?•, ::.:,..,:.:.:.:.:.:...:.:.:.:...:.:.:.:.:.:.:.:.;.:... o•,. ,•. •,•;•::- -,-,,,-,,•:.:,:,:.:.:,:,:,:.:.:.:. -:-:-:-:,:-:-:-:-:-:4•;:-_-•' :-:-:-:-:,:-:-:-:-:-:-:-:-:-:.:.:.:,:4,:-:,:-:-: '"•,'--, ,,•- •,•';";"•-•;"•"_ ,,-•,':-,',-,',•:.,:,:,:,:.:-:,:-:.:,:-:.:
ß :-:-:-:-:-:-:-:.:-:-:-;-.'-.'..•..'....-.'•;$•.•_•. -:-:-:-:-:-'..: :.:-:.:.:.:.:-'.:-:.:.:-:-:.:-'.:.:-'.:-:-:.:.:-:-: •. '•;'-•_ ..•.-?:.:-:.:-:-:.:-:-:-:-:- -:-:.:-:-:-:.:-:-:-:-•-.%'o:-.'• :-:.:.:-:-:.:.'.:.:.:-:-:.:.:.:-:-:.:.:.:.:.:.:.:.:.:-:-:.:-:-.'-øoøo'-..'-....'-.':--_ .'-;;-'.-:-:-'.-:-:-:-:-:.:-:.:.:-:.:.:.: : ================================= •:-:::::::::::::: ::: ::::::::::::::::::::::::::::::::::::::::::::::: ß :::::::::::::::::::::::::::::::: :::::::::::::::::::::::::::::: ::::::::::::::::::::::::::::::::::::::::::::::::::::::::::::::::::::::::::::::::::::::::::::::::::::::: ß ::::::::::::::::::::::::::::::::: ::::::: ::::::::::¾ :::.::: :.: :.:::::..: :. :.:: :. :: :. :: :: :: ..:: :::.:. 'e•'-'•--'..-'.'.....::•.. :•_. _.-..'•i::i:.:. :::::::::.:.:::.:: :::::::::::::::::::::::::::: ..:::: ::.:. :.:¾:: :::::::::: ::::: :: :::::: :.:•:: :::: ::::::: ::: ::..... '•-:--'.. ß -:•:......-'••_ :.•5'•::::...:::.:.:.:.:::.:.:.:. : :.;.;.:.::;.:.:;:.;.;.-ø.•;•;.•:•$ • -.:.:.:.:.:.'...:.:.:. :.:.:.'.:.:.:. :. :.:.:.'. :... :.:.:.:.:.;.: ",•,',-•-•.'.-.;q..-.;.:.:.;.;..-.:.- ;.:.:.:.:.•:::;:;:;::.-?..-,-:•:,•:• ':.:::.:.:........:.:.:.:.:.:.:.:...:...:.:.:.:...:.....::.-: ß .:.:.:.:.:.:.:.:.........................`..:.••.``•.:.:.:.:.:.:.:.:.•.:.:.:.:.:.:.:.:.:.:.:.:::.:.:.:.:.:.:.. •.'. ,.-"•.-...-..-.:..-.:.:.-..:.:.:.:.:.:.:.: .:.:.:.:.:.:.:.:.:......•-':.'•..':• :.:.:.:.:.::.:::.:.:.:.:.:.============================ .... :::::::::::::::::::::::::::::::::::::: ' .:•:•:•:.:...:.:...:.:...•.•.•..:•:•.::.`..•::`•..:.:.:.:.:.:.:.:.:.:.:...:...:.:.:•:.:.:.:.:.:• "•¾, ::':......:'_ ß .'-•- -•:::':i:':':':':':':':':':':': ":':'":'::'":':':":':':-':--•. . .- :' :•:.%• ':':':"'-:' '"'"'"""'"'""'"'"'":':' "½•'"•'-" '•' :'•-•"-':-':':':':':':':':':':':':':" ß .-.-.:-.-:-....:-...-:;;'-..:-'...-:-•..•$,?...........-.............-...-.......-.-.-.-.- ø.% :•-•:. -.....'_ .::¾::;;.-.v...v...-.-.-. .-.-:-.-.-:-:-:-:.:-:-:-:-:-:-:-:-:-:-:-•¾ :-:-:-..:-:-:-. :.:.:..:...-:.:-:.:-:' o.-..:-:-._ '-.•:' •:-:-:-:-:.:-:-:-:-.'.:.:.:.:.:.:.:.:.:.' : :::::::::::::::::::::::::::::::::::::::::::: ======================================================================= :::::::::::':':':::::::':'::: :."..:.:..'":::::•:•_.":':':':':':':':':':':':':':':'":-.-, •'•'"'---- :':- - -:' ;:•;:':':':':':':':':':':':':':':':"
: ============================================== "•" '-'-'-•'"-- "•:'-'••:-•:.•,:•!::::i:::: .... ::i:i:i:i:i:i•:i•:i:!:i::.:i:!:i:i:.:::.::.:i:.:E:.::i::.:i:i:i•:.::i:i:!:i:i:.::i:i:i:i:.::.:::.:i:i:i:i:.:::.. : ===================================================== "" "'"' '"'"•'' ' •'"" • ••' '' •••:•.-'-•:•i.:.:':'"':'- ..:.:•:.:.:.:.:.:.:.:•:.:•:•:•:.:.:.:.:.:.:.:•:.:.:•:.:.:.:.:•:.:.:.:.:.:.:.:.:.:.:.:.:.:•:.:•:.:•:.:.:.:.:.:.:.:.:.. ß =============================================================== '•' '•"•' "-•-•. •_ _ :":;:._-':':•:-:':-: .... :-:-:-:-:':':':-:-:-:-:-:-:-:-:-:':-:-:':-:-:-:-:-:':.:-:.:-'-:- .... •'-'e... ß -. •:•.-:.-:•.:.-:•::-:-:-.'-:-:-:.:-:.:: : :.:.:.:.:.:.:.:.:.:.:.:.:.:.:.:.:.:.:..'-';;;. -'.... •:•:.•-,:•,,•:•,'• . ::.:.:.:.:.:..:... ,•,-.•. -•;-•_'_ :. :_::_:_::_::::::.. ======================================================= -............:,•$........•:•...•,:.:... •..• ...... ;..••...•...::!:.:.:.:.:.::::::. ß ..:.:.:.:.:.:.:.:.:.:.:.:.:.:.:.:-.....- -.--.-•...,....-•;:•-•,,• ...::.:.:.:.:.:.:.:.:.:.:.:.:.:...---..--•:. •....;._ _ --..:;.•-:•.:.:.:. ..:.:....:.:•:.:.:•:•:.:.:•:.:.:•:.:.:.:.:.:.:.:.:.:.:.:.:.::::•..•:.•:•:.:•:•:•.`•:.... •:•:•o•......:_ _ .•:-:•?..:.:.:.:.:....: ; ..:.:.;.;.:.:..'.;..'.;.;.:;-:.-.....•. ,-,,•;•;?-•-,•,•........-.;.-.-.v.;.;.-.-.-.-.-.-.;.:.:.-.-.-.-.. •?,,,-•o-•O•,..-.-.-. .-.-.-.-.-.-.-.:'.'.'-.'.-:.::-.:-.-.:-.-.:..::-;qoø ø .-.v.-.v.-.....-.- : ===================================================================================================================== -::i:i:.::i:i:i:i:!::':?":- - ::::.-....:•::':.::•:.:;:::::...;::.;:.;:•'.:•-::i:i:!:!:!:?i:i:i:i:i:i:' •'•' •"•'•- - '---:;:,,. ß .•. ß --'•-•;-.•.;ii:.':::::::::::::::::.'; : =========================================================================================================== •,•,•:-.:::.-::. ::::::::::::::::::::::::::::::::::::::::::::::::::::::::::::::::::::::::::::::: ß .......:.....:,...:.,_..',•-',,•,,'•_,ooo ....•...................:................................:...:.:.......:: g_•_•_,,-o;,;,;:.... ...........:.:.:.:.:..-..-,.-•;_•,•.'• ß .......:...:.:......................:.:.:.:. ß ;•;•;•:•;•;.;•;•;..`..•;.•..;•.•:.:.•...................•.•.•.•.•.:•.:•:•:•:.:.;•:`:•:•:•:•:•:q•;•;•; •, e,,_,-_ %,•_o,,•..:;.;.; . .:.:.;....:.:.:.;.::....-•..-•;,-_'•,• .-.-.-......v.......-..:.................. :..-...-.- : =========================================================================================================== •---' •*-•.•..•_ _ _ _ :'•!i!i.':. :::::::::::::::::::::::: :::::::::::::::::::::::::::::::::::::::::::::::::::::::::::::::: ::::::::::::::::::::::::::::::::::::: ! ::.::!:i:i:i:i:i:!:'-.-':-:..'.::'......:......-'-..•Si•e-i:i:::!:i:i:::!:i:i:i:!:i:i:i:' ' ' "'"' ''"'" '"'"" '"'•:'" ":•••"•!iii:::-':: ============================================= ..... i:i:! .... i.i::: ...... ::::::::::::::::::::::::::::::::::::::::::::::::::::::::::::: ß .-.-.-.-:.-.-.-.-.-:-:-.-:•.•::':• -.-...- ...... .. --.-.- •;•.•s • .•:•,,.,•:,-:•:! •,. '-',;,:•'•:• ,,_•.••:;:•:;:;:-:-. .:-:-:.:.:.:.:.:.:.:-:.:-:-:-:•:•'.'-...'...-....'.-......'.:...'...: :.....'.- -.-.-.- .'.-•:.-.;-.-.-.-.;-.-.-.-.-.;-.-.-;.-.-. ß .-:-:-:-:.:-:-:-:.:-:-:-:-:::::::::: :-: ........................ :.:-.'•,•'--'•..•...":'• ........ •'•-'--' •"'" • '"" ' •"'' •;'••... •••':.".-'ii:-.'.:- ............. : .......... :.':':':-": ................................. ::.'-.:'""•'::-:-:-:-•_•:•':':-:-:-:-:-:-:-:-:-:-:-:-:-:-:':-:-:' : :::::::::::::::::::::::::::::::::::::::::::::::::::::::::::::::::::::::::::::::::::: '-'-•"•'•', •:---- •,.....::. :_ _ - :•::$.•,•,'•'•'•:...•.•, ::::- -:.•:::::':': : ':':':':':':':':':':':':':':':':::::.• ":::' :- :'.' :': ' :' :' :': '.' :':;.•:i::. :-:':':-:-: ';;•, ,•:.:;.•i;:::::::::::::::::::::::::::: ::::- ............... •!• ........................... •- - - - - -- - -- •--• -o- • -o-o--• • •o•o••• ,*•,i, ,-•,-;-,•;,.-o.... . -.-o-.-.,.-.-.:-,:-,.oOoOo.o.o,;;-•, ...........................•.x,•,-.•s•-... ß ..-.-. ß -... : -:-:-:-:-:-:-:-:-:-:.:.:-:-:-:e•:•,-:-:.:.:.:.:-:.:-:.:.:.:.:.:-: :.:.:.:.:.:.:.:.:.:->:.. '-'------ -" - -" '-'""-'-", .•'•••,-'•'•••-..'•.•::-.'. . :-:.:-:-:-:-:.:-:-:-:.:-:-:.:-:.:.:•'-:,: '.:.:.:.:-:.: :.:.:.:.:.:.x•:•:.:.:...:-:-::.•.:..-'-,,'•-;•:;•_ _ _ _ .•;•:•:•:.:.:.:.:.:.:.: , '.:.:.:..'.:.:.:.:.:..'.:.:..-..'::•$.•_ .:.:.:,:.:,:-:.:.:.:.:.:.:.:.:.:.:.:.:.:.:.:.:.:.:.:.:.: •o;..%....-...-...;- - •.-.•. --,•,•:,•.-..•,•,•,.-,•.-..:•.-.._.-•.' : :.:.:.:.;.;..-..-..-.:..-.:.:.;.:.:.::.-..•:.-:,• :.:.:.:.:.:.:.:.:.:.:.:.:.,•.•,..•.:.:.:.:.:.- . •:o.:... o-,•.-•o-.. e;o;o-.-;•.•:........:•.;..;•:;.:.;:.:....: : ::::::::::::::::::::::::::::::::::::::::::::::::::::::::::::::::::::::::::::::::::::::::: •'""-'-"-'-" -•"'"'•-•;:••_ _ ___•:'-_-.'-i.-"_-.--'::::. : =========================================================================================:•i:..i:!:.•. •-"-'-•'-' "'"-•"•:-•••___ _ .•i::' , ::;•.•.:.•.:.•..;.;•..:•..•;•.%•.........•.....................................•. ß .... --o---o-o-o•--o•.•o•:•;_•:•.-.-.-.- , ...:..-.....-.-.;..v.-.-.-:...-;;.-; -.....,.-...-.-......-.....-.-.~.-.-•-.-.-.;-.- •.• :-.;-. •ø•ø• ß -.:.:.:.:.:.:.:.:.:.:.:.:.:.:...:;:•:•.-.:.: ....... : ......... :..:...:.:.-.--...-.--.-.-.-.-.-...•.-... •........;.--- ;.;.;•..:; , .......;.:..;;.::.....;........:•:•: ..-.:.:.:...............,,.....,................;_.:$•:•_:........... , -.-.-;.-;.-.-.;v.-:.-:-.'-.-.%•-•?o ß -.-.-...-.-...-...-...............-.........-. ...... -'-'"ø•-- ß -•'-e-'--'•... •ø•.. •:- ';•::.-.'::-:- : :.:.:.:.:.:.:.:...:.;.:.:.:.:.:.:.:.;.::.• v....... :.:.:. :.:.:.:.:. :.:.:.:.:.:. :.:.v.- _• ,?•?•?•: .-.v.-.-.-.-.. : ================================================================================ ........... •' '..--., "•:'-"•..... ••:•••-•!•:i:-: : ::i::.::':iE:i:i:i:•-:!•:i:i:i:i:i:!•::'::'.: '::i:i :i: !:!:i:!:i? i:i:::i:i:! ? i.i:?: •.: 'i:i:.::i:i:i:i:i:::- :'"'•', "': ,,,•i.::::':.'. : ==================================================================== '"'""-'-'-' '•'•'' ' '' "•'"'- ß '••••."•."•i:::-'::: :' =============================================================================================== "":,-:•,,, .'•_ __ ,:-::i•f'
i ":':::'E::'E:i::'::':•:i:i:i::'::'::':i:•:iE:.::iEE::::. ':•:iEEEE:::'. :::.::•;i:!:i:i:EEE:? : -:: ..................................... •"' '••'-"•- - -':••••.-'!EE'-:' : ========================================================================= : .................... • -' ' '-'-'-'-'-'-' '-'-'•;••'..'•. -.'••.'.-:.-'.;!;.:-' i '""::":'::i!i!!ii!:.-.-'!!?:!!.-"..'ii!!E.:.-"ili?:si•.:.-:EE.:.-:?':" - ":'::"'""" '-""-'-"•'-'-'-'-•'"'"•:'"•' "•:-"'-'::'::
: f.::::::.::$:•..:::::::::::::::::::::::.::•`::.•`•::....:.:•:.:::.:.:....•.. ========================================== :::::::::::::::::::':':':':':':':':':' ---- -------•'--' '• •'•,•,•-" ••'•½•••:•:•.•-'•:i:':':':':'::
: ::::::::::::::::::::::::::::::::::::::::::::::::::::::::::::::::::: -'-: :.•:•::-:_-:::-:-:::::-:.:-:-:-:-:-:-:-:-.'-:-:- ::-:.:.:-:-:-:-:-:-:-:.:-:.:-:-:-;•-ø..-:-:-:.:.:-:.:..'-: :.'..•..x•;.:.:.:.:.:.:.:.:.: .'..?-.. •."_::':i:::::::::; ß :::::::::::::::::::::::::::::::::::::::::::::::::::::::::::::.•.:;•.:•i:!:i:::::!:..::....iiiii::..:.i•.:!i!i!i:. . ::::s:::::::•!•.:E::.:.:.:.:.:i•:•.•..........:.........•E`.•(`?.•:::::•........:. :-:...-....'.. '. . '. '-" .x2•:i:i::::i:•:.i::..•,•:':•$;•.:ii:i:i:!.:.
: ::.'e.::•:iE:i:i:i:i:i:i:iEf.::i:i:iE:i:!:i::::.:.:.::::?i:i:i:i:i: ":i:i:i:i::';"i•:.:i::':i:i:i:i:i:i:i:i:i:i:.::.:::':•:i:i:i: ;•:-::'::':'...'-.:•. •:i:i:i:i ::.::' /•'i:!:i:i:?i::-'.::::::.'-:::x . .r.:.::-:-::: .......... ,'" 8•:i':':': : ::•.5:i:!:.-'E•:i:i:i:i:i•:• :i:i:!E:i:: :::::::': .... : :i:::i:i•:"•.-.•__ -•.•'.._.';:•_:.:'•E:i:i:!:i:i:i:i:i:i:i:i:i:i.'.-':i:i' .:""•"•----'--'-.•.. :.'. _'.-:.:•::!:i:.-"i:i'.: :...' :':•'...':'...::i:i':::::::::: :.'f-.•' ' ,,•,:...-.'.:•:.':.-..¾":':'::':'•:. •:... :•;•ii:::: 5 :::::::::::::::::::::::::::::::::::::::::::::::::::::::::::::: ..... :::::::::::::::::::::::::::::::::::::::::::::::::::::::::::::::: : :..::::::...:.::.:::.:.::.::::::::::::::::::::.:::::::::::::::::::::::::::::::::::::::::::: :.-'•'-'-'-'-'-'-'-"' ' -••- ß '•• - -'•.•'•'•••.'.-•i:i:!:!: : :,:.:.::5::..-.:.-:.::.:.:.-.::5:..':5.'-..'555i::%•:•:•:•:•:•::::•: :::: ..... ?:5::•::::•:..-':%'.'-5:5:i:::::•i?.:.-.'-.-.:.-.::.::5:5.-..':5:5.-.::5:i:5 -:-::.-..•:•:•:'•:5:i:5:i::•-.:'.--::.'-:5:.-':.-':5:i:•:•:•:•:•:•:•:•:•?•:• ....... •:•:•.•:i:::i.: ..... :-?-: ............. •.-.---- .•.••... <•••....'.i!15:5:5:5
ß ........ ' '-'-'-'-----'---- •-.-.,. "-------:•..../•. :::•..-'•:::::::::::::::::::::::::::::::::::::::: :i:: :i: -'- "-'-' '" ' •-"••'-':•----••..:-..'.55..:.::.'::.':.--'.-::: ::.:.':.:.:'i:E:E:.::5:E:E:.'•:•-?'• .. •.._`...:•:'!::?5:!:i:i:i:::i::: .i. i ................... •'-'"-' "•- - - -- "':• ß '•-.'••:' .'. •:..::':i:i:i:i'!'i:::!:!:!:i.i:i:!:!:::!:!:!:i: --"' -'-'-'-"-"•••'-'-•;'•' '•••••':-i!i:' ':::::-• :::::::::::::::: •:..-•'-..-•:.:_. ::.:.::•-'::. ::::::::::::::::::::::::::::::::::::::::::::::::::::::::::::::::::::::::::::::::::::: ß :';';:,o,'o•o,%',',',-,',-,',',-.',',-,',',',øa,', ß '.'-'.'.'.'.'.'-'.'.'.'.'.'.' '•o•';','.':,•'"-•', ', •"a e•.,, •,• ,"' f_ __ _ ,•,', ,'•,','•:.",',' ß -,•-,• -.-.-.-.-o,-,•,'_ __-,'-_,'o•,o_-",-•;-;-;-;Ooo_. v.-..-:..-.-.-...........-.--ø,-aa,'.-.'ø_-.:-a::::,-,-,-,-.-.-.-:,,a,,
.............. •':':•':•.- .'-:. '.-."'-!:.::i• '":"":'"• -"' '•••:-•.':'.'•':i:i:i:i::'-.:::::::'"":"•'-- •'•_ :•i•':i::-':' '"'"' '"'"'""'"'"'•'• .... ==================================================== .... ...-..•..:....,..:. :_ _ _ _ _._-•:_::._.::.:._...., ,:,. :.. ;. :. ...... ;.....,,..¾. •.,_ :,..::•:.•::.... :. :..:: .:... :. :.;:-.... :•.:,:.:.:•.:.: .: .:. . ............ .......•............•, .,..........••....,,•,:_••......:•.....: .: .:: .:,:,: .: .:.: ..: .:: .:. :....... .... ... ....
........ ================================================================== . ..:.:.:.:.:.:.:.:.:.:.:.:.:.:.:.:.:.:.:.:.:.:.::
Figure 12. Contour surgery simulation of a disturbed, barotropic polar vortex. Contours are of potential vorticity; the vortex is initially circular but disturbed by a wave 1 topography, similar to case 5.4 of Juckes [1987]. The gray scale gives values of potential vorticity, with darkest shading being the most cyclonic. Frames shown (reading from left to right and top to bottom) are at 0, 3, 6, 9, 12, and 13.5 days from the start of the integration. Note the intrusion on day 12; see text for discussion.
PLUMB ET AL.: INTRUSIONS INTO THE ARCTIC VORTEX 1105
the final warming in mid-December. Therefore we have no evidence that the kind of intrusions shown here occur in the
Antarctic vortex, although the situation in other years may be different, and we have less confidence in the balanced wind analyses for the southern hemisphere.
Acknowledgments. Work at MIT has been supported by NASA through grant NAGW-1727 and by the National Science Foundation through grant 9218841. Some of the computations were performed at the Pittsburgh Supercomputing Center. The CAS code was devel- oped from a contour surgery code kindly provided to us by David Dritschel. The authors thank Darin Toohey and Linnea Availone for allowing us to use their CIO data, the members of the Lidar Applications Group at NASA Langley Research Center for their assistance in acquiring and analyzing the airborne lidar data pre- sented in this paper, and the entire AASE 2 team for their support during the course of the experiment.
References
Browell, E. V., Differential absorption lidar sensing of ozone, Proc. IEEE, 77, 419-432, 1989.
Browell, E. V., C. F. Butler, M. A. Fenn, W. B. Grant, S. Ismail, M. Schoeberl, O. B. Toon, M. Loewenstein, and J. R. Podolske, Ozone and aerosol changes observed during the 1991-92 Airborne Arctic Stratosphere Experiment, Science, 261, 1155-1158, 1993.
Carver, G. D., W. A. Norton, and J. A. Pyle, A case study in forecasting the stratospheric vortex during EASOE, Geophys. Res. Lett., in press, 1993.
Dritschel, D. G., Contour surgery: A topological reconnection scheme for extended integrations using contour dynamics, J. Comp. Phys., 77, 240-266, 1988.
Dritschel, D. G., Contour dynamics and contour surgery: Numerical algorithms for extended, high-resolution modeling of vortex dy- namics in two-dimensional, inviscid, incompressible flows, Comp. Phys. Rep., 10, 77-146, 1989.
Hartmann, D. L., L. E. Heidt, M. Loewenstein, J. R. Podolske, J. F. Vedder, W. L. Starr, and S. E. Strahan, Transport into the south polar vortex in early spring, J. Geophys. Res., 94, 16,779- 16,795, 1989a.
Hartmann, D. L., K. R. Chan, B. L. Gary, M. R. Schoeberl, P. A. Newman, R. L. Martin, M. Loewenstein, J. R. Podolske, and S. E. Strahan, Potential vorticity and mixing in the south polar vortex during spring, J. Geophys. Res., 94, 11,625-11,640, 1989b.
Juckes, M. N., Studies of stratospheric dynamics, Ph.D. thesis, Univ. of Cambridge, Cambridge, England, 1987.
Juckes, M. N., A shallow water model of the winter stratosphere, J. Atmos. Sci., 46, 2934-2954, 1989.
Juckes, M. N., and M. E. Mcintyre, A high-resolution, one-layer model of breaking planetary waves in the winter stratosphere, Nature, 328, 590-596, 1987.
Loewenstein, M., J. R. Podolske, K. R. Chan, and S. E. Strahan, N20 as a dynamical tracer in the Arctic vortex, Geophys. Res. Lett., 17, 477-480, 1990.
Mcintyre, M. E., On the Antarctic ozone hole, J. Atmos. Terr. Phys., 51, 29-43, 1989.
Mcintyre, M. E., and T. N. Palmer, Breaking planetary waves in the stratosphere, Nature, 305,593-600, 1983.
Nakamura, M., and R. A. Plumb, The effects of flow asymmetry on the direction of Rossby wave breaking, J. Atmos. Sci., in press, 1993.
Newman, P. A., L. R. Lait, M. R. Schoeberl, E. R. Nash, K. Kelly, D. Fahey, R. M. Nagatani, D. Toohey, L. Availone, and J.
Anderson, Stratospheric meteorological conditions in the Arctic polar vortex, 1991 to 1992, Science, 261, 1134-1136, 1993.
Norton, W., Breaking Rossby waves in a model stratosphere diagnosed by a vortex-following coordinate system and a tech- nique for advecting material contours, J. Atmos. Sci., in press, 1993.
Polvani, L. M., and R. A. Plumb, Rossby wave breaking, micro- breaking, filamentation and secondary vortex formation: The dynamics of a perturbed vortex, J. Atmos. Sci., 49,462-476, 1992.
Proffitt, M. H., K. K. Kelly, J. A. Powell, B. L. Gary, M. Loewenstein, J. R. Podolske, S. E. Strahan, and K. R. Chan, Evidence for diabatic cooling and poleward transport within and around the 1987 Antarctic ozone hole, J. Geophys. Res., 94, 16,797-16,813, 1989.
Proffitt, M. H., J. J. Margitan, K. K. Kelly, M. Loewenstein, J. R. Podolske, and K. R. Chan, Ozone loss in the Arctic polar vortex inferred from high-altitude aircraft measurements, Nature, 347, 31-36, 1990.
Rosen, J. M., N. T. Kjome, and H. Fast, Penetration of Mt. Pinatubo aerosols into the north polar vortex, Geophys. Res. Lett., 19, 1751-1754, 1992.
Schoeberl, M. R., L. R. Lait, P. A. Newman, and J. E. Rosenfield, The structure of the polar vortex, J. Geophys. Res., 97, 7859- 7882, 1992.
Schoeberl, M. R., et al., The evolution of CIO and NO along air parcel trajectories, Geophys. Res. Lett., 20, 2511-2514, 1993.
Simmons, A. J., Validation and development of the high-resolution semi-Lagrangian ECMWF forecast model, in Proceedings of 1992 ECMWF Seminar on Validation of Models Over Europe, vol. 1, pp. 153-181, Eur. Cent. for Med.-Range Weather Forecasts, Reading, England, 1993.
Toohey, D. W., L. M. Availone, L. R. Lait, P. A. Newman, M. R. Schoeberl, D. W. Fahey, E. L. Woodbridge, and J. G. Anderson, The seasonal evolution of reactive chlorine in the northern
hemisphere stratosphere, Science, 261, 1134-1136, 1993. Tuck, A. F., Synoptic and chemical evolution of the Antarctic
vortex in late winter and early spring, 1987, J. Geophys. Res., 94, 11,687-11,737, 1989.
Tuck, A. F., et al., Polar stratospheric cloud processed air and potential vorticity in the northern hemisphere lower stratosphere at midlatitudes during winter, J. Geophys. Res., 97, 7883-7904, 1992.
Waugh, D. W., Contour surgery simulations of a forced polar vortex, J. Atmos. Sci., 50, 714-730, 1993.
Waugh, D. W., and R. A. Plumb, Contour advection with surgery: A technique for investigating fine scale structure in tracer trans- port, J. Atmos. Sci., in press, 1993.
Waugh, D. W., et al., Transport out of the lower stratospheric Arctic vortex by Rossby wave breaking, J. Geophys. Res., this issue.
R. J. Atkinson, R. A. Plumb, and D. W. Waugh, Center for Meteorology and Physical Oceanography, Massachusetts Institute of Technology, 54-1726, Cambridge, MA 02139.
E. V. Browell, NASA Langley Research Center, Hampton, VA 23665-5225.
L. R. Lait, P. A. Newman, and M. R. Schoeberl, NASA Goddard Space Flight Center, Greenbelt, MD 20771.
M. Loewenstein, NASA Ames Research Center, Moffett Field, CA 94035.
A. J. Simmons, European Centre for Medium-Range Weather Forecasts, Reading, Berks RG2 9AX, England.
(Received April 19, 1993; revised August 25, 1993; received September 9, 1993.)