Seed Morphology and Taxonomic Relationships in Calochortus (Liliaceae)
Long-term temporal and spatial trends in phytoplankton biomass and class-level
taxonomic composition in the hydrologically variable Neuse–Pamlico estuarine
continuum, North Carolina, U.S.A.
Lexia M. Valdes-Weaver,1 Michael F. Piehler, James L. Pinckney,2 Karin E. Howe, Karen Rossignol,and Hans W. PaerlInstitute of Marine Sciences, University of North Carolina at Chapel Hill, 3431 Arendell Street, Morehead City,North Carolina 28557
Abstract
Phytoplankton diagnostic photopigments in near-surface waters (<0.5 m) were identified and quantified byhigh-performance liquid chromatography beginning in April 1994 in the Neuse River Estuary and in October1999 in the Pamlico Sound, North Carolina. Photopigment concentrations were analyzed using ChemTax todetermine the class-specific biomass of the dominant phytoplankton groups. Long-term annual and seasonaltrends in phytoplankton biomass and composition were characterized along the river–estuarine continuum andcompared to river flow rates, which were variable because of droughts, uncharacteristic seasonal rainfall patterns,and, since 1996, an increase in the frequency of tropical storms and hurricanes. We tested the hypothesis thattemporal and spatial patterns of phytoplankton biomass and composition were largely controlled by changes inriver flow rate through associated changes in salinity and residence time or through physical transport andadvection of phytoplankton classes with river flow along the estuary. Significant interannual, seasonal, andspatial variability in phytoplankton biomass and composition was observed and coincided with variability inriver flow rates. The five dominant phytoplankton classes (Chlorophyceae, Cryptophyceae, Cyanobacteria,Bacillariophyceae, and Dinophyceae) were physically displaced downstream during periods of elevated river flow.Dinoflagellates were reduced in abundance during high flow conditions, especially in the upper Neuse RiverEstuary. The abundance of cyanobacteria was also reduced throughout the system during elevated river flowconditions, although chlorophytes were more abundant. Changes in hydrology can be a useful indicator ofseasonal phytoplankton distribution and higher level compositional changes along hydrologic gradients in theseand similar systems.
Because of their small size, rapid nutrient uptake andgrowth rates, specific growth requirements, and suscepti-bility to grazing, phytoplankton are particularly responsiveto variations in environmental condition (Reynolds 1984;Stolte et al. 1994). This sensitivity, combined with theirability to rapidly proliferate in waters affected by anthro-pogenic (agricultural, urban, and industrial watershedactivities) and natural (droughts and elevated rainfallevents) disturbances, implies that phytoplankton can beuseful indicators of environmental change in freshwater,estuarine, and marine environments (Paerl 1988; Reynolds
et al. 1993; Richardson 1997). Deviations from typicalphytoplankton abundance and compositional patternsthrough time and space can thus be used to detect theoccurrence of ecological change in estuaries (Malone et al.1988; Harding 1994). In systems that have been eutrophicfor many years and continue to be affected by anthropo-genic and climatic perturbations, determining the normalcycles of phytoplankton abundance and composition fromwhich to detect these deviations proves to be difficult. Inaddition, in many estuarine systems, few data exist onphytoplankton community structure prior to these impacts.In order to distinguish between typical and uncharacteristictemporal and spatial phytoplankton cycles and thus tobe able to detect past, present, and future ecologicalchange, long-term, continuous information on phytoplank-ton community structure is necessary to develop a site-specific reference or baseline condition of phytoplanktoncommunity dynamics (Harding and Perry 1997).
Previously, phytoplankton biomass and compositiondata were acquired by microscopic analysis of watersamples. This technique proved to be time-consuming,analyst-specific, and prone to errors (Tester et al. 1995;Mackey et al. 1996). More recently, the use of high-performance liquid chromatography (HPLC) to identifyand quantify concentrations of phytoplankton diagnosticphotopigments (chlorophylls and carotenoids) and thesubsequent analysis of these photopigment concentrationsby mathematical computations (multiple linear regressionor steepest-descent algorithm using ChemTax), has become
1 Corresponding author ([email protected]).2 Department of Biological Sciences, University of South
Carolina, Columbia, South Carolina 29208.
AcknowledgmentsWe appreciate the technical assistance and input of past and
present laboratory technicians and students, especially Alan R.Joyner, Tom Gallo, Nathan S. Hall, Benjamin L. Peierls, RichardS. Weaver, and Pamela R. Wyrick.
Research discussed in this paper was partially supported by theNational Science Foundation (DEB 9815495 and OCE 9905723),the U.S. Department of Agriculture NRI Project 00-35101-9981,the U.S. EPA STAR Projects R82-5243-010, R83-0652, andR82867701, the NOAA/North Carolina Sea Grant Program R/MER-43, and the North Carolina Department of NaturalResources and Community Development/University of NorthCarolina Water Resources Research Institute (Neuse RiverEstuary Modeling and Monitoring Project, ModMon, and theFerry-based Water Quality Monitoring Program, FerryMon).
Limnol. Oceanogr., 51(3), 2006, 1410–1420
E 2006, by the American Society of Limnology and Oceanography, Inc.
1410
a quicker and more cost-effective alternative for determin-ing class-specific phytoplankton biomass (Mackey et al.1996; Pinckney et al. 1997; Paerl et al. 2003). The HPLC–ChemTax approach relies on the specificity of photopig-ments to major phytoplankton classes. However, somephotopigments are frequently present in more than onephytoplankton class, and variations in photopigment typeand concentration may occur depending on the physiolog-ical state of the phytoplankton (light and nutrient condi-tions). To account for these discrepancies, this techniquerelies on the use of photopigment/chlorophyll a (Chl a)ratios that are specific to phytoplankton cells in the area ofstudy, as well as on the routine verification of HPLC–ChemTax results with microscopy (Tester et al. 1995;Schluter et al. 2000; Lewitus et al. 2005). One disadvantageof the HPLC–ChemTax method is that it cannot determinespecies-specific biomass; only higher-level (division orclass) information on phytoplankton composition can bederived. Previous studies have suggested that these higherlevels of biological organization can sometimes prove to bebetter indicators of environmental condition and effectsthan species-specific data (Cottingham and Carpenter 1998;Pinckney et al. 2001). Furthermore, in estuarine systems,phytoplankton communities are frequently dominated byone or a few species during bloom events (Pinckney et al.2001). The composition of these blooms would therefore beadequately classified by the HPLC–ChemTax approach.
The primary objective of this study was to illustrate thelong-term temporal and spatial patterns of phytoplanktonbiomass and class-level composition in the Neuse RiverEstuary (NRE) and Pamlico Sound (PS). In particular, thestudy focused on the phytoplankton classes that dominateprimary production in the NRE-PS; Chlorophyceae(chlorophytes), Cryptophyceae (cryptophytes), Cyanobac-teria, Bacillariophyceae (diatoms), and Dinophyceae (dino-flagellates) (Mallin 1994; Tester et al. 1995). The availabil-ity of long-term data will allow us to estimate the patternsof phytoplankton communities in these dynamic systemsand thus provide a means to potentially detect short andlong-term estuarine ecological change in response to thecombined stresses of anthropogenic nutrient enrichment,droughts, and increased tropical storm and hurricanefrequency that have affected these systems. In addition,the continuous monitoring of phytoplankton can be used toevaluate the success of nutrient reduction efforts aimed atcontrolling unwanted symptoms of eutrophication (e.g.,nuisance blooms).
The secondary objective was to investigate whether theselong-term temporal and spatial patterns in phytoplanktonbiomass and class-level composition were largely a result ofchanges in river flow rates that have influenced the NRE-PS continuum through time. Specifically, we used theseobjectives to test the hypotheses that (1) changes in riverflow rates determined phytoplankton class composition asa result of changes in water residence time, salinity, andnutrient concentrations and (2) river flow physicallytransported or advected all phytoplankton classes alongthe estuary. The goal was to determine whether certainphytoplankton classes were more abundant during reducedriver flow rates that occurred during drought conditions
(long water residence time, increased salinity, and reducednutrient concentrations) whereas other classes were possi-bly more abundant during periods of increased river flowassociated with elevated rainfall events (reduced waterresidence times and salinity and increased nutrient con-centrations). In the Chesapeake Bay, for example, increasesin river flow rates have a strong influence on the abundanceand distribution of diatoms (Paerl et al. 2006). Increases ordecreases in river flow rates may be key determinants of theoccurrence, location, magnitude and composition ofphytoplankton blooms, because they are directly linked towater residence time, nutrient loading concentrations, andsalinity variations, factors known to affect phytoplanktongrowth rates, distribution, and succession (Harding 1994;Pinckney et al. 1999; Paerl et al. 2006).
The NRE-PS system is an ideal location for investigatingthe effects of hydrologic variability on the abundance,composition, and spatial distribution of phytoplanktoncommunities, because this microtidal lagoonal system hasexperienced large variations in freshwater inflow and waterresidence time caused by recurrent drought periods (1997,2000–2002) and an increased frequency of tropical stormsand hurricanes beginning in 1996. A total of sevenhurricanes have impacted coastal North Carolina withinthe past 8 yr (Paerl et al. 2001, 2006; Peierls et al. 2003).These large-scale natural perturbations have caused largedeviations in river flow, estuarine water residence time,salinity, and nutrient concentrations and loads, therebyaltering the ecological condition of these systems, andpotentially favoring opportunistic phytoplankton groupsthat exhibit optimal growth during these conditions (Paerlet al. 1995; Peierls et al. 2003; Christian et al. 2004).
Methods
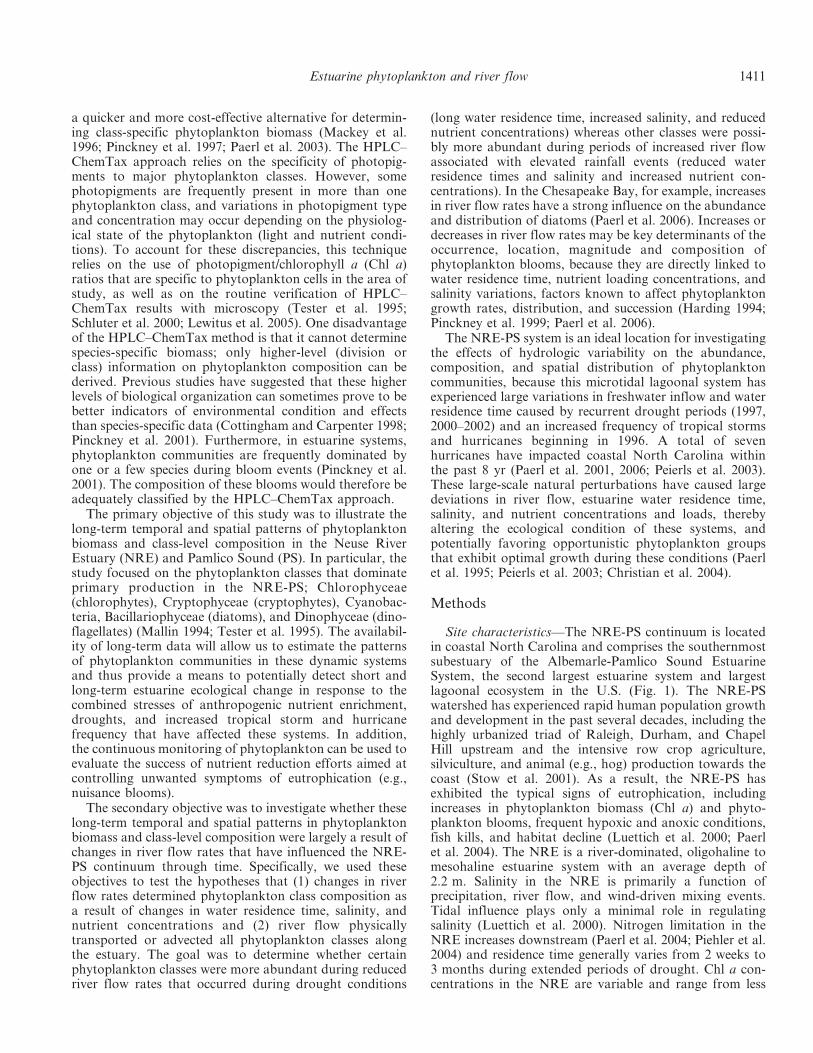
Site characteristics—The NRE-PS continuum is locatedin coastal North Carolina and comprises the southernmostsubestuary of the Albemarle-Pamlico Sound EstuarineSystem, the second largest estuarine system and largestlagoonal ecosystem in the U.S. (Fig. 1). The NRE-PSwatershed has experienced rapid human population growthand development in the past several decades, including thehighly urbanized triad of Raleigh, Durham, and ChapelHill upstream and the intensive row crop agriculture,silviculture, and animal (e.g., hog) production towards thecoast (Stow et al. 2001). As a result, the NRE-PS hasexhibited the typical signs of eutrophication, includingincreases in phytoplankton biomass (Chl a) and phyto-plankton blooms, frequent hypoxic and anoxic conditions,fish kills, and habitat decline (Luettich et al. 2000; Paerlet al. 2004). The NRE is a river-dominated, oligohaline tomesohaline estuarine system with an average depth of2.2 m. Salinity in the NRE is primarily a function ofprecipitation, river flow, and wind-driven mixing events.Tidal influence plays only a minimal role in regulatingsalinity (Luettich et al. 2000). Nitrogen limitation in theNRE increases downstream (Paerl et al. 2004; Piehler et al.2004) and residence time generally varies from 2 weeks to3 months during extended periods of drought. Chl a con-centrations in the NRE are variable and range from less
Estuarine phytoplankton and river flow 1411
than 1 mg L21 to greater than 100 mg L21, with an averageChl a concentration of approximately 14 mg L21 (Luettichet al. 2000; Paerl et al. 2004). The NRE flows into PS,a large (129 km long and up to 48 km wide) relativelyshallow (mean depth < 5 m) lagoon separated from theAtlantic Ocean by the Outer Banks barrier island system.Tidal mixing of PS with the Atlantic Ocean occurs throughfour small inlets (Pietrafesa et al. 1996). The salinity of PStypically ranges from 15 to near 30 (Paerl et al. 2001; Peierlset al. 2003). Because of the disparity between its large sizeand its limited access to the open ocean, residence times inthis system are long, averaging 11 months (Pietrafesa et al.1996). Its three major riverine tributaries (Neuse, Tar–Pamlico, and Chowan–Roanoke) serve as effective trapsfor dissolved and particulate nutrients and organic matter(Matson et al. 1983; Luettich et al. 2000; Clesceri 2003),rendering the open Sound a nutrient-deplete, oligotrophicto mesotrophic system, with a mean Chl a concentration ofapproximately 9 mg L21 (Paerl et al. 2001; Peierls et al.2003). Nitrogen limitation is generally more pronouncedand chronic in the PS than in the NRE. Deviations fromthese conditions have occurred during extended periods ofdrought and, since the mid-1990s, during flooding eventsassociated with an upsurge in the occurrence of Atlantictropical storms and hurricanes (Goldenberg et al. 2001)that have impacted the watersheds of the NRE-PS (Paerlet al 2001; Bales 2003; Peierls et al. 2003). In particular,a large pulse of nutrient-laden discharge resulted from thecategory 2 or greater hurricanes, Dennis, Floyd, and Irene,that affected the area during a 6-week period in fall 1999.This pulse led to a protracted period (at least 9 months) ofelevated primary production, with Chl a levels exceeding30 mg L21 in PS (Paerl et al. 2001; Peierls et al. 2003; Testeret al. 2003).
Water quality assessments—Because of the sensitivity ofthe NRE-PS to the combined effects of anthropogenic and
natural disturbances, several continuous water qualitymonitoring programs were initiated to detect estuarineecological change in response to these perturbations.Continuous long-term monitoring since 1994 has generateda comprehensive dataset for the NRE-PS that has beenused to establish baseline and change information for thisstudy. The Neuse River Bloom Project (Pinckney et al.1999), the Neuse River Modeling and Monitoring Project(ModMon) (Luettich et al. 2000; Paerl et al. 2004) and theAtlantic Coast Environmental Indicators ConsortiumProject-ACE-INC (www.aceinc.org) (Paerl et al. 2006)were used as data sources.
Water samples were collected at a depth of approxi-mately 0.5 m from fixed stations located within the NRE-PS and analyzed for primary productivity and nutrient, Chla, and diagnostic photopigment concentrations. Ambientphysical and chemical conditions (salinity, temperature,conductivity, dissolved oxygen concentrations, pH, andphotosynthetically active radiation levels) were also assessedat each sampling site. To assess the long-term temporal andspatial patterns of phytoplankton community structure,only data pertaining to phytoplankton photopigmentswere analyzed in this study.
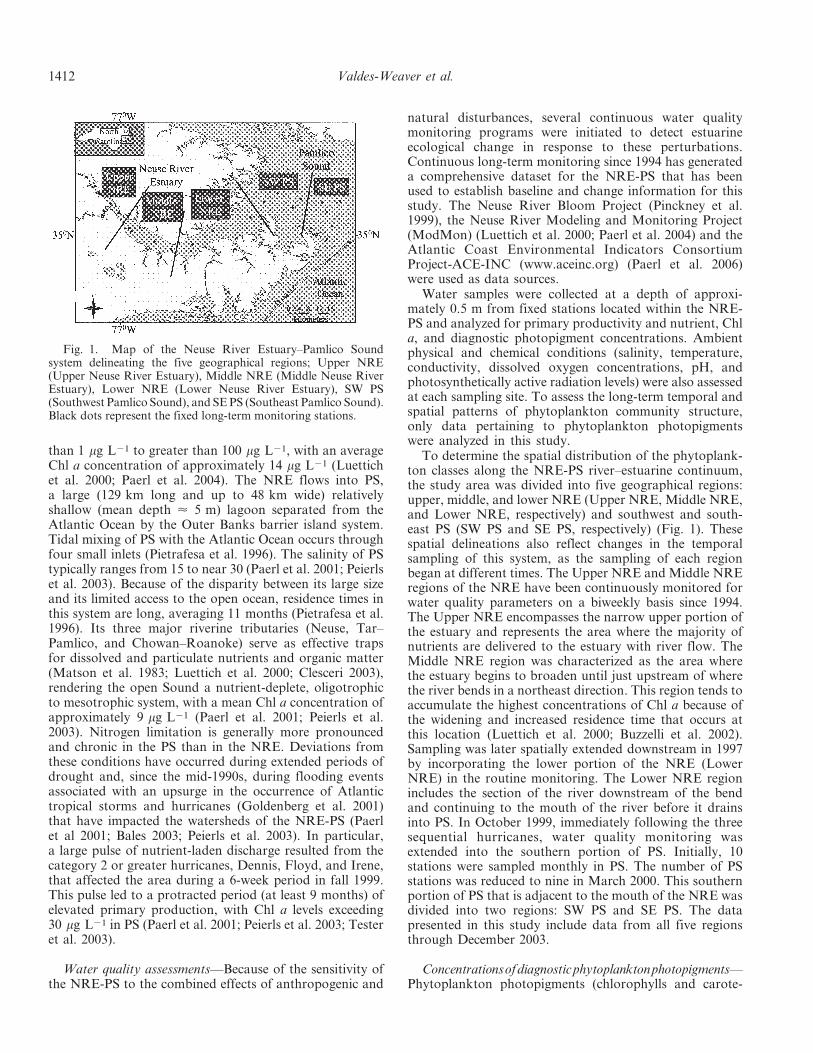
To determine the spatial distribution of the phytoplank-ton classes along the NRE-PS river–estuarine continuum,the study area was divided into five geographical regions:upper, middle, and lower NRE (Upper NRE, Middle NRE,and Lower NRE, respectively) and southwest and south-east PS (SW PS and SE PS, respectively) (Fig. 1). Thesespatial delineations also reflect changes in the temporalsampling of this system, as the sampling of each regionbegan at different times. The Upper NRE and Middle NREregions of the NRE have been continuously monitored forwater quality parameters on a biweekly basis since 1994.The Upper NRE encompasses the narrow upper portion ofthe estuary and represents the area where the majority ofnutrients are delivered to the estuary with river flow. TheMiddle NRE region was characterized as the area wherethe estuary begins to broaden until just upstream of wherethe river bends in a northeast direction. This region tends toaccumulate the highest concentrations of Chl a because ofthe widening and increased residence time that occurs atthis location (Luettich et al. 2000; Buzzelli et al. 2002).Sampling was later spatially extended downstream in 1997by incorporating the lower portion of the NRE (LowerNRE) in the routine monitoring. The Lower NRE regionincludes the section of the river downstream of the bendand continuing to the mouth of the river before it drainsinto PS. In October 1999, immediately following the threesequential hurricanes, water quality monitoring wasextended into the southern portion of PS. Initially, 10stations were sampled monthly in PS. The number of PSstations was reduced to nine in March 2000. This southernportion of PS that is adjacent to the mouth of the NRE wasdivided into two regions: SW PS and SE PS. The datapresented in this study include data from all five regionsthrough December 2003.
Concentrationsofdiagnosticphytoplanktonphotopigments—Phytoplankton photopigments (chlorophylls and carote-
Fig. 1. Map of the Neuse River Estuary–Pamlico Soundsystem delineating the five geographical regions; Upper NRE(Upper Neuse River Estuary), Middle NRE (Middle Neuse RiverEstuary), Lower NRE (Lower Neuse River Estuary), SW PS(Southwest Pamlico Sound), and SE PS (Southeast Pamlico Sound).Black dots represent the fixed long-term monitoring stations.
1412 Valdes-Weaver et al.
noids) generally representative of specific phytoplanktontaxa were separated and quantified using high-performanceliquid chromatography (HPLC, Spectra-Physics SP8800)coupled to an inline photodiode array spectrophotometer(Shimadzu SPD M10av) (Tester et al. 1995; Jeffrey et al.1997). Up to a liter of water sample was vacuum-filteredusing 47-mm glass fiber filters (Whatman GF/F) togenerate sufficient pigment concentrations for detectionand analysis. Filters were subsequently frozen and storedat 280uC prior to analysis. Photopigments were laterextracted from the frozen filters by placing them in 100%acetone, followed by sonication and storage at 20uC for12–24 h. Extracts (200 mL) were injected into the HPLCfor analysis. The HPLC column configurations andpigment separation procedures are described in Pinckneyet al. (1996, 1998, 2001). Photopigments were identifiedaccording to their characteristic absorption spectra asdetermined from pure crystalline pigment standards (SigmaChemical Company and Hoffman-LaRoche and Compa-ny) or from pigments extracted from phytoplanktoncultures (Wright et al. 1991).
ChemTax analysis—Photopigment concentrations weresubsequently analyzed using ChemTax, a matrix factoriza-tion program that determines the absolute and relativecontribution of specific phytoplankton taxonomic groups tothe total Chl a pool based on an initial pigment ratio matrixspecific to the study area (Mackey et al. 1996, 1997). Theinitial pigment ratio matrix used in this study was obtainedfrom a matrix characteristic of coastal phytoplankton groups(Mackey et al. 1996) and consisted of nine photopigments(alloxanthin, antheraxanthin, chlorophyll b, total Chl a [Chla + chlorophyllide a], fucoxanthin, lutein, peridinin, violax-anthin, and zeaxanthin) indicative of five algal groups:chlorophytes, cryptophytes, cyanobacteria, diatoms, anddinoflagellates. To minimize the variation in pigment ratiosthat accompany changes in phytoplankton species composi-tion with season and salinity regime, homogenous datagroupings of the HPLC-derived photopigment concentra-tions were delineated prior to running on ChemTax. Pigmentconcentrations were grouped by season (winter, spring,summer, and fall) and then by salinity regime (oligohaline[,5.0], mesohaline [5.01–18.0], and polyhaline [.18.01]).
Although species composition as determined frommicroscopy would have generated more in-depth informa-tion on changes in phytoplankton composition throughtime, class-specific phytoplankton abundance as deter-mined by the HPLC–ChemTax procedure was used inorder to be able to most effectively analyze and interpretthe large amount of long-term photopigment data that wascollected.
River flow rates—Daily means of Neuse River flow rateswere obtained from a long-term (1930–present) UnitedStates Geological Survey streamflow gauging stationlocated approximately 20 km upstream of the Neuse RiverEstuary, near Kinston, North Carolina (Station 02089500).Because of the long-term data available from this station,and its proximity to the Neuse River Estuary, this stationhas been routinely used for estimating river flow and
nutrient loading into the Neuse River Estuary (Bales 2003;Peierls et al. 2003).
Data analysis—Phytoplankton community structuredata were averaged by year, season, and the previouslymentioned five regions of the NRE-PS. These means werecompared to mean annual river flow rates. The seasonalclassifications used were: winter (December throughFebruary), spring (March through May), summer (Junethrough August), and fall (September through November).Class-specific phytoplankton abundance was also correlat-ed to the average daily river flow rate on the day ofsampling (T0). In addition, to account for the time lags ofriver flow effects downstream, phytoplankton abundancewas also directly related to average daily river flow rates 1(T1), 2 (T2), 3 (T3), and 4 (T4) wk prior to the samplingdate. This helped determine the approximate length of timethat each phytoplankton class responded to changes inriver flow rate in each region of the NRE-PS.
All statistical tests were performed using the statisticalpackage SPSS for Windows, version 11.5 (SPSS Inc.).Because of the violations of the assumptions for parametricstatistical testing, nonparametric statistical analyses wereperformed for all parameters to account for the lack ofparameter normality, unequal group variances, and un-equal sample number between groups. For each parameter,Kruskal–Wallis or Mann–Whitney nonparametric testswere performed to test for significant differences inphytoplankton community structure between years, sea-sons, and regions of the NRE-PS. Nonparametric Spear-man correlations were also performed to relate theabundance of the five phytoplankton classes to river flow.An alpha level of 0.05 was used for all hypotheses testingexcept where noted.
Results
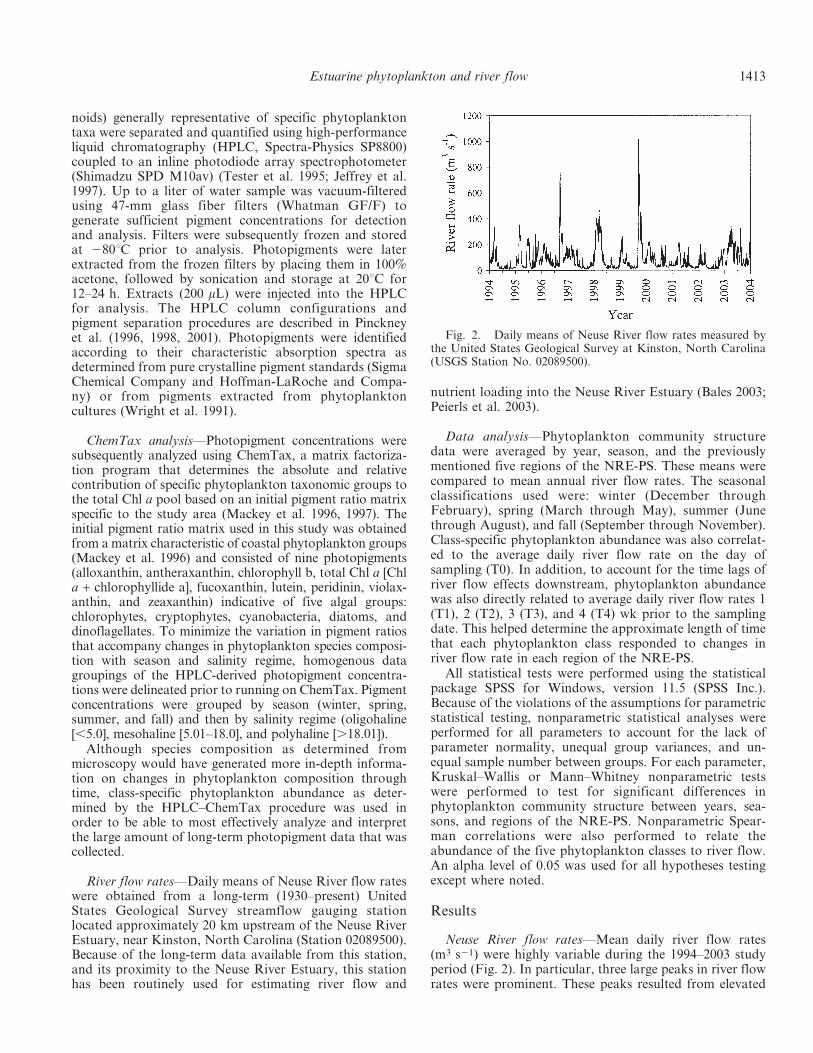
Neuse River flow rates—Mean daily river flow rates(m3 s21) were highly variable during the 1994–2003 studyperiod (Fig. 2). In particular, three large peaks in river flowrates were prominent. These peaks resulted from elevated
Fig. 2. Daily means of Neuse River flow rates measured bythe United States Geological Survey at Kinston, North Carolina(USGS Station No. 02089500).
Estuarine phytoplankton and river flow 1413
rainfall associated with Hurricane Fran in September 1996(762 m3 s21), an abnormally wet winter-spring in 1998(470 m3 s21), and the three consecutive hurricanes in fall1999 (1,014 m3 s21). Interspersed between these peaks inriver flow were periods of extended drought, specificallyduring the summer and fall months of 1994 and 1997 (alsoan El Nino year), during fall 1998, during summer 1999,and during 2000–2002, when river flow rates werecomparatively reduced, especially during the summermonths. These hydrologic events caused significant in-terannual (p , 0.001) and seasonal (p , 0.001) variabilityin river flow rates. Overall, elevated mean annual river
flow rates were observed for 1995 (101 m3 s21), 1996(124 m3 s21), 1998 (114 m3 s21), 1999 (130 m3 s21), and2003 (128 m3 s21), whereas reduced river flow was ob-served for 1994 (54 m3 s21), 1997 (63 m3 s21), and 2000–2002 (78 m3 s21, 54 m3 s21, and 51 m3 s21, respectively)(Fig. 3). During the 10-yr study, river flow rates were notsignificantly different between winter and spring months(p 5 0.504) and were significantly greater during the winter(p , 0.001) and spring (p , 0.001) than during the fall(data not shown). Summer river flow rates were signifi-cantly reduced when compared to the other seasons (p ,0.001).
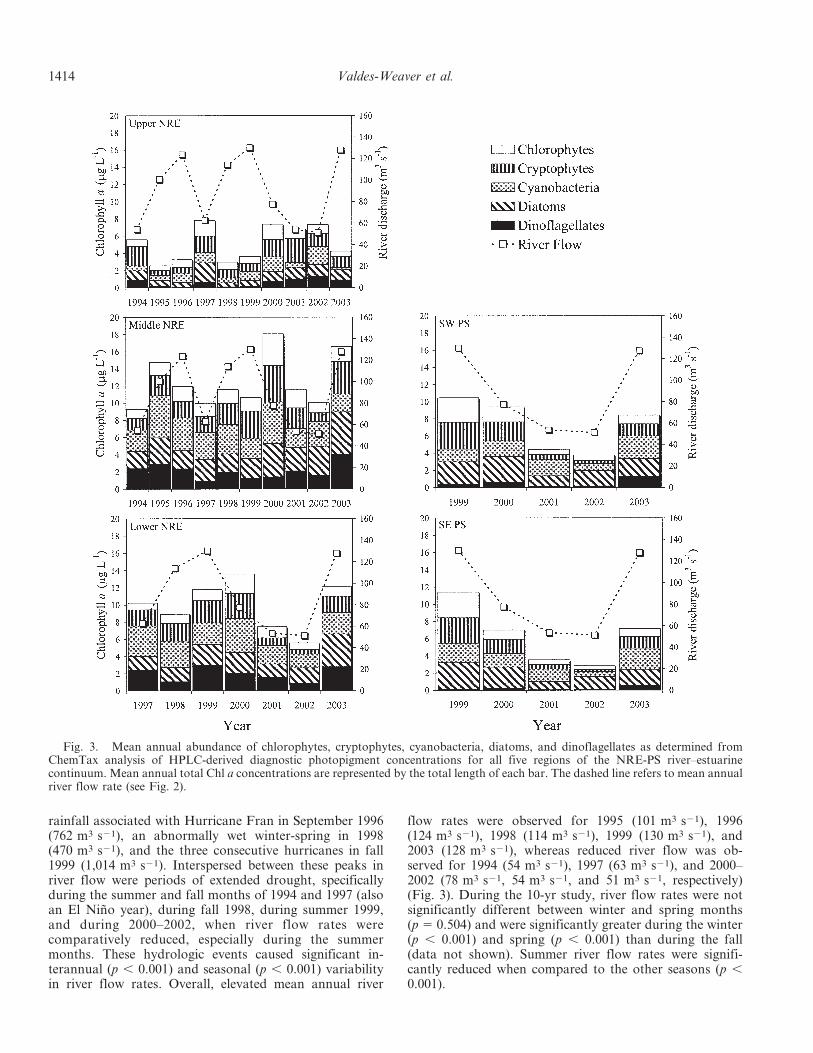
Fig. 3. Mean annual abundance of chlorophytes, cryptophytes, cyanobacteria, diatoms, and dinoflagellates as determined fromChemTax analysis of HPLC-derived diagnostic photopigment concentrations for all five regions of the NRE-PS river–estuarinecontinuum. Mean annual total Chl a concentrations are represented by the total length of each bar. The dashed line refers to mean annualriver flow rate (see Fig. 2).
1414 Valdes-Weaver et al.
Annual trends—During 1994–2003, significant interan-nual variability in total Chl a concentrations, an indicatorof total phytoplankton biomass, and in the mean abun-dance of chlorophytes, cryptophytes, cyanobacteria, dia-toms, and dinoflagellates was observed within each of thefive regions of the NRE-PS (p , 0.001) (Fig. 3). Annualtotal and class-specific Chl a trends also differed betweenthe five regions. In the Upper NRE, mean annual total Chla concentrations and class-specific algal abundances(except cyanobacteria) were higher during years character-ized by reduced mean annual river flow rates than duringelevated river flow years. This inverse relationship betweenmean annual total Chl a concentrations and mean annualriver flow rates was not observed in the other four regionsof the NRE-PS. In fact, the opposite effect was observed atthe other extreme of the system in the SW PS and SE PSregions, where annual trends in total Chl a concentrationsclosely paralleled changes in mean annual river flow rates.In the Upper NRE, the mean annual abundance ofdinoflagellates was, in particular, reduced during theelevated river flow rate years of 1995 (0.21 mg L21), 1996(0.05 mg L21), 1998 (0.09 mg L21), and 1999 (0.16 mg L21).In this region, chlorophytes demonstrated greater meanannual abundances during dry years that immediatelyfollowed hurricane years, specifically in 1997 (1.82 mg L21)and 2000 (1.77 mg L21). Diatoms also showed a large peakin mean annual abundance during the reduced river flowyear of 1997 (2.28 mg L21). Contrary to these groups,cyanobacteria in the Upper NRE region did not demon-strate a clear relationship between abundance and meanannual river flow rates.
The Middle and Lower NRE regions demonstrated verysimilar interannual patterns in total Chl a concentrationsduring the extended drought period that occurred from2000 through 2002 and during the high flow year of 2003(Fig. 3). Only during these years (2000–2003) were meanannual total Chl a concentrations in these two regionspositively related to mean annual river flow rates. In 2000,the year following the passage of the three sequentialhurricanes in fall 1999, mean annual total Chl a concentra-tions and the abundance of chlorophytes, cryptophytes,and cyanobacteria in the Middle NRE and Lower NREwere considerably higher when compared to the other yearsstudied. After 2000 and coinciding with a decrease in meanannual river flow rate, annual total Chl a concentrationsincrementally decreased with each successive year through2002 in these regions. In 2003, when river flow rates wereonce again elevated, total Chl a concentrations in bothregions once again increased. Contrary to these patterns,the Upper NRE demonstrated consistently elevated meanannual total Chl a concentrations throughout 2000–2002(.6.8 mg L21) and a reduced mean annual Chl a concen-tration in 2003 (4.2 mg L21).
The two PS regions, SW PS and SE PS, demonstratedvery similar interannual trends in mean annual total Chla concentrations and class-specific algal abundance (Fig. 3).Mean annual total Chl a concentrations and the abundanceof all phytoplankton classes studied were greater immedi-ately following the three sequential hurricanes in fall 1999than during the reduced flow rate period (2000–2002).
After fall 1999 and similar to what was observed in theMiddle NRE and Lower NRE regions, mean annual totalChl a concentrations and the mean annual abundance of allphytoplankton classes in these two regions decreased witheach successive year through 2002 . Then, coinciding withthe increase in mean annual river flow rate in 2003, meanannual total Chl a concentrations and the abundance of allphytoplankton classes, especially cyanobacteria and dino-flagellates, considerably increased. Overall, mean annualphytoplankton community structure in the two regions ofPS changed from a community dominated by chlorophytes,cryptophytes, and diatoms in fall 1999 and 2000 to oneprimarily dominated by cyanobacteria and diatoms during2001–2003. The community structure observed in theselatter years may be more reflective of the typical commu-nity composition of PS.
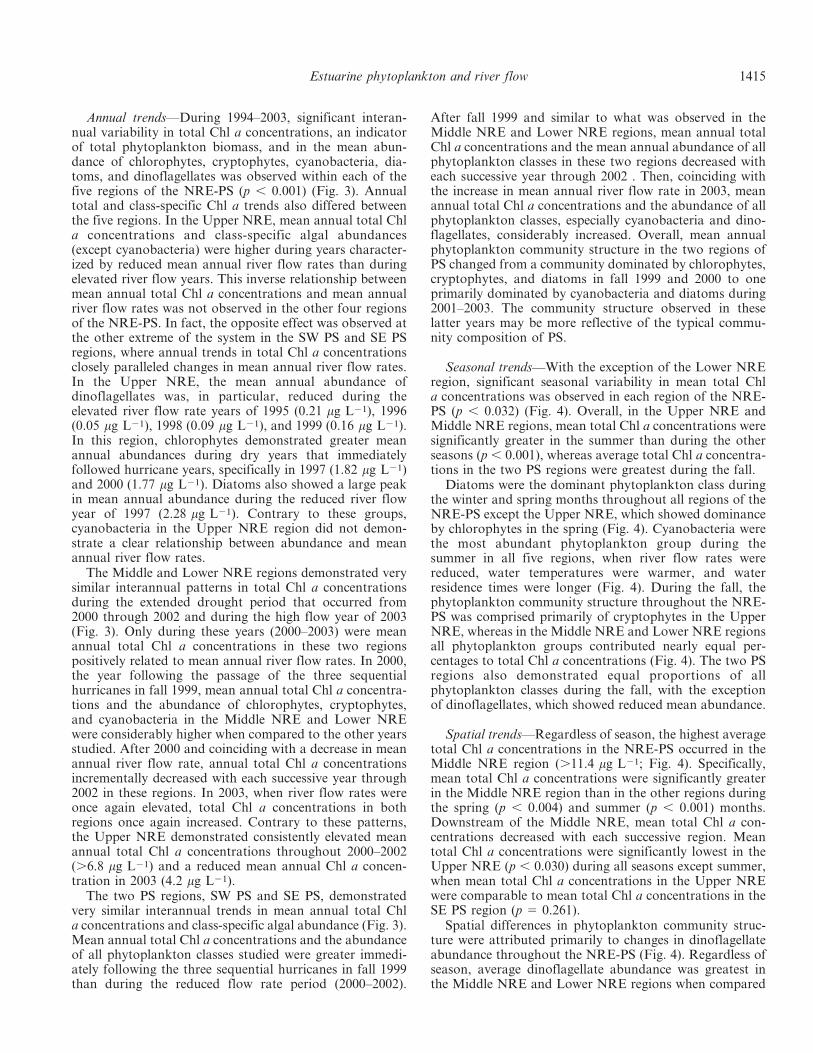
Seasonal trends—With the exception of the Lower NREregion, significant seasonal variability in mean total Chla concentrations was observed in each region of the NRE-PS (p , 0.032) (Fig. 4). Overall, in the Upper NRE andMiddle NRE regions, mean total Chl a concentrations weresignificantly greater in the summer than during the otherseasons (p , 0.001), whereas average total Chl a concentra-tions in the two PS regions were greatest during the fall.
Diatoms were the dominant phytoplankton class duringthe winter and spring months throughout all regions of theNRE-PS except the Upper NRE, which showed dominanceby chlorophytes in the spring (Fig. 4). Cyanobacteria werethe most abundant phytoplankton group during thesummer in all five regions, when river flow rates werereduced, water temperatures were warmer, and waterresidence times were longer (Fig. 4). During the fall, thephytoplankton community structure throughout the NRE-PS was comprised primarily of cryptophytes in the UpperNRE, whereas in the Middle NRE and Lower NRE regionsall phytoplankton groups contributed nearly equal per-centages to total Chl a concentrations (Fig. 4). The two PSregions also demonstrated equal proportions of allphytoplankton classes during the fall, with the exceptionof dinoflagellates, which showed reduced mean abundance.
Spatial trends—Regardless of season, the highest averagetotal Chl a concentrations in the NRE-PS occurred in theMiddle NRE region (.11.4 mg L21; Fig. 4). Specifically,mean total Chl a concentrations were significantly greaterin the Middle NRE region than in the other regions duringthe spring (p , 0.004) and summer (p , 0.001) months.Downstream of the Middle NRE, mean total Chl a con-centrations decreased with each successive region. Meantotal Chl a concentrations were significantly lowest in theUpper NRE (p , 0.030) during all seasons except summer,when mean total Chl a concentrations in the Upper NREwere comparable to mean total Chl a concentrations in theSE PS region (p 5 0.261).
Spatial differences in phytoplankton community struc-ture were attributed primarily to changes in dinoflagellateabundance throughout the NRE-PS (Fig. 4). Regardless ofseason, average dinoflagellate abundance was greatest inthe Middle NRE and Lower NRE regions when compared
Estuarine phytoplankton and river flow 1415
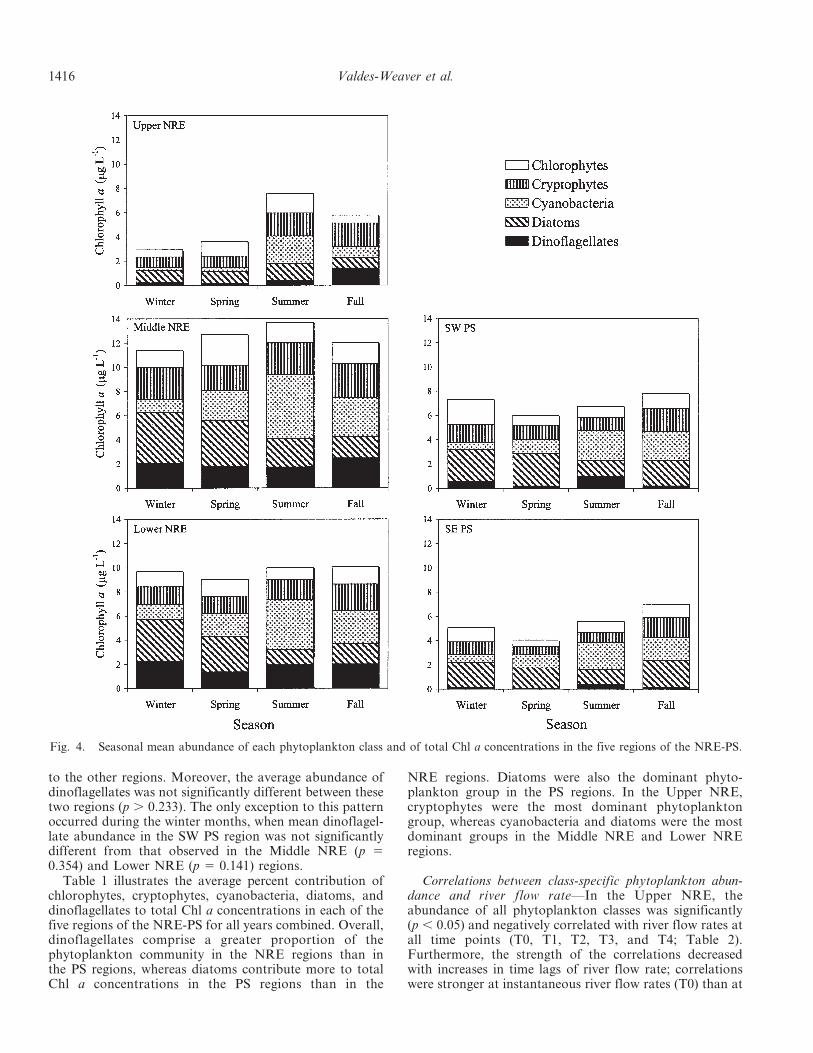
to the other regions. Moreover, the average abundance ofdinoflagellates was not significantly different between thesetwo regions (p . 0.233). The only exception to this patternoccurred during the winter months, when mean dinoflagel-late abundance in the SW PS region was not significantlydifferent from that observed in the Middle NRE (p 50.354) and Lower NRE (p 5 0.141) regions.
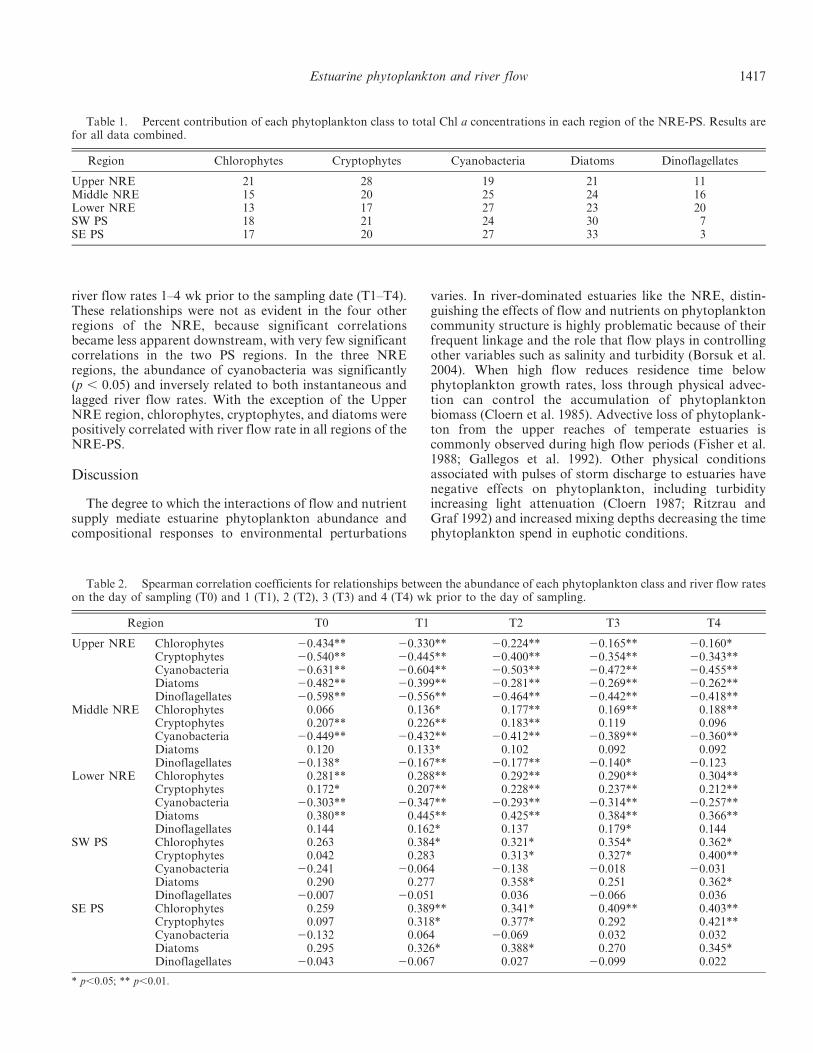
Table 1 illustrates the average percent contribution ofchlorophytes, cryptophytes, cyanobacteria, diatoms, anddinoflagellates to total Chl a concentrations in each of thefive regions of the NRE-PS for all years combined. Overall,dinoflagellates comprise a greater proportion of thephytoplankton community in the NRE regions than inthe PS regions, whereas diatoms contribute more to totalChl a concentrations in the PS regions than in the
NRE regions. Diatoms were also the dominant phyto-plankton group in the PS regions. In the Upper NRE,cryptophytes were the most dominant phytoplanktongroup, whereas cyanobacteria and diatoms were the mostdominant groups in the Middle NRE and Lower NREregions.
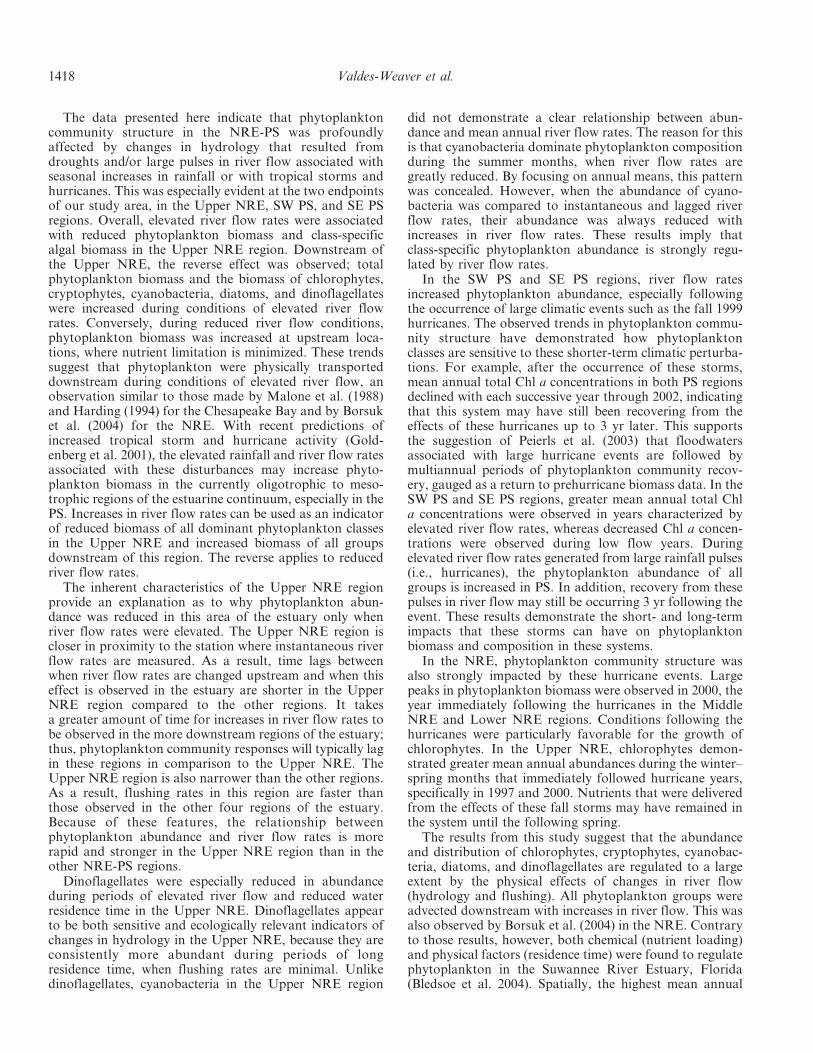
Correlations between class-specific phytoplankton abun-dance and river flow rate—In the Upper NRE, theabundance of all phytoplankton classes was significantly(p , 0.05) and negatively correlated with river flow rates atall time points (T0, T1, T2, T3, and T4; Table 2).Furthermore, the strength of the correlations decreasedwith increases in time lags of river flow rate; correlationswere stronger at instantaneous river flow rates (T0) than at
Fig. 4. Seasonal mean abundance of each phytoplankton class and of total Chl a concentrations in the five regions of the NRE-PS.
1416 Valdes-Weaver et al.
river flow rates 1–4 wk prior to the sampling date (T1–T4).These relationships were not as evident in the four otherregions of the NRE, because significant correlationsbecame less apparent downstream, with very few significantcorrelations in the two PS regions. In the three NREregions, the abundance of cyanobacteria was significantly(p , 0.05) and inversely related to both instantaneous andlagged river flow rates. With the exception of the UpperNRE region, chlorophytes, cryptophytes, and diatoms werepositively correlated with river flow rate in all regions of theNRE-PS.
Discussion
The degree to which the interactions of flow and nutrientsupply mediate estuarine phytoplankton abundance andcompositional responses to environmental perturbations
varies. In river-dominated estuaries like the NRE, distin-guishing the effects of flow and nutrients on phytoplanktoncommunity structure is highly problematic because of theirfrequent linkage and the role that flow plays in controllingother variables such as salinity and turbidity (Borsuk et al.2004). When high flow reduces residence time belowphytoplankton growth rates, loss through physical advec-tion can control the accumulation of phytoplanktonbiomass (Cloern et al. 1985). Advective loss of phytoplank-ton from the upper reaches of temperate estuaries iscommonly observed during high flow periods (Fisher et al.1988; Gallegos et al. 1992). Other physical conditionsassociated with pulses of storm discharge to estuaries havenegative effects on phytoplankton, including turbidityincreasing light attenuation (Cloern 1987; Ritzrau andGraf 1992) and increased mixing depths decreasing the timephytoplankton spend in euphotic conditions.
Table 1. Percent contribution of each phytoplankton class to total Chl a concentrations in each region of the NRE-PS. Results arefor all data combined.
Region Chlorophytes Cryptophytes Cyanobacteria Diatoms Dinoflagellates
Upper NRE 21 28 19 21 11Middle NRE 15 20 25 24 16Lower NRE 13 17 27 23 20SW PS 18 21 24 30 7SE PS 17 20 27 33 3
Table 2. Spearman correlation coefficients for relationships between the abundance of each phytoplankton class and river flow rateson the day of sampling (T0) and 1 (T1), 2 (T2), 3 (T3) and 4 (T4) wk prior to the day of sampling.
Region T0 T1 T2 T3 T4
Upper NRE Chlorophytes 20.434** 20.330** 20.224** 20.165** 20.160*Cryptophytes 20.540** 20.445** 20.400** 20.354** 20.343**Cyanobacteria 20.631** 20.604** 20.503** 20.472** 20.455**Diatoms 20.482** 20.399** 20.281** 20.269** 20.262**Dinoflagellates 20.598** 20.556** 20.464** 20.442** 20.418**
Middle NRE Chlorophytes 0.066 0.136* 0.177** 0.169** 0.188**Cryptophytes 0.207** 0.226** 0.183** 0.119 0.096Cyanobacteria 20.449** 20.432** 20.412** 20.389** 20.360**Diatoms 0.120 0.133* 0.102 0.092 0.092Dinoflagellates 20.138* 20.167** 20.177** 20.140* 20.123
Lower NRE Chlorophytes 0.281** 0.288** 0.292** 0.290** 0.304**Cryptophytes 0.172* 0.207** 0.228** 0.237** 0.212**Cyanobacteria 20.303** 20.347** 20.293** 20.314** 20.257**Diatoms 0.380** 0.445** 0.425** 0.384** 0.366**Dinoflagellates 0.144 0.162* 0.137 0.179* 0.144
SW PS Chlorophytes 0.263 0.384* 0.321* 0.354* 0.362*Cryptophytes 0.042 0.283 0.313* 0.327* 0.400**Cyanobacteria 20.241 20.064 20.138 20.018 20.031Diatoms 0.290 0.277 0.358* 0.251 0.362*Dinoflagellates 20.007 20.051 0.036 20.066 0.036
SE PS Chlorophytes 0.259 0.389** 0.341* 0.409** 0.403**Cryptophytes 0.097 0.318* 0.377* 0.292 0.421**Cyanobacteria 20.132 0.064 20.069 0.032 0.032Diatoms 0.295 0.326* 0.388* 0.270 0.345*Dinoflagellates 20.043 20.067 0.027 20.099 0.022
* p,0.05; ** p,0.01.
Estuarine phytoplankton and river flow 1417
The data presented here indicate that phytoplanktoncommunity structure in the NRE-PS was profoundlyaffected by changes in hydrology that resulted fromdroughts and/or large pulses in river flow associated withseasonal increases in rainfall or with tropical storms andhurricanes. This was especially evident at the two endpointsof our study area, in the Upper NRE, SW PS, and SE PSregions. Overall, elevated river flow rates were associatedwith reduced phytoplankton biomass and class-specificalgal biomass in the Upper NRE region. Downstream ofthe Upper NRE, the reverse effect was observed; totalphytoplankton biomass and the biomass of chlorophytes,cryptophytes, cyanobacteria, diatoms, and dinoflagellateswere increased during conditions of elevated river flowrates. Conversely, during reduced river flow conditions,phytoplankton biomass was increased at upstream loca-tions, where nutrient limitation is minimized. These trendssuggest that phytoplankton were physically transporteddownstream during conditions of elevated river flow, anobservation similar to those made by Malone et al. (1988)and Harding (1994) for the Chesapeake Bay and by Borsuket al. (2004) for the NRE. With recent predictions ofincreased tropical storm and hurricane activity (Gold-enberg et al. 2001), the elevated rainfall and river flow ratesassociated with these disturbances may increase phyto-plankton biomass in the currently oligotrophic to meso-trophic regions of the estuarine continuum, especially in thePS. Increases in river flow rates can be used as an indicatorof reduced biomass of all dominant phytoplankton classesin the Upper NRE and increased biomass of all groupsdownstream of this region. The reverse applies to reducedriver flow rates.
The inherent characteristics of the Upper NRE regionprovide an explanation as to why phytoplankton abun-dance was reduced in this area of the estuary only whenriver flow rates were elevated. The Upper NRE region iscloser in proximity to the station where instantaneous riverflow rates are measured. As a result, time lags betweenwhen river flow rates are changed upstream and when thiseffect is observed in the estuary are shorter in the UpperNRE region compared to the other regions. It takesa greater amount of time for increases in river flow rates tobe observed in the more downstream regions of the estuary;thus, phytoplankton community responses will typically lagin these regions in comparison to the Upper NRE. TheUpper NRE region is also narrower than the other regions.As a result, flushing rates in this region are faster thanthose observed in the other four regions of the estuary.Because of these features, the relationship betweenphytoplankton abundance and river flow rates is morerapid and stronger in the Upper NRE region than in theother NRE-PS regions.
Dinoflagellates were especially reduced in abundanceduring periods of elevated river flow and reduced waterresidence time in the Upper NRE. Dinoflagellates appearto be both sensitive and ecologically relevant indicators ofchanges in hydrology in the Upper NRE, because they areconsistently more abundant during periods of longresidence time, when flushing rates are minimal. Unlikedinoflagellates, cyanobacteria in the Upper NRE region
did not demonstrate a clear relationship between abun-dance and mean annual river flow rates. The reason for thisis that cyanobacteria dominate phytoplankton compositionduring the summer months, when river flow rates aregreatly reduced. By focusing on annual means, this patternwas concealed. However, when the abundance of cyano-bacteria was compared to instantaneous and lagged riverflow rates, their abundance was always reduced withincreases in river flow rates. These results imply thatclass-specific phytoplankton abundance is strongly regu-lated by river flow rates.
In the SW PS and SE PS regions, river flow ratesincreased phytoplankton abundance, especially followingthe occurrence of large climatic events such as the fall 1999hurricanes. The observed trends in phytoplankton commu-nity structure have demonstrated how phytoplanktonclasses are sensitive to these shorter-term climatic perturba-tions. For example, after the occurrence of these storms,mean annual total Chl a concentrations in both PS regionsdeclined with each successive year through 2002, indicatingthat this system may have still been recovering from theeffects of these hurricanes up to 3 yr later. This supportsthe suggestion of Peierls et al. (2003) that floodwatersassociated with large hurricane events are followed bymultiannual periods of phytoplankton community recov-ery, gauged as a return to prehurricane biomass data. In theSW PS and SE PS regions, greater mean annual total Chla concentrations were observed in years characterized byelevated river flow rates, whereas decreased Chl a concen-trations were observed during low flow years. Duringelevated river flow rates generated from large rainfall pulses(i.e., hurricanes), the phytoplankton abundance of allgroups is increased in PS. In addition, recovery from thesepulses in river flow may still be occurring 3 yr following theevent. These results demonstrate the short- and long-termimpacts that these storms can have on phytoplanktonbiomass and composition in these systems.
In the NRE, phytoplankton community structure wasalso strongly impacted by these hurricane events. Largepeaks in phytoplankton biomass were observed in 2000, theyear immediately following the hurricanes in the MiddleNRE and Lower NRE regions. Conditions following thehurricanes were particularly favorable for the growth ofchlorophytes. In the Upper NRE, chlorophytes demon-strated greater mean annual abundances during the winter–spring months that immediately followed hurricane years,specifically in 1997 and 2000. Nutrients that were deliveredfrom the effects of these fall storms may have remained inthe system until the following spring.
The results from this study suggest that the abundanceand distribution of chlorophytes, cryptophytes, cyanobac-teria, diatoms, and dinoflagellates are regulated to a largeextent by the physical effects of changes in river flow(hydrology and flushing). All phytoplankton groups wereadvected downstream with increases in river flow. This wasalso observed by Borsuk et al. (2004) in the NRE. Contraryto those results, however, both chemical (nutrient loading)and physical factors (residence time) were found to regulatephytoplankton in the Suwannee River Estuary, Florida(Bledsoe et al. 2004). Spatially, the highest mean annual
1418 Valdes-Weaver et al.
total Chl a concentrations in the NRE-PS occurred in theMiddle NRE region. Phytoplankton biomass had pre-viously been shown to accumulate in this region because ofits physical features and the frequent stratification thatoccurs in this region (Paerl et al. 1995; Luettich et al. 2000).
Trends in phytoplankton community structure werepreviously documented during 1994–1996 by Pinckney etal. (1998) for the Upper NRE and Middle NRE regions.Over those 3 yr, phytoplankton composition in theseregions was found to be divided fairly evenly amongchlorophytes, cryptophytes, cyanobacteria, diatoms, anddinoflagellates (e.g., 17%, 23%, 18%, 20%, and 22%,respectively). Analogous to those findings, dominance byone or a few phytoplankton taxonomic groups was notobserved in any region of the NRE-PS system during this10-yr study. However, there were slight differences in thecontributions of cyanobacteria, diatoms, and dinoflagel-lates to total Chl a concentrations between the 1994–1996study and this 1994–2003 study for the combined UpperNRE and Middle NRE regions; the percentage contribu-tion of cyanobacteria and diatoms increased slightly from18% to 24% and from 20% to 24% for these groupsrespectively. The contribution of dinoflagellates, however,decreased from 22% during 1994–1996 to 14% during1994–2003. Because dinoflagellates’ abundance is generallyreduced during periods of high river flow and reducedwater residence times, the increase in the frequency oftropical storms and hurricanes in the more recent yearsmay be reducing the abundance of dinoflagellates in thetwo uppermost regions of the system. This shift is likely tohave food web ramifications, because crustacean zooplank-ton grazers in the NRE are known to prefer dinoflagellategenera (Heterocapsa, Gymnodinium, and Scrippsiella) thatdominate this phytoplankton group (Mallin and Paerl1994). In addition, such hydrologically-forced shifts inphytoplankton community structure are likely to havebiogeochemical effects, including changes in sedimentcarbon flux and hypoxia dynamics (Paerl et al. 1998).
These results have strengthened our understanding ofphytoplankton community responses to hydrologic forcingand stress the importance of incorporating variability inriver flow as a major factor in management strategies. Long-term analyses like the one presented here serve as a baselinefrom which to compare future ecological condition andassess change. Long-term monitoring of phytoplanktonphotopigments is a broadly applicable tool for examiningand separating the impacts of these physical–chemicalforcings. The methods for determining the abundance ofeach phytoplankton group are cost-effective and can beincorporated into already existing water quality monitoringprograms. Discharge may be an indicator of phytoplanktonbiomass and community structure in estuarine systemsworldwide that are affected discretely or simultaneously bynatural (hydrologic) and anthropogenic factors.
References
BALES, J. D. 2003. Effects of Hurricane Floyd inland flooding,September–October 1999, on tributaries to Pamlico Sound,North Carolina. Estuaries 26: 1319–1328.
BLEDSOE, E. L., E. J. PHLIPS, C. E. JETT, AND K. A. DONNELLY.2004. The relationships among phytoplankton biomass,nutrient loading and hydrodynamics in an inner-shelf estuary.Ophelia 58: 29–47.
BORSUK, M. E., C. A. STOW, AND K. H. RECKHOW. 2004.Confounding effect of flow on estuarine response to nitrogenloading. J. Environ. Eng. 130: 605–614.
BUZZELLI, C. P., R. A. LUETTICH, S. P. POWERS, C. H. PETERSON,J.E McNINCH, J. L. PINCKNEY, AND H. W. PAERL. 2002.Estimating the spatial extent of bottom-water hypoxia andhabitat degradation in a shallow estuary. Mar. Ecol. Prog.Ser. 230: 103–112.
CHRISTIAN, R. R., J. E. O’NEAL, B. PEIERLS, L. VALDES, AND H. W.PAERL. 2004. Episodic nutrient loading impacts on eutrophi-cation of the southern Pamlico Sound: The effects of the 1999hurricanes. Report No. 349, University of North Carolina,Water Resources Research Institute, Raleigh, NC.
CLESCERI, E. J. 2003. Quantification of particulate organic mattersources in an eutrophic river estuary by stable carbon andnitrogen isotopes and photopigments (Neuse River Estuary,NC USA). Ph.D. thesis, Univ. of North Carolina at ChapelHill.
———. 1987. Turbidity as a control on phytoplankton biomassand productivity in estuaries. Cont. Shelf Res. 7: 1367–1381.
CLOERN, J. E., B. E. COLE, R. L. J. WONG, AND A. E. ALPINE. 1985.Temporal dynamics of estuarine phytoplankton: A case studyof San-Francisco Bay. Hydrobiologia 129: 153–176.
COTTINGHAM, K. L., AND S. R. CARPENTER. 1998. Population,community, and ecosystem variates as ecological indicators:Phytoplankton responses to whole-lake enrichment. Ecol.Appl. 8: 508–530.
FISHER, T. R., L. W. HARDING, JR., D. W. STANLEY, AND L. G.WARD. 1988. Phytoplankton, nutrients, and turbidity in theChesapeake, Delaware, and Hudson estuaries. Estuar. Coast.Shelf Sci. 27: 61–93.
GALLEGOS, C. L., T. E. JORDAN, AND D. L. CORREL. 1992. Event-scale response of phytoplankton to watershed inputs ina subestuary: Timing, magnitude, and location of blooms.Limnol. Oceanogr. 37: 813–828.
GOLDENBERG, S. B., C. W. LANDSEA, A. M. MESTAS-NUNEZ, AND
W. M. GRAY. 2001. The recent increase in Atlantic hurricaneactivity: Causes and implications. Science 293: 474–479.
HARDING, L. W. 1994. Long-term trends in the distribution ofphytoplankton in Chesapeake Bay: Roles of light, nutrients,and streamflow. Mar. Ecol. Prog. Ser. 104: 267–291.
———, AND E. S. PERRY. 1997. Long-term increase of phyto-plankton biomass in Chesapeake Bay, 1950–1994. Mar. Ecol.Prog. Ser. 157: 39–52.
JEFFREY, S. W., R. F. C. MANTOURA, AND S. W. WRIGHT [EDS.].1997. Phytoplankton pigments in oceanography: Guidelinesto modern methods. UNESCO.
LEWITUS, A. J., D. L. WHITE, R. G. TYMOWSKI, M. E. GEESEY, S.N. HYMEL, AND P. A. NOBLE. 2005. Adapting the CHEMTAXmethod for assessing phytoplankton taxonomic compositionin southeastern U.S. estuaries. Estuaries 28: 160–172.
LUETTICH, R. A., JR., AND oTHERS. 2000. Neuse River Estuarymodeling and monitoring project stage 1: Hydrography andcirculation, water column nutrients and productivity, sedi-mentary processes and benthic-pelagic coupling, and benthicecology. Raleigh (NC): University of North Carolina, WaterResources Research Institute. Report No. 325B.
MACKEY, M. D., H. W. HIGGINS, D. J. MACKEY, AND S. W.WRIGHT. 1997. CHEMTAX user’s manual: A program forestimating class abundances from chemical markers—applica-tion to HPLC measurements of phytoplankton pigments. C-SIRO. Mar. Lab. Report No. 229.
Estuarine phytoplankton and river flow 1419
———, D. J. MACKEY, H. W. HIGGINS, AND S. W. WRIGHT. 1996.CHEMTAX—a program for estimating class abundancesfrom chemical markers: Application to HPLC measurementsof phytoplankton. Mar. Ecol. Prog. Ser. 144: 265–283.
MALLIN, M. A. 1994. Phytoplankton ecology of North Carolinaestuaries. Estuaries 17: 561–574.
———, AND H. W. PAERL. 1994. Planktonic trophic transfer in anestuary: Seasonal, diel, and community structure effects.Ecology 75: 2168–2184.
MALONE, T. C., CROCKER, L. H., PIKE, S. E., AND B. W. WENDLER.1988. Influence of river flow on the dynamics of phytoplank-ton in a partially stratified estuary. Mar. Ecol. Prog. Ser. 48:235–249.
MATSON, E. A., M. M. BRINSON, D. D. CAHOON, AND G. J. DAVIS.1983. Biogeochemistry of the sediments of the Pamlico andNeuse River Estuaries, North Carolina. Raleigh (NC):University of North Carolina Water Resources ResearchInstitute. Report No. 191.
PAERL, H. W. 1988. Nuisance phytoplankton blooms in coastal,estuarine, and inland waters. Limnol. Oceanogr. 33: 823–847.
———, M. A. MALLIN, C. A. DONAHUE, M. GO, AND B. L.PEIERLS. 1995. Nitrogen loading sources and eutrophication ofthe Neuse River estuary, North Carolina: Direct and indirectroles of atmospheric deposition. University of North CarolinaWater Resources Research Institute. Report No. 291.
———, J. L. PINCKNEY, J. M. FEAR, AND B. J. PEIERLS. 1998.Ecosystem responses to internal and watershed organic matterloading: Consequences for hypoxia in the eutrophying NeuseRiver Estuary, North Carolina, USA. Mar. Ecol. Prog. Ser.166: 17–25.
———, L. M. VALDES, J. ADOLF, B. L. PEIERLS, AND L. W.HARDING, JR. 2006. Anthropogenic and climatic influences onthe eutrophication of large estuarine ecosystems. Limnol.Oceanogr. 51: 448–462.
———, ———, A. R. JOYNER, M. F. PIEHLER, AND M. E. LEBO.2004. Solving problems resulting from solutions: Evolution ofa dual nutrient management strategy for the eutrophyingNeuse River Estuary, North Carolina. Environ. Sci. Technol.38: 3068–3073.
———, ———, J. L. PINCKNEY, M. F. PIEHLER, J. DYBLE, AND P.H. MOISANDER. 2003. Phytoplankton photopigments asindicators of estuarine and coastal eutrophication. BioScience53: 953–964.
———, AND oTHERS. 2001. Ecosystem impacts of three sequentialhurricanes (Dennis, Floyd and Irene) on the Unites States’largest lagoonal estuary, Pamlico Sound, NC. Proc. Natl.Acad. Sci. USA 98: 5655–5660.
PEIERLS, B. L., R. R. CHRISTIAN, AND H. W. PAERL. 2003. Waterquality and phytoplankton as indicators of hurricane impactson a large estuarine ecosystem. Estuaries 26: 1329–1343.
PIEHLER, M. F., L. J. TWOMEY, N. S. HALL, AND H. W. PAERL.2004. Impacts of inorganic nutrient enrichment on thephytoplankton community structure and function in PamlicoSound, NC USA. Estuar. Coast. Shelf Sci. 61: 197–209.
PIETRAFESA, L. J., G. S. JANOWITZ, T.-Y. CHAO, H. WEISBERG, F.ASKARI, AND E. NOBLE. 1996. The physical oceanography ofPamlico Sound. Raleigh (NC): North Carolina SeagrantProgram. Publ. UNC-WP-86-5.
PINCKNEY, J. L., D. F. MILLIE, K. E. HOWE, H. W. PAERL, AND J.P. HURLEY. 1996. Flow scintillation counting of 14C-labeledmicroalgal photosynthetic pigments. J. Plankton Res. 18:1867–1880.
———, ———, B. T. VINYARD, AND H. W. PAERL. 1997.Environmental controls of phytoplankton bloom dynamicsin the Neuse River Estuary, North Carolina, USA. Can. J.Fish. Aquat. Sci. 54: 2491–2501.
———, H. W. PAERL, AND M. B. HARRINGTON. 1999. Responsesof the phytoplankton community growth rate to nutrientpulses in variable estuarine environments. J. Phycol. 35:1455–1463.
———, ———, ———, AND K. E. HOWE. 1998. Annual cycles ofphytoplankton community structure and bloom dynamics inthe Neuse River Estuary, North Carolina. Mar. Biol. 131:371–381.
———, T. L. RICHARDSON, D. F. MILLIE, AND H. W. PAERL. 2001.Application of photopigment biomarkers for quantifyingmicroalgal community composition and in situ growth rates.Org. Geochem. 32: 585–595.
REYNOLDS, C. S. 1984. Phytoplankton periodicity: The interac-tions of form, function and environmental variability.Freshw. Biol. 14: 111–142.
———, J. PADISAK, AND U. SOMMER. 1993. Intermediatedisturbance in the ecology of phytoplankton and themaintenance of species diversity: A synthesis. Hydobiologia249: 183–188.
RICHARDSON, K. 1997. Harmful or exceptional phytoplanktonblooms in the marine ecosystem. Adv. Mar. Biol. 31: 301–385.
RITZRAU, W., AND G. GRAF. 1992. Increase of microbial biomassin the benthic turbidity zone of Kiel Bight after resuspensionby a storm event. Limnol. Oceanogr. 37: 1081–1086.
SCHLUTER, L., F. MOHLENBERG, H. HAVSKUM, AND S. LARSEN.2000. The use of phytoplankton pigments for identifying andquantifying phytoplankton groups in coastal areas: Testingthe influence of light and nutrients on pigment/chlorophyllratios. Mar. Ecol. Prog. Ser. 192: 49–63.
STOLTE, W., T. MCCOLLIN, A. NOORDELOOS, AND R. RIEGMAN.1994. Effect of nitrogen-source on the size distribution withinmarine-phytoplankton populations. J. Exp. Mar. Biol. Ecol.184: 83–97.
STOW, C. A., M. E. BORSUK, AND D. W. STANLEY. 2001. Long-termchanges in watershed nutrient inputs and riverine exports inthe Neuse River, North Carolina. Water Research 35:1489–1499.
TESTER, P. A., M. E. GEESEY, C. Z. GUO, H. W. PAERL, AND D. F.MILLIE. 1995. Evaluating phytoplankton dynamics inthe Newport River Estuary (North-Carolina, USA) byHPLC-derived pigment profiles. Mar. Ecol. Prog. Ser. 124:237–245.
———, AND oTHERS. 2003. Airborne detection of ecosystemresponses to an extreme event: Phytoplankton displacementand abundance after hurricane induced flooding in theAlbemarle-Pamlico Sound system, North Carolina. Estuaries26: 1353–1364.
WRIGHT, S. W., S. W. JEFFREY, R. F. C. MANTOURA, C. A.LLEWELLYN, T. BJØRNLAND, D. REPETA, AND N. WELSCH-
MEYER. 1991. Improved HPLC method for the analysis ofchlorophylls and carotenoids from marine-phytoplankton.Mar. Ecol. Prog. Ser. 77: 183–196.
Received: 14 July 2005Accepted: 7 December 2005Amended: 12 January 2006
1420 Valdes-Weaver et al.
Copyright © 2022 FDOKUMEN