Investigation of potential water quality and quantity impacts ...
Upload
khangminh22Category
view
0download
0
fmars-07-00274 April 26, 2020 Time: 14:19 # 1
ORIGINAL RESEARCHpublished: 28 April 2020
doi: 10.3389/fmars.2020.00274
Edited by:Maria Lourdes D. Palomares,
The University of British Columbia,Canada
Reviewed by:Arne Michael Malzahn,
SINTEF Ocean, NorwayAnwesha Ghosh,
Indian Institute of Science Educationand Research Kolkata, India
Wei Li,Chongqing University, China
*Correspondence:Rong Bi
Specialty section:This article was submitted to
Marine Biology,a section of the journal
Frontiers in Marine Science
Received: 02 December 2019Accepted: 06 April 2020Published: 28 April 2020
Citation:Bi R and Sommer U (2020) Food
Quantity and Quality Interactions atPhytoplankton–Zooplankton Interface:
Chemical and ReproductiveResponses in a Calanoid Copepod.
Front. Mar. Sci. 7:274.doi: 10.3389/fmars.2020.00274
Food Quantity and QualityInteractions atPhytoplankton–ZooplanktonInterface: Chemical andReproductive Responses in aCalanoid CopepodRong Bi1,2,3* and Ulrich Sommer2
1 Frontiers Science Center for Deep Ocean Multispheres and Earth System, and Key Laboratory of Marine Chemistry Theoryand Technology, Ministry of Education, Ocean University of China, Qingdao, China, 2 Marine Ecology, GEOMAR HelmholtzCenter for Ocean Research Kiel, Kiel, Germany, 3 Laboratory for Marine Ecology and Environmental Science, QingdaoNational Laboratory for Marine Science and Technology, Qingdao, China
Marine food webs form the major component of the biological pump and play a centralrole in the global carbon (C) cycle. Understanding the response of particular processesin marine food webs to changing environments is a prerequisite to predict changes inecological functioning in the future ocean. Here, we experimentally assessed the effectsof nitrogen:phosphorus (N:P) supply ratios (the molar ratios 10:1, 24:1, and 63:1) onelemental and biochemical quality of marine phytoplankton Rhodomonas sp., and theinteractions between food quantity and quality on stoichiometric C:N:P, fatty acids (FAs)and reproductions in copepods Acartia tonsa. Overall, the stoichiometry of A. tonsawas to some extent homeostatic in response to the changing algal C:N and C:P ratios,with significant changes in C:N ratios of A. tonsa observed, especially under higherfood quantities. The relative gross growth efficiencies (GGEs) for C and N (and P) wereanalyzed, revealing that copepods may achieve homeostasis by lowering the GGE for Cwhile increasing it for the limiting nutrient. Egg production rates in A. tonsa were loweston nutrient deficient diets under low food quantities. Reduced egg production rates maybe attributed to the lowered GGEs for C and reduced transfer efficiency of essentialFAs between phytoplankton and copepods, indicating interactive-essential effects ofelements and FAs on copepod production. Our results highlight that nutrient deficiencyin the environments may reduce energy transfer efficiency at the base of food webs byaltering phytoplankton chemical composition, which can interact with food quantity andhave implications on food web dynamics in the changing ocean.
Keywords: food webs, food concentration, nutritional quality, stoichiometry, fatty acids, egg production, nutrientlimitation
Frontiers in Marine Science | www.frontiersin.org 1 April 2020 | Volume 7 | Article 274
fmars-07-00274 April 26, 2020 Time: 14:19 # 2
Bi and Sommer Interactions of Food Quantity and Quality
INTRODUCTION
The pelagic food webs play a fundamental role in the biologicalpump and contribute substantially to carbon sequestration inthe ocean (Passow and Carlson, 2012). Global climate changehas exerted profound and complex impacts on marine foodwebs (Sommer et al., 2002; Edwards and Richardson, 2004;Lewandowska et al., 2014). For example, primary production,zooplankton abundance and fish stock recruitment in the NorthSea have declined over 25 years and this has been drivenprimarily by a decrease in riverine nutrient inputs; the reductionin nutrient inputs caused a decline in primary productionwhich was mirrored by a decline in small copepod abundance,revealing bottom–up control of herbivorous zooplankton byphytoplankton production (Capuzzo et al., 2018). In the centralBaltic Sea in summer, zooplankton become more carnivorousunder nutrient depletion (Loick-Wilde et al., 2019), because small(<5 µm) phytoplankton (generally favored by low nutrients)and N2-fixing cyanobacteria are outside the optimal food sizerange of herbivorous zooplankton (Sommer et al., 2002). Thus,the structure of marine pelagic food webs differs at differentlevels of nutrient richness (Sommer et al., 2002). Understandingthe responses of marine food webs to environmental changesis therefore of critical importance to predict the structure andfunctioning of marine ecosystems under future ocean scenarios.
Phytoplankton and crustacean zooplankton (zooplanktonhereafter) occupy a key ecological position in marine food webs asthey constitute the crucial link of energy and substance transportto higher trophic levels (Harris et al., 2000). Ocean environmentalchanges have caused pronounced changes in phytoplanktonbiomass (Boyce et al., 2010; Lotze et al., 2019) and chemicalcomposition (Galbraith and Martiny, 2015; Bi et al., 2017, 2018;Ruess and Müller-Navarra, 2019), altering the quantity andquality of phytoplankton as a food for consumers. While foodquantity has long time been acknowledged as a limiting factorfor consumers, limitation by food quality became an issue sinceca. 25 years ago (Sommer, 1992; Urabe and Watanabe, 1992;Müller-Navarra et al., 2000; Boersma et al., 2008). Sterner andSchulz (1998) pioneered the integration of food quantity andquality aspect in regulating zooplankton nutrition, showing thatzooplankton growth rate in response to food quantity differsunder distinct scenarios of food quality. To date, studies on theinteractive effects of food quantity and quality have been mostlyperformed with freshwater zooplankton (e.g., Amarasinghe et al.,1997; Boersma and Kreutzer, 2002; Schälicke et al., 2019), whilelittle is known for marine zooplankton (but see Ambler, 1986;Koski et al., 2010).
Food quantity is conventionally measured in terms of carbon(C) absolute concentration (Sterner and Robinson, 1994), andfood quality is primarily determined by the chemical matchbetween phytoplankton elemental and biochemical compositionand zooplankton demands (Müller-Navarra, 2008). Elementalquality of food is frequently expressed as elemental stoichiometry(Anderson et al., 2004; Hessen, 2008). Of all biochemicalindicators of food quality, fatty acids (FAs) have attractedparticular interest (Müller-Navarra et al., 2004; Ruess and Müller-Navarra, 2019). Essential FAs (EFAs) cannot be synthesized by
consumers, or the synthesis rate is not sufficient to meet thebasic biochemical needs of consumers (Arts et al., 2001; Kainzet al., 2004), and thus must be acquired through diet. ω3-and ω6-polyunsaturated FAs (PUFAs) such as eicosapentaenoicacid (20:5n-3; EPA) and docosahexaenoic acid (22:6n-3; DHA)are essential for animals and have received intense attention(Müller-Navarra, 2008; Parrish, 2009; Taipale et al., 2011;Ilic et al., 2019). There is evidence for the significance ofphytoplankton elemental stoichiometry or EFAs in regulatingmarine zooplankton growth (Malzahn and Boersma, 2012; Diezet al., 2013), egg production (Augustin and Boersma, 2006;Jónasdóttir et al., 2009; Franco-Santos et al., 2018), developmentrate (Marja et al., 1998; Malzahn et al., 2010; Mathews et al.,2018), feeding behavior (Meunier et al., 2016), and movementpatterns (Herstoff et al., 2019). The relative importance ofelemental versus biochemical quality of food is a long-standingcontroversy which has attracted more attention in limnology thanin marine ecology (Lampert, 2009), some studies proposing theprimary control of elemental quality (e.g., Hessen, 1992; Boersma,2000; Becker and Boersma, 2005; Malzahn and Boersma, 2012)but the others emphasizing the importance of FA availabilityin zooplankton nutrition (e.g., Brett, 1993; Müller-Navarra,1995; Park et al., 2002; Ravet and Brett, 2006; Li et al.,2019). So far, little effort has been invested to simultaneouslydeal with food quantity and quality effects, and particularlyto incorporate elemental and biochemical quality of food aslimiting factors in the study of zooplankton production in thechanging environments.
In the present study, we investigated the transfer of elements[C, nitrogen (N) and phosphorus (P)] and EFAs (ω3- and ω6-PUFAs, in particular EPA and DHA) from marine phytoplanktonto copepods, and egg production rates and nucleic acidratios (RNA:DNA) of copepods under different food quantityand nutritional quality scenarios. The measurement of eggproduction rate is the most common technique to estimatezooplankton growth (Runge and Roff, 2000), while RNA:DNAhas become a useful tool for zooplankton growth assessment,because of the primary function of RNA in protein synthesis(Saiz et al., 1998; Gorokhova, 2003; Gusmão and McKinnon,2011; Yebra et al., 2017). We applied stoichiometric models totest the responses of the relative gross growth efficiencies (GGEs)for elements to different food quantity and nutritional quality(Anderson and Hessen, 1995), as well as the strength of limitationof elements versus EPA (and DHA) under nutrient deficientconditions (Anderson and Pond, 2000). Also, the relative trophictransfer efficiencies of EFAs versus C can be assessed bycomparing the relative EFA contents of phytoplankton andcopepods (Brett and Müller-Navarra, 1997; Gladyshev et al., 2011;Pommier et al., 2012). The calanoid copepod Acartia tonsa waschosen as the model species for our study. The adults of thisspecies do not build up large energy storage pools but ratherinvest most assimilated energy directly into egg production andthus respond quickly to altered feeding conditions with changedegg production (<24 h) (Dagg, 1977; Kiørboe et al., 1985). Foodquality in this study is expressed as elemental stoichiometry(C:N and C:P) and carbon-normalized contents of EFAs in thecryptophyte Rhodomonas sp. under a wide range of N:P supply
Frontiers in Marine Science | www.frontiersin.org 2 April 2020 | Volume 7 | Article 274

fmars-07-00274 April 26, 2020 Time: 14:19 # 3
Bi and Sommer Interactions of Food Quantity and Quality
ratios and growth rates (dilution rates). Our study aims to testthe following questions:
(1) How homeostatic is the stoichiometry of A. tonsa underdifferent algal C:N and C:P? Does homeostasis depend onfood quantity, and can it be achieved by increasing the GGEfor the limiting nutrient or by lowering it for C?
(2) Is nutrient deficiency the ultimate cause and FA deficiencythe proximate cause of changes in egg production?
(3) Do the costs of homeostasis reduce egg production undernutrient deficiency? Is this effect different under low andhigh food quantities?
MATERIALS AND METHODS
Phytoplankton CulturesThe cryptophyte Rhodomonas sp. originated from the Kiel Bight,Baltic Sea. The cultures were maintained in sterile filterednatural seawater (Sterilizing Grade Filter, Sartobran P 0.2 µm;Sartorius Stedim Biotech GmbH, Göttingen, Germany), withadditional macronutrients and micronutrients based on themodified Provasoli’s culture medium (Provasoli, 1963; Ismaret al., 2008). The algae were grown at 18◦C and a salinity of 18 psuin a temperature-controlled room, with constant light intensityat 100 µmol photons m−2 s−1 at a light:dark cycle of 16:8 h.Algal cultures were kept in 1 L Erlenmeyer flasks with 500 mLculture volume. All flasks were aerated slightly with filtered airand agitated manually twice per day at a set time.
Around 20 days prior to the copepod feeding experiment,batch cultures of Rhodomonas sp. were started under three N:Psupply ratios (N deficiency: N:P = 10:1 mol mol−1, 352 µmolL−1 for N and 36 µmol L−1 for P; balanced nutrient condition:N:P = 24:1 mol mol−1, 880 µmol L−1 for N and 36 µmol L−1
for P; P deficiency: N:P = 63:1 mol mol−1, 880 µmol L−1 forN, and 14 µmol L−1 for P). Background concentrations of Nand P in natural seawater were very low and thus negligible.The N:P molar ratio of 24:1 instead of canonical 16:1 wasconsidered balanced, consistent with the setup of N:P ratio inthe common and widely used f/2 medium (Guillard, 1975). TheN:P ratios of 10:1 and 63:1 were chosen to cover the typicalranges of N:P in the ocean, including coastal and eutrophicregions (Downing, 1997). The observed maximal growth rate(µmax, d−1) was calculated from cell number changes during theexponential growth phase. Cell density was determined daily andsubsequently transformed logarithmically. The linear increasingpart in log plot of cell density was defined as the exponentialphase. Once batch cultures reached the early stationary phase,semi-continuous cultures were started with two specific growthrates, 20% of µmax for N and P deficiency, and 80% of µmax forthe balanced nutrient condition. Three food quality treatmentswere determined according to our previous studies (Bi et al.,2012, 2014). Briefly, we observed the lowest N:P biomass ratiosin Rhodomonas sp. under N deficiency and 20% of µmax, theintermediate values under the balanced nutrient condition and80% of µmax, and the highest ones under P deficiency and20% of µmax (Bi et al., 2012). Moreover, PUFA contents in
Rhodomonas sp. were higher under N deficiency and low growthrates compared to those under P deficiency and balanced nutrientcondition (Bi et al., 2014).
Semi-continuous cultures were conducted three timescorresponding to the three runs of copepod chemical responseexperiments. Each treatment was run with two or three replicates.The outflows of semi-continuous cultures were daily suppliedto copepods as food. Before feeding copepods, food suspensionsfrom replicate flasks were pooled. Thus, copepod feeding was notinfluenced by variance between the algal culture replicates andcopepod replicates received identical food.
General Procedure of Copepod CulturesThe copepod A. tonsa isolated from the Kiel Bight was obtainedfrom the Department of Biology, Institute for Hydrobiologyand Fisheries Science at the University of Hamburg and keptin our laboratory at the Helmholtz Centre for Ocean ResearchKiel (GEOMAR) for more than three generations. The copepodswere routinely fed Rhodomonas sp. grown under the balancednutrient condition. The eggs of A. tonsa were stored in seawaterat 4◦C for later use, and those used in the experiments were notolder than 3 months. It has been observed that A. tonsa eggsretain a high viability for up to 1 year at cold storage of 2–3◦C(Drillet et al., 2006).
To initiate the experiments, a batch of eggs was incubatedin filtered natural seawater. Copepod cultures were maintainedunder the same ambient conditions and culture medium as thosein their diet throughout the experiment. The copepods werefed ad libitum Rhodomonas sp. until the cohort reached thecopepodite V–VI stages. Developmental stage of copepods wasidentified using a ZEISS Discovery V.8 microscope.
Experiments of Copepod ChemicalComposition ResponseTo test the effects of food quantity and quality on copepodchemical composition, we ran experiments using the algaefrom semi-continuous cultures. Six gradients of food quantitieswere set for each of the three food quality treatments(Table 1). Copepods were placed in 1 L Erlenmeyer flasks with800 mL culture volume under different food treatments at anapproximate density of 500 individuals L−1. This density iswithin the range of observed natural copepod aggregations inthe ocean (Haury and Yamazaki, 1995; Mauchline, 1998). Theinitial densities were set as approximately 190 individuals neededfor various chemical analyses and subsequent experiments withan estimated average mortality rate of 15 to 20% d−1. Threeexperimental runs were conducted to cover the wide range offood quantity in each food quality treatment. Duplicates ofeach food treatment were established. All culture flasks wereaerated slightly with filtered air and carefully agitated twice perday at a set time.
Copepods were acclimated to different food treatments for4 days prior to further measurements. During the acclimationperiod, the food was renewed daily to ensure that food qualityremained constant. Initial food concentrations were calculatedfrom the corresponding nominal algal concentrations and algal
Frontiers in Marine Science | www.frontiersin.org 3 April 2020 | Volume 7 | Article 274

fmars-07-00274 April 26, 2020 Time: 14:19 # 4
Bi and Sommer Interactions of Food Quantity and Quality
TABLE 1 | Initial food concentrations (calculated from the corresponding nominalinitial food concentrations and algal carbon contents; µg C L−1) under differentfood quantity and quality treatments [the balanced and fast growth diet (80% ofµmax), and N- and P-deficient and slow growth diet (20% of µmax)] in copepodchemical response experiments and egg production rate experiments.
Initial food concentration
N deficiency20% µmax
P deficiency20% µmax
Balanced N:P80% µmax
Chemical responseexperiments
41.6a 41.9a 29.9b
114.6b 133.9b 59.8b
237.9c 278.0c 176.9c
415.8a 419.2a 314.4a
916.5b 1059.6b 1257.8a
2079.2a 2096.1a 1914.5b
Egg production rateexperimentsa
415.8 419.2 314.4
2079.2 2096.1 1257.8
a,b,cCopepods were fed the diet from experiment run 1, 2, and 3, respectively.
C contents (Table 1); the mean concentrations were lower thaninitial values due to grazing. Food levels were adjusted once (highfood), twice (medium food), or three times daily (low food).This food concentration adjustment schedules were tailoredaccording to Campbell et al. (2001). After the acclimation period,approximately 120 individuals were harvested for chemicalanalyses, and the others (about 70 individuals) were picked outfor egg production experiments.
Egg Production ExperimentsThe adults were sorted from two food levels at each food qualitytreatment (Table 1). Five females and two males were transferredinto a Plexiglass chamber (10 cm in height, 5 cm diameter with a250 µm mesh 3 cm above the bottom), which was placed within a500 mL bottle filled with a total of 450 mL culture volume (filteredseawater and food). The 250 µm mesh allowed the eggs but notcopepod adults to pass through and thus strongly reduced thepossibility of egg cannibalism. Eight or ten replicates were setfor each treatment except for the lowest food quantity treatmentunder N deficiency, in which there were only five replicates.All cultures were maintained under the same conditions as inthe acclimation period. After 24 h, the eggs were collected witha 40 µm mesh and counted using a Bogorov tray. The 24 hduration is a suitable incubation period both to avoid the risk ofbiasing daily estimates and to be representative of the in situ rate(Runge and Roff, 2000).
Analytical ProcedureAlgal cells were counted daily using an improved Neubauerhemacytometer (Glaswarenfabrik Karl Hecht GmbH, RhönMountains, Germany) under microscope (Hund, Wetzlar,Germany). For elemental and FA analysis, algae at steady stateof semi-continuous cultures were harvested by filtration on pre-combusted Whatman GF/F filters (Whatman GmbH, Dassel,Germany), while copepods after the acclimation period were
first filtered through a 250 µm mesh and flushed thoroughlyto remove algae, and subsequently collected on pre-combustedWhatman GF/F filters. Samples for elemental analysis wereimmediately dried and stored in a desiccator, and those forFA analysis were frozen at −80◦C. Female adults used in eggproduction experiment were sorted and stored in −80◦C fornucleic acid analysis.
The determination of particulate organic C and N wascarried out after Sharp (1974) by gas chromatographyin an organic elemental analyzer (Thermo Flash 2000;Thermo Fisher Scientific, Inc., Schwerte, Germany).Particulate organic P was analyzed colorimetrically byconverting organic phosphorus compounds to orthophosphate(Hansen and Koroleff, 1999).
FAs were measured as fatty acid methyl esters (FAMEs) usinga gas chromatograph (Trace GC-Ultra; Thermo Fisher ScientificInc., Schwerte, Germany). Lipids were extracted with a solventmixture of chloroform:dichloromethane:methanol (1:1:1 volumeratios). The FAME mixture of 13:0, 15:0, 17:0, 19:0 and 21:0 wasadded as internal standard, and tricosanoic acid (23:0) addedas esterification control. Esterification was done at 50◦C witha mixture of toluene and methanol which was supplementedwith 1% concentrated sulphuric acid. The extract was dissolvedwith n-hexane to a final volume of 100 µL. Sample aliquots(1 µL) were given into the GC by splitless injection withhydrogen as the carrier gas. The GC was equipped with a flameionization detector and a TR-FAME-column (10 m, 0.1 mm i.d.,0.2 µm film). Temperature programme started at 50◦C for 1 min,increased by 30◦C min−1 to 150◦C, then 4◦C min−1 to 180◦Cand 30◦C min−1 to 240◦C. Individual FAs were integrated usingChromcard software (Thermo Fisher Scientific, Inc., Schwerte,Germany) and identified with reference to commercially availablestandards, Supelco 37 component FAME mixture and SupelcoMenhaden fish oil. FA data are shown as carbon-normalizedcontents (as µg mg C−1) and proportions (as a percentage oftotal FAs) in the two species (Supplementary Tables 1, 2). Inboth species, ω3-PUFAs with 18–22 carbon atoms (C18–C22)were mainly represented by a-linolenic acid (18:3n-3; ALA),stearidonic acid (SDA; 18:4n-3), EPA and DHA, while C18-C22ω6-PUFAs mainly included 18:2n-6, 18:3n-6 and arachidonicacid (20:4n-6; ARA).
RNA and DNA were analyzed in individual female copepodsaccording to Malzahn et al. (2007). Samples were freeze-driedfor at least 16 h before measurement. RNA and DNA werequantified fluorometrically in a microtiter fluorescence reader(Labsystems, Fluoreskan Ascent) using ethidium bromide asa fluorophore. Total nucleic acids were first measured, andsubsequently RNase (Serva, Ribonuclease A) was applied todigest RNA to measure the remaining DNA. Nucleic acidstandards were Lambda DNA (Boehringer 745782) and 16S and23S rRNA (Boehringer 206938). DNA amounts were calculatedbased on the relationship between RNA and DNA fluorescence(Le Pecq and Paoletti, 1966).
The extended stoichiometric hypothesis permits simultaneousanalysis of any number of dietary components for zooplanktonproduction (Anderson and Pond, 2000). Substrate i is limitingif it is in most demand relative to supply as compared to other
Frontiers in Marine Science | www.frontiersin.org 4 April 2020 | Volume 7 | Article 274

fmars-07-00274 April 26, 2020 Time: 14:19 # 5
Bi and Sommer Interactions of Food Quantity and Quality
substrates such as j, and so the strength of limitation of i relativeto j, Si:j, is:
Si:j =φi × K∗j × Zi:j
φj × K∗i × Fi:j(1)
where Fi:j and Zi:j are the i:j ratios of components i and jin food and consumer. Parameters Ki
∗ and Kj∗ are defined as
the maximum GGE for i and j, respectively. Only the limitingsubstrate will be used with a maximum GGE. To take accountof possible synthesis of EPA and DHA by the consumer, φi and φjare introduced as the fraction of demand for constituent i andj which is met directly by dietary intake. When the limitationpotential of component i is higher than that of component j, thevalue of Si:j is higher than one and vice versa.
The GGEs for elements are defined as the efficiencieswith which elements can be used for zooplankton production(Anderson, 1992; Anderson and Hessen, 1995; Anderson et al.,2004). The relative GGE for each element is governed by thestoichiometric ratio of the elements in the zooplankton versusthat in the food (Anderson and Hessen, 1995), and thus can becalculated as: KC/KN = ZC:N/FC:N and KC/KP = ZC:P/FC:P.
We show the results for SN:EPA and SN:DHA when A. tonsawas fed the N-deficient diet, and for SP:EPA and SP:DHA onthe P-deficient diet, respectively. We assume that there is zerosynthesis of EPA and DHA by A. tonsa, and thus parameters φEPAand φDHA are set to 1.0, as suggested by Anderson and Pond(2000). N and P must be of dietary origin, thus φN and φP are1.0. The possible upper bound for KN
∗ and KP∗ might be 0.8
(Anderson and Pond, 2000; Anderson et al., 2005; Mayor et al.,2009), thus KN
∗ and KP∗ are each set at 0.8 in this study for
A. tonsa on the N- and P-deficient diet, respectively. KEPA∗ and
KDHA∗ are each set at 0.9 (Anderson and Pond, 2000).
Statistical AnalysisOne-way analysis of variance (ANOVA) was conducted to test theeffects of experimental run on C:N, C:P and carbon-normalizedEPA and DHA contents in Rhodomonas sp., respectively. Thesame analysis was done for the effects of nutrient treatment.The effects of food quantity on the limiting strengths SN:EPAand SN:DHA in A. tonsa fed on the N-deficient diet, and SP:EPAand SP:DHA on the P-deficient diet were also tested by one-wayANOVA. Experimental run showed no significant effects on anyresponse variables in Rhodomonas sp. (Supplementary Table 3).Thus, C:N, C:P and EPA and DHA contents in Rhodomonas sp.are shown as the average values of the three experimental runs foreach food quality treatment.
Two-way ANOVA was applied to test the effects of foodquantity and quality treatments on C:N, C:P, the contentsof EPA and DHA, egg production rates and RNA:DNA inA. tonsa. If there were significant effects, a post hoc test [Tukey’shonest significant difference (HSD) test] was applied, and themagnitude of effect was calculated [ω2 = (effect sum of squares –effect degree of freedom × error mean square)/(total sum ofsquares + error mean square)] (Graham and Edwards, 2001;Hughes and Stachowicz, 2009).
Multiple regression was used to analyze the responses ofKC/KX, with the predicting variables of algal C:X ratio, food
quantity, (algal C:X ratio)2, (food quantity)2, and (algal C:Xratio) × (food quantity), here X = N and P, respectively.The same analysis was conducted for the ratios of carbon-normalized ω3- (and ω6-) PUFA contents between copepodsand algae (ω3-PUFA Z/f and ω6-PUFA Z/f). Dependent andindependent variables were Log10 (x) transformed to obtainapproximate normality and homogeneity of variance in multipleregression analyses.
All statistical analyses were conducted in Statistica 8 (StatSoft[Europe] GmbH, Hamburg, Germany). The significance level wasset to p < 0.05.
RESULTS
C:N:P StoichiometryThe ratios of C:N and C:P in Rhodomonas sp. respondedsignificantly to nutrient treatment changes (ANOVA; bold lettersin Table 2). Specifically, we observed the highest C:N ratios underN deficiency at 20% of µmax (Tukey’s HSD test, p < 0.001;Figure 1A and Supplementary Table 4), and the highest C:Pratios under P deficiency at 20% of µmax (Tukey’s HSD test,p ≤ 0.022; Figure 1B).
In A. tonsa, the C:N ratios varied significantly with differentfood quantity and quality treatments (ANOVA; Table 2), showinghigher values on the N-deficient diets than those in other twotreatments, especially at high food quantity (>900 µg C L−1)(Tukey’s HSD test, p ≤ 0.031; Figure 1C and SupplementaryTable 4). The C:P ratios showed non-significant responses to foodquantity and quality changes.
Fatty AcidsIn Rhodomonas sp., carbon-normalized contents of EPAresponded significantly to different nutrient treatments(ANOVA; Table 2), showing the highest values under Ndeficiency (Tukey’s HSD test, p < 0.001; Figure 2A andSupplementary Table 1). However, carbon-normalized contentsof DHA showed non-significant changes.
In A. tonsa, carbon-normalized EPA contents respondedsignificantly to the changes in food quantity and quality,while DHA varied significantly only with food quality changes(ANOVA; Table 2). The contents of EPA were generally higherat higher food quantities and on nutrient deficient diets (Tukey’sHSD test, p < 0.006; Figure 2C and Supplementary Table 2),while DHA was higher on the P-deficient diets than that on thebalanced nutrient diets (Tukey’s HSD test, p = 0.008; Figure 2D).
Gross Growth Efficiency of Elements andthe Relative Trophic Transfer Efficienciesof EFAs Versus CMultiple regression analyses show that the relative GGE ofKC/KN responded significantly to all independent variables,while for KC/KP regression with only the linear term [algalC:P ratio] and the quadratic term [food quantity]2 showed thebest model fit (bold letters in Table 3). Specifically, KC/KNdecreased with increasing food quality (algal C:N ratios), but
Frontiers in Marine Science | www.frontiersin.org 5 April 2020 | Volume 7 | Article 274
fmars-07-00274 April 26, 2020 Time: 14:19 # 6
Bi and Sommer Interactions of Food Quantity and Quality
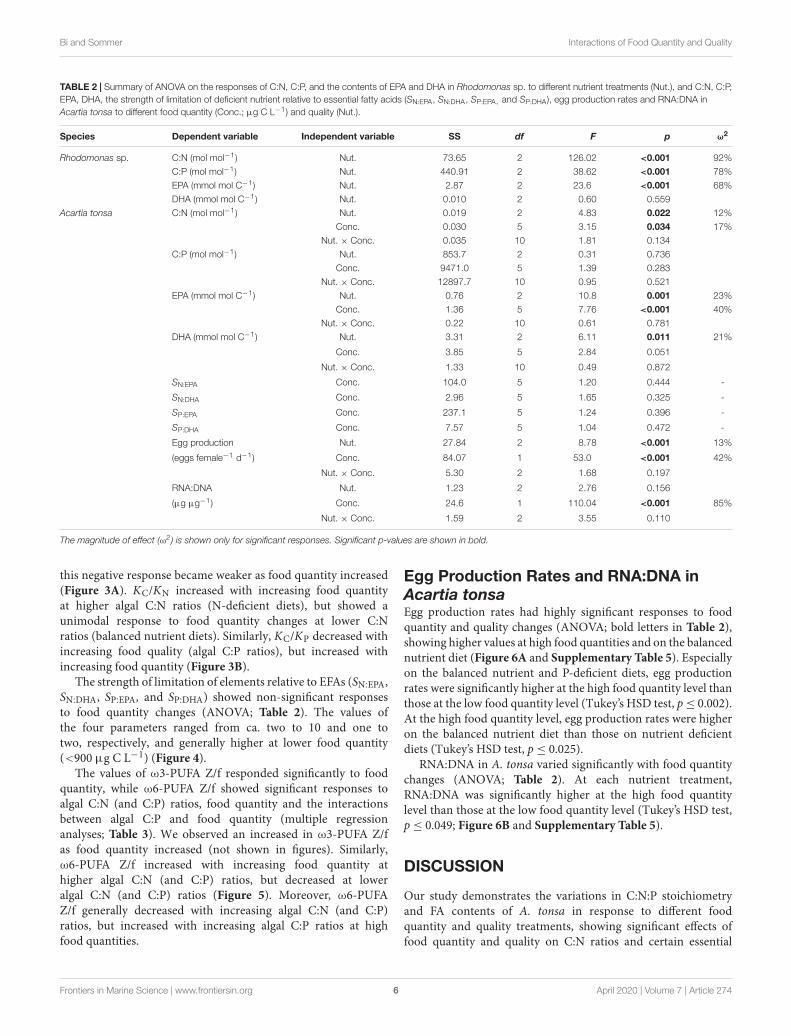
TABLE 2 | Summary of ANOVA on the responses of C:N, C:P, and the contents of EPA and DHA in Rhodomonas sp. to different nutrient treatments (Nut.), and C:N, C:P,EPA, DHA, the strength of limitation of deficient nutrient relative to essential fatty acids (SN:EPA, SN:DHA, SP:EPA, and SP:DHA), egg production rates and RNA:DNA inAcartia tonsa to different food quantity (Conc.; µg C L−1) and quality (Nut.).
Species Dependent variable Independent variable SS df F p ω2
Rhodomonas sp. C:N (mol mol−1) Nut. 73.65 2 126.02 <0.001 92%
C:P (mol mol−1) Nut. 440.91 2 38.62 <0.001 78%
EPA (mmol mol C−1) Nut. 2.87 2 23.6 <0.001 68%
DHA (mmol mol C−1) Nut. 0.010 2 0.60 0.559
Acartia tonsa C:N (mol mol−1) Nut. 0.019 2 4.83 0.022 12%
Conc. 0.030 5 3.15 0.034 17%
Nut. × Conc. 0.035 10 1.81 0.134
C:P (mol mol−1) Nut. 853.7 2 0.31 0.736
Conc. 9471.0 5 1.39 0.283
Nut. × Conc. 12897.7 10 0.95 0.521
EPA (mmol mol C−1) Nut. 0.76 2 10.8 0.001 23%
Conc. 1.36 5 7.76 <0.001 40%
Nut. × Conc. 0.22 10 0.61 0.781
DHA (mmol mol C−1) Nut. 3.31 2 6.11 0.011 21%
Conc. 3.85 5 2.84 0.051
Nut. × Conc. 1.33 10 0.49 0.872
SN:EPA Conc. 104.0 5 1.20 0.444 -
SN:DHA Conc. 2.96 5 1.65 0.325 -
SP:EPA Conc. 237.1 5 1.24 0.396 -
SP:DHA Conc. 7.57 5 1.04 0.472 -
Egg production Nut. 27.84 2 8.78 <0.001 13%
(eggs female−1 d−1) Conc. 84.07 1 53.0 <0.001 42%
Nut. × Conc. 5.30 2 1.68 0.197
RNA:DNA Nut. 1.23 2 2.76 0.156
(µg µg−1) Conc. 24.6 1 110.04 <0.001 85%
Nut. × Conc. 1.59 2 3.55 0.110
The magnitude of effect (ω2) is shown only for significant responses. Significant p-values are shown in bold.
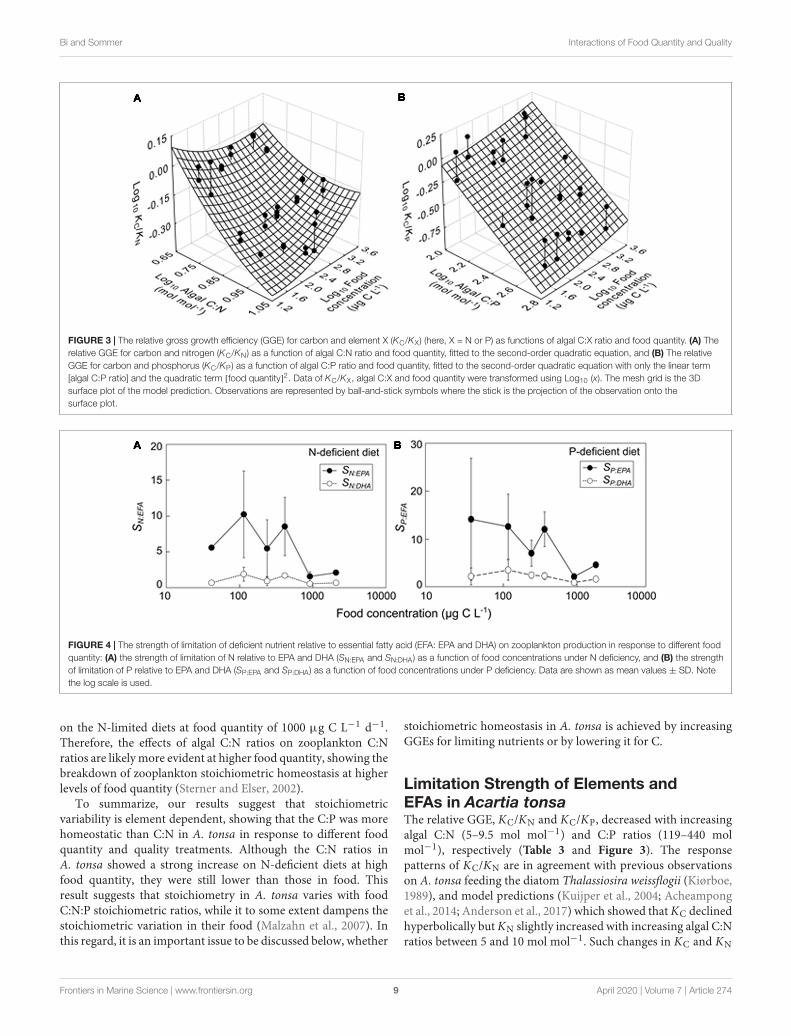
this negative response became weaker as food quantity increased(Figure 3A). KC/KN increased with increasing food quantityat higher algal C:N ratios (N-deficient diets), but showed aunimodal response to food quantity changes at lower C:Nratios (balanced nutrient diets). Similarly, KC/KP decreased withincreasing food quality (algal C:P ratios), but increased withincreasing food quantity (Figure 3B).
The strength of limitation of elements relative to EFAs (SN:EPA,SN:DHA, SP:EPA, and SP:DHA) showed non-significant responsesto food quantity changes (ANOVA; Table 2). The values ofthe four parameters ranged from ca. two to 10 and one totwo, respectively, and generally higher at lower food quantity(<900 µg C L−1) (Figure 4).
The values of ω3-PUFA Z/f responded significantly to foodquantity, while ω6-PUFA Z/f showed significant responses toalgal C:N (and C:P) ratios, food quantity and the interactionsbetween algal C:P and food quantity (multiple regressionanalyses; Table 3). We observed an increased in ω3-PUFA Z/fas food quantity increased (not shown in figures). Similarly,ω6-PUFA Z/f increased with increasing food quantity athigher algal C:N (and C:P) ratios, but decreased at loweralgal C:N (and C:P) ratios (Figure 5). Moreover, ω6-PUFAZ/f generally decreased with increasing algal C:N (and C:P)ratios, but increased with increasing algal C:P ratios at highfood quantities.
Egg Production Rates and RNA:DNA inAcartia tonsaEgg production rates had highly significant responses to foodquantity and quality changes (ANOVA; bold letters in Table 2),showing higher values at high food quantities and on the balancednutrient diet (Figure 6A and Supplementary Table 5). Especiallyon the balanced nutrient and P-deficient diets, egg productionrates were significantly higher at the high food quantity level thanthose at the low food quantity level (Tukey’s HSD test, p≤ 0.002).At the high food quantity level, egg production rates were higheron the balanced nutrient diet than those on nutrient deficientdiets (Tukey’s HSD test, p ≤ 0.025).
RNA:DNA in A. tonsa varied significantly with food quantitychanges (ANOVA; Table 2). At each nutrient treatment,RNA:DNA was significantly higher at the high food quantitylevel than those at the low food quantity level (Tukey’s HSD test,p ≤ 0.049; Figure 6B and Supplementary Table 5).
DISCUSSION
Our study demonstrates the variations in C:N:P stoichiometryand FA contents of A. tonsa in response to different foodquantity and quality treatments, showing significant effects offood quantity and quality on C:N ratios and certain essential
Frontiers in Marine Science | www.frontiersin.org 6 April 2020 | Volume 7 | Article 274

fmars-07-00274 April 26, 2020 Time: 14:19 # 7
Bi and Sommer Interactions of Food Quantity and Quality
FIGURE 1 | The C:N and C:P ratios (mean ± SD) in Rhodomonas sp. (A,B) under three nutrient treatments (N deficiency and 20% of µmax, P deficiency and 20% ofµmax, and the balanced nutrient condition and 80% of µmax), and in adult A. tonsa (C,D) under different food quantity and quality treatments [N- and P-deficient andslow growing diets (20% of µmax) and the balanced nutrient and fast growing diet (80% of µmax)]. Data presented in Rhodomonas sp. are mean values of the threeexperimental runs in each nutrient treatment. Note the log scale is used in (C,D).
FA contents but not on C:P ratios. In particular, we observedstronger changes in A. tonsa C:N at higher food concentrations,consistent with previous observations of relaxed rather than stricthomeostasis in A. tonsa (Malzahn et al., 2007). The limitationstrength of elements and EPA (and DHA) was quantified, and thetransfer efficiencies of EFAs and C were also tested to characterizethe mechanisms of homeostatic controls in A. tonsa. We showthat the GGE for C and transfer efficiency for EFAs would bereduced on N- and P-deficient diets, which can explain low eggproduction rates under nutrient deficient conditions.
Homeostasis of C:N:P Stoichiometry inAcartia tonsaFood quality showed significant effects on the C:N ratios, butnot C:P ratios in A. tonsa in our study (Table 2 and Figure 1),consistent with early observations for A. tonsa feeding onRhodomonas salina grown in nutrient-replete (f/2), and N andP-deplete treatments (Malzahn et al., 2010). Different responsesbetween C:N and C:P ratios in copepods can be explainedby the regulation of behavioral and physiological responseson different types of nutrient deficient phytoplankton (Burianet al., 2018). When exposed to N-deficient diets, A. tonsa
raised amino acid (AA) retention efficiencies to compensatelow dietary AA concentration, while the supply of essentialFA became co-limiting and restricted the further increase inAA retention efficiencies (Burian et al., 2018). In our study,DHA concentrations in A. tonsa were significantly higher onN-deficient diets, while those in algae showed non-significantchanges in response to nutrient concentration changes (Table 2and Figure 2), suggesting that DHA in the N-deficient dietmay have become limiting for A. tonsa. Essential FA depletionmay restrict upregulation of AA retention efficiencies andexplain higher C:N ratios in copepods such as Acartia spp.,Temora sp., Centropages sp., and Pseudo/Paracalanus spp. feedingon N-deficient diets in this study and previous work (VanNieuwerburgh et al., 2004; Malzahn et al., 2007; Franco-Santoset al., 2018). The exposure of A. tonsa to P-deficient diets causedthe increase in maximum ingestion rate (Burian et al., 2018),which may be also the case in our study and led to non-significantchanges in C:P ratios in A. tonsa.
Food quantity showed significant effects on the C:N ratios inA. tonsa, causing a clear increase in C:N ratios under high foodquantity (>900 µg C L−1) (Table 2 and Figure 1). Our resultsare comparable to previous studies (Malzahn et al., 2007, 2010),which showed significantly higher C:N ratios in A. tonsa feeding
Frontiers in Marine Science | www.frontiersin.org 7 April 2020 | Volume 7 | Article 274

fmars-07-00274 April 26, 2020 Time: 14:19 # 8
Bi and Sommer Interactions of Food Quantity and Quality
FIGURE 2 | The carbon-normalized contents (mean ± SD) of EPA (eicosapentaenoic acid; 20:5n-3) and DHA (docosahexaenoic acid; 22:6n-3) in Rhodomonas sp.(A,B) under three nutrient treatments (N deficiency and 20% of µmax, P deficiency and 20% of µmax, and the balanced nutrient condition and 80% of µmax), and inadult A. tonsa (C,D) under different food quantity and quality treatments [N- and P-deficient and slow growing diets (20% of µmax) and the balanced nutrient and fastgrowing diet (80% of µmax)]. Data presented in Rhodomonas sp. are mean values of the three experimental runs in each nutrient treatment. Note the log scale isused in (C,D).
TABLE 3 | Results of multiple regression analyses for the relative gross growth efficiency for carbon and nitrogen (KC/KN), the relative gross growth efficiency for carbonand phosphorus (KC/KP), the ratio of ω3-PUFA contents between Acartia tonsa and food (ω3-PUFA Z/f), and the ratio of ω6-PUFA contents between A. tonsa and food(ω6-PUFA Z/f).
Dependent variable Independent variable Parameter estimate ± SE t p r2 (adj.) n
KC/KN Algal C:N ratio (C:N) −4.74 ± 1.30 −3.68 0.001 0.86 35
Food concentration (Cf) −0.53 ± 0.14 −3.70 <0.001
C:N2 1.76 ± 0.76 2.31 0.028
Cf2 0.05 ± 0.03 2.13 0.042
C:N × Cf 0.38 ± 0.13 3.07 0.005
KC/KP Algal C:P ratio (C:P) −1.08 ± 0.10 −10.93 <0.001 0.79 33
Cf2 0.02 ± 0.01 2.17 0.038
ω3-PUFA Z/f C:N 0.16 ± 0.34 0.47 0.641 0.35 34
Cf 0.28 ± 0.06 4.38 <0.001
ω3-PUFA Z/f C:P 0.24 ± 0.14 1.72 0.096 0.40 34
Cf 0.27 ± 0.06 4.41 <0.001
ω6-PUFA Z/f C:N −4.55 ± 1.67 −2.73 0.011 0.29 34
Cf −0.93 ± 0.52 −1.78 0.085
C:N × Cf 1.22 ± 0.63 1.93 0.064
ω6-PUFA Z/f C:P −2.50 ± 0.71 −3.52 0.001 0.28 34
Cf −1.88 ± 0.66 −2.83 0.008
C:P × Cf 0.83 ± 0.28 2.95 0.006
All dependent variables and independent variables (algal C:N ratio, algal C:P ratio and food concentration) were transformed using Log10 (x). Significant p-values areshown in bold; n is the number of observations.
Frontiers in Marine Science | www.frontiersin.org 8 April 2020 | Volume 7 | Article 274
fmars-07-00274 April 26, 2020 Time: 14:19 # 9
Bi and Sommer Interactions of Food Quantity and Quality
FIGURE 3 | The relative gross growth efficiency (GGE) for carbon and element X (KC/KX) (here, X = N or P) as functions of algal C:X ratio and food quantity. (A) Therelative GGE for carbon and nitrogen (KC/KN) as a function of algal C:N ratio and food quantity, fitted to the second-order quadratic equation, and (B) The relativeGGE for carbon and phosphorus (KC/KP) as a function of algal C:P ratio and food quantity, fitted to the second-order quadratic equation with only the linear term[algal C:P ratio] and the quadratic term [food quantity]2. Data of KC/KX, algal C:X and food quantity were transformed using Log10 (x). The mesh grid is the 3Dsurface plot of the model prediction. Observations are represented by ball-and-stick symbols where the stick is the projection of the observation onto thesurface plot.
FIGURE 4 | The strength of limitation of deficient nutrient relative to essential fatty acid (EFA: EPA and DHA) on zooplankton production in response to different foodquantity: (A) the strength of limitation of N relative to EPA and DHA (SN:EPA and SN:DHA) as a function of food concentrations under N deficiency, and (B) the strengthof limitation of P relative to EPA and DHA (SP:EPA and SP:DHA) as a function of food concentrations under P deficiency. Data are shown as mean values ± SD. Notethe log scale is used.
on the N-limited diets at food quantity of 1000 µg C L−1 d−1.Therefore, the effects of algal C:N ratios on zooplankton C:Nratios are likely more evident at higher food quantity, showing thebreakdown of zooplankton stoichiometric homeostasis at higherlevels of food quantity (Sterner and Elser, 2002).
To summarize, our results suggest that stoichiometricvariability is element dependent, showing that the C:P was morehomeostatic than C:N in A. tonsa in response to different foodquantity and quality treatments. Although the C:N ratios inA. tonsa showed a strong increase on N-deficient diets at highfood quantity, they were still lower than those in food. Thisresult suggests that stoichiometry in A. tonsa varies with foodC:N:P stoichiometric ratios, while it to some extent dampens thestoichiometric variation in their food (Malzahn et al., 2007). Inthis regard, it is an important issue to be discussed below, whether
stoichiometric homeostasis in A. tonsa is achieved by increasingGGEs for limiting nutrients or by lowering it for C.
Limitation Strength of Elements andEFAs in Acartia tonsaThe relative GGE, KC/KN and KC/KP, decreased with increasingalgal C:N (5–9.5 mol mol−1) and C:P ratios (119–440 molmol−1), respectively (Table 3 and Figure 3). The responsepatterns of KC/KN are in agreement with previous observationson A. tonsa feeding the diatom Thalassiosira weissflogii (Kiørboe,1989), and model predictions (Kuijper et al., 2004; Acheamponget al., 2014; Anderson et al., 2017) which showed that KC declinedhyperbolically but KN slightly increased with increasing algal C:Nratios between 5 and 10 mol mol−1. Such changes in KC and KN
Frontiers in Marine Science | www.frontiersin.org 9 April 2020 | Volume 7 | Article 274

fmars-07-00274 April 26, 2020 Time: 14:19 # 10
Bi and Sommer Interactions of Food Quantity and Quality
FIGURE 5 | The ratio of ω6-polyunsaturated fatty acid (PUFA) contents (µg mg C−1) between A. tonsa and algae (ω6-PUFA Z/f) as a function of algal C:X ratio (here,X = N or P) and food quantity, fitted to the multiple regression model with the linear term algal C:X ratios, food quantity and the interactions between the two.(A) ω6-PUFA Z/f as a function of algal C:N and food quantity, and (B) ω6-PUFA Z/f as a function of algal C:P and food quantity. Data of ω6-PUFA Z/f, algal C:X andfood quantity were transformed using Log10 (x). The mesh grid is the 3D surface plot of the model prediction. Observations are represented by ball-and-sticksymbols where the stick is the projection of the observation onto the surface plot.
FIGURE 6 | Egg production rate (A) and RNA:DNA (B) (mean ± SD) in A. tonsa feeding on Rhodomonas sp. under different food quantity and quality treatments [N-and P-deficient and slow growing diets (20% of µmax) and the balanced nutrient and fast growing diet (80% of µmax)].
reveal the differential allocations of C and N to egg production,indicating a strong decrease in the fraction of C but a less changein that of N allocated to egg production with increasing algal C:Nratios in A. tonsa (Kuijper et al., 2004).
As food concentration increased, KC/KN increased at higheralgal C:N ratios (N-deficient diets) and showed a unimodalresponse at lower algal C:N ratios, while KC/KP increased overthe entire range of algal C:P ratios in our study (Table 3 andFigure 3). Previous studies have shown variable response patternsof GGE to increasing food concentrations in zooplankton,e.g., positive responses in the copepod Eudiaptomus graciloides(Hamburger and Boetius, 1987), Cyclops vicinus (Santer and vanden Bosch, 1994) and Daphnia (Anderson et al., 2005), negativeresponses in A. tonsa (Kiørboe et al., 1985; Wendt and Thor,2015), the cladoceran Penilia avirostris (Atienza et al., 2007) andthe copepod Oithona davisae (Almeda et al., 2010b), and non-significant changes in A. tonsa (Wendt and Thor, 2015). Suchvariations in zooplankton GGE responses to food concentrationscan be explained by differences in nutrient quality of food
(e.g., algal C:N and C:P ratios in the present study; Straile,1997; Bukovinszky et al., 2012), prey species (Wendt and Thor,2015), development stages of zooplankton (Almeda et al., 2010a),methodological protocols (Straile, 1997), as well as within-population genetic variance in the metabolic rate (Einum et al.,2019). In our study, KC/KN and KC/KP in A. tonsa were overallhigher at higher food concentrations, especially when feedingon N- and P-deficient diets (Figure 3). This result is generallyconsistent with the predictions of the metabolic stoichiometricmodel (Anderson et al., 2005). Metabolism has a high C:N ratio(Anderson et al., 2017) and accounts for a lower fraction of intakeat high intake (food concentrations), while more substrates areavailable for egg production (Anderson et al., 2005), indicatinghigher KC/KN at higher intake.
The values of SN:EPA, SN:DHA, SP:EPA, and SP:DHA were higherthan one in our study (Figure 4), suggesting that the limitationpotential of N (and P) was higher than that of EPA and DHAon the N- (and P-) deficient diet. Similarly, Mayor et al. (2009)suggested that limiting potentials for C and N were higher than
Frontiers in Marine Science | www.frontiersin.org 10 April 2020 | Volume 7 | Article 274

fmars-07-00274 April 26, 2020 Time: 14:19 # 11
Bi and Sommer Interactions of Food Quantity and Quality
those of EPA and DHA for egg production in the copepodCalanus finmarchicus in the north east Atlantic. Furthermore,Mayor et al. (2011) reported variable basal turnover rates andabsorption efficiencies for essential PUFAs and N in Calanus spp.,and showed that maintenance of essential PUFAs and absorbed Nis a prerequisite for growth, as substantial post-absorptive lossesof these substrates are associated with routine tissue maintenance.It can thus be expected that compared to EPA and DHA, the basalturnover rates of N (and P) in A. tonsa in the present study may behigher, especially at low food concentrations, causing a relativelyhigh proportion of N (and P) utilized for basal metabolisminstead of egg production on the N- (and P-) deficient diet. Thisassumption is in correspondence with the results in Malzahn et al.(2007), which suggested that mineral nutrient requirements haveto be satisfied first, and FAs can further promote growth of larvalherring in experimental tri-trophic food chains with P-deficientphytoplankton. While the primary roles of elemental versusbiochemical limitation on zooplankton have long been discussed(Hessen, 1992; Brett, 1993; Müller-Navarra, 1995; Brett et al.,2000; Boersma et al., 2008), our results highlight the necessaryto incorporate both elemental and biochemical approaches in thestudy of food webs (Anderson and Pond, 2000; Sterner and Elser,2002; Lampert, 2009; Hessen et al., 2013).
Moreover, lower values of SN:EPA, SN:DHA, SP:EPA, and SP:DHAat higher food concentrations indicate that the strength oflimitation of N (P) relative to EFAs was reduced as foodconcentrations increased (Figure 4). It is well-known thatingestion and assimilation of zooplankton such as Daphniaincrease with increasing food concentrations, and at thresholdfood concentrations the metabolic expenditure is balancedwith net food intake and production equals zero (Lampert,1977; Lampert and Sommer, 2007). According to the metabolicstoichiometric model, the proportions of C, N and P used forgrowth increase at high intake (Anderson et al., 2005). Thispositive relationship between growth efficiencies and intake canbe attributed to the diminishing relative cost of maintenance(Anderson et al., 2005), which may explain the reduced limitationstrength of N (and P) relative to EFAs at high food concentrationsin A. tonsa in this study.
Altogether, we suggest that homeostatic stoichiometry inA. tonsa may be maintained by the reduced KC and increasedKN (and KP) when feeding on N- (and P-) deficient diets,which underlies differential mechanisms of C and N (and P)in controlling zooplankton production, and indicates that Nand P are retained more efficiently than C in zooplankton.Significant interactions between food quantity and quality onKC/KN indicate that differences in dietary C:N ratios can resultin variable responses of GGE to food concentration changes inA. tonsa. Our results indicate a higher limitation potential of N(and P) than that of EPA and DHA for A. tonsa feeding on the N-(and P-) deficient diet, while the limitation potential of N (and P)was reduced as food concentration increased.
Egg Production Rates in Acartia tonsaOur results show that egg production rates in A. tonsa respondedsignificantly to the changes of food quantity and quality, showingoverall higher values on the balanced nutrient diets at the high
food quantity level, and the lower ones on nutrient deficiencydiets at the low food quantity (Table 2 and Figure 6). It iswell-established that egg production rate is higher when thefood is obtained from nutrient-enriched or other optimizedenvironments (Kleppel et al., 1998). Our results are generallyin agreement with early observations which showed higheregg production rates in A. tonsa at higher food quantities(Jónasdóttir, 1994; Gusmão and McKinnon, 2009; Acheamponget al., 2011; Wendt and Thor, 2015), or at higher food qualities(lower food C:N ratios) (Kiørboe, 1989). In contrast, non-significant changes or a decrease in egg production rates werealso found with increasing dietary C:N in A. tonsa (Jónasdóttir,1994; Augustin and Boersma, 2006). For example, at similarfood quantity and elemental food quality using the same algalspecies with our study, Augustin and Boersma (2006) reportedthat egg production rates in A. tonsa were about 10 eggsfemale−1 d−1 on N-sufficient diets, which was higher thanthat on N-depleted diets (about 4 eggs female−1 d−1) at 15◦Cand a salinity of 32–33. These values of egg production rateswere lower than that in our study (14 and 22 eggs female−1
d−1 on N deficient and balanced nutrient diets, respectively;Supplementary Table 5), where A. tonsa was cultured at 18◦Cand a salinity of 18. It has been observed that egg productionrates in copepods vary strongly with the changes in temperature(Koski and Kuosa, 1999; Holste and Peck, 2006; Neila et al., 2012)and salinity (Augustin, 2006; Peck and Holste, 2006; Devrekeret al., 2009); therefore, differences in temperature and salinitymay potentially explain the differential results in our study andAugustin and Boersma (2006). Future studies should considerthe interactions between environmental factors and food qualityto better understand the responses of copepod production to thechanging environments.
Biochemical limitation may be one of reasonable options toexplain the low egg production rates when feeding on nutrientdeficient diets in our study, because nutrient deficiency ofphytoplankton can influence its biochemical contents such as FAs(Bi et al., 2014, 2017). Also, it has been observed that higher EFAcontents have positive effects on egg production rates in A. tonsa(Amin et al., 2011; Rossoll et al., 2012). Thus, nutrient deficiencymight be the ultimate cause and FA-limitation the proximatecause of lowered egg production rate. This, however, is not thecase in our study, as PUFA contents in Rhodomonas sp. were evenhigher under N- and P-deficient conditions (SupplementaryTable 1). This result is in agreement with stoichiometric analysisabove which showed that N (and P) had a limitation potentialhigher than that of EFAs for A. tonsa on the N- (and P-)deficient diet.
Furthermore, we observed that the ratios of ω3- (and ω6-)PUFA contents between A. tonsa and food (PUFA Z/f) variedwith food concentrations and nutrient treatments (Table 3and Figure 5). For example, we observed significant negativeresponses of ω6-PUFA Z/f to increasing food C:N and C:P ratios,suggesting that the relative transfer efficiency of ω6-PUFA tocarbon may reduce with increasing food C:N and C:P. BecauseKC in A. tonsa may decrease on N- and P-deficient diets, itis reasonable to assume that transfer efficiency of ω6-PUFAsmay also decrease, and even to a larger extent compared to
Frontiers in Marine Science | www.frontiersin.org 11 April 2020 | Volume 7 | Article 274

fmars-07-00274 April 26, 2020 Time: 14:19 # 12
Bi and Sommer Interactions of Food Quantity and Quality
carbon, in such food conditions. Co-limitation of food quantity(in terms of carbon) and quality (in terms of N, P and FAs) hasbeen observed to influence the egg production of the North Seacopepod Pseudocalanus elongatus (Koski et al., 2010). Also, ourresults suggest that a lowered GGE for C might also lower theGGE of EFAs, which would mean that elements and EFAs areinteractive-essential and not Liebig-type essential resources forthe egg production in A. tonsa.
CONCLUSION
Our study provides new insight into trophic interactions betweenmarine phytoplankton and copepods, with emphasis on trophictransfer of elements and EFAs, as well as the regulationsof zooplankton reproduction. Overall, C:N ratios in A. tonsachanged significantly; however, the copepod C:P was morehomeostatic than C:N and independent from algal C:P, but stillshowed some degree of variability. We also showed that C:N:Pin A. tonsa was more homeostatic than its diets. Homeostasis inA. tonsa can be maintained via regulating GGEs for elements,with a reduced GGE for C and enhanced GGEs for N (and P)on N- (and P-) deficient diets assumed based on our results.Moreover, we first conducted experimental and mathematicalanalysis on elemental and FA limitation of food quality, showinga higher limitation potential of N (and P) relative to EPA andDHA for A. tonsa egg production when feeding on the N-(and P-) deficient diet. Egg production rates in A. tonsa wereconsiderably reduced as the costs associated with homeostaticregulations on nutrient deficient diets. Along with the loweredGGE for C, reduced transfer efficiency of ω3- and ω6-PUFAs mayalso contribute to low egg production rates on nutrient deficientdiets. Therefore, N and P deficiency in the environments can alterphytoplankton chemical composition, reduce trophic transferefficiencies of C and EFAs from phytoplankton to zooplankton,decrease zooplankton production, and eventually change thestructure and functions of marine food webs.
DATA AVAILABILITY STATEMENT
All datasets generated for this study are included in thearticle/Supplementary Material.
AUTHOR CONTRIBUTIONS
RB and US planning of experiments and writing. RBconduction of experiments, sample analysis, data analysisand figures.
FUNDING
This study was supported by the National Natural ScienceFoundation of China (Grant Nos. 41876118 and 41630966),the State Sponsored Graduate Scholarship Program, ChinaScholarship Council (CSC), and the Youth Talent SupportProgram of the Laboratory for Marine Ecology andEnvironmental Science, Pilot National Laboratory for MarineScience and Technology (Qingdao) (Grant No. LMEES-YTSP-2018-02-01).
ACKNOWLEDGMENTS
We wish to thank Thomas Hansen, Cordula Meyer, andBente Gardeler for technical assistance, and Alexander Raschke,Tanya Schchipkova, Hui Zhang, and Ashley Cipriano for theirhelp during the experiments. We thank Martina Wichmann,Berenike Diekmann and Myron Peck for providing Acartiatonsa eggs, Dennis Rossoll for introducing the protocol forassessing copepod egg production, and Dennis Brenneckefor helping with FA analysis. We are also grateful forcomments from Stefanie Ismar, Meixun Zhao and threereviewers that greatly improved this manuscript. This work ismodified after the Ph.D. thesis of Bi (2013). This is MCTLcontribution 217.
SUPPLEMENTARY MATERIAL
The Supplementary Material for this article can be foundonline at: https://www.frontiersin.org/articles/10.3389/fmars.2020.00274/full#supplementary-material
REFERENCESAcheampong, E., Campbell, R. W., Diekmann, A. B. S., and St John, M. A.
(2011). Food availability effects on reproductive strategy: the case of Acartiatonsa (Copepoda: Calanoida). Mar. Ecol. Prog. Ser. 428, 151–159. doi: 10.3354/meps09061
Acheampong, E., Hense, I., and St John, M. A. (2014). A model for the descriptionof feeding regulation by mesozooplankton under different conditions oftemperature and prey nutritional status. Ecol. Model. 272, 84–97. doi: 10.1016/j.ecolmode1.2013.09.009
Almeda, R., Augustin, C. B., Alcaraz, M., Calbet, A., and Saiz, E. (2010a). Feedingrates and gross growth efficiencies of larval developmental stages of Oithonadavisae (Copepoda, Cyclopoida). J. Exp. Mar. Biol. Ecol. 387, 24–35. doi: 10.1016/j.jembe.2010.03.002
Almeda, R., Calbet, A., Alcaraz, M., Yebra, L., and Saiz, E. (2010b). Effects oftemperature and food concentration on the survival, development and growthrates of naupliar stages of Oithona davisae (Copepoda, Cyclopoida). Mar. Ecol.Prog. Ser. 410, 97–109. doi: 10.3354/meps08625
Amarasinghe, P. B., Boersma, M., and Vijverberg, J. (1997). The effectof temperature, and food quantity and quality on the growth anddevelopment rates in laboratory-cultured copepods and cladocerans from aSri Lankan reservoir. Hydrobiologia 350, 131–144. doi: 10.1023/a:1003087815861
Ambler, J. W. (1986). Effect of food quantity and quality on egg production ofacartia tonsa dana from East Lagoon, Galveston, Texas. Estuar. Coast. Shelf Sci.23, 183–196. doi: 10.1016/0272-7714(86)90053-3
Amin, R. M., Koski, M., Bamstedt, U., and Vidoudez, C. (2011). Strain-relatedphysiological and behavioral effects of Skeletonema marinoi on three common
Frontiers in Marine Science | www.frontiersin.org 12 April 2020 | Volume 7 | Article 274

fmars-07-00274 April 26, 2020 Time: 14:19 # 13
Bi and Sommer Interactions of Food Quantity and Quality
planktonic copepods. Mar. Biol. 158, 1965–1980. doi: 10.1007/s00227-011-1706-7
Anderson, T. R. (1992). Modelling the influence of food C:N ratio, and respirationon growth and nitrogen excretion in marine zooplankton and bacteria.J. Plankton Res. 14, 1645–1671. doi: 10.1093/plankt/14.12.1645
Anderson, T. R., Boersma, M., and Raubenheimer, D. (2004). Stoichiometry:linking elements to biochemicals. Ecology 85, 1193–1202. doi: 10.1890/02-0252
Anderson, T. R., and Hessen, D. O. (1995). Carbon or nitrogen limitation in marinecopepods? J. Plankton Res. 17, 317–331. doi: 10.1093/plankt/17.2.317
Anderson, T. R., Hessen, D. O., Boersma, M., Urabe, J., and Mayor, D. J. (2017).Will invertebrates require increasingly carbon-rich food in a warming world?Am. Nat. 190, 725–742. doi: 10.1086/694122
Anderson, T. R., Hessen, D. O., Elser, J. J., and Urabe, J. (2005). Metabolicstoichiometry and the fate of excess carbon and nutrients in consumers. Am.Nat. 165, 1–15. doi: 10.1086/426598
Anderson, T. R., and Pond, D. W. (2000). Stoichiometric theory extended tomicronutrients: Comparison of the roles of essential fatty acids, carbon, andnitrogen in the nutrition of marine copepods. Limnol. Oceanogr. 45, 1162–1167.doi: 10.4319/lo.2000.45.5.1162
Arts, M. T., Ackman, R. G., and Holub, B. J. (2001). Essential fatty acids in aquaticecosystems: a crucial link between diet and human health and evolution. Can.J. Fish. Aquat. Sci. 58, 122–137. doi: 10.1139/f00-224
Atienza, D., Calbet, A., Saiz, E., and Lopes, R. M. (2007). Ecological success of thecladoceran Penilia avirostris in the marine environment: feeding performance,gross growth efficiencies and life history. Mar. Biol. 151, 1385–1396. doi: 10.1007/s00227-006-0578-8
Augustin, C. B. (2006). Food and Climate Effects On Copepod Reproduction In TheNorth and Baltic Seas. Ph. D. thesis, Christian-Albrechts-Universität zu Kiel,Kiel.
Augustin, C. B., and Boersma, M. (2006). Effects of nitrogen stressed algae ondifferent Acartia species. J. Plankton Res. 28, 429–436. doi: 10.1093/plankt/fbi131
Becker, C., and Boersma, M. (2005). Differential effects of phosphorus and fattyacids on Daphnia magna growth and reproduction. Limnol. Oceanogr. 50,388–397. doi: 10.2307/3597910
Bi, R. (2013). Chemical Composition Of Phytoplankton As The Determinant Of FoodQuality. Ph. D. thesis, Christian-Albrechts-Universität zu Kiel, Kiel.
Bi, R., Arndt, C., and Sommer, U. (2012). Stoichiometric responses ofphytoplankton species to the interactive effect of nutrient supply ratios andgrowth rates. J. Phycol. 48, 539–549. doi: 10.1111/j.1529-8817.2012.01163.x
Bi, R., Arndt, C., and Sommer, U. (2014). Linking elements to biochemicals:effects of nutrient supply ratios and growth rates on fatty acid composition ofphytoplankton species. J. Phycol. 50, 117–130. doi: 10.1111/jpy.12140
Bi, R., Ismar, S. M. H., Sommer, U., and Zhao, M. (2017). Environmentaldependence of the correlations between stoichiometric and fatty acid-basedindicators of phytoplankton nutritional quality. Limnol. Oceanogr. 62, 334–347.doi: 10.1002/lno.10429
Bi, R., Ismar, S. M. H., Sommer, U., and Zhao, M. (2018). Simultaneous shiftsin stoichiometric and fatty acid composition of Emiliania huxleyi in responseto environmental changes. Biogeosciences 15, 1029–1045. doi: 10.5194/bg-15-1029-2018
Boersma, M. (2000). The nutritional quality of P-limited algae for Daphnia. Limnol.Oceanogr. 45, 1157–1161. doi: 10.4319/lo.2000.45.5.1157
Boersma, M., Aberle, N., Hantzsche, F. M., Schoo, K. L., Wiltshire, K. H., andMalzahn, A. M. (2008). Nutritional limitation travels up the food chain.Internat. Rev. Hydrobiol. 93, 479–488. doi: 10.1002/iroh.200811066
Boersma, M., and Kreutzer, C. (2002). Life at the edge: is food quality really ofminor importance at low quantities?. Ecology 83, 2552–2561. doi: 10.1890/0012-9658(2002)083%5B2552:lateif%5D2.0.co;2
Boyce, D. G., Lewis, M. R., and Worm, B. (2010). Global phytoplankton declineover the past century. Nature 466, 591–596. doi: 10.1038/nature09268
Brett, M., and Müller-Navarra, D. C. (1997). The role of highly unsaturated fattyacids in aquatic foodweb processes. Freshw. Biol. 38, 483–499. doi: 10.1046/j.1365-2427.1997.00220.x
Brett, M. T. (1993). Comment on Possibility of N or P limitation for planktoniccladocerans: an experimental test (Urabe and Watanabe) and Nutrient elementlimitation of zooplankton production (Hessen). Limnol. Oceanogr. 38, 1333–1337. doi: 10.4319/lo.1993.38.6.1333
Brett, M. T., Muller-Navarra, D. C., and Park, S. K. (2000). Empirical analysisof the effect of phosphorus limitation on algal food quality for freshwaterzooplankton. Limnol. Oceanogr. 45, 1564–1575. doi: 10.4319/lo.2000.45.7.1564
Bukovinszky, T., Verschoor, A. M., Helmsing, N. R., Bezemer, T. M., Bakker, E. S.,Vos, M., et al. (2012). The good, the bad and the plenty: Interactive effects offood quality and quantity on the growth of different Daphnia species. PLoS One7:42966. doi: 10.1371/journal.pone.0042966
Burian, A., Grosse, J., Winder, M., and Boschker, H. T. S. (2018). Nutrientdeficiencies and the restriction of compensatory mechanisms in copepods.Funct. Ecol. 32, 636–647. doi: 10.1111/1365-2435.13016
Campbell, R. G., Melissa, M. W., Gregory, J. T., Carla, A. B., and Edward, G. D.(2001). Growth and development rates of the copepod Calanus finmarchicusreared in the laboratory. Mar. Ecol. Prog. Ser. 221, 161–183. doi: 10.3354/meps221161
Capuzzo, E., Lynam, C. P., Barry, J., Stephens, D., Forster, R. M., Greenwood,N., et al. (2018). A decline in primary production in the North Sea over 25years, associated with reductions in zooplankton abundance and fish stockrecruitment. Glob. Change Biol. 24, E352–E364. doi: 10.1111/gcb.13916
Dagg, M. (1977). Some effects of patchy food environments on copepods. Limnol.Oceanogr. 22, 99–107. doi: 10.4319/lo.1977.22.1.0099
Devreker, D., Souissi, S., Winkler, G., Forget-Leray, J., and Leboulenger, F. (2009).Effects of salinity, temperature and individual variability on the reproduction ofEurytemora affinis (Copepoda; Calanoida) from the seine estuary: a laboratorystudy. J. Exp. Mar. Biol. Ecol. 368, 113–123. doi: 10.1016/j.jembe.2008.10.015
Diez, B., Van Nieuwerburgh, L., and Snoeijs, P. (2013). Water nutrientstoichiometry modifies the nutritional quality of phytoplankton and somaticgrowth of crustacean mesozooplankton. Mar. Ecol. Prog. Ser. 489, 93–105.doi: 10.3354/meps10438
Downing, J. A. (1997). Marine nitrogen: phosphorus stoichiometry and the globalN:P cycle. Biogeochemistry 37, 237–252. doi: 10.1023/a:1005712322036
Drillet, G., Iversen, M. H., Sørensen, T. F., Ramløv, H., Lund, T., and Hansen,B. W. (2006). Effect of cold storage upon eggs of a calanoid copepod, Acartiatonsa (Dana) and their offspring. Aquaculture 254, 714–729. doi: 10.1016/j.aquaculture.2005.11.018
Edwards, M., and Richardson, A. J. (2004). Impact of climate change on marinepelagic phenology and trophic mismatch. Nature 430, 881–884. doi: 10.1038/nature02808
Einum, S., Fossen, E. I. F., Parry, V., and Pelabon, C. (2019). Genetic variation inmetabolic rate and correlations with other energy budget components and lifehistory in Daphnia magna. Evol. Biol. 46, 170–178. doi: 10.1007/s11692-019-09473-x
Franco-Santos, R. M., Auel, H., Boersma, M., De Troch, M., Meunier, C. L., andNiehoff, B. (2018). Bioenergetics of the copepod Temora longicornis underdifferent nutrient regimes. J. Plankton Res. 40, 420–435. doi: 10.1093/plankt/fby016
Galbraith, E. D., and Martiny, A. C. (2015). A simple nutrient-dependencemechanism for predicting the stoichiometry of marine ecosystems. Proc. Natl.Acad. Sci. U.S.A. 112, 8199–8204. doi: 10.1073/pnas.1423917112
Gladyshev, M., Sushchik, N., Anishchenko, O., Makhutova, O., Kolmakov, V.,Kalachova, G., et al. (2011). Efficiency of transfer of essential polyunsaturatedfatty acids versus organic carbon from producers to consumers in a eutrophicreservoir. Oecologia 165, 521–531. doi: 10.1007/s00442-010-1843-6
Gorokhova, E. (2003). Relationships between nucleic acid levels and eggproduction rates in Acartia bifilosa: implications for growth assessment ofcopepods in situ. Mar. Ecol. Prog. Ser. 262, 163–172. doi: 10.3354/meps262163
Graham, M. H., and Edwards, M. S. (2001). Statistical significance versus fit:estimating the importance of individual factors in ecological analysis ofvariance. Oikos 93, 505–513. doi: 10.1034/j.1600-0706.2001.930317.x
Guillard, R. R. L. (1975). “Culture of phytoplankton for feeding marineinvertebrates,” in Culture of Marine Invertebrate Animals, eds W. L. Smith, andM. H. Chanley, (Boston, MA: Springer), 29–60. doi: 10.1007/978-1-4615-8714-9_3
Gusmão, L. F. M., and McKinnon, A. D. (2009). The effect of food type and quantityon egg production and nucleic acid content of Acartia sinjiensis. Aquaculture296, 71–80. doi: 10.1016/j.aquaculture.2009.08.015
Gusmão, L. F. M., and McKinnon, A. D. (2011). Nucleic acid indices of eggproduction in the tropical copepod Acartia sinjiensis. J. Exp. Mar. Biol. Ecol.396, 122–137. doi: 10.1016/j.jembe.2010.10.008
Frontiers in Marine Science | www.frontiersin.org 13 April 2020 | Volume 7 | Article 274

fmars-07-00274 April 26, 2020 Time: 14:19 # 14
Bi and Sommer Interactions of Food Quantity and Quality
Hamburger, K., and Boetius, F. (1987). Ontogeny of growth, respiration andfeeding rate of the freshwater calanoid copepod Eudiaptomus graciloides.J. Plankton Res. 9, 589–606. doi: 10.1093/plankt/9.4.589
Hansen, H. P., and Koroleff, F. (1999). “Determination of nutrients,” in Methodsof Seawater Analysis, 3rd Edn, eds K. Grasshoff, K. Kremling, and M. Ehrhardt,(Weinheim: Wiley-VCH), 159–228. doi: 10.1002/9783527613984.ch10
Harris, R., Wiebe, P., Lenz, J., Skjoldal, H. R., and Huntley, M. (2000). ZooplanktonMethodology Manual. London: Academic Press.
Haury, L. R., and Yamazaki, H. (1995). The dichotomy of scales in the perceptionand aggregation behavior of zooplankton. J. Plankton Res. 17, 191–197. doi:10.1093/plankt/17.1.191
Herstoff, E. M., Baines, S. B., Boersma, M., and Meunier, C. L. (2019). Does preyelemental stoichiometry influence copepod movement over ontogeny? Limnol.Oceanogr. 9999, 1–11. doi: 10.1002/lno.11198
Hessen, D. O. (1992). Nutrient element limitation of zooplankton production. Am.Nat. 140, 799–814. doi: 10.1086/285441
Hessen, D. O. (2008). Efficiency, energy and stoichiometry in pelagic food webs;reciprocal roles of food quality and food quantity. Freshw. Rev. 1, 43–57. doi:10.1608/frj-1.1.3
Hessen, D. O., Elser, J. J., Sterner, R. W., and Urabe, J. (2013). Ecologicalstoichiometry: An elementary approach using basic principles. Limnol.Oceanogr 58, 2219–2236. doi: 10.4319/lo.2013.58.6.2219
Holste, L., and Peck, M. (2006). The effects of temperature and salinity on eggproduction and hatching success of Baltic Acartia tonsa (Copepoda: Calanoida):a laboratory investigation. Mar. Biol. 148, 1061–1070. doi: 10.1007/s00227-005-0132-0
Hughes, A. R., and Stachowicz, J. J. (2009). Ecological impacts of genotypicdiversity in the clonal seagrass Zostera marina. Ecology 90, 1412–1419. doi:10.1890/07-2030.1
Ilic, M., Werner, C., and Fink, P. (2019). Equal relevance of omega-3 and omega-6polyunsaturated fatty acids for the fitness of Daphnia spp. Limnol. Oceanogr. 64,2512–2525. doi: 10.1002/lno.11201
Ismar, S. M. H., Hansen, T., and Sommer, U. (2008). Effect of food concentrationand type of diet on Acartia survival and naupliar development. Mar. Biol. 154,335–343. doi: 10.1007/s00227-008-0928-9
Jónasdóttir, S. H. (1994). Effects of food quality on the reproductive success ofAcartia tonsa and Acartia hudsonica: laboratory observations. Mar. Biol. 121,67–81. doi: 10.1007/BF00349475
Jónasdóttir, S. H., Visser, A. W., and Jespersen, C. (2009). Assessing the role of foodquality in the production and hatching of Temora longicornis eggs. Mar. Ecol.Prog. Ser. 382, 139–150. doi: 10.3354/meps07985
Kainz, M., Arts, M. T., and Mazumder, A. (2004). Essential fatty acids in theplanktonic food web and their ecological role for higher trophic levels. Limnol.Oceanogr. 49, 1784–1793. doi: 10.4319/lo.2004.49.5.1784
Kiørboe, T. (1989). Phytoplankton growth rate and nitrogen content: implicationsfor feeding and fecundity in a herbivorous copepod. Mar. Ecol. Prog. Ser. 55,229–234. doi: 10.3354/meps055229
Kiørboe, T., Møhlenberg, F., and Hamburger, K. (1985). Bioenergetics of theplanktonic copepod Acartia tonsa: relation between feeding, egg productionand respiration, and composition of specific dynamic action. Mar. Ecol. Prog.Ser. 26, 85–97. doi: 10.3354/meps026085
Kleppel, G. S., Burkart, C., and Tomas, C. (1998). Egg production of the copepodAcartia tonsa in Florida Bay during summer. 1. The roles of food environmentand diet. Estuaries 21, 328–339. doi: 10.2307/1352479
Koski, M., Dutz, J., Klein Breteler, W., Rampen, S., and Noordeloos, A. (2010).Seasonal changes in food quantity and quality of the common NorthSea copepods Temora longicornis and Pseudocalanus elongatus: a bioassayapproach. Mar. Ecol. Prog. Ser. 399, 141–155. doi: 10.3354/meps08357
Koski, M., and Kuosa, H. (1999). The effect of temperature, food concentration andfemale size on the egg production of the planktonic copepod Acartia bifilosa.J. Plankton Res. 21, 1779–1790. doi: 10.1093/plankt/21.9.1779
Kuijper, L. D. J., Anderson, T. R., and Kooijman, S. A. L. M. (2004). C and N grossgrowth efficiencies of copepod egg production studied using a Dynamic EnergyBudget model. J. Plankton Res. 26, 213–226. doi: 10.1093/plankt/fbh020
Lampert, W. (1977). Studies on the carbon balance of Daphnia pulex as related toenvironmental conditions. IV. Determination of the ’threshold’ concentrationas a factor controlling the abundance of zooplankton species. Arch. Hydrobiol.48, 361–368.
Lampert, W. (2009). “Foreword,” in Lipids in Aquatic Ecosystems, eds M. T. Arts,M. T. Brett, and M. J. Kainz, (Heidelberg: Springer), 5–6. doi: 10.1111/j.1651-2227.2006.tb02370.x
Lampert, W., and Sommer, U. (2007). Limnoecology: The Ecology Of Lakes AndStreams. Oxford: Oxford University Press.
Le Pecq, J.-B., and Paoletti, C. (1966). A new fluorometric method for RNA andDNA determination. Anal. Biochem. 17, 100–107. doi: 10.1016/0003-2697(66)90012-1
Lewandowska, A. M., Boyce, D. G., Hofmann, M., Matthiessen, B., Sommer, U.,and Worm, B. (2014). Effects of sea surface warming on marine plankton. Ecol.Lett. 17, 614–623. doi: 10.1111/ele.12265
Li, W., Xu, X., Yao, J., Tanaka, N., Nishimura, O., and Ma, H. (2019). Combinedeffects of elevated carbon dioxide and temperature on phytoplankton-zooplankton link: a multi-influence of climate change on freshwater planktoniccommunities. Sci. Total. Environ. 658, 1175–1185. doi: 10.1016/j.scitotenv.2018.12.180
Loick-Wilde, N., Fernandez-Urruzola, I., Eglite, E., Liskow, I., Nausch, M., Schulz-Bull, D., et al. (2019). Stratification, nitrogen fixation, and cyanobacterialbloom stage regulate the planktonic food web structure. Glob. Change Biol. 25,794–810. doi: 10.1111/gcb.14546
Lotze, H. K., Tittensor, D. P., Bryndum-Buchholz, A., Eddy, T. D., Cheung,W. W. L., Galbraith, E. D., et al. (2019). Global ensemble projections revealtrophic amplification of ocean biomass declines with climate change. Proc. Natl.Acad. Sci. U.S.A. 116, 12907–12912. doi: 10.1073/pnas.1900194116
Malzahn, A. M., Aberle, N., Clemmesen, C., and Boersma, M. (2007). Nutrientlimitation of primary producers affects planktivorous fish condition. Limnol.Oceanogr. 52, 2062–2071. doi: 10.4319/lo.2007.52.5.2062
Malzahn, A. M., and Boersma, M. (2012). Effects of poor food quality on copepodgrowth are dose dependent and non-reversible. Oikos 121, 1408–1416. doi:10.1111/j.1600-0706.2011.20186.x
Malzahn, A. M., Hantzsche, F., Schoo, K. L., Boersma, M., and Aberle, N.(2010). Differential effects of nutrient-limited primary production on primary,secondary or tertiary consumers. Oecologia 162, 35–48. doi: 10.1007/s00442-009-1458-y
Marja, K., Wim Klein, B., and Nelleke, S. (1998). Effect of food quality on rateof growth and development of the pelagic copepod Pseudocalanus elongatus(Copepoda. Calanoida). Mar. Ecol. Prog. Ser. 170, 169–187. doi: 10.3354/meps170169
Mathews, L., Faithfull, C. L., Lenz, P. H., and Nelson, C. E. (2018). The effects offood stoichiometry and temperature on copepods are mediated by ontogeny.Oecologia 188, 75–84. doi: 10.1007/s00442-018-4183-6
Mauchline, J. (1998). The Biology of Calanoid Copepods. San Diego: AcademicPress.
Mayor, D. J., Anderson, T. R., Pond, D. W., and Irigoien, X. (2009). Limitation ofegg production in Calanus finmarchicus in the field: a stoichiometric analysis.J. Mar. Syst. 78, 511–517. doi: 10.1016/j.jmarsys.2008.12.020
Mayor, D. J., Cook, K., Thornton, B., Walsham, P., Witte, U. F. M., Zuur, A. F., et al.(2011). Absorption efficiencies and basal turnover of C, N and fatty acids in amarine Calanoid copepod. Funct. Ecol. 25, 509–518. doi: 10.1111/j.1365-2435.2010.01791.x
Meunier, C. L., Boersma, M., Wiltshire, K. H., and Malzahn, A. M. (2016).Zooplankton eat what they need: copepod selective feeding and potentialconsequences for marine systems. Oikos 125, 50–58. doi: 10.1111/oik.02072
Müller-Navarra, D. (2008). Food web paradigms: the biochemical view ontrophic interactions. Internat. Rev. Hydrobiol. 93, 489–505. doi: 10.1002/iroh.200711046
Müller-Navarra, D. C. (1995). Biochemical versus mineral limitation in Daphnia.Limnol. Oceanogr. 40, 1209–1214. doi: 10.4319/lo.1995.40.7.1209
Müller-Navarra, D. C., Brett, M. T., Liston, A. M., and Goldman, C. R. (2000).A highly unsaturated fatty acid predicts carbon transfer between primaryproducers and consumers. Nature 403, 74–77. doi: 10.1038/47469
Müller-Navarra, D. C., Brett, M. T., Park, S., Chandra, S., Ballantyne, A. P., Zorita,E., et al. (2004). Unsaturated fatty acid content in seston and tropho-dynamiccoupling in lakes. Nature 427, 69–72. doi: 10.1038/nature02210
Neila, A.-T., Nejib, D.-Y. M., Genuario, B., Lotfi, A., and Habib, A. (2012).Impacts of very warm temperature on egg production rates of three Acartiidae(Crustacea, Copepoda) in a Northern African lagoon. J. Therm. Biol. 37,445–453. doi: 10.1016/j.jtherbio.2012.03.003
Frontiers in Marine Science | www.frontiersin.org 14 April 2020 | Volume 7 | Article 274

fmars-07-00274 April 26, 2020 Time: 14:19 # 15
Bi and Sommer Interactions of Food Quantity and Quality
Park, S., Brett, M. T., Müller-Navarra, D. C., and Goldman, C. R. (2002). Essentialfatty acid content and the phosphorus to carbon ratio in cultured algae asindicators of food quality for Daphnia. Freshw. Biol. 47, 1377–1390. doi: 10.1046/j.1365-2427.2002.00870.x
Parrish, C. C. (2009). “Essential fatty acids in aquatic food webs,” in Lipids inAquatic Ecosystems, eds M. T. Arts, M. T. Brett, and M. J. Kainz, (Heidelberg:Springer), 309–326. doi: 10.1007/978-0-387-89366-2_13
Passow, U., and Carlson, C. A. (2012). The biological pump in a high CO2 world.Mar. Ecol. Prog. Ser. 470, 249–271. doi: 10.3354/meps09985
Peck, M. A., and Holste, L. (2006). Effects of salinity, photoperiod and adultstocking density on egg production and egg hatching success in Acartia tonsa(Calanoida: Copepoda): optimizing intensive cultures. Aquaculture 255, 341–350. doi: 10.1016/j.aquaculture.2005.11.055
Pommier, J., Frenette, J. J., Massicotte, P., Lapierre, J. F., and Glémet, H. (2012).Seston fatty acid composition and copepod RNA:DNA ratio with respect to theunderwater light climate in fluvial Lac Saint-Pierre. Aquat. Sci. 74, 539–553.doi: 10.1007/s00027-011-0246-z
Provasoli, L. (1963). “Growing marine seaweeds,” in Proceedings of the FourthInternational Seaweed Symposium, eds A. D. De Virville, and J. Feldmann,(Oxford: Pergamon Press), 9–17.
Ravet, J. L., and Brett, M. T. (2006). Phytoplankton essential fatty acid andphosphorus content constraints on Daphnia somatic growth and reproduction.Limnol. Oceanogr. 51, 2438–2452. doi: 10.4319/lo.2006.51.5.2438
Rossoll, D., Bermúdez, R., Hauss, H., Schulz, K. G., Riebesell, U., Sommer, U.,et al. (2012). Ocean acidification-induced food quality deterioration constrainstrophic transfer. PLoS One 7:e34737. doi: 10.1371/journal.pone.0034737
Ruess, L., and Müller-Navarra, D. C. (2019). Essential biomolecules in food webs.Front. Ecol. Evol. 7:269. doi: 10.3389/fevo.2019.00269
Runge, J. A., and Roff, J. C. (2000). “The measurement of growth and reproductiverates,” in Zooplankton Methodology Manual, eds R. Harris, P. Wiebe, J. Lenz,H. R. Skjoldal, and M. Huntley, (London: Acadamic Press), 401–454. doi: 10.1016/b978-012327645-2/50010-4
Saiz, E., Calbet, A., Fara, A., and Berdalet, E. (1998). RNA content of copepodsas a tool for determining adult growth rates in the field. Limnol. Oceanogr. 43,465–470. doi: 10.4319/lo.1998.43.3.0465
Santer, B., and van den Bosch, F. (1994). Herbivorous nutrition of Cyclops vicinus:the effect of a pure algal diet on feeding, development, reproduction and lifecycle. J. Plankton Res. 16, 171–195. doi: 10.1093/plankt/16.2.171
Schälicke, S., Sobisch, L. Y., Martin-Creuzburg, D., and Wacker, A. (2019). Foodquantity–quality co-limitation: interactive effects of dietary carbon and essentiallipid supply on population growth of a freshwater rotifer. Freshw. Biol. 64,903–912. doi: 10.1111/fwb.13272
Sharp, J. (1974). Improved analysis for particulate organic carbon and nitrogenfrom seawater. Limnol. Oceanogr. 19, 984–989. doi: 10.4319/lo.1974.19.6.0984
Sommer, U. (1992). Phosphorus-limited Daphnia: intraspecific facilitation insteadof competition. Limnol. Oceanogr. 37, 966–973. doi: 10.4319/lo.1992.37.5.0966
Sommer, U., Stibor, H., Katechakis, A., Sommer, F., and Hansen, T. (2002).Pelagic food web configurations at different levels of nutrient richness and theirimplications for the ratio fish production: primary production. Hydrobiologia484, 11–20. doi: 10.1023/a:1021340601986
Sterner, R. W., and Elser, J. J. (2002). Ecological Stoichiometry: The Biology OfElements From Molecules To The Biosphere. Princeton: Princeton UniversityPress.
Sterner, R. W., and Robinson, J. L. (1994). Thresholds for growth in Daphinamagna with high and low phosphorus diets. Limnol. Oceanogr. 39, 1228–1232.doi: 10.4319/lo.1994.39.5.1228
Sterner, R. W., and Schulz, K. (1998). Zooplankton nutrition: recent progress anda reality check. Aquat. Ecol. 32, 261–279. doi: 10.1023/A:1009949400573
Straile, D. (1997). Gross growth efficiencies of protozoan and metazoanzooplankton and their dependence on food concentration, predator-preyweight ratio, and taxonomic group. Limnol. Oceanogr. 42, 1375–1385. doi:10.4319/lo.1997.42.6.1375
Taipale, S. J., Kainz, M. J., and Brett, M. T. (2011). Diet-switching experiments showrapid accumulation and preferential retention of highly unsaturated fatty acidsin Daphnia. Oikos 120, 1674–1682. doi: 10.1111/j.1600-0706.2011.19415.x
Urabe, J., and Watanabe, Y. (1992). Possibility of N or P limitation for planktoniccladocerans: an experimental test. Limnol. Oceanogr. 37, 244–251. doi: 10.4319/lo.1992.37.2.0244
Van Nieuwerburgh, L., Wänstrand, I., and Snoeijs, P. (2004). Growth andC:N:P ratios in copepods grazing on N- or Si-limited phytoplankton blooms.Hydrobiologia 514, 57–72. doi: 10.1023/B:hydr.0000018206.02271.2b
Wendt, I., and Thor, P. (2015). Influence of prey species and concentration on eggproduction efficiency and hatching success in Acartia tonsa Dana (Copepoda,Calanoida). Crustaceana 88, 675–687. doi: 10.1163/15685403-00003436
Yebra, L., Kobari, T., Sastri, A. R., Gusmao, F., and Hernandez-Leon, S. (2017).Advances in biochemical indices of zooplankton production. Adv. Mar. Biol.76, 157–240. doi: 10.1016/bs.amb.2016.09.001
Conflict of Interest: The authors declare that the research was conducted in theabsence of any commercial or financial relationships that could be construed as apotential conflict of interest.
Copyright © 2020 Bi and Sommer. This is an open-access article distributed under theterms of the Creative Commons Attribution License (CC BY). The use, distributionor reproduction in other forums is permitted, provided the original author(s) andthe copyright owner(s) are credited and that the original publication in this journalis cited, in accordance with accepted academic practice. No use, distribution orreproduction is permitted which does not comply with these terms.
Frontiers in Marine Science | www.frontiersin.org 15 April 2020 | Volume 7 | Article 274
Copyright © 2022 FDOKUMEN