Analysis of tender sum forecasting by quantity surveyors and ...
29
Articles • Artikels RG Pearl, A Akintoye, PA Bowen & C Hardcastle Analysis of tender sum forecasting by quantity surveyors and contractors in South Africa Peer reviewed Abstract Although extensive research has been undertaken on the accuracy of quantity surveyors' tender price forecasts, very little of this research contains information relating to the factors affecting tender sum forecasting by quantity surveyors and contractors. The primary objective of this empirical study was to gain insight into the factors influencing both quantity surveyors' and contractors' tender price forecasts. This was achieved through an analysis of tender information relating to 278 projects for a fifteen-year period and collected from 30 quantity-surveying practices and MBATA tender records. The analysis of South African tender information reported in this article indicates an average forecast performance by quantity surveyors of 8.33% (std dev (standard deviation) = 11,183, CV (coefficient of variation) = 134,2%). The variability of contractors' tenders ranged from 0,37% to 46,53%, with a mean of 5,65% (std dev = 5,22, SE (standard error) = 0,313). Furthermore, there is no evidence to suggest that forecast performance is dependent on type of project, client, function of project, size of project, location of project and number of bidders. The contractor's results suggest that local authority projects are associated with high variability of their tender sum forecasts. The only factor, which shows significance for quantity surveyors, is the date of tender which may tend to point to the importance of market conditions and economic cycle in the tender sum forecast performance of South African quantity surveyors. Keywords: Tender price forecasts, tender information, accuracy, building industry. Professor RG Pearl, School of Civil Engineering, Surveying and Construction, University of Natal. Professor A Akintoye, Department of Building and Surveying, Glasgow Caledonian University. Professor PA Bowen, Department of Construction Economics and Management, University of Cape Town, Rondebosch. Professor C Hardcastle, Department of Building and Surveying, Glasgow Caledonian University. 5
-
Upload
khangminh22 -
Category
Documents
-
view
0 -
download
0
Transcript of Analysis of tender sum forecasting by quantity surveyors and ...

Articles • Artikels
RG Pearl, A Akintoye, PA Bowen & C Hardcastle
Analysis of tender sum forecasting by
quantity surveyors and contractors in
South Africa
Peer reviewed
Abstract
Although extensive research has been undertaken on the accuracy of quantity surveyors' tender price forecasts, very little of this research contains information relating to the factors affecting tender sum forecasting by quantity surveyors and contractors. The primary objective of this empirical study was to gain insight into the factors influencing both quantity surveyors' and contractors' tender price forecasts. This was achieved through an analysis of tender information relating to 278 projects for a fifteen-year period and collected from 30 quantity-surveying practices and MBATA tender records. The analysis of South African tender information reported in this article indicates an average forecast performance by quantity surveyors of 8.33% (std dev (standard deviation) = 11,183, CV (coefficient of variation) = 134,2%). The variability of contractors' tenders ranged from 0,37% to 46,53%, with a mean of 5,65% (std dev = 5,22, SE (standard error) = 0,313). Furthermore, there is no evidence to suggest that forecast performance is dependent on type of project, client, function of project, size of project, location of project and number of bidders. The contractor's results suggest that local authority projects are associated with high variability of their tender sum forecasts. The only factor, which shows significance for quantity surveyors, is the date of tender which may tend to point to the importance of market conditions and economic cycle in the tender sum forecast performance of South African quantity surveyors.
Keywords: Tender price forecasts, tender information, accuracy, building industry.
Professor RG Pearl, School of Civil Engineering, Surveying and Construction, University of Natal. Professor A Akintoye, Department of Building and Surveying, Glasgow Caledonian University. Professor PA Bowen, Department of Construction Economics and Management, University of Cape Town, Rondebosch. Professor C Hardcastle, Department of Building and Surveying, Glasgow Caledonian University.
5

Acta Structilia 2003: 10( l & 2)
'N ANALISE VAN TENDERPRYS-VOORSPELLINGS DEUR SUID-AFRIKAANSE
BOUREKENAARS EN KONTRAKTEURS
Hoewel omvangryke navorsing gedoen is oor die akkuraatheid van bourekenaars se tenderprys-voorspellings, het min van hierdie navorsing inligting bevat aangaande die faktore wat die ramings van bourekenaars en kontrakteurs be'i'nvloed. Die basiese oogmerk met die empiriese studie is om insig te bekom in die faktore wat 'n invloed uitoefen op bourekenaars en kontrakteurs se tenderprysvoorspellings. Dit is gedoen met behulp van 'n analise van tender-inligting oor 278 projekte wat oor 'n tydperk van vyftien jaar ingesamel deur dertig bourekenaarspraktyke en verkry is uit die tenderverslae van die Westelike Provinsie Meesterbouers en Verenigde Handelsorganisasie (MBATA). 'n Analise van die Suid-Afrikaanse tender-inligting soos vervat in die artikel dui op 'n gemiddelde beraming van 8,33% deur bourekenaars (standaardafwyking = 11,183, koeffisient-afwyking = 134,2%). Die kontrakteurs se tenders wissel tussen 0,37% en 46,53% met 'n gemiddelde van 5,65% (standaardafwyking = 5,22, standaardfout = 0,313). Geen bewyse is gevind wat daarop dui dot die beramings afhanklik is van die tipe projek, die klient, die funksie, die omvang, die ligging 6f die aantal tenderaars nie. Die kontrakteur se resultate dui daarop dot die plaaslike regerings se projekte moontlik verband hou met groot skommelinge in die tenderprys-voorspellings. Die enigste beduidende faktor ten opsigte van bourekenaars is die tenderdatum wat moontlik dui op die belangrikheid van marktoestande en die ekonomiese siklus in die tenderprysvoorspellings van Suid-Afrikaanse bourekenaars.
Sleutelwoorde: Tenderprys-voorspellings, tender-inligting, akkuraatheid, boubedryf.
6

Pearl, Akintoye, Bowen & Hardcastle • Tender sum forecasting
Introduction
Numerous authors (Barnes, 1974; Adams & Busch, 1981; Bennett et
al., 1981; Flanagan & Norman, 1983; Betts & Gunner, 1989; Kwakye, 1994) have commented that absolute accuracy is
virtually impossible to achieve in building price forecasts. The issue of what comprises an 'acceptable' degree of accuracy is inevitably linked to the aspect of expectation of performance by the client on the one hand, and achievement level of the estimator on the other.
Before any analysis of the accuracy of price predictions can logically be undertaken, consideration needs to be given to an appraisal of what is meant by the term 'accuracy'. Previous attempts at defining accuracy in terms of price forecasting in the building industry are questionable, most being based on the recognition of an "absence of error" when comparing the estimate with the price for which the work is contracted. Flanagan and Norman (1983) remark that this suggestion that the smaller the error, the higher the accuracy, and vice versa, whilst being
partially true, is naive inasmuch as it requires a further definition of error.
Rapier (1990), however, suggests that for capital cost estimating "estimating accuracy is the degree of conformity of the estimate (our measure) to the final as-built project cost (our true value)". This definition suffers from the failing that no indication is giveri as to what extent of non-conformity is unacceptable, and would consequently be termed 'inaccuracy'.
The proposal by True (1988) that accuracy is "the percent of difference between the estimated value of the product or work as compared to the price for which the product or work is contracted", although hinting that the process is quantifiable, is incomplete in terms of the need to provide parameters of acceptability. Raftery (1987) introduces a different approach, when stating that the term should be considered in relation to "the etymology of the word 'accuracy' itself (exact, correct, from the latin accuratus, meaning performed with care)"; suggesting
that it should be used to denote correctness or care in performance.
In this article it is argued that an acceptable definition of the term, as applied to price forecasting in the building industry, should be based on the rationale of Raftery (1987) given above, but additionally linking the performance to that which could reasonably be expected of an informed and suitably experienced estimator.
7

Acta Structilia 2003: 10( l & 2)
Bias, consistency and precision
Forecasting performance is often identified as consisting of two main properties: bias, which is concerned with the average of the differences (error) between prices and forecasts, and consistency, which is concerned with the degree of variation (dispersion) about the average (Skitmore, 1990; Gunner & Betts, 1990; Gunner & Skitmore, 1999).
Many practitioners appear to confuse accuracy with precision (Pearl, 1992). The two principles are totally different; it being quite possible to be precise, but inaccurate, and vice verso. The overall quality of performance of the forecaster is usually considered in terms of the relationship between estimates and contract bids. The decision to measure the quantity surveyor's estimating performance against the accepted (normally the lowest) tender, means that the assessment of accuracy is partially dependent upon the variability of the tender(s) chosen for this purpose.
A number of measures of performance, such as the range, mean deviation, standard deviation and co-efficient of variation are described in the literature as measures of 'accuracy'. In effect, however, the blending of these units of measure tends to reflect reliability of estimates, combining precision, bias, consistency and accuracy.
Factors influencing tender sum forecast accuracy
It can be argued that the quantity surveyor's task in producing price forecasts should be to contemplate the same factors as the contractor takes into account in compiling the tender, so that the estimate produced reflects the actual project and its particular context, rather than an ideal or average situation otherwise presented. A brief review of published research on factors affecting the performance of both designs team price forecasters and contractors, is necessary to identify the principal features requiring detailed study.
Quantity surveyors
Pearl (l992) indicated that the expertise of the price forecaster and adequate and representative historical price data are the two most influential factors affecting the accuracy of pre-tender price forecasts produced by quantity surveyors in South Africa. Numerous other studies on the factors affecting estimating accuracy have been undertaken in
other countries. Beeston (1975), Bennett et al. (1981), Ashworth and Skitmore (1982), Flanagan and Norman (1983), Morrison (1984), Skitmore (1987a), Skitmore and Tan (1987), and Betts and Gunner (1989) address a wide spectrum of issues affecting consultants' price forecasting performance. These are summarised by Ogunlana (1989) in attempting to establish the most important elements with respect to estimating accuracy.
8
Pearl, Akintoye, Bowen & Hardcastle Tender sum forecasting
The factors examined in the studies include those related to project characteristics, such as the type, size, duration and geographical location of the development; tender issues, including the number of bidders and the economic state of the construction market; the level of information available, and the ability of the estimator. The factors discussed below are those, which have been highlighted by previous researchers as being the most influential in price forecasting performance.
Type of project
An examination of this factor needs to consider, firstly, the form of construction indexing, i.e. a classification structure such as the CI/SfB system, and secondly, what sub-division within each form should be separated. With regard to the building type to be identified, the researcher is essentially faced with a decision as to whether to use a formally identified structure (e.g. CI/SfB building classification system), or to rely on a subjective classification of building types, based on typical use. Further subdivision, such as project value and floor area/volume, are dealt with separately under the heading of 'project size'. The issues of quality, structure type, and plan shape, are considered under the section of 'project complexity'.
A further important consideration is whether any trend specific to a building type is caused by a strong relationship with one of the possible subdivisions referred to above (e.g. power stations being considered structurally complex); or if the trend is essentially due to the specific esti\mator being more familiar with a particular use of building (e.g. a quantity surveying firm handling many school projects).
A study of the literature reveals numerous examples of variable estimating performance between different forms of construction or building types. However, in many instances it is not easy to clearly determine the primary cause for such variance. For instance, a cause of variability in any set of figures could be that not all the estimates tested are produced by the same estimator, or by estimators with the same background or ability.
The evidence from the following studies suggests that estimating accuracy achieved by consultants relates directly to project type. McCaffer's (1976) analysis of 132 Belgian Public Works building projects and 168 Belgian road projects reveals that the estimates for the building contracts are less accurate (5,2% mean underestimation) than those for the road projects (l ,5% mean underestimation). Complicating this analysis, however, is the fact that the estimates for the building projects are more consistent than those for the road contracts.
9

Acta Structilia 2003: 10(1 & 2)
The results of Harvey's (1979) analysis of 2401 Canadian Public Works contracts let between 1973 and 1976, indicate that the accuracy levels of the building contracts in the large sample are generally slightly poorer than those for non-building contracts. A report produced in the same year by Merrow et al (1979), describes unusually high inaccuracy levels in nuclear power plant estimates, implying that the level of accuracy achievable on 'new' or unique types of construction is very poor. This assertion is consistent with the record of substantial estimating errors occurring on 'one-off' structures and is ostensibly related to the magnitude of uncertainty on such contracts.
The Property Services Agency (1980) observes from an analysis of the estimates obtained from six separate UK public sector quantity-surveying offices, that housing and school projects are associated with higher degrees of accuracy than other building types. In addition, estimating tends to be better on types of projects with which the estimator has had extensive personal experience, such familiarity being associated with an up to 40% improvement in forecasting accuracy.
Similar results are also reported by Skitmore (1985) in experiments conducted with a small number of quantity surveyors in which quite different low bid/estimate ratios are recorded between schools and houses on the one hand, and offices on the other. The only analysis of this factor found to reflect a contrary opinion to that described above is that of Skitmore (1988). A total of 33 UK local authority-building contracts of different types of use were examined, and no significant differences in bias of percentage errors between the project types or any difference in consistency was detected. The small sample size is possibly the reason for these different findings.
Project complexity
This is perhaps the most difficult factor to define in terms of a standard for measurement purposes. Tan (1988) states that complexity is also subject to changing technology; what is considered technologically complicated today may well be considered commonplace in a short period, due to advances through research, or continued application and development through experience/expertise.
The limited number of studies pertaining to aspects of this design feature deal either with a) design aspects such as plan shape or complexity of design detail, or b) the differences between 'new' building work and alterations to existing structures. Tan ( 1988), in analysing the results of his study of 6 7 construction projects for NASA, contends that the projects classified as "sophisticated" and those with a plan shape described as "very irregular", are the most consistently accurately
10

Pearl, Akintoye, Bowen & Hardcastle Tender sum forecasting
estimated with an underestimation of less than 0,5%. However, Skitmore (1988), in referring to the same data, presents a contradictory opinion. In his view, consistency of estimates generally deteriorates with increasingly complex designs. In analysing 33 Local Authority building projects, Tan (1988) indicates that the accuracy of estimates of alteration work is higher than those of new build construction. Skitmore (1988), in commenting on these projects, notes that the alteration work is less biased than the 'new building works', but places the findings in their correct context by observing that, because of the limited sample sizes, in none of the instances quoted is the magnitude of the results significant.
The complexity factor is likely to be more significant in the decisionmaking process in the very earliest stages of design development than at the pre�tender stage. The ability to conceive, and allow for extra costs due to complexities in the initial phase of project development, could be a significant factor in assessing the expertise of an estimator.
Project size
Recognition of the effect that project size has on price forecasting performance appears at first to be easier to establish than some of the other factors studied. However, closer examination indicates that contractors face the forecaster with a complex situation, involving consideration of aspects as diverse as the measurement of the physical properties of buildings, and the psychological approach to the compilation of tenders.
'Project size' can be construed to mean the physical parameters of the building (e.g. height, area, volume), or a defined interpretation associated with the 'value' (i.e. either cost of erection, price paid by client, or intrinsic value to a party). The only study found linking price forecasting performance and physical measurements of buildings is that of Tan (1988). Tan notes, from the analysis of the 67 projects built for NASA, that consistency of estimates improves with increasing floor area. However, he also comments that a similar analysis of 33 buildings erected for a local authority in the UK reveals no apparent trend of this nature.
A complication when reflecting on appraisals based on building value, is that many authors refer to 'small' and 'large' projects without due attention to what these terms may convey. From the perspective of the consultant quantity surveyor, a small firm (possibly comprising only a sole proprietor, such as is common in South Africa, Billett (l990) may consider a project of Rl million as a 'large' project, while a larger firm may classify the same project as 'small'. In searching for reasons why larger projects may attract better estimating accuracy, Ogunlana and Thorpe (1991) suggest that a major cause could be the managerial
11

Acta Structilia 2003: l 0(1 & 2)
aspect that favours keener cost estimating (tendering) in high value
projects. In support of this theory, it is suggested that as construction
cost estimates are costly to prepare, only large projects can justify
devoting much time to this activity. Once more, no recognition is given
to differing interpretations of worth to other parties. 'Small' contracting
firms may adopt a perfectly acceptable level of attention to the
compilation of tender estimates for jobs of lesser value.
A large measure of contradictory opinion, with respect to the effect on
forecasting performance of project size, is presented in the literature in
both theoretical and empirical studies. A comprehensive literature
search reveals that the only researchers suggesting that building size
(value of contract) has no effect on the quantity surveyor's accuracy of
price forecasting, are McCaffer (1976) and Wilson et al. (1987).
Even less support is provided for the belief that accuracy of estimates
is reduced with increasing project size. The only evidence of such an
opinion is provided by Harvey (1979) in a thesis on competitive bidding
on Canadian public construction projects. The vast majority of
researchers appear to support the suggestion that quantity surveyors'
estimating generally tends to improve with increasing project size. The
Property Services Agency's (1980) comprehensive research study is the
earliest reliable reference source indicating this opinion, although it is
observed that contrasting results are found in different data sources
used for the study.
Skitmore (1988), in commenting on Tan's (1988) research, notes that
there is a general trend of improving accuracy with increasing contract
value. This tendency appears to be fairly widespread, as indicated by
the results of a statistical analysis carried out by Betts and Gunner
(1989) on projects handled by an international firm of cost consultants
in their Singapore offices. Ogunlana and Thorpe (1991) and Mills (1991)
achieved similar results, in case studies on large numbers of contracts
of varying value in the UK and Australia, respectively. In both instances
the projects studied are arbitrarily divided into different value ranges.
Further to the above, Skitmore et al. (1990) conclude that price forecasters tend to under-estimate smaller and/or over-estimate larger size
building projects. No reason is given for this phenomenon but it is
possibly due to differing psychological approaches being adopted by
estimators, such as the fear of possibly greater magnitude of repercus
sions relating to 'errors' on large projects - often done for major clients.
This does not necessarily imply unprofessional conduct in respect of
smaller appointments; merely a possible over-anxiety to perform well on
the 'more important' projects.
12

Pearl, Akintoye, Bowen & Hardcastle • Tender sum forecasting
Another interesting observation of Skitmore et al. ( l 990) is the implication
that low price intensity contracts (based on rate per floor area) are more accurately forecast than high price intensity projects. Again, no reasons to explain this phenomenon are provided. However, it is presumed that while this may be relevant in the early stage estimating systems (e.g. single-price rate methods), it is unlikely to be applicable at the pre-tender stage if bills of quantities are utilised.
Notwithstanding the opinions expressed above, it would appear as if project size is strongly linked to other factors, such as type of project, complexity, number of bidders, and quite possibly to individual estima
tors' pricing philosophy. Skitmore et al. ( l 990) reflect a similar view when
commenting on the research of Flanagan and Norman (1983). The opinion is expressed that differences in relationships recorded between sets of data "seem to indicate that, if a contract size (value) biasing effect does exist, it is not universal in either its strength or direction, but
somehow dependent on the source of the forecast" (Skitmore et al.
1990: 9).
Number of bidders
As expected, evidence indicates that the number of tenderers per project fluctuates according to the economic climate being experienced. The study by Hindle (1991 ), although reflecting a regional condition in South Africa, is likely to represent the national situation fairly, confirming this assertion.
There are mixed opinions with regard to the effect that the number of bidders has on tender prices. Wyskida (1986) is one of the few researchers to suggest that the number of bidders has no effect on tender price. Most
researchers, including McCaffer (1976), Wilson et al. (1987), Skitmore
(1987b), and Mills (1991 ), contend that, as the number of tenders increases, so the average value of the tenders fall. Runeson and Bennett ( 1983) observe that as the competition increases, not only does the price level fall, but the accuracy of the contractors' cost estimates on which the tenders are based, is improved, and the mark-up becomes more consistent. Flanagan and Norman (1985) suggest that little is to be gained from inviting more than five contractors with single stage selective tendering. Other authors appear to support this view (Drew 1990; Mills 1991 ), commenting that to call for a larger number of tenderers only adds to the cost of the tendering process. However, the studies conducted to date on the effect of the number of bids on the price forecaster's accuracy have not provided conclusive results.
Ogunlana and Thorpe (1991 ), in stating that the relationship between number of bidders on a contract and estimate accuracy evolves from
13

Acta Structilia 2003: 10(1 & 2)
the degree of competition amongst bidders, propose that as projects with more bidders are expected to provide wider variability between tenders, design price forecasts may consequently be less accurate. The probable effect of this condition is that prices will be lower than those anticipated by the estimator, possibly resulting in over-estimation.
Other researchers indicate that as the number of bidders increases, price forecasters' accuracy improves. Prominent amongst these authors are De Neufville et als' (1977) analysis of data on all new construction costing over $1 00 OOO by the Commonwealth of Massachusetts Bureau of Building Construction from 1961 to 1974. The result is a curved negative relationship between low bid/engineers' estimate ratios and the number of bids received.
The findings of Harvey (1979), Flanagan (1980), and Hanscomb Associates' (1984) analysis of low bid/engineers' estimate ratios on over 11 00 US projects between 1977 and 1983, also indicate a significant trend towards improved performance with increasing numbers of tenders. Contrary to the findings of the majority of previous studies in the field, the results of Skitmore et als' (1990) experiments indicate that no correlation exists between competitive intensity and forecasting performance. More recent empirical evidence in support of this theory is provided by an analysis of 51 projects undertaken by Ogunlana and Thorpe (1991), showing no apparent trend in the mean accuracy.
The linkage of this factor with others requires careful consideration - an example being the assertion by Skitmore (1987b), citing De Neufville et
al. (1977), that the good/bad year effect is separate from the number of bidders. This phenomenon needs to be studied carefully in other geographical locations such as South Africa, in order to establish the validity of their findings under different market conditions. Further, when studying the 'project size' factor, the situation in South Africa regarding the availability of contractors differs significantly from that commented upon in overseas literature. There are very few large contracting firms in South Africa that are able to compete for large projects. Although the effect of large numbers of tenderers on price forecasters' accuracy is expected to be the same as experienced overseas, it is anticipated that the result of combining project size and number of bidders may be entirely different.
Geographical location of project
Location exerts a powerful influence on the major components of construction cost and also on the manner in which building design is performed. Avery (1982) identifies locational influences that may have an affect on the cost of executing work to any given design and
14

Pearl, Akintoye, Bowen & Hardcastle • Tender sum forecasting
consequently concerns tenderers as well as those engaged in forecast
ing tender levels. Features mentioned are: a) remoteness from source of
material supply, b) labour cost and productivity, c) water, power and
sewage supplies, d) water and power for the works and mechanical
plant, e) security, f) climate and weather, g) regional market conditions
or climate of tendering, and h) local tendering customs.
In South Africa, with its wide range of climatic and geographic conditions, virtually all of the above locational influences are considered pertinent. Even within relatively small geographic regions, certain of these factors may play an important part in the tendering strategy (e.g. differences in price levels of construction between neighbouring areas due to political violence). This allowance for 'local area' adjustments is often considered more difficult to make than that for working in distant regions. Conclusions drawn from overseas experience (which is minimally recorded) can be considered inappropriate for South Africa. It is of interest, however, to note that whilst Harvey's (1979) analysis of variance shows significant differences in estimating bias across the six Canadian regions studied, the results emanating from Ogunlana and Thorpe's (1991)
empirical research are contrary to their expectations. Wilson et al. (1987)
conclude their study by stating that it would appear as if location has no bearing on the accuracy of estimates.
Contractors
Few published papers reflect the impact of influencing factors on
accuracy levels of contractors' estimates (Akintoye, 2000). However, the
literature does point to the influence of certain factors such as project
size and number of bidders, which are described below.
Project size/value
Only three reference sources dealing with this factor in relation to the
tendering performance of building contractors are referred to in the
literature. The first study, presented by Drew and Skitmore (1990) dealing
with the bidding performance of contractors on certain public sector
projects in Hong Kong between l 982 and 1988, provides a number of
interesting results. Their findings confirm Flanagan and Norman's (1982)
contention that "tendering strategy in general is affected by the type of
project and value range". The study by Shash and AI-Khaldi (1992) which
relates to the production of construction cost estimates in Saudi Arabia,
similarly indicates that this factor has a major effect on the production of
accurate estimates.
15

Acta Structilia 2003: 10(1 & 2)
Number of bidders
Empirical studies indicate that under conditions in which a contractor is forced by competition to lower the mark-up, there is a likelihood that this will be compensated for by attempting to improve the accuracy of the cost estimate (Runeson & Bennett, 1983). It is reasoned that a greater number of tenders is likely to reduce the lowest bid (Beeston, 1983; Runeson & Bennett, 1983; Flanagan & Norman, 1985) and produce a larger range between the lowest and highest tender (Goh & Teo, 1992).
McCaffer (1976), in a survey of tenders on 168 road contracts, investigated the relationship between the low bid, the mean bid and the design engineers estimate, finding that the standard deviation of the differences decreases with the increasing number of bidders. A possible explanation for this phenomenon is that the nature of the projects leads to greater consistency in tendering on these contracts.
Summary
An awareness of the effect that the above factors can have on a ten
derer's pricing strategies is important to design consultants. An under
standing of these issues may be constructively used to refine pre-tender
estimates and to select contractors for inclusion in tender lists.
The preceding review provides a summary of available literature on the measurement of accuracy in both quantity surveyors' and contractors' tender price forecasting. This provides a basis upon which the assessment of an empirical study of South African estimating performance can be structured. The factors identified for this study are those that are indicated by the literature as being the most influential in price forecasting effectiveness.
Methodology
The small size and structure of the typical South African quantity surveying firm (Billett, 1990) results in a relatively low number of building contracts being handled by one practice. In order to gain access to a significantly large amount of data on tenders and related estimates, it was necessary to establish contact with a large number of firms. It was thought that support from practitioners on the sensitive matter of tender information (typically confidential), could best be achieved by approaching firms individually. The need to adopt this personalised approach means that the scope of information base for the study is limited to the Cape Peninsula geographic area of South Africa. This area is responsible for a high proportion of construction activity; and apart from this it is an important commercial and industrial centre for the South African economy.
16

Pearl, Akintoye, Bowen & Hardcastle • Tender sum forecasting
The projects for which tender information was collected and the names of the quantity surveying firms responsible for these projects, were obtained from the tender submission diaries of the Cape Peninsula Master Builders' and Allied Trades' Association (MBATA). The tender database of MBATA contains a total of l 086 projects over a fifteen-year period. From the database 38 quantity surveying practices were identified as being currently active and were approached for tender information on projects listed under their names. Thirty practices provided the details requested relating to 278 projects for the period reviewed. A general problem was the difficulty in providing information on projects put out to tender up to 5 years prior to the investigation. Another problem, which may be regarded a shortcoming of this study, is that a small minority of firms appeared to have provided information on a selective basis, by providing information on projects where their forecast is regarded close to the contractor's accepted tender sum.
Tender information collected for each project included the location of
the project (LOCATION), tender sums submitted by contractors for each
project, number of tenders (NOBID), and the quantity surveyor tender
forecast. Other information collected comprised TYPE of project (new
work or alteration), client or SECTOR (private sector, local authority and
central government), name of the contract, date of tender (YEAR),
classification of work (CLASSIFN - based on CI/SfB classifications),
amount of provisional sums and PC sums. Seven locations for the study
were identified within the Cape Peninsula.
For the purpose of the empirical analysis, the contractor's accepted
tender sum (tender price at which the project was awarded, which was
in most cases the lowest tender) formed the basis for the analysis.
Based on the tender information for each project the contractors'
tender coefficient of variation (CTR COV) for each project was
determined. The contractor's accepted tender sum was used as a
measure of the project size (PROJSIZE), which was further classified as a
small, medium, large or mega-sized project. Deviation of the quantity
surveyor's forecast from the contractor's accepted tender sum for each
project was determined and represented as a percentage. An
absolute value of this percentage deviation (QSDEVABS) was used as a
measure of the tender forecast performance of quantity surveyors.
Deviation of the contractor's acceptable tender from the mean tender
for each project, expressed as a percentage of the contractor's
acceptable tender sum, was also determined (BIDRANG).
The empirical analyses were carried out based on the hypothesis that the factors LOCATION, YEAR, TYPE, SECTOR, NOBID, CLASSIFN, PROJSIZE influence quantity surveyors' forecasting performance (QSDEVABS) and
17

Acta Structilia 2003: 10(1 & 2)
contractors' bids variability (CTR COV). Inspection of available data for
the sample projects revealed that it was possible for a comparative
analysis of both consultant and contractor price forecasting
performance to be conducted simultaneously.
Data analysis and results
Statistical analyses, such as descriptive analysis, cross-tabulation,
analysis of variance (ANOVA), and linearity were employed in the
empirical analysis of the data. The analyses were undertaken using
the Statistical Package for the Social Sciences (SPSS). The empirical
analysis produced the aescript,ve statistics (mean, standard deviation
and coefficienr of variation (CV)) for eacn of the independent
variables (TYPE, SECTOR, NOBID, CLASSIFN, LOCATION, PROJSIZE, and
YEAR) based on the dependent variables (QSDEVABS and CTR COV). The ANOVA tests the null r1ypothesis that the mean of tne depenaent
variables is equal in all the groupings defined by the independent
variables. Where the null hypothesis is accepted it suggests that the
dependent variable is not affected by that independent variable. The
ETA statistics produced measure the strength of association between
the dependent and independent variables.
A test of the mean linearity between the dependent and independent
variables was produced. This test produces the ANOVA, which tests the
null hypothesis that the mean of the dependent variables is a linear
function of the value of the independent variable. The correlation coef
ficients for the relationships are also produced. In both these ANOVA
tests, the F statistics and probability were produced; where p<0,05
implies that the null hypothesis is rejected at the 5% significant level,
suggesting that the dependent variable is affected by the
independent variable. The presentation of the descriptive statistics
enables the level of accuracy of the dependent variable to be
determined and provides more information when cross-tabulated with
the independent variables.
18

Pearl, Akintoye, Bowen & Hardcastle • Tender sum forecasting
Tender sum forecast performance of the quantity surveying practices
Table 1 depicts the accuracy of the quantity surveying price forecasts grouped into 5 categories.
Table l : Quantity surveyors' level of price forecast performance
Frequency Percentage Cumulative percentage
144 51,8 51,8 64 21,0 74,8
48 17,3 -r 92, I i 17 6,1 1 98,2
1 1,8---i -
Level of performance
0-5%6-10% 11-25% 26-50%
Over 50% 5 100,0 - __,
The absolute percentage devim1on of the quantity surveyors' 1urE,custs from the contractors' accepted render sum ranged from 0.00% TO 88,37%, with a mean of 8,33% (standard deviation = 11,183; standard error (SE) = 0,6 71 ). The forecast performance frequency is positively skewed (skewness = 3,161, SE = 0, 146) with a high Pearson's coefficient of skewness' (SK = 0,745). About 52% of the quanrity surveyors were able to forecast the contractor's accepted tender price to within ±5%, while almost 75% were able to predict to within the ± l 0% level of accuracy. This result is consistent with Beeston's (1975) opinion that the best that quantity surveying estimating procedures can be expected to produce in practical terms, is 52% of estimates within 5% and 84% of estimates within l 0% of the lowest tender, once the detailed design stage is completed.
Table 2 shows ANOVA (analysis of variance) and linearity test results, which indicate the extent to which the quantity surveyors' performance in forecasting the contractor's accepted tender is determined by the size of project, the type of client, type of work, location of project, classification of work, number of bidders and the date (year) of tender. The Table shows that the strength of association between the quantity surveyors' forecast performance and each factor listed is generally low (ETA ranged between 0, l 00 and 0,309). The highest strength of association is due to date of tender (YEAR) with ETA of 0,309. ANOVA results show that, with the exception of date of tender, there is no evidence that the forecast performance of the quantity surveyors is affected by any of the other factors. The linearity tests show no significant linear relationship between quantity surveyors' forecast performance and any of the factors, with the exception of the date of tender.
Pearson's coefficient of skewness, SK, is a measure of skewness that focuses on the diff&rsnce oeiween
the mode and the mean, and then relates it ta the standard deviation.
19

Acta Structilia 2003: l 0(l & 2)
Table 2: Statistical analysis on forecast performance of quantity surveyors
ANOVA Linearity
Dependent Independent variables variables
ETA F-
Prob. Correlation F- Prob.
statistics statistics coefficient
LOCATION 0.182 1.854 0.103 Not opplicoble
CLASSIFN 0.186 1.384 0.212 Not applicable
TYPE 0.016 0.070 0.791 Not applicable
SECTOR 0,028 QSDEVABS
0,106 0.899 Not applicable
PROJSIZE 0.100 0.928 0.428 0.200 0.655
NOBID 0.166 1.532 0.180 1.559 0.213
YEAR 0,309 2,134 0,013 8,502 0,004
CTR COV 0.148 1.006 0.422 1.527 0,218
-0.027
0.075
-0,171
0,074
There is insignificant negative relationship between the quantity survey
ors' forecast performance and project size. Tables 3 to 7 indicate the cross-tabulation of QSDEVABS with classification of work (CLASSIFN), type
of work (TYPE), type of client (SECTOR), size of projects (PROJSIZE) and
number of bidders (NOBIDS), respectively. The Tables show that the
coefficient of variation (CV), which measures the degree of
consistency in projects' tender sum forecasts by the quantity surveyor, is
more than l 00% in all cases. 'Count' in each case refers to the
cumulative count.
Table 3 shows the CV of forecast performance of quantity surveyors in relation to the classification of work. and indicates that the highest
degree of consistency relates to residential buildings, followed by
utilities projects such as health clinics. The lowest degree of consistency
relates to commercial projects, followed by religious buildings. An
explanation for the poor price forecast performance relating to
religious projects (e.g. churches, mosques) could be that this type of
project is not undertaken on a regular basis by the practices. This
explanation is supported by the fact that. of the 278 projects spanning 15
years, data relating to only 9 religious projects are included in the analysis.
Commercial projects have the highest number of projects (76 out of 278
projects in the analysis). The share number of commercial projects
included in the analysis raises the possibility of the inclusion of outliers.
Although this share number will tend to suggest that the practices should
be more familiar with this type of project with a consequence of better
forecasting performance, it is not unusual for commercial projects to be
more complex in design, scope and construction. Moreover, commercial
projects are usually associated with the use of new materials and
technology, all of which could contribute to the comparatively poor
forecasting performance by quantity surveyors. The residential, utilities
and industrial projects are associated with better forecasting
performance than other types of projects, which could be explained by
their simplicity of design, construction, and scope. 20

Pearl, Akintoye, Bowen & Hardcastle • Tender sum forecasting
Table 3: Forecast performance of quantity surveyors' estimates in relation to classification of work
Sid Quantity surveyors' level of forecast performance
Projects Mean CV deviation Count Over
% 5,0% 10,0% 25,0% 50,0%
50,0%
Utilities 5.52 6.41 116.06 Count 10 17 18 19
% 52,7 89,5 94,8 100
Industrial 5.52 6,41 116,07 Count 19 27 36 37
% 51,3 72,9 97,2 100
Commercial 8.33 12,97 155.73 Count 40 57 70 74 76
% 52.6 75,0 92,l 97,4 100
Health 5.86 6.57 112.20 Count 17 20 24 25 25
% 68.0 80.0 96,0 100 100
Recreational 7,74 10,66 137,84 Count 9 14 15 17
% 53.0 82.4 88.3 100
Religious 12.29 18.15 147,62 Count 5 7 7 8 9
% 55.5 77,7 77.7 88.8 100
Educational 11,99 14.45 120.53 Count 20 31 42 46 48
% 41,7 64.6 87,5 95.8 100
Residential 7,74 8,64 111,57 Count 24 35 44 47
% 74.5 93,7 100 Average for all
8.33 11,18 134.23 Totals 208 256 273 278
projects %
51.l
144
51.8 74,8 92,l 98,2 100
Table 4 shows, contrary to expectation, that the CV for alteration projects is
better than that for new work. Quah's (1988) study suggests that refurbishment work, because of the uncertainty inherent in such work and the problems associated with pricing alterations work. is generally associated with a low degree of accuracy of tender sum forecast. The results emanating from the analysis of the South African data do not support the findings of Quah's UK empirical study.
Table 4: Forecast performance of quantity surveyors' estimates in relation to type of work
Sid Quantity surveyors' level of forecast performance
Type of work Mean deviation
CV Count Over
% 5,0% 10,0% 25,0% 50,0%
50,0%
New work 8.4412 11,6270 137,74 Count 106 148 186 197 201
% 52.8 73,7 92.6 98,l 100
Alteration work 8.0432 9.9955 124.27 Count 38 60 70 76 77
% 49,4 78,0 91.0 98.8 100 Average for all
8,3309 11, 1827 134,23 Totals 144 208 256 273 278 projects
% 51.8 74,8 92,l 98,2 100
Table 5 shows that the highest consistency in the performance of
quantity surveyors' forecasts of the anticipated lowest tender figure is associated with local government projects, followed by private sector projects and central government projects. The results, however, should be treated with circumspection given the bias in the raw data towards private sector projects (72%).
21

Acta Structilia 2003: 10[ l & 2)
Table 5: Forecast performance of quantity surveyors' estimates in relation to the type of client
Sid Quantity surveyors' level of forecast performance
Projects Mean deviation
CV Count Over
5,0% 10,0% 25,0% 50,0% 50,0%
Private 8,176 10,968 134,15 Count 101 150 183 196 199
% 50,7 75,3 91,9 98.4 100
Local govt 8,927 11,612 130,08 Count 31 43 54 58 59
% 52,5 72,8 91,5 98,3 100
Central govt 8,109 12.504 154.20 Count 12 15 19 19 20
% 60,0 75,0 95,0 0,95 100 Average for all
8,331 11,183 134,23 Totals 144 208 256 273 278 projects
% 51,8 74,8 92.l 98.2 100
Table 6 suggests that both small and very large projects are associated with poor forecasting performance. The reasons are not immediately apparent although the results in respect of large projects are in line with overseas trends. The performance achieved on small projects is not surprising as a feature of these projects is a large number of bidders. This would normally be expected to result in unstable tendering conditions with consequential difficulties being experienced by consultants in estimating tender prices.
Table 6: Forecast performance of quantity surveyors' estimates in relation to size of projects
Sid Quantity surveyors' level of forecast performance
Projects Mean CV deviation Count Over
5,0% 10,0% 25,0% 50,0% 50,0%
Small' 7,92 10,62 134,07 Count 55 82 95 101 103
% 53.4 79,6 92,2 98.0 100
Medium 10,02 13,13 130,95 Count 35 56 73 79 81
% 43,2 69,l 90,l 97,5 100
Large 7, 16 8,69 121,29 Count 28 37 47 50
% 56,0 74,0 94,0 100,0
Mega 7,50 11, 10 148.06 Count 26 33 41 43 44
% 59,l 75,0 93,2 97,7 100 Average tor all
8,33 11, 18 134,23 Totals 144 208 256 273 278 projects
% 51.8 74,8 92,l 98,2 100
Given the number of projects involved in the analysis, Table 7 suggests that quantity surveyors are most likely to achieve a high level of forecasting performance with 7 to 8 bidders. The most likely reason for this is the potential for distorted tendering patterns when either very small or very large tender lists are encountered.
22
Note: Small projects (<Rl million); medium projects (Rl-2,5 million); large projects (R2,5-5 million); mega
projects (>R5 million).

Pearl, Akintoye, Bowen & Hardcastle • Tender sum forecasting
Table 7: Forecast performance of quantity surveyors' estimates in relation to the number of bidders
Sid Quantity surveyors' level of forecast performance
Bidders Mean CV deviation Count Over 5,0% 10,0% 25,0% 50,0% 50,0%
2 - 4 bidders 8.39 10,76 128.26 Count 15 21 25 29 29
% 51,70 72.40 86.10 99,90 100
5 - 6 bidders 8.42 12.86 152.67 Count 40 61 73 76 78
% 51,30 78,20 93,60 97.40 100
7 • 8 bidd8!S 7,02 7,93 112,97 Count 32 51 64 65 66
% 48.40 77,20 96,90 98.40 100
9 - I O bidd8!S 6.79 9,09 133,94 Count 36 45 56 57 58
% 62,00 77,50 96,40 98,10 100
11 - 14 bidders 10,97 13,87 126.42 Count 15 23 29 33 34
% 44,10 67,60 0,85 97,00 100
(>;Sf 14 bidders 14,28 14.62 102.39 Count 6 7 9 13
% 46,20 53,90 69,30 100 AV8!oge fO! all
8.33 11.18 134,23 Totals 144 208 256 273 278
projects % 51.80 74,80 92.10 98,20 100
Overall, these results suggest that the forecast performance of contractors' accepted tender sums by quantity surveyors in South Africa is not affected by any of the independent variables, with the exception of the date of tender. Moreover, the fact that date of tender is significant in the analysis tends to suggest that the forecast performance of quantity surveyors is affected by the market conditions dictated by the turbulent economy cycle within South Africa.
Analysis of variability of contractors' tenders
Fine (1974), Beeston (1875), Ashworth and Skitmore (1982), Runeson and Bennett (1983), Hodgetts (1987), Newton (1991) and Betts and Brown (1992) have all commented on the wide distribution of prices between the lowest and highest tenders submitted on projects. The contributing factors responsible for the differences cited were cost structures of firms, disparate competitive strategies, and familiarity with particular type of projects and market conditions.
Table 8 shows the variability of the contractors' tenders grouped into 5
categories. The variability of the contractors' tenders ranged from 0,37% to 46,53%, with a mean of 5,65% (standard deviation = 5,22, SE = 0,313).
23

Acta Structilia 2003: 10(1 & 2)
Table 8: Variability of contractors' tenders
Varlablity Frequency Percentage Cumulative level percentage
0-2,5% 40 14,39 14.39
2,6%-5,0% 116 41,73 56.12
6,0 - 10,0% 96 34,53 90,65
11,0 - 25.0% 22 7,91 98.56
Over 25.0% 4 1.44 100.00
The variability performance frequency is positively skewed (skewness = 5,012, SE = 0, 146). It is noteworthy that 90,6% of contractors' tender variability lies within the 1 0% accuracy margin, compared to the price forecasting performance of quantity surveyors, where 75% of the quantity surveyors sampled forecast the contractor's lowest tender price within the ± 1 0% level of accuracy.
Table 9 shows ANOVA and linearity test results which indicate the extent
to which the variability of the contractors' tenders is influenced by the size of project, the type of client. type of work, location of project, classification of work, number of bidders and the date (year) of tender.
Table 9: Statistical analysis of the variability of contractors' tenders
ANOVA Linearity
Dependent Independent variables variables
ETA F-
Prob. F-
Prob. Correlation
statistics statistics coefficient
LOCATION 0.135 1,012 0,411 Not opplicoble
ClASSIFN 0.125 0.608 0.749 Not opplicoble
TYPE 0,043 0,520 0,471 Not opplicoble
CTRS COV SECTOR 0,120 2.010 o. 136 Not opplicoble
PROJSIZE 0,103 0,978 0.404 2,007 QSABSDEV 0,239 2.730 0,014 2,837 BIDRANG 0,629 44.743 0.000 128,412
YEAR 0.232 1.152 0,316 4,986
NOBIDS 0,122 0,816 0.539 l.780
1.158
0,093
0.000
0.026
0,183
-0.085
0.099
0.533
0.134
0,080
The Table shows that the strength of association between the contractors' tender variability and the listed factors (with the exception of BIDRANGE, ETA = 0,629) is generally low, with ETA ranging from 0, 1 03 to 0,239. The high strength of association between the contractors' tenders' coefficient of variation and BIDRANGE is not unexpected, given that the two variables can indeed be used to measure contractors' bid variability. ANOVA results also show that, with the exception BIDRANGE and QSABSDEV. there is no evidence that the variability of the contractors' tenders is influenced by any other factors. The linearity tests show no significant linear relationship between the contractors' bid variability
24
Pearl, Akintoye, Bowen & Hardcastle • Tender sum forecasting
and any other factors, with the exception of BIDRANGE. There is an insignificant negative relationship between the contractors' bid variability and project size. The results suggest that the contractors' tender price variability in South Africa is not affected by any of the listed independent variables.
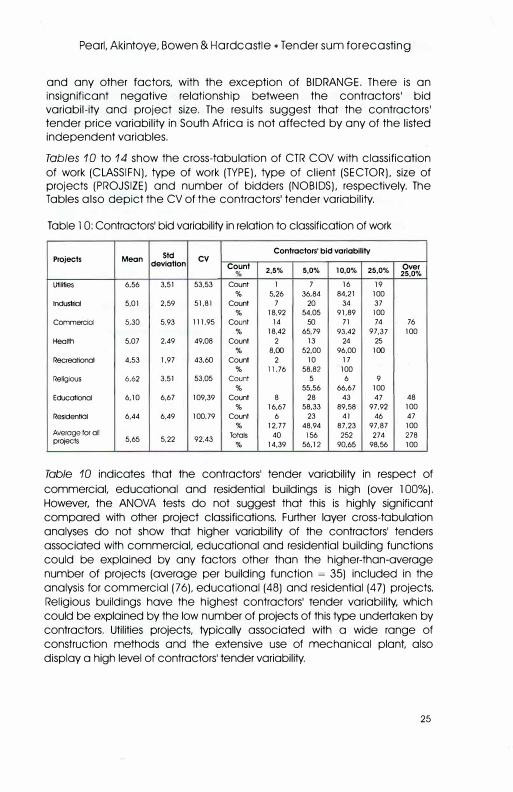
Tables 10 to 14 show the cross-tabulation of CTR COV with classification of work (CLASSIFN), type of work (TYPE), type of client (SECTOR), size of projects (PROJSIZE) and number of bidders (NOBIDS), respectively. The Tables also depict the CV of the contractors' tender variability.
Table l 0: Contractors' bid variability in relation to classification of work
Sid Contractors' bid variability
Projects Mean CV deviation Count Over
2,5% 5,0% 10,0% 25,0% 25,0%
Utilities 6.56 3.51 53.53 Count 1 7 16 19
% 5,26 36.84 84,21 100
Industrial 5,01 2,59 51.81 Count 7 20 34 37
% 18,92 54,05 91,89 100
Commercial 5.30 5.93 111,95 Count 14 50 71 74 76
% 18.42 65,79 93.42 97,37 100
Health 5.07 2.49 49,08 Count 2 13 24 25
% 8.00 52.00 96,00 100
Recreotional 4,53 1,97 43,60 Count 2 10 17
% 11.76 58.82 100
Religious 6.62 3.51 53,05 Count 5 6 9
% 55.56 66,67 100
Educational 6,10 6,67 109,39 Count 8 28 43 47 48
% 16,67 58,33 89,58 97,92 100
Residential 6.44 6.49 100.79 Count 6 23 41 46 47
% 12,77 48,94 87,23 97,87 100 Average tor all
5.65 5.22 92.43 Totals 40 156 252 274 278
projects % 14,39 56,12 90,65 98.56 100
Table 10 indicates that the contractors' tender variability in respect of
commercial, educational and residential buildings is high (over 100%). However, the ANOVA tests do not suggest that this is highly significant compared with other project classifications. Further layer cross-tabulation analyses do not show that higher variability of the contractors' tenders associated with commercial, educational and residential building functions could be explained by any factors other than the higher-than-average number of projects (average per building function = 35) included in the analysis for commercial (76), educational (48) and residential (47) projects. Religious buildings have the highest contractors' tender variability, which could be explained by the low number of projects of this type undertaken by contractors. Utilities projects, typically associated with a wide range of construction methods and the extensive use of mechanical plant, also display a high level of contractors' tender variability,
25

Acta Structilia 2003: l0(l & 2)
Table 11 does not indicate any significant difference in the variability of the contractors' tenders between new work and alteration work. Table
12 shows that the contractors' bids are highly variable in respect of local authority projects in comparison with private sector and central government projects.
Table l l : Contractors' bid variability in relation to the type of work
Sid Controctors' bid voriobility
Type of work Mean deviation
CV Count
2,5% 5,0% 10,0% 25,0% Over
% 25,0%
New work 5,51 4,97 90.16 Count 30 115 181 199 201
% 14,93 57,21 90,05 99,00 100
Alteration worlc 6.02 5,86 97.30 Count 10 41 7l 75 77
% 12,99 53,25 92,21 97,40 100 Average for all
5,65 5,22 92.43 Totals 40 156 252 274 278
projects % 14,39 56,12 90,65 98,56 100
Tobie 12: Contractors' bid variability in relation to the type of client
Sid Contractors' bid variability
Projects Mean CV deviation Count Over
2,5% 5,0% 10,0% 25,0% 25,0%
Private 5,29 3,54 66,90 Count 32 113 179 198 199
% 16,08 56.78 89,95 99.50 100
Local govt 6,83 9,21 134,77 Count 8 36 53 56 59
% 13,56 61.02 89,83 94,92 100
Central govt 5.78 l.65 28.64 Count 7 20
% 35,00 100 Average tor all
5,65 5,22 92,43 Toto� 40 156 252 274 278
projects % 14,39 56,12 90,65 98,56 100
Further analysis within the confines of the data shows that the only factor that could have explained the high variability associated with local authority projects (mean = R4,65 million, std = 6,43 million) is the size of those projects compared with those initiated by the private sector (mean = R2,55 million, std = 3,96 million) and central government (mean = R2,45 million, std = 2,06 million) projects. The fact that large projects are associated with higher variability of contractors' tenders is reflected in Table 13, with mega-sized projects having a CV of 172,48%.
Although the small-sized projects display the highest mean variability, the tender sum forecasts by contractors within this group are the most consistent, with a CV of 57,45%. Whilst the reason for this performance is not obvious, it is possibly a result of the familiarity that local contractors hove developed with this size of project. It is noticeable that l 83 of a total of 278 projects analysed foll into the 'small/medium' categories.
26

Pearl, Akintoye, Bowen & Hardcastle • Tender sum forecasting
Table 13: Contractors' bid variability in relation to the size of the project
Sid Contractors' bid variability
Projects Mean CV deviation Count over
% 2,5% 5,0% 10,0% 25,0% 25,0%
Small 6.33 3,64 57.45 Count 6 44 87 103 % 5,83 42.72 84,47 100
Medium 5,39 4,66 86.47 Count 9 46 77 80 81 % 11,11 56.79 95,06 98,77 100
large 4,99 4,02 80,57 Count 10 32 46 49 50
% 20.00 64,0 92,00 98,00 100 Mega 5,31 9,15 172,48 Count 15 34 42 42 44
% 34,09 77,27 95,45 95,45 100 Average for all
5,65 5.22 92,43 Tota� 40 156 252 274 278
projects % 14,39 56.12 90,65 98,56 100
Table 14 shows that, although the 5 to 6 bidders range has the lowest contractors' tender variability (mean CV= 4,93), followed by the 7 to 8 bidders range (mean CV = 5,26), with the exception of over 14 bidders, the 7 to 8 bidders range displays the highest consistency of tender sum forecast performance by contractors with a CV of 53%.
Table 14: Contractors' bid variablity in relation to the number ot bidders
Sid Contractors' bid variability
Bidders Mean CV deviation Count Over
% 2,5% 5,0% 10,0% 25,0% 25,0%
2 - 4 bidders 5,82 7,46 128,23 Count 9 15 28 28 29 % 31.03 51.72 96,55 96,55 100
5 - 6 bidders 4,93 5,14 104,18 Count 17 49 74 77 78 % 21.79 62.82 94.87 98.72 100
7 - 8 bidders 5,26 2.79 53,00 Count 5 37 60 66
% 7,58 56,06 90,91 100 9 - 10 bidders 6,54 6,82 104.26 Count 6 34 47 57 58
% 10.34 58.62 81.03 98,28 100 11 - 14 bidders 6.21 4,34 69,89 Count 3 15 31 33 34
% 8.82 44.12 91.18 97,06 100 Over 14 bidders 6.18 2.55 41,26 Count 6 12 13
% 46,15 92.31 100 Averoge tor all
5,65 5,22 92,43 Tota� 40 156 252 274 278
projects % 14,39 56,12 90,65 98,56 100
Discussion of results
Published research dealing with the variability of contractors' tender sum forecasts tends to suggest that this varies between a 5% and 9% coefficient of variation. Beeston (1975) has suggested that, due to several causes of tender variability applying in practice, there is little prospect of reducing the coetticient of variation tor tenders to less than 8%. This view is partially supported by the opinion of Ashworth and Skitmore (1982), who declare that contractors should estimate with an error of
27

Acta Structilia 2003: l 0(1 & 2)
considerably less than 1 0% of their total final cost, and generally of the order of :±:5%, given a set of quantities and subcontractors quotations.
In a study of 64 projects built by a large contracting firm in the UK, Flanagan (1980) established that the coefficient of variation varied, depending on project value, between 2,85% and 11,55%. The mean for the sample analysis is 8,22%. Flanagan concluded that the best measure of a contractor's ability to estimate his own costs on projects is 6,6% CV. Barnes' (1974) analysis of 228 projects taken from 10 different contracting organisations found that the coefficient of variation measured between the contractors' estimate and the actual cost of the projects, was approximately 7%. Skitmore's (1986) analysis of 269 building projects in the UK shows that the estimating variability of construction contractors has a mean CV of 6,5%, while Runeson's (1988) analysis of 1064 building projects produced a mean CV of 4,9%.
Greig's ( 1981) analysis shows that 72% of estimates produced by quantity surveyors are within 5% when compared with the accepted tender, and 73% when compared with the final account figure. Morrison's (1984) research, based on an examination of 55 7 projects from 7 largely public sector sources, deduced that the best performance that quantity surveyors can achieve is roughly within 15,5% of the lowest acceptable tender. This contradicts an earlier opinion held by Beeston (1975) who reasons that, using currently available methods of estimating, the best possible forecast accuracy is in the order of 7 per cent and 8 per cent of the lowest accepted tender. The level of forecast performance was qualified as dependent upon the quantity surveyor's 'intuitive' estimating ability.
A study based on 273 construction projects undertaken between 1974 and 1 981 by the National Aeronautical and Space Administration (NASA) in the USA and cited by Tan (1988), indicated that the cost consultants' forecasts average was 7,8% higher than the low bids accepted.
Skitmore (1988) analysed cost consultants' forecasts of the contractors' lowest tender price, the analysis being based on two sets of data. Analysis of the first set of data, based on 67 building and engineering projects in the USA , found their forecasts to be an average of 1 2,38% higher than the low bids (std dev = 21,53, CV= 173,9%). Analysis of the second set of data, based on 33 building contracts executed in the UK between 1983 and 1987, revealed that the estimates were, on average, 4,91 % lower than the lowest tenders (std dev = 17,22 and CV = 350.7%). In both of these instances there is high inconsistency in the forecast performance of contractors' lowest acceptable tender by the cost consultants.
28

Pearl, Akintoye, Bowen & Hardcastle • Tender sum forecasting
Conclusions
The analysis of South African tender information reported in this paper indicates an average forecast performance by quantity surveyors of 8,33% [std dev = 11,183, CV = 134,2%). The results indicate that consultants in other countries less accurate and more inconsistent than those compile the pre-tender estimates produced by South African quantity surveyors. This situation demonstrates that there is considerable potential for improving the pre-tender estimating service provided to clients in South Africa. No evidence has been found, in the case of these South African data, to link forecasting performance with
the type of project, client, function of project, project size, location or number of bidders. The only factor, which shows significance is the date of tender, which may be an indicator of the importance of market conditions prevailing at the time that pre-tender estimates are produced.
The current analysis of 278 projects in South Africa for the period in ques
tion shows that the variability of contractors' tender sum forecasts is
5,65% (std dev = 5,22, SE = 0,313). Analysis of these data, contrary to
the findings of Flanagan [1980), does not conclude that this variability
is dependent on project value (Pearson correlation = -0,026, p =
0,668). Moreover, there is also no evidence, based on these South
African data, to suggest that the variability of contractors' tender sum
forecasts is dependent on building function, type of work [new or
alteration), type of client, and the number of bidders. However, the
results do suggest that local authority projects are associated with high
variability of contractors' tender sum forecasts, while 7 to 8 bidders
produced the highest consistency in contractors' tender sum forecasts.
Overall, the South African results tend to support randomness of
variability of contractors' tenders, a view held by Beeston (1975).
References
AKINTOYE, A.A. 2000. Analysis of factors influencing project cost estimating practice. Construction Management and Economics, 18(1), pp. 77-89.
ADAMS, J. & BUSCH, J.K. 1981. Reducing project uncertainty. In: Proceedings of PMI Symposium: The World of Project Management, Boston, September, pp. 374-381.
ASHWORTH, A. & SKITMORE, M. 1982. Accuracy in estimating. Occasional Paper No. 27, London: Chartered Institute of Building, London.
29

Acta Structilia 2003: 10( l & 2)
AVERY, D.W.
1982. Problems of locality in construction in construction cost
forecasting and control. In: Brandon, P.S. (ed). Building Cost Techniques: New Directions. London: E. & F.N. Spon, pp. 159-160.
BARNES, N.M.L.
1974. Financial control of construction. Control of Civil Engineering
Projects (eds SH Wearne & Edward Arnold), Chapter 5.
BEESTON, D.T.
1975. One statistician's view of estimating. Building Technology and
Management, Morch, pp. 33-37.
BEESTON, D.T.
1983. Statistical methods for building price data. London: E & FN Spon.
BENNETT, J., MORRISON, N.A.D. & STEVENS, S.D.
1981. Cost planning and computers. London: Property Services
Agency.
BETTS, M. & BROWN, P.
1992. Construction tender bid variability in Singapore. Transactions.
American Association of Cost Engineers, pp. Q.6.l-Q.6.12.
BETTS, M. & GUNNER, J.
1989. The accuracy of a consultant quantity surveyor's building
price prediction. Occasional Paper No. 3/89, School of Building and
Estate Management, National University of Singapore.
BILLET, R.E.
1990. An investigation into estimating and cost planning methods
used by quantity surveying firms in South Africa. Unpublished MSc
(Building) thesis, Faculty of Architecture. Johannesburg: University of
the Witwatersrand.
DE NEUFVILLE, R., HANI, E.N. & LESAGE, Y. 1977. Bidding models: effects of bidders' risk aversion. Journal of the
Construction Division, American Society of Civil Engineers, Vol. l 03(C01 ), pp. 57-70, March.
DREW, D.S.
30
1990. Competitive bidding: an overview with reference to the Hong Kong construction industry. Proceedings of the Conference on Construction Costs and Management.

Pearl, Akintoye, Bowen & Hardcastle • Tender sum forecasting
DREW, D.S. & SKITMORE, R.M.
FINE, B.
1990. Analysing bidding performance: measuring the influence of contract size and type. Proceedings of the C.I.B. W-55/65 International Symposium on Building Economics and Construction Management. Sydney, March, 6, pp. 129-139.
1974. Tendering strategy. Building, 25 October, pp. 116-121.
FLANAGAN, R.
1980. Tender price and time prediction for construction work. Unpublished PhD thesis, Birmingham: University of Aston.
FLANAGAN, R. & NORMAN, G.
1982. Making good use of low bids. Chartered Quantity Surveyor,
March, pp. 226-227.
1983. The accuracy and monitoring of quantity surveyor's price
forecasting for building work. Construction Management and
Economics, l (2), pp. l 57 - l 80.
1985. Sealed bid auctions: an application to the building industry.
Construction Management and Economics, 3(2), pp. 145-161.
GOH, B.H. & TEO, T.H.
1992. Tender price index forecasting and bid analysis in Singapore. London: Royal Institution of Chartered Surveyors.
GREIG, M.D. 1981. Construction cost advice - is the customer satisfied?
Unpublished MSc dissertation, Department of Building, Edinburgh: Heriot Watt University.
GUNNER, J. & BETTS, M. 1990. Price forecasting performance by design team consultants in the Pacific rim. In: Proceedings of the CIB. W-55/65 International Symposium on Building Economics and Construction Management, Sydney. March, 3, pp. 302-312.
GUNNER, J. & SKITMORE, M. 1999. Comparative analysis of pre-bid forecasting of building prices based on Singapore data. Construction Management and
Economics, 17(5), pp. 635-646.
31

Pearl, Akintoye, Bowen & Hardcastle • Tender sum forecasting
OGUNLANA, S.O. & THORPE, A. 1991. The nature of estimating accuracy: developing correct
associations. Building and Environment, 26(2), pp. 77-86.
PEARL, R. 1992. Factors affecting the accuracy of quantity surveyors' pretender price forecasts in South Africa. Unpublished MSc dissertation. Rondebosch: University of Cape Town.
PROPERTY SERVICES AGENCY 1980. Construction cost data base. Second Annual Report. London: Property Services Agency Library.
QUAH, L.K. 1988. An evaluation of the risks in estimating and tendering for refurbishment contracts. Unpublished PhD thesis, Heriot-Watt University.
RAFTERY, J .l987. The state of cost/price modelling in the UK construction
industry: A multicriteria approach. In: Brandon, P.S. (ed). Building
Cost Modelling and Computers. London: E & FN Span, pp. 49-71.
RAPIER, C.P.
1990. How to deal with accuracy and contingency. Transactions. American Association of Cost Engineers, pp. K.8. l-K.8.8.
RUNESON, G.1988. An analysis of the accuracy of estimating and the distribution of
tenders. Construction Economics and Management, 6, pp. 357-370.
RUNESON, G. & BENNETT, J. 1983. Tendering and the price level in the New Zealand building
industry. Construction Papers, 2, pp. 29-35.
SHASH, A.A. & AL-KHALDI, Z.S. 1992. The production of accurate construction cost estimates in
Saudi Arabia. Cost Engineering, 34(8), pp. 15-24.
SKITMORE, R.M. 1985. The influence of professional expertise in construction price forecasts. Report: Department of Civil Engineering. Salford: University of Salford.
1987°. The effect of project information on the accuracy of
building price forecasts, In: Brandon, P.S. (ed). Building cost
modelling and computers. London: E & FN Span, pp. 327-336.
33

Act a Structilia 2003: l O( l & 2 )
1987". Construction prices: the market effect. London: Report for the Royal Institution of Chartered Surveyors Educational Trust.
1988. Factors affecting accuracy of engineers' estimates. Transactions.
American Association of Cost Engineers, pp. B.3. l-B.3.8.
1990. Early stage construction price forecasting - a review of performance. Report: Department of Surveying. Salford: University of Salford.
SKITMORE, R.M. & TAN, S.H. 1987. Factors affecting accuracy of engineers' estimates. Research Report: Department of Civil Engineering. Salford: University of Salford.
SKITMORE, R.M., STRADLING, S. TUOHY, A. & MKWEZALAMBA , H.
TAN, S.H.
1990. The accuracy of construction price forecasts. Salford: The University of Salford.
1988. An investigation into the accuracy of cost estimates during the design stages of construction projects. Unpublished BSc (Hons) dissertation. Salford: University of Salford.
TRUE, N.F.
1988. Determining the accuracy of a cost estimate. Transactions. American Association of Cost Engineers, pp. T.2. 1-T.2. l 0.
WILSON, O.D., SHARPE, K. & KENLEY, R. 1987. Estimates given and tenders received: A comparison.
Construction Management and Economics, 5(3), pp. 211-226.
WYSKIDA, R.M.
34
1986. Personal communication. Industrial Systems and Engineering, Huntsville (USA): University of Alabama.