A big full-round tunnel formwork designed for the Ingula ...
Upload
khangminh22Category
view
0download
0
BIM-BASED FORMWORK AND CLADDING QUANTITY TAKE-OFF USING
VISUAL PROGRAMING
A THESIS SUBMITTED TO
THE GRADUATE SCHOOL OF NATURAL AND APPLIED SCIENCES
OF
MIDDLE EAST TECHNICAL UNIVERSITY
BY
YAŞAR ÇEPNİ
IN PARTIAL FULFILLMENT OF THE REQUIREMENTS
FOR
THE DEGREE OF MASTER OF SCIENCE
IN
CIVIL ENGINEERING
SEPTEMBER 2021


Approval of the thesis:
BIM-BASED FORMWORK AND CLADDING QUANTITY TAKE-OFF
USING VISUAL PROGRAMING
submitted by YAŞAR ÇEPNİ in partial fulfillment of the requirements for the
degree of Master of Science in Civil Engineering, Middle East Technical
University by,
Prof. Dr. Halil Kalıpçılar
Dean, Graduate School of Natural and Applied Sciences
Prof. Dr. Ahmet Türer
Head of the Department, Civil Engineering
Assist. Prof. Aslı Akçamete Güngör
Supervisor, Civil Engineering, METU
Examining Committee Members:
Prof. Dr. M. Talat Birgönül
Civil Engineering, METU
Assist. Prof. Dr. Aslı Akçamete Güngör
Civil Engineering, METU
Prof. Dr. İrem Dikmen Toker
Civil Engineering, METU
Prof. Dr. Rifat Sönmez
Civil Engineering, METU
Assist. Prof. Dr. Saman Aminbakhsh
Civil Engineering, Atılım University
Date: 09.09.2021

iv
I hereby declare that all information in this document has been obtained and
presented in accordance with academic rules and ethical conduct. I also declare
that, as required by these rules and conduct, I have fully cited and referenced
all material and results that are not original to this work.
Name Last name : Yaşar Çepni
Signature :

v
ABSTRACT
BIM-BASED FORMWORK AND CLADDING QUANTITY TAKE-OFF
USING VISUAL PROGRAMING
Çepni, Yaşar
Master of Science, Civil Engineering
Supervisor : Assist. Prof. Dr. Aslı Akçamete Güngör
September 2021, 111 pages
Material quantity take-off (QTO) is an indispensable work item in construction
projects since it is essentially utilized for scheduling and cost calculation.
Traditionally, quantities are calculated based on 2D drawings, which require
significant time. It is also an error-prone process because of human inclusion.
Moreover, during the project execution, the take-off process gets tedious due to
design revisions, missing information, accumulated errors, and inevitable mistakes
while performing QTO. Hence, the architecture, engineering, and construction
(AEC) industry have been paving the way for implementing Building Information
Modeling (BIM) for material QTO and other crucial tasks in the building industry,
such as visualization, design analysis, and clash detection. However, the reliability
of BIM-based QTO is being questioned among construction practitioners. It is
because, and according to the literature, the accurate and automated calculation of
area-based materials like formwork and architectural claddings using BIM remains
problematic. The reason is mainly due to lack of modeling conventions, agreed
workflows among project participants, erroneous modeling process, and limitations
of BIM software. Previous studies proposed various modeling approaches, methods

vi
for querying BIM models for quantities, creating bridges between BIM-based QTO
and take-off standards, and especially recent studies suggested using visual
programing for more accurate and reliable BIM-based QTO. Therefore, two different
methodologies are developed in this thesis to obtain accurate formwork and
architectural cladding QTO within the context of visual programing. Then, a case
study is implemented using Autodesk Revit and Dynamo to test the proposed
methodologies. Meanwhile, the current software capability for BIM-based QTO is
investigated while verifying case study results. Accordingly, results indicate that the
algorithms developed in Dynamo successfully obtain material quantities more
accurately, and it is also capable of automatically creating 3D models with essential
information for formwork and architectural elements. The main contributions of this
study are the proposed frameworks, visual codes, and showing the limitations and
capabilities of one of the most commonly used BIM tools and problems during the
execution of the case study. This research can also be further improved for 4D
scheduling, clash detection, and most importantly, new studies in IFC (Industry
Foundation Classes) format can be performed for enabling QTO with neutral and
open format approaches.
Keywords: Building Information Modeling (BIM), Quantity Take-Off (QTO),
Visual Programing, Formwork QTO, Architectural Cladding QTO

vii
ÖZ
YAPI BİLGİ MODELLEMESİ TABANLI KALIP VE KAPLAMA
METRAJLARININ GÖRSEL PROGRAMLAMA KULLANILARAK
HESAPLANMASI
Çepni, Yaşar
Yüksek Lisans, İnşaat Mühendisliği
Tez Yöneticisi: Dr.Öğr.Üyesi Aslı Akçamete Güngör
Eylül 2021, 111 sayfa
Malzeme metrajı çıkarma işlemi, inşaat projelerinin planlama ve bütçeleme
süreçlerinde vazgeçilmez bir iş kalemidir. Geleneksel olarak metrajlar 2B çizimlere
göre hazırlanır ve çok zaman gerektirir. Ayrıca insandan kaynaklı hata yapma
ihtimali yüksektir. Üstelik metraj çıkarma süreci proje yapım aşamasındaki
revizyonlar, eksik bilgiler ve gittikçe biriken ve kaçınılmaz olan hatalar yüzünden
zahmetli olmaya başlar. Bu sebeple Yapı Bilgi Modellemesi (YBM) sisteminin,
görselleştirme, tasarım ve çakışma analizlerinde olduğu gibi, metraj çıkarma
işlemlerinde kullanılmasının da önü inşaat sektörü tarafından açılmaktadır. Ancak
YBM tabanlı metraj çıkarma işlemlerinin güvenilirliği proje paydaşları tarafından
sorgulanmaktadır. Literatürdeki çalışmalara göre, kalıp ve mimari kaplamalar gibi
alana bağlı malzeme metrajlarının doğru ve otomatik olarak hesaplanması hala
problemli bir süreçtir. Bunun başlıca nedenleri modelleme kurallarının ve proje
paydaşları arasında önceden belirlenmiş iş akışlarının eksikliği, modelleme
sürecindeki hatalar ve yazılımsal kısıtlamalardır. Önceki çalışmalar, çeşitli
modelleme yöntemleri ve 3B modellerin daha doğru metraj sonuçları vermesi için
sorgulamalar ve aynı zamanda metraj standartları ve YBM tabanlı metrajların

viii
birbirine bağlanması konusunda önerilerde bulunmuştur. Yakın zamandaki
çalışmalar ise görsel programlamanın daha doğru ve otomatik metrajlar için
kullanılabileceğini öne sürmüştür. Dolayısıyla, bu tez çalışmasında kalıp ve mimari
kaplamaların metrajlarını daha doğru alabilmek amacıyla, görsel programlama
çerçevesinde iki farklı metot geliştirilmiştir. Daha sonrasında, önerilen yöntemleri
test etmek için Autodesk Revit ve Dynamo ile örnek bir çalışma yapılmıştır. Test
çalışması sırasında bir YBM yazılımında halihazırda bulunan metraj çıkarma
özellikleri de incelenmiş ve geliştirilen yöntemin sonuçları ile karşılaştırılmıştır.
Sonuçlar kapsamında, görsel programlama aracı Dynamo kullanılarak malzeme
metrajları doğru ve otomatik bir şekilde çıkartılmış ve aynı zamanda otomatik olarak
3B kalıp ve mimari kaplama modelleri oluşturulmuştur. Bu çalışmanın başlıca
katkıları önerdiği metraj çıkarma yöntemi, görsel programlama kodları, yaygın
olarak kullanılan bir YBM yazılımının metraj çıkarma kapasitesinin ve
kısıtlamalarının gösterilmesi ve aynı zamanda örnek çalışma yapılırken ortaya çıkan
metraj çıkarma problemlerinin incelenmesidir. Bu çalışma ilerleyen aşamalarda 4B
planlama ve çakışma analizi için geliştirilebilir. Aynı zamanda yeni çalışmalar IFC
(Industry Foundation Classes) formatı kullanılarak yapılabilir. Böylelikle YBM
tabanlı metraj çıkarmak için yazılımdan bağımsız ve açık kaynaklı yöntemler
oluşturulabilir.
Anahtar Kelimeler: Yapı Bilgi Modellemesi (YBM), Metraj, Görsel Programlama,
Kalıp Metrajı, Mimari Kaplama Metrajı

ix
Dedicated to my beloved family

x
ACKNOWLEDGMENTS
I would like to express my deepest gratitude to my supervisor Assist. Prof. Dr. Aslı
Akçamete Güngör for her guidance, advice, criticism, and insight throughout the
research. While building up this study, she encouraged me to attend international
academic conferences, and I gained tremendously valuable experiences. She also
willingly supported me to go abroad for an exchange program during my master's
study and let me meet a new culture and have a study experience in another well-
known educational institute. Besides, she gave reference to me for my first job four
years ago and enabled me to gain invaluable work experience in an international
project.
I also would like to thank Assist. Prof. Dr. Ralf Klein for his suggestions and
comments on my research during my Erasmus at KU Leuven. I will never forget his
support, friendly approach, and welcomeness. He always encouraged me to keep my
motivation at the utmost level during the Covid 19 pandemic.
I am grateful to my mother Nezihe Çepni, and my father Sait Çepni for their immense
support and energetic approach. I am here today thanks to their motivational words,
"You will do my son!!!". I am truly blessed to have the privilege of being their son
and being the brother of my lovely sister Sema Sağgün. She always believed what I
am doing and why I am doing it and continuously supported me.
xi
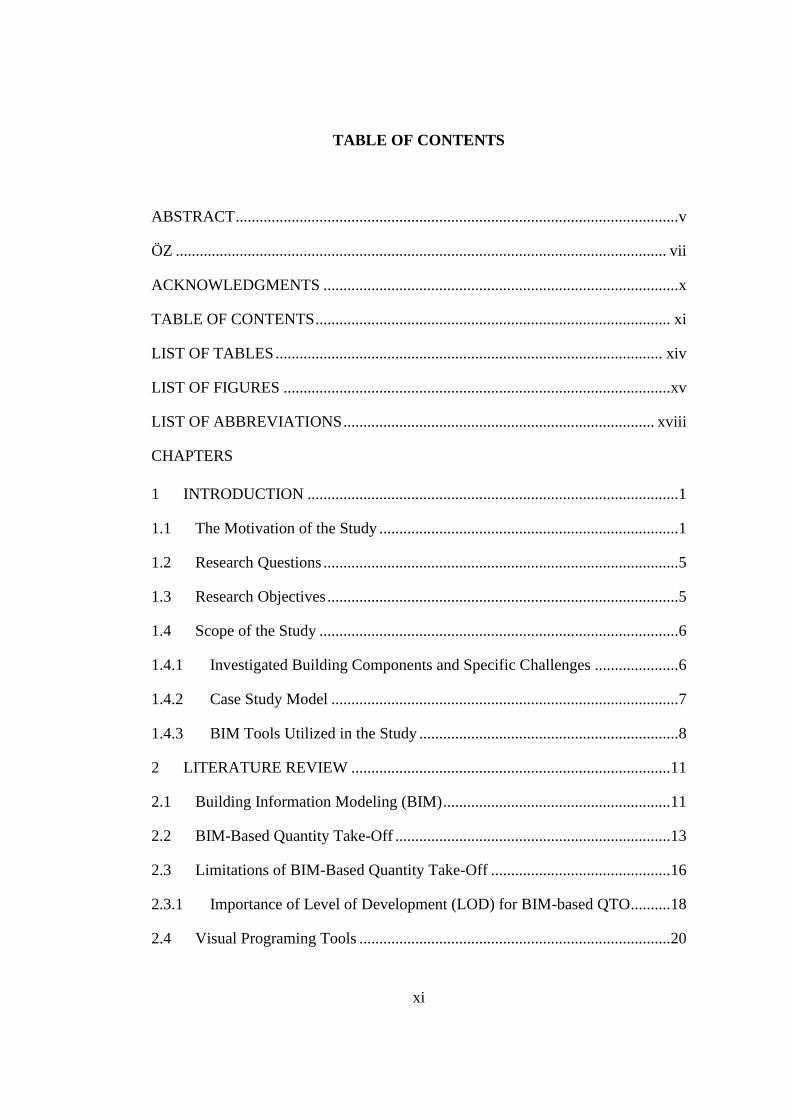
TABLE OF CONTENTS
ABSTRACT ............................................................................................................... v
ÖZ ........................................................................................................................... vii
ACKNOWLEDGMENTS ......................................................................................... x
TABLE OF CONTENTS ......................................................................................... xi
LIST OF TABLES ................................................................................................. xiv
LIST OF FIGURES ................................................................................................. xv
LIST OF ABBREVIATIONS .............................................................................. xviii
CHAPTERS
1 INTRODUCTION ............................................................................................. 1
1.1 The Motivation of the Study ........................................................................... 1
1.2 Research Questions ......................................................................................... 5
1.3 Research Objectives ........................................................................................ 5
1.4 Scope of the Study .......................................................................................... 6
1.4.1 Investigated Building Components and Specific Challenges ..................... 6
1.4.2 Case Study Model ....................................................................................... 7
1.4.3 BIM Tools Utilized in the Study ................................................................. 8
2 LITERATURE REVIEW ................................................................................ 11
2.1 Building Information Modeling (BIM) ......................................................... 11
2.2 BIM-Based Quantity Take-Off ..................................................................... 13
2.3 Limitations of BIM-Based Quantity Take-Off ............................................. 16
2.3.1 Importance of Level of Development (LOD) for BIM-based QTO .......... 18
2.4 Visual Programing Tools .............................................................................. 20

xii
2.5 Formwork Quantification ............................................................................. 22
2.6 Architectural Material Quantification .......................................................... 24
2.7 Literature Gap ............................................................................................... 26
3 METHODOLOGY .......................................................................................... 29
3.1 Formwork Quantification Framework .......................................................... 29
3.1.1 Preparation of Visual Code for Formwork ............................................... 35
3.2 Cladding Quantification Framework ............................................................ 41
3.2.1 Preparation of visual code for claddings ................................................... 45
4 CASE STUDY ................................................................................................. 51
4.1 Formwork Quantification and Modeling ...................................................... 52
4.1.1 Foundation Formworks ............................................................................. 52
4.1.2 Column Formworks .................................................................................. 54
4.1.3 Wall Formworks ....................................................................................... 56
4.1.4 Beam Formworks ...................................................................................... 58
4.1.5 Slab Formworks ........................................................................................ 59
4.1.6 Stair Formworks ....................................................................................... 61
4.2 Cladding Quantification and Modeling ........................................................ 62
4.2.1 Floor Claddings ......................................................................................... 66
4.2.2 Wall Claddings ......................................................................................... 68
4.2.3 Wall Base Claddings ................................................................................. 70
4.2.4 Ceiling Claddings ..................................................................................... 71
5 DISCUSSION OF RESULTS ......................................................................... 73
5.1 Results for Formwork Calculations and Modeling ...................................... 73
5.1.1 Manual Formwork QTO Check for Individual Elements ......................... 82

xiii
5.1.2 Evaluation of Building Expansion Joints .................................................. 86
5.2 Results for Cladding Calculations and Modeling ......................................... 87
.................................................................................................................................. 90
5.2.1 Evaluation of Case Study Model for Architectural Material QTO ........... 91
5.3 Major Challenges and Evaluation of Visual Programing ............................. 93
6 CONCLUSIONS .............................................................................................. 97
6.1 Summary ....................................................................................................... 97
6.2 Limitations of the Study ................................................................................ 98
6.3 Recommendations and Future Works ........................................................... 99
REFERENCES ...................................................................................................... 103

xiv
LIST OF TABLES
TABLES
Table 4.1. Investigated building rooms information ............................................... 62
Table 5.1. Formwork quantification result comparison for individual elements .... 75
Table 5.2. Formwork quantification result comparison for individual elements
using actual values ................................................................................................... 84
Table 5.3. Formwork quantification result comparison for individual elements
using mean absolute percent values ........................................................................ 85
Table 5.4. Effect of expansion joint over formwork area ........................................ 87
Table 5.5. Room cladding quantification comparison using actual values ............. 89
Table 5.6. Room cladding quantification comparison using mean absolute percent
values ....................................................................................................................... 90
Table 5.7. Dynamo processing times for formwork quantification and modeling .. 95

xv
LIST OF FIGURES
FIGURES
Figure 1.1. A comparison between conventional CAD and new BIM approach
(Azhar et al., 2008) ................................................................................................... 3
Figure 1.2. Typical formwork quantification challenges .......................................... 7
Figure 1.3. (a) Composite floor and (b) wall elements overlapping with other
building components Khosakitchalert et al. (2019a) ................................................ 7
Figure 1.4. Revit model view for the case study ....................................................... 8
Figure 1.5. Differences between visual and textual programing
(https://primer.dynamobim.org/) ............................................................................... 9
Figure 1.6. Sample Dynamo workflow and its key points ...................................... 10
Figure 2.1. Some common connotations of multiple BIM terms (Succar, 2009) ... 12
Figure 2.2. Definition of BIM by different organizations (Yun & Kim, 2013) ...... 12
Figure 2.3. Differences between LOD 300 and LOD 350 (BIM Forum, 2019) ..... 19
Figure 3.1. Issues in extracting formwork quantities from a BIM model ............... 30
Figure 3.2. A view illustrating stair casting assumptions ....................................... 31
Figure 3.3. Shared parameter assignment (a), population of shared parameters (b)
and shared parameter text file (c) ............................................................................ 32
Figure 3.4. Formwork area calculation and modeling framework .......................... 33
Figure 3.5. Dynamo workflow for input variables.................................................. 35
Figure 3.6. Dynamo workflow for eliminating overlapping areas among building
components ............................................................................................................. 36
Figure 3.7. Dynamo workflow for generating formwork IDs using element IDs .. 37
Figure 3.8. Dynamo workflow for eliminating top and bottom surfaces ................ 38
Figure 3.9. Dynamo workflow for generating formwork panels using generic
models ..................................................................................................................... 39
Figure 3.10. Dynamo workflow for exporting results to a spreadsheet .................. 40
Figure 3.11. Cladding area calculation and modeling framework .......................... 43
Figure 3.12. Dynamo workflow for importing room data ...................................... 45

xvi
Figure 3.13. Dynamo workflow to manipulate room data before importing Revit . 46
Figure 3.14. Dynamo workflow to create different family types for floors and walls
................................................................................................................................. 46
Figure 3.15. Dynamo workflow for creating floor claddings .................................. 47
Figure 3.16. Dynamo workflow showing the key part of wall cladding creation ... 47
Figure 3.17. Dynamo workflow for creating floor claddings at door sills and
scaling doors to eliminate room perimeters ............................................................. 48
Figure 3.18. Dynamo workflow to create ceiling components as generic models .. 49
Figure 4.1. Foundation elements modeled with floor category in Revit ................. 52
Figure 4.2. Distinguishing floor elements based on their comments property ........ 53
Figure 4.3. Foundation formwork panels and populated formwork parameters ..... 53
Figure 4.4. Inclined formwork surface elimination ................................................. 54
Figure 4.5. Circular column formwork panels and populated formwork parameters
................................................................................................................................. 55
Figure 4.6. Rectangular column formwork panels and populated formwork
parameters ................................................................................................................ 55
Figure 4.7. Wall formwork calculation and modeling results ................................. 56
Figure 4.8. Organization of list structures using List.Flatten node ......................... 57
Figure 4.9. The corrected result of wall formwork modeling ................................. 57
Figure 4.10. Typical beam, column, and floor connections calculated and modeled
correctly ................................................................................................................... 58
Figure 4.11. Visual script part for overriding problematic floor elements .............. 59
Figure 4.12. Visual script part for creating the geometry of problematic floor
elements ................................................................................................................... 60
Figure 4.13. Slab formwork calculation and modeling results ................................ 60
Figure 4.14. Stair formwork calculation and modeling results ............................... 61
Figure 4.15. Room separation lines and some room elements ................................ 63
Figure 4.16. Dynamo code for extracting room data from the design model ......... 64
Figure 4.17. Manual entered and automatically created room data......................... 65

xvii
Figure 4.18. Automatic floor generation results in Revit project browser
(a) previous floor list (b) floor list after Dynamo run ............................................. 65
Figure 4.19. Floor cladding calculation and modeling code ................................... 66
Figure 4.20. Dynamo workflow for creating floor claddings at door sills ............. 67
Figure 4.21. Floor cladding calculation and modeling result ................................. 68
Figure 4.22. Wall cladding calculation and modeling result .................................. 69
Figure 4.23. Overcoming material extension above ceiling parameters with 0 value
................................................................................................................................. 69
Figure 4.24. Wall base cladding calculation and modeling result .......................... 70
Figure 4.25. Ceiling calculation and modeling result ............................................. 71
Figure 5.1. (a) Revit Schedule/Quantities and Material Takeoff options, and (b)
Paint and Split Face options .................................................................................... 74
Figure 5.2. (a) Unreduced formwork area between foundations and floors, and (b)
calculated schedule parameter addition in Revit..................................................... 77
Figure 5.3. Wall opening formwork problem ......................................................... 78
Figure 5.4. Arched wall surface formwork panels .................................................. 78
Figure 5.5. Parameter addition for column base perimeter, (a) for rectangular and
(b) for circular columns........................................................................................... 79
Figure 5.6. Calculated schedule parameter addition in Revit for columns using
predefined base perimeter parameter ...................................................................... 80
Figure 5.7. Beam section parameter creation and its use in calculated schedule
parameter ................................................................................................................. 81
Figure 5.8. Stair landing modeled with floor element and stair formwork view .... 82
Figure 5.9. Manual QTO example for SB106 column ............................................ 83
Figure 5.10. Expansion joints in the building and casting sequence ...................... 86
Figure 5.11. Architectural details from case study model ...................................... 92
Figure 5.12. Unnecessary material claddings above ceiling level .......................... 93
Figure 5.13. PolySurface problem and increase in sublists for surfaces................ 94

xviii
LIST OF ABBREVIATIONS
ABBREVIATIONS
AEC Architecture, Engineering and Construction
BIM Building Information Modeling
CAD Computer Aided Design
GBA Gross Building Area
LOD Level of Development
NBIMS National BIM Standard
RGB Red-Green-Blue
QTO Quantity Take-Off

1
CHAPTER 1
1 INTRODUCTION
1.1 The Motivation of the Study
Staub-French et al. (2003) stated that cost estimation is a knowledge-intensive
engineering task, and it requires an educated and experienced team of professionals
to perform this task. Otherwise, clients and contractors end up with considerable
fluctuations in construction cost calculations of different estimators for the same
project, and this inconsistency brings about overestimation or underestimation,
which further results in loss of opportunities and abrupt expenses. Similarly, Aram
et al. (2014) emphasized that cost calculation is the point of departure for successful
project management such that budgeting, bidding, production planning, and cost
control activities rely on effectiveness in cost estimation.
Jrade & Alkass (2007) stated that cost estimation during the initial phase of a project
traditionally relies on the experience of estimators and assumptions based on
previous data of projects having a similar scope of works while design drawings and
specifications are being utilized later for the detailed estimation. It is because
detailed cost calculation requires understanding the design details and differences
between consecutive design revisions and their unexpected ramifications on the
project budget in later stages (Lawrence et al., 2014).
Cost estimation is a critical process, and it is generally comprised of material, labor,
equipment, and overhead costs. Material costs inevitably rely on quantity take-off
(QTO) based on construction documents, including design drawings and
specifications. Hence, Olsen & Taylor (2017) stated that design documents should
be meticulously investigated for material QTO so that there is not double-counted or

2
disregarded information on the construction documents. These documents should
also be closely followed up during the project execution because they are most
subject to change, and those changes might need to be reflected in material take-offs.
Quantity take-off (QTO) is a detailed measurement of building materials, and it is
the backbone of construction activities (Firat et al., 2010). It is stated that QTO
provides the base for preliminary cost estimation in the early project stage;
meanwhile, it helps estimate project cost and duration of work items in the tendering
phase while it is utilized for scheduling and budgeting construction activities in the
construction stage for the economic control of the project (Monteiro & Martins,
2013). In general, the QTO process includes identifying construction items and their
relations using design drawings by obtaining dimensions and calculating units of
measurements such as areas, volumes, and linear meters (Shen & Issa, 2010).
However, this process eventually gets tedious and time-consuming since designs are
always changing, and details continuously increase in the project life cycle. Cheung
et al. (2012) stated that traditional QTO gets iterative and ineffective since design
development between successive activities creates time-lags during design
development and design reviews, and consequently, cost calculation and QTO
becomes slower. Despite its importance, traditional QTO is a manual process, and it
requires a significant amount of time to interpret conventional printed and CAD
drawings (Sabol, 2008).
For this reason, the AEC industry has already been using BIM for material QTO.
Ashcraft (2008) stated that 3D information models include data or links to associated
data required to extract material quantities such as length, area, cost information. He
also added that BIM prevents processing the take-offs manually, decreasing errors
and misconceptions while building up cost data with the design developments and
updates. Azhar et al. (2008) worded that BIM tools have cost estimating features that
automatically calculate and update material quantities; this way, whole-life costs of
construction projects are better captured. Hence, a well-structured BIM model
includes all necessary geometric and non-geometric building data for building

3
components (Figure 1.1). As the model develops, a list of materials can be extracted
from 3D models, and they can be used for various purposes.
Figure 1.1. A comparison between conventional CAD and new BIM approach
(Azhar et al., 2008)
However, there are some problems with obtaining accurate QTO results from 3D
models. Khosakitchalert et al. (2019a) expressed that 3D models provided by
designers may not have detailed building elements enough for material take-offs, or
the quantities may be excessive or insufficient due to the modeling process.
Lawrence et al. (2014) stressed that the estimating process is more than just counting
and measuring but understating and evaluating construction conditions such as
unique wall conditions and compelling situations affecting project costs.
Therefore, it reduces the reliability of BIM-based QTO even though 3D models can
still be utilized for visualization, clash detection, and shop drawing production. Olsen
& Taylor (2017) stated that construction practitioners find BIM-based QTO
unreliable due to the limited and misleading information in 3D models and the
amount of time for checking model correctness. Furthermore, Franco et al. (2015)
pointed out that the cost and time for creating the detailed 3D model, implementing
an automated estimation structure, and training of the BIM staff hinder the BIM
implementation for material QTO. Hence, the automated modeling of building
components can save time and money for the construction industry. Monteiro et al.
(2014) stated that data manipulation is required in some cases for the quantity take-
off data to make the quantities compatible with the required format, but BIM features

4
for implementing necessary mathematical relations are not user-friendly.
Wijayakumar & Jayasena (2013) stated that counting objects is straightforward in
BIM-based QTO, but area-based take-offs are challenging and hard to extract using
BIM tools. Distinguishing overlapping building components and deducting opening
areas like windows and doors is not always easy due to software limitations.
According to studies in the literature, BIM-based QTO has some drawbacks due to
the following reasons;
✓ lack of manipulation of BIM take-off data
✓ unexpected design conditions and unique building components
✓ limited and deceptive information in 3D models
✓ cost and time for developing detailed models for QTO
✓ excessive and insufficient material quantities due to the modeling process
✓ software limitations for area-based material take-offs
It is evident that additional effort should be made to increase BIM-based QTO
accuracy for the benefit of construction practitioners, especially contractors.
Moreover, the automated creation of building components should be investigated to
increase the efficiency of the 3D modeling process. Therefore, this study is intended
to demonstrate the application of visual programing tools for QTO calculations in
the BIM environment by eliminating modeling mistakes and software limitations.
Building materials targeted in the study are area-based materials like formwork for
structural framing systems and floor and wall claddings for architectural finishes. In
the end, this thesis reveals the fact that visual programing tools facilitate material
QTO for models having modeling mistakes or limitations, and it also paves the way
for automatic 3D modeling of building components like temporary formwork and
architectural claddings. The proposed methods and applications of visual
programing are especially beneficial for contractors who needs detailed and accurate
quantification of each building component in the construction stage.

5
1.2 Research Questions
This thesis aims at finding solutions for the following questions:
✓ How can concrete formwork and architectural finish QTOs be accurately
extracted from 3D models using visual programing tools?
✓ How can visual programing tools be used to create 3D models for formwork
and architectural elements automatically?
1.3 Research Objectives
The main objective of this thesis is to develop visual codes in Autodesk Dynamo to
obtain accurate material QTOs for structural formwork and architectural floor, wall,
and ceiling elements using 3D information models. This objective aims to eliminate
errors due to modeling mistakes and deficiencies in the model and overcome some
software limitations for extracting accurate area information, which is highly
valuable for detailed cost estimation, to enhance the BIM-based material QTO
process.
The second objective is to improve visual codes to generate surfaces for formwork
and architectural finishes so that these surfaces can be automatically converted into
intelligent 3D model elements such as walls, floors, and generic models. This
objective aims to add missing geometric information into BIM models to prevent
manual updates and reduce the time spent on the modeling process. It will allow the
integration of 3D models of these elements into clash detection and the 4D
simulation process. For example, automatically generated formwork models, which
are temporary structures in construction, can be utilized in the 4D simulation process
to better visualize the concrete casting works.

6
1.4 Scope of the Study
This thesis study investigates extracting accurate area-based quantities from 3D
models using the Dynamo for Revit as the visual coding platform, and it also focuses
on creating 3D model components automatically in the Revit environment. Only
structural and architectural building elements are considered in this study. Hence,
two frameworks are developed for structural formwork and architectural cladding
materials. Structural foundations, walls, columns, beams, slabs, and stairs are
selected building components for formwork calculations, while the floors, walls,
wall bases, and ceilings are considered for architectural cladding calculations.
Besides, the development of visual codes is explained in detail, and an underground
station building, which is a reinforced concrete structure, is tested with proposed
strategies.
1.4.1 Investigated Building Components and Specific Challenges
In this study, the focal unit of measurement is surface area since its calculation
requires eliminating overlapping regions and correct modeling strategies for accurate
results. Hence, this thesis firstly focuses on the accurate formwork area
quantification of structural elements, including foundations, walls, columns, slabs,
beams, and stairs. Secondly, the thesis investigates architectural components,
including floors and walls since surface area extraction of these elements is
challenging due to their composite structure. As discussed in sections 1.2 and 1.3,
the thesis also focuses on generating 3D models for formwork and cladding
materials.
For example, Figure 1.2 shows the typical challenges in formwork quantification.
Accordingly, intersection areas between beams, walls, and columns are problematic
in BIM-based formwork calculations. Besides, overlaps between different building
components result in inaccurate results. Figure 1.3, on the other hand, illustrates the

7
sources of erroneous material QT for floor and wall claddings. The main reason is
the overlaps among different elements, as Khosakitchalert et al. (2019a) emphasized.
Figure 1.2. Typical formwork quantification challenges
Figure 1.3. (a) Composite floor and (b) wall elements overlapping with other
building components Khosakitchalert et al. (2019a)
1.4.2 Case Study Model
This study investigates an underground station structure in Turkey. Figure 1.4
represents the 3D model views of the main station building. The station is
constructed as a reinforced concrete structure encapsulated with walls having 1500
mm thickness all around and supported by an 1800 mm thick mat foundation. The
building is formed by two different blocks separated by a 50 mm expansion joint
from the foundation top of the structure. The building has three-occupancy floors

8
with three entry-exit structures, including both regular stairs and escalators. The
entry-exit structures are also separated from the main building by a 50 mm expansion
joint.
Figure 1.4. Revit model view for the case study
1.4.3 BIM Tools Utilized in the Study
There are many BIM tools in the construction industry. The focal BIM software
utilized in this thesis is Autodesk Revit 2021, which is a suite of BIM software most
commonly used in the industry by different disciplines. As a BIM software, Revit is
a 3D modeling tool for engineers and architects. It mainly serves for visualization,
coordination, quantity take-off, design analysis, and shop drawing production.
Besides, there is a dynamic link between 3D views, plans, sections, elevations,
details, drawings sheets, and schedules in the Revit environment. Hence, changes in
one view, such as 3D views, also simultaneously update the other associated views.
The visual programing tool used in this study is Dynamo 2.6.1, which is already
ready in Revit software. Dynamo is described by Dynamo Primer as;

9
"A visual programing tool that aims to be accessible to both non-programers
and programers alike. It gives users the ability to visually script behavior,
defines custom pieces of logic, and script using various textual programing
languages."
Figure 1.5 illustrates the differences between visual and textual programing for a
simple code creating a circle. Accordingly, visual programing is easy to grasp by
architects and engineers who do not have programing experience but also need
programing from time to time. Figure 1.6 demonstrates a generic sample visual code
to filter parapet walls in Autodesk Revit models using the "Top Constraint"
parameter. Dynamo gets all wall elements in the model and checks their "Top
Constraint" parameter, and if it is "unconnected" as marked with purple, Dynamo
filters them in the "in" output of the last node as marked with red. The user also can
preview the output results both in Dynamo and Revit environment simultaneously.
Figure 1.5. Differences between visual and textual programing
(https://primer.dynamobim.org/)

10
Figure 1.6. Sample Dynamo workflow and its key points
The chapters in this study are organized as below:
✓ Chapter 1 introduces the problems in BIM-based QTO processes, research
questions, objectives, and scope of the thesis. It also provides information
regarding the evaluated building components, case study model, and BIM
tools utilized throughout the study.
✓ Chapter 2 presents the literature studies on BIM, advantages, and limitations
of BIM-based QTO, visual programing, formwork, and architectural finish
quantification, and identifies the research gap in the previous studies.
✓ Chapter 3 explains the methodology using frameworks for achieving
accurate BIM-based QTO and generating 3D model components.
✓ Chapter 4 presents the case study application of proposed methodologies.
✓ Chapter 5 discusses the results obtained from proposed strategies and real
case data.
✓ Chapter 6 summarizes the main research findings, discusses the limitations
of the thesis study, and provides new directions for future studies.

11
CHAPTER 2
2 LITERATURE REVIEW
2.1 Building Information Modeling (BIM)
BIM is a multidimensional, historically evolving, and complex phenomenon
representing a building digitally in an object-oriented three-dimensional
environment or being a repository of project data to enable information exchange
and interoperability using advanced software tools (Miettinen & Paavola, 2014).
In a more concrete way, the National BIM Standard defines BIM as “a digital
representation of physical and functional characteristics of a facility. A BIM is a
shared knowledge resource for information about a facility forming a reliable basis
for decisions during its life-cycle; defined as existing from earliest conception to
demolition.” NBIMS also states that “a basic premise of BIM is a collaboration by
different stakeholders at different phases of the life cycle of a facility to insert,
extract, update or modify information in the BIM to support and reflect the roles of
that stakeholder.”
Azhar (2011) enounced that the construction industry can benefit from BIM since it
provides detailed information for geometry characterization, spatial relationship,
geographic data, quantity take-off, cost estimation, material inventory, and project
scheduling. He also added that BIM is beneficial for faster and more effective
processes, better designs, controlled whole-life costs and environmental and life-
cycle data, better production quality, automated assemblies, and better client service.
12
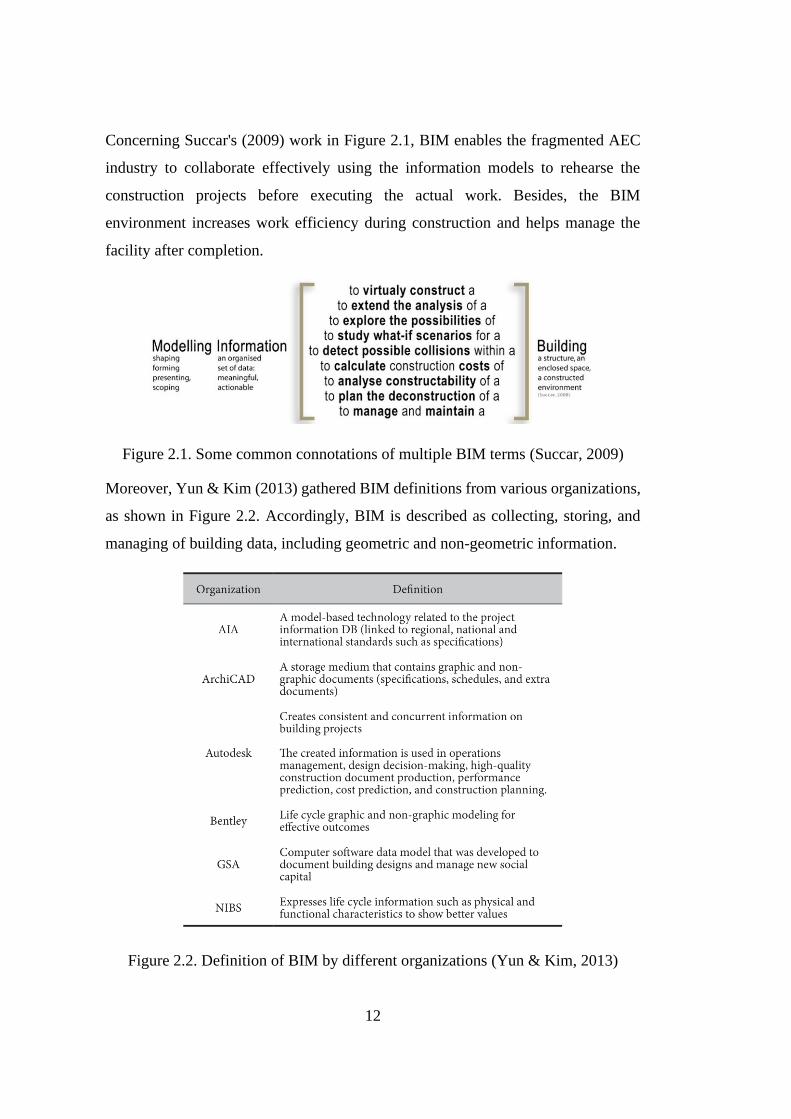
Concerning Succar's (2009) work in Figure 2.1, BIM enables the fragmented AEC
industry to collaborate effectively using the information models to rehearse the
construction projects before executing the actual work. Besides, the BIM
environment increases work efficiency during construction and helps manage the
facility after completion.
Figure 2.1. Some common connotations of multiple BIM terms (Succar, 2009)
Moreover, Yun & Kim (2013) gathered BIM definitions from various organizations,
as shown in Figure 2.2. Accordingly, BIM is described as collecting, storing, and
managing of building data, including geometric and non-geometric information.
Figure 2.2. Definition of BIM by different organizations (Yun & Kim, 2013)

13
Furthermore, Penttilä (2006) stated that BIM is a way to operate the building design,
construction, and maintenance in a computer environment during the whole life cycle
of buildings. He also added that computer-aided design (CAD) methods are primary
tools to prepare geometric and non-geometric data, and there are various approaches
to improve a software-independent format to facilitate information flow among AEC
parties, and it is IFC (Industry Foundation Classes) within the context of this study.
IFC developed by buildingSMART is a neutral and open format to share and
exchange construction information in the building industry (Bonduel et al., 2018).
Pauwels & Terkaj (2016) stated that the IFC standard is a conceptual schema and a
data exchange format for the AEC industry since it facilitates BIM data sharing
among various BIM tools to elevate the functionality of computer-aided design
(CAD) for structural analysis, 4D planning, and 5D cost calculation.
Even though there are many aspects to conduct detailed research about BIM, this
research aims to enhance the quantity take-off (QTO) and automated 3D modeling
features in BIM using visual programing tools.
2.2 BIM-Based Quantity Take-Off
Ahn et al. (2016) stated that as a rapidly emerging and innovative environment, BIM
enhances the design and management of construction projects by lowering the costs
and schedule variations while contributing to the overall process and quality of the
project. BIM-based project management provides a strong constitution between
scope, time, and cost and enables the automated update of project plans when
changing main or subparts (Peterson et al., 2011). Hence, managing accurate
estimation and actual project planning costs using the BIM approach plays a
prominent role in the successful construction business because cost estimation can
be created easily when construction costs are determined and linked to the
construction elements and scheduling activities (Pučko, 2014).

14
Ghaffarianhoseini et al. (2017) mentioned that economic benefits are one of the
apparent current benefits of BIM. Accordingly, reducing documentation errors,
increasing marketing advantages, and less staff turnover are the short-term benefits
of BIM contributing to the construction economy. Meanwhile, reduced construction
costs and fewer contractual claims are the long-term benefits. They also added that
cost calculations could be obtained from the building model and keep construction
practitioners updated about the cost variations as design changes because BIM helps
to evaluate whether a building with a given size, quality level and desired
requirements are feasible to construct within a given cost and time.
Harrison & Thurnell (2015) conducted a qualitative study in New Zealand, and the
benefits of BIM-based estimation were revealed. Accordingly, enhanced
visualization because of the 3D function of BIM facilitates the decision-making
process because it reduces quantity take-off assumptions and inaccurate drawing
interpretation. Efficient data extraction for early-stage design estimation is also
crucial for the take-off process because it is generally used as a bulk-checking tool
for manual measurements. Furthermore, efficient data extraction for detailed
estimation and producing schedules of quantities are other benefits of BIM, but here
it is also noted that these benefits are valid for certain building items and require
some manual adjustments. Participants are generally agreed that the usage of BIM
and trust for BIM-based QTO is expected to be soaring up in the future owing to
increasing experience and awareness.
Khosakitchalert et al. (2019a) conducted a detailed literature study and grouped
research into four groups for BIM-based QTO. Accordingly, the first group
concentrates on BIM modeling approaches for accurate quantities. For example,
Zima (2017) investigated composite walls and compared single walls and walls with
different material layers. He summed up that a single wall approach is helpful for
quick and rough estimations, but walls modeled with different layers serve better for
detailed material QTO, and accuracy is higher than the former approach. The second
group investigates the cost and QTO calculations in early design stages where 3D
models are not sufficiently detailed yet for material take-off. Rajabi et al. (2015)

15
developed a scenario for quantifying MEP systems for the early design stage based
on the idea that BIM is not just a detailed 3D model. Accordingly, he advocated that
the quantities would be more accurate as the relations and logic became more precise.
Moreover, Lim et al. (2016) examined problems with existing rebar quantification
tools and framed the logical steps for potential algorithms and later rebar
classification for a systematic estimation is developed to prevent omissions and
duplications for integrated project delivery systems. The third group aims to link
BIM-based QTO with standard databases. Zhiliang et al. (2011) proposed an
information model requirement for cost estimation for tendering process in China.
They first categorized the information required for cost calculation into seven parts:
the building products information, the division-items project information, the cost-
items information, the schedule information, the quantity information, the resource
information, and the price information. Later, the IFC standard is utilized to describe
previously defined requirements, and the IFC standard was unable to support desired
information requirements such that they modified the IFC schema to enable direct
integration with the cost estimation standards of China. The fourth group that
Khosakitchalert et al. (2019a) is considered investigates querying information and
material quantities from 3D models. Lin et al. (2013) suggested a novel framework
using IFC schema, Natural Language Processing (NLP), and International
Framework for Dictionaries (IFD) to retrieve data from BIM models and represent
the data in the format of tables, charts, animations. They concluded that this approach
could be implemented for cost management with detailed study to enrich the IFC
content and advanced IFC mapping strategies. Hence, BIM-based QTO is
investigated in terms of querying BIM models, integrating BIM with various
standards, proposing new modeling techniques, and obtaining quantities from
insufficiently detailed 3D models. Recently, visual programing approaches were also
implemented for BIM-based QTO, and they will be discussed in detail in sections
2.5 and 2.6 as the main focus of this thesis is also visual programing for BIM-based
quantification.

16
2.3 Limitations of BIM-Based Quantity Take-Off
Even though BIM has many benefits for the construction industry, some limitations
and problems are emerging due to improper implementation. For example, Sattineni
& Bradford (2011) emphasized that there are different departments for cost
estimation and BIM in construction companies, and consequently, time reduction
and quality increase for cost estimation cannot be achieved. It is because estimation
and BIM departments can work in an uncoordinated process, which in reality should
share the same data and feed each other to benefit from BIM-based QTO and cost
estimation in every step of the projects. Smith (2014) stated that the AEC industry
generally confronts problems in BIM-based QTO because the quality of BIM models
is not trustworthy owing to a lack of understanding of automated QTO among
estimators and limitation of solid knowledge of the QTO process that may give rise
to not realizing CAD and BIM problems when it comes to BIM-based QTO.
Olatunji et al. (2010) stated that specific data, vitally crucial for estimators, may not
be available in 3D information models since models provide material quantities
superficially; hence wastes, joining and lapping allowances, in-line fittings and
accessories, material contexts, treatments, and other indirect inputs may not be
extracted from BIM models. Monteiro & Martins (2012) revealed that composite
building components such as walls and floors are difficult to manage in BIM models.
Although section details represent the original configuration, the 3D model is still
one single element for walls and floors, bringing about the same dimensions for
every layer of the component. Modeling mistakes, limitations in BIM tools, and not
setting up ground modeling rules result in questioning the reliability of BIM-based
material quantification (Bečvarovská & Matějka, 2014).
BIM implementation requires significant time and cost investments by the AEC
industry, such as staff training, software, and hardware updates (Ghaffarianhoseini
et al., 2017). However, companies generally suffer from interoperability issues, non-
user-friendly delivery formats, and lack of skills and experience towards BIM,
thereby low return on investment and not adopting BIM-based QTO.

17
Abanda et al. (2017) stated that there are four main limitations of the current BIM-
based QTO. The first one is the lack of measurement standard, meaning that there
might be inconsistency and quantities may not be compared easily, as a second
reason, and in the case of existence of a measurement standard, the standard might
be based on specific countries where software is developed. Hence, the quantities
might not be helpful for other countries and might require additional workflows.
Another reason is that software having standard measurement catalogs includes
those standards in their installation folders, and it cannot be shared with other tools
when required to acquire information. The last reason is that there is a manual and
time-consuming process to arrange quantities extracted from BIM tools to put the
quantity data into the desired format. Accordingly, managing and manipulating BIM
data for material quantity might be challenging even we have the quantities in 3D
models. According to a study conducted by Harrison & Thurnell (2015) in New
Zealand, the following reasons are the main barriers to achieving BIM-based
material QTO.
✓ Software interoperability issues
✓ Incompatibility with quantity surveying formats and lack of industry
standards and protocols
✓ The necessity of manually reviewing and checking extracted quantities
✓ Lack of government intervention
✓ Lack of context for construction means and methods and training issues
✓ Cultural resistance
✓ Increased client costs
As the previous research reveals, there are many aspects of BIM-based QTO and
cost estimation requiring detailed studies and improvements. However, this study
mainly focuses on problems emerging from modeling approaches, software
limitations, and the organization of BIM data.

18
2.3.1 Importance of Level of Development (LOD) for BIM-based QTO
BIM is a process such that information embedded into models develops during the
life cycle of projects, and the development of the information over time brings about
a new concept named level of development (LOD). BIM Forum (2019) defines the
level of development as “the degree to which the element’s geometry and attached
information have been thought through – the degree to which project team members
may rely on the information when using the model.” The input to an element should
be considered as the level of detail, and the reliable output of an element is to be
understood as the level of development (BIM Forum, 2019). It is essential to
understand both concepts since they are closely related and used interchangeably in
some sources.
There are six different LOD stages in practice and literature: LOD 100, 200, 300,
350, 400, 500, and these stages need to be achieved at different phases of the project.
Figure 2.3 illustrates the development of a wall element from LOD 300 to LOD 350.
LOD 350 model includes the wall studs, actual opening dimensions, which affect the
quantification and coordination processes.
LOD is crucial for BIM applications since models with more details are more
applicable and reliable for quantification, coordination, and scheduling. Song &
Fischer (2020) states that site supervisors cannot take advantage of unimproved
models that are insufficient for daily planning since specific products like brackets
and drywall frames are not present in the model. It is because they cannot quantify
the material needed for a specific job, even they cannot see a complicated assembly
for visualization owing to lack of LOD.
It is evident that preparing a model in high LOD is taking some time, but Leite et al.
(2011) concluded that additional modeling effort increases precision and enables
better decision making in the project life-cycle. For example, modeling architectural
claddings and structural core walls separately may cause small time loss during the

19
design stage, but it is beneficial for the construction stage since take-offs can be
quickly and correctly extracted from models.
Figure 2.3. Differences between LOD 300 and LOD 350 (BIM Forum, 2019)
All project participants should determine LOD in the project life-cycle and create
models to make the quantification process feasible and comfortable (Firat et al.,
2010). LOD needs to be changing to reflect preliminary and detailed cost estimations
during the execution of projects (Sabol, 2008). Hence, models should have enough
LOD for better visualization, job follow-up, and quantification purposes.
Furthermore, model elements should be modeled following the construction
sequence with actual dimensions so that models serve for budgeting and scheduling
activities.

20
2.4 Visual Programing Tools
Visual programing tools have already been adopted in the AEC industry since they
are user-friendly and provide automated processes for construction professionals.
Kensek (2014) performed a case study to enquire the feasibility of integrating
environmental lighting, humidity sensors, and carbon dioxide receptors to BIM using
Dynamo for Revit and Rhino Grasshopper for the benefits of intelligent building
façade systems. Later, Kensek (2015) carried out new case studies to build an energy
simulation package with Dynamo and checked the reaction of the 3D model with
light sensors and simultaneously updated shadings of the building façade according
to solar angles. According to these studies, Dynamo can create a workflow for 3D
models, automatic updates can be achieved using parametric relations, and it
enhances the sustainable design alternatives for building façades.
Collins (2016) utilized Dynamo to create architectural precast concrete fabrication
with five types of parametric properties, including top caps, turn backs, reveals,
notches, and embed locations. With this approach, Collins (2016) coordinated
precast concrete panels with other exterior wall assemblies, generated automatically
updateable shop drawings and tickets, and calculated material quantities like the
volume of concrete and type and number of embeds. Ignatova et al. (2018) stated
that the option "family name" is a built-in parameter in Revit, and there is no standard
Dynamo node to get the embedded parameters, but with the help of Python, a new
custom node is developed to get the required family parameters. It means that
Dynamo provides an open environment to improve BIM’s capacity and useability
further.
Pocobelli et al. (2018) performed a study to analyze humidity in the BIM
environment so that weathering and degradation of heritage building façades can be
introduced to BIM. For this purpose, they created the case study model and placed
moisture measurements in the form of families to specific model points. Later, they
used Dynamo, and imported the required Revit elements, obtained RGB colors, and
merged them with previously created RGB color range to distinguish moisture

21
changes. Bueno et al. (2018) obtained environmental performances of a social
housing model by integrating manufacturer based LCA data in Revit using Dynamo
and MS Excel in the early design stages for the reliable decision-making process and
complex data management for building components.
Likhitruangsilp et al. (2018) developed a system calculating the impacts of change
orders by evaluating the changed conditions of the building, time, and schedule using
Dynamo for Revit and addressed the data acquisition, change detection, schedule
impact analysis, cost impact analysis, and reporting methods. Sadeghi et al. (2019)
presented a study enabling BIM-based workflow to capture and retrieved facility
management information to generate operation and maintenance data according to
the end-user requested format using Dynamo as an add-in for extending parametric
functionality of Autodesk Revit.
Shahsavari et al. (2019) performed a case study for the design uncertainties affecting
building energy performance, and Dynamo for Revit is utilized to extract model
variables for an energy analysis tool that analyzes sensitivity and uncertainty for
decision-making. Yang et al. (2019) utilized Dynamo to handle the complex
geometry and knowledge composing heritage building and performed a mesh-to-
HBIM (Historic-BIM) and HBIM-ontology integration to extend the capacity of
BIM. Yang et al. (2020) later stated that the adoption of Dynamo minimizes human
inclusion in the BIM modeling processes.
Previous studies show that Dynamo is already used for various applications to
automate processes, manipulate BIM data, perform uncertainty analysis, and create
3D geometry to reduce errors. Therefore, Dynamo can be further utilized for cost
estimation and material QTO purposes. Here, it is essential to note that studies
implementing visual programing in BIM-based QTO are to be discussed in sections
2.5 and 2.6.

22
2.5 Formwork Quantification
Formwork, a temporary structure for molding materials, is an indispensable part of
the construction industry since it is inevitably integrated with the design and
construction of concrete structures due to industrialization in the modern era
(Shapira, 1999). However, the construction industry conventionally pays attention to
the design and construction of permanent structures, and temporary structures such
as formwork and scaffolds assisting in building the actual structure are generally
ignored in terms of detailed design, estimation, and construction process (Shapira,
1999).
This trend also continues in the CAD environment because formwork and
scaffolding, as temporary structures, are generally missing from 3D models resulting
in manual involvement for formwork quantification (Liu et al., 2014). This is
because BIM tools, including IFC schemas, do not have a specific tool for formwork
modeling and investigation and generally do not calculate formwork areas correctly
where building elements intersect (Monteiro & Martins, 2013). On the other hand,
formwork models need to be developed on the existing 3D models to increase cost
estimation accuracy for temporary formwork structures; otherwise, the estimation
remains statistical (Cho & Chun, 2015). Thus, various research focused on
improving the BIM-assisted formwork QTO using specific BIM tools and
approaches.
Meadati et al. (2011) proposed a BIM-based repository for teaching purposes by
associating additional information to 3D models to represent design loads through
3D models, alternative design analysis, and constructability analysis automation of
shop drawing productions and material quantity take-off using Autodesk Revit and
Navisworks environment. Kannan & Santhi (2013) created formwork components
in Autodesk Revit, which are simplified families and developed manually, for a high-
rise building to compare the selection and operation of conventional formwork
systems, climbing formwork systems, and automatic and semi-automatic climbing
formwork systems. Jiang & Leicht (2016) proposed an ontology-based strategy to

23
capture and determine the mutual interdependencies between design and
construction process for formwork construction. They systematically structured the
constructability knowledge to enhance and create reusable information and
continuous collaboration among project participants, thereby saving time and effort
in the constructability process of RC structures.
Mansuri et al. (2017) proposed a framework for the management of formwork
systems in terms of reusability, minimizing formwork planning, reducing temporary
storages, lowering the formwork damages, and cutting down the crane lifts and
operation on construction sites by using organized and effective handling of BIM
data developed in Tekla Structures environment. Their study concluded that there is
a time-consuming process of developing formwork models that also affect the
efficiency of their formwork management strategy. Eventually, they suggest the
development of automatic formwork modeling tools.
Lee et al. (2017) developed an object-oriented approach to integrate schedule and
cost estimation using ArchiCAD models to represent productivity with visual
progress in 3D models and generate a productivity best-fit line, which can be utilized
as a baseline for similar projects. Kannan & Santhi (2018) later developed a Revit
add-in, named CONSTaFORM, to assess various concrete systems in terms of
constructability. They classified the constructability attributes for material, labor,
and construction in terms of cost, time, quality, safety, and sustainability.
Eroglu (2019) evaluated formwork quantification features of Autodesk Revit based
on the BIM model, which is previously prepared in Nemetschek Allplan. In this
study, a 3D model of an actual hospital building is also created in Revit, and
formwork quantities are extracted from the model using a free add-in called “Sofistik
BIMtools” since there is no available feature to calculate formwork area directly
from 3D Revit models. Later, the formwork area results from Revit, Allplan and
manual calculations are compared. Accordingly, he concluded that the formwork
area for foundation elements, structural columns, and parapet walls is correctly
calculated from the Revit model, while the wall formwork area cannot be calculated

24
due to the limitations of formwork area tool in Sofistik BIMtools. Similarly, the
formwork area of beams cannot be calculated accurately from the Revit model,
especially when there is a drop slab on the sides of beam elements. Moreover, floor
areas are also extracted inaccurately compared to actual results since the formwork
tool cannot distinguish and evaluate shaft openings. Hence, there are still problems
with formwork quantification due to software limitations and modeling approaches.
Khosakitchalert et al. (2019a) suggested using their visual programing approach
BCEQTI (BIM-based compound element quantity take-off improvement) to
estimate structural concrete volumes and formwork areas using Dynamo for Revit.
After that, Khosakitchalert et al. (2019b) developed a visual algorithm based on their
previous study and calculated structural formwork areas for foundations, walls,
columns, beams, floors, and stairs in an RC building. Their studies calculated the
surface area for columns, walls, foundations, beams, slabs, and stairs for a building
having prismatic structural components.
Lee et al. (2021) developed a formwork design tool, converting meshes into a
geometric form with identical square-shaped meshes to create a 3D vertex set for
automatically calculating quantities and formwork types. Their software
consequently created a formwork layout for walls and deck systems, but it needs to
be tested further for connection and supporting members and validated with actual
formwork quantity based on conventional 2D CAD drawings.
2.6 Architectural Material Quantification
Monteiro & Martins (2013) stated that the surface coatings like finishes, protections
and embellishments requiring a delicate measurement process could either be
modeled for the same material QTO or surfaces of 3D structural elements can be
utilized with a presumed error margin. Accordingly, the first approach increases the
model size significantly, while the second results in a considerable amount of
measurement errors requiring in-depth analysis. Hence, material QTO for

25
architectural components is a significantly crucial process for accuracy and time
management.
Cheung et al. (2012) introduced a knowledge-based tool for early design cost
estimation to assess the changes in building mass and types in Google SketchUp and
simultaneously update the quantities for walls, floors, doors, and windows. Liu et al.
(2016) suggested a construction-oriented QTO framework specifically focusing on
light-frame building construction with an ontology-based semantic approach to
obtain the material quantities not explicitly modeled in Autodesk Revit. Kim et al.
(2019) revealed the quantity discrepancies in interior materials, including masonry,
wood, thermal and moisture protection, insulation, and finishes due to model
representation and unnecessary modeling and provided suggestions for the BIM
modeling process to reduce inconsistencies in material take-offs.
Eroglu (2019) also investigated quantification features of Autodesk Revit for
architectural elements in his study. Accordingly, without human errors, the quantity
results for exterior architectural walls, façade insulation, exterior plastering and
painting, number of windows, doors, and curtain wall areas are calculated accurately
from Revit models. This study shows the importance of modeling quality and
approaches because the quantity results can be obtained accurately when building
elements are correctly modeled, and materials are assigned cautiously.
Khosakitchalert et al. (2019a) developed a visual programing algorithm to extract
surface area information by eliminating modeling mistakes for architectural wall and
floor elements from erroneous models using the Dynamo tool for Revit.
Khosakitchalert et al. (2020a) also suggested a wall framing quantification method
for general and sub-contractors by enhancing the power of the visual programing
tool Dynamo. Khosakitchalert et al. (2020b) later proposed a visual programing
algorithm to automatically separate wall and floor elements into their layers and
convert each layer to an individual model component so that material quantities for
each wall and floor layer can be accurately obtained.

26
2.7 Literature Gap
Even though BIM provides more accurate and faster quantity take-off results,
construction practitioners usually consider BIM unreliable for the QTO process
unless models are developed meticulously. Creating accurate 3D models for material
QTO is time-consuming and requires more work hours and cost investment. Hence,
BIM implementation is generally limited to visualization, coordination, and project
documentation in construction projects. Cost estimation and cost integration with
BIM-based material QTO is left behind compared to other BIM applications in the
construction sector. As referred to in previous sections, there are various research
approaches to improve BIM-based QTO. Recent studies mainly focus on applying
visual programing tools to benefit from 3D models having modeling mistakes and
deficiencies or overcoming software limitations to some extent. Thus, this thesis
aims to improve workflows for accurate QTO in the Autodesk Revit environment
using Dynamo. Structural formwork and architectural claddings, including floor,
wall, and ceiling materials, are investigated within this research scope.
The focus for the formwork elements is to obtain the formwork area of each
structural element in 3D models. While previous studies obtain formwork quantities
in category level, this study obtains the formwork area in element level, which is
more valuable from cost estimation and scheduling viewpoints. Besides, the research
focuses on automatic formwork model creation to facilitate the 3D modeling process.
This approach will enable fast and accurate formwork quantification, and 3D
formwork models can be used in 4D scheduling.
The goal for quantifying cladding elements is to extract accurate QTO for wall, floor,
and ceiling elements in conjunction with creating 3D models for these elements.
Quantities are calculated using the structural 3D model, and room elements are
placed manually and populated automatically with spreadsheet data. The idea is
based on the fact that material names for floors, walls, and ceilings for each building
room are generally tabulated in spreadsheets for building projects. This data may or
may not be extracted from BIM, but it can be integrated with 3D models. This way,

27
structural model geometry can be used for accurate material QTO, and even
materials can be modeled automatically. This approach will be beneficial for projects
where BIM models are erroneous or not detailed enough. The proposed methods are
especially useful for the construction phase requiring detailed and accurate material
quantification for scheduling and budgeting activities.

28

29
CHAPTER 3
3 METHODOLOGY
3.1 Formwork Quantification Framework
Construction projects heavily rely on reinforced concrete (RC), and concrete is a
moldable material that can be cast in any desired shape using formwork structures.
While doing this, the concrete casting is generally executed systematically, requiring
detailed analysis and planning such that foundations are cast first and walls and
columns wait for the foundation's setting. Structural slabs and beams are placed upon
completion of vertical structural elements, and stairs and parapet walls are mainly
constructed after casting the adjacent building components. Hence, this hierarchy is
also considered while developing the proposed method in this study. The formwork
area of a structural category is calculated by intersecting its surfaces with other
structural categories to eliminate surfaces that do not require formwork installation.
For example, beam and slab elements are cast after the construction of structural
walls and columns, and some surfaces of beams and slabs are already formed and
supported by previously installed building elements, and they do not require
formwork. Another example is that beams and floors are poured together for better
integration and design requirements, and in this case, some surfaces of beam or part
of some surfaces may not require formwork due to construction methods (Figure
3.1). Besides, concrete stairs may not be considered in the formwork calculation of
other structural categories since they are cast later and consequently not acting as
natural formwork for different building components considering the construction
sequence.

30
Figure 3.1. Issues in extracting formwork quantities from a BIM model
(Monteiro & Martins, 2013)
Therefore, the below assumptions are made while developing formwork calculation
and modeling framework by pondering possible construction sequence and software
capabilities:
✓ Foundations are cast first, and all sides of the foundation are open, meaning
that excavations around the building are wide enough for formwork
installation.
✓ Walls are cast after foundations, and then columns are cast. In this case, walls
and columns integrated into each other are considered to be poured at
different times to simplify the calculation process and classify wall and
column quantities separately.
✓ Stairs are cast after the completion of all adjacent construction. According to
Figure 3.2, some stair faces intersect with walls, columns and beams, and if
stairs are considered in the calculation of walls, columns and beams, then the
formwork area for those elements will be underestimated. Hence, it is
assumed that stairs are cast later, and area deduction will be made from the
stair formwork area, which is more realistic. It is also important to note that
open side surfaces, bottom surfaces, and vertical side of stair risers need to
be considered in the formwork calculations.
✓ While modeling formwork elements in Revit, the generic models category is
utilized since there is no available category or structure for formwork
modeling in the software.

31
Figure 3.2. A view illustrating stair casting assumptions
The proposed framework aims to calculate formwork areas accurately and create
formwork models for structural foundations, walls, columns, beams, slabs, and
stairs. For this reason, the algorithm eliminates overlapping areas among different
building components, extracts the formwork areas, which is usually not possible due
to software limitations like beam-column intersections and wall opening surfaces.
Furthermore, Dynamo for Revit helps extracting surface area information for tapered
beams, inclined wall surfaces, slanted columns, circular columns with drop panels,
and arched openings, so these are also considered in developing the formwork
framework.
Figure 3.4 illustrates the framework of the algorithm to calculate and model
formwork elements. The framework comprises both manual and automated
processes shown inside dashed box in Figure 3.4. The manual part is to prepare the
BIM model and manipulate the outputs of the automated process. The manual part
includes creating project parameters in the first place and grouping and saving
formwork models in the form of another Revit file after their creation. Moreover,
linking formwork models back to the original model and creating schedules to see
them in the model environment is part of the manual process. Checking formwork

32
panels and removing unnecessary ones due to lack of algorithm capacity are also
considered manual processes. The formwork area, formwork type, and formwork ID
parameters are assigned to generic models categories in the project parameter
creation part (Figure 3.3). The first parameter is used to store surface area
information, and the second one is for storing the type of structural category to which
formwork belongs. The third one is to store element IDs of structural elements to
which formwork belongs.
Figure 3.3. Shared parameter assignment (a), population of shared parameters (b)
and shared parameter text file (c)
Figure 3.3a shows the assignment window for shared parameters. Here parameters
are grouped under text group parameters meaning that they are gathered under the
text part in the properties tab. Figure 3.3b illustrates how shared parameters are
utilized. Accordingly, these parameters are filled automatically. Figure 3.3c
demonstrates how the text file looks like for shared parameters that are continuously
updated automatically once changed. These three parameters can be scheduled,
which is crucial from the QTO standpoint, and tagged when required. Moreover, the
shared parameter file shown in Figure 3.3c can be utilized in different projects
without creating the parameters again.

33
Fig
ure
3.4
. F
orm
work
are
a ca
lcula
tion a
nd m
odel
ing
fra
mew
ork

34
According to Figure 3.4, Dynamo first gets the elements for both formwork
categories, the category that formwork surfaces are to be calculated, and other
categories used to distinguish formwork surfaces. After that, element faces of other
categories are obtained, and simultaneously element surfaces for the formwork
category are also extracted. Element faces of other categories are combined into
polysurfaces, and the surface difference between created polysurfaces and element
surfaces of the formwork category is obtained.
After removing all overlaps and grouping surfaces that do not connect or touch with
other elements for the formwork category, subgrouping of new surfaces is started.
Firstly, all sides and sloped surfaces are separated because these surfaces are
definitely to be formed in the construction process. Secondly, top surfaces are filtered
and checked whether they are required to form. For all surfaces except for door and
window sills, top surfaces are eliminated because they will not be formed in the
construction process. Similarly, bottom surfaces are also filtered, and they are
eliminated for foundations, columns, and walls while reassessing for beams, slabs,
stairs, and wall opening heads like door and window tops. While performing top and
bottom surface classification, formwork categories are controlled in a roundabout
way, and it is shown with red dashed lines in Figure 3.4. After the organization of
surfaces, they are all gathered and considered as formwork requiring surfaces. Later
element IDs and extracted parameters like element names, marks, material types are
duplicated as the number of surfaces for a single element. It is because there are
different numbers of surfaces for each building element requiring formwork
installation. For example, three surfaces need to be formed for a beam while four
surfaces for column and six surfaces for a wall element. Hence, the element IDs and
other parameters should be duplicated three, four, and six times for beam, column,
and wall, respectively. Following this process, parameters and element IDs are
matched with formwork surfaces, and formwork panels are created using the generic
models category in Revit. After panel generation, previously defined parameters like
formwork IDs, area, and type are filled as previously demonstrated in Figure 3.3b.
In the final stage of the formwork process, results are exported into a spreadsheet.

35
3.1.1 Preparation of Visual Code for Formwork
This section introduces the preparation of visual codes in Dynamo using the
proposed framework, and only the Dynamo part shown in Figure 3.4 is to be
discussed here. Figure 3.5 shows how to get formwork elements and other elements
from the 3D Revit model. For other elements, a list is created, and it is later
manipulated, while formwork elements are excluded from that list. The main idea is
to keep the list structure of formwork elements so that element IDs are not lost along
the workflow. This approach helps classifying formwork surfaces efficiently.
Figure 3.5. Dynamo workflow for input variables
Figure 3.6 demonstrates how surface difference operation is performed. Surfaces
coming from formwork elements are connected to surface input, and all other
surfaces and polysurfaces are connected to others input in the Surface.Difference
node. A system error is obtained when running the code, and it will be investigated
in detail in the discussions section. Moreover, after getting surface differences,
additional operations are done like cleaning lists from null elements and exploding
remaining polysurfaces into single surfaces. It is important to note that this whole
operation still keeps the list structure coming from Figure 3.5 for formwork elements.

36
Fig
ure
3.6
. D
yn
amo w
ork
flow
for
elim
inat
ing o
ver
lappin
g a
reas
am
ong b
uil
din
g c
om
ponen
ts

37
Figure 3.8 shows the elimination of top and bottom surfaces using vector operation
tools in Dynamo. Accordingly, a point is generated on the center of each surface
using nodes 1 and 2. After that, these vectors are compared with normal vector in
the z-axis using Vector.IsAlmostEqualTo node and true and false boolean values are
obtained. Later whole surface list is checked according to boolean values, and top
surfaces are eliminated, and all other surfaces are processed further to check bottom
surfaces. While checking bottom surfaces, the only difference is to reverse the z-axis
vector using Vector.Reverse node and filter side and sloped surfaces.
Figure 3.7 illustrates the workflow to create enough formwork IDs for each
formwork surface for classification purposes. Therefore, ID information for each
formwork element is obtained using Element.Id node and the number of formwork
surfaces are counted using List.Count node. After that, element IDs are multiplied
using the number of surface counts using List.Cycle node.
Figure 3.7. Dynamo workflow for generating formwork IDs using element IDs

38
Fig
ure
3.8
. D
yn
amo w
ork
flow
for
elim
inat
ing t
op a
nd b
ott
om
surf
aces

39
Figure 3.9 shows how to create formwork panels using the generic models category.
Here, it is essential to note that panel thickness is considered 20 mm based on
standard plywood dimensions. In this workflow, FamilyInstance.ByGeometry node
from springs package in Dynamo is utilized to convert formwork surfaces into
generic models. With the help of this node, each surface is converted to a family
instance with different names. While naming each panel, the number of surfaces are
counted, and numbers are created from 1 to counter value, and then these numbers
are concatenated with "Formwork" string to create family and type names.
Figure 3.9. Dynamo workflow for generating formwork panels using generic
models
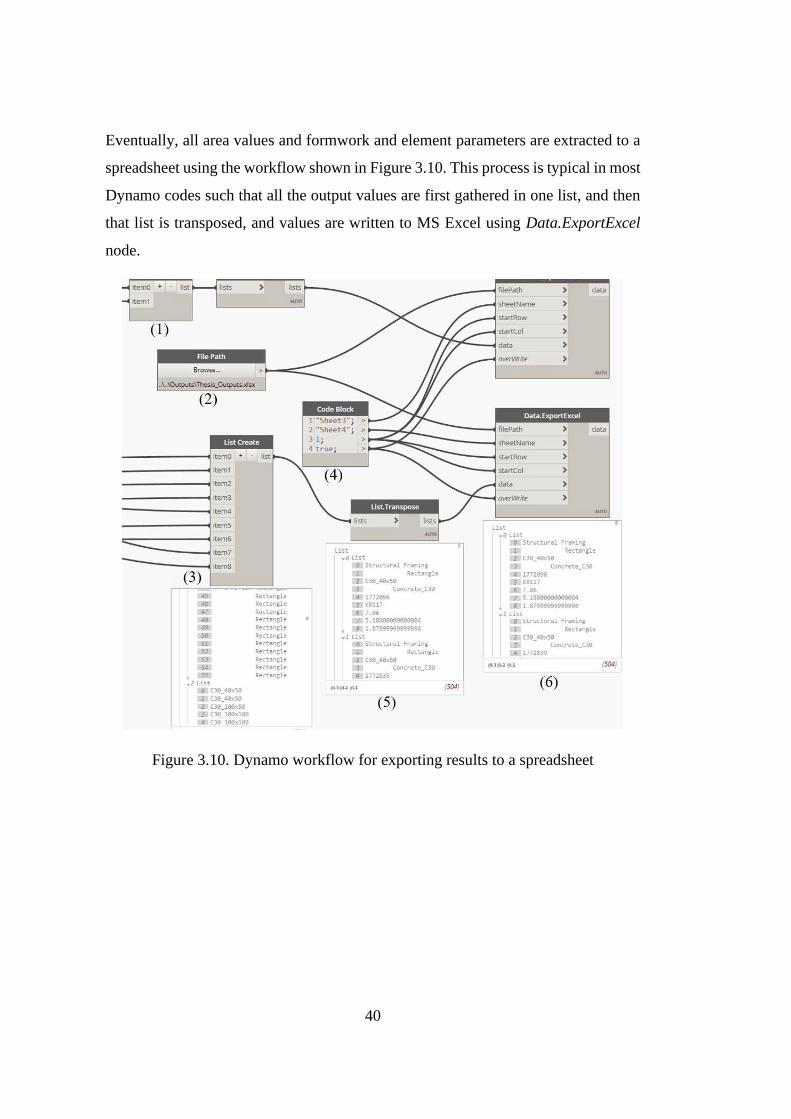
40
Eventually, all area values and formwork and element parameters are extracted to a
spreadsheet using the workflow shown in Figure 3.10. This process is typical in most
Dynamo codes such that all the output values are first gathered in one list, and then
that list is transposed, and values are written to MS Excel using Data.ExportExcel
node.
Figure 3.10. Dynamo workflow for exporting results to a spreadsheet

41
3.2 Cladding Quantification Framework
Contractors are prominent stakeholders in construction projects, and they need to
have detailed and structured data regarding the project in which they are involved.
Mainly, they need to know all materials and quantities to prepare cost calculations
and forecast their future conditions. When BIM is adopted from the beginning of the
project with required building data, the contractors can benefit from information-rich
3D models regarding material quantities and cost estimation. However, as discussed
previously, BIM models may contain limited data, and construction drawings and
schedules may be manipulated in the 2D environment resulting in deviations from
the 3D model and loss of geometric information. Hence, construction practitioners
face situations like building data stored on spreadsheets and models provided by the
design team, but they cannot use them together or check the reliability of quantitative
data. Considering these situations, this part of the study proposes a framework to use
BIM model geometry and spreadsheet information to obtain the quantities of
materials in a building room using the visual programing tool Dynamo.
The following assumptions are made while developing architectural cladding
calculation and modeling framework by pondering possible construction sequence
and software capabilities.
✓ Floors are completed before wall cladding installation.
✓ Ceilings are installed after completion of wall claddings
✓ Revit and Dynamo do not support ceiling model generation, so ceilings are
modeled using the generic models category.
The proposed framework aims to calculate accurate surface area quantities for floor,
wall, and ceiling materials and total length for wall base materials in a building room.
Moreover, the framework also focuses on creating 3D model elements for these
building components automatically. Figure 3.11 shows the overall framework, and
tasks inside the dashed boxes are performed automatically. The manual part is about
organizing and preparing building data, such as placing room elements into the BIM

42
model, creating project parameters for data storage, and sorting and grouping room
information in a spreadsheet accordingly. The automated part transfers room
information between the spreadsheet and Autodesk Revit and extracts the building
geometry to obtain correct surfaces and lines for the floor, wall, wall base, and
ceiling components.
According to Figure 3.11, the process starts with the room placement in the 3D
model, and room data is organized in the spreadsheet based on the Revit room
numbers. Moreover, some project parameters like base material height, ceiling area,
material extension above the ceiling, and room number for doors are also assigned
for the later stages to store the room data. The room number for doors parameter
determines which finish material is required at door sills while passing from one
room to another. The ceiling area parameter is created to store the ceiling area
information. The material extension above the ceiling and base material height
parameters is created to store the wall cladding starting level and wall heights.
The automated process starts with importing room data into Revit and creating the
required wall, floor, and ceiling types. After that, the automated process continues
with getting the building geometry inside Dynamo and filtering room elements.
Room element geometries are then exploded, and room perimeters and top of room
surface are separated. At the same time, door opening widths are filtered and using
them together with room perimeters, base area calculated and modeled.
Room perimeters are then used for the creation of floor elements. For this purpose,
the room boundary is combined into a closed polyline curve, and this curve is
converted into a floor element, and its area is automatically calculated.
Similarly, room perimeters are also utilized for wall element creation. In this case,
wall elements are placed along the room perimeter, and while doing that, rooms are
checked whether they have wall base material affecting the main cladding of wall
surfaces. If so, these base materials are deducted from the overall surface area of
walls, and then wall claddings are modeled.

43
Fig
ure
3.1
1. C
laddin
g a
rea
calc
ula
tio
n a
nd m
od
elin
g f
ram
ework

44
While calculating and modeling wall bases, room perimeters are again utilized, but
in this case, at door locations, the width of the door needs to be deducted. For this
purpose, door bounding boxes are extracted, and they are scaled to larger geometries
at their original coordinates so that doors and room perimeters are intersected with
each other and room perimeters
For ceilings, room solid geometries are exploded into surfaces, and top surfaces are
filtered. These surfaces are later exploded again to obtain the perimeter curves, and
these curves are shifted towards to center of the room by the thickness of wall
cladding, considering the ceiling installation is performed after wall installation.
Then, new surfaces are created using the new curves, and surface area is calculated,
and ceiling models are generated.

45
3.2.1 Preparation of visual code for claddings
This section introduces the preparation of visual codes in Dynamo using the
proposed framework, and only the Dynamo part shown in Figure 3.11 is to be
discussed here. Figure 3.12 shows how room data import starts. Accordingly, a code
block is defined with required parameters, and these parameters are looked up in the
spreadsheet, and their corresponding values are imported into Revit. For example,
Dynamo gets the floor finish material of a room using the "Floor_Finish" parameter.
Figure 3.12. Dynamo workflow for importing room data
Figure 3.13 demonstrates how to organize room data in order to prepare for Revit
import. For data manipulation, List.IndexOf and List.GetItemAtIndex and
List.RemoveItemAtIndex nodes are frequently utilized in almost every location so
that required data can be added, filtered, and removed. Moreover, String.Contains
and List.FilterByBoolMask nodes are utilized to divide lists into two categories by
using true and false boolean values.

46
Figure 3.13. Dynamo workflow to manipulate room data before importing Revit
Figure 3.14 illustrates the last stage of the type generation code. The node
FamilyType.SetCompoundLayerWidth is taken from the clockwork package to
generate different wall and floor types based on room data imported from the
spreadsheet.
Figure 3.14. Dynamo workflow to create different family types for floors and walls
Figure 3.15 shows the process of creating floor claddings using
Floor.ByOutlineTypeAndLevel node. Here room perimeters are obtained, and their
finish boundaries are converted into curves using PolyCurve.ByJoinedCurves node
and these curves are used as the outline curve for the floor element. Simultaneously,
the floor cover and level on which the floor is to be placed are also used as input for
the floor creation.

47
Figure 3.15. Dynamo workflow for creating floor claddings
Figure 3.16 demonstrates how wall claddings are created. Again, room finish
boundaries are utilized, and they have first converted closed curves. Then these
curves are offset by the thickness of cladding material (-a/2 in the code block) so that
the cladding material and structural wall part align with each other. After that, these
curves are again converted into new curves, and they have used a curve input in the
Wall.ByCurveAndHeight node. Wall height, level, and type are also provided as
input for this node to create wall claddings.
Figure 3.16. Dynamo workflow showing the key part of wall cladding creation
Figure 3.17 includes two different code workflows. The one inside the dashed
rectangle is used to create floor cladding at door sills. For this purpose, the bounding
box of door openings is extracted, and the bottom surface of this geometry is
considered as the floor area at door sills.

48
Fig
ure
3.1
7. D
yn
amo w
ork
flow
for
crea
ting f
loor
clad
din
gs
at d
oor
sill
s an
d s
cali
ng d
oors
to e
lim
inat
e ro
om
per
imet
ers

49
The code outside the dashed box in Figure 3.17 is utilized to scale door geometries
so that they can clash with room perimeter boundaries. This way, the width of the
doors is deducted from the room perimeter lengths, and the remaining room
perimeter is used for creating wall bases along the room boundary. The scaling
process is done only in one direction, meaning that the width of the door is not
changed after scaling.
Figure 3.18 demonstrates how to model ceiling elements. Revit and Dynamo do not
support creating ceiling categories in 2021 versions. Hence, similar to formwork
elements, the generic models category is used to model ceiling components and area
information stored in the previously defined ceiling area parameter.
Figure 3.18. Dynamo workflow to create ceiling components as generic models

50

51
CHAPTER 4
4 CASE STUDY
An underground station building is studied within the scope of this study, and the
design model of the structure, which is developed in Revit 2020, is used to test
proposed frameworks for formwork and architectural claddings. The designer
already separated structural and architectural models. According to the thesis
structure, both formwork and architectural cladding tests are to be performed using
the structural model. The architectural design model is used to verify architectural
cladding results. Below is the general information about the structure and the
materials of the building.
✓ Structure type: Underground metro station with entrance structures
✓ Foundation type: Mat foundation
✓ The number of railway platforms: Two platforms
✓ The number of floors: 11 floors (Basement, platform floor, and nine floors)
✓ The number of expansion joints: Four expansion joints
✓ The number of stairs: Eleven concrete stairs with additional escalators
✓ Floor Covering Materials: Ceramic tile, screeds, and leveling concrete
✓ Interior Wall Materials: Aerated concrete walls, paints, and ceramic tile
✓ Exterior Wall Materials: Concrete wall with waterproofing and insulation
✓ Ceiling Materials: Paint, gypsum board, suspended ceilings
Accordingly, this study aims to quantify and model formwork for structural
components and floor covering materials, interior wall materials, and ceiling
materials for architectural components. This study is performed using Autodesk
Revit 2021, so the design model is first upgraded to the new version before testing.

52
4.1 Formwork Quantification and Modeling
4.1.1 Foundation Formworks
In the first step, foundation formwork calculations and modeling are performed. The
foundation type in this case study is mat foundation meaning that it is a continuous
concrete slab extending the gross area of the building.
The visual code is applied to the foundation elements, and it is observed that
formwork calculations and modeling are not taken place at some locations. The
reason is investigated and found that some foundations are modeled with floor
category even though they should be created with foundation category (Figure 4.1).
Since this study considers that every building component placed directly over the
grade is a foundation, a new code is implemented to include floors (modeled as
foundations) into foundation calculations. Therefore, a 3D model is opened, and all
such floors are selected manually. Then, “Foundation” is written in their comment
properties, as shown in Figure 4.1. This way, these floors are filtered in Dynamo,
and they are treated as foundation elements (Figure 4.2).
Figure 4.1. Foundation elements modeled with floor category in Revit

53
The floors are separated using List.FilterByBoolMask node based on their comment
value, and they are combined with actual foundation category in a list node. After
that, the normal process is applied, and the formwork area and modeling process are
performed using the framework shown in Figure 3.4. Figure 4.3 shows the created
formwork panels and populated formwork parameters.
Figure 4.2. Distinguishing floor elements based on their comments property
Figure 4.3. Foundation formwork panels and populated formwork parameters
Furthermore, it is realized that inclined surfaces cannot be eliminated at some
locations because of the lack of code implementation. When the script eliminates top
and bottom surfaces, it checks whether their z-vector is 1 or -1, respectively.
However, inclined surfaces have z-vectors in between the below values.

54
For this reason, code in Figure 4.4 is implemented into the current code workflow,
and inclined surfaces of foundation elements, which again do not require formwork
for both upward and downward direction, are eliminated from the calculation.
According to Figure 4.4, the script checks for the normal vector (z-vector) of each
surface, and if they are different from 1 and -1, they are removed from the calculation
process.
Figure 4.4. Inclined formwork surface elimination
4.1.2 Column Formworks
In the second step, formwork calculation and modeling are done for structural
columns, including circular, rectangular, and square shapes. Even though the
formwork calculation and modeling are correct at most locations, there are some
locations where the beam area cannot be deducted from the column area. For
example, beam and floor areas are correctly deducted from the surface area of the
circular column shown in Figure 4.5. However, one of the beam areas cannot be
reduced from the surface area of the rectangular column on one side in Figure 4.6,
while formwork for the other sides is calculated and modeled accurately. The reason
is investigated, and it is observed that some beam elements are not correctly joining

55
and touching with column elements. Hence, the trim and extend option is used to
extend beam elements to the face of the column. This operation is done for five beam
elements after visually investigating the formwork panels. After the correction, the
code is rerun, and the error is corrected.
Figure 4.5. Circular column formwork panels and populated formwork parameters
Figure 4.6. Rectangular column formwork panels and populated formwork
parameters

56
4.1.3 Wall Formworks
In the third step, the wall formwork calculation and modeling process are performed,
but due to the high number of wall elements (301 wall elements), the calculation
process took around five hours. Even though the process is completed and formwork
models are created, there are some problems. For example, Figure 4.7 shows the
calculation result, and accordingly, most faces of the walls are calculated and
modeled correctly. However, the areas at wall and wall intersections cannot be
deducted while the area between the top slab and the top of the walls is eliminated
correctly. Besides, all side surfaces and top surfaces of wall openings are calculated
and modeled correctly, but only one bottom surface for one opening can be created.
Hence it is decided to review the visual script, and it is realized that the list structure
is mixed up while removing overlapping areas between two wall elements. After
correcting the script by creating another list, as shown in Figure 4.8, the unreduced
areas at wall and wall intersections are calculated and modeled correctly.
Figure 4.7. Wall formwork calculation and modeling results

57
Figure 4.8. Organization of list structures using List.Flatten node
Figure 4.9 shows the correct calculation and modeling for wall and wall joints.
Moreover, an arched surface is demonstrated to reinforce that the visual approach
can manage the challenging wall surfaces.
Figure 4.9. The corrected result of wall formwork modeling

58
4.1.4 Beam Formworks
In the fourth step, beam formwork calculation and modeling are performed, and it is
realized that the problem faced for columns are also experienced in beam formwork
calculation. Therefore, after the first run of the code, the trim and extend command
is applied for beam and column connections to make beam surfaces touch the column
surfaces. Another big problem is experienced that most beam and floor connections
are not calculated and modeled accurately because of a software problem.
Accordingly, Dynamo cannot generate element geometry for four big floor elements
due to their complex model and various openings on the floor surfaces. Another
approach, which will be discussed in section 4.1.5, is utilized to obtain the geometry
of those floor elements, and visual code is rerun after correction. Eventually, beam
formwork calculation and model generation is completed with accurate results, as
visualized in Figure 4.10.
Figure 4.10. Typical beam, column, and floor connections calculated and modeled
correctly

59
4.1.5 Slab Formworks
In the fifth step, slab formwork is calculated, and it is realized that the visual code
neglects four slabs with a total projection area of approximately 4000 m2. The
reasons are investigated, and it is concluded that slabs with complex boundaries and
various openings cannot be imported into Dynamo. Since these four slabs intersect
with many different elements, another approach is used for those floor elements.
Floor elements that cannot be converted into Dynamo geometry are first colorized in
Revit using the workflow shown in Figure 4.11. The highlighted elements are then
filtered in the 3D view, and the workflow shown in Figure 4.12 is applied.
Accordingly, floor elements and their top surfaces are selected manually using Select
Model Element and Select Face nodes. After that, Dynamo automatically gets the
thickness of floor elements and creates a solid extrusion using the selected top face
and floor thickness. In order to locate the created solid geometry precisely at the
exact location with the actual floor element, Geometry.Translate node is used. Here,
the thickness of the floor is divided by two and multiplied by -1. The calculated value
shows how much vertical translation should be done in the z-axis to place the solid
geometry. The solid geometry is exploded into surfaces, and these surfaces are
included formwork calculation process.
Figure 4.11. Visual script part for overriding problematic floor elements

60
Figure 4.12. Visual script part for creating the geometry of problematic floor
elements
Eventually, slab calculations and modeling process are completed, and results are
obtained in Figure 4.13. Slab sides are calculated, the bottom of the slab is formed
according to the boundary of columns and beam, and small floor pieces are even
calculated using the proposed approach.
Figure 4.13. Slab formwork calculation and modeling results

61
4.1.6 Stair Formworks
In the sixth step, stair formwork is calculated and modeled, as shown in Figure 4.14.
The calculation process was straightforward. All top surfaces and surfaces clashing
with other elements are automatically eliminated, and formwork panels are
generated. Detailed investigation of stair formwork results is made in section 5.1.
Figure 4.14. Stair formwork calculation and modeling results

62
4.2 Cladding Quantification and Modeling
According to the case study model, there are 131 rooms in this building, but this
study only investigates seven rooms for calculation convenience. The investigated
room levels, names, and numbers are shown in Table 4.1. These values are extracted
from the original architectural model, and they are all actual design data.
Table 4.1. Investigated building rooms information
Level Name Number
UNDER PLATFORM LEVEL WATER TANK R1
UNDER PLATFORM LEVEL WATER TANK R2
UNDER PLATFORM LEVEL ELECTRICAL ROOM R3
UNDER PLATFORM LEVEL FIRE PUMP ROOM R4
UNDER PLATFORM LEVEL WASTE WATER PUMP ROOM R5
UNDER PLATFORM LEVEL ELECTRICAL ROOM R6
ABOVE PLATFORM LEVEL TECHNICAL ROOM R7
The architectural model for the case study is well-detailed, and quantities extracted
from the model are assumed to be correct. However, creating a detailed architectural
model with LOD to provide accurate QTO is very time consuming and hence such
models are not generated in all projects. Therefore, this study provides a solution for
models with less information and details such that a reinforced concrete model is
considered, and spreadsheet data is utilized to obtain quantities in conjunction with
3D models and generate the 3D models of architectural claddings. Hence, some room
elements are selected, and they are placed into the structural model. Some of the
rooms shown in Table 4.1 have complete architectural walls, which are not available
in the structural model, and structural walls bound some rooms. There should be
some room bounding elements to define room elements in Revit, and due to the
requirement of workflow and framework, room separation lines are drawn manually
for some rooms to define room elements (Figure 4.15). After drawing these lines,
room elements are placed as shown in Figure 4.15. Later, room numbers are
manually written for each room property, and it terminates the manual process.

63
To sum up, the manual process for the architectural quantification and modeling can
be listed as the followings;
✓ Draw room separation lines if necessary
✓ Locate room elements
✓ Provide room number information
The model is now ready for the automated process, and the first thing is to fill room
parameters and then create the required floor, wall, and ceiling types.
Figure 4.15. Room separation lines and some room elements
Room data is also obtained from the original architectural model using the Dynamo
code shown in Figure 4.16. Extracted values are then grouped according to room

64
numbers in MS Excel, and they are imported to newly created room elements in the
structural model (Figure 4.17). Using these parameters, new floor and wall elements
are generated with the required material thickness, and those elements are used for
the 3D modeling process. Figure 4.18a shows all floor types available in the
structural model before running Dynamo code, and Figure 4.18b shows the newly
generated floor types based on room data presented in Figure 4.17.
Figure 4.16. Dynamo code for extracting room data from the design model

65
Figure 4.17. Manual entered and automatically created room data
Figure 4.18. Automatic floor generation results in Revit project browser
(a) previous floor list (b) floor list after Dynamo run

66
4.2.1 Floor Claddings
Floor claddings are calculated and modeled according to the visual code given in
Figure 4.19. All room elements are extracted, and their surface perimeters are
utilized to place floor claddings in the room. Moreover, the code shown in Figure
4.20 is used to calculate and model floors at door sills. For this purpose, the Model-
in-Place command is used to put the mass shape of door elements, and these masses
are utilized for placing floor elements. Eventually, floor claddings are obtained both
inside the room and at door sills (Figure 4.21).
Figure 4.19. Floor cladding calculation and modeling code
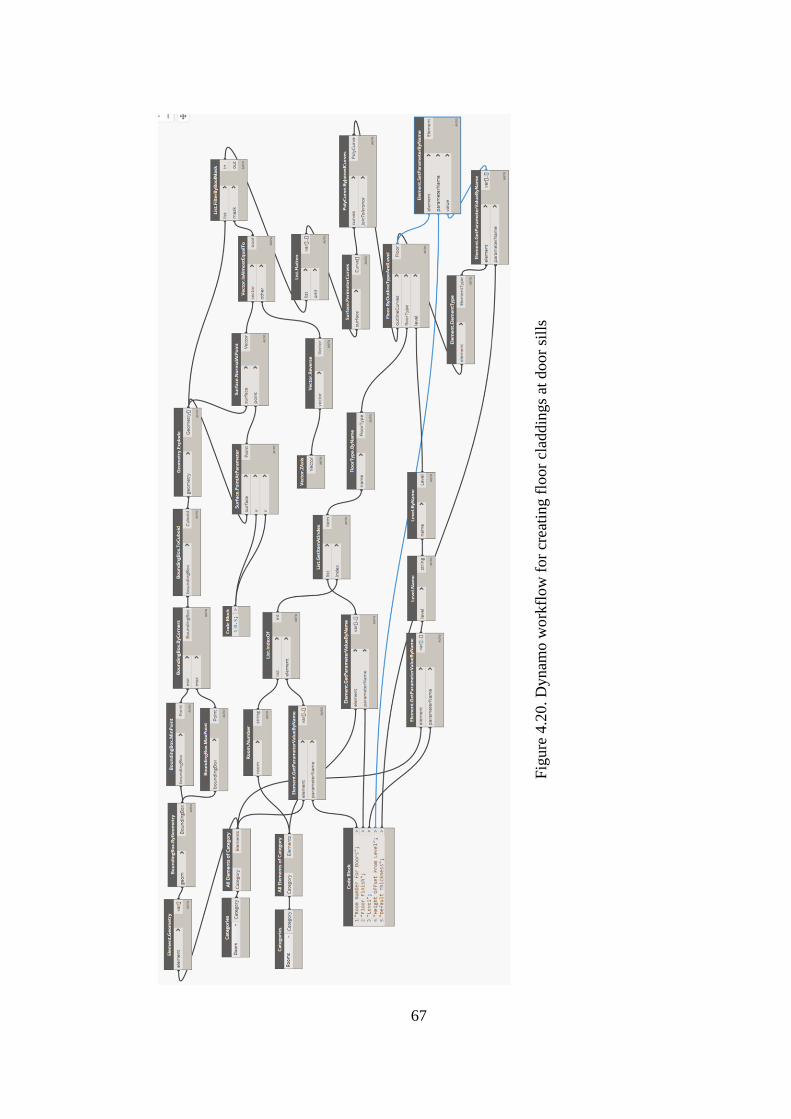
67
Fig
ure
4.2
0. D
yn
amo w
ork
flow
for
crea
ting f
loor
clad
din
gs
at d
oor
sill
s

68
Figure 4.21. Floor cladding calculation and modeling result
4.2.2 Wall Claddings
Wall claddings are calculated and modeled according to the framework provided in
Figure 3.11. The geometry of previously placed room elements is obtained, and their
perimeters are used to located wall claddings. After generating the wall element, its
surface area is automatically calculated by Revit since it is a regular wall element.
Wall claddings are also modeled around the column elements, which is usually a
manually overwhelming task, as shown in Figure 4.22. However, it is observed that
created wall elements cannot be cut with the door and window elements, and the
reason is that these doors and window elements are created using the Model-in-Place
option, so they are not acting as regular Revit families. Hence, wall profiles should
be modified manually to prevent overestimation due to door and window openings.
The framework shown in Figure 3.11 is designed for rooms having suspended
ceilings. Hence, a parameter material extension above the ceiling is added for each
room element. However, some room elements do not have a suspended ceiling, and

69
they have only paint over concrete. In this case, Dynamo gives an error and cannot
calculate wall heights, so “if” node is implemented and if the value of material
extension is 0, then a 0 value is inserted in the calculation. Otherwise, the actual
value of the parameter is utilized (Figure 4.23).
Figure 4.22. Wall cladding calculation and modeling result
Figure 4.23. Overcoming material extension above ceiling parameters with 0 value

70
4.2.3 Wall Base Claddings
Wall base calculation and modeling are done using the room perimeter curves, but
door opening widths are deducted from the total length of the room perimeter. For
this reason, the workflow shown in Figure 3.17 is utilized to manipulate door
geometry. Besides, top and bottom offsets of wall bases are arranged using the floor
cladding thickness since wall bases are located over the floor cover. This way, the
overlap between the base material and floor cladding is prevented. Figure 4.24
presents the wall base results for the fire pump room.
Figure 4.24. Wall base cladding calculation and modeling result

71
4.2.4 Ceiling Claddings
Ceiling calculation is done using the top surfaces of room elements. They are first
exploded into curves, and obtained curves are shifted towards to center of rooms by
the thickness of wall cladding. It is because ceilings are assumed to be constructed
after wall cladding is done. After that, the curves are converted back to surfaces, and
they are converted to generic models. The surface area information is stored under
the ceiling area parameter. Figure 4.25 demonstrates the ceiling calculation and
modeling results. It is shown how ceiling elements are placed after wall cladding to
prevent overlap.
Figure 4.25. Ceiling calculation and modeling result

72

73
CHAPTER 5
5 DISCUSSION OF RESULTS
In this part of the thesis, the quantities obtained using Dynamo are compared with
Revit Schedule/Quantities and Material Takeoff options. The reasons for deviations
are discussed in detail, and the accuracy of BIM-based QTO obtained by following
the developed frameworks using Dynamo for Revit is revealed.
5.1 Results for Formwork Calculations and Modeling
Material QTO is performed for formwork and formwork models are generated for
the case study structure in section 4.1 using the visual programing tool Dynamo for
Revit. Quantity results are compared with Revit Schedule/Quantities and Material
Takeoff options (Figure 5.1a) since actual construction data is not available yet.
Material Take-off option is utilized together with Paint and Split Face options in
Revit (Figure 5.1b). Both options require significant amount of time for arranging
data for take-off process. Revit Schedule/Quantities option requires additional
parameters that can appear in schedules and assigning and formulating these
parameters require time and detailed software knowledge. Material Take-off option
requires spliting correct faces for formwork installation and painting each surface
one by one, which again requires time and attention. Accordingly, formwork
requiring surfaces are carefully separated using Split Face and Paint option is
applied, then material paint is scheduled using Material Takeoff option. Even though
the Revit Schedule/Quantities option is weak in area extraction, various formulations
are applied to get the most accurate results. The results obtained from both options
are compared with Dynamo results in Table 5.1 for foundations, walls, columns,
beams, slabs, and stairs categories, and deviations are calculated. Furthermore, a few

74
individual building components are selected, manual take-off is performed, and
results are compared in Table 5.2.
Figure 5.1. (a) Revit Schedule/Quantities and Material Takeoff options, and (b)
Paint and Split Face options

75
Tab
le 5
.1. F
orm
work
quan
tifi
cati
on r
esult
com
par
ison f
or
indiv
idual
ele
men
ts
Form
work
Cate
gory
Rev
it
Sch
edu
le
Qu
an
tity
(m2)
Rev
it
Pain
t
Mate
ria
l
Qu
an
tity
(m2)
Pro
pose
d
Met
hod
Res
ult
(m
2)
Dev
iati
on
s
Rev
it S
ched
ule
& P
rop
ose
d
Met
hod
(m
2)
Dev
iati
on
s
Rev
it P
ain
t
& P
rop
ose
d
Met
hod
(m
2)
Dev
iati
on
s
Rev
it
Sch
edu
le &
Pro
pose
d
Met
hod
(%
)
Dev
iati
on
s
Rev
it P
ain
t
& P
rop
ose
d
Met
hod
(%
)
Fou
nd
ati
on
1302.7
9
1341.3
6
1332.9
5
30.1
6
-8.4
1
2.2
6
0.6
3
Wall
s 23703.4
7
24038.2
5
23993.2
5
289.7
8
-45
1.2
1
0.1
9
Colu
mn
s 2416.1
6
2416.1
6
2290.6
3
-125.5
3
-125.5
3
5.4
8
5.4
8
Bea
ms
1267.2
4
954.3
5
952.2
2
-773.8
1
-2.1
3
33.0
8
0.2
2
Sla
bs
15757.0
9
12274.7
4
12211.7
4
-3545.3
5
-63
29.0
3
0.5
2
Sta
irs
- 957.5
7
1004.4
3
- 46.8
6
- 4.6
7

76
According to Table 5.1,
i. Deviations between the proposed method and Revit Schedule/Quantities
option is 30.16 m2 while it is 8.41 m2 between the proposed method and
Material Takeoff using paint option for foundation category. Besides, the
mean absolute percentages between the proposed method and Revit
Schedule/Quantities and Material Takeoff options are 2.26 and 0.63,
respectively. As explained in section 4.1.1, some foundation elements are
modeled using the category of the floor, and those floor elements are
calculated considering that they are foundation elements. Similarly, those
floor elements are scheduled differently, and their results obtained from Revit
Schedule/Quantities, and Material Takeoff options are added to foundation
results. However, it is also realized that one floor element is modeled using
the Mass-in-Place option, and area information cannot be extracted using
Revit Schedule/Quantities, which is the main reason for the 30.16 m2 area
difference. 8.42 m2 deviation results from the fact that Dynamo cannot
deduct the surface area of two floor elements intersecting with foundation
elements, as shown in Figure 5.2a. It is also important to note that side
formworks for foundation elements are calculated by implementing a
calculated schedule parameter using default perimeter and foundation
thickness parameters (Figure 5.2b). This implementation has significantly
increased the accuracy of Revit quantities because Revit usually provides the
projection area of the foundation category, which is not vital from the
formwork quantification standpoint.

77
Figure 5.2. (a) Unreduced formwork area between foundations and floors, and (b)
calculated schedule parameter addition in Revit
ii. All formwork surfaces are carefully painted for wall elements and assumed
that the Revit Material Takeoff option results are more accurate and correct
than other options. Revit Schedule/Quantities option provides only vertical
projection area of wall elements. Hence, similar to foundation elements, a
calculated schedule parameter is added by multiplying the default wall area
by two since both sides of the walls are formed. Even though the accuracy is
significantly increased, it is still less than Revit Material Takeoff and
Dynamo results because this approach does not account for wall openings.
On the other hand, Dynamo results are very close to Revit Material Takeoff
options, but there is still an underestimation because Dynamo could not
calculate the base surface of openings, as shown in Figure 5.3. The reason is
that the normal vector for those surfaces is on the positive z-axis, and while
eliminating top surfaces, those surfaces are lost in the calculation process.
Hence, Dynamo code needs to be improved to get more accurate results. In
addition, it is observed that Dynamo can create formwork panels and
calculate formwork areas for irregular shapes. In this case, the most irregular
shape is the connections between the main building and tunnels, creating an
arched wall surface. These surfaces are also calculated, but some could not

78
be created due to the same reason explained previously. The direction of the
normal vectors with z-positive directions cannot be obtained and needs
further study, as shown in Figure 5.4. It verifies that Dynamo can handle
irregular formwork surfaces.
Figure 5.3. Wall opening formwork problem
Figure 5.4. Arched wall surface formwork panels
iii. For column category, results obtained from Dynamo are more accurate
compared to other options. Revit Schedule/Quantities option does not
provide column surface area, and for this reason, some manipulations are
done to at least obtain some results. Firstly, the column family editor is
opened, and the base perimeter parameter is added, and it is connected to
column default dimensions. Since rectangular and circular columns exist in
the case study, different formulations are implemented for circular and
rectangular columns (Figure 5.5). After that, the base perimeter parameter is

79
scheduled, and it is used together with the column default length parameter
to get the side surfaces of structural columns, which is vital for formwork
calculations (Figure 5.6). This approach provides the gross vertical surface
area of columns, but it does not account for beam-column, wall-column, and
floor-column intersections. Moreover, formwork requiring surfaces of
columns are painted, and they are also scheduled using the Material Takeoff
option. It is observed that Material Takeoff and Revit Schedule/Quantities
options provide the same results, and they are not deducting the column
intersections with other elements. On the other hand, Dynamo extracts
column surfaces and eliminates intersection areas, bringing more accuracy.
Figure 5.5. Parameter addition for column base perimeter, (a) for rectangular and
(b) for circular columns

80
Figure 5.6. Calculated schedule parameter addition in Revit for columns using
predefined base perimeter parameter
iv. Revit does not provide formwork area information for the structural framing
(beam) category similar to the column category. Hence, a section perimeter,
beam width, and height parameters are assigned, and these parameters are
used to get the formwork area together with the default cut length parameter
(Figure 5.7). For this purpose, section perimeter is first multiplied with the
cut length of the beam to find the total surface area of beams, then cut length
is multiplied with beam width and deducted from the total surface area not to
include top surfaces of beam elements. Even though this approach provides
good results, beam and floor intersections cannot be reduced, and it causes
overestimation. Hence, the Revit Schedule/Quantities option provides 33.08
percent higher quantities than other methods according to Table 5.1. There is
a 2.13 m2 difference between the Material Takeoff option and the proposed
method. The main reason why Material Takeoff is more accurate is the cut
relationship between structural framing and floor categories. It means that
when painting formwork requiring surfaces of beam elements, intersection
areas between floors and beams are not painted, ensuring accurate results.
Dynamo provided accurate results for beams, such that beam-column, beam-
floor, and beam-wall joints are correctly eliminated, as demonstrated in
Figure 4.10.

81
Figure 5.7. Beam section parameter creation and its use in calculated schedule
parameter
v. There is a considerable difference, which is 29.03 percent, for the Revit
Schedule/Quantities option for floor elements. Hence, reasons for the
deviations are investigated. A calculated schedule parameter for Revit
Schedule/Quantities is added to obtain the side formwork area, similar to
foundation elements. However, it does not account for the intersection of
floor elements with other building components, ending with overestimation.
It is because all perimeter of slabs are multiplied by the thickness of the slab,
so no reduction is made when elements intersect. The results from the
proposed method are accurate and compatible with the Material Takeoff
option, but the generic formwork model cannot be created for the bottom of
two large floors, and the reason cannot be comprehended in detail. It is
observed that these surfaces belong to the floor elements, which created
problems while obtaining their geometry, as explained in section 4.1.5. We
assume that this is a software bug in Dynamo such that Dynamo sometimes
cannot handle complex floor boundaries and too many floor openings.
However, obtaining area information is not affected, and the area of
problematic surfaces is extracted, so that is the reason quantities are accurate.

82
vi. Revit Schedule/Quantities option does not provide formwork area of stairs
and does not enable adding and manipulating parameters. Hence, this part is
empty in Table 5.1. For stair elements, formwork is needed on the bottom,
sides, and vertical faces of risers, so these faces are carefully painted, and the
Material Takeoff option is utilized to extract quantities. In general, the
formwork model created by Dynamo is investigated, and the results are
promising with only 4.67 percent deviations. At some locations, it is
observed that stair landings are modeled using floor elements as shown in
Figure 5.8; therefore, that places are included in slab formwork quantities and
are not reflected in stair formwork QTO.
Figure 5.8. Stair landing modeled with floor element and stair formwork view
5.1.1 Manual Formwork QTO Check for Individual Elements
Formwork areas are grouped according to the structural category in the previous
section. This section compares the results obtained from Dynamo, Revit
Schedule/Quantities, Revit Material Takeoff, and manual calculations for specific
elements to show the verification process at the element level. The below calculation
belongs to column SB106 with element ID of 1766739, also shown in Table 5.2.
Accordingly, all elements connecting to the SB106 column are determined, and all
the intersecting areas are deducted from the total column side area. The deducted

83
building components and automatically generated formwork panels and their
interaction with column SB106 are shown in Figure 5.9.
𝐴𝑆𝐵106 = 𝐴𝑆𝐵106 − 𝐴𝐾𝐵105 − 𝐴𝐾𝐵109 − 𝐴𝐾𝐵104 − 𝐴𝑆𝑙𝑎𝑏
𝐴𝑆𝐵106 = 6.12𝑥(2.50 + 1.00) ∗ 2 − 1.00𝑥1.00 − 0.5𝑥(1.75 + 1.00) − 0.50𝑥1.00
− 0.50𝑥1.00 − 0.5𝑥(2.50 + 0.75) = 37.84 𝑚2
Figure 5.9. Manual QTO example for SB106 column
A similar calculation process is done for sample elements from other categories, and
results are shown in Table 5.2 and Table 5.3. The higher error occurs in the floor and
stair categories since the problematic floor element is selected for the example and
the Dynamo code is not giving accurate results for the selected stair element, and
errors in other categories are acceptably more negligible. For stairs, the error comes
from where stairs and landings meet, and for foundations, the error occurred because
of the floor and foundation joining case shown in Figure 5.2.

84
Tab
le 5
.2. F
orm
work
quan
tifi
cati
on r
esult
com
par
ison f
or
indiv
idu
al e
lem
ents
usi
ng
act
ual
val
ues

85
Tab
le 5
.3. F
orm
work
quan
tifi
cati
on r
esult
com
par
ison f
or
indiv
idual
ele
men
ts u
sing
mea
n a
bso
lute
per
cent
val
ues

86
5.1.2 Evaluation of Building Expansion Joints
The case study structure includes three entrance structures and one main building.
The entrance structures are separated from the main building with a 50 mm
expansion joint. The main building is also divided into two structures by a 50 mm
expansion joint, as shown in Figure 5.10. Generally, both sides of the expansion joint
are not cast simultaneously due to constructability issues. Hence, this brings some
advantages in formwork cost because the previously cast structure acts as formwork
for the adjacent construction. Usually, one side of the expansion joint is cast, and
then after the setting of concrete, an expansion filler material, which will be removed
after both sides are cast, is placed in the expansion joint properly, and the other side
is poured. For the time being, this logic cannot be implemented in visual code, and
both sides of the expansion joint formwork are calculated and modeled.
Figure 5.10. Expansion joints in the building and casting sequence
Table 5.4 shows how much area will be lost when casting concrete, as explained
above. Accordingly, 503.58 m2 formwork area can be saved and should be deducted
from the formwork calculations. Table 5.4 results are obtained using the paint option
in Revit.

87
Table 5.4. Effect of expansion joint over formwork area
Expansion Joint Location Area Loss
(m2)
In between the foundations of main building blocks 23.80
In between the foundations of entrance structures and main building walls 42.80
In between the walls of main building blocks 75.00
In between the walls of main and entrance structures 191.82
In between the columns of main and entrance structures 11.72
In between the floors of main and entrance structures 38.68
In between the floors of main building blocks 119.76
Total 503.58
5.2 Results for Cladding Calculations and Modeling
The proposed framework for architectural claddings is tested with seven rooms in
the case study building. Even though the building data could be in any format such
as pdf or text file, this study considered that all data is stored in MS Excel. According
to the framework and prepared Dynamo codes, rooms are placed in the 3D structural
model, and then room parameters are filled, and new types of floors and walls are
generated automatically per room data. After that, using the room geometry, floor,
wall, wall bases, and ceiling components for each room are created and calculated.
Hence, the building does not have any architectural components initially, and all
architectural things are generated automatically after the placement of room
elements. The findings are listed below, and the results are shown in Table 5.5.
i. Floor claddings are created, and takeoff is extracted perfectly, but for floor
claddings at door sills, an additional door element is located so that the visual
code understands that there is a door at specific locations. Hence, there is a
disadvantage here since manual work is incorporated.
ii. Wall claddings are also generated, and takeoff is done, but wall covers should
be manually edited after their placements for door and window openings. It
is expected that previously located door, and window elements should
automatically cut the newly added wall covers, but it does not work out since

88
door and window elements are created using the model-in-place option. All
bottom and top elevations of wall covers are arranged automatically,
allowing for the placement of wall bases without clashing with other
components.
iii. Wall bases are created with wall elements, but it is observed that wall sweeps
are utilized while modeling wall bases, which is more logical and appropriate
since the software allows and is capable. Like wall elements, all top and
bottom elevations of wall bases are automatically arranged with visual
coding, as shown in Figure 4.24.
iv. Software features (Revit 2021.1) are not allowing to generate ceiling
elements using Dynamo, so the generic model category is utilized to model
ceiling components, as previously shown in Figure 4.25. Area information is
also obtained and stored in the previously defined parameter.
It is confirmed that the framework enables material QTO for architectural claddings
and also helps to generate 3D models automatically. Compared to the previous
studies, this framework facilitates using spreadsheet data and 3D model geometry
effectively because past research focuses only on the data extraction from 3D
information models.
The main differences between the proposed method, Revit, and manual calculation
results shown in Table 5.5 and Table 5.6 come from the shaft openings at floor and
ceiling levels. Besides, there is a big difference between ceiling areas coming from
Revit and Dynamo for the electrical and technical rooms. The ceiling for these rooms
also includes some adjacent rooms, meaning that some portion of the ceiling quantity
belongs to different rooms. There is a modeling mistake and lack of detailing in
ceilings for these rooms. Other slight differences come from the overlaps eliminated
in Dynamo.

89
Tab
le 5
.5. R
oom
cla
ddin
g q
uan
tifi
cati
on c
om
par
ison
usi
ng
act
ual
val
ues

90
Tab
le 5
.6. R
oom
cla
ddin
g q
uan
tifi
cati
on c
om
par
ison
usi
ng
mea
n a
bso
lute
per
cent
val
ues

91
5.2.1 Evaluation of Case Study Model for Architectural Material QTO
Architectural material QTO requires high detail level for accurate results. Even
though the proposed strategy can quantify wall claddings, wall bases, floor
claddings, and ceiling covers, automation in complex architectural projects is
challenging. It is because every project is unique, and there is no limitation behind
architectural imagination and complex detailing, which is a natural and acceptable
situation. Hence, models should be developed in a way that is comfortable to extract
material quantities, and modeling guidelines should be provided, and 3D models
should be information-rich and at the same time manageable. Figure 5.11 shows
some details from the case study model, which is highly detailed and manageable
based on the author’s experience, and the reasons are listed below.
i. Most importantly, the architectural model is created as separate from
structural and mechanical models, making the model manageable and
effective. Figure 5.11a shows a linked view of the structural and architectural
model. Besides, expansion joints, wall bases, wall claddings, wall cores, and
floor claddings are modeled with parametric objects which can be scheduled
and quantified (Figure 5.11b).
ii. Covers on columns are modeled using wall elements, and column bases are
modeled with wall sweeps, which again can be scheduled. This way, cladding
or paint areas for columns can be extracted, and the accuracy of material
quantification is increased (Figure 5.11d).
iii. Figure 5.11c shows railings in the architectural 3D model, and they have
length parameters, which can be scheduled as well. The high accuracy of the
3D model can be proved by column bases in Figure 5.11c, which are not
entirely surrounding the column, but only walkable side of the building.
iv. Figure 5.11b shows wall claddings and wall core modeled separately, making
the material QTO of composite building components like walls and floors
more accurate. Figure 5.11d shows the reinforcing columns for architectural
walls, again demonstrating the high detail level in the 3D models.

92
Fig
ure
5.1
1. A
rchit
ectu
ral
det
ails
fro
m c
ase
study
model

93
Figure 5.12. Unnecessary material claddings above ceiling level
On the other hand, Figure 5.12 demonstrates a sample case resulting in high paint
material quantity results. Accordingly, the design model includes column and wall
paints extending too much above the suspending ceilings. This extension is generally
limited between 100 mm and 200 mm in practice since it is not architecturally
visible. In this case, modeling details should be improved following the architectural
desires and at the same time to achieve cost-efficiency.
5.3 Major Challenges and Evaluation of Visual Programing
Programing and coding play a prominent role in the construction industry. Most of
the time, engineers and architects utilize programing to reduce their time over
repetitive tasks. For example, replacing page numbers or creating new ones with an
order might be time-consuming and easy to handle with programing applications. In
the context of BIM, Dynamo helps manipulating such data, especially for those who
lack knowledge in textual programing. It is because Dynamo has visual code blocks
which are understandable, and input and output logic are apparent. It also allows for
implementing textual codes and creating new custom nodes, which is not
investigated in this study. However, there are some considerable challenges in visual

94
codes prepared in Dynamo. These inferences are based on the difficulties coped
within this study, and they are listed below.
i. List structure in Dynamo can get complex and challenging to manage. For
example, a floor element with too many faces results in many surfaces, and
some surfaces are left as polysurfaces (having two or more surfaces) in the
first geometric explosion (Figure 5.13). In this case, these polysurfaces need
to be divided again, increasing the number of nodes and sublists, which is not
easily manageable.
Figure 5.13. PolySurface problem and increase in sublists for surfaces
ii. As explained in section 4.1.5, some floor elements cannot be converted into
solid geometry because of floor complexity and software bugs as searched
on the internet. Even though the problem is solved by implementing
additional code, this is a random error, making Dynamo unstable for complex
geometries.
iii. In addition to the above item, one surface of the problematic floor elements
cannot be converted to Revit geometry, and the reason cannot be understood.
The surface area can be extracted for this specific surface, but it cannot be
converted to a formwork element.
iv. Even though Dynamo is fast in architectural cladding quantification and
modeling, formwork quantification and modeling takes longer, and Dynamo

95
gets slow while converting surfaces into generic models. Table 5.7 shows the
total times for completing formwork quantification and modeling processes.
Architectural parts are not included since they are significantly less compared
to formwork operations. However, for better evaluation of the performance
of Dynamo, this study should also be done with another visual programing
tool like Rhino Grasshopper and results should be compared. According to
Table 5.7, the number of panels for stairs is high compared to its number, and
the main reason is that Dynamo calculates every riser and side of risers
separately. The highest processing time belongs to wall elements, and it
might get higher if bottom surfaces of wall openings are also calculated.
It is important to note that some floor elements are considered in the foundation
category in section 4.1.1. Therefore, the same thing is applied while preparing Table
5.7. This is why there is an explanation under the number of elements in the
foundation category. Consequently, 13 floor elements are deducted from floor
formwork calculation and added to foundation formwork calculation.
Table 5.7. Dynamo processing times for formwork quantification and modeling
Building
Category Number of Elements
Number
of
Formwork
Panels
Processing Time
Foundation
24
-11 from foundation category
-13 from floor category
178 10 min 01:28 s
Walls 301 1341 240 min 05:36 s
Columns 73 274 43 min 07:20 s
Beams 56 187 32 min 04:15 s
Floors 105 939 110 min 03:31 s
Stairs 11 1784 120 min 08:36 s

96

97
CHAPTER 6
6 CONCLUSIONS
6.1 Summary
Construction projects require detailed QTO results for every component in the
project scope since quantities affect the cost and schedule activities. However, area-
based quantification with BIM for materials like formwork and architectural
claddings still has problems. For this reason, this study focuses on the accurate
quantification of formwork and architectural cladding materials and applies a visual
programing approach to an underground metro station building. There are reliable
results, gains, and learning outcomes in this study. First of all, a detailed literature
review is performed, and various approaches in the past research are discussed in
detail for BIM-based QTO, visual programing, and QTO of formwork and
architectural claddings. Although there are different methods to improve BIM-based
material QTO, this study is structured to enhance visual programing approaches.
Secondly, it is comprehended that Revit QTO features are limited for formwork
quantification since the software does not account for the intersection between
different elements, and quantifying the formwork area of a complex structure takes
time and requires attention. Hence, Dynamo helps extracting area quantities
accurately and creates a 3D geometry that might be useful for other construction
activities like 4D simulation. Thirdly, it is confirmed that architectural quantities can
be extracted with Dynamo, and a 3D model can be generated, and a link can be
maintained between spreadsheet data and Autodesk Revit. However, this part of the
study needs further improvement because of the high detail requirements in
architectural materials. At this point, automation of importing room data, creating
cladding materials, and locating cladding materials in the correct places is achieved.
98
Lastly, this study provides an insight into visual programing, and the steps utilized
in this work can be implemented for other visual programing applications.
6.2 Limitations of the Study
In this study, BIM-based material QTO is investigated using the visual programing
tool Dynamo for Revit. Due to construction sequence, applied methods, and software
tools, there are some limitations of the study, and they can be summarized as the
followings:
✓ The investigated structure is an underground structure, and it is considered
that the excavation is wide enough to build this structure like an ordinary
building. In deep excavations without side slopes, formwork activities
significantly change such that perimeter walls are probably cast with one-
sided formwork, meaning that the formwork area of those walls is cut in half.
Moreover, foundations do not require any side formworks in this case. The
visual script should further be developed for such cases.
✓ While calculating column and beam formwork calculations, beam areas
touching the column faces cannot be deducted from column and beam
formwork calculations in the first code trials. Codes are investigated, and it
is realized that trim and extend command should be applied for the
problematic areas to ensure the beam and column faces are touching each
other. It brings a considerable limitation to the proposed framework. Hence
the visual codes should be further improved such that a tolerance gap should
be provided among different elements. For example, column surfaces should
be evaluated with the elements located 10 mm away from the face of the
columns. This way, beam surfaces not touching the column due to modeling
approaches can also be considered in the estimation process.
✓ Stairs are considered cast after adjacent construction is performed, so if stairs
are cast integrated with other building components, some formwork area is
to be reduced from the adjacent building components.

99
✓ The architectural material QTO is performed using the structural 3D model.
Therefore the architectural calculations and modelings should be studied in
more detail considering the additional conditions such that the existence of
non-structural building elements like partition walls and the orientation of
walls should be taken into account to distinguish material layers on different
walls of a room boundary.
✓ Another limitation for the architectural quantification is the sample size due
to the architectural complexity in the case study. As mentioned in section 4.2,
there are 131 rooms in the case study building, but only seven rooms,
including two water tanks, two electrical, one fire pump, one waste water
pump, and one technical room, are studied within the scope of this study. As
the number of rooms increases, the results might deviate; therefore, more
rooms with different details and complexity should be investigated.
✓ This study is performed with Autodesk Revit 2021.1 and Dynamo 2.6.1.8850
versions, so performing similar studies with older versions may yield
difficulties such that some nodes and features might not be available due to
frequent updates of nodes and packages.
6.3 Recommendations and Future Works
Visual programing tools for the AEC industry are open source and developing
perpetually. Moreover, the ability of BIM tools is also increasing each year and new
releases are solving the problems encountered previously. For this reason, the
following are suggested as recommendations and possible future works.
✓ This study is based on the implementation of Autodesk Revit, and it is a
vendor-dependent software tool and is considered a barrier for open-BIM
applications in the AEC industry. Hence, this study should be implemented
with IFC (Industry Foundation Classes) schema using visual programing
tools Dynamo and Rhino Grasshopper to create a neutral and open

100
framework while still enforcing visual programing approaches, which is
user-friendly and easy to grasp.
✓ These frameworks should be tested with other building types and
infrastructure projects to draw a better conclusion about the benefits of visual
programing tools for BIM-based QTO. It is considered that the building used
in this study is sufficiently complex, especially from the architectural
standpoint, so the proposed method for the architectural part might work
better in more standardized residential buildings, and it should be
investigated in more detail.
✓ Revit can also provide more accurate results if the model is correct and
detailed sufficiently. Thus, the Revit Schedule/Quantities option results can
be further improvedby forcing the boundaries of calculated schedule
parameters in the software. Similarly, accuracy of results obtained from Revit
Material Takeoff can also be further increased by pushing software
boundaries by adding additional parameters to column and beam families.
For example, paint parameters can be added to column and beam families for
formwork quantification, and these adaptive paint dimensions can be
arranged according to the connected beam, column, and wall dimensions.
However, it takes a significant amount of time, and it requires great attention
to prevent mistakes.
✓ For the formwork part, the created formwork models represent the panel
(plywood) part of the formwork systems, and it is known that formwork
systems are more complex and require more detailed models. It is proposed
that a formwork library from the market can be integrated with Dynamo, and
panels can be generated with actual details according to extracted formwork
surfaces that account for all element connections and casting sequences.
✓ For the architectural part of the thesis, more manual work is performed while
placing room elements and organizing spreadsheets. Hence, the automated or
faster ways of doing these tasks should be searched further.

101
✓ Even though process time is not verified in this study, the results show that
Dynamo should be compared with another visual programing tool since the
generation of panels take significant time, and processing surfaces get
complicated, especially for floor elements. The algorithm might need to be
improved as well for reducing processing time.

102

103
REFERENCES
Autodesk Dynamo
https://dynamobim.org/
Autodesk Dynamo Clockwork Package Nodes
https://github.com/andydandy74/ClockworkForDynamo
Autodesk Dynamo Spring Package Nodes
https://github.com/dimven/SpringNodes
Abanda, F. H., Kamsu-Foguem, B., & Tah, J. H. M. (2017). BIM–New rules of
measurement ontology for construction cost estimation. Engineering Science
and Technology, an International Journal, 20(2), 443-459.
Ahn, Y. H., Kwak, Y. H., & Suk, S. J. (2016). Contractors’ transformation strategies
for adopting building information modeling. Journal of management in
engineering, 32(1), 05015005.
Aram, S., Eastman, C., & Sacks, R. (2014, January). A knowledge-based framework
for quantity takeoff and cost estimation in the AEC industry using BIM. In
The 31st International Symposium on Automation and Robotics in
Construction and Mining (p. 1).
Ashcraft, H. W. (2008). Building information modeling: A framework for
collaboration. Constr. Law., 28, 5.
Azhar, S. (2011). Building information modeling (BIM): Trends, benefits, risks, and
challenges for the AEC industry. Leadership and management in engineering,
11(3), 241-252.

104
Azhar, S., Nadeem, A., Mok, J. Y., & Leung, B. H. (2008, August). Building
Information Modeling (BIM): A new paradigm for visual interactive
modeling and simulation for construction projects. In Proc., First
International Conference on Construction in Developing Countries (Vol. 1,
pp. 435-46).
Bečvarovská, R., & Matějka, P. (2014). Comparative analysis of creating traditional
quantity takeoff method and using a BIM tool. In Construction Maeconomics
Conference (pp. 1-4).
BIM Forum. (2019). Level of development (LOD) specification Part I &
commentary.
Bonduel, M., Oraskari, J., Pauwels, P., Vergauwen, M., & Klein, R. (2018). The IFC
to linked building data converter: current status. In 6th linked data in
architecture and construction workshop (Vol. 2159, pp. 34-43).
Bueno, C., Pereira, L. M., & Fabricio, M. M. (2018). Life cycle assessment and
environmental-based choices at the early design stages: an application using
building information modelling. Architectural Engineering and Design
Management, 14(5), 332-346.
Cheung, F. K., Rihan, J., Tah, J., Duce, D., & Kurul, E. (2012). Early stage multi-
level cost estimation for schematic BIM models. Automation in construction,
27, 67-77.
Cho, J., & Chun, J. (2015). Cost estimating methods for RC structures by quantity
takeoff and quantity prediction in the design development stage. Journal of
Asian Architecture and Building Engineering, 14(1), 65-72.
Collins, J. (2016). Incorporating BIM into Architectural Precast Concrete
Fabrication. In ISARC. Proceedings of the International Symposium on
Automation and Robotics in Construction (Vol. 33, p. 1). IAARC
Publications.
105
Eroğlu, E. (2019). Evaluation of the reliability of BIM-based quantity take-off
processes in construction projects (Master's thesis, Middle East Technical
University).
Firat, C. E., Arditi, D., Hämäläinen, J. P., Stenstrand, J., & Kiiras, J. (2010). Quantity
take-off in model-based systems. In 27th CIB W78 Conference, Cairo, Egypt,
November 2010. CIB.
Franco, J., Mahdi, F., & Abaza, H. (2015). Using building information modeling
(BIM) for estimating and scheduling, adoption barriers. Universal Journal of
Management, 3(9), 376-384.
Ghaffarianhoseini, A., Tookey, J., Ghaffarianhoseini, A., Naismith, N., Azhar, S.,
Efimova, O., & Raahemifar, K. (2017). Building Information Modelling
(BIM) uptake: Clear benefits, understanding its implementation, risks and
challenges. Renewable and Sustainable Energy Reviews, 75, 1046-1053.
Harrison, C., & Thurnell, D. (2015). BIM implementation in a New Zealand
consulting quantity surveying practice. International journal of construction
supply chain management, 5(1), 1-15.
Ignatova, E., Zotkin, S., & Zotkina, I. (2018, June). The extraction and processing of
BIM data. In IOP Conference Series: Materials Science and Engineering
(Vol. 365, No. 6, p. 062033). IOP Publishing.
Jiang, L., & Leicht, R. M. (2016). Supporting automated Constructability checking
for formwork construction: An ontology. Journal of Information Technology
in Construction (ITcon), 21(28), 456-478.
Jrade, A., & Alkass, S. (2007). Computer-integrated system for estimating the costs
of building projects. Journal of Architectural Engineering, 13(4), 205-223.
Kannan, M. R., & Santhi, M. H. (2018). Automated constructability rating
framework for concrete formwork systems using building information
modeling. Asian Journal of Civil Engineering, 19(4), 387-413.

106
Kensek, K. M. (2014). Integration of Environmental Sensors with BIM: case studies
using Arduino, Dynamo, and the Revit API.
Kensek, K. M. (2015). Visual programing for building information modeling: energy
and shading analysis case studies. Journal of Green Building, 10(4), 28-43.
Khosakitchalert, C., Yabuki, N., & Fukuda, T. (2019a). Improving the accuracy of
BIM-based quantity takeoff for compound elements. Automation in
Construction, 106, 102891.
Khosakitchalert, C., Yabuki, N., & Fukuda, T. (2019b). Automatic concrete
formwork quantity takeoff using building information modeling. In
Proceedings of the 19th International Conference on Construction
Applications of Virtual Reality (CONVR) (pp. 21-28).
Khosakitchalert, C., Yabuki, N., & Fukuda, T. (2020a). Development of BIM-based
quantity takeoff for light-gauge steel wall framing systems. J. Inf. Technol.
Constr., 25, 522-544.
Khosakitchalert, C., Yabuki, N., & Fukuda, T. (2020b). Automated modification of
compound elements for accurate BIM-based quantity takeoff. Automation in
Construction, 113, 103142.
Kim, S., Chin, S., & Kwon, S. (2019). A discrepancy analysis of BIM-based quantity
take-off for building interior components. Journal of Management in
Engineering, 35(3), 05019001.
Lawrence, M., Pottinger, R., Staub-French, S., & Nepal, M. P. (2014). Creating
flexible mappings between Building Information Models and cost
information. Automation in Construction, 45, 107-118.
Lee, B., Choi, H., Min, B., Ryu, J., & Lee, D. E. (2021). Development of formwork
automation design software for improving construction productivity.
Automation in Construction, 126, 103680.

107
Lee, J., Park, Y. J., Choi, C. H., & Han, C. H. (2017). BIM-assisted labor productivity
measurement method for structural formwork. Automation in Construction,
84, 121-132.
Leite, F., Akcamete, A., Akinci, B., Atasoy, G., & Kiziltas, S. (2011). Analysis of
modeling effort and impact of different levels of detail in building
information models. Automation in construction, 20(5), 601-609.
Likhitruangsilp, V., Handayani, T. N., Ioannou, P. G., & Yabuki, N. (2018). A BIM-
enabled system for evaluating impacts of construction change orders. In
Construction Research Congress 2018 (pp. 622-631).
Lim, C., Hong, W. K., Lee, D., & Kim, S. (2016). Automatic rebar estimation
algorithms for integrated project delivery. Journal of Asian Architecture and
Building Engineering, 15(3), 411-418.
Lin, J., Hu, Z., & Zhang, J. (2013). BIM oriented intelligent data mining and
representation. In Proceedings of the 30th CIB W78 International
Conference, 280-289.
Liu, H., Lu, M., & Al-Hussein, M. (2014). BIM-based integrated framework for
detailed cost estimation and schedule planning of construction projects. In
ISARC. Proceedings of the International Symposium on Automation and
Robotics in Construction (Vol. 31, p. 1). IAARC Publications.
Liu, H., Lu, M., & Al-Hussein, M. (2016). Ontology-based semantic approach for
construction-oriented quantity take-off from BIM models in the light-frame
building industry. Advanced Engineering Informatics, 30(2), 190-207.
Sabol, L. (2008). Challenges in cost estimating with Building Information Modeling.
IFMA world workplace, 1-16.

108
Mansuri, D., Chakraborty, D., Elzarka, H., Deshpande, A., & Gronseth, T. (2017).
Building information modeling enabled cascading formwork management
tool. Automation in Construction, 83, 259-272.
Meadati, P., Irizarry, J., & Aknoukh, A. (2011, April). BIM and concrete formwork
repository. In Proceedings 47th ASC annual international conference,
associated schools of construction, Omaha, US.
Miettinen, R., & Paavola, S. (2014). Beyond the BIM utopia: Approaches to the
development and implementation of building information modeling.
Automation in construction, 43, 84-91.
Monteiro, A., Mêda, P., & Martins, J. P. (2014). Framework for the coordinated
application of two different integrated project delivery platforms.
Automation in Construction, 38, 87-99.
Monteiro, A., & Martins, J. P. (2012). BIM modeling for contractors-improving
model takeoffs. In CIB W078 29th International Conference on Applications
of it in the AEC Industry.
Monteiro, A., & Martins, J. P. (2013). A survey on modeling guidelines for quantity
takeoff-oriented BIM-based design. Automation in construction, 35, 238-
253.
NIBS (National Institute of Building Sciences). (2012). United States national
building information modeling standard: Version 2.
Olatunji, O. A., Sher, W., & Ogunsemi, D. R. (2010, May). The impact of building
information modelling on construction cost estimation. In W055-Special
Track 18th CIB World Building Congress May 2010 Salford, United
Kingdom (p. 193).
Olsen, D., & Taylor, J. M. (2017). Quantity take-off using building information
modeling (BIM), and its limiting factors. Procedia engineering, 196, 1098-
1105.

109
Pauwels, P., & Terkaj, W. (2016). EXPRESS to OWL for construction industry:
Towards a recommendable and usable ifcOWL ontology. Automation in
construction, 63, 100-133.
Penttilä, H. (2006). Describing the changes in architectural information technology
to understand design complexity and free-form architectural expression.
Journal of Information Technology in Construction (ITcon), 11(29), 395-408.
Peterson, F., Hartmann, T., Fruchter, R., & Fischer, M. (2011). Teaching
construction project management with BIM support: Experience and lessons
learned. Automation in Construction, 20(2), 115-125.
Pocobelli, D. P., Boehm, J., Bryan, P., Still, J., & Grau-Bové, J. (2018, May).
Building information models for monitoring and simulation data in heritage
buildings. In International Archives of the Photogrammetry, Remote Sensing
and Spatial Information Sciences-ISPRS Archives (Vol. 42, No. 2, pp. 909-
916).
Pučko, Z., Šuman, N., & Klanšek, U. (2014). Building information modeling based
time and cost planning in construction projects. Organization, technology &
management in construction: An International Journal, 6(1).
Rajabi, M., Bigga, T., & Bartl, M. A. (2015). Optimization of the quantity take-off
(QTO) process for Mechanical, Electrical and plumbing (MEP) trades in
tender estimation phase of the construction projects. In ISARC. Proceedings
of the International Symposium on Automation and Robotics in Construction
(Vol. 32, p. 1). IAARC Publications.
Kannan, M. R., & Santhi, M. H. (2013). Constructability assessment of climbing
formwork systems using building information modeling. Procedia
Engineering, 64, 1129-1138.
Sadeghi, M., Elliott, J. W., Porro, N., & Strong, K. (2019). Developing building
information models (BIM) for building handover, operation and
maintenance. Journal of Facilities Management.

110
Sattineni, A., & Bradford, R. H. (2011). Estimating with BIM: A survey of US
construction companies. Proceedings of the 28th ISARC, Seoul, Korea, 564,
569.
Shahsavari, F., Koosha, R., & Yan, W. (2019). Uncertainty and Sensitivity Analysis
Using Building Information Modeling-(An Energy Analysis Test Case),
Intelligent & Informed, Proceedings of the 24th International Conference of
the Association for Computer-Aided Architectural Design Research in Asia
(CAADRIA) 2019, Volume 1, 615-624.
Shapira, A. (1999). Contemporary trends in formwork standards—a case study.
Journal of Construction Engineering and Management, 125(2), 69-75.
Shen, Z., & Issa, R. R. (2010). Quantitative evaluation of the BIM-assisted
construction detailed cost estimates.
Smith, P. (2014). BIM & the 5D project cost manager. Procedia-Social and
Behavioral Sciences, 119, 475-484.
Song, M. H., & Fischer, M. (2020). Generating a Daily Bill of Materials at Level of
Development 400 Using the Smallest Workface Boundary. Journal of
Construction Engineering and Management, 146(5), 04020035.
Staub-French, S., Fischer, M., Kunz, J., & Paulson, B. (2003). A generic feature-
driven activity-based cost estimation process. Advanced Engineering
Informatics, 17(1), 23-39.
Succar, B. (2009). Building information modelling framework: A research and
delivery foundation for industry stakeholders. Automation in construction,
18(3), 357-375.
Wijayakumar, M., & Jayasena, H. S. (2013, June). Automation of BIM quantity take-
off to suit QS’s requirements. In The Second World Construction Symposium
(pp. 70-80).

111
Yang, X., Koehl, M., & Grussenmeyer, P. (2018, June). Mesh-to-BIM: from
segmented mesh elements to BIM model with limited parameters. In ISPRS
TC II Mid-term Symposium “Towards Photogrammetry 2020 (Vol. 42, pp.
1213-1218). Copernicus Publications.
Yang, X., Lu, Y. C., Murtiyoso, A., Koehl, M., & Grussenmeyer, P. (2019). HBIM
modeling from the surface mesh and its extended capability of knowledge
representation. ISPRS International Journal of Geo-Information, 8(7), 301.
Yun, S., & Kim, S. (2013). Basic research on BIM-based quantity take-off
guidelines. Architectural research, 15(2), 103-109.
Zhiliang, M., Zhenhua, W., Wu, S., & Zhe, L. (2011). Application and extension of
the IFC standard in construction cost estimating for tendering in China.
Automation in Construction, 20(2), 196-204.
Zima, K. (2017). Impact of information included in the BIM on preparation of Bill
of Quantities. Procedia engineering, 208, 203-210.
Copyright © 2022 FDOKUMEN


![109 – [2] Wave Overtopping Quantity](https://static.fdokumen.com/doc/165x107/6333c268e3da70449d01c8d7/109-2-wave-overtopping-quantity.jpg)