Laser Welding and Cladding: The Effects of Defects on ...
206
DOCTORAL THESIS Laser Welding and Cladding: The Effects of Defects on Fatigue Behaviour Md. Minhaj Alam
-
Upload
khangminh22 -
Category
Documents
-
view
0 -
download
0
Transcript of Laser Welding and Cladding: The Effects of Defects on ...

DOCTORA L T H E S I S
Department of Engineering Sciences and MathematicsDivision of Product and Production Development Laser Welding and Cladding:
The Effects of Defects on Fatigue Behaviour
Md. Minhaj Alam
ISSN: 1402-1544 ISBN 978-91-7439-515-0
Luleå University of Technology 2012
Md. M
inhaj Alam
Laser Welding and C
ladding: The E
ffects of Defects on Fatigue B
ehaviour
ISSN: 1402-1544 ISBN 978-91-7439-XXX-X Se i listan och fyll i siffror där kryssen är

Doctoral Thesis
Laser welding and cladding: The effects of defects on fatigue behaviour
Md. Minhaj Alam
Luleå University of Technology Department of Engineering Sciences and Mathematics
Division of Product and Production Development 971 87 Luleå,
Sweden
Luleå, December 2012

Printed by Universitetstryckeriet, Luleå 2012
ISSN: 1402-1544 ISBN 978-91-7439-515-0
Luleå 2012
www.ltu.se

Dream is not that which you see while sleeping, it is something that does not let you sleep

Md. Minhaj Alam Laser Welding & Cladding: Defects and Fatigue i
Abstract
The thesis focuses on weld defects in laser processed materials (for laser welding, laser hybrid arc welding and laser cladding) and their effect on the fatigue life of components. Component properties were studied with particular emphasis on the macro and micro surface geometry, weld defects and clad defects. The influence of these defects on fatigue life was analyzed by; the nominal and effective notch stress method, fatigue life prediction using Linear Elastic Fracture Mechanics (LEFM), fatigue testing, metallurgical analysis, fractography, elastic and elastic-plastic Finite Element Analysis (FEA). A simplified Computational Fluid Dynamics (CFD) analysis was also carried out to better understand the formation of undercuts during the welding process. The main objective is to gain an understanding of the impact of laser weld and clad defects on the fatigue behaviour of components.
In the first two papers, fatigue testing involving the bending of laser hybrid arc welded eccentric fillet joints was carried out. Based on measurements of the weld surface geometry the crack initiation location and the crack propagation path were studied, experimentally and in conjunction with FE stress analysis. The competing criteria of throat depth and stress raising by the weld toe radii and by the surface ripples are explained, showing that the topology of surface ripples can be critical to fatigue behaviour. LEFM analysis was conducted to study the effect of Lack of Fusion (LOF) on fatigue life. Cracking starts and propagates preferentially from the lower toe of the top surface for this eccentric weld, even in cases of LOF.
In the third paper two-dimensional linear elastic FEA was carried out for laser welding of a high strength steel beam. The impact of the geometrical aspects of joint design and of the weld root geometry on the fatigue performance was studied. Critical geometrical aspects were classified and then studied by FE-analysis with respect to their impact on the fatigue behaviour.
In the fourth paper the melt pool flow behaviour during the laser hybrid arc welding process was analyzed by CFD simulation. The melt velocity behind the keyhole was measured from high speed imaging as a starting value for the simulation. It was found that a high speed flow in the thin topmost layer of the melt transferred its momentum to an underlying flow which is faster than the welding speed and this delays the lifting of the depressed melt.
In the fifth and sixth papers FEA of different macro stress fields and of stress raisers produced by defects was studied in laser clad surfaces for four different fatigue load conditions. Defects were categorized into zero-, one- and two-dimensional types. Pores intersecting or just beneath the surface initiated fatigue cracking, accompanied by two circular buckling patterns. For a four-point bending load involving a surface pore on a spherical rod, the critical range of azimuthal angle was identified to be 55º. The performance of as-clad surfaces was found to be governed by the sharpness of surface notches. Planar defects like hot cracks or LOF are most critical if oriented vertically, transverse to the bar axis. A generalized theory was established, showing that the combination of the macro stress field with the defect type, position and orientation, determines whether it is the most critical stress raiser.

ii Laser Welding & Cladding: Defects and Fatigue Md. Minhaj Alam

Md. Minhaj Alam Laser Welding & Cladding: Defects and Fatigue iii
Preface When you start to read this thesis, you start to read my work at the Division of Product and Production Development at Luleå University of Technology since September 2007. But this is not completely true that it is only my work. There were many people involves to my PhD work who really deserve gratitude from me.
First of all, I would like to thank to ALMIGHTY ALLAH for making me capable to live like a normal people, gave me knowledge to work and shows the way of true path.
I would like to give the heartiest thank to my supervisor Professor Alexander Kaplan to appoint me without knowing me before. You also deserve thank for your continuous support and creating new ideas for my work. I believe it would not be possible to finish this thesis within time without your assist even in the mid night or in the early morning by web meeting. When I ran out of ideas, your support was vital. I do not know if you ever doubted my capacity; if so, you hide it well.
Special thanks to Dr. Zuheir Barsoum for his courage and help at the beginning of my PhD when I was struggling to find out the way. Special thanks also go to Prof. Hans Åke Häggblad and Dr. Pär Jonsén for being my co-author and spending lot of time with me by giving valuable advice. I am grateful to Prof. John Powell for his innovative ideas, suggestions and for English proof reading of my all papers. I am also thankful to Dr. Jari Tuominen, Prof. Petri Vuoristo, Dr. Juha Miettinen, Jarmo Poutala, Jonne Näkki, Juha Junkala, Tuomo Peltola for their support. I am sincerely grateful and show my gratitude for the funding provided by VINNOVA – The Swedish Innovation Agency (projects LOST, no. 2006-00563 and HYBRIGHT, no. 2005-02895), by the K&A Wallenberg Foundation (15 kW Fibre Laser, project no. KAW 2007-0119) and by the EU (programme Objective 2, project IndLas, no. 152512 and programme Interreg IV A North, project FATLASE, no. 304-13933-09). Thanks also go to my colleagues at the Division of Product and Production Development at LTU for all their countless support. I would also like to give thanks to Tore Silver and Greger Wiklund for all the helps in the laser lab and with my unlimited questions. Thanks to Peter Norman for his guidance as mentor. I would also like to give thanks to all my Bangladeshi friends in Stockholm and Luleå for their help and support during my entire Sweden life. Most significantly, I am expressing my deep and warmest appreciation to my family, my dear parents, who give me proper guidance, educate me, encourage me for higher studies, and give me the freedom to choose my career with unconditional love. Thank you for helping and thanks for being with me. Also thanks to my younger sister, Manni for her affection. Specially thanks to my mother in law for keeping patience and faith on me. My heartiest love only for my Lajori, my daughter who is the best company at home. Last but not least, I would like to express my deepest gratitude to my beloved wife, Sharna, for her continuous tolerance and unconditional support. This PhD work would not be possible without her encouragement. Md. Minhaj Alam December, 2012

iv Laser Welding & Cladding: Defects and Fatigue Md. Minhaj Alam
Md. Minhaj Alam Laser Welding & Cladding: Defects and Fatigue v
List of research papers The core of the thesis is composed of the following research papers: Paper I Alam M M, Barsoum Z, Jonsén P, Kaplan A F H, Häggblad H Å. The influence of surface geometry and topography on the fatigue cracking behaviour of laser hybrid welded eccentric fillet joints. Appl Surf Sci 2010; 256:1936-45.
Paper II Alam M M, Barsoum Z, Jonsén P, Kaplan A F H, Häggblad H Å. Influence of defects on fatigue crack propagation in laser hybrid welded eccentric fillet joint. Eng Fract Mech 2011; 78:2246-58. Paper III Alam M M, Karlsson J, Kaplan A F H. Generalising fatigue stress analysis of different laser weld geometries. Mater Des 2011; 32:1814-23. Paper IV Alam M M, Kaplan A F H. Analysis of the rapid central melt pool flow in hybrid laser-arc welding, Physics Procedia, 2012 (in press; also presented at the LANE-conference in Erlangen, Germany). Paper V Alam M M, Powell J, Kaplan A F H, Tuominen J, Vuoristo P, Miettinen J, Poutala J, Näkki J, Junkala J, Peltola T. Surface pore initiated fatigue failure in laser clad components, 2012 (submitted). Paper VI Alam M M, Kaplan A F H, Tuominen J, Vuoristo P, Miettinen J, Poutala J, Näkki J, Junkala J, Peltola T, Barsoum Z. Analysis of the stress raising action of flaws in laser clad deposits, Mater Des, 2012 (in press, available online, DOI: 10.1016/j.matdes.2012.10.010).

vi Laser Welding & Cladding: Defects and Fatigue Md. Minhaj Alam
Md. Minhaj Alam Laser Welding & Cladding: Defects and Fatigue vii
Table of contents Abstract ............................................................................................................................ i Preface............................................................................................................................ iii List of research papers .................................................................................................... v INTRODUCTION 1. Organisation of the thesis ........................................................................................... 9 2. Motivation of the research ........................................................................................ 13 3. Methodological approach ......................................................................................... 14
4. Laser materials processing........................................................................................ 15 4.1 Introduction ......................................................................................................... 15 4.2 Laser welding ...................................................................................................... 16 4.3 Hybrid laser welding ........................................................................................... 20 4.4 Laser cladding ..................................................................................................... 23
5. Fatigue cracking........................................................................................................ 28 5.1 Fundamental knowledge of fatigue analysis ....................................................... 29 5.2 Fatigue mechanism.............................................................................................. 30 5.3 Fatigue assessment methods ............................................................................... 31
6. Numerical analysis methods ..................................................................................... 34 6.1 Introduction ......................................................................................................... 34 6.2 Computational Fluid Dynamics by FVM............................................................ 34 6.3 Stress analysis by FEA........................................................................................ 36 6.4 Crack propagation analysis ................................................................................. 37
7. Summary of the research papers ............................................................................... 41 8. General conclusions of the thesis.............................................................................. 47 9. Future outlook........................................................................................................... 48 10. References............................................................................................................... 49 ANNEX A Review Paper i: Fracture and Fatigue of Welds ........................................................... 55 Review Paper ii: Fatigue in Clad Layers ...................................................................... 91 ANNEX B Paper I: Influence of Surface Geometry and Topography.......................................... 113 Paper II: Fatigue Cracking including Lack of Fusion ................................................ 125 Paper III: Stress Analysis of Laser Weld Geometries ................................................ 141 Paper IV: Melt Flow Analysis of Hybrid Welding..................................................... 153 Paper V: Fatigue Failure by a Surface Pore................................................................ 163 Paper VI: Stress Raising in Laser Clad Deposits........................................................ 177

viii Laser Welding & Cladding: Defects and Fatigue Md. Minhaj Alam
Md. Minhaj Alam Introduction 9
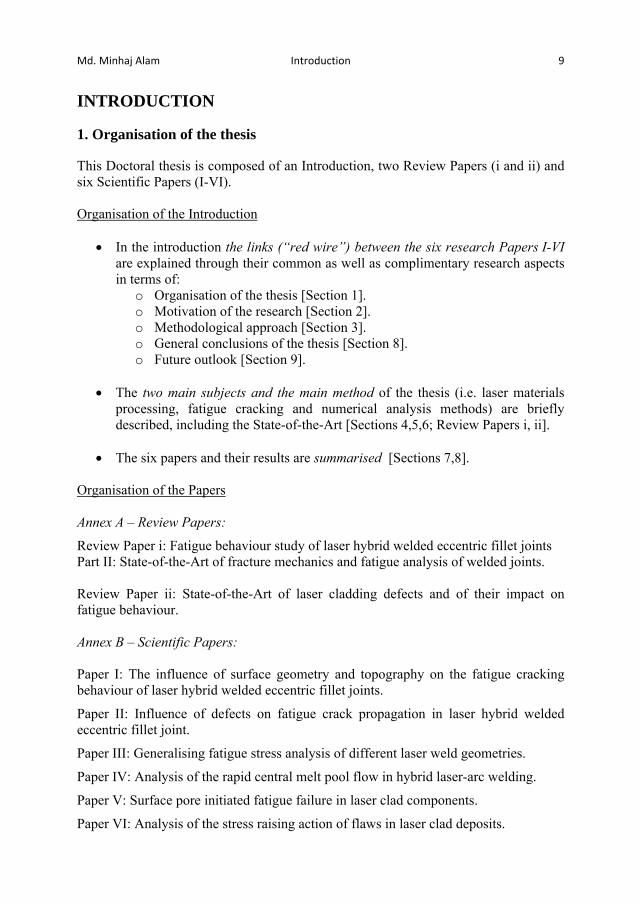
INTRODUCTION 1. Organisation of the thesis This Doctoral thesis is composed of an Introduction, two Review Papers (i and ii) and six Scientific Papers (I-VI). Organisation of the Introduction
In the introduction the links (“red wire”) between the six research Papers I-VI are explained through their common as well as complimentary research aspects in terms of:
o Organisation of the thesis [Section 1]. o Motivation of the research [Section 2]. o Methodological approach [Section 3]. o General conclusions of the thesis [Section 8]. o Future outlook [Section 9].
The two main subjects and the main method of the thesis (i.e. laser materials processing, fatigue cracking and numerical analysis methods) are briefly described, including the State-of-the-Art [Sections 4,5,6; Review Papers i, ii].
The six papers and their results are summarised [Sections 7,8].
Organisation of the Papers Annex A – Review Papers:
Review Paper i: Fatigue behaviour study of laser hybrid welded eccentric fillet joints Part II: State-of-the-Art of fracture mechanics and fatigue analysis of welded joints. Review Paper ii: State-of-the-Art of laser cladding defects and of their impact on fatigue behaviour. Annex B – Scientific Papers: Paper I: The influence of surface geometry and topography on the fatigue cracking behaviour of laser hybrid welded eccentric fillet joints.
Paper II: Influence of defects on fatigue crack propagation in laser hybrid welded eccentric fillet joint.
Paper III: Generalising fatigue stress analysis of different laser weld geometries.
Paper IV: Analysis of the rapid central melt pool flow in hybrid laser-arc welding.
Paper V: Surface pore initiated fatigue failure in laser clad components.
Paper VI: Analysis of the stress raising action of flaws in laser clad deposits.
10 Introduction Md. Minhaj Alam
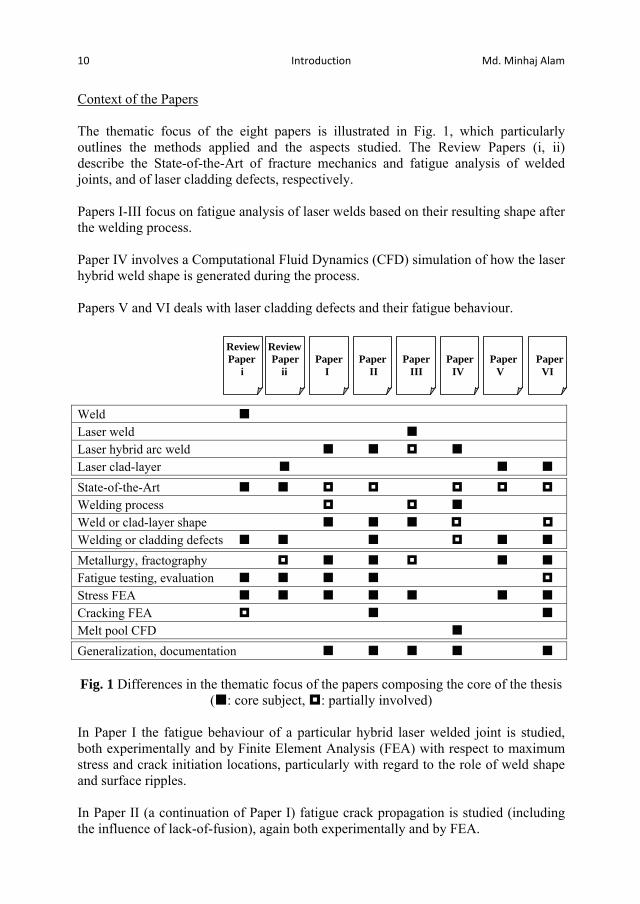
Context of the Papers The thematic focus of the eight papers is illustrated in Fig. 1, which particularly outlines the methods applied and the aspects studied. The Review Papers (i, ii) describe the State-of-the-Art of fracture mechanics and fatigue analysis of welded joints, and of laser cladding defects, respectively. Papers I-III focus on fatigue analysis of laser welds based on their resulting shape after the welding process. Paper IV involves a Computational Fluid Dynamics (CFD) simulation of how the laser hybrid weld shape is generated during the process. Papers V and VI deals with laser cladding defects and their fatigue behaviour.
Weld Laser weld Laser hybrid arc weld Laser clad-layer
State-of-the-Art Welding process Weld or clad-layer shape Welding or cladding defects
Metallurgy, fractography Fatigue testing, evaluation Stress FEA Cracking FEA Melt pool CFD
Generalization, documentation
Fig. 1 Differences in the thematic focus of the papers composing the core of the thesis ( : core subject, : partially involved)
In Paper I the fatigue behaviour of a particular hybrid laser welded joint is studied, both experimentally and by Finite Element Analysis (FEA) with respect to maximum stress and crack initiation locations, particularly with regard to the role of weld shape and surface ripples. In Paper II (a continuation of Paper I) fatigue crack propagation is studied (including the influence of lack-of-fusion), again both experimentally and by FEA.
Paper Review Review Paper Paper Paper Paper Paper Paper Paper Paper
I i ii I II III IV V VI
Md. Minhaj Alam Introduction 11
Paper III presents FEA modelling of stress raisers for different laser welded joints and for a variety of root geometries. In Paper IV, CFD simulation was carried out on the laser hybrid arc welding process in order to understand the undercut formation process and methods to suppress this phenomenon. In Paper V, laser cladding defects and their fatigue behaviour are studied in depth both experimentally and by Finite Element Analysis (FEA) for a specific case and in Paper VI this subject is tackled in a wider, generalising manner. All six papers, but particularly Paper III and Paper VI aim also at generalisation and illustration of the knowledge revealed. The author of the thesis co-ordinated the research and carried out or concluded many of the results by himself. Nonetheless, the research was conducted in close cooperation with the academic and industrial partners of the VINNOVA-projects HYBRIGHT (Papers I,II) and LOST (Paper III), of the EU-Objective 2 project IndLas (Paper IV) and of the EU Interreg Nord IVA project FATLASE (Papers V,VI). In particular, Dr. Zuheir Barsoum (KTH, Sweden) and Dr. Pär Jonsén (LTU) contributed significantly with FEA for Papers I and II. Moreover, Dr. Pär Jonsén and Prof. Hans-Åke Häggblad (LTU) conducted the fatigue testing and were involved in its analysis for Papers I, II. Jan Frostevarg (LTU) carried out the experimental laser welding study in Paper III. Fatigue testing of laser clad components and the analysis of fracture surface was carried out by Dr. Jari Tuominen, Dr. Juha Miettinen and Jonne Näkki (all from Tampere UT, Finland). The above researchers plus the main PhD-supervisor, Prof. Alexander Kaplan, were a close team during the research and provided intense, valuable discussions. The author of the thesis is grateful for this fruitful close cooperation. Additional publications of relevance The eight papers listed so far were produced together with the six conference manuscripts listed below, containing additional findings and more detailed descriptions of the methods applied. They present the results in a more focused rather than interdisciplinary manner for their respective research communities (laser processing, fatigue analysis). M. M. Alam, Z. Barsoum, P. Jonsén, H. Å. Häggblad, A. F. H. Kaplan, The effects of surface topography and lack of fusion on the fatigue strength of laser hybrid welds, in Proceedings of ICALEO 28 Conference, Orlando, Florida, USA (2009) 38-46. M. M. Alam, Z. Barsoum, P. Jonsén, H. Å. Häggblad, A. F. H. Kaplan, Geometrical aspects of the fatigue behaviour of laser hybrid fillet welds, in Proceedings of Fatigue Design Conference, Senlis, Paris, France (2009).
12 Introduction Md. Minhaj Alam
A. F. H. Kaplan, J. Karlsson, M. M. Alam, T. Ilar, Stress analysis of laser weld geometries for light-weight design joints, in Proceedings of the Swedish Conference on Light Weight Optimized Welded Structures (LOST), Borlänge, Sweden (2010). J. Karlsson, C. Markmann C, M. M. Alam, A. F. H. Kaplan, Parameter influence on the laser weld geometry documented by the matrix flow chart, Physics Procedia, 5 (2010) 183-192. (also presented at the LANE conference in Erlangen, Germany) A. F. H. Kaplan, Z. Barsoum, M. M. Alam, P. Jonsén, H. Å. Häggblad, T. Ilar, The impact of weld shape on fatigue cracking of eccentric geometry laser hybrid welds under bending load, Proceedings of IIW Conference, Istanbul, Turkey, IIW (2010). M. M. Alam, Z. Barsoum, P. Jonsén, H. Å. Häggblad, A. F. H. Kaplan, Fatigue behaviour study of laser hybrid welded eccentric fillet joints – Part I, in Proceedings of NOLAMP 12 Conference, Copenhagen, Denmark (2009). Review Paper i of the thesis is also published, in: M. M. Alam, P. Jonsén, A. F. H. Kaplan, Fatigue behaviour study of laser hybrid welded eccentric fillet joints – Part II: State-of-the-art of fracture mechanics and fatigue analysis of welded joints, in Proceedings of NOLAMP 12, Copenhagen, Denmark, FORCE Technology (2009).

Md. Minhaj Alam Introduction 13
2. Motivation of the research Traditional welding processes, e.g. arc welding of various kinds, are well established manufacturing techniques. The mechanical strength of the joints produced is accepted as a result of decades of experience. New welding technologies, e.g. laser or hybrid laser welding, are still struggling to gain acceptance from manufacturers even though research has often demonstrated higher mechanical strength than that of conventional arc welded joints [1]. One important factor in improving the level of application of laser or hybrid laser welding is a fuller appreciation of the fatigue behaviour of the welds produced. Similarly, the adhesive strength of laser clad layers is often much better than for many other coating techniques such as plasma spraying or CMD [2], but confidence in the technique will remain low until the fatigue behaviour of laser clad layers is better understood. Thus, the motivation behind this thesis comes directly from the manufacturing requirement to study the fatigue behaviour of laser welded and cladded components. In particular, closer cooperation between the different research communities dealing with the welding and cladding processes and with the stress analysis of the resulting products was a desired goal. Papers I and II (project HYBRIGHT) aim at better understanding of maximum stress locations and of fatigue crack propagation with regard to the geometrical properties of laser hybrid arc welds, such as joint design, weld shape, roughness and defects. An improved understanding of the load stress field generated by different joint geometries, and particularly by various weld root shapes, for a laser (or hybrid) welded beam was studied in Paper III, as part of the broad lightweight design platform LOST. Understanding of favoured weld shapes is an interface between two processes, namely (i) the generation of the weld shape during manufacturing and (ii) the fatigue cracking process based on the weld shape of the product in load. Therefore, given the geometrical knowledge accumulated in the earlier papers, in Paper IV (project IndLas) the melt flow in the laser hybrid weld pool tail was simulated to better understand the generation of the weld geometry (reinforcement and undercuts). Papers V, VI (project FATLASE) study the fatigue durability of laser clad components for various loads and defects. Beside generating knowledge through case studies, one aim of the thesis is the generalisation of stress analysis information, and its illustration and formulation, in order to transfer it to different applications and techniques, and for creating standards. This was done in Papers III and VI. The overall motivation of the thesis is an improved understanding, confidence and use of laser welding, laser hybrid arc welding and laser cladding.
14 Introduction Md. Minhaj Alam
3. Methodological approach The goal of the thesis is to obtain an improved understanding on the fatigue life of laser-processed components. Although the different techniques of laser welding, laser hybrid arc welding and laser cladding were studied, many aspects of the fatigue behaviour exhibit similarities, particularly when generalising the results. Fatigue cracking can be divided into crack initiation and crack propagation. For the former the identification of locations and levels of maximum stress is of importance and this was done by Finite Element stress analysis. Moreover, from fractography of fatigue tested samples the ratchet lines indicated the crack initiation location. The propagation of the crack was simulated by FEA, assuming a certain tip radius. A survey on the numerical methods used is given in Chapter 6 of the Introduction. The experimental and numerical methods applied are described in more detail in the papers. Fatigue lifetimes were expressed by SN-curves that were obtained from fatigue testing. For analysis of welded samples, the identification of surface shapes and even of their topology was an essential input for the stress analysis. For laser cladding, the location and orientation of different types of defects determined the maximum stress. The load situation was a key criterion analyzed by FEA, including the joint type for welding and the sample shape for cladding. The location and level of maximum stress was explained and illustrated by categorising the competing mechanisms that contribute to stress raisers, which beside the macro stress field can be surface curvatures and notches or defects and their location and orientation. Residual stress and distortion were not central to the present study, but were considered as superimposed mechanisms in the discussions. Various illustrative methods for the explanation, documentation and comparison of the identified aspects, mechanisms and trends were developed, both at a qualitative and quantitative level. Although the study mainly focuses on fatigue behaviour for a certain load situation with reference to the weld or clad shape, along with its defects, due to its important link Paper IV also studied the generation of the weld shape. The weld pool flow was simulated by Computational Fluid Dynamics to study the impact of the liquid movement observed by high speed imaging on the undercut formation. Eventually, from generalization of the findings, particularly by categorisation and illustration, recommendations for product development and production are given to maximise fatigue life. At this general level, many of the results are transferable between welding and cladding.
Md. Minhaj Alam Introduction 15
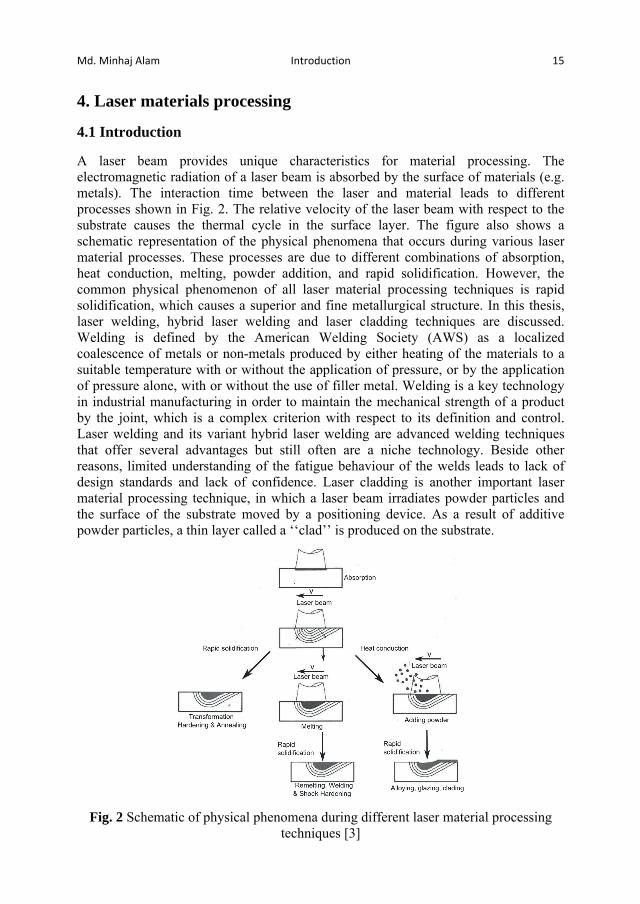
4. Laser materials processing 4.1 Introduction A laser beam provides unique characteristics for material processing. The electromagnetic radiation of a laser beam is absorbed by the surface of materials (e.g. metals). The interaction time between the laser and material leads to different processes shown in Fig. 2. The relative velocity of the laser beam with respect to the substrate causes the thermal cycle in the surface layer. The figure also shows a schematic representation of the physical phenomena that occurs during various laser material processes. These processes are due to different combinations of absorption, heat conduction, melting, powder addition, and rapid solidification. However, the common physical phenomenon of all laser material processing techniques is rapid solidification, which causes a superior and fine metallurgical structure. In this thesis, laser welding, hybrid laser welding and laser cladding techniques are discussed. Welding is defined by the American Welding Society (AWS) as a localized coalescence of metals or non-metals produced by either heating of the materials to a suitable temperature with or without the application of pressure, or by the application of pressure alone, with or without the use of filler metal. Welding is a key technology in industrial manufacturing in order to maintain the mechanical strength of a product by the joint, which is a complex criterion with respect to its definition and control. Laser welding and its variant hybrid laser welding are advanced welding techniques that offer several advantages but still often are a niche technology. Beside other reasons, limited understanding of the fatigue behaviour of the welds leads to lack of design standards and lack of confidence. Laser cladding is another important laser material processing technique, in which a laser beam irradiates powder particles and the surface of the substrate moved by a positioning device. As a result of additive powder particles, a thin layer called a ‘‘clad’’ is produced on the substrate.
Fig. 2 Schematic of physical phenomena during different laser material processing techniques [3]

16 Introduction Md. Minhaj Alam
4.2 Laser welding The theoretical fundamental principles of stimulated emission and the quantum-mechanical fundamental principles of the laser were postulated by A. Einstein and others in the beginning of last century. However, it took more than 40 years until the development of the first (ruby) laser took place in the Hughes Research Laboratories. The following years were characterized by a rapid development of laser technology. Already in 1970, and especially with the availability of high-power lasers in the beginning of the Eighties, CO2- and solid-state lasers were used in material processing. Nowadays, the power of these lasers is often in the range of 5-10 kW (up to 50 kW in some cases) for the CO2 lasers, 0.3-4 kW for Nd: YAG lasers and up to 30 kW for fiber laser. Table 1 provides an overview of the characteristics of some of the commercially available high power cw laser sources. There are many manufacturing methods possible when using a laser beam as an optical energy source (cutting, micromachining, surface treatment, rapid prototyping) but the main focus will be laser welding in this thesis.
Table 1: Comparison (indicative) of high power laser sources
Laser type CO2 Lamp-pumped Nd:YAG
Diode-pumped Nd:YAG
Yb:fibre (multi-mode)
Thin disc Yb:YAG
Lasing medium Gas mixture
Crystalline rod
Crystalline rod Doped fibre Crystalline
disk Wavelength, μm 10.6 1.06 1.06 1.07 1.03 Beam transmission
Mirror, lens Fibre, lens Fibre, lens Fibre, lens Fibre, lens
Typical delivery fibre Ø, micron - 600 400 100-200 150-200
Output powers, kW
Up to 15kW Up to 4kW Up to 6kW Up to
30kW Up to 16kW
Typical beam quality, mm.mrad
3.7 25 12 12 7
Maintenance interval, khrs 2 0.8-1 2-5 100 2-5
Power efficiency, % 5-8 3-5 10-20 20-30 10-20
Approximate cost per kW, k$ 60 130-150 150-180 130-150 130-150
Footprint of laser source large medium medium small medium
Laser mobility low low low high low Laser welding is a widely known technique, sometimes massively used (70% of the welds of the VW Golf VI body-in-white were laser welded, however now becoming less, and 50-75% of large passenger ship structures at Meyer Shipyard, Germany are hybrid laser welded) but often a high performance niche technology. The laser is

Md. Minhaj Alam Introduction 17
focused onto the workpiece creating a concentrated heat source in order to melt and fuse material together [4], see Fig. 3. The main characteristic advantage of laser welding is the capability of distribution of the energy (via the drilled vapour capillary, the so-called keyhole) deep into the material to generate a narrow, deep weld [5, 6]. The energy required for melting the surface is about 106 W/cm2, which is one of the highest among the different welding processes available. Due to excellent focusing capabilities, high power lasers suitable for welding have nowadays reached cw-power densities of the order of 107-108 W/cm2. This high energy concentration produces a weld with a high depth to width ratio with minimal thermal distortion.
Fig. 3 Schematic view from the side of the laser welding process
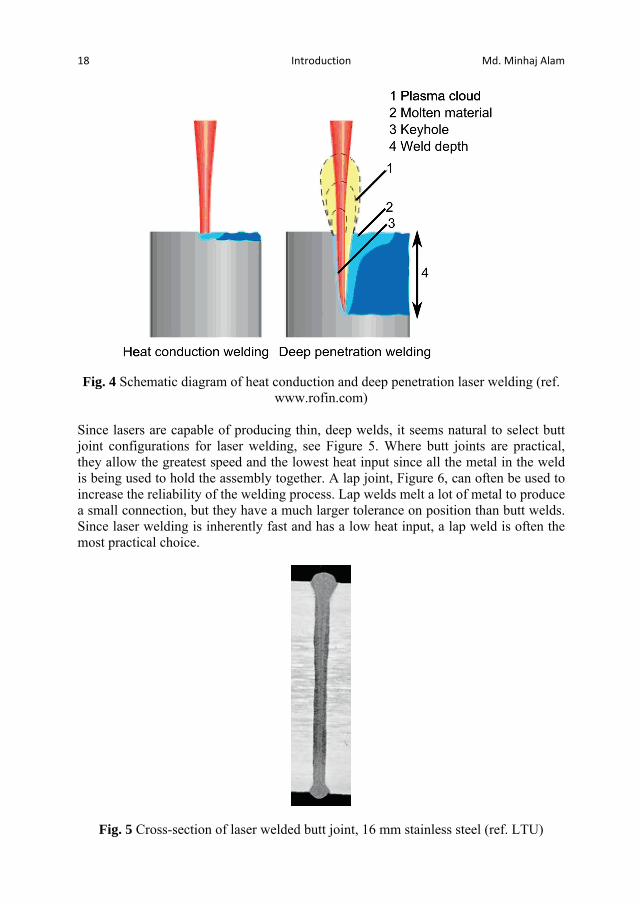
In laser welding we distinguish between two main processes: heat conduction welding and deep penetration welding, see Fig. 4. In heat conduction welding, the materials to be joined are melted by absorption of the laser beam at the material surface from where the heat flows into depth – the solidified melt joins the materials. Welding penetration depths in this context are typically below 2 mm. Deep penetration welding starts at energy densities of approx. 106 W/cm2 where evaporation is reached and a vapour capillary is created inside the material. The resulting vapour pressure inside the material keeps the capillary open, being of similar diameter as the laser beam. The beam is moved through the material by the motion system, following the contour to be welded. The hydrostatic pressure, the surface tension of the melt, and the vapor pressure inside the capillary, particularly the ablation pressure locally generated by the laser beam, reach equilibrium, preventing the keyhole from collapsing. Multiple reflections inside the keyhole guide the incident laser beam deep into the material and enhance its absorption. Today, given sufficient laser power, weld depths of up to 25 mm (steel) can be achieved.
18 Introduction Md. Minhaj Alam
Fig. 4 Schematic diagram of heat conduction and deep penetration laser welding (ref.
www.rofin.com)
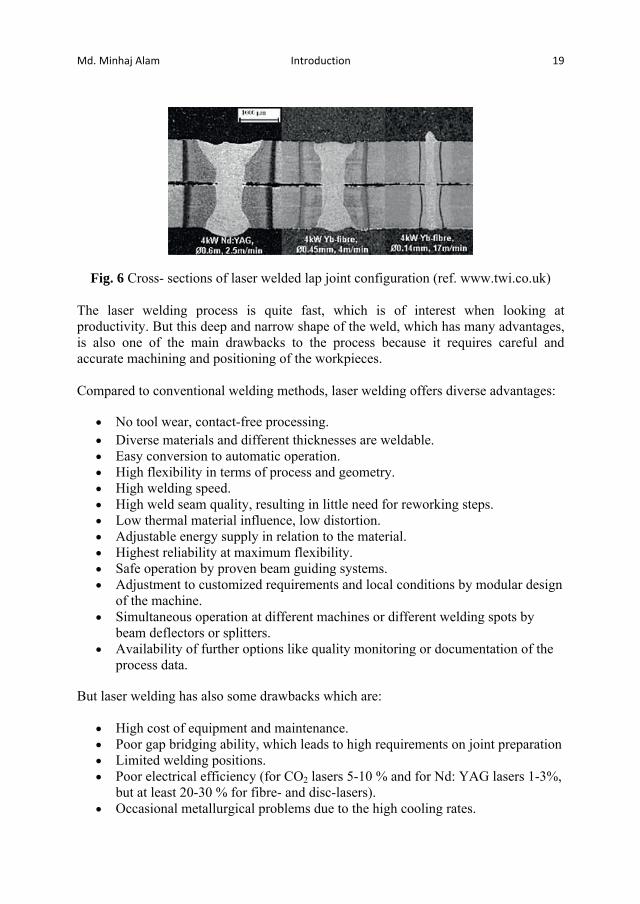
Since lasers are capable of producing thin, deep welds, it seems natural to select butt joint configurations for laser welding, see Figure 5. Where butt joints are practical, they allow the greatest speed and the lowest heat input since all the metal in the weld is being used to hold the assembly together. A lap joint, Figure 6, can often be used to increase the reliability of the welding process. Lap welds melt a lot of metal to produce a small connection, but they have a much larger tolerance on position than butt welds. Since laser welding is inherently fast and has a low heat input, a lap weld is often the most practical choice.
Fig. 5 Cross-section of laser welded butt joint, 16 mm stainless steel (ref. LTU)
Md. Minhaj Alam Introduction 19
Fig. 6 Cross- sections of laser welded lap joint configuration (ref. www.twi.co.uk)
The laser welding process is quite fast, which is of interest when looking at productivity. But this deep and narrow shape of the weld, which has many advantages, is also one of the main drawbacks to the process because it requires careful and accurate machining and positioning of the workpieces.
Compared to conventional welding methods, laser welding offers diverse advantages:
No tool wear, contact-free processing. Diverse materials and different thicknesses are weldable. Easy conversion to automatic operation. High flexibility in terms of process and geometry. High welding speed. High weld seam quality, resulting in little need for reworking steps. Low thermal material influence, low distortion. Adjustable energy supply in relation to the material. Highest reliability at maximum flexibility. Safe operation by proven beam guiding systems. Adjustment to customized requirements and local conditions by modular design
of the machine. Simultaneous operation at different machines or different welding spots by
beam deflectors or splitters. Availability of further options like quality monitoring or documentation of the
process data.
But laser welding has also some drawbacks which are:
High cost of equipment and maintenance. Poor gap bridging ability, which leads to high requirements on joint preparation Limited welding positions. Poor electrical efficiency (for CO2 lasers 5-10 % and for Nd: YAG lasers 1-3%,
but at least 20-30 % for fibre- and disc-lasers). Occasional metallurgical problems due to the high cooling rates.
20 Introduction Md. Minhaj Alam
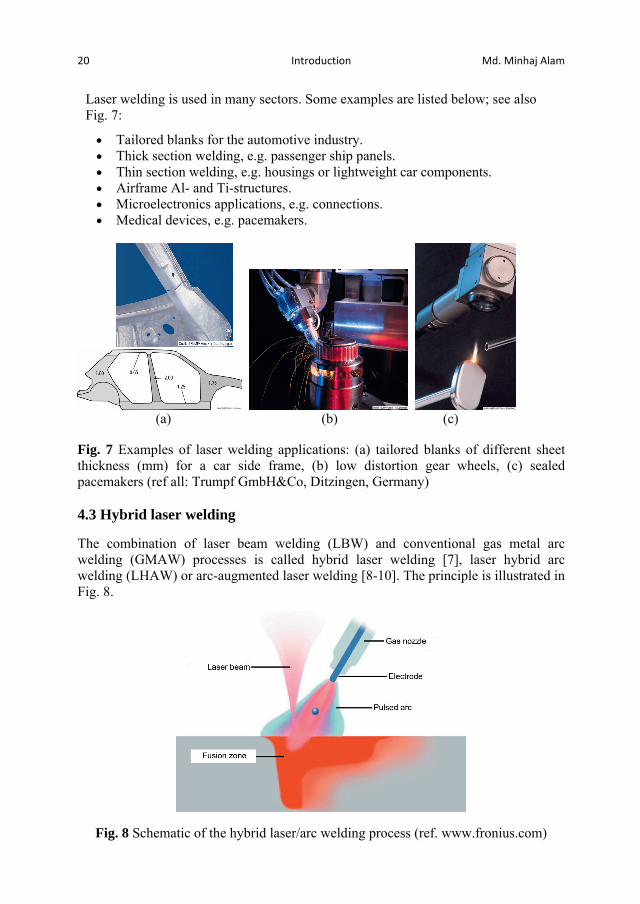
Laser welding is used in many sectors. Some examples are listed below; see also Fig. 7:
Tailored blanks for the automotive industry. Thick section welding, e.g. passenger ship panels. Thin section welding, e.g. housings or lightweight car components. Airframe Al- and Ti-structures. Microelectronics applications, e.g. connections. Medical devices, e.g. pacemakers.
(a) (b) (c) Fig. 7 Examples of laser welding applications: (a) tailored blanks of different sheet thickness (mm) for a car side frame, (b) low distortion gear wheels, (c) sealed pacemakers (ref all: Trumpf GmbH&Co, Ditzingen, Germany) 4.3 Hybrid laser welding The combination of laser beam welding (LBW) and conventional gas metal arc welding (GMAW) processes is called hybrid laser welding [7], laser hybrid arc welding (LHAW) or arc-augmented laser welding [8-10]. The principle is illustrated in Fig. 8.
Fig. 8 Schematic of the hybrid laser/arc welding process (ref. www.fronius.com)
Md. Minhaj Alam Introduction 21
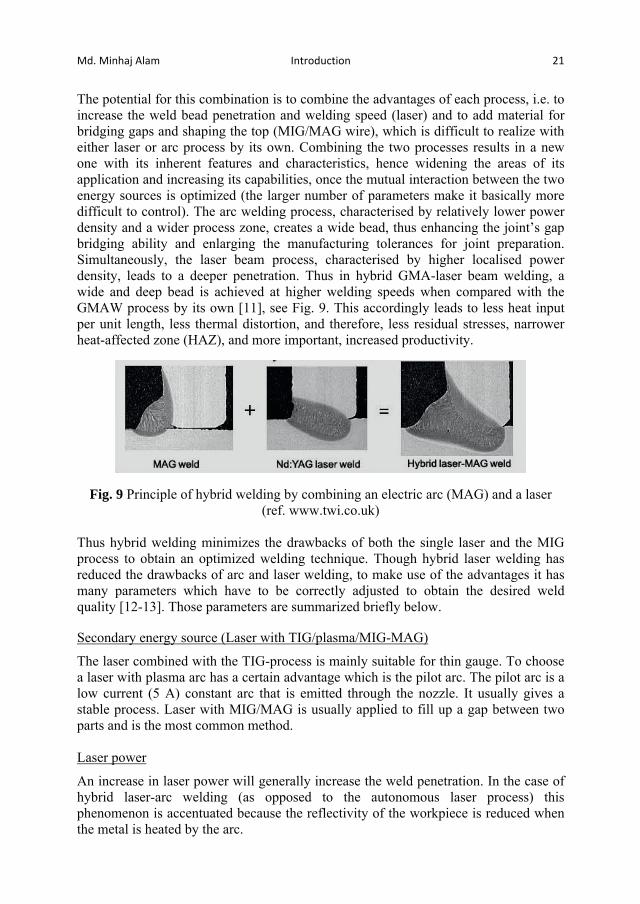
The potential for this combination is to combine the advantages of each process, i.e. to increase the weld bead penetration and welding speed (laser) and to add material for bridging gaps and shaping the top (MIG/MAG wire), which is difficult to realize with either laser or arc process by its own. Combining the two processes results in a new one with its inherent features and characteristics, hence widening the areas of its application and increasing its capabilities, once the mutual interaction between the two energy sources is optimized (the larger number of parameters make it basically more difficult to control). The arc welding process, characterised by relatively lower power density and a wider process zone, creates a wide bead, thus enhancing the joint’s gap bridging ability and enlarging the manufacturing tolerances for joint preparation. Simultaneously, the laser beam process, characterised by higher localised power density, leads to a deeper penetration. Thus in hybrid GMA-laser beam welding, a wide and deep bead is achieved at higher welding speeds when compared with the GMAW process by its own [11], see Fig. 9. This accordingly leads to less heat input per unit length, less thermal distortion, and therefore, less residual stresses, narrower heat-affected zone (HAZ), and more important, increased productivity.
Fig. 9 Principle of hybrid welding by combining an electric arc (MAG) and a laser (ref. www.twi.co.uk)
Thus hybrid welding minimizes the drawbacks of both the single laser and the MIG process to obtain an optimized welding technique. Though hybrid laser welding has reduced the drawbacks of arc and laser welding, to make use of the advantages it has many parameters which have to be correctly adjusted to obtain the desired weld quality [12-13]. Those parameters are summarized briefly below. Secondary energy source (Laser with TIG/plasma/MIG-MAG)
The laser combined with the TIG-process is mainly suitable for thin gauge. To choose a laser with plasma arc has a certain advantage which is the pilot arc. The pilot arc is a low current (5 A) constant arc that is emitted through the nozzle. It usually gives a stable process. Laser with MIG/MAG is usually applied to fill up a gap between two parts and is the most common method. Laser power
An increase in laser power will generally increase the weld penetration. In the case of hybrid laser-arc welding (as opposed to the autonomous laser process) this phenomenon is accentuated because the reflectivity of the workpiece is reduced when the metal is heated by the arc.
22 Introduction Md. Minhaj Alam
Welding speed
The weld penetration increases when the welding speed is decreased because the heat input per unit length of weld is higher. Also the gap filling capability by the filler wire is improved at lower welding speeds (at constant filler wire feeding). The ratio between welding speed and filler wire feeding is important for the stability of the keyhole and thus for the stability of the process itself. Focal point position
The maximum weld penetration for the hybrid laser-arc process is generally obtained when the laser beam is focused below the top sheet surface (2 to 4 mm). Investigations have also shown that no change in focal point position is needed when Nd: YAG/TIG hybrid welding compared to pure laser welding takes place. Angle of electrode
In conventional welding, the torch angle from horizontal orientation is usually around 50°.The penetration depth does not increase at angles closer to vertical. Shielding gas
The predominant constituent of the shield gas is generally an inert gas such as helium or argon. A shielding gas providing a higher ionisation potential is required since the plasma can deflect or absorb a portion of the laser energy when CO2 lasers are employed. Helium is therefore often preferred to argon for laser welding, but its low density and higher price is a disadvantage, thus it is often combined with argon which is heavier without substantial alteration of the weld penetration depth. The addition of reactive gases such as oxygen and carbon dioxide has been shown to have an influence on the weld pool wetting characteristics and bead smoothness. Edge preparation
The preparation of edges is different in laser welding and conventional welding due to the different type of energy distribution. Because of the restricted width of the laser beam, perpendicular edges are needed in autogenous laser welding. Therefore, laser cut edges are preferred to shear cut edges. In MIG/MAG welding, a V-shape or other angled cut is normally made prior to welding; however, the preferred angle is often smaller than for arc-welding. Relative distance between laser and MIG
The relative distance between the laser beam and the MIG torch is one of the most important parameters to control in hybrid welding. It will be dependent on the energy supplied from each source. A short distance, typically 2 mm between the laser spot and the filler wire tip has been shown to be favourable for a steady keyhole and for maximum penetration. Whether the laser or the arc is leading is also an often discussed item. For the leading arc the wire drops can enter and fill the gap easier while for the leading laser often a more stable process was reported.
Md. Minhaj Alam Introduction 23
Joint gap
For laser welding gaps up to 0.2 mm can be managed. Gaps larger than this will lead to weld defects such as an incomplete weld bead and undercut. The hybrid laser-arc process allows us to join work pieces with gaps of 1 mm without any problem and even wider gaps, if the wire feeding is set high enough. This process is therefore more tolerant to inaccurate joint preparation and joint fit-up as well as thermal distortion of the work piece during the welding process. It is also more tolerant to a beam to gap misalignment. Advantages of hybrid laser welding
Lower capital cost, reduction of 30-40% compared to laser alone due to reduction in laser power requirement for same speed.
Higher welding speeds. Reduction of edge preparation accuracy needed. Control of seam width and top weld shape. Control of metallurgical variables through the addition of filler wire. Less material hardening. Improved process reliability. Higher electrical efficiency, up to 50% reduction in power consumption.
Disadvantages of hybrid laser welding
More parameters to be controlled/optimized. Process more difficult to control systematically. The advantage of the “laser finger” makes sense only for thickness larger 3 mm. Welding standards and experience widely missing yet.
Industrial applications
Shipbuilding, e.g. Odense Shipyard, Meyer Shipyard. Automotive, e.g. VW, Audi. Aerospace. Railway. Pipelines and offshore installations. Heavy industry, power generation.
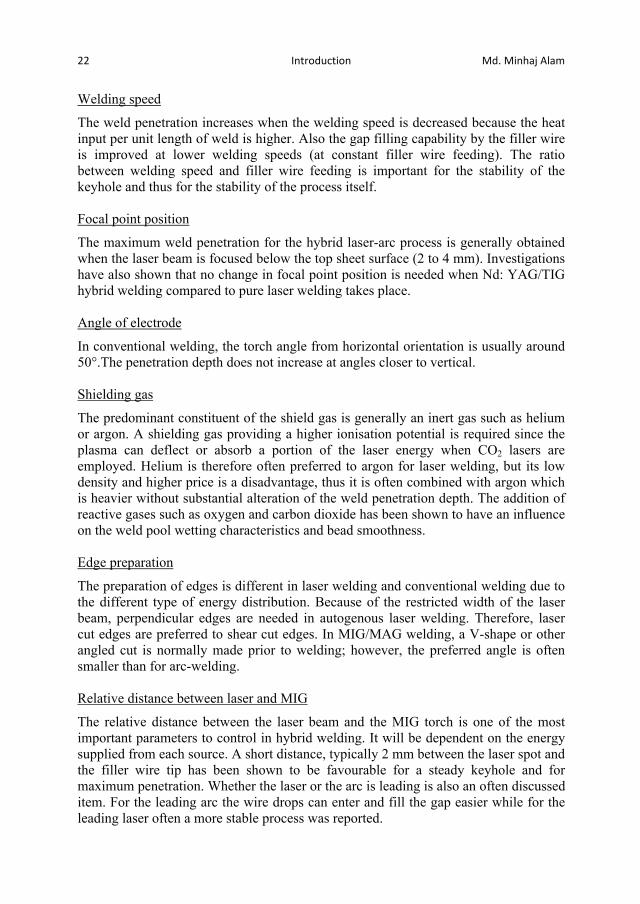
4.4 Laser cladding During laser cladding the laser beam melts an alloy addition onto a substrate. The alloy may be introduced into the beam-material interaction zone in various ways, either during or prior to processing. Figure 10 shows a technique in which alloy powder is blown into the laser beam and is deposited as a molten coating on the substrate. Very little of the substrate is normally melted and so due to the low dilution a clad with the nominal alloy composition is created. Surface properties can then be tailored to a given application by selecting an alloy with good wear, erosion, friction,
24 Introduction Md. Minhaj Alam
oxidation or corrosion properties [14]. The molten clad solidifies rapidly, forming a strong metallurgical bond with the substrate. Most substrates that tolerate laser melting are generally suitable for cladding: carbon-manganese and stainless steels and alloy based on aluminum, titanium, manganese, nickel and copper. Popular cladding alloys are based on cobalt, iron and nickel. The type of laser used depends on the surface area to be covered, the thickness of the clad required and the complexity of the component. CO2 lasers are ideal for large areas that require a clad layer being several millimeters in thickness over regions with a regular geometry. A robot-mounted diode laser beam, or Nd: YAG laser light delivered via a fibreoptic cable, is more suitable for precision treatment of complex three-dimensional components which require a coating less than one millimeter in thickness. The overall aim is to produce a clad with appropriate service properties, a strong bond to the substrate, with maximum coverage rate, the minimum use of alloy addition, and minimal distortion [15].
Fig. 10 Laser cladding by the blown powder technique [16]
Basically, two techniques for laser cladding can be distinguished, as follows:
1. Two-step process (pre-placed powder laser cladding) 2. One-step process
In the two-step process, the first stage consists of a layer of coating material being placed before laser irradiating. It is then melted along with the substrate surface by the laser beam in the second stage. In the one-step process, an additive is fed into the melt pool. The additive may be supplied in the following forms:
Powder injection Wire feeding Paste

Md. Minhaj Alam Introduction 25
4.4.1 Two-step laser cladding (pre-placed powder laser cladding) Pre-placed powder laser cladding is a simple method used for coating and prototyping where clad powder is placed on the substrate to fuse to form a clad layer by the laser beam [17], see Fig. 11. Several issues are involved in this process. The pre-placed powder particles on the substrate must have not only enough bonding to the substrate, but also enough cohesion to each other. It is necessary to prevent the powder particles on the substrate from removing due to the gas flow during the melting in the second step of the process. To overcome this problem, the powder is usually mixed with a chemical binder to ensure its cohesion with the substrate during the process. The side effect of a chemical binder is porosity in the clad due to its evaporation during the process. In the second step of the process the following phenomena occur:
1. Creation of a melt pool in the top surface of the pre-placed powder due to absorption of an irradiating laser beam.
2. Expansion of the melt pool to the interface powder-substrate due to the heat conduction.
3. Penetration of heat into the substrate, causing a fusion bond.
Fig. 11 Principle of the pre-placed powder laser cladding method [14]
4.4.2 One-step laser cladding One step laser cladding can be categorised into three methods: powder injection, wire feeding and paste laser cladding. The common feature of all three methods is the simultaneous feeding of a deposited material in the presence of the laser beam. Laser cladding by powder injection During the blown powder laser cladding technique, the metal powder is transported into the melt pool that is generated by a laser beam moving relative to the substrate. The laser beam is accompanied by a nozzle with carrier. The nozzle is typically directed at an angle in the range 38-45º towards the substrate, see Fig. 12, but can also be concentrically employed. The powder particles are heated when they pass through the laser beam. Melting starts at the interface and the molten particles are trapped in
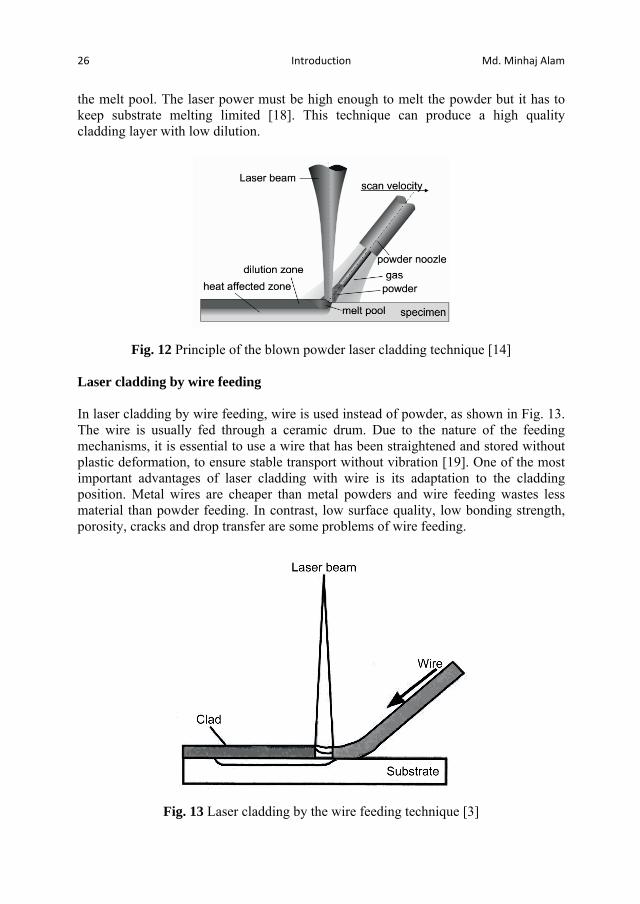
26 Introduction Md. Minhaj Alam
the melt pool. The laser power must be high enough to melt the powder but it has to keep substrate melting limited [18]. This technique can produce a high quality cladding layer with low dilution.
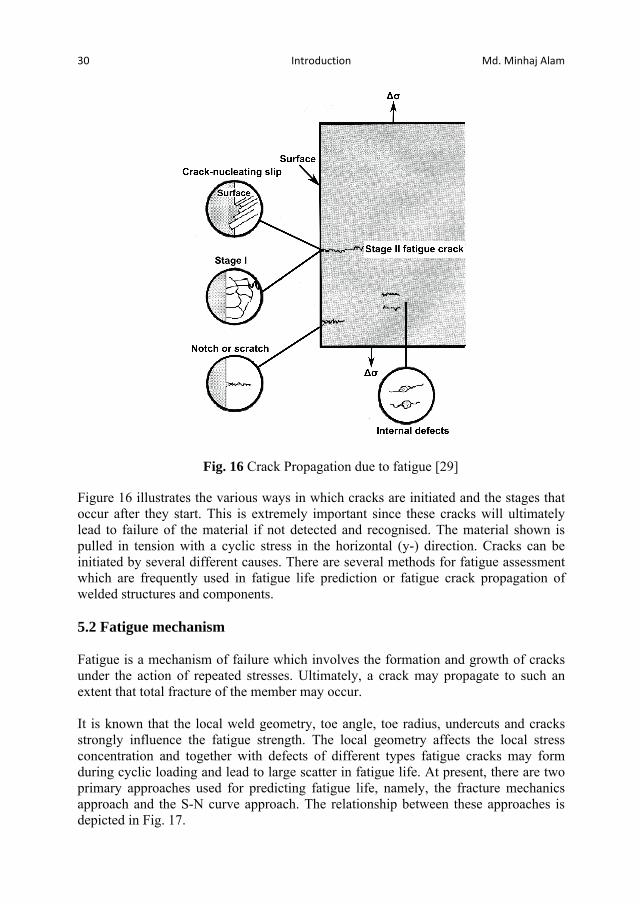
Fig. 12 Principle of the blown powder laser cladding technique [14] Laser cladding by wire feeding In laser cladding by wire feeding, wire is used instead of powder, as shown in Fig. 13. The wire is usually fed through a ceramic drum. Due to the nature of the feeding mechanisms, it is essential to use a wire that has been straightened and stored without plastic deformation, to ensure stable transport without vibration [19]. One of the most important advantages of laser cladding with wire is its adaptation to the cladding position. Metal wires are cheaper than metal powders and wire feeding wastes less material than powder feeding. In contrast, low surface quality, low bonding strength, porosity, cracks and drop transfer are some problems of wire feeding.
Fig. 13 Laser cladding by the wire feeding technique [3]

Md. Minhaj Alam Introduction 27
Laser cladding by paste In laser cladding by paste, a stream of paste-bound material is deposited on a point of the substrate that is usually slightly ahead of the laser beam [20], as shown in Fig.14. The paste consists of the hard facing powder with a suitable binder. However, the binder must be dried in a short period of time while the hard facing material in a compact form is still kept; otherwise powder particles would be blown away by the shielding gas. High porosity, extreme sensitivity of the process to disturbances and difficulties in the paste feeding mechanism are troublesome conditions of paste laser cladding.
Fig. 14 Laser cladding by the paste technique [3]
Advantages of laser cladding
Laser cladding offers many advantages over conventional coating processes such as arc welding and plasma spraying. Using laser cladding, the following advantages can be obtained:
Reduced dilution, which is the mixing percentage of the substrate to the clad region.
Improved wear resistance of a part. Reduced thermal distortion. Improved controllability of the process. Repair of worn out parts. Reduced production time.
Disadvantages of laser cladding
Despite the obvious benefits of laser cladding, this process has some drawbacks:
High investment cost. Low sensitivity. Process is difficult to control.

28 Introduction Md. Minhaj Alam
Industrial applications
Industrial applications require parts with good wear, corrosion resistance and hardness properties; laser cladding is a process which can fulfil all these requirements. Examples of industrial laser cladding applications are:
Automotive (engine valve seats). Aerospace (valve rim, injection moulding tool, turbine blade). Machinery (turbine blade, compressor blade, cutting tools, etc.). Petrochemical (drill rods). Power generation (valves, gas turbine parts, turbine blades, etc.).
5. Fatigue cracking Welding strongly affects material by the process of heating and cooling, as well as by the addition of filler material, resulting in inhomogeneous material zones. Moreover, the shape of the weld depends on the melt flow and its resolidification. As a consequence, fatigue failures appear in welded structures mostly at the welds rather than in the base metal, see Fig. 15. For this reason, fatigue analyses are of high practical interest for all cyclic loaded welded structures, such as ships, offshore structures, cranes, bridges vehicles, railways, etc.
Fig. 15 Fatigue failure in welded joint-fracture surface
For several years there has been a trend towards fatigue life improvement by using advanced welding techniques like laser welding or hybrid laser welding. Until now, all toughness improvements of the fatigue strength of welds were carried out by post-weld treatments such as TIG (Tungsten Inert Gas) dressing, hammer peening, grinding, UIT (Ultrasonic Impact Treatment) and post-weld heat treatment [21-23]. However, these methods often require well-skilled workers or special equipments, and most of these methods are time-consuming processes which inevitably make construction costs higher. Kirkhope et al. [24-25] also discusses methods of improving the fatigue life of welded steel structures by operations such as grinding, peening, water-jet eroding and remelting. They stated that the use of special welding techniques applied as part of the welding process in lieu of post-weld operations are attractive because the associated costs are lower and the quality control is simpler. Nowadays the improvement of weld

Md. Minhaj Alam Introduction 29
surface geometry is being achieved with advanced welding technology, particularly laser and hybrid laser welding. Therefore, studies of geometrical aspects on the fatigue behaviour of hybrid laser welded joints are necessary. The fatigue failure of welded elements without crack-like defects comprises two phases: fatigue crack initiation and fatigue crack propagation [26]. To estimate fatigue crack initiation life, the weld toe stress concentration factor (SCF) is usually needed. To predict the crack propagation life, stress intensity factors (SIF) are used when a linear elastic fracture mechanics approach is employed [27]. Estimation of the fatigue life usually assumes the weld toe geometry by a weld angle, and a circular arc which defines the weld toe radius. This local geometry affects the local stress concentration and together with defects of different types, fatigue cracks form during cyclic loading and lead to a large scatter in fatigue life data. Also there is another important weld surface geometry - weld surface waviness or ripples from where cracks may initiate. Chapetti and Otegui [28] investigated the effect of toe irregularity for fatigue resistance of welds and concluded that the period of toe waves, as well as local toe geometry, strongly influences the fatigue crack initiation and propagation life. Same as for laser and hybrid laser welding, the laser cladding process can generate defects such as lack-of-fusion, hot cracks, pores or inclusions, both at the layer-substrate interface and inside the clad layer, and particularly at the interfaces of overlapping layers. Moreover, as-clad wavy surfaces create high stress concentration during fatigue loading. All these mentioned defects have great influence on the fatigue crack initiation and propagation of laser clad components, depending on their size, shape, location and orientation. 5.1 Fundamental knowledge of fatigue analysis
Fatigue is the progressive and localised structural damage that occurs when a material is subjected to cyclic loading. The maximum stress values are less than the ultimate tensile stress limit, and may be below the yield stress limit of the material. Failure of a material due to fatigue may be viewed on a microscopic level in three steps (a) Crack Initiation - The initial crack occurs in this stage. The crack may be caused by surface scratches caused by handling, or tooling of the material; threads (as in a screw or bolt); slip bands or dislocations intersecting the surface as a result of previous cyclic loading or work hardening. (b) Crack Propagation - The crack continues to grow during this stage as a result of continuously applied stresses. (c)Failure - Failure occurs when the material that has not been affected by the crack cannot withstand the applied stress. This stage happens very quickly.
30 Introduction Md. Minhaj Alam
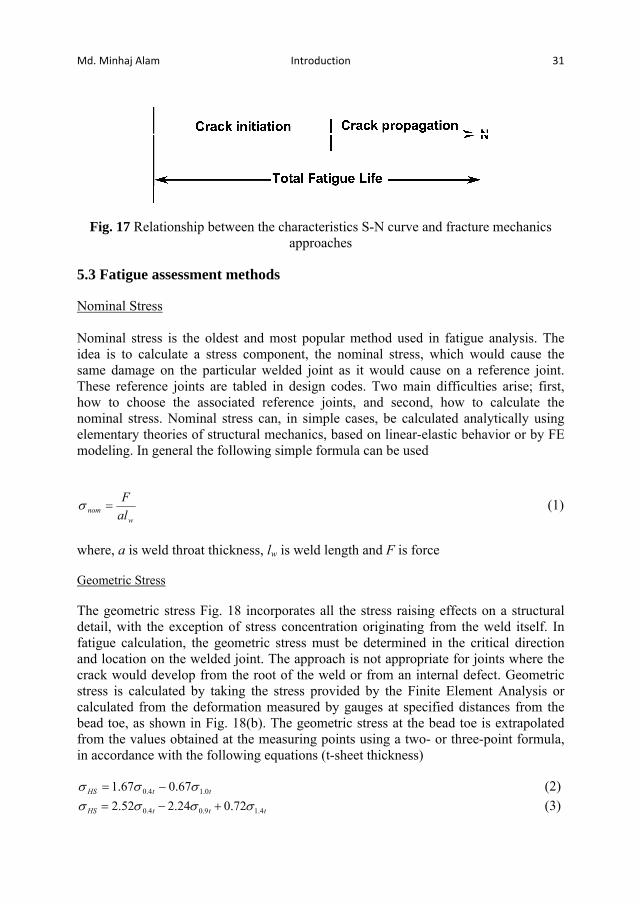
Fig. 16 Crack Propagation due to fatigue [29]
Figure 16 illustrates the various ways in which cracks are initiated and the stages that occur after they start. This is extremely important since these cracks will ultimately lead to failure of the material if not detected and recognised. The material shown is pulled in tension with a cyclic stress in the horizontal (y-) direction. Cracks can be initiated by several different causes. There are several methods for fatigue assessment which are frequently used in fatigue life prediction or fatigue crack propagation of welded structures and components. 5.2 Fatigue mechanism Fatigue is a mechanism of failure which involves the formation and growth of cracks under the action of repeated stresses. Ultimately, a crack may propagate to such an extent that total fracture of the member may occur. It is known that the local weld geometry, toe angle, toe radius, undercuts and cracks strongly influence the fatigue strength. The local geometry affects the local stress concentration and together with defects of different types fatigue cracks may form during cyclic loading and lead to large scatter in fatigue life. At present, there are two primary approaches used for predicting fatigue life, namely, the fracture mechanics approach and the S-N curve approach. The relationship between these approaches is depicted in Fig. 17.
Md. Minhaj Alam Introduction 31
Fig. 17 Relationship between the characteristics S-N curve and fracture mechanics
approaches 5.3 Fatigue assessment methods Nominal Stress Nominal stress is the oldest and most popular method used in fatigue analysis. The idea is to calculate a stress component, the nominal stress, which would cause the same damage on the particular welded joint as it would cause on a reference joint. These reference joints are tabled in design codes. Two main difficulties arise; first, how to choose the associated reference joints, and second, how to calculate the nominal stress. Nominal stress can, in simple cases, be calculated analytically using elementary theories of structural mechanics, based on linear-elastic behavior or by FE modeling. In general the following simple formula can be used
wnom al
F (1)
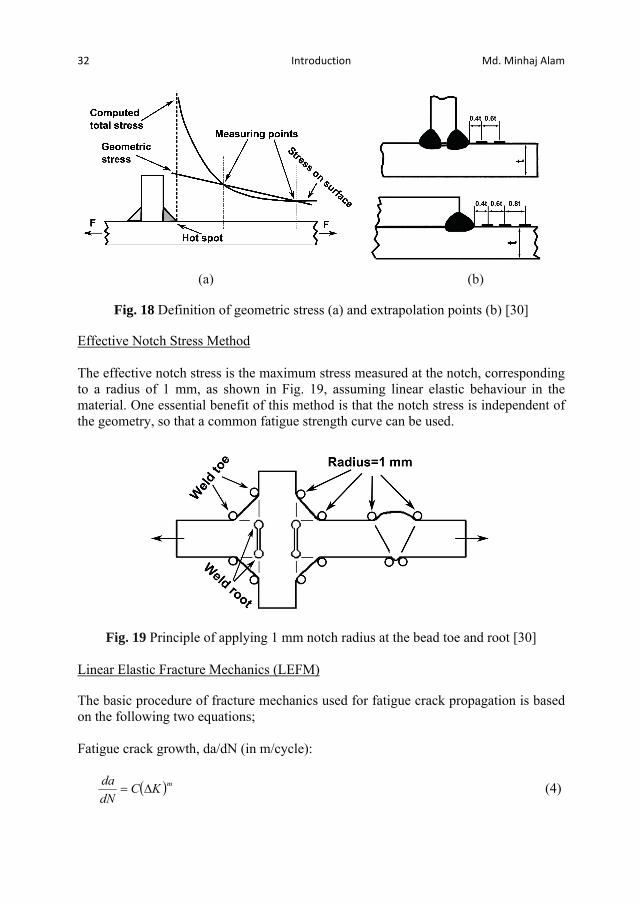
where, a is weld throat thickness, lw is weld length and F is force Geometric Stress The geometric stress Fig. 18 incorporates all the stress raising effects on a structural detail, with the exception of stress concentration originating from the weld itself. In fatigue calculation, the geometric stress must be determined in the critical direction and location on the welded joint. The approach is not appropriate for joints where the crack would develop from the root of the weld or from an internal defect. Geometric stress is calculated by taking the stress provided by the Finite Element Analysis or calculated from the deformation measured by gauges at specified distances from the bead toe, as shown in Fig. 18(b). The geometric stress at the bead toe is extrapolated from the values obtained at the measuring points using a two- or three-point formula, in accordance with the following equations (t-sheet thickness)
ttHS 0.14.0 67.067.1 (2) tttHS 4.19.04.0 72.024.252.2 (3)
32 Introduction Md. Minhaj Alam
(a) (b)
Fig. 18 Definition of geometric stress (a) and extrapolation points (b) [30]
Effective Notch Stress Method The effective notch stress is the maximum stress measured at the notch, corresponding to a radius of 1 mm, as shown in Fig. 19, assuming linear elastic behaviour in the material. One essential benefit of this method is that the notch stress is independent of the geometry, so that a common fatigue strength curve can be used.
Fig. 19 Principle of applying 1 mm notch radius at the bead toe and root [30]
Linear Elastic Fracture Mechanics (LEFM) The basic procedure of fracture mechanics used for fatigue crack propagation is based on the following two equations; Fatigue crack growth, da/dN (in m/cycle):
mKCdNda (4)
Md. Minhaj Alam Introduction 33
Stress intensity factor range, K (in MPa m-0.5):
aaFK )( (5) (a = initial crack size in the direction of the crack growth, C, m = material constant, = applied nominal stress, F(a) = correction factor for the stress intensity factor)
In the literature some engineering values for initial crack sizes in welds in steel can be found. Radaj [31] suggests the value a = 0.1-0.5 mm for a line crack and for a semi elliptical crack he gives a/c = 0.1-0.5 for the depth/width ratio. In a literature survey by Samuelsson [32] the following typical flaw sizes were found for use in conjunction with welds. At the surface, welding causes defects with depths from 0.01 to 0.05 mm.
When the applied stress range, , is constant during crack propagation, the fatigue crack growth equation can be written as follows
maaFC
dadN)(
(6)
Then, the fatigue crack propagation life, Np, from and initial crack size ai to a final crack size af can be computed as follows:
f
i
f
i
a
a m
N
NPaaFC
dadNN)(
(7)
The stress intensity factor range, K, for a crack initiating at the weld toe may be conveniently expresses as follows:
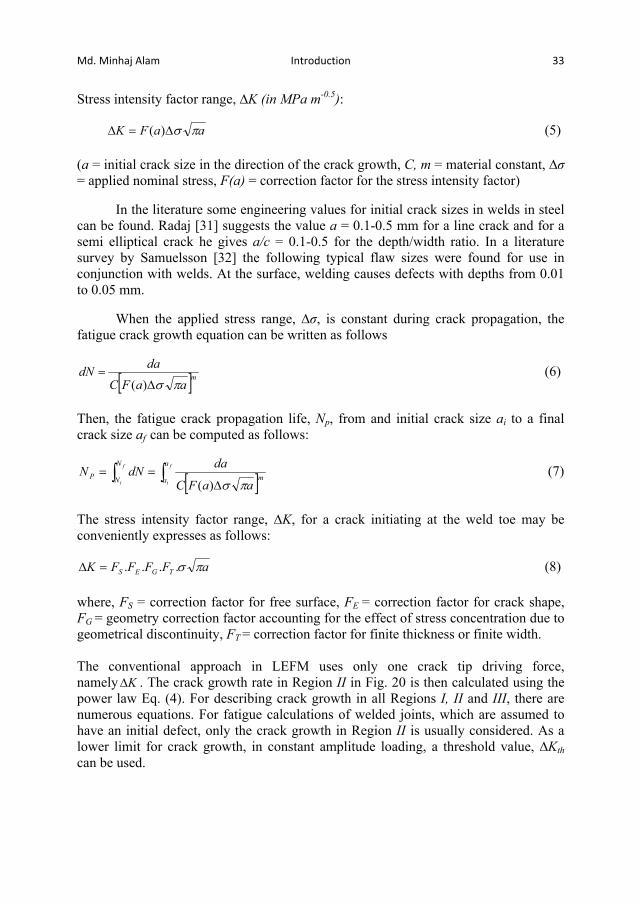
aFFFFK TGES .... (8) where, FS = correction factor for free surface, FE = correction factor for crack shape, FG = geometry correction factor accounting for the effect of stress concentration due to geometrical discontinuity, FT = correction factor for finite thickness or finite width. The conventional approach in LEFM uses only one crack tip driving force, namely K . The crack growth rate in Region II in Fig. 20 is then calculated using the power law Eq. (4). For describing crack growth in all Regions I, II and III, there are numerous equations. For fatigue calculations of welded joints, which are assumed to have an initial defect, only the crack growth in Region II is usually considered. As a lower limit for crack growth, in constant amplitude loading, a threshold value, Kth can be used.
34 Introduction Md. Minhaj Alam
Fig. 20 Fatigue crack growth law
6. Numerical analysis methods 6.1 Introduction Numerical analysis is the area of mathematics and computer science that creates, analyses and implements algorithms for solving numerically the problems of continuous mathematics. Such problems originate generally from real-world applications of algebra, geometry and calculus, and they involve variables which vary continuously; these problems occur throughout the natural sciences, social sciences, engineering, medicine, and business. In the engineering field, there are several methods available to perform numerical analysis. Among them, Finite Element Analysis (FEA), the Finite Differences Method (FDM) and the Finite Volume Method (FVM) are perhaps the most popular nowadays. As numerical methods are the main approaches applied in this thesis, they are briefly discussed in the following chapter. 6.2 Computational Fluid Dynamics by FVM
The Finite Volume Method (FVM) is a method for representing and evaluating partial differential equations in the form of algebraic equations [33, 34]. Finite Volume refers to the small volume surrounding each node point on a mesh. In the finite volume method, volume integrals in a partial differential equation that contain a divergence term are converted to surface integrals, using the divergence theorem. These terms are then evaluated as fluxes at the surfaces of each finite volume. Because the flux entering a given volume is identical to that leaving the adjacent volume, these methods are conservative. Another advantage of the Finite Volume Method is that it is easily formulated to allow for unstructured meshes. The method is used in many computational fluid dynamics packages.
Md. Minhaj Alam Introduction 35
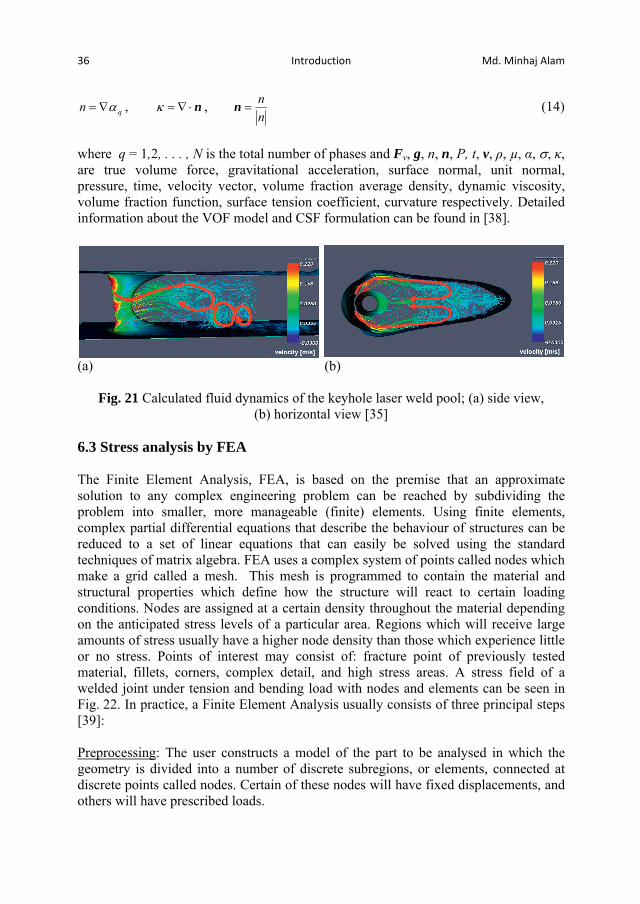
In this thesis, in Paper IV, a free surface multiphase model was adopted where the interface movement molten metal-gas was studied. A method to describe a free surface must present three essential features. First, a scheme is needed to describe the shape and location of a surface. Second, an algorithm is required to track the shape and location in time. Finally, free-surface boundary conditions, BC, are applied at the surface. Different numerical approaches have been developed to deal with interphase modelling. Probably the most applied of these methods is the Volume of Fluid technique, VOF, because of its simplicity and robustness. An example of the VOF technique applied for the melt flow in keyhole laser welding is shown in Fig. 21 [35]. It is particularly recommended for describing highly complex interfaces. Since the volume of a phase cannot be occupied by the other phases, the concept of phasic volume fraction is introduced. These volume fractions are assumed to be continuous functions of space and time and their sum is equal to one. Conservation equations for each phase are derived to obtain a set of equations, which have similar structure for all phases. These equations are closed by providing constitutive relations that are obtained from empirical information. In the considered multiphase approach, the VOF model is applied. In the original algorithm, developed by Hirt and Nichols [36], it is assumed that all the phases (incompressible, viscous fluids) must fill the whole domain; hence, no void regions are allowed. In addition, to implement the interphase tracking, this algorithm is usually combined with a formulation to include the surface tension in the momentum equations as volume forces. This algorithm is the continuous surface force (CSF) formulation [37]. For analysis of the fluid flow in relation to the tracking free surface in the weld, solutions are found for the governing equations of mass conservation, momentum conservation (Navier-Stokes equations) and the volume fraction function with CSF formulation [38]. The governing equations can be expressed in Cartesian coordinates as follows:
Mass conservation equation:
0vt
(9)
Navier-Stokes equation:
vPt
Fvgvvv 2 (10)
Volume fraction function equation:
0qq
tv (11)
N
11,
N
1q ,
N
qqq
1 (12)
Continuous surface force formulation (for two phases):
ji
iiijv
21
F (13)
36 Introduction Md. Minhaj Alam
qn , n , nnn (14)
where q = 1,2, . . . , N is the total number of phases and Fv, g, n, n, P, t, v, , μ, , , , are true volume force, gravitational acceleration, surface normal, unit normal, pressure, time, velocity vector, volume fraction average density, dynamic viscosity, volume fraction function, surface tension coefficient, curvature respectively. Detailed information about the VOF model and CSF formulation can be found in [38].
(a) (b)
Fig. 21 Calculated fluid dynamics of the keyhole laser weld pool; (a) side view, (b) horizontal view [35]
6.3 Stress analysis by FEA The Finite Element Analysis, FEA, is based on the premise that an approximate solution to any complex engineering problem can be reached by subdividing the problem into smaller, more manageable (finite) elements. Using finite elements, complex partial differential equations that describe the behaviour of structures can be reduced to a set of linear equations that can easily be solved using the standard techniques of matrix algebra. FEA uses a complex system of points called nodes which make a grid called a mesh. This mesh is programmed to contain the material and structural properties which define how the structure will react to certain loading conditions. Nodes are assigned at a certain density throughout the material depending on the anticipated stress levels of a particular area. Regions which will receive large amounts of stress usually have a higher node density than those which experience little or no stress. Points of interest may consist of: fracture point of previously tested material, fillets, corners, complex detail, and high stress areas. A stress field of a welded joint under tension and bending load with nodes and elements can be seen in Fig. 22. In practice, a Finite Element Analysis usually consists of three principal steps [39]: Preprocessing: The user constructs a model of the part to be analysed in which the geometry is divided into a number of discrete subregions, or elements, connected at discrete points called nodes. Certain of these nodes will have fixed displacements, and others will have prescribed loads.

Md. Minhaj Alam Introduction 37
Analysis: The dataset prepared by the pre-processor is used as input to the finite element code itself, which constructs and solves a system of linear or nonlinear algebraic equations
jiji uKF (15) where u and f are the displacements and externally applied forces at the nodal points. The formation of the K matrix is dependent on the type of problem being attacked. Commercial codes may have very large element libraries, with elements appropriate to a wide range of problem types. One of FEA's principal advantages is that many problem types can be addressed with the same code, merely by specifying the appropriate element types from the library. Postprocessing: A typical postprocessor display overlays coloured contours representing stress levels on the model, showing a full-field picture similar to that of photoelastic or experimental results.
Fig. 22 The contour of normal stress under tension (left) and bending (right) with nodes and elements [40]
6.4 Crack propagation analysis An existing crack within a structure creates a plastic zone around the crack tip as a result of stress concentration. Inclined Lack-of-Fusion, LOF, which can be regarded as an existing crack with two crack tips, is shown in Fig. 23(a) and the corresponding propagation due to fatigue loading can be seen in Fig. 23(b). During fatigue loading, if the plastic zone at the crack tip is sufficiently small compared with the crack size (LEFM), displacement, stress and strain fields around the tip are defined by K, which has the relationship with crack growth rate as follows:
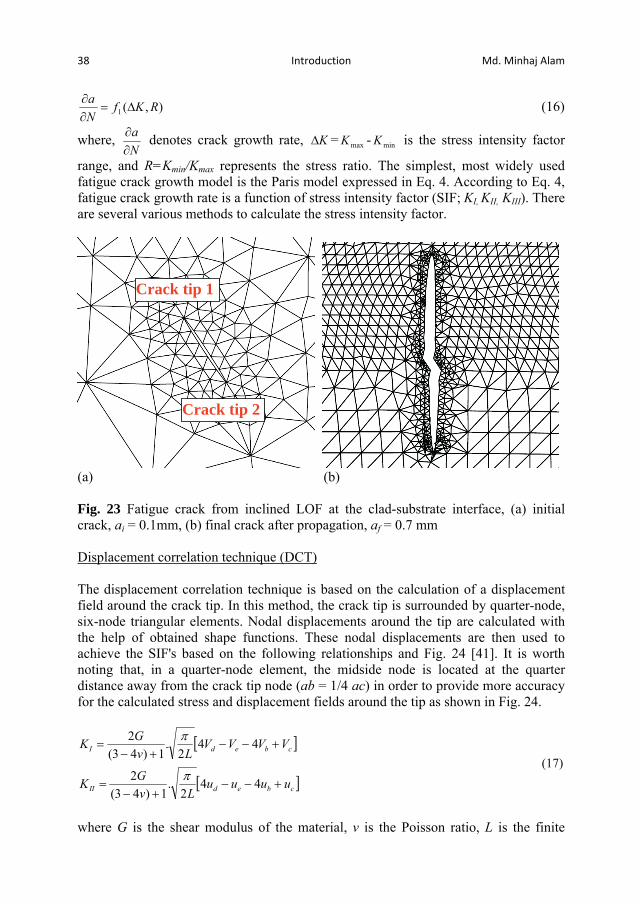
38 Introduction Md. Minhaj Alam
),(1 RKfNa (16)
where, Na denotes crack growth rate, K = maxK - minK is the stress intensity factor
range, and R=Kmin/Kmax represents the stress ratio. The simplest, most widely used fatigue crack growth model is the Paris model expressed in Eq. 4. According to Eq. 4, fatigue crack growth rate is a function of stress intensity factor (SIF; KI, KII, KIII). There are several various methods to calculate the stress intensity factor.
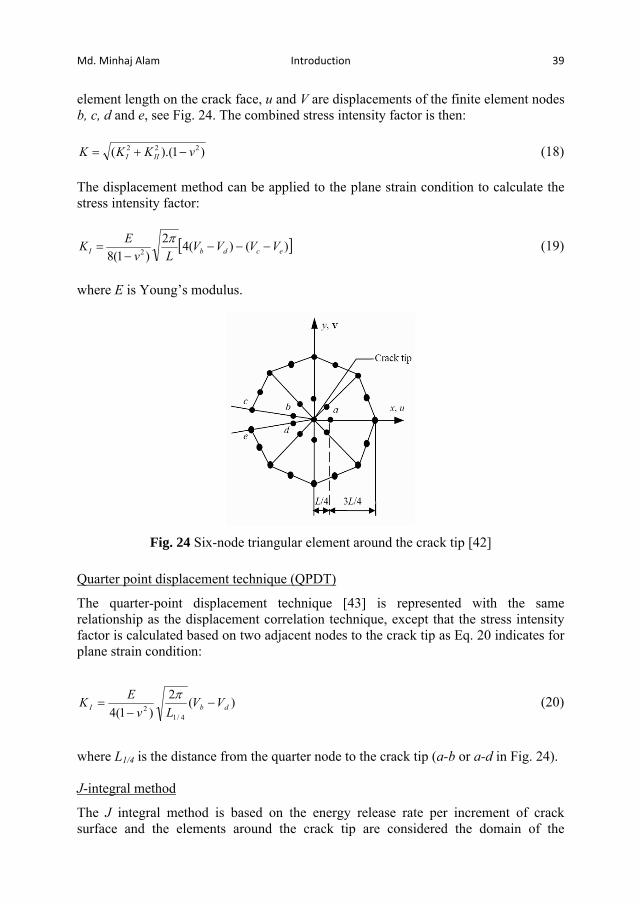
(a) (b) Fig. 23 Fatigue crack from inclined LOF at the clad-substrate interface, (a) initial crack, ai = 0.1mm, (b) final crack after propagation, af = 0.7 mm Displacement correlation technique (DCT) The displacement correlation technique is based on the calculation of a displacement field around the crack tip. In this method, the crack tip is surrounded by quarter-node, six-node triangular elements. Nodal displacements around the tip are calculated with the help of obtained shape functions. These nodal displacements are then used to achieve the SIF's based on the following relationships and Fig. 24 [41]. It is worth noting that, in a quarter-node element, the midside node is located at the quarter distance away from the crack tip node (ab = 1/4 ac) in order to provide more accuracy for the calculated stress and displacement fields around the tip as shown in Fig. 24.
cbedII
cbedI
uuuuLv
GK
VVVVLv
GK
442
.1)43(
2
442
.1)43(
2
(17)
where G is the shear modulus of the material, v is the Poisson ratio, L is the finite
Crack tip 1
Crack tip 2
Md. Minhaj Alam Introduction 39
element length on the crack face, u and V are displacements of the finite element nodes b, c, d and e, see Fig. 24. The combined stress intensity factor is then:
)1).(( 222 vKKK III (18) The displacement method can be applied to the plane strain condition to calculate the stress intensity factor:
)()(42)1(8 2 ecdbI VVVV
LvEK (19)
where E is Young’s modulus.
Fig. 24 Six-node triangular element around the crack tip [42]
Quarter point displacement technique (QPDT)
The quarter-point displacement technique [43] is represented with the same relationship as the displacement correlation technique, except that the stress intensity factor is calculated based on two adjacent nodes to the crack tip as Eq. 20 indicates for plane strain condition:
)(2)1(4 4/1
2 dbI VVLv
EK (20)
where L1/4 is the distance from the quarter node to the crack tip (a-b or a-d in Fig. 24). J-integral method
The J integral method is based on the energy release rate per increment of crack surface and the elements around the crack tip are considered the domain of the

40 Introduction Md. Minhaj Alam
integration. Because linear elastic fracture mechanics (LEFM) and elastic plastic fracture mechanics (EPFM) present the same fatigue analysis below the yield strength, the values of energy release rate for linear (G) and nonlinear (J) materials are equal. Because of the relationship between G and K in LEFM, the stress intensity factor is extracted from J for plane stress and strain conditions, based on the following equation [44, 45]:
'
2
EKGJ (21)
Modified crack-closure (MCC) integral technique
The modified crack closure method calculates the strain energy release rate for a linear elastic material (G). The stress intensity factor is then obtained by applying Eq. 21 [46, 47]. The comparison of these four different methods has attracted the attention of many researchers [48-52]. Based on the review of this previous work it is concluded that these methods provide nearly identical results and suggest a preference for working with the displacement method. To simulate the crack growth direction in 2D FE-analysis, the most usual criteria for the computation of crack growth are: (a) maximum circumferential stress ( max); (b) maximum potential energy release rate (g max); and (c) minimum strain energy density (S max). For the first criterion, Erdogan and Sih [53] considered that a crack grows in the same direction as the maximum circumferential tensile stress around the crack tip. In the second criterion, Hussain et al. [54] have suggested that the crack propagates in the direction with the highest energy relaxation rate and Sih [55] proposed the third criterion that crack grows in the direction that provides the lowest level of strain energy within the material. Although research has shown a close similarity between the results of these three methods for predicting the crack growth direction, most of the studies indicate that the first method (the maximum circumferential tensile stress method) has been preferred [56-58]. In the maximum circumferential stress theory, the direction of crack propagation is computed from
0)1cos3(sin III KK (22) Analysis of Equation (22) for the two pure modes showed that for pure Mode I, KII = 0, KIsin = 0 and = 0°, and for pure Mode II, KI = 0 and = ±70.5°. These values of are the extreme values of the crack propagation angles. The intermediary values are
found by solving Eq. (22) for considering the mixed mode, resulting in
841
41arctan2
2
II
I
II
I
KK
KK (23)

Md. Minhaj Alam Introduction 41
7. Summary of the research papers Paper I: The influence of surface geometry and topography on the fatigue cracking behaviour of laser hybrid welded eccentric fillet joints. Abstract: Laser hybrid welding of an eccentric fillet joint causes a complex geometry for fatigue load by 4-point bending. The weld surface geometry and topography were measured and studied in order to understand the crack initiation mechanisms. The crack initiation location and the crack propagation path were studied and compared to Finite Element stress analysis, taking into account the surface macro- and micro-geometry. It can be explained why the root and the upper weld toe are uncritical for cracking. The cracks that initiate from the weld bead show higher fatigue strength than the samples failing at the lower weld toe, as can be explained by a critical radius for the toe below which surface ripples instead determine the main stress raiser location for cracking. The location of maximum surface stress is related to a combination of throat depth, toe radius and sharp surface ripples along which the cracks preferably propagate. Conclusions: (i) The toe radius does not always dominate fatigue performance, as ripples can
become local stress raisers. (ii) If the toe radii are large enough, the stress peak can be shifted to the weld bead;
the weld re-solidification ripple pattern guides the cracks. (iii) Welds which fail in the bead show higher fatigue strength than those which fail
in the toe. (iv) The toe radius and surface topography can vary along the weld. (v) The lower toe radius is more critical than the upper toe in this eccentric joint, as
its shorter distance to the root generally causes higher stress. (vi) The surface ripples significantly raise stress, but those in the toe normally cause
the highest stress, except when the toe radius is small. (vii) The cracks in this case always started in the weld, not in the HAZ, nor at the
fusion interface. (viii) The complex geometrical interactions involved can be explained by a
theoretical illustration.
42 Introduction Md. Minhaj Alam
Paper II: Influence of defects on fatigue crack propagation in laser hybrid welded eccentric fillet joint. Abstract: Fatigue cracking of laser hybrid welded eccentric fillet joints has been studied for stainless steel. Two-dimensional linear elastic fracture mechanics analysis was carried out for this joint geometry for four point bending load. The numerical simulations explain for the experimental observations why the crack propagates from the lower weld toe and why the crack gradually bends towards the root. Lack of fusion turned out to be uncritical for the initiation of cracks due to its compressive stress conditions. The linear elastic fracture mechanics analysis has demonstrated in good qualitative agreement with fatigue test results that lack of fusion slightly (<10%) reduces the fatigue life by accelerating the crack propagation. For the geometrical conditions studied here improved understanding of the crack propagation was obtained and in turn illustrated. The elaborated design curves turned out to be above the standard recommendations. Conclusions: Fatigue crack propagation of a laser hybrid welded eccentric fillet joint has been studied for four point bending load conditions using linear elastic fracture mechanics. The internal weld defect, lack of fusion, is introduced in the linear elastic fracture mechanics analysis, as well as surface weld defects. Fatigue testing is evaluated by the nominal stress method. The conclusions are as follows: (i) In good agreement between simulation and experiments, the crack first
propagates normal to the local weld surface, preferably at the lower toe, but then gradually bends to the root.
(ii) Lack of fusion frequently occurs for this kind of weld, however, is not so
critical to initiate cracking when under compressive stress from loading. When a crack propagates closer to lack of fusion, the interaction increases the stress around the crack and accelerates propagation, slightly (<10%) reducing the fatigue life for the case studied here.
(iii) Higher slope (m = 3.16) of the S–N curves was obtained for hybrid laser
welded eccentric fillet joints than the corresponding standard (for gas metal arc welding, m = 3) which indicates longer fatigue life of hybrid laser welded joints.
Paper III: Generalising fatigue stress analysis of different laser weld geometries. Abstract: Two-dimensional elastic–plastic finite element analyses was carried out on a laser welded box beam in order to study the impact of the geometrical aspects of the joint type and weld root on the fatigue stress behaviour. Different experimental and hypothetical weld geometries were studied. Characteristic root shapes, measured by the plastic replica method, and critical geometrical aspects were classified and then

Md. Minhaj Alam Introduction 43
studied by FE-analysis with respect to their impact on the maximum stress. The simulation of hypothetical transition geometries facilitated the identification of trends and the explanation of part of the phenomena. However, quantitative geometry criteria were only partially suitable to describe the relations. The results have shown that the combination of throat depth, local surface radius and its opening angle determines the peak stress value and its location. Beside extended throat depths, particularly larger toe radii and the avoidance of small opening angles and of surface ripples reduces the peak stress. The explanations were developed in a generalising manner, accompanied by illustrative and flow chart description. Conclusions: From the numerical study of the stress field of four laser welding joint geometries and manifold similar surface geometries the following conclusions can be drawn: (i) The combination of throat depths (anchors), local surface radius (including
roughness and sharp corners) and its opening angle determines the peak stress value and its location, as was shown for a series of joint types and root shapes studied.
(ii) Basic criteria, derived from inverting the above key geometrical properties,
widely explained the qualitative trends, but only to a limited extent the quantitative relations when comparing the stress peaks of different cases; the interacting origins are difficult to separate, even in the simulated stress field data, except when conducting sensitivity studies.
(iii) Little surface radii, small opening angles or sharp corners (e.g. at the root or by
surface ripples) can attract the maximum stress to a different location than the minimum throat depth location; large radii and the avoidance of sharp corners, of ripples or of small opening angles are highly efficient design guidelines for lowering the stress.
(iv) Illustration of the main geometrical aspects and of the stress distribution is a suitable tool for qualitative stress analysis of different joint and surface geometries, particularly for the transition between similar kinds; a modified flow chart method was developed for formulating and documenting the findings, suitable for extension.
Paper IV: Analysis of the rapid central melt pool flow in hybrid laser-arc welding. Abstract: Hybrid laser arc welding creates a long weld pool tail. By high speed imaging the melt velocity behind the keyhole was measured to be very high, of the order of meters per second. Fluid dynamics simulation was carried out locally in the central axial plane of the pool tail. The high speed melt layer redistributes its momentum to slow movement of the deeper bulk. The consequences of initially high
44 Introduction Md. Minhaj Alam
melt speed and its mass flow redistribution on the formation of the central reinforcement peak are discussed. Conclusions: (i) Hybrid laser welding with leading arc tends to undercuts despite excess of
material from the wire. (ii) From high speed imaging very high velocity of the melt surface at the
beginning of the long tail was discovered, rapidly slowing down in two stages. (iii) The melt speed reached 1.0-2.2 m/s, here a factor 29-61 times the welding
speed, probably driven by the arc pressure. (iv) Numerical simulation of the flow field has shown that the mass flow of the
high-speed-layer rapidly is redistributed to the much thicker melt bulk, increasing the bulk velocity above the welding speed.
(v) This trend is different to other high velocity phenomena such as Marangoni
convection; the behaviour remained similar for different viscosity or top speed. (vi) We postulate the hypothesis that higher bulk speed elongates the pool and
delays lateral resolidification, favouring flow to the centre which emphasizes the central weld peak and undercuts.
Paper V: Surface pore initiated fatigue failure in laser clad components. Abstract: A laser clad cylindrical structural steel rod was fatigue tested under four-point bending load. The resulting fracture could be tracked back to a spherical surface pore in the Co-based coating. Due to an oxide inclusion the pore was invisible. Two circular buckling strain patterns that were detected beside the pore at the surfaces after fracture confirm local plastic deformation prior to crack initiation. In order to calculate the stress field around the surface pore, linear elastic finite element analysis was carried out. For four-point bending load a surface pore generally exceeds the maximum stress of a smooth rod as long as the pore is located within an azimuthal angle of 55º, which was the case for the presented as well as for another pore-initiated sample. Conclusions: (i) Experimental evidence in a laser-clad rod has confirmed that close-to-surface
pores are critical stress raisers initiating fatigue cracking which have a severe effect on the fatigue life of structural components.
(ii) For a bending load on a non- rotating cylindrical rod a general critical range of
azimuthal angles of 55º was calculated, in which close-to-surface pores and
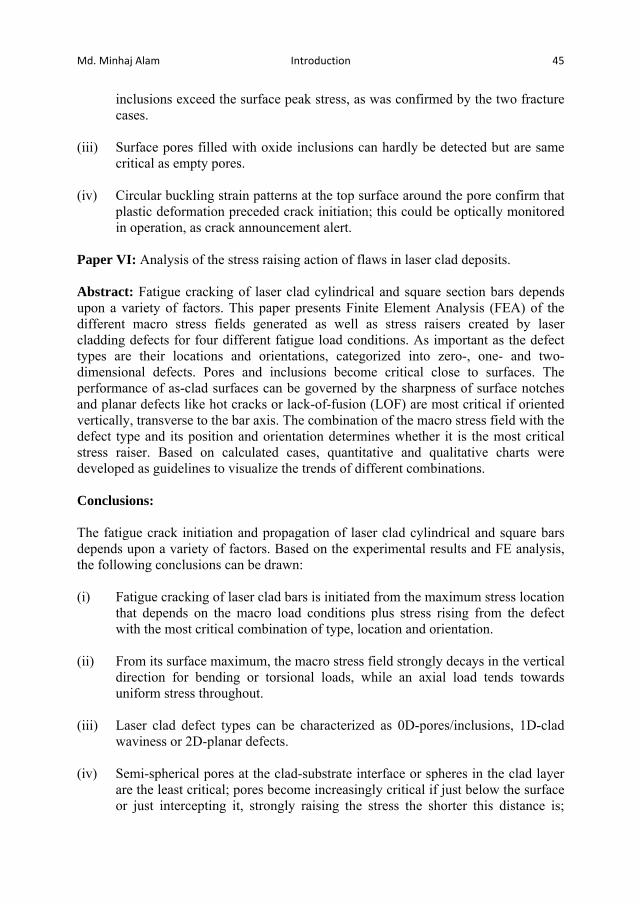
Md. Minhaj Alam Introduction 45
inclusions exceed the surface peak stress, as was confirmed by the two fracture cases.
(iii) Surface pores filled with oxide inclusions can hardly be detected but are same
critical as empty pores. (iv) Circular buckling strain patterns at the top surface around the pore confirm that
plastic deformation preceded crack initiation; this could be optically monitored in operation, as crack announcement alert.
Paper VI: Analysis of the stress raising action of flaws in laser clad deposits. Abstract: Fatigue cracking of laser clad cylindrical and square section bars depends upon a variety of factors. This paper presents Finite Element Analysis (FEA) of the different macro stress fields generated as well as stress raisers created by laser cladding defects for four different fatigue load conditions. As important as the defect types are their locations and orientations, categorized into zero-, one- and two-dimensional defects. Pores and inclusions become critical close to surfaces. The performance of as-clad surfaces can be governed by the sharpness of surface notches and planar defects like hot cracks or lack-of-fusion (LOF) are most critical if oriented vertically, transverse to the bar axis. The combination of the macro stress field with the defect type and its position and orientation determines whether it is the most critical stress raiser. Based on calculated cases, quantitative and qualitative charts were developed as guidelines to visualize the trends of different combinations. Conclusions: The fatigue crack initiation and propagation of laser clad cylindrical and square bars depends upon a variety of factors. Based on the experimental results and FE analysis, the following conclusions can be drawn: (i) Fatigue cracking of laser clad bars is initiated from the maximum stress location
that depends on the macro load conditions plus stress rising from the defect with the most critical combination of type, location and orientation.
(ii) From its surface maximum, the macro stress field strongly decays in the vertical
direction for bending or torsional loads, while an axial load tends towards uniform stress throughout.
(iii) Laser clad defect types can be characterized as 0D-pores/inclusions, 1D-clad
waviness or 2D-planar defects. (iv) Semi-spherical pores at the clad-substrate interface or spheres in the clad layer
are the least critical; pores become increasingly critical if just below the surface or just intercepting it, strongly raising the stress the shorter this distance is;

46 Introduction Md. Minhaj Alam
towards side edges this surface impact contributes once more, which can cause the most critical combination.
(v) The notches from wavy as-laser clad surfaces raise the stress fields –
particularly for smaller notch radii and angles; a wavy clad-substrate interface is a very weak stress raiser; the clad orientation relative to the tensile stress is important.
(vi) Planar inner defects like lack-of-fusion or hot cracks can under load be
considered as propagating cracks; they accelerate vertically in both directions, but faster towards the surface; again the orientation angles are most critical normal to the tensile load, i.e. as vertical planes.
(vii) For maximum fatigue life of laser clad bars the above critical stress raiser
combinations have to be avoided.
Md. Minhaj Alam Introduction 47
8. General conclusions of the thesis From the papers in this thesis, beside their paper-specific conclusions, the following general conclusion can be drawn:
High speed imaging enables us to detect detailed and sometimes unexpected surface phenomena, for example the high-speed melt flow that controls the solidified weld or clad surface shape and thus its fatigue behaviour.
Using high speed imaging evidence about the surface melt flow, Computational Fluid Dynamics simulation of the melt pool flow can provide additional information on the flow field in the volume; this can be essential for understanding the solidification at the surface of the welding or cladding process.
Fatigue cracking of laser processed components is initiated from the maximum stress location - which depends on the macro load conditions plus stress concentration from the defect with the most critical combination of type, location and orientation. For welding the joint type and the weld surface shape are of particular importance while for laser cladding the location of defects is usually more essential.
Defect types from laser material processing can be characterized as (here so-called) 0D-pores/inclusions, 1D-waviness or 2D-planar defects.
Particularly for bending loads, certain areas can experience compressive stress and normally critical geometries and defects then become uncritical, as was shown for lack-of-fusion or for root notches.
Particularly for asymmetric loads like bending, the location and orientation of generated defects in the product determine whether they can initiate fatigue cracking; general criteria can be stated, e.g. for azimuthal pore positions.
Surface ripples or sharp root shapes can be critical shapes that initiate and even guide cracking.
Close-to-surface pores are critical stress raisers to initiate fatigue cracking.
The fatigue life of welded joints is greatly influenced by the competing stress raiser mechanism between toe radii, root radii, weld shape angle and throat depth (or weld penetration depth).
When comparing different joint types, often several short distances (here called anchor lengths) that confine the stress distribution need to be considered; moreover only the domains of the weld under tensile load are essential.
Internal defects like lack of fusion often have only a minimal impact on fatigue cracking; they often do not propagate but merely slightly deviate and accelerate cracking in their vicinity.
Illustrations of the phenomena and flow chart formulations are suitable new methods to generalize, visualize, compare and transfer new findings.

48 Introduction Md. Minhaj Alam
9. Future outlook Laser welding and cladding are advanced joining and coating technologies for which numerous research studies have already been carried out. However, stress analysis of laser welded and clad products are unsatisfactory. More and more complex products are being invented by designers, including the use of high strength metals, which requires proper investigation to achieve the desired mechanical strength. Thus some of the future outlook for this work is:
Three-dimensional analysis by CFD simulation of the hybrid laser arc welding process, including most of the parameters, to predict the weld shape formation.
Additional comparison with already studied weld joint types but improving the
weld geometry, by the aid of BFC and with different numerical analysis.
Numerical study of the Elastic Plastic Fracture Mechanics (EPFM) regime (typically below 105 cycles).
Improved understanding of the impact of microscopic surface details on fatigue
behaviour, particularly by three-dimensional fatigue analysis with a real 3D surface texture for complex joints.
Development of design rules for laser welding, laser hybrid arc welding and
laser cladding and thus standardised fatigue curves for different load situations.
Innovation of new techniques which correlate the laser welding and cladding process with the fatigue strength by means of controlling the defects for various geometries.
Isolated analysis of the interacting mechanisms contributing to the stress
formation in order to better judge the origins of stress raisers. Improved guidelines for the welding process parameters for how to avoid
critical weld quality details.
Improved understanding of the fatigue life of laser cladded components for different material combinations.
Standard SN-curves for specific material combinations of laser cladded
components.
Experimental and numerical analysis of residual stress of laser material processed components.
Converging knowledge by improved and more frequent use of standardised,
generally applicable documentation methods (like the BFC, TFC or illustrative methods) for gradually combining and generalising the findings
Md. Minhaj Alam Introduction 49
10. References
[1] V. Caccese, P.A. Blomquist, K.A. Berube, S.R. Webber, N.J. Orozco, Effect of weld geometric profile on fatigue life of cruciform welds made by laser/GMAW processes, Mar. Struct. 19 (2006) 1-22. [2] A. Hjörnhede, A. Nylund, Adhesion testing of thermally sprayed and laser deposited coatings, Surf. Coat. Technol. 184 (2004) 208-218. [3] E. Toyserkani, S. Corbin, A. Khajepour. Laser Cladding. CRC Press (2005). [4] W. W. Duley, Laser welding, New York Wiley, ISBN 0.471-24679-4 (1999). [5] X. Jin, P. Berger, Th. Graf, Multiple reflections and Fresnel absorption in an actual 3D keyhole during deep penetration laser welding, J. Phys. D: Appl. Phys. 39 (2006) 4703-4712. [6] A.F.H. Kaplan, A model of deep penetration laser welding based on calculation of the keyhole profile, J. Phys. D: Appl. Phys. 27 (1994) 1805-1814. [7] U. Dilthey, H. Keller, A. Ghandahari, Laser beam welding with filler metal, Steel Research 70 (1999) 198-202. [8] J. Matsuda, A. Utsumi, M. Hamasaki, S. Nagata, TIG or MIG arc augmented laser welding of thick mild steel plate, Join. Mater. 1 (1988) 31-34. [9] J. Alexander, W. M. Steen, Arc augmented laser welding-process variables, structure and properties, The Joining of Metals: Practice and Performance (2000) 155-160. [10] W.M. Steen, M. Eboo, Arc augmented laser welding, Metal Construction, 21 (1979) 332-335. [11] N. Abe, Y. Agamo, M. Tsukamoto, T. Makino, M. Hayashi, T. Kurosawa, High speed welding of thick plates using a laser-arc combination system, Transactions of JWRI 26 (1997) 69 -75. [12] C. Bagger, F. Olsen, Review of laser hybrid welding, J. Laser. Appl. 17 (2005)
2-14. [13] K.H. Magee, V. E. Merchant, C. V. Hyatt, Laser assisted gas metal arc weld characteristics, Proceedings of the Laser Materials Processing-ICALEO 90, Nov 4-9 1990, Boston, MA, USA, LIA (Laser Institute of America), v 71 (1991).
50 Introduction Md. Minhaj Alam
[14] F. Vollertsen, K. Partes, J. Meijer, State of the art of Laser Hardening and Cladding, Proceedings of the Third International WLT-Conference on Lasers in Manufacturing, Munich (2005). [15] M. Zhong, W. Liu, Laser surface cladding: the state of the art and challenges, Proc. IMechE Part C: J. Mech. Eng. Sci. 224 (2010) 1041-1060. [16] www.thefabricator.com [17] J. Powell, P.S. Henry, W.W. Steen, Laser cladding with preplaced powder: Analysis of thermal cycling and dilution effects, Surf. Eng. 4 (1988) 141-149. [18] J.M. Yellup, Laser cladding using the powder blowing technique, Surf. Coat. Tech. 71 (1995) 121-128. [19] J.D. Kim, Y. Peng, Melt pool shape and dilution of laser cladding with wire feeding, J. Mater. Process. Techn. 104 (2000) 284-293. [20] E. Lugscheider, H. Bolender, H. Krappitz, Laser cladding of paste bound hardfacing alloys, Surf. Eng. 7 (1991) 341-344. [21] C. Miki, K. Homma, T. Tominaga, High strength and high performance steels and their use in bridge structures, J. Constr. Steel Res. 58 (2002) 3-20. [22] R. Bjorhovde, Development and use of high performance steel, J. Constr. Steel Res. 60 (2004) 393-400. [23] T. Dahle, Design fatigue strength of TIG-dressed welded joints in high-strength steels subjected to spectrum loading, Int. J. Fatig. 20 (1998) 677-681. [24] K. J. Kirkhope, R. Bell, L. Caron, R. I. Basu, K. T. Ma, Weld detail fatigue life improvement techniques, Part 1: Review, Mar. Struct. 2 (1999) 447-474. [25] K. J. Kirkhope, R. Bell, L. Caron, R. I. Basu, K. T. Ma, Weld detail fatigue life improvement techniques, Part 2: Application to ship structures, Mar. Struct. 12 (1999) 477-496. [26] Z. Xiulin, L. Baotong, C. Tianxie, L. Xiaoyan, L. Chao, Fatigue tests and life
prediction of 16 Mn steel butt welds without crack-like defect, Int. J. Frac. 68 (1994) 275-85.
[27] C.Y. Hou, Fatigue analysis of welded joints with the aid of real three- dimensional weld toe geometry, Int. J. Fatig. 29 (2007) 772-785. [28] M.D. Chapetti, J.L. Otegui, Importance of toe irregularity for fatigue resistance of automatic welds, Int. J. Fatig. 17 (1995) 531-538.
Md. Minhaj Alam Introduction 51
[29] F. Ellyin, Fatigue damage, crack growth and life prediction, ISBN 0-412-59600 8 (1996). [30] G. Pettersson, Fatigue assessment of welded structures with non-linear boundary conditions, Licentiate Thesis, Dept. of Aeronautical and Vehicle Engineering, KTH, Sweden, ISBN 91-7283-948-1 (2004). [31] D. Radaj, Design and analysis of fatigue resistant welded structures, Abington Publishing, ISBN 1 85573 004 9 (1990). [32] J. Samuelsson, Fatigue design of vehicle components: Methodology and applications, report 88-23, Dep. Of Aeronautical Structures and Materials, The Royal Institute of Technology, Stockholm (1998). [33] R. LeVeque, Finite Volume Methods for Hyperbolic Problems, Cambridge University Press (2002). [34] E.F. Toro, Riemann Solvers and Numerical Methods for Fluid Dynamics,
Springer-Verlag (1999). [35] M. Geiger, K.-H. Leitz, H. Koch, A. Otto, A 3D transient model of keyhole and melt pool dynamics in laser beam welding applied to the joining of zinc coated sheets, Prod. Eng. Res. Dev. 3 (2009) 27-136. [36] C. W. Hirt, B. D. Nichols, Volume of fluid (VOF) method for the dynamics of free boundaries, J. Comput. Phys. 39 (1981) 201-225. [37] J. U. Brackbill, D. B. Kothe, C. A. Zemach, A continuum method for modeling surface tension, J. Comput. Phys. 100 (1992) 335-354. [38] FLUENT User’s Guide, FLUENT Inc. (2011). [39] E. Madenci, I. Guven, The finite element method and applications in Engineering using ANSYS (2006) ISBN 0-387-28289-0. [40] H. Remes, Strain-based approach to fatigue strength assessment of laser- welded joints, Doctoral dissertation, Department of Mechanical Engineering, Ship Laboratory, Helsinki University of Technology (2008). [41] C.F. Shih, H.G. Lorenzi, M.D. German, Crack extension modeling with singular quadratic isoparametric elements, Int. J. Fract. 12 (1976) 647-651. [42] M.A. Abdulnaser, A.A. Kamal, Finite element simulation of stress intensity
factors in elastic-plastic crack growth, J. of Zhejiang University Science A, 7 (2006) 1336-1342.
52 Introduction Md. Minhaj Alam
[43] B.D. Fehl, K.Z. Truman, An evaluation of fracture mechanics quarter-point displacement techniques used for computing stress intensity factors, Eng Struct. 21 (1999) 406-415. [44] T.L. Anderson, Fracture Mechanics: Fundamentals and Applications, 2nd ed. Boca Raton (1994). [45] G.P. Nikishkov, S.N. Atluri, Calculation of fracture mechanics parameters for an arbitrary three-dimensional crack by the equivalent domain integral method, Int. J. Numer. Meth. Eng. 24 (1987) 1801-1821. [46] I.S. Raju, Calculation of strain-energy release rates with higher order and singular finite elements, Eng. Fract. Mech. 28 (1987) 251-274. [47] E.F. Rybicki, M.F. Kanninen, A finite element calculation of stress-intensity factors by a modified crack closure integral, Eng. Fract. Mech. 9 (1977) 931-938. [48] A. Scialpi, L.A.C. de Filippis, P. Cavaliere, Influence of shoulder geometry on microstructure and mechanical properties of friction stir welded 6082 aluminium alloy, Mater. Des. 28 (2007) 1124-1129. [49] Z. Xiang, S.T. Lie, B. Wang, Z. Cen, A simulation of fatigue crack propagation in a welded T-joint using 3D boundary element method, Int. J. Press. Ves. Pip. 80 (2003) 111-120. [50] S. Glodez, M. Sraml, J. Kramberger, A computational model for determination of service life of gears, Int. J. Fatig. 24 (2002) 1013-1020. [51] T.N. Bittencourt, P.A. Wawrzynek, A.R. Ingraffea, J.L. Sousa, Quasi automatic
simulation of crack propagation for 2D LEFM problems, Eng. Fract. Mech. 55 (1996) 321–334.
[52] X. Yan, Automated simulation of fatigue crack propagation for two-dimensional linear elastic fracture mechanics problems by boundary element method, Eng. Fract. Mech. 74 (2007) 2639-2641. [53] F. Erdogan, G.C. Sih, On the crack extension in plates under plane loading and transverse shear, ASME J. Basic. Eng. 85 (1963) 519-527. [54] M.A. Hussain, S.U. Pu, J. Underwood, Strain energy release rate for a crack under combined mode I and II, ASTM STP. 560 (1974) 2-28. [55] G.C. Sih, Strain-energy-density factor applied to mixed mode crack problems. Int. J. Fract. Mech. 10 (1974) 305-321.

Md. Minhaj Alam Introduction 53
[56] A. Ural, G. Heber, P.A. Wawrzynek, A.R. Ingraffea, D.G. Lewicki, J.B.C Neto, Three dimensional parallel finite element simulation of fatigue crack growth in a spiral bevel pinion gear, Eng. Fract. Mech. 72 (2005) 1148-1170. [57] C.A. Rogers, G.J. Hancock, Fracture toughness of G550 sheet steels subjected to tension, J. Constr. Steel Res. 57 (2001) 71-89. [58] M. Fulland, M. Sander, G. Kullmer, H.A. Richard, Analysis of fatigue crack propagation in the frame of a hydraulic press, Eng. Fract. Mech. 75 (2008) 892- 900.

54 Introduction Md. Minhaj Alam
Md. Minhaj Alam Review Paper i: Fracture & Fatigue of Welds 55
ANNEX A Review Paper i FATIGUE BEHAVIOUR STUDY OF LASER HYBRID WELDED ECCENTRIC FILLET JOINTS – PART II: STATE-OF-THE-ART OF FRACTURE MECHANICS AND FATIGUE ANALYSIS OF WELDED JOINTS M. M. Alam, A. F. H. Kaplan, P. Jonsén Proceedings of NOLAMP 12 Conference, Copenhagen, Denmark, 24-26 August 2009

56 Review Paper i: Fracture & Fatigue of Welds Md. Minhaj Alam
Md. Minhaj Alam Review Paper i: Fracture & Fatigue of Welds 57
FATIGUE BEHAVIOUR STUDY OF LASER HYBRID WELDED ECCENTRIC FILLET JOINTS – PART II: STATE-OF-THE-ART OF FRACTURE MECHANICS AND FATIGUE ANALYSIS OF WELDED JOINTS. M. M. Alam, A. F. H. Kaplan, P. Jonsén
1) Luleå University of Technology, Dept. of Applied Physics and Mechanical Engineering, Sweden, www.ltu.se/tfm/produktion
ABSTRACT
Simplified fatigue and fracture mechanics based assessment methods are widely used by the industry to determine the structural integrity significance of postulated cracks, manufacturing flaws, service-induced cracking or suspected degradation of engineering components under normal and abnormal service loads. In many cases, welded joints are the regions most likely to contain original fabrication defects or cracks initiating and growing during service operation. The welded joints are a major component that is often blamed for causing a structure failure or for being the point at which fatigue or fracture problems initiate and propagate. Various mathematical models/techniques for various classes of welded joints are developed by analytically or by simulation software’s that can be used in fatigue and fracture assessments. This literature survey compiled useful information on fracture and fatigue analysis of various welded joints. The present review is divided into two major sections- fracture mechanics and fatigue analysis with widely used models. A survey table is also introduced to get the outlook of research trend on fatigue and fracture over last 3 decades. Although tremendous research effort has been implemented on fatigue and fracture analysis of conventional welding, research on relatively new welding technology (laser welding, hybrid laser welding) is still limited and unsatisfactory. In order to give guarantee or make welding standard for new welding technology, further research is required in the field of fatigue and fracture mechanics including FEM and multi-scale modeling. Keywords: Fracture mechanics, fatigue, welded joints, welding standards, FEM, multi-scale modeling. 1. INTRODUCTION This paper is a literature survey which compiled useful information regarding fracture and fatigue analysis of various welded joints. The main objective was on to analyze fracture mechanics and fatigue life prediction on hybrid laser welded joints. Since hybrid laser welding is a new technology and very few researches have been done on this area, this literature survey has to restrict on conventional welding process from where fracture and fatigue analysis are shortly presented. Around 550 publications are illustrated in [1].
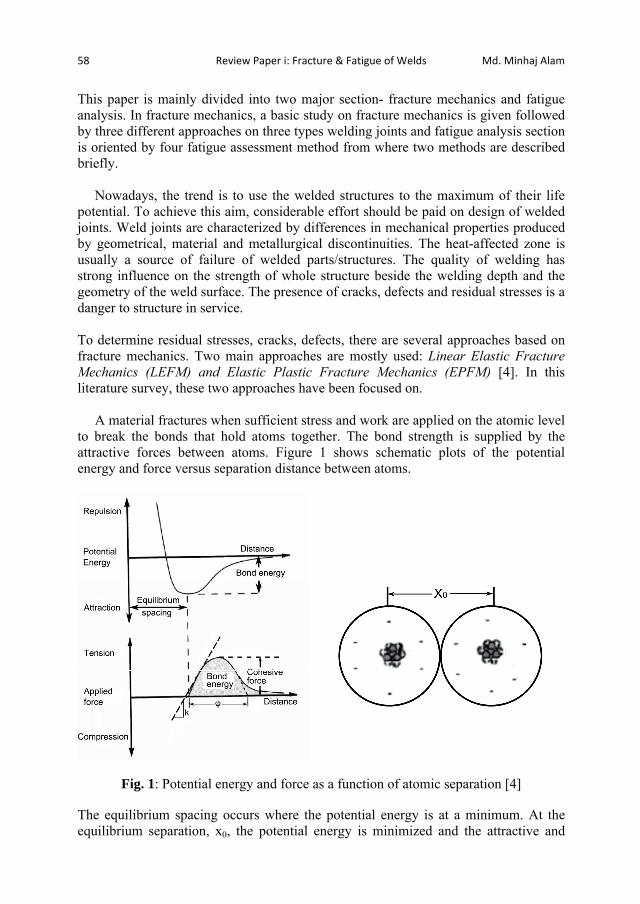
58 Review Paper i: Fracture & Fatigue of Welds Md. Minhaj Alam
This paper is mainly divided into two major section- fracture mechanics and fatigue analysis. In fracture mechanics, a basic study on fracture mechanics is given followed by three different approaches on three types welding joints and fatigue analysis section is oriented by four fatigue assessment method from where two methods are described briefly. Nowadays, the trend is to use the welded structures to the maximum of their life potential. To achieve this aim, considerable effort should be paid on design of welded joints. Weld joints are characterized by differences in mechanical properties produced by geometrical, material and metallurgical discontinuities. The heat-affected zone is usually a source of failure of welded parts/structures. The quality of welding has strong influence on the strength of whole structure beside the welding depth and the geometry of the weld surface. The presence of cracks, defects and residual stresses is a danger to structure in service. To determine residual stresses, cracks, defects, there are several approaches based on fracture mechanics. Two main approaches are mostly used: Linear Elastic Fracture Mechanics (LEFM) and Elastic Plastic Fracture Mechanics (EPFM) [4]. In this literature survey, these two approaches have been focused on. A material fractures when sufficient stress and work are applied on the atomic level to break the bonds that hold atoms together. The bond strength is supplied by the attractive forces between atoms. Figure 1 shows schematic plots of the potential energy and force versus separation distance between atoms.
Fig. 1: Potential energy and force as a function of atomic separation [4]
The equilibrium spacing occurs where the potential energy is at a minimum. At the equilibrium separation, x0, the potential energy is minimized and the attractive and
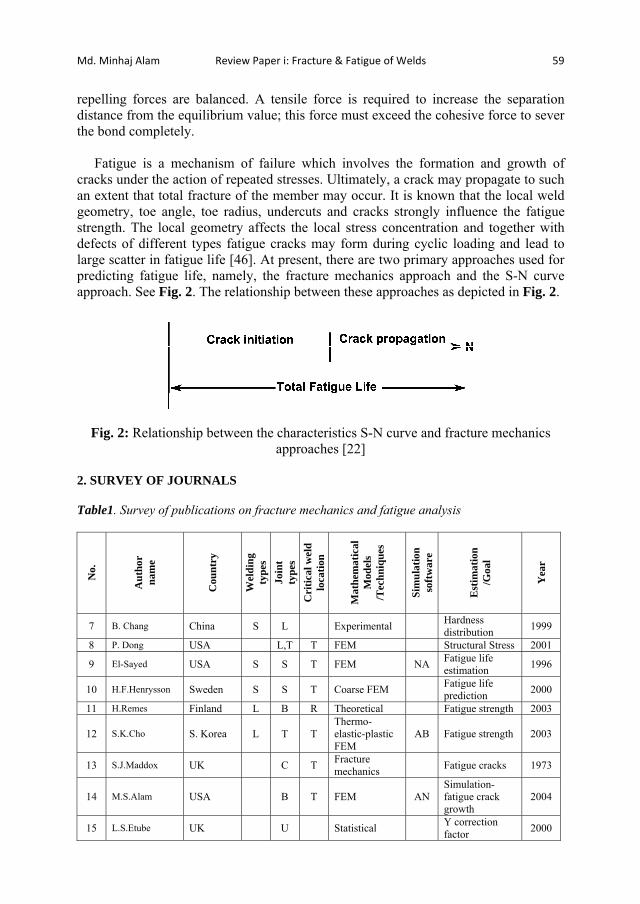
Md. Minhaj Alam Review Paper i: Fracture & Fatigue of Welds 59
repelling forces are balanced. A tensile force is required to increase the separation distance from the equilibrium value; this force must exceed the cohesive force to sever the bond completely. Fatigue is a mechanism of failure which involves the formation and growth of cracks under the action of repeated stresses. Ultimately, a crack may propagate to such an extent that total fracture of the member may occur. It is known that the local weld geometry, toe angle, toe radius, undercuts and cracks strongly influence the fatigue strength. The local geometry affects the local stress concentration and together with defects of different types fatigue cracks may form during cyclic loading and lead to large scatter in fatigue life [46]. At present, there are two primary approaches used for predicting fatigue life, namely, the fracture mechanics approach and the S-N curve approach. See Fig. 2. The relationship between these approaches as depicted in Fig. 2.
Fig. 2: Relationship between the characteristics S-N curve and fracture mechanics approaches [22]
2. SURVEY OF JOURNALS Table1. Survey of publications on fracture mechanics and fatigue analysis
No.
Aut
hor
nam
e
Cou
ntry
Wel
ding
ty
pes
Join
t ty
pes
Cri
tical
wel
d lo
catio
n
Mat
hem
atic
al
Mod
els
/Tec
hniq
ues
Sim
ulat
ion
softw
are
Est
imat
ion
/Goa
l
Yea
r
7 B. Chang China S L Experimental Hardness distribution 1999
8 P. Dong USA L,T T FEM Structural Stress 2001
9 El-Sayed USA S S T FEM NA Fatigue life estimation 1996
10 H.F.Henrysson Sweden S S T Coarse FEM Fatigue life prediction 2000
11 H.Remes Finland L B R Theoretical Fatigue strength 2003
12 S.K.Cho S. Korea L T T Thermo-elastic-plastic FEM
AB Fatigue strength 2003
13 S.J.Maddox UK C T Fracture mechanics Fatigue cracks 1973
14 M.S.Alam USA B T FEM AN Simulation-fatigue crack growth
2004
15 L.S.Etube UK U Statistical Y correction factor 2000
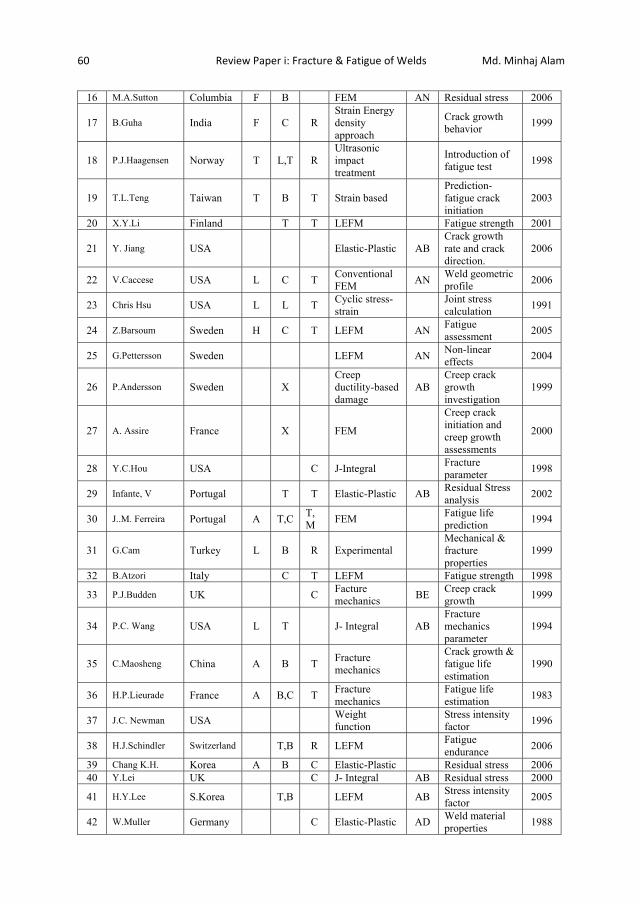
60 Review Paper i: Fracture & Fatigue of Welds Md. Minhaj Alam
16 M.A.Sutton Columbia F B FEM AN Residual stress 2006
17 B.Guha India F C R Strain Energy density approach
Crack growth behavior 1999
18 P.J.Haagensen Norway T L,T R Ultrasonic impact treatment
Introduction of fatigue test 1998
19 T.L.Teng Taiwan T B T Strain based Prediction-fatigue crack initiation
2003
20 X.Y.Li Finland T T LEFM Fatigue strength 2001
21 Y. Jiang USA Elastic-Plastic AB Crack growth rate and crack direction.
2006
22 V.Caccese USA L C T Conventional FEM AN Weld geometric
profile 2006
23 Chris Hsu USA L L T Cyclic stress-strain Joint stress
calculation 1991
24 Z.Barsoum Sweden H C T LEFM AN Fatigue assessment 2005
25 G.Pettersson Sweden LEFM AN Non-linear effects 2004
26 P.Andersson Sweden X Creep ductility-based damage
AB Creep crack growth investigation
1999
27 A. Assire France X FEM
Creep crack initiation and creep growth assessments
2000
28 Y.C.Hou USA C J-Integral Fracture parameter 1998
29 Infante, V Portugal T T Elastic-Plastic AB Residual Stress analysis 2002
30 J..M. Ferreira Portugal A T,C T, M FEM Fatigue life
prediction 1994
31 G.Cam Turkey L B R Experimental Mechanical & fracture properties
1999
32 B.Atzori Italy C T LEFM Fatigue strength 1998
33 P.J.Budden UK C Facture mechanics BE Creep crack
growth 1999
34 P.C. Wang USA L T J- Integral AB Fracture mechanics parameter
1994
35 C.Maosheng China A B T Fracture mechanics
Crack growth & fatigue life estimation
1990
36 H.P.Lieurade France A B,C T Fracture mechanics Fatigue life
estimation 1983
37 J.C. Newman USA Weight function Stress intensity
factor 1996
38 H.J.Schindler Switzerland T,B R LEFM Fatigue endurance 2006
39 Chang K.H. Korea A B C Elastic-Plastic Residual stress 2006 40 Y.Lei UK C J- Integral AB Residual stress 2000
41 H.Y.Lee S.Korea T,B LEFM AB Stress intensity factor 2005
42 W.Muller Germany C Elastic-Plastic AD Weld material properties 1988
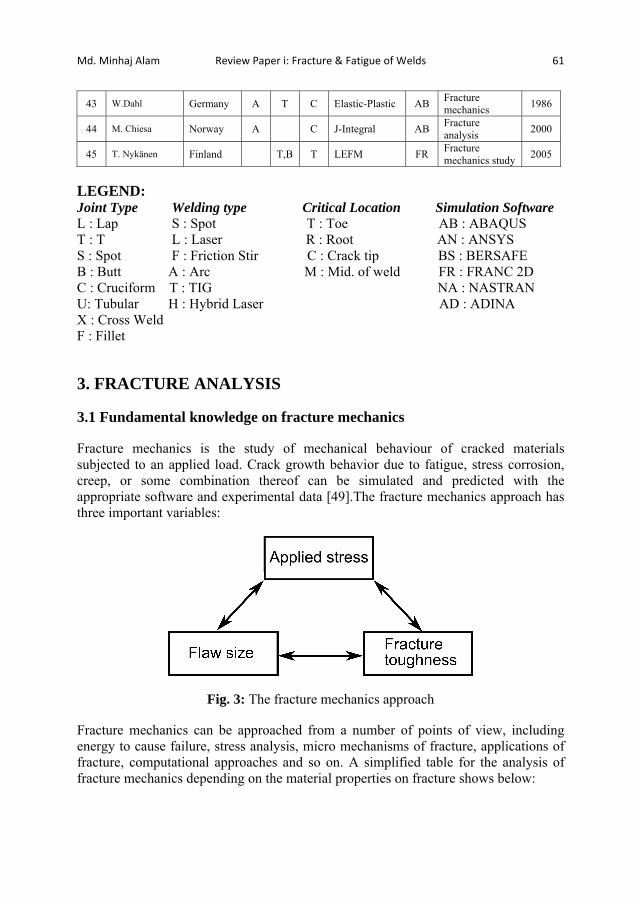
Md. Minhaj Alam Review Paper i: Fracture & Fatigue of Welds 61
43 W.Dahl Germany A T C Elastic-Plastic AB Fracture mechanics 1986
44 M. Chiesa Norway A C J-Integral AB Fracture analysis 2000
45 T. Nykänen Finland T,B T LEFM FR Fracture mechanics study 2005
LEGEND: Joint Type Welding type Critical Location Simulation Software L : Lap S : Spot T : Toe AB : ABAQUS T : T L : Laser R : Root AN : ANSYS S : Spot F : Friction Stir C : Crack tip BS : BERSAFE B : Butt A : Arc M : Mid. of weld FR : FRANC 2D C : Cruciform T : TIG NA : NASTRAN U: Tubular H : Hybrid Laser AD : ADINA X : Cross Weld F : Fillet 3. FRACTURE ANALYSIS 3.1 Fundamental knowledge on fracture mechanics Fracture mechanics is the study of mechanical behaviour of cracked materials subjected to an applied load. Crack growth behavior due to fatigue, stress corrosion, creep, or some combination thereof can be simulated and predicted with the appropriate software and experimental data [49].The fracture mechanics approach has three important variables:
Fig. 3: The fracture mechanics approach Fracture mechanics can be approached from a number of points of view, including energy to cause failure, stress analysis, micro mechanisms of fracture, applications of fracture, computational approaches and so on. A simplified table for the analysis of fracture mechanics depending on the material properties on fracture shows below:

62 Review Paper i: Fracture & Fatigue of Welds Md. Minhaj Alam
Table 2: Simplified table for the field of fracture mechanics [2]
Category Material Property
Parameter Effective Regime
Linear Elastic Fracture Mechanics
(LEFM)
Linear, time-
independent
Stress intensity factor(K),
Energy release rate(G)
Elastic Plastic Fracture Mechanics
Non-linear, time-
independent
J- Integral, Crack tip opening
displacement (CTOD) 3.1.1. Linear elastic fracture mechanics
Linear Elastic Fracture Mechanics (LEFM) first assumes that the material is isotropic and linear elastic. Based on the assumption, the stress field near the crack tip is calculated using the theory of elasticity. When the stresses near the crack tip exceed the material fracture toughness, the crack will grow.
THE GRIFFITH ENERGY BALANCE
According to the First Law of Thermodynamics, when a system goes from a non equilibrium state to equilibrium, there will be a net decrease in energy. In 1920 Griffith applied this idea to the formation of a crack. Griffith observed that the strain energy in a body is partly released by the propagation of a crack. At the same time, new surfaces are created in the body, which are associated with a certain surface energy, which in turn is characteristic for a material. According to Griffith, a necessary condition for failure is that the released strain energy, corresponding to a certain crack growth, is greater than the consumed surface energy. Griffith considered a plane plate of a linear elastic material with a through-thickness crack of length 2a, Fig. 4. The in-plane dimensions of the plate are much larger than the length of the crack and in the theory the plate is assumed to be infinite. The boundary of the plate is subjected to a constant and uni-axial stress perpendicular to the plane of the crack.
Fig. 4: The Griffith crack [4]

Md. Minhaj Alam Review Paper i: Fracture & Fatigue of Welds 63
From the stress state in a plate with an elliptic hole (Inglis, 1913), Griffith determined the elastic strain energy U (a) as a function of crack length for a plate with crack:
EaUaU
22
0)( (1)
Where U0 is the strain energy in the plate without regard to the crack, the nominal stress in the crack plane and E is Young’s modulus.
Through crack growth, material close to the newly formed crack surfaces is unloaded and the corresponding elastic energy released. The energy released per unit length of crack growth at a crack tip, or the crack extension force G, is:
Ea
daadUG
22)( (2)
In the crack propagation process, energy is required to create new crack surfaces and for plastic deformation and other dissipative processes adjacent to the new surfaces. The energy required per unit crack length is called the critical crack extension force Gc
The condition for fracture is then G = Gc
i.e. fracture occurs at a critical value of the crack extension force.
Thus it can be concluded that failure occurs when the stress, crack length and critical crack extension force are related as follows:
EaG cc
c
2 (3)
Here c is the nominal, or critical, stress at fracture and ac the critical crack length.
STRESS INTENSITY FACTOR
While the energy-balance approach provides a great deal of insight to the fracture process, an alternative method that examines the stress state near the tip of a sharp crack directly has proven more useful in engineering practice. A plane plate with a crack can in the general case be loaded in three different ways, in accordance to the nominal stress components yy, xy and yz in the plane of the plate. Fig. 5 is shown the stress components and the orientation of the coordinates and of the crack. The plane of the crack is situated in the xz-plane and the crack front is along the z-axis.
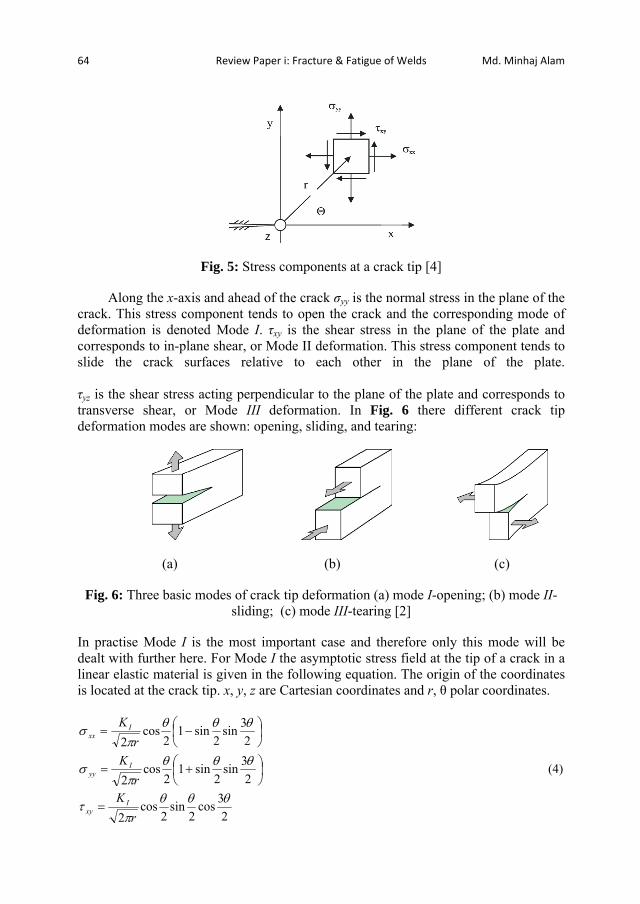
64 Review Paper i: Fracture & Fatigue of Welds Md. Minhaj Alam
Fig. 5: Stress components at a crack tip [4]
Along the x-axis and ahead of the crack yy is the normal stress in the plane of the crack. This stress component tends to open the crack and the corresponding mode of deformation is denoted Mode I. xy is the shear stress in the plane of the plate and corresponds to in-plane shear, or Mode II deformation. This stress component tends to slide the crack surfaces relative to each other in the plane of the plate.
yz is the shear stress acting perpendicular to the plane of the plate and corresponds to transverse shear, or Mode III deformation. In Fig. 6 there different crack tip deformation modes are shown: opening, sliding, and tearing:
(a) (b) (c)
Fig. 6: Three basic modes of crack tip deformation (a) mode I-opening; (b) mode II-sliding; (c) mode III-tearing [2]
In practise Mode I is the most important case and therefore only this mode will be dealt with further here. For Mode I the asymptotic stress field at the tip of a crack in a linear elastic material is given in the following equation. The origin of the coordinates is located at the crack tip. x, y, z are Cartesian coordinates and r, polar coordinates.
23cos
2sin
2cos
2
23sin
2sin1
2cos
2
23sin
2sin1
2cos
2
rK
rK
rK
Ixy
Iyy
Ixx
(4)
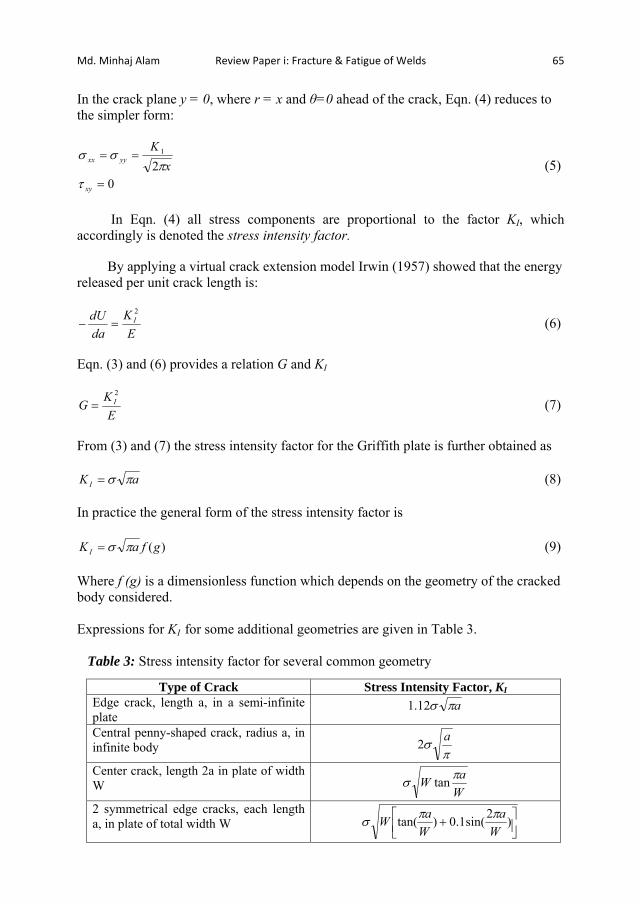
Md. Minhaj Alam Review Paper i: Fracture & Fatigue of Welds 65
In the crack plane y = 0, where r = x and =0 ahead of the crack, Eqn. (4) reduces to the simpler form:
02
1
xy
yyxx xK
(5)
In Eqn. (4) all stress components are proportional to the factor KI, which accordingly is denoted the stress intensity factor.
By applying a virtual crack extension model Irwin (1957) showed that the energy released per unit crack length is:
EK
dadU I
2
(6)
Eqn. (3) and (6) provides a relation G and KI
EKG I
2
(7)
From (3) and (7) the stress intensity factor for the Griffith plate is further obtained as
aK I (8)
In practice the general form of the stress intensity factor is
)(gfaK I (9) Where f (g) is a dimensionless function which depends on the geometry of the cracked body considered. Expressions for KI for some additional geometries are given in Table 3. Table 3: Stress intensity factor for several common geometry
Type of Crack Stress Intensity Factor, KI Edge crack, length a, in a semi-infinite plate
a12.1
Central penny-shaped crack, radius a, in infinite body
a2
Center crack, length 2a in plate of width W W
aW tan
2 symmetrical edge cracks, each length a, in plate of total width W )2sin(1.0)tan(
Wa
WaW
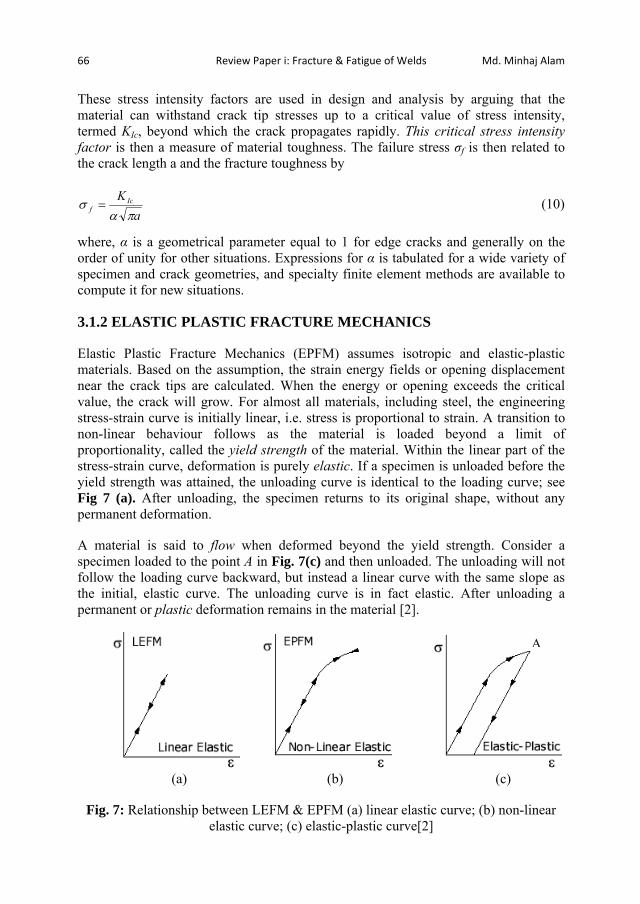
66 Review Paper i: Fracture & Fatigue of Welds Md. Minhaj Alam
These stress intensity factors are used in design and analysis by arguing that the material can withstand crack tip stresses up to a critical value of stress intensity, termed KIc, beyond which the crack propagates rapidly. This critical stress intensity factor is then a measure of material toughness. The failure stress f is then related to the crack length a and the fracture toughness by
aK Ic
f (10)
where, is a geometrical parameter equal to 1 for edge cracks and generally on the order of unity for other situations. Expressions for is tabulated for a wide variety of specimen and crack geometries, and specialty finite element methods are available to compute it for new situations.
3.1.2 ELASTIC PLASTIC FRACTURE MECHANICS
Elastic Plastic Fracture Mechanics (EPFM) assumes isotropic and elastic-plastic materials. Based on the assumption, the strain energy fields or opening displacement near the crack tips are calculated. When the energy or opening exceeds the critical value, the crack will grow. For almost all materials, including steel, the engineering stress-strain curve is initially linear, i.e. stress is proportional to strain. A transition to non-linear behaviour follows as the material is loaded beyond a limit of proportionality, called the yield strength of the material. Within the linear part of the stress-strain curve, deformation is purely elastic. If a specimen is unloaded before the yield strength was attained, the unloading curve is identical to the loading curve; see Fig 7 (a). After unloading, the specimen returns to its original shape, without any permanent deformation.
A material is said to flow when deformed beyond the yield strength. Consider a specimen loaded to the point A in Fig. 7(c) and then unloaded. The unloading will not follow the loading curve backward, but instead a linear curve with the same slope as the initial, elastic curve. The unloading curve is in fact elastic. After unloading a permanent or plastic deformation remains in the material [2].
(a) (b) (c)
Fig. 7: Relationship between LEFM & EPFM (a) linear elastic curve; (b) non-linear elastic curve; (c) elastic-plastic curve[2]
A
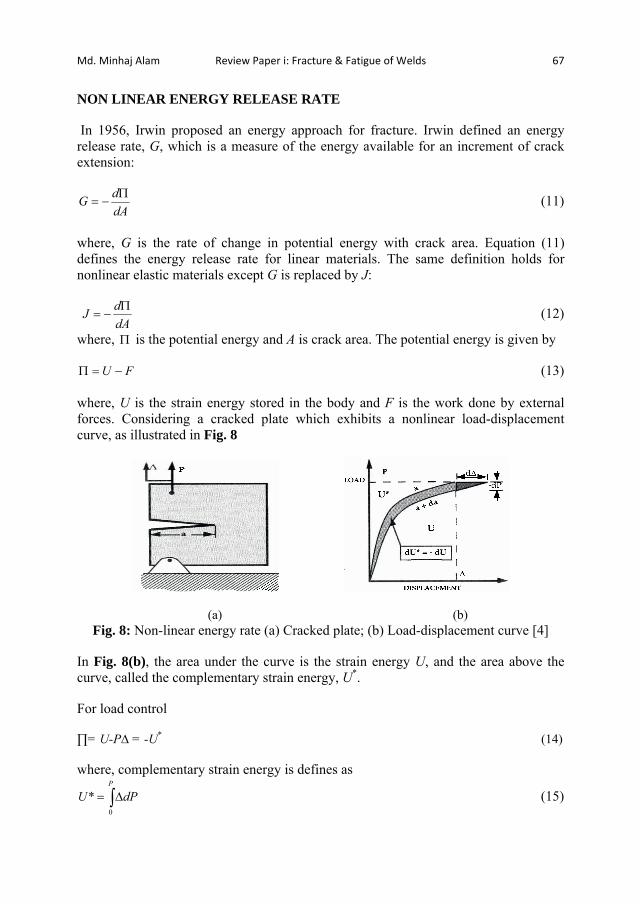
Md. Minhaj Alam Review Paper i: Fracture & Fatigue of Welds 67
NON LINEAR ENERGY RELEASE RATE
In 1956, Irwin proposed an energy approach for fracture. Irwin defined an energy release rate, G, which is a measure of the energy available for an increment of crack extension:
dAdG (11)
where, G is the rate of change in potential energy with crack area. Equation (11) defines the energy release rate for linear materials. The same definition holds for nonlinear elastic materials except G is replaced by J:
dAdJ (12)
where, is the potential energy and A is crack area. The potential energy is given by
FU (13) where, U is the strain energy stored in the body and F is the work done by external forces. Considering a cracked plate which exhibits a nonlinear load-displacement curve, as illustrated in Fig. 8
(a) (b) Fig. 8: Non-linear energy rate (a) Cracked plate; (b) Load-displacement curve [4]
In Fig. 8(b), the area under the curve is the strain energy U, and the area above the curve, called the complementary strain energy, U*.
For load control
= U-P = -U* (14) where, complementary strain energy is defines as
P
dPU0
* (15)

68 Review Paper i: Fracture & Fatigue of Welds Md. Minhaj Alam
Thus, if the plate in Fig. 8 (a) is in load control, J is given by
PdadUJ
*
(16)
If the crack advances at a fixed displacement, F=0 and J is given by
dadUJ
*
(17)
According to Fig. 8, dU* for load control differs from –dU for displacement control by
the amount dPd21 , which vanishingly small compared to dU. Therefore, J for load
control is equal to J for displacement control.
J INTEGRAL
For a two-dimensional body of area, A, with surface traction, Ti prescribed over a portion of the bounding surface, , the potential energy of the body is given by
dsuTWdA iA
i (18)
By differentiating Eqn. 18
J= dsdadu
TB
dAdadW
BdAd i
iA
11 (19)
After some manipulations, this equation can be written in the form
dsxuTWdyJ i
i (20)
where, is arbitrary counter-clockwise path around crack tip as illustrated in Fig. 9. W= ijij d is the strain energy density where ij is the stress tensor and ij the strain tensor, Ti = ijnj is the stress vector where nj is positive outward unit normal and ui the displacement vector and ds an increment of the length along the path.
J can be evaluated on an arbitrary contour around a crack tip. Because of the property of path independence of the integral, it always yields the same value for any path enclosing the crack tip. Thus J is called a path-independent integral.

Md. Minhaj Alam Review Paper i: Fracture & Fatigue of Welds 69
Fig. 9: Arbitrary contour around the tip of a crack [4]
3.2 WELDED JOINTS ANALYSIS ON FRACTURE MECHANICS 3.2.1 T-JOINTS (Stress Intensity approach) In service cracks may form at the weld toe due to the stress concentration there. Such cracks tend to be along the line A-A in Fig. 10, i.e. normal to the transverse stress. A fracture assessment for such a crack will generally require the linear elastic stress intensity factor, K, due to the weld residual stress and any additional primary (mechanical) loading [3].
Fig. 10: Geometry of T-plate weld [3] The stress intensity factors for the cracked T-plate have been calculated using linear superposition.

70 Review Paper i: Fracture & Fatigue of Welds Md. Minhaj Alam
K(i) = K(ii) = 0 - K(iii)
Fig. 11: Superposition method to determine stress intensity factor [4]
As illustrated in Fig. 11, to determine the value of K only the stress distribution over the crack face is required, i.e., K(i)= -K(iii). For the current problem, the crack face loading is simply the measured (or approximated) residual stress at the weld toe. The approach taken here is analogous to the weight function method, except for the fact that the K value from the crack face loading is obtained directly using a finite element analysis, rather than by using a weight function. FEM Simulation A typical finite element mesh, which contains 13,000 plane strain four nodded elements, is illustrated in Fig. 12.
Fig. 12: Finite element mesh used in stress intensity factor calculation [3] The (un-cracked) T-plate is assumed symmetric with weld angle, = 80°. A crack of length, a, is included at the right hand weld toe, as indicated in the inset to Fig. 12, thus losing the symmetry of the problem. Because of the very dense mesh near the weld toe the element boundaries are not visible in this region of the figure. The smallest element size is 0.03 mm. The fracture mechanics parameters J and K can be calculated from any FEM software. J is calculated using a standard domain integral implementation and K is obtained using an interaction integral approach. The advantage of the latter approach is that for mixed mode problems, both the mode I and mode II intensity factors, KI and KII, respectively, are calculated. For a mode I linear elastic problem K=KI can be evaluated from J using the relationship (for plane strain),
21 vJEK (21)
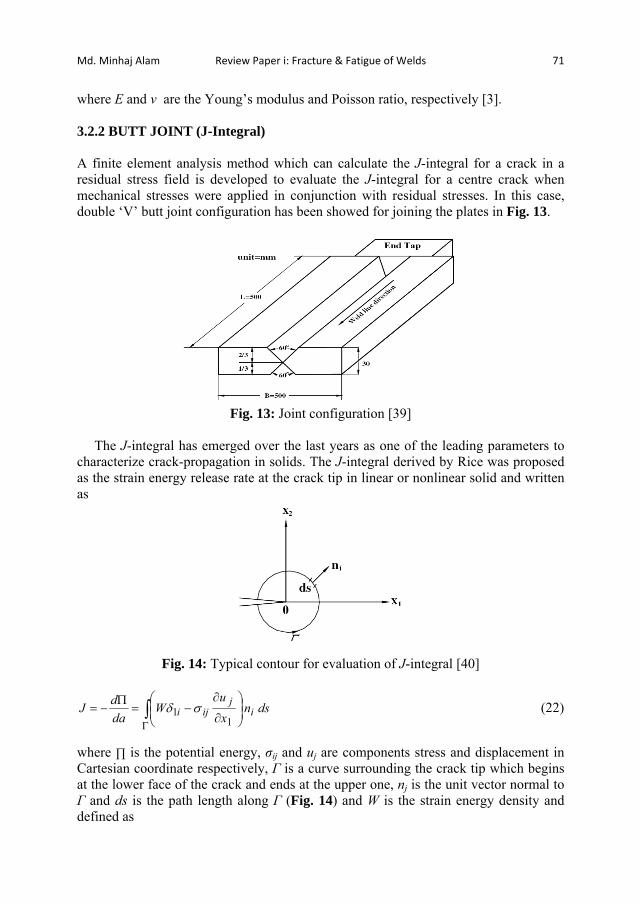
Md. Minhaj Alam Review Paper i: Fracture & Fatigue of Welds 71
where E and v are the Young’s modulus and Poisson ratio, respectively [3]. 3.2.2 BUTT JOINT (J-Integral) A finite element analysis method which can calculate the J-integral for a crack in a residual stress field is developed to evaluate the J-integral for a centre crack when mechanical stresses were applied in conjunction with residual stresses. In this case, double ‘V’ butt joint configuration has been showed for joining the plates in Fig. 13.
Fig. 13: Joint configuration [39]
The J-integral has emerged over the last years as one of the leading parameters to characterize crack-propagation in solids. The J-integral derived by Rice was proposed as the strain energy release rate at the crack tip in linear or nonlinear solid and written as
Fig. 14: Typical contour for evaluation of J-integral [40]
ds n xu
WdadJ i
jiji
11 (22)
where is the potential energy, ij and uj are components stress and displacement in Cartesian coordinate respectively, is a curve surrounding the crack tip which begins at the lower face of the crack and ends at the upper one, nj is the unit vector normal to
and ds is the path length along (Fig. 14) and W is the strain energy density and defined as
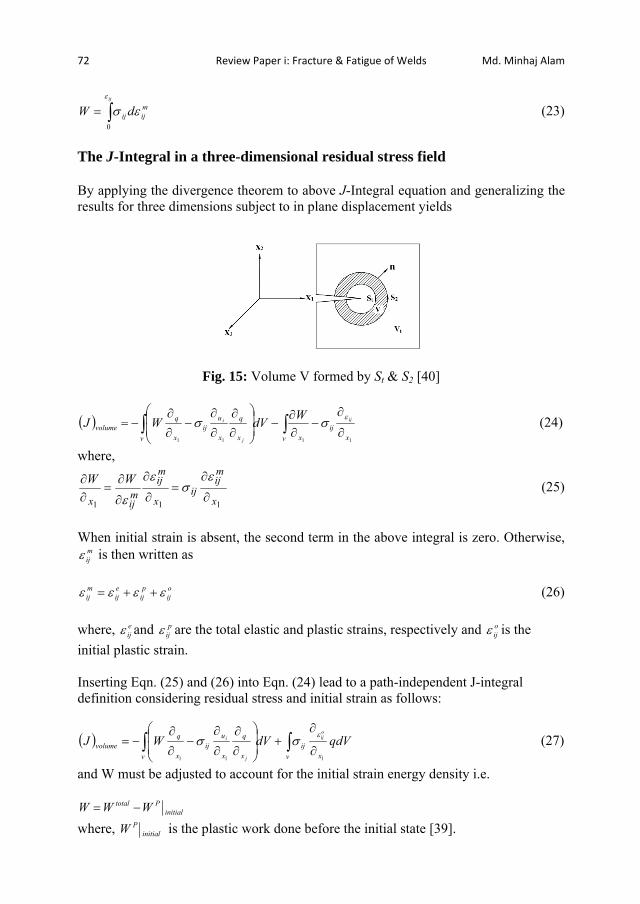
72 Review Paper i: Fracture & Fatigue of Welds Md. Minhaj Alam
ij
mijij dW
0
(23)
The J-Integral in a three-dimensional residual stress field By applying the divergence theorem to above J-Integral equation and generalizing the results for three dimensions subject to in plane displacement yields
Fig. 15: Volume V formed by St & S2 [40]
1111 xij
v xv x
q
x
uij
x
qvolume
ij
j
i WdVWJ (24)
where,
111 x
mij
ijx
mij
mijx
WW (25)
When initial strain is absent, the second term in the above integral is zero. Otherwise,
mij is then written as
oij
pij
eij
mij (26)
where, e
ij and pij are the total elastic and plastic strains, respectively and o
ij is the initial plastic strain. Inserting Eqn. (25) and (26) into Eqn. (24) lead to a path-independent J-integral definition considering residual stress and initial strain as follows:
qdVdVWJxv
ijv x
q
x
uij
x
qvolume
oij
j
i
111
(27)
and W must be adjusted to account for the initial strain energy density i.e.
initialPtotal WWW
where, initialPW is the plastic work done before the initial state [39].

Md. Minhaj Alam Review Paper i: Fracture & Fatigue of Welds 73
3.2.3 TUBULAR JOINTS (Stress intensity approach) The accurate evaluation of SIF for surface cracks in tubular joints is a difficult task due to complex geometry of the joint and crack configuration.
Fig. 16: Geometry of Tubular joints [47]
Well established procedures commonly used for evaluating SIF in arbitrary cracked bodies are, displacement extrapolation technique, strain energy release rate (SERR) method and J-integral method. In this paper, displacement extrapolation technique has been used for computing SIF. Bowness and Lee [5] reported an investigation on the prediction of SIF in tubular joints for semi-elliptical surface cracks by using displacement extrapolation technique. The method uses the elastic displacements in the vicinity of the crack front for computing SIF. For the case of plane strain conditions at crack front, the displacement fields are expressed as: [4]
Mode I:
02
sin212
sin2
2cos22
2sin
2
2
2
t
Ir
In
w
vrGKu
vrGKv
(28)
Mode II:
02
cos222
sin2
2sin21
2sin
2
2
2
t
IIr
IIn
w
vrG
Ku
vrG
Kv
(29)
Mode II:
2sin
2
00
rG
Kw
uv
IIIt
r
n
(30)

74 Review Paper i: Fracture & Fatigue of Welds Md. Minhaj Alam
where, KI, KII and KIII are the SIF for Modes I, II and III respectively; G, the shear modulus; , the poissons ratio; and ur , n and wt denote the local radial, normal and tangential displacements, respectively, as shown in Fig. 17. The plane stress form of these equations is obtained by substituting by / (1 + )
Fig. 17: Local axes system at crack front [47]
Using the displacements near the crack front obtained from FE analysis, the corresponding SIF may be calculated by using equations (28)-(30). The SIF for a particular radial path are then plotted against the distance from the crack tip. The crack front SIF may then be found by extrapolating the linear part of the distribution back to the crack front. In order to apply the displacement extrapolation technique to a doubly curved crack in a tubular joint, the local radial, normal and tangential directions must be defined for each point on the crack front. This is achieved by first calculating the vectors defining the local directions, which is quite straightforward as the crack is planar and lies in one of the global planes. The radial direction is calculated from the co-ordinates of the nodes on the radial paths along the crack front. The tangential direction is determined from the derivative of the equation defining the elliptical crack front. The two vectors defining these directions are then mapped to vectors defining the local radial and tangential directions for the doubly curved weld toe crack. The third vector in the normal direction is then generated from a cross product of the other two. Having determined these local directions, the global displacements from the FE analysis may then be transformed into local displacements as:
ZYX
nmlnmlnml
wvu
t
n
r
333
222
111
where X , Y and Z are the global displacements and l1, m1, n1 etc. are the direction cosines of the local directions with respect to the global axes X, Y and Z. To evaluate SIF, the largest displacement in the vicinity of the crack, obtained from the radial paths up the crack front, i.e. q = ±180° is generally chosen [48].
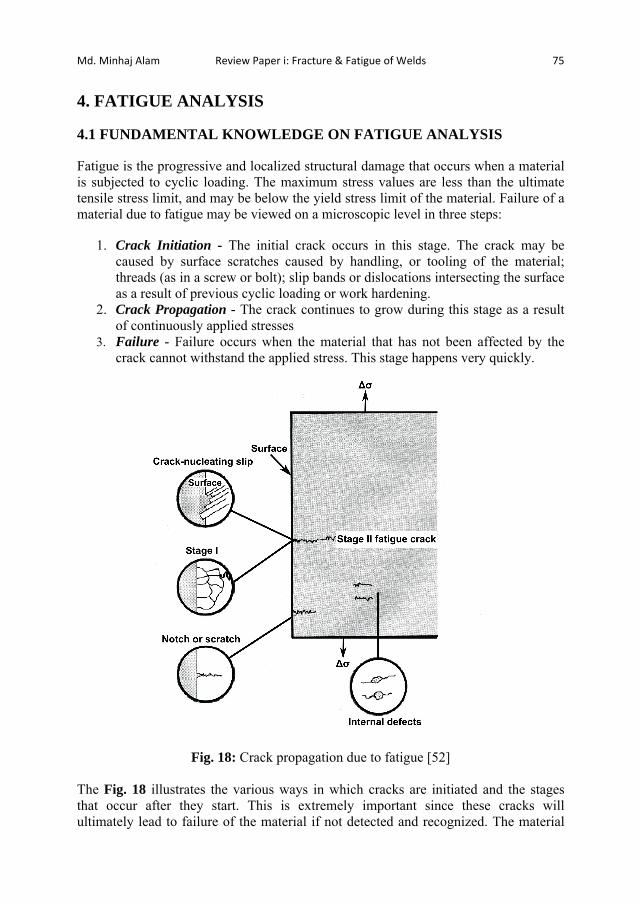
Md. Minhaj Alam Review Paper i: Fracture & Fatigue of Welds 75
4. FATIGUE ANALYSIS 4.1 FUNDAMENTAL KNOWLEDGE ON FATIGUE ANALYSIS
Fatigue is the progressive and localized structural damage that occurs when a material is subjected to cyclic loading. The maximum stress values are less than the ultimate tensile stress limit, and may be below the yield stress limit of the material. Failure of a material due to fatigue may be viewed on a microscopic level in three steps:
1. Crack Initiation - The initial crack occurs in this stage. The crack may be caused by surface scratches caused by handling, or tooling of the material; threads (as in a screw or bolt); slip bands or dislocations intersecting the surface as a result of previous cyclic loading or work hardening.
2. Crack Propagation - The crack continues to grow during this stage as a result of continuously applied stresses
3. Failure - Failure occurs when the material that has not been affected by the crack cannot withstand the applied stress. This stage happens very quickly.
Fig. 18: Crack propagation due to fatigue [52]
The Fig. 18 illustrates the various ways in which cracks are initiated and the stages that occur after they start. This is extremely important since these cracks will ultimately lead to failure of the material if not detected and recognized. The material
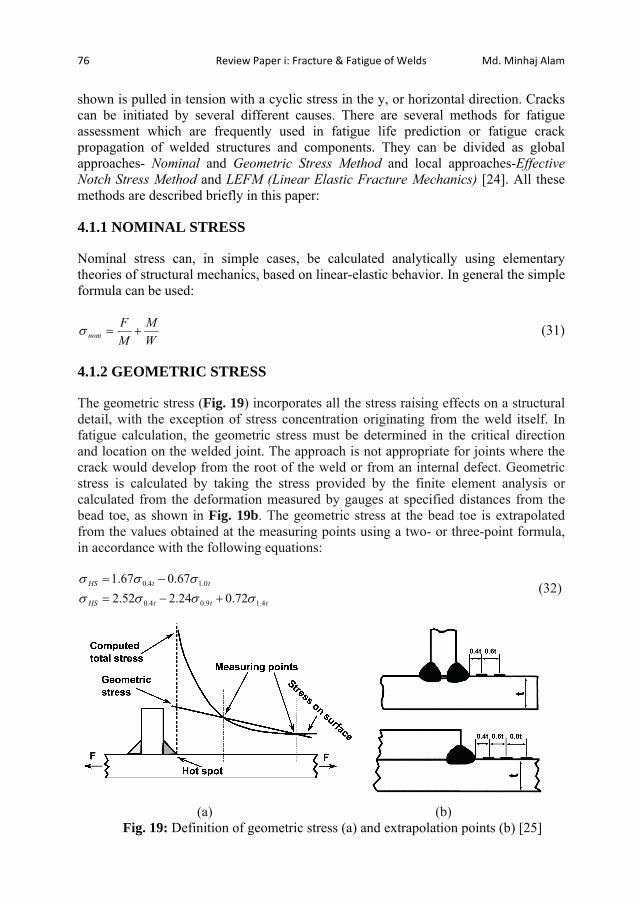
76 Review Paper i: Fracture & Fatigue of Welds Md. Minhaj Alam
shown is pulled in tension with a cyclic stress in the y, or horizontal direction. Cracks can be initiated by several different causes. There are several methods for fatigue assessment which are frequently used in fatigue life prediction or fatigue crack propagation of welded structures and components. They can be divided as global approaches- Nominal and Geometric Stress Method and local approaches-Effective Notch Stress Method and LEFM (Linear Elastic Fracture Mechanics) [24]. All these methods are described briefly in this paper: 4.1.1 NOMINAL STRESS Nominal stress can, in simple cases, be calculated analytically using elementary theories of structural mechanics, based on linear-elastic behavior. In general the simple formula can be used:
WM
MF
nom (31)
4.1.2 GEOMETRIC STRESS The geometric stress (Fig. 19) incorporates all the stress raising effects on a structural detail, with the exception of stress concentration originating from the weld itself. In fatigue calculation, the geometric stress must be determined in the critical direction and location on the welded joint. The approach is not appropriate for joints where the crack would develop from the root of the weld or from an internal defect. Geometric stress is calculated by taking the stress provided by the finite element analysis or calculated from the deformation measured by gauges at specified distances from the bead toe, as shown in Fig. 19b. The geometric stress at the bead toe is extrapolated from the values obtained at the measuring points using a two- or three-point formula, in accordance with the following equations:
tttHS
ttHS
4.19.04.0
0.14.0
72.024.252.267.067.1
(32)
(a) (b) Fig. 19: Definition of geometric stress (a) and extrapolation points (b) [25]
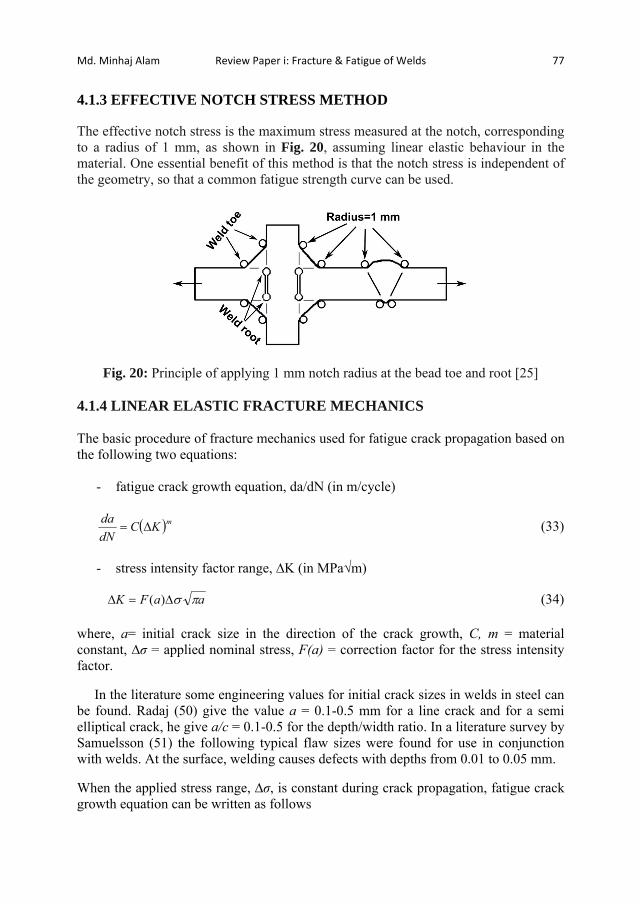
Md. Minhaj Alam Review Paper i: Fracture & Fatigue of Welds 77
4.1.3 EFFECTIVE NOTCH STRESS METHOD The effective notch stress is the maximum stress measured at the notch, corresponding to a radius of 1 mm, as shown in Fig. 20, assuming linear elastic behaviour in the material. One essential benefit of this method is that the notch stress is independent of the geometry, so that a common fatigue strength curve can be used.
Fig. 20: Principle of applying 1 mm notch radius at the bead toe and root [25]
4.1.4 LINEAR ELASTIC FRACTURE MECHANICS The basic procedure of fracture mechanics used for fatigue crack propagation based on the following two equations:
- fatigue crack growth equation, da/dN (in m/cycle)
mKCdNda (33)
- stress intensity factor range, K (in MPa m)
aaFK )( (34) where, a= initial crack size in the direction of the crack growth, C, m = material constant, = applied nominal stress, F(a) = correction factor for the stress intensity factor.
In the literature some engineering values for initial crack sizes in welds in steel can be found. Radaj (50) give the value a = 0.1-0.5 mm for a line crack and for a semi elliptical crack, he give a/c = 0.1-0.5 for the depth/width ratio. In a literature survey by Samuelsson (51) the following typical flaw sizes were found for use in conjunction with welds. At the surface, welding causes defects with depths from 0.01 to 0.05 mm.
When the applied stress range, , is constant during crack propagation, fatigue crack growth equation can be written as follows

78 Review Paper i: Fracture & Fatigue of Welds Md. Minhaj Alam
maaFC
dadN)(
(35)
Then, the fatigue crack propagation life, Np, from and initial crack size ai to a final crack size af can be computed as follows:
f
i
f
i
a
a m
N
NPaaFC
dadNN)(
(36)
The stress intensity factor range, K, for a crack initiating at the weld toe may conveniently express as follows:
aFFFFK TGES .... (37) where, FS = correction factor for free surface, FE = correction factor for crack shape, FG = geometry correction factor accounting for the effect of stress concentration due to geometrical discontinuity, FT = correction factor for finite thickness or finite width. [46].
4.2 WELDED JOINTS ANALYSIS BASED ON FATIGUE ANALYSIS 4.2.1 BUTT JOINT (Theoretical Model) The process of the fatigue failure in the welded joints can be divided into two main periods: micro cracks nucleation, growth and coalescence (stage I fatigue crack) and macro crack propagation to a length, which causes fracture (stage II fatigue crack). The boundaries of the periods are poorly defined, but it is useful to think that the total fatigue life NF consist of macro crack initiation period NI and macro crack propagation period NP: NF = NI + NP (38) Macro crack initiation S-NI curve can be now written on the basis of the fatigue strength on N=500 load cycles 500 and fatigue strength on N=2·106 load cycles E:
610.2..
E
fI
KSN (39)
where, S is nominal stress range. The slope of S-NI curve mI is
)log()log(
)500log()10.2log(
500
6
f
EI
K
m (40)
The material fatigue strength, 500 and E can be estimated using Basquin-Morrow equation:
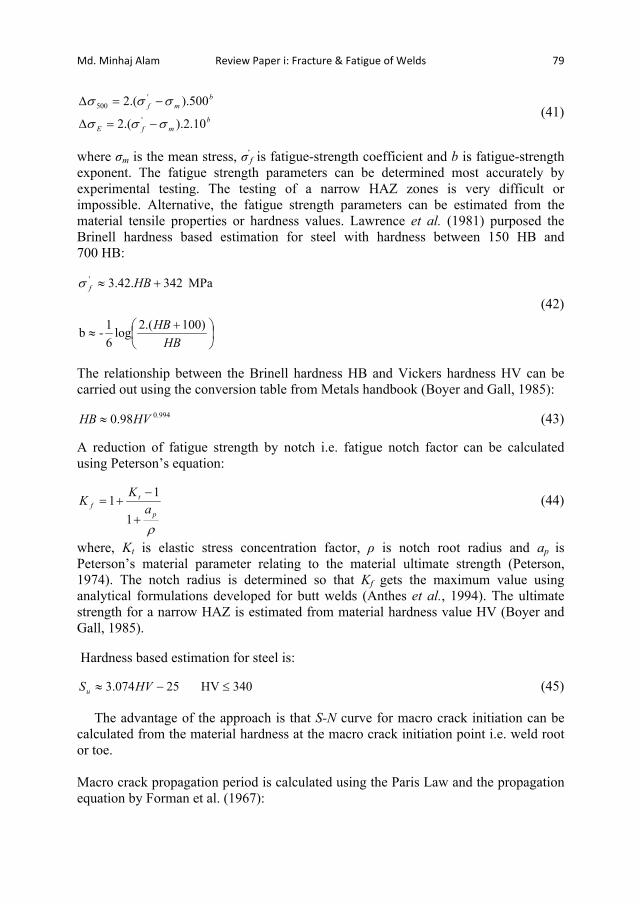
Md. Minhaj Alam Review Paper i: Fracture & Fatigue of Welds 79
bmfE
bmf
10.2)..(2
500)..(2'
'500 (41)
where m is the mean stress, f is fatigue-strength coefficient and b is fatigue-strength exponent. The fatigue strength parameters can be determined most accurately by experimental testing. The testing of a narrow HAZ zones is very difficult or impossible. Alternative, the fatigue strength parameters can be estimated from the material tensile properties or hardness values. Lawrence et al. (1981) purposed the Brinell hardness based estimation for steel with hardness between 150 HB and 700 HB:
HBHB
HBf
)100.(2log61-b
MPa 342.42.3'
(42)
The relationship between the Brinell hardness HB and Vickers hardness HV can be carried out using the conversion table from Metals handbook (Boyer and Gall, 1985):
994.098.0 HVHB (43) A reduction of fatigue strength by notch i.e. fatigue notch factor can be calculated using Peterson’s equation:
p
tf a
KK1
11 (44)
where, Kt is elastic stress concentration factor, is notch root radius and ap is Peterson’s material parameter relating to the material ultimate strength (Peterson, 1974). The notch radius is determined so that Kf gets the maximum value using analytical formulations developed for butt welds (Anthes et al., 1994). The ultimate strength for a narrow HAZ is estimated from material hardness value HV (Boyer and Gall, 1985). Hardness based estimation for steel is:
340HV 25074.3 HVSu (45) The advantage of the approach is that S-N curve for macro crack initiation can be calculated from the material hardness at the macro crack initiation point i.e. weld root or toe. Macro crack propagation period is calculated using the Paris Law and the propagation equation by Forman et al. (1967):
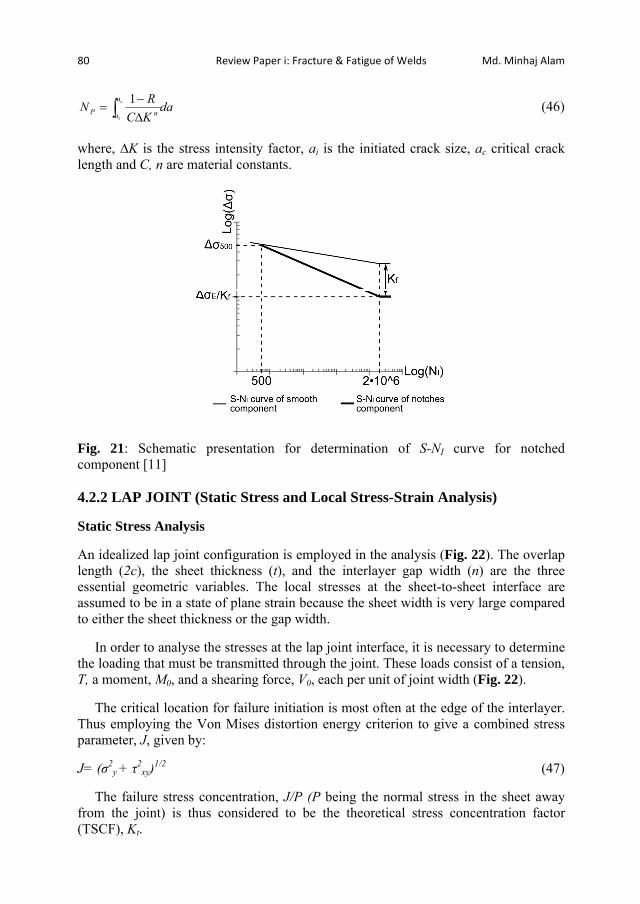
80 Review Paper i: Fracture & Fatigue of Welds Md. Minhaj Alam
daKCRN c
i
a
a nP1 (46)
where, K is the stress intensity factor, ai is the initiated crack size, ac critical crack length and C, n are material constants.
Fig. 21: Schematic presentation for determination of S-NI curve for notched component [11] 4.2.2 LAP JOINT (Static Stress and Local Stress-Strain Analysis) Static Stress Analysis An idealized lap joint configuration is employed in the analysis (Fig. 22). The overlap length (2c), the sheet thickness (t), and the interlayer gap width (n) are the three essential geometric variables. The local stresses at the sheet-to-sheet interface are assumed to be in a state of plane strain because the sheet width is very large compared to either the sheet thickness or the gap width. In order to analyse the stresses at the lap joint interface, it is necessary to determine the loading that must be transmitted through the joint. These loads consist of a tension, T, a moment, M0, and a shearing force, V0, each per unit of joint width (Fig. 22). The critical location for failure initiation is most often at the edge of the interlayer. Thus employing the Von Mises distortion energy criterion to give a combined stress parameter, J, given by: J= ( 2
y + 2xy)1/2 (47)
The failure stress concentration, J/P (P being the normal stress in the sheet away from the joint) is thus considered to be the theoretical stress concentration factor (TSCF), Kt.
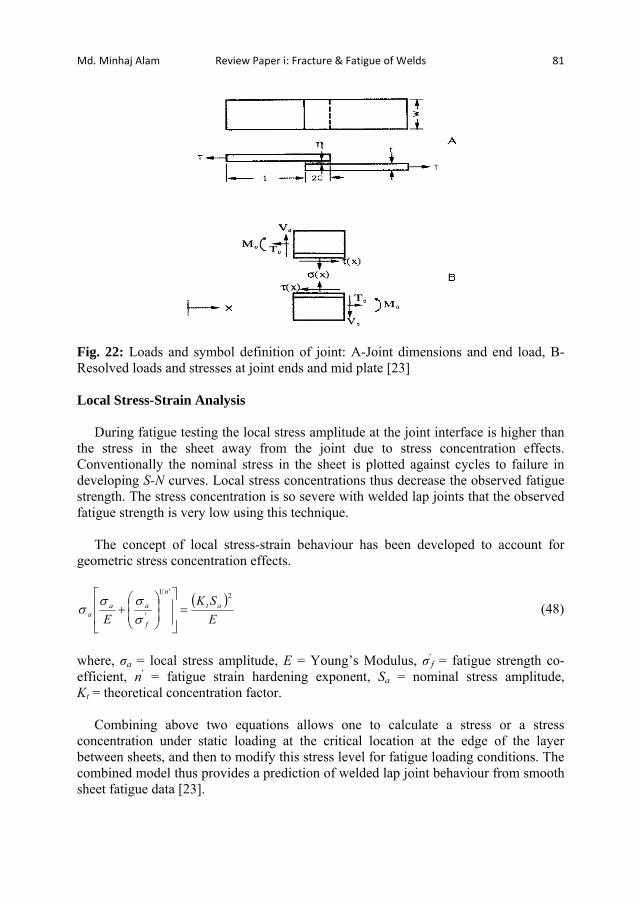
Md. Minhaj Alam Review Paper i: Fracture & Fatigue of Welds 81
Fig. 22: Loads and symbol definition of joint: A-Joint dimensions and end load, B- Resolved loads and stresses at joint ends and mid plate [23] Local Stress-Strain Analysis During fatigue testing the local stress amplitude at the joint interface is higher than the stress in the sheet away from the joint due to stress concentration effects. Conventionally the nominal stress in the sheet is plotted against cycles to failure in developing S-N curves. Local stress concentrations thus decrease the observed fatigue strength. The stress concentration is so severe with welded lap joints that the observed fatigue strength is very low using this technique. The concept of local stress-strain behaviour has been developed to account for geometric stress concentration effects.
ESK
Eat
n
f
aaa
2'1
' (48)
where, a = local stress amplitude, E = Young’s Modulus, f = fatigue strength co-efficient, n = fatigue strain hardening exponent, Sa = nominal stress amplitude, Kt = theoretical concentration factor. Combining above two equations allows one to calculate a stress or a stress concentration under static loading at the critical location at the edge of the layer between sheets, and then to modify this stress level for fatigue loading conditions. The combined model thus provides a prediction of welded lap joint behaviour from smooth sheet fatigue data [23].
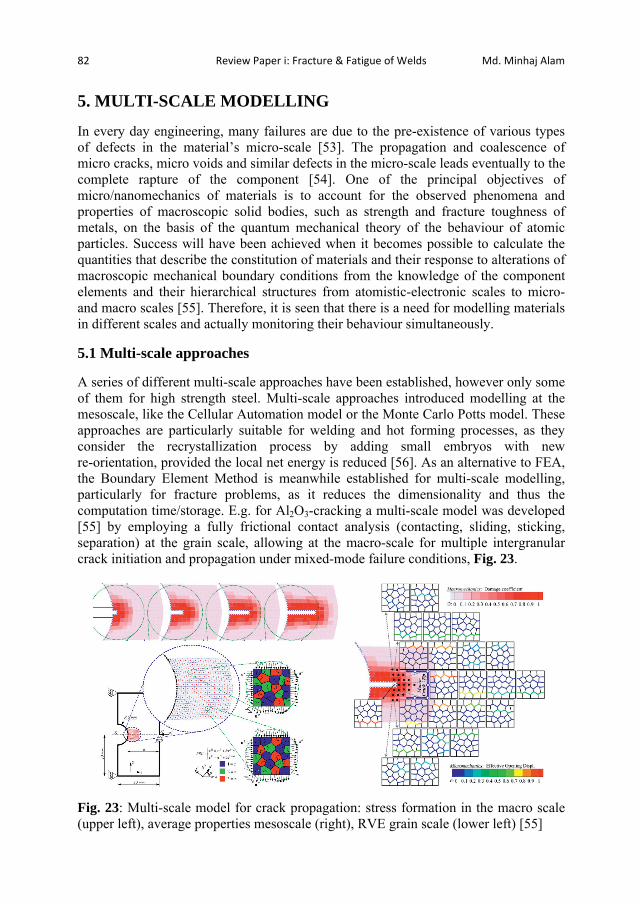
82 Review Paper i: Fracture & Fatigue of Welds Md. Minhaj Alam
5. MULTI-SCALE MODELLING In every day engineering, many failures are due to the pre-existence of various types of defects in the material’s micro-scale [53]. The propagation and coalescence of micro cracks, micro voids and similar defects in the micro-scale leads eventually to the complete rapture of the component [54]. One of the principal objectives of micro/nanomechanics of materials is to account for the observed phenomena and properties of macroscopic solid bodies, such as strength and fracture toughness of metals, on the basis of the quantum mechanical theory of the behaviour of atomic particles. Success will have been achieved when it becomes possible to calculate the quantities that describe the constitution of materials and their response to alterations of macroscopic mechanical boundary conditions from the knowledge of the component elements and their hierarchical structures from atomistic-electronic scales to micro- and macro scales [55]. Therefore, it is seen that there is a need for modelling materials in different scales and actually monitoring their behaviour simultaneously. 5.1 Multi-scale approaches A series of different multi-scale approaches have been established, however only some of them for high strength steel. Multi-scale approaches introduced modelling at the mesoscale, like the Cellular Automation model or the Monte Carlo Potts model. These approaches are particularly suitable for welding and hot forming processes, as they consider the recrystallization process by adding small embryos with new re-orientation, provided the local net energy is reduced [56]. As an alternative to FEA, the Boundary Element Method is meanwhile established for multi-scale modelling, particularly for fracture problems, as it reduces the dimensionality and thus the computation time/storage. E.g. for Al2O3-cracking a multi-scale model was developed [55] by employing a fully frictional contact analysis (contacting, sliding, sticking, separation) at the grain scale, allowing at the macro-scale for multiple intergranular crack initiation and propagation under mixed-mode failure conditions, Fig. 23.
Fig. 23: Multi-scale model for crack propagation: stress formation in the macro scale (upper left), average properties mesoscale (right), RVE grain scale (lower left) [55]

Md. Minhaj Alam Review Paper i: Fracture & Fatigue of Welds 83
5.1.1 Macro continuum scale Finite Element simulation of the stress formation and the strain response of a weld under load conditions is a common method often applied at the macro continuum scale. The difficulties are meshing at locations with small dimensions/curvatures or strong deformations. Moreover, valid material properties are needed, often by empirically identified material models. For single phase metals the stress-strain curve is often developed by an empirical model based on the chemical composition, while modelling of the physics is based on the density of dislocations and mobility of the grain boundaries. However, for multi phase materials like high strength steels (DP, TRIP) and for the different zones of a weld the identification is difficult as the micro polycrystal structure is heterogeneous, which demands for modelling of the material properties at one or several micro-scale levels. 5.1.2 Microstructure and RVE-scale A recently often applied method for modelling the formability at the micro-scale is the Representative Volume Element (RVE) method for solving the crystal plasticity constitutive equations. The RVE can be determined by SEM-EBSD measurement. Fig. 24 shows the different phases of an RVE model
Fig. 24: Four phases (ferrite, bainite, retain austenite, martensite) of the RVE (cube size e.g. of the order of 100 m) of a TRIP steel Many RVE models have been developed, but they suffer from lack of describing the grain location, size or orientation accurately in 3D space, due to the strong interaction with adjacent grains to be considered. 5.1.3 Crystallic/atomic scale Both, plastic deformation and fracture have their origin at the atomic scale. While deformation is caused by the propagation of dislocations (atomistic sliding), governed by the Rice criterion, during fracture of a crystal atomic aggregates are split into two parts, as can be calculated by a universal relation for the binding energy leading to a newly created surface energy. The imperfections of real crystals have to be taken into account, such as impurity or interstitial atoms, vacant lattice site and dislocations. Calculation of these lattice-particle interactions at the atomic level is complicated, but essential for understanding and control of separation or dislocation propagation, as it is the key for setting goals for the development of advanced high strength steel types.

84 Review Paper i: Fracture & Fatigue of Welds Md. Minhaj Alam
6. WELDING STANDARD Welding standard in Hybrid laser welding is not prepared yet by any international organization. The available welding standards are ISO 5817 (Welding-Fusion welded joints in steel, nickel, titanium and their alloys-Quality levels of imperfections), ISO 9692-1 (Welding and allied processes- recommendations for joint preparation, BS EN ISO 6520-2 (Welding and allied processes- Classification of geometric imperfections in metallic materials - Welding with pressure) etc. Therefore separate standards, based on existing welding standards, have to be prepared. 7. CONCLUSIONS
Finite element modelling is a powerful method for calculating fracture and fatigue of welded joints.
ANSYS and ABAQUS are widely accepted commercial simulation software. Stress intensity factor (K) is one of the most important parameter in fracture
mechanics for the mathematical model of welded joints. Recent trends of fracture research include dynamic and time-dependent fracture
on nonlinear materials, fracture mechanics of microstructures, and models related to local, global, and geometry-dependent fractures.
LEFM is capable to describe crack growth and crack propagation in welded structures in a physically correct way.
An engineering value of initial crack size at weld toe would be 0.1 mm. From the publication survey, it can be said that the critical weld location is at
the toe for different joint. More research effort is required on hybrid laser welded joints.
8. ACKNOWLEDGEMENTS The authors are grateful to VINNOVA – The Swedish Innovation Agency (project HYBRIGHT, no. 27382-2) for funding the research. 9. LITERATURE
1. Jaroslav M, Finite element analysis and simulation of welding – an addendum: a bibliography (1996-2001), Modelling Simul Mater Sci Eng 10 (2002) 295-318.
2. http://www.efunda.com/formulae/solid_mechanics/fracture_mechanics/fm_intro.cfm.
3. O’Dowd N P, Nikbin K M, Lee H-Y, Wimpory R, Biglari F, Stress intensity factors due to residual stresses in T-plate welds, J Press Vessel Technol 126 (2004) 6-12.
Md. Minhaj Alam Review Paper i: Fracture & Fatigue of Welds 85
4. Anderson T L, Fracture Mechanics fundamentals and applications, ISBN 0-8493-4260-0.
5. Bowness D, Lee M M K, A finite element study of stress fields and stress
intensity factors in tubular joints, J Strain Anal 30 (1995) 135-142.
6. HSU C, Albright C E, Fatigue analysis of laser welded lap joints, Eng Fract Mech 39 (1991) 575-580.
7. Baohua C, Yaown S, Liangqing L, Studies on the stress distribution and fatigue behaviour of weld-bonded lap shear joints, J Mater Process Tech 108 (2001) 307-313.
8. Dong P, A structural stress definition and numerical implementation for fatigue analysis of welded joints, Int J of Fatig 23 (2001) 865-876.
9. El-Sayed M E M, Stawiarski T, Frutiger R, Fatigue analysis of spot-welded
joints under variable amplitude load history, Eng Fract Mech 55 (1996) 363-369.
10. Henrysson H F, Fatigue life predictions of spot welds using coarse FE
meshes, Fatig Fract Eng Mater Struct 23 (2000) 737-746. 11. Remes H, A theoretical model to predict fatigue life of laser welded joints,
Ship laboratory, Helsinki University of Technology, Finland (2005). 12. Cho S K, Yang Y S, Son K J, Kim J Y, Fatigue strength in laser welding of
the lap joint, Finite Elem Anal Des 40 (2004) 1059-1070. 13. Maddox S J, An analysis of fatigue cracks in fillet welded joints, Int J Fract
11 (1975) 221-243. 14. Alam M S, Wahab M A, Modeling the fatigue crack growth and
propagation life of a joint of two elastic materials using interface elements, Int J Press Vessel Piping 82 (2005) 105-113.
15. Etube L S, Bremen F P, Dover W D, A new method for predicting stress
intensity factors in cracked welded tubular joints, Int J Fatig 22 (2000) 447-456.
16. Sutton M A, Reynolds A P, Ge Y Z, Deng X, Limited weld residual stress
measurements in fatigue crack propagation: Part II FEM based fatigue crack propagation with complete residual stress fields, Fatig Fract Eng Mater Struct 29 (2006) 537-545.
86 Review Paper i: Fracture & Fatigue of Welds Md. Minhaj Alam
17. Balasubramanian V, Guha B, Effect of weld size on fatigue crack growth behaviour of cruciform joints by strain energy density factor approach, Theor Appl Fract Mech 31 (1999) 141-148.
18. Haagensen P J, Statnikov E S, Martinez L L, Introductory fatigue tests on
welded joints in high strength steel and aluminium improved by various methods including ultrasonic impact treatment, IIW Doc. XIII- 1748-98.
19. Teng T L, Chang P H, Effect of residual stresses in fatigue crack initiation
life for butt-welded joints, J Mater Process Tech 145 (2004) 325-335. 20. Li X Y, Partanen T, Nykänen T, Björk T, Finite element analysis of the effect
of weld geometry and local condition on fatigue strength of lap joint, Int J Press Vessel Pipping 78 (2001) 591-597.
21. Ding F, Zhao T, Jiang Y, A study of fatigue crack growth with changing
loading direction, Eng Fract Mech 74 (2007) 2014-2029. 22. Caccese V, Blomquist P A, Berube K A, Effect of weld geometric profile on
fatigue life of cruciform welds made by laser/GMAW processes, Marine Struct 19 (2006) 1-22.
23. Hsu C, Albright C E, Fatigue analysis of laser welded lap joints, Eng Fract
Mech 39 (1991) 575-580. 24. Barsoum Z, Residual Stress Analysis and fatigue of Welded Structures,
Licentiate Thesis, Dept. of Aeronautical and Vehicle Engineering, KTH, Sweden 2006. ISBN 91-7178-264-8.
25. Pettersson G, Fatigue assessment of welded structures with non-linear
boundary conditions, Licentiate Thesis, Dept. of Aeronautical and Vehicle Engineering, KTH, Sweden 2004. ISBN 91-7283-948-1.
26. Andersson P, Segle P, Samuelson L Å, Numerical investigation of creep
crack growth in cross-weld CT specimens. Part II: influence of specimen size, Fatig Frac Eng Struct 23 (1999) 533-540.
27. Assire A, Michel B, Raous M, Creep crack initiation and creep crack
growth assessments in welded structures, Nucl Eng Des 206 (2001) 45-56. 28. Hou Y C, Pan J, A fracture parameter for welded structures with residual
stresses, Comput Mech 22 (1998) 281-288. 29. Infante V, Branco C M, Bapista R, Gomes E, A residual stresses and fracture
mechanics analysis of welded joints repaired by hammer peening, 8th Portuguese Conference on Fracture (2002).
Md. Minhaj Alam Review Paper i: Fracture & Fatigue of Welds 87
30. Ferreira J M, Pereira A H, Branco C M, A fracture mechanics based fatigue life prediction for welded joints of square tubes, Thin Wall Struct 21 (1995) 107-120.
31. Cam G, Erim S, Yeni C, Kocak M, Determination of mechanical and
fracture properties of laser beam welded steel joints, Welding Research Supplement (1999).
32. Atzori B, Lazzarin P, Tovo R, From a local stress approach to fracture
mechanics: a comprehensive evaluation of the fatigue strength of welded joints, Fatig Fract Eng Struct 22 (1998) 369-381.
33. Budden P J, Curbishley I, Assessment of creep crack growth in dissimilar
metal welds, Nucl Eng Des 197 (2000) 13-23. 34. Wang P C, Fracture mechanics parameter for the fatigue resistance of laser
welds, Int J Fatig 17 (1995) 25-34. 35. Maosheng C, Shan W, Shaofu L, Crack growth and fatigue life estimation in
welded T- Tubular joints based on fracture mechanics, Proceedings of the International Offshore Mechanics and Arctic Engineering symposium, Vol. 3, pp. 351-358 (1990).
36. Lieurade H P, Application of fracture mechanics to the fatigue of welded
structures, Weld World 21 (1983) 272-295. 37. Zaho W, Newman J C, Sutton M A, Shivkumar K N, Wu X R, Stress intensity
factors for surface cracks at a hole by a three dimensional weight function method with stresses from the finite element method, Fatig Fract Eng Mater Struct 21 (1996) 229-239.
38. Schindler H J, Martens H J, Sönnichsen S, A fracture mechanics approach to
estimate the fatigue endurance of welded t-joints including residual stress effects, Fatig Fract Eng Mater Struct 30 (2006) 206-213.
39. Chang K H, Lee C H, Residual stresses and fracture mechanics analysis of a
crack in welds of high strength steels, Eng Fract Mech 74 (2007) 980-994. 40. Lei Y, Dowd N P, Webster G A, Fracture mechanics analysis of a crack in a
residual stress field, Int J Fract 106 (2000) 195-216. 41. Lee H Y, Nikbin K M, Dowd N P, A generic approach for a linear elastic
fracture mechanics analysis of a components containing residual stress, Int J Press Vessel Piping 82 (2005) 797-806.
88 Review Paper i: Fracture & Fatigue of Welds Md. Minhaj Alam
42. Muller W, Veith H, Influence of weld material properties on fracture mechanics parameters in welds analysed by FEM calculations, Int J Press Vessel Piping 33 (1998) 285-300.
43. Dahl W, Ehrhardt H, Heuser A, Hubo R, Twickler R, Uwer D, Determination
of fracture mechanics properties of welded joints and comparison with the failure behaviour of wide plates, Nucl Eng Des 102 (1987) 451-461.
44. Chiesa M, Skallerud B, Thaulow C, Fracture analysis of strength-
mismatched welded wide plates by line spring elements, Eng Frac Mech 68 (2001) 987-1001.
45. Nykänen T, Li X, Björk T, Marquis G, A parametric fracture mechanics
study of welded joints with toe cracks and lack of penetration, Eng Fract Mech 72 (2005) 1580-1609.
46. Ellyin F, Fatigue damage, crack growth and life prediction, ISBN 0-412-
59600-8 (1996). 47. Cao J J, Yang G J, Packer J A, Burdekin F M, Crack modelling in FE analysis
of circular tubular joints, Eng Fract Mech 61 (1998) 537-553. 48. Murthy A R C, Palani G S, Iyer N R, Appa Rao T V S R, An efficient FE
modelling strategy for fracture analysis of tubular joints, J Inst Engr 85 (2004) 17-51.
49. http://www.mpmtechnologies.com/Finite-Element-Fracture-Mechanics.htm. 50. Radaj D, Design and analysis of fatigue resistant welded structures,
Abington Publishing (1990), ISBN 1 85573 004 9. 51. Samuelsson J, Fatigue design of vehicle components: methodology and
applications, report 88-23, Dep. of Aeronautical Structures and Materials, The Royal Institute of Technology, Stockholm (1998).
52. http://www.sv.vt.edu/classes/MSE2094_NoteBook/97ClassProj/anal/kelly/fatig
ue.html. 53. Gagg C R, Failure of components and products by ‘engineered-in’ defects:
case studies, Eng Fail Anal 12 (2000) 1000-1026. 54. Scutti J J, McBrine W J, Failure Analysis and Prevention, in: W.T. Becker,
R.J. Shipley (Eds.), ASM Handbook, vol. 11, ASM, USA (2002).

Md. Minhaj Alam Review Paper i: Fracture & Fatigue of Welds 89
55. Hao S, Liu W K, Moran B, Vernerey F, Olson G B, Multi-scale constitutive model and computational framework for the design of ultra-high strength high toughness steels, Comput Meth Appl Mech Eng 193 (2004) 1865-1908.
56. Yu Q, Esche S K, A multi-scale approach for microstructural prediction in
thermomechanical processing of metals, J Mat Proc Tech 169 (2005) 493-502.

90 Review Paper i: Fracture & Fatigue of Welds Md. Minhaj Alam

Md. Minhaj Alam Review Paper ii: Fatigue in Clad Layers 91
Review Paper ii STATE-OF-THE-ART OF LASER CLADDING DEFECTS AND OF THEIR IMPACT ON FATIGUE BEHAVIOUR M. M. Alam, A. F. H. Kaplan Literature Review (unpublished)

92 Review Paper ii: Fatigue in Clad Layers Md. Minhaj Alam
Md. Minhaj Alam Review Paper ii: Fatigue in Clad Layers 93
State-of-the-art of laser cladding defects and of their impact on fatigue behaviour
M. M. Alam, A. F. H. Kaplan 1) Luleå University of Technology, Division of Product and Production Development,
Department of Engineering Sciences and Mathematics, SE-971 87 Luleå, Sweden
Email: [email protected], [email protected]
Abstract The laser cladding process can generate various types of defects. Crack initiation and propagation from these defects is likely to occur under fatigue loading. This paper presents a literature survey of the effects of various defects on the fatigue behaviour of laser clad components. Due to the similarity of many defect types, welding and casting defects are also considered in this paper. Finite Element Analysis (FEA) of different macro stress fields generated as well as stress raisers created by laser cladding defects under different fatigue load conditions are discussed. Comprehensive studies of the fatigue analysis of laser clad components considering local defects combined with Finite Elements Analysis are still unsatisfactory. In order to give clear understanding of the effects of defects on fatigue behaviour of laser clad components, more research is required. Keywords: laser cladding; defects; fatigue; crack. 1. Introduction In this literature survey, the information about fatigue behaviour of laser clad components due to several kinds of defects is reported. To date, very little research has been carried out on defect and fatigue analysis of laser clad components. Therefore, effects on fatigue life due to welding and casting defects are also mentioned in this survey because of the similarity of the defect types. Laser cladding is a versatile technique which consists in the overlay of one alloy with another, creating a sound metallurgical bond between them in order to assure good adherence and favorable mechanical properties, achieving low values of porosity and dilution which degrade the special properties of the covering alloy [1]. Both the adherence of the coating and the tribological behaviour are superior to the ones obtained by other techniques such as Atmospheric Plasma Spraying (APS) or High Velocity Oxy-Fuel (HVOF) [2]. Laser cladding has a high potential and experiences growing industrial interest. It is increasingly used for the deposition of protective coatings and for the refurbishment of worn off tools and valuable components [3], especially in the aerospace, energy and automotive industries. Turbine blades, engines, dies, molds, axles, valve seats etc. are examples of usually expensive components
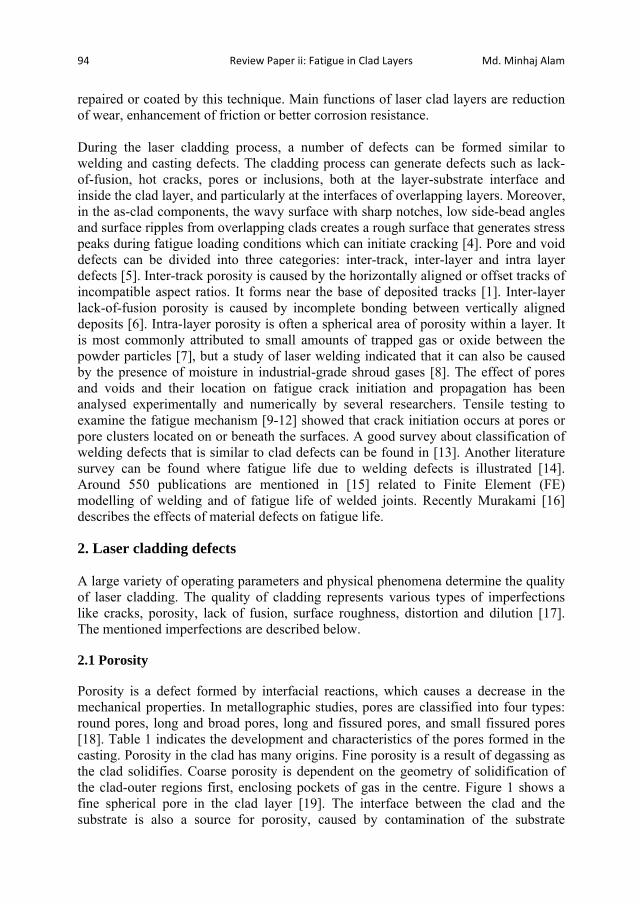
94 Review Paper ii: Fatigue in Clad Layers Md. Minhaj Alam
repaired or coated by this technique. Main functions of laser clad layers are reduction of wear, enhancement of friction or better corrosion resistance. During the laser cladding process, a number of defects can be formed similar to welding and casting defects. The cladding process can generate defects such as lack-of-fusion, hot cracks, pores or inclusions, both at the layer-substrate interface and inside the clad layer, and particularly at the interfaces of overlapping layers. Moreover, in the as-clad components, the wavy surface with sharp notches, low side-bead angles and surface ripples from overlapping clads creates a rough surface that generates stress peaks during fatigue loading conditions which can initiate cracking [4]. Pore and void defects can be divided into three categories: inter-track, inter-layer and intra layer defects [5]. Inter-track porosity is caused by the horizontally aligned or offset tracks of incompatible aspect ratios. It forms near the base of deposited tracks [1]. Inter-layer lack-of-fusion porosity is caused by incomplete bonding between vertically aligned deposits [6]. Intra-layer porosity is often a spherical area of porosity within a layer. It is most commonly attributed to small amounts of trapped gas or oxide between the powder particles [7], but a study of laser welding indicated that it can also be caused by the presence of moisture in industrial-grade shroud gases [8]. The effect of pores and voids and their location on fatigue crack initiation and propagation has been analysed experimentally and numerically by several researchers. Tensile testing to examine the fatigue mechanism [9-12] showed that crack initiation occurs at pores or pore clusters located on or beneath the surfaces. A good survey about classification of welding defects that is similar to clad defects can be found in [13]. Another literature survey can be found where fatigue life due to welding defects is illustrated [14]. Around 550 publications are mentioned in [15] related to Finite Element (FE) modelling of welding and of fatigue life of welded joints. Recently Murakami [16] describes the effects of material defects on fatigue life. 2. Laser cladding defects A large variety of operating parameters and physical phenomena determine the quality of laser cladding. The quality of cladding represents various types of imperfections like cracks, porosity, lack of fusion, surface roughness, distortion and dilution [17]. The mentioned imperfections are described below. 2.1 Porosity Porosity is a defect formed by interfacial reactions, which causes a decrease in the mechanical properties. In metallographic studies, pores are classified into four types: round pores, long and broad pores, long and fissured pores, and small fissured pores [18]. Table 1 indicates the development and characteristics of the pores formed in the casting. Porosity in the clad has many origins. Fine porosity is a result of degassing as the clad solidifies. Coarse porosity is dependent on the geometry of solidification of the clad-outer regions first, enclosing pockets of gas in the centre. Figure 1 shows a fine spherical pore in the clad layer [19]. The interface between the clad and the substrate is also a source for porosity, caused by contamination of the substrate

Md. Minhaj Alam Review Paper ii: Fatigue in Clad Layers 95
surface, which influences the wetting ability of the molten clad processing zone, it can result in vaporization of volatile organic compounds. Table 1: Four different types of pores, their development and characterization in solidifying casting for the case Al-7Si-Mg [18]
Fig. 1: Porosity due to the laser cladding process [19]
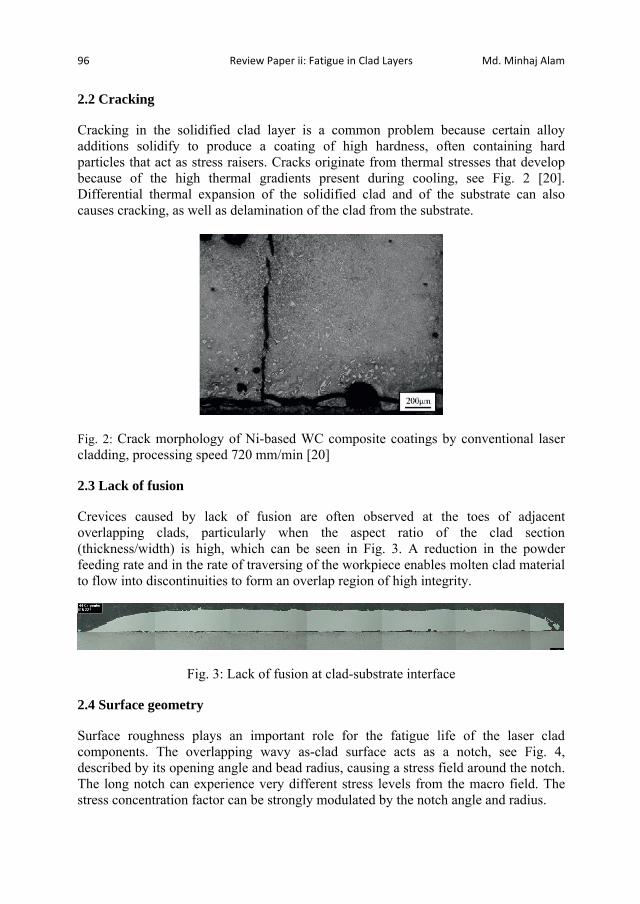
96 Review Paper ii: Fatigue in Clad Layers Md. Minhaj Alam
2.2 Cracking Cracking in the solidified clad layer is a common problem because certain alloy additions solidify to produce a coating of high hardness, often containing hard particles that act as stress raisers. Cracks originate from thermal stresses that develop because of the high thermal gradients present during cooling, see Fig. 2 [20]. Differential thermal expansion of the solidified clad and of the substrate can also causes cracking, as well as delamination of the clad from the substrate.
Fig. 2: Crack morphology of Ni-based WC composite coatings by conventional laser cladding, processing speed 720 mm/min [20]
2.3 Lack of fusion Crevices caused by lack of fusion are often observed at the toes of adjacent overlapping clads, particularly when the aspect ratio of the clad section (thickness/width) is high, which can be seen in Fig. 3. A reduction in the powder feeding rate and in the rate of traversing of the workpiece enables molten clad material to flow into discontinuities to form an overlap region of high integrity.
Fig. 3: Lack of fusion at clad-substrate interface 2.4 Surface geometry Surface roughness plays an important role for the fatigue life of the laser clad components. The overlapping wavy as-clad surface acts as a notch, see Fig. 4, described by its opening angle and bead radius, causing a stress field around the notch. The long notch can experience very different stress levels from the macro field. The stress concentration factor can be strongly modulated by the notch angle and radius.
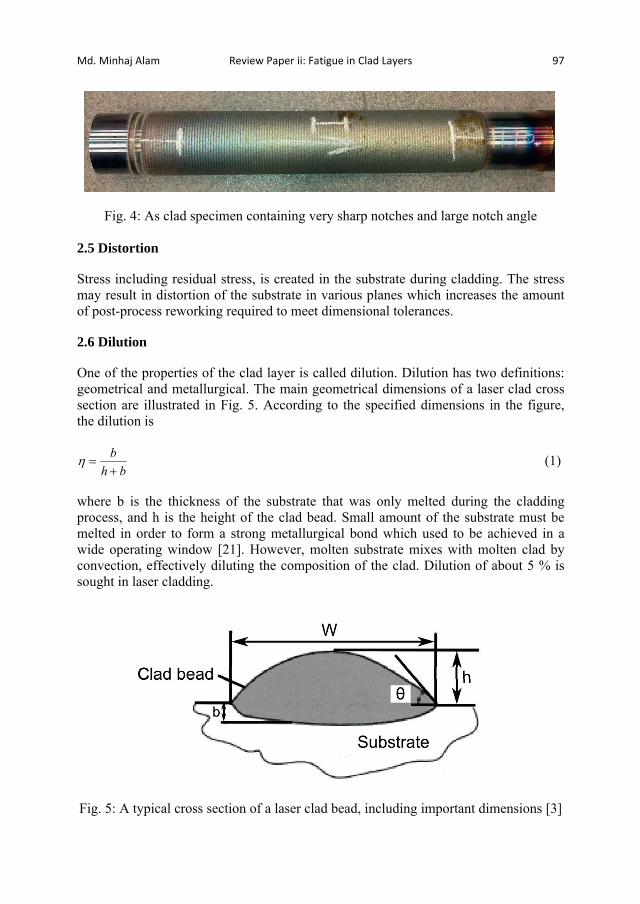
Md. Minhaj Alam Review Paper ii: Fatigue in Clad Layers 97
Fig. 4: As clad specimen containing very sharp notches and large notch angle
2.5 Distortion Stress including residual stress, is created in the substrate during cladding. The stress may result in distortion of the substrate in various planes which increases the amount of post-process reworking required to meet dimensional tolerances. 2.6 Dilution One of the properties of the clad layer is called dilution. Dilution has two definitions: geometrical and metallurgical. The main geometrical dimensions of a laser clad cross section are illustrated in Fig. 5. According to the specified dimensions in the figure, the dilution is
bhb (1)
where b is the thickness of the substrate that was only melted during the cladding process, and h is the height of the clad bead. Small amount of the substrate must be melted in order to form a strong metallurgical bond which used to be achieved in a wide operating window [21]. However, molten substrate mixes with molten clad by convection, effectively diluting the composition of the clad. Dilution of about 5 % is sought in laser cladding.
Fig. 5: A typical cross section of a laser clad bead, including important dimensions [3]

98 Review Paper ii: Fatigue in Clad Layers Md. Minhaj Alam
3. Fatigue analysis of laser clad components Surprisingly, very few investigations are published about the influence of cladding on fatigue properties of components. Depending on the material combination and process parameters applied, it seems that the fatigue properties of laser cladding can degrade but also be improved. H. Koehler et al. [22] presented an approach to calculate fatigue properties of laser clad components. They have tested two types of substrate which are 42CrMo4 and X5CrNi18-10, clad by Stellite 21. According to their findings, laser cladding of Stellite 21 on steel 42CrMo4 and steel X5CrNi18-10 with the selected process parameters generally decreases the fatigue strength. Even fatigue limits vary for different substrates. Figure 6 shows that at both stress ratios the fatigue limits of the X5CrNi18-10 specimens are superior to the fatigue limits of the 42CrMo4 specimens.
Fig. 6: Haigh diagram of steels X5CrNi19-10 and 42CrMo4 coated with Stellite 21 [22] In another publication by H. Koehler et al. [23], it is again confirmed that laser cladding led to a strong decrease in fatigue strength. A new approach has been proposed by Koehler to calculate the fatigue strength of a crank shaft, which is shown in Fig. 7.
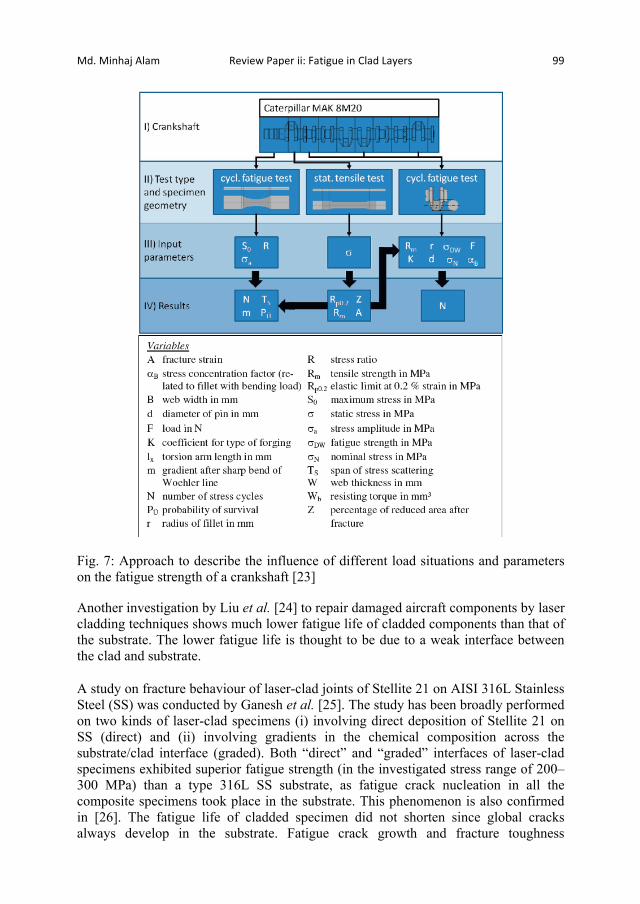
Md. Minhaj Alam Review Paper ii: Fatigue in Clad Layers 99
Fig. 7: Approach to describe the influence of different load situations and parameters on the fatigue strength of a crankshaft [23] Another investigation by Liu et al. [24] to repair damaged aircraft components by laser cladding techniques shows much lower fatigue life of cladded components than that of the substrate. The lower fatigue life is thought to be due to a weak interface between the clad and substrate. A study on fracture behaviour of laser-clad joints of Stellite 21 on AISI 316L Stainless Steel (SS) was conducted by Ganesh et al. [25]. The study has been broadly performed on two kinds of laser-clad specimens (i) involving direct deposition of Stellite 21 on SS (direct) and (ii) involving gradients in the chemical composition across the substrate/clad interface (graded). Both “direct” and “graded” interfaces of laser-clad specimens exhibited superior fatigue strength (in the investigated stress range of 200–300 MPa) than a type 316L SS substrate, as fatigue crack nucleation in all the composite specimens took place in the substrate. This phenomenon is also confirmed in [26]. The fatigue life of cladded specimen did not shorten since global cracks always develop in the substrate. Fatigue crack growth and fracture toughness
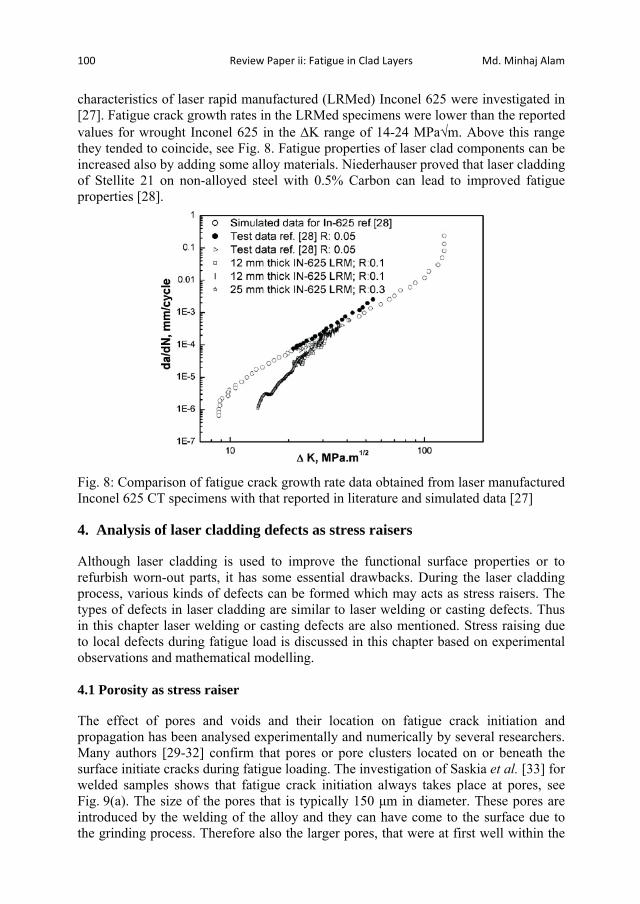
100 Review Paper ii: Fatigue in Clad Layers Md. Minhaj Alam
characteristics of laser rapid manufactured (LRMed) Inconel 625 were investigated in [27]. Fatigue crack growth rates in the LRMed specimens were lower than the reported values for wrought Inconel 625 in the K range of 14-24 MPa m. Above this range they tended to coincide, see Fig. 8. Fatigue properties of laser clad components can be increased also by adding some alloy materials. Niederhauser proved that laser cladding of Stellite 21 on non-alloyed steel with 0.5% Carbon can lead to improved fatigue properties [28].
Fig. 8: Comparison of fatigue crack growth rate data obtained from laser manufactured Inconel 625 CT specimens with that reported in literature and simulated data [27] 4. Analysis of laser cladding defects as stress raisers Although laser cladding is used to improve the functional surface properties or to refurbish worn-out parts, it has some essential drawbacks. During the laser cladding process, various kinds of defects can be formed which may acts as stress raisers. The types of defects in laser cladding are similar to laser welding or casting defects. Thus in this chapter laser welding or casting defects are also mentioned. Stress raising due to local defects during fatigue load is discussed in this chapter based on experimental observations and mathematical modelling. 4.1 Porosity as stress raiser The effect of pores and voids and their location on fatigue crack initiation and propagation has been analysed experimentally and numerically by several researchers. Many authors [29-32] confirm that pores or pore clusters located on or beneath the surface initiate cracks during fatigue loading. The investigation of Saskia et al. [33] for welded samples shows that fatigue crack initiation always takes place at pores, see Fig. 9(a). The size of the pores that is typically 150 m in diameter. These pores are introduced by the welding of the alloy and they can have come to the surface due to the grinding process. Therefore also the larger pores, that were at first well within the
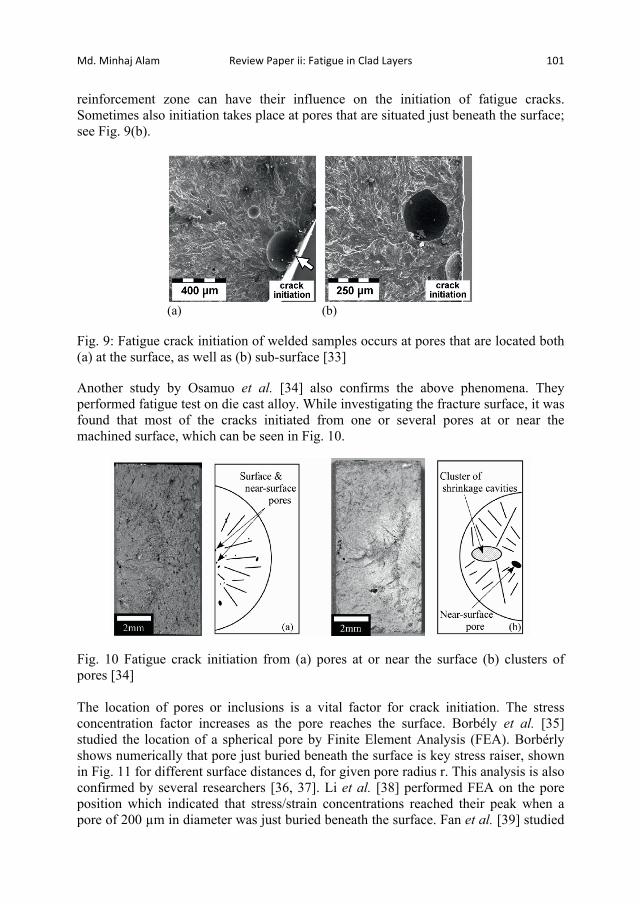
Md. Minhaj Alam Review Paper ii: Fatigue in Clad Layers 101
reinforcement zone can have their influence on the initiation of fatigue cracks. Sometimes also initiation takes place at pores that are situated just beneath the surface; see Fig. 9(b).
(a) (b)
Fig. 9: Fatigue crack initiation of welded samples occurs at pores that are located both (a) at the surface, as well as (b) sub-surface [33] Another study by Osamuo et al. [34] also confirms the above phenomena. They performed fatigue test on die cast alloy. While investigating the fracture surface, it was found that most of the cracks initiated from one or several pores at or near the machined surface, which can be seen in Fig. 10.
Fig. 10 Fatigue crack initiation from (a) pores at or near the surface (b) clusters of pores [34] The location of pores or inclusions is a vital factor for crack initiation. The stress concentration factor increases as the pore reaches the surface. Borbély et al. [35] studied the location of a spherical pore by Finite Element Analysis (FEA). Borbérly shows numerically that pore just buried beneath the surface is key stress raiser, shown in Fig. 11 for different surface distances d, for given pore radius r. This analysis is also confirmed by several researchers [36, 37]. Li et al. [38] performed FEA on the pore position which indicated that stress/strain concentrations reached their peak when a pore of 200 μm in diameter was just buried beneath the surface. Fan et al. [39] studied
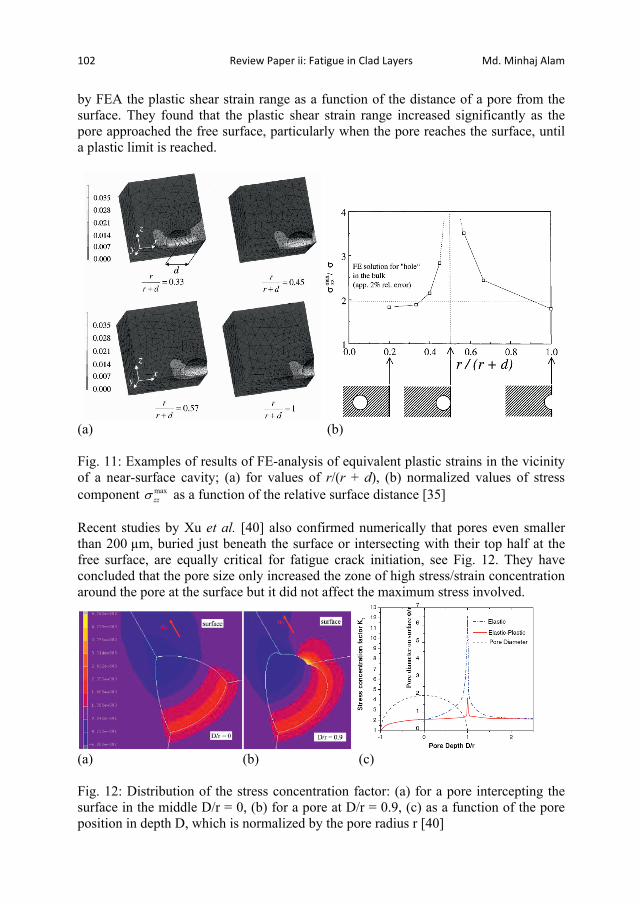
102 Review Paper ii: Fatigue in Clad Layers Md. Minhaj Alam
by FEA the plastic shear strain range as a function of the distance of a pore from the surface. They found that the plastic shear strain range increased significantly as the pore approached the free surface, particularly when the pore reaches the surface, until a plastic limit is reached.
(a) (b)
Fig. 11: Examples of results of FE-analysis of equivalent plastic strains in the vicinity of a near-surface cavity; (a) for values of r/(r + d), (b) normalized values of stress component max
zz as a function of the relative surface distance [35] Recent studies by Xu et al. [40] also confirmed numerically that pores even smaller than 200 μm, buried just beneath the surface or intersecting with their top half at the free surface, are equally critical for fatigue crack initiation, see Fig. 12. They have concluded that the pore size only increased the zone of high stress/strain concentration around the pore at the surface but it did not affect the maximum stress involved.
(a) (b) (c) Fig. 12: Distribution of the stress concentration factor: (a) for a pore intercepting the surface in the middle D/r = 0, (b) for a pore at D/r = 0.9, (c) as a function of the pore position in depth D, which is normalized by the pore radius r [40]

Md. Minhaj Alam Review Paper ii: Fatigue in Clad Layers 103
Many other researchers have used X-ray Computer Tomography (CT) to visualize and track the fatigue crack initiation pores [34] and to quantify the stress concentration around those pores by image based FE methods [41-42]. Marrow et al. [43] performed in situ X-ray synchrotron radiation on fatigue specimen to observe the early stage of fatigue crack nucleation and suggested that large pores act as notches to concentrate stress on smaller pores which leads to crack initiation. In a study by Toda et al. [44], the relationship between fatigue crack initiation and micro pores has been investigated using high-resolution X-ray micro-tomography, see Fig. 13, combined with two kinds of statistical analysis. It has been revealed that consideration of micro pore pairs is necessary. A number of parameters for paired micro pores that may be strongly associated with fatigue crack initiation are recommended to be statistically evaluated.
Fig. 13: 3-D view of pores in a cast metal and magnified fatigue crack initiation behaviour for two different numbers of cycles [44]
A methodology to evaluate the effect of pores on fatigue life of aluminium die casts is proposed in terms of stress concentration factor by Bidhar et al. [45]. They proposed an empirical formulation of an elastic stress concentration factor around a pair of spherical shaped cavities by numerical results of three-dimensional Finite Element Linear Elastic Analyses, see Fig. 14. The effect of inter-pore distance and orientation of inter-pore axis to loading direction, on the stress concentration factor is obtained numerically by systematically changing each of these parameters, as shown in Fig. 15.

104 Review Paper ii: Fatigue in Clad Layers Md. Minhaj Alam
Fig. 14: Dependence of the maximum principal stress location on angle of orientation of inter-cavity axis to loading direction at =1.01 for six different angles of orientation [45]
Fig. 15: Prediction and curve fitting showing the variation of the stress concentration factor on the normalized inter cavity distance [45]
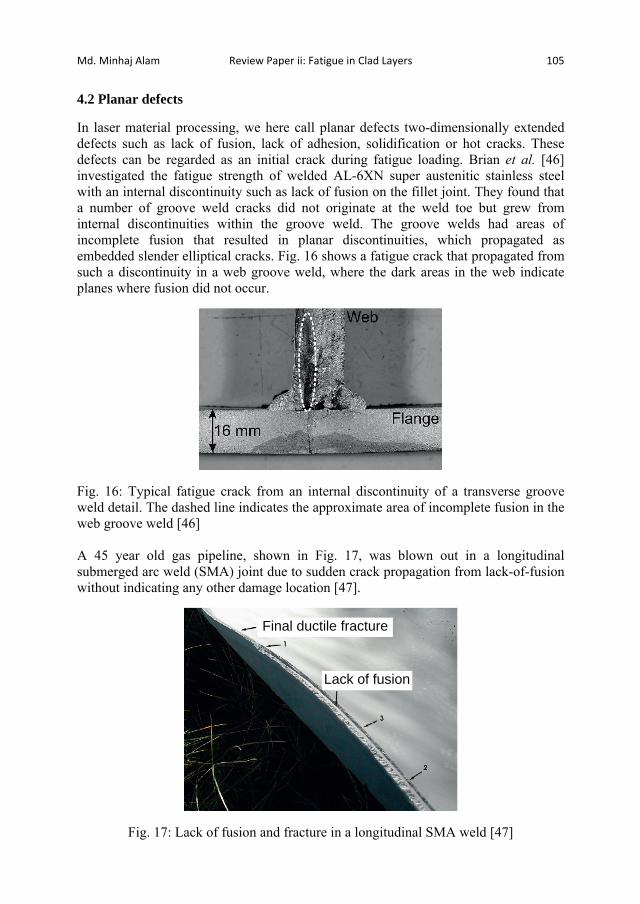
Md. Minhaj Alam Review Paper ii: Fatigue in Clad Layers 105
4.2 Planar defects In laser material processing, we here call planar defects two-dimensionally extended defects such as lack of fusion, lack of adhesion, solidification or hot cracks. These defects can be regarded as an initial crack during fatigue loading. Brian et al. [46] investigated the fatigue strength of welded AL-6XN super austenitic stainless steel with an internal discontinuity such as lack of fusion on the fillet joint. They found that a number of groove weld cracks did not originate at the weld toe but grew from internal discontinuities within the groove weld. The groove welds had areas of incomplete fusion that resulted in planar discontinuities, which propagated as embedded slender elliptical cracks. Fig. 16 shows a fatigue crack that propagated from such a discontinuity in a web groove weld, where the dark areas in the web indicate planes where fusion did not occur.
Fig. 16: Typical fatigue crack from an internal discontinuity of a transverse groove weld detail. The dashed line indicates the approximate area of incomplete fusion in the web groove weld [46] A 45 year old gas pipeline, shown in Fig. 17, was blown out in a longitudinal submerged arc weld (SMA) joint due to sudden crack propagation from lack-of-fusion without indicating any other damage location [47].
Fig. 17: Lack of fusion and fracture in a longitudinal SMA weld [47]
Lack of fusion
Final ductile fracture

106 Review Paper ii: Fatigue in Clad Layers Md. Minhaj Alam
Lack of adhesion was found in H13 tool steel Fig. 18 due to incomplete fusion of the substrate by Borges et al. [48]. Cold cracks were also found by Broges in [48]. They have mentioned that the cold cracks in laser cladding with filler wire are a result of the thermal residual stresses. Cold cracks appear when the clad is too thick and near to stress concentration areas due to thermal residual stress produced during rapid cooling of laser cladding, see Fig. 19(a) and 19(b).
Fig. 18: Lack of adhesion in a clad in H13 tool steel with three coating layers [48]
(a) (b) Fig. 19: Cold cracks in clad in H13 tool steel, (a) for three layers, (b) for two layers [47] 4.3 Surface roughness Surface roughness plays an important role on the fatigue life of the specimen. In the as-clad components, the wavy surface with sharp notches, low side-bead angles and surface ripples from overlapping clads creates a rough surface that generates stress peaks during fatigue loading conditions, which can initiate cracking. Resch et al. [49] identified different surface roughness by three levels of powder feeding rates. Low feed rates yielded smooth surfaces due to substantial remelting of previous layers while high feeding rates caused high roughness and an increased susceptibility of
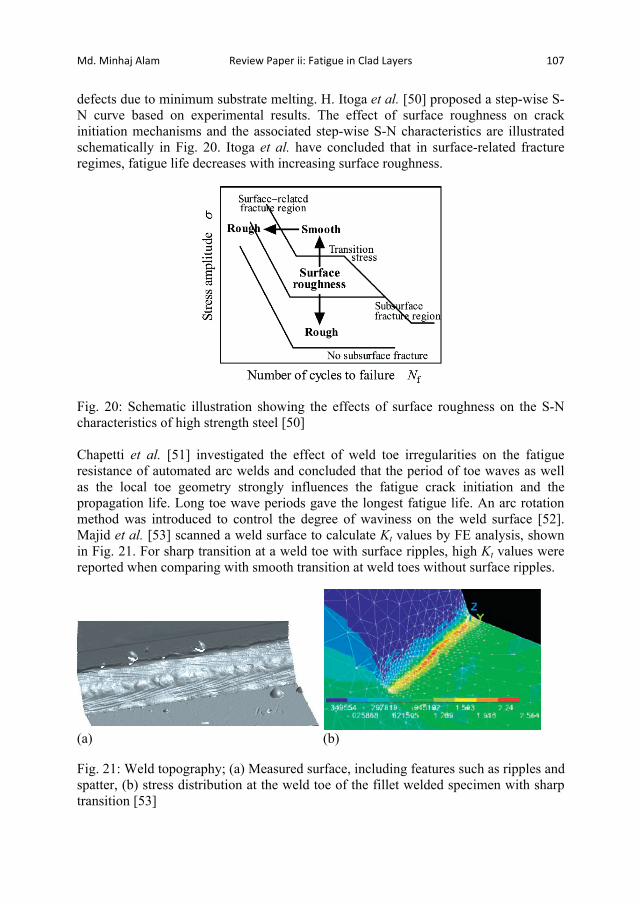
Md. Minhaj Alam Review Paper ii: Fatigue in Clad Layers 107
defects due to minimum substrate melting. H. Itoga et al. [50] proposed a step-wise S-N curve based on experimental results. The effect of surface roughness on crack initiation mechanisms and the associated step-wise S-N characteristics are illustrated schematically in Fig. 20. Itoga et al. have concluded that in surface-related fracture regimes, fatigue life decreases with increasing surface roughness.
Fig. 20: Schematic illustration showing the effects of surface roughness on the S-N characteristics of high strength steel [50] Chapetti et al. [51] investigated the effect of weld toe irregularities on the fatigue resistance of automated arc welds and concluded that the period of toe waves as well as the local toe geometry strongly influences the fatigue crack initiation and the propagation life. Long toe wave periods gave the longest fatigue life. An arc rotation method was introduced to control the degree of waviness on the weld surface [52]. Majid et al. [53] scanned a weld surface to calculate Kt values by FE analysis, shown in Fig. 21. For sharp transition at a weld toe with surface ripples, high Kt values were reported when comparing with smooth transition at weld toes without surface ripples.
(a) (b) Fig. 21: Weld topography; (a) Measured surface, including features such as ripples and spatter, (b) stress distribution at the weld toe of the fillet welded specimen with sharp transition [53]
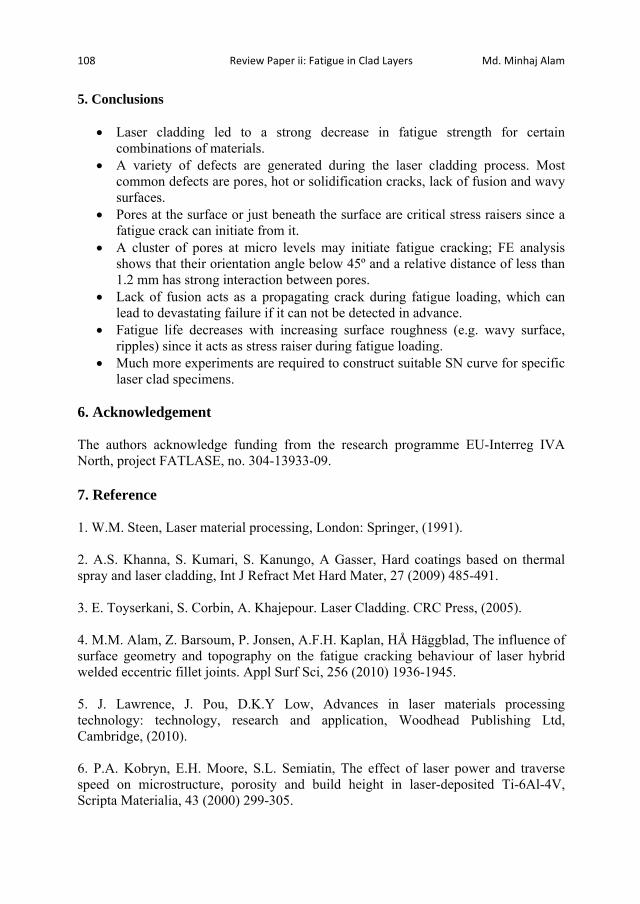
108 Review Paper ii: Fatigue in Clad Layers Md. Minhaj Alam
5. Conclusions
Laser cladding led to a strong decrease in fatigue strength for certain combinations of materials.
A variety of defects are generated during the laser cladding process. Most common defects are pores, hot or solidification cracks, lack of fusion and wavy surfaces.
Pores at the surface or just beneath the surface are critical stress raisers since a fatigue crack can initiate from it.
A cluster of pores at micro levels may initiate fatigue cracking; FE analysis shows that their orientation angle below 45º and a relative distance of less than 1.2 mm has strong interaction between pores.
Lack of fusion acts as a propagating crack during fatigue loading, which can lead to devastating failure if it can not be detected in advance.
Fatigue life decreases with increasing surface roughness (e.g. wavy surface, ripples) since it acts as stress raiser during fatigue loading.
Much more experiments are required to construct suitable SN curve for specific laser clad specimens.
6. Acknowledgement The authors acknowledge funding from the research programme EU-Interreg IVA North, project FATLASE, no. 304-13933-09. 7. Reference 1. W.M. Steen, Laser material processing, London: Springer, (1991). 2. A.S. Khanna, S. Kumari, S. Kanungo, A Gasser, Hard coatings based on thermal spray and laser cladding, Int J Refract Met Hard Mater, 27 (2009) 485-491. 3. E. Toyserkani, S. Corbin, A. Khajepour. Laser Cladding. CRC Press, (2005). 4. M.M. Alam, Z. Barsoum, P. Jonsen, A.F.H. Kaplan, HÅ Häggblad, The influence of surface geometry and topography on the fatigue cracking behaviour of laser hybrid welded eccentric fillet joints. Appl Surf Sci, 256 (2010) 1936-1945. 5. J. Lawrence, J. Pou, D.K.Y Low, Advances in laser materials processing technology: technology, research and application, Woodhead Publishing Ltd, Cambridge, (2010). 6. P.A. Kobryn, E.H. Moore, S.L. Semiatin, The effect of laser power and traverse speed on microstructure, porosity and build height in laser-deposited Ti-6Al-4V, Scripta Materialia, 43 (2000) 299-305.

Md. Minhaj Alam Review Paper ii: Fatigue in Clad Layers 109
7. P. Gorman, J.E. Smugeresky, D.M. Keicher, Evaluation of property dependence on build rate for LENS powder metal deposition, Symposium on Rapid Prototyping of Materials at the TMS Fall Meeting, Columbus OH USA, Minerals, Metals and Materials Society, (2002). 8. G. Verhaeghe, P.A. Hilton, Laser welding of low-porosity aerospace aluminium alloy, In Hinduja, S. (Ed.) 34th International MATADOR Conference. UMIST Manchester UK, Springer, (2004). 9. N. Chawla, T.F. Murphy, K.S. Narasimhan, M. Koopman, K.K. Chawla, Axial fatigue behaviour of binder-treated versus diffusion alloyed powder metallurgy steels, Mater Sci Eng A 308 (2001) 180-188. 10. H. D’Armas, L. Llanes, J. Penafiel, J. Bas, M. Anglada, Tempering effects on the tensile response and fatigue life behaviour of a sinterhardened steel, Mater Sci Eng A 277 (2000) 291-296. 11. S. Carabajar, C. Verdu, A. Hamel, R. Fougeres, Fatigue behaviour of a nickel alloyed sintered steel, Mater Sci Eng A 257 (1998) 225-234. 12. S. Carabajar, C. Verdu, R. Fougeres, Damage mechanisms of a nickel alloyed sintered steel during tensile tests, Mater Sci Eng A 232 (1997) 80-87. 13. P. Norman, H. Engström, A.F.H. Kaplan, State-of-the-art of monitoring and imaging of laser welding defects, Proc. 11th Nordic Laser Material Processing Conference, NOLAMP 11, Aug. 20-22, Lappeenranta Univ. of Technology, Lappeenranta, Finland, (2007). 14. M.M. Alam, P. Jonsen, A.F.H. Kaplan, State-of-the-art of fracture mechanics and fatigue analysis of welded joints, Proc. of NOLAMP 12 Conference, Copenhagen, Denmark 24-26 August, (2009). 15. J. Mackerle, Finite element analysis and simulation of welding-an addendum: a bibliography (1996–2001), Modelling Simul. Mater. Sci. Eng. 10 (2002) 295-318. 16. Y. Murakami, Material defects as the basis of fatigue design. Int J of Fatig 41(2012) 2-10. 17. R. Vilar, Laser cladding, J of Laser Appl 11 (1999) 64-79. 18. X.G. Chen, S. Engler, Formation of Gas Porosity in Aluminium Alloys, American Foundry Society Transactions 94 (1993) 673-682. 19. S. Zhou, Y. Huang, X. Zeng, Study of Ni-based WC composite coatings by laser induction hybrid rapid cladding with elliptical spot, Appl Surf Sci 254 (2008) 3110-3119.
110 Review Paper ii: Fatigue in Clad Layers Md. Minhaj Alam
20. S. Zhou, X. Zeng, Q. Hu, Y. Huang, Analysis of crack behavior for Ni-based WC composite coatings by laser cladding and crack-free realization, Appl Surf Sci 255 (2008) 1646-1653. 21. H. Gedda, A. Kaplan, J. Powell, Melt-solid interactions in laser cladding and laser casting, Metall Mater Trans B: Process Metall Mater Process Sci 36 (2005) 683-689. 22. H. Koehler, J. Schumacher, K. Schuischel, K. Partes, H. Bomas, F. Jablonski, F. Vollertsen, R. Kienzler, An approach to calculate fatigue properties of laser cladded components, Prod Eng Res Devel 6 (2012) 137-148. 23. H. Koehler, K. Partes, T. Seefeld, F. Vollertsen, Influence of laser reconditioning on fatigue properties of crankshafts, Physics Procedia 12 (2011) 512-518. 24. Q. Liu, M. Janardhana, B. Hinton, M. Brandt, K. Sharp, Laser cladding as a potential repair technology for damaged aircraft components, Int J Struct Integ 2 (2011) 314-331. 25. P. Ganesha, A. Moitra, P. Tiwari, S. Sathyanarayanan, H. Kumar, S.K. Rai, R. Kaul, C.P. Paul, R.C. Prasad, L.M. Kukreja, Fracture behavior of laser-clad joint of Stellite 21 on AISI 316L stainless steel, Mater Sci Eng A 527 (2010) 3748-3756. 26. S. Niederhauser, B. Karlsson, Fatigue behaviour of Co-Cr laser cladded steel plates for railway applications, Wear 258 (2005) 1156-1164. 27. P. Ganesh, R. Kaul, C.P. Paul, P. Tiwari, S.K. Rai, R.C. Prasad, L.M. Kukreja, Fatigue and fracture toughness characteristics of laser rapid manufactured Inconel 625 structures, Mater Sci Eng A 527 (2010) 7490-7497. 28. S. Niederhauser, B. Karlsson, Mechanical properties of laser cladded steel. Mater Sci Technol 19 (2003) 1611-1616. 29. P.K. Rohatgi S. Alaraj, R.B. Thakkar, A. Daoud, Variation in fatigue properties of cast A359-SiC composites under total strain controlled conditions: Effects of porosity and inclusions, Composites: Part A 38 (2007) 1829-1841. 30. F. Wang, J. Xu, J. Li, X. Li, H. Wang, Fatigue crack initiation and propagation in A356 alloy reinforced with in situ TiB2 particles, Mater Des 33 (2012) 236-241. 31. J. Maa, B. Zhang, D. Xu, E.H. Han, W. Ke, Effects of inclusion and loading direction on the fatigue behaviour of hot rolled low carbon steel, Int J of Fatig 32 (2010) 1116-1125. 32. C. Li, F. Ellyin, S. Koh, S.J. Oh, Influence of porosity on fatigue resistance of cast SiC particulate-reinforced Al–Si alloy composite, Mater Sci Eng A 276 (2000) 218-25.
Md. Minhaj Alam Review Paper ii: Fatigue in Clad Layers 111
33. S.B. Vries, A. Bakker, G. C. A. M. Janssen, H. Wit, Fatigue crack initiation behavior of welded AA5083 in a seawater environment, J Eng Mater Tech 126 (2004) 199-203. 34. O. Kuwazuru, Y. Murata, Y. Hangai, T. Utsunomiya, S. Kitahara, N. Yoshikawa, X-Ray CT inspection for porosities and its effect on fatigue of die cast aluminium alloy, J Solid Mech Mater Eng 2 (2008) 1220-1231. 35. A. Borbély, H. Mughrabi, G. Eisenmeier, H.W. Höppel, A finite element modelling study of strain localization in the vicinity of near-surface cavities as a cause of subsurface fatigue crack initiation, Int J of Frac 115 (2002) 227-232. 36. Y. X. Gao, J. Z. Yi, P. D. Lee, T. C. Lindley, The effect of porosity on the fatigue life of cast aluminium-silicon alloys, Fatig Fract Eng Mater Struct 27 (2004) 559-570. 37. J.P. Weiler, J.T. Wood, Modeling fracture properties in a die-cast AM60B magnesium alloy II-The effects of the size and location of porosity determined using finite element simulations, Mater Sci Eng A 527 (2009) 32-37. 38. P. Li, P.D. Lee, D.M. Maijer, T.C. Lindley, Quantification of the interaction within defect populations on fatigue behavior in an aluminum alloy, Acta Materialia 57 (2009) 3539-3548. 39. J.H. Fan, D.L. McDowell, M.F. Horstemeyer, K. Gall, Cyclic plasticity at pores and inclusions in cast Al–Si alloys, Eng Fract Mech 70 (2003) 1281-1302. 40. Z. Xu, W. Wen, T. Zhai, Effects of pore position in depth on stress/strain concentration and fatigue crack initiation, Metall Mater Trans A 43 (2011) 2763-2770. 41. R. A. Hardin, Prediction of the fatigue life of cast steel containing shrinkage porosity, Metall Mater Trans A 40 (2009) 581-597. 42. Y. Lu, Experimental and numerical study of the effect of porosity on fatigue crack initiation of HPDC magnesium AM60B alloy, J of Alloy Comp 470 (2009) 202-213. 43. T. J. Marrow, High resolution X-ray tomography of short fatigue crack nucleation in austempered ductile cast iron, Int J Fatig 26 (2004) 717-725. 44. H. Toda, S. Masuda, R. Batres, M. Kobayashi, S. Aoyama, M. Onodera, R. Furusawa, K. Uesugi, A. Takeuchi, Y. Suzuki, Statistical assessment of fatigue crack initiation from sub-surface hydrogen micropores in high-quality die-cast aluminum, Acta Materialia 59 (2011) 4990-4998. 45. S. Bidhar, O. Kuwazuru, Y. Hangai, T. Yano, T. Utsunomiya, N. Yoshikawa, Empirical prediction of stress concentration factor for a Pair of Spherical Cavities, 4th

112 Review Paper ii: Fatigue in Clad Layers Md. Minhaj Alam
International conference on Modelling, Simulation and Applied Optimization (ICMSAO), (2011). 46. B. Metrovich, J. W. Fisher, B. T. Yen, E. J. Kaufmann, X. Cheng, Z. Ma, Fatigue strength of welded AL-6XN superaustenitic stainless steel, Int J Fatig 25 (2003) 1309-1315. 47. P.G. Fazzini, J.C. Belmonte, M.D. Chapetti,J.L. Otegui, Fatigue assessment of a double submerged arc welded gas pipeline, Int J of Fatig 29 (2007) 1115-1124. 48. B. Borges, L. Quintino, M. R. Miranda, P. Carr, Imperfections in laser clading with powder and wire fillers, Int J Adv Manuf Technol 50 (2010) 175-183. 49. M. Resch, A.F.H. Kaplan, D. Schuocker, Laser-assisted generating of three-dimensional parts by the blown powder process. XIII International Symposium on Gas Flow and Chemical Lasers. Florence Italy, Society of Photo-Optical Instrumentation Engineers, 555-558 (2001). 50. H. Itoga, K. Tokaji, M. Nakajima, H.N. Ko, Effect of surface roughness on step wise S-N characteristics in high strength steel, Int J Fatig 25 (2003) 379-385. 51. M.D. Chapetti, J.L. Otegui, Importance of toe irregularity for fatigue resistance of automatic welds, Int J Fatig 17 (1995) 531-538. 52. M.D. Chapetti, J.L. Otegui, Controlled toe waviness as a means to increase fatigue resistance of automatic welds in transverse loading, Int J Fatig 19 (1997) 667-675. 53. M.F. Sohi, N. Järvstråt, B. Jonsson, Surface geometry measurements and the experimental and numerical investigation of stress concentration in fillet welds, International Institute of Welding, XIII-2142-06 (2006).

Md. Minhaj Alam Paper I: Influence of Surface Geometry and Topography 113
ANNEX B Paper I THE INFLUENCE OF SURFACE GEOMETRY AND TOPOGRAPHY ON THE FATIGUE CRACKING BEHAVIOUR OF LASER HYBRID WELDED ECCENTRIC FILLET JOINTS M. M. Alam, Z. Barsoum, P. Jonsén, H. Å. Häggblad, A. F. H. Kaplan Applied Surface Science, 2010; 256: 1936-1945

114 Paper I: Influence of Surface Geometry and Topography Md. Minhaj Alam
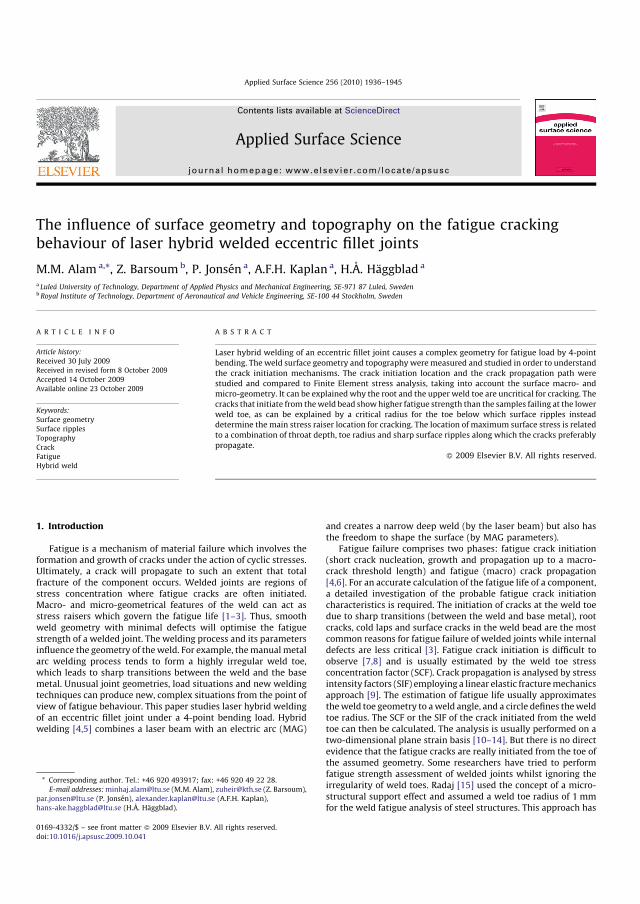
The influence of surface geometry and topography on the fatigue crackingbehaviour of laser hybrid welded eccentric fillet joints
M.M. Alam a,*, Z. Barsoumb, P. Jonsen a, A.F.H. Kaplan a, H.A. Haggblad a
a Lulea University of Technology, Department of Applied Physics and Mechanical Engineering, SE-971 87 Lulea, SwedenbRoyal Institute of Technology, Department of Aeronautical and Vehicle Engineering, SE-100 44 Stockholm, Sweden
1. Introduction
Fatigue is a mechanism of material failure which involves theformation and growth of cracks under the action of cyclic stresses.Ultimately, a crack will propagate to such an extent that totalfracture of the component occurs. Welded joints are regions ofstress concentration where fatigue cracks are often initiated.Macro- and micro-geometrical features of the weld can act asstress raisers which govern the fatigue life [1–3]. Thus, smoothweld geometry with minimal defects will optimise the fatiguestrength of a welded joint. The welding process and its parametersinfluence the geometry of theweld. For example, themanualmetalarc welding process tends to form a highly irregular weld toe,which leads to sharp transitions between the weld and the basemetal. Unusual joint geometries, load situations and new weldingtechniques can produce new, complex situations from the point ofview of fatigue behaviour. This paper studies laser hybrid weldingof an eccentric fillet joint under a 4-point bending load. Hybridwelding [4,5] combines a laser beam with an electric arc (MAG)
and creates a narrow deep weld (by the laser beam) but also hasthe freedom to shape the surface (by MAG parameters).
Fatigue failure comprises two phases: fatigue crack initiation(short crack nucleation, growth and propagation up to a macro-crack threshold length) and fatigue (macro) crack propagation[4,6]. For an accurate calculation of the fatigue life of a component,a detailed investigation of the probable fatigue crack initiationcharacteristics is required. The initiation of cracks at the weld toedue to sharp transitions (between the weld and base metal), rootcracks, cold laps and surface cracks in the weld bead are the mostcommon reasons for fatigue failure of welded joints while internaldefects are less critical [3]. Fatigue crack initiation is difficult toobserve [7,8] and is usually estimated by the weld toe stressconcentration factor (SCF). Crack propagation is analysed by stressintensity factors (SIF) employing a linear elastic fracturemechanicsapproach [9]. The estimation of fatigue life usually approximatestheweld toe geometry to aweld angle, and a circle defines theweldtoe radius. The SCF or the SIF of the crack initiated from the weldtoe can then be calculated. The analysis is usually performed on atwo-dimensional plane strain basis [10–14]. But there is no directevidence that the fatigue cracks are really initiated from the toe ofthe assumed geometry. Some researchers have tried to performfatigue strength assessment of welded joints whilst ignoring theirregularity of weld toes. Radaj [15] used the concept of a micro-structural support effect and assumed a weld toe radius of 1 mmfor the weld fatigue analysis of steel structures. This approach has
Applied Surface Science 256 (2010) 1936–1945
A R T I C L E I N F O
Article history:
Received 30 July 2009
Received in revised form 8 October 2009
Accepted 14 October 2009
Available online 23 October 2009
Keywords:
Surface geometry
Surface ripples
Topography
Crack
Fatigue
Hybrid weld
A B S T R A C T
Laser hybrid welding of an eccentric fillet joint causes a complex geometry for fatigue load by 4-point
bending. The weld surface geometry and topography were measured and studied in order to understand
the crack initiation mechanisms. The crack initiation location and the crack propagation path were
studied and compared to Finite Element stress analysis, taking into account the surface macro- and
micro-geometry. It can be explained why the root and the upper weld toe are uncritical for cracking. The
cracks that initiate from theweld bead showhigher fatigue strength than the samples failing at the lower
weld toe, as can be explained by a critical radius for the toe below which surface ripples instead
determine the main stress raiser location for cracking. The location of maximum surface stress is related
to a combination of throat depth, toe radius and sharp surface ripples along which the cracks preferably
propagate.
� 2009 Elsevier B.V. All rights reserved.
* Corresponding author. Tel.: +46 920 493917; fax: +46 920 49 22 28.
E-mail addresses:[email protected] (M.M. Alam), [email protected] (Z. Barsoum),
[email protected] (P. Jonsen), [email protected] (A.F.H. Kaplan),
[email protected] (H.A. Haggblad).
Contents lists available at ScienceDirect
Applied Surface Science
journa l homepage: www.e lsev ier .com/ locate /apsusc
0169-4332/$ – see front matter � 2009 Elsevier B.V. All rights reserved.
doi:10.1016/j.apsusc.2009.10.041
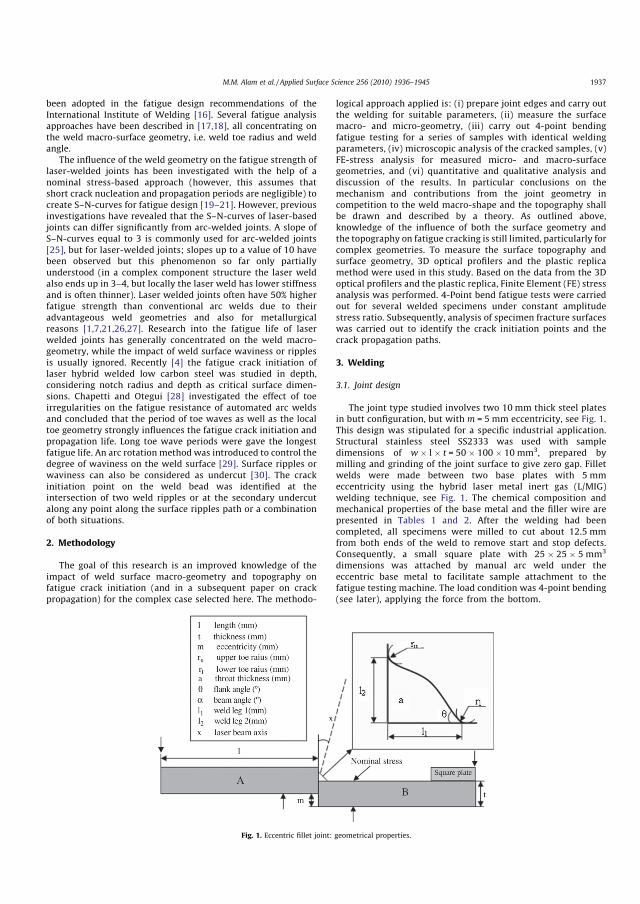
been adopted in the fatigue design recommendations of theInternational Institute of Welding [16]. Several fatigue analysisapproaches have been described in [17,18], all concentrating onthe weld macro-surface geometry, i.e. weld toe radius and weldangle.
The influence of the weld geometry on the fatigue strength oflaser-welded joints has been investigated with the help of anominal stress-based approach (however, this assumes thatshort crack nucleation and propagation periods are negligible) tocreate S–N-curves for fatigue design [19–21]. However, previousinvestigations have revealed that the S–N-curves of laser-basedjoints can differ significantly from arc-welded joints. A slope ofS–N-curves equal to 3 is commonly used for arc-welded joints[25], but for laser-welded joints; slopes up to a value of 10 havebeen observed but this phenomenon so far only partiallyunderstood (in a complex component structure the laser weldalso ends up in 3–4, but locally the laser weld has lower stiffnessand is often thinner). Laser welded joints often have 50% higherfatigue strength than conventional arc welds due to theiradvantageous weld geometries and also for metallurgicalreasons [1,7,21,26,27]. Research into the fatigue life of laserwelded joints has generally concentrated on the weld macro-geometry, while the impact of weld surface waviness or ripplesis usually ignored. Recently [4] the fatigue crack initiation oflaser hybrid welded low carbon steel was studied in depth,considering notch radius and depth as critical surface dimen-sions. Chapetti and Otegui [28] investigated the effect of toeirregularities on the fatigue resistance of automated arc weldsand concluded that the period of toe waves as well as the localtoe geometry strongly influences the fatigue crack initiation andpropagation life. Long toe wave periods were gave the longestfatigue life. An arc rotation method was introduced to control thedegree of waviness on the weld surface [29]. Surface ripples orwaviness can also be considered as undercut [30]. The crackinitiation point on the weld bead was identified at theintersection of two weld ripples or at the secondary undercutalong any point along the surface ripples path or a combinationof both situations.
2. Methodology
The goal of this research is an improved knowledge of theimpact of weld surface macro-geometry and topography onfatigue crack initiation (and in a subsequent paper on crackpropagation) for the complex case selected here. The methodo-
logical approach applied is: (i) prepare joint edges and carry outthe welding for suitable parameters, (ii) measure the surfacemacro- and micro-geometry, (iii) carry out 4-point bendingfatigue testing for a series of samples with identical weldingparameters, (iv) microscopic analysis of the cracked samples, (v)FE-stress analysis for measured micro- and macro-surfacegeometries, and (vi) quantitative and qualitative analysis anddiscussion of the results. In particular conclusions on themechanism and contributions from the joint geometry incompetition to the weld macro-shape and the topography shallbe drawn and described by a theory. As outlined above,knowledge of the influence of both the surface geometry andthe topography on fatigue cracking is still limited, particularly forcomplex geometries. To measure the surface topography andsurface geometry, 3D optical profilers and the plastic replicamethod were used in this study. Based on the data from the 3Doptical profilers and the plastic replica, Finite Element (FE) stressanalysis was performed. 4-Point bend fatigue tests were carriedout for several welded specimens under constant amplitudestress ratio. Subsequently, analysis of specimen fracture surfaceswas carried out to identify the crack initiation points and thecrack propagation paths.
3. Welding
3.1. Joint design
The joint type studied involves two 10 mm thick steel platesin butt configuration, but with m = 5 mm eccentricity, see Fig. 1.This design was stipulated for a specific industrial application.Structural stainless steel SS2333 was used with sampledimensions of w � l � t = 50 � 100 � 10 mm3, prepared bymilling and grinding of the joint surface to give zero gap. Filletwelds were made between two base plates with 5 mmeccentricity using the hybrid laser metal inert gas (L/MIG)welding technique, see Fig. 1. The chemical composition andmechanical properties of the base metal and the filler wire arepresented in Tables 1 and 2. After the welding had beencompleted, all specimens were milled to cut about 12.5 mmfrom both ends of the weld to remove start and stop defects.Consequently, a small square plate with 25 � 25 � 5 mm3
dimensions was attached by manual arc weld under theeccentric base metal to facilitate sample attachment to thefatigue testing machine. The load condition was 4-point bending(see later), applying the force from the bottom.
Fig. 1. Eccentric fillet joint: geometrical properties.
M.M. Alam et al. / Applied Surface Science 256 (2010) 1936–1945 1937

3.2. Welding set-up
An Ytterbium Fiber Laser (IPG Laser YLR 15000) with amaximum power of 15 kW (wavelength 1070 nm), beam para-meters product 10.4 mmmrad delivered through a 200 mm fibercore, was in use for these experiments. The optics (focusingcollimating length = 300:150 = 2:1) created a beam with a focaldiameter of 400 mm and a Rayleigh length of �4 mm, with a focalplane position on the top surface of the weld. The laser was combinedwith a MIG-welding source (ESAB ARISTO). The filler wire, seeTables 1 and 2, had a diameter of 1.2 mm. During the hybrid laser/MIG-welding process, the laser beam was traveling 2 mm in front oftheMIG torch. Further process parameters are summarized in Table 3.
3.3. Welding samples
For statistical purpose, 13 samples were welded under identicalconditions. Fig. 2 shows a typical top surface and weld crosssection. The effective weld throat thickness is 6–7 mm and the leglength is 4 mm. As the bending force acts from the bottom, theweld root shape is not important, as this area is under compressivestress. In contrast, the shape of the top of the weld is critical to thefatigue performance of the specimen.
4. Weld surface shape analysis
4.1. Shape measurement
The surface geometry is mainly determined by the toe radii andtoe angles (see Fig. 1), and these were measured by the non-destructive plastic replica method [7,31]. The specimen surfacewas first polished to remove surface oxides. Afterwards the surfaceof the weld toes was filled with liquid silicon rubber. The rubberhardened within a few minutes, generating an inverted accurate3D-profile of the weld surface. The hardened profile was detachedfrom the surface and sliced in 4 positions. The cross sections thusgenerated which were used to measure the toe radii and angles by
optical microscopy. The measured data (radius and angle) werethen used to create a two-dimensional FE-model to calculate thestress concentration factor; Kt. Fig. 3 shows the relationshipbetween all toe radii and toe angles. The values were measured atthe positions 1 mm, 8 mm, 16 mm and 25 mm along the weld persample. In this figure all the measured values from plastic replicasare plotted. Smooth toe radii and smaller toe angle gives lowerstress concentration factor [25]. Due to smooth toe surfacegeometry, weld failure shifted from the toe region towards theweld bead. Thoughmany researchers have shown that toe radius isthe most significant parameter for the stress concentration[7,32,33], out of our thirteen samples, only 4 specimens werecracked at the lower toe region whereas the rest of the specimenscracked at theweld bead, i.e. in theweld surface ripples. Therefore,the topography (micro-geometry) of the welds was also studied.
Fig. 2. Typical resulting weld: (a) top surface appearance, and (b) cross section.
Table 1Chemical composition [%] of the materials used for the sheets and for the filler wire.
Material C Si Mn Cr Ni P S N
SS142333 (sheets) 0.05 1.0 2.0 19.0 11.0 0.045 0.030 –
Avesta 253MA (wire) 0.07 1.6 0.6 21.0 10.0 – – 0.15
Table 2Mechanical properties of the materials used.
Material Rp0.2(N/mm2)
min
Rm(N/mm2) A5 (%)
min
Hardness,
HB max
SS142333 (sheets) 210 490–690 45 200
Avesta 253MA (wire) 440 680 38 210
Table 3Hybrid welding parameters.
Parameter Value/type
MIG current (constant) 328A
MIG voltage (resulting) 27V
Pulse time 2.4ms
Frequency 90Hz
Wire stick out length 16mm
Wire feed rate 4.2m/min
Shielding gas Ar
Shielding gas flow 20 l/min
Laser beam angle, a 108Welding speed 1.05m/min
Laser power 3.25kW
M.M. Alam et al. / Applied Surface Science 256 (2010) 1936–19451938
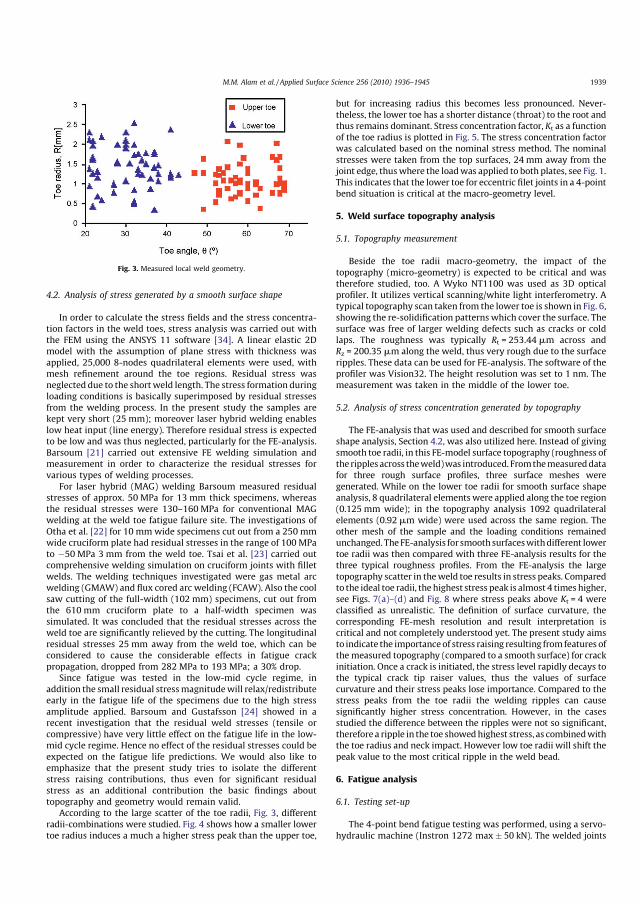
4.2. Analysis of stress generated by a smooth surface shape
In order to calculate the stress fields and the stress concentra-tion factors in the weld toes, stress analysis was carried out withthe FEM using the ANSYS 11 software [34]. A linear elastic 2Dmodel with the assumption of plane stress with thickness wasapplied, 25,000 8-nodes quadrilateral elements were used, withmesh refinement around the toe regions. Residual stress wasneglected due to the shortweld length. The stress formation duringloading conditions is basically superimposed by residual stressesfrom the welding process. In the present study the samples arekept very short (25 mm); moreover laser hybrid welding enableslow heat input (line energy). Therefore residual stress is expectedto be low and was thus neglected, particularly for the FE-analysis.Barsoum [21] carried out extensive FE welding simulation andmeasurement in order to characterize the residual stresses forvarious types of welding processes.
For laser hybrid (MAG) welding Barsoum measured residualstresses of approx. 50 MPa for 13 mm thick specimens, whereasthe residual stresses were 130–160 MPa for conventional MAGwelding at the weld toe fatigue failure site. The investigations ofOtha et al. [22] for 10 mmwide specimens cut out from a 250 mmwide cruciform plate had residual stresses in the range of 100 MPato �50 MPa 3 mm from the weld toe. Tsai et al. [23] carried outcomprehensive welding simulation on cruciform joints with filletwelds. The welding techniques investigated were gas metal arcwelding (GMAW) and flux cored arc welding (FCAW). Also the coolsaw cutting of the full-width (102 mm) specimens, cut out fromthe 610 mm cruciform plate to a half-width specimen wassimulated. It was concluded that the residual stresses across theweld toe are significantly relieved by the cutting. The longitudinalresidual stresses 25 mm away from the weld toe, which can beconsidered to cause the considerable effects in fatigue crackpropagation, dropped from 282 MPa to 193 MPa; a 30% drop.
Since fatigue was tested in the low-mid cycle regime, inaddition the small residual stressmagnitudewill relax/redistributeearly in the fatigue life of the specimens due to the high stressamplitude applied. Barsoum and Gustafsson [24] showed in arecent investigation that the residual weld stresses (tensile orcompressive) have very little effect on the fatigue life in the low-mid cycle regime. Hence no effect of the residual stresses could beexpected on the fatigue life predictions. We would also like toemphasize that the present study tries to isolate the differentstress raising contributions, thus even for significant residualstress as an additional contribution the basic findings abouttopography and geometry would remain valid.
According to the large scatter of the toe radii, Fig. 3, differentradii-combinations were studied. Fig. 4 shows how a smaller lowertoe radius induces a much a higher stress peak than the upper toe,
but for increasing radius this becomes less pronounced. Never-theless, the lower toe has a shorter distance (throat) to the root andthus remains dominant. Stress concentration factor, Kt as a functionof the toe radius is plotted in Fig. 5. The stress concentration factorwas calculated based on the nominal stress method. The nominalstresses were taken from the top surfaces, 24 mm away from thejoint edge, thuswhere the loadwas applied to both plates, see Fig. 1.This indicates that the lower toe for eccentric filet joints in a 4-pointbend situation is critical at the macro-geometry level.
5. Weld surface topography analysis
5.1. Topography measurement
Beside the toe radii macro-geometry, the impact of thetopography (micro-geometry) is expected to be critical and wastherefore studied, too. A Wyko NT1100 was used as 3D opticalprofiler. It utilizes vertical scanning/white light interferometry. Atypical topography scan taken from the lower toe is shown in Fig. 6,showing the re-solidification patterns which cover the surface. Thesurface was free of larger welding defects such as cracks or coldlaps. The roughness was typically Rt = 253.44mm across andRz = 200.35mm along the weld, thus very rough due to the surfaceripples. These data can be used for FE-analysis. The software of theprofiler was Vision32. The height resolution was set to 1 nm. Themeasurement was taken in the middle of the lower toe.
5.2. Analysis of stress concentration generated by topography
The FE-analysis that was used and described for smooth surfaceshape analysis, Section 4.2, was also utilized here. Instead of givingsmooth toe radii, in this FE-model surface topography (roughness ofthe ripplesacross theweld)was introduced. Fromthemeasureddatafor three rough surface profiles, three surface meshes weregenerated. While on the lower toe radii for smooth surface shapeanalysis, 8 quadrilateral elementswere applied along the toe region(0.125mm wide); in the topography analysis 1092 quadrilateralelements (0.92mm wide) were used across the same region. Theother mesh of the sample and the loading conditions remainedunchanged. TheFE-analysis for smoothsurfaceswithdifferent lowertoe radii was then compared with three FE-analysis results for thethree typical roughness profiles. From the FE-analysis the largetopography scatter in theweld toe results in stress peaks. Comparedto the ideal toe radii, thehighest stress peak is almost 4 timeshigher,see Figs. 7(a)–(d) and Fig. 8 where stress peaks above Kt = 4 wereclassified as unrealistic. The definition of surface curvature, thecorresponding FE-mesh resolution and result interpretation iscritical and not completely understood yet. The present study aimsto indicate the importanceof stress raising resulting fromfeatures ofthe measured topography (compared to a smooth surface) for crackinitiation. Once a crack is initiated, the stress level rapidly decays tothe typical crack tip raiser values, thus the values of surfacecurvature and their stress peaks lose importance. Compared to thestress peaks from the toe radii the welding ripples can causesignificantly higher stress concentration. However, in the casesstudied the difference between the ripples were not so significant,thereforea ripple in the toe showedhighest stress, as combinedwiththe toe radius and neck impact. However low toe radii will shift thepeak value to the most critical ripple in the weld bead.
6. Fatigue analysis
6.1. Testing set-up
The 4-point bend fatigue testing was performed, using a servo-hydraulic machine (Instron 1272 max � 50 kN). The welded joints
Fig. 3. Measured local weld geometry.
M.M. Alam et al. / Applied Surface Science 256 (2010) 1936–1945 1939
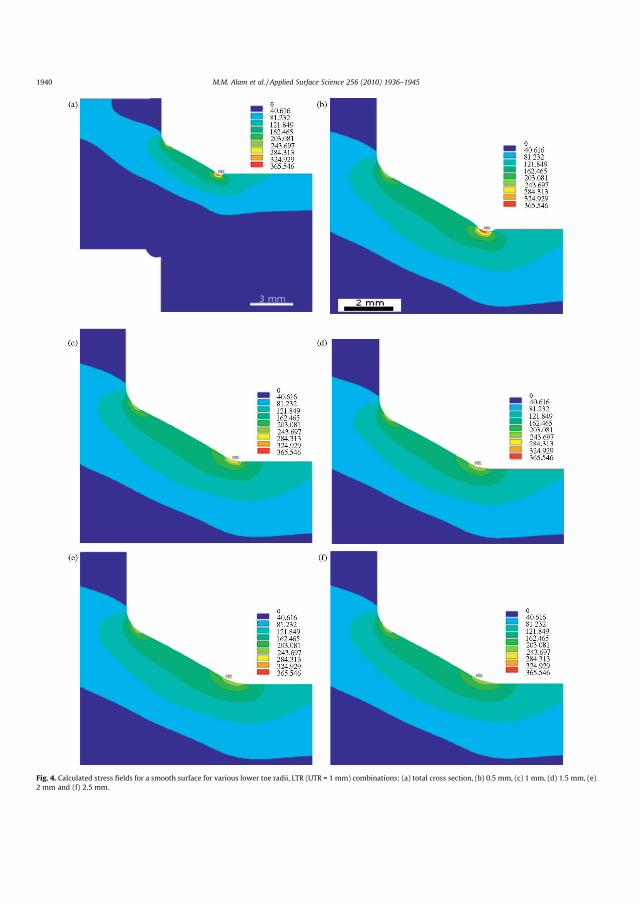
Fig. 4. Calculated stress fields for a smooth surface for various lower toe radii, LTR (UTR = 1 mm) combinations: (a) total cross section, (b) 0.5 mm, (c) 1 mm, (d) 1.5 mm, (e)
2 mm and (f) 2.5 mm.
M.M. Alam et al. / Applied Surface Science 256 (2010) 1936–19451940
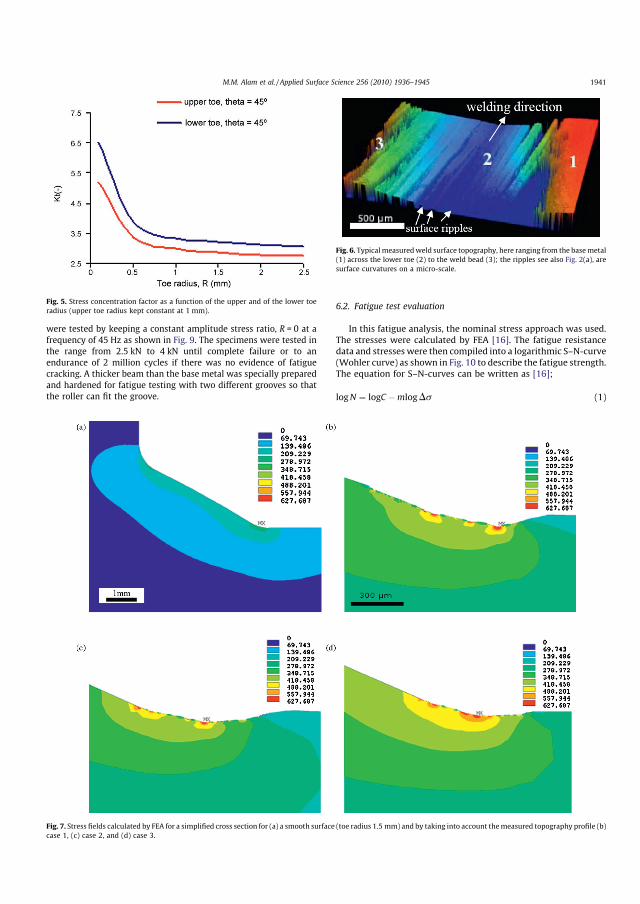
were tested by keeping a constant amplitude stress ratio, R = 0 at afrequency of 45 Hz as shown in Fig. 9. The specimens were tested inthe range from 2.5 kN to 4 kN until complete failure or to anendurance of 2 million cycles if there was no evidence of fatiguecracking. A thicker beam than the base metal was specially preparedand hardened for fatigue testing with two different grooves so thatthe roller can fit the groove.
6.2. Fatigue test evaluation
In this fatigue analysis, the nominal stress approach was used.The stresses were calculated by FEA [16]. The fatigue resistancedata and stresses were then compiled into a logarithmic S–N-curve(Wohler curve) as shown in Fig. 10 to describe the fatigue strength.The equation for S–N-curves can be written as [16];
logN ¼ logC �mlogDs (1)
Fig. 5. Stress concentration factor as a function of the upper and of the lower toe
radius (upper toe radius kept constant at 1 mm).
Fig. 6. Typicalmeasuredweld surface topography, here ranging from the basemetal
(1) across the lower toe (2) to the weld bead (3); the ripples see also Fig. 2(a), are
surface curvatures on a micro-scale.
Fig. 7. Stress fields calculated by FEA for a simplified cross section for (a) a smooth surface (toe radius 1.5 mm) and by taking into account themeasured topography profile (b)
case 1, (c) case 2, and (d) case 3.
M.M. Alam et al. / Applied Surface Science 256 (2010) 1936–1945 1941
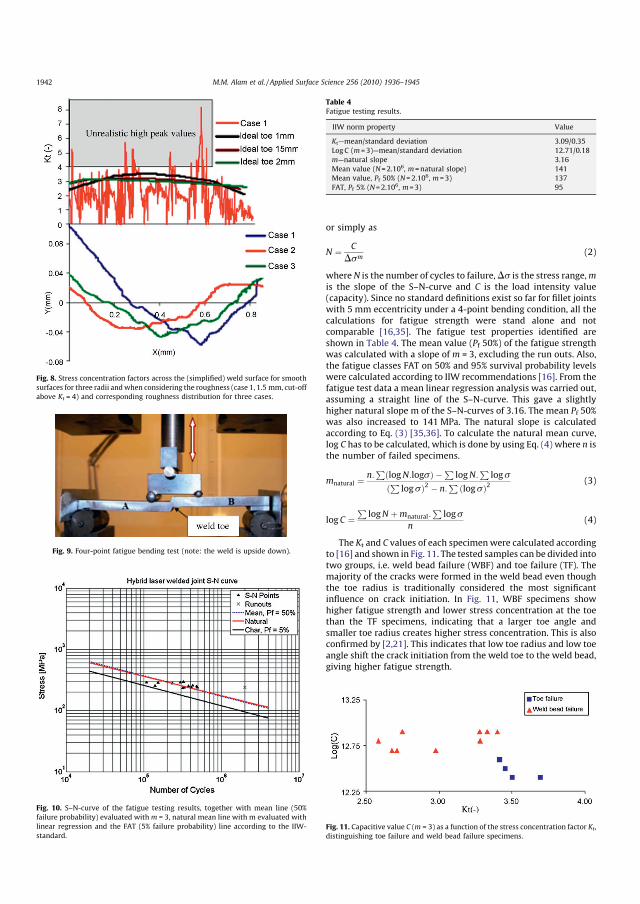
or simply as
N ¼ C
Dsm(2)
where N is the number of cycles to failure,Ds is the stress range,mis the slope of the S–N-curve and C is the load intensity value(capacity). Since no standard definitions exist so far for fillet jointswith 5 mm eccentricity under a 4-point bending condition, all thecalculations for fatigue strength were stand alone and notcomparable [16,35]. The fatigue test properties identified areshown in Table 4. The mean value (Pf 50%) of the fatigue strengthwas calculated with a slope of m = 3, excluding the run outs. Also,the fatigue classes FAT on 50% and 95% survival probability levelswere calculated according to IIW recommendations [16]. From thefatigue test data a mean linear regression analysis was carried out,assuming a straight line of the S–N-curve. This gave a slightlyhigher natural slope m of the S–N-curves of 3.16. The mean Pf 50%was also increased to 141 MPa. The natural slope is calculatedaccording to Eq. (3) [35,36]. To calculate the natural mean curve,log C has to be calculated, which is done by using Eq. (4) where n isthe number of failed specimens.
mnatural ¼n:
PlogN:logsð Þ �P
logN:P
logsPlogsð Þ2 � n:
Plogsð Þ2
(3)
logC ¼P
logN þmnatural:P
logsn
(4)
The Kt and C values of each specimenwere calculated accordingto [16] and shown in Fig. 11. The tested samples can be divided intotwo groups, i.e. weld bead failure (WBF) and toe failure (TF). Themajority of the cracks were formed in the weld bead even thoughthe toe radius is traditionally considered the most significantinfluence on crack initiation. In Fig. 11, WBF specimens showhigher fatigue strength and lower stress concentration at the toethan the TF specimens, indicating that a larger toe angle andsmaller toe radius creates higher stress concentration. This is alsoconfirmed by [2,21]. This indicates that low toe radius and low toeangle shift the crack initiation from the weld toe to the weld bead,giving higher fatigue strength.
Fig. 8. Stress concentration factors across the (simplified) weld surface for smooth
surfaces for three radii andwhen considering the roughness (case 1, 1.5 mm, cut-off
above Kt = 4) and corresponding roughness distribution for three cases.
Fig. 9. Four-point fatigue bending test (note: the weld is upside down).
Fig. 10. S–N-curve of the fatigue testing results, together with mean line (50%
failure probability) evaluated with m = 3, natural mean line with m evaluated with
linear regression and the FAT (5% failure probability) line according to the IIW-
standard.
Table 4Fatigue testing results.
IIW norm property Value
Kt—mean/standard deviation 3.09/0.35
LogC (m=3)—mean/standard deviation 12.71/0.18
m—natural slope 3.16
Mean value (N=2.106, m=natural slope) 141
Mean value, Pf 50% (N=2.106, m=3) 137
FAT, Pf 5% (N=2.106, m=3) 95
Fig. 11. Capacitive value C (m = 3) as a function of the stress concentration factor Kt,
distinguishing toe failure and weld bead failure specimens.
M.M. Alam et al. / Applied Surface Science 256 (2010) 1936–19451942
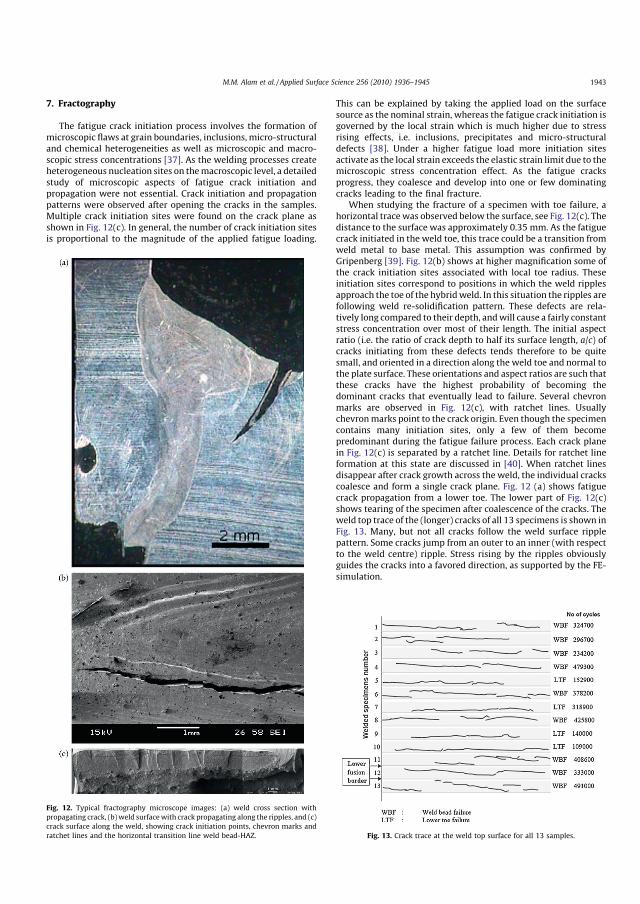
7. Fractography
The fatigue crack initiation process involves the formation ofmicroscopic flaws at grain boundaries, inclusions, micro-structuraland chemical heterogeneities as well as microscopic and macro-scopic stress concentrations [37]. As the welding processes createheterogeneous nucleation sites on themacroscopic level, a detailedstudy of microscopic aspects of fatigue crack initiation andpropagation were not essential. Crack initiation and propagationpatterns were observed after opening the cracks in the samples.Multiple crack initiation sites were found on the crack plane asshown in Fig. 12(c). In general, the number of crack initiation sitesis proportional to the magnitude of the applied fatigue loading.
This can be explained by taking the applied load on the surfacesource as the nominal strain, whereas the fatigue crack initiation isgoverned by the local strain which is much higher due to stressrising effects, i.e. inclusions, precipitates and micro-structuraldefects [38]. Under a higher fatigue load more initiation sitesactivate as the local strain exceeds the elastic strain limit due to themicroscopic stress concentration effect. As the fatigue cracksprogress, they coalesce and develop into one or few dominatingcracks leading to the final fracture.
When studying the fracture of a specimen with toe failure, ahorizontal trace was observed below the surface, see Fig. 12(c). Thedistance to the surface was approximately 0.35 mm. As the fatiguecrack initiated in the weld toe, this trace could be a transition fromweld metal to base metal. This assumption was confirmed byGripenberg [39]. Fig. 12(b) shows at higher magnification some ofthe crack initiation sites associated with local toe radius. Theseinitiation sites correspond to positions in which the weld ripplesapproach the toe of the hybridweld. In this situation the ripples arefollowing weld re-solidification pattern. These defects are rela-tively long compared to their depth, andwill cause a fairly constantstress concentration over most of their length. The initial aspectratio (i.e. the ratio of crack depth to half its surface length, a/c) ofcracks initiating from these defects tends therefore to be quitesmall, and oriented in a direction along the weld toe and normal tothe plate surface. These orientations and aspect ratios are such thatthese cracks have the highest probability of becoming thedominant cracks that eventually lead to failure. Several chevronmarks are observed in Fig. 12(c), with ratchet lines. Usuallychevronmarks point to the crack origin. Even though the specimencontains many initiation sites, only a few of them becomepredominant during the fatigue failure process. Each crack planein Fig. 12(c) is separated by a ratchet line. Details for ratchet lineformation at this state are discussed in [40]. When ratchet linesdisappear after crack growth across the weld, the individual crackscoalesce and form a single crack plane. Fig. 12 (a) shows fatiguecrack propagation from a lower toe. The lower part of Fig. 12(c)shows tearing of the specimen after coalescence of the cracks. Theweld top trace of the (longer) cracks of all 13 specimens is shown inFig. 13. Many, but not all cracks follow the weld surface ripplepattern. Some cracks jump from an outer to an inner (with respectto the weld centre) ripple. Stress rising by the ripples obviouslyguides the cracks into a favored direction, as supported by the FE-simulation.
Fig. 12. Typical fractography microscope images: (a) weld cross section with
propagating crack, (b)weld surfacewith crack propagating along the ripples, and (c)
crack surface along the weld, showing crack initiation points, chevron marks and
ratchet lines and the horizontal transition line weld bead-HAZ. Fig. 13. Crack trace at the weld top surface for all 13 samples.
M.M. Alam et al. / Applied Surface Science 256 (2010) 1936–1945 1943
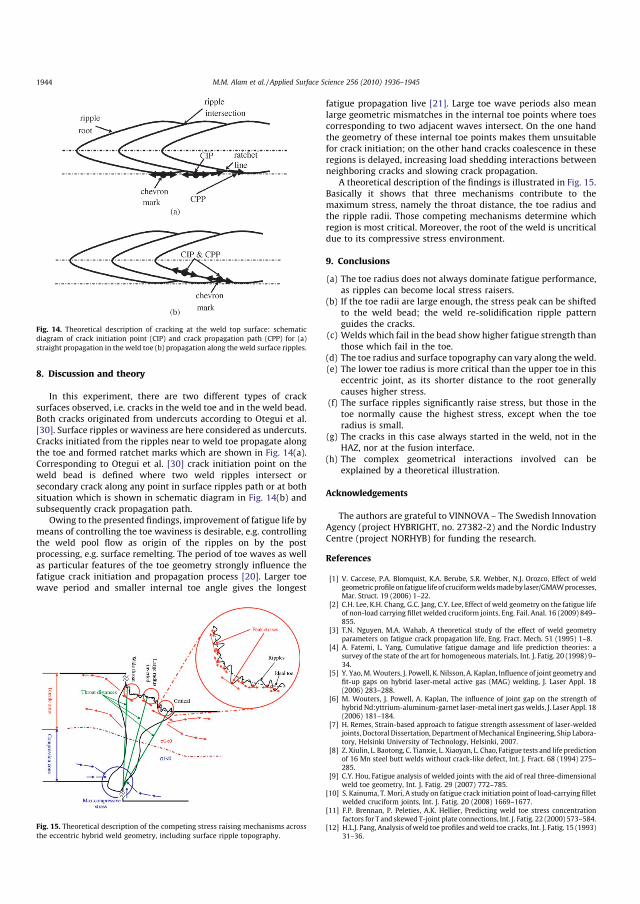
8. Discussion and theory
In this experiment, there are two different types of cracksurfaces observed, i.e. cracks in the weld toe and in the weld bead.Both cracks originated from undercuts according to Otegui et al.[30]. Surface ripples or waviness are here considered as undercuts.Cracks initiated from the ripples near to weld toe propagate alongthe toe and formed ratchet marks which are shown in Fig. 14(a).Corresponding to Otegui et al. [30] crack initiation point on theweld bead is defined where two weld ripples intersect orsecondary crack along any point in surface ripples path or at bothsituation which is shown in schematic diagram in Fig. 14(b) andsubsequently crack propagation path.
Owing to the presented findings, improvement of fatigue life bymeans of controlling the toe waviness is desirable, e.g. controllingthe weld pool flow as origin of the ripples on by the postprocessing, e.g. surface remelting. The period of toe waves as wellas particular features of the toe geometry strongly influence thefatigue crack initiation and propagation process [20]. Larger toewave period and smaller internal toe angle gives the longest
fatigue propagation live [21]. Large toe wave periods also meanlarge geometric mismatches in the internal toe points where toescorresponding to two adjacent waves intersect. On the one handthe geometry of these internal toe points makes them unsuitablefor crack initiation; on the other hand cracks coalescence in theseregions is delayed, increasing load shedding interactions betweenneighboring cracks and slowing crack propagation.
A theoretical description of the findings is illustrated in Fig. 15.Basically it shows that three mechanisms contribute to themaximum stress, namely the throat distance, the toe radius andthe ripple radii. Those competing mechanisms determine whichregion is most critical. Moreover, the root of the weld is uncriticaldue to its compressive stress environment.
9. Conclusions
(a) The toe radius does not always dominate fatigue performance,as ripples can become local stress raisers.
(b) If the toe radii are large enough, the stress peak can be shiftedto the weld bead; the weld re-solidification ripple patternguides the cracks.
(c) Welds which fail in the bead show higher fatigue strength thanthose which fail in the toe.
(d) The toe radius and surface topography can vary along the weld.(e) The lower toe radius is more critical than the upper toe in this
eccentric joint, as its shorter distance to the root generallycauses higher stress.
(f) The surface ripples significantly raise stress, but those in thetoe normally cause the highest stress, except when the toeradius is small.
(g) The cracks in this case always started in the weld, not in theHAZ, nor at the fusion interface.
(h) The complex geometrical interactions involved can beexplained by a theoretical illustration.
Acknowledgements
The authors are grateful to VINNOVA – The Swedish InnovationAgency (project HYBRIGHT, no. 27382-2) and the Nordic IndustryCentre (project NORHYB) for funding the research.
References
[1] V. Caccese, P.A. Blomquist, K.A. Berube, S.R. Webber, N.J. Orozco, Effect of weldgeometricprofile on fatigue life of cruciformweldsmadeby laser/GMAWprocesses,Mar. Struct. 19 (2006) 1–22.
[2] C.H. Lee, K.H. Chang, G.C. Jang, C.Y. Lee, Effect of weld geometry on the fatigue lifeof non-load carrying fillet welded cruciform joints, Eng. Fail. Anal. 16 (2009) 849–855.
[3] T.N. Nguyen, M.A. Wahab, A theoretical study of the effect of weld geometryparameters on fatigue crack propagation life, Eng. Fract. Mech. 51 (1995) 1–8.
[4] A. Fatemi, L. Yang, Cumulative fatigue damage and life prediction theories: asurvey of the state of the art for homogeneous materials, Int. J. Fatig. 20 (1998) 9–34.
[5] Y. Yao, M.Wouters, J. Powell, K. Nilsson, A. Kaplan, Influence of joint geometry andfit-up gaps on hybrid laser-metal active gas (MAG) welding, J. Laser Appl. 18(2006) 283–288.
[6] M. Wouters, J. Powell, A. Kaplan, The influence of joint gap on the strength ofhybrid Nd:yttrium-aluminum-garnet laser-metal inert gas welds, J. Laser Appl. 18(2006) 181–184.
[7] H. Remes, Strain-based approach to fatigue strength assessment of laser-weldedjoints, Doctoral Dissertation, Department ofMechanical Engineering, Ship Labora-tory, Helsinki University of Technology, Helsinki, 2007.
[8] Z. Xiulin, L. Baotong, C. Tianxie, L. Xiaoyan, L. Chao, Fatigue tests and life predictionof 16 Mn steel butt welds without crack-like defect, Int. J. Fract. 68 (1994) 275–285.
[9] C.Y. Hou, Fatigue analysis of welded joints with the aid of real three-dimensionalweld toe geometry, Int. J. Fatig. 29 (2007) 772–785.
[10] S. Kainuma, T. Mori, A study on fatigue crack initiation point of load-carrying filletwelded cruciform joints, Int. J. Fatig. 20 (2008) 1669–1677.
[11] F.P. Brennan, P. Peleties, A.K. Hellier, Predicting weld toe stress concentrationfactors for T and skewed T-joint plate connections, Int. J. Fatig. 22 (2000) 573–584.
[12] H.L.J. Pang, Analysis of weld toe profiles andweld toe cracks, Int. J. Fatig. 15 (1993)31–36.
Fig. 15. Theoretical description of the competing stress raising mechanisms across
the eccentric hybrid weld geometry, including surface ripple topography.
Fig. 14. Theoretical description of cracking at the weld top surface: schematic
diagram of crack initiation point (CIP) and crack propagation path (CPP) for (a)
straight propagation in the weld toe (b) propagation along the weld surface ripples.
M.M. Alam et al. / Applied Surface Science 256 (2010) 1936–19451944
[13] H.L.J. Pang, Analysis of weld toe radius effects on fatigue weld toe cracks, Int. J.Press. Vessels Pip. 58 (1994) 171–177.
[14] J.A.M. Ferreira, C.A.M. Branco, Influence of the radius of curvature at the weld toein the fatigue strength of fillet weld joints, Int. J. Fatig. 11 (1989) 29–36.
[15] D. Radaj, Design and Analysis of Fatigue Resistant Welded Structures, AbingtonPublishing, Cambridge, 1990.
[16] A. Hobbacher, Fatigue design of welded joints and components, IIW DocumentXIII-2151-07/XV-1254-07.
[17] W. Fricke, Fatigue analysis of welded joints: state of development, Mar. Struct. 16(2003) 185–200.
[18] S.J. Maddox, Fatigue Strength of Welded Structures, Abington Publishing Limited,second ed., 2002.
[19] P. Kujala, G. Socha, K. Koli, T. Toivonen, Characteristics of stake laser welded joints,in: Proceedings 7th Nordic Conference in Laser Processing of Materials Lappeen-ranta, Finland, (1999), pp. 120–133.
[20] J. Weldingh, J.K. Kristensen, Hybrid YAG-laser/MAG welding quality and stability,in: Proceedings 9th Conference on Laser Materials Processing in the NordicCountries, Trondheim, Norway, (2003), pp. 15–24.
[21] Z. Barsoum, Residual stress analysis and fatigue assessment of welded steelstructures, Doctoral Dissertation, Department of Aeronautical and Vehicle Engi-neering, Royal Institute of Technology, Stockholm, 2007.
[22] A. Otha, Y. Maeda, N. Suzuki, Residual stress effect on fatigue strength of non-load- carrying cruciform welded joints of SM570Q steel for welded structures,Weld. World 46 (2002) 20–25.
[23] C-L. Tsai, C-M. Tso,W-C.Mohr, Geometry effect on fatigue life of fillet welds undertensioncompression loading, EWI Material Joining Technology, Report No.MR0306, 2003.
[24] Z. Barsoum, M. Gustafsson, Fatigue of high strength steel joints welded with lowtemperature transformation consumables, J. Eng. Fail. Anal. 16 (2009) 2186–2194.
[25] R.F. Ricondo, Fatigue and quality analysis of cruciform joints welded withdifferent methods, Master Thesis, Department of Aeronautical and Vehicle Engi-neering, Royal Institute of Technology, Stockholm, 2006.
[26] M. Ring, W. Dahl, Fatigue properties of laser-beam weldments on the highstrength steels, Steel Res. 65 (1994) 505–510.
[27] F. Weichel, H. Petershagen, Fatigue strength of laser welded structural steels withthicknesses between 8 and 20 mm, IIW Document XIII-1590-95, University ofHamburg, Germany, 1995.
[28] M.D. Chapetti, J.L. Otegui, Importance of toe irregularity for fatigue resistance ofautomatic welds, Int. J. Fatig. 17 (1995) 531–538.
[29] M.D. Chapetti, J.L. Otegui, Controlled toe waviness as a means to increasefatigue resistance of automatic welds in transverse loading, Int. J. Fatig. 19(1997) 667–675.
[30] J.L. Otegui, H.W. Kerr, D.J. Burns, U.H. Mohaupt, Fatigue crack initiation fromdefects at weld toes in steel, Int. J. Press. Vessels Pip. 38 (1989) 385–417.
[31] L.L. Martinez, Fatigue behaviour of welded high-strength steels, Doctoral dis-sertation, Department of Aeronautical and Vehicle Engineering, Royal Institute ofTechnology, Stockholm, 1997.
[32] J. Martinsson, Fatigue assessment of complex welded steel structures, DoctoralDissertation, Department of Aeronautical and Vehicle Engineering, Royal Instituteof Technology, Stockholm, 2005.
[33] R. Bell, O. Vosikovsky, S.A. Bain, Significance ofweld toe undercuts in the fatigue ofsteel plate T-joints, Int. J. Fatig. 11 (1989) 3–11.
[34] ANSYS guide, ANSYS release 11. Swanson Analysis Systems, Houston.[35] H. Narimani, Fatigue strength of laser hybrid welded high strength steel, Master’s
Thesis, Department of Applied Physics and Mechanical Engineering, Lulea Uni-versity of Technology, Lulea, 2008
[36] T. Gurney, Cumulative Damage of Welded Joints, Woodhead Publishing Limited,2006.
[37] S. Suresh, Fatigue of materials, in: Cambridge Solid State Science Series, seconded., Cambridge University Press, 1998.
[38] R.W. Hertzberg, Deformation and Fracture Mechanics of Engineering Materials,fourth ed., John Wiley and Sons, INC, USA, 1996.
[39] H. Gripenberg, A study of submerged arc, laser and hybrid weld properties,residual stresses, css-curves and fractography, Research Report TKK-MTR-2/03.2003, Helsinki University of Technology, Laboratory of Engineering Materials,Espoo, Finland.
[40] Y. Verreman, B. Nie, Short crack growth and coalescence along the toe of amanualfillet weld, Fatig. Fract. Eng. Mater. Struct. 14 (1991) 337–349.
M.M. Alam et al. / Applied Surface Science 256 (2010) 1936–1945 1945
Md. Minhaj Alam Paper II: Fatigue Cracking including Lack of Fusion 125
Paper II
INFLUENCE OF DEFECTS ON FATIGUE CRACK PROPAGATION IN LASER HYBRID WELDED ECCENTRIC FILLET JOINT
M. M. Alam, Z. Barsoum, P. Jonsén, H. Å. Häggblad, A. F. H. Kaplan
Engineering Fracture Mechanics, 2011; 78:2246-2258

126 Paper II: Fatigue Cracking including Lack of Fusion Md. Minhaj Alam
Influence of defects on fatigue crack propagation in laser hybridwelded eccentric fillet joint
M.M. Alam a,⇑, Z. Barsoumb, P. Jonsén a, A.F.H. Kaplan a, H.Å. Häggblad a
a Luleå University of Technology, Dept. of Applied Physics and Mechanical Engineering, SE-971 87 Luleå, SwedenbRoyal Institute of Technology, Dept. of Aeronautical and Vehicle Engineering, SE-100 44 Stockholm, Sweden
a r t i c l e i n f o
Article history:Received 18 November 2009Received in revised form 11 April 2011Accepted 18 April 2011Available online 23 April 2011
Keywords:CrackFatigueWeldLinear elastic fracture mechanicsLack of fusion
a b s t r a c t
Fatigue cracking of laser hybrid welded eccentric fillet joints has been studied for stainlesssteel. Two-dimensional linear elastic fracture mechanics analysis was carried out for thisjoint geometry for four point bending load. The numerical simulations explain for theexperimental observations why the crack propagates from the lower weld toe and whythe crack gradually bends towards the root. Lack of fusion turned out to be uncritical forthe initiation of cracks due to its compressive stress conditions. The linear elastic fracturemechanics analysis has demonstrated in good qualitative agreement with fatigue testresults that lack of fusion slightly (<10%) reduces the fatigue life by accelerating the crackpropagation. For the geometrical conditions studied here improved understanding of thecrack propagation was obtained and in turn illustrated. The elaborated design curvesturned out to be above the standard recommendations.
� 2011 Elsevier Ltd. All rights reserved.
1. Introduction
A welded joint may contain defects such as inclusions, pores, cavities, undercuts that can lead to high stress concentra-tion. As a consequence, fatigue failures appear in welded structures mostly at the welds rather than in the base metal. Forthis reason, fatigue analyses are of practical interest for many welded structures exposed for cyclic loads.
Fatigue failure usually includes three stages: crack initiation, propagation and final fracture [1]. At each stage, the corre-sponding fatigue behaviour can be affected by various factors, such as load conditions, geometry of the weld, constraint ofthe structure, material properties and environment. Studies have shown that the initiation and propagation of cracks fromwelded joints is different from that in homogeneous base materials due to the high level of residual stresses [2], complexmicrostructure [3–6], strength mismatching [7,8], complex loading [9] or internal defects [10] found in welds. It shouldbe noted that the welding process may introduce cracks or crack-like imperfections. The existence of crack-like imperfec-tions in the welded joint is normally considered to eliminate the crack initiation stage of fatigue life. Therefore, the emphasisof the fatigue assessment can often be focused on the crack growth stage of the fatigue life. The existence of crack-like flaws(sharp toe radii, surface ripples, lack of fusion (LOF), lack of penetration (LOP), cold laps, etc.) in the welded steel joints and itsimpact on fatigue crack initiation life has often been studied [11]. The effect of toe radii and surface ripples on fatigue crackinitiation has been extensively reported in [12] as a base for the present study, and in [13].
In a wide variety of cases crack growth problems can be solved within the frame of linear elastic fracture mechanics(LEFM). This is the case when the yield zone at the crack tip is small with respect to both the crack size and the remaining
0013-7944/$ - see front matter � 2011 Elsevier Ltd. All rights reserved.doi:10.1016/j.engfracmech.2011.04.011
⇑ Corresponding author. Tel.: +46 (0)920 49 39 17; fax: +46 (0)920 49 22 28.E-mail addresses: [email protected] (M.M. Alam), [email protected] (Z. Barsoum), [email protected] (P. Jonsén), [email protected] (A.F.H. Kaplan),
[email protected] (H.Å. Häggblad).
Engineering Fracture Mechanics 78 (2011) 2246–2258
Contents lists available at ScienceDirect
Engineering Fracture Mechanics
journal homepage: www.elsevier .com/locate /engfracmech
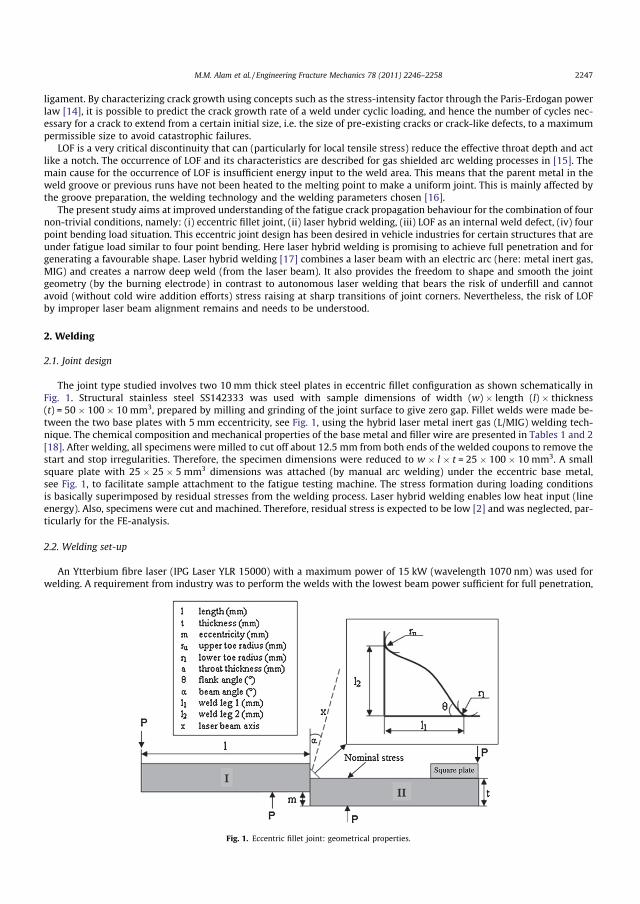
ligament. By characterizing crack growth using concepts such as the stress-intensity factor through the Paris-Erdogan powerlaw [14], it is possible to predict the crack growth rate of a weld under cyclic loading, and hence the number of cycles nec-essary for a crack to extend from a certain initial size, i.e. the size of pre-existing cracks or crack-like defects, to a maximumpermissible size to avoid catastrophic failures.
LOF is a very critical discontinuity that can (particularly for local tensile stress) reduce the effective throat depth and actlike a notch. The occurrence of LOF and its characteristics are described for gas shielded arc welding processes in [15]. Themain cause for the occurrence of LOF is insufficient energy input to the weld area. This means that the parent metal in theweld groove or previous runs have not been heated to the melting point to make a uniform joint. This is mainly affected bythe groove preparation, the welding technology and the welding parameters chosen [16].
The present study aims at improved understanding of the fatigue crack propagation behaviour for the combination of fournon-trivial conditions, namely: (i) eccentric fillet joint, (ii) laser hybrid welding, (iii) LOF as an internal weld defect, (iv) fourpoint bending load situation. This eccentric joint design has been desired in vehicle industries for certain structures that areunder fatigue load similar to four point bending. Here laser hybrid welding is promising to achieve full penetration and forgenerating a favourable shape. Laser hybrid welding [17] combines a laser beam with an electric arc (here: metal inert gas,MIG) and creates a narrow deep weld (from the laser beam). It also provides the freedom to shape and smooth the jointgeometry (by the burning electrode) in contrast to autonomous laser welding that bears the risk of underfill and cannotavoid (without cold wire addition efforts) stress raising at sharp transitions of joint corners. Nevertheless, the risk of LOFby improper laser beam alignment remains and needs to be understood.
2. Welding
2.1. Joint design
The joint type studied involves two 10 mm thick steel plates in eccentric fillet configuration as shown schematically inFig. 1. Structural stainless steel SS142333 was used with sample dimensions of width (w) � length (l) � thickness(t) = 50 � 100 � 10 mm3, prepared by milling and grinding of the joint surface to give zero gap. Fillet welds were made be-tween the two base plates with 5 mm eccentricity, see Fig. 1, using the hybrid laser metal inert gas (L/MIG) welding tech-nique. The chemical composition and mechanical properties of the base metal and filler wire are presented in Tables 1 and 2[18]. After welding, all specimens were milled to cut off about 12.5 mm from both ends of the welded coupons to remove thestart and stop irregularities. Therefore, the specimen dimensions were reduced to w � l � t = 25 � 100 � 10 mm3. A smallsquare plate with 25 � 25 � 5 mm3 dimensions was attached (by manual arc welding) under the eccentric base metal,see Fig. 1, to facilitate sample attachment to the fatigue testing machine. The stress formation during loading conditionsis basically superimposed by residual stresses from the welding process. Laser hybrid welding enables low heat input (lineenergy). Also, specimens were cut and machined. Therefore, residual stress is expected to be low [2] and was neglected, par-ticularly for the FE-analysis.
2.2. Welding set-up
An Ytterbium fibre laser (IPG Laser YLR 15000) with a maximum power of 15 kW (wavelength 1070 nm) was used forwelding. A requirement from industry was to perform the welds with the lowest beam power sufficient for full penetration,
Fig. 1. Eccentric fillet joint: geometrical properties.
M.M. Alam et al. / Engineering Fracture Mechanics 78 (2011) 2246–2258 2247
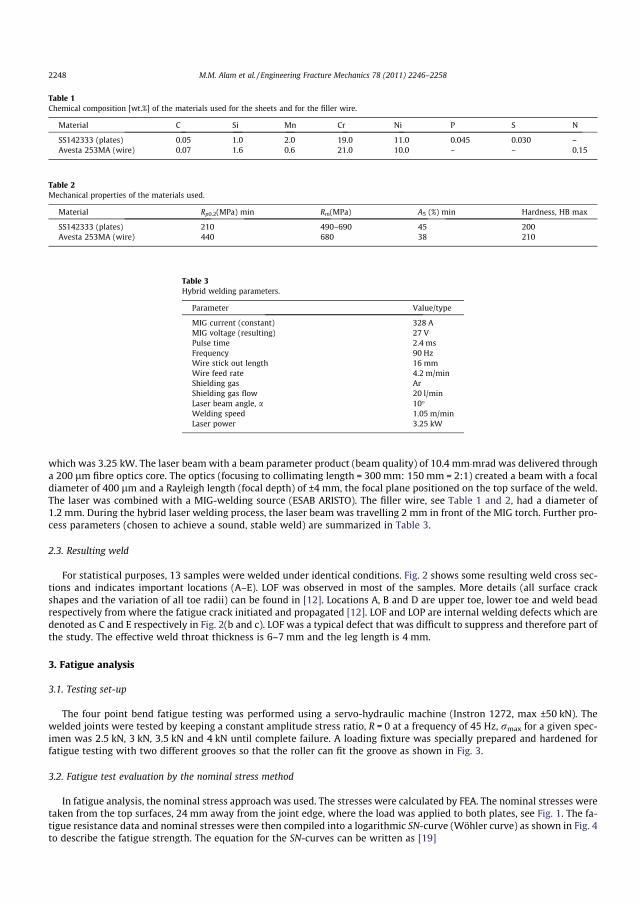
which was 3.25 kW. The laser beam with a beam parameter product (beam quality) of 10.4 mm�mrad was delivered througha 200 lm fibre optics core. The optics (focusing to collimating length = 300 mm: 150 mm = 2:1) created a beam with a focaldiameter of 400 lm and a Rayleigh length (focal depth) of ±4 mm, the focal plane positioned on the top surface of the weld.The laser was combined with a MIG-welding source (ESAB ARISTO). The filler wire, see Table 1 and 2, had a diameter of1.2 mm. During the hybrid laser welding process, the laser beam was travelling 2 mm in front of the MIG torch. Further pro-cess parameters (chosen to achieve a sound, stable weld) are summarized in Table 3.
2.3. Resulting weld
For statistical purposes, 13 samples were welded under identical conditions. Fig. 2 shows some resulting weld cross sec-tions and indicates important locations (A–E). LOF was observed in most of the samples. More details (all surface crackshapes and the variation of all toe radii) can be found in [12]. Locations A, B and D are upper toe, lower toe and weld beadrespectively from where the fatigue crack initiated and propagated [12]. LOF and LOP are internal welding defects which aredenoted as C and E respectively in Fig. 2(b and c). LOF was a typical defect that was difficult to suppress and therefore part ofthe study. The effective weld throat thickness is 6–7 mm and the leg length is 4 mm.
3. Fatigue analysis
3.1. Testing set-up
The four point bend fatigue testing was performed using a servo-hydraulic machine (Instron 1272, max ±50 kN). Thewelded joints were tested by keeping a constant amplitude stress ratio, R = 0 at a frequency of 45 Hz, rmax for a given spec-imen was 2.5 kN, 3 kN, 3.5 kN and 4 kN until complete failure. A loading fixture was specially prepared and hardened forfatigue testing with two different grooves so that the roller can fit the groove as shown in Fig. 3.
3.2. Fatigue test evaluation by the nominal stress method
In fatigue analysis, the nominal stress approach was used. The stresses were calculated by FEA. The nominal stresses weretaken from the top surfaces, 24 mm away from the joint edge, where the load was applied to both plates, see Fig. 1. The fa-tigue resistance data and nominal stresses were then compiled into a logarithmic SN-curve (Wöhler curve) as shown in Fig. 4to describe the fatigue strength. The equation for the SN-curves can be written as [19]
Table 1Chemical composition [wt.%] of the materials used for the sheets and for the filler wire.
Material C Si Mn Cr Ni P S N
SS142333 (plates) 0.05 1.0 2.0 19.0 11.0 0.045 0.030 –Avesta 253MA (wire) 0.07 1.6 0.6 21.0 10.0 – – 0.15
Table 2Mechanical properties of the materials used.
Material Rp0.2(MPa) min Rm(MPa) A5 (%) min Hardness, HB max
SS142333 (plates) 210 490–690 45 200Avesta 253MA (wire) 440 680 38 210
Table 3Hybrid welding parameters.
Parameter Value/type
MIG current (constant) 328 AMIG voltage (resulting) 27 VPulse time 2.4 msFrequency 90 HzWire stick out length 16 mmWire feed rate 4.2 m/minShielding gas ArShielding gas flow 20 l/minLaser beam angle, a 10�Welding speed 1.05 m/minLaser power 3.25 kW
2248 M.M. Alam et al. / Engineering Fracture Mechanics 78 (2011) 2246–2258

logN ¼ logC �m logDr ð1Þor simply as
N ¼ CDrm
ð2Þ
where N is the number of cycles to failure, Dr is the stress range, m is the slope of the SN-curve and C is the load intensityvalue (Capacity). For comparison, the numerically predicted values for fatigue life are also shown in Fig. 4. They will be de-scribed in Section 5.2. The fatigue test properties identified are shown in Table 4. The mean value (Pf 50%) of the fatiguestrength was calculated with a slope of m = 3, excluding one run out. Also, the fatigue classes FAT on 50% and 95% survivalprobability levels were calculated according to the IIW recommendations [19]. From the fatigue test data a mean linearregression analysis was carried out, assuming a straight line of the SN-curve. This gave a slightly higher natural slope ofthe SN-curves of m = 3.16. The mean Pf 50% was also increased to 141 MPa. The natural slope is calculated according toEq. (3) [20]. To calculate the natural mean curve, log C has to be calculated, which is done by using Eq. (4) where n is thenumber of failed specimens.
mnatural ¼ n:PðlogN: logrÞ �P
logN:P
logrðP logrÞ2 � n:
PðlogrÞ2ð3Þ
logC ¼P
logN þmnatural:P
logrn
ð4Þ
Another method for predicting fatigue life locally is the effective notch stress method where the real weld contour is re-placed by an effective notch radius of 1 mm. A comprehensive review of notch stress methods can be found in [19,21,22].
4. Fatigue crack geometry and crack morphology
Fig. 5 shows a typical fatigue cracked weld top surface that failed at the lower toe. Fig. 6 shows fatigue crack propagationfrom the lower and upper toes of welds with LOF defects. It is interesting to note that LOF opens under load, but does not
Fig. 2. Typical resulting weld: (a) defect-free weld cross section, (b) with LOF-interface, (c) with distinct LOF and lack of penetration.
Fig. 3. Four-point fatigue bending test (note: the sample is upside down).
M.M. Alam et al. / Engineering Fracture Mechanics 78 (2011) 2246–2258 2249
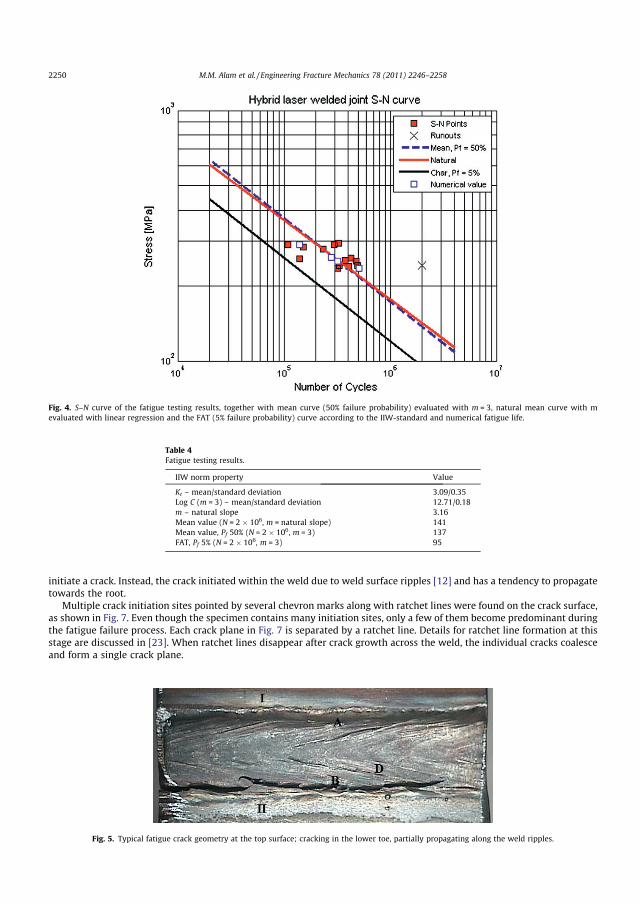
initiate a crack. Instead, the crack initiated within the weld due to weld surface ripples [12] and has a tendency to propagatetowards the root.
Multiple crack initiation sites pointed by several chevron marks along with ratchet lines were found on the crack surface,as shown in Fig. 7. Even though the specimen contains many initiation sites, only a few of them become predominant duringthe fatigue failure process. Each crack plane in Fig. 7 is separated by a ratchet line. Details for ratchet line formation at thisstage are discussed in [23]. When ratchet lines disappear after crack growth across the weld, the individual cracks coalesceand form a single crack plane.
Fig. 4. S–N curve of the fatigue testing results, together with mean curve (50% failure probability) evaluated with m = 3, natural mean curve with mevaluated with linear regression and the FAT (5% failure probability) curve according to the IIW-standard and numerical fatigue life.
Table 4Fatigue testing results.
IIW norm property Value
Kt – mean/standard deviation 3.09/0.35Log C (m = 3) – mean/standard deviation 12.71/0.18m – natural slope 3.16Mean value (N = 2 � 106, m = natural slope) 141Mean value, Pf 50% (N = 2 � 106, m = 3) 137FAT, Pf 5% (N = 2 � 106, m = 3) 95
Fig. 5. Typical fatigue crack geometry at the top surface; cracking in the lower toe, partially propagating along the weld ripples.
2250 M.M. Alam et al. / Engineering Fracture Mechanics 78 (2011) 2246–2258
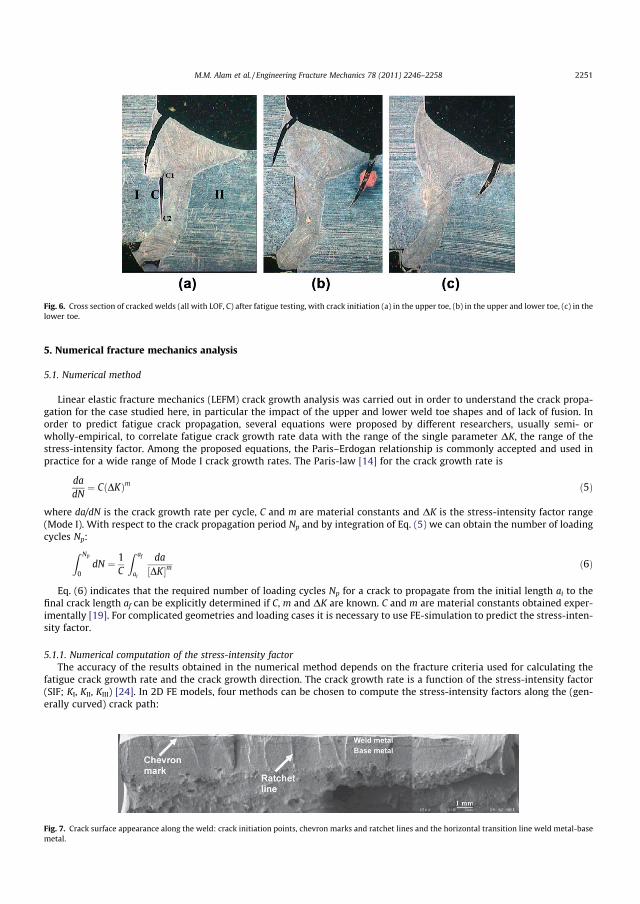
5. Numerical fracture mechanics analysis
5.1. Numerical method
Linear elastic fracture mechanics (LEFM) crack growth analysis was carried out in order to understand the crack propa-gation for the case studied here, in particular the impact of the upper and lower weld toe shapes and of lack of fusion. Inorder to predict fatigue crack propagation, several equations were proposed by different researchers, usually semi- orwholly-empirical, to correlate fatigue crack growth rate data with the range of the single parameter DK, the range of thestress-intensity factor. Among the proposed equations, the Paris–Erdogan relationship is commonly accepted and used inpractice for a wide range of Mode I crack growth rates. The Paris-law [14] for the crack growth rate is
dadN
¼ CðDKÞm ð5Þ
where da/dN is the crack growth rate per cycle, C and m are material constants and DK is the stress-intensity factor range(Mode I). With respect to the crack propagation period Np and by integration of Eq. (5) we can obtain the number of loadingcycles Np:Z Np
0dN ¼ 1
C
Z af
ai
da½DK�m ð6Þ
Eq. (6) indicates that the required number of loading cycles Np for a crack to propagate from the initial length ai to thefinal crack length af can be explicitly determined if C, m and DK are known. C and m are material constants obtained exper-imentally [19]. For complicated geometries and loading cases it is necessary to use FE-simulation to predict the stress-inten-sity factor.
5.1.1. Numerical computation of the stress-intensity factorThe accuracy of the results obtained in the numerical method depends on the fracture criteria used for calculating the
fatigue crack growth rate and the crack growth direction. The crack growth rate is a function of the stress-intensity factor(SIF; KI, KII, KIII) [24]. In 2D FE models, four methods can be chosen to compute the stress-intensity factors along the (gen-erally curved) crack path:
Fig. 6. Cross section of cracked welds (all with LOF, C) after fatigue testing, with crack initiation (a) in the upper toe, (b) in the upper and lower toe, (c) in thelower toe.
Fig. 7. Crack surface appearance along the weld: crack initiation points, chevron marks and ratchet lines and the horizontal transition line weld metal-basemetal.
M.M. Alam et al. / Engineering Fracture Mechanics 78 (2011) 2246–2258 2251
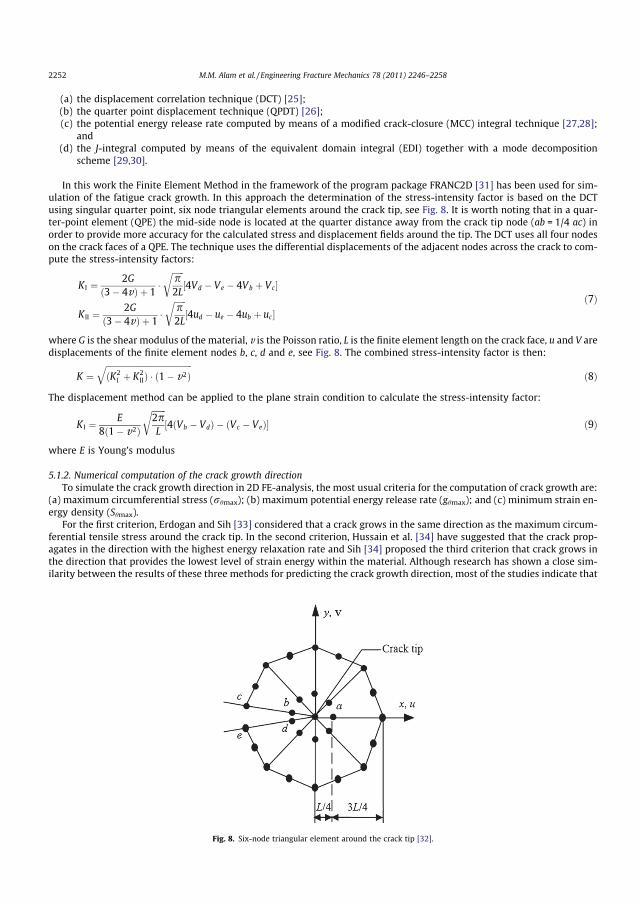
(a) the displacement correlation technique (DCT) [25];(b) the quarter point displacement technique (QPDT) [26];(c) the potential energy release rate computed by means of a modified crack-closure (MCC) integral technique [27,28];
and(d) the J-integral computed by means of the equivalent domain integral (EDI) together with a mode decomposition
scheme [29,30].
In this work the Finite Element Method in the framework of the program package FRANC2D [31] has been used for sim-ulation of the fatigue crack growth. In this approach the determination of the stress-intensity factor is based on the DCTusing singular quarter point, six node triangular elements around the crack tip, see Fig. 8. It is worth noting that in a quar-ter-point element (QPE) the mid-side node is located at the quarter distance away from the crack tip node (ab = 1/4 ac) inorder to provide more accuracy for the calculated stress and displacement fields around the tip. The DCT uses all four nodeson the crack faces of a QPE. The technique uses the differential displacements of the adjacent nodes across the crack to com-pute the stress-intensity factors:
K I ¼ 2Gð3� 4vÞ þ 1
�ffiffiffiffiffiffip2L
r½4Vd � Ve � 4Vb þ Vc�
K II ¼ 2Gð3� 4vÞ þ 1
�ffiffiffiffiffiffip2L
r½4ud � ue � 4ub þ uc�
ð7Þ
where G is the shear modulus of the material, v is the Poisson ratio, L is the finite element length on the crack face, u and V aredisplacements of the finite element nodes b, c, d and e, see Fig. 8. The combined stress-intensity factor is then:
K ¼ffiffiffiffiffiffiffiffiffiffiffiffiffiffiffiffiffiffiffiffiffiffiffiffiffiffiffiffiffiffiffiffiffiffiffiffiffiffiffiffiffiffiðK2
I þ K2IIÞ � ð1� v2Þ
qð8Þ
The displacement method can be applied to the plane strain condition to calculate the stress-intensity factor:
K I ¼ E8ð1� v2Þ
ffiffiffiffiffiffiffi2pL
r½4ðVb � VdÞ � ðVc � VeÞ� ð9Þ
where E is Young’s modulus
5.1.2. Numerical computation of the crack growth directionTo simulate the crack growth direction in 2D FE-analysis, the most usual criteria for the computation of crack growth are:
(a) maximum circumferential stress (rhmax); (b) maximum potential energy release rate (ghmax); and (c) minimum strain en-ergy density (Shmax).
For the first criterion, Erdogan and Sih [33] considered that a crack grows in the same direction as the maximum circum-ferential tensile stress around the crack tip. In the second criterion, Hussain et al. [34] have suggested that the crack prop-agates in the direction with the highest energy relaxation rate and Sih [34] proposed the third criterion that crack grows inthe direction that provides the lowest level of strain energy within the material. Although research has shown a close sim-ilarity between the results of these three methods for predicting the crack growth direction, most of the studies indicate that
Fig. 8. Six-node triangular element around the crack tip [32].
2252 M.M. Alam et al. / Engineering Fracture Mechanics 78 (2011) 2246–2258
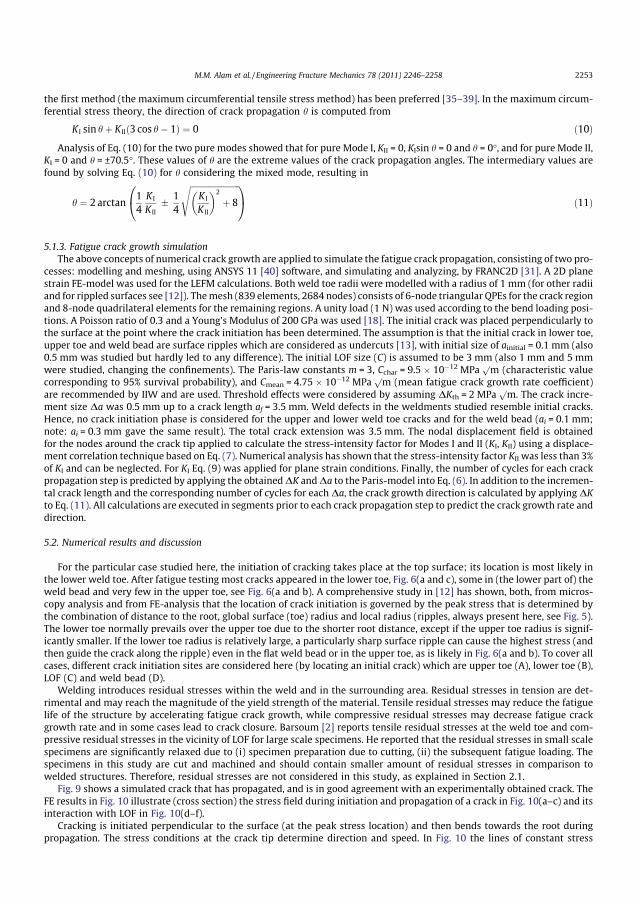
the first method (the maximum circumferential tensile stress method) has been preferred [35–39]. In the maximum circum-ferential stress theory, the direction of crack propagation h is computed from
K I sin hþ K IIð3 cos h� 1Þ ¼ 0 ð10ÞAnalysis of Eq. (10) for the two pure modes showed that for pure Mode I, KII = 0, KIsin h = 0 and h = 0�, and for pure Mode II,
KI = 0 and h = ±70.5�. These values of h are the extreme values of the crack propagation angles. The intermediary values arefound by solving Eq. (10) for h considering the mixed mode, resulting in
h ¼ 2 arctan14
K I
K II� 1
4
ffiffiffiffiffiffiffiffiffiffiffiffiffiffiffiffiffiffiffiffiffiffiffiffiK I
K II
� �2
þ 8
s0@
1A ð11Þ
5.1.3. Fatigue crack growth simulationThe above concepts of numerical crack growth are applied to simulate the fatigue crack propagation, consisting of two pro-
cesses: modelling and meshing, using ANSYS 11 [40] software, and simulating and analyzing, by FRANC2D [31]. A 2D planestrain FE-model was used for the LEFM calculations. Both weld toe radii were modelled with a radius of 1 mm (for other radiiand for rippled surfaces see [12]). Themesh (839 elements, 2684 nodes) consists of 6-node triangular QPEs for the crack regionand 8-node quadrilateral elements for the remaining regions. A unity load (1 N) was used according to the bend loading posi-tions. A Poisson ratio of 0.3 and a Young’s Modulus of 200 GPa was used [18]. The initial crack was placed perpendicularly tothe surface at the point where the crack initiation has been determined. The assumption is that the initial crack in lower toe,upper toe and weld bead are surface ripples which are considered as undercuts [13], with initial size of ainitial = 0.1 mm (also0.5 mm was studied but hardly led to any difference). The initial LOF size (C) is assumed to be 3 mm (also 1 mm and 5 mmwere studied, changing the confinements). The Paris-law constants m = 3, Cchar = 9.5 � 10�12 MPa
pm (characteristic value
corresponding to 95% survival probability), and Cmean = 4.75 � 10�12 MPapm (mean fatigue crack growth rate coefficient)
are recommended by IIW and are used. Threshold effects were considered by assuming DKth = 2 MPapm. The crack incre-
ment size Da was 0.5 mm up to a crack length af = 3.5 mm. Weld defects in the weldments studied resemble initial cracks.Hence, no crack initiation phase is considered for the upper and lower weld toe cracks and for the weld bead (ai = 0.1 mm;note: ai = 0.3 mm gave the same result). The total crack extension was 3.5 mm. The nodal displacement field is obtainedfor the nodes around the crack tip applied to calculate the stress-intensity factor for Modes I and II (KI, KII) using a displace-ment correlation technique based on Eq. (7). Numerical analysis has shown that the stress-intensity factor KII was less than 3%of KI and can be neglected. For KI Eq. (9) was applied for plane strain conditions. Finally, the number of cycles for each crackpropagation step is predicted by applying the obtainedDK andDa to the Paris-model into Eq. (6). In addition to the incremen-tal crack length and the corresponding number of cycles for each Da, the crack growth direction is calculated by applying DKto Eq. (11). All calculations are executed in segments prior to each crack propagation step to predict the crack growth rate anddirection.
5.2. Numerical results and discussion
For the particular case studied here, the initiation of cracking takes place at the top surface; its location is most likely inthe lower weld toe. After fatigue testing most cracks appeared in the lower toe, Fig. 6(a and c), some in (the lower part of) theweld bead and very few in the upper toe, see Fig. 6(a and b). A comprehensive study in [12] has shown, both, from micros-copy analysis and from FE-analysis that the location of crack initiation is governed by the peak stress that is determined bythe combination of distance to the root, global surface (toe) radius and local radius (ripples, always present here, see Fig. 5).The lower toe normally prevails over the upper toe due to the shorter root distance, except if the upper toe radius is signif-icantly smaller. If the lower toe radius is relatively large, a particularly sharp surface ripple can cause the highest stress (andthen guide the crack along the ripple) even in the flat weld bead or in the upper toe, as is likely in Fig. 6(a and b). To cover allcases, different crack initiation sites are considered here (by locating an initial crack) which are upper toe (A), lower toe (B),LOF (C) and weld bead (D).
Welding introduces residual stresses within the weld and in the surrounding area. Residual stresses in tension are det-rimental and may reach the magnitude of the yield strength of the material. Tensile residual stresses may reduce the fatiguelife of the structure by accelerating fatigue crack growth, while compressive residual stresses may decrease fatigue crackgrowth rate and in some cases lead to crack closure. Barsoum [2] reports tensile residual stresses at the weld toe and com-pressive residual stresses in the vicinity of LOF for large scale specimens. He reported that the residual stresses in small scalespecimens are significantly relaxed due to (i) specimen preparation due to cutting, (ii) the subsequent fatigue loading. Thespecimens in this study are cut and machined and should contain smaller amount of residual stresses in comparison towelded structures. Therefore, residual stresses are not considered in this study, as explained in Section 2.1.
Fig. 9 shows a simulated crack that has propagated, and is in good agreement with an experimentally obtained crack. TheFE results in Fig. 10 illustrate (cross section) the stress field during initiation and propagation of a crack in Fig. 10(a–c) and itsinteraction with LOF in Fig. 10(d–f).
Cracking is initiated perpendicular to the surface (at the peak stress location) and then bends towards the root duringpropagation. The stress conditions at the crack tip determine direction and speed. In Fig. 10 the lines of constant stress
M.M. Alam et al. / Engineering Fracture Mechanics 78 (2011) 2246–2258 2253
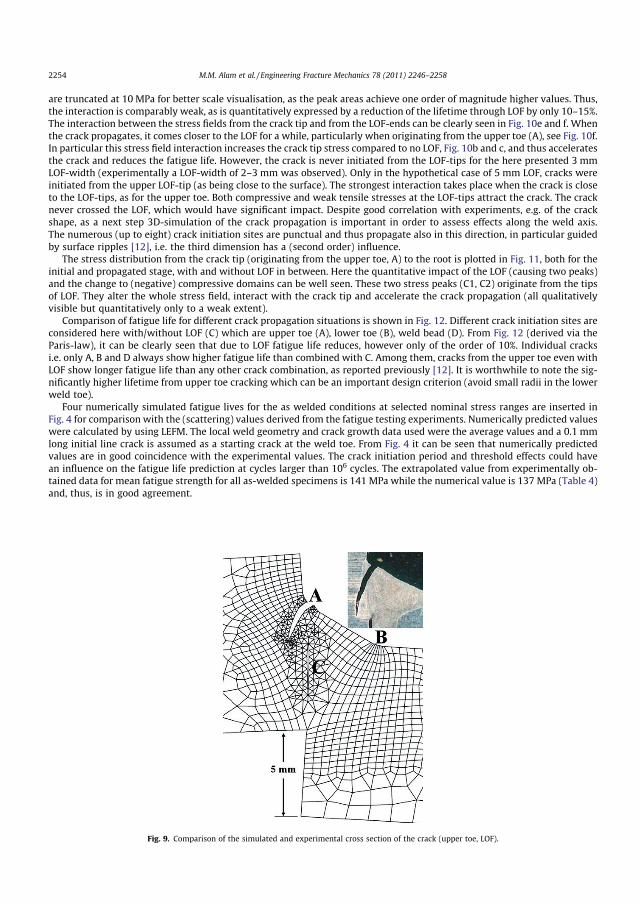
are truncated at 10 MPa for better scale visualisation, as the peak areas achieve one order of magnitude higher values. Thus,the interaction is comparably weak, as is quantitatively expressed by a reduction of the lifetime through LOF by only 10–15%.The interaction between the stress fields from the crack tip and from the LOF-ends can be clearly seen in Fig. 10e and f. Whenthe crack propagates, it comes closer to the LOF for a while, particularly when originating from the upper toe (A), see Fig. 10f.In particular this stress field interaction increases the crack tip stress compared to no LOF, Fig. 10b and c, and thus acceleratesthe crack and reduces the fatigue life. However, the crack is never initiated from the LOF-tips for the here presented 3 mmLOF-width (experimentally a LOF-width of 2–3 mm was observed). Only in the hypothetical case of 5 mm LOF, cracks wereinitiated from the upper LOF-tip (as being close to the surface). The strongest interaction takes place when the crack is closeto the LOF-tips, as for the upper toe. Both compressive and weak tensile stresses at the LOF-tips attract the crack. The cracknever crossed the LOF, which would have significant impact. Despite good correlation with experiments, e.g. of the crackshape, as a next step 3D-simulation of the crack propagation is important in order to assess effects along the weld axis.The numerous (up to eight) crack initiation sites are punctual and thus propagate also in this direction, in particular guidedby surface ripples [12], i.e. the third dimension has a (second order) influence.
The stress distribution from the crack tip (originating from the upper toe, A) to the root is plotted in Fig. 11, both for theinitial and propagated stage, with and without LOF in between. Here the quantitative impact of the LOF (causing two peaks)and the change to (negative) compressive domains can be well seen. These two stress peaks (C1, C2) originate from the tipsof LOF. They alter the whole stress field, interact with the crack tip and accelerate the crack propagation (all qualitativelyvisible but quantitatively only to a weak extent).
Comparison of fatigue life for different crack propagation situations is shown in Fig. 12. Different crack initiation sites areconsidered here with/without LOF (C) which are upper toe (A), lower toe (B), weld bead (D). From Fig. 12 (derived via theParis-law), it can be clearly seen that due to LOF fatigue life reduces, however only of the order of 10%. Individual cracksi.e. only A, B and D always show higher fatigue life than combined with C. Among them, cracks from the upper toe even withLOF show longer fatigue life than any other crack combination, as reported previously [12]. It is worthwhile to note the sig-nificantly higher lifetime from upper toe cracking which can be an important design criterion (avoid small radii in the lowerweld toe).
Four numerically simulated fatigue lives for the as welded conditions at selected nominal stress ranges are inserted inFig. 4 for comparison with the (scattering) values derived from the fatigue testing experiments. Numerically predicted valueswere calculated by using LEFM. The local weld geometry and crack growth data used were the average values and a 0.1 mmlong initial line crack is assumed as a starting crack at the weld toe. From Fig. 4 it can be seen that numerically predictedvalues are in good coincidence with the experimental values. The crack initiation period and threshold effects could havean influence on the fatigue life prediction at cycles larger than 106 cycles. The extrapolated value from experimentally ob-tained data for mean fatigue strength for all as-welded specimens is 141 MPa while the numerical value is 137 MPa (Table 4)and, thus, is in good agreement.
Fig. 9. Comparison of the simulated and experimental cross section of the crack (upper toe, LOF).
2254 M.M. Alam et al. / Engineering Fracture Mechanics 78 (2011) 2246–2258
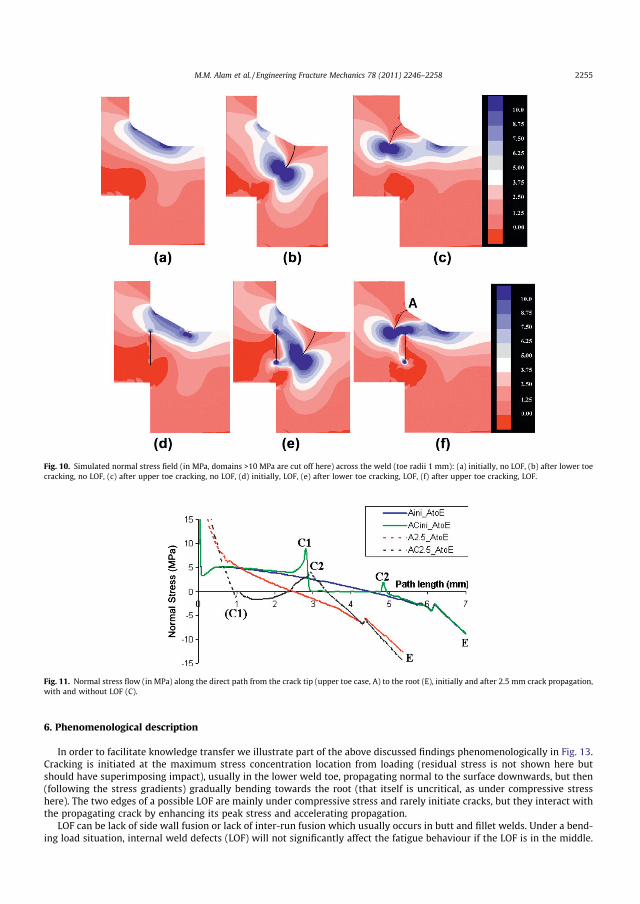
6. Phenomenological description
In order to facilitate knowledge transfer we illustrate part of the above discussed findings phenomenologically in Fig. 13.Cracking is initiated at the maximum stress concentration location from loading (residual stress is not shown here butshould have superimposing impact), usually in the lower weld toe, propagating normal to the surface downwards, but then(following the stress gradients) gradually bending towards the root (that itself is uncritical, as under compressive stresshere). The two edges of a possible LOF are mainly under compressive stress and rarely initiate cracks, but they interact withthe propagating crack by enhancing its peak stress and accelerating propagation.
LOF can be lack of side wall fusion or lack of inter-run fusion which usually occurs in butt and fillet welds. Under a bend-ing load situation, internal weld defects (LOF) will not significantly affect the fatigue behaviour if the LOF is in the middle.
Fig. 10. Simulated normal stress field (in MPa, domains >10 MPa are cut off here) across the weld (toe radii 1 mm): (a) initially, no LOF, (b) after lower toecracking, no LOF, (c) after upper toe cracking, no LOF, (d) initially, LOF, (e) after lower toe cracking, LOF, (f) after upper toe cracking, LOF.
Fig. 11. Normal stress flow (in MPa) along the direct path from the crack tip (upper toe case, A) to the root (E), initially and after 2.5 mm crack propagation,with and without LOF (C).
M.M. Alam et al. / Engineering Fracture Mechanics 78 (2011) 2246–2258 2255
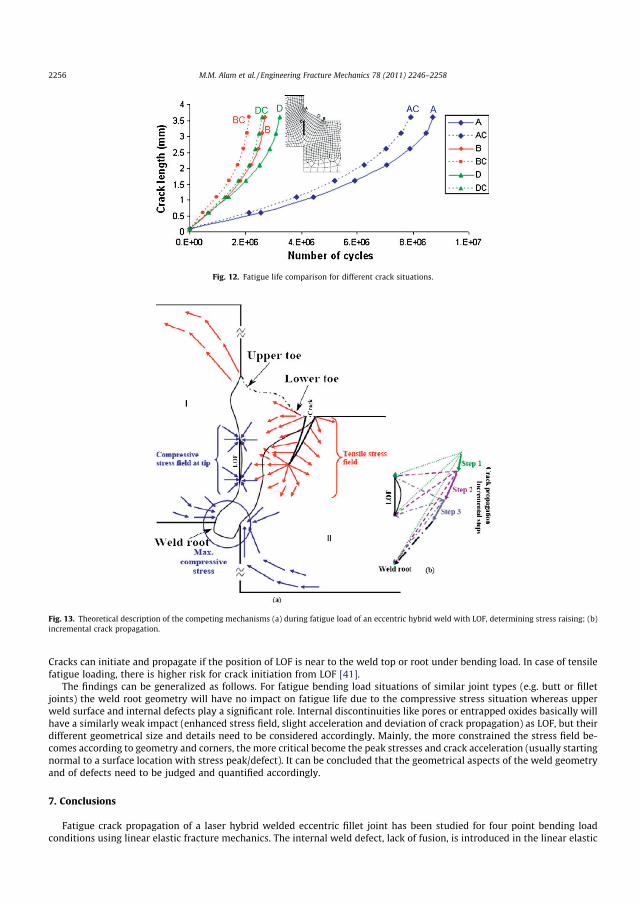
Cracks can initiate and propagate if the position of LOF is near to the weld top or root under bending load. In case of tensilefatigue loading, there is higher risk for crack initiation from LOF [41].
The findings can be generalized as follows. For fatigue bending load situations of similar joint types (e.g. butt or filletjoints) the weld root geometry will have no impact on fatigue life due to the compressive stress situation whereas upperweld surface and internal defects play a significant role. Internal discontinuities like pores or entrapped oxides basically willhave a similarly weak impact (enhanced stress field, slight acceleration and deviation of crack propagation) as LOF, but theirdifferent geometrical size and details need to be considered accordingly. Mainly, the more constrained the stress field be-comes according to geometry and corners, the more critical become the peak stresses and crack acceleration (usually startingnormal to a surface location with stress peak/defect). It can be concluded that the geometrical aspects of the weld geometryand of defects need to be judged and quantified accordingly.
7. Conclusions
Fatigue crack propagation of a laser hybrid welded eccentric fillet joint has been studied for four point bending loadconditions using linear elastic fracture mechanics. The internal weld defect, lack of fusion, is introduced in the linear elastic
Fig. 12. Fatigue life comparison for different crack situations.
Fig. 13. Theoretical description of the competing mechanisms (a) during fatigue load of an eccentric hybrid weld with LOF, determining stress raising; (b)incremental crack propagation.
2256 M.M. Alam et al. / Engineering Fracture Mechanics 78 (2011) 2246–2258
fracture mechanics analysis, as well as surface weld defects. Fatigue testing is evaluated by the nominal stress method. Theconclusions are as follows:– In good agreement between simulation and experiments, the crack first propagates normal to the local weld surface, pref-erably at the lower toe, but then gradually bends to the root.
– Lack of fusion frequently occurs for this kind of weld, however, is not so critical to initiate cracking when under compres-sive stress from loading. When a crack propagates closer to lack of fusion, the interaction increases the stress around thecrack and accelerates propagation, slightly (<10%) reducing the fatigue life for the case studied here.
– Higher slope (m = 3.16) of the S–N curves was obtained for hybrid laser welded eccentric fillet joints than the correspond-ing standard (for gas metal arc welding, m = 3) which indicates longer fatigue life of hybrid laser welded joints.
Acknowledgements
The authors are grateful to VINNOVA – The Swedish Governmental Agency for Innovation Systems (Project HYBRIGHT,No. 2005-02895; Project LOST, No. 2006-00563) for funding the research.
References
[1] Fatemi A, Yang L. Cumulative fatigue damage and life prediction theories: a survey of the state of the art for homogeneous materials. Int J Fatigue1998;20:9–34.
[2] Barsoum Z. Residual stress analysis and fatigue assessment of welded steel structures. Doctoral dissertation. Department of Aeronautical and VehicleStockholm: Royal Institute of Technology; 2007.
[3] Buirette C, Deqallaix G, Dauphin JY, Menigault J. Microstructural effects on short fatigue crack initiation and propagation in high strength steel buttwelded joints. Weld World 1998;41:37–48.
[4] Kim JH, Oh YJ, Hwang IS, Kim DJ, Kim JT. Fracture behavior of heat-affected zone in low alloy steels. J Nucl Mater 2001;299:132–9.[5] Brandt U, Lawrence FV, Sonsino CM. Fatigue crack initiation and growth in AlMg4 5Mn butt weldments.. Fatigue Fract Engng Mater Struct
2001;24:117–26.[6] Saiama MM. Fatigue crack growth behavior of titanium alloy Ti–6Al–4V and weldment. J Offshore Mech Arctic Engng 2001;123:141–6.[7] Li XY, Zhu HG, Tian XT. A study of fatigue crack growth and crack closure in mechanical heterogeneous welded joints. Engng Fract Mech
1996;55:689–97.[8] Zhang HQ, Zhang YH, Li LH, Ma XS. Influence of weld mismatching on fatigue crack growth behavior of electron beam welded joints. Mater Sci Engng A
2002;334:141–6.[9] Christopher B, Gregory G, John P. Fatigue crack initiation and growth in A517 submerged arc welds under variable amplitude loading. Int J Fatigue
2000;22:799–808.[10] Kin IT, Yamada K, Kainuma S. Fatigue behavior of butt welded joints containing inclined lack of-penetration. Struct Engng/Earthquake Engng
2001;18:53–62.[11] Lee CH, Chang KH, Jang GC, Lee CY. Effect of weld geometry on the fatigue life of non-load carrying fillet welded cruciform joints. Engng Fail Anal
2009;16:849–55.[12] AlamMM, Barsoum Z, Jonsén P, Kaplan AFH, Häggblad HÅ. The influence of surface geometry and topography on the fatigue cracking behaviour of laser
hybrid welded eccentric fillet joints. Appl Surf Sci 2010;256:1936–45.[13] Otegui JL, Kerr HW, Burns DJ, Mohaupt UH. Fatigue crack initiation from defects at weld toes in steel. Int J Press Ves Pip 1989;38:385–417.[14] Paris PC. Fracture mechanics and fatigue: a historical perspective. Fatigue Fract Engng Mater Struct 1998;21:535–40.[15] Allen DJ, Degnan G. An investigation of fusion quality in conventional MIG, synergic pulsed MIG, flux-cored arc and manual metal arc welding. In:
Proceedings of the 2nd European conference on joining technology, Eurojoin 2, Florence; 1994.[16] Yamauchi N, Inaba Y, Taka T. Formation mechanisms of lack of fusion in MAG welding. International Institute of Welding, IIW Doc. 212-529-82; 1982.[17] Yao Y, Wouters M, Powell J, Nilsson K, Kaplan AFH. Influence of joint geometry and fit-up gaps on hybrid laser-metal active gas (MAG) welding. J Laser
App 2006;18:283–8.[18] Handbook no. 4. Rostfria stål, 3rd ed. MNC Stockholm; 1983.[19] Hobbacher A. Fatigue design of welded joints and components, IIW document XIII-2151-07 XV-1254-07.[20] Gurney T. Cumulative damage of welded joints. Woodhead Publishing Limited; 2006.[21] Radaj D, Sonsino CM, Fricke W. Fatigue assessment of welded joints by local approaches, Woodhead publishing. 2nd ed. Cambridge: Abington; 2006.[22] Martinsson J. Fatigue assessment of a welded component in construction machinery based on different methods. IIW Document No XIII-1905-01.[23] Verreman Y, Nie B. Short crack growth and coalescence along the toe of a manual fillet weld. Fatigue Fract Engng Mater Struct 1991;14:337–49.[24] Alegre JM, Solana FG, Aragon A. A finite element simulation methodology of the fatigue behavior of punched and drilled plate components. Engng Fail
Anal 2004;11:737–50.[25] Shih CF, Lorenzi HGde, German MD. Crack extension modeling with singular quadratic isoparametric elements. Int J Fract 1976;12:647–51.[26] Fehl BD, Truman KZ. An evaluation of fracture mechanics quarter-point displacement techniques used for computing stress intensity factors. Engng
Struct 1999;21:406–15.[27] Raju IS. Calculation of strain-energy release rates with higher order and singular finite elements. Engng Fract Mech 1987;28:251–74.[28] Rybicki EF, Kanninen MF. A finite element calculation of stress-intensity factors by a modified crack closure integral. Engng Fract Mech 1977;9:931–8.[29] Nikishkov GP, Atluri SN. Calculation of fracture mechanics parameters for an arbitrary three-dimensional crack by the equivalent domain integral
method. Int J Numer Meth Engng 1987;24:1801–21.[30] Anderson TL, Fracture mechanics: fundamentals and applications. 2nd ed. Boca Raton; 1994.[31] FRANC2D. Version 3.2 <http://www.cfg.cornell.edu>.[32] Abdulnaser MA, Kamal AA. Finite element simulation of stress intensity factors in elastic–plastic crack growth. J Zhejiang Univ Sci A 2006;7:1336–42.[33] Erdogan F, Sih GC. On the crack extension in plates under plane loading and transverse shear. ASME J Basic Engng 1963;85:519–27.[34] Hussain MA, Pu SU, Underwood J. Strain energy release rate for a crack under combined mode I and II. ASTM STP 1974;560:2–28.[35] Sih GC. Strain-energy-density factor applied to mixed mode crack problems. Int J Fract Mech 1974;10:305–21.[36] Bittencourt TN, Wawrzynek PA, Ingraffea AR, Sousa JL. Quasi-automatic simulation of crack propagation for 2D LEFM problems. Engng Fract Mech
1996;55:321–34.[37] Ural A, Heber G, Wawrzynek PA, Ingraffea AR, Lewicki DG, Neto JBC. Three dimensional parallel finite element simulation of fatigue crack growth in a
spiral bevel pinion gear. Engng Fract Mech 2005;72:1148–70.[38] Rogers CA, Hancock GJ. Fracture toughness of G550 sheet steels subjected to tension. J Constr Steel Res 2001;57:71–89.
M.M. Alam et al. / Engineering Fracture Mechanics 78 (2011) 2246–2258 2257

[39] Fulland M, Sander M, Kullmer G, Richard HA. Analysis of fatigue crack propagation in the frame of a hydraulic press. Engng Fract Mech2008;75:892–900.
[40] ANSYS guide, ANSYS release 11. Houston: Swanson Analysis Systems.[41] Rihar G, Uran M. Lack of fusion – characterisation of indications. Weld World 2006;50:35–9.
2258 M.M. Alam et al. / Engineering Fracture Mechanics 78 (2011) 2246–2258

Md. Minhaj Alam Paper III: Stress Analysis of Laser Weld Geometries 141
Paper III GENERALISING FATIGUE STRESS ANALYSIS OF DIFFERENT LASER WELD GEOMETRIES M. M. Alam, J. Karlsson, A. F. H. Kaplan Materials & Design, 2011; 32:1814-1823

142 Paper III: Stress Analysis of Laser Weld Geometries Md. Minhaj Alam
Generalising fatigue stress analysis of different laser weld geometries
M.M. Alam ⇑, J. Karlsson, A.F.H. KaplanLuleå University of Technology, Department of Applied Physics and Mechanical Engineering, SE-971 87 Luleå, Sweden
a r t i c l e i n f o
Article history:Received 6 August 2010Accepted 13 December 2010Available online 21 December 2010
Keywords:C. LasersD. WeldingE. Fatigue
a b s t r a c t
Two-dimensional elastic–plastic finite element analyses was carried out on a laser welded box beam inorder to study the impact of the geometrical aspects of the joint type and weld root on the fatigue stressbehaviour. Different experimental and hypothetical weld geometries were studied. Characteristic rootshapes, measured by the plastic replica method, and critical geometrical aspects were classified and thenstudied by FE-analysis with respect to their impact on the maximum stress. The simulation of hypothet-ical transition geometries facilitated the identification of trends and the explanation of part of the phe-nomena. However, quantitative geometry criteria were only partially suitable to describe the relations.The results have shown that the combination of throat depth, local surface radius and its opening angledetermines the peak stress value and its location. Beside extended throat depths, particularly larger toeradii and the avoidance of small opening angles and of surface ripples reduces the peak stress. The expla-nations were developed in a generalising manner, accompanied by illustrative and flow chart description.
� 2010 Elsevier Ltd. All rights reserved.
1. Introduction
Welding often has a strong impact on the product value. Highquality of the weld for avoiding failure is prerequisite, but a com-plex issue that needs improved understanding. The weld quality isdirectly influenced by the process parameters; therefore, weldingcan be considered as a multi-input multi-output process. A com-mon problem faced is the control of the process via the inputparameters to obtain an acceptable welded joint with the requiredweld geometry and weld quality and with minimum detrimentalresidual stresses and distortion. It can be divided into research ofthe influence of the parameters on the process and on the resultingweld quality, and into research on the weld under mechanical loadfrom which the quality standard can be derived and specified. Thispaper focuses on the latter, but also links to the former. As researchis commonly conducted case-specific, it is often difficult to inter-pret and use the results for other applications, both qualitativelyand quantitatively. Although the here presented study is alsocase-based, it tries to develop approaches for generalising the find-ings and the explanations behind.
During laser welding, the beam is focused onto the substratematerial where its high power density enables to drill a vapourcapillary where the beam energy is absorbed over depth, thus typ-ically creating a deep, narrow weld [1]. Laser welding has progres-sively attracted the attention of engineers during the last decades
for its many advantages over more traditional technologies, butsuffers from difficulties in controlling the process quality. How-ever, the laser weld quality is often difficult to control becausethe complex process can be highly sensitive and is not fully under-stood yet. Also the quality standard specifications are not satisfac-tory yet [2,3]. The laser weld geometry is mainly dependent on theparameters welding speed, laser power, focal plane position,shielding gas type/flow and the joint gap [4]. Variation of the mainprocess parameters (power, speed) has a strong effect on the beadprofile (width, penetration depth, melted area) [5,6]. E.g. relation-ships between the focal point position, laser power, welding speedand the responses of tensile and impact strength (stainless steel)were established [7], similarly about the shielding gas for alumin-ium [8]. The effect of laser beam angle, focal point position and fo-cal depth on the weld top and root geometry was systematicallystudied [9] as a base for the present stress analysis.
The particular technique of hybrid laser-arc welding combinesthe advantages of laser and arc welding (simultaneously operated),producing deep penetration welds (laser), yet at the same timehaving an improved tolerance to joint fit-up (burning arc wire-electrode) [10]. From a fundamental analysis of hybrid welds itwas shown that sharp root edges lower the impact strength, thusa gap with a rounded root is even favourable to a zero-gap situa-tion [11]. Other works about the effects of the interaction of weld-ing speed and wire feed rate on penetration are examined in[12,13].
Fatigue life is a combination of crack initiation and propagationstages [14] (followed by the fast failure stage). It usually dependson the weld geometry, e.g. toe radii, root radii, weld angle and de-
0261-3069/$ - see front matter � 2010 Elsevier Ltd. All rights reserved.doi:10.1016/j.matdes.2010.12.031
⇑ Corresponding author. Tel.: +46 (0)920 493917.E-mail addresses: [email protected] (M.M. Alam), [email protected] (J.
Karlsson), [email protected] (A.F.H. Kaplan).
Materials and Design 32 (2011) 1814–1823
Contents lists available at ScienceDirect
Materials and Design
journal homepage: www.elsevier .com/locate /matdes
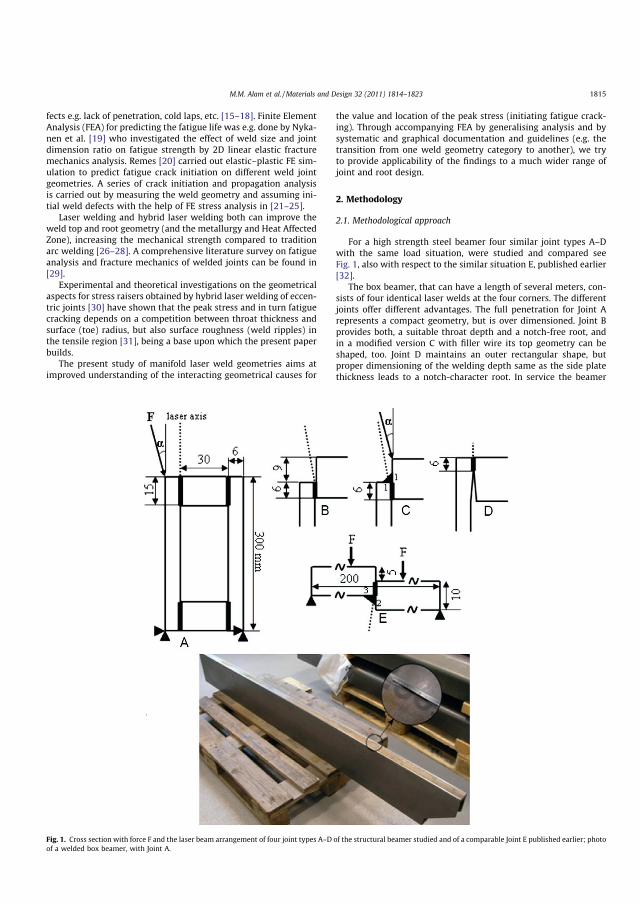
fects e.g. lack of penetration, cold laps, etc. [15–18]. Finite ElementAnalysis (FEA) for predicting the fatigue life was e.g. done by Nyka-nen et al. [19] who investigated the effect of weld size and jointdimension ratio on fatigue strength by 2D linear elastic fracturemechanics analysis. Remes [20] carried out elastic–plastic FE sim-ulation to predict fatigue crack initiation on different weld jointgeometries. A series of crack initiation and propagation analysisis carried out by measuring the weld geometry and assuming ini-tial weld defects with the help of FE stress analysis in [21–25].
Laser welding and hybrid laser welding both can improve theweld top and root geometry (and the metallurgy and Heat AffectedZone), increasing the mechanical strength compared to traditionarc welding [26–28]. A comprehensive literature survey on fatigueanalysis and fracture mechanics of welded joints can be found in[29].
Experimental and theoretical investigations on the geometricalaspects for stress raisers obtained by hybrid laser welding of eccen-tric joints [30] have shown that the peak stress and in turn fatiguecracking depends on a competition between throat thickness andsurface (toe) radius, but also surface roughness (weld ripples) inthe tensile region [31], being a base upon which the present paperbuilds.
The present study of manifold laser weld geometries aims atimproved understanding of the interacting geometrical causes for
the value and location of the peak stress (initiating fatigue crack-ing). Through accompanying FEA by generalising analysis and bysystematic and graphical documentation and guidelines (e.g. thetransition from one weld geometry category to another), we tryto provide applicability of the findings to a much wider range ofjoint and root design.
2. Methodology
2.1. Methodological approach
For a high strength steel beamer four similar joint types A–Dwith the same load situation, were studied and compared seeFig. 1, also with respect to the similar situation E, published earlier[32].
The box beamer, that can have a length of several meters, con-sists of four identical laser welds at the four corners. The differentjoints offer different advantages. The full penetration for Joint Arepresents a compact geometry, but is over dimensioned. Joint Bprovides both, a suitable throat depth and a notch-free root, andin a modified version C with filler wire its top geometry can beshaped, too. Joint D maintains an outer rectangular shape, butproper dimensioning of the welding depth same as the side platethickness leads to a notch-character root. In service the beamer
Fig. 1. Cross section with force F and the laser beam arrangement of four joint types A–D of the structural beamer studied and of a comparable Joint E published earlier; photoof a welded box beamer, with Joint A.
M.M. Alam et al. /Materials and Design 32 (2011) 1814–1823 1815

experiences a complex load, in the present study simplified by aninclined force at the upper left corner. This reduces the 3D-prob-lem to the 2D-cross section where two corners experience widen-ing of the 90�-angle, the other two an angle compression, whichgives much basic insight into the load behaviour.
Joint E bears geometrical similarities in dimension, shape andload, although resulting from laser hybrid welding of stainlesssteel, and to be compared upside down. As the focus of that study[28] was different (impact of roughness and lack of fusion, crackpropagation), it was an interesting challenge to mutually transferthe findings with the present research results.
From the weld surface geometries resulting from experimentsfor joint type A, [9] five representative root geometries of differentcategories were selected. In addition, several hypothetical rootdimensions describing the transition from one category to the otherwere defined. Joints B and C have the same root characteristics as A,thus the same root shapes can be assumed, while for the differentroot in D we compare a sharp root with a semi-circular shape. Thetop of Case E is compared to the roots A–D, as its load orientationis inverted, for comparing the essential tensile stress location. LinearFE-analysis of the stress field was carried out. In particular the peakstress values and their locations were compared.
The above roots were divided into several root classes. In orderto generalise the results it was important to understand the transi-tion from one root class to another, which was possible by FE-anal-ysis of intermediate geometry steps defined. Moreover, sensitivitystudies of certain key dimensions were conducted for quantitativediscussion of essential geometrical properties.
Basic geometry criteria (throat depth, called anchors, curvatureradii and angles) governing the maximum stress were then formu-lated, being stress raiser indicators. For the manifold cases com-puted, the trends for the maximum stress depending on the jointand root geometry were then compared to calculated indicator val-ues in order to analyse the responsible mechanisms and geometri-cal details.
One important aim of the research was to generalise the resultsin order to make them applicable to similar welding situations.
This is a particular challenge, as the generation of stress fields isa highly non-linear mechanism and the strongly geometry-depen-dent causes (similar to fluid flow) can hardly be isolated. The illus-trative description of the results is regarded as an importantmethod to facilitate transferring the knowledge and guidelines tothe reader and to support the reader in applying the findings toother applications and in extending the knowledge in a unifiedmanner by developing the illustrated results further. For this pur-pose: (i) the different geometries were arranged in a scaled dia-gram by comparing their peak stress, (ii) the stress distributionfield was illustrated for a typical geometry, emphasizing its basicgoverning details, (iii) different joint and root types were drawnand properly arranged, including key anchors governing the jointtypes and similar shapes describing the transfer between the roots,(iv) a flow chart was developed to plot the essential criteria forlowering the peak stress.
The flow chart approach is based on a recently developed meth-od for illustrating, documenting, and standardising the findingsfrom analysis of the welding process, called the Bifurcation FlowChart, BFC [33]. The BFC turned out to be suitable for documentingthe causes and phenomena responsible whether a certain weldingdefect occurs or not, thus a digital bifurcation. An extension, theMatric Flow Chart, MFC, was developed and applied in the accom-panying paper [9], illustrating how the five different root types (forJoint A) result depending on the laser welding parameters (to beshown below). In both charts types, high speed imaging findingscan be incorporated as additional information. When trying to ap-ply the BFC to the stress analysis (instead of the welding process)for the first time, it turned out that a different chart is requiredhere, as the goal is continuous (reducing the peak stress as muchas possible) instead of digital (suppressing a weld defect). There-fore, the Tuning Flow Chart, called TFC, was developed, shown inFig. 2 and applied later. It enables to document which (geometri-cal) weld property change reduces the peak stress and how differ-ent property trends act as combination.
Fig. 2. Basic structure of the Tuning Flow Chart.
Table 3Laser and hybrid laser welding parameters.
Parameter Laser welding Hybrid laser
Joint A Joints B–D Joint E
Laser beam power 15 kW 5 kW 3.25 kWWelding speed 2.5 m/min 5 m/min 1.05 m/minLaser beam angle, a 5� or 10� 10� 10�Focal length 500 mm 500 mm 300 mmRayleigh length ±8 mm ±8 mm ±4 mmFocal spot diameter 667 lm 667 lm 400 lm
Table 1Chemical composition [wt.%] of the materials used (sheets, filler wire).
Joint/material C Si Mn Cr Ni P S N Al
A–D: Domex 700 (6 mm thick) 0.12 0.10 2.10 – – 0.025 0.010 – 0.015A–D: Weldox 960 (15 mm thick) 0.20 0.50 1.60 0.70 1.5 0.02 0.010 0.015 0.018E: S142333 (sheets, 10 mm) 0.05 1.0 2.0 19.0 11.0 0.045 0.030 – –E: Avesta 253MA (filler wire) 0.07 1.6 0.6 21.0 10.0 – – 0.15 –
Table 2Mechanical properties of the materials used.
Joint/material Rp0.2 (N/mm2) Rm (N/mm2) A5 (%) Hardness (HB)min min max
A–D: Domex 700 (6 mm) 700 750 12 270A–D: Weldox 960 (15 mm) 960 980 12 320E: SS142333 (sheets) 210 490–690 45 200E: Avesta 253MA (wire) 440 680 38 210
1816 M.M. Alam et al. /Materials and Design 32 (2011) 1814–1823
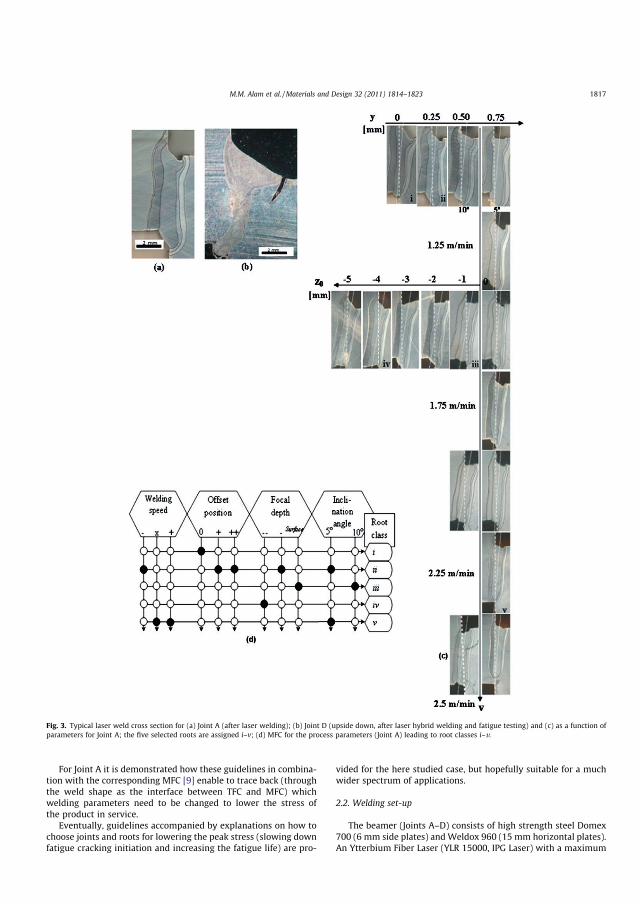
For Joint A it is demonstrated how these guidelines in combina-tion with the corresponding MFC [9] enable to trace back (throughthe weld shape as the interface between TFC and MFC) whichwelding parameters need to be changed to lower the stress ofthe product in service.
Eventually, guidelines accompanied by explanations on how tochoose joints and roots for lowering the peak stress (slowing downfatigue cracking initiation and increasing the fatigue life) are pro-
vided for the here studied case, but hopefully suitable for a muchwider spectrum of applications.
2.2. Welding set-up
The beamer (Joints A–D) consists of high strength steel Domex700 (6 mm side plates) and Weldox 960 (15 mm horizontal plates).An Ytterbium Fiber Laser (YLR 15000, IPG Laser) with a maximum
Fig. 3. Typical laser weld cross section for (a) Joint A (after laser welding); (b) Joint D (upside down, after laser hybrid welding and fatigue testing) and (c) as a function ofparameters for Joint A; the five selected roots are assigned i–v; (d) MFC for the process parameters (Joint A) leading to root classes i–v.
M.M. Alam et al. /Materials and Design 32 (2011) 1814–1823 1817
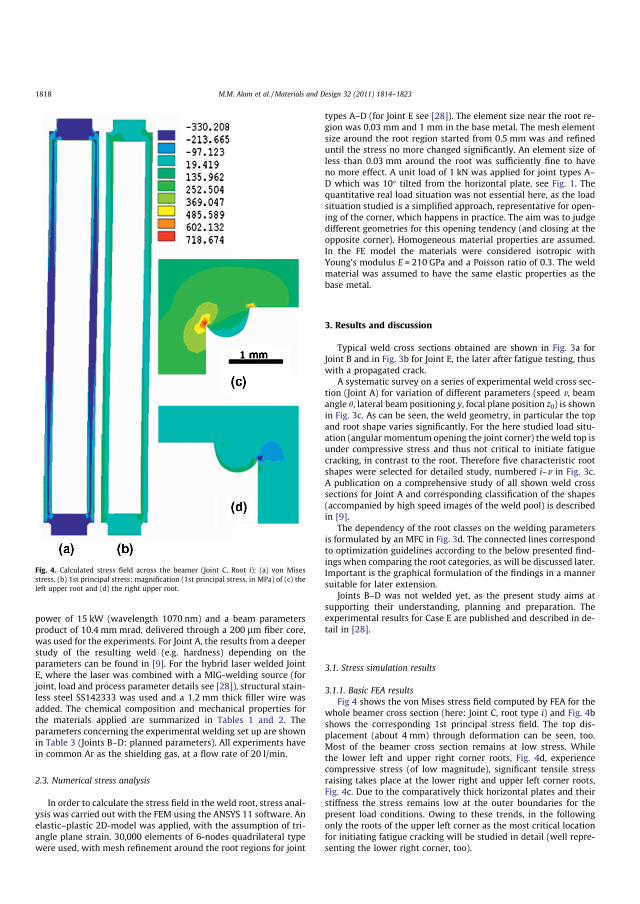
power of 15 kW (wavelength 1070 nm) and a beam parametersproduct of 10.4 mmmrad, delivered through a 200 lm fiber core,was used for the experiments. For Joint A, the results from a deeperstudy of the resulting weld (e.g. hardness) depending on theparameters can be found in [9]. For the hybrid laser welded JointE, where the laser was combined with a MIG-welding source (forjoint, load and process parameter details see [28]), structural stain-less steel SS142333 was used and a 1.2 mm thick filler wire wasadded. The chemical composition and mechanical properties forthe materials applied are summarized in Tables 1 and 2. Theparameters concerning the experimental welding set up are shownin Table 3 (Joints B–D: planned parameters). All experiments havein common Ar as the shielding gas, at a flow rate of 20 l/min.
2.3. Numerical stress analysis
In order to calculate the stress field in the weld root, stress anal-ysis was carried out with the FEM using the ANSYS 11 software. Anelastic–plastic 2D-model was applied, with the assumption of tri-angle plane strain. 30,000 elements of 6-nodes quadrilateral typewere used, with mesh refinement around the root regions for joint
types A–D (for Joint E see [28]). The element size near the root re-gion was 0.03 mm and 1 mm in the base metal. The mesh elementsize around the root region started from 0.5 mm was and refineduntil the stress no more changed significantly. An element size ofless than 0.03 mm around the root was sufficiently fine to haveno more effect. A unit load of 1 kN was applied for joint types A–D which was 10� tilted from the horizontal plate, see Fig. 1. Thequantitative real load situation was not essential here, as the loadsituation studied is a simplified approach, representative for open-ing of the corner, which happens in practice. The aim was to judgedifferent geometries for this opening tendency (and closing at theopposite corner). Homogeneous material properties are assumed.In the FE model the materials were considered isotropic withYoung’s modulus E = 210 GPa and a Poisson ratio of 0.3. The weldmaterial was assumed to have the same elastic properties as thebase metal.
3. Results and discussion
Typical weld cross sections obtained are shown in Fig. 3a forJoint B and in Fig. 3b for Joint E, the later after fatigue testing, thuswith a propagated crack.
A systematic survey on a series of experimental weld cross sec-tion (Joint A) for variation of different parameters (speed v, beamangle h, lateral beam positioning y, focal plane position z0) is shownin Fig. 3c. As can be seen, the weld geometry, in particular the topand root shape varies significantly. For the here studied load situ-ation (angular momentum opening the joint corner) the weld top isunder compressive stress and thus not critical to initiate fatiguecracking, in contrast to the root. Therefore five characteristic rootshapes were selected for detailed study, numbered i–v in Fig. 3c.A publication on a comprehensive study of all shown weld crosssections for Joint A and corresponding classification of the shapes(accompanied by high speed images of the weld pool) is describedin [9].
The dependency of the root classes on the welding parametersis formulated by an MFC in Fig. 3d. The connected lines correspondto optimization guidelines according to the below presented find-ings when comparing the root categories, as will be discussed later.Important is the graphical formulation of the findings in a mannersuitable for later extension.
Joints B–D was not welded yet, as the present study aims atsupporting their understanding, planning and preparation. Theexperimental results for Case E are published and described in de-tail in [28].
3.1. Stress simulation results
3.1.1. Basic FEA resultsFig 4 shows the von Mises stress field computed by FEA for the
whole beamer cross section (here: Joint C, root type i) and Fig. 4bshows the corresponding 1st principal stress field. The top dis-placement (about 4 mm) through deformation can be seen, too.Most of the beamer cross section remains at low stress. Whilethe lower left and upper right corner roots, Fig. 4d, experiencecompressive stress (of low magnitude), significant tensile stressraising takes place at the lower right and upper left corner roots,Fig. 4c. Due to the comparatively thick horizontal plates and theirstiffness the stress remains low at the outer boundaries for thepresent load conditions. Owing to these trends, in the followingonly the roots of the upper left corner as the most critical locationfor initiating fatigue cracking will be studied in detail (well repre-senting the lower right corner, too).
Fig. 4. Calculated stress field across the beamer (Joint C, Root i): (a) von Misesstress, (b) 1st principal stress; magnification (1st principal stress, in MPa) of (c) theleft upper root and (d) the right upper root.
1818 M.M. Alam et al. /Materials and Design 32 (2011) 1814–1823
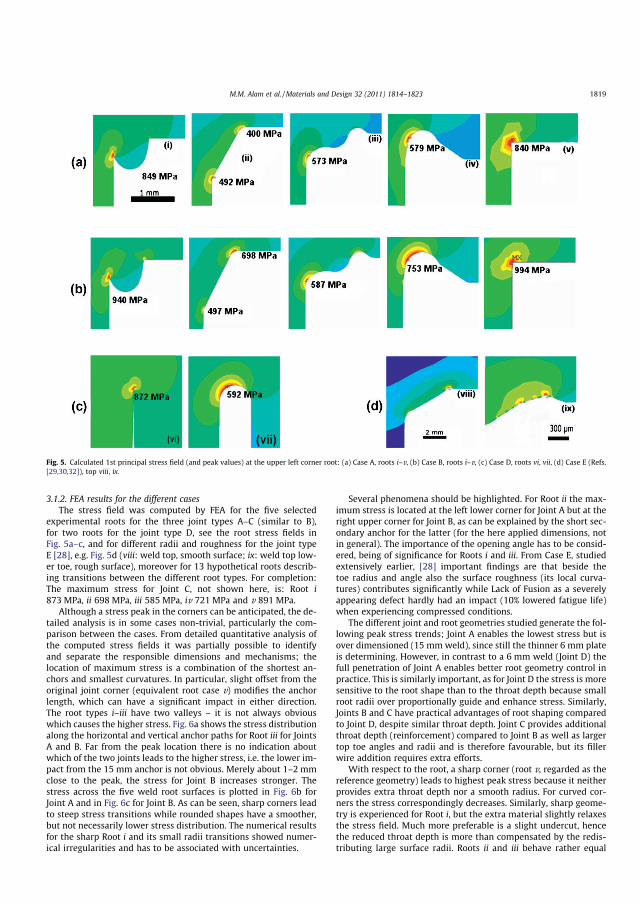
3.1.2. FEA results for the different casesThe stress field was computed by FEA for the five selected
experimental roots for the three joint types A–C (similar to B),for two roots for the joint type D, see the root stress fields inFig. 5a–c, and for different radii and roughness for the joint typeE [28], e.g. Fig. 5d (viii: weld top, smooth surface; ix: weld top low-er toe, rough surface), moreover for 13 hypothetical roots describ-ing transitions between the different root types. For completion:The maximum stress for Joint C, not shown here, is: Root i873 MPa, ii 698 MPa, iii 585 MPa, iv 721 MPa and v 891 MPa.
Although a stress peak in the corners can be anticipated, the de-tailed analysis is in some cases non-trivial, particularly the com-parison between the cases. From detailed quantitative analysis ofthe computed stress fields it was partially possible to identifyand separate the responsible dimensions and mechanisms; thelocation of maximum stress is a combination of the shortest an-chors and smallest curvatures. In particular, slight offset from theoriginal joint corner (equivalent root case v) modifies the anchorlength, which can have a significant impact in either direction.The root types i–iii have two valleys – it is not always obviouswhich causes the higher stress. Fig. 6a shows the stress distributionalong the horizontal and vertical anchor paths for Root iii for JointsA and B. Far from the peak location there is no indication aboutwhich of the two joints leads to the higher stress, i.e. the lower im-pact from the 15 mm anchor is not obvious. Merely about 1–2 mmclose to the peak, the stress for Joint B increases stronger. Thestress across the five weld root surfaces is plotted in Fig. 6b forJoint A and in Fig. 6c for Joint B. As can be seen, sharp corners leadto steep stress transitions while rounded shapes have a smoother,but not necessarily lower stress distribution. The numerical resultsfor the sharp Root i and its small radii transitions showed numer-ical irregularities and has to be associated with uncertainties.
Several phenomena should be highlighted. For Root ii the max-imum stress is located at the left lower corner for Joint A but at theright upper corner for Joint B, as can be explained by the short sec-ondary anchor for the latter (for the here applied dimensions, notin general). The importance of the opening angle has to be consid-ered, being of significance for Roots i and iii. From Case E, studiedextensively earlier, [28] important findings are that beside thetoe radius and angle also the surface roughness (its local curva-tures) contributes significantly while Lack of Fusion as a severelyappearing defect hardly had an impact (10% lowered fatigue life)when experiencing compressed conditions.
The different joint and root geometries studied generate the fol-lowing peak stress trends; Joint A enables the lowest stress but isover dimensioned (15 mmweld), since still the thinner 6 mm plateis determining. However, in contrast to a 6 mm weld (Joint D) thefull penetration of Joint A enables better root geometry control inpractice. This is similarly important, as for Joint D the stress is moresensitive to the root shape than to the throat depth because smallroot radii over proportionally guide and enhance stress. Similarly,Joints B and C have practical advantages of root shaping comparedto Joint D, despite similar throat depth. Joint C provides additionalthroat depth (reinforcement) compared to Joint B as well as largertop toe angles and radii and is therefore favourable, but its fillerwire addition requires extra efforts.
With respect to the root, a sharp corner (root v, regarded as thereference geometry) leads to highest peak stress because it neitherprovides extra throat depth nor a smooth radius. For curved cor-ners the stress correspondingly decreases. Similarly, sharp geome-try is experienced for Root i, but the extra material slightly relaxesthe stress field. Much more preferable is a slight undercut, hencethe reduced throat depth is more than compensated by the redis-tributing large surface radii. Roots ii and iii behave rather equal
Fig. 5. Calculated 1st principal stress field (and peak values) at the upper left corner root: (a) Case A, roots i–v, (b) Case B, roots i–v, (c) Case D, roots vi, vii, (d) Case E (Refs.[29,30,32]), top viii, ix.
M.M. Alam et al. /Materials and Design 32 (2011) 1814–1823 1819

as they even combine both advantages of extended throat depthand large radii.
From the geometry several determining criteria K can be de-rived that can be applied as qualitative and quantitative indicators(or guidelines) for judging joint geometries and root shapes. The
primary anchor length (shortest throat thickness) S1 can be com-bined with the secondary anchor length S2 as stress raiser indicatoras follows:
KS ¼ 1S1
þ 1S2
ð1Þ
The radius describing the curvature of the root surface (here:only cross section-plane) at a certain location results from
RðnÞ ¼ � 1þ @1@n
� �2" #3=2
@1@n
� ��1
ð2Þ
where n is the coordinate along the root surface (cross section)while f is the coordinate normal to the surface. The minimum ra-dius is the key criterion applied for the equations, except where ashorter anchor length S takes over. Beside the main curvature, if sig-nificant surface roughness profiles occur (e.g. ripples [28]) the sameequation can be applied, resulting in a local value r, competing withR, which can be formulated as follows:
KR ¼ 1Rþ 1
rð3Þ
The opening angle b, identified as an important contribution,too, is here defined by the locations where the curvature changessign or transfers to a straight line.
Kb ¼ 1b
ð4Þ
Eq. (4) can fail due to a singularity for parallel walls as in Joint D.A combination of the above stress raisers is:
Ktot ¼ K5bKSKR ¼ 1b
1S1
þ 1S2
� �1Rþ 1
r
� �ð5Þ
The above formulations basically describe the trends experi-enced from the FE-simulations, both in a qualitative and to someextent in a quantitative manner, although of course not accurately,only indicative. Further modelling could introduce a weighting po-tency for each contribution, e.g. a potency p for the curvature:
KRp ¼ R�p ð6ÞFor Joint A, the dimensions of the roots studied, including be-
side the five experimental shapes also six of the hypotheticalshapes for describing the transitions between them are listed in Ta-ble 4 along with the above derived stress raising factors K. For thesharp corners i and v transitions with limited rather than zero radiiwere studied to avoid the singularity in Eq. (1).
Although the above criteria K widely indicate the trends, thequantitative prediction of the maximum stress (e.g. the ratio be-tween any two peak values) is unsatisfactory, due to the stronglynon-linear mechanisms and interactions. For example even forthe less complex root shape v, the influence of the corner radiuscannot be described sufficiently. In the last column the best fittingpotency, p = 0.3 was applied to Eq. (6), providing better relationsbut still overestimating small radii.
The stress peak values obtained from FEA can be compared inan illustrating scale diagram, see Fig. 7, by arranging the differentjoint cases and roots, including the hypothetical transition casesstudied.
Widely the trends, i.e. the change of the stress peak when com-paring one geometry to another, follow the above formulated crite-ria and can thus be explained. For the sharp corner Root i too lowvalues result, probably due to meshing difficulties, but the asymp-totic trend of reduced curvature towards a corner confirms the ex-pected trend, namely that a smaller radius enhances the peakstress. In particular towards a sharp corner a higher stress is gen-erated compared to the other root types. For Joint D a sensitivity
Fig. 6. Stress (1st principal) distribution: (a) along the horizontal and verticalanchors comparing two cases; across the root surface (starting from left lower) forthe five roots for (b) Joint A and (c) Joint B.
1820 M.M. Alam et al. /Materials and Design 32 (2011) 1814–1823

study of the weld throat depth was conducted, providing a quanti-tative sensitivity measure.
The simplified 2D-model and load situation leads to quantita-tive differences to the real load case, which were discussed sepa-
rately. The goal was to achieve with a simplified, manageablemodel representative trends from FEA on the root geometry, likethe increased peak stress from sharp corners and small opening an-gle. For root (i) the very sharp corner was difficult to mesh properlybut as soon as it was approached by a small radius it could be accu-rately computed with an acceptable mesh, leading to the expectedtrends and values.
3.2. Generalised formulation of the trends
By developing additional illustrative approaches, we try to sup-port the understanding of the findings for the reader and the trans-fer to other applications. The comparison of different geometries ishandled by looking at intermediate shapes, followed by studyinghow the essential stress raisers change when geometrical keyproperties change. The above expressions (1), (3)–(5) are one ap-proach for describing the conditions, with Eq. (6) as a more sophis-ticated formulation. The main mechanisms contributing as stressraisers (for the here studied shapes), governed by the anchorlengths, surface radii and opening angles (including roughness)are illustrated in Fig. 8.
The impact of different anchors is illustrated in Fig. 9a, high-lighting the varying impact of the secondary anchor. Two hypo-thetical joint types are added to illustrate how the approach/guidelines can be transferred in a more general manner.
The curvature and opening angle of the root is illustrated inFig. 9b, in particular the shapes describing the transition from oneroot to another. Essential is the surface curvature and the opening
Table 4Maximum stress rmax computed by FEA, main dimensions and derived stress raiser indicators K (normalized to Root i) for Joint A for the five experimental root types i–v and forhypothetical transition root shapes with similar dimensions.
Root rmax S1 S2 R b KS KR Kb Ktot rmax KR0.3
MPa mm mm mm � 1 1 1 1 1 1
i 819 5.83 15.3 0.05 30 1.000 1.000 1.000 1.000 1.000ii 492 5.83 16.6 0.25 150 0.978 0.200 0.200 0.039 0.601iii 573 5.87 15.4 0.45 90 0.993 0.111 0.333 0.037 0.700iv 579 5.93 14.5 0.44 45 1.002 0.114 0.667 0.076 0.707v 840 5.83 15.0 0.05 90 1.006 1.000 0.333 0.335 1.026 1.00ii 525 5.87 15.5 0.33 91 0.992 0.152 0.330 0.050 0.641ii 510 5.86 15.5 0.33 104 0.993 0.152 0.288 0.043 0.623ii 501 5.86 15.5 0.33 114 0.993 0.152 0.263 0.040 0.612v 833 5.86 15.3 0.10 90 1.006 0.500 0.333 0.168 1.017 0.81v 680 5.90 15.7 0.25 90 1.006 0.200 0.333 0.067 0.830 0.62v 391 6.12 15.8 1.00 90 1.006 0.050 0.333 0.017 0.477 0.41
Fig. 7. 1st principle peak stress values (root of the upper corners) for the different cases.
Fig. 8. Illustration of the geometry-dependent trends of the stress distribution(angular momentum load) governed by the joint anchors and by the surfacecurvature.
M.M. Alam et al. /Materials and Design 32 (2011) 1814–1823 1821
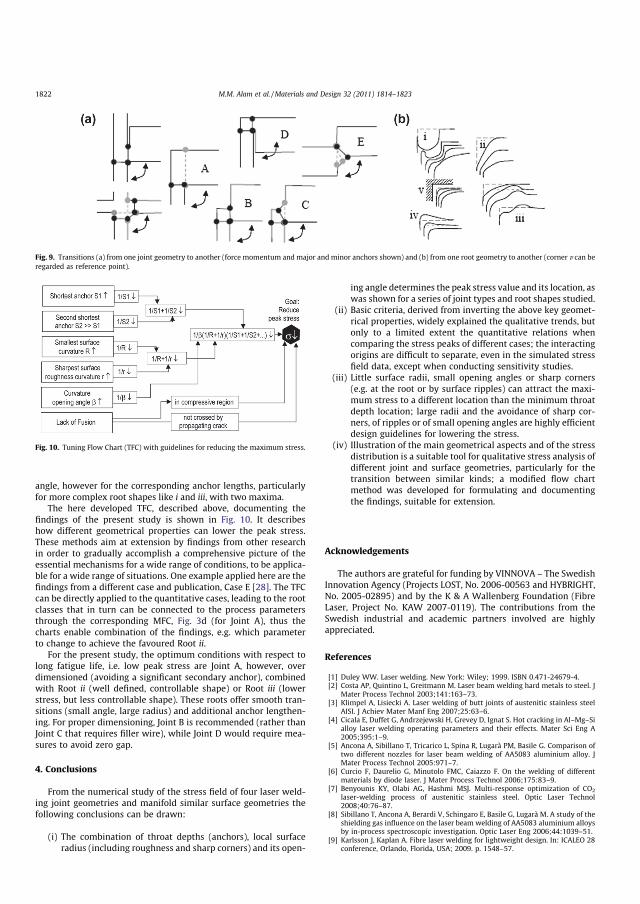
angle, however for the corresponding anchor lengths, particularlyfor more complex root shapes like i and iii, with two maxima.
The here developed TFC, described above, documenting thefindings of the present study is shown in Fig. 10. It describeshow different geometrical properties can lower the peak stress.These methods aim at extension by findings from other researchin order to gradually accomplish a comprehensive picture of theessential mechanisms for a wide range of conditions, to be applica-ble for a wide range of situations. One example applied here are thefindings from a different case and publication, Case E [28]. The TFCcan be directly applied to the quantitative cases, leading to the rootclasses that in turn can be connected to the process parametersthrough the corresponding MFC, Fig. 3d (for Joint A), thus thecharts enable combination of the findings, e.g. which parameterto change to achieve the favoured Root ii.
For the present study, the optimum conditions with respect tolong fatigue life, i.e. low peak stress are Joint A, however, overdimensioned (avoiding a significant secondary anchor), combinedwith Root ii (well defined, controllable shape) or Root iii (lowerstress, but less controllable shape). These roots offer smooth tran-sitions (small angle, large radius) and additional anchor lengthen-ing. For proper dimensioning, Joint B is recommended (rather thanJoint C that requires filler wire), while Joint D would require mea-sures to avoid zero gap.
4. Conclusions
From the numerical study of the stress field of four laser weld-ing joint geometries and manifold similar surface geometries thefollowing conclusions can be drawn:
(i) The combination of throat depths (anchors), local surfaceradius (including roughness and sharp corners) and its open-
ing angle determines the peak stress value and its location, aswas shown for a series of joint types and root shapes studied.
(ii) Basic criteria, derived from inverting the above key geomet-rical properties, widely explained the qualitative trends, butonly to a limited extent the quantitative relations whencomparing the stress peaks of different cases; the interactingorigins are difficult to separate, even in the simulated stressfield data, except when conducting sensitivity studies.
(iii) Little surface radii, small opening angles or sharp corners(e.g. at the root or by surface ripples) can attract the maxi-mum stress to a different location than the minimum throatdepth location; large radii and the avoidance of sharp cor-ners, of ripples or of small opening angles are highly efficientdesign guidelines for lowering the stress.
(iv) Illustration of the main geometrical aspects and of the stressdistribution is a suitable tool for qualitative stress analysis ofdifferent joint and surface geometries, particularly for thetransition between similar kinds; a modified flow chartmethod was developed for formulating and documentingthe findings, suitable for extension.
Acknowledgements
The authors are grateful for funding by VINNOVA – The SwedishInnovation Agency (Projects LOST, No. 2006-00563 and HYBRIGHT,No. 2005-02895) and by the K & A Wallenberg Foundation (FibreLaser, Project No. KAW 2007-0119). The contributions from theSwedish industrial and academic partners involved are highlyappreciated.
References
[1] Duley WW. Laser welding. New York: Wiley; 1999. ISBN 0.471-24679-4.[2] Costa AP, Quintino L, Greitmann M. Laser beam welding hard metals to steel. J
Mater Process Technol 2003;141:163–73.[3] Klimpel A, Lisiecki A. Laser welding of butt joints of austenitic stainless steel
AISI. J Achiev Mater Manf Eng 2007;25:63–6.[4] Cicala E, Duffet G, Andrzejewski H, Grevey D, Ignat S. Hot cracking in Al–Mg–Si
alloy laser welding operating parameters and their effects. Mater Sci Eng A2005;395:1–9.
[5] Ancona A, Sibillano T, Tricarico L, Spina R, Lugarà PM, Basile G. Comparison oftwo different nozzles for laser beam welding of AA5083 aluminium alloy. JMater Process Technol 2005:971–7.
[6] Curcio F, Daurelio G, Minutolo FMC, Caiazzo F. On the welding of differentmaterials by diode laser. J Mater Process Technol 2006;175:83–9.
[7] Benyounis KY, Olabi AG, Hashmi MSJ. Multi-response optimization of CO2
laser-welding process of austenitic stainless steel. Optic Laser Technol2008;40:76–87.
[8] Sibillano T, Ancona A, Berardi V, Schingaro E, Basile G, Lugarà M. A study of theshielding gas influence on the laser beam welding of AA5083 aluminium alloysby in-process spectroscopic investigation. Optic Laser Eng 2006;44:1039–51.
[9] Karlsson J, Kaplan A. Fibre laser welding for lightweight design. In: ICALEO 28conference, Orlando, Florida, USA; 2009. p. 1548–57.
Fig. 9. Transitions (a) from one joint geometry to another (force momentum and major and minor anchors shown) and (b) from one root geometry to another (corner v can beregarded as reference point).
Fig. 10. Tuning Flow Chart (TFC) with guidelines for reducing the maximum stress.
1822 M.M. Alam et al. /Materials and Design 32 (2011) 1814–1823
[10] Yao Y, Wouters M, Powell J, Nilsson K, Kaplan A. Influence of joint geometryand fit-up gaps on hybrid laser-metal active gas (MAG) welding. J Laser Appl2006;18:283–8.
[11] Wouters M. Hybrid laser-MIG welding – an investigation of geometricalconsideriations, Lic. Thesis, Luleå University of Technology; 2005.
[12] Correia DV, Gonc alves CV, Simões da Cunha S, Ferraresi VA. Comparisonbetween genetic algorithms and response surface methodology in GMAWwelding optimization. J Mater Process Technol 2005;160:70–6.
[13] Yi X, Shan P, Hu S, Luo Z. A numerical model of wire melting rate in CO2 gas-shielded welding. Mater Des 2002;23:501–4.
[14] Xiulin Z, Baotong L, Tianxie C, Xiaoyan L, Chao L. Fatigue tests and lifeprediction of 16 Mn steel butt welds without crack-like defect. Int J Fract1994;68:275–85.
[15] Lee CH, Chang KH, Jang GC, Lee CY. Effect of weld geometry on the fatigue lifeof non-load-carrying fillet welded cruciform joints. Eng Fail Anal2009;16:849–55.
[16] Barsoum Z. Residual stress analysis and fatigue assessment of welded steelstructures. Doctoral dissertation, Department of Aeronautical and VehicleEngineering, Royal Institute of Technology, Stockholm; 2007.
[17] Hou CY. Fatigue analysis of welded joints with the aid of real three-dimensional weld toe geometry. Int J Fatigue 2007;29:772–85.
[18] Otegui JL, Kerr HW, Burns DJ, Mohaupt UH. Fatigue crack initiation fromdefects at weld toes in steel. Int J Press Vessels Pip 1989;38:385–417.
[19] Nykanen T, Li X, Bjork T, Marquis G. A parametric fracture mechanics study ofwelded joints with toe cracks and lack of penetration. Eng Fract Mech2005;72:1580–609.
[20] Remes H. Strain-based approach to fatigue strength assessment of laser-welded joints. Doctoral dissertation, Department of MechanicalEngineering, Ship Laboratory, Helsinki University of Technology, Helsinki;2007.
[21] Kainuma S, Mori T. A study on fatigue crack initiation point of load-carryingfillet welded cruciform joints. Int J Fatigue 2008;20:1669–77.
[22] Brennan FP, Peleties P, Hellier AK. Predicting weld toe stress concentrationfactors for T and skewed T-joint plate connections. Int J Fatigue2000;22:573–84.
[23] Pang HLJ. Analysis of weld toe profiles and weld toe cracks. Int J Fatigue1993;15:31–6.
[24] Pang HLJ. Analysis of weld toe radius effects on fatigue weld toe cracks. Int JPress Vessels Pip 1994;58:171–7.
[25] Ferreira JAM, Branco CAM. Influence of the radius of curvature at the weld toein the fatigue strength of fillet weld joints. Int J Fatigue 1989;11:29–36.
[26] Caccese V, Blomquist PA, Berube KA, Webber SR, Orozco NJ. Effect of weldgeometric profile on fatigue life of cruciform welds made by laser/GMAWprocesses. Mar Struct 2006;19:1–22.
[27] Ring M, Dahl W. Fatigue properties of laser-beam weldments on the highstrength steels. Steel Res 1994;65:505–10.
[28] Alam MM, Barsoum Z, Jonsén P, Häggblad HA, Kaplan A. The influence ofsurface geometry and topography on the fatigue cracking behaviour of laserhybrid welded eccentric fillet joints. Appl Surf Sci 2010;256:1936–45.
[29] Alam MM, Barsoum Z, Jonsén P, Häggblad HA, Kaplan A. Fatigue behaviourstudy of laser hybrid welded eccentric fillet joints – Part II: State-of-the-art offracture mechanics and fatigue analysis of welded joints. In: Proceedings ofNOLAMP 12 conference, Copenhagen, Denmark; 2009.
[30] Alam MM, Barsoum Z, Jonsén P, Häggblad HA, Kaplan A. The effects of surfacetopography and lack of fusion on the fatigue strength of laser hybrid welds. In:Proceedings of ICALEO 28 conference, Orlando, Florida, USA; 2009. p. 38–46.
[31] Hobbacher A. Fatigue design of welded joints and components, IIW documentXIII 2151-07/XV-1254-07.
[32] AlamMM, Barsoum Z, Jonsén P, Häggblad HA, Kaplan A. Geometrical aspects ofthe fatigue behaviour of laser hybrid fillet welds. In: Proceedings of fatiguedesign conference, Senlis, Paris, France; 2009.
[33] Kaplan A, Norman P, Wiklund G. The bifurcation flow chart as a method for ageneralised theory, applied to spatter defects during laser welding. In: Proc.12th NOLAMP, Copenhague (DK), FORCE technology; 2009.
M.M. Alam et al. /Materials and Design 32 (2011) 1814–1823 1823
Md. Minhaj Alam Paper IV: Melt Flow Analysis of Hybrid Welding 153
Paper IV ANALYSIS OF THE RAPID CENTRAL MELT POOL FLOW IN HYBRID LASER-ARC WELDING M. M. Alam, A. F. H. Kaplan Physics Procedia, 2012 (in press)

154 Paper IV: Melt Flow Analysis of Hybrid Welding Md. Minhaj Alam
Physics Procedia v (2012) pp.
PHPRO
www.elsevier.com/locate/procedia
LANE 2012
Analysis of the rapid central melt pool flow
in hybrid laser-arc welding M.M. Alama , A.F.H. Kaplana
aLuleå University of Technology, Department of Engineering Sciences and Mathematics, 97187 Luleå, Sweden
Abstract
Hybrid laser arc welding creates a long weld pool tail. By high speed imaging the melt velocity behind the keyhole was measured to be very high, of the order of meters per second. Fluid dynamics simulation was carried out locally in the central axial plane of the pool tail. The high speed melt layer redistributes its momentum to slow movement of the deeper bulk. The consequences of initially high melt speed and its mass flow redistribution on the formation of the central reinforcement peak are discussed. © 2011 Published by Elsevier Ltd. Selection and/or review under responsibility of Bayerisches Laserzentrum GmbH Keywords: hybrid laser arc welding; numerical simulation; melt flow
1. Introduction Hybrid laser arc welding (HLAW) combines two heat sources with different physical properties and mechanisms, namely laser welding and MAG-arc welding, combining their complementary advantages but also their complexity [1]. The occurrence of defects like undercuts has direct impact on the quality and strength of the welded joint [2]. Different types of undercuts can be distinguished, e.g. curved, crack-like and micro-flaw types. Figure 1(a) shows a typical curved undercut from HLAW, while Fig. 1(b) shows the scanned three-dimensional surface topology of the weld with a distinct top reinforcement accompanied by an undercut. The mechanisms of the formation of two types of undercuts during HLAW process were deeper analyzed by high speed photography and micrography [3].
Nowadays the complex flow conditions in the arc, keyhole and melt pool in HLAW have been studied by high speed photography [3], e.g. different drop flight trajectories for leading or trailing arc, with or
* Corresponding author. Tel.: +46-920-493917; fax: +46-920- 4922 28. E-mail address: [email protected]
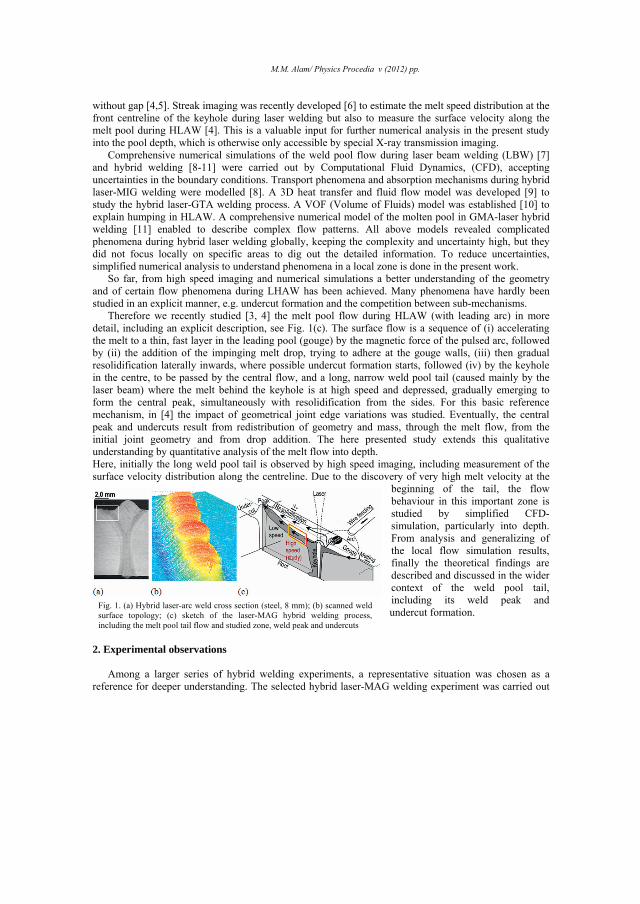
M.M. Alam/ Physics Procedia v (2012) pp.
without gap [4,5]. Streak imaging was recently developed [6] to estimate the melt speed distribution at the front centreline of the keyhole during laser welding but also to measure the surface velocity along the melt pool during HLAW [4]. This is a valuable input for further numerical analysis in the present study into the pool depth, which is otherwise only accessible by special X-ray transmission imaging.
Comprehensive numerical simulations of the weld pool flow during laser beam welding (LBW) [7] and hybrid welding [8-11] were carried out by Computational Fluid Dynamics, (CFD), accepting uncertainties in the boundary conditions. Transport phenomena and absorption mechanisms during hybrid laser-MIG welding were modelled [8]. A 3D heat transfer and fluid flow model was developed [9] to study the hybrid laser-GTA welding process. A VOF (Volume of Fluids) model was established [10] to explain humping in HLAW. A comprehensive numerical model of the molten pool in GMA-laser hybrid welding [11] enabled to describe complex flow patterns. All above models revealed complicated phenomena during hybrid laser welding globally, keeping the complexity and uncertainty high, but they did not focus locally on specific areas to dig out the detailed information. To reduce uncertainties, simplified numerical analysis to understand phenomena in a local zone is done in the present work.
So far, from high speed imaging and numerical simulations a better understanding of the geometry and of certain flow phenomena during LHAW has been achieved. Many phenomena have hardly been studied in an explicit manner, e.g. undercut formation and the competition between sub-mechanisms.
Therefore we recently studied [3, 4] the melt pool flow during HLAW (with leading arc) in more detail, including an explicit description, see Fig. 1(c). The surface flow is a sequence of (i) accelerating the melt to a thin, fast layer in the leading pool (gouge) by the magnetic force of the pulsed arc, followed by (ii) the addition of the impinging melt drop, trying to adhere at the gouge walls, (iii) then gradual resolidification laterally inwards, where possible undercut formation starts, followed (iv) by the keyhole in the centre, to be passed by the central flow, and a long, narrow weld pool tail (caused mainly by the laser beam) where the melt behind the keyhole is at high speed and depressed, gradually emerging to form the central peak, simultaneously with resolidification from the sides. For this basic reference mechanism, in [4] the impact of geometrical joint edge variations was studied. Eventually, the central peak and undercuts result from redistribution of geometry and mass, through the melt flow, from the initial joint geometry and from drop addition. The here presented study extends this qualitative understanding by quantitative analysis of the melt flow into depth. Here, initially the long weld pool tail is observed by high speed imaging, including measurement of the surface velocity distribution along the centreline. Due to the discovery of very high melt velocity at the
beginning of the tail, the flow behaviour in this important zone is studied by simplified CFD-simulation, particularly into depth. From analysis and generalizing of the local flow simulation results, finally the theoretical findings are described and discussed in the wider context of the weld pool tail, including its weld peak and undercut formation.
Fig. 1. (a) Hybrid laser-arc weld cross section (steel, 8 mm); (b) scanned weld surface topology; (c) sketch of the laser-MAG hybrid welding process, including the melt pool tail flow and studied zone, weld peak and undercuts
2. Experimental observations
Among a larger series of hybrid welding experiments, a representative situation was chosen as a reference for deeper understanding. The selected hybrid laser-MAG welding experiment was carried out
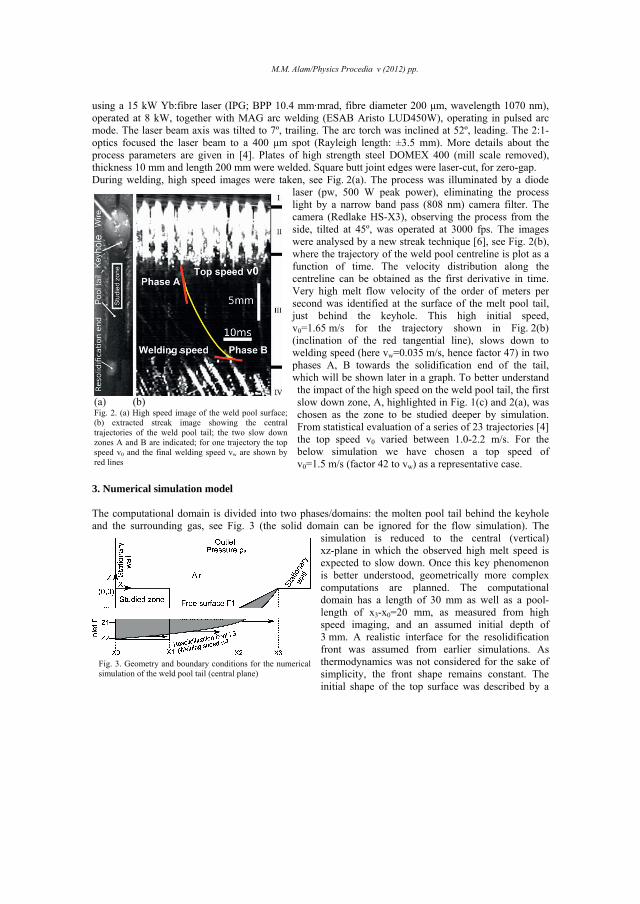
M.M. Alam/Physics Procedia v (2012) pp.
using a 15 kW Yb:fibre laser (IPG; BPP 10.4 mm·mrad, fibre diameter 200 m, wavelength 1070 nm), operated at 8 kW, together with MAG arc welding (ESAB Aristo LUD450W), operating in pulsed arc mode. The laser beam axis was tilted to 7º, trailing. The arc torch was inclined at 52º, leading. The 2:1-optics focused the laser beam to a 400 m spot (Rayleigh length: ±3.5 mm). More details about the process parameters are given in [4]. Plates of high strength steel DOMEX 400 (mill scale removed), thickness 10 mm and length 200 mm were welded. Square butt joint edges were laser-cut, for zero-gap. During welding, high speed images were taken, see Fig. 2(a). The process was illuminated by a diode
laser (pw, 500 W peak power), eliminating the process light by a narrow band pass (808 nm) camera filter. The camera (Redlake HS-X3), observing the process from the side, tilted at 45º, was operated at 3000 fps. The images were analysed by a new streak technique [6], see Fig. 2(b), where the trajectory of the weld pool centreline is plot as a function of time. The velocity distribution along the centreline can be obtained as the first derivative in time. Very high melt flow velocity of the order of meters per second was identified at the surface of the melt pool tail, just behind the keyhole. This high initial speed, v0=1.65 m/s for the trajectory shown in Fig. 2(b) (inclination of the red tangential line), slows down to welding speed (here vw=0.035 m/s, hence factor 47) in two phases A, B towards the solidification end of the tail, which will be shown later in a graph. To better understand the impact of the high speed on the weld pool tail, the first slow down zone, A, highlighted in Fig. 1(c) and 2(a), was chosen as the zone to be studied deeper by simulation. From statistical evaluation of a series of 23 trajectories [4] the top speed v0 varied between 1.0-2.2 m/s. For the below simulation we have chosen a top speed of v0=1.5 m/s (factor 42 to vw) as a representative case.
(a) (b) Fig. 2. (a) High speed image of the weld pool surface;(b) extracted streak image showing the central trajectories of the weld pool tail; the two slow downzones A and B are indicated; for one trajectory the topspeed v0 and the final welding speed vw are shown byred lines
3. Numerical simulation model The computational domain is divided into two phases/domains: the molten pool tail behind the keyhole and the surrounding gas, see Fig. 3 (the solid domain can be ignored for the flow simulation). The
simulation is reduced to the central (vertical) xz-plane in which the observed high melt speed is expected to slow down. Once this key phenomenon is better understood, geometrically more complex computations are planned. The computational domain has a length of 30 mm as well as a pool-length of x3-x0=20 mm, as measured from high speed imaging, and an assumed initial depth of 3 mm. A realistic interface for the resolidification front was assumed from earlier simulations. As thermodynamics was not considered for the sake of simplicity, the front shape remains constant. The initial shape of the top surface was described by a
Fig. 3. Geometry and boundary conditions for the numericalsimulation of the weld pool tail (central plane)
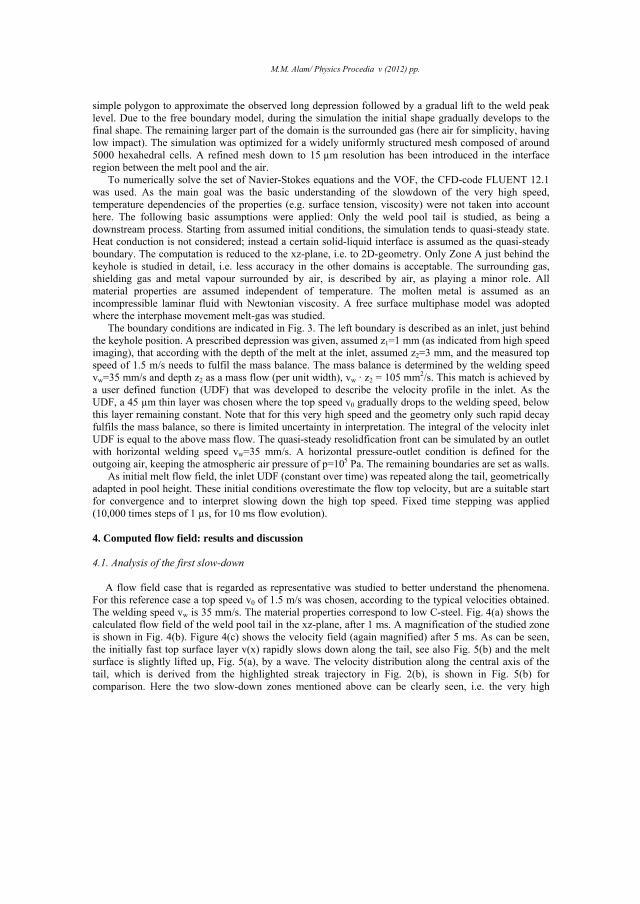
M.M. Alam/ Physics Procedia v (2012) pp.
simple polygon to approximate the observed long depression followed by a gradual lift to the weld peak level. Due to the free boundary model, during the simulation the initial shape gradually develops to the final shape. The remaining larger part of the domain is the surrounded gas (here air for simplicity, having low impact). The simulation was optimized for a widely uniformly structured mesh composed of around 5000 hexahedral cells. A refined mesh down to 15 μm resolution has been introduced in the interface region between the melt pool and the air.
To numerically solve the set of Navier-Stokes equations and the VOF, the CFD-code FLUENT 12.1 was used. As the main goal was the basic understanding of the slowdown of the very high speed, temperature dependencies of the properties (e.g. surface tension, viscosity) were not taken into account here. The following basic assumptions were applied: Only the weld pool tail is studied, as being a downstream process. Starting from assumed initial conditions, the simulation tends to quasi-steady state. Heat conduction is not considered; instead a certain solid-liquid interface is assumed as the quasi-steady boundary. The computation is reduced to the xz-plane, i.e. to 2D-geometry. Only Zone A just behind the keyhole is studied in detail, i.e. less accuracy in the other domains is acceptable. The surrounding gas, shielding gas and metal vapour surrounded by air, is described by air, as playing a minor role. All material properties are assumed independent of temperature. The molten metal is assumed as an incompressible laminar fluid with Newtonian viscosity. A free surface multiphase model was adopted where the interphase movement melt-gas was studied.
The boundary conditions are indicated in Fig. 3. The left boundary is described as an inlet, just behind the keyhole position. A prescribed depression was given, assumed z1=1 mm (as indicated from high speed imaging), that according with the depth of the melt at the inlet, assumed z2=3 mm, and the measured top speed of 1.5 m/s needs to fulfil the mass balance. The mass balance is determined by the welding speed vw=35 mm/s and depth z2 as a mass flow (per unit width), vw · z2 = 105 mm2/s. This match is achieved by a user defined function (UDF) that was developed to describe the velocity profile in the inlet. As the UDF, a 45 μm thin layer was chosen where the top speed v0 gradually drops to the welding speed, below this layer remaining constant. Note that for this very high speed and the geometry only such rapid decay fulfils the mass balance, so there is limited uncertainty in interpretation. The integral of the velocity inlet UDF is equal to the above mass flow. The quasi-steady resolidfication front can be simulated by an outlet with horizontal welding speed vw=35 mm/s. A horizontal pressure-outlet condition is defined for the outgoing air, keeping the atmospheric air pressure of p=105 Pa. The remaining boundaries are set as walls.
As initial melt flow field, the inlet UDF (constant over time) was repeated along the tail, geometrically adapted in pool height. These initial conditions overestimate the flow top velocity, but are a suitable start for convergence and to interpret slowing down the high top speed. Fixed time stepping was applied (10,000 times steps of 1 μs, for 10 ms flow evolution). 4. Computed flow field: results and discussion 4.1. Analysis of the first slow-down
A flow field case that is regarded as representative was studied to better understand the phenomena. For this reference case a top speed v0 of 1.5 m/s was chosen, according to the typical velocities obtained. The welding speed vw is 35 mm/s. The material properties correspond to low C-steel. Fig. 4(a) shows the calculated flow field of the weld pool tail in the xz-plane, after 1 ms. A magnification of the studied zone is shown in Fig. 4(b). Figure 4(c) shows the velocity field (again magnified) after 5 ms. As can be seen, the initially fast top surface layer v(x) rapidly slows down along the tail, see also Fig. 5(b) and the melt surface is slightly lifted up, Fig. 5(a), by a wave. The velocity distribution along the central axis of the tail, which is derived from the highlighted streak trajectory in Fig. 2(b), is shown in Fig. 5(b) for comparison. Here the two slow-down zones mentioned above can be clearly seen, i.e. the very high
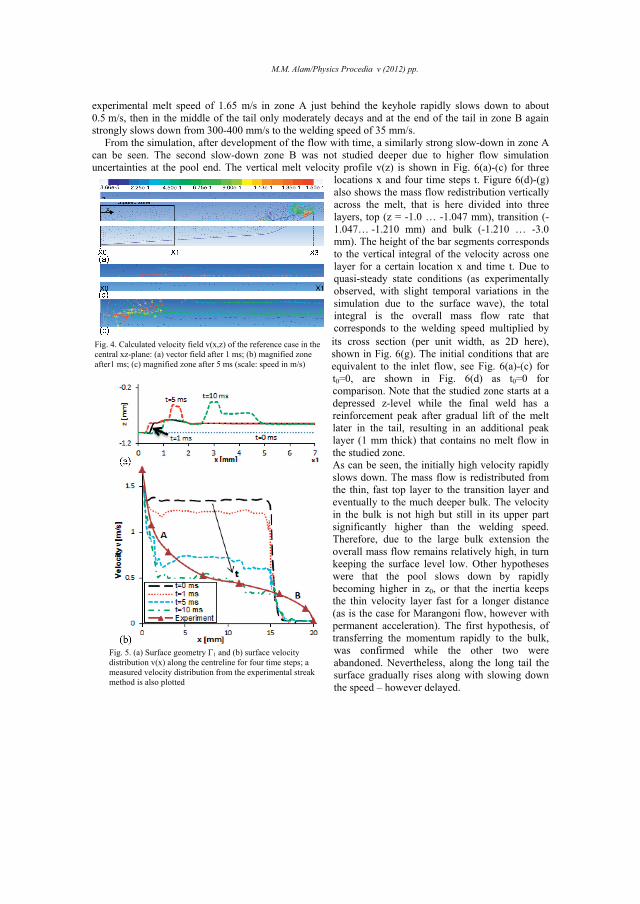
M.M. Alam/Physics Procedia v (2012) pp.
experimental melt speed of 1.65 m/s in zone A just behind the keyhole rapidly slows down to about 0.5 m/s, then in the middle of the tail only moderately decays and at the end of the tail in zone B again strongly slows down from 300-400 mm/s to the welding speed of 35 mm/s.
From the simulation, after development of the flow with time, a similarly strong slow-down in zone A can be seen. The second slow-down zone B was not studied deeper due to higher flow simulation uncertainties at the pool end. The vertical melt velocity profile v(z) is shown in Fig. 6(a)-(c) for three
locations x and four time steps t. Figure 6(d)-(g) also shows the mass flow redistribution vertically across the melt, that is here divided into three layers, top (z = -1.0 … -1.047 mm), transition (-1.047… -1.210 mm) and bulk (-1.210 … -3.0 mm). The height of the bar segments corresponds to the vertical integral of the velocity across one layer for a certain location x and time t. Due to quasi-steady state conditions (as experimentally observed, with slight temporal variations in the simulation due to the surface wave), the total integral is the overall mass flow rate that corresponds to the welding speed multiplied by its cross section (per unit width, as 2D here), shown in Fig. 6(g). The initial conditions that are equivalent to the inlet flow, see Fig. 6(a)-(c) for t0=0, are shown in Fig. 6(d) as t0=0 for comparison. Note that the studied zone starts at a depressed z-level while the final weld has a reinforcement peak after gradual lift of the melt later in the tail, resulting in an additional peak layer (1 mm thick) that contains no melt flow in the studied zone.
Fig. 4. Calculated velocity field v(x,z) of the reference case in the central xz-plane: (a) vector field after 1 ms; (b) magnified zone after1 ms; (c) magnified zone after 5 ms (scale: speed in m/s)
As can be seen, the initially high velocity rapidly slows down. The mass flow is redistributed from the thin, fast top layer to the transition layer and eventually to the much deeper bulk. The velocity in the bulk is not high but still in its upper part significantly higher than the welding speed. Therefore, due to the large bulk extension the overall mass flow remains relatively high, in turn keeping the surface level low. Other hypotheses were that the pool slows down by rapidly becoming higher in z0, or that the inertia keeps the thin velocity layer fast for a longer distance (as is the case for Marangoni flow, however with permanent acceleration). The first hypothesis, of transferring the momentum rapidly to the bulk, was confirmed while the other two were abandoned. Nevertheless, along the long tail the surface gradually rises along with slowing down the speed – however delayed.
Fig. 5. (a) Surface geometry 1 and (b) surface velocity distribution v(x) along the centreline for four time steps; a measured velocity distribution from the experimental streak method is also plotted
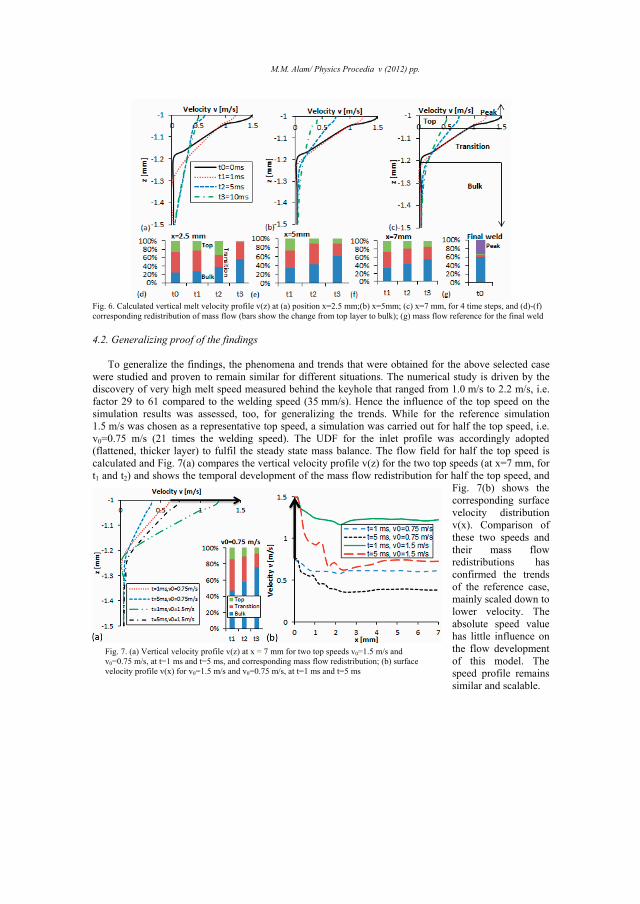
M.M. Alam/ Physics Procedia v (2012) pp.
Fig. 6. Calculated vertical melt velocity profile v(z) at (a) position x=2.5 mm;(b) x=5mm; (c) x=7 mm, for 4 time steps, and (d)-(f) corresponding redistribution of mass flow (bars show the change from top layer to bulk); (g) mass flow reference for the final weld 4.2. Generalizing proof of the findings
To generalize the findings, the phenomena and trends that were obtained for the above selected case were studied and proven to remain similar for different situations. The numerical study is driven by the discovery of very high melt speed measured behind the keyhole that ranged from 1.0 m/s to 2.2 m/s, i.e. factor 29 to 61 compared to the welding speed (35 mm/s). Hence the influence of the top speed on the simulation results was assessed, too, for generalizing the trends. While for the reference simulation 1.5 m/s was chosen as a representative top speed, a simulation was carried out for half the top speed, i.e. v0=0.75 m/s (21 times the welding speed). The UDF for the inlet profile was accordingly adopted (flattened, thicker layer) to fulfil the steady state mass balance. The flow field for half the top speed is calculated and Fig. 7(a) compares the vertical velocity profile v(z) for the two top speeds (at x=7 mm, for t1 and t2) and shows the temporal development of the mass flow redistribution for half the top speed, and
Fig. 7(b) shows the corresponding surface velocity distribution v(x). Comparison of these two speeds and their mass flow redistributions has confirmed the trends of the reference case, mainly scaled down to lower velocity. The absolute speed value has little influence on the flow development of this model. The speed profile remains similar and scalable.
Fig. 7. (a) Vertical velocity profile v(z) at x = 7 mm for two top speeds v0=1.5 m/s and v0=0.75 m/s, at t=1 ms and t=5 ms, and corresponding mass flow redistribution; (b) surface velocity profile v(x) for v0=1.5 m/s and v0=0.75 m/s, at t=1 ms and t=5 ms
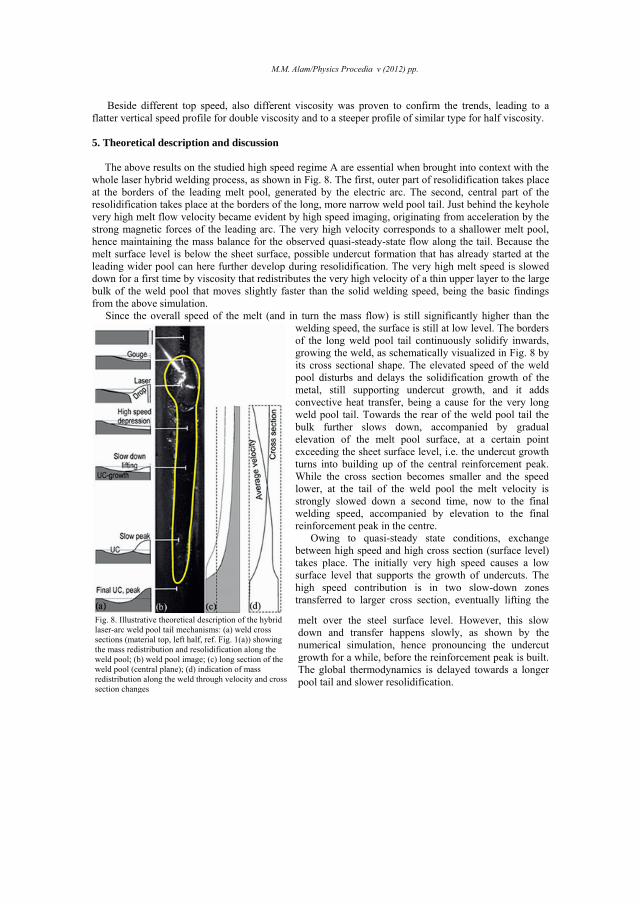
M.M. Alam/Physics Procedia v (2012) pp.
Beside different top speed, also different viscosity was proven to confirm the trends, leading to a
flatter vertical speed profile for double viscosity and to a steeper profile of similar type for half viscosity. 5. Theoretical description and discussion
The above results on the studied high speed regime A are essential when brought into context with the
whole laser hybrid welding process, as shown in Fig. 8. The first, outer part of resolidification takes place at the borders of the leading melt pool, generated by the electric arc. The second, central part of the resolidification takes place at the borders of the long, more narrow weld pool tail. Just behind the keyhole very high melt flow velocity became evident by high speed imaging, originating from acceleration by the strong magnetic forces of the leading arc. The very high velocity corresponds to a shallower melt pool, hence maintaining the mass balance for the observed quasi-steady-state flow along the tail. Because the melt surface level is below the sheet surface, possible undercut formation that has already started at the leading wider pool can here further develop during resolidification. The very high melt speed is slowed down for a first time by viscosity that redistributes the very high velocity of a thin upper layer to the large bulk of the weld pool that moves slightly faster than the solid welding speed, being the basic findings from the above simulation. Since the overall speed of the melt (and in turn the mass flow) is still significantly higher than the
welding speed, the surface is still at low level. The borders of the long weld pool tail continuously solidify inwards, growing the weld, as schematically visualized in Fig. 8 by its cross sectional shape. The elevated speed of the weld pool disturbs and delays the solidification growth of the metal, still supporting undercut growth, and it adds convective heat transfer, being a cause for the very long weld pool tail. Towards the rear of the weld pool tail the bulk further slows down, accompanied by gradual elevation of the melt pool surface, at a certain point exceeding the sheet surface level, i.e. the undercut growth turns into building up of the central reinforcement peak. While the cross section becomes smaller and the speed lower, at the tail of the weld pool the melt velocity is strongly slowed down a second time, now to the final welding speed, accompanied by elevation to the final reinforcement peak in the centre.
Owing to quasi-steady state conditions, exchange between high speed and high cross section (surface level) takes place. The initially very high speed causes a low surface level that supports the growth of undercuts. The high speed contribution is in two slow-down zones transferred to larger cross section, eventually lifting the
melt over the steel surface level. However, this slow down and transfer happens slowly, as shown by the numerical simulation, hence pronouncing the undercut growth for a while, before the reinforcement peak is built. The global thermodynamics is delayed towards a longer pool tail and slower resolidification.
Fig. 8. Illustrative theoretical description of the hybrid laser-arc weld pool tail mechanisms: (a) weld cross sections (material top, left half, ref. Fig. 1(a)) showing the mass redistribution and resolidification along the weld pool; (b) weld pool image; (c) long section of the weld pool (central plane); (d) indication of mass redistribution along the weld through velocity and cross section changes

M.M. Alam/ Physics Procedia v (2012) pp.
Further numerical and experimental studies are needed for complete understanding of the formation of
the undercuts and of the reinforcement. These are two essential weld quality criteria that have strong impact on the strength, as stress raisers and for fatigue crack propagation. However, from the above described wider context of the mechanisms in the weld pool tail and from the findings of the present study several hypotheses can be postulated on how to suppress undercut formation, e.g. reduction of the top speed through optimized magnetic arc forces, trailing arc, or matching the laser and arc parameters. 6. Conclusions (i) Hybrid laser welding with leading arc tends to undercuts despite excess of material from the wire. (ii) From high speed imaging very high velocity of the melt surface at the beginning of the long tail was
discovered, rapidly slowing down in two stages. (iii) The melt speed reached 1.0-2.2 m/s, here a factor 29-61 times the welding speed, probably driven by
the arc pressure. (iv) Numerical simulation of the flow field has shown that the mass flow of the high-speed-layer rapidly
is redistributed to the much thicker melt bulk, increasing the bulk velocity above the welding speed. (v) This trend is different to other high velocity phenomena such as Marangoni convection; the
behaviour remained similar for different viscosity or top speed. (vi) We postulate the hypothesis that higher bulk speed elongates the pool and delays lateral
resolidification, favouring flow to the centre which emphasizes the central weld peak and undercuts. Acknowledgements The authors acknowledge funding from the EU-Objective 2-project IndLas, no. 152512. References [1] Ribic B.; Palmer T. A.; DebRoy T.: Problems and issues in laser-arc hybrid welding. Int. Mater. Rev. 2009; 54: pp.223-244. [2] Alam M. M; Barsoum Z; Jonsen P; Häggblad H.A.; Kaplan A. F. H.: The influence of surface geometry and topography on
the fatigue cracking behaviour of laser hybrid welded eccentric fillet joints. Appl. Surf. Sci. 2010; 256: pp. 1936-1945. [3] Karlsson J.; Norman P.; Lamas J.; Yañez A.; Kaplan A. F. H.: Observation of the mechanisms causing two kinds of undercuts
during laser hybrid arc welding, Appl. Surf. Sci. 2011; 257: pp. 7501-7506. [4] Kaplan A. F. H; Lamas J.; Karlsson J.; Norman P.; Yañez A.: Scanner analysis of the topology of laser hybrid welds
depending on the joint edge tolerances. 12th NOLAMP conference, 2011, Trondheim, Norway, Ed. E. Halmoy (2011). [5] Kim Y. P.; Alam N.; Bang H. S.: Observation of hybrid (cw Nd:YAG laser +MIG) welding phenomenon in AA 5083 butt
joints with different gap condition. Sci. Tech. Weld. Join. 2006; 11: pp. 295–307. [6] Eriksson I.; Powell J.; Kaplan A. F. H.: Measurements of fluid flow inside laser welding keyholes. Sci. Tech. Weld.
Join.: 2011; 16: pp. 636-641. [7] Wang R.; Lei Y.; Shi Y.: Numerical simulation of transient temperature field during laser keyhole welding of 304 stainless
steel sheet. Optic. Laser Tech. 2011; 43: pp. 870-873. [8] Zhou J.; Tsai H.L.: Modeling of transport phenomena in hybrid laser-MIG keyhole welding. Int. J. Heat Mass Transf. 2008;
51: pp. 4353–4366. [9] Ribic B.; Rai R.; Debroy T.: Numerical simulation of heat transfer and fluid flow in GTA/laser hybrid welding. Sci. Tech.
Weld. Join. 2008; 13: pp. 683-693. [10] Cho M. H.; Farson D.; Lim Y. C.; Choi H. W.: Hybrid laser/arc welding process for controlling bead profile. Sci. Tech. Weld.
Join. 2007; 12: pp. 677-688. [11] Cho J. H.; Na S. J.: Three-dimensional analysis of molten pool in GMA-Laser hybrid welding. Weld. J. 2009; 88: pp. 35-43.
Md. Minhaj Alam Paper V: Fatigue Failure by a Surface Pore 163
Paper V SURFACE PORE INITIATED FATIGUE FAILURE IN LASER CLAD COMPONENTS M. M. Alam, J. Powell, A. F. H. Kaplan, J. Tuominen, P. Vuoristo, J. Miettinen, J. Poutala, J. Näkki, J. Junkala, T. Peltola
Submitted, 2012

164 Paper V: Fatigue Failure by a Surface Pore Md. Minhaj Alam
Md. Minhaj Alam Paper V: Fatigue Failure by a Surface Pore
Surface pore initiated fatigue failure in laser clad components M. M. Alam1*, J. Powell1, A. F. H. Kaplan1, J. Tuominen2, P. Vuoristo2, J. Miettinen3, J. Poutala3, J. Näkki2,4, J. Junkala4, T. Peltola4
1Luleå University of Technology, Department of Engineering Science and Mathematics SE-971 87 Luleå, Sweden Email: [email protected], [email protected], [email protected] 2Tampere University of Technology, Department of Materials Science FI-33101 Tampere, Finland Email: [email protected], [email protected], [email protected] 3Tampere University of Technology, Department of Mechanics and Design FI-33101 Tampere, Finland Email: [email protected], [email protected] 4Technology Centre KETEK Ltd FI-67100 Kokkola, Finland Email: [email protected], [email protected] *Corresponding author: [email protected] Phone: +46(0)920 493917 Fax: +46(0)920 49 22 28
Abstract A laser clad cylindrical structural steel rod was fatigue tested under four-point bending load. The resulting fracture could be tracked back to a spherical surface pore in the Co-based coating. Due to an oxide inclusion the pore was invisible. Two circular buckling strain patterns that were detected beside the pore at the surfaces after fracture confirm local plastic deformation prior to crack initiation. In order to calculate the stress field around the surface pore, linear elastic finite element analysis was carried out. For four-point bending load a surface pore generally exceeds the maximum stress of a smooth rod as long as the pore is located within an azimuthal angle of 55º, which was the case for the presented as well as for another pore-initiated sample.
Keywords: pore; inclusion; laser clad; Co-based coating; fatigue cracking
Paper V: Fatigue Failure by a Surface Pore Md. Minhaj Alam
1. Introduction Various machine elements, like cylindrical rods, are coated in order to improve their wear and corrosion resistance. Laser cladding is a technique that deposits metal powder on a laser-melted substrate, either by blowing or preplacing the powder.1 Owing to remelting of the top layer of the substrate, such coatings are metallurgically well bonded. Therefore, the adhesive strength is much better for laser clads than for many other coating techniques such as plasma spraying or cold metal deposition.2 With this technique, a wide variety of materials has been successfully deposited as coating on the substrate, such as Co-based hard facing alloys,3-5 Ni-based alloys,6-7 or composites.8 Thus laser cladding is becoming widely used in many industrial applications such as automotive, railway etc due to its high corrosion and wear resistance characteristics.
In spite of a significant increase in corrosion or wear resistance characteristics, thin layers, strong bonding and high density, laser cladding technology has some essential drawbacks. During laser cladding, a large mismatch in thermo-physical properties between the substrate and clad material along with steep temperature gradients often results in the development of residual stress at substrate/clad interface. The ripples from overlapping clads create a rough surface that generates stress peaks during fatigue loading condition which can initiate cracking.9 Despite higher homogeneity than other techniques, the cladding process can generate defects such as lack of fusion, hot cracks, pores or inclusions, both at the layer-substrate interface and inside the clad layer, and particularly at the interfaces of overlapping layers. The physical mechanisms of blown powder laser cladding can be explained by a mathematical model.10 Pores in the laser clad layer were detected and partially explained by Vedani et al.11 Although the present paper studies a pore filled with oxide, which is usually called an inclusion, we prefer to call it a pore as weakly bonded fillings have a minimal impact on stress raising, as simulations have shown. The presence of a spherical cavity in the metal body is the essential feature under discussion. The effect of pores and their locations on fatigue crack initiation has been analysed numerically by several researchers, mainly for pores in cast alloys. Fan et al.12 studied by Finite Element Analysis (FEA) the plastic shear strain range as a function of the distance of a pore from the surface. They found that the plastic shear strain range increased significantly as the pore approached the free surface, particularly when the pore reaches the surface, until a plastic limit is reached. Other researchers have also shown through fatigue testing that fatigue cracks were most likely initiated from those pores that were just buried beneath the surface.13 Li et al.14 performed FEA on the pore position which indicated that stress/strain concentrations reached their peaks when a pore of 200 μm in diameter was just buried beneath the surface. But Xu et al.15 confirmed numerically that pores even smaller than 200 μm buried just beneath the surface or with their top half intercepting the free surface are equally critical for fatigue crack initiation. They have concluded that the pore size only increased the zone of high stress/strain concentration around the pore in the surface but did not affect the maximum stress involved. Recent studies by Murakami16 have also confirmed that crack initiation is strongly influenced by the shape of cavities/pores. The size of pores

Md. Minhaj Alam Paper V: Fatigue Failure by a Surface Pore
does not alter the maximum stress but it strongly influences the fatigue limit. Once the crack has initiated from inhomogeneities, inclusions or other defects, the size of the crack determines the stress intensification at the crack tip and accordingly the threshold condition for propagation.
While most studies concentrate on homogeneous materials and load situations, we
present here evidence of fatigue cracking initiated from an oxide filled surface pore, generated in a Co-based laser clad layer, and which experienced asymmetric four-point bending load where the azimuthal pore location becomes important. 2. Experimental method Co-base powder was first deposited on a cylindrical steel rod by laser cladding, then the surface was finished by machining and finally the sample was fatigue tested under a four point bending load. The fracture surface and its initiating pore were studied by microscopy. FEM stress analysis was carried out to calculate the stress field in the rod as well as stress raising by a pore.
Laser cladding was carried out using a diode-pumped Nd:YAG laser Rofin-Sinar
DY044, at Technology Center KETEK Ltd. with a maximum power of 4.4 kW (wavelength 1064 nm) and a beam parameter product of 18 mm mrad, delivered through a fibre with 600 m core diameter. The experimental set-up consisted of a laser integrated with a beam delivery system, co-axial nozzle, powder feeder using blown powder technique and a robot controlled workstation. The laser beam was focused with 200 mm focal length optics. The defocused beam employed had a diameter of 6 mm at the surface of the base material. During the cladding process, the cylindrical structural steel S355 rod was rotating relative to the laser beam and the blown metal powder of Stellite 21. The chemical composition and the mechanical properties of the cladding powder and substrate are tabulated in Table 1 and Table 2 respectively while experimental parameters used for the study are summarized in Table 3. The rod with its radial clad pattern can be seen in Fig 1(a). After cladding, half of the 1.5 mm thick deposited layer was machined off, generating a smooth, 0.75 mm thick clad layer with a surface roughness of Ra = 0.2 m. The dimensions of the test specimens were L=580 mm in length and 49.3 mm in diameter (including the 0.75 mm thick clad layer). From dye penetration inspection after machining, a series of surface pores were detected for the here studied sample, however, not the crack initiating inclusion. For the second sample presented, process optimization enabled to avoid any surface pores, while again an invisible surface inclusion initiated cracking.
Table 1: Chemical composition (wt.-%) of the coating powder and substrate
Material Co C Cr Ni Mn Si Mo Fe Cu Al S
Stellite 21 (coating) Base 0.27 25.8 2.41 0.65 0.37 5.39 0.09 – – –
S355 (substrate) - 0.22 1.24 0.3 Base .04 .025 .02
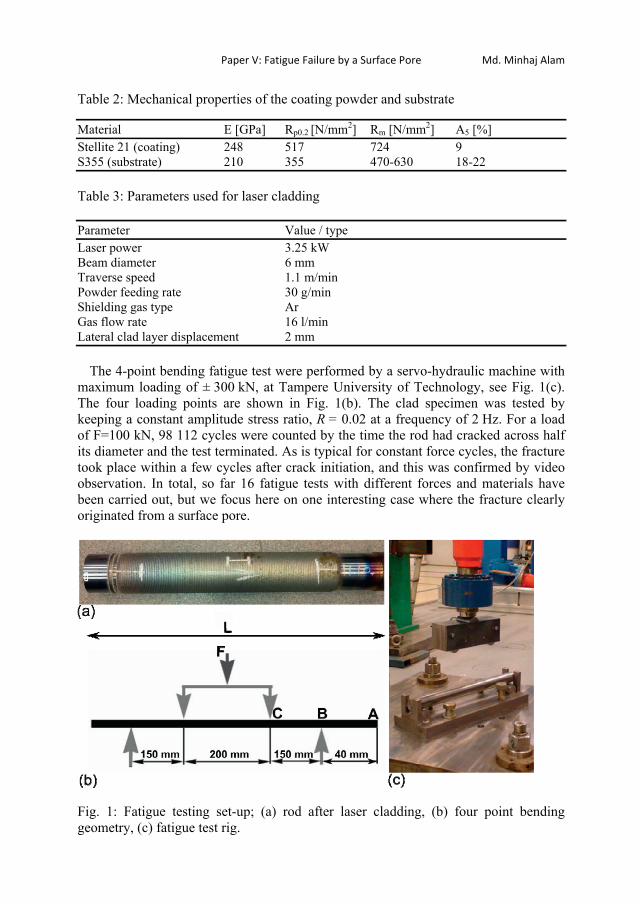
Paper V: Fatigue Failure by a Surface Pore Md. Minhaj Alam
Table 2: Mechanical properties of the coating powder and substrate Material E [GPa] Rp0.2 [N/mm2] Rm [N/mm2] A5 [%] Stellite 21 (coating) 248 517 724 9 S355 (substrate) 210 355 470-630 18-22 Table 3: Parameters used for laser cladding Parameter Value / type Laser power 3.25 kW Beam diameter 6 mm Traverse speed 1.1 m/min Powder feeding rate 30 g/min Shielding gas type Ar Gas flow rate 16 l/min Lateral clad layer displacement 2 mm
The 4-point bending fatigue test were performed by a servo-hydraulic machine with
maximum loading of ± 300 kN, at Tampere University of Technology, see Fig. 1(c). The four loading points are shown in Fig. 1(b). The clad specimen was tested by keeping a constant amplitude stress ratio, R = 0.02 at a frequency of 2 Hz. For a load of F=100 kN, 98 112 cycles were counted by the time the rod had cracked across half its diameter and the test terminated. As is typical for constant force cycles, the fracture took place within a few cycles after crack initiation, and this was confirmed by video observation. In total, so far 16 fatigue tests with different forces and materials have been carried out, but we focus here on one interesting case where the fracture clearly originated from a surface pore.
Fig. 1: Fatigue testing set-up; (a) rod after laser cladding, (b) four point bending geometry, (c) fatigue test rig.
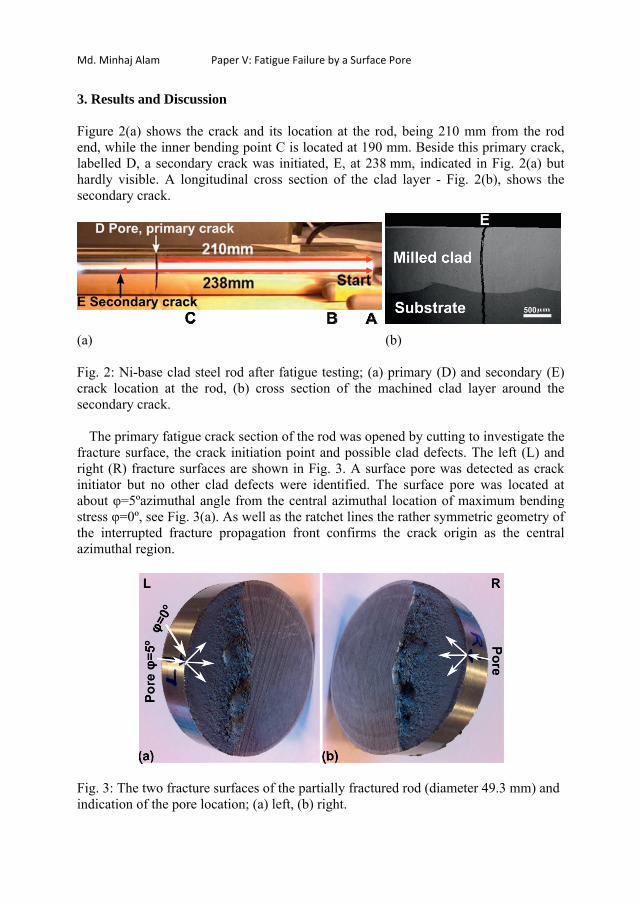
Md. Minhaj Alam Paper V: Fatigue Failure by a Surface Pore
3. Results and Discussion Figure 2(a) shows the crack and its location at the rod, being 210 mm from the rod end, while the inner bending point C is located at 190 mm. Beside this primary crack, labelled D, a secondary crack was initiated, E, at 238 mm, indicated in Fig. 2(a) but hardly visible. A longitudinal cross section of the clad layer - Fig. 2(b), shows the secondary crack.
(a) (b) Fig. 2: Ni-base clad steel rod after fatigue testing; (a) primary (D) and secondary (E) crack location at the rod, (b) cross section of the machined clad layer around the secondary crack.
The primary fatigue crack section of the rod was opened by cutting to investigate the fracture surface, the crack initiation point and possible clad defects. The left (L) and right (R) fracture surfaces are shown in Fig. 3. A surface pore was detected as crack initiator but no other clad defects were identified. The surface pore was located at about =5ºazimuthal angle from the central azimuthal location of maximum bending stress =0º, see Fig. 3(a). As well as the ratchet lines the rather symmetric geometry of the interrupted fracture propagation front confirms the crack origin as the central azimuthal region.
Fig. 3: The two fracture surfaces of the partially fractured rod (diameter 49.3 mm) and indication of the pore location; (a) left, (b) right.

Paper V: Fatigue Failure by a Surface Pore Md. Minhaj Alam
The asymmetric stress field generated during four point bending of a cylindrical rod was calculated by FEM, using ANSYS 13 software.17 The 1st principle stress field for a rod with smooth surface is presented in Fig. 4(a). For visualization of the stress field inside the rod only a quarter of the symmetric rod is shown. Symmetrical boundary conditions are imposed on the central r-z and r- planes. A linear elastic 3D model with 100 kN load was applied. 169 308 10-node-tetrahedral elements with were used. The number of elements was increased to 276 490 when refining the mesh around the surface pore region. During four-point bending of a cylindrical rod the peak stress domain becomes quite extended, as can be seen in Fig. 4(a). Both cracks D and E were initiated from within this maximum bending stress region.
Compared to the stress field generated for a smooth surface, defects like a surface
pore can be regarded as additional stress raisers. As was already simulated earlier (for simpler load situations15) and confirmed here, pores close to or at the surface cause higher stress than pores deeper in the material. We simulated similar conditions to the detected pore through a semi-spherical (half open) surface pore of 200 m diameter placed at the axial centre z=0 of the rod, at different azimuthal angles varied from
=0º to =75º, otherwise keeping the same boundary conditions as for a perfectly smooth rod. For =0º the calculated stress field around the pore is shown in Fig. 4(b). As can be seen, the surface pore acts as a significant local stress raiser.
(a) (b) Fig. 4: Stress field calculated for the laser-clad rod under four-point bending load; (a) 1st principle bending stress field [MPa] of the laser-clad rod (long section, diameter 49.3 mm), (b) notch stress field [MPa] due to a 200 m diameter surface pore at =0º.
The calculated maximum stress as a function of the azimuthal angle is shown in Fig.
5 for the smooth rod compared to one with a surface pore at the respective azimuthal position (at z=0). The results show that a central surface pore approximately doubles the maximum stress. The surface pore remains a stress raiser that exceeds the central maximum stress of the smooth surface up to azimuthal angles of = 55º. Outside this range the pore causes lower stress than the maximum central stress of the smooth surface, which can be regarded as a safe region. In Fig. 5 the here case of a pore at
=5º is inserted, clarifying that its impact was particularly strong at this almost central location. The location of another pore that initiated fatigue cracking in another sample is also inserted. It was again inside the critical range of angles. These calculated
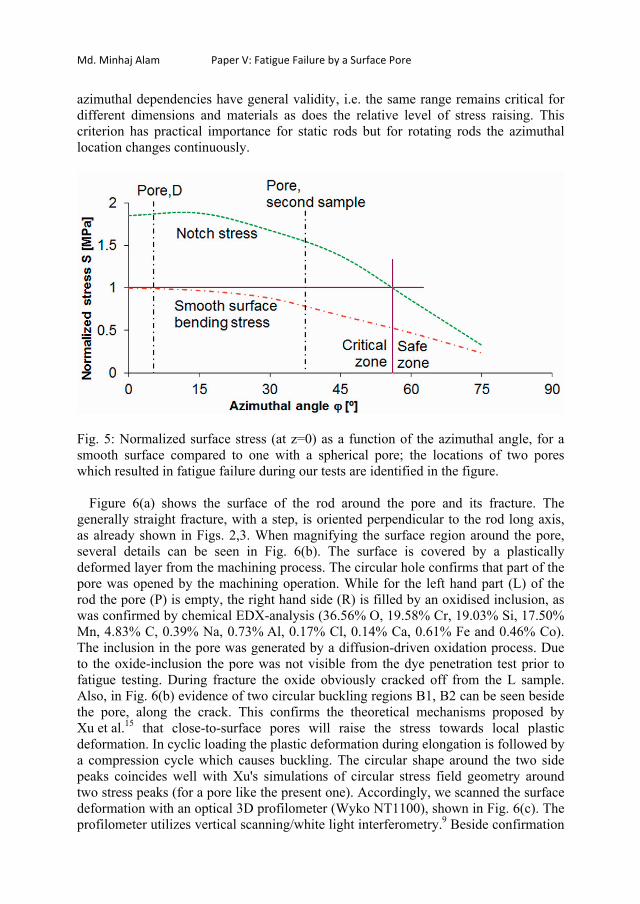
Md. Minhaj Alam Paper V: Fatigue Failure by a Surface Pore
azimuthal dependencies have general validity, i.e. the same range remains critical for different dimensions and materials as does the relative level of stress raising. This criterion has practical importance for static rods but for rotating rods the azimuthal location changes continuously.
Fig. 5: Normalized surface stress (at z=0) as a function of the azimuthal angle, for a smooth surface compared to one with a spherical pore; the locations of two pores which resulted in fatigue failure during our tests are identified in the figure.
Figure 6(a) shows the surface of the rod around the pore and its fracture. The generally straight fracture, with a step, is oriented perpendicular to the rod long axis, as already shown in Figs. 2,3. When magnifying the surface region around the pore, several details can be seen in Fig. 6(b). The surface is covered by a plastically deformed layer from the machining process. The circular hole confirms that part of the pore was opened by the machining operation. While for the left hand part (L) of the rod the pore (P) is empty, the right hand side (R) is filled by an oxidised inclusion, as was confirmed by chemical EDX-analysis (36.56% O, 19.58% Cr, 19.03% Si, 17.50% Mn, 4.83% C, 0.39% Na, 0.73% Al, 0.17% Cl, 0.14% Ca, 0.61% Fe and 0.46% Co). The inclusion in the pore was generated by a diffusion-driven oxidation process. Due to the oxide-inclusion the pore was not visible from the dye penetration test prior to fatigue testing. During fracture the oxide obviously cracked off from the L sample. Also, in Fig. 6(b) evidence of two circular buckling regions B1, B2 can be seen beside the pore, along the crack. This confirms the theoretical mechanisms proposed by Xu et al.15 that close-to-surface pores will raise the stress towards local plastic deformation. In cyclic loading the plastic deformation during elongation is followed by a compression cycle which causes buckling. The circular shape around the two side peaks coincides well with Xu's simulations of circular stress field geometry around two stress peaks (for a pore like the present one). Accordingly, we scanned the surface deformation with an optical 3D profilometer (Wyko NT1100), shown in Fig. 6(c). The profilometer utilizes vertical scanning/white light interferometry.9 Beside confirmation

Paper V: Fatigue Failure by a Surface Pore Md. Minhaj Alam
of the two buckles and their height levels (max 27.3 μm - the clad layer surface has a level of –5 μm), the measurement also confirms that the oxide inclusion in the pore at the R-side has experienced a slight deformation or displacement.
Fig. 6: Plastic deformation at the laser clad rod surface around the surface pore (P) due to cyclic loading; (a) top view of both halves of the surface, L and R, (b) two plastically deformed regions (B1 and B2) due to plastic deformation, (c) measured clad surface topography around the surface pore region.
Figure 7(a),(b) shows inclined views of the two rod and fracture surfaces L,R around the pore. The normal view on the fracture surfaces is shown in Fig. 7(c),(d) where the ratchet lines can be easily seen, as clear evidence that the fracture originated from the pore. No other pore or defect was found at the fracture surface edges, see also Fig. 3. Figures 7(e),(f) show a magnification of the pore, where it can be clearly seen that side L is empty (because the inclusion has cracked off during fracture) while side R still retains a remnant of the oxide inclusion. The oxide has an inner pore that developed during solidification. However, the main stress raiser is the existence of the spherical pore which contained the inclusion. As can be seen from comparison with a 150 μm-circle, the pore shape slightly deviates only slightly from a sphere. Murakami16 confirms that the fatigue crack initiation is strongly influenced by the shape of the
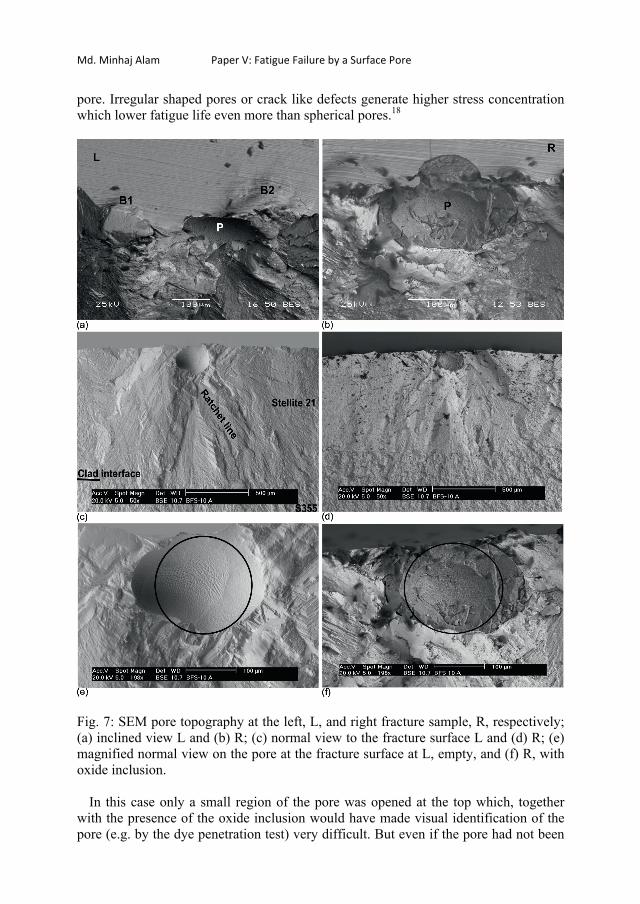
Md. Minhaj Alam Paper V: Fatigue Failure by a Surface Pore
pore. Irregular shaped pores or crack like defects generate higher stress concentration which lower fatigue life even more than spherical pores.18
Fig. 7: SEM pore topography at the left, L, and right fracture sample, R, respectively; (a) inclined view L and (b) R; (c) normal view to the fracture surface L and (d) R; (e) magnified normal view on the pore at the fracture surface at L, empty, and (f) R, with oxide inclusion.
In this case only a small region of the pore was opened at the top which, together with the presence of the oxide inclusion would have made visual identification of the pore (e.g. by the dye penetration test) very difficult. But even if the pore had not been
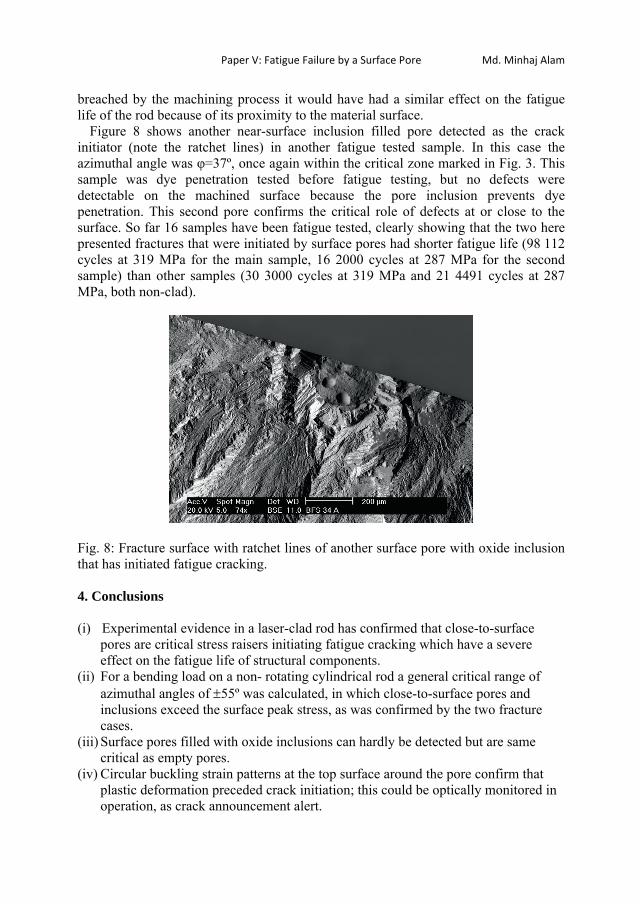
Paper V: Fatigue Failure by a Surface Pore Md. Minhaj Alam
breached by the machining process it would have had a similar effect on the fatigue life of the rod because of its proximity to the material surface.
Figure 8 shows another near-surface inclusion filled pore detected as the crack initiator (note the ratchet lines) in another fatigue tested sample. In this case the azimuthal angle was =37º, once again within the critical zone marked in Fig. 3. This sample was dye penetration tested before fatigue testing, but no defects were detectable on the machined surface because the pore inclusion prevents dye penetration. This second pore confirms the critical role of defects at or close to the surface. So far 16 samples have been fatigue tested, clearly showing that the two here presented fractures that were initiated by surface pores had shorter fatigue life (98 112 cycles at 319 MPa for the main sample, 16 2000 cycles at 287 MPa for the second sample) than other samples (30 3000 cycles at 319 MPa and 21 4491 cycles at 287 MPa, both non-clad).
Fig. 8: Fracture surface with ratchet lines of another surface pore with oxide inclusion that has initiated fatigue cracking. 4. Conclusions (i) Experimental evidence in a laser-clad rod has confirmed that close-to-surface
pores are critical stress raisers initiating fatigue cracking which have a severe effect on the fatigue life of structural components.
(ii) For a bending load on a non- rotating cylindrical rod a general critical range of azimuthal angles of 55º was calculated, in which close-to-surface pores and inclusions exceed the surface peak stress, as was confirmed by the two fracture cases.
(iii) Surface pores filled with oxide inclusions can hardly be detected but are same critical as empty pores.
(iv) Circular buckling strain patterns at the top surface around the pore confirm that plastic deformation preceded crack initiation; this could be optically monitored in operation, as crack announcement alert.

Md. Minhaj Alam Paper V: Fatigue Failure by a Surface Pore
Acknowledgements The authors acknowledge funding from the programme EU-Interreg IVA North, project FATLASE, no. 304-13933-09. References 1R. Vilar, “Solid freeform fabrication: Laser cladding,” Int. J. Powder Metall. 37, 31-48 (2001). 2A. Hjörnhede and A. Nylund, “Adhesion testing of thermally sprayed and laser deposited coatings”, Surf. Coat. Technol. 184, 208-218 (2004). 3W.C. Lin and C. Chen, ‘‘Characteristics of thin surface layers of cobalt-based alloys deposited by laser cladding,’’ Surf. Coat. Technol. 200, 4557-4563 (2006). 4P. Ganesh, A. Moitra, Pragya Tiwari, S. Sathyanarayanan, Harish Kumar, S.K. Rai, R. Kaul, C.P. Paul, R.C. Prasad and L.M. Kukreja, ‘‘Fracture behavior of laser-clad joint of Stellite 21 on AISI 316L stainless steel,’’ Mater. Sci. and Eng. A. 527, 3748-3756 (2010). 5H. Koehler, J. Schumacher, K. Schuischel, K. Partes, H. Bomas, F. Jablonski, F. Vollertsen and R. Kienzler, ‘‘An approach to calculate fatigue properties of laser cladded components,’’ Prod. Eng. Res. Devel. 6, 37-148 (2012). 6S.W. Huang, D. Nolan and M. Brandt, ‘‘Pre-placed WC/Ni clad layers produced with a pulsed Nd:YAG laser via optical fibres.’’ Surf. Coat. Technol. 165, 26-34 (2003). 7P. Ganesh, R. Kaul, C.P. Paul, P. Tiwari, S.K. Rai, R.C. Prasad and L.M. Kukreja, ‘‘Fatigue and fracture toughness characteristics of laser rapid manufactured Inconel 625 structures,’’ Mater. Sci. and Eng. A. 527, 7490-7497 (2010). 8Z. Mei, L.F. Guo and T.M. Yue,‘‘The effect of laser cladding on the corrosion resistance of magnesium ZK60/SiC composite,’’ J. Mater. Process. Technol. 161, 462-466 (2005). 9M.M. Alam, Z. Barsoum, P. Jonsen, A.F.H. Kaplan and H.Å. Häggblad,‘‘The influence of surface geometry and topography on the fatigue cracking behaviour of laser hybrid welded eccentric fillet joints,’’ Appl. Surf. Sci. 265, 1936-1945 (2010). 10A.F.H. Kaplan and G. Groboth, ‘‘Process Analysis of Laser Beam Cladding’’ Trans. ASME: J. Manuf. Sci. Eng. 123, 609-614 (2001). 11M. Vedani, B. Previtali, G.M. Vimercati, A. Sanvito and G. Somaschini, ‘‘Problems in laser repair-welding a surface-treated tool steel,’’Surf. Coat. Techn. 201, 4518-4525 (2007).
Paper V: Fatigue Failure by a Surface Pore Md. Minhaj Alam
12J.H. Fan, D.L. McDowell, M.F. Horstemeyer and K. Gall, ‘‘Cyclic plasticity at pores and inclusions in cast Al–Si alloys,’’ Eng. Fract. Mech. 70, 1281-1302 (2003). 13H.T. Pang and P.A.S. Reed, ‘‘Fatigue crack initiation and short crack growth in nickel-base turbine disc alloys-the effects of microstructure and operating parameters,’’ Int. J. Fatig. 25, 1089-99 (2003). 14P. Li, P.D. Lee, D.M. Maijer and T.C. Lindley, ‘‘Quantification of the interaction within defect populations on fatigue behavior in an aluminum alloy,’’ Acta Mater. 57, 3539-3548 (2009). 15Z. Xu, W. Wen and T. Zhai, ‘‘Effects of Pore Position in Depth on Stress/Strain Concentration and Fatigue Crack Initiation,’’ Metall. Trans. A. 8, 2763-2770 (2012). 16Y. Murakami, ‘‘Material defects as the basis of fatigue design.’’ Int. J. Fatig. 41, 2-10 (2012). 17ANSYS guide, ANSYS release 13. Swanson Analysis Systems, Houston. 18L. Li, Z. Liu and M. Snow, ‘‘Effect of defects on fatigue strength of GTAW repaired cast aluminum alloy,’’ Welding Journal (Miami, FL). 85, 264-270 (2006).

Md. Minhaj Alam Paper VI: Stress Raising in Laser Clad Deposits 177
Paper VI ANALYSIS OF THE STRESS RAISING ACTION OF FLAWS IN LASER CLAD DEPOSITS M. M. Alam, A. F. H. Kaplan, J. Tuominen, P. Vuoristo, J. Miettinen, J. Poutala, J. Näkki, J. Junkala, T. Peltola, Z. Barsoum
Materials and Design, 2012 (in press, available online, DOI: 10.1016/j.matdes.2012.10.010)

178 Paper VI: Stress Raising in Laser Clad Deposits Md. Minhaj Alam
Md. Minhaj Alam Paper VI: Stress Raising in Laser Clad Deposits
Analysis of the stress raising action of flaws in laser clad deposits M. M. Alam1*, A. F. H. Kaplan1, J. Tuominen2, P. Vuoristo2, J. Miettinen3, J. Poutala3, J. Näkki2,4, J. Junkala4, T. Peltola4, Z. Barsoum5
1Luleå University of Technology, Dept. of Engineering Sciences and Mathematics, SE-971 87 Luleå, Sweden Email: [email protected], [email protected] 2Tampere University of Technology, Department of Materials Science, FI-33101 Tampere, Finland Email: [email protected], [email protected], [email protected] 3Tampere University of Technology, Department of Mechanics and Design, FI-33101 Tampere, Finland Email: [email protected], [email protected] 4Technology Centre KETEK Ltd., FI-67100 Kokkola, Finland Email: [email protected], [email protected] 5Royal Institute of Technology, Department of Aeronautical and Vehicle Engineering, SE-100 44 Stockholm, Sweden Email: [email protected] *Corresponding author: [email protected] Phone: +46(0)920 49 3917 Fax: +46(0)920 49 2228 Abstract Fatigue cracking of laser clad cylindrical and square section bars depends upon a variety of factors. This paper presents Finite Element Analysis (FEA) of the different macro stress fields generated as well as stress raisers created by laser cladding defects for four different fatigue load conditions. As important as the defect types are their locations and orientations, categorized into zero-, one- and two-dimensional defects. Pores and inclusions become critical close to surfaces. The performance of as-clad surfaces can be governed by the sharpness of surface notches and planar defects like hot cracks or lack-of-fusion (LOF) are most critical if oriented vertically, transverse to the bar axis. The combination of the macro stress field with the defect type and its position and orientation determines whether it is the most critical stress raiser. Based on calculated cases, quantitative and qualitative charts were developed as guidelines to visualize the trends of different combinations. Keywords: fatigue load; laser cladding; defect; stress analysis; stress raiser
Paper VI: Stress Raising in Laser Clad Deposits Md. Minhaj Alam
1. Introduction Laser-clad bars were studied with respect to different aspects that influence the maximum stress level and in turn the fatigue life for particular load conditions, material defects types and defect location. The technique of laser cladding deposits a desired material onto the surface of a substrate to form a metallurgically sound and dense clad layer [1-3]. This process is widely accepted due to its integral metallurgical bond between the clad layer and the substrate, a narrow intermixing zone (with a gradual change of composition from the substrate to the surface), limited heat load and thus minimal distortion of the clad components and laser coatings are susceptible to cracking due to fast cooling rate [4]. With this technique, a wide variety of materials has been successfully deposited on various substrates, such as Cobalt (Co)-based hard facing alloys [5-7], Nickel (Ni)-based alloys [8,9], or composites [10] and by the addition of hard Tungsten Carbide (WC)- or Titanium Carbide (TiC)-particles. Therefore laser cladding techniques are used in many industrial applications to improve the functional properties of the surface (such as the resistance to corrosion, wear, or high-temperature oxidation) by depositing high-performance material. Laser cladding has also been used to repair/restore original geometries and functionalities of a damaged base material and occasionally to recover a undersized expensive material or product due to machining or grinding errors [11,12]. Although laser cladding is used to improve the functional surface properties or to refurbish worn-out parts, it has some essential drawbacks. In the as-clad components the overlapping clad traces generate a wavy surface with sharp notches. Low side-bead angles and surface ripples from overlapping clads creates a rough surface that generates stress peaks during fatigue loading conditions which can initiate cracking [13]. Resch et al. [14] identified different types of surface roughness governed by different levels of powder feed rate. A low feed rate yielded smooth surfaces due to substantial remelting of previous layers while high feeding rate caused high roughness and an increased susceptibility of defects due to minimal substrate melting. During laser cladding, a large mismatch in thermo-physical properties between the substrate and clad material along with steep temperature gradients often results in the development of residual stress at the substrate/clad interface [15]. Despite higher homogeneity and density than other techniques, the cladding process can generate defects such as Lack of fusion (LOF, hot cracks, pores or inclusions, both at the layer-substrate interface and inside the clad layer, and particularly at the interfaces of overlapping layers. Basically these pore and void defects can be divided into three categories: inter-track, inter-layer and intra layer defects [16]. Inter-track porosity is caused by the horizontally aligned or offset tracks of incompatible aspect ratios. It forms near the base of deposited tracks [2]. Inter-layer LOF porosity is caused by incomplete bonding between vertically aligned deposits [17]. The orientation of LOF relative to the loading direction plays an important role on fatigue life [18], which is described in this paper. Intra-layer porosity is often a spherical area of porosity within a layer. It is most commonly attributed to small amounts of trapped gas or oxide

Md. Minhaj Alam Paper VI: Stress Raising in Laser Clad Deposits
between the powder particles [19], but a study of laser welding indicated that it can also be caused by the presence of moisture in industrial-grade shroud gases [20]. The effect of pores and voids and their location on fatigue crack initiation and propagation has been analyzed experimentally and numerically by several researchers. Tensile testing to examine the fatigue mechanism [21-24] showed that crack initiation occurs at pores or pore clusters located on or beneath the surfaces. Many authors [21,22,25,26] agree that stress concentration at pores, particularly surface pores, is responsible for localized slip, leading to crack initiation. Fan et al. [27] studied by Finite Element Analysis (FEA) the plastic shear strain range as a function of the distance of a pore from the surface. They found that the plastic shear strain range increased significantly as the pore approached the free surface, particularly when the pore reaches the surface, until a plastic limit is reached. Li et al. [28] performed FEA on the pore position which indicated that stress/strain concentrations reached their peak when a pore of 200 μm in diameter was just buried beneath the surface. Xu et al. [29] also confirmed numerically that pores even smaller than 200 μm, buried just beneath the surface or with their top half intercepting the free surface are equally critical for fatigue crack initiation. They have concluded that the pore size only increased the zone of high stress/strain concentration around the pore in the surface but did not affect the maximum stress involved. Recent studies by Murakami [30] have also confirmed that crack initiation is strongly influenced by the shape of cavities/pores. The size of pores does not alter the maximum stress but it strongly influences the fatigue limit. Once the crack has initiated from inhomogeneities, inclusions or other defects, the size of the crack determines the stress intensification at the crack tip and accordingly the threshold condition for propagation. Crack-like defects (such as LOF or hot cracks) are even more critical. A 45 years old gas pipeline was blown out at a longitudinal submerged arc weld joint due to sudden crack propagation from LOF [31]. Li et al. [32] also confirmed that crack-like defects have the most significant effect in decreasing the fatigue life of welded specimens. Spherical pores also contributed to a decrease in the fatigue life of welded specimens, although not as significantly as crack-like defects. The motivation of the present study was the fatigue testing of laser-clad bars for different load conditions that are representative for specific industrial applications. In particular, the macro stress field from the fatigue load conditions is regarded as the global stress environment in which various kinds of defects can act as significant stress raisers, also depending on their geometrical situation. 2. Method For cylindrical and square bars, two material combinations and four load situations (expressed as standard testing methods) were investigated. Co-base powder (Stellite 21) and Ni-base powder (Inconel 625) were deposited on structural steel (S355) bars and on hardened and tempered steel (42CrMo4) bars by laser cladding. Subsequently, the surface was finished by machining, retaining a smooth 0.75 mm thick clad layer (of originally 1.5 mm). Finally, the samples were fatigue tested. So far, fatigue testing has been carried out for two of the four load situations. Comparisons with uncoated bars of the base metals were also carried out. Fracture surfaces and polished cross-

Paper VI: Stress Raising in Laser Clad Deposits Md. Minhaj Alam
sections were studied by optical microscopy and Scanning Electron Microscope (SEM). Finite Element (FE) stress analysis was carried out for the following four different load situations to calculate their macro stress fields; (i) axial fatigue load on a standard dog-bone specimen (representing a cylindrical bar), (ii) four-point bending fatigue load on a square bar, (iii) four-point bending fatigue load on a cylindrical bar, (iv) torsional fatigue load on a standard dog-bone specimen (again representing a cylindrical bar). In addition, the stress field generated by local cladding defects was calculated by simplified FE-analysis. Laser cladding was carried out using a diode-pumped Neodymium-Doped Yttrium Aluminum Garnet (Nd:YAG) laser (Rofin-Sinar DY044, at the KETEK Ltd. Technology Center) with a maximum power of 4.4 kW (wavelength 1064 nm) and a beam parameter product of 18 mm mrad, delivered through a fiber with 600 m core diameter. The experimental set-up consisted of a laser integrated with a beam delivery system, a co-axial nozzle, a powder feeder (blown powder technique) and a robot controlled workstation. The laser beam was focused with optics of 200 mm focal length. The defocused beam employed had a diameter of 6 mm at the sample surface. Thus far, only the cylindrical laser clad rod has undergone four-point bending fatigue tests and the dog-bone specimen has undergone torsional fatigue tests. During the cladding process, cylindrical rods of structural steel S355 (Young’s modulus E = 208 GPa) and tempered steel 42CrMo4 (E = 211 GPa) were rotated relative to the laser beam. The blown metal powder deposited by overlapping lateral clad layers was Stellite 21 (E = 248 GPa) and Inconel 625 (E = 208 GPa), respectively. The experimental parameters used for the study are summarized in Table 1. After cladding, half of the 1.5 mm thick deposited layer was machined off, generating a smooth, 0.75 mm thick clad layer with a surface roughness of Ra = 0.2 m. The dimensions of the axial fatigue, four-point bending fatigue and torsional fatigue test specimens were selected according to ASTM:E466-07, DNV-M3 [33] and ISO 1352:2011[34] respectively. The length and the narrow section diameter of the dog-bone axial fatigue test specimen were 283 mm and 20 mm while the length and the narrow section diameter of the dog-bone specimen for torsional fatigue tests were 200 mm and 32 mm respectively. For the four-point bending fatigue test specimen, the cylindrical rods are 580 mm in length with 49.3 mm diameter while the square bars are (length width thickness) 340 60 30 mm3. Table 1: Parameters used for laser cladding Parameter Value / type Laser beam power (cw) 3.25 kW Beam diameter 6 mm Traverse speed 1.1 m/min Powder feeding rate 30 g/min Shielding gas type Ar Gas flow rate 16 l/min Lateral clad layer displacement 2 mm
Md. Minhaj Alam Paper VI: Stress Raising in Laser Clad Deposits
Four point bending fatigue testing on cylindrical bars was performed by a servo-hydraulic machine (maximum force amplitude ±300 kN, at Tampere University of Technology). Uncoated and laser clad specimen were tested by keeping a constant amplitude stress ratio, R = 0.02 at a frequency of 2-3 Hz at a load range of 80-160 kN. In these experiments, the force control principle has been applied. As is typical for constant force cycles, once cracking was initiated the fracture took place rapidly, within a few cycles, as was confirmed by video observation. In total, so far 16 fatigue tests with different forces and materials have been carried out. Torsional fatigue test were carried out with a position controlled servo-hydraulic machine (max. ±150 kN, 2-3 Hz) at CENTRIA, Kokkola on standard specimens to ISO 1352:2011 [34]. The experiment was conducted by using the constant amplitude angular displacement control principle. The substrate and clad specimen were tested at a displacement range of 3.250-4.875 mm. In this case, owing to the angular displacement control principle, the fracture grows very slowly. The early crack stages are difficult to notice. So far nine fatigue tests have been performed on uncoated and on Inconel 625-coated 42CrMo4-specimens. To be able to plot a Wöhler diagram based on a sufficient amount of statistical data, a few more samples are scheduled for future fatigue testing. All FEA has been carried out with the software code ANSYS 13 [35]. To calculate the macro stress field, a linear elastic 3D-model with 100 kN load was applied to the dog-bone specimen for axial fatigue load, and to the cylindrical rod for four-point fatigue bending. 10-node-tetrahedral elements were used for meshing. A linear elastic 2D-model was developed by applying the same 100 kN load to a square bar for four-point fatigue bending, with the clad at the bottom. Plane 2D-8 node elements were used in this case. For torsional fatigue test simulation a dog-bone ISO 1352:2011[34] standard specimen were modeled using Multi Point Constraint elements (MPC) where a torque is applied in a single element. Details about this technique can be found in [35]. In all the above mentioned simulations, Stellite 21 for the clad and S355 for the bar were applied because the difference in E-modulus for this material combination is higher and therefore more critical than for the other combinations of materials. For calculating the stress concentration factor due to cladding defects, extensive FE-simulation was carried out to analyze and compare the severity of the different defects on fatigue life. Firstly, the wavy as-clad surface and the wavy clad-substrate interface were regarded as wavy geometry defects that were modeled for local specimen cells of dimension 5 5 5 mm3 under axial loading. Symmetric boundary conditions were imposed on the xy-cross section, lateral to the load direction. In the wavy surfaces, the notch radius and bead opening angle were systematically varied. Pores in the clad layer, at the top surface and at the side edge (square bar) were modelled at different distances from the surfaces. The same specimen dimensions and boundary conditions as for the wavy geometries were again imposed here. Note that the pore was half open when studied at the surface. A pore diameter of 200 μm was used for all calculations. The pore location was systematically changed from the substrate-clad interface to the clad surface for in-clad and side edge pores. For
Paper VI: Stress Raising in Laser Clad Deposits Md. Minhaj Alam
cylindrical bars under four-point bending load the surface pore position was also varied in the azimuthal direction. Planar defects such as LOF and hot cracking were modelled using Linear Elastic Fracture Mechanics (LEFM) analysis. Such defects that are extended in two dimensions can be regarded as propagating cracks. The simulation of the fatigue crack propagation consists of two processes: Modelling and meshing was carried out by the software code ANSYS 13 [35] while simulation and analysis was carried out by the code FRANC2D [36]. A 2D plane strain FE-model was used for the LEFM calculations. The initial crack was placed at the clad-substrate interface as horizontal LOF or as a perpendicular hot crack. An initial crack length of ai = 0.1 mm, a final crack length of af =1.3 mm and a crack propagation increment of a = 0.1 mm in each step were selected. 3. Results and discussion In the following, first the different loads and their induced macro stress fields will be presented, followed by descriptions of the effects of a variety of stress raisers. 3.1 Macro stress field The macro stress field generated by four different fatigue load cases will now be presented namely; an axial load of a cylindrical bar, four-point bending of a square bar and a cylindrical bar and torsional load of a cylindrical bar. The longitudinal section of an ASTM:E466-07 testing sample representing a laser clad cylindrical bar under axial fatigue load is shown in Fig. 1(a). The 1st principle stress, calculated by FEA, shows a widely homogeneous stress level along the central (representative) cylindrical bar. The two stress peaks that can be seen originate from the curvature of this standard dog-bone geometry. For a larger radius of the curved part these peaks would be significantly lower. Hence, for axial fatigue loads, defects always experience the same stress from the macro field independent of their axial (z), radial (r), or azimuthal position ( ). Nevertheless, the position can have an impact due to its distance to the surface or its orientation relative to the load direction. In Fig. 1(b) the 1st principle stress field, computed for a four-point bending test sample of a square bar, is shown from the side. The 0.75 mm thick laser clad layer is located at the bottom where the stress field remains almost constant over a wide axial range while it rapidly decays in vertical direction, x. Thus, the vertical position of a clad layer defect can be very important (however, laser clad layers are often very thin) while the influence of the axial position is small over a wide range. In the lateral direction the stress field remains constant. Nevertheless, as will be shown later, the side edges of a square bar can have significance for defects located close to the surface. If the product has no significant clad defects the region of maximum macro stress will initiate cracking, as a benchmark for the stress raisers discussed below.
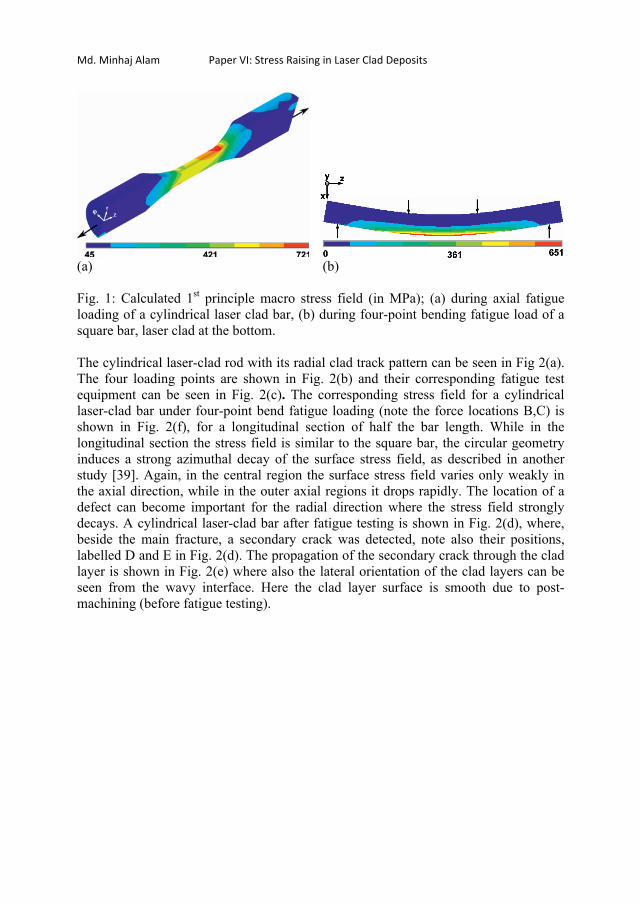
Md. Minhaj Alam Paper VI: Stress Raising in Laser Clad Deposits
(a) (b) Fig. 1: Calculated 1st principle macro stress field (in MPa); (a) during axial fatigue loading of a cylindrical laser clad bar, (b) during four-point bending fatigue load of a square bar, laser clad at the bottom. The cylindrical laser-clad rod with its radial clad track pattern can be seen in Fig 2(a). The four loading points are shown in Fig. 2(b) and their corresponding fatigue test equipment can be seen in Fig. 2(c). The corresponding stress field for a cylindrical laser-clad bar under four-point bend fatigue loading (note the force locations B,C) is shown in Fig. 2(f), for a longitudinal section of half the bar length. While in the longitudinal section the stress field is similar to the square bar, the circular geometry induces a strong azimuthal decay of the surface stress field, as described in another study [39]. Again, in the central region the surface stress field varies only weakly in the axial direction, while in the outer axial regions it drops rapidly. The location of a defect can become important for the radial direction where the stress field strongly decays. A cylindrical laser-clad bar after fatigue testing is shown in Fig. 2(d), where, beside the main fracture, a secondary crack was detected, note also their positions, labelled D and E in Fig. 2(d). The propagation of the secondary crack through the clad layer is shown in Fig. 2(e) where also the lateral orientation of the clad layers can be seen from the wavy interface. Here the clad layer surface is smooth due to post-machining (before fatigue testing).

Paper VI: Stress Raising in Laser Clad Deposits Md. Minhaj Alam
Fig. 2: Four-point bend fatigue load of a cylindrical laser-clad bar; (a) rod after laser cladding, (b) four point bending geometry (force F, rod length L), (c) fatigue test rig, (d) cracked specimen, (e) clad layer cross section with seconday crack propagation, (f) 1st principle macro stress field (in MPa; longitudinal section of the bar, cut in half). Figure 3(a) shows the torsional fatigue test rig. In Fig. 3(c) the ISO 1352:2011 [34] standard test sample of a cylindrical laser-clad bar under torsional fatigue loading can be seen. Crossing crack patterns, which are typical for torsional loads, can be seen. The propagation of multiple cracks through the laser clad layer is shown in Fig. 3(d). Note that torsional fatigue testing was carried out with constant displacement control while for the four-point bending tested cylindrical rod the force was controlled. Therefore, in this case, the fatigue growth and fracture takes place much slower. From the calculated shear stress field, see Fig. 3(b), it can be seen that neither the axial nor the azimuthal position of a defect would be critical in the representative central cylinder region, while a strong radial stress field decay can be seen towards the centre. One additional macro stress field to be considered is the residual stress of the base metal and that generated during laser cladding and post-machining. In the present study the residual stress field was measured close to the surface for selected samples. In all samples (including clad/machined as well as clad/machined/post-heat-treated) tensile stress was measured.

Md. Minhaj Alam Paper VI: Stress Raising in Laser Clad Deposits
Fig. 3: Torsional fatigue load of a cylindrical laser-clad bar (dog-bone); (a) torsional fatigue test rig, (b) 1st principle macro stress field (in MPa; longitudinal section of the dogbone test sample), (c) cracked specimen, (d) clad layer cross section with multiple crack propagation. The results for four-point bend fatigue tests of cylindrical bars are shown as SN-curves in Fig. 4. For Stellite 21-cladding of structural steel, Fig. 4(a), the laser clad sample had a shorter fatigue life than the uncoated base material. However, only a few data points are available and two of the three laser-clad fractures were induced by surface pore defects, as described in detail in another study [37]. In contrast, for 42CrMo4-steel the Inconel 625 cladding has significantly enhanced the fatigue life, see Fig. 4(b). Hence, the material combinations, despite having rather similar properties, have significant influence on the fatigue life.
(a) (b) Fig. 4: SN-curves comparing the four-point bending fatigue life of laser clad (red, solid) with non-clad (blue, broken) cylindrical bars for (a) structural steel S355 with Stellite21-cladding, (b) 42CrMo4-steel with Inconel 625-cladding.

Paper VI: Stress Raising in Laser Clad Deposits Md. Minhaj Alam
3.2 Laser cladding defects The macro field generated by the fatigue load situation can experience local stress raisers through a variety of defects from laser cladding, as illustrated in Fig. 5.
Fig. 5: Illustration of the laser clad layer cross section, left as-clad and right after machining, with the variety of possible defects and their positions. Micrographs of some of the defects are shown in Fig. 6. We have distinguished three categories of defect, long wavy geometries (one-dimensional, 1D), local defects (0D) and planar (2D) defects. Long wavy geometries, see Fig. 6(a), are the wavy surface (A in Fig. 5) generated by overlapping laser clads, and the wavy interface between the clad layers and the substrate (B in Fig. 5). Post-machining would eliminate the notches from the wavy surface (A) to a flat surface. Local defects comprise pores, see Fig. 6(b)-(f), and inclusions, Fig. 6(d),(g). As described in another study [37], for example an oxide inclusion such as in Fig. 6(d) will act as a stress raiser similar to a spherical cavity while the inclusion substance itself is of minor importance. So the inclusion in Fig. 6(d) mainly acts like a spherical pore to the stress field while the inclusion in Fig. 6(g) acts as a cavity with an irregular, sharp shape [38]. Spherical pores can appear at the surface (F in Figs. 5) see Fig. 6(c), and can be detected by the dye penetration test, see Fig. 6(b) for a cylindrical bar. Alternatively, the pores can be located inside the clad layer (I in Figs. 5) see Fig. 6(f). Moreover, semi-spherical pores J were found at the clad-substrate interface, see Fig. 6(e). As illustrated in Fig. 5, pores and inclusions can have a variety of critical locations, particularly just below the surface, G, H, and at the side edges of rectangular bars, K, L, M, as will be analyzed below. Another category is plane-like defects, namely hot cracks, D, see Fig. 6(h) and LOF, C, E, see Fig. 6(i). Notches from as-clad surfaces are extended in one direction, but in the case of defects that have plane-like non-bonded interfaces their vertical inclination is of importance as well as their lateral orientation. The mechanisms for generating these
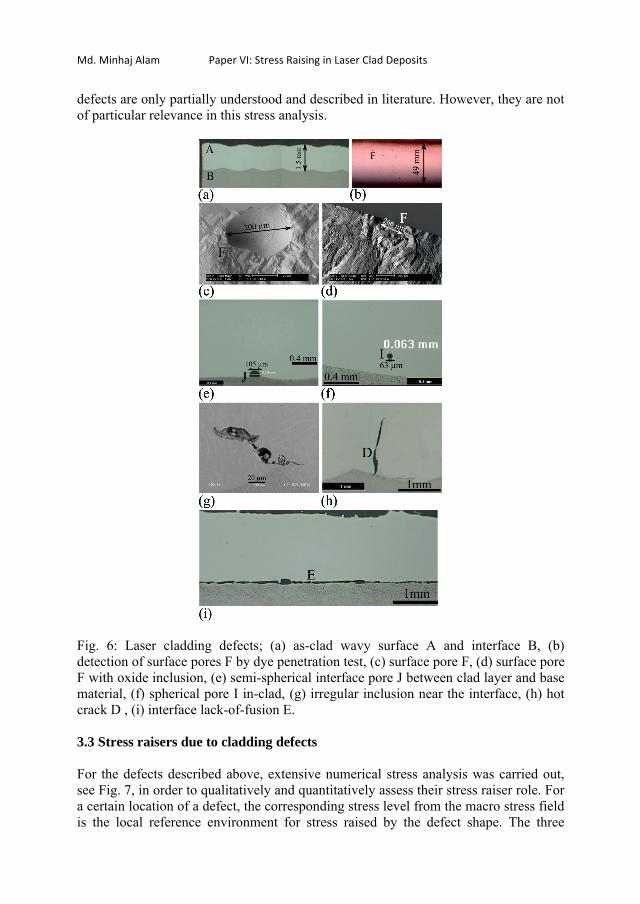
Md. Minhaj Alam Paper VI: Stress Raising in Laser Clad Deposits
defects are only partially understood and described in literature. However, they are not of particular relevance in this stress analysis.
Fig. 6: Laser cladding defects; (a) as-clad wavy surface A and interface B, (b) detection of surface pores F by dye penetration test, (c) surface pore F, (d) surface pore F with oxide inclusion, (e) semi-spherical interface pore J between clad layer and base material, (f) spherical pore I in-clad, (g) irregular inclusion near the interface, (h) hot crack D , (i) interface lack-of-fusion E. 3.3 Stress raisers due to cladding defects For the defects described above, extensive numerical stress analysis was carried out, see Fig. 7, in order to qualitatively and quantitatively assess their stress raiser role. For a certain location of a defect, the corresponding stress level from the macro stress field is the local reference environment for stress raised by the defect shape. The three
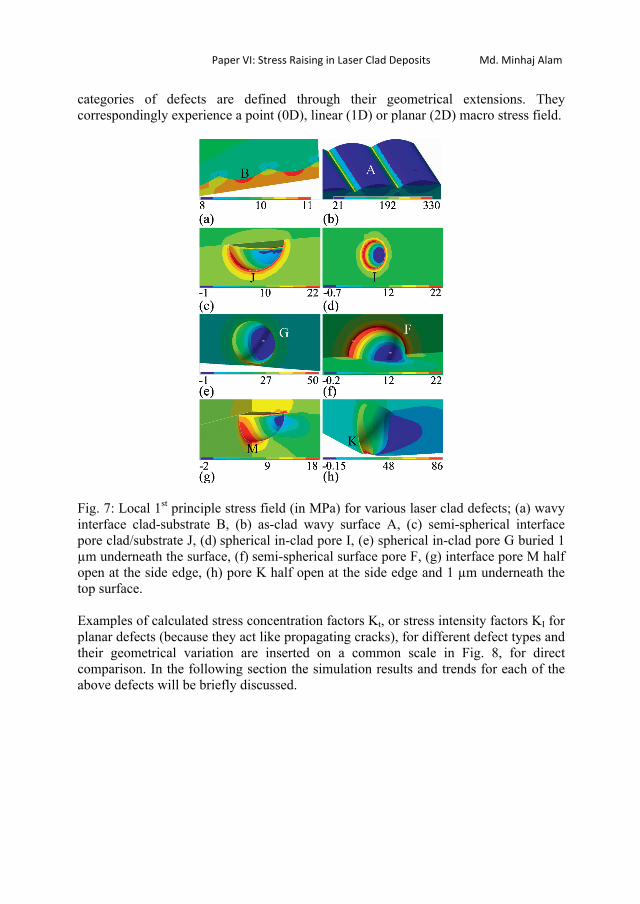
Paper VI: Stress Raising in Laser Clad Deposits Md. Minhaj Alam
categories of defects are defined through their geometrical extensions. They correspondingly experience a point (0D), linear (1D) or planar (2D) macro stress field.
Fig. 7: Local 1st principle stress field (in MPa) for various laser clad defects; (a) wavy interface clad-substrate B, (b) as-clad wavy surface A, (c) semi-spherical interface pore clad/substrate J, (d) spherical in-clad pore I, (e) spherical in-clad pore G buried 1 μm underneath the surface, (f) semi-spherical surface pore F, (g) interface pore M half open at the side edge, (h) pore K half open at the side edge and 1 μm underneath the top surface. Examples of calculated stress concentration factors Kt, or stress intensity factors KI for planar defects (because they act like propagating cracks), for different defect types and their geometrical variation are inserted on a common scale in Fig. 8, for direct comparison. In the following section the simulation results and trends for each of the above defects will be briefly discussed.
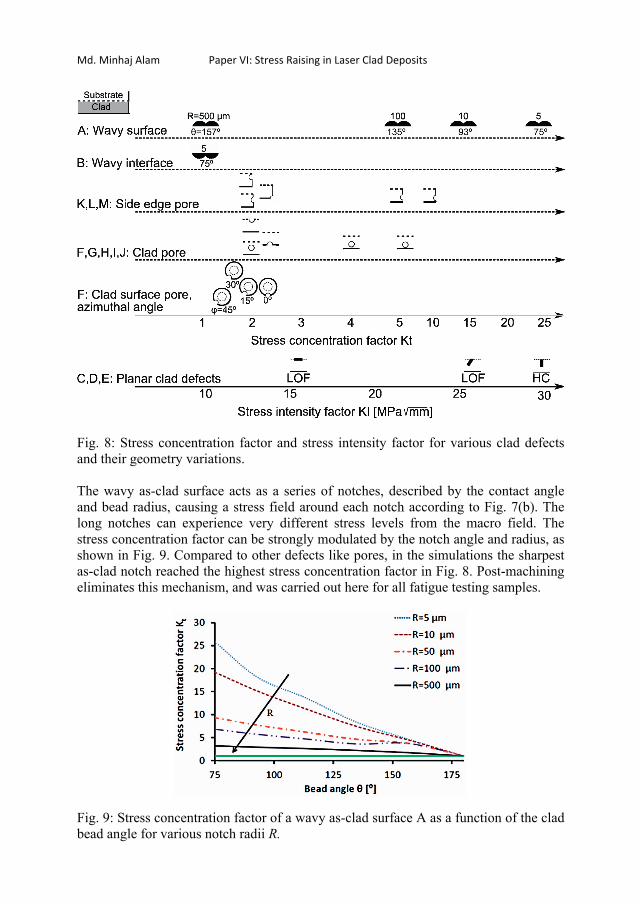
Md. Minhaj Alam Paper VI: Stress Raising in Laser Clad Deposits
Fig. 8: Stress concentration factor and stress intensity factor for various clad defects and their geometry variations. The wavy as-clad surface acts as a series of notches, described by the contact angle and bead radius, causing a stress field around each notch according to Fig. 7(b). The long notches can experience very different stress levels from the macro field. The stress concentration factor can be strongly modulated by the notch angle and radius, as shown in Fig. 9. Compared to other defects like pores, in the simulations the sharpest as-clad notch reached the highest stress concentration factor in Fig. 8. Post-machining eliminates this mechanism, and was carried out here for all fatigue testing samples.
Fig. 9: Stress concentration factor of a wavy as-clad surface A as a function of the clad bead angle for various notch radii R.

Paper VI: Stress Raising in Laser Clad Deposits Md. Minhaj Alam
The wavy interface clad-substrate merely achieved a stress concentration factor up to Kt = 1.1 and is not critical. The maximum stress was not generated at the sharp interface edges but at the rounded bottom, see Fig. 6(a). The peak stress is mainly governed by the different E-modulus of the clad layer and the substrate. As mentioned above, stress raising from spherical pores, see Fig. 6(d), will depend strongly on the location in the macro-field (e.g. azimuthal angle for cylindrical bars under four-point bending load [37], see Fig. 8) and on the pore location relative to the surfaces, see Fig. 8 (“clad pore”). As shown in an earlier simulation [29], pores generate a maximum stress when just buried underneath the surface, Figs. 6(e),7 (“In-clad”). Pores deeper below the surface or more open, see Fig. 6(f), have lower the stress raising effects. Stress raising by a pore is independent of its diameter. As mentioned above, inclusions within a spherical pore have very little effect on the stress raising property of that pore but non-spherical cavities or inclusions with sharp corners, see Fig. 6(f), can be critical stress raisers. Due to their large variety these were not simulated here [38]. While for the cylindrical bar the azimuthal position of a pore can be important, for a square bar any pores close to the side edges experience an additional stress raiser. The stress concentration factor of a pore semi-spherically open to the side edge, L in Fig. 5, is shown in Fig. 10 as a function of the depth below the surface. As in the case without the edge, a peak is achieved when the pore is just below the surface, as shown in Fig. 7(h). If located in the clad layer, the edge pore L and the in-clad pore I have almost the same stress concentration factors. Close to the clad layer surface the edge pore achieves significantly higher values, due to the combined impact from two surfaces.
Fig. 10: Stress concentration factor as a function of the pore centre position in depth D, normalized by the pore radius R for a regular in-clad pore and for a pore semi-open to the side edge. Another special case is the semi-spherical interface pore J, see Figs. 5,6(e). The semi-spherical interface pore causes lower stress concentration than a semi-spherical surface pore, both in-clad, see Fig. 7(c) and at the side edge, see Fig. 7(h), as shown in Fig. 8.

Md. Minhaj Alam Paper VI: Stress Raising in Laser Clad Deposits
A plane-like defect can be regarded as a crack and is therefore described by the stress intensity factor KI, as shown in Fig. 8. Horizontal LOF defect E, inclined LOF C and vertical hot cracks D achieve increasing KI-values in that order. Beside the impact of this angle relative to the clad interface, the horizontal orientation of the clad relative to the bar axis is also of importance. As for the wavy clad surface A, the planar defects are most critical across the bar and their effect gradually decreases when inclined more towards the bar axis, and finally have no effect when in parallel. Figure 11(a) shows how an inclined LOF defect deviates towards the vertical propagation directions, propagating faster to the surface than to the inner regions of the bar. The kink angle for incremental crack propagation, Fig.11(b), shows that the horizontal LOF has to start with strong kink angle deviations (which delays the crack propagation) while the inclined LOF more rapidly achieves straight vertical propagation and the vertical hot crack keeps in its direction. A planar defect from the surface (e.g. cold lap or LOF from the as-clad notch) can be regarded as a special case, propagating solely into the material.
Fig. 11: (a) Fatigue crack propagation from inclined LOF at the interface, (b) kink angle variation as a function of crack length generated from a vertical hot cracking and from inclined as well as horizontal LOF. 3.4 General description for stress raisers of laser clad bars A general description of the combined view of stress raisers is illustrated in Fig. 12 as a Tuning Flow Chart, TFC, a method developed recently [39]. It summarizes that the most critical stress is generated by a combination of the macro-stress field, the
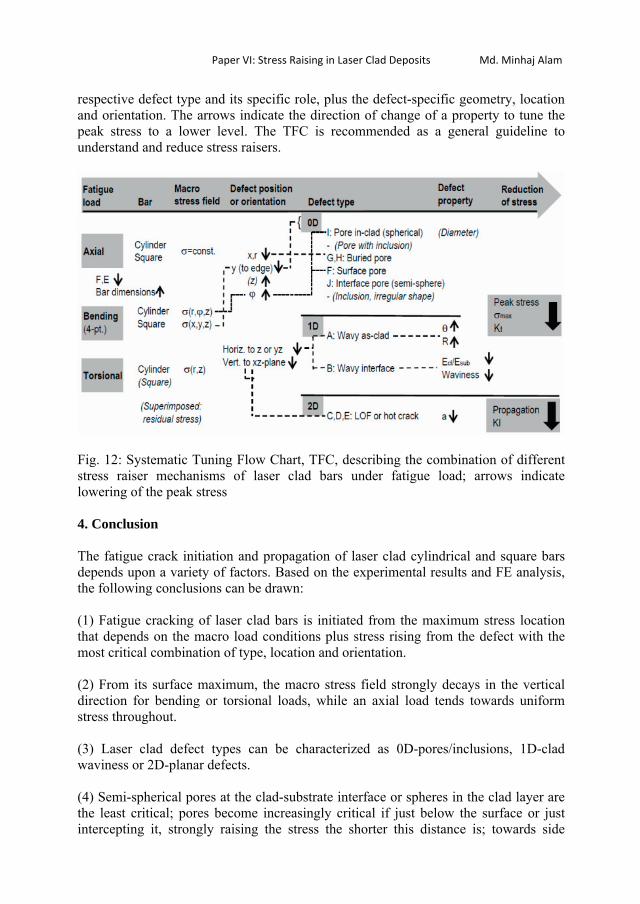
Paper VI: Stress Raising in Laser Clad Deposits Md. Minhaj Alam
respective defect type and its specific role, plus the defect-specific geometry, location and orientation. The arrows indicate the direction of change of a property to tune the peak stress to a lower level. The TFC is recommended as a general guideline to understand and reduce stress raisers.
Fig. 12: Systematic Tuning Flow Chart, TFC, describing the combination of different stress raiser mechanisms of laser clad bars under fatigue load; arrows indicate lowering of the peak stress 4. Conclusion The fatigue crack initiation and propagation of laser clad cylindrical and square bars depends upon a variety of factors. Based on the experimental results and FE analysis, the following conclusions can be drawn: (1) Fatigue cracking of laser clad bars is initiated from the maximum stress location that depends on the macro load conditions plus stress rising from the defect with the most critical combination of type, location and orientation. (2) From its surface maximum, the macro stress field strongly decays in the vertical direction for bending or torsional loads, while an axial load tends towards uniform stress throughout. (3) Laser clad defect types can be characterized as 0D-pores/inclusions, 1D-clad waviness or 2D-planar defects. (4) Semi-spherical pores at the clad-substrate interface or spheres in the clad layer are the least critical; pores become increasingly critical if just below the surface or just intercepting it, strongly raising the stress the shorter this distance is; towards side
Md. Minhaj Alam Paper VI: Stress Raising in Laser Clad Deposits
edges this surface impact contributes once more, which can cause the most critical combination. (5) The notches from wavy as-laser clad surfaces raise the stress fields – particularly for smaller notch radii and angles; a wavy clad-substrate interface is a very weak stress raiser; the clad orientation relative to the tensile stress is important. (6) Planar inner defects like LOF or hot cracks can under load be considered as propagating cracks; they accelerate vertically in both directions, but faster towards the surface; again the orientation angles are most critical normal to the tensile load, i.e. as vertical planes. (7) For maximum fatigue life of laser clad bars the above critical stress raiser combinations have to be avoided. Acknowledgement The authors acknowledge funding from the research programme EU-Interreg IVA North, project FATLASE, no. 304-13933-09. Reference [1] Vilar R. Laser cladding. Int J Powder Metall 2001; 37:31-48. [2] Steen WM. Laser material processing. 2nd ed. Springer: London; 1998. [3] Toyserkani E, Khajepour A, Corbin S. Laser cladding. CRC Press: Boca Raton; 2005. [4] Palumbo G, Pinto S, Tricarico L. Numerical finite element investigation on laser cladding treatment of ring geometries. J Mater Process Tech 2004; 155:1443-1450.
[5] Lin W C, Chen C. Characteristics of thin surface layers of cobalt-based alloys deposited by laser cladding. Surf Coat Technol 2006; 200:4557-4563.
[6] Ganesh P, Moitra A, Tiwari P, Sathyanarayanan S, Kumar H, Rai S K, Kaul R, Paul C P, Prasad R C, Kukreja L M. Fracture behavior of laser-clad joint of Stellite 21 on AISI 316L stainless steel. Mater Sci Eng A 2010; 527: 3748-3756.
[7] Koehler H, Schumacher J, Schuischel K, Partes K, Bomas H, Jablonski F, Vollertsen F, Kienzler R. An approach to calculate fatigue properties of laser cladded components. Prod Eng Res Devel 2012; 6:137-148. [8] Huang S W, Nolan D, Brandt M. Pre-placed WC/Ni clad layers produced with a pulsed Nd: YAG laser via optical fibres. Surf Coat Technol 2003; 165:26-34.
Paper VI: Stress Raising in Laser Clad Deposits Md. Minhaj Alam
[9] Ganesh P, Kaul R, Paul C P, Tiwari P, Rai S K, Prasad R C, Kukreja L M. Fatigue and fracture toughness characteristics of laser rapid manufactured Inconel 625 structures. Mater Sci Eng A 2010; 527:7490-7497. [10] Mei Z, Guo L F, Yue T M. The effect of laser cladding on the corrosion resistance of magnesium ZK60/SiC composite. J Mater Process Technol 2005; 161:462-466.
[11] Schubert E, Seefeld T, Rinn A, Sepold G. Laser beam cladding: a flexible tool for local surface treatment and repair. J Therm Spray Technol 1999; 8:590-596. [12] Dubourg L, Archambeault J. Technological and scientific landscape of laser cladding process in 2007. Surf Coat Technol 2008; 202:5863-69. [13] Alam M M, Barsoum Z, P. Jonsen, Kaplan A F H, Häggblad HÅ. The influence of surface geometry and topography on the fatigue cracking behaviour of laser hybrid welded eccentric fillet joints. Appl Surf Sci 2010; 256:1936-1945.
[14] Resch M, Kaplan A F H, Schuocker D. Laser-assisted generating of three-dimensional parts by the blown powder process. XIII International Symposium on Gas Flow and Chemical Lasers. Florence Italy, Society of Photo-Optical Instrumentation Engineers. 2001; 555-558.
[15] Chen J Y, Conlon K, Xue L, Rogge R. Experimental study of residual stresses in laser clad AISI P20 tool steel on pre-hardened wrought P20 substrate. Mater Sci Eng A 2010; 527: 7265-7273
[16] Lawrence J, Pou J, Low D K Y. Advances in laser materials processing technology: technology, research and application. Woodhead Publishing Ltd, Cambridge; 2010 [17] Kobryn P A, Moore E H, Semiatin S L. The effect of laser power and traverse speed on microstructure, porosity and build height in laser-deposited Ti-6Al-4V. Scripta Materialia 2000; 43:299-305. [18] Alam M M, Barsoum A, Jonsén P, Kaplan A F H, Häggblad H Å. Influence of defects on fatigue crack propagation in laser hybrid welded eccentric fillet joint. Eng Fract Mech 2011; 78:2246-2258. [19] Gorman P, Smugeresky J E, Keicher D M. Evaluation of property dependence on build rate for LENS powder metal deposition. Symposium on Rapid Prototyping of Materials at the TMS Fall Meeting. Columbus OH USA, Minerals, Metals and Materials Society. 2002. [20] Verhaeghe G, Hilton P A. Laser welding of low-porosity aerospace aluminium alloy. In Hinduja, S. (Ed.) 34th International MATADOR Conference. UMIST Manchester UK, Springer. 2004

Md. Minhaj Alam Paper VI: Stress Raising in Laser Clad Deposits
[21] Chawla N, Murphy T F, Narasimhan K S, Koopman M, Chawla K K. Axial fatigue behaviour of binder-treated versus diffusion alloyed powder metallurgy steels. Mater Sci Eng A 2001; 308:180-8. [22] D’Armas H, Llanes L, Penafiel J, Bas J, Anglada M. Tempering effects on the tensile response and fatigue life behaviour of a sinterhardened steel. Mater Sci Eng A 2000; 277:291-6. [23] Carabajar S, Verdu C, Hamel A, Fougeres R. Fatigue behaviour of a nickel alloyed sintered steel. Mater Sci Eng A 1998; 257:225-34. [24] Carabajar S, Verdu C, Fougeres R. Damage mechanisms of a nickel alloyed sintered steel during tensile tests. Mater Sci Eng A 1997; 232:80-7. [25] Beiss P, Dalgic M. Structure property relationships in porous sintered steels. Mater Chem Phys 2001; 67:37-42. [26] Kobayashi T, Ito T, Yao Q, Fatahalla N. Fatigue properties and microstructure of Al–Si Cu system casting alloys. Mater Sci Technol 1999; 15(9):1037-43. [27] Fan J H, McDowell D L, Horstemeyer M F, Gall K. Cyclic plasticity at pores and inclusions in cast Al–Si alloys. Eng Fract Mech 2003; 70:1281-1302.
[28] Li P, Lee P D, Maijer D M, Lindley T C. Quantification of the interaction within defect populations on fatigue behavior in an aluminum alloy. Acta Mater 2009; 57:3539-48. [29] Xu Z, Wen W, Zhai T. Effects of pore position in depth on stress/strain concentration and fatigue crack initiation. Metall Mater Trans A 2012; 43:2763-2770. [30] Murakami Y. Material defects as the basis of fatigue design. Int J of Fatig 2012; 41:2-10.
[31] Fazzini P G, Belmonte J C, Chapetti M D, Otegui J L, Fatigue assessment of a double submerged arc welded gas pipeline, Int J of Fatig 2007; 29:1115-1124.
[32] Li L, Liu Z, Snow M. Effect of defects on fatigue strength of GTAW repaired cast aluminum alloy. Welding Journal (Miami, FL) 2006; 85:264-270.
[33] DNV-M3, Dynamic bending test, DET NORSKE VERITAS, Report no. 2009-3295; 2009.
[34] ISO 1352:2011, Metallic materials - Torque-controlled fatigue testing; 2011.
[35] ANSYS® Academic Research, Release 13.0, Help System, Structural Analysis Guide, ANSYS, Inc.; 2012.
Paper VI: Stress Raising in Laser Clad Deposits Md. Minhaj Alam
[36] FRANC2D User’s Guide, Version 3.1, [www.cfg.cornell.edu/software/franc2dl.htm] (2012-04-23). [37] Alam M M, Powell J, Kaplan A F H, Tuominen J, Vuoristo P, Miettinen J, Poutala J, Näkki J, Junkala J, Peltola T. Surface pore initiated fatigue failure in laser clad components. Unpublished.
[38] Yi J Z, Gao Y X, Lee P D, Flower H M, Lindley T C. Scatter in Fatigue Life Due to Effects of Porosity in Cast A356-T6 Aluminum-Silicon Alloys. Metall Mater Trans A 2003; 34A:1879-90. [39] Alam M M, Karlsson J, Kaplan A F H. Generalising fatigue stress analysis of different laser weld geometries. Mater Des 2011; 32:1814-1823.