
Technique for cladding of poison sheets for Cd-poisoned moderator
Upload
khangminh22Category
view
1download
0
University of Tennessee, Knoxville University of Tennessee, Knoxville
TRACE: Tennessee Research and Creative TRACE: Tennessee Research and Creative
Exchange Exchange
Doctoral Dissertations Graduate School
12-2020
Multiphysics Assessment of Accident Tolerant Fuel, Cladding, and Multiphysics Assessment of Accident Tolerant Fuel, Cladding, and
Core Structural Material Concepts Core Structural Material Concepts
Jacob Preston Gorton [email protected]
Follow this and additional works at: https://trace.tennessee.edu/utk_graddiss
Part of the Nuclear Engineering Commons
Recommended Citation Recommended Citation Gorton, Jacob Preston, "Multiphysics Assessment of Accident Tolerant Fuel, Cladding, and Core Structural Material Concepts. " PhD diss., University of Tennessee, 2020. https://trace.tennessee.edu/utk_graddiss/6073
This Dissertation is brought to you for free and open access by the Graduate School at TRACE: Tennessee Research and Creative Exchange. It has been accepted for inclusion in Doctoral Dissertations by an authorized administrator of TRACE: Tennessee Research and Creative Exchange. For more information, please contact [email protected].

To the Graduate Council:
I am submitting herewith a dissertation written by Jacob Preston Gorton entitled "Multiphysics
Assessment of Accident Tolerant Fuel, Cladding, and Core Structural Material Concepts." I have
examined the final electronic copy of this dissertation for form and content and recommend
that it be accepted in partial fulfillment of the requirements for the degree of Doctor of
Philosophy, with a major in Nuclear Engineering.
Nicholas R. Brown, Major Professor
We have read this dissertation and recommend its acceptance:
Jamie B. Coble, G. Ivan Maldonado, Benjamin S. Collins, Andrew T. Nelson
Accepted for the Council:
Dixie L. Thompson
Vice Provost and Dean of the Graduate School
(Original signatures are on file with official student records.)

Multiphysics Assessment of Accident Tolerant Fuel,
Cladding, and Core Structural Material Concepts
A Dissertation Presented for the
Doctor of Philosophy
Degree
The University of Tennessee, Knoxville
Jacob Preston Gorton
December 2020

ii
Copyright © 2020 by Jacob Preston Gorton
All rights reserved.

iii
ACKNOWLEDGEMENTS
I would like to thank my advisor, Dr. Nicholas Brown, for his support and
excellent mentorship throughout my years in graduate school. I also extend my gratitude
to all of my other committee members, Dr. Jamie Coble, Dr. Ivan Maldonado, Dr. Ben
Collins, and Dr. Andrew Nelson, for all of their time and feedback throughout the
proposal and defense process. Further, I greatly appreciate the technical guidance and
support Dr. Collins and Dr. Nelson provided while I was working on the studies in this
dissertation. I also want to thank Dr. Aaron Graham, Dr. Bob Salko, Dr. Shane Stimpson,
and Dr. Shane Henderson from the ORNL CASL team for helping me with VERA.
Thank you to my collaborators on the works contained in this dissertation, including Mr.
Soon Lee, Dr. Youho Lee, Dr. Aaron Wysocki, Dr. Danny Schappel, Dr. Gyan Singh, Dr.
Yutai Katoh, and Dr. Brian Wirth. I want to thank my parents, Harvey and Robin, for
their continuous support. Finally, I’d like to thank my domestic partner Haley for always
supporting me, proofreading my papers, and watching me practice presentations.
Some of this work was supported by the U.S. Department of Energy (DOE)
Nuclear Energy University Program (NEUP) award #17-12688 and the U.S. DOE Office
of Nuclear Energy Advanced Fuels Campaign. Any opinions, findings, and conclusions
presented in this dissertation are only those of the author and do not necessarily reflect
the views of the funding agencies.

iv
ABSTRACT
The severe accident at the Fukushima-Daiichi nuclear power plant in 2011 ignited
a global research and development effort to replace traditionally-used materials in Light
Water Reactors (LWRs) with Accident Tolerant Fuel (ATF) materials. These materials
are intended to extend the coping time of nuclear power plants during severe accident
scenarios, but must undergo thorough safety and performance evaluations before being
implemented. Four ATF concepts are analyzed in this dissertation using state-of-the-art
computer modeling tools: (1) iron-chromium-aluminum (FeCrAl) fuel rod cladding, (2)
silicon carbide (SiC) fiber-reinforced, SiC matrix composite (SiC/SiC) boiling water
reactor (BWR) channel boxes, (3) mixed thorium mononitride (ThN) and uranium
mononitride (UN) fuel, (4) and UO2 [uranium dioxide] with embedded high thermal
conductivity Mo inserts. The goals and approaches used for each study differed, and
portions of this dissertation focused on verifying the accuracy of advanced modeling
tools. Although each ATF evaluation is distinct, the underlying theme is the enhancement
of safety, efficiency, and economic competitiveness of nuclear power through the use of
advanced modeling techniques applied to material characterization studies.
Results from the evaluations show the pros and cons of each ATF concept and
highlight areas of needed modeling development. Comparisons of simulated and
experimental critical heat flux (CHF) data for FeCrAl cladding and subsequent sensitivity
analyses emphasized differences between real-world and simulated post-CHF
phenomena. The Virtual Environment for Reactor Applications (VERA) multiphysics
modeling suite was verified against other widely-used modeling tools for BWR
application, and its advanced features were used to generate boundary conditions in
SiC/SiC channel boxes used for deformation analyses. Several ThN-UN mixtures were
analyzed using reactor physics and thermal hydraulic techniques and were shown to
significantly increase the margin to fuel melt compared with UO2 [uranium dioxide] in
LWRs. Mo inserts for UO2 [uranium dioxide] were optimized using sensitivity regression
techniques and were also shown to significantly increase the margin to fuel melt
compared with traditional UO2 [uranium dioxide].

v
TABLE OF CONTENTS
CHAPTER 1 INTRODUCTION ........................................................................................ 1
1.1 Accident Tolerant Fuels ...................................................................................... 1
1.2 The Role of Computer Modeling in ATF Assessments ...................................... 2
1.3 Goals and Hypotheses ......................................................................................... 3
1.4 Dissertation Contributions and Outline .............................................................. 6
CHAPTER 2 LITERATURE REVIEW ........................................................................... 10
2.1 Motivation for ATF Technology Development ................................................ 10
2.1.1 Historical Perspective ............................................................................... 10
2.1.2 Review of ATF Technology Requirements and Desirable Traits ............. 11
2.2 Current Concepts .............................................................................................. 13
2.2.1 FeCrAl Cladding ....................................................................................... 14
2.2.2 SiC/SiC Cladding and Structural Material Concepts ................................ 15
2.2.3 Thorium-based Fuel Concepts .................................................................. 18
2.2.4 Non-fissile Inserts in UO2 ......................................................................... 20
2.3 Review of Accident and Safety-Related Concepts ........................................... 22
2.3.1 Reactivity Temperature Coefficients ........................................................ 22
2.3.2 Reactivity-Initiated Accidents and Critical Heat Flux .............................. 24
2.4 Computational Modeling: Review of the State-of-the-Art ............................... 28
2.4.1 Computational Reactor Physics ................................................................ 28
2.4.2 The Current Paradigm ............................................................................... 30
2.4.3 Advanced Computational Methods........................................................... 33
CHAPTER 3 THERMAL HYDRAULIC EVALUATION OF FECRAL CLADDING . 37
3.1 Background ....................................................................................................... 37
3.2 Experiment and Computer Model Descriptions ............................................... 39
3.2.1 Experiment Setup ...................................................................................... 39
3.2.2 CTF and RELAP5-3D Model Descriptions .............................................. 43
3.3 Results ............................................................................................................... 43
3.3.1 UNM Experimental Results ...................................................................... 43
3.3.2 Code-to-Experiment Comparisons............................................................ 45
3.4 Sensitivity and Uncertainty Analysis of FeCrAl Heat Transfer Coefficients and
Material Properties ........................................................................................................ 52
3.4.1 Sensitivity Case 1: Heat Transfer Coefficient and the CHF Multiplier .... 53
3.4.2 Sensitivity Case 2: FeCrAl Thermophysical Properties ........................... 54
3.4.3 Best Match Parameters ............................................................................. 58
3.5 Discussion ......................................................................................................... 65
vi
CHAPTER 4 ASSESSMENT OF CASL VERA FOR BWR ANALYSIS AND
APPLICATION TO SIC/SIC CHANNEL BOX .............................................................. 70
4.1 Background ....................................................................................................... 70
4.2 BWR Model Descriptions and Study Organization .......................................... 73
4.2.1 Peach Bottom Fuel Assembly Model Descriptions .................................. 74
4.2.2 Description of Modern BWR Fuel Assembly and Mini-Core Models ..... 76
4.2.3 Summary of Modeling Tools and Study Organization ............................. 79
4.3 Few-Group Cross Section Comparisons ........................................................... 81
4.4 VERA to PARCS/PATHS Comparisons .......................................................... 86
4.4.1 Code-to-code Comparison of BWR Analysis ........................................... 86
4.4.2 Discussion on VERA-to-PARCS/PATHS Comparisons .......................... 90
4.5 SiC/SiC Channel Box Analysis using VERA ................................................... 95
4.5.1 Evaluation of SiC/SiC Channel Box ......................................................... 95
CHAPTER 5 REACTOR PERFORMANCE AND SAFETY CHARACTERISTICS OF
THN-UN FUEL CONCEPTS IN A PWR ...................................................................... 105
5.1 Motivation for ThN-UN .................................................................................. 105
5.2 ThN-UN Fuel Composition for UO2 Cycle Length Matching........................ 106
5.2.1 Pin-cell Model Descriptions ................................................................... 106
5.2.2 UO2 Cycle Length Matching and Comparison to Serpent Results ......... 108
5.3 Fuel Performance of ThN-UN ........................................................................ 113
5.3.1 Flux Spectra Characterization and Reactivity Coefficients .................... 113
5.3.2 Impact of 100% Enriched 15N ................................................................. 121
5.3.3 Thermal Performance.............................................................................. 123
5.4 Discussion ....................................................................................................... 126
CHAPTER 6 REACTOR PERFORMANCE AND SAFETY CHARACTERISTICS OF
UO2 with MO INSERTS ................................................................................................. 131
6.1 Motivation ....................................................................................................... 131
6.2 Methodology ................................................................................................... 132
6.2.1 Selection of Mo Content and 235U Enrichment ....................................... 132
6.2.2 Sensitivity Analysis Methods ................................................................. 135
6.2.3 Determination of Reactivity Coefficients and Reactor Performance ..... 140
6.2.4 Summary of Methods and Computational Tools .................................... 141
6.3 Neutronics Results: Sensitivity Studies and In-Depth Analysis ..................... 144
6.3.1 Neutronics Sensitivity Analysis Results ................................................. 144
6.3.2 Cycle Length and Self-Shielding ............................................................ 144
6.4 Heat Transfer Results: Sensitivity Studies and In-Depth Analysis ................ 149
6.4.1 BISON Setup .......................................................................................... 149
6.4.2 Heat Transfer Sensitivity Analysis Results............................................. 150

vii
6.4.3 Fuel Temperature Gradient and Energy Storage .................................... 150
6.5 Reactor Performance and Safety ..................................................................... 157
6.5.1 Reactivity Coefficients and Control Worth ............................................ 157
6.5.2 Calibration of CTF to BISON for Multiphysics Reactor Analysis ......... 161
6.5.3 Scoping Analysis of PWR Thermal Performance .................................. 165
6.6 Discussion of Results ...................................................................................... 171
CHAPTER 7 CONCLUSION......................................................................................... 175
7.1 Summary and Conclusions ............................................................................. 175
7.1.1 FeCrAl Cladding Thermal Hydraulic Evaluation ................................... 175
7.1.2 Assessment of VERA BWR Modeling and Analysis of SiC/SiC Channel
Box 177
7.1.3 Reactor Performance and Safety Characteristics of ThN-UN ................ 180
7.1.4 Reactor Performance and Safety Characteristics of UO2 with Mo Inserts
181
7.2 Contributions and Evaluation of Hypotheses ................................................. 183
7.2.1 Contributions........................................................................................... 183
7.2.2 Review of Hypotheses ............................................................................ 184
7.3 Recommended Future Work ........................................................................... 186
References ....................................................................................................................... 189
Vita .................................................................................................................................. 204
viii
LIST OF TABLES
Table 1: Experimental parameters for all materials .......................................................... 42
Table 2: Relative error between the RELAP5 and CTF results to the experimental values
................................................................................................................................... 49
Table 3: Parameters used in the Best Match Combined run from Sensitivity Case 1 ...... 63
Table 4: Relative error of the Best Match Combined run from Sensitivity Case 1 .......... 63
Table 5: Parameters used in the Best Match Combined run from Sensitivity Case 2 ...... 64
Table 6: Relative error of the Best Match Combined run from Sensitivity Case 2 .......... 64
Table 7: Peach Bottom fuel assembly geometry [8] ......................................................... 75
Table 8: Peach Bottom fuel assembly boundary conditions ............................................. 75
Table 9: Comparison of infinite multiplication factor between Serpent and MPACT ..... 83
Table 10: Comparison of key parameter predictions between PARCS/PATHS and VERA
................................................................................................................................... 89
Table 11: Dimensions of PWR pin-cell model ............................................................... 107
Table 12: ThN-UN mixtures that approximately match the UO2 cycle length ............... 109
Table 13: Two-group macroscopic capture cross sections for each fuel form at BOC and
EOC......................................................................................................................... 119
Table 14: Comparison of reactivity coefficients to AP1000 DCD limits ....................... 120
Table 15: ThN-UN mixtures with enriched 15N that approximately match the UO2 cycle
length....................................................................................................................... 122
Table 16: Neutronic sensitivity study results and variable rankings .............................. 146
Table 17: Heat transfer sensitivity indices and variable rankings .................................. 152
Table 18: Comparison of maximum fuel temperature, maximum temperature gradient,
and energy storage in UO2, the HTC, and the LTC. ............................................... 154
Table 19: Two-group neutron flux and absorption, fission, and capture cross sections at
BOC. ....................................................................................................................... 162
Table 20: Agreement of calibrated CTF results relative to BISON predictions ............. 167
ix
LIST OF FIGURES
Figure 1: Depiction of a control rod ejection and RIA in a PWR (reproduced from [88])
........................................................................................................................................... 25
Figure 2: (a) UNM Flow boiling loop schematic (b) cross-sectional view of the test
section [6].................................................................................................................. 40
Figure 3: Nodalization diagram of RELAP5-3D model ................................................... 44
Figure 4: Experimental results for (a) Inconel, (b) SS316 and (c) FeCrAl....................... 44
Figure 5: Comparison of experimental and simulated heat flux for (a) Inconel, (b) SS316
and (c) FeCrAl .......................................................................................................... 46
Figure 6: Comparison of experimental and simulated tube outer surface temperatures for
(a) Inconel, (b) SS316 and (c) FeCrAl ...................................................................... 47
Figure 7: CHF predictions by RELAP5-3D and CTF using the Groeneveld look-up table
for (a) Inconel, (b) SS316 and (c) FeCrAl ................................................................ 50
Figure 8: RELAP5-3D and CTF predictions for (a) pressure, (b) mass flux, (c)
equilibrium quality and (d) vapor void fraction for the FeCrAl case ....................... 51
Figure 9: Sensitivity of CHF to heat transfer coefficient and CHF multipliers ................ 55
Figure 10: Sensitivity of PCT to heat transfer coefficient and CHF multipliers .............. 56
Figure 11: Sensitivity of CHF to (a) the CHF, (b) thermal conductivity, (c) volumetric
heat capacity, (d) thermal effusivity and (e) thermal diffusivity multipliers ............ 59
Figure 12: Sensitivity of PCT to (a) the CHF, (b) thermal conductivity, (c) volumetric
heat capacity, (d) thermal effusivity and (e) thermal diffusivity multipliers ............ 60
Figure 13: Comparison of experimental heat flux to the best matches for each FoM from
Sensitivity Case 1 ...................................................................................................... 62
Figure 14: Comparison of experimental surface temperature to the best matches for each
FoM from Sensitivity Case 1 .................................................................................... 62
Figure 15: Comparison of experimental heat flux to the best matches for each FoM from
Sensitivity Case 2 ...................................................................................................... 63
Figure 16: Comparison of experimental surface temperature to the best matches for each
FoM from Sensitivity Case 2 .................................................................................... 64
Figure 17: Comparison of heat flux and inner surface temperature between the
experiment and RELAP5-3D best match model around the CHF/MHF point ......... 66
Figure 18: Time rate of change of heat flux and cladding inner surface temperature
around the CHF and MHF from the FeCrAl experiment .......................................... 68

x
Figure 19: Heat flux and temperature around the CHF (top) and time rate of change of
heat flux and temperature around the CHF (bottom) for Inconel 600 (left) and SS316
(right) ........................................................................................................................ 68
Figure 20: Cross section of the single fuel assembly model with the control blade (shown
in red on sides 1 and 2) fully inserted ....................................................................... 78
Figure 21: BWR Control Cell ........................................................................................... 80
Figure 22: Organization of the current study and summary of modeling tools used ........ 82
Figure 23: Comparison of cross sections from Serpent and MPACT for assembly types a)
1, b) 3, and c) 5 ......................................................................................................... 83
Figure 24: Comparison of cross sections calculated by Serpent and MPACT for
Assembly Type 3 using the P2 scattering approximation ......................................... 85
Figure 25: Comparison of relative power and keff for assembly types 1 (left) and 2 (right)
................................................................................................................................... 88
Figure 26: Comparison of void fraction and outlet equilibrium quality for assembly types
1 (left) and 2 (right)................................................................................................... 88
Figure 27: Comparison of coolant pressure drop for assembly types 1 (left) and 2 (right)
................................................................................................................................... 88
Figure 28: Comparison of average fuel temperature for assembly types 1 (left) and 2
(right) ........................................................................................................................ 89
Figure 29: Comparison of relative power and keff predictions from MPACT and PARCS
for assembly type 1 ................................................................................................... 92
Figure 30: Comparison of void fraction and outlet equilibrium quality predicted by CTF
and PATHS for assembly type 1 ............................................................................... 92
Figure 31: Comparison of pressure drop predicted by CTF and PATHS for assembly type
1................................................................................................................................. 93
Figure 32: Comparison of average fuel temperature predicted by CTF and PATHS for
assembly type 1 ......................................................................................................... 93
Figure 33: Fast neutron flux distribution in a SiC-SiC channel box using a 0.067 MeV
cutoff (top), 0.183 MeV cutoff (bottom), and the percent difference in flux between
the two cutoffs (right) with the control blade fully withdrawn ................................. 96
Figure 34: Fast neutron flux distribution in a SiC-SiC channel box using a 0.067 MeV
cutoff (top), 0.183 MeV cutoff (bottom), and the percent difference in flux between
the two cutoffs (right) with the control blade halfway inserted ................................ 97
Figure 35: Fast neutron flux distribution in a SiC-SiC channel box using a 0.067 MeV
cutoff (top), 0.183 MeV cutoff (bottom), and the percent difference in flux between
the two cutoffs (right) with the control blade fully inserted ..................................... 98
xi
Figure 36: Temperature distribution in the channel box for the case with control blade
fully withdrawn ......................................................................................................... 99
Figure 37: Temperature distribution in the channel box for the case with control blade
halfway inserted ........................................................................................................ 99
Figure 38: Temperature distribution in the channel box for the case with control blade
fully inserted. .......................................................................................................... 100
Figure 39: Fast flux distribution in a control cell with a fully inserted control blade .... 102
Figure 40: Temperature distribution in a control cell with a fully inserted control blade
................................................................................................................................. 102
Figure 41: Total lateral displacement of SiC/SiC channel box as a function of time and
control blade configuration [17] ............................................................................. 104
Figure 42: Comparison of keff calculated by MPACT and Serpent for a) UO2, b) 20%
ThN-80% UN, c) 40% ThN-60% UN, d) 66% ThN-34% UN, and e) UN ............ 111
Figure 43: Comparison of 232Th and 233U mass as a function of burnup in the 66% ThN,
34% UN mixture ..................................................................................................... 112
Figure 44: Thermal and intermediate neutron flux spectra at BOC for UO2, UN, and ThN-
UN mixtures ............................................................................................................ 114
Figure 45: Fast neutron flux spectra at BOC for UO2, UN, and ThN-UN mixtures ...... 114
Figure 46: Comparison of BOC and EOC thermal and intermediate flux spectra for UO2,
UN, and 66% ThN-34% UN ................................................................................... 115
Figure 47: FTC of UO2, UN, and ThN-UN fuels as a function of burnup ..................... 115
Figure 48: Moderator temperature coefficient of UO2, UN, and ThN-UN fuels as a
function of burnup................................................................................................... 116
Figure 49: Impact of boron on moderator temperature coefficient for UO2 and 66% ThN-
34% UN .................................................................................................................. 116
Figure 50: Soluble boron coefficient of UO2, UN, and ThN-UN fuels as a function of
burnup ..................................................................................................................... 117
Figure 51: Control rod worth of UO2, UN, and ThN-UN fuels as a function of burnup 117
Figure 52: 135Xe mass as a function of burnup for each fuel form ................................. 119
Figure 53: FTC for UO2, 40ThN-60UN with natural nitrogen and 40ThN-60UN with
100% 15N enrichment .............................................................................................. 122
Figure 54: MTC for UO2, 40ThN-60UN with natural nitrogen, and 40ThN-60UN with
100% 15N enrichment .............................................................................................. 124
Figure 55: SBC for UO2, 40ThN-60UN with natural nitrogen, and 40ThN-60UN with
100% 15N enrichment .............................................................................................. 124

xii
Figure 56: Control rod worth for UO2, 40ThN-60UN with natural nitrogen, and 40ThN-
60UN with 100% 15N enrichment ........................................................................... 125
Figure 57: Thermal conductivity of UN, ThN, and ThN-UN mixtures .......................... 127
Figure 58: Specific heat capacity of UN, ThN, and ThN-UN mixtures ......................... 127
Figure 59: Homologous temperature as a function of fuel rod height at BOC ............... 128
Figure 60: Homologous temperature as a function of burnup ........................................ 128
Figure 61: Difference in cycle length of various combinations of Mo content and 235U
enrichment relative to 4.9% enriched UO2 ............................................................. 134
Figure 62: Difference in neutron multiplication factors between Serpent and MPACT 134
Figure 63: Thermal resistance network in a) a typical UO2 fuel pellet and b) a UO2 fuel
pellet with a rod-and-disk Mo insert ....................................................................... 136
Figure 64: Example of Mo insert geometry with two radial disks ................................. 138
Figure 65: Process flowchart used for this study. ........................................................... 142
Figure 66: Summary of computational tools and their roles in this study. ..................... 143
Figure 67: Unconditional neutronic results as a function of each input variable ........... 145
Figure 68: Example of A(xi) between the unconditional CDF and a conditional CDF .. 145
Figure 69: Neutronic sensitivity indices as a function of model runs per variable......... 146
Figure 70: Cross sections of the HRC (left) and LRC (right) pin-cell models ............... 146
Figure 71: Impact of Mo inserts on self-shielding in the fuel pellet ............................... 148
Figure 72: Unconditional predictions of maximum fuel temperature as a function of each
input variable .......................................................................................................... 151
Figure 73: Heat transfer sensitivity indices as a function of model runs per variable .... 151
Figure 74: Cross sections of the HTC geometry (left) and the LTC geometry (right) ... 152
Figure 75: Volumetric heat capacity of UO2 [34] and Mo [82] ...................................... 154
Figure 76. a) Plot of the maximum temperature in the pellet b) Maximum and minimum
fuel-clad gap widths vs burnup for the LTC ........................................................... 156
Figure 77: Radial temperature profiles in UO2, the HTC, and the LTC ......................... 156
Figure 78: a) UO2-Mo thermal conductivity profile. b) temperature profile for the UO2-
Mo pellet. c) UO2 thermal conductivity profile. d) temperature profile for the UO2
pellet. ....................................................................................................................... 158
Figure 79: FTC for UO2 and UO2-Mo mixtures as a function of burnup. ...................... 159
Figure 80: MTC for UO2 and UO2-Mo mixtures as a function of burnup. ..................... 159
Figure 81: SBC for UO2 and UO2-Mo mixtures as a function of burnup. ...................... 160

xiii
Figure 82: Control rod worth for UO2 and UO2-Mo mixtures as a function of burnup . 160
Figure 83: Concentration of 135Xe for UO2 and UO2-Mo mixtures as a function of burnup.
................................................................................................................................. 162
Figure 84: Relative power profile used for PWR fuel rod model in CTF; markers indicate
locations used for calibration .................................................................................. 164
Figure 85: Radial fuel temperature profiles predicted by BISON at 219, 63, and 15 cm166
Figure 86: Comparison of calibrated CTF and BISON radial fuel temperature profiles for
the LTC at 219, 63, and 15 cm................................................................................ 166
Figure 87: Comparison of calibrated CTF and BISON radial fuel temperature profiles for
the HTC at 219, 63, and 15 cm ............................................................................... 167
Figure 88: Homologous temperature in the hottest rod in a PWR fuel assembly at BOC
................................................................................................................................. 169
Figure 89: Peak homologous temperature in a PWR fuel rod as a function of burnup .. 169
Figure 90: Relative power shapes for UO2 and the LTC at different burnup values. ..... 170
1
CHAPTER 1
INTRODUCTION
1.1 Accident Tolerant Fuels
On March 11, 2011, the Great East Japan Earthquake and ensuing tsunami caused
a station blackout (SBO) accident at the Fukushima-Daiichi nuclear power plant. During
the accident, all operating reactors were automatically shut down, and primary and
backup generators that powered feedwater circulation pumps were disabled by the
flooding. The loss of coolant circulation made decay heat removal impossible, and
reactor core temperatures began to rise. Elevated core temperatures accelerated the
oxidation reaction between water and Zircaloy, the typical fuel rod cladding material in
Light Water Reactors (LWRs). Accumulation of hydrogen gas released from the
oxidation reaction eventually exploded in three reactor units at the plant, and radioactive
material was released into the environment. The events that transpired at Fukushima
influenced the U.S Department of Energy Office of Nuclear Energy (DOE-NE) to
prioritize research and development focused on Accident Tolerant Fuel (ATF) materials.
The development of ATF technologies intended to extend the coping time during a
Fukushima-like accident soon became an international effort [1].
Since then, the umbrella term “ATF” has been expanded to include not just fuel
materials, but also fuel rod cladding and core structural material concepts that may
enhance accident-tolerance. Candidates concepts must undergo thorough evaluation
before being implemented in an operating nuclear reactor to ensure that the technology
enhances safety and does not negatively impact reactor performance, operations, or
economics. Four candidate ATF technologies are focused on in this dissertation: (1) iron-
chromium-aluminum (FeCrAl) cladding, (2) silicon carbide (SiC) fiber-reinforced, SiC
matrix composite (SiC/SiC) boiling water reactor (BWR) channel boxes, (3) mixtures of
thorium mononitride (ThN) and uranium mononitride (UN) fuels (ThN-UN), and (4) UO2
with embedded Mo inserts. The primary properties of these materials that qualify them as
ATF concepts are enhanced oxidation resistance, which will reduce hydrogen gas
2
production during an accident scenario, and enhanced heat transfer capabilities, which
will reduce the stored energy in the reactor core.
A primary objective of this dissertation is to evaluate these concepts using
computational methods to characterize their performance from thermal hydraulic and
reactor physics perspectives. Several of these analyses are supplemented with sensitivity
and optimization techniques, with an overall aim to gain understanding of the reactor
performance and safety characteristics of these ATF candidate materials. The second
objective of this dissertation is to highlight areas of needed development in computational
models and to verify the accuracy of novel model capabilities. Specifically, the accuracy
of recently developed BWR modeling capabilities in the Virtual Environment for Reactor
Applications (VERA) multiphysics modeling suite is verified using current regulator-
grade tools.
1.2 The Role of Computer Modeling in ATF Assessments
The United States Nuclear Regulatory Commission (NRC) has outlined a process
for licensing ATF materials, which requires a holistic understanding of a material’s
response to steady-state, transient, and accident conditions [2]. The technical basis for
licensing an ATF material requires a series of tests that include unirradiated and
irradiated materials testing, in-reactor experiments using lead test assemblies (LTA),
transient irradiation testing, and characterization of materials outside the realm of fuel
performance, such as fission product release, core melt progression, core relocation, and
mechanical and chemical interactions. All of these experiments are used to compile data
to provide a licensing basis for an ATF material and also to inform and calibrate
computational models of nuclear designs.
Performing the full suite of required tests for any ATF concept is a process that
even the most aggressive timelines foresee taking at least a decade or more [1], [2], [3].
This process also requires multiple large-scale experiments that are costly to conduct.
However, the testing process can be made more efficient and economical through the use
of computer modeling evaluations. Advanced computer models can be used to screen
ATF concepts for their feasibility as a reactor material so that only the most promising

3
candidates move to the experimental stage. For the concepts that do progress to the
experimental stage, computer models can be used to highlight areas of testing need and
inform experimental designs. Accurate modeling tools that are validated and verified
using experimental databases are used for regulatory purposes and can determine reactor
response to design basis accidents (DBAs) and beyond design basis accidents (BDBAs).
These accident scenarios are difficult and costly to replicate experimentally, which
underscores the important role that computer modeling plays in the progression of a
novel material concept to real-world application. Overall, computational modeling is a
vital step in the screening and licensing of ATF materials, and is the essence of this
dissertation.
1.3 Goals and Hypotheses
At a high level, the purpose of this dissertation is to evaluate ATF material
concepts and advanced computational modeling capabilities that will enhance the safety,
efficiency, and economic competitiveness of nuclear power. Distinct studies were carried
out for each of the four aforementioned ATF concepts that each have different goals and
approaches, but all support this single, overarching purpose. Additionally, portions of this
work were dedicated to verifying the accuracy of novel modeling capabilities, which also
supports the underlying theme of this dissertation. The goals of these distinct studies were
designed to fill knowledge gaps for each of the ATF concepts.
FeCrAl cladding is considered an ATF concept because of its excellent resistance
to oxidation in steam environments relative to Zircaloy [4], [5]. Additional understanding
on the potential accident response of FeCrAl cladding from a thermal hydraulics
standpoint is still needed, especially in regards to its behavior related to the critical heat
flux (CHF). CHF is a pertinent parameter in determining the thermal response of a
system to a high-temperature accident scenario and is directly related to the thermal
safety margin of LWRs. The FeCrAl cladding study aims to enhance understanding of the
impact that uncertainties in FeCrAl material properties, heat transfer coefficients, and
CHF enhancement during transient heating events have on the CHF value and post-CHF
cladding temperatures during accident scenarios using sensitivity analysis methods and

4
computer models. This study also compared results from small-scale CHF experiments
[6] and computer models of the experiment to highlight differences between simulated
results and observed behavior after CHF is reached.
SiC/SiC composite is also being considered as a potential material for BWR
channel boxes due to its excellent oxidation resistance [7]. The temperature and neutron
flux gradients experienced in BWR fuel assemblies may lead to irradiation swelling and
deformation of a SiC/SiC channel box, which could then interfere with control blade
insertion or other operational maneuvers. The purpose of the SiC/SiC channel box study
is to calculate high-fidelity temperature and fast neutron flux distributions in the channel
box for several control blade configurations that could then be used as boundary
conditions in deformation and stress models. An advanced modeling tool that could
calculate these boundary conditions using multiphysics methods with fine spatial fidelity
was desired for this study. The Consortium for Advanced Simulation of LWRs (CASL)
multiphysics modeling suite, VERA, met these qualifications. However, the BWR
modeling capability in VERA was a recent development that had not yet been validated
or verified. Comparisons between VERA results and those calculated using regulatory-
grade tools for fuel assembly designs from the Peach Bottom reactor [8] were made to
verify the accuracy of VERA’s BWR modeling capability.
Admixture of ThN and UN fuels is a novel concept that is primarily intended to
increase heat transfer capabilities of nuclear fuel in reactors. Although ThN-UN fuels
have favorable heat transfer characteristics, its feasibility as an LWR fuel material was
unknown. The purpose of the ThN-UN study is to compare the reactor performance and
safety characteristics of this fuel form to that of traditional UO2. Several mixtures of
ThN, UN, and 235U enrichment were determined that gave the same cycle length as UO2
in a pressurized water reactor (PWR), and then reactivity temperature coefficients
(RTCs), control worth, and thermal performance of each mixture was determined as a
function of burnup.
Studies focused on the addition of Mo into UO2, either in the form of insert
structures or granule mixtures, to increase thermal conductivity have previously been
conducted [9], [10], [11], [12]. However, the studies in the literature focused on the

5
measured thermal conductivity of the UO2-Mo designs and the temperature reduction in
single fuel pellet models, leaving several areas of research need for this concept. First, no
attention has been given to the neutronic impact of replacing fuel material with a non-
fissile insert. Second, the benefit of this concept to reducing fuel temperatures has only
been quantified in a single fuel pellet model that was focused primarily on the heat
transfer mechanism. Reactor-scale models are needed that account for neutronic and
thermal hydraulic feedback mechanisms to better quantify the performance of this
concept. Lastly, there is no systematic procedure in place that can be used to optimize the
shape or structure of the insert design. The purpose of the UO2-Mo study in this
dissertation is to address all of these research needs using multiphysics, sensitivity, and
optimization methods.
Based on the scope of these ATF evaluations, the following hypotheses are
proposed:
1. The CHF and peak cladding temperature (PCT) of FeCrAl cladding are sensitive to
heat transfer coefficients, material properties, and transient-induced CHF
enhancement.
2. VERA is capable of accurately predicting BWR performance and is valid to use for
novel, complex problems, such as ATF evaluations.
3. Temperature and fast neutron flux gradients in a SiC/SiC channel box will lead to
deformation and control blade interference.
4. ThN-UN fuels provide an enhanced thermal safety margin due to the high thermal
conductivity of nitride-based fuel.
5. A Mo insert design for UO2 fuel pellets can be optimized to improve thermal safety
margin of LWRs while having minimal impact on neutronic performance.
The contributions of this work include an increased knowledge base of fuel,
cladding, and structural ATF concepts, demonstration of differences between
experimental data and simulated results, validation of a U.S. Department of Energy
(DOE) computational tool for BWR application, and novel use of that tool for ATF
research. The work presented in this dissertation is informative for future experiments
and studies, demonstrates the feasibility of a number of ATF concepts, and validates an

6
advanced multiphysics modeling tool for BWR application, all of which are vital steps in
the NRC’s project plan for licensing ATF materials. Of the four concepts considered, the
NRC considers FeCrAl cladding to be a near-term concept, meaning it may be deployed
as soon as the early to mid 2020s, while any SiC/SiC cladding or structural concept is
considered a longer-term concept [2]. Both ThN-UN fuels and fuels with Mo inserts are
at an infancy stage in which preliminary feasibility studies and initial materials
evaluations are being performed. The breadth of ATF concepts considered, covering fuel,
cladding, and structural concepts, varying in development from early formulation to near-
term deployment and the use of state-of-the art modeling tools suggest that the studies
presented in this dissertation will be relevant and impactful for years to come.
1.4 Dissertation Contributions and Outline
The work in this dissertation contributes new knowledge to a variety of ATF-
related initiatives. CHAPTER 2 of this dissertation reviews literature relevant to the
history, purpose, and requirements of ATF technologies and lists a number of the most
developed ATF concepts and their properties. Some background on all of the
computational modeling tools used in this dissertation is given, along with some review
on other tools widely used in the nuclear industry. The ATF evaluations presented are all
distinctly different and offer a wide viewpoint on the types of computational studies
needed to advance ATF technologies. There are four ATF evaluations at the heart of this
dissertation that have been previously published in first-author, peer-reviewed journal
publications [13], [14], [15], [16]. Novel contributions to the literature from this
dissertation are summarized as follows:
1. Development of flow boiling models for assessing CHF characteristics of new
cladding materials during accident scenarios in two widely-used thermal hydraulic
analysis tools [13]. These models are based on an experimental flow boiling
apparatus constructed at the University of New Mexico (UNM) [6], and were used for
code-to-experiment comparisons of measured CHF data for FeCrAl cladding. This
work was performed in direct collaboration with UNM, in which they provided
experimental data and guidance on the experiment design.

7
2. Execution of a sensitivity analysis focused on heat transfer coefficients, material
properties, and transient CHF enhancement to determine the relationship between
these parameters and CHF and PCT [13]. This sensitivity study used one of the
models based on the UNM flow boiling apparatus and varied each input parameters
based on measurement uncertainty, uncertainty in correlations, and the observed
enhancement of CHF during a heating transient. Nearly 18,000 model runs were
conducted in this study to elucidate the impact of each input parameter.
3. Investigation into the differences between how CHF and post-CHF effects are
modeled and the observed phenomena [13]. Specifically, comparisons between
simulated results and the UNM experimental data showed large differences in the rate
of heat transfer decline after the CHF is reached, causing the computer models to be
highly conservative in PCT predictions.
4. The initial assessment of VERA’s coupled neutronics-to-thermal-hydraulics BWR
analysis capability using other widely-used modeling tools [14]. BWR modeling is
under development for VERA and has not yet been validated or verified. BWR fuel
assembly models were developed in both VERA and regulatory-grade modeling tools
to make comparisons between results and provide a preliminary appraisal of VERA’s
BWR modeling capability. These comparisons were performed with guidance from
BWR modeling experts at the Oak Ridge National Laboratory (ORNL).
5. Determination of 3-D fast neutron flux and temperature distributions in SiC/SiC
channel boxes for a number of control blade configurations using single and multi-
fuel-assembly models in VERA. Work involving single-assembly models has been
published in a co-author journal article, in which these fast flux and temperature
distributions were used as boundary conditions for a finite-element channel box
deformation study [17]. These distributions were also calculated in a mini-core model
as an initial demonstration of VERA’s advanced modeling features and applicability
to ATF research [16].
6. Identification of several ThN and UN mixtures that are capable of matching
conventional UO2 cycle length in a PWR [15]. This required the development of
simple PWR pin-cell models in multiple computational tools for verification purposes
8
and parametric studies of ThN content, UN content, and 235U enrichments to find
acceptable combinations. Additionally, this process was carried out using natural
nitrogen, which is almost entirely 14N, and then repeated for 100%-enriched 15N.
Accurate thorium modeling was performed with guidance from a VERA developer.
7. Calculation of reactor safety and thermal performance parameters for ThN-UN fuels
and comparison to UO2 performance [15]. RTCs, soluble boron coefficient (SBC),
and control rod worth were calculated using reactor physics tools as a function of
burnup for each of the identified ThN-UN mixtures. Homologous temperature, the
ratio of fuel temperature to its melting point, was calculated using VERA’s
multiphysics methods.
8. Design and execution of a sensitivity analysis method to study the impact of insert
geometry on the neutronic and heat transfer performance of UO2 with Mo inserts
[16]. The goals of the study precluded the use of traditional one-at-a-time sampling
methods, and instead called for the adaptation of a more unique method. The Monte
Carlo particle transport code Serpent [18] was utilized for the neutronics study, and
the finite element code BISON [19] was used for the heat transfer study. This study
was performed in collaboration with ORNL, and an ORNL researcher executed all
BISON simulations. However, I designed the sensitivity study and programmed a
Python script that automatically generated thousands of BISON geometry files from a
template provided by the ORNL researcher.
9. Development of a thermal conductivity calibration scheme to match fuel temperature
results from VERA’s thermal hydraulics modeling tool to higher-fidelity temperature
profiles predicted by BISON for UO2 with Mo inserts [16]. This was required to
make the leap from single fuel pellet models in BISON, which is capable of explicitly
modeling the 3-D insert geometry, to a reactor analysis tool, which has to
homogenize this composite fuel form into a single material.
10. Comparison of reactor safety-related parameters and thermal hydraulic performance
of UO2 with Mo inserts to conventional UO2 in a PWR [16]. These comparisons used
VERA PWR models to calculate RTCs, SBC, and control rod worth. Also, VERA

9
and the calibrated thermal conductivity relationships were used to determine
homologous temperature of these fuels in comparison with UO2.
More in-depth descriptions of each of these studies are given in CHAPTER 3
through CHAPTER 6. Specifically, the thermal hydraulic evaluation of FeCrAl cladding,
which includes the first three contributions listed above, is given in CHAPTER 3.
Verification of VERA’s BWR modeling capability through comparisons with current
state-of-the-art modeling tools is presented in CHAPTER 4. Also included in CHAPTER
4 is the calculation of temperature and fast neutron flux boundary conditions in SiC/SiC
channel boxes for various reactor and control blade configurations.
ThN-UN fuel compositions that can match the UO2 cycle length in a PWR were
determined in CHAPTER 5, as are calculations of RTCs, SBC, control worth, and
thermal performance of those fuel compositions as a function of burnup. In CHAPTER 6,
the reader can find the study of Mo inserts for UO2. The chapter includes sensitivity and
optimization studies focused on the neutronic and heat transfer performance of the fuel
design. As was done in the ThN-UN study, RTCs, SBC, control worth, and thermal
performance were determined. In both chapters, comparisons were made between the
performance and safety characteristics of these novel fuel types and UO2. Lastly,
CHAPTER 7 summarizes the findings and contributions of this work and concludes the
dissertation.
10
CHAPTER 2
LITERATURE REVIEW
2.1 Motivation for ATF Technology Development
2.1.1 Historical Perspective
Following Admiral Hyman Rickover’s decision to use LWR technology with
zirconium-based alloy (or Zircaloy) cladding and UO2 fuel in the U.S. Navy’s first
nuclear submarine, the U.S.S. Nautilus, LWRs have become the most common type of
power-producing nuclear reactor in the world [20], [21]. Since that decision was made in
the years shortly after World War II, relatively few changes to LWR materials technology
have been made. Several operational and safety upgrades were implemented after the
Three Mile Island accident in 1979, but LWR technology that uses the Zircaloy/UO2
cladding and fuel system remains the dominant form of nuclear power [1]. However, the
events that transpired at the Fukushima-Daiichi nuclear power plant in 2011 have
inspired a global research and development effort to replace traditional LWR materials
with ATF materials to enhance safety.
The tsunami that struck Japan as a result of a magnitude 9.0 earthquake caused an
SBO at the Daiichi nuclear power plant, which cut power to the pumps that circulate
coolant through three of the reactors at the site. Reactors at the Daiichi site automatically
shut down by design when then earthquake was detected, but decay heat produced in the
core required that coolant still be pumped through the system. Backup generators for the
coolant pumps turned on, but failed shortly after as a result of the tsunami and flooding,
leaving the coolant water stationary in the reactor cores. The stationary water quickly
reached excessive temperatures, which led to boiling and an increased the rate of the
oxidation reaction between Zircaloy and water. Flammable hydrogen gas is a byproduct
of the oxidation reaction, which is given by Equation (1), and the build-up of hydrogen
eventually led to several explosions that compromised the reactor containment building,
thus allowing the radioactive material to escape to the environment [22].

11
𝑍𝑟 + 2𝐻2𝑂 → 𝑍𝑟𝑂2 + 2𝐻2 (1)
Contaminated coolant water was also released into the ocean during the accident
containment process since it was unable to be pumped through the system [23]. The
events that transpired at Fukushima led to increased research in ATF technologies, which
includes nuclear fuel, fuel rod cladding, and core structural materials that could
potentially replace the typical Zircaloy/UO2 system used in current LWRs.
2.1.2 Review of ATF Technology Requirements and Desirable Traits
The major consequence from a nuclear accident is the release of fission products
from inside the reactor core to the environment that results in adverse effects on public
health, the environment, and the economy [23]. The NRC lists three hazard barriers in
current LWRs intended to prevent the release of fission products to the environment: the
metallic fuel rod cladding (typically Zircaloy), the reactor pressure vessel and water
pipes, and the concrete containment building [24]. The UO2 fuel pellets typically used in
LWRs may also be considered a hazard barrier to fission product release due to their
porous structure that retains fission gas [23]. The primary objectives for an ATF material
are to extend the coping time during a BDBA, such as the one that occurred at
Fukushima, and to prevent the release of fission products into the environment.
A set of required and desired attributes of an ATF candidate have been discussed
in several publications [1], [3], [25]. In addition to extending the coping time during an
accident, ATF materials must also meet economic and reactor performance criteria,
otherwise commercial reactor vendors will not be willing to invest in them. For this
reason, ATF technologies are expected to meet a “do no harm” criteria in which they
perform at least as well as the Zircaloy/UO2 system in terms of reactor operations and
performance [3], [26], [27].
Characteristics of an ATF technology that will increase coping time during a
severe accident and maintain fission product retention are significantly reduced oxidation
and corrosion rates in high-pressure steam environments, reduced probability of
mechanical failure from pellet-cladding interactions (PCIs) or other mechanisms, and
increased ability to transfer heat from the fuel pellet to the coolant. It is desirable for an

12
ATF cladding material to be ~100 times more oxidation resistant than Zircaloy in reactor
environments up to at least 1200C [1], [28]. There are two reasons for finding a material
with increased oxidation resistance: to reduce the build-up of hydrogen in the reactor
vessel and to reduce the amount of heat that needs to be removed by the emergency core
cooling system (ECCS) during a severe accident [29]. The oxidation reaction between
water and Zircaloy is exothermic, meaning it releases heat as it occurs and adds to the
decay heat produced by nuclear fuel during a reactor trip. At approximately 1200C, the
reaction becomes self-catalytic in steam environments and the rate at which heat is
released increases [30]. It is understood that even at much slower reaction rates, no
material can fully prevent oxidation and the build-up of hydrogen, but rather only provide
extra time for containing an accident before hydrogen levels and core temperatures
become dangerous.
PCIs can increase the likelihood of fuel rod cladding failure and therefore the
release of fission products. Therefore, it is desirable for an ATF cladding candidate to be
more likely than Zircaloy to either withstand PCIs or avoid them altogether. PCIs caused
by chemical reactions, referred to pellet-cladding or fuel-cladding chemical interactions
(PCCI or FCCI), between the fuel and cladding or fission products and the cladding often
lead to stress corrosion cracking. A common FCCI in LWRs is the reaction between
iodine and zirconium. The formation of ZrI4 from the reaction removes zirconium atoms
from the cladding in a process known as pitting. This reaction weakens the cladding and
increases the likelihood of failure from stress corrosion cracking [31]. PCIs occurring
from physical interaction between the pellet and cladding are referred to as pellet-
cladding mechanical interactions (PCMIs) and occur due to the different thermal
expansion rates of the fuel pellet and cladding, and the swelling of the fuel pellet over
time. PCMIs can lead to breaching of the fuel rod cladding and the release of fission
products into the reactor coolant [32]. The most limiting PCMI case occurs during a
reactivity-initiated accident (RIA), which is discussed in more detail in Section 2.3.2.
UO2 was originally selected as the fuel for LWRs because of its high melting
temperature, stability under irradiation, and relatively high U density [33]. However,
UO2 is also known to have a low thermal conductivity [34], which leads to higher fuel
13
centerline temperatures and stored energy in the fuel. Enhanced thermal conductivity
compared with UO2 is a desirable characteristic of an ATF because it increases heat
transfer from the fuel through the cladding and to the coolant. High thermal conductivity
also contributes to shallower temperature gradients across the fuel pellet radius. These
characteristics can improve the performance and safety of LWRs by reducing stored
energy in the fuel, reducing fission gas release [9], [10], [35], and enhancing short-term
accident tolerance [35]. Lower fuel temperatures may also reduce the likelihood of PCIs
[9], [10], [32] and makes power uprates possible in LWRs [10].
There are several characteristics and metrics of the Zircaloy/UO2 system that an
ATF material must match in order to have a minimal impact on the performance of an
LWR under normal operational conditions. For example, ATF materials should have
similar reactivity coefficients and cycle lengths as the Zircaloy/UO2 system. ATF
materials need to be backwards compatible with current LWR designs so that they can be
implemented in the current reactor fleet [3], [26]. Furthermore, ATF materials should
have a minimal impact on the nuclear fuel cycle [27]. By mitigating the impact to
performance and operations of a nuclear reactor while also enhancing safety, any
implemented ATF technology will be a significant upgrade to current LWR technology.
2.2 Current Concepts
Of the ATF technologies considered in this dissertation, several of them have
been heavily studied, while others are more unique. FeCrAl alloys, along with SiC/SiC,
and coated Zircaloy, are among the most common fuel rod cladding concepts [29].
SiC/SiC is also considered as a potential channel box material in BWRs [36] [17]. UN,
U3Si2, and fully ceramic microencapsulated (FCM) fuels are highly researched fuel
concepts due to their greater thermal conductivity compared to UO2 [9]. Two unique fuel
concepts discussed in this dissertation are the mixture of ThN and UN, and the inclusion
of non-fissile inserts in UO2. The motivation of studying these concepts is that UN
readily degrades in water, so mixing with another constituent may mitigate this issue
[37], and the inclusion of non-fissile inserts with high thermal conductivity in UO2 may
enhance heat transfer capabilities.
14
2.2.1 FeCrAl Cladding
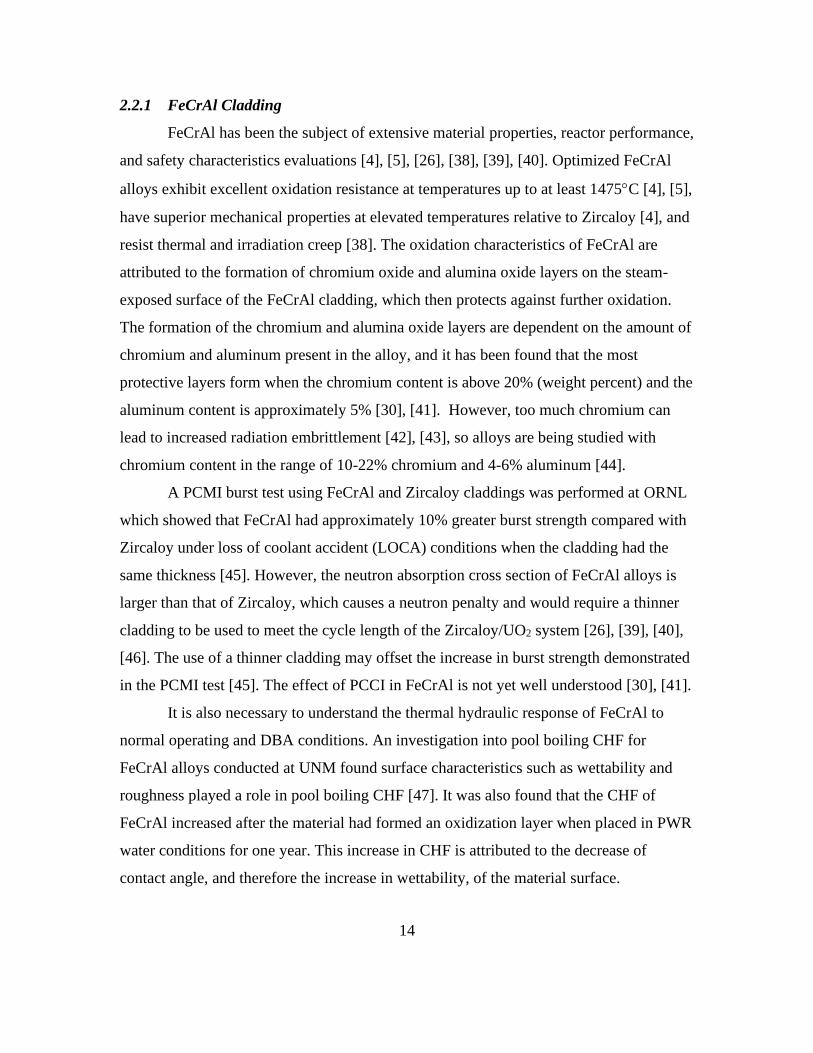
FeCrAl has been the subject of extensive material properties, reactor performance,
and safety characteristics evaluations [4], [5], [26], [38], [39], [40]. Optimized FeCrAl
alloys exhibit excellent oxidation resistance at temperatures up to at least 1475C [4], [5],
have superior mechanical properties at elevated temperatures relative to Zircaloy [4], and
resist thermal and irradiation creep [38]. The oxidation characteristics of FeCrAl are
attributed to the formation of chromium oxide and alumina oxide layers on the steam-
exposed surface of the FeCrAl cladding, which then protects against further oxidation.
The formation of the chromium and alumina oxide layers are dependent on the amount of
chromium and aluminum present in the alloy, and it has been found that the most
protective layers form when the chromium content is above 20% (weight percent) and the
aluminum content is approximately 5% [30], [41]. However, too much chromium can
lead to increased radiation embrittlement [42], [43], so alloys are being studied with
chromium content in the range of 10-22% chromium and 4-6% aluminum [44].
A PCMI burst test using FeCrAl and Zircaloy claddings was performed at ORNL
which showed that FeCrAl had approximately 10% greater burst strength compared with
Zircaloy under loss of coolant accident (LOCA) conditions when the cladding had the
same thickness [45]. However, the neutron absorption cross section of FeCrAl alloys is
larger than that of Zircaloy, which causes a neutron penalty and would require a thinner
cladding to be used to meet the cycle length of the Zircaloy/UO2 system [26], [39], [40],
[46]. The use of a thinner cladding may offset the increase in burst strength demonstrated
in the PCMI test [45]. The effect of PCCI in FeCrAl is not yet well understood [30], [41].
It is also necessary to understand the thermal hydraulic response of FeCrAl to
normal operating and DBA conditions. An investigation into pool boiling CHF for
FeCrAl alloys conducted at UNM found surface characteristics such as wettability and
roughness played a role in pool boiling CHF [47]. It was also found that the CHF of
FeCrAl increased after the material had formed an oxidization layer when placed in PWR
water conditions for one year. This increase in CHF is attributed to the decrease of
contact angle, and therefore the increase in wettability, of the material surface.
15
To determine if this pool boiling effect also occurred in flow boiling, a low-
pressure flow loop was developed at UNM for CHF testing [6]. The same test specimens
were used for multiple experiments so that the impact of an evolving surface structure on
CHF in flow boiling could be determined. After 10 steady-state experiments, the average
contact angle of FeCrAl decreased from the as-received contact angle of 69.43º to 53.64º.
The surface roughness also decreased after the steady-state experiments. Based on the
relationship between surface morphology and CHF found in the UNM pool boiling
experiments [47], it may be expected that the decrease in contact angle occurring after
multiple flow boiling experiments would lead to an increase in CHF. However, there was
no appreciable change in the steady-state CHF between each trial in the flow loop. After
an additional six transient experiments on the same FeCrAl specimen, the contact angle
was an average of 59.12º. Despite the contact angle changing throughout the tests, no
significant change in CHF occurred between each transient experiment with the average
CHF being 3371 kW/m2 with a standard deviation of 109 kW/m2 (3.23%).
The lack of appreciable change in flow boiling CHF due to increased surface
wettability served as the technical basis for the hypothesis that heat transfer coefficients
and material thermal properties, including thermal conductivity, k, and volumetric heat
capacity, Cp, thermal effusivity, 𝑒, and thermal diffusivity, , may have a significant
impact on CHF in flow boiling conditions. Further, the FeCrAl CHF values observed in
the flow boiling experiments were found to be 22% greater than the Zircaloy-4 CHF
values during steady state tests under the same conditions [6]. This observation gave
further reason to examine the influence of material properties on CHF.
2.2.2 SiC/SiC Cladding and Structural Material Concepts
Like FeCrAl, SiC/SiC composites are being considered as a cladding material due
to its high oxidation resistance up to at least 1200C (and potentially as high as 1700C)
[7], as well as its acceptable strength, low neutron absorption cross section, and resistance
to irradiation creep [48]. As a cladding material, however, SiC/SiC has been found to
present a number of challenges: SiC/SiC swells volumetrically under neutron irradiation
and deforms significantly [49], [50], SiC/SiC is more brittle than Zircaloy and may be

16
more likely to fail during a PCMI [50], the thermal conductivity of SiC/SiC decreases
when it is irradiated, and there is not currently a suitable manufacturing method for
sealing SiC/SiC fuel rods after the fuel has been loaded [51].
Due to the challenges faced when using SiC/SiC as a cladding material, it has
been proposed to use SiC/SiC as a channel box material in BWRs. Channel boxes
surround each fuel assembly in a BWR to provide structural support and contain the flow
of steam inside each fuel assembly. They make up approximately 40% of the Zircaloy in
a BWR core [48], so replacing the channel box material with SiC/SiC may provide
significant benefit in terms of reducing hydrogen production in the case of an accident.
Over the course of the fuel cycle, the high-dose environment of a nuclear reactor leads to
radiation degradation phenomena in the core materials [52]. Examples of radiation
degradation phenomena are void swelling, irradiation creep, volumetric swelling, and
radiation embrittlement, all of which are the result of the accumulation of point defects
from fast neutrons [52], [53]. A primary challenge associated with the SiC/SiC channel
box material concept is the effect of volumetric swelling under irradiation, which may
lead to significant deformation in non-uniform neutron flux environments [36], [17]. A
deformed channel box may come in contact with the cruciform control blades used in
BWRs, which are inserted between fuel assemblies, and impact operational or safety
performance.
The channel box that encloses each BWR fuel assembly provides structural
support, forms paths for cruciform control blades to be inserted between assemblies, and
maintains cooling in the active fuel regions of the core by preventing void drift to the
bypass region between assemblies [54]. Boiling of coolant in the core, axially and
radially heterogeneous fuel loading patterns, and control blade insertion all contribute to
nonuniform fast neutron flux gradients in the entire fuel assembly, including in the
channel box. The fast flux gradients contribute to channel box deformation because
different parts of the channel box will grow or swell at different rates, causing the
channel to bow. When Zircaloy is used as the channel box material, pressure differential
between the inside and outside of the channel box can cause irradiation creep and bulging
of the channel box [54]. This is not expected to be an issue for SiC-based channel boxes

17
because the material is resistant to irradiation to creep [48]. It is worth noting the
distinction between irradiation growth and irradiation swelling: irradiation growth is an
anisotropic process that conserves volume, while irradiation swelling is an isotropic
process that does not conserve volume. Zircaloy is more susceptible to irradiation growth,
while SiC/SiC is resistant to anisotropic growth but is susceptible to isotropic swelling.
Regardless of the mechanism, nonuniform growth or swelling rates in the channel box
lead to distortion.
There are two major implications that may result from channel box deformation.
First, channel box bowing can alter inter-assembly gap widths, which directly affects
neutron moderation and pin power distributions. A computational analysis of a
Westinghouse SVEA-96+ BWR fuel assembly showed that the change in gap sizes
resulting from a 9-mm channel bow led to a maximum change in the fission reaction rate
of 16% and a maximum change in the 238U parasitic capture rate of 6% [53]. While a 9-
mm bow is considered an upper-bounding case, this phenomenon may have an impact on
thermal safety margins, such as the critical power ratio (CPR).
The second major consequence resulting from channel box bowing is interference
with control blades. It is estimated that the clearance between a channel box and control
blade is between 2.4 and 3.3 mm, and potentially even less based on the tolerances of the
channel box and control blade wings [55]. Interaction between the channel box and
control blade can prevent the insertion of the control blade or may cause channel box
failure, both of which have adverse effects on reactor safety. The main strategy for
avoiding control blade interference is fuel assembly shuffling in such a manner that a fuel
assembly which has been exposed to a flux gradient in one direction is exposed to a flux
gradient in the opposite direction [53]. If interference is unable to be avoided, fully
inserting the control blade at the first indication of interference and shutting down the
control cell for the remainder of the cycle may be necessary, as was done at the LaSalle
Units 1 and 2 in 2007 and 2008 [56]. The effect of neutron flux gradients in the channel
box on deformation and the associated operational and safety ramifications serve as the
motivation behind the study of SiC/SiC channel boxes using multiphysics methods in this
dissertation.

18
2.2.3 Thorium-based Fuel Concepts
The use of thorium in a thermal reactor presents several unique advantages and
challenges compared to a traditional uranium-based fuel cycle. Thorium is approximately
three times more abundant than uranium in Earth’s crust [57], [58]. U-233, produced
from the absorption of a neutron by a 232Th nucleus and subsequent 𝛽-decays, yields a
greater reproduction factor, 𝜂, than 235U or 239Pu at thermal energies. This leads to better
fuel cycle performance in terms of conversion ratio, and it opens the possibility of
breeding or breakeven fuel cycles in a thermal reactor [57], [58], [59]. From a
nonproliferation standpoint, the addition of thorium in an LWR leads to less plutonium
production. The strong gamma emission from 232U makes 233U extraction a difficult
process and therefore may improve proliferation resistance [57], [60]. Additionally,
thorium-fueled reactors could be used to reduce the plutonium stockpile since thorium
systems initially require a neutron source to convert thorium into 233U [59], [60].
Another benefit that most directly relates to the interests of the ATF program is
that thorium-based fuels have a higher thermal conductivity than uranium-based fuels
[57]. It has been shown that the thermal conductivity of ThO2 is several times greater
than that of UO2 at low temperatures, but it approaches approximately the same value at
elevated temperatures (>1,200°C) [61], [62], thus limiting its potential as an ATF
material. Further, transmutation of thorium to protactinium and uranium will degrade
thermal conductivity during reactor operation [62], [63], [64], [65]. The thermal
conductivity of ThN has also been shown to be greater than that of UN, and both ThN
and UN have greater thermal conductivity than UO2 [63]. Although the thermal
conductivity of ThN decreases as temperature increases, it remains an order of magnitude
greater than the thermal conductivity of UO2 up to at least 1,500°C. Additionally, the
thermal conductivity of UN increases with increasing temperature. If it is assumed that
the thermal conductivity of a mixture is the volume-weighted average of the constituent
thermal conductivities, then mixing the two fuels will lead to a thermal conductivity that
is still an order of magnitude greater than that of UO2 over the temperature range of
interest for LWRs and up to at least 1,500°C.
19
Higher thermal conductivity of the fuel pellets leads to a larger thermal safety
margin in terms of the homologous temperature, which is the ratio of the maximum
temperature in the fuel (i.e., the fuel centerline temperature) to the melting point of the
fuel using the Kelvin scale. The melting or disassociation point (temperature where solid
mononitride transforms to liquid metal and gaseous nitrogen) of ThN and UN depends on
the nitrogen overpressure, but is approximately 2,800–2,850°C when approximately
atmospheric nitrogen pressure is available [66], [67], [68]. These temperatures are
comparable to that of UO2, which also melts at approximately 2,850°C [69]. Better
thermal conductivity in nitride-based fuel forms may potentially reduce fission product
release since the smaller temperature gradient in the fuel leads to smaller thermal stresses
and a decreased likelihood of fuel pellet cracking [70].
A thorium-based fuel form also presents several challenges, the primary one being
that thorium itself is not a fissile material and needs an external neutron source to convert
thorium into the fissile 233U. Uranium can act as the external neutron source, but the 235U
enrichment must be greater than the typical 5 wt% 235U limit [60]. However, high assay,
low-enriched uranium (HALEU) with enrichments greater than 5 but less than 20 wt%
235U/U may be used, although this will increase fuel cycle costs [60]. Production of 233U
from the 𝛽-decay of 233Pa, which is produced in the transmutation chain of 232Th and has
a half-life of 27 days, can cause an increase in reactivity after a reactor has been shut
down. Furthermore, the 232U gamma that makes thorium fuels proliferation resistant also
makes fuel refabrication difficult. Despite these challenges, thorium fuels have been used
in high-temperature gas-cooled reactors (HTGRs) and water reactors, and concepts exist
for their use in molten salt reactors (MSRs).
BIstructural- and TRIstructural-ISOtropic (BISO and TRISO) fuels using
UO2/ThO2 fuel particles coated in pyrolytic carbon and silicon carbide layers have been
used in the prototype HTGRs Peach Bottom 1 in the United States, AVR in Germany,
and Dragon in the United Kingdom. After successful experiments in these reactors,
thorium fuels were used in the Fort Saint Vrain and Thorium High Temperature Reactor
(THTR) experimental reactors in the United States and Germany, respectively [59], [71].
The successful Molten Salt Reactor Experiment (MSRE) at ORNL led to the
20
development of the Molten Salt Breeder Reactor (MSBR) project, which utilized a
thorium fuel cycle [72]. More recently, fast-spectrum, thorium-fueled MSR concepts are
being revisited [73].
Mixed UO2/ThO2 fuels were used in the Elk River and Indian Point LWRs [59],
and the Shippingport reactor made use of the seed-blanket concept [74] to demonstrate
breeding in an LWR. The seed-blanket concept, also known as the Radkowsy Thorium
Fuel (RTF) concept [75], uses fissile seed regions to initially fuel the reactor and to
supply neutrons to the blanket region of thorium, which is transmuted into 233U for
continued operation. LWRs with reduced moderation have been proposed, including
heavy water PWRs and tight-pitch BWRs, both of which have a smaller moderator-to-
fuel ratio and larger conversion ratio than typical LWRs, and they primarily operate in an
intermediate energy spectrum (1 eV to 100 keV). Pressurized heavy water reactors
(PHWRs) have been built in India, and several thorium-containing fuel bundles have
been loaded into the Kakrapar Atomic Power Station [76]. An advanced heavy water
reactor is currently under development in India [77], and several other nations, including
Turkey [78] and Canada [79], have taken interest in and have performed computational
studies on thorium fuels in heavy water reactors. Evaluations of these concepts show that
break-even or breeding can be achieved in these systems when seed-blanket concepts and
reduced moderator-to-fuel ratios are used [80], [81].
2.2.4 Non-fissile Inserts in UO2
A variety of UO2-based composite fuels have been developed with the primary
intention to increase heat transfer capabilities. Zhou and Zhou [9] have compiled a
comprehensive review of composite fuels containing UO2 and a non-fissile phase.
Several examples non-fissile phases that have been studied in the past include BeO, SiC,
carbon-based phases, Cr, and Mo. The driving motivation behind the use of these phases
is increasing the thermal conductivity of the fuel in an LWR, the benefits of which were
stated in Section 2.1.2. To summarize, higher thermal conductivity leads to lower
operating temperature, reduced energy storage, and shallower temperature gradients in
the fuel. These characteristics enhance short-term accident tolerance and fission product

21
release, while also lowering the probability of PCIs. However, replacing fuel volume
with a non-fissile material induces a neutronic penalty that likely must be compensated
for with increased 235U enrichment.
Though a number of potential high-thermal conductivity phases have been
investigated, the study in this dissertation focuses on metallic Mo insert structures with
the objective to quantify the impact of Mo inserts on PWR performance. Mo is focused
on because of its excellent thermal conductivity [82] [83], thermochemical compatibility
with UO2 [83], and resistance to swelling or other degradation under irradiation [84].
Also, Mo has a melting point of 2,623°C [11], which is comparable with the melting
point of fresh UO2 at 2,850°C [69]. Several studies have focused on the fabrication,
thermal conductivity, and potential improvement in LWR heat transfer performance of
UO2 that contains Mo, either as a structural insert or in a mixed form. Kim et al. [11]
fabricated UO2-Mo pellets by sintering mixtures of UO2 granules and Mo powder and
then demonstrated the ability to create a continuous channel of Mo microcells that had a
higher thermal conductivity than pure UO2. Finkeldei et al. [12] fabricated pellets of UO2
and Mo that did not contain a continuous network of Mo within the UO2, but instead
featured a dispersed network and still found increased thermal conductivity compared to
pure UO2. Buckley, et al. [83] also developed UO2-Mo fuel pellets by using spark plasma
sintering to radially disperse Mo throughout the pellet. Both studies developed UO2-Mo
fuel pellets with 5 and 10% Mo by volume and measured similar thermal conductivities
to each other. Medvedev and Mariani [10] used the BISON code [19] to evaluate the
thermal performance of Mo insert designs. In that study, a design that used alternating
50-µm thick Mo disks and 0.95-mm thick UO2 disks reduced the maximum fuel
temperature by 995°C compared with regular UO2 at a set linear heating rate of 500
W/cm.
Although its material properties and previous studies in the literature justify its
use as an insert material from a heat transfer standpoint, less attention has been given to
the effect of Mo inserts from a neutronic standpoint. Replacing fuel meat with a non-
fissile material will reduce achievable cycle length, and Mo has a large neutron capture
cross section in the resonance region, as shown by Brown et al [26]. There is currently a

22
gap in the understanding of how these inserts would impact neutronic performance and
safety characteristics. Further, the use of advanced additive manufacturing techniques
opens the doorway for a wide range of potential inserts to be fabricated. There is
currently little understanding on how to optimize the geometry of the insert to maximize
heat transfer and neutronic performance. The study of UO2 with Mo inserts in CHAPTER
6 aims to fill both of these knowledge gaps.
2.3 Review of Accident and Safety-Related Concepts
Several accident and safety-related concepts that are pertinent to the ATF
concepts studies in this dissertation are detailed in this section. Specifically, RTCs and
the RIA, a type of DBA, are discussed. CHF, a potential repercussion of an RIA, is also
discussed. RTC calculations are carried out for both the ThN-UN and UO2-Mo fuel forms
in CHAPTER 5 and CHAPTER 6, whereas RIAs and CHF are focused on in the analysis
of FeCrAl cladding in CHAPTER 3.
2.3.1 Reactivity Temperature Coefficients
RTCs are the basis for the mechanism of thermal feedback in which changes in
reactor conditions have an impact on the reactivity, and therefore the overall power level,
of the reactor. They are an important measure related to the safety of nuclear reactors
[85]. Temperature feedback is the first-order feedback mechanism in a nuclear reactor
[86], and temperature coefficients of reactivity are typically characterized for the fuel and
moderator in an LWR. Signified by 𝛼𝑇, RTCs describe the change in reactivity per
change in temperature. This is shown in Equation (2) for a generic material j, which
could denote fuel, moderator, or another core component. RTCs are typically required to
be negative so that an increase in temperature leads to a decrease in reactor power, giving
the reactor inherent stability. If the reactivity coefficient were positive, an increase in
temperature would lead to an increase in power, which would further increase the
temperature and lead to an unstable reactor.
𝛼𝑇,𝑗 =𝜕𝜌
𝜕𝑇𝑗 (2)
23
In nuclear fuel, the temperature feedback is dominated by the nuclear Doppler
effect, in which the width of cross section resonances in heavy nuclei broadens as
temperature increases [85]. The Doppler effect is quantified using the Doppler
coefficient, also known as the fuel temperature coefficient (FTC). This phenomenon
increases the likelihood of resonance absorption and thus leads to a decrease in reactivity.
In LWRs, the moderator temperature coefficient (MTC) takes into account
changes in reactivity due to temperature changes and density changes, since the density
of water is strongly dependent on its temperature. For water reactors, the change in
moderator density is the primary contributor to the MTC because as the density of the
water decreases, moderating ability is lost. The decrease in moderation leads to increased
resonance absorption and neutron leakage rates. MTCs are typically negative in LWRs,
although they become less negative with the addition of a chemical shim, such as soluble
boron, because the expansion of the water with an increase in temperature also expels
some of the chemical shim. The addition of too much chemical shim can make the MTC
positive in an LWR.
Other reactivity-related values of interest often calculated for LWRs are the
soluble boron coefficient (SBC) and control rod worth. The SBC, which is only relevant
for PWRs, is the ratio of the change of reactivity to the change in boron concentration,
often in units of ppm, in the coolant. The SBC is always negative because an increase in
boron concentration reduces the thermal utilization factor and decreases reactivity.
Control rod worth is equivalent to the change in the multiplication factor when the
control rod goes from fully withdrawn to fully inserted.
Control rod worths are useful for calculating the shutdown margin of a reactor,
which is defined to be the degree of subcriticality of the core when all control elements
are fully inserted. Two caveats to that definition are used for licensing reactors: the
shutdown margin must be calculated at ambient conditions, which is the most reactive
core state, and with the highest-worth rod in the fully withdrawn position [86]. This
definition provides an extra margin of safety when licensing reactors for operation.

24
2.3.2 Reactivity-Initiated Accidents and Critical Heat Flux
RIAs are a postulated accident scenario in an LWR that primarily takes the form
of a control rod ejection in a PWR or a control blade drop in a BWR. The rapid ejection
of a control rod inserts a large amount of positive reactivity in the core, which causes a
power excursion. The power excursion is turned around by the thermal feedback effect,
resulting in a wave-shaped power pulse that drastically increases core temperatures. RIAs
can be broken down into low-temperature and high-temperature phases [87]. A depiction
of the event in a PWR is provided in Figure 1 [88].
During the low-temperature phase, there is rapid energy deposition into the fuel
pellets but on a timescale small enough that heat has not yet transferred to the cladding.
Retention of heat in the fuel pellet causes rapid thermal expansion, and the pellet contacts
the cladding inner wall. This is the phase that causes PCMI because the fuel pellet
expands on a millisecond time scale and contacts the cladding [46]. The contact between
the fuel pellet and cladding induces stress in the cladding, which can deform or even
burst if the cladding is embrittled [87].
Brown et al. [46] studied RIAs in a PWR that used FeCrAl cladding with a
decreased thickness and increased fuel pellet diameter compared with the typical values
for Zircaloy and UO2. It was shown that the pulse width of the RIA power response is
narrower, the peak power is greater, and the energy deposition is similar compared with
the UO2-Zircaloy system. The total fuel pellet expansion is similar for the two cases
because expansion is a function of energy deposition, but the rate at which fuel expands
is greater for the FeCrAl cladding case because this is a function of pulse width and peak
power. A higher rate of fuel expansion can lead to a higher strain rate within the cladding,
which potentially increases the likelihood of a PCMI failure.
During the high-temperature phase of RIA, high cladding temperature caused by
the CHF being exceeded is the dominant cladding failure mechanism [89]. Bubble
crowding CHF, also referred to as departure from nucleate boiling (DNB), is the heat flux
at which a vapor blanket forms between the liquid flow and the heated surface, and
dryout CHF is the point at which the vapor void fraction of two-phase flow becomes so
large that the heated surface is no longer in contact with any liquid. In either case, the

25
Figure 1: Depiction of a control rod ejection and RIA in a PWR (reproduced from [88])

26
heat flux from the heated surface to the coolant is drastically reduced due to the poorer
heat transfer capabilities of single-phase vapor. The CHF mechanism associated with the
rapid increase in heat flux caused by an RIA in a PWR is DNB [90]. Equilibrium quality
of the coolant is quickly increased due to the heat flux ramp and forms the vapor blanket
that causes a dramatic reduction in heat flux. DNB is directly related to the thermal safety
margin of a PWR through the DNB ratio (DNBR). The DNBR is the ratio of the
predicted CHF to the actual heat flux in a fuel rod, as given by Equation (3).
𝐷𝑁𝐵𝑅 = 𝑞𝐶𝐻𝐹
"
𝑞𝑎𝑐𝑡𝑢𝑎𝑙"
(3)
This ratio is required to be above 1.0, as a DNBR below 1.0 indicates that the CHF has
been exceeded and a temperature excursion is expected that could lead to cladding
failure.
One of the most widely used methods to predict CHF is the Groeneveld look-up
table [91]. CHF is predicted from the look-up table using the local absolute pressure,
mass flux, and equilibrium quality of the system. The tables were developed using an
internal flow apparatus with stainless steel tubes, and the results were normalized to
provide CHF values for tubes with an 8-mm inner diameter. Eight correction factors can
be used to modify predicted CHF values based on geometry and various flow conditions.
The experiments conducted at UNM [6] were designed to be geometrically representative
of the Groeneveld experiments.
Despite the existence of the look-up table and other CHF prediction methods, it
continues to be difficult to accurately project the CHF and post-CHF temperatures during
transient events, which has warranted continued experimental work on the subject. Hohl
et al. performed steady-state and transient pool boiling experiments and showed that the
CHF was greater in the heating portion of transient experiments than in steady-state
experiments, and the CHF increased as the heating rate increased [92]. Those same
experiments showed that the CHF during transient cooling also varied with the cooling
rate, and a faster cooling rate led to a lower CHF. Multiple steady-state pool boiling
experiments have shown that the CHF under given conditions is the same for heating and
27
cooling processes [92], [93]. A large number of data have been produced that show a
hysteresis in the transient boiling curve between heating and cooling processes [94].
The differences between steady-state and transient CHF have been demonstrated
in experiments based on the RIA event. The PATRICIA Experimental Program at the
CEA in Grenoble, France performed steady-state and transient CHF experiments by
simulating an RIA using a single fuel rod and boundary conditions representative of a
PWR at hot zero power (HZP) [95]. The PATRICIA test facility is able to apply a half
sinewave power curve using the Joule effect with a Full Width at Half Maximum
(FWHM) pulse width of 30 ms, which is within the typical range of HZP RIA pulse
widths in PWRs of 25 to 65 ms [96]. The transient PATRICIA experiments produce a
cladding heating rate between 2,200 K/s and 4,900 K/s to the single rod assembly. The
cladding heating rate in a superprompt PWR RIA can vary, but is typically at least 1000
K/s [97], [98]. Between 201 J/g of cladding and 331 J/g of cladding was injected in each
PWR-relevant transient. It was shown that CHF measured during the RIA-like transients
was greater than that measured during steady-state experiments by as much as a factor of
2, although the initial conditions were different between the steady-state experiment and
some of the transient experiments. The transient runs that had similar boundary
conditions to the steady-state experiments had a CHF that was repeatedly 35.5% to
41.9% greater than the steady-state CHF. A similar effect was observed in the UNM
experiments, where the transient CHF was 23% greater than the steady-state CHF for
FeCrAl [6].
It has been postulated that greater CHF occurs during the heating phase of
transients because there is a larger temperature gradient near the heater surface that
promotes turbulent convective heat transfer [93]. Witte and Lienhard [94] believe the
hysteresis exists because in a heating process, the boiling regime moves from nucleate to
film, so the transition regime shows more properties of nucleate boiling and therefore
allows better heat transfer. During cooling, the boiling regime moves from film to
nucleate, so the transition regime shows more properties of film boiling, and therefore
has worse heat transfer. Although there are several theories as to why the enhancement of
28
CHF during a heating transient occurs, there is no correlation in existence that can
quantify this phenomenon.
2.4 Computational Modeling: Review of the State-of-the-Art
Numerous computer modeling tools exist for a wide variety of nuclear
applications ranging from radiological protection to severe accident modeling. In this
section, the focus will be on the current state-of-the-art in thermal hydraulics, reactor
physics, and multiphysics modeling that is used for regulatory licensing purposes.
Comparisons are made between tools used by the NRC and the next generation of
modeling tools that employ high-fidelity multiphysics methods to increase the accuracy
of reactor analyses. The advancement of computer modeling methods is vital to the
nuclear industry because more accurate predictions will enhance the safety, efficiency,
and economic competitiveness of nuclear power.
2.4.1 Computational Reactor Physics
The 3-D Boltzmann Transport Equation, given by Equation (4) for a fission
reactor, describes the movement of neutrons through a system.
1
𝑣
𝜕𝜓(𝑟, 𝐸, Ω̂, 𝑡)
𝜕𝑡+ Ω̂ ∙ ∇⃑⃑⃑𝜓(𝑟, 𝐸, Ω̂, 𝑡) + Σ𝑡𝜓(𝑟, 𝐸, Ω̂, 𝑡)
= ∫ 𝑑Ω̂4𝜋
∫ 𝑑𝐸′Σ𝑠(𝐸′ → 𝐸, Ω̂′ → Ω̂)𝜓(𝑟, 𝐸, Ω̂, 𝑡)∞
0
+𝜒(𝐸)
4𝜋𝑘 ∫ 𝑑Ω̂
4𝜋
∫ 𝑑𝐸′𝜈(𝐸′)Σ𝑓(𝐸′)∞
0
𝜓(𝑟, 𝐸, Ω̂, 𝑡)
(4)
The first term on the left-hand side of Equation (4) denotes the time rate of change of the
angular flux (𝜓), which is a function of the phase space defined by position (𝑟), energy
(𝐸), angular direction (Ω̂), and time (𝑡), multiplied by the inverse neutron velocity (1𝑣⁄ ).
The next two terms on the left-hand side of Equation (4) describe neutron losses from the
system due to leakage and nuclear reactions, respectively. The nuclear reactions include
neutron absorption and neutron scattering out of the phase space of interest, the
probability of which is denoted by the macroscopic total cross section (Σ𝑡). Neutrons
coming into the system are described by the two terms on the right-hand side of Equation

29
(4). The first term on the right-hand side of the equation describes neutrons that are being
scattered into the phase space of interest and takes into account the macroscopic
scattering cross section (Σ𝑠). The final term describes the production of neutrons in the
system from fission reactions, where 𝜒(𝐸) is the fission neutron energy probability
density function, 𝜈 is the number of neutrons produced per fission, 𝑘 is the neutron
multiplication factor, and Σ𝑓 is the macroscopic fission cross section.
Several approximations to the 3-D Boltzmann transport equation have been made
to reduce complexity and make the equation more readily solvable. The primary
approximation is the diffusion equation, in which isotropic fission and scattering sources
are assumed, the angular dependence of the neutron flux is assumed to be negligible, and
Fick’s Law is used. In the context of reactor physics, Fick’s Law states that the current of
neutrons, 𝐽, will diffuse through the system based on the negative gradient of neutron flux
times the diffusion coefficient, D. The diffusion equation is often solved with a multi-
group approach, where a “group” refers to each interval in a discretized energy mesh. The
steady-state multi-group diffusion equation is given by Equation (5).
−∇⃑⃑⃑ ∙ 𝐷𝑔 ∇⃑⃑⃑𝜙𝑔 + Σ𝑅,𝑔𝜙𝑔 = ∑ Σ𝑠,𝑔′𝑔𝜙𝑔′
𝑔−1
𝑔′=1
+1
𝑘𝜒𝑔 ∑ 𝜈𝑔′
𝐺
𝑔′=1
Σ𝑓,𝑔′𝜙𝑔′ (5)
In Equation (5), the subscript g indicates a group number, where G is the total number of
groups. Traditionally, group 1 indicates the highest energy group, and the energy
decreases as the group number increases. Σ𝑅 indicates the removal cross section, which is
the probability of neutron removal from the system through absorption or scattering. The
two terms on the right-hand side of Equation (5) describe scattering into the group of
interest and neutrons produced by fission into the group of interest, respectively.
Acquiring solutions to the Boltzmann transport or diffusion equations typically
requires the use of computational numerical methods, which can be broken down into
stochastic or deterministic methods. Monte Carlo is a widely-used stochastic solution
method where probability density functions are used to track neutrons and the various
possible nuclear reactions. Results from Monte Carlo calculations have an associated
30
uncertainty, which can be reduced by simulating additional neutron histories and the
implementation of variance reduction techniques. The advantages of Monte Carlo are that
no approximations need to be made for the problem geometry or the energy dependence
of nuclear cross sections. However, the number of neutron histories that must be
simulated in order to achieve acceptable uncertainties for complex systems often results
in substantial computational cost.
The large cost of Monte Carlo calculations has led to deterministic methods being
the preferred numerical method for large-scale reactor physics calculations [99].
Although deterministic methods are able to save on computational cost, they require that
the space, energy, and angular domains be discretized into a mesh, which introduces
discretization error. There is a trade-off between fine meshes, which reduce discretization
error, and coarser meshes, which reduce computational cost. Even when solving the
diffusion equation, in which the angular dependence has been integrated out, fine spatial
mesh and energy group structures that incur significant computational cost may be
required to obtain accurate solutions. This is a challenge especially for full-core
calculations in which hundreds of fuel assemblies containing thousands of fuel rods are
modeled. The length scale varies from under a cm for a single fuel rod diameter to ~15-
20 cm for the side of a fuel assembly to several meters for the diameter of the core. This
challenge is further exacerbated by the influence of other physical phenomena, such as
thermal hydraulics and mechanics, which have motivated the coupling of multiple
modeling tools together that will iteratively pass information back and forth to obtain a
single solution. The following sections describe the various procedures that have been
developed to address the challenge of accurate computer modeling across various
physical scales and phenomena.
2.4.2 The Current Paradigm
Current regulatory practice is to use a two-step approach to perform full-core
modeling [100]. The first step is to model single fuel rods, also known as pin-cells, and
fuel assemblies using a lattice physics code and 1-D or 2-D transport methods. A fine
spatial mesh and up to a few hundred energy groups are used to accurately predict the

31
neutron flux, reaction rates, and macroscopic cross sections in these relatively small
models with infinite boundary conditions. These values are spatially averaged over each
material, which includes the fuel, cladding, and moderator in a pin-cell model and may
include control blades, channel boxes, or other core structural materials in a fuel
assembly model. Then, these cross sections are homogenized, or collapsed, to a few-
group structure using Equation (6).
⟨Σ𝑔⟩ =∫ Σ(𝐸)�̃�(𝐸)
𝐸𝑔−1
𝐸𝑔𝑑𝐸
∫ �̃�(𝐸)𝐸𝑔−1
𝐸𝑔𝑑𝐸
(6)
In Equation (6), Σ(𝐸) represents a generic macroscopic cross section and ⟨Σ𝑔⟩
represents the group-collapsed cross section to be used in full-core calculations. Equation
(6) preserves the total reaction rates in the system by using a weighting function to
average the cross section over a range of energies. �̃�(𝐸) is used as the weighting
function, and is the neutron flux calculated from the lattice physics calculations in the
pin-cell and fuel assembly models. The use of the neutron flux from lattice physics
calculations as a weighting function for collapsing cross sections is a good estimate of the
flux in a larger system due to the regularity of LWRs in which fuel rods are arranged in
square lattices and assemblies are loaded in a repetitive pattern.
Oftentimes, more than 200 energy groups are used for lattice physics calculations,
and the resulting cross sections are collapsed down to two energy groups. Lattice physics
calculations are typically performed for a variety of potential reactor conditions and
configurations. These different conditions, known as branches, account for a range of fuel
and moderator temperatures, as well as different control rod/blade configurations. Boron
concentration is also considered for PWRs, and the void fraction of the two-phase flow is
also considered for BWRs. Additionally, lattice physics depletion calculations may be
performed to account for changes in cross sections as a function of burnup. All of the
resulting collapsed cross sections are organized into a table or other computer-readable
format to be used by a diffusion code for full-core calculations. For regulatory activities,
the NRC uses the Standardized Computer Analyses for Licensing Evaluation (SCALE)
code system [101] developed at ORNL for lattice physics calculations and generating
32
cross sections. The primary reactor kinetics tool used by the NRC is the Purdue
Advanced Reactor Core Simulator (PARCS) [102], which is 3-D nodal diffusion code.
Following the traditional procedure for core analysis, the SCALE framework is
used to generate cross sections from highly-discretized pin-cell and assembly models at
numerous reactor configurations. SCALE is a framework that employs a number of
codes, including the Transport Rigor Implemented with Time-Dependent Operation for
Neutronic depletion (TRITON) control module, which can automatically execute a series
of codes to perform lattice physics calculations. At the heart of TRITON is the Monte
Carlo code KENO and the discrete ordinates code NEWT (New ESC-Based Weighting
Transport, where ESC is Extended Step Characteristic), both of which can be used to
perform lattice physics calculations and generate few-group cross sections. In addition to
KENO and NEWT, the SCALE package also contains the Oak Ridge Isotope Generation
(ORIGEN) code, which can be used with the lattice physics codes to perform depletion
calculations. The general modeling process is to use TRITON to perform lattice physics
calculations using highly-detailed but relatively simple models of fuel assembly lattices
and a fine energy mesh structure containing 238 groups. Few-group cross sections (often
just two-group) are collapsed from the resulting macroscopic cross sections for a variety
of reactor conditions as a function of burnup. The few-group cross sections are then
reorganized into a format that is readable by the nodal diffusion code, which for PARCS
is the Purdue Macroscopic XS (cross section) Set (PMAXS) format [103].
PARCS reads the PMAXS file to perform diffusion calculations in 3-D. PARCS
is able to solve the time-dependent neutron diffusion equation using few-group cross
sections, making it a useful tool for analyzing accidents, such as RIAs. To increase the
accuracy of reactor physics calculations, PARCS has been coupled to a variety of thermal
hydraulics analysis tools in order to account for thermal feedback. The TRAC/RELAP
Advanced Computational Engine (TRACE) [104] is a best-estimate reactor systems code
with 1-D and 3-D modeling capabilities and is the primary thermal hydraulics code used
by the NRC. TRACE is the culmination of development efforts to combine modeling
features from the NRC legacy codes TRAC-P, TRAC-B, RAMONA, and the NRC
version of the Reactor Excursion and Leak Analysis program (RELAP5) and is used to

33
analyze large and small break LOCAs and other reactor transients in LWRs. TRACE is
able to be directly coupled to PARCS to provide thermal hydraulic feedback to update
cross section data.
Another thermal hydraulics tool used by the NRC is PATHS [105], which is
specifically used for coupling with PARCS to perform full-core, steady-state depletion
calculations for BWRs. PATHS uses several simplifying assumptions, including the use
of three differential equations for two-phase flow and an algebraic void-quality equation,
in contrast to the six-differential-equation set used by TRACE for the void drift model.
PATHS is also capable of simultaneously solving the velocity and pressure field
equations [106]. These assumptions and capabilities result in fast run times compared to
TRACE, which is useful in full-core analysis of BWRs because each of the more than
700 fuel assemblies in a typical BWR core must be modeled separately for accurate
results.
This algorithm for performing full-core calculations typically results in solutions
that provide one radial node per fuel assembly. For example, a model of the Edwin I.
Hatch Unit 1 reactor was developed by Yarsky et al. [107]. Each of the reactor’s 560 fuel
assemblies were modeled using one radial node and 24 axial nodes. This nodalization
scheme results in the calculated parameters, such as fuel temperature, cladding
temperature, and coolant properties, being radially averaged over the array of fuel rods in
each fuel assembly. In other words, modeling tools currently used for licensing purposes
produce outputs on a fuel assembly scale and do not provide information for individual
fuel rods. Although this method has relatively low computational cost, full-core
calculations are often conservative and are unable to capture localized phenomena that
may have reactor performance or safety implications [108].
2.4.3 Advanced Computational Methods
The continuous advancement of computational capabilities has led to the
development of modeling tools that improve upon the current methods used for
regulatory purposes in the nuclear industry. The heterogeneous nature of nuclear systems
has demanded that modeling tools have high-fidelity multiphysics capabilities that can
34
capture localized phenomena on the fuel rod scale, rather than on the fuel assembly scale.
Examples of local phenomena that may impact reactor performance and safety are grid-
to-rod fretting, PCIs, DNB, and the impact of Chalk River Unidentified Deposits
(CRUD), including CRUD-induced power shifts (CIPS), and CRUD-induced localized
corrosion (CILC) [52]. Further, it has become desirable for these capabilities to be
contained within a single framework or environment [109]. Two examples of these
multiphysics packages developed by the DOE are the Multiphysics Object Oriented
Simulation Environment (MOOSE) framework [110], and CASL VERA. Both MOOSE
and VERA have subsidiary codes that have been integrated into the Nuclear Energy
Advanced Modeling and Simulation (NEAMS) [111].
The MOOSE framework includes over 30 modules for modeling a wide variety of
nuclear and non-nuclear systems. Some of the more commonly used tools within
MOOSE are BISON, MARMOT, and Rattlesnake. BISON is a finite elements code that
couples heat transfer, fuel mechanics, and species diffusion equations and is primarily
used for fuel performance analysis [110], [19]. MARMOT is also a finite elements code
but is used to predict microstructure evolution phenomena, such as void formation, grain
boundary migration, and thermal conductivity evolution [112]. The code is often coupled
to BISON, and an example of this was performed by Gaston et al. [113], who used
BISON to predict fuel temperatures and fission rates in a PWR and passed that
information to MARMOT, which would then determine the change in thermal
conductivity as a function of burnup. The main radiation transport tool within the
MOOSE framework is Rattlesnake [114] and is often used with BISON and RELAP-7
[115], the next generation thermal hydraulics system safety analysis code in the RELAP
series, in a coupling scheme referred to as MAMMOTH [116].
VERA contains a number of subsidiary codes to perform coupled neutronics,
thermal hydraulics, fuel performance, and chemistry analyses [117], [118]. The driving
tool in VERA is MPACT, a full-core neutronics code that uses a 2-D/1-D Method of
Characteristics (MOC) algorithm [119] [100]. This algorithm uses a 2-D approximation
to the 3-D Boltzmann transport equation in the radial direction and a 1-D approximation
in the axial direction. These approximations are suitable because heterogeneity in LWRs

35
occurs primarily in the radial direction. MOC is used to solve the partial differential
equations in the 2-D/1-D transport approximations. Cross section libraries ranging from
about 50 to 252 energy groups have been developed and optimized for MPACT [120],
allowing MPACT to perform its own lattice physics calculations. A coarse-mesh finite-
difference (CMFD) acceleration scheme [119] is used to spatially average the flux and
cross sections from the finer MOC calculations over each fuel rod. CMFD accelerates the
convergence of the problem and provides stability, but still provides solutions on a pin-
resolved scale. This methodology provides higher-order and higher-fidelity solutions
compared to the two-step method currently used in the nuclear community, although
laboratory or industry-scale computer clusters are needed for full-core calculations.
The primary thermal hydraulics tool in VERA is CTF [121], a sub-channel tool
that derives from the Coolant Boiling in Rod Arrays – Two Fluid (COBRA-TF) line of
codes that were originally developed at the Pacific Northwest National Laboratory and
later at Pennsylvania State University, North Carolina State University, and ORNL. CTF
considers three separate fluid fields (liquid film, liquid droplets, and vapor) that each
have their own set of conservation equations and is capable of modeling crossflow
between coolant channels due to pressure differences, turbulent mixing, and void drift.
CTF calculates temperature distributions in each fuel rod and sub-channel, which is the
coolant flow path between each fuel rod. Coupling between MPACT and CTF is often
performed in VERA so that temperatures and densities calculated by CTF are used to
update the cross section data used by MPACT to calculate flux and power distributions.
Several components of the SCALE system are used in VERA, most specifically the
isotopic depletion capabilities of ORIGEN. VERA leverages the MOOSE framework for
fuel performance modeling and uses a version of the BISON, while the CRUD chemistry
code MAMBA [122] is used to determine the change in thermal resistances due to CRUD
build-up, which can lead to CIPS and CILC in nuclear reactors.
The high-fidelity multiphysics methods employed by environments like MOOSE
and VERA are on the forefront of computational nuclear modeling and provide numerous
benefits over the previous generation of nuclear modeling codes by capturing the various
physical phenomena at play. The development of these systems is vital to improving the

36
safety, efficiency, and economic competitiveness of nuclear power since they are more
accurate and better able to predict localized phenomena that may have operational or
safety-related consequences [118]. The evaluation of ATF candidates further motivates
the use of these novel computational tools, since their advanced features allow them to
solve complex problems that the legacy tools cannot.
The multiphysics capabilities of VERA are leveraged for several of the ATF
studies in this dissertation. VERA has previously been validated for PWR analysis [123],
[124], and is used to study the reactor performance and safety characteristics of ThN-UN
and UO2-Mo fuel concepts in PWRs in CHAPTER 5 and CHAPTER 6, respectively.
However, application of VERA to BWR analysis is under development, and this
capability has not yet been fully validated against experimental data [125]. An initial
assessment of VERA’s capability to perform BWR analysis is provided in CHAPTER 4.
This assessment is performed by comparing results from models of fuel assemblies from
the Peach Bottom Unit 2 reactor developed in VERA and PARCS/PATHS for a select set
of progression problems. This set of progression problems is a novel contribution to the
literature.
37
CHAPTER 3
THERMAL HYDRAULIC EVALUATION OF FECRAL CLADDING
3.1 Background
FeCrAl alloys are considered an ATF candidate for the reasons highlighted in
Section 2.2.1: they exhibit excellent oxidation resistance and superior mechanical
strength in comparison to Zircaloy at elevated temperatures [4], [5]. Pool and flow
boiling experiments conducted at UNM have shown that FeCrAl may also have enhanced
CHF properties compared with Zircaloy [6], [47]. This is a favorable characteristic that
may increase the thermal safety margin in an LWR during normal operating and accident
conditions. This work provides an early thermal hydraulic evaluation of FeCrAl cladding
by comparing data from flow boiling CHF experiments conducted at UNM to results
from computer models of those experiments developed in the DOE version of RELAP5-
3D [126] and the CASL version of CTF. There are three main objectives of this work:
1. To compare best-estimate predictions from widely-used system and sub-channel
analysis codes to a simple, well-understood CHF test for an ATF material where
test repeatability has been demonstrated.
2. To enhance understanding of the sensitivity of these models to the shape of the
boiling curve and the thermophysical properties of the test section.
3. To demonstrate an approach to optimize CHF and post-CHF model predictions in
these system and sub-channel analysis codes while highlighting differences
between how CHF is modeled and what occurs in reality using a single test. It is
noted that the best application of this approach would be to apply it to a large
dataset consisting of a significant number of tests.
Objectives 2 and 3 both consider three key figures of merit (FoMs) for the model
predictions: (1) maximum heat flux (MHF, which is the same as critical heat flux in the
system and subchannel analysis codes), (2) integral heat flux (an analog to the energy
deposition), and (3) the peak test section temperature (an analog to peak temperature of
the cladding in a reactor).

38
The flow boiling test loop at UNM was used to perform transient and steady-state
tests on various materials, including FeCrAl [6]. The purpose of the test loop is to
determine the CHF and post-CHF response of different materials under a variety of
conditions. This work focuses on the experimental results from tests using power
transients representative of those that occur during an RIA applied to test sections made
of Inconel 600, Stainless Steel 316 (SS316), and Fe-13Cr-6Al (13% Cr and 6% Al
content by weight) and compares them to models of the experiment built in RELAP5-3D
and CTF. The power transients performed in the experiment are RIA-like because of their
half sinewave shape and pulse width [26], [46]. The approximately 1-second pulse width
used in the experiment is longer than the typical superprompt RIA pulse width of 25 to 65
ms and is more similar to the pulse width of a subprompt RIA in a PWR at hot full power
(HFP), which can range from 0.4 to 4.5 seconds [96]. The wider pulse width of the power
transients performed at UNM leads to a cladding heating rate of 685 K/s, which is below
the expected cladding heating rate for a superprompt RIA at HZP of 1000 K/s or more
[97], [98].
Because the UNM experiments showed no appreciable change in flow boiling
CHF due to increased surface wettability, it is hypothesized that heat transfer coefficients
and material thermal properties, including thermal conductivity, k, and volumetric heat
capacity, Cp, thermal effusivity, 𝑒, and thermal diffusivity, , may have a greater impact
on CHF in flow boiling conditions. The work in this chapter describes two sensitivity
studies in which the impact of heat transfer coefficients and material thermal properties
on CHF and peak test section temperature, which is analogous to the PCT in a nuclear
reactor, were determined. FeCrAl was the only material considered in the sensitivity
studies. Sensitivity analysis can be a useful step in understanding complex phenomena,
such as CHF, and can reduce costs by informing experimental designs and reducing
conservatism in new fuel and cladding designs [127], [128]. Liu et al. [89] performed a
sensitivity study using a RELAP5-3D model of the Three Mile Island Unit 2 reactor in
which multipliers on heat transfer coefficients and the predicted CHF were varied from
0.7 to 1.3 during an RIA transient. They found that the PCT was sensitive to the film
boiling heat transfer coefficient and CHF multipliers. The sensitivity of CHF to the

39
multipliers was not investigated, and the study did not include material heat transfer
properties. Chen et al. [129] also showed that PCT was sensitive to the film boiling and
CHF multipliers using a one-eighth PWR core model in COBRA-EN, but additionally
showed a dependence of PCT upon the nucleate boiling heat transfer coefficient
multiplier. Several fuel pellet and cladding material combinations were investigated by
Chen et al. [129], and it was shown that PCT and the fuel centerline temperature was
sensitive to the materials, and therefore the material properties, used.
Using the uncertainty quantification tool Risk Analysis and Virtual Environment
(RAVEN) [130] coupled to the RELAP5-3D model of the UNM test facility, two
sensitivity studies were conducted. The first study varied heat transfer coefficient and
CHF multipliers, and the second study varied thermal conductivity and volumetric heat
capacity to determine the sensitivity of CHF and PCT to these parameters, as well as to
thermal effusivity and thermal diffusivity, which are calculated using the sampled k and
Cp values. The parameter space for each input was chosen based upon experimental
data, uncertainties of material properties, and error values within certain heat transfer
correlations.
3.2 Experiment and Computer Model Descriptions
3.2.1 Experiment Setup
An in-depth description of the UNM flow boiling apparatus is given by Lee, et al. [6].
The test facility, shown in Figure 2, consists of a tank for steam separation, chiller and
cooler condensing system, pump, heater, a section to install a 50.8-cm test specimen, as
well as various instrumentation to measure coolant temperature, pressure, and mass flow.
Water flows internally throughout the system with an uncertainty in flow velocity of
2% and inlet temperature uncertainty of 0.2 C [6]. The test sections were thermally
insulated on the outside surface. A DC power supply was used to apply voltage through
copper terminals to the heated length of the test specimens, which were located 25.4 cm
up the specimens’ lengths to ensure flow was fully developed before being heated. In the
transient experiments, a K-type thermocouple was used to measure the temperature of the
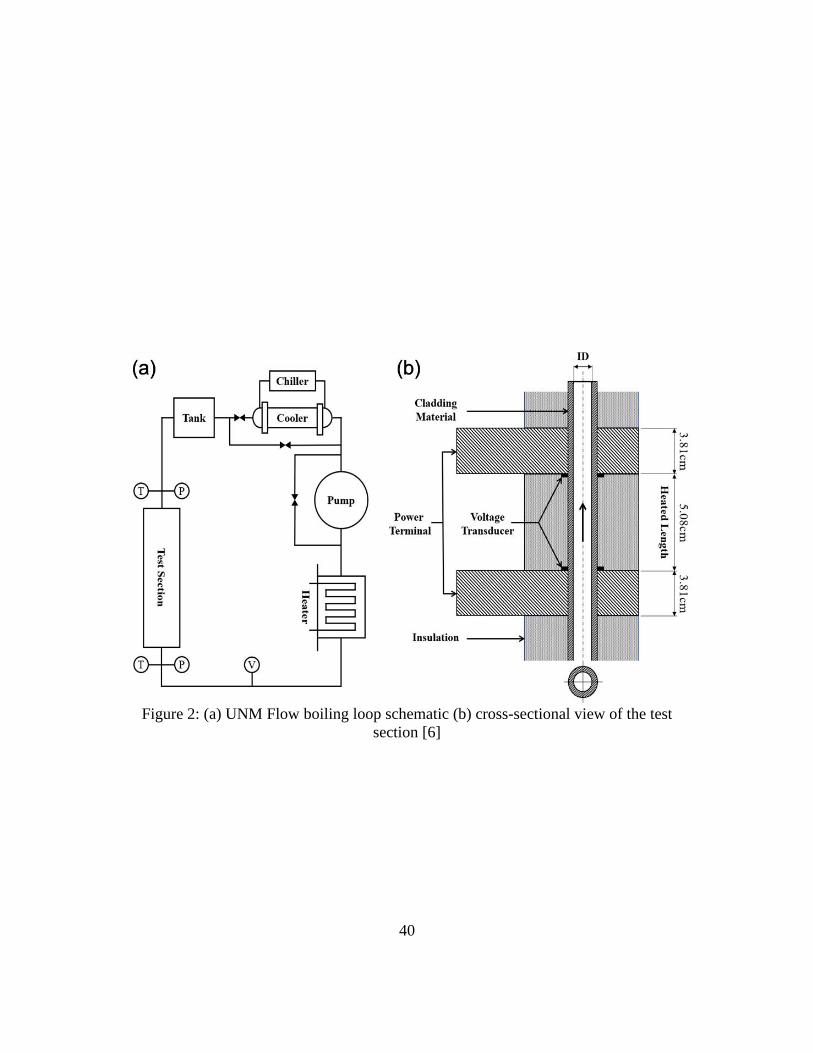
40
Figure 2: (a) UNM Flow boiling loop schematic (b) cross-sectional view of the test
section [6]
41
tubes’ outer surfaces and was located at the axial center of the heated lengths. In the
steady-state experiments, the thermocouple was located near the top of the heated length.
The thermocouples were attached to the test sections using ~3-mm thick high-
temperature silica tape. To prevent electrical interference between the current and voltage
applied to the test specimen and the thermocouple, the outer surface of each specimen
was coated with a less than 0.5-mm thick layer of silicon. Thermocouple wires were
ungrounded, unsheathed, and 0.05 mm in diameter, so thermal lag and the fin effect were
assumed to be negligible. A 50 Hz response rate was used to prevent response error from
thermal mass. Uncertainty of the temperature measurements under constant flow and zero
power is ± 0.1ºC, and is expected to remain small at the temperatures at which DNB was
recorded.
Heat flux through the tubes and the tube inner surface temperature was calculated
using the measured surface temperature, measured voltage drop across the heated length,
and measured current through the copper terminals to solve the transient conduction
equation with an implicit finite difference method. CHF was determined in the
experiments by finding the point at which the outside surface temperature rate of change
with respect to time dramatically increased, indicating the formation of a vapor layer and
the start of the post-CHF temperature excursion.
Specific experiments were conducted to quantify the impact of the thermocouple
location on the potential uncertainty in CHF prediction. Measurements were performed
with transient power pulses using 5 different thermocouples arranged axially at 5 mm
intervals from the top to the center of the test section. The experiment results indicated
less than 3.3% difference between values at different test section locations [6]. In
addition, multiple measurements of CHF were made with multiple samples to ensure the
repeatability of the experiments. For FeCrAl, 10 measurements were made with one
sample and 3 measurements were made with an independent sample. The average of the
measurements was 2,736 kW/m2 with a standard deviation of 213 kW/m2,
approximately 8%. The transient experiments analyzed in this paper used Inconel 600,
SS316, and FeCrAl alloy as the test section materials. Table 1 lists the experimental
parameters for each material.

42
Table 1: Experimental parameters for all materials
Inconel 600 SS316 FeCrAl
Inner Diameter (cm) 0.8509 0.8763 0.8763
Outer Diameter (cm) 0.9525 0.9525 0.9525
Total Length (cm) 50.8 50.8 50.8
Entrance Length (cm) 25.4 25.4 25.4
Heated Length (cm) 5.08 10.16 5.08
Peak Power (kW) 2.5 8.8 8.1
Pressure (absolute, kPa) 84 84 84
Mass Flux (kg/m2-s) 300 300 300
Inlet Equilibrium Quality -0.0089 -0.0827 -0.0089
Inlet Coolant Temperature (C) 90 50 90
Degree of Subcooling (C) 4.8 44.8 4.8
43
3.2.2 CTF and RELAP5-3D Model Descriptions
The RELAP5-3D model is comprised of a time-dependent inlet volume connected
to a vertical pipe using a time-dependent junction, which is then connected to a sink time-
-dependent volume using a single junction. A heat structure is attached to the pipe to
provide the power transient. A nodalization diagram of the RELAP5 model is shown in
Figure 3. The tube dimensions listed in Table 1 were replicated in the models. Only the
heated lengths of the test sections were modeled in RELAP5-3D because the heat transfer
packages within the codes always assume fully developed, steady flow [126]. CTF does
not assume fully developed flow, so the full 50.8 cm of the test sections were modeled as
a tube with a single, internal sub-channel. The test sections were thermally insulated on
the outer surface in both RELAP5-3D and CTF. Mesh and time sensitivity studies were
performed in both computational tools to ensure the models were stable. Models with up
to 100 axial nodes were tested, and it was found that 50 axial nodes were sufficient for
model stability in both RELAP5 and CTF. The heat structure in RELAP5 also had 50
nodes. In RELAP5-3D, a minimum timestep of 1x10⁻⁸ seconds was used, and in CTF, a
minimum timestep of 1x10⁻⁶ seconds was found to be sufficient. Both RELAP and CTF
automatically ensure that the maximum timestep used is below the Courant limit, and in
practice, neither code used a timestep larger than 5x10⁻⁵ seconds for any model. UNM
provided the transient power pulse data, which was applied to the appropriate nodes in
each model. The pressure, mass flux, and temperature of the coolant listed in Table 1
were used as boundary conditions in the models. The Groeneveld look-up table was used
as the CHF prediction method in all models, and all results presented are from the axial
center of the heated length to match the experiment.
3.3 Results
3.3.1 UNM Experimental Results
The heat flux and surface temperature results from the experiments conducted at
UNM are shown in Figure 4 for Inconel, SS316, and FeCrAl. Input power converted to
MW/m2 is also shown in Figure 4. CHF was reached in all cases, which is indicated by

44
Figure 3: Nodalization diagram of RELAP5-3D model
Figure 4: Experimental results for (a) Inconel, (b) SS316 and (c) FeCrAl
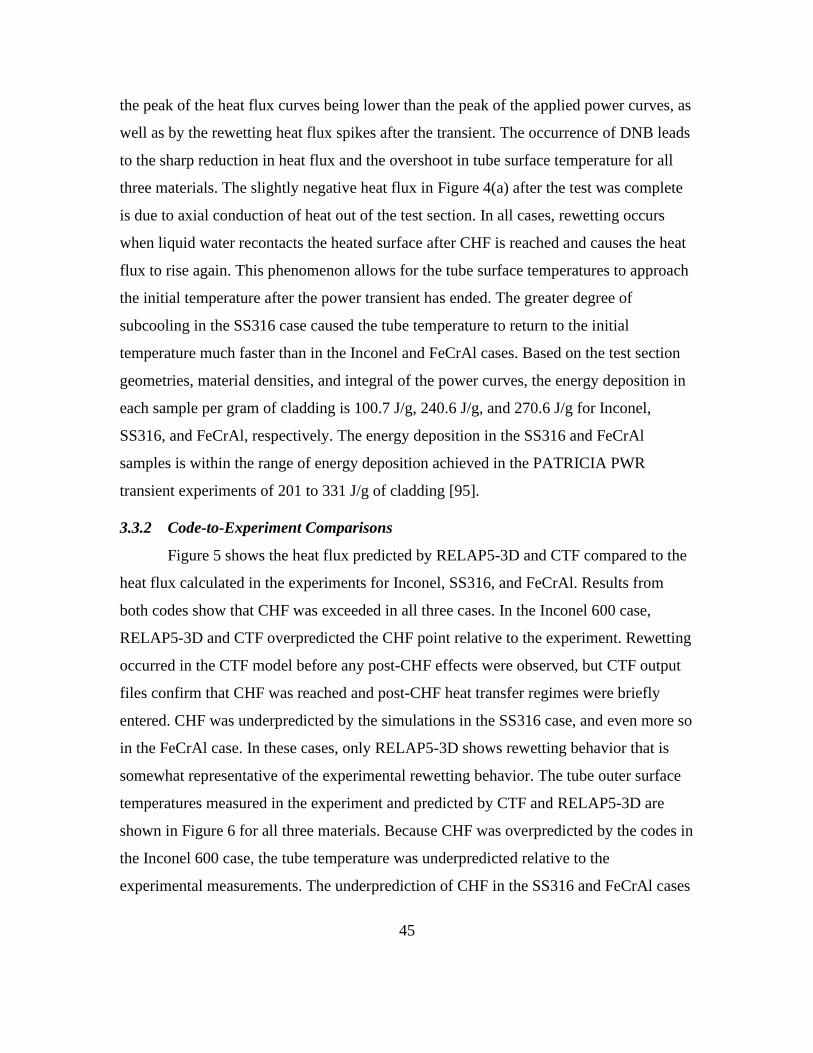
45
the peak of the heat flux curves being lower than the peak of the applied power curves, as
well as by the rewetting heat flux spikes after the transient. The occurrence of DNB leads
to the sharp reduction in heat flux and the overshoot in tube surface temperature for all
three materials. The slightly negative heat flux in Figure 4(a) after the test was complete
is due to axial conduction of heat out of the test section. In all cases, rewetting occurs
when liquid water recontacts the heated surface after CHF is reached and causes the heat
flux to rise again. This phenomenon allows for the tube surface temperatures to approach
the initial temperature after the power transient has ended. The greater degree of
subcooling in the SS316 case caused the tube temperature to return to the initial
temperature much faster than in the Inconel and FeCrAl cases. Based on the test section
geometries, material densities, and integral of the power curves, the energy deposition in
each sample per gram of cladding is 100.7 J/g, 240.6 J/g, and 270.6 J/g for Inconel,
SS316, and FeCrAl, respectively. The energy deposition in the SS316 and FeCrAl
samples is within the range of energy deposition achieved in the PATRICIA PWR
transient experiments of 201 to 331 J/g of cladding [95].
3.3.2 Code-to-Experiment Comparisons
Figure 5 shows the heat flux predicted by RELAP5-3D and CTF compared to the
heat flux calculated in the experiments for Inconel, SS316, and FeCrAl. Results from
both codes show that CHF was exceeded in all three cases. In the Inconel 600 case,
RELAP5-3D and CTF overpredicted the CHF point relative to the experiment. Rewetting
occurred in the CTF model before any post-CHF effects were observed, but CTF output
files confirm that CHF was reached and post-CHF heat transfer regimes were briefly
entered. CHF was underpredicted by the simulations in the SS316 case, and even more so
in the FeCrAl case. In these cases, only RELAP5-3D shows rewetting behavior that is
somewhat representative of the experimental rewetting behavior. The tube outer surface
temperatures measured in the experiment and predicted by CTF and RELAP5-3D are
shown in Figure 6 for all three materials. Because CHF was overpredicted by the codes in
the Inconel 600 case, the tube temperature was underpredicted relative to the
experimental measurements. The underprediction of CHF in the SS316 and FeCrAl cases
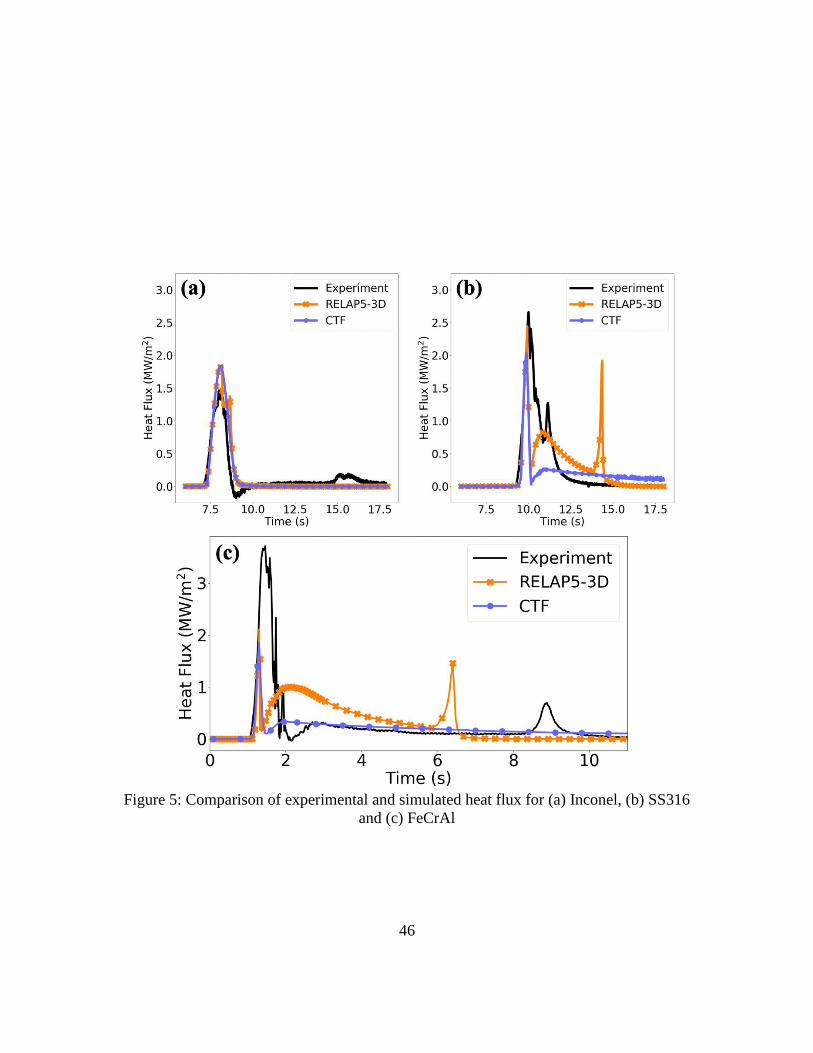
46
Figure 5: Comparison of experimental and simulated heat flux for (a) Inconel, (b) SS316
and (c) FeCrAl

47
Figure 6: Comparison of experimental and simulated tube outer surface temperatures for
(a) Inconel, (b) SS316 and (c) FeCrAl

48
led to an overshoot in tube surface temperature predictions. In the FeCrAl case, the
temperatures calculated by RELAP5-3D and CTF approach the melting point of most
FeCrAl alloys, which is approximately 1500C [131].
Table 2 quantifies the percent error of the simulated predictions relative to the
experimental values using the MHF and PCT as the two FoMs. Relative error
calculations are performed with temperatures converted to Kelvin. Note that the MHF
and the CHF were not necessarily equivalent in the experimental results, but typically
were in the simulated results. Further discussion on the separation of MHF and CHF is
provided in Section 3.5 of this chapter. In the Inconel case, the codes overpredicted the
MHF by approximately 25%, leading to an underprediction of PCT by 27.5% to 31.8%.
RELAP5-3D and CTF underpredicted the MHF in the SS316 case by 8.16% and 20.0%,
respectively, causing both codes to overpredict the PCT by 70% to nearly 100%. The
MHF was underpredicted by the codes by approximately 50% in the FeCrAl case,
causing an approximately 45% to 52% overprediction in the PCT.
As were shown in Figure 5 and Figure 6, CTF and RELAP5-3D predicted
different CHF and temperatures than the experiments and also predicting CHF and
temperatures different from each other. It is worth noting that the differences in cladding
temperature predictions between CTF and RELAP5 for an RIA-like event are not
uncommon, as demonstrated by predictions of cladding temperature for the nuclear safety
research reactor (NSRR) VA-1 experiment using a variety of computer modeling tools
[132]. Figure 7 shows the CHF predictions within each code as a function of time. Note
that RELAP defaults to a CHF of 0.0 when no power source is applied. Despite both
codes using the 2006 Groeneveld look-up table, the predictions made by RELAP5-3D
and CTF are clearly different from each other.
Because the Groeneveld look-up table is a function of absolute pressure, mass
flux, and equilibrium quality, differences in CHF predictions by RELAP5-3D and CTF
may be explained by differences in calculations for these hydrodynamic parameters.
Figure 8 shows the simulated predictions for these hydrodynamic parameters for the
FeCrAl case only. Also included in Figure 8 are the predictions for vapor void fraction,
which, while not used in the look-up table, is a relevant parameter to CHF and typically

49
Table 2: Relative error between the RELAP5 and CTF results to the experimental values
MHF
(MW/m2)
MHF Error
(%)
PCT
(C)
PCT Error
(%)
Inconel
Experiment 1.463 - 369.5 -
RELAP5-3D 1.798 22.9 192.8 -27.5
CTF 1.828 25.0 165.2 -31.8
SS316
Experiment 2.659 - 539.8 -
RELAP5-3D 2.442 -8.16 1111.7 70.3
CTF 2.128 -20.0 1336.6 98.0
FeCrAl
Experiment 3.713 - 856.2 -
RELAP5-3D 2.110 -43.2 1360.9 44.7
CTF 1.857 -50.0 1447.3 52.3

50
Figure 7: CHF predictions by RELAP5-3D and CTF using the Groeneveld look-up table
for (a) Inconel, (b) SS316 and (c) FeCrAl
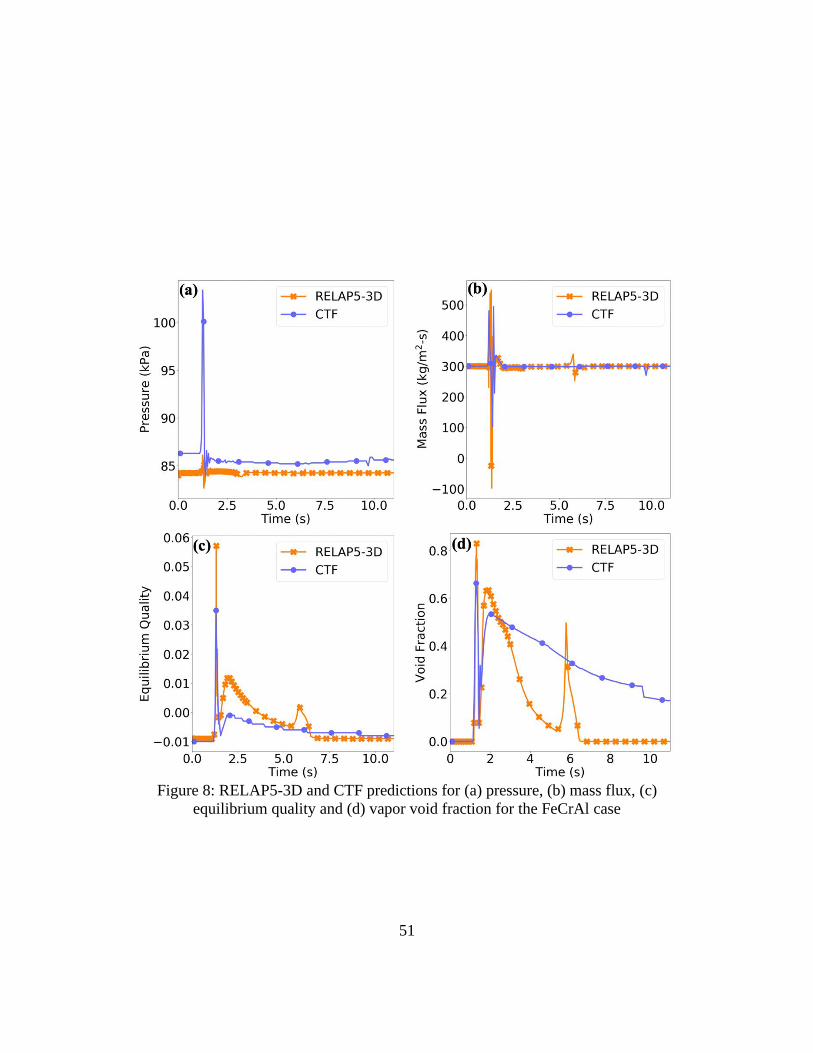
51
Figure 8: RELAP5-3D and CTF predictions for (a) pressure, (b) mass flux, (c)
equilibrium quality and (d) vapor void fraction for the FeCrAl case
52
follows a similar trend as equilibrium quality. The hydrodynamic predictions between the
two codes differ significantly from each other, which would then lead to differences in
CHF prediction using the Groeneveld look-up table. CTF predicts a much larger spike in
pressure during the power transient, while RELAP5-3D shows larger oscillations in mass
flux and even shows the flow rate going negative. This is because the two infinite
volumes in the model maintain the initial conditions throughout the transient, so the
conservation of mass and momentum leads to large oscillations in mass flux.
Another source of error is that the lowest pressure in the Groeneveld look-up table
is 100 kPa absolute, and RELAP5-3D and CTF extrapolate differently to predict CHF at
84 kPa. The 2006 look-up table is 15 pressure values by 21 mass flux values by 23
equilibrium quality values; CTF duplicates the outer boundaries of the table to create a
17-by-23-by-25 matrix of values so that any parameter outside of the table limits are
always extrapolated as constant values. RELAP5-3D uses a correction factor based on the
ratio of water properties at the pressure of interest to water properties at 100 kPa, and
then multiplies this correction factor by the CHF predicted at 100 kPa.
3.4 Sensitivity and Uncertainty Analysis of FeCrAl Heat Transfer
Coefficients and Material Properties
Two sensitivity studies were performed using the RELAP5-3D FeCrAl model and
RAVEN to elucidate the predicted impact of heat transfer coefficients and material
thermal properties on CHF and PCT. The motivation behind the sensitivity studies is to
determine if uncertainties in heat transfer correlations and material thermophysical
properties can help explain the discrepancies between the experimental data and
computer model predictions, as well as the differences in CHF for different materials.
Both sensitivity studies also show the impact of the CHF multiplier, which is a linear
multiplier that is applied to the CHF value predicted using the Groeneveld look-up tables.
While the impact of a CHF multiplier may seem obvious, it is included in these studies as
a means to reflect the enhancement of CHF that occurs during transient heating
processes. The magnitude of the CHF enhancement is dependent on the heating rate used,
although no correlation exists to predict the CHF enhancement caused by a given heating

53
rate. Two sensitivity studies were performed because a separate effects relationship
between the input parameters and FoMs, CHF and PCT, was desired. Uniformly-
distributed, discrete parameters were used in both sensitivity studies to ensure the
parameter space of interest was covered while also not assuming any prior knowledge of
how each parameter is distributed. This is an initial study that is intended to be
informative, and the results presented here could be used to inform future parametric
studies. Note that the CHF and MHF are always equivalent in the RELAP5-3D FeCrAl
models.
3.4.1 Sensitivity Case 1: Heat Transfer Coefficient and the CHF Multiplier
RELAP5-3D heat structure input allows for the use of multipliers on heat transfer
coefficients and CHF predicted by their respective correlations. In the base model, it was
found that the flow regimes entered during the transient are laminar forced convection,
turbulent forced convection, nucleate boiling, transition boiling, and film boiling.
RAVEN was used to vary multipliers on the heat transfer coefficients for these flow
regimes, as well as the CHF value predicted by the Groeneveld look-up table.
The multiplier values over which the sensitivity study was performed were chosen
in several ways. Laminar and turbulent forced convection regimes were only entered
before and after the power transient, and it was not expected that these would have much
impact on CHF. Therefore, the multipliers were arbitrarily varied from 0.7 to 1.3 to
confirm this expectation. It was shown in the UNM experiments that the nucleate boiling
heat transfer coefficient for FeCrAl could be as much as double the value for Zircaloy
[6], so the nucleate boiling heat transfer coefficient multiplier was varied from 1.0 to 2.0
to determine if this effect could have an impact on CHF. The film boiling heat transfer
coefficient measured in the experiment was approximately 1/3 of the value predicted in
the RELAP5-3D base model, so the film boiling heat transfer coefficient multiplier was
varied from 0.3 to 1.0. The Chen-Sundaram-Ozkaynak correlation [133] is used to predict
the transition boiling heat transfer coefficient, and, while the average deviation of the
correlation from experimental data is 16%, some data points vary from experimental data
by much more than this. For this reason, the transition boiling heat transfer coefficient

54
multiplier was varied from 1.0 to 2.0. The CHF multiplier was ranged from 1.0 to 2.0,
which was the maximum CHF enhancement observed over the steady state value in the
RIA transient experiments by Bessiron [95]. Regardless of the range of values tested, the
goal of the study was to determine the overall dependence of CHF and PCT on these heat
transfer coefficients.
In total, 13,608 combinations of heat transfer coefficients and CHF multipliers
were tested. Figure 9 shows CHF as a function of each multiplier. All 13,608 data points
are shown in each subplot of Figure 9, and a linear fit to the data is also plotted to show
how CHF depends on each multiplier. As shown in the figure, CHF somewhat depends
on the transition boiling heat transfer coefficient and strongly depends on the CHF
multiplier. The impact of the transition boiling heat transfer coefficient multiplier is a
result of CHF and the transition boiling regime being reached elsewhere in the tube
before it is reached at the center node (recall that all presented results are from the center
node of the test section). The combination of enhanced transition boiling heat transfer and
CHF being reached elsewhere before the center node leads to enhanced heat transfer
throughout the entire tube relative to the base model. The enhanced heat transfer delays
DNB at the center node and increases the CHF. Figure 10 shows the sensitivity of PCT
to each of the heat transfer coefficient and CHF multipliers.
The PCT decreased as the transition and film boiling heat transition coefficient
and CHF multiplier were increased. This occurs because transition and film boiling are
the flow regimes that occur post-CHF, so increased heat transfer during this period would
decrease the maximum temperature reached. Increasing the CHF multiplier would also
lead to a decrease in PCT because more heat is transferred out of the tube before the CHF
is reached, so the post-CHF temperature excursion is less severe.
3.4.2 Sensitivity Case 2: FeCrAl Thermophysical Properties
For this case, several thermophysical properties of FeCrAl were varied, including
volumetric heat capacity and thermal conductivity, within the uncertainty ranges of those
properties. The sensitivity of CHF to thermal effusivity and thermal diffusivity was also
determined since they are functions of volumetric heat capacity and thermal conductivity.
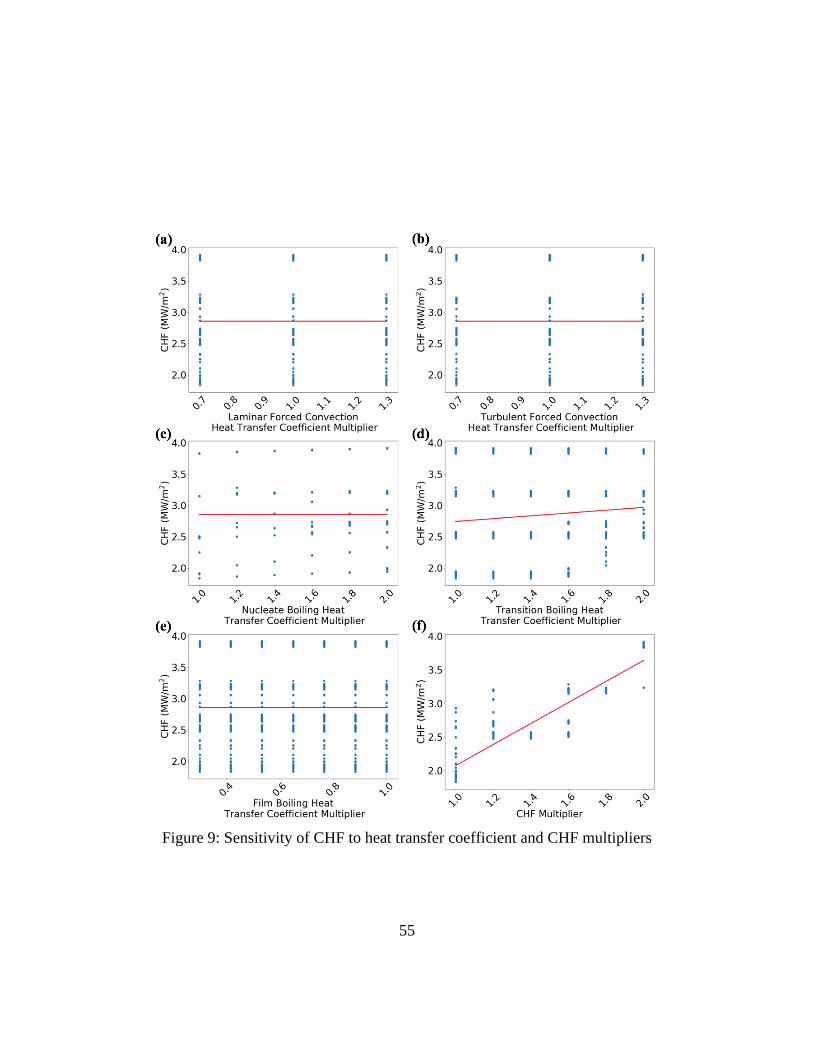
55
Figure 9: Sensitivity of CHF to heat transfer coefficient and CHF multipliers

56
Figure 10: Sensitivity of PCT to heat transfer coefficient and CHF multipliers
57
Variation of the CHF multiplier is again included to reflect the enhancement in CHF
caused by a transient heating process and to ensure that the experimental CHF is reached.
A total of 4,275 combinations were explored to help understand the sensitivities. In this
case, a main effects technique was used in which the impact of a single input is shown by
averaging the output across all other input variables [134].
The thermal conductivity and specific heat capacity of FeCrAl were obtained
from a handbook on FeCrAl properties published by ORNL [5]. The theoretical density
limits of Fe-13Cr-6Al using Equations (7) and (8), where xi is the weight percentage of
each component in an alloy and i is the density of each component in an alloy, are 6.98
g/cm3 and 7.47 g/cm3, respectively.
𝜌 = 1
∑ 𝑥𝑖𝜌𝑖
⁄ (7)
𝜌 = ∑ 𝑥𝑖𝜌𝑖 (8)
These theoretical density values were used as the limits of the density in the sensitivity
study, with the average of the two limits being 7.225 g/cm3. Kanthal reports the density
of several FeCrAl alloys with similar chemical compositions to Fe-13Cr-6Al to be
approximately 7.20 to 7.30 g/cm3 [135], confirming these limits. Thermal conductivity
and specific heat capacity limits were based on the uncertainties of measurements
reported in the FeCrAl handbook [5]. The sensitivity study limits on volumetric heat
capacity, which is the product of density and specific heat capacity, is then the product of
the lower and upper limits of these two parameters.
Thermal effusivity, e, and thermal diffusivity, , are calculated from thermal
conductivity and volumetric heat capacity, as shown in Equations (9) and (10). Thermal
conductivity, density, and specific heat capacity are sampled in this study, and thermal
effusivity and diffusivity are calculated at each sampled combination of k, 𝜌, and Cp.
𝑒 = √𝑘𝜌𝐶𝑝 (9)
58
𝛼 = 𝑘
𝜌𝐶𝑝 (10)
Figure 11 shows CHF as functions of the CHF multiplier, thermal conductivity,
volumetric heat capacity, thermal effusivity, and thermal diffusivity, respectively, and
shows that CHF is sensitive to all of the tested parameters and increases with each of
them except for the volumetric heat capacity. The sensitivity of PCT is shown in Figure
12. From the figure, PCT decreases as the volumetric heat capacity increases, which also
causes a decrease in PCT as thermal effusivity increases, but an increase in PCT as
thermal diffusivity increases. An increase in the CHF multiplier also led to a decrease in
PCT, while varying thermal conductivity appeared to have little impact on PCT.
3.4.3 Best Match Parameters
Using the results from the sensitivity studies, the RELAP5-3D simulations using
FeCrAl alloy that best matched the experimental results were able to be determined using
three FoMs. The MHF and PCT were again used as FoMs, as was the total integral heat
flux deposited into the tube. The integral heat flux was used as an analog to represent the
total energy deposited in the test section. A RELAP5 run that had the minimum relative
error from the experiment was determined for each FoM. Additionally, a run was
identified that had the minimum root-mean-square error (RMSE) for all three FoMs in
order to find the input parameters that gave the best overall match to the experimental
results. Several extra criteria were used in determining the best overall match to the
experiment:
1. The relative MHF error could not exceed 3.5%, which is within the repeatability
range of the experimental MHF obtained by UNM [6].
2. The magnitude of the rewetting heat flux spike occurring after the power transient
could not exceed the heat flux during the power transient, which would not be
consistent with physical expectations.
3. PCT could not exceed 1500C, which is the approximate melting temperature of
FeCrAl [131]. Temperatures above 1500C are physically incorrect since the test
section did not melt in any of the 13 FeCrAl tests that were conducted at UNM.
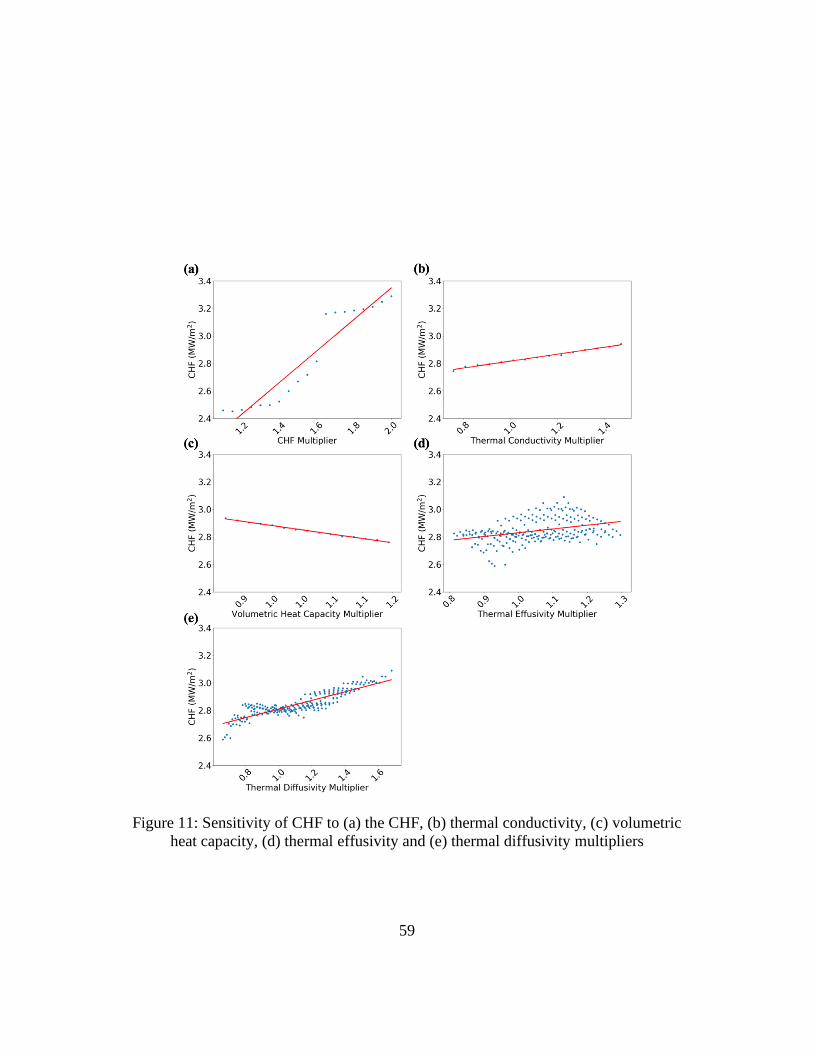
59
Figure 11: Sensitivity of CHF to (a) the CHF, (b) thermal conductivity, (c) volumetric
heat capacity, (d) thermal effusivity and (e) thermal diffusivity multipliers
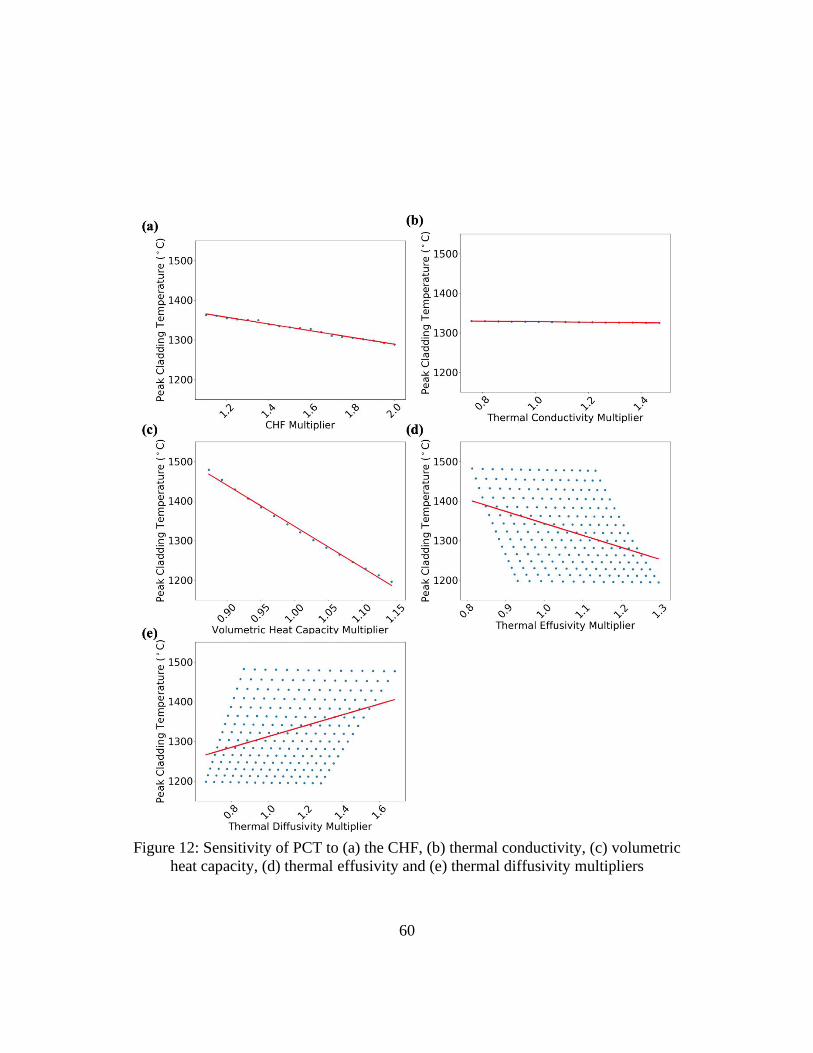
60
Figure 12: Sensitivity of PCT to (a) the CHF, (b) thermal conductivity, (c) volumetric
heat capacity, (d) thermal effusivity and (e) thermal diffusivity multipliers

61
The best match plots based on the Sensitivity Case 1 parameters for heat flux and
surface temperature are shown in Figure 13 and Figure 14, respectively. Figure 13
includes a subplot that is zoomed in around the power transient. The run with the
minimum RMSE predicted the PCT nearly as well as the run with the minimum PCT
error, so the lines overlap in Figure 14. Because CHF/MHF (the two are equivalent in the
RELAP5-3D simulations for the FeCrAl case) is relatively insensitive to the heat transfer
coefficient multipliers, the CHF multiplier is the key parameter in matching the
experiment. Table 3 lists the parameters used in run #756, which provided the best
overall match to the experiment by having the minimum RMSE. Table 4 lists the relative
error of each FoM from run #756 to the experimental values, as well as its RMSE. The
PCT relative error is calculated with the temperatures in Kelvin. Compared to the base
model results previously presented in Table 2, the PCT error decreased from 44.7% to
36.52% and the MHF error improved from -43.2% to 3.22%. It is important to note that
the uncertainty in the measured CHF value is about 8%, so this relative error in MHF is
within the uncertainty of the measurement itself.
Figure 15 and Figure 16 show comparisons of the experimental results to the best
match cases from Sensitivity Case 2 for heat flux and surface temperature, respectively.
Again, the minimum RMSE run predicted PCT almost as well as the run with the
minimum PCT error, so the lines overlap. In this case, run #4155 was the best overall
match to the experiment based on minimum RMSE. Table 5 lists the thermophysical
parameters used in run #4155, and Table 6 lists the error values relative to the
experiment. As shown by Table 5, the CHF multiplier is still the major factor in matching
the experimental MHF. The MHF error of 1.24% is better than both the base model error
of -43.2% and the Sensitivity Case 1 error of 3.22%. Variation of thermal conductivity
and volumetric heat capacity and their derived quantities brought the relative error of the
PCT down from 44.7% in the base model to 27.02%. The MHF and RMSE values are
smaller than in Sensitivity Case 1 involving heat transfer coefficient multipliers, which
reiterates the stronger dependence of PCT upon the thermal properties that was shown in
Figure 12.

62
Figure 13: Comparison of experimental heat flux to the best matches for each FoM from
Sensitivity Case 1
Figure 14: Comparison of experimental surface temperature to the best matches for each
FoM from Sensitivity Case 1

63
Table 3: Parameters used in the Best Match Combined run from Sensitivity Case 1
Parameter Value
hlaminar multiplier 1.3
hturbulent multiplier 0.7
hnucleate multiplier 1.0
htransition multiplier 2.0
hfilm multiplier 1.0
CHF multiplier 2.0
Table 4: Relative error of the Best Match Combined run from Sensitivity Case 1
FoM Relative Error (%)
MHF 3.22
PCT 36.52
Integral Heat Flux 2.52
RMSE 36.74
Figure 15: Comparison of experimental heat flux to the best matches for each FoM from
Sensitivity Case 2

64
Figure 16: Comparison of experimental surface temperature to the best matches for each
FoM from Sensitivity Case 2
Table 5: Parameters used in the Best Match Combined run from Sensitivity Case 2
Parameter Value
k multiplier 1.06
Cp multiplier 1.14
e multiplier 1.10
multiplier 0.93
CHF multiplier 2.0
Table 6: Relative error of the Best Match Combined run from Sensitivity Case 2
FoM Relative Error (%)
MHF 1.24
PCT 27.02
Integral Heat Flux 1.70
RMSE 27.10
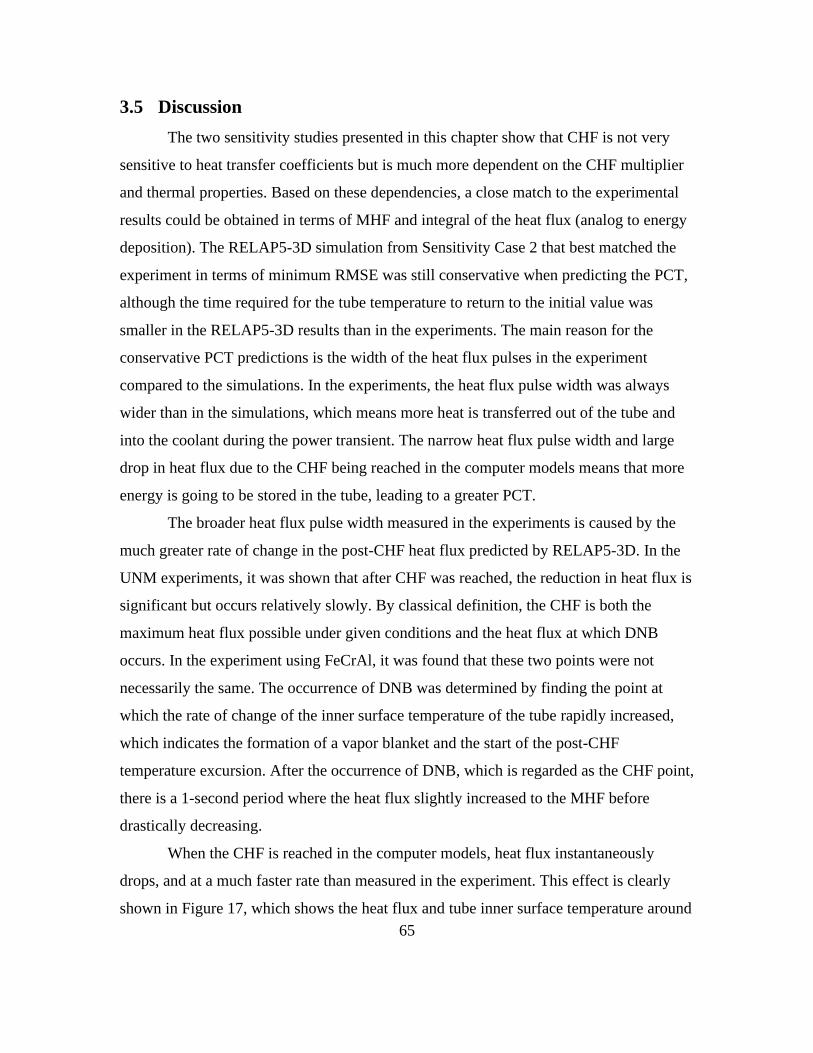
65
3.5 Discussion
The two sensitivity studies presented in this chapter show that CHF is not very
sensitive to heat transfer coefficients but is much more dependent on the CHF multiplier
and thermal properties. Based on these dependencies, a close match to the experimental
results could be obtained in terms of MHF and integral of the heat flux (analog to energy
deposition). The RELAP5-3D simulation from Sensitivity Case 2 that best matched the
experiment in terms of minimum RMSE was still conservative when predicting the PCT,
although the time required for the tube temperature to return to the initial value was
smaller in the RELAP5-3D results than in the experiments. The main reason for the
conservative PCT predictions is the width of the heat flux pulses in the experiment
compared to the simulations. In the experiments, the heat flux pulse width was always
wider than in the simulations, which means more heat is transferred out of the tube and
into the coolant during the power transient. The narrow heat flux pulse width and large
drop in heat flux due to the CHF being reached in the computer models means that more
energy is going to be stored in the tube, leading to a greater PCT.
The broader heat flux pulse width measured in the experiments is caused by the
much greater rate of change in the post-CHF heat flux predicted by RELAP5-3D. In the
UNM experiments, it was shown that after CHF was reached, the reduction in heat flux is
significant but occurs relatively slowly. By classical definition, the CHF is both the
maximum heat flux possible under given conditions and the heat flux at which DNB
occurs. In the experiment using FeCrAl, it was found that these two points were not
necessarily the same. The occurrence of DNB was determined by finding the point at
which the rate of change of the inner surface temperature of the tube rapidly increased,
which indicates the formation of a vapor blanket and the start of the post-CHF
temperature excursion. After the occurrence of DNB, which is regarded as the CHF point,
there is a 1-second period where the heat flux slightly increased to the MHF before
drastically decreasing.
When the CHF is reached in the computer models, heat flux instantaneously
drops, and at a much faster rate than measured in the experiment. This effect is clearly
shown in Figure 17, which shows the heat flux and tube inner surface temperature around
66
Figure 17: Comparison of heat flux and inner surface temperature between the
experiment and RELAP5-3D best match model around the CHF/MHF point
67
the CHF and MHF points from the UNM FeCrAl experiment and a model from
Sensitivity Case 2. Figure 18 shows the time rate of change of the heat flux (𝑑𝑞′′ 𝑑𝑡⁄ ) and
cladding inner surface temperature (𝑑𝑇/𝑑𝑡) around the time of CHF and MHF being
reached in the FeCrAl experiment. Figure 18 shows that there is a noticeable increase in
𝑑𝑇/𝑑𝑡 and decrease in 𝑑𝑞′′ 𝑑𝑡⁄ at both the CHF and MHF points identified in Figure 17.
This phenomenon was only observed in the FeCrAl experiment, not in the Inconel or
SS316 experiments. CHF and MHF were equivalent to each other in the Inconel and
SS316 experiments.
Figure 19 shows the heat flux, cladding inner surface temperature, 𝑑𝑞′′ 𝑑𝑡⁄ , and
𝑑𝑇/𝑑𝑡 around the CHF for Inconel and SS316. There is no evidence in any of these
subplots that there is a reduction in heat flux due to DNB occurring before the maximum
measured heat flux. It is worth noting that in the FeCrAl experiment, the MHF is
approximately 6.5% greater than the CHF, which is within the uncertainty of the
experimental temperature measurement and heat flux calculation. It could also be
postulated that an unstable vapor layer formed at the CHF point identified in the FeCrAl
experiment, which then reflooded and reformed with stability at the MHF.
After CHF occurred, the heat flux through the Inconel test section began to
decline but did not drastically drop until approximately 0.2-0.25 seconds after the CHF
was reached. From the Inconel time derivative subplot shown in Figure 19, it is shown
that the change in heat flux and cladding temperature over time remains relatively
constant in the tenths of seconds before and after CHF is reached. In the SS316
experiment, heat flux also declined after CHF was reached, but shows a jump in heat flux
starting at 10.1 seconds. This suggests reflooding occurred, even if only temporarily, and
is further evidence that unstable vapor layers are forming and rewetting before a stable
layer is developed. Regardless of the cause of the discrepancy between CHF and MHF
found in the FeCrAl experimental data, a key takeaway from Figure 17 through Figure
19, along with the computational results previously presented in Figure 5, is that after
CHF is reached, the computational tools predict a much faster rate of change in heat flux
than is experienced in reality. From this takeaway and the best match results presented in
Section 3.4.3, it can be concluded that even if the computational tools were to predict the
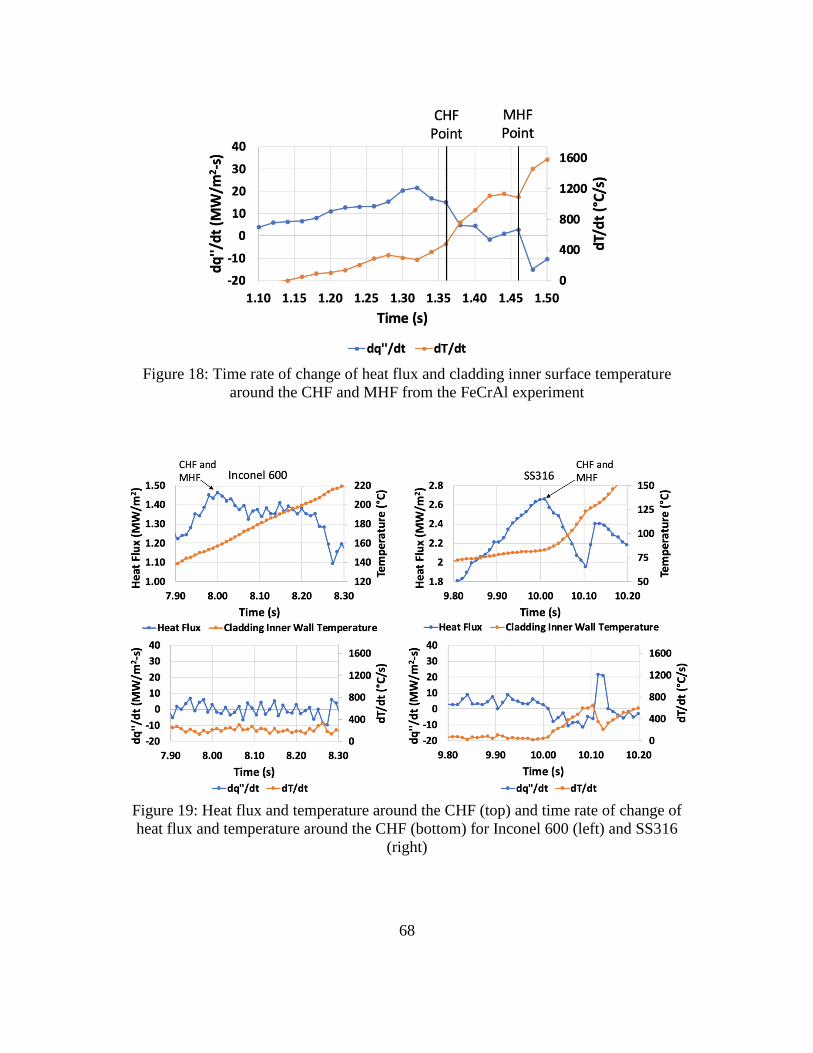
68
Figure 18: Time rate of change of heat flux and cladding inner surface temperature
around the CHF and MHF from the FeCrAl experiment
Figure 19: Heat flux and temperature around the CHF (top) and time rate of change of
heat flux and temperature around the CHF (bottom) for Inconel 600 (left) and SS316
(right)

69
correct CHF, they will overpredict the PCT due to the faster rate of heat flux decline.
The observations on the differences between experimental and simulated CHF
and post-CHF behavior is a novel contribution of this work. Additionally, the sensitivity
studies that elucidate on the effects of FeCrAl cladding material properties and predicted
heat transfer coefficients are a new contribution to the literature. This work highlights
several areas of experimental and computational development need. There is currently no
correlation in existence that can predict the enhancement of CHF during a heating
transient, or the rate of heat transfer decline after CHF has been reached. This study is a
preliminary heat transfer evaluation that is useful for informing future work, and its
primary contribution is pointing out the areas of research need in order to increase the
accuracy of nuclear reactor safety analysis.
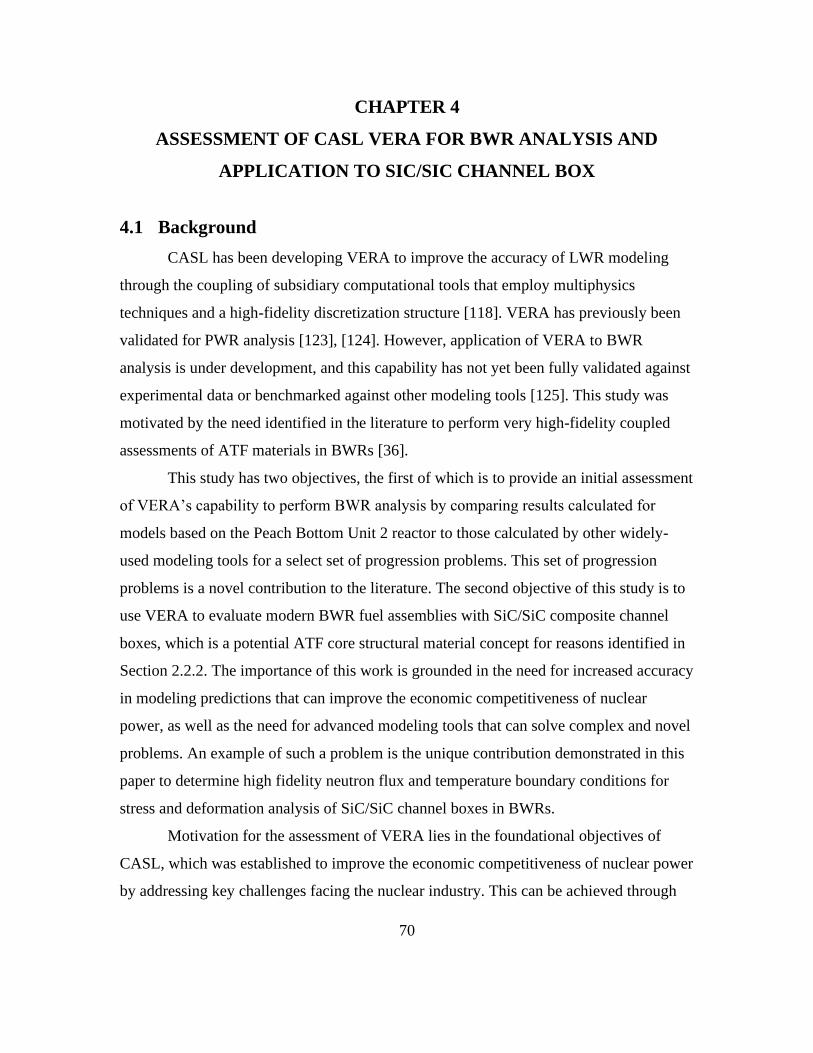
70
CHAPTER 4
ASSESSMENT OF CASL VERA FOR BWR ANALYSIS AND
APPLICATION TO SIC/SIC CHANNEL BOX
4.1 Background
CASL has been developing VERA to improve the accuracy of LWR modeling
through the coupling of subsidiary computational tools that employ multiphysics
techniques and a high-fidelity discretization structure [118]. VERA has previously been
validated for PWR analysis [123], [124]. However, application of VERA to BWR
analysis is under development, and this capability has not yet been fully validated against
experimental data or benchmarked against other modeling tools [125]. This study was
motivated by the need identified in the literature to perform very high-fidelity coupled
assessments of ATF materials in BWRs [36].
This study has two objectives, the first of which is to provide an initial assessment
of VERA’s capability to perform BWR analysis by comparing results calculated for
models based on the Peach Bottom Unit 2 reactor to those calculated by other widely-
used modeling tools for a select set of progression problems. This set of progression
problems is a novel contribution to the literature. The second objective of this study is to
use VERA to evaluate modern BWR fuel assemblies with SiC/SiC composite channel
boxes, which is a potential ATF core structural material concept for reasons identified in
Section 2.2.2. The importance of this work is grounded in the need for increased accuracy
in modeling predictions that can improve the economic competitiveness of nuclear
power, as well as the need for advanced modeling tools that can solve complex and novel
problems. An example of such a problem is the unique contribution demonstrated in this
paper to determine high fidelity neutron flux and temperature boundary conditions for
stress and deformation analysis of SiC/SiC channel boxes in BWRs.
Motivation for the assessment of VERA lies in the foundational objectives of
CASL, which was established to improve the economic competitiveness of nuclear power
by addressing key challenges facing the nuclear industry. This can be achieved through
71
the integration of subsidiary nuclear modeling tools into VERA [136]. Several example
approaches for increasing the competitiveness of nuclear energy include uprating nominal
reactor power, achieving higher burnup and fuel cycle lengths, and extending the lifetime
of nuclear power plants. However, each of these approaches may increase the likelihood
and/or severity of operational occurrences, such as grid-to-rod fretting, PCI, DNB, CIPS,
and CILC [52]. Any of these phenomena may increase the probability of cladding or fuel
failure during normal operation and accident scenarios, which has operational and safety
related consequences. Current modeling tools used in industry and for reactor licensing
purposes either lack the multiphysics integration or the spatial fidelity required to fully
capture the localized effects caused by these phenomena, which can result in large
uncertainties and overly conservative safety margin estimates. This drives the need for
tools like VERA, which, compared to current regulatory-grade modeling tools, uses
higher-order neutron transport and thermal hydraulic solution methods and a higher-
fidelity spatial discretization scheme. These advanced modeling features suggest that
VERA could be integrated into the nuclear industry to improve the accuracy of reactor
performance predictions and reduce costs [136], [108].
Multiphysics simulators like VERA must undergo an extensive validation and
verification (V&V) procedure to ensure safety margin estimates for nuclear reactors are
produced with a high level of confidence. This procedure includes V&V exercises first
for each of the single-physics tools, followed by additional exercises for the multiphysics
coupling of those tools. V&V is supplemented by uncertainty quantification to define the
confidence bounds of predicted safety margins [137]. VERA has undergone this
procedure for PWR applications, with the final demonstration being a simulation of 20
years of the Watts Bar Nuclear Power Station Unit 1 operating history [123], [138].
This V&V process is yet to be performed for VERA’s application to BWR
analysis, although the primary VERA codes leveraged in the current study, MPACT and
CTF, have undergone single-physics assessments. Kochunas, et al., [139] compared
eigenvalue predictions from MPACT for Peach Bottom fuel assemblies to the KENO
Monte Carlo code from the SCALE framework [140], and demonstrated MPACT’s
ability to model 3-D BWR control cells and a 2-D BWR full core problem. Porter and

72
Avramova [141] compared CTF pressure drop and void fraction predictions to data
contained in the Japanese Nuclear Power Engineering Corporation (NUPEC) BWR
database, and also summarized other BWR-relevant validation exercises performed using
the COBRA-TF line of codes from which CTF originates. Parametric studies were
performed by Avramova, et al., [142] and Gorton, et al., [143] that showed single and
two-phase turbulent mixing coefficients and interfacial drag coefficients significantly
contribute to uncertainties in void fraction distributions. The current study is the first to
assess VERA’s capability to perform multiphysics evaluations of BWR fuel assemblies
and is an integral part of the broader V&V process that VERA must go through to be
applied with confidence for BWR applications.
The code-to-code comparisons in this study are made for steady-state BWR
performance parameters and two-group nuclear cross sections for BWR fuel lattices. A
set of code-to-code progression problems was developed with increasing complexity to
perform the comparisons, analogous to past efforts in the literature for PWRs. The
modeling tools used for the comparisons are the U.S. NRC’s reactor kinetics code
PARCS/PATHS and the Monte Carlo particle transport code, Serpent [18]. VERA’s
primary subsidiary tools that are employed in the comparisons and in the evaluation of
SiC/SiC channel boxes are MPACT and CTF. The few-group nuclear cross section data
used in PARCS in this study are provided by MPACT, which has its own cross section
libraries.
PARCS/PATHS was chosen as the computational tool to compare VERA against
because it is considered state-of-the-art for coupled regulatory analysis in the United
States and is the NRC’s primary tool for BWR depletion analysis [106], [107]. It is worth
noting that PARCS has been coupled to other regulatory thermal hydraulic solvers,
including RELAP5 [144] and TRACE [145]. However, PATHS offers faster simulation
times compared to these other thermal hydraulic solvers, and a comparative study by
Wysocki, et al., [106] showed that PATHS is able to predict steady-state BWR
performance similarly to both TRACE and SIMULATE-3, a nodal diffusion code with
thermal hydraulic feedback that is commonly used in industry for BWR analysis [146].
Serpent was chosen as the neutronics tool for the two-group cross section
73
comparisons against MPACT because it is a continuous-energy Monte Carlo code that
has been employed in a wide range of nuclear applications. Validated continuous-energy
Monte Carlo tools are known to be more accurate than deterministic solvers because no
approximations are made in cross section energy dependence and exact geometries can be
modeled without introducing discretization error. Still, deterministic solvers are typically
preferred for large scale multiphysics applications due to reduced computational burden
and faster runtimes compared to Monte Carlo methods [99], hence the selection of a
deterministic code in VERA. In this context, Serpent is used to verify the two-group cross
sections generated by MPACT using infinite 2-D fuel lattice models, an exercise that has
been carried out with Serpent for a number of deterministic codes with LWR applications
[147], [148], [149].
While the code-to-code comparisons use historical Peach Bottom BWR fuel
assembly designs with typical Zircaloy-4 channel boxes, a section of this chapter is
dedicated to a high-fidelity, multiphysics evaluation of modern BWR fuel assembly
designs equipped with accident tolerant SiC/SiC channel boxes. This type of analysis can
only be performed with a tool like VERA and would be impossible to carry out with the
same level of output resolution using current regulatory tools. This portion of the study
not only demonstrates the advanced capabilities of VERA, but also furthers ATF research
and development efforts.
4.2 BWR Model Descriptions and Study Organization
This section details the BWR models developed for this work and the general
organization of the study. Section 4.2.1 details the Peach Bottom fuel assembly models
that were used for the code-to-code comparisons between MPACT and Serpent for two-
group cross sections and between VERA and PARCS/PATHS for steady-state reactor
performance parameters. Section 4.2.2 describes a sixteen-assembly mini-core model
developed in VERA that comprises of modern BWR fuel assembly designs with SiC/SiC
channel boxes. Analysis of the mini-core model with VERA is intended to highlight the
tool’s advanced modeling capabilities and potential utilization of VERA for ATF
research and in the broader nuclear industry. Lastly, Section 4.2.3 summarizes the
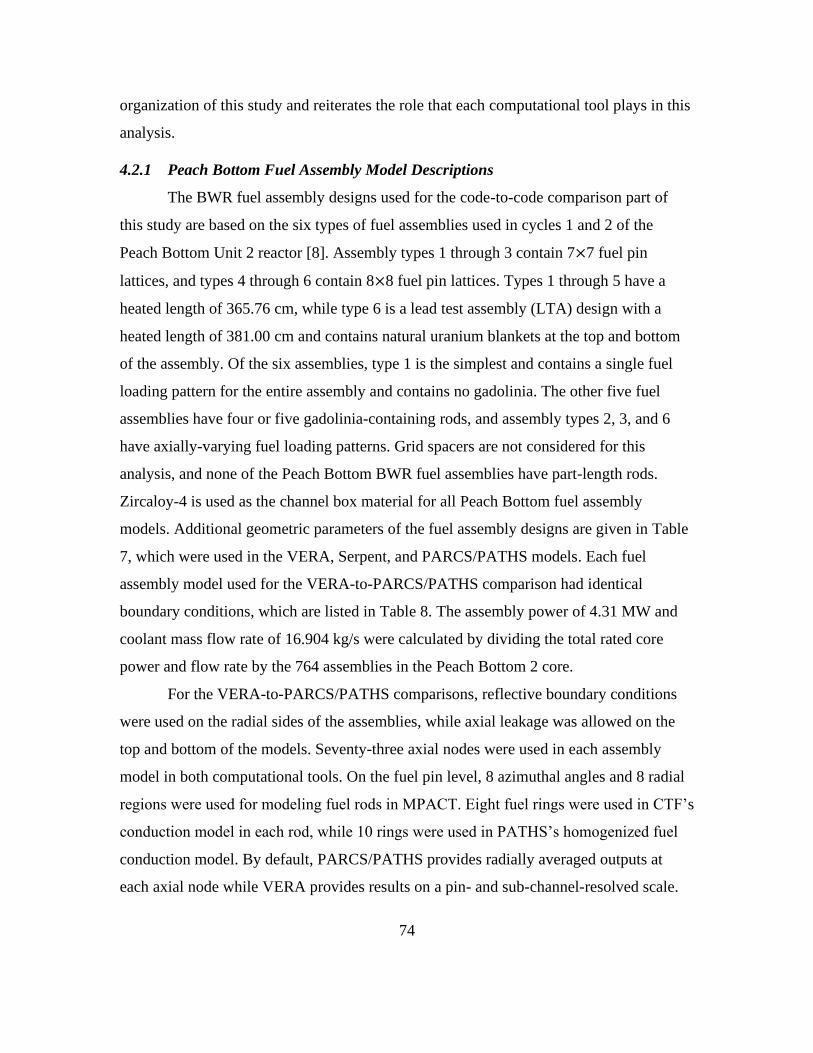
74
organization of this study and reiterates the role that each computational tool plays in this
analysis.
4.2.1 Peach Bottom Fuel Assembly Model Descriptions
The BWR fuel assembly designs used for the code-to-code comparison part of
this study are based on the six types of fuel assemblies used in cycles 1 and 2 of the
Peach Bottom Unit 2 reactor [8]. Assembly types 1 through 3 contain 7×7 fuel pin
lattices, and types 4 through 6 contain 8×8 fuel pin lattices. Types 1 through 5 have a
heated length of 365.76 cm, while type 6 is a lead test assembly (LTA) design with a
heated length of 381.00 cm and contains natural uranium blankets at the top and bottom
of the assembly. Of the six assemblies, type 1 is the simplest and contains a single fuel
loading pattern for the entire assembly and contains no gadolinia. The other five fuel
assemblies have four or five gadolinia-containing rods, and assembly types 2, 3, and 6
have axially-varying fuel loading patterns. Grid spacers are not considered for this
analysis, and none of the Peach Bottom BWR fuel assemblies have part-length rods.
Zircaloy-4 is used as the channel box material for all Peach Bottom fuel assembly
models. Additional geometric parameters of the fuel assembly designs are given in Table
7, which were used in the VERA, Serpent, and PARCS/PATHS models. Each fuel
assembly model used for the VERA-to-PARCS/PATHS comparison had identical
boundary conditions, which are listed in Table 8. The assembly power of 4.31 MW and
coolant mass flow rate of 16.904 kg/s were calculated by dividing the total rated core
power and flow rate by the 764 assemblies in the Peach Bottom 2 core.
For the VERA-to-PARCS/PATHS comparisons, reflective boundary conditions
were used on the radial sides of the assemblies, while axial leakage was allowed on the
top and bottom of the models. Seventy-three axial nodes were used in each assembly
model in both computational tools. On the fuel pin level, 8 azimuthal angles and 8 radial
regions were used for modeling fuel rods in MPACT. Eight fuel rings were used in CTF’s
conduction model in each rod, while 10 rings were used in PATHS’s homogenized fuel
conduction model. By default, PARCS/PATHS provides radially averaged outputs at
each axial node while VERA provides results on a pin- and sub-channel-resolved scale.

75
Table 7: Peach Bottom fuel assembly geometry [8]
Assembly
Type
Pin Lattice
Design
Fuel Pellet
Radius (cm)
Pellet-Cladding
Gap Thickness
(cm)
Cladding
Thickness
(cm)
Number
of Water
Rods
1 7×7 0.61849 0.01524 0.08128 0
2 7×7 0.60579 0.01524 0.09398 0
3 7×7 0.60579 0.01524 0.09398 0
4 8×8 0.52832 0.01143 0.08636 1
5 8×8 0.52832 0.01143 0.08636 1
6 8×8 0.52070 0.01143 0.08128 2
Table 8: Peach Bottom fuel assembly boundary conditions
Parameter Value
Power (MW) 4.31
Coolant Mass Flow Rate (kg/s) 16.904
Outlet Pressure (Bar) 71.36
Coolant Inlet Temperature (°C) 274.85

76
This means that PARCS/PATHS can provide centerline, average, and surface fuel
temperatures, averaged power profiles, and average coolant properties, while VERA
provides radial fuel pellet temperatures in each rod, axial power distributions for each
rod, and coolant properties in each sub-channel. Due to the finer mesh used in the VERA
models, additional computational resources were used to run the models. All VERA and
PARCS/PATHS models were ran on ORNL computing clusters, where VERA used 64
cores over two computing nodes, while PARCS/PATHS used a single core.
To ensure a direct comparison, the CTF models were designed to use the default
temperature-dependent polynomials used for UO2 and Zircaloy-2 thermal conductivities
in PATHS. A constant pellet-cladding gap heat transfer coefficient of 5700 W/m2-K was
used in both CTF and PATHS, as was the Churchill wall friction correlation [150]. The
Lellouche-Zolotar model [151] was used in PATHS for subcooled boiling, while the
Chen model [152] was used in CTF. Neither PARCS/PATHS nor the version of VERA
used for this analysis currently has the capability to explicitly model the bypass region
that exists between BWR fuel assemblies, meaning that the models were considered to be
adiabatic. Bypass flow modeling is currently under development by CASL.
4.2.2 Description of Modern BWR Fuel Assembly and Mini-Core Models
The neutronic and thermal-hydraulic capabilities in VERA were used to obtain fast
neutron flux and temperature profiles in BWR fuel assemblies. The BWR models created
in VERA are based on a modern 10×10 fuel pin lattice design. The geometry of the BWR
fuel assembly models used for this study is based on the geometric data detailed in the
thesis by Ferroni [153], as are the power, pressure, and coolant mass flow rate. Seven axial
zones were used in the computer models, each of which contains a unique fuel loading
pattern [49]. Reflective boundary conditions are used, making the models used in this study
representative of assemblies near the center of the reactor core.
Thermal properties of irradiated SiC-SiC [49] were implemented in the CTF input
decks for the channel box. The channel box was modeled as heat slabs were to the sub-
channels along the periphery of the assembly in CTF. A 47-group neutron cross-section
library was used in MPACT. In a previous channel box study using Serpent (which uses a

77
continuous cross-section library), a 0.1 MeV cutoff was used for tallying fast neutron flux
[36]. This cutoff is not available in the 47-group library, while the nearest fast neutron
cutoff energies available in the current analysis are 0.067 MeV and 0.183 MeV. Single fuel
assembly models with a SiC-SiC channel box were modeled using both cutoffs to show the
impact on fast flux tallies.
VERA is capable of modeling the cruciform control blades used in BWR cores.
This study provides fast neutron flux and temperature distributions in cladding and the
channel box for three cases: the control blade fully withdrawn, the control blade halfway
inserted, and the control blade fully inserted. The control blade design implemented in the
models is on the design used in the LaSalle Unit 1 reactor [154]. Figure 20 shows a 2-D
cross-sectional view of the single BWR assembly model used for this study and includes
the control blade. Different colored fuel pins within the figure indicate different levels of
235U enrichment. For demonstration purposes, the same power is used for all the three cases
of control blade position in the fuel assembly.
For the accident-tolerant SiC/SiC channel box analysis, a mini-core model was
developed in VERA that consisted of sixteen identical BWR fuel assemblies. Each
assembly contains a 10×10 fuel pin lattice, two large water rods, seven distinct axial fuel
regions with varying fuel enrichments and gadolinia content [155], and seven grid
spacers. Modern 10×10 BWR fuel assemblies often feature part-length rods, however,
this modeling feature is still under development in VERA. As a workaround, part-length
rods were modeled as full-length rods that have extremely low fuel density and 235U
enrichment (both values on the order of 10-6) in the regions where the part-length rods
would have disappeared. The neutronic impact of this workaround is negligible, but it
will have some impact on thermal hydraulic calculations in CTF. Seventy-five axial
nodes were used in the mini-core model, and 5 conduction rings were used in the CTF
fuel model to shorten run times. Eight azimuthal angles and 8 radial regions were again
used in MPACT for modeling the fuel rods.
The mini-core is arranged into a 4×4 array of fuel assemblies with a cruciform
control blade modeled in the center of the core. As was the case for the single fuel
assembly models, the control blade design is based on that from the LaSalle Unit 1
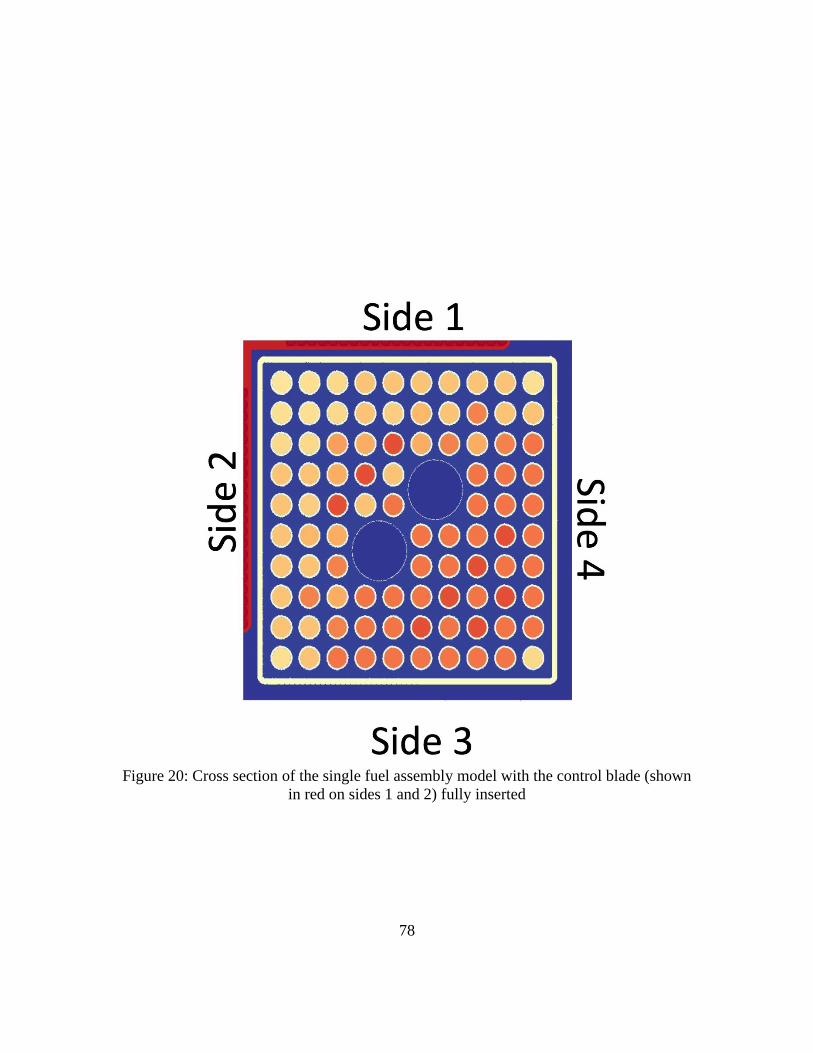
78
Figure 20: Cross section of the single fuel assembly model with the control blade (shown
in red on sides 1 and 2) fully inserted
79
reactor [154]. Typical UO2 fuel and Zircaloy-2 cladding were used, along with the default
thermal properties for these materials in CTF, while SiC/SiC was used as the channel box
material. Because the thermal conductivity of SiC/SiC degrades under irradiation, the
thermal properties of preirradiated SiC/SiC were used [49] in CTF. The dynamic pellet-
cladding gap conductance model in CTF was turned on for this analysis, and heat transfer
from the channel box to the coolant in the bypass region was not modeled. Although the
bypass region was not explicitly modeled, VERA automatically adjusts the flow rate in
each fuel assembly so that the same axial pressure drop is experienced across all
assemblies in the mini-core. Due to the symmetry of the model, results are presented
from a single control cell (cluster of four fuel assemblies), which is shown in Figure 21,
where “Asm” is short for “assembly.” Note that these analyses of modern fuel assemblies
are the only portion of this study that utilize SiC/SiC channel boxes.
4.2.3 Summary of Modeling Tools and Study Organization
This study can be broken down into three primary segments:
1. Two-group cross section comparisons between MPACT and Serpent for BWR fuel
lattices
2. Comparison of steady-state performance parameter predictions between VERA and
PARCS/PATHS for legacy BWR fuel assemblies
3. Analysis of modern BWR fuel assemblies with SiC/SiC channel boxes using VERA
The two-group cross section comparison is a neutronics-only study and is
presented in Section 4.3. The purpose of this comparison is to show how well MPACT
can generate few-group cross sections to be used in nodal diffusion codes compared to a
widely-used, continuous-energy Monte Carlo code. Comparisons of steady-state BWR
performance parameter calculations are made between VERA and PARCS/PATHS in
Section 4.4.1. These comparisons assess VERA’s ability to model BWR fuel assemblies
relative to a regulatory-grade tool. The high-fidelity outputs provided by VERA are post-
processed to match the output fidelity of PARCS/PATHS in order to make direct
comparisons between the two modeling tools. To better illustrate VERA’s modeling
features, an analysis of modern BWR fuel assemblies with SiC/SiC channel boxes is
80
Figure 21: BWR Control Cell
81
presented in Section 4.5. The purpose of this analysis is to present a unique study that can
only be performed with a tool like VERA with high-fidelity and high-order modeling
capabilities while also providing an evaluation of an accident tolerant material that is
useful in and of itself. This demonstration that VERA can carry out an analysis of a novel
problem that currently-used regulatory tools are unable to perform incentivizes its use in
the broader nuclear industry. Figure 22 provides a graphical summary of the three
primary components of this paper. Note that historical Peach Bottom fuel assembly
designs are used for the code-to-code comparisons, meaning that Zircaloy-4 is used as the
channel box material, while modern BWR fuel assembly designs with SiC/SiC channel
boxes are used for the fast neutron flux and temperature calculations with VERA.
4.3 Few-Group Cross Section Comparisons
Three fuel loading patterns from the six fuel assembly types were modeled as
infinite 2-D lattices in MPACT and Serpent to verify MPACT’s ability to generate few-
group macroscopic cross sections from a lattice physics calculation using a finer energy
group structure. Fuel loading patterns from assembly types 1, 3, and 5 were used for this
comparison, and were chosen because these lattices cover a range of design complexity.
The loading patterns from assembly types 1 and 5 are the only loading patterns used in
these assemblies, while the loading pattern from type 3 only extends a portion of the
assembly length and is referred to as lattice type D by Larsen [8]. Each MPACT
calculation utilized a 51-group cross section library, and a fuel temperature of 900 K,
coolant temperature of 548 K, and a void fraction of 40% were used as boundary
conditions for all lattice calculations in both Serpent and MPACT. These comparisons are
made for fresh fuel only.
Table 9 shows a comparison of 𝑘∞ and Figure 23 shows comparisons of
macroscopic cross sections pertinent to two-group diffusion calculations calculated by
Serpent and MPACT for the three lattices examined. The differences in 𝑘∞ in Table 9 are
given in units of percent millirho (pcm), where 1 pcm is equal to 1×10⁻⁵ Δ𝑘. A transport-
corrected, zeroth-order Legendre polynomial expansion for scattering (the TCP0
approximation) was used to obtain the results in Figure 23. Scattering in Group 1 is
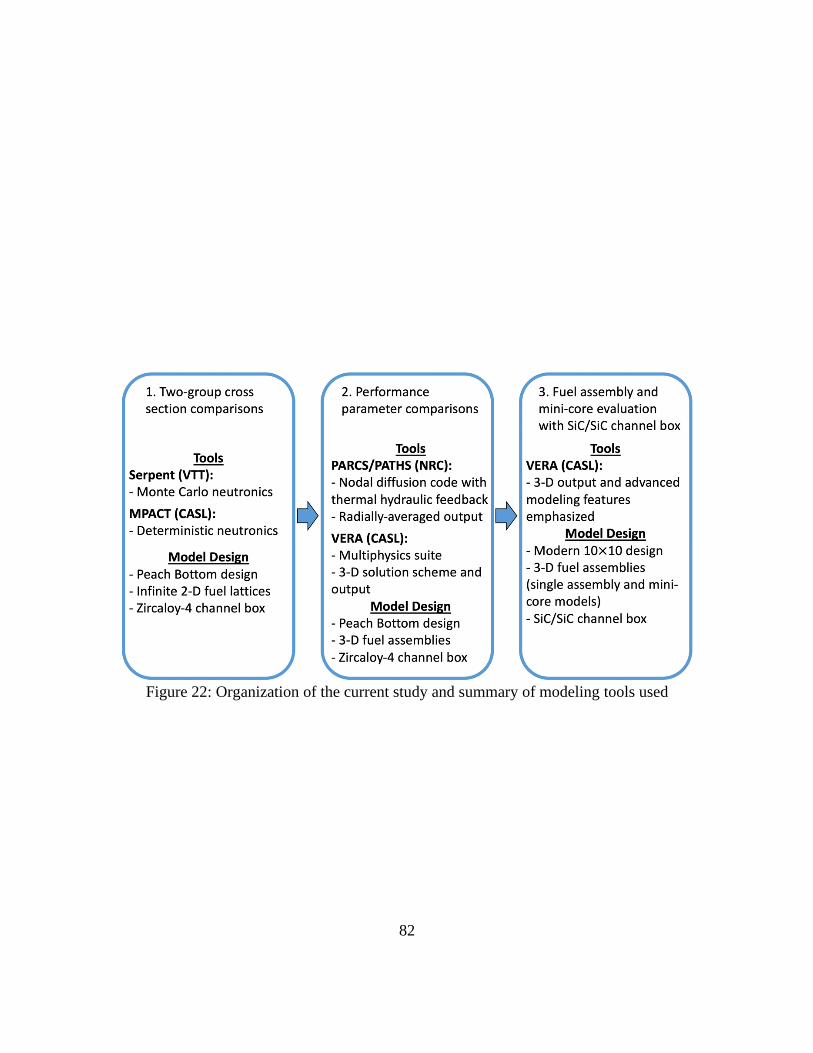
82
Figure 22: Organization of the current study and summary of modeling tools used
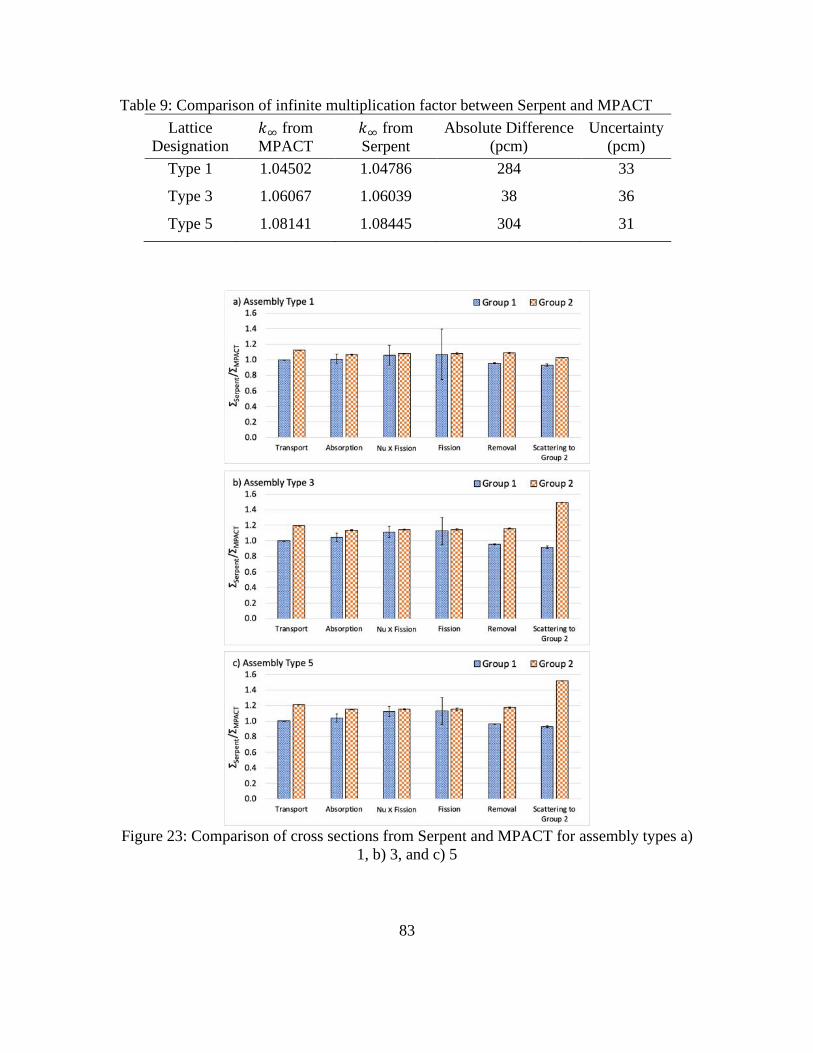
83
Table 9: Comparison of infinite multiplication factor between Serpent and MPACT
Lattice
Designation
𝑘∞ from
MPACT
𝑘∞ from
Serpent
Absolute Difference
(pcm)
Uncertainty
(pcm)
Type 1 1.04502 1.04786 284 33
Type 3 1.06067 1.06039 38 36
Type 5 1.08141 1.08445 304 31
Figure 23: Comparison of cross sections from Serpent and MPACT for assembly types a)
1, b) 3, and c) 5
84
excluded from the figure and is discussed separately. Results are presented as a ratio of
the Serpent-predicted value to the MPACT-predicted value, so values close to 1.0
indicate better agreement. Because Serpent is a Monte Carlo code, the statistical
uncertainty in the cross section predictions is propagated into the ratios.
The Group 1 scattering cross sections include within group scattering (Σ𝑠,1→1)
and upscattering from Group 2 (Σ𝑠,2→1). For Σ𝑠,1→1, the Serpent-to-MPACT ratios are
1.036, 1.966, and 1.962 for assembly types 1, 3, and 5, respectively, and have negligible
uncertainties. In a two-group energy structure, MPACT assumes there is no upscatter,
while Serpent calculated Σ𝑠,2→1 cross sections of 6.879×10⁻⁴ 1/cm, 1.049×10⁻³ 1/cm, and
1.107×10⁻³ 1/cm for types 1, 3, and 5, respectively. The calculated uncertainty for each
of these values is more than 100%, meaning that MPACT’s assumption of no upscatter
falls within the range of possible values predicted by Serpent.
When the statistical uncertainty in the Serpent calculations are taken into account,
most of the Group 1 cross sections match within a few percent. In Group 2, Serpent
consistently predicted macroscopic cross sections that were approximately 10-20%
greater than those predicted by MPACT. In terms of the multiplication factor, the tools
matched within about 304 pcm or less. Some of the differences may be accounted for by
the use of different cross section library versions, since MPACT used an Evaluated
Nuclear Data File Version B (ENDF/B)-VII.1 library [156] while Serpent used an
ENDF/B-VII.0 library [157]. The largest discrepancy occurs for the within group
scattering cross sections, Σ𝑠,1→1 and Σ𝑠,2→2, specifically in the cases where gadolinia is
present. For assembly types 3 and 5, Serpent predicted a nearly 100% larger Group 1
self-scattering cross section and approximately 50% greater Group 2 self-scattering cross
section. To address the differences in scattering cross section predictions, two additional
higher-order P2 approximation for scattering. In one case, the same 51-group cross
section library was used, and in the other case, a 252-group cross section library was
used. Figure 24 shows the Serpent-to-MPACT ratio for the various cross sections using a
51-group library and the P2 approximation in MPACT.
From Figure 24, it is shown that most of the Serpent-to-MPACT ratios did not
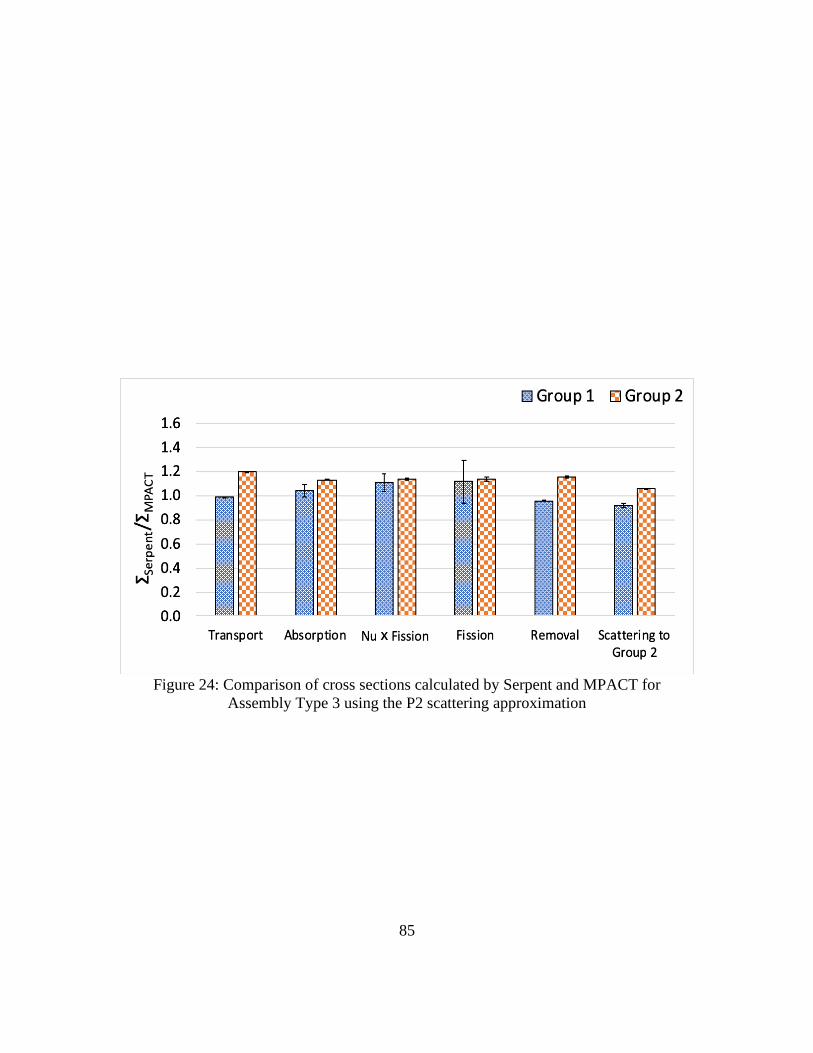
85
Figure 24: Comparison of cross sections calculated by Serpent and MPACT for
Assembly Type 3 using the P2 scattering approximation
86
change significantly, but the Group 2 self-scattering cross section ratio dropped from
1.495 to 1.061. Additionally, the Group 1 self-scattering cross section ratio decreased
from 1.966 to 1.039, showing significantly better agreement between the codes. For 𝑘∞,
however, the difference between the Serpent and MPACT predictions increased from 28
± 36 pcm to 163 ± 36 pcm. The final MPACT case, which used the P2 approximation and
a 252-group cross section library, showed marginal improvement over the case using P2
and 51-group library in terms of cross section agreement, but the difference between
Serpent and MPACT decreased to just 1 ± 36 pcm. These cross section differences may
lead to somewhat harder spectrum predictions in MPACT since each of the predicted
thermal cross sections were less than those predicted by Serpent, and the lower transport
cross section in MPACT will decrease axial streaming.
4.4 VERA to PARCS/PATHS Comparisons
4.4.1 Code-to-code Comparison of BWR Analysis
Comparisons of a number of neutronic and thermal hydraulic parameters were
made between VERA and PARCS/PATHS for the six Peach Bottom BWR fuel
assemblies described in Section 4.2.1. To perform these comparisons, PARCS/PATHS
requires two-group cross sections and other diffusion parameters generated by a reactor
physics code for a given reference state and a number of branch cases with different
thermal hydraulic parameters. For this study, MPACT was used in standalone mode to
generate these parameters, which include two-group cross sections, the diffusion
coefficient, and assembly discontinuity factors. The MPACT models used a 252-group
cross section library, the TCP0 approximation for scattering, and reflective boundary
conditions on the radial sides of the assemblies but vacuum conditions on the top and
bottom. The reference state used a coolant temperature of 548 K, a fuel temperature of
900 K, and a void fraction of 40%. Six coolant density branches were calculated with
void fractions of 0%, 10%, 30%, 50%, 70%, and 90%, and three fuel temperature
branches were calculated off of the reference state and each density branch using fuel
temperatures of 500 K, 1500 K, and 2500 K. Additionally, two coolant temperature
branches were calculated at void fractions of 40% and 70% using a coolant temperature
87
of 561 K and fuel temperature of 900 K. This branch structure more than encapsulates the
recommendation by the NRC for BWR analysis using PARCS/PATHS [158].
For each fuel assembly type, keff, relative power profile, void fraction, outlet
equilibrium quality, average fuel temperature, and coolant pressure drop are compared.
Because PARCS/PATHS uses a single radial node per fuel assembly, the pin-resolved
results from VERA had to be radially averaged to match the fidelity of PARCS/PATHS.
For fuel pin parameters, such as relative power and fuel temperature, the values were
simply averaged at each axial level. Sub-channel area was used as a weighting factor
when averaging void fraction and pressure because the corner and side subchannels have
different areas than inner sub-channels, while sub-channel coolant mass flow rate was
used to weight the quality. Figures shown in this section are only for assembly types 1
and 2 since the single fuel loading pattern of type 1 and the gadolinia content and axially-
varying fuel loading pattern of type 2 make these assemblies representative of all six
assembly types. A table is used to quantify the differences between the two modeling
tools for all six assembly types.
Figure 25 shows the comparison of relative power and keff between VERA and
PARCS/PATHS for assembly types 1 and 2. Comparisons for void fraction, coolant
pressure, and average fuel temperature for the two assemblies are shown in Figure 26
through Figure 28, respectively. Figure 26 also lists the outlet equilibrium quality
predicted by PATHS and CTF, and Figure 27 also lists the total pressure drop.
Qualitatively, PARCS/PATHS predicted a greater peak relative power and greater peak
fuel temperature for both fuel assemblies. The exit void fraction was slightly greater in
PARCS/PATHS for both cases, although the void fraction predicted by VERA was
greater at lower axial regions. The same outlet equilibrium quality was predicted by both
modeling tools, and VERA predicted a greater pressure drop for the two assemblies
shown. Table 10 is shown below to better quantify the differences between the two tools
for all six assembly types. The differences in keff are presented as absolute differences in
units of pcm while all other differences are all relative to the values predicted by
PARCS/PATHS. It should also be noted that the computing time of the VERA models on
64 cores required runtimes from approximately 32 to 78 minutes, while the

88
Figure 25: Comparison of relative power and keff for assembly types 1 (left) and 2 (right)
Figure 26: Comparison of void fraction and outlet equilibrium quality for assembly types
1 (left) and 2 (right)
Figure 27: Comparison of coolant pressure drop for assembly types 1 (left) and 2 (right)

89
Figure 28: Comparison of average fuel temperature for assembly types 1 (left) and 2
(right)
Table 10: Comparison of key parameter predictions between PARCS/PATHS and VERA
Assembly
Type
Δ𝑘
(pcm)
Relative difference
in maximum fuel
temperature (%)
Relative
difference in exit
void fraction (%)
Relative
difference in
pressure drop (%)
1 271 4.44 0.98 -3.41
2 409 6.24 0.95 -3.27
3 153 17.80 1.13 1.35
4 235 6.65 1.28 -4.37
5 197 7.26 1.28 -4.36
6 282 6.44 1.11 1.14
90
PARCS/PATHS models run in approximately 1 second. However, PARCS requires few-
group cross sections that are generated using a separate lattice physics code and
converted into the PARCS format, while VERA has its own cross section data libraries.
From Table 10, it is shown that a greater multiplication factor was predicted by
PARCS/PATHS for all six assembly types, and the differences are within several
hundred pcm. In terms of axial power profiles, the RMSE across all six fuel assemblies
and all axial locations between the two modeling tools is 10.36%. PARCS/PATHS also
predicted a greater peak fuel temperature for all six assembly types. For most of the
assemblies, the agreement in peak fuel temperature was from 4% to 7%, however, the
tools differed by nearly 18% for assembly type 3. In terms of void fraction,
PARCS/PATHS predicted a greater exit void in all cases by about 1.3% or less, but, as is
shown in Figure 26, VERA predicted greater void at lower axial regions in the fuel
assemblies for all six cases. VERA predicted a greater total pressure drop in four out of
the six cases, and relative differences of 1.14% to 4.37% were demonstrated for all
assembly types.
4.4.2 Discussion on VERA-to-PARCS/PATHS Comparisons
Further discussion on the code-to-code comparisons made in Section 4.4.1 is
provided here to provide additional understanding on the differences between the
predictions from the two modeling tools. Some differences between results from VERA
and PARCS/PATHS may be expected based on the different methodologies used each in
of the codes. Recall that PARCS uses the diffusion approximation with few-group cross
sections, while MPACT uses MOC to solve a 2-D radial, 1-D axial approximation to the
3-D Boltzmann transport equation and a much finer energy group structure. CTF solves
conservation equations for each of the three fluid fields (liquid film, liquid droplets, and
vapor) modeled in the code, while PATHS uses the drift flux model. Also, both PARCS
and PATHS homogenize fuel assemblies into a single radial node, while MPACT and
CTF use a higher-fidelity spatial mesh. Comparisons of detailed transport and
homogenized diffusion solutions for BWRs performed by Tada et al. [159] showed
differences between the two solution methods in 𝑘∞ predictions of as much as 2,200

91
pcm. Although assembly discontinuity factors, which were used in this analysis, have
been shown to significantly reduce the discrepancy [160], some differences between
PARCS/PATHS and VERA predictions are expected to occur due to different spatial
meshes, energy group structures, and solution methodologies.
Discrepancies similar to those presented in this paper between PARCS/PATHS
and VERA have been shown before between other commonly used modeling tools and
experimental and reactor data. Comparisons of thermal hydraulic results for a BWR fuel
assembly were made by Wysocki et al. [106] using PATHS, TRACE, and SIMULATE.
The results from that study showed that PATHS predicted the lowest void fraction in the
lower axial regions of the assembly but predicted the greatest exit void fraction out of the
three modeling tools. Validation work for CTF has shown that compared to measured
data from several two-phase flow experimental facilities, CTF often overpredicts two-
phase pressure drop and void fraction in the bubbly and slug flow regimes [161], [141].
The study by Wysocki et al. [106] also presented a comparison of axial power profiles
from a BWR core that were measured using a traveling in-core probe (TIP) and
calculated using PARCS/PATHS that showed a 9.9% RMSE across all TIP measurement
locations, which is similar to the RMSE for relative power predicted between VERA and
PARCS/PATHS of 10.36%. Yarsky et al. [107] also compared PARCS/PATHS power
profiles to TIP data from Edwin Hatch Unit 1, Cycle 2 and found that compared to the
measured data, PARCS/PATHS always predicted a greater peak power as well as a lower
relative power at the top and bottom nodes of the model. Each of these observations are
consistent with those made in the present study.
The observed differences in relative power and void fraction between the codes
and measured data will have cascading effects on other key parameters and on each other.
Relative power directly impacts fuel temperature and void fraction, which then impacts
pressure drop and relative power due to increased neutron absorption. To understand the
first-order cause of the discrepancies between VERA and PARCS/PATHS, standalone
neutronics and thermal hydraulics calculations were performed for assembly type 1.
Figure 29 shows a comparison of relative power and keff predicted by MPACT and
PARCS for assembly type 1 at a void fraction of 40%, while Figure 30 through Figure 32

92
Figure 29: Comparison of relative power and keff predictions from MPACT and PARCS
for assembly type 1
Figure 30: Comparison of void fraction and outlet equilibrium quality predicted by CTF
and PATHS for assembly type 1

93
Figure 31: Comparison of pressure drop predicted by CTF and PATHS for assembly type
1
Figure 32: Comparison of average fuel temperature predicted by CTF and PATHS for
assembly type 1
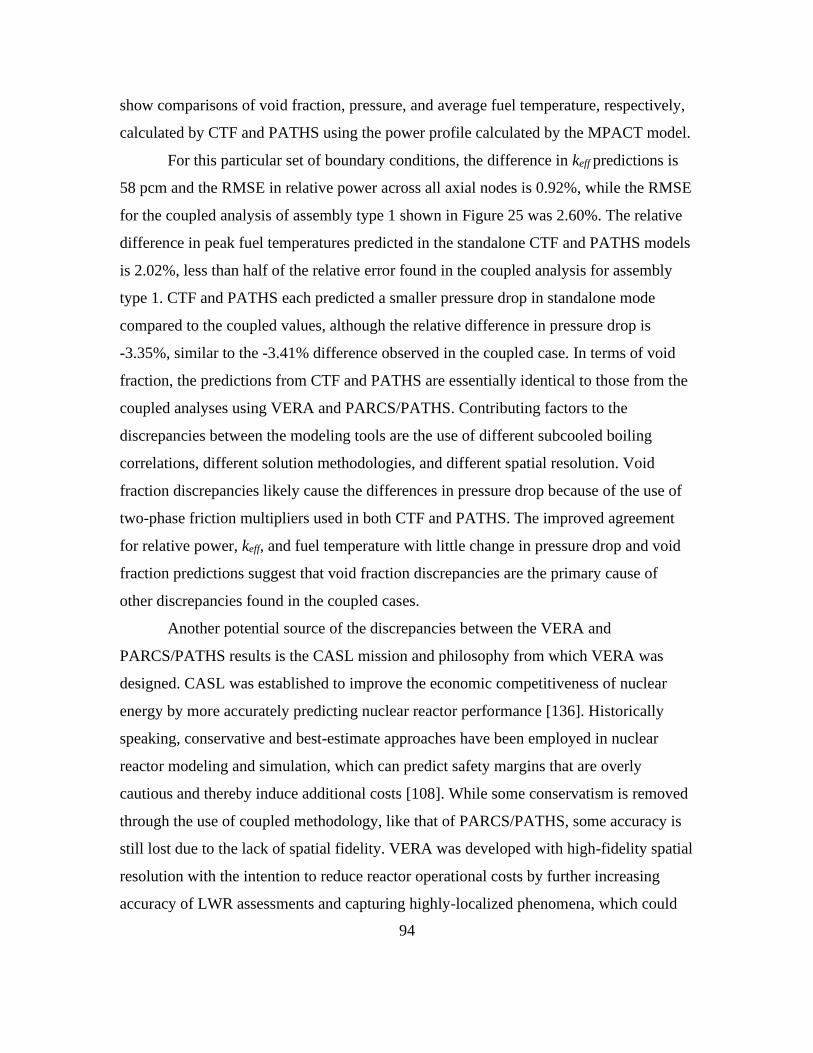
94
show comparisons of void fraction, pressure, and average fuel temperature, respectively,
calculated by CTF and PATHS using the power profile calculated by the MPACT model.
For this particular set of boundary conditions, the difference in keff predictions is
58 pcm and the RMSE in relative power across all axial nodes is 0.92%, while the RMSE
for the coupled analysis of assembly type 1 shown in Figure 25 was 2.60%. The relative
difference in peak fuel temperatures predicted in the standalone CTF and PATHS models
is 2.02%, less than half of the relative error found in the coupled analysis for assembly
type 1. CTF and PATHS each predicted a smaller pressure drop in standalone mode
compared to the coupled values, although the relative difference in pressure drop is
-3.35%, similar to the -3.41% difference observed in the coupled case. In terms of void
fraction, the predictions from CTF and PATHS are essentially identical to those from the
coupled analyses using VERA and PARCS/PATHS. Contributing factors to the
discrepancies between the modeling tools are the use of different subcooled boiling
correlations, different solution methodologies, and different spatial resolution. Void
fraction discrepancies likely cause the differences in pressure drop because of the use of
two-phase friction multipliers used in both CTF and PATHS. The improved agreement
for relative power, keff, and fuel temperature with little change in pressure drop and void
fraction predictions suggest that void fraction discrepancies are the primary cause of
other discrepancies found in the coupled cases.
Another potential source of the discrepancies between the VERA and
PARCS/PATHS results is the CASL mission and philosophy from which VERA was
designed. CASL was established to improve the economic competitiveness of nuclear
energy by more accurately predicting nuclear reactor performance [136]. Historically
speaking, conservative and best-estimate approaches have been employed in nuclear
reactor modeling and simulation, which can predict safety margins that are overly
cautious and thereby induce additional costs [108]. While some conservatism is removed
through the use of coupled methodology, like that of PARCS/PATHS, some accuracy is
still lost due to the lack of spatial fidelity. VERA was developed with high-fidelity spatial
resolution with the intention to reduce reactor operational costs by further increasing
accuracy of LWR assessments and capturing highly-localized phenomena, which could

95
potentially result in stronger negative feedback from local void and fuel temperature. It is
possible that some of the discrepancies between VERA and PARCS/PATHS, which
showed that VERA always predicted lower relative power and peak fuel temperatures,
may be the result of reduced conservatism from higher-order multiphysics solution
methods and finer spatial resolution.
4.5 SiC/SiC Channel Box Analysis using VERA
4.5.1 Evaluation of SiC/SiC Channel Box
Figure 33 through Figure 35 show the 3-D spatial distribution of the fast neutron
flux in a BWR channel box for the fully withdrawn control blade, the partially inserted
control blade and the fully inserted control blade positioning, respectively. The
distributions using the 0.067 MeV and 0.183 MeV neutron energy cutoffs are both
shown, as is the percent difference between using these two different energy cutoff
values. The difference in fast flux between the two cutoffs is spatially dependent and
ranges from approximately 4% to 17%, depending on the control blade position. All four
sides of the channel box are shown for a clear visualization of the radial heterogeneity in
the flux distributions. The side numbers correspond to those that were shown in Figure
20. Figure 36 through Figure 38 show the temperature distributions in the channel box for
the fully withdrawn, partially inserted, and fully inserted control blade positions,
respectively.
Figure 33 through Figure 38 show that there is significant axial variation in the
fast flux and temperature, regardless of the control blade position. The axial gradient is
most pronounced when the control blade is partially inserted, since this position causes a
top-heavy power shape in the fuel assembly. The radial gradient in fast flux and
temperature becomes most pronounced when the control blade is fully inserted because
the power is most depressed along the two sides of the assembly adjacent to the control
blade wings. Linearly interpolating between the maximum flux values calculated using
the two different neutron energy cutoffs (1.804 × 10¹⁴ neutrons/cm2-s for the 0.067 MeV
cutoff and 1.502 × 10¹⁴ neutrons/cm2-s for the 0.183 MeV cutoff) gives an estimate of the
flux at a 0.1 MeV neutron energy cutoff of 1.644 × 10¹⁴ neutrons/cm2-s. This value is
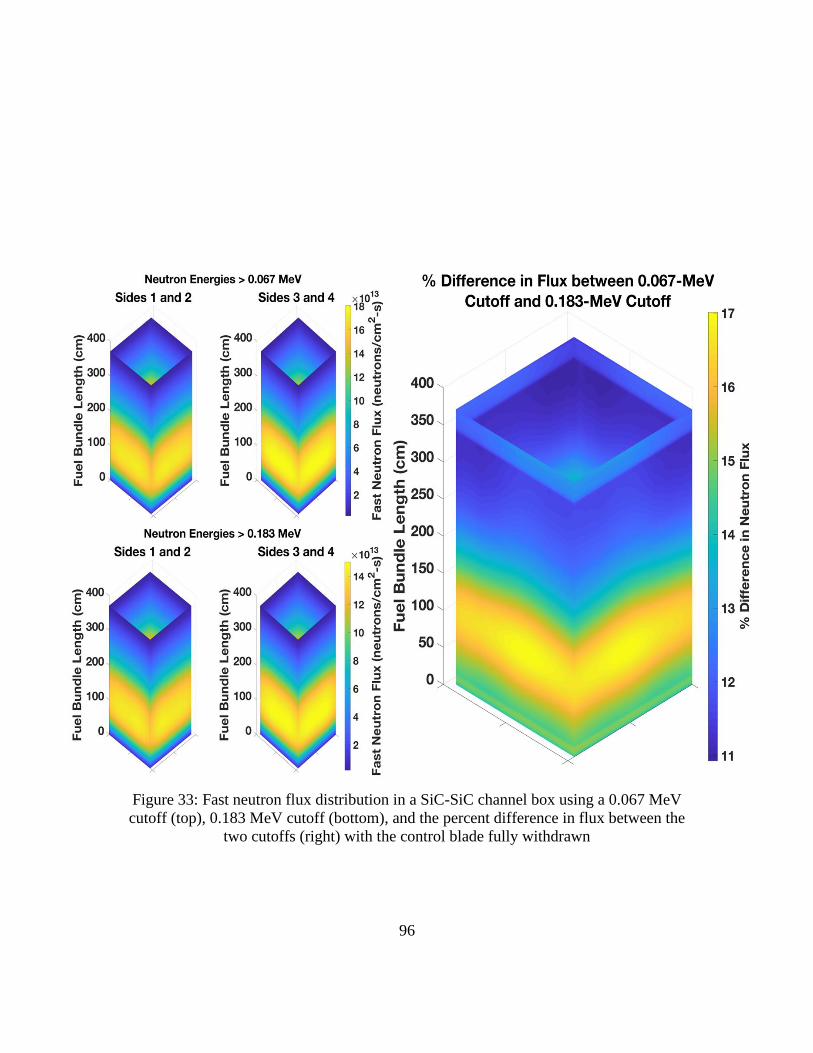
96
Figure 33: Fast neutron flux distribution in a SiC-SiC channel box using a 0.067 MeV
cutoff (top), 0.183 MeV cutoff (bottom), and the percent difference in flux between the
two cutoffs (right) with the control blade fully withdrawn

97
Figure 34: Fast neutron flux distribution in a SiC-SiC channel box using a 0.067 MeV
cutoff (top), 0.183 MeV cutoff (bottom), and the percent difference in flux between the
two cutoffs (right) with the control blade halfway inserted
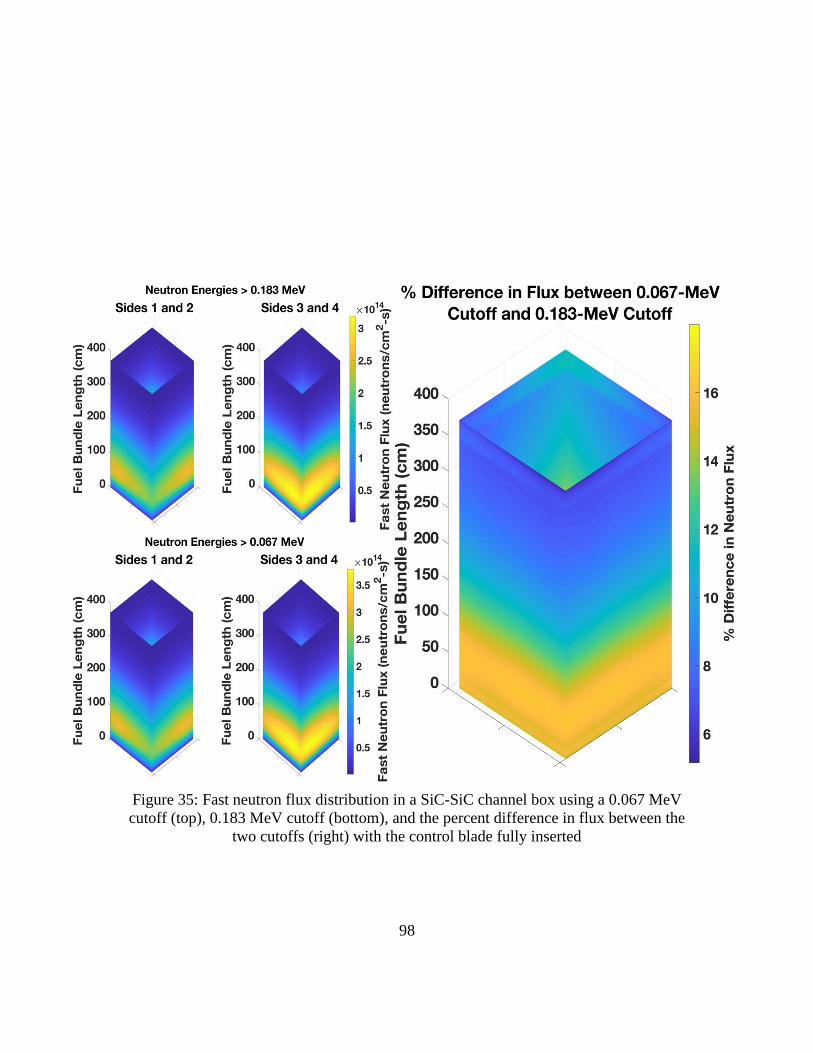
98
Figure 35: Fast neutron flux distribution in a SiC-SiC channel box using a 0.067 MeV
cutoff (top), 0.183 MeV cutoff (bottom), and the percent difference in flux between the
two cutoffs (right) with the control blade fully inserted
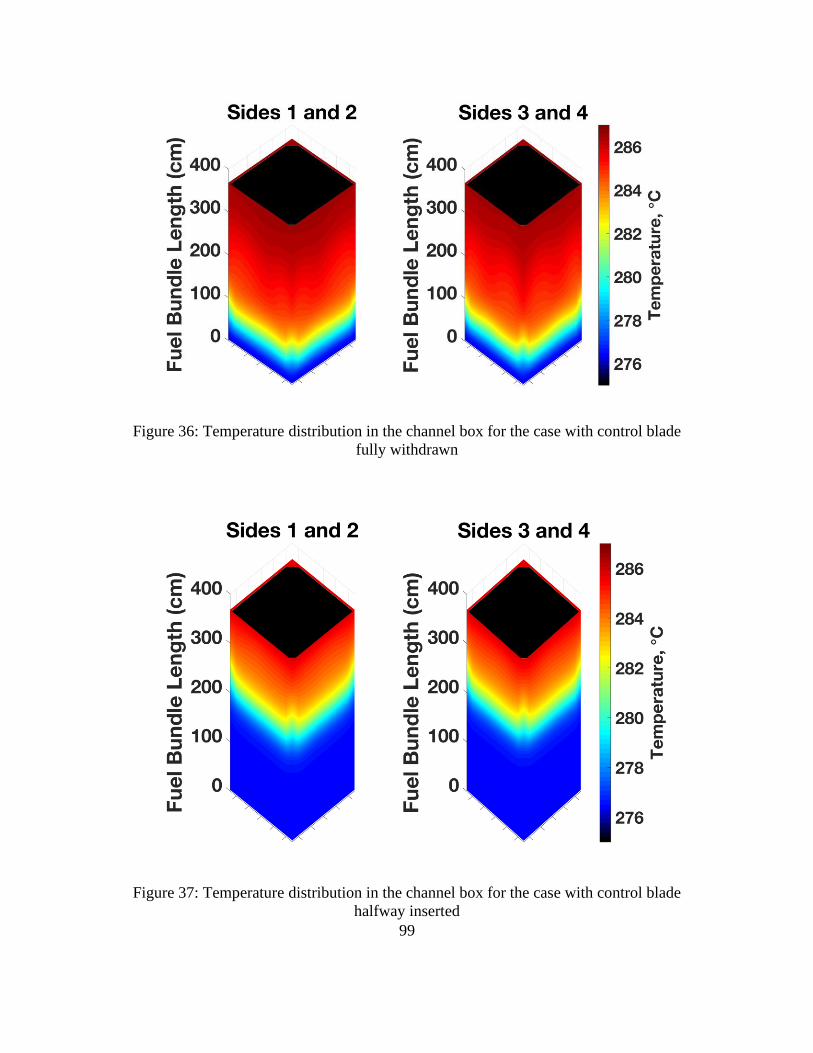
99
Figure 36: Temperature distribution in the channel box for the case with control blade
fully withdrawn
Figure 37: Temperature distribution in the channel box for the case with control blade
halfway inserted
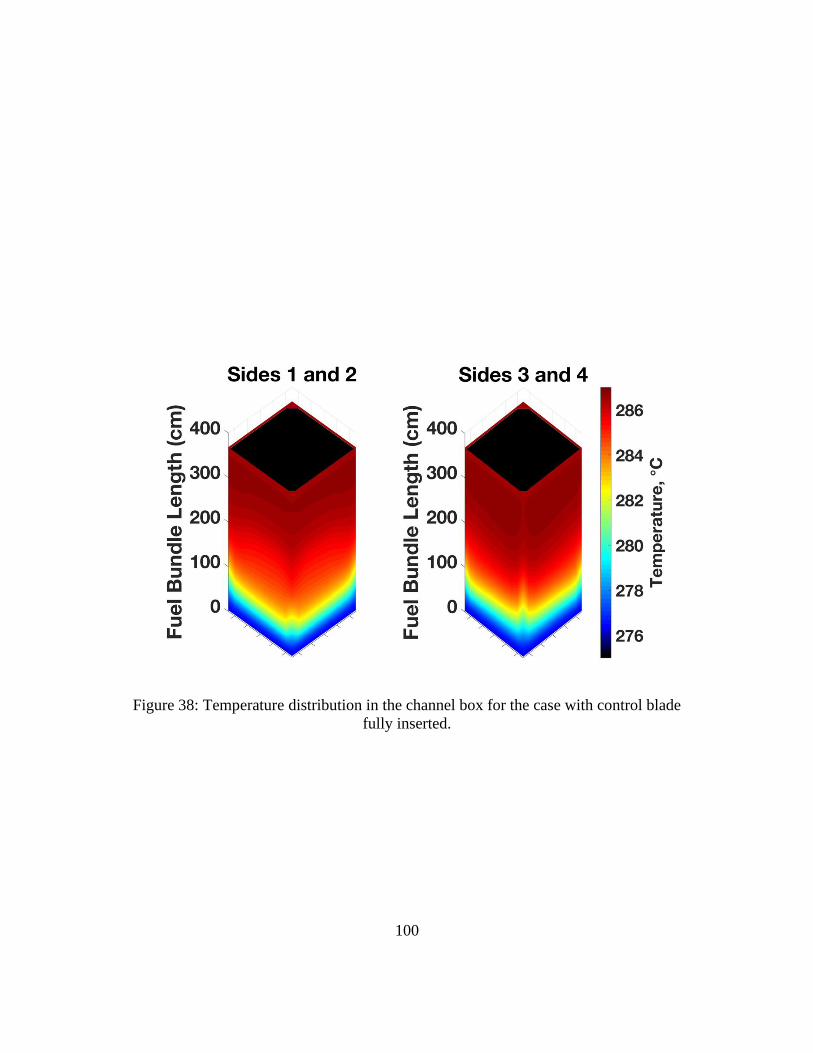
100
Figure 38: Temperature distribution in the channel box for the case with control blade
fully inserted.
101
approximately 25% less than the peak fast flux calculated in previous work using CTF
and Serpent [36]. The difference in peak flux values is caused by using a 3-D method
with pin-resolved thermal hydraulic feedback in this study versus a 2-D method using
interpolation and averaged thermal hydraulic parameters in the previous study.
The sixteen-assembly mini-core model which contains the control cell previously
shown in Figure 21 was ran with SiC/SiC channel boxes surrounding each fuel assembly.
Only the case with a fully inserted control blade using 0.067 MeV as the fast neutron
cutoff energy has been considered. Fast neutron flux in the channel boxes ranges from
8.34×10¹¹ to 4.24×10¹⁴ neutrons/cm2-s with an average value of 1.81×10¹⁴ neutrons/cm2-
s. Figure 39 shows the relative difference of the fast neutron flux from the average value
in the SiC/SiC channel boxes. The assembly number designations correspond to those in
Figure 21 with Assembly 4 (prominent on the right-hand side of the figure) being closest
to the control blade location and Assembly 1 (prominent on the left-hand side of the
figure) being the farthest from the control blade The flux gradient ranges from an
approximately -99% to 135% difference from the average value, and the figure highlights
the significant axial and radial gradient in fast flux that contributes to channel box
deformation. Three-dimensional distributions of temperature in the SiC/SiC channel
boxes are shown in Figure 40 with the control blade fully inserted.
Figure 39 and Figure 40 show the expected behavior caused by the control blade:
the fast flux and temperature are lowest on right-hand side of the figures, which depict
the two faces of Assembly 4 nearest the blade. Gradients in the fast neutron flux are the
first order cause of channel box deformation, so these results indicate that the Assembly 4
channel box may undergo the most deformation since it has the greatest radial fast flux
gradient. Additionally, temperature gradients are the cause of residual deformation once
irradiation swelling occurs in the entire channel box, so Assembly 4 may also have the
largest degree of post-saturation deformation. However, further analyses are required to
confirm these hypotheses.
The purpose of calculating these fast neutron flux and temperature distributions is
to use them as boundary conditions in other computational assessments of SiC/SiC
channel boxes. One such assessment is the deformation of SiC/SiC channel boxes, which

102
Figure 39: Fast flux distribution in a control cell with a fully inserted control blade
Figure 40: Temperature distribution in a control cell with a fully inserted control blade
103
is caused by irradiation swelling and is a strong function of fast neutron flux gradients.
The fast flux and temperature distributions shown in Figure 33 through Figure 38 were
used as boundary conditions in an Abuqus finite difference model developed by Singh et
al. [17] that utilized fast flux dependent correlations to calculate channel box deformation
over time. Figure 41 shows the total lateral displacement calculated by Singh et al. [17]
as a function of time for each control blade configuration and fast flux energy cutoff.
At a high level, this analysis highlights the advanced modeling features available
in VERA while also assessing a potential ATF concept. Although a specific case study is
presented here, these results pave the way for a number of future studies that take into
account other spatial and temporal effects such as control blade history, fuel assembly
location within the core, and core shuffling. A primary contribution of this study is an
initial assessment of an advanced multiphysics modeling tool through comparisons to
currently used regulatory analysis and Monte Carlo tools. The comparisons were
favorable and add confidence to the use of VERA for BWR applications. Following the
assessments, VERA was used to generate temperature and fast neutron flux boundary
conditions in SiC/SiC channel boxes in both single and multiple fuel assmebly models for
a variety of control blade configurations. The generation of these boundary conditions
using a high-fidelity multiphysics tool is an additional key contribution of this work.

104
Figure 41: Total lateral displacement of SiC/SiC channel box as a function of time and
control blade configuration [17]

105
CHAPTER 5
REACTOR PERFORMANCE AND SAFETY CHARACTERISTICS
OF THN-UN FUEL CONCEPTS IN A PWR
5.1 Motivation for ThN-UN
Among the ATF candidates considered in research and development efforts are
composite fuels with UN as one phase. UN fuel provides several advantages over UO2,
most notably a significantly higher thermal conductivity and higher uranium density. UN,
though, is known to chemically react and deteriorate in water, and has been shown to do
so under water pressure and temperature representative of LWR operating conditions
[66], [67], [162], [163]. To combat the reactivity of UN with water, research efforts have
investigated the benefits of mixing UN with other fuel forms, such as UO2 [164], [165]
and another ATF candidate, U3Si2, driven by the hypothesis that UO2 or U3Si2 may shield
UN from degradation in water [26], [166], [163]. However, later experiments at the Los
Alamos National Laboratory showed that U3Si2 may pulverize and wash out when
exposed to PWR coolant chemistry within 30 days at 300C and can be severely
degraded after 1 hour of coolant exposure at 350C [162], [167].
Another potential composite phase that may shield UN from reacting with water
is ThN. The potential benefits and challenges of a thorium-based fuel form were
highlighted in Section 2.2.3. To reiterate, the primary benefits of ThN are its thermal
conductivity that is greater than both UO2 and UN and its high melting point. The high
thermal conductivity and melting point of both ThN and UN should lead to lower
homologous temperatures in a reactor, thus increasing the thermal margin to fuel melt.
Further, high thermal conductivity leads to reduced thermal stresses, energy storage, and
fission product release in the fuel. Each of these characteristics are beneficial from a
reactor performance and safety standpoint [9], [10], [32], [35]. However, thorium is not
fissile or fissionable and must transmute to 233U to become fissile. The uranium in UN
can provide the neutron source to cause the transmutation, but the introduction of thorium
into the fuel will require the use of HALEU that has 235U enrichment between 5 and 20%.
106
This chapter presents a preliminary analysis of homogenously mixed ThN-UN
fuels in a typical PWR pin-cell model. MPACT was used to determine ThN-UN mixture
ratios and corresponding 235U enrichments needed to match the cycle length of
conventional UO2 fuel. For verification purposes, these cycle length calculations were
compared with results from the Monte Carlo code Serpent. FTC, MTC, SBC, and control
rod worth were all determined using MPACT. Further, a comparison of cycle length and
reactivity coefficients for ThN-UN fuels that used natural nitrogen, which is almost 100%
14N, and 100% enriched 15N was made. Finally, a thermal hydraulic performance
comparison between the ThN-UN mixtures and the UO2 baseline was made that focused
on homologous temperature. This comparison was made using the coupled neutronics
and thermal hydraulics capabilities of MPACT and CTF within CASL VERA.
5.2 ThN-UN Fuel Composition for UO2 Cycle Length Matching
5.2.1 Pin-cell Model Descriptions
Two-dimensional PWR pin-cell models were developed in MPACT to determine
the combinations of ThN-UN and 235U enrichments needed to match the cycle length of a
pin-cell with 4.90 wt% enriched UO2 using a 252-group ENDF/B-VII.1 nuclear cross
section library [156]. The pin-cell models include a fuel pellet, helium-filled pellet-
cladding gap, Zircaloy-4 cladding, and coolant. Table 11 lists the dimensions of the pin-
cell model, which are based on the Westinghouse AP1000 design [168].
The P2 approximation was used for scattering, and all models treated the 232Th
and 238U resonances explicitly rather than lumping them together. MPACT was chosen as
the primary tool for this analysis due to its speed as a deterministic code, its LWR-
focused development, and its ease of coupling to the thermal hydraulic sub-channel code
CTF within CASL’s VERA. Reflective boundary conditions were applied on all sides of
the model. After running the models, the burnup, cycle length, and infinite multiplication
factors were adjusted by assuming a three-batch fuel management scheme and 3%
neutron leakage, both of which are typical values for large PWRs [169], [170]. A fuel
temperature of 900 K was used, and all other temperatures in the model were set to the
AP1000 inlet temperature of 552.6 K (535.0°F). The same power density in W/cm3

107
Table 11: Dimensions of PWR pin-cell model
Parameter Value (cm)
Fuel pellet radius 0.4096
Pellet-cladding gap thickness 0.0084
Cladding thickness 0.057
Height 1.0
Pin pitch 1.26
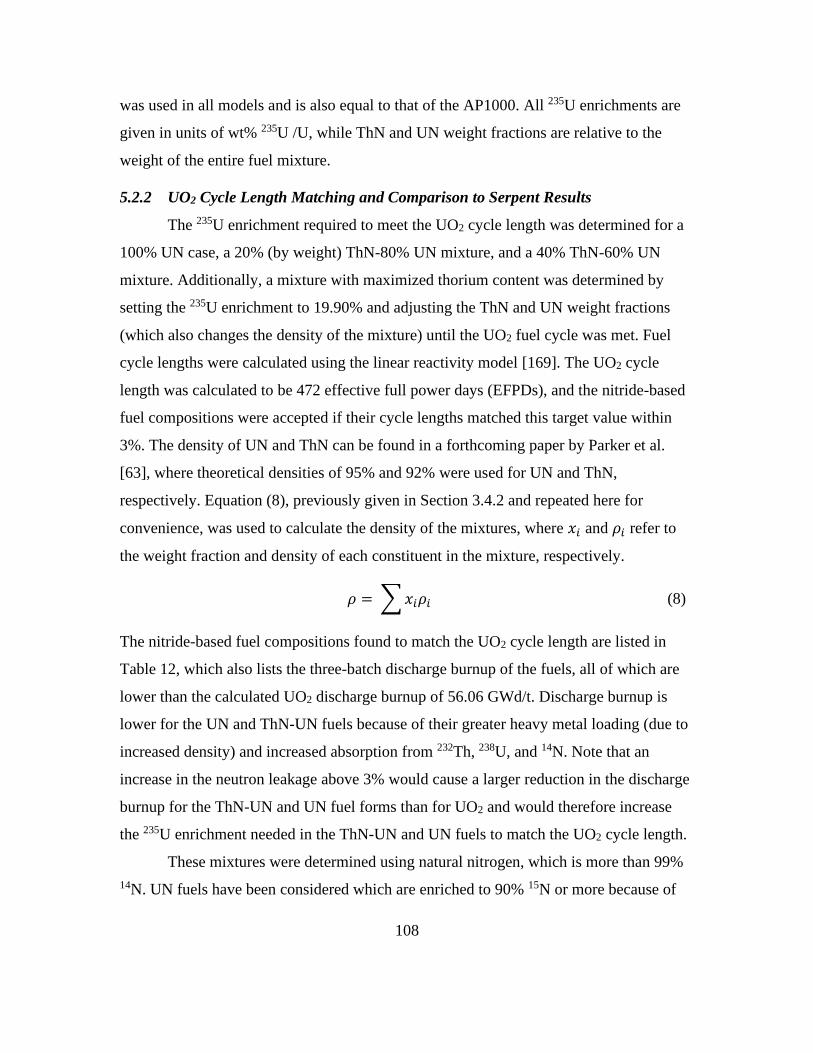
108
was used in all models and is also equal to that of the AP1000. All 235U enrichments are
given in units of wt% 235U /U, while ThN and UN weight fractions are relative to the
weight of the entire fuel mixture.
5.2.2 UO2 Cycle Length Matching and Comparison to Serpent Results
The 235U enrichment required to meet the UO2 cycle length was determined for a
100% UN case, a 20% (by weight) ThN-80% UN mixture, and a 40% ThN-60% UN
mixture. Additionally, a mixture with maximized thorium content was determined by
setting the 235U enrichment to 19.90% and adjusting the ThN and UN weight fractions
(which also changes the density of the mixture) until the UO2 fuel cycle was met. Fuel
cycle lengths were calculated using the linear reactivity model [169]. The UO2 cycle
length was calculated to be 472 effective full power days (EFPDs), and the nitride-based
fuel compositions were accepted if their cycle lengths matched this target value within
3%. The density of UN and ThN can be found in a forthcoming paper by Parker et al.
[63], where theoretical densities of 95% and 92% were used for UN and ThN,
respectively. Equation (8), previously given in Section 3.4.2 and repeated here for
convenience, was used to calculate the density of the mixtures, where 𝑥𝑖 and 𝜌𝑖 refer to
the weight fraction and density of each constituent in the mixture, respectively.
𝜌 = ∑ 𝑥𝑖𝜌𝑖 (8)
The nitride-based fuel compositions found to match the UO2 cycle length are listed in
Table 12, which also lists the three-batch discharge burnup of the fuels, all of which are
lower than the calculated UO2 discharge burnup of 56.06 GWd/t. Discharge burnup is
lower for the UN and ThN-UN fuels because of their greater heavy metal loading (due to
increased density) and increased absorption from 232Th, 238U, and 14N. Note that an
increase in the neutron leakage above 3% would cause a larger reduction in the discharge
burnup for the ThN-UN and UN fuel forms than for UO2 and would therefore increase
the 235U enrichment needed in the ThN-UN and UN fuels to match the UO2 cycle length.
These mixtures were determined using natural nitrogen, which is more than 99%
14N. UN fuels have been considered which are enriched to 90% 15N or more because of

109
Table 12: ThN-UN mixtures that approximately match the UO2 cycle length
Thorium
Content (wt%)
UN content
(wt%)
235U
Enrichment
(wt% 235U/U)
Cycle Length
(EFPD)
Discharge
Burnup
(GWd/t)
20.0 80.0 7.80 471 41.81
40.0 60.0 11.10 472 43.68
66.0 34.0 19.90 469 45.99
0 100 5.20 470 38.04

110
its smaller absorption cross section in the thermal region compared to 14N [163], [171],
but doing so increases production costs, and natural nitrogen is the current default in the
VERA modeling suite. N-15 enrichment is also preferable because of the (n,p) reaction
that occurs in 14N, which produces the radioactive 14C and poses a disposal issue. Brown,
Todosow, and Cuadra [26] consider the neutronic penalty caused by using natural
nitrogen rather than 15N enrichment. Section 5.3.2 of this article recalculates the 235U
enrichments needed to match the UO2 cycle length for 20% ThN-80% UN, 40% ThN-
60% UN, and UN cases, as well as the maximum possible weight fraction of ThN for a
235U enrichment of 19.90% using 100% enriched 15N.
Because MPACT is a deterministic code optimized for LWR analysis and traditional UO2
fuel, the predictions of keff as a function of burnup for the ThN-UN mixtures are
compared to predictions by the Monte Carlo code Serpent for verification. Figure 42
shows a comparison of the three-batch multiplication factor throughout the cycle as
predicted by MPACT and Serpent, as well as the absolute difference between the two
codes in pcm for UO2, UN, and all ThN-UN mixtures. A neutron leakage of 3% is
assumed in Figure 42. At beginning of cycle (BOC), the difference in keff between the two
codes is 100–500 pcm for all cases. Brown et al. (2014) [163] show that differences in keff
calculated by Serpent and TRITON for UN fuels of varying densities at BOC were
between 290 and 327 pcm when a 238-group cross section library was used in TRITON.
Serpent predicted a greater keff at BOC but a smaller keff at end of cycle (EOC) for all
cases. Note that the Serpent continuous energy library is based on the ENDF/B-VII.0 data
library [157], whereas the MPACT models used ENDF/B-VII.1 data, which may explain
some of the differences between predictions from the two codes. The behavior trends
between the two codes were consistent across each enrichment and fuel type considered.
A comparison of the 232Th and 233U mass throughout the cycle calculated by MPACT and
Serpent is shown in Figure 43. The relative difference in mass calculations between
MPACT and Serpent is less than 1.2% for 233U and less than approximately 0.03% for
232Th across all burnup steps.

111
Figure 42: Comparison of keff calculated by MPACT and Serpent for a) UO2, b) 20%
ThN-80% UN, c) 40% ThN-60% UN, d) 66% ThN-34% UN, and e) UN

112
Figure 43: Comparison of 232Th and 233U mass as a function of burnup
in the 66% ThN, 34% UN mixture
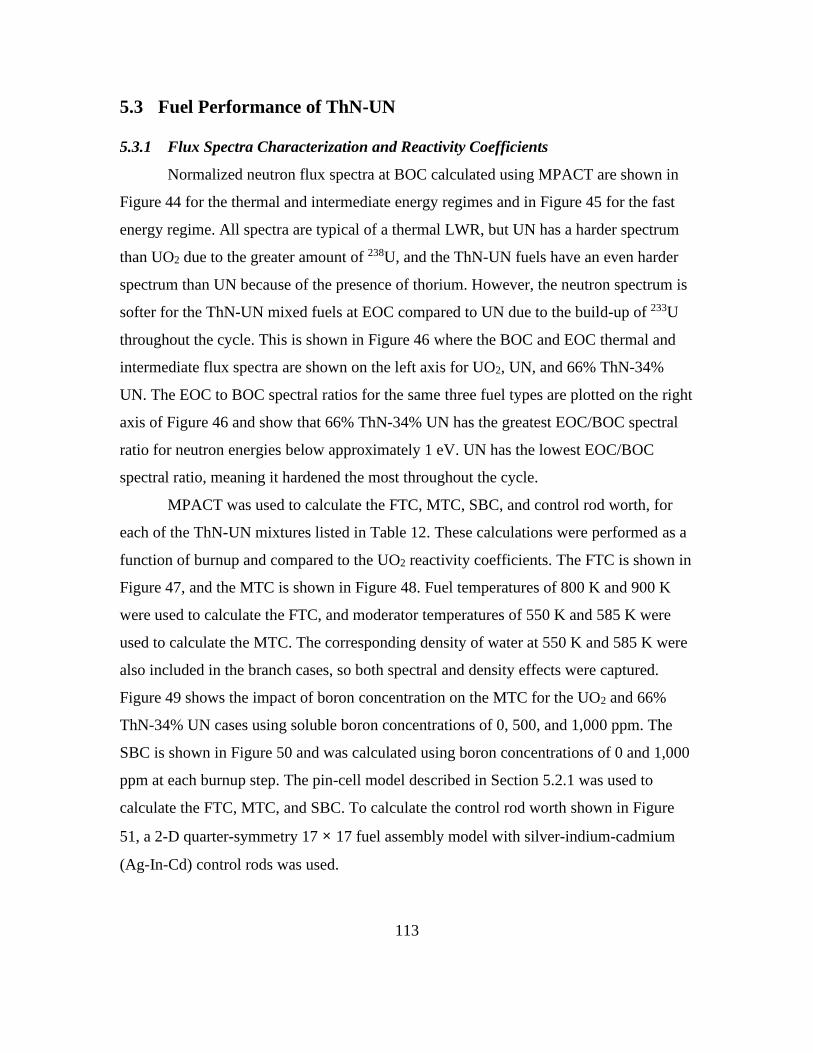
113
5.3 Fuel Performance of ThN-UN
5.3.1 Flux Spectra Characterization and Reactivity Coefficients
Normalized neutron flux spectra at BOC calculated using MPACT are shown in
Figure 44 for the thermal and intermediate energy regimes and in Figure 45 for the fast
energy regime. All spectra are typical of a thermal LWR, but UN has a harder spectrum
than UO2 due to the greater amount of 238U, and the ThN-UN fuels have an even harder
spectrum than UN because of the presence of thorium. However, the neutron spectrum is
softer for the ThN-UN mixed fuels at EOC compared to UN due to the build-up of 233U
throughout the cycle. This is shown in Figure 46 where the BOC and EOC thermal and
intermediate flux spectra are shown on the left axis for UO2, UN, and 66% ThN-34%
UN. The EOC to BOC spectral ratios for the same three fuel types are plotted on the right
axis of Figure 46 and show that 66% ThN-34% UN has the greatest EOC/BOC spectral
ratio for neutron energies below approximately 1 eV. UN has the lowest EOC/BOC
spectral ratio, meaning it hardened the most throughout the cycle.
MPACT was used to calculate the FTC, MTC, SBC, and control rod worth, for
each of the ThN-UN mixtures listed in Table 12. These calculations were performed as a
function of burnup and compared to the UO2 reactivity coefficients. The FTC is shown in
Figure 47, and the MTC is shown in Figure 48. Fuel temperatures of 800 K and 900 K
were used to calculate the FTC, and moderator temperatures of 550 K and 585 K were
used to calculate the MTC. The corresponding density of water at 550 K and 585 K were
also included in the branch cases, so both spectral and density effects were captured.
Figure 49 shows the impact of boron concentration on the MTC for the UO2 and 66%
ThN-34% UN cases using soluble boron concentrations of 0, 500, and 1,000 ppm. The
SBC is shown in Figure 50 and was calculated using boron concentrations of 0 and 1,000
ppm at each burnup step. The pin-cell model described in Section 5.2.1 was used to
calculate the FTC, MTC, and SBC. To calculate the control rod worth shown in Figure
51, a 2-D quarter-symmetry 17 × 17 fuel assembly model with silver-indium-cadmium
(Ag-In-Cd) control rods was used.

114
Figure 44: Thermal and intermediate neutron flux spectra at BOC for UO2, UN, and ThN-
UN mixtures
Figure 45: Fast neutron flux spectra at BOC for UO2, UN, and ThN-UN mixtures
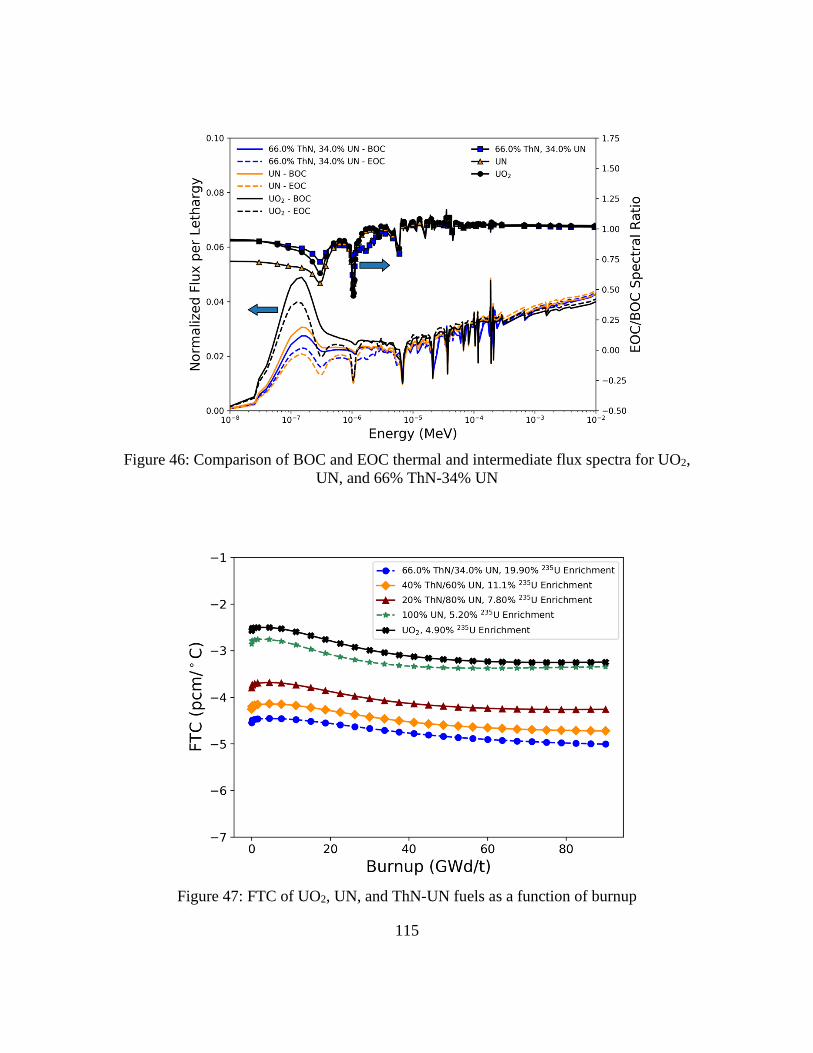
115
Figure 46: Comparison of BOC and EOC thermal and intermediate flux spectra for UO2,
UN, and 66% ThN-34% UN
Figure 47: FTC of UO2, UN, and ThN-UN fuels as a function of burnup
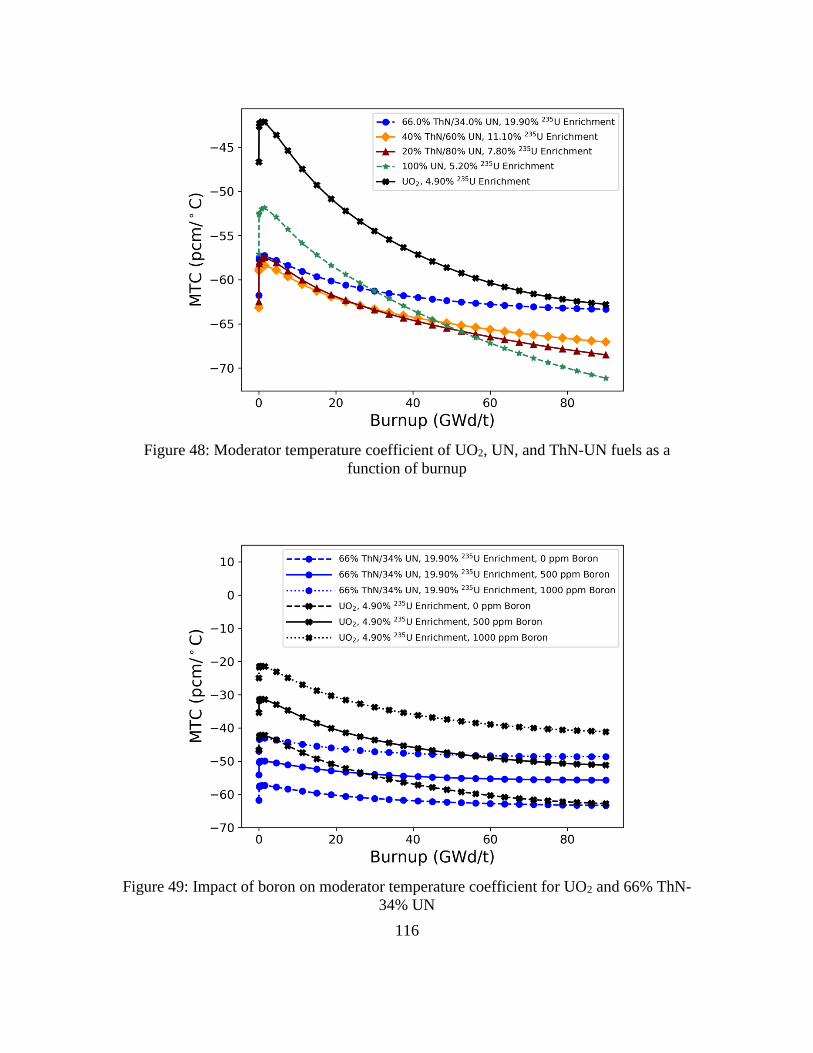
116
Figure 48: Moderator temperature coefficient of UO2, UN, and ThN-UN fuels as a
function of burnup
Figure 49: Impact of boron on moderator temperature coefficient for UO2 and 66% ThN-
34% UN
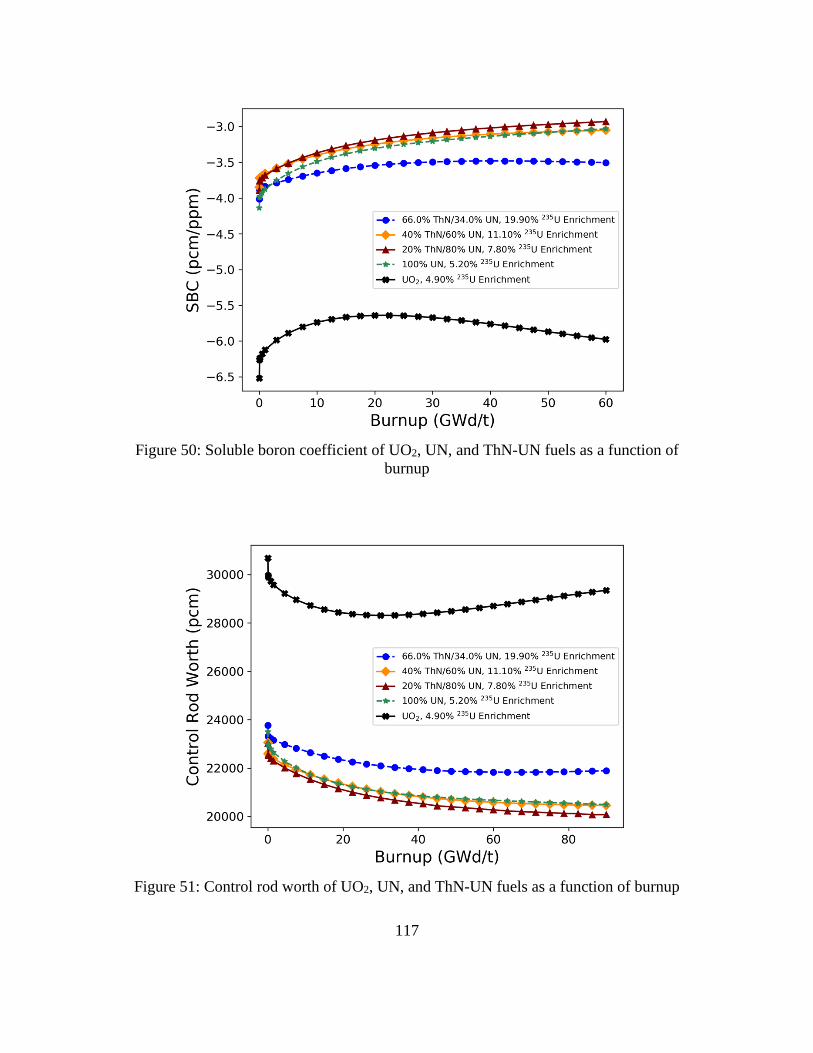
117
Figure 50: Soluble boron coefficient of UO2, UN, and ThN-UN fuels as a function of
burnup
Figure 51: Control rod worth of UO2, UN, and ThN-UN fuels as a function of burnup
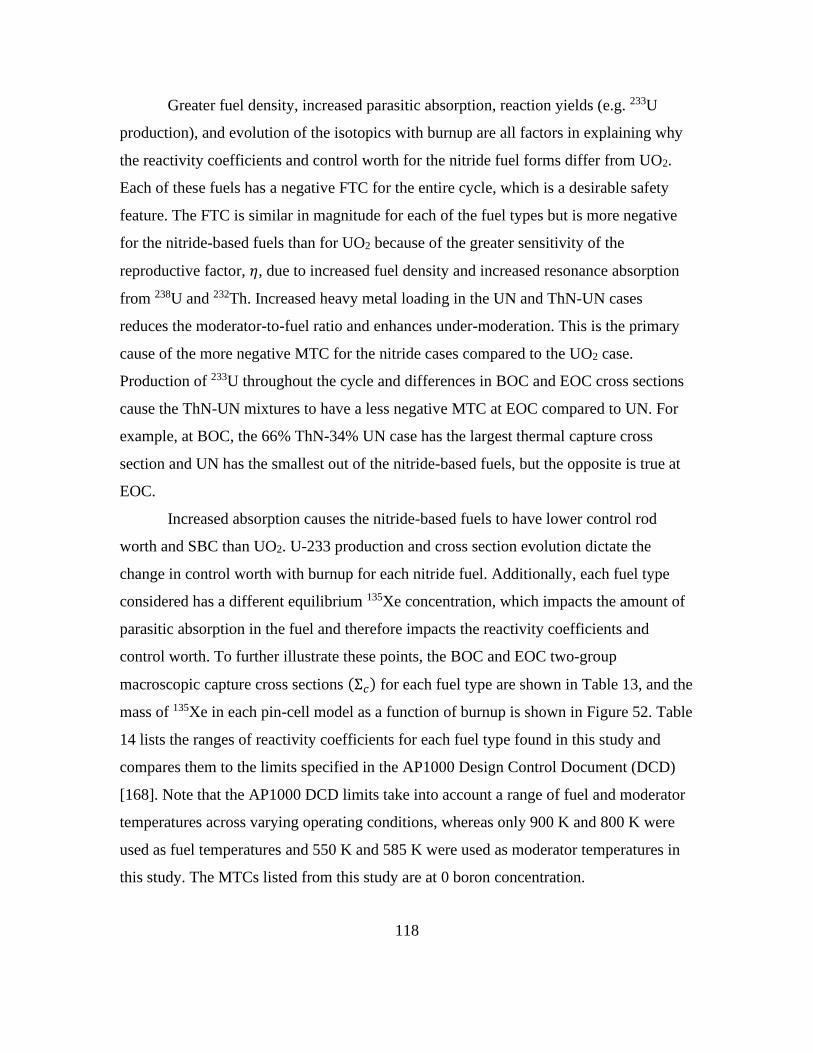
118
Greater fuel density, increased parasitic absorption, reaction yields (e.g. 233U
production), and evolution of the isotopics with burnup are all factors in explaining why
the reactivity coefficients and control worth for the nitride fuel forms differ from UO2.
Each of these fuels has a negative FTC for the entire cycle, which is a desirable safety
feature. The FTC is similar in magnitude for each of the fuel types but is more negative
for the nitride-based fuels than for UO2 because of the greater sensitivity of the
reproductive factor, 𝜂, due to increased fuel density and increased resonance absorption
from 238U and 232Th. Increased heavy metal loading in the UN and ThN-UN cases
reduces the moderator-to-fuel ratio and enhances under-moderation. This is the primary
cause of the more negative MTC for the nitride cases compared to the UO2 case.
Production of 233U throughout the cycle and differences in BOC and EOC cross sections
cause the ThN-UN mixtures to have a less negative MTC at EOC compared to UN. For
example, at BOC, the 66% ThN-34% UN case has the largest thermal capture cross
section and UN has the smallest out of the nitride-based fuels, but the opposite is true at
EOC.
Increased absorption causes the nitride-based fuels to have lower control rod
worth and SBC than UO2. U-233 production and cross section evolution dictate the
change in control worth with burnup for each nitride fuel. Additionally, each fuel type
considered has a different equilibrium 135Xe concentration, which impacts the amount of
parasitic absorption in the fuel and therefore impacts the reactivity coefficients and
control worth. To further illustrate these points, the BOC and EOC two-group
macroscopic capture cross sections (Σ𝑐) for each fuel type are shown in Table 13, and the
mass of 135Xe in each pin-cell model as a function of burnup is shown in Figure 52. Table
14 lists the ranges of reactivity coefficients for each fuel type found in this study and
compares them to the limits specified in the AP1000 Design Control Document (DCD)
[168]. Note that the AP1000 DCD limits take into account a range of fuel and moderator
temperatures across varying operating conditions, whereas only 900 K and 800 K were
used as fuel temperatures and 550 K and 585 K were used as moderator temperatures in
this study. The MTCs listed from this study are at 0 boron concentration.
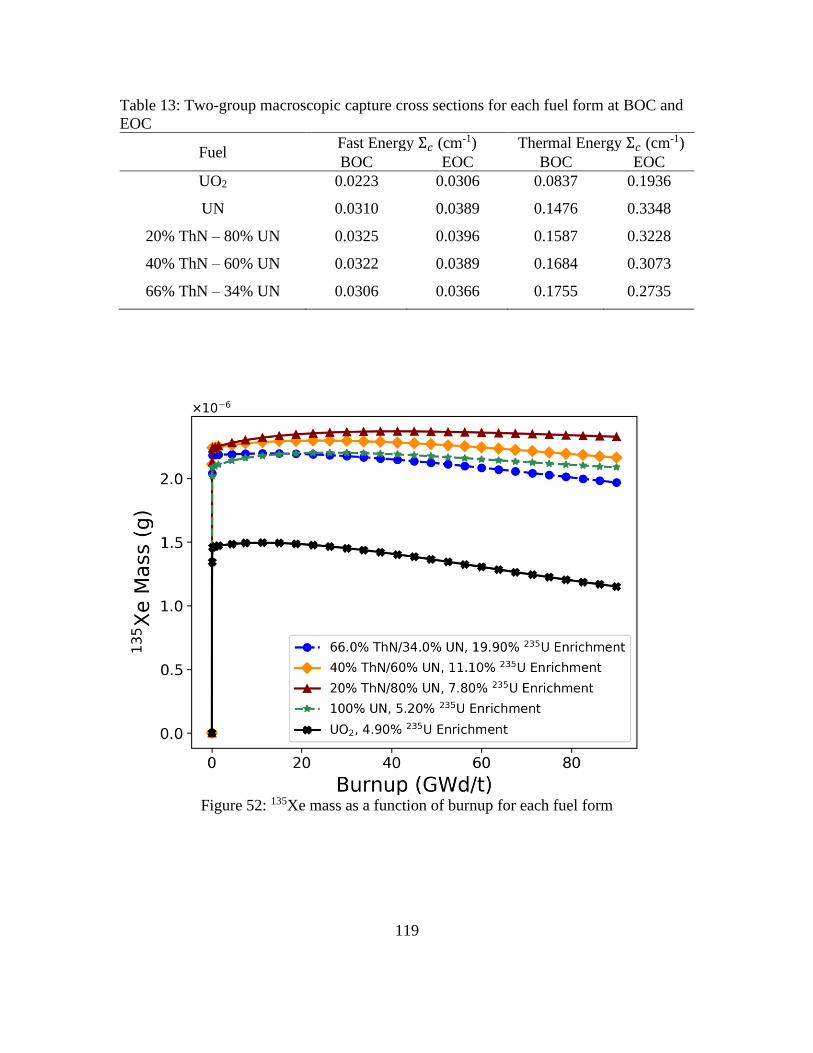
119
Table 13: Two-group macroscopic capture cross sections for each fuel form at BOC and
EOC
Fuel Fast Energy Σ𝑐 (cm-1) Thermal Energy Σ𝑐 (cm-1)
BOC EOC BOC EOC
UO2 0.0223 0.0306 0.0837 0.1936
UN 0.0310 0.0389 0.1476 0.3348
20% ThN – 80% UN 0.0325 0.0396 0.1587 0.3228
40% ThN – 60% UN 0.0322 0.0389 0.1684 0.3073
66% ThN – 34% UN 0.0306 0.0366 0.1755 0.2735
Figure 52: 135Xe mass as a function of burnup for each fuel form
120
Table 14: Comparison of reactivity coefficients to AP1000 DCD limits
Case FTC (pcm/°C) MTC (pcm/°C) SBC (pcm/ppm)
AP1000 DCD -6.3 to -1.8 -72 to 0 -13.5 to -5.0
UO2 -3.3 to -2.5 -62.8 to -42.1 -6.5 to -5.6
UN -3.4 to -2.8 -71.1 to -51.9 -4.1 to -3.0
20% ThN – 80% UN -4.3 to -3.7 -68.5 to -57.5 -3.9 to -2.9
40% ThN – 60% UN -4.7 to -4.1 -67.1 to -58.4 -3.8 to -3.1
66% ThN – 34% UN -5.0 to -4.5 -63.3 to -57.3 -4.0 to -3.5

121
All FTC and MTC values calculated in this study fall within the AP1000 DCD
limits, but the boron coefficients for UN and the ThN-UN mixtures are less negative than
the specified limits. The larger absolute values of the UN and ThN-UN MTCs, along with
the significantly lower control rod worth for these fuels shown in Figure 51, may pose an
issue with shutdown margin. Typically, a shutdown margin of 1.0–1.3% is required under
all reactor conditions, the most limiting of which occur at cold moderator temperatures
such as cold zero power or during a main steam line break in a PWR. In their analysis of
a Th-MOX-fueled PWR core, Fridman and Kliem [172] also predicted a reduced boron
worth and control rod worth in the Th-based fuels compared to a UO2 baseline. They
addressed this problem by suggesting that the soluble boron be enriched to 40% 10B and
by replacing control rods made of Ag-In-Cd, which is the more common control rod
material in current PWRs, with control rods made of higher absorbing B4C. The nitride-
based fuels have less excess reactivity, as was shown in Figure 42, which may help
compensate for the lower boron and control rod worth, but similar design changes may be
required for a ThN-UN-fueled reactor.
5.3.2 Impact of 100% Enriched 15N
All results presented thus far in the study used natural nitrogen, which is primarily
14N, in UN and ThN phases. Previous studies have shown that 15N enrichment boosts
reactor and fuel performance over natural nitrogen since 14N is a significant neutron
absorber at thermal energies [163], [26], [171]. The differences in fuel performance from
using 100% enriched 15N in UN and ThN-UN fuels in terms of required 235U enrichment
and RTCs are quantified in this section.
The 235U enrichments required to approximately match the 4.90%-enriched UO2
cycle length of 472 EFPDs are listed in Table 15. With 100% 15N, the relative decrease in
required 235U enrichment for 20% ThN-80% UN, 40% ThN-60% UN, and UN from the
natural nitrogen cases are 24.4%, 23.4% and 25%, respectively. The maximum possible
ThN weight fraction increased from 66 wt% to 73.5 wt%, a relative increase of 11.4%.
To illustrate the impact of 15N enrichment on RTCs, the 40% ThN-60% UN mixture and
100% UN is considered. Figure 53 shows the FTC as a function of burnup for 40% ThN-

122
Table 15: ThN-UN mixtures with enriched 15N that approximately match the UO2 cycle
length
Thorium Content
(wt%)
UN Content
(wt%)
235U Enrichment
(wt% 235U/U)
Cycle Length
(EFPD)
20.0 80.0 5.90 475
40.0 60.0 8.50 478
73.5 26.5 19.90 480
0 100 3.90 478
Figure 53: FTC for UO2, 40ThN-60UN with natural nitrogen
and 40ThN-60UN with 100% 15N enrichment

123
-60% UN and 100% UN with natural nitrogen and 100% enriched 15N, as well as the UO2
reference case. Similar comparisons are shown in Figure 54–Figure 56 for MTC, SBC,
and control rod worth, respectively. There is little difference in FTC between the natural
nitrogen and enriched 15N cases since this phenomenon is caused by the resonance
broadening of the fertile and fissile material (primarily 238U and 232Th). The MTC is
similar in magnitude between the natural nitrogen and enriched 15N cases since they both
have approximately the same heavy metal loading and therefore the same moderator-to-
fuel ratio. The small increase in the MTC for the enriched 15N cases is due to a lower
equilibrium 135Xe concentration. By enriching the fuel with 15N, the neutron flux
spectrum softens, which increases the worth of soluble boron and the control rods for the
ThN-UN and UN cases. The control worth increases less for UN because it is the denser
fuel, and the absorption from 238U is greater than the combined absorption from 238U and
232Th in the ThN-UN fuel. While the control worth is still not equivalent to that in a UO2
system and is still outside of the AP1000 DCD limits, the shutdown margin issue is
somewhat mitigated by 15N enrichment.
5.3.3 Thermal Performance
A 3-D fuel pin model was developed to evaluate the thermal performance of ThN-
UN fuels relative to UO2. The model utilizes VERA’s thermal–hydraulics–to–neutronics
coupling capability between CTF and MPACT. The fuel pin design is based on the
AP1000 design, with the power and coolant mass flow rate scaled for a single pin and
four surrounding subchannels. The same power density in W/cm3 was used for all fuel
forms. CTF’s dynamic gap conductance model was employed. Built-in thermal properties
for Zircaloy-4 cladding were used for all cases, and built-in properties for UO2 were used
for that case. Crossflow between the four CTF sub-channels was modeled using the CTF-
default single-phase mixing factor of 0.037. The thermal conductivity and heat capacity
for ThN and UN found in the forthcoming paper by Parker et al. [13] were used, and the
thermal properties for the ThN-UN mixtures were estimated for calculation purposes
using the respective volume fractions of each phase. The thermal conductivity and
specific heat capacity of UN, ThN, and the ThN-UN mixtures used in the CTF
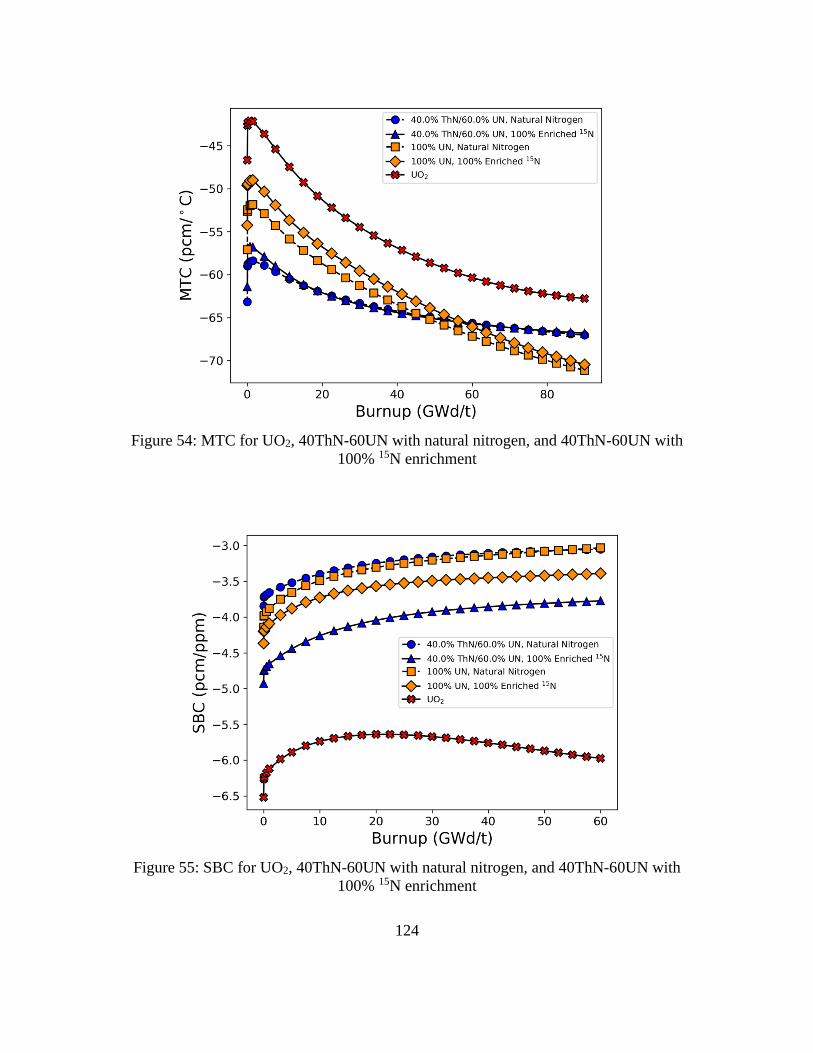
124
Figure 54: MTC for UO2, 40ThN-60UN with natural nitrogen, and 40ThN-60UN with
100% 15N enrichment
Figure 55: SBC for UO2, 40ThN-60UN with natural nitrogen, and 40ThN-60UN with
100% 15N enrichment
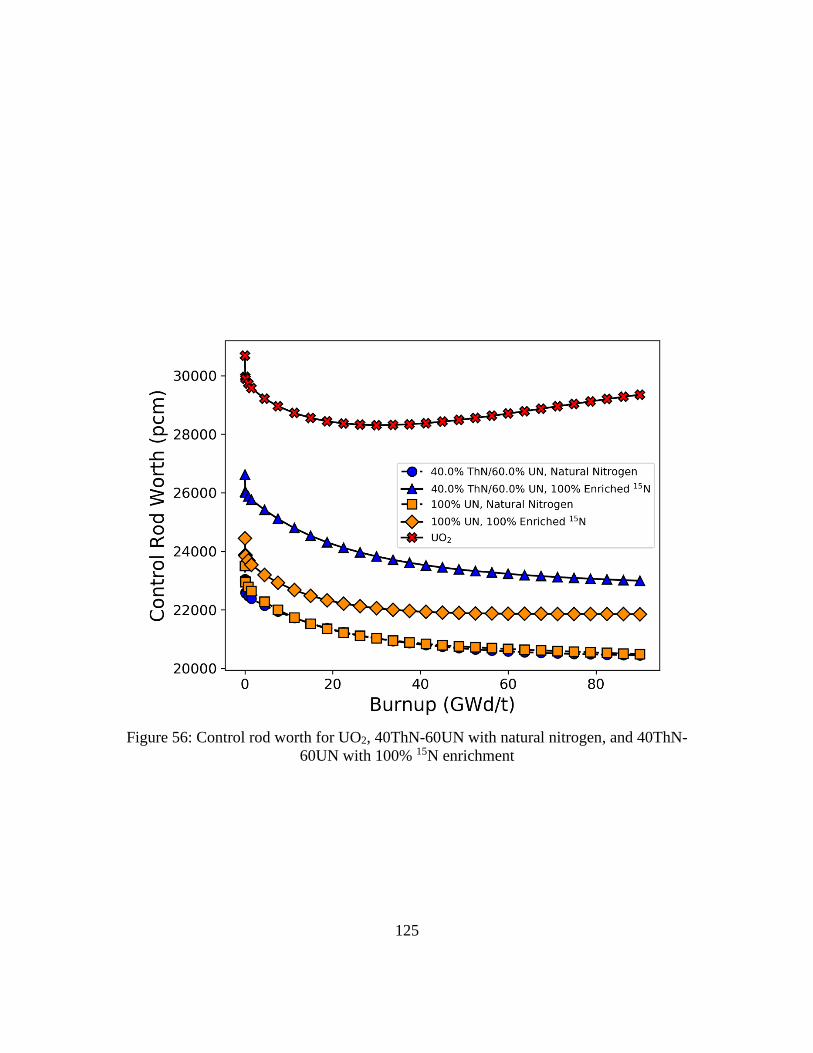
125
Figure 56: Control rod worth for UO2, 40ThN-60UN with natural nitrogen, and 40ThN-
60UN with 100% 15N enrichment

126
models are shown in Figure 57 and Figure 58, respectively.
Figure 59 presents the calculated axial dependence of homologous temperature in
the fuel pin for the different fuel forms at BOC, and the maximum homologous
temperature as a function of burnup for each fuel form is shown in Figure 60. The
homologous temperature is the ratio of the maximum fuel temperature (fuel centerline
temperature) to the melting (or disassociation) temperature of the fuel. For UO2 and
100% UN, a melting temperature of 3,123.2 K (2,850°C) was used, and for the ThN
mixtures, a melting temperature of 3,063.2 K (2,790°C) was used.
The maximum homologous temperature reached at BOC was 0.34 for UO2, and it was
between 0.18 and 0.20 for all UN and ThN-UN cases. As a function of burnup, the
homologous temperature for UO2 peaks at approximately 0.42, but never gets above 0.21
for UN or any ThN-UN mixture. The change in homologous temperature as a function of
burnup is caused by the shifting relative power profile in the rod. Note that the same
thermal properties for fuel were used at all burnup steps. The significantly lower
homologous temperature obtained using UN and ThN-UN fuels illustrates the enhanced
thermal safety margin and accident tolerance of nitride-based fuels over oxide fuels.
Although this calculation was performed under normal operating conditions, the nitride-
based fuels may also have an improved safety margin during an accident scenario, thus
reducing the likelihood of fuel melting and fission product release. An additional benefit
from the greater thermal conductivity and smaller axial temperature gradient shown in
Figure 59 is that there will be smaller thermal stresses induced in the fuel pellets and
cladding, which may reduce the likelihood of pellet cracking and fission product release.
5.4 Discussion
A preliminary evaluation of composite ThN-UN fuel forms under normal PWR
operating conditions was performed using CASL’s neutronics and thermal hydraulics
tools MPACT and CTF within the VERA modeling suite. There are two primary drivers
for pursuing this fuel form. First, ThN and UN both have high thermal conductivity
compared to conventional UO2, which would provide performance and safety benefits in
an LWR. Second, each phase may mitigate the main challenges associated with the other

127
Figure 57: Thermal conductivity of UN, ThN, and ThN-UN mixtures
Figure 58: Specific heat capacity of UN, ThN, and ThN-UN mixtures

128
Figure 59: Homologous temperature as a function of fuel rod height at BOC
Figure 60: Homologous temperature as a function of burnup

129
phase, i.e. UN provides the external fissile material needed to transmute 232Th into 233U,
while ThN may shield UN from chemically reacting with water. Further investigation is
needed to understand these characteristics.
For any ATF candidate fuel to be considered for real-world application, it must
perform equally as well as UO2 in terms of fuel performance. Because of this
requirement, ThN-UN mixtures and 235U enrichments were determined that matched the
cycle length of UO2. Since it is not known what amount of ThN, if any, will prevent a
ThN-UN composite fuel from degrading in water, several possible mixtures of ThN, UN,
and 235U enrichment were determined. When natural nitrogen is used, the maximum ThN
weight fraction obtainable while remaining under the proliferation limit of 20 wt% 235U
enrichment was 66%, with the balance being UN. For a mixture consisting of 40% ThN
and 60% UN, the required 235U enrichment was 11.10 wt%, and for a 20% ThN, 80% UN
mixture, the required enrichment was 7.80 wt%. Pure UN required a 5.20 wt%
enrichment to match the UO2 cycle length. N-15 enrichment was also considered, and the
required 235U enrichments for 20% ThN-80% UN, 40% ThN-60% UN, and UN were
5.90wt%, 8.50wt%, and 3.90wt%, respectively. Each of these enrichments is
approximately 25% less than the enrichments needed for natural nitrogen, and the
maximum possible weight fraction of ThN at 19.90 wt% enrichment increased from 66.0
to 73.5%.
Comparisons of reactivity coefficients between the nitride-based fuels and UO2
showed that each of the RTCs and SBC were negative. However, the more negative MTC
and smaller magnitude of the SBC and control worth for the nitride-based fuels prompt
the need for a full-core shutdown margin calculation at a variety of reactor states and
burnups. From an accident tolerance standpoint, the ThN-UN fuels exhibited a
significantly lower homologous temperature compared with UO2 in PWR fuel rod and
fuel assembly models. This suggests that ThN-UN may display better fission product
retention, reduced energy storage, and less thermal stress and expansion. It is noteworthy,
however, that this is a preliminary screening study focused on neutronic and thermal
hydraulic performance. The progression of this concept relies on a number of additional
computational studies, such as full-core shutdown margin, accident analysis, and fuel

130
performance. Further, experimental work is needed to characterize the degradation of
ThN-UN fuel forms in a relevant PWR coolant chemistry environment. The results from
the current study warrant future investigation of ThN-UN, but is intended to be an early-
stage screening study of neutronic and thermal hydraulic performance.
131
CHAPTER 6
REACTOR PERFORMANCE AND SAFETY CHARACTERISTICS
OF UO2 WITH MO INSERTS
6.1 Motivation
The incorporation of non-fissile inserts into UO2 is being considered as a potential
advanced low-enriched uranium (LEU) fuel form to increase heat transfer capabilities of
LWRs [173]. The motivation for improving heat transfer capabilities with high thermal
conductivity inserts is to improve short-term accident tolerance, improve fission product
retention, and reduce the probability of PCIs, which can cause cladding burst and release
fission products into the coolant. These benefits stem from the reduced fuel temperature,
energy storage, and thermal stresses in the fuel caused by high thermal conductivity.
Previous work on UO2-Mo fuel forms has focused primarily on the measured thermal
conductivity of fabricated samples and the heat transfer performance of small-scale,
single-physics models. Much less attention has been given to the neutronic impact of
using Mo inserts, especially on the fuel assembly scale with multiphysics methods.
Additionally, advanced additive manufacturing techniques allow for a wide array of
possible insert geometries. There is a direct need for a method that can be used to
systematically optimize the insert geometry in a way that maximizes heat transfer and
neutronic performance.
This work investigates nuclear reactor performance and safety characteristics of
UO2 with high thermal conductivity Mo insert structures using multiphysics modeling
techniques. The purpose of this study is to use scoping analyses to quantify the impact of
using Mo inserts from neutronic and heat transfer standpoints. Attention is given to
reactor performance and safety parameters, such as cycle length, self-shielding, RTCs,
maximum fuel temperature, temperature gradients in the fuel, and stored energy in the
fuel. The finite-element code BISON and the Monte Carlo particle transport code Serpent
were used to perform sensitivity analyses on the Mo insert geometry to optimize the
insert design and inform larger scale modeling that required the homogenization of the

132
UO2 and Mo. Although BISON is often used as a fuel performance analysis tool, it is
used in this context for heat transfer analysis only. This work addresses a knowledge gap
in the literature by quantifying the impact of Mo inserts on reactor physics and heat
transfer parameters. The scope of this work remains focused on the areas of neutronics
and heat transfer performance for this novel fuel concept and is not intended to optimize
the UO2-Mo design from a fuel performance standpoint.
6.2 Methodology
Sections 6.2.1–6.2.3 describe the methods used to evaluate Mo inserts in UO2. In
Section 6.2.1, two combinations of Mo content and 235U enrichment were chosen based
on their achievable cycle length compared with regular UO2. One combination remains
below the United States commercial LWR enrichment limit of 5% 235U. The other case
exceeds this enrichment limit and is studied to address the increasing interest in using
HALEU in LWRs that are equipped with ATF materials and can safely operate at higher
burnups [174].
Once the Mo content and 235U enrichment combinations were chosen, two
sensitivity studies were performed: one to determine the effect of insert geometry on
initial neutron multiplication factors and one to determine the effect of insert geometry on
the maximum fuel temperature. Section 6.2.2 describes the sensitivity analysis method,
and Section 6.2.3 details the analyses performed to determine the reactor performance
and safety of the UO2 with Mo inserts. Lastly, Section 6.2.4 summarizes the overarching
process of the study and all of the computational tools used.
6.2.1 Selection of Mo Content and 235U Enrichment
To obtain a rough estimate of the maximum attainable Mo content in the fuel that
can still match the cycle length of regular UO2, an infinite 2-D pin-cell model was used to
calculate cycle length for homogeneously mixed UO2-Mo fuel ranging in Mo content
from 0 to 30% by weight and 3 to 10% 235U enrichment. MPACT and a 252-group
ENDF/B-VII.1 nuclear cross section library [120] [156] were used to perform these
calculations. The pin-cell geometry was based on the Westinghouse AP1000 design
[168], the dimensions of which were previously provided in Table 11 in CHAPTER 5.

133
The linear reactivity model [169] was used to calculate the cycle length in which
the infinite neutron multiplication factor 𝑘∞ was adjusted for 4% reactivity leakage and
the cycle length was adjusted for a typical three-batch loading scheme. The results are
shown in the contour plot in Figure 61. Each contour line shows the relative difference in
cycle length for a given Mo content and 235U enrichment combination against a reference
value, which—in this case—was chosen to be the cycle length of UO2 that is 4.9%
enriched. Any combination of Mo content and 235U enrichment along a given contour line
has the same cycle length, and two combinations of Mo content and 235U enrichment
were chosen as the focus of the remainder of the study.
The first combination is 6.25wt% Mo and 4.9% 235U enrichment, which, from
Figure 61, gives a cycle length that is equivalent to regular UO2 that is 4.0% enriched, or
approximately 360 EFPD. The second combination is 15.0wt% Mo and 7.52% 235U
enrichment, which gives the same cycle length as regular UO2 that is 4.9% enriched
(approximately 451 EFPD). These combinations were chosen because the primary
objective of this paper is to make a relevant comparison between the performance of
UO2-Mo and typical PWR fuel.
To verify the accuracy of the cycle length predictions made using MPACT,
comparisons of neutron multiplication factor as a function of burnup were made for the
two identified homogeneously mixed fuel forms using the Monte Carlo particle transport
code, Serpent [18]. The difference in neutron multiplication factors for both fuel forms is
shown in Figure 62. Some differences are expected because the MPACT cross section
libraries are based on ENDF/B-VII.1 data [156], whereas Serpent uses ENDF/B-VII.0
data [157]. The uncertainty in the Serpent results at each burnup step is approximately 20
pcm. Figure 62 shows that Serpent predicted a greater neutron multiplication factor at the
beginning of cycle (BOC) for both fuel designs. Serpent also predicted a faster depletion
rate, so MPACT predicted a higher neutron multiplication factor later in the cycle.
Agreement within several hundred pcm is considered acceptable for this scoping study,
and Figure 62 shows that Serpent and MPACT agreed within this range for relevant
burnup levels.
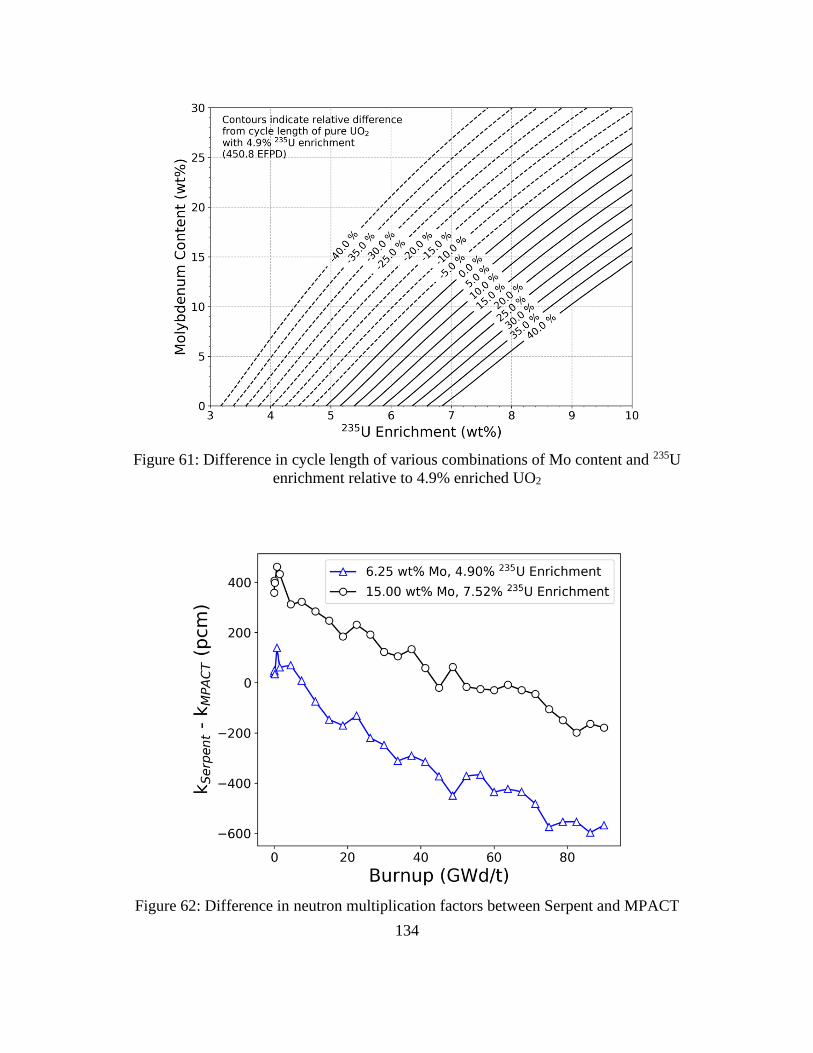
134
Figure 61: Difference in cycle length of various combinations of Mo content and 235U
enrichment relative to 4.9% enriched UO2
Figure 62: Difference in neutron multiplication factors between Serpent and MPACT

135
6.2.2 Sensitivity Analysis Methods
Sensitivity studies were performed using Monte Carlo and finite element models
of a single AP1000 fuel pellet to determine the effect of the Mo insert geometry and the
importance of geometric features on initial neutron multiplication factors and maximum
fuel temperature. Serpent was used to perform the neutronics sensitivity study where the
initial neutron multiplication factor was the FoM. The finite element code BISON was
used to perform a heat transfer sensitivity study for which the maximum fuel temperature
was the FoM. A greater initial neutron multiplication factor was assumed to correspond
to a greater cycle length. This is a reasonable assumption for this study since all the fuel
pellets tested have the same Mo content, 235U enrichment, and U density. These
sensitivity studies also provide insight into the effect of the insert geometry on other
phenomena—such as self-shielding, temperature gradients across the fuel, and energy
storage in the fuel—which all have performance and safety implications. Additionally,
results from the sensitivity studies reflect upon the validity of assuming homogeneously
mixed UO2-Mo fuel pellets for purposes of scoping analysis and can be used to inform
reactor analysis models for which homogenization may be required.
Relatively simple geometries were considered for these studies in which disks
extend radially from a central, vertically-oriented rod. Heat transfer in nuclear fuel rods is
predominantly in the radial direction, and the work of Medvedev and Mariani [10]
already focused on thin, radial disks stacked alternately with UO2 disks. Although this
concept is simple from a manufacturing standpoint, a modification to the fuel rod loading
process would be needed to alternate the UO2 and Mo disks within the cladding. The rod-
and-disk geometry considered in this study was selected because the axial structure may
improve manufacturability using additive manufacturing and sintering techniques [175]
and would not require any changes to how the fuel rods are loaded. Further, the axial
structure eliminates the UO2 centerline region, which is the hottest region in a typical
UO2 fuel pellet, and the disks provide a radial pathway for heat to move from the pellet to
the coolant. Figure 63 shows how the rod-and-disk insert design alters the thermal
resistance network in the fuel rod compared to a traditional UO2 fuel pellet, where �̇�
indicates where heat is added to the system. Four geometric variables were considered in

136
Figure 63: Thermal resistance network in a) a typical UO2 fuel pellet and b) a UO2 fuel
pellet with a rod-and-disk Mo insert
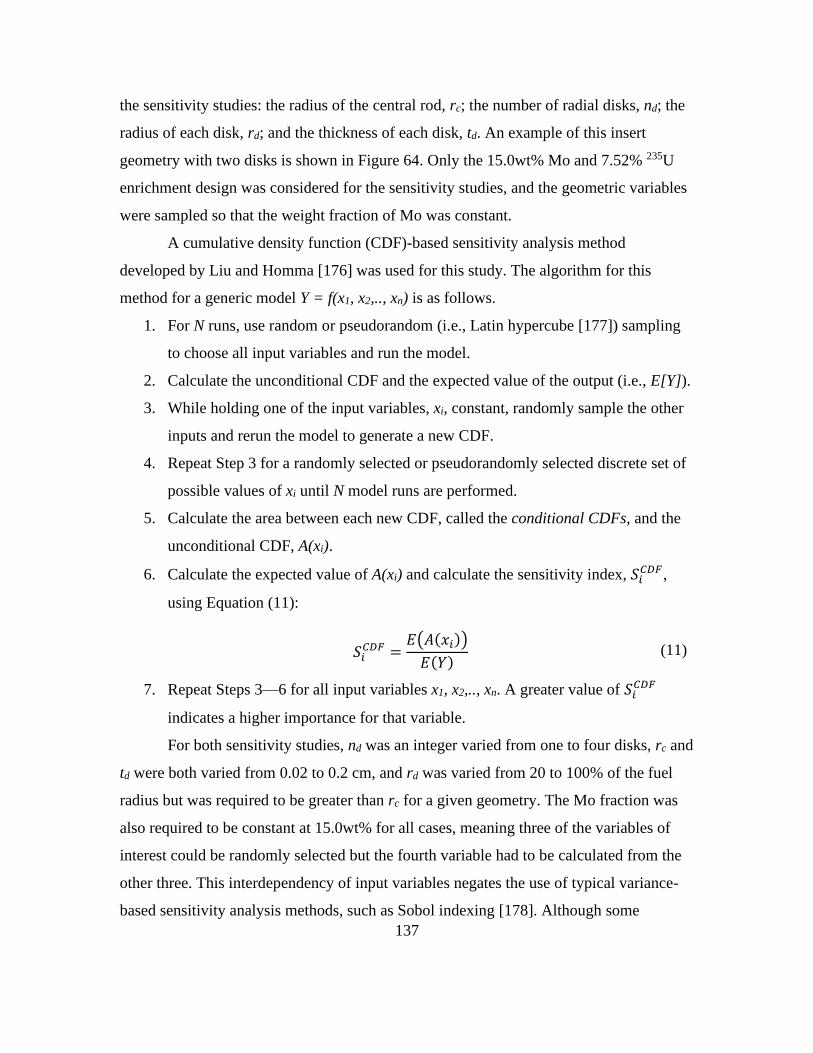
137
the sensitivity studies: the radius of the central rod, rc; the number of radial disks, nd; the
radius of each disk, rd; and the thickness of each disk, td. An example of this insert
geometry with two disks is shown in Figure 64. Only the 15.0wt% Mo and 7.52% 235U
enrichment design was considered for the sensitivity studies, and the geometric variables
were sampled so that the weight fraction of Mo was constant.
A cumulative density function (CDF)-based sensitivity analysis method
developed by Liu and Homma [176] was used for this study. The algorithm for this
method for a generic model Y = f(x1, x2,.., xn) is as follows.
1. For N runs, use random or pseudorandom (i.e., Latin hypercube [177]) sampling
to choose all input variables and run the model.
2. Calculate the unconditional CDF and the expected value of the output (i.e., E[Y]).
3. While holding one of the input variables, xi, constant, randomly sample the other
inputs and rerun the model to generate a new CDF.
4. Repeat Step 3 for a randomly selected or pseudorandomly selected discrete set of
possible values of xi until N model runs are performed.
5. Calculate the area between each new CDF, called the conditional CDFs, and the
unconditional CDF, A(xi).
6. Calculate the expected value of A(xi) and calculate the sensitivity index, 𝑆𝑖𝐶𝐷𝐹,
using Equation (11):
𝑆𝑖𝐶𝐷𝐹 =
𝐸(𝐴(𝑥𝑖))
𝐸(𝑌) (11)
7. Repeat Steps 3––6 for all input variables x1, x2,.., xn. A greater value of 𝑆𝑖𝐶𝐷𝐹
indicates a higher importance for that variable.
For both sensitivity studies, nd was an integer varied from one to four disks, rc and
td were both varied from 0.02 to 0.2 cm, and rd was varied from 20 to 100% of the fuel
radius but was required to be greater than rc for a given geometry. The Mo fraction was
also required to be constant at 15.0wt% for all cases, meaning three of the variables of
interest could be randomly selected but the fourth variable had to be calculated from the
other three. This interdependency of input variables negates the use of typical variance-
based sensitivity analysis methods, such as Sobol indexing [178]. Although some
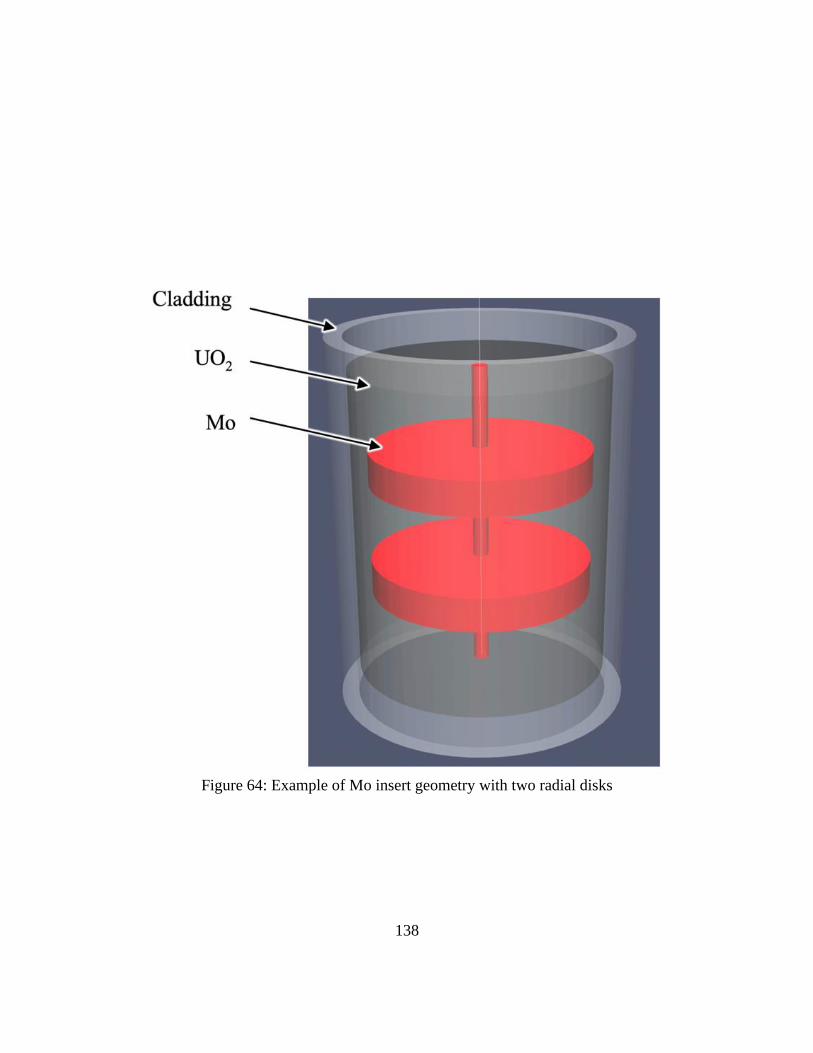
138
Figure 64: Example of Mo insert geometry with two radial disks

139
techniques have been developed to handle models with dependent inputs [179] [180],
variance-based sensitivity methods are still inapplicable due to the uniqueness of inputs
that make one-at-a-time sampling impossible for this case. For example, if values of nd,
rc, and rd are randomly selected, then there is the unique value of td that gives a geometry
that meets the Mo fraction constraint; thus, it is impossible to hold three of the variables
constant while only varying the fourth. However, the CDF-based method uses a
complimentary strategy in which one variable is held constant and the other three are
varied, which is possible for this case.
Latin hypercube sampling (LHS) [177] was used for all variables to generate the
unconditional CDF to improve the statistical accuracy. This stratified sampling strategy
was also used to select the discrete set of inputs for each conditional case, but regular
Monte Carlo sampling was used to pick the other variables in the conditional cases. LHS
is used because it ensures the entire range of possible values is sampled and reduces the
required number of runs for these high-fidelity computationally expensive models to
obtain statistical accuracy. The variables that are not being held constant in each
conditional case (Step 3 in the algorithm) are sampled using regular random sampling
because the emphasis of the CDF-based sensitivity method is on the change in the CDF
caused by the conditional variable, xi, not the other variables. Each sensitivity study was
performed until the relative change in each sensitivity index per model run converged to
less than 5 × 10⁻⁴ and a stability of importance ranking had been clearly demonstrated
[181].
The Pearson correlation coefficient [182] was also determined for each input
variable to quantify the association between the initial neutron multiplication factor and
maximum fuel temperature on insert geometry, as well as to add confidence to the
importance rankings of the variables obtained using the CDF-based method. The Pearson
correlation coefficient varies between -1 and 1 and quantifies the linear association
between a model output Y and an input xi, as given by Equation (12).
𝜌(𝑥𝑖, 𝑌) =𝐶𝑜𝑣(𝑥𝑖, 𝑌)
√𝑉𝑎𝑟(𝑥𝑖)𝑉𝑎𝑟(𝑌) (12)

140
The closer the magnitude of 𝜌(𝑥𝑖 , 𝑌) is to 1, the stronger the linear association between xi
and Y. The value of the Pearson correlation coefficient does not necessarily indicate the
importance of a variable and is used in this study only as a secondary measure of the
relationship between each input variable and the FoMs.
The insert geometries that performed the best and worst in the sensitivity studies
(i.e., the geometries that gave the highest and lowest initial neutron multiplication factor
and the lowest and highest maximum fuel temperature, respectively) were identified for
more in-depth analyses. From a neutronics perspective, the additional analyses include a
burnup calculation to determine cycle length and a study to determine the impact that
insert geometry has on self-shielding effects. The homogeneously mixed UO2-Mo fuel is
included in the self-shielding analysis, which—in conjunction with the cycle length
calculations—informs on the validity of assuming the mixed fuel type for the other
scoping analyses that are discussed in Section 6.2.3. From a heat transfer perspective, the
maximum temperature gradient and energy storage were determined for the insert
geometries that gave the lowest and highest maximum fuel temperature in the sensitivity
study and were compared with what can be expected in monolithic UO2.
6.2.3 Determination of Reactivity Coefficients and Reactor Performance
The importance and definition of RTCs and control rod worth were given in
Section 2.3.1. To calculate the RTCs and control worth, several branch cases are modeled
in which the fuel or moderator temperature, boron concentration, or control rod
configuration is varied from a reference value and the reactivity at each state is
calculated. The values used to calculate the RTCs were 800 and 900 K for fuel
temperature, 550 and 585 K for moderator temperature (770 kg/m3 and 701 kg/m3 for
liquid water density, respectively), and 0 and 1,000 ppm for SBC. These limits cover
typical values for average fuel temperature, coolant temperature, and soluble boron
content in PWRs. An infinite pin-cell model was used to calculate FTC, MTC, and SBC,
and an infinite one-quarter symmetry model of a typical 17 × 17 PWR fuel assembly with
Ag-In-Cd control rods was used to calculate control rod worth. This procedure is similar
to the one used in CHAPTER 5 to calculate RTCs and control worth for the ThN-UN

141
fuels. All coefficients were calculated for regular UO2 and the homogeneous UO2-Mo
fuels with 6.25 and 15wt% Mo as a function of burnup using MPACT and a 252-group
cross section library.
A 3-D 17 × 17 PWR fuel assembly model was developed in VERA to determine
the heat transfer performance of the homogenously mixed UO2-Mo fuels. The impact of
Mo inserts on heat transfer performance was quantified using the homologous
temperature, which is the ratio of the maximum fuel temperature to its melting
temperature, as a function of burnup. The same method that was used in CHAPTER 5 for
calculating homologous temperature for ThN-UN fuels using the feedback loop between
MPACT and CTF within VERA was used in the current study to calculate homologous
temperature for UO2-Mo. The PWR model used boundary conditions representative of
those in the Westinghouse AP1000 design [168]. Before performing the multiphysics
calculation, a thermal conductivity calibration scheme was developed so that uncoupled
CTF results closely matched those from BISON in terms of maximum fuel temperature,
average fuel temperature, and the relative RMSE in temperature across radial nodes in
UO2 fuel pellets with Mo inserts. The calibration procedure was performed using several
data points from a single PWR fuel rod and is discussed in more detail in Section 6.5.2.
Both the calibration procedure in the PWR fuel rod and the determination of homologous
temperature in the PWR fuel assembly were performed for the best and worst performing
geometries from the heat transfer sensitivity study.
6.2.4 Summary of Methods and Computational Tools
The analyses performed in this study span a range of scales and physical
phenomena that required the use of multiple computational tools. A flowchart
summarizing the general process followed in this study is given in Figure 65. Figure 66
further elucidates the role of each modeling tool in this study and the function of each
portion of the study by providing a wholistic evaluation of the effect of Mo inserts in
UO2. In this study, all references to VERA imply the use of MPACT coupled to CTF to
provide a neutronics-to-thermal-hydraulics feedback loop. Although a version of BISON
has been integrated into VERA, BISON is only used in standalone mode in the current
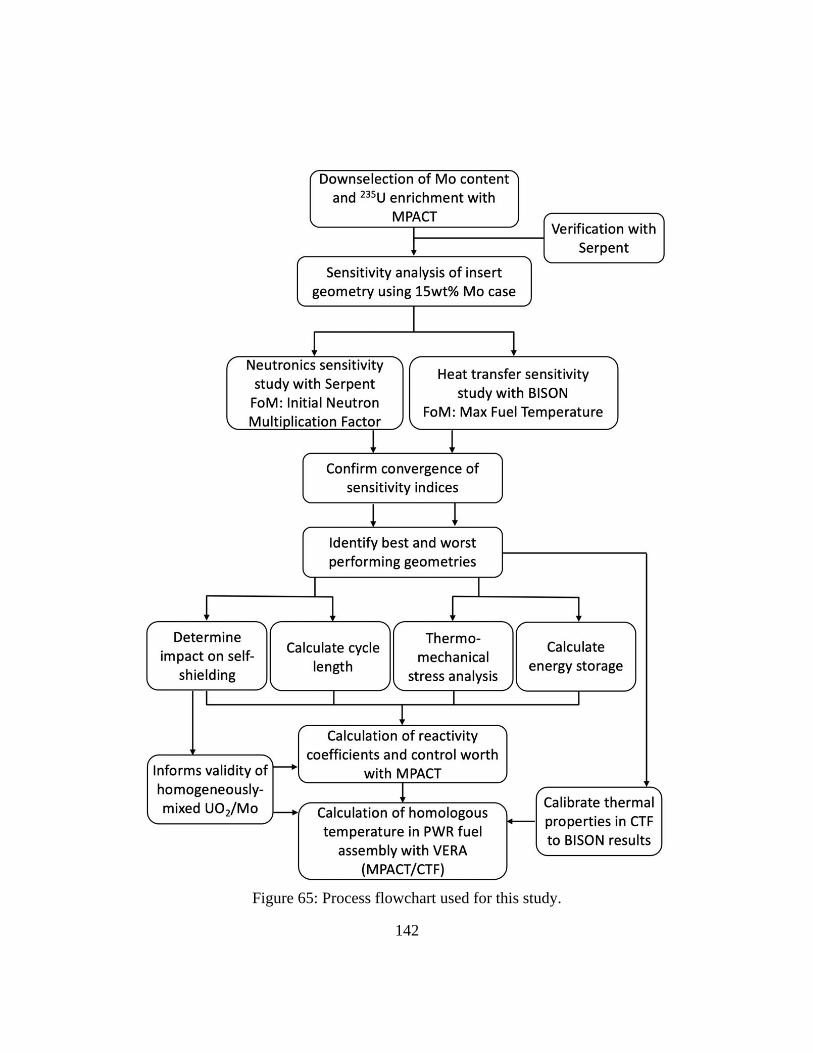
142
Figure 65: Process flowchart used for this study.

143
Figure 66: Summary of computational tools and their roles in this study.
144
study. Direct references to MPACT and CTF imply that they are being used in standalone
mode.
6.3 Neutronics Results: Sensitivity Studies and In-Depth Analysis
6.3.1 Neutronics Sensitivity Analysis Results
Overall, 3,000 Serpent model runs were performed for the neutronic sensitivity
analysis: 600 for each of the four geometric variables and an additional 600 model runs to
generate the unconditional CDF. Figure 67 shows the infinite neutron multiplication
factor as a function of each geometric variable for the 600 model runs that compose the
unconditional CDF. Because Serpent is a Monte Carlo code, error bars are included on
the figure to show the uncertainty in the neutron multiplication factor predictions, all of
which were 20–25 pcm.
The algorithm described in Section 6.2.2 was used to determine 𝑆𝑖𝐶𝐷𝐹 for each of
the four input variables, and an example of A(xi) from this study is shown in Figure 68. A
plot of the sensitivity indices as a function of the number of model runs per variable is
shown in Figure 69. The indices were converged to a relative change per model run
between 5 × 10⁻⁵ and 3 × 10⁻⁴, and Figure 69 shows that the importance ranking had not
changed since 200 runs per variable. Equation (12) was used to also determine the
Pearson correlation coefficient for each variable, and the resulting values of 𝑆𝑖𝐶𝐷𝐹,
𝜌(𝑥𝑖, 𝑌), and their associated rankings are given in Table 16. The results from Table 16
show that the CDF-based sensitivity method and the Pearson correlation coefficients both
predicted the same ranking of the four variables and indicated that the radius/radii of the
disks are the most important feature in terms of impact on the initial neutron
multiplication factor.
6.3.2 Cycle Length and Self-Shielding
The highest and lowest neutron multiplication factor from all runs in the
sensitivity study were 1.38182 and 1.37020, respectively—a difference of 1,152 pcm.
Cross sections of the pin-cell model for these two cases, hereafter referred to as the high-
reactivity case (HRC) and low-reactivity case (LRC), are shown in Figure 70. The Mo

145
Figure 67: Unconditional neutronic results as a function of each input variable
Figure 68: Example of A(xi) between the unconditional CDF and a conditional CDF
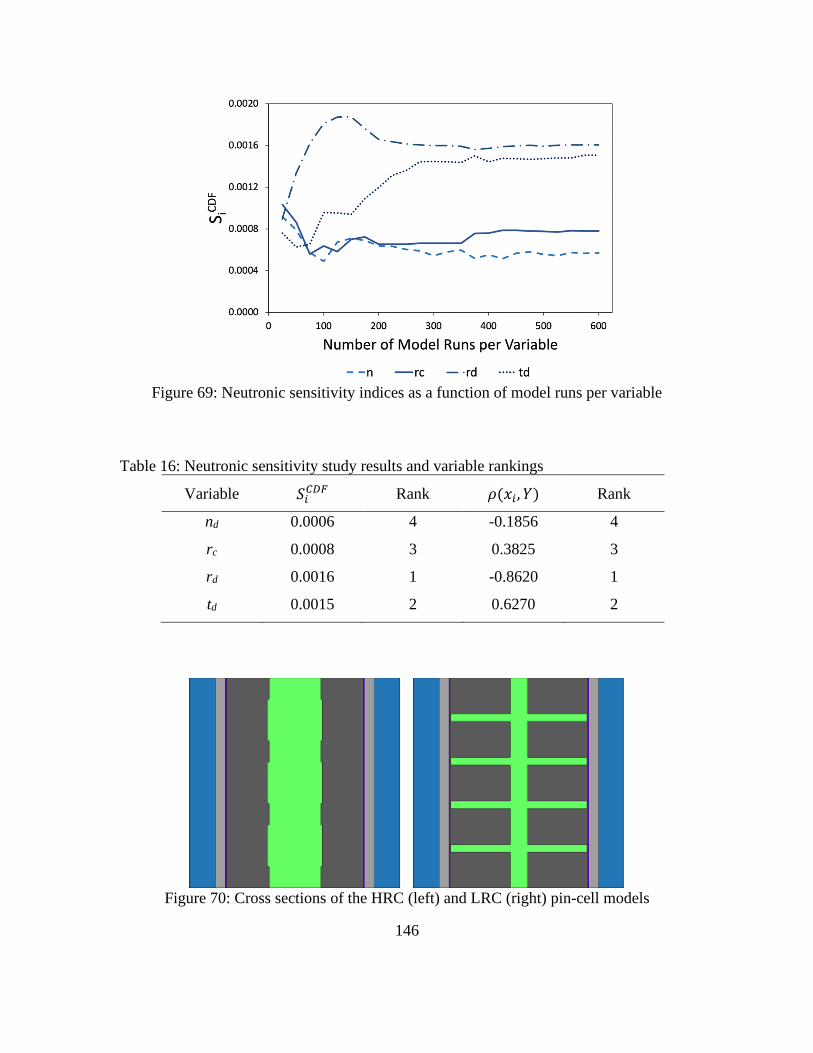
146
Figure 69: Neutronic sensitivity indices as a function of model runs per variable
Table 16: Neutronic sensitivity study results and variable rankings
Variable 𝑆𝑖𝐶𝐷𝐹 Rank 𝜌(𝑥𝑖, 𝑌) Rank
nd 0.0006 4 -0.1856 4
rc 0.0008 3 0.3825 3
rd 0.0016 1 -0.8620 1
td 0.0015 2 0.6270 2
Figure 70: Cross sections of the HRC (left) and LRC (right) pin-cell models

147
inserts are bright green in the figure. Figure 70 shows that the HRC has a relatively large
central rod with very small disk radii, whereas the LRC has four radial disks that extend
nearly the full width of the fuel pellet.
Serpent was used to perform burnup calculations to determine the cycle length of
each of these two cases for which 4% reactivity leakage and a three-batch loading scheme
were assumed. The resulting cycle length of the HRC was 470.5 EFPD, and the cycle
length of the LRC was about 3% lower at 456.7 EFPD. Previously shown in Figure 61,
the cycle length of a homogeneously mixed UO2-Mo fuel pellet with the same Mo
content and 235U enrichment as these two geometries was calculated using MPACT to be
450.8 EFPD, which is 1.3 and 4.2% lower than the cycle length of the LRC and HRC,
respectively. These cycle length predictions suggest that the assumption that higher initial
reactivity corresponds to longer cycle lengths for these fuels and the use of homogenized
UO2-Mo models is acceptable for this scoping study.
Serpent was used to study the effect of insert geometry on self-shielding within
the fuel pellet. Self-shielding in the fuel is directly related to the rim effect in which the
outer rim of the fuel pellet experiences greater fission rate. Self-shielding was studied by
tallying the relative absorption rate in 10 concentric rings in the fuel pellet. Each of the
10 rings have equivalent volumes to each other. Only BOC was considered, and only
absorption in the fuel was tallied because the purpose of studying self-shielding in this
context is to determine whether the Mo inserts impact the rim effect. Figure 71 shows the
tallies of the absorption rate in each of the 10 volumes relative to the total absorption rate
in the fuel for the HRC, LRC, a homogeneously mixed UO2-Mo fuel pellet, and a
reference UO2 fuel pellet that is 4.9% enriched. All fuel types had the same total power.
The x-axis in the figure is the ratio of each of the 10 equal-volume radii to the total fuel
pellet radius.
Because the radius of the central rod in the HRC is greater than the radius of the
innermost equal-volume ring, there is no absorption in the fuel in this ring. The relative
absorption rate in each of the eight outermost rings is greatest in the HRC since there is
no Mo in these regions and also because the concentration of Mo near the center of the
pellet reduces the relative absorption in this region. Compared with the reference UO2
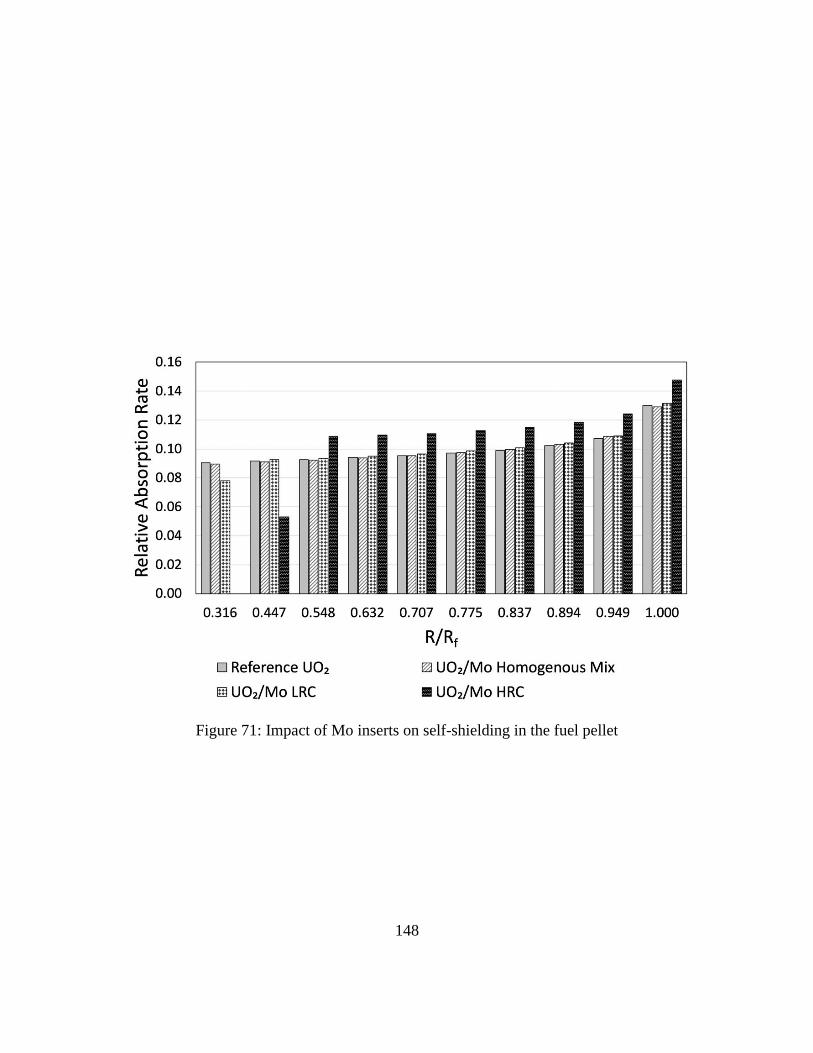
148
Figure 71: Impact of Mo inserts on self-shielding in the fuel pellet

149
case, the homogenously mixed UO2-Mo has little impact on self-shielding, and the LRC
has a lower absorption rate near the center of the pellet—again, because of the central Mo
rod—but is relatively similar to the reference case in the other pellet regions.
6.4 Heat Transfer Results: Sensitivity Studies and In-Depth Analysis
6.4.1 BISON Setup
Due to the complexity of the UO2-Mo configuration, it was necessary to employ a
multidimensional tool to calculate the heat transfer and temperature profiles. For this
purpose, BISON was selected for the simulations, and Cubit was selected to perform the
meshing of the 3-D geometries. BISON was used in this study to optimize the heat
transfer performance of the UO2-Mo fuel form using the systematic regression techniques
outlined in Section 6.2.2. This optimization using BISON focuses only on heat transfer
and does not attempt to optimize the Mo insert for fuel performance. The thermal
conductivity of the Mo was set to a curve fit to data presented by Rasor and McClelland
[82], with resulting values of about 100 to 125 W/m-K in the temperature range of
interest.
There is also a 50 𝜇𝑚 thick boarder with a low thermal conductivity around the
Mo inserts to provide a conservative estimate of the thermal resistance due to interface
shearing or separation between the UO2 and Mo. The thermal conductivity for this region
was set to 0.25 W/m-K using the assumption that any free volume between the UO2 and
Mo would become filled with He. The heat generation was set to a radial power factor
determined by the neutronics simulations and the heat was modeled as being generated
into the UO2. Gamma heating in the Mo was not included in the simulations, which is
expected to have a negligible impact on results since the gamma heating in Mo would be
small compared to the overall power and also because the Mo thermal conductivity is
high.
A coolant pressure of 15.5 MPa was applied to outer cladding surface, and an
initial He fill gas pressure of 2 MPa was applied to the fuel-cladding gap. However,
fission gas was not added to the gap. The wide range of geometry produced a significant
range of temperature gradients across the pellet. This resulted in significant differences in
150
the fission gas released and the cladding gap pressures. A pellet-cladding gap
optimization would have been necessary for a fair comparison of the various geometries,
which is beyond the scope of this work given the number of geometries considered and
the emphasis on heat transfer performance rather than fuel performance. While the
stresses are not reported, the thermal expansion of the UO2 and Mo, and swelling of the
UO2 remains included in the following simulations to better assess the pellet-cladding
gap thermal resistivity. The UO2 and Mo were modeled as mechanically bonded to each
other in the following simulations.
6.4.2 Heat Transfer Sensitivity Analysis Results
The heat transfer sensitivity analysis required 4,750 model runs for all sensitivity
indices to converge to a relative change-per-model run between 5 × 10⁻⁴ and 5 × 10⁻⁵,
which equated to 950 model runs per variable plus 950 runs to generate the unconditional
CDF. Figure 72 shows the maximum temperatures recorded in the 950 unconditional
model runs as a function of each of the geometric variables. Figure 73 shows the value of
the sensitivity indices for each variable as a function of model runs per variable and
demonstrates the stability of each index. The plot also shows that the same importance
ranking of the indices had been maintained since approximately 175 model runs per
variable. Table 17 shows the CDF-based sensitivity indices and Pearson correlation
coefficients for each variable, as well as the ranking determined with each method.
In terms of maximum fuel temperature, the radius of the central rod was the most
important factor. Unlike the neutronics sensitivity study, the CDF-based method and the
Pearson correlation gave different rankings since the rank of rd and nd are swapped.
However, these two variables are of approximately equal importance, so this result is
considered a qualitive verification.
6.4.3 Fuel Temperature Gradient and Energy Storage
A constant power of 270 W was used in each of the BISON models in the
sensitivity studies, and it was found that the highest and lowest fuel temperature predicted
at BOC in the study were 1,495.0 K and 1,133.9 K. Cross sections of the geometries that
gave these maximum temperature values are shown in Figure 74 and are henceforth

151
Figure 72: Unconditional predictions of maximum fuel temperature as a function of each
input variable
Figure 73: Heat transfer sensitivity indices as a function of model runs per variable

152
Table 17: Heat transfer sensitivity indices and variable rankings
Variable 𝑆𝑖𝐶𝐷𝐹 Rank 𝜌(𝑥𝑖, 𝑌) Rank
Number of disks, nd 0.0117 4 -0.1161 3
Central rod radius, rc 0.0366 1 -0.7980 1
Disk radius/radii, rd 0.0146 3 -0.1033 4
Disk thickness, td 0.0282 2 0.5728 2
Figure 74: Cross sections of the HTC geometry (left) and the LTC geometry (right)
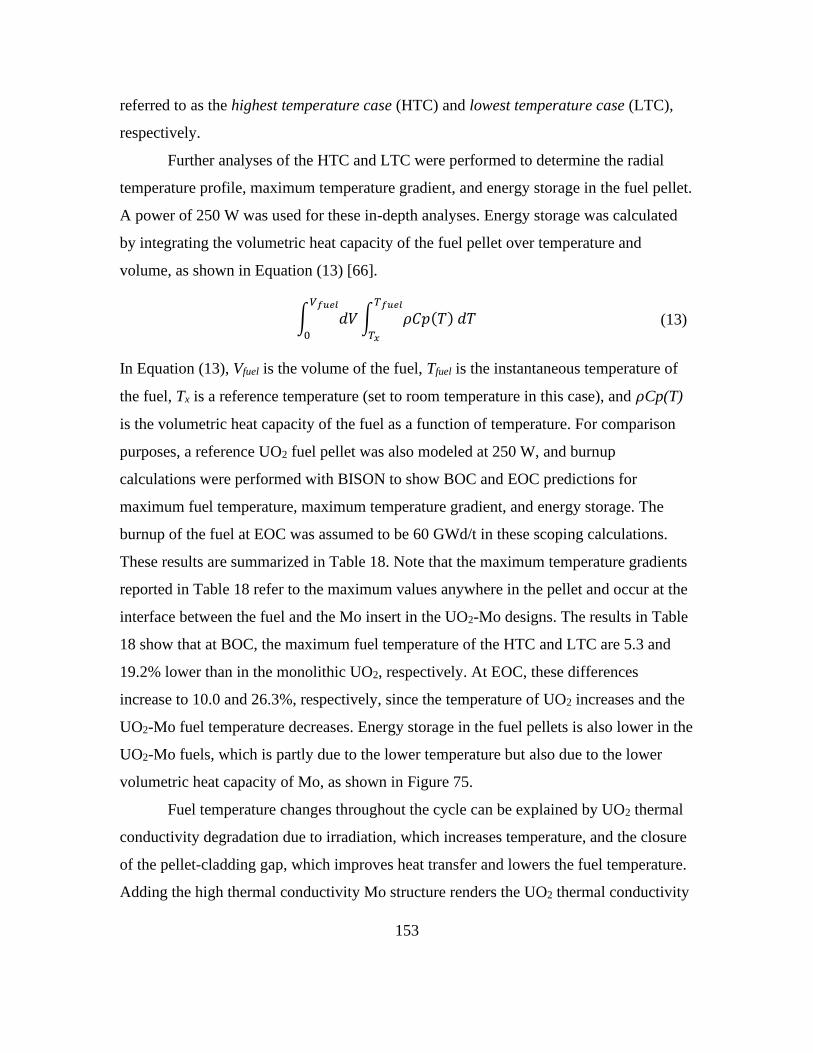
153
referred to as the highest temperature case (HTC) and lowest temperature case (LTC),
respectively.
Further analyses of the HTC and LTC were performed to determine the radial
temperature profile, maximum temperature gradient, and energy storage in the fuel pellet.
A power of 250 W was used for these in-depth analyses. Energy storage was calculated
by integrating the volumetric heat capacity of the fuel pellet over temperature and
volume, as shown in Equation (13) [66].
∫ 𝑑𝑉𝑉𝑓𝑢𝑒𝑙
0
∫ 𝜌𝐶𝑝(𝑇) 𝑑𝑇𝑇𝑓𝑢𝑒𝑙
𝑇𝑥
(13)
In Equation (13), Vfuel is the volume of the fuel, Tfuel is the instantaneous temperature of
the fuel, Tx is a reference temperature (set to room temperature in this case), and 𝜌Cp(T)
is the volumetric heat capacity of the fuel as a function of temperature. For comparison
purposes, a reference UO2 fuel pellet was also modeled at 250 W, and burnup
calculations were performed with BISON to show BOC and EOC predictions for
maximum fuel temperature, maximum temperature gradient, and energy storage. The
burnup of the fuel at EOC was assumed to be 60 GWd/t in these scoping calculations.
These results are summarized in Table 18. Note that the maximum temperature gradients
reported in Table 18 refer to the maximum values anywhere in the pellet and occur at the
interface between the fuel and the Mo insert in the UO2-Mo designs. The results in Table
18 show that at BOC, the maximum fuel temperature of the HTC and LTC are 5.3 and
19.2% lower than in the monolithic UO2, respectively. At EOC, these differences
increase to 10.0 and 26.3%, respectively, since the temperature of UO2 increases and the
UO2-Mo fuel temperature decreases. Energy storage in the fuel pellets is also lower in the
UO2-Mo fuels, which is partly due to the lower temperature but also due to the lower
volumetric heat capacity of Mo, as shown in Figure 75.
Fuel temperature changes throughout the cycle can be explained by UO2 thermal
conductivity degradation due to irradiation, which increases temperature, and the closure
of the pellet-cladding gap, which improves heat transfer and lowers the fuel temperature.
Adding the high thermal conductivity Mo structure renders the UO2 thermal conductivity

154
Table 18: Comparison of maximum fuel temperature, maximum temperature gradient,
and energy storage in UO2, the HTC, and the LTC.
Fuel design Tmax (K)
Maximum temperature
gradient (K/mm) Energy storage (J)
BOC EOC BOC EOC BOC EOC
UO2 1,422.1 1,448.6 237 309 1,371 1,280
HTC 1,346.6 1,303.4 334 361 1,334 1,144
LTC 1,149.3 1,068.1 297 341 1,226 1,028
Figure 75: Volumetric heat capacity of UO2 [34] and Mo [82]

155
degradation negligible compared with the heat transfer increase caused by the gap
closure. It also causes the EOC temperature to be lower than the BOC value.
The maximum burnup reached in the simulations was 8.5% fissions per initial
heavy metal atom (FIMA), while the pellet average burnup was about 6.8% FIMA. The
pellet-cladding gap remains open longer in the UO2-Mo designs compared with UO2 due
to the lower temperatures in the pellet, which also releases less gaseous fission product
swelling compared to a UO2 pellet. The released fission gas was minimal in the
simulations resulting in lower temperatures but was more significant in the geometries
resulting in hotter temperatures. However, the actual impact of the Mo-inserts on fission
gas release would require experiments to determine. These scoping calculations may not
capture all of the relevant physics.
Figure 76 shows the maximum temperature in the LTC, as well as the minimum
and maximum pellet-cladding gap widths in the LTC design as a function of burnup. The
maximum temperature decreases with time as the pellet-cladding gap width decreases,
which does not close for the LTC or for most of the simulated geometries. The slow
closure of the pellet-cladding gap improves heat transfer while the fuel is burned, and
competes with the degradation of UO2 thermal conductivity that typically causes a rise in
fuel temperature as a function of burnup.
In Figure 76b, the maximum pellet-cladding gap occurs at the radial Mo disk
locations, while the narrowest gap width occurs in between the disks. The maximum
temperature gradient reported in Table 18 was the maximum value recorded anywhere in
the fuel pellets, and is greater in the HTC and LTC than in UO2. The large temperature
gradients reported in Table 18 occur at the interface between the fuel and the central Mo
rod, and another significant temperature gradient occurs at the interface between the fuel
and the edge of the radial Mo disks.
Figure 77 compares the radial temperature profiles in UO2, the HTC, and the LTC
at both BOC and EOC. The figure shows that the temperature profiles in the fuels with
Mo inserts are generally flatter than that of UO2, with the exceptions occurring at the
UO2-Mo interface regions. This suggests that the UO2-Mo fuels may have better overall
fission gas retention, although an in-depth analysis and accompanying irradiation
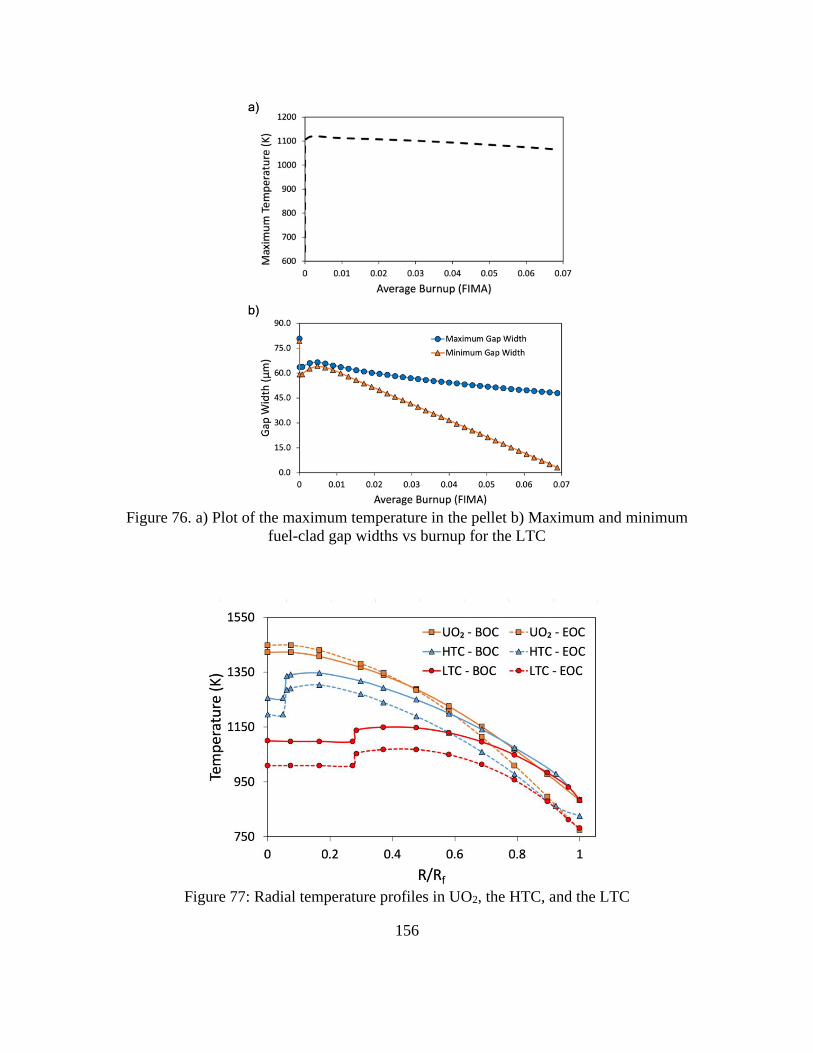
156
Figure 76. a) Plot of the maximum temperature in the pellet b) Maximum and minimum
fuel-clad gap widths vs burnup for the LTC
Figure 77: Radial temperature profiles in UO2, the HTC, and the LTC

157
experiments on the impact of the large temperature gradient at the UO2 and Mo interface
would be required. Although fission gas release to the pellet-cladding gap was excluded
from the BISON models, this assumption is not expected to significantly alter the results
shown in Table 18.
A notable observation from the BISON sensitivity study was that the UO2 with
Mo insert design fuel centerline temperature is not the maximum temperature as it is in
monolithic UO2. In the LTC, the centerline temperature is approximately 50 K lower than
the maximum temperature, and in the HTC, the centerline temperature is about 90 K
lower than the maximum. To better explain this observation, Figure 78 compares the
thermal conductivity and temperature profiles for the LTC and regular UO2 at BOC. As
can be seen from the figure, the Mo center rod reduces the maximum distance between
the UO2 and the pellet surface, and the radial Mo disks provide some heat transport
capability from the interior towards the perimeter. This combination can result in a
centerline temperature that is less than the maximum temperature of the pellet. The heat
is then transported from the pellet surface to the cladding using the gap conduction model
provided in BISON, where it is then rejected from the cladding using the convective
boundary condition.
6.5 Reactor Performance and Safety
6.5.1 Reactivity Coefficients and Control Worth
Using 252-group cross section libraries, the FTC, MTC, SBC, and control rod
worth were determined as a function of burnup for UO2 and both UO2-Mo cases selected
in Section 6.2.1 using MPACT. FTC, MTC, and SBC were calculated using an infinite
pin-cell model, and control rod worth was calculated in a one-eighth symmetry model of
a typical 17 × 17 PWR fuel assembly. A homogenous UO2-Mo mixture was modeled in
all cases. Figure 79–Figure 82 show the FTC, MTC, SBC, and control rod worth,
respectively, for both UO2-Mo mixtures and regular UO2 that is 4.9% enriched.
The FTCs for UO2 and the two UO2-Mo fuels are all relatively similar. FTC is
dominated by the Doppler broadening in 238U resonance absorption peaks, so differences
in FTC that are present between the three fuels are primarily caused by differences in

158
Figure 78: a) UO2-Mo thermal conductivity profile. b) temperature profile for the UO2-
Mo pellet. c) UO2 thermal conductivity profile. d) temperature profile for the UO2 pellet.

159
Figure 79: FTC for UO2 and UO2-Mo mixtures as a function of burnup.
Figure 80: MTC for UO2 and UO2-Mo mixtures as a function of burnup.

160
Figure 81: SBC for UO2 and UO2-Mo mixtures as a function of burnup.
Figure 82: Control rod worth for UO2 and UO2-Mo mixtures as a function of burnup
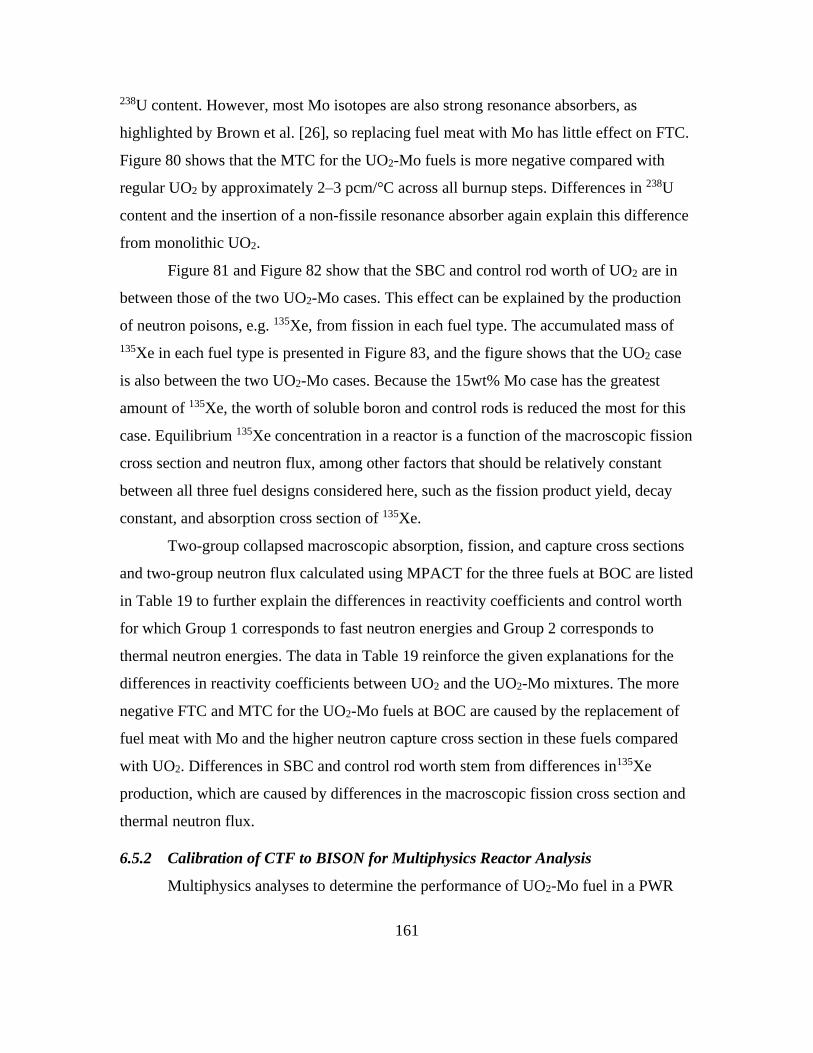
161
238U content. However, most Mo isotopes are also strong resonance absorbers, as
highlighted by Brown et al. [26], so replacing fuel meat with Mo has little effect on FTC.
Figure 80 shows that the MTC for the UO2-Mo fuels is more negative compared with
regular UO2 by approximately 2–3 pcm/°C across all burnup steps. Differences in 238U
content and the insertion of a non-fissile resonance absorber again explain this difference
from monolithic UO2.
Figure 81 and Figure 82 show that the SBC and control rod worth of UO2 are in
between those of the two UO2-Mo cases. This effect can be explained by the production
of neutron poisons, e.g. 135Xe, from fission in each fuel type. The accumulated mass of
135Xe in each fuel type is presented in Figure 83, and the figure shows that the UO2 case
is also between the two UO2-Mo cases. Because the 15wt% Mo case has the greatest
amount of 135Xe, the worth of soluble boron and control rods is reduced the most for this
case. Equilibrium 135Xe concentration in a reactor is a function of the macroscopic fission
cross section and neutron flux, among other factors that should be relatively constant
between all three fuel designs considered here, such as the fission product yield, decay
constant, and absorption cross section of 135Xe.
Two-group collapsed macroscopic absorption, fission, and capture cross sections
and two-group neutron flux calculated using MPACT for the three fuels at BOC are listed
in Table 19 to further explain the differences in reactivity coefficients and control worth
for which Group 1 corresponds to fast neutron energies and Group 2 corresponds to
thermal neutron energies. The data in Table 19 reinforce the given explanations for the
differences in reactivity coefficients between UO2 and the UO2-Mo mixtures. The more
negative FTC and MTC for the UO2-Mo fuels at BOC are caused by the replacement of
fuel meat with Mo and the higher neutron capture cross section in these fuels compared
with UO2. Differences in SBC and control rod worth stem from differences in135Xe
production, which are caused by differences in the macroscopic fission cross section and
thermal neutron flux.
6.5.2 Calibration of CTF to BISON for Multiphysics Reactor Analysis
Multiphysics analyses to determine the performance of UO2-Mo fuel in a PWR
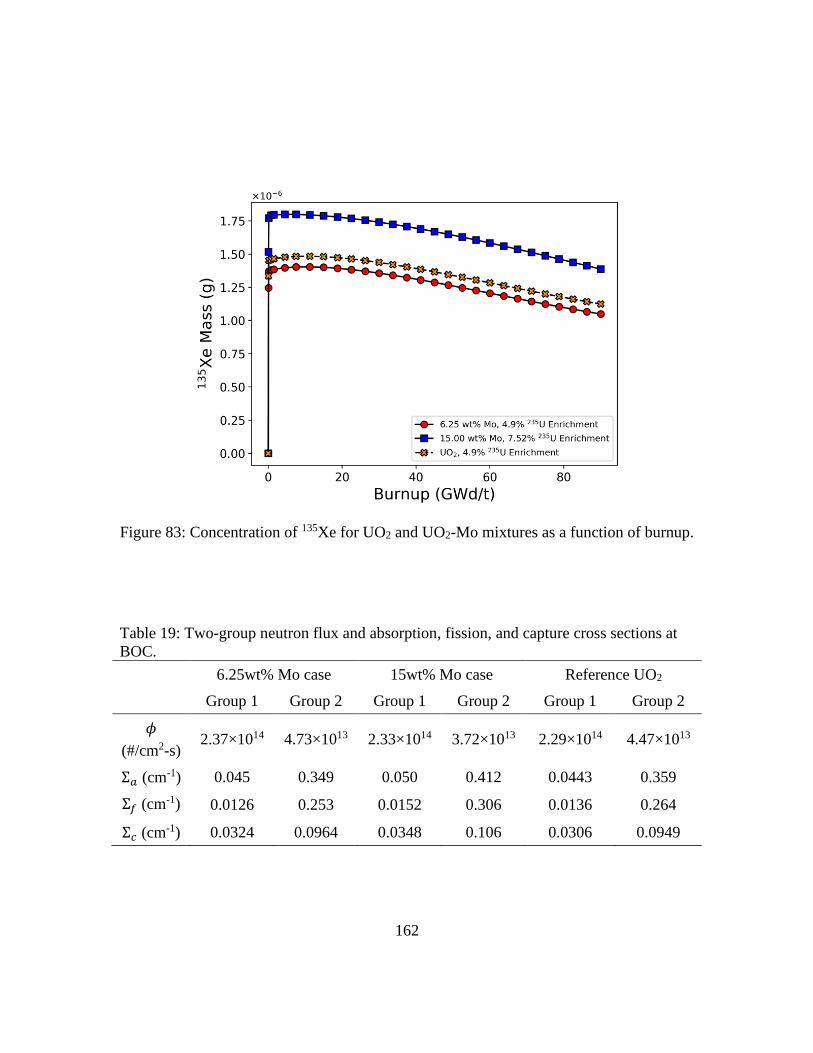
162
Figure 83: Concentration of 135Xe for UO2 and UO2-Mo mixtures as a function of burnup.
Table 19: Two-group neutron flux and absorption, fission, and capture cross sections at
BOC.
6.25wt% Mo case 15wt% Mo case Reference UO2
Group 1 Group 2 Group 1 Group 2 Group 1 Group 2
𝜙
(#/cm2-s) 2.37×10¹⁴ 4.73×10¹³ 2.33×10¹⁴ 3.72×10¹³ 2.29×10¹⁴ 4.47×10¹³
Σ𝑎 (cm-1) 0.045 0.349 0.050 0.412 0.0443 0.359
Σ𝑓 (cm-1) 0.0126 0.253 0.0152 0.306 0.0136 0.264
Σ𝑐 (cm-1) 0.0324 0.0964 0.0348 0.106 0.0306 0.0949
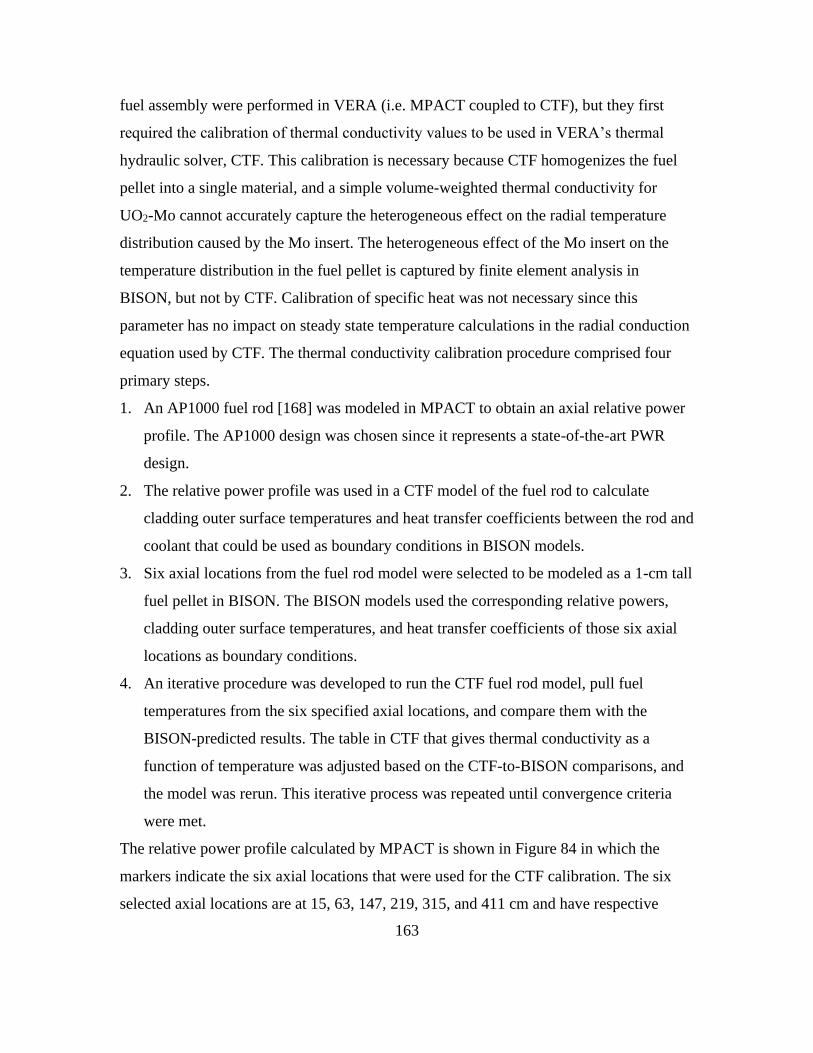
163
fuel assembly were performed in VERA (i.e. MPACT coupled to CTF), but they first
required the calibration of thermal conductivity values to be used in VERA’s thermal
hydraulic solver, CTF. This calibration is necessary because CTF homogenizes the fuel
pellet into a single material, and a simple volume-weighted thermal conductivity for
UO2-Mo cannot accurately capture the heterogeneous effect on the radial temperature
distribution caused by the Mo insert. The heterogeneous effect of the Mo insert on the
temperature distribution in the fuel pellet is captured by finite element analysis in
BISON, but not by CTF. Calibration of specific heat was not necessary since this
parameter has no impact on steady state temperature calculations in the radial conduction
equation used by CTF. The thermal conductivity calibration procedure comprised four
primary steps.
1. An AP1000 fuel rod [168] was modeled in MPACT to obtain an axial relative power
profile. The AP1000 design was chosen since it represents a state-of-the-art PWR
design.
2. The relative power profile was used in a CTF model of the fuel rod to calculate
cladding outer surface temperatures and heat transfer coefficients between the rod and
coolant that could be used as boundary conditions in BISON models.
3. Six axial locations from the fuel rod model were selected to be modeled as a 1-cm tall
fuel pellet in BISON. The BISON models used the corresponding relative powers,
cladding outer surface temperatures, and heat transfer coefficients of those six axial
locations as boundary conditions.
4. An iterative procedure was developed to run the CTF fuel rod model, pull fuel
temperatures from the six specified axial locations, and compare them with the
BISON-predicted results. The table in CTF that gives thermal conductivity as a
function of temperature was adjusted based on the CTF-to-BISON comparisons, and
the model was rerun. This iterative process was repeated until convergence criteria
were met.
The relative power profile calculated by MPACT is shown in Figure 84 in which the
markers indicate the six axial locations that were used for the CTF calibration. The six
selected axial locations are at 15, 63, 147, 219, 315, and 411 cm and have respective
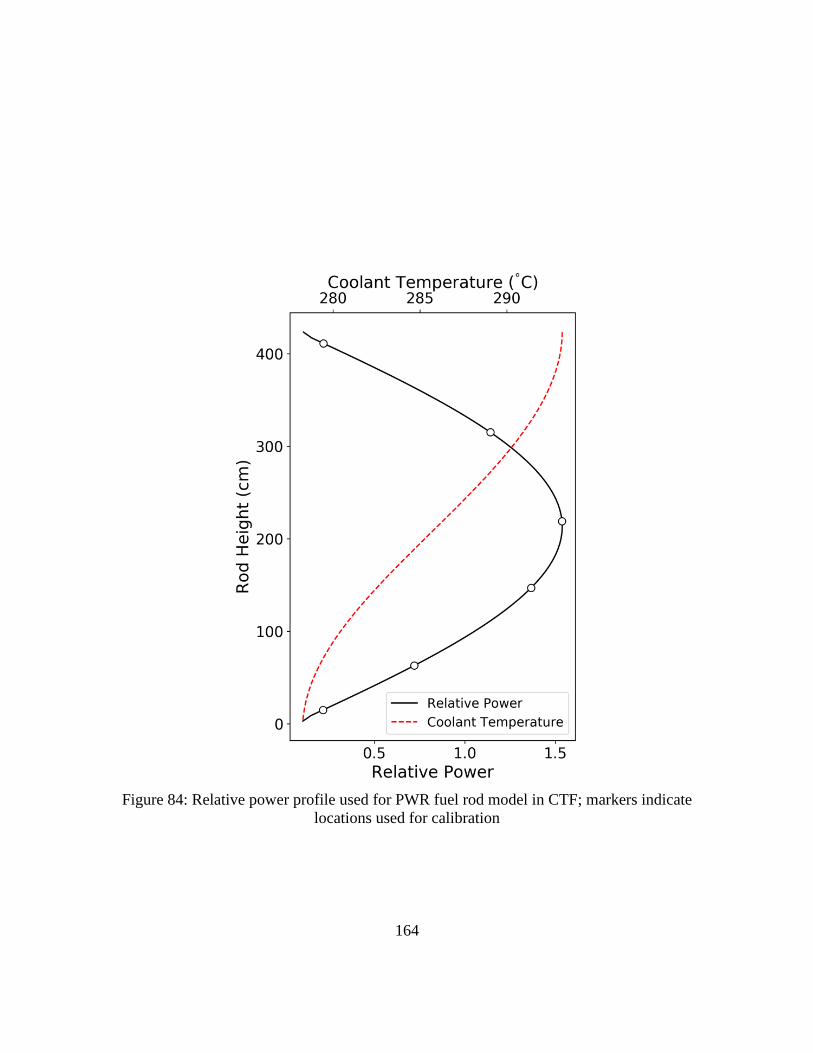
164
Figure 84: Relative power profile used for PWR fuel rod model in CTF; markers indicate
locations used for calibration

165
relative powers of 0.22, 0.72, 1.37, 1.54, 1.14, and 0.22. Although the same relative
power was selected twice, the other boundary conditions differ at the two points, as
shown by the inclusion of coolant temperature in Figure 84.
Of the six selected calibration points, the BISON-predicted radial fuel
temperatures for the LTC and HTC at three of the points are shown in Figure 85 for
clarity. In the figure, the highest temperatures correspond to the 219 cm point, the middle
temperatures correspond to the 63 cm point, and the lowest temperatures correspond to
the 15 cm point. Calibration was performed by adjusting the temperature-dependent
thermal conductivity in CTF to give reasonable agreement to the average fuel
temperature and the maximum fuel temperature. Accurately predicting average fuel
temperature is important since MPACT uses this value to update cross sections in a
coupled calculation, and accurately predicting the maximum fuel temperature is
important for safety implications. Additionally, fuel temperatures at 11 radial nodes in the
fuel pellet were compared, and the calibration procedure also aimed to minimize the
relative RMSE between CTF and BISON at these 11 nodes.
Figure 86 and Figure 87 show the calibrated CTF temperature predictions
compared with the BISON predictions for the LTC and HTC, respectively, at the same
three axial locations shown in Figure 85. Table 20 lists the relative agreement that the
calibrated CTF predictions have with the BISON predictions in terms of average fuel
temperature, maximum fuel temperature, and the RMSE across all 11 radial nodes in the
fuel pellet. Table 20 shows that the average and maximum fuel temperatures predicted by
CTF using the calibrated thermal conductivity relationships agreed with the BISON
values within 3% for the LTC and within 1% for the HTC, whereas the relative RMSE
across the 11 radial nodes was less than 5% for both cases. These values indicate
acceptable agreement, especially since CTF is unable to capture the decrease in
temperature that occurs at the central Mo rod interface with the fuel.
6.5.3 Scoping Analysis of PWR Thermal Performance
Models of a 17 × 17 PWR fuel assembly and a single PWR fuel rod were
developed in VERA to compare the thermal performance of UO2-Mo fuel in a reactor

166
Figure 85: Radial fuel temperature profiles predicted by BISON at 219, 63, and
15 cm
Figure 86: Comparison of calibrated CTF and BISON radial fuel temperature
profiles for the LTC at 219, 63, and 15 cm

167
Figure 87: Comparison of calibrated CTF and BISON radial fuel temperature profiles for
the HTC at 219, 63, and 15 cm
Table 20: Agreement of calibrated CTF results relative to BISON predictions
Case 𝑇𝑎𝑣𝑔 agreement (%) 𝑇𝑚𝑎𝑥 agreement (%) RMSE (%)
LTC -2.81 3.00 4.98
HTC 0.96 0.15 3.20
168
environment with that of UO2 using multiphysics methods. Thermal performance was
quantified in this context using the homologous temperature, or the ratio of the fuel
temperature to its melting point. The melting temperature of UO2 is 2,850°C [69], and the
melting temperature of Mo used to determine the homologous temperature of the UO2-
Mo fuels is 2,623°C [11]. The melting temperature of UO2 decreases slightly as a
function of burnup, although it is on the order of 0.5°C/GWd/t [183], so this effect is
assumed negligible in the current study. In the 17 × 17 fuel assembly, homologous
temperature was calculated in the hottest fuel rod at BOC only but was calculated as a
function of burnup in the single fuel rod model. CTF’s built-in properties for UO2 were
used for the reference calculation, and the calibrated thermal conductivity relationships
derived for the LTC and HTC were used for the UO2-Mo calculations.
Figure 88 shows the hottest rod’s homologous temperature in the PWR fuel
assembly at BOC as a function of the fuel rod’s height for UO2, the LTC, and the HTC.
Figure 89 shows the homologous temperature at the hottest location in the single fuel rod
model as a function of burnup for the three fuel designs. All thermal conductivity
relationships were assumed to be constant as a function of burnup because the version of
VERA used for this analysis does not account for UO2 thermal conductivity degradation
as a function of burnup. The impact of this assumption is that the predictions of
homologous temperature will be conservative since the BISON analysis showed that the
monolithic UO2 temperature will increase as a function of burnup, but the temperature of
the UO2-Mo fuel goes down as a function of temperature.
The changes in homologous temperature that occur as a function of burnup are
due to axial power shifts during the cycle and the use of CTF’s dynamic gap conductance
model. Figure 90 shows the relative power in the single fuel rod model for monolithic
UO2 and the LTC at 0, 30, and 60 GWd/t as examples of how the power shape evolves
for these fuels. In the fuel assembly, the LTC lowers the peak homologous temperature
by 23.5% and the HTC lowers the homologous temperature by 4.2% compared with UO2.
As a function of burnup, the LTC reduced the peak homologous temperature by 13–32%.
The HTC showed a maximum reduction of homologous temperature of 21%, but there
were several points near BOC in which the HTC caused an increase in homologous

169
Figure 88: Homologous temperature in the hottest rod in a PWR fuel assembly at
BOC
Figure 89: Peak homologous temperature in a PWR fuel rod as a function of
burnup
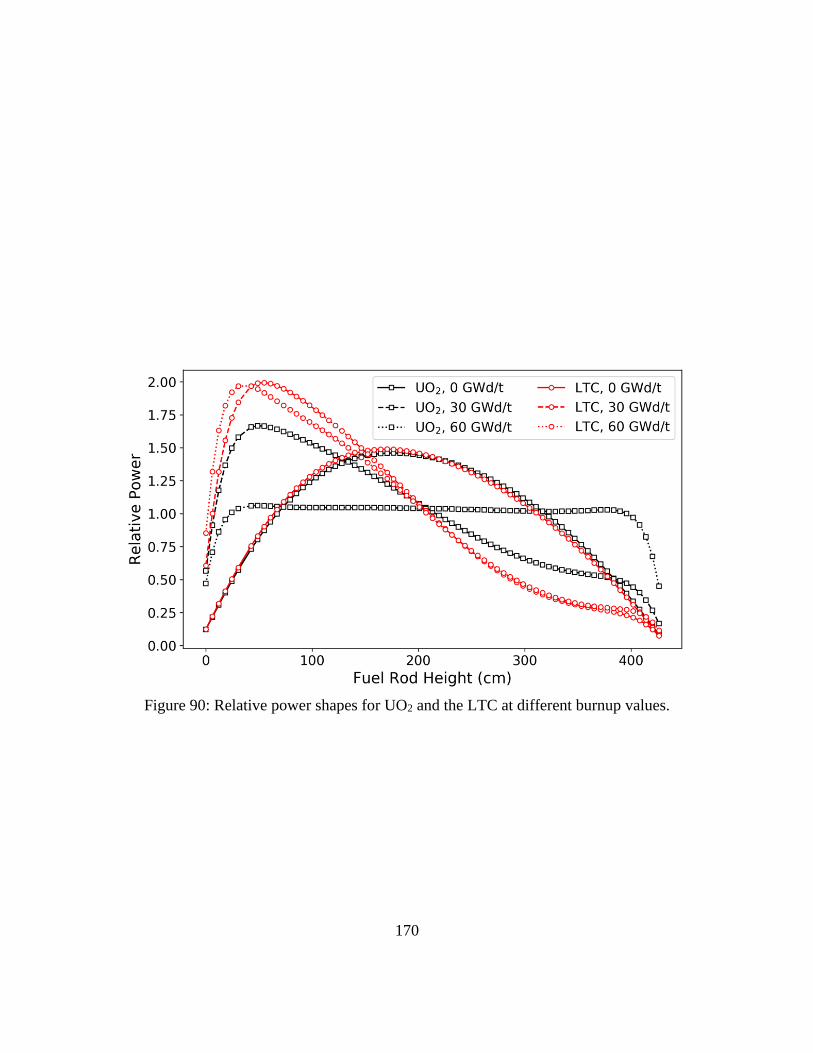
170
Figure 90: Relative power shapes for UO2 and the LTC at different burnup values.

171
temperature by several percent. Although the operating temperature of the HTC is lower
than that of UO2, this result is caused by the melting temperature of Mo being more than
200°C lower than that of UO2.
6.6 Discussion of Results
The sensitivity study results presented in Section 6.3 indicate that the Mo insert
geometry does impact neutronic and heat transfer performance. However, the effect of
geometry on initial neutron multiplication factors and cycle length was small since the
best performing geometry had a cycle length that was about 14 days, or 3%, longer than
the worst performing geometry. Furthermore, the geometry that gave the highest initial
reactivity augmented spatial self-shielding effects. The self-shielding in the geometry that
gave the lowest initial reactivity and the self-shielding in the homogeneously mixed UO2-
Mo design was more similar to what is experienced in UO2. In terms of heat transfer, the
insert geometry had a much larger impact. Compared with UO2 at a power of 270 W, the
worst performing UO2-Mo design in the heat transfer sensitivity study lowered the
maximum temperature by approximately 80 K at BOC, whereas the best performing
geometry lowered the maximum temperature by approximately 280 K. BISON
calculations at EOC showed even more significant temperature reductions from the Mo
structures. Temperature differences between the bounding insert geometries were
approximately 15–20%.
Generally, the geometric features that were best for cycle length were not the best
for heat transfer. The only exception was the radius of the central rod, rc, since an
increase in this value tended to give an increase in cycle length and a decrease in fuel
temperature. A cycle length calculation was performed for the LTC from the heat transfer
sensitivity study, and it was determined to be 459 EFPD. Despite the LTC having a
relatively large value for rc, this cycle length is just 2 days longer than the cycle length of
the worst performing geometry from the neutronics sensitivity study. This occurs because
the LTC also had large disk radii, which was the most impactful parameter on neutronics
that brings down the achievable cycle length. Although the geometric features of the
insert that are best for heat transfer typically do not optimize the cycle length, the results
172
of this study suggest that emphasis could be placed on optimizing the heat transfer
performance since the geometric impact on temperatures is on the order of 20%, whereas
the impact on cycle length is just a few percent. However, a formal cost-benefit analysis
would need to be performed to determine if the reduction in fuel temperature and related
safety and operational benefits outweigh the monetary costs associated with a several
percent reduction in cycle length. It may be found that some combination of Mo content,
235U enrichment, and insert geometry minimizes the cost of the design while still
realizing most of the potential heat transfer benefits.
The results from the heat transfer sensitivity study showed that rc was the most
impactful geometric feature on the maximum fuel temperature. Annular fuel pellets, in
which the central region of the fuel pellet is hollow, have been previously studied and it
was found that the benefits of annular fuel are greater than those from the UO2-Mo fuel
form in terms of reducing fuel temperatures [184]. At 150% nominal power density, the
dual-cooled annular fuel pellet concept showed a peak temperature decrease of 1300°C
compared to UO2 at 100% nominal power density. However, for these benefits to be
realized, the annular fuel requires internal cooling and changes to the typical PWR fuel
rod geometry. An in-depth cost-benefit analysis would need to be performed for the UO2-
Mo fuel to determine which fuel form is more economically feasible.
Because the impact of insert geometry on cycle length and neutron multiplication
factor calculations was small, it was justified to homogeneously mix the UO2 and Mo in
neutronics models used for RTCs and multiphysics calculations. Although homogenously
mixing UO2 and Mo was deemed appropriate for neutronics calculations, the relatively
large impact of the Mo insert geometry on fuel temperature and heat transfer performance
required thermal conductivity calibration in CTF. BISON results showed that the
maximum fuel temperature did not occur at the centerline in the UO2-Mo designs, and
there were large temperature gradients at the insert-to-fuel interface. Neither phenomena
can be mimicked in CTF, although thermal conductivity calibration was performed that
allowed CTF to closely match the temperatures predicted by BISON in terms of pellet
average, maximum, and RMSE across a set of radial nodes. This calibration enabled
scoping analysis which include thermal hydraulic effects.

173
Multiphysics PWR fuel rod and assembly calculations performed using calibrated
fuel thermal conductivity and MPACT coupled to CTF within VERA showed that an
optimized Mo insert could increase the margin to fuel melt by as much as 32% during the
fuel cycle compared with UO2. This prediction was made under the assumption that the
thermal conductivity relationships were constant with burnup and might differ with the
use of burnup-dependent thermal conductivity and gap closure models. Regardless, this
evaluation of the UO2-Mo fuel form with multiphysics modeling tools consistently
suggests that an optimal insert geometry can reduce fuel temperatures by up to about 30%
and provide an associated decrease in stored energy in the fuel on the order of 10–20%
compared with UO2. These reductions in temperature and stored energy may improve
fuel performance during normal reactor operation, reduce fission gas release, and
possibly provide enhanced accident tolerance. A transient analysis of large-break LOCAs
in LWRs by Terrani et al. [35] showed that an increase in fuel thermal conductivity and
the associated decrease in stored energy at nominal power can have a modest impact on
the peak fuel and cladding temperature in a PWR during the transient. In that study, the
reduction in peak cladding temperature during the large-break LOCA in a PWR due to
increases of fuel thermal conductivity of 200% and 500% were 56°C and 92°C,
respectively. Similar benefits may be realized with the UO2-Mo fuel form, as indicated
by the lower stored energy in the fuel pellet compared with UO2 indicated in Table 18. It
is important to note that the benefits of incorporating Mo inserts requires an increase in
235U enrichment to match the cycle length of monolithic UO2. A 235U enrichment of over
7.5% was required to approximately match the cycle length of UO2 that is 4.9% enriched.
However, based on the contour plot in Figure 61, the detriment to cycle length in a 4.9%
enriched UO2 fuel pellet with 15wt% Mo would be over 40%.
A secondary outcome of this work can be used to guide ongoing and future
investigations of UO2-Mo fuel forms. The present study does not take into account the
challenges or methods that would be required to produce UO2 fuel pellets containing Mo
inserts of the geometries investigated. While a number of experimental efforts have
produced UO2-Mo composite microstructures of varying complexity, none disclosed have
to date achieved the complexity represented in Figure 64. Advances in fuel fabrication
174
methods are required to achieve this level of complexity [185]. The systematic approach
used in this study could be applied to other UO2-Mo fuel forms, such as the concepts
developed by Medvedev and Mariani [10]. However, a concept that uses additive
manufacturing techniques may allow for a more complex insert structure that is
optimized for performance and safety, improves manufacturability, and does not impact
the fuel rod assembly process since the UO2 and Mo would not need to be alternately
stacked. The results of this work agree with previous investigations that insert geometry
will have a modest impact on maximum fuel temperature, but minimal impact on
neutronic characteristics. Research programs seeking to further develop UO2-Mo fuel
forms can therefore prioritize fabrication trials and experimental work with an
understanding that reactor performance and safety should be minimally impacted by the
specific geometry of the Mo inserts used.

175
CHAPTER 7
CONCLUSION
7.1 Summary and Conclusions
The development of accident tolerant fuel, cladding, and core structural materials
is motivated by the need to extend the coping time during a severe accident, such as the
one that occurred at the Fukushima-Daiichi nuclear power plant in 2011. Computational
evaluations of four ATF technologies spanning from early-stage to near-term deployment
concepts were performed in this dissertation. Additionally, an initial assessment of
VERA’s ability to perform BWR analysis and demonstration of the modeling suite’s
advanced features and application to ATF research was performed. These types of
simulation-based evaluations are vital to enhancing the efficiency of new materials
research and make the licensing process for new materials more economical. Although a
variety of ATF concepts were studied using a breadth of methods, the single underlying
theme of this work is the support of ATF development through advanced, multiphysics
modeling methods. Results from each of these evaluations highlighted key advantages
and potential challenges associated with each concept.
7.1.1 FeCrAl Cladding Thermal Hydraulic Evaluation
CHAPTER 3 presented a computational thermal hydraulic analysis of FeCrAl
cladding subjected to an RIA-like power transient. When predictions of CHF and
cladding temperature calculated by RELAP5-3D and CTF were compared to
experimental data, it was found that the computer models errored on the side of
conservatism by underpredicting CHF and overpredicting the cladding temperature when
the power transient was applied. To understand the discrepancy between the computer
simulation results and the experimental data, two sensitivity studies were conducted to
determine if the differences between the experimentally measured CHF and the CHF
predicted using the look-up method may be explained by differences in heat transfer
coefficients, material thermal properties, or the enhancement of CHF that occurs during a
heating transient.

176
Both sensitivity studies used RAVEN coupled to the RELAP5-3D model of the
experiment. The first sensitivity study varied multipliers on heat transfer coefficients and
also included variation of the CHF multiplier, which may reflect the enhancement of
CHF caused by a transient heating process. It was found that CHF was not dependent
upon most of the heat transfer coefficients and was only impacted somewhat by the
variation in the transition boiling heat transfer coefficient and much more so by the CHF
multiplier. The PCT was sensitive to the transition and film boiling heat transfer
coefficients and the CHF multiplier because transition and film boiling are the flow
regimes that occur in the post-CHF regime. The second sensitivity study varied the
thermal conductivity and volumetric heat capacity of the FeCrAl cladding based on
measurement uncertainties. The CHF multiplier was also included in the second
sensitivity study. Variations in thermal effusivity and thermal diffusivity were able to be
calculated from the thermal conductivity and volumetric heat capacity. The resulting
trends showed that CHF increases with the CHF multiplier, thermal conductivity, thermal
effusivity, and thermal diffusivity, but somewhat decreased as volumetric heat capacity
increased. PCT decreased as the CHF multiplier, volumetric heat capacity, and thermal
diffusivity increased, but decreased as thermal effusivity increased. There was no
apparent sensitivity of PCT to thermal conductivity.
The discrepancies between experimental data and simulated results indicate the
areas of research that require the most attention. The relative insensitivity of CHF and
PCT to heat transfer coefficients suggest that improving upon the numerous empirical
heat transfer correlations is less of a priority than understanding the material property
evolution of FeCrAl and the need for a correlation that predicts the CHF enhancement
caused by a power transient. The results in CHAPTER 3 show that this is an important
quantity to understand to correctly predict CHF and PCT.
An important contribution from the FeCrAl study is the demonstrated difference
between how CHF is being modeled and the real-world phenomenon. From the
sensitivity studies, which included a total of 17,883 trial runs, the runs that best matched
the experimental data could be determined in terms of three FoMs: MHF, PCT, and
integral heat flux. A best match for each FoM was determined based on relative error to
177
the experiment. An overall best match was also determined, which was identified as the
run with the minimum combined RMSE for each FoM. The overall best match from the
first sensitivity study had relative errors for the MHF, PCT, and integral heat flux of
3.22%, 36.52%, and 2.52%, respectively, giving an RMSE of 36.74%. The overall best
match from the second sensitivity study involving material thermal properties had
relative errors for the MHF, PCT, and integral heat flux of 1.24%, 27.02%, and 1.70%,
respectively, resulting in an RMSE of 27.10 %.
The relative errors from the best match cases show that even when a good match
to the MHF and integral heat flux is made, RELAP5-3D is still conservative when
predicting the post-CHF temperature excursion. This is due to the difference between the
post-CHF behavior modeled by computer codes and the phenomenon that occurs in
reality. In the UNM FeCrAl experiment, there was a 1-second transition period after
DNB occurred where the heat flux continued to increase. This led to a difference between
the CHF and the MHF, which broadened the heat flux pulse width and allowed more heat
to be transferred to the coolant during the power transient. The distinction between CHF
and MHF was only experienced in the experiment using FeCrAl, and may be due to
uncertainty in the measurements. However, it was shown in the experimental for Inconel,
stainless steel, and FeCrAl that the heat flux decreases at a much slower rate in reality
than in the computer models after CHF is reached. The faster rate of heat flux reduction
in the codes reduces the width of the heat flux pulse during the transient and caused a
large overshoot in the post-CHF surface temperature prediction. These observations are
key contributions from the study of FeCrAl cladding that highlight conservatism in
computer models and area of needed research.
7.1.2 Assessment of VERA BWR Modeling and Analysis of SiC/SiC Channel Box
An initial assessment of the BWR modeling capability in CASL VERA and its
application to predicting temperature and fast neutron flux distributions in SiC/SiC
channel boxes was made in CHAPTER 4. Two types of code-to-code comparisons were
made for this assessment, both of which used historical Peach Bottom BWR fuel
assembly geometries. First, two-group cross sections generated by VERA’s deterministic

178
neutron transport code MPACT and the Monte Carlo code Serpent were compared. The
cross sections generated for the 2-D fuel lattices were typically in good agreement,
especially when the statistical uncertainties in the Monte Carlo estimates from Serpent
were taken into account. The greatest discrepancies between the two modeling tools
occurred in the scattering cross sections produced from the lattices that contained
gadolinia, but it was found that using the P2 approximation for scattering significantly
reduced the differences.
Predictions of several key reactor parameters made by VERA and
PARCS/PATHS were compared for six fuel assembly designs from the Peach Bottom
Unit 2 reactor. To perform the comparisons, the high-fidelity results from VERA were
radially averaged to match the output resolution produced by PARCS/PATHS. In terms
of keff, the two modeling tools agreed within approximately 150-410 pcm, and the
differences in relative power, exit void fraction, pressure drop, and fuel temperature were
mostly on the order of 1-10%. While the exit void fractions predicted by the two codes
were similar, VERA always predicted noticeably greater voids at lower regions in the
assemblies. Standalone comparisons between CTF and PATHS showed that these void
fraction discrepancies are a primary cause of other discrepancies in the coupled
calculations. Differences between the two modeling codes may also be explained through
differences in methodology and design philosophy since VERA was specifically designed
to utilize multiphysics capabilities, a high-fidelity output structure, and higher-order
solution methods compared to PARCS/PATHS.
Following the assessment of VERA’s BWR modeling capability, the modeling
suite was used to generate temperature and fast neutron flux boundary conditions in
SiC/SiC channel boxes in single fuel assembly and mini-core models. Calculations of
temperature and fast neutron flux distributions in SiC/SiC channel boxes showed that the
fast neutron flux varies significantly in both the radial and axial directions, especially in
the presence of an inserted control blade. These distributions are important because fast
flux gradients are the primary cause of potential SiC/SiC channel box deformation due to
nonuniform irradiation swelling rates.
179
In the single fuel assembly models, two energy cutoffs were used for predicting
the fast flux. In previous SiC/SiC characterization studies, 0.1 MeV was considered as the
energy cutoff for neutrons that could cause displacement damage and lead to irradiation
swelling. The cutoffs of 0.067 MeV and 0.183 MeV were the nearest available cutoffs to
0.1 MeV in the VERA cross section library. Calculating the fast flux distribution at these
two energy cutoffs showed the sensitivity of the fast flux and the channel box
deformation to the fast neutron energy. The difference in fast flux between the two
cutoffs was between 4% and 17% depending on the axial location considered and the
control blade configuration. Regardless of the fast flux energy cutoff used, the radial fast
neutron flux gradient is approximately 35-40% when the control blade is fully inserted,
and the peak fast flux is approximately 5 to 7 times greater than the minimum peak flux
in the axial direction. The axial temperature gradient is about 10°C and the radial
temperature gradient is about 2-3°C depending on the control blade configuration.
Results from the mini-core model showed similar distributions to the single fuel
assembly models. The fast neutron flux gradient across all four channel boxes in the
control cell ranged from a relative difference of approximately -99–130% from the
average flux value. Both the temperature and fast neutron flux gradient were most
pronounced in the channel box nearest to the control blade and would be expected to
undergo the most deformation.
This study suggests that VERA is capable of predicting steady-state BWR
performance at least as well as current regulatory tools, while also offering numerous
advanced modeling features that allow it to solve complex and novel problems. To
further improve confidence in the application of VERA to BWRs, uncertainty
quantification studies, code-to-code comparisons of full-core and depletion analyses,
additional cross section comparisons in fuel lattices at different states and burnup, and
validation against measured BWR data should be performed. Benchmarking of VERA’s
ability to model grid spacers in BWRs also needs addressed. Overprediction of void
fraction in bubbly and slug flow regimes by CTF compared to experimental data has been
highlighted in previous studies and is an area of continued development within CASL.
From an ATF standpoint, analyses of SiC/SiC channel boxes can also be expanded upon
180
to account for operational procedures such as varying control blade configurations and
core shuffling maneuvers, and additional deformation studies could be performed using
the boundary conditions generated in this study.
7.1.3 Reactor Performance and Safety Characteristics of ThN-UN
The ATF evaluation presented in CHAPTER 5 involved finding mixtures of ThN
and UN that could match the UO2 cycle length, and then determining the reactor
performance safety characteristics of those mixtures. The motivation for this study is that
both UN and ThN have a higher thermal conductivity than UO2, so better thermal
performance was expected. However, on their own, UN is known to readily deteriorate in
water, and thorium has no fissile isotopes and is unable to be used as a standalone fuel
type. The consideration of composite ThN-UN fuel forms was driven by the hypothesis
that ThN may mitigate the degradation of UN in water, while UN provides the external
neutron source to transmute 232Th to the fissile 233U. Compositions were determined for
both natural nitrogen and 100% enriched 15N cases.
RTCs were calculated for the determined UN and ThN-UN fuel compositions and
compared to the UO2 reactivity coefficients. The FTC and MTC were more negative for
the UN and ThN-UN fuels but were still within the acceptable limits provided by the
AP1000 DCD. Both the SBC and control rod worth for the nitride fuels were found to be
less negative than the UO2 case and were outside the AP1000 limits. The reduced control
worth and more negative MTC suggest that shutdown margin may be an issue for this
fuel form. When 100% enriched 15N was used, the FTC and MTC for UN and 40%ThN-
60%UN were similar to the natural nitrogen cases. The worth of the soluble boron and
control rods increased by using enriched 15N, but they were still less than the control
worth in a UO2 system and still outside the AP1000 DCD limits. Although the reduced
control rod worth may partially be compensated for by less excess reactivity and 15N
enrichment, full-core analysis should be performed to confirm if shutdown margin is
truly an issue for UN or ThN-UN-fueled PWRs. If shutdown margin is insufficient for
these fuel types, then design changes such as soluble boron with enriched 10B or B4C
control rods may need to be considered.

181
The thermal performance of ThN-UN fuel in an AP1000 fuel pin was determined
using the coupled neutronics and thermal hydraulics capabilities of MPACT and CTF
within VERA. Axial distribution of homologous temperature was found at BOC for each
fuel form, and results showed that the maximum homologous temperature for the nitride
fuels was approximately 50% of the UO2 homologous temperature. When burnup was
considered, the maximum UO2 homologous temperature was found to be 0.42, whereas
the maximum homologous temperature for UN was approximately 0.20. The homologous
temperature never surpassed 0.195 for any of the ThN-UN mixtures. This significant
reduction in homologous temperature highlights the benefits of nitride fuels from an ATF
perspective: these fuels have a larger thermal safety margin and therefore a smaller
chance of melting and releasing fission products.
Overall, the preliminary results from this study point to ThN-UN mixtures being a
feasible fuel form in a PWR under normal operating conditions, and they may have
advantages from an accident tolerance viewpoint. For ThN-UN to be implemented,
further evaluation is required to address key remaining challenges, such as shutdown
margin, ThN-UN chemical reactivity with water, fuel behavior during irradiation, and
fuel safety during accident scenarios. An analysis could be performed to determine if
moving to a thorium-based fuel is viable from an economic viewpoint. Future work could
expand upon the work on this study by performing assembly-level and full-core analyses
in which additional factors would need to be considered such as varying fuel loading
patterns, the impact of fuel assembly location within the core, fuel management schemes,
and the axial and radial dependence of burnup within the fuel. The comparison of ThN-
UN fuels to a UO2 fuel pin-cell of a single enrichment value provides a first look at the
feasibility of this novel fuel type, but further investigation would be required to optimize
the core design in terms of fuel management and loading patterns.
7.1.4 Reactor Performance and Safety Characteristics of UO2 with Mo Inserts
The impact of UO2 with Mo inserts and insert geometry on reactor performance
and safety characteristics was investigated in CHAPTER 6 using sensitivity analysis
techniques and multiphysics methods. Sensitivity analyses on the insert geometry impact
182
on neutronic and heat transfer performance were performed using Serpent and BISON.
Results from the sensitivity studies that used single fuel pellet models informed reactor
analysis models in coupled MPACT and CTF within the VERA multiphysics modeling
environment. This included justifying the use of homogenized UO2-Mo in neutronics
models and calibrating UO2-Mo thermal conductivity to allow CTF to approximate the
finite element results produced by BISON.
The sensitivity analyses showed that the most impactful geometric features
differed between the neutronics and heat transfer studies, and that optimal features in one
study hurt performance in the other study. For example, large radial disks caused the
greatest decrease in cycle length but improved the thermal performance of the insert.
However, the overall impact of insert geometry on cycle length was much smaller than
the impact on fuel temperature and energy storage. Although the impact of the insert
geometry on cycle length was small for the Mo content and 235U enrichment considered
in this study, the inclusion of Mo in UO2 significantly affects cycle length in a way that
will likely require compensation via HALEU.
RTC calculations showed that the investigated geometries had a relatively small
effect on FTC and MTC, likely due to the similarity in absorption cross sections between
Mo and 238U. However, Mo content did impact SBC and control worth since replacing
fuel with Mo and the varying 235U enrichments affected flux levels and fission product
poisoning. Homologous temperatures predicted at BOC in a PWR fuel assembly and as a
function of burnup in a single fuel rod showed that the optimal Mo insert geometry
increased the margin to fuel melt from 13 to 32%. Also, an unoptimized geometry can
exhibit little to no benefit compared with UO2 in terms of homologous temperature since
the melting point of Mo is lower than that of UO2.
The key takeaway from this study is that using Mo inserts in UO2 can potentially
provide significant safety and fuel performance benefits in a reactor environment if the
insert geometry is optimized, but these benefits come with a significant decrease in cycle
length that requires more than 5% 235U enrichment as compensation. Features of an
optimal geometry were identified in this study using sensitivity analysis methods, and a
central axial rod with a large radius was the most important geometric feature for
183
reducing maximum fuel temperature. Inserts with many thin, radial disks that extend to
the edge of the fuel pellet further reduce temperature by providing a radial pathway for
heat to transfer out of the fuel. Incorporating Mo inserts into nuclear fuel appears feasible
based on the RTC calculations made in this study since the impact to FTC and MTC was
small. However, full-core shutdown margin calculations are suggested to confirm this
since reduced control worth and a somewhat more negative MTC were observed in the
fuel design with 15wt% Mo and 7.52% 235U enrichment. A stress analysis of UO2 with
Mo inserts is also suggested to determine whether stress-induced failure could occur
during fabrication or reactor operation, and comparisons with other UO2-Mo concepts
should be carried out that focus on the feasibility of manufacturing and assembling these
designs. Lastly, an optimization study and accompanying irradiation experiments that
focus on fuel performance of this novel fuel form is also suggested for future work since
the optimization performed in this study focused on neutronics and heat transfer only.
7.2 Contributions and Evaluation of Hypotheses
7.2.1 Contributions
In general, the work presented in this dissertation contributes new knowledge of
the operational and safety performance of potential ATF candidates using advanced
computational methods. This work demonstrates a key step in the licensing process of
new materials that is made more efficient and economical through the application of
novel multiphysics methods and tools. The significant and specific contributions of this
dissertation include:
1. Comparison of experimental and simulated results for a flow boiling CHF apparatus.
2. Quantification of the sensitivity of CHF and post-CHF phenomena to heat transfer
coefficients, material properties, and the CHF enhancement caused by a heating
transient.
3. Examination of key differences between CHF modeling and the observed
phenomenon, most notably the transition period from nucleate boiling to post-CHF
boiling regimes in which heat transfer is yet to decline.
184
4. An initial assessment of CASL’s multiphysics modeling suite, VERA, for BWR fuel
assembly cross section generation and performance modeling using current state-of-
the-art simulation tools.
5. Calculation of 3-D temperature and fast neutron flux distributions in SiC/SiC channel
boxes for a variety of control blade configurations using VERA.
6. Identification of multiple ThN-UN mixtures that are capable of meeting the fuel cycle
length of UO2 in a PWR for both natural nitrogen and 100% enriched 15N.
7. Determination of reactor performance and safety characteristics, specifically RTCs
and homologous temperature, of ThN-UN fuel forms using both natural nitrogen and
enriched 15N in a PWR.
8. Development of an optimization scheme that uses sensitivity analysis methods to
maximize the neutronic and heat transfer performance of Mo inserts in UO2.
9. Programming of a calibration scheme to obtain close matches between UO2-Mo fuel
temperature profiles in CTF in which the Mo is smeared in the UO2 to finite element
profiles from BISON in which Mo inserts are explicitly modeled.
10. Determination of RTCs and homologous temperature of UO2 with Mo inserts in a
PWR using multiphysics methods.
7.2.2 Review of Hypotheses
The hypotheses presented in Section 1.3 are reviewed based on the findings
presented in this dissertation.
1. The CHF and PCT of FeCrAl cladding are sensitive to heat transfer coefficients,
material properties, and the transient-induced CHF enhancement.
This statement is largely true because it was shown that CHF and PCT of FeCrAl
were most sensitive to material properties and the CHF multiplier. CHF and PCT showed
some sensitivity to the heat transfer coefficients in the post-CHF boiling regimes
(transition and film boiling), but their effect was minor compared to that of material
properties and the CHF multiplier.
2. VERA is capable of accurately predicting BWR performance and is valid to use for
novel, complex problems, such as ATF evaluations.

185
An assessment was made of VERA’s ability to generate nuclear cross sections
and predict reactor performance parameters. Comparisons of two-group cross sections
were made between VERA’s deterministic neutron transport solver, MPACT, and the
Monte Carlo code Serpent using 2-D BWR fuel lattice models. These comparisons
showed that the cross sections predicted by MPACT matched or nearly matched those
predicted by Serpent within uncertainty bounds. Peach Bottom BWR fuel assembly
models were developed in VERA and PARCS/PATHS to compare reactor performance
parameters. Predictions from each tool showed agreement of neutron multiplication
factors within approximately 409 pcm or less, relative agreement of peak fuel
temperature between 4.4 and 17.8%, and agreement in pressure drop of 4.4% or less.
Outlet equilibrium quality predictions were the same between VERA and
PARCS/PATHS for all six assembly types, and both modeling tools predicted similar exit
void fractions, although CTF typically predicted a faster vapor generation rate. This level
of agreement is typically considered acceptable, and confirms the hypothesis.
3. Temperature and fast neutron flux gradients in a SiC/SiC channel box will lead to
deformation and control blade interference.
VERA was used to calculate 3-D distributions of temperature and fast neutron
flux in SiC/SiC channel boxes. Both single fuel assembly and mini-core models were
utilized, and several control blade configurations were considered. The resulting
distributions showed significant fast neutron flux gradients in both the axial and radial
directions. These distributions were used as boundary conditions in finite-element
deformation and stress analysis models [17], which showed that significant deformation
will occur and control blade interference is likely, at least until swelling in the channel
box saturates. The residual deformation from thermal gradients is not enough to cause
control blade interference.
4. ThN-UN fuels provide an enhanced thermal safety margin due to the high thermal
conductivity of nitride-based fuel.
The results presented in CHAPTER 5 confirm this statement. Each of the nitride-
based fuels considered had a homologous temperature in PWR conditions that was
approximately half that of UO2 across all burnups considered. Additionally, the ThN-UN

186
fuels considered were able to match the cycle length of conventional UO2 when HALEU
was used and RTCs for these fuels were relatively similar to those for UO2. The
preliminary screening study in this dissertation highlights the feasibility of composite
ThN-UN fuel concepts in LWRs.
5. A Mo insert design for UO2 fuel pellets can be optimized to improve thermal safety
margin of LWRs while having minimal impact on neutronic performance.
An optimization and sensitivity analysis procedure was developed to optimize the
neutronic and heat transfer performance of Mo inserts in UO2. The study showed that the
geometry of the insert had a minimal impact on cycle length, although the inclusion of a
non-fissile insert in-and-of itself reduces cycle length in a way that will require
compensation via HALEU. Geometry of the Mo insert does have an impact on heat
transfer capabilities, however, and the difference in maximum fuel temperature between
the bounding insert geometries was about 15–20%. Further analyses are needed to
determine if the safety and operational benefits from the reduction in fuel temperature
outweigh the costs associated with the reduction in cycle length. It was also shown that
the Mo insert had a minimal impact on RTCs, preliminarily implying that this is a
feasible fuel concept for LWRs.
7.3 Recommended Future Work
Owing to the computational nature of the studies in this dissertation, much of the
suggested work for these potential ATF concepts is based on experiments and additional
computational analyses. One of the key takeaways from the FeCrAl analysis is that there
is no current model for the transition period that occurs when CHF is reached before the
heat transfer declines. Investigation of this phenomena and subsequent development of a
correlation is necessary to increased accuracy of accident modeling in which CHF is a
factor. Additionally, no model exists for predicting the enhancement in CHF caused by a
power transient. Without correlations for these phenomena, current modeling tools make
overly conservative predictions of when CHF is reached and the resulting PCT, which
may be acceptable from a safety standpoint but is uneconomical.

187
The assessment of VERA presented in this dissertation was performed for a
limited set of 2-D BWR fuel lattices and 3-D fuel assembly models at steady state and
normal operating conditions. A broader array of progression problems is required for the
V&V process and should build up to comparisons of plant operation data, similar to the
Watts Bar 20-year operational history that was simulated to validate VERA for PWR
applications [138]. In regards to the SiC/SiC channel box study, it would be beneficial to
determine the effect of fuel assembly location within the core, control blade history, and
burnup on the fluence a particular channel box is subjected to. Inclusion of these effects
will give a more realistic set of fast flux boundary conditions to be used in channel box
deformation studies. Additionally, fuel loading schemes and other operational maneuvers,
such as core shuffling and fuel assembly rotations, could be optimized to limit channel
box deformation and control blade interference.
The evaluation of ThN-UN fuels indicate that it is capable of enhancing accident
tolerance and is a feasible fuel form for LWRs if HALEU is able to be used. However,
the purpose of introducing ThN in the first place is to reduce the chemical reactivity of
UN in water. Further experimentation is needed to characterize the degradation of mixed
ThN-UN fuels in water and the performance of these fuels under irradiation. It was
shown that control rods and soluble boron have reduced reactivity worth for nitride-based
fuels relative to UO2, which suggests that shutdown margin may be an issue with this fuel
concept. This concern is exacerbated by the more negative MTC of these fuels compared
with UO2. Further analysis on a full-core scale is recommended to determine if this is the
case, and if so, design changes may be required. If shutdown margin is confirmed to be
an issue for ThN-UN fuels with typical AIC control rods, it is possible that B4C control
rods with enriched 10B may mitigate the issue.
Similarly to the ThN-UN fuels, UO2 with optimized Mo inserts is a fuel concept
that was shown to improve the margin to fuel melt during normal operation and be
feasible for LWRs when HALEU is used. Because the study in CHAPTER 6 focused on
neutronics and heat transfer, the primary future work suggested for this concept is the
characterization of fuel performance and accompanying irradiation experiments.
Additionally, stress analyses should be performed to design an insert geometry that will
188
not fail during fabrication or reactor operation. Since it has been shown that the insert
geometry has a minimal impact on neutronic performance, future studies may focus
primarily on developing a geometry that optimizes heat transfer performance while also
attempting to maximize fuel performance and minimize mechanical and thermal stress.
Cost-benefit analyses should be performed in parallel with future optimization studies to
ensure the performance and safety benefits make up for any additional costs incurred
from cycle length reduction. The results from the UO2-Mo study indicate that changes in
Mo content and 235U enrichment have a stronger impact on cycle length than the insert
geometry. The approach developed for insert geometry optimization could be utilized in
these future studies.
Each ATF concept analyzed in this dissertation shows potential for eventual
application, but each one also requires additional evaluations and testing before being
licensed. Both ThN-UN and UO2 with Mo inserts are in the early stages of screening, and
many more material characterization experiments and testing will be needed for these
concepts to progress. SiC/SiC as a channel box material is considered a long-term
concept by the NRC, and must also undergo a number of additional tests and
computational evaluations. Bowing of the channel box and potential control blade
interference is currently the most pressing challenge for the concept, and additional work
is needed to determine methods for alleviating this issue. FeCrAl cladding is the concept
closest to being deployed, but several years of analysis and testing are still required for
this concept as well. At the time of this writing, lead test assemblies containing IronClad,
the name given to Global Nuclear Fuel’s FeCrAl cladding design, are loaded into
Southern Nuclear’s Edwin I. Hatch Plant in Georgia and Exelon’s Clinton Power Station
in Illinois.

189
REFERENCES
190
[1] S. J. Zinkle, K. A. Terrani, J. C. Gehin, L. J. Ott and L. L. Snead, "Accident
Tolerant Fuels for LWRs: A Perspective," Journal of Nuclear Materials, vol. 448,
pp. 374-379, 2014.
[2] U.S. Nuclear Regulatory Commission, "Project Plan to Prepare the U.S. Nuclear
Regulatory Commission for Efficient and Effective Licensing of Accident
Tolerant Fuels," U.S. Nuclear Regulatory Commission, 2018.
[3] S. M. Bragg-Sitton, M. Todosow, R. Montgomery, C. R. Stanek, R. Montgomery
and W. J. Carmack, "Metrics for the Technical Performance Evaluation of Light
Water Reactor Accident-Tolerant Fuel," Nuclear Technology, vol. 195, no. 2, pp.
111-123, 2016.
[4] Y. Yamamoto, B. A. Pint, K. A. Terrani, K. G. Field, Y. Yang and L. L. Snead,
"Development and property evaluation of nuclear grade wrought FeCrAl fuel
cladding for light water reactors," Journal of Nuclear Materials, vol. 467, pp. 703-
716, 2015.
[5] K. G. Field, M. A. Snead, Y. Yamamoto and K. A. Terrani, "Handbook on the
Material Properties of FeCrAl Alloys for Nuclear Power Production
Applications," ORNL/TM-2017/186, 2017.
[6] S. K. Lee, M. Liu, N. R. Brown, K. A. Terrani, E. D. Blandford, H. Ban, C. B.
Jensen and Y. Lee, "Comparison of steady and transient flow boiling critical heat
flux for FeCrAl accident tolerant fuel cladding alloy, Zircaloy, and Inconel,"
International Journal of Heat and Mass Transfer, vol. 132, pp. 643-654, 2019.
[7] T. Cheng, J. R. Keiser, M. P. Brady, K. A. Terrani and B. A. Pint, "Oxidation of
fuel cladding candidate materials in steam environments at high temperature and
pressure," Journal of Nuclear Materials, vol. 427, pp. 396-400, 2012.
[8] N. H. Larsen, "Core Design and Operating Data for Cycles 1 and 2 of Peach
Bottom 2," No. EPRI-NP-563, General Electric Company, 1978.
[9] W. Zhou and W. Zhou, "Enhanced thermal conductivity accident tolerant fuels for
improved reactor safety - A comprehensive review," Annals of Nuclear Energy,
vol. 119, pp. 66-86, 2018.
[10] P. G. Medvedev and R. D. Mariani, "Conductive inserts to reduce nuclear fuel
temperature," Journal of Nuclear Materials, vol. 531, p. 151966, 2020.
[11] D.-J. Kim, Y. W. Rhee, J. H. Kim, K. S. Kim, J. S. Oh, J. H. Yang, Y.-H. Koo and
K.-W. Song, "Fabrication of micro-cell UO2-Mo pellet with enhanced thermal
conductivity," Journal of Nuclear Materials, vol. 462, pp. 289-295, 2015.
[12] S. C. Finkeldei, J. O. Kiggans, R. D. Hunt, A. T. Nelson and K. A. Terrani,
"Fabrication of UO2-Mo composite fuel with enhanced thermal conductivity from
sol-gel feedstock," Journal of Nuclear Materials, vol. 520, pp. 56-64, 2019.
[13] J. P. Gorton, S. K. Lee, Y. Lee and N. R. Brown, "Comparison of experimental
and simulated critical heat flux tests with various cladding alloys: Sensitivity of
iron-chromium-aluminum (FeCrAl) to heat transfer coefficients and material
properties," Nuclear Engineering and Design, vol. 353, p. 110295, 2019.

191
[14] J. P. Gorton, B. S. Collins, A. J. Wysocki and N. R. Brown, "Assessment of CASL
VERA for BWR analysis and application to accident tolerant SiC/SiC channel
box," Nuclear Engineering and Design, vol. 365, p. 110732, 2020.
[15] J. P. Gorton, B. S. Collins, A. T. Nelson and N. R. Brown, "Reactor performance
and safety characteristics of ThN-UN fuel concepts in a PWR," Nuclear
Engineering and Design, vol. 355, p. 110317, 2019.
[16] J. P. Gorton, D. Schappel, A. T. Nelson and N. R. Brown, "Impact of uranium
oxide (UO2) fuel with molybdenum (Mo) inserts on pressurized water reactor
performance and safety," Journal of Nuclear Materials, vol. 542, p. 152492, 2020.
[17] G. Singh, J. P. Gorton, D. Schappel, B. S. Collins, Y. Katoh, N. R. Brown and B.
D. Wirth, "Impact of control blade insertion on the deformation behavior of SiC-
SiC channel boxes in BWRs," Nuclear Engineering and Design, vol. 363, p.
110621, 2020.
[18] J. Leppänen, "Serpent - a Continuous-energy Monte Carlo Reactor Physics
Burnup Calculation Code," VTT Technical Research Centre of Finland, 2013.
[19] R. L. Williamson, J. D. Hales, S. R. Novascone, M. R. Tonks, D. R. Gaston, C. J.
Permann, D. Andrs and R. C. Martineau, "Multidimensional multiphysics
simulation of nuclear fuel behavior," Journal of Nuclear Materials, vol. 423, pp.
149-163, 2012.
[20] H. G. Rickover, L. D. Geiger and B. Lustman, "History of the Development of
Zirconium Alloys for Use in Nuclear Reactors," United States Energy Research
and Development Administration Division of Naval Reactors, Denver, CO, 1975.
[21] S. J. Zinkle, K. A. Terrani and L. L. Snead, "Motivation for utilizing new high-
performance advanced materials in nuclear energy systems," Current Opinion in
Solid State and Materials Science, vol. 20, pp. 401-410, 2016.
[22] A. Labib and M. J. Harris, "Learning how to learn from failures: The Fukushima
nuclear disaster," Engineering Failure Analysis, vol. 47, pp. 117-128, 2015.
[23] Y.-H. Koo, Y.-S. Yang and K.-W. Song, "Radioactivity release from the
Fukushima accident and its consequences: A review," Progress in Nuclear
Energy, vol. 74, pp. 61-70, 2014.
[24] Nuclear Regulatory Commission, "Nuclear Reactor Risk," July 2018. [Online].
Available: https://www.nrc.gov/docs/ML0318/ML031830809.pdf.
[25] J. Carmack, F. Goldner, S. M. Bragg-Sitton and L. L. Snead, "Overview of the
U.S. DOE Accident Tolerant Fuel Development Program," Idaho National
Laboratory, INL/CON-13-29288, 2013.
[26] N. R. Brown, M. Todosow and A. Cuadra, "Screening of advanced cladding
materials and UN-U3Si5 fuel," Journal of Nuclear Materials, vol. 462, pp. 26-42,
2015.
[27] L. J. Ott, K. R. Robb and D. Wang, "Preliminary assessment of accident-tolerant
fuels on LWR performance during normal operation and under DB and BDB
accident conditions," Journal of Nuclear Materials, vol. 448, pp. 520-533, 2014.
192
[28] B. A. Pint, K. A. Terrani, Y. Yamamoto and L. L. Snead, "Material Selection for
Accident Tolerant Fuel Cladding," Metallurgical and Materials Transactions E,
vol. 2E, pp. 190-196, 2015.
[29] K. A. Terrani, "Accident tolerant fuel cladding development: Promise, status, and
challenges," Journal of Nuclear Materials, vol. 501, pp. 13-30, 2018.
[30] K. A. Terrani, S. J. Zinkle and L. L. Snead, "Advanced oxidation-resistant iron-
based alloys for LWR fuel cladding," Journal of Nuclear Materials, vol. 448, pp.
420-435, 2014.
[31] C. Gillen, A. Garner, A. Plowman, C. P. Race, T. Lowe, C. Jones, K. L. Moore
and P. Frankel, "Advanced 3D characterisation of iodine induced stress corrosion
cracks in zirconium alloys," Materials Characterization, vol. 141, pp. 348-361,
2018.
[32] N. Capps, R. Montgomery, D. Sunderland, M. Pytel and B. D. Wirth, "Evaluation
of missing pellet surface geometry on cladding stress distribution and magnitude,"
Nuclear Engineering and Design, vol. 305, pp. 51-63, 2016.
[33] E. Epremian, "Uranium Compounds for New High-Temperature Fuels," in Fuel
Elements Conference: Paris, November 18-23, 1957. Sessions IV, V, VI, Atomic
Energy Commission, 1957, p. 549.
[34] J. K. Fink, "Thermophysical properties of uranium dioxide," Journal of Nuclear
Materials, vol. 279, pp. 1-18, 2000.
[35] K. A. Terrani, D. Wang, L. J. Ott and R. O. Montgomery, "The effect of fuel
thermal conductivity on the behavior of LWR cores during loss-of-coolant
accidents," Journal of Nuclear Materials, vol. 448, pp. 512-519, 2014.
[36] G. Singh, J. Gorton, D. Schappel, N. R. Brown, Y. Katoh, B. D. Wirth and K. A.
Terrani, "Deformation analysis of SiC-SiC channel box for BWR applications,"
Journal of Nuclear Materials, vol. 513, pp. 71-85, 2019.
[37] L. H. Ortega, B. J. Blamer, J. A. Evans and S. M. McDeavitt, "Development of an
accident-tolerant fuel composite from uranium mononitride (UN) and uranium
sesquisilicide (U3Si2) with increased uranium loading," Journal of Nuclear
Materials, vol. 471, pp. 116-121, 2016.
[38] K. A. Terrani, T. M. Karlsen and Y. Yamamoto, "Input Correlations for Irradiation
Creep of FeCrAl and SiC Based on In-Pile Halden Test Results," Oak Ridge
National Laboratory, ORNL/TM-2016/191, 2016.
[39] N. M. George, K. Terrani, J. Powers, A. Worrall and I. Maldonado, "Neutronic
analysis of candidate accident-tolerant cladding concepts in pressurized water
reactors," Annals of Nuclear Energy, vol. 75, pp. 703-712, 2015.
[40] X. Wu, T. Kozlowski and J. D. Hales, "Neutronics and fuel performance
evaluations of accident tolerant FeCrAl cladding under normal operation
conditions," Annals of Nuclear Energy, vol. 85, pp. 763-775, 2015.

193
[41] B. A. Pint, K. A. Terrani, M. P. Brady, T. Cheng and J. R. Keiser, "High
temperature oxidation of fuel cladding candidate materials in steam-hydrogen
environments," Journal of Nuclear Materials, vol. 440, pp. 420-427, 2013.
[42] K. A. Unocic, Y. Yamamoto and B. A. Pint, "Effect of Al and Cr Content on Air
and Steam Oxidation of FeCrAl Alloys and Commercial APMT Alloy," Oxidation
of Metals, vol. 87, no. 3-4, pp. 431-441, 2017.
[43] K. G. Field, S. A. Briggs, K. Sridharan, R. H. Howard and Y. Yamamoto,
"Mechanical properties of neutron-irradiated model and commercial FeCrAl
alloys," Journal of Nuclear Materials, vol. 489, pp. 118-128, 2017.
[44] R. B. Rebak, "Iron-chrome-aluminum alloy cladding for increasing safety in
nuclear power plants," EPJ Nuclear Science Technology, vol. 3, no. 34, 2017.
[45] C. P. Massey, K. A. Terrani, S. N. Dryepondt and B. A. Pint, "Cladding burst
behavior of Fe-based alloys under LOCA," Journal of Nuclear Materials, vol.
470, pp. 128-138, 2016.
[46] N. R. Brown, A. J. Wysocki, K. A. Terrani, K. G. Xu and D. M. Wachs, "The
potential impact of accident tolerant cladding materials on reactivity initiated
accidents in light water reactors," Annals of Nuclear Energy, vol. 99, pp. 353-365,
2017.
[47] A. F. Ali, J. P. Gorton, N. R. Brown, K. A. Terrani, C. B. Jensen, Y. Lee and E. D.
Blandford, "Surface wettability and pool boiling Critical Heat Flux of Accident
Tolerant Fuel cladding-FeCrAl alloys," Nuclear Engineering and Design, vol.
338, pp. 218-231, 2018.
[48] K. Yueh and K. A. Terrani, "Silicon carbide composite for light water reactor fuel
assembly applications," Journal of Nuclear Materials, vol. 448, pp. 380-388,
2014.
[49] Y. Katoh, K. Ozawa, C. Shih, T. Nozawa, R. J. Shinavski, A. Hasegawa and L. L.
Snead, "Continuous SiC fiber, CVI SiC matrix composites for nuclear
applications: Properties and irradiation effects," Journal of Nuclear Materials, vol.
448, pp. 448-476, 2014.
[50] G. Singh, R. Sweet, N. R. Brown, B. D. Wirth, Y. Katoh and K. Terrani,
"Parametric Evaluation of SiC/SiC Composite Cladding with UO2 Fuel for LWR
Applications: Fuel Rod Interactions and Impact of Nonuniform Power Profile in
Fuel Rod," Journal of Nuclear Materials, vol. 499, pp. 155-167, 2018.
[51] C. H. Henager, Jr., Y. Shin, Y. Blum, L. A. Giannuzzi, B. W. Kempshall and S.
M. Schwarz, "Coatings and joining for SiC and SiC-composites for nuclear energy
systems," Journal of Nuclear Materials, Vols. 367-370, pp. 1139-1143, 2007.
[52] S. J. Zinkle and G. S. Was, "Materials challenges in nuclear energy," Acta
Materialia, vol. 61, pp. 735-758, 2013.
[53] P. Grimm, F. Jatuff, M. Murphy, R. Seiler, T. Williams, R. Jacot-Guillarmod and
R. Chawla, "Experimental Validation of Channel Bowing Effects on Pin Power
Distributions in a Westinghouse SVEA-96+ Assembly," Nuclear Science and
Technology, vol. 43, no. 3, pp. 223-230, 2006.

194
[54] D. G. Franklin and R. B. Adamson, "Implications of Zircaloy Creep and Growth
to Light Water Reactor Performance," Journal of Nuclear Materials, vol. 159, pp.
12-21, 1988.
[55] F. Garzarolli, R. Adamson, P. Rudling and A. Strasser, "BWR Fuel Channel
Distortion," Advanced Nuclear Technology International, Mölnlycke, Sweden,
2011.
[56] P. Cantonwine, D. Crawford, M. Downs, B. Joe, T. Bahensky, J. Reimer, C. del la
Hoz, K. Petersen, M. Reitmeyer, J. Morris and A. Zbib, "Channel Control-Blade
Interference Management at LaSalle 1 and 2 during 2007 and 2008," in Topical
Meeting on Advances in Nuclear Fuel Management III, Hilton Head Island, South
Carolina, 2003.
[57] P. Rodriguez and C. V. Sundaram, "Nuclear and materials aspects of the thorium
fuel cycle," Journal of Nuclear Materials, vol. 100, pp. 227-249, 1981.
[58] International Atomic Energy Agency, "Thorium fuel cycle - Potential benefits and
challenges," IAEA-TECDOC-1450, 2005.
[59] M. Lung and O. Gremm, "Perspectives of the thorium fuel cycle," Nuclear
Engineering and Design, vol. 180, pp. 133-146, 1998.
[60] M. Todosow, A. Galperin, S. Herring, M. Kazimi, T. Downar and A. Morozov,
"Use of Thorium in Light Water Reactors," Nuclear Technology, vol. 151, no. 2,
pp. 168-176, 2005.
[61] C. S. Pillai and P. Raj, "Thermal conductivity of ThO2 and Th0.98U0.02O2,"
Journal of Nuclear Materials, vol. 277, pp. 116-119, 200.
[62] K. Bakker, E. Cordfunke, R. Konings and R. Schram, "Critical evaluation of the
thermal properties of ThO2 and Th1-yUyO2 and a survey of the literature data on
Th1-yPuyO2," Journal of Nuclear Materials, vol. 250, pp. 1-12, 1997.
[63] S. S. Parker, J. T. White, P. Hosemann and A. T. Nelson, "Thermophysical
properties of thorium mononitride from 298-1700 K," Accepted to Journal of
Nuclear Materials, 2019.
[64] J. H. Yang, K. W. Kang, K. W. Song, C. B. Lee and Y. H. Jung, "Fabrication and
Thermal Conductivity of (Th,U)O2 Pellets," Nuclear Technology, vol. 147, no. 1,
pp. 113-119, 2004.
[65] T. R. G. Kutty, K. B. Khan, P. S. Somayajulu, A. K. Sengupta, J. P. Panakkal, A.
Kumar and H. S. Kamath, "Development of CAP process for fabrication of ThO2-
UO2 fuels Part I: Fabrication and densification behaviour," Journal of Nuclear
Materials, vol. 373, pp. 299-308, 2008.
[66] S. L. Hayes, J. K. Thomas and K. L. Peddicord, "Material property correlations for
uranium mononitride: III. Transport properties," Journal of Nuclear Materials,
vol. 171, no. 2-3, pp. 289-299, 1990.
[67] M. Uno, T. Nishi and M. Takano, "Thermodynamic and Thermophysical
Properties of the Actinide Nitrides," Comprehensive Nuclear Materials, pp. 61-85,
2012.

195
[68] R. Benz, C. G. Hoffman and G. N. Rupert, "Some Phase Equilibria in the
Thorium-Nitrogen System," Journal of the American Chemical Society, vol. 89,
no. 2, pp. 191-197, 1967.
[69] D. Manara, C. Ronchi, M. Sheindlin, M. Lewis and M. Brykin, "Melting of
stoichiometric and hyperstoichiometric uranium dioxide," Journal of Nuclear
Materials, vol. 342, pp. 148-163, 2005.
[70] L. van Brutzel, R. Dingreville and T. J. Bartel, "Nuclear fuel and deformation
phenomena," NEA/NSC/R(2015)5, 2015.
[71] H. Nickel, H. Nabielek, G. Pott and A. W. Mehner, "Long time experience with
the development of HTR fuel elements in Germany," Nuclear Engineering and
Design, vol. 217, pp. 141-151, 2002.
[72] L. Mathieu, D. Heuer, R. Brissot, C. Garzenne, C. Le Brun, D. Lecarpentier, E.
Liatard, J.-M. Loiseaux, O. Méplan, E. Merle-Lucotte, A. Nuttin, E. Walle and J.
Wilson, "The thorium molten salt reactor: Moving on from the MSBR," Progress
in Nuclear Energy, vol. 48, pp. 664-679, 2006.
[73] D. Heuer, E. Merle-Lucotte, M. Allibert, M. Brovchenko, V. Ghetta and P.
Rubiolo, "Towards the thorium fuel cycle with molten salt fast reactors," Annals of
Nuclear Energy, vol. 64, pp. 421-429, 2014.
[74] L. B. Freeman, B. R. Beaudoin, R. A. Frederickson, G. L. Hartfield, H. C. Hecker,
S. Milani, W. K. Sarber and W. C. Schick, "Physics experiments and lifetime
performance of the light water breeder reactor," Nuclear Science and Engineering,
vol. 102, no. 4, pp. 341-364, 1989.
[75] A. Radkowsky and A. Galperin, "The nonproliferative light water thorium reactor:
A new approach to light water core technology," Nuclear Technology, vol. 124,
no. 3, pp. 215-222, 1998.
[76] K. Balakrishnan, S. Majumdar, A. Ramanujam and A. Kakodkar, "The Indian
perspective on thorium fuel cycles," Thorium fuel utilization: Options and trends,
p. 257, 2002.
[77] R. K. Sinha and A. Kakodkar, "Design and development of the AHWR - the
Indian thorium fuelled innovative nuclear reactor," Nuclear Engineering and
Design, vol. 236, pp. 683-700, 2006.
[78] S. Şahin, H. M. Şahin, M. Alkan and K. Yildiz, "An assessment of thorium and
spent LWR-fuel utilization potential in CANDU reactors," Energy Conversion and
Management, vol. 45, pp. 1067-1085, 2004.
[79] B. P. Bromley, "High-utilization lattices for thorium-based fuels in heavy water
reactors," Nuclear Technology, vol. 186, no. 1, pp. 17-32, 2014.
[80] S. Permana, N. Takaki and H. Sekimoto, "Breeding Capability and Void
Reactivity Analysis of Heavy-Water-Cooled Thorium Reactor," Journal of
Nuclear Science and Technology, vol. 45, no. 7, pp. 589-600, 2008.
[81] N. R. Brown, J. J. Powers, B. Feng, F. Heidet, N. E. Stauff, G. Zhang, M.
Todosow, A. Worrall, J. C. Gehin, T. K. Kim and T. A. Taiwo, "Sustainable

196
thorium nuclear fuel cycles: A comparison of intermediate and fast neutron
spectrum systems," Nuclear Engineering and Design, vol. 289, pp. 252-265, 2015.
[82] N. S. Rasor and J. D. McClelland, "Thermal properties of graphite, molybdenum
and tantalum to their destruction temperatures," Journal of Physics and Chemistry
of Solids, vol. 15, pp. 17-26, 1960.
[83] J. Buckley, J. D. Turner and T. J. Abram, "Uranium dioxide - Molybdenum
composite fuel pellets with enhanced thermal conductivity manufactured via spark
plasma sintering," Journal of Nuclear Materials, vol. 523, pp. 360-368, 2019.
[84] B. V. Cockeram, R. W. Smith, N. Hashimoto and L. L. Snead, "The swelling,
microstructure, and hardening of wrought LCAC, TZM, and ODS molybdenum
following neutron irradiation," Journal of Nuclear Materials, vol. 418, pp. 121-
136, 2011.
[85] J. R. Lamarsh and A. J. Baratta, Introduction to Nuclear Engineering, Third
Edition, Upper Saddle River, New Jersey: Prentice-Hall, Inc., 2001.
[86] J. J. Duderstadt and L. J. Hamilton, Nuclear Reactor Analysis, Ann Arbor,
Michigan: John Wiley & Sons, Inc., 1976.
[87] J. Desquines, D. A. Koss, A. T. Motta, B. Cazalis and M. Petit, "The issue of
stress state during mechanical tests to asses cladding performance during a
reactivity-initiated accident (RIA)," Journal of Nuclear Materials, vol. 412, pp.
250-267, 2011.
[88] Japan Atomic Energy Agency, "Fuel Safety Research Group: Research on Fuel
Behavior during RIA," [Online]. Available:
https://www.jaea.go.jp/04/anzen/en/group/fsrg/index2.html. [Accessed 1
September 2020].
[89] M. Liu, N. R. Brown, K. A. Terrani, A. F. Ali, E. D. Blandford and D. M. Wachs,
"Potential impact of accident tolerant fuel cladding critical heat flux characteristics
on the high temperature phase of reactivity initiated accidents," Annals of Nuclear
Energy, vol. 110, pp. 48-62, 2017.
[90] N. E. Todreas and M. S. Kazimi, Nuclear Systems, Vol. 1: Thermal Hydraulic
Fundamentals, Boca Raton, FL: CRC Press, 2nd Edition, 2012.
[91] D. C. Groeneveld, J. Q. Shan, A. Z. Vasic, L. K. H. Leung, A. Durmayaz, J. Yang,
S. C. Cheng and A. Tanase, "The 2006 CHF look-up table," Nuclear Engineering
and Design, vol. 237, pp. 1909-1922, 2007.
[92] R. Hohl, M. Buchholz, T. Lüttich, H. Auracher and W. Marquardt, "Model-based
experimental analysis of pool boiling heat transfer with controlled wall
temperature transients," International Journal of Heat and Mass Transfer, vol. 44,
pp. 2225-2238, 2001.
[93] H. Auracher and W. Marquardt, "Heat transfer characteristics and mechanisms
along entire boiling curves under steady-state and transient conditions,"
International Journal of Heat and Fluid Flow, vol. 24, pp. 223-242, 2004.
197
[94] L. C. Witte and J. H. Lienhard, "On the existence of two 'transition' boiling
curves," International Journal of Heat and Mass Transfer, vol. 25, no. 6, pp. 771-
779, 1982.
[95] V. Bessiron, "Modelling of Clad-to-Coolant Heat Transfer for RIA Applications,"
Journal of Nuclear Science and Technology, vol. 44, no. 2, pp. 211-221, 2007.
[96] OECD NEA, "Nuclear Fuel Behavior Under Reactivity-initiated Accident (RIA)
Conditions, State-of-the-art Report," ISBN 978-92-64-99113-2,
NEA/CSNI/R(2010)1, Paris, France, 2010.
[97] F. Lemoine and M. Balourdet, "RIA related analytical studies and separate effects
tests," in International Topical Meeting on Light Water Reactor Fuel
Performance, Portland, OR, 1997.
[98] M. Le Saux, J. Besson, S. Carassou, C. Poussard and X. Averty, "A model to
describe the anisotropic viscoplastic mechanical behavior of fresh and irradiated
Zircaloy-4 fuel claddings under RIA loading conditions," Journal of Nuclear
Materials, vol. 378, pp. 60-69, 2008.
[99] W. R. Martin, "Challenges and prospects for whole-core Monte Carlo analysis,"
Nuclear Engineering and Technology, vol. 44, pp. 151-160, 2012.
[100] B. Collins, S. Stimpson, B. W. Kelley, M. T. H. Young, B. Kochunas, A. Graham,
E. W. Larsen, T. Downar and A. Godfrey, "Stability and accuracy of 3D neutron
transport simulations using the 2D/1D method in MPACT," Journal of
Computational Physics, vol. 326, pp. 612-628, 2016.
[101] B. T. Rearden, M. A. Jessee and Eds., "SCALE Code System," ORNL/TM-
2005/39, Version 6.2, Oak Ridge National Laboratory, Oak Ridge, Tennessee,
2016.
[102] T. J. Downar, D. A. Barber, R. M. Miller, C. H. Lee, T. Kozlowski, D. Lee, Y. Xu,
J. Gan, H. G. Joo, J. Y. Cho and K. Lee, "PARCS: Purdue advanced reactor core
simulator," 2002.
[103] B. J. Ade, "SCALE/TRITON Primer: A Primer for Light Water Reactor Lattice
Physics Calculations," NUREG/CR-7041, U.S. Nuclear Regulatory Commission,
2012.
[104] M. Bernard, C. Gingrich, C. L. Hoxie, A. Ireland, J. Kelly, J. Mahaffy, J. Murray,
C. Murray, J. Spore, J. Staudenmeier, M. Thurgood, K. Tien and J. Whitman,
"Development, Validation and Assessment of the TRACE Thermal-Hydraulics
Systems Code," in 16th International Meeting on Nuclear Reactor Thermal
Hydraulics (NURETH-16), Chicago, Illinois, 2015.
[105] B. Collins, L. Li, D. Wang, S. Stimpson, D. Jabaay, A. Ward, Y. Xu and T.
Downar, "PATHS: A Steady State Two-Phase Thermal-Hydraulics Solver for
PARCS Depletion," Toronto, Ontario, 2011.
[106] A. Wysocki, A. Ward, A. Manera, T. Downar, Y. Xu, J. March-Leuba, C.
Thurston, N. Hudson and A. Ireland, "The modeling of advanced BWR fuel
designs with the NRC fuel depletion codes PARCS/PATHS," Nuclear
Technology, vol. 190, no. 3, pp. 323-335, 2015.

198
[107] P. Yarsky, Y. Xu, A. Ward, N. Hudson and T. Downar, "BWR Control Rod Drift
Analysis Capability in the U.S. NRC Core Simulator PATHS/PARCS," Nuclear
Technology, vol. 197, no. 3, pp. 265-283, 2017.
[108] K. Ivanov and M. Avramova, "Challenges in coupled thermal-hydraulics and
neutronics simulations for LWR safety analysis," Annals of Nuclear Energy, vol.
34, pp. 501-513, 2007.
[109] A. G. Mylonakis, M. Varvayanni, N. Catsaros, P. Savva and D. G. Grigoriadis,
"Multi-physics and multi-scale methods used in reactor analysis," Annals of
Nuclear Energy, vol. 72, pp. 104-119, 2014.
[110] D. Gaston, C. Newman, G. Hansen and D. Lebrun-Grandié, "MOOSE: A parallel
computational framework for coupled systems of nonlinear equations," Nuclear
Engineering and Design, vol. 239, pp. 1768-1778, 2009.
[111] B. T. Rearden and R. A. Lefebvre, "Objectives of the NEAMS Workbench," Oak
Ridge National Laboratory, Oak Ridge, Tennessee, 2018.
[112] M. R. Tonks, D. Gaston, P. C. Millet, D. Andrs and P. Talbot, "An object-oriented
finite element framework for multiphysics phase field simulations,"
Computational Materials Science, vol. 51, pp. 20-29, 2012.
[113] D. R. Gaston, C. J. Permann, J. W. Peterson, A. E. Slaughter, D. Andrs, Y. Wang,
M. P. Short, D. M. Perez, M. R. Tonks, J. Ortensi, L. Zou and R. C. Martineau,
"Physics-based multiscale coupling for full core nuclear reactor simulation,"
Annals of Nuclear Energy, vol. 84, pp. 45-54, 2015.
[114] Y. Wang, S. Schunert, M. DeHart, R. Martineau and W. Zheng, "Hybrid PN - SN
with Lagrange multiplier and upwinding for the multiscale transport capability in
Rattlesnake," Progress in Nuclear Energy, vol. 101, pp. 381-393, 2017.
[115] R. A. Berry, L. Zou, H. Zhao, H. Zhang, J. W. Peterson, R. C. Martineau, S. Y.
Kadioglu, D. Andrs and J. E. Hansel, "RELAP-7 Theory Manual, Revision 3,"
INL/EXT-14-31366, Idaho National Laboratory , 2018.
[116] F. Gleicher, J. Ortensi, M. DeHart, Y. Wang, S. Schunert, S. Novascone, J. Hales,
R. Williamson, A. Slaughter, C. Permann, D. Andrs and R. Martineau, "The
Application of MAMMOTH for a Detailed Tightly Coupled Fuel Pin Simulation
with a Station Blackout," in Top Fuel 2016, Boise, Idaho, 2016.
[117] R. Schmidt, K. Belcourt, R. Hooper, R. Pawlowski, K. Clarno, S. Simunovic, S.
Slattery, J. Turner and S. Palmtag, "An approach for coupled-code multiphysics
core simulations from a common input," Annals of Nuclear Energy, vol. 84, pp.
140-152, 2015.
[118] J. A. Turner, K. Clarno, M. Sieger, R. Bartlett, B. Collins, R. Pawlowski, R.
Schmidt and R. Summers, "The Virtual Environment for Reactor Applications
(VERA): Design and architecture," Journal of Computational Physics, vol. 326,
pp. 544-568, 2016.
[119] B. W. Kelley and E. W. Larsen, "A consistent 2D/1D approximation to the 3D
neutron transport equation," Nuclear Engineering and Design, vol. 295, pp. 598-
614, 2015.

199
[120] K. S. Kim, M. L. Williams, D. Wiarda and K. T. Clarno, "Development of the
multigroup cross section library for the CASL neutronics simulator MPACT:
Method and procedure," Annals of Nuclear Energy, vol. 133, pp. 46-58, 2019.
[121] R. K. Salko and M. N. Avramova, "CTF Theory Manual," Consortium for
Advanced Simulation of LWRs, CASL-U-2016-1110-000, 2016.
[122] B. Kendrick, V. Petrov, D. Walter, A. Manera, B. Collins, T. Downar, J. Secker
and K. Belcourt, "CALS multiphysics modeling of crud deposition in PWRs," in
Proceedings of the 2013 LWR Fuel Performance Meeting/Top Fuel, Charlotte,
North Carolina, 2013.
[123] A. Godfrey, B. Collins, K. S. Kim, J. Powers, R. Salko, S. Stimpson, W.
Wieselquist, R. Montgomery, B. Kochunas, D. Jabaay, N. Capps and J. Secker,
"VERA Benchmarking Results for Watts Bar Nuclear Plant Unit 1 Cycles 1-12,"
Oak Ridge National Laboratory, CASL-U-2015-0206-000, 2015.
[124] B. Collins and A. Godfrey, "Analysis of the BEAVRS Benchmark Using VERA-
CS," Nashville, Tennessee, 2015.
[125] J. P. Gorton, B. S. Collins and N. R. Brown, "A Demonstration of BWR Coupled
Analysis and Potential ATF Applications Using CASL's MPACT/CTF,"
Minneapolis, MN, 2019a.
[126] Idaho National Laboratory, "RELAP5-3D Code Manuals, Volumes I, II, III, IV,
V, and Appendix A, Revision 4.3," Idaho National Laboratory, Idaho Falls, ID,
INEEL-EXT 98-00834, 2015.
[127] D. Maljovec, B. Wang, P. Rosen, A. Alfonsi, G. Pastore, C. Rabiti and V.
Pascucci, "Rethinking Sensitivity Analysis of Nuclear Simulations with
Topology," in IEEE Pacific Visualization Symposium, Taipei, Taiwan, 2016.
[128] H. S. Abdel-Khalik, Y. Bang and C. Wang, "Overview of hybrid subspace
methods for uncertainty quantification, sensitivity analysis," Annals of Nuclear
Energy, vol. 52, pp. 28-46, 2013.
[129] Z. Chen, J. Cai, R. Liu and Y. Wang, "Preliminary thermal hydraulic analysis of
various accident tolerant fuels and claddings for control rod ejection accidents in
LWRs," Nuclear Engineering and Design, vol. 331, pp. 282-294, 2018.
[130] C. Rabiti, A. Alfonsi, J. Cogliati, D. Mandelli, R. Kinoshita, S. Sen and C. Wang,
"RAVEN User Manual," Idaho National Laboratory, Idaho Falls, ID, 2016.
[131] J. W. McMurray, R. Hu, S. V. Ushakov, D. Shin, B. A. Pint, K. A. Terrani and A.
Navrotsky, "Solid-liquid phase equilibria of Fe-Cr-Al alloys and spinels," Journal
of Nuclear Materials, vol. 492, pp. 128-133, 2017.
[132] Nuclear Energy Agency, "RIA Fuel Codes Benchmark Volume 1,"
NEA/CSNI/R(2013)7, 2013.
[133] J. C. Chen, R. K. Sundaram and F. T. Ozkaynak, "A Phenomenological
Correlation for Post-CHF Heat Transfer," Lehigh University Department of
Mechanical Engineering and Mechanics, Bethlehem, PA, NUREG-0237, 1977.

200
[134] G. Pastore, L. P. Swiler, J. D. Hales, S. R. Novascone, D. M. Perez, B. W.
Spencer, L. Luzzi, P. Van Uffelen and R. L. Williamson, "Uncertainty and
sensitivity analysis of fission gas behavior in engineering-scale fuel modeling,"
Journal of Nuclear Materials, vol. 456, pp. 398-408, 2015.
[135] Kanthal, "Material Datasheets," Sandvik Group, [Online]. Available:
https://www.kanthal.com/en/products/material-
datasheets/?query=fecral&sort=&page=1. [Accessed 25 October 2018].
[136] P. J. Turinsky and D. B. Kothe, "Modeling and simulation challenges pursued by
the Consortium for Advanced Simulation of Light Water Reactors (CASL),"
Journal of Computational Physics, vol. 313, pp. 367-376, 2016.
[137] M. N. Avramova and K. N. Ivanov, "Verification, validation and uncertainty
quantification in multi-physics modeling for nuclear reactor design and safety
analysis," Progress in Nuclear Energy, vol. 52, pp. 601-614, 2010.
[138] A. Godfrey, B. Collins, K. S. Kim, J. Powers, R. Salko, S. Stimpson, W.
Wieselquist, K. Clarno and J. Gehin, "VERA benchmarking results for Watts Bar
Nuclear Plant Unit 1 Cycles 1-12," Sun Valley, ID, 2016.
[139] B. Kochunas, D. Jabaay, A. Fitzgerald, T. J. Downar and S. Palmtag, "Initial BWR
Modeling Capacility for MPACT," in M&C 2017, Jeju, Korea, 2017.
[140] S. M. Bowman, "SCALE 6: Comprehensive Nuclear Safety Analysis Code
System," Nuclear Technology, vol. 174, no. 2, pp. 126-148, 2011.
[141] N. W. Porter and M. N. Avramova, "Validation of CTF pressure drop and void
predictions for the NUPEC BWR database," Nuclear Engineering and Design,
vol. 337, pp. 291-299, 2018.
[142] M. Avramova, K. Ivanov, B. Krzykacz-Hausmann, K. Velkov, A. Pautz and Y.
Perin, "Uncertainty analysis of COBRA-TF void distribution predictions for the
OECD/NRC BFBT Benchmark," Saratoga Springs, NY, 2009.
[143] J. P. Gorton, B. S. Collins and N. R. Brown, "Effect of crossflow modeling on
vapor void fraction and criticality in a BWR fuel assembly using MPACT/CTF,"
Seattle, WA, 2019b.
[144] A. L. Costa, C. Pereira, W. Ambrosini and F. D'Auria, "Simulation of an
hypothetical out-of-phase instability case in boiling water reactor by
RELAP5/PARCS coupled codes," Annals of Nuclear Energy, vol. 35, pp. 947-
957, 2008.
[145] Y. Xu, T. Downar, R. Walls, K. Ivanov, J. Staudenmeier and J. March-Lueba,
"Application of TRACE/PARCS to BWR stability analysis," Annals of Nuclear
Energy, vol. 36, pp. 317-323, 2009.
[146] Studsvik Scandpower, "SIMULATE-3 Advanced Three-Dimensional Two-Group
Reactor Analysis Code," SSP-95/15 Rev. 3, 2005.
[147] E. Fridman and J. Leppänen, "On the use of the Serpent Monte Carlo code for
few-group cross section generation," Annals of Nuclear Energy, vol. 38, pp. 1399-
1405, 2011.
201
[148] M. Hursin, L. Rossinelli, H. Ferroukhi and A. Pautz, "BWR full core analysis with
Seprent/SIMULATE-3 hybrid stochastic/deterministic code sequence," Nashville,
TN, 2015.
[149] A. Bennett and N. Martin, "Validation of APOLLO2-A Against Serpent 2 on
BWR Lattices," Portland, OR, 2019.
[150] S. W. Churchill, "Friction-factor equation spans all fluid-flow regimes," Chemical
Engineering, vol. 84, no. 24, pp. 91-92, 1977.
[151] G. Lellouche and B. Zolotar, "Mechanistic Model for Predicting the Two-Phase
Void Fraction in Vertical Tubes, Channels, and Rod Bundles," EPRI NP-2246-SR,
Electric Power Research Institute, 1982.
[152] J. C. Chen, "Correlation for boiling heat transfer to saturated fluids in convective
flow," Industrial & Engineering Chemistry Process Design and Development, vol.
5, no. 3, pp. 322-329, 1966.
[153] P. Ferroni, "Steady State Thermal Hydraulic Analysis of Hydride Fueled BWRs,"
Master's Thesis, Massachusetts Institute of Technology, Cambridge, MA, 2006.
[154] I. C. Gauld, "Scale-4 Analysis of LaSalle Unit 1 BWR Commercial Reactor
Critical Configurations," ORNL/TM-1999/247, Oak Ridge National Laboratory,
2000.
[155] M. L. Fensin, "Optimum Boiling Water Reactor Fuel Design Strategies to
Enhance Reactor Shutdown by the Standby Liquid Control System," Master's
Thesis, University of Florida, 2004.
[156] M. B. Chadwick, M. Herman, P. Oblozinsky, M. E. Dunn, Y. Danon, A. C.
Kahler, D. L. Smith, B. Pritychenko, G. Arbanas, R. Arcilla, R. Brewer, D. A.
Brown, R. Capote, A. D. Carlson, Y. S. Cho, H. Derrien, K. Guber, G. M. Hale
and S. Hoblit, "ENDF/B-VII.1 Nuclear Data for Science and Technology: Cross
Sections, covariances, Fission Product Yields and Decay Data," Nuclear Data
Sheets, vol. 112, pp. 2887-2996, 2011.
[157] M. B. Chadwick, P. Oblozinsky, M. Herman, N. M. Greene, R. D. McKnight, D.
L. Smith, P. G. Young, R. E. MacFarlane, G. M. Hale, S. C. Frankle, A. C. Kahler,
T. Kawano, R. C. Little, D. G. Madland, P. Moller, R. D. Mosteller, P. R. Page
and T, "ENDF/B-VII.0: Next Generation Evaluated Nuclear Data Library for
Nuclear Science and Technology," Nuclear Data Sheets, vol. 107, pp. 2931-3060,
2006.
[158] D. Wang, B. J. Ade and A. Ward, "Cross Section Generation Guidelines for
TRACE-PARCS," No. ORNL/TM-2012/518, Oak Ridge National Laboratory,
2013.
[159] K. Tada, A. Yamamoto, Y. Yamane and Y. Kitamuray, "Applicability of the
Diffusion and Simplified P3 Theories for Pin-by-Pin Geometry of BWR," Journal
of Nuclear Science and Technology, vol. 45, no. 10, pp. 997-1008, 2008.
[160] T. Fujita, T. Endo and A. Yamamoto, "Application of correction technique using
leakage index combined with SPH or discontinuity factors for energy collapsing

202
on pin-by-pin BWR core analysis," Journal of Nuclear Science and Technology,
vol. 52, no. 3, pp. 355-370, 2015.
[161] X. Zhao, A. J. Wysocki, K. Shirvan and R. K. Salko, "Assessment of the
Subchannel code CTF for Single- and Two-Phase Flows," Nuclear Technology,
vol. 205, no. 1-2, pp. 338-351, 2019.
[162] A. T. Nelson, A. Migdisov, E. S. Wood and C. J. Grote, "U3Si2 behavior in H2O
environments: Part II, pressurized water with controlled redox chemistry," Journal
of Nuclear Materials, vol. 500, pp. 81-91, 2018.
[163] N. R. Brown, A. Aronson, M. Todosow, R. Brito and K. J. McClellan, "Neutronics
performance of uranium nitride composite fuels in a PWR," Nuclear Engineering
and Design , vol. 275, pp. 393-407, 2014.
[164] B. J. Jaques, J. Watkins, J. R. Croteau, G. A. Alanko, B. Tyburska-Püschel, M.
Meyer, P. Xu, E. J. Lahoda and D. P. Butt, "Synthesis and sintering of UN-UO2
fuel composites," Journal of Nuclear Materials, vol. 466, pp. 745-754, 2015.
[165] J. H. Yang, D.-J. Kim, K. S. Kim and Y.-H. Koo, "UO2-UN composites with
enhanced uranium density and thermal conductivity," Journal of Nuclear
Materials, vol. 465, pp. 509-515, 2015.
[166] J. T. White, A. W. Travis, J. T. Dunwoody and A. T. Nelson, "Fabrication and
thermophysical property characterization of UN/U3Si2 composite fuel forms,"
Journal of Nuclear Materials, vol. 495, pp. 463-474, 2017.
[167] E. S. Wood, J. T. White, C. J. Grote and A. T. Nelson, "U3Si2 behavior in H2O:
Part I, flowing steam and the effect of hydrogen," Journal of Nuclear Materials,
vol. 501, pp. 404-412, 2018.
[168] Westinghouse Electric Company, "AP1000 Design Control Document Rev. 19,"
2011.
[169] M. J. Driscoll, T. J. Downar and E. E. Pilat, The Linear Reactivity Model for
Nuclear Fuel Management, La Grange Park, Illinois: American Nuclear Society,
1990.
[170] Z. Xu, M. J. Driscoll and M. S. Kazimi, "Neutron Spectrum Effects on Burnup,
Reactivity, and Isotopics in UO2/H2O Lattices," Nuclear Science and
Engineering, vol. 141, pp. 175-189, 2002.
[171] J. Zakova and J. Wallenius, "Fuel residence time in BWRs with nitride fuels,"
Annals of Nuclear Energy, vol. 47, pp. 182-191, 2012.
[172] E. Fridman and S. Kliem, "Pu recycling in a full Th-MOX PWR core. Part I:
Steady state analysis," Nuclear Engineering and Design, vol. 241, pp. 193-202,
2011.
[173] R. Mariani, A. Nelson, R. Blomquist, D. Keiser, G. Hofman, G. Youinou and G.
Griffith, "Initial Evaluation of Fuel-Reactor Concepts for Advanced LEU Fuel
Development," Idaho National Laboratory, INL/EXT-20-54641, 2020.

203
[174] J. R. Burns, R. Hernandez, K. A. Terrani, A. T. Nelson and N. R. Brown, "Reactor
and fuel performance of light water reactor fuel with 235U enrichments above
5%," Annals of Nuclear Energy, vol. 142, p. 107423, 2020.
[175] K. A. Terrani and A. T. Nelson, "3D Printing of Additive Structures for Nuclear
Fuels". United States of America Patent 138974.186629-US, 2019.
[176] Q. Liu and T. Homma, "A new importance measure for sensitivity analysis,"
Journal of Nuclear Science and Technology, vol. 47, no. 1, pp. 53-61, 2010.
[177] M. D. Mckay, R. J. Beckman and W. J. Conover, "A comparison of three methods
for selecting values of input variables in the analysis of output from a computer
code," Technometrics, vol. 21, no. 2, pp. 239-245, 1979.
[178] I. M. Sobol, "Sensitivity estimates for nonlinear mathematical models,"
Mathematical Modeling and Computational Experiments, vol. 1, no. 4, pp. 407-
414, 1993.
[179] C. Gaëlle, F. Gamboa and C. Prieur, "Generalized Hoeffding-Sobol decomposition
for dependent variables - application to sensitivity analysis," Electronic Journal of
Statistics, vol. 6, pp. 2420-2448, 2012.
[180] A. Saltelli and S. Tarantola, "On the relative importance of input factors in
mathematical models: Safety assessment for nuclear waste disposal," Journal of
the American Statistical Association, vol. 97, no. 459, pp. 702-709, 2002.
[181] F. Sarrazin, F. Pianosi and T. Wagener, "Global Sensitivity Analysis of
environmental models: Convergence and validation," Environmental Modelling &
Software, vol. 79, pp. 135-152, 2016.
[182] R. J. Larsen and M. L. Marx, An Introduction to Mathematical Statistics and its
Applications, 6th ed., Upper Saddle River, New Jersey: Prentice-Hall, 2017.
[183] J. J. Carbajo, G. L. Yoder, S. G. Popov and V. K. Ivanov, "A review of the
thermophysical properties of MOX and UO2 fuels," Journal of Nuclear Materials,
vol. 299, pp. 181-198, 2001.
[184] P. Hejzlar and M. S. Kazimi, "Annular fuel for high-power-density pressurized
water reactors: Motivation and overview," Nuclear Technology, vol. 160, no. 1,
pp. 2-15, 2007.
[185] A. T. Nelson, "Features that further the Performance Limits of Nuclear Fuel
Fabrication: Opportunities for Additive Manufacturing of Nuclear Fuels," Oak
Ridge National Laboratory, ORNL/SPR-2019/1183, 2019.

204
VITA
Jacob P. Gorton was born in Warren, Pennsylvania in 1995. He graduated Summa Cum
Laude from Gannon University in Erie, PA in 2017, where he received his Bachelor of
Science degree in Mechanical Engineering. He then went on to earn his Master of
Science degree in Nuclear Engineering from the Pennsylvania State University in
December of 2018. While earning his master’s degree, Jacob was inducted into and
elected president of the local Alpha Nu Sigma Nuclear Engineering Honor Society and
held a summer internship at Oak Ridge National Laboratory in Oak Ridge, Tennessee.
Jacob began attending the University of Tennessee, Knoxville in January, 2019, where he
has received the UTK Top 100 Graduate Student Fellowship and an Innovations in
Nuclear Technology R&D award for his work on ThN-UN fuels. He has accepted a staff
scientist position at Oak Ridge National Laboratory, which he intends to begin after
earning his PhD in Nuclear Engineering in December, 2020.
Copyright © 2022 FDOKUMEN