Investigation of potential water quality and quantity impacts ...
12
Available on website http://www.wrc.org.za ISSN 0378-4738 (Print) = Water SA Vol. 36 No. 5 October 2010 ISSN 1816-7950 (On-line) = Water SA Vol. 36 No. 5 October 2010 531 * To whom all correspondence should be addressed. +2751-4012482; fax: +2751 4446538; e-mail: [email protected] Received 8 April 2010; accepted in revised form 3 September 2010. Investigation of potential water quality and quantity impacts associated with mining of the shallow Waterberg coal reserves, west of the Daarby Fault, Limpopo Province, South Africa M Bester and PD Vermeulen* Institute for Groundwater Studies, University of the Free State, PO Box 339 Bloemfontein 9300, South Africa Abstract From South African and international experience, it is known that coal mining has a pronounced impact on surface and groundwater quality and quantity. The influx of water may be as low as 1% of rainfall for underground mines to as much as 20% for opencast mines. Such differences may influence the quantity and quality of surface water and groundwa- ter resources at the local scale and further afield. The Waterberg coal reserves represent the only area with proven coal reserves which are still available for development in South Africa. These reserves are targeted for large-scale mining in the near future, and are situated in a relatively dry part of South Africa. In view of the low rainfall and limited surface water resources, the necessary level of safeguard measures to ensure the quantity and quality of existing water resources is unclear. Experience from other areas cannot necessarily be extrapolated directly. A scoping level study was performed to consolidate the existing information on the geohydrology and pre-mining water quantity and quality of water resources associated with the Waterberg coal reserves. New data regarding water quality and acid-base potential for the different geo- logical areas (through field investigations) and geology and mining methods were obtained. Findings showed a significant likely impact on groundwater resources, with a potential for generation of acid mine drainage, although low transmissivities will in all probability prevent decant after back-filling is complete. Keywords: Waterberg Coalfield, water quality, water quantity, recharge, acid-base accounting, geohydrological modelling Introduction Local South African and international experience in the field of coal mining has yielded the generally known fact that coal mining has a pronounced impact on surface water and ground- water quality and quantity. The influx of water into the mines may be as low as 1% of rainfall for deep board and pillar mines with no subsidence, to as much as 20% for some opencast mines (Hodgson et al., 2007). Such differences may influence the quantity and quality of surface water and groundwater resources at the local scale and further afield. The Waterberg coal reserves represent the only large area with proven coal resources remaining for development in South Africa. These resources have been targeted for large-scale mining in the near future. The Waterberg coal resources are situated in a relatively dry part of South Africa. In view of the low rainfall and lim- ited surface-water resources, the necessary level of safeguard measures to ensure the quantity and quality of existing water resources is still unclear. Experience gained from other South African mining areas cannot be extrapolated directly as the area is unique in terms of the climatic setting and prevailing local conditions. Objectives of the study The study aimed to investigate: • The different aquifers in the study area and their geohydro- logical parameters • Pre-mining water quantity and quality of water resources associated with the Waterberg Coalfield • The acid-generating potential of the geology found in the study area and buffering capacity of country rock. This information will assist in: • Detecting potential problem lithologies with regards to higher acid generation potential • Predicting the impact of additional mines in the area • Determining whether the future mines would ever reach decant level using geohydrological modelling methods • Providing recommendations on future studies. Study area The study area is located in the Limpopo Province of South Africa, and forms part of the Waterberg Coalfield. The Limpopo province is South Africa’s northernmost province (see Fig. 1). The study area covers an area of more than 2 300 km 2 . With regards to infrastructure there is presently 1 operational colliery and 1 operational power station located in the study area, with a second power station currently under construction. The area has a low rainfall with a dry climate, receiving only summer rainfall. The average annual rainfall for the area varies between 285 mm and 560 mm (SA Weather Service, 2008). The area is drained by 2 rivers, namely the Mokolo,
-
Upload
khangminh22 -
Category
Documents
-
view
1 -
download
0
Transcript of Investigation of potential water quality and quantity impacts ...
Available on website http://www.wrc.org.zaISSN 0378-4738 (Print) = Water SA Vol. 36 No. 5 October 2010ISSN 1816-7950 (On-line) = Water SA Vol. 36 No. 5 October 2010 531
* To whom all correspondence should be addressed. +2751-4012482; fax: +2751 4446538; e-mail: [email protected] Received 8 April 2010; accepted in revised form 3 September 2010.
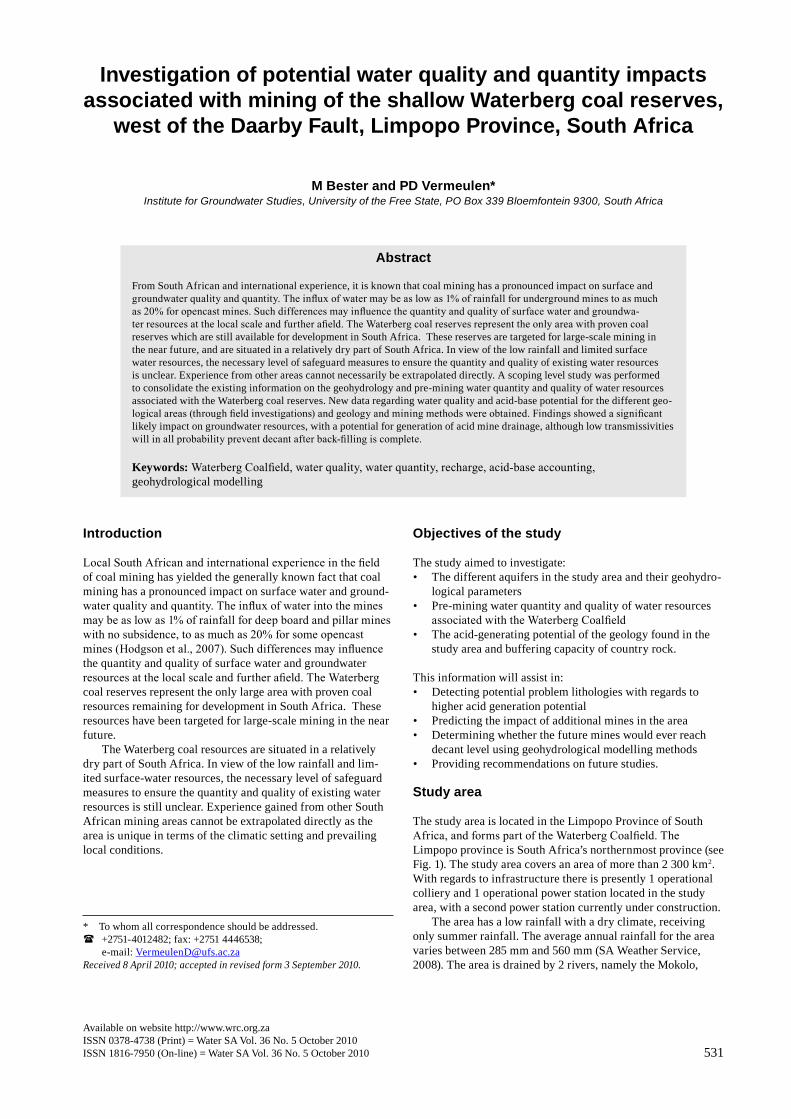
Investigation of potential water quality and quantity impacts associated with mining of the shallow Waterberg coal reserves,
west of the Daarby Fault, Limpopo Province, South Africa
M Bester and PD Vermeulen*Institute for Groundwater Studies, University of the Free State, PO Box 339 Bloemfontein 9300, South Africa
Abstract
From South African and international experience, it is known that coal mining has a pronounced impact on surface and groundwater quality and quantity. The influx of water may be as low as 1% of rainfall for underground mines to as much as 20% for opencast mines. Such differences may influence the quantity and quality of surface water and groundwa-ter resources at the local scale and further afield. The Waterberg coal reserves represent the only area with proven coal reserves which are still available for development in South Africa. These reserves are targeted for large-scale mining in the near future, and are situated in a relatively dry part of South Africa. In view of the low rainfall and limited surface water resources, the necessary level of safeguard measures to ensure the quantity and quality of existing water resources is unclear. Experience from other areas cannot necessarily be extrapolated directly. A scoping level study was performed to consolidate the existing information on the geohydrology and pre-mining water quantity and quality of water resources associated with the Waterberg coal reserves. New data regarding water quality and acid-base potential for the different geo-logical areas (through field investigations) and geology and mining methods were obtained. Findings showed a significant likely impact on groundwater resources, with a potential for generation of acid mine drainage, although low transmissivities will in all probability prevent decant after back-filling is complete.
Keywords: Waterberg Coalfield, water quality, water quantity, recharge, acid-base accounting, geohydrological modelling
Introduction
Local South African and international experience in the field of coal mining has yielded the generally known fact that coal mining has a pronounced impact on surface water and ground-water quality and quantity. The influx of water into the mines may be as low as 1% of rainfall for deep board and pillar mines with no subsidence, to as much as 20% for some opencast mines (Hodgson et al., 2007). Such differences may influence the quantity and quality of surface water and groundwater resources at the local scale and further afield. The Waterberg coal reserves represent the only large area with proven coal resources remaining for development in South Africa. These resources have been targeted for large-scale mining in the near future.
The Waterberg coal resources are situated in a relatively dry part of South Africa. In view of the low rainfall and lim-ited surface-water resources, the necessary level of safeguard measures to ensure the quantity and quality of existing water resources is still unclear. Experience gained from other South African mining areas cannot be extrapolated directly as the area is unique in terms of the climatic setting and prevailing local conditions.
Objectives of the study
The study aimed to investigate: • The different aquifers in the study area and their geohydro-
logical parameters• Pre-mining water quantity and quality of water resources
associated with the Waterberg Coalfield • The acid-generating potential of the geology found in the
study area and buffering capacity of country rock.
This information will assist in:• Detecting potential problem lithologies with regards to
higher acid generation potential• Predicting the impact of additional mines in the area• Determining whether the future mines would ever reach
decant level using geohydrological modelling methods• Providing recommendations on future studies.
Study area
The study area is located in the Limpopo Province of South Africa, and forms part of the Waterberg Coalfield. The Limpopo province is South Africa’s northernmost province (see Fig. 1). The study area covers an area of more than 2 300 km2. With regards to infrastructure there is presently 1 operational colliery and 1 operational power station located in the study area, with a second power station currently under construction.
The area has a low rainfall with a dry climate, receiving only summer rainfall. The average annual rainfall for the area varies between 285 mm and 560 mm (SA Weather Service, 2008). The area is drained by 2 rivers, namely the Mokolo,

Available on website http://www.wrc.org.zaISSN 0378-4738 (Print) = Water SA Vol. 36 No. 5 October 2010
ISSN 1816-7950 (On-line) = Water SA Vol. 36 No. 5 October 2010532
running north-south, and the Limpopo, running roughly south/west - north. Both rivers can be classified as non-perennial. The Limpopo River is an international water course which drains Botswana, South Africa, Zimbabwe and Mozambique. In terms of the National Water Act, 1998 (Act No. 36 of 1998: RSA, 1998), any authorisations for water use activities including disposal of waste associated with mining and power generation will be conditional upon preventing pollution of the river, in order to meet international obligations and conditions of any international agreements. It is necessary to ensure that future planned mining activities are located and configured to mini-mise pollution with particular consideration of international rivers and their requirements.
Geology and mining
Coal was discovered on the farm Grootegeluk while drilling for water in 1920. Iscor (Pty.) Ltd. began the development of the Grootegeluk Colliery in the 1970s, with the mine producing its first 200 kt of low-ash coking coal in 1980 (Snyman, 1998).
The Waterberg Coalfield trends east–west, and is heavily faulted (see Fig. 2). It is composed of sediments of the Karoo Sequence and forms a graben structure. The Eenzaamheid fault forms the southern boundary, with rocks belonging to the Waterberg Group occurring south of this fault, while the northern boundary is delineated by the Zoetfontein fault with Archaean granites outcropping north of this fault. The Karoo sequence in the area has been faulted by 2 major faults with displacements greater than 250 m, namely the Daarby Fault in the north and the Eenzaamheid Fault in the south. Associated minor faulting within this graben is also apparent and recog-nizable lineaments have been interpreted over the regional area as well.
The Daarby fault subdivides the coalfield into a shallow, opencast-mineable western part and a deeper north-eastern
part, across a displacement of some 400 m, trending NE/SW for a distance of approximately 25 km. The Zoetfontein fault was tectonically active before and during Karoo deposition, while the Eenzaamheid and Daarby faults – as most of the other faulting in the Waterberg Coalfield – are younger than the Karoo sequence. The original sedimentary basin in which the coal was formed extended further south than the present south-ern boundary (Eenzaamheid fault). Sedimentation occurred in a shallow east-west trough and the general direction of trans-port was ENE-WSW. Karoo sediments were deposited on the Waterberg Group in the southern portion of the coalfield, while in the north, north of the Zoetfontein fault, they were depos-ited on Achaean rocks. The paleo-floor in the eastern portion consists of granite and basic rocks of the Bushveld Igneous Complex.
The Daarby fault is a major north-east, then north-west, trending fault, assumed to be part of 1 set of events because both ‘legs’ of the fault exhibit the same throw and throw direc-tion. Both faults have consequently been combined under 1 name. The Daarby fault has a down throw of 360 m to the north and the fault dips at an angle of between 50 and 60 degrees to the north, bringing up-thrown Beaufort and Ecca Groups to the south into contact with the down-thrown Letaba, Clarens, Elliott and Molteno formations on the north. The Eenzaamheid fault, situated south of the Daarby fault, has a throw of 250 m to the north bringing the up-thrown Waterberg Group on the southern side of the fault into contact with the down-thrown Beaufort and Ecca groups on the northern side of the fault. The dip angle of the Eenzaamheid fault is near vertical.
All the units of the Karoo Sequence are present in the coalfield, and the subdivision of the Karoo Sequence is mainly based on lithological boundaries, consisting, from top to bot-tom, of the Stormberg Group (Letaba Formation), followed by the Beaufort Group, the Ecca Group and the Dwyka Group (Snyman, 1998).
Figure 1Location of the study area (outlined in green)

Available on website http://www.wrc.org.zaISSN 0378-4738 (Print) = Water SA Vol. 36 No. 5 October 2010ISSN 1816-7950 (On-line) = Water SA Vol. 36 No. 5 October 2010 533
Figure 2Simplified geological map of the Lephalale coalfield
Within the Waterberg Coalfield, coal occurs in both the Vryheid and Grootegeluk formation, (which are equivalent to the Volksrust formation) of the Karoo Supergroup. The coal-bearing interval is 115 m thick, and is subdivided into 11 zones. The lower 4 of these form part of the Vryheid for-mation (Snyman, 1998). These zones also coincide with the 4 lower zones of predominantly dull coal, which have aver-age thicknesses of 1.5 m to 5.5 m. Zones 5 to 11 occur in the Grootegeluk formation, which consist of rapidly alternating
mudstone and thin coal seams. This coal mainly consists of bright coal (Snyman, 1998).
According to Dreyer (2008; 2009), the deepest level to which most mining (west of Grootegeluk) in the area can be economically opencasted in is Coal Zone 4. Surface mining below this layer is considered uneconomical. It is possible to use subsurface methods for future coal mining but this is at present not being considered. The barrier between the open-cast- and subsurface-mineable coal is a thick succession of Ecca sandstone.
Acid-base accounting (ABA)
For assessment of acid mine drainage potential, the study area was divided into 3 main categories, according to the weather-ing of the geological strata (Fig. 3). These are:• Areas that contain the full succession of geology• Areas that have been weathered down to the middle Ecca• Areas that have been weathered down to the lower Ecca
These subdivisions were used to identify sample localities for acid-base analysis testing.
Geological samples were collected for ABA testing from various locations in the study area. The aim of the testing was to determine any predisposition for acid generation in the geological layers, and whether there is sufficient neu-tralising potential in the rocks to counteract the acidity. The ABA samples consisted of various core and chip samples. Additionally the samples included 2 processing plant discard samples (one from each plant) obtained from the 2 plants at the Grootegeluk Mine. (The blue triangles in Fig. 3 indicate the position where samples were taken). The peroxide static test method was used to analyse the samples. These tests are intended to predict the potential to produce acid, and not the generation rate of acid. Static tests can be conducted quickly
Figure 3
Location of the sample localities (blue triangles) with regards to weathering

Available on website http://www.wrc.org.zaISSN 0378-4738 (Print) = Water SA Vol. 36 No. 5 October 2010
ISSN 1816-7950 (On-line) = Water SA Vol. 36 No. 5 October 2010534
Table 1XRD results for the north-western samples (those in red have high acid-generating potential)
Sample Quartz Ferroan Clinochlore
Calcite Siderite Ankerite Goethite/Hematite
Illite Pyrite
SS1 XX x SS2 XX x SS3 XX xx xx xx SS4 XX X x xx SS5 XX xx xx x x xx SS6 XX xx xx x xx SS7 XX xx xx xx X x xSS8 XX xx xx x x x SS9 XX X xx SS10 X xx XX xx xx SS11 XX X xx x xx x xSS12 X X X x SS14 X XX xx X xx xx SS15 X XX xx X x xx x xSS17 X XX x xx
SS18a XX xx X xx xx x SS18b XX xx x SS19 XX X x
where: XX Dominant (>40% per volume) X Major (10-40% per volume)xx Minor (2-10% per volume) x Accessory (1-2% per volume)
NPR vs Sulphide -S
0.00001
0.0001
0.001
0.01
0.1
1
10
100
10000.0001 0.001 0.01 0.1 1 10
% Sulphide-S
NPR
NPR=4Samples0.3% SNPR=1
Very Low Probability of
Very High Probability of
Figure 4Percentage S vs. NPR for the north/western
core
and are inexpensive compared to kinetic tests. Acid-base accounting is a screening procedure whereby the acid-neu-tralising potential and acid-generating potential of rock sam-ples are determined and the difference (NNP) is calculated. The NNP and/or the ratio of neutralising potential to acid-generation potential are compared with a predetermined value, or set of values, to divide samples into categories that either do or do not require further determinative acid poten-tial test work.
Samples were collected from the north/western parts of the study area, as well as from the south/eastern parts, as these areas are most likely to be mined. The results were as follows:
Full coal-bearing succession
Core samples were collected from only one available borehole located in the north-western sampling location. The core was divided according to the lithology into 20 samples over a depth of 200 m.
The percentage sulphur in the samples plotted against the NPR (Fig. 4) indicates a high risk of acid production, with some of the samples plotting in the red area. Other samples plot in the neutral-ising capacity region (green), indicating a mixture of acid produc-ers, as well as some with neutralising capabilities. Those samples with values close to zero indicate no neutralising potential, while those with values greater than 4 indicate no acid potential.

Available on website http://www.wrc.org.zaISSN 0378-4738 (Print) = Water SA Vol. 36 No. 5 October 2010ISSN 1816-7950 (On-line) = Water SA Vol. 36 No. 5 October 2010 535
Table 2Interpretation of ABA pH results (figures in red indicate high
acid-generating potential)Site name Depth (m) Initial pH Final pH Interpretation
SS 1 5 6.88 3.74 Medium risk acid generationSS 2 17 7.78 4.05 Medium risk acid generationSS 3 25 7.68 6.70 Lower acid riskSS 4 43 7.03 4.19 Medium risk acid generationSS 5 54 8.18 5.87 Lower acid riskSS 6 66 8.00 5.13 Medium risk acid generationSS 7 68 6.78 1.99 Higher risk acid generationSS 8 72 7.68 2.83 Higher risk acid generationSS 9 75 6.84 2.32 Higher risk acid generationSS 10 77 8.38 4.09 Medium risk acid generationSS 11 83 7.39 1.58 Higher risk acid generationSS 12 94 7.85 3.13 Higher risk acid generationSS13 96 7.57 3.43 Higher risk acid generationSS 14 104 7.91 4.09 Medium risk acid generationSS 15 118 7.86 2.07 Higher risk acid generationSS16 173 5.58 1.97 Higher risk acid generationSS 17 187 7.18 2.26 Higher risk acid generation
SS 18A 188 7.10 2.10 Higher risk acid generationSS 18B 188 7.43 2.81 Higher risk acid generationSS 19 190 6.84 3.06 Higher risk acid generation
The XRD analyses (Table 1) indicate the dominant min-eral as quartz and Ferroan Chlinochlore. (These samples from the core were taken in depth from the top to the bottom). The samples containing 2-10% calcite vary in terms of base poten-tial. The 3 samples (SS7, 11 and 15, marked in red) with 1-2 % pyrite have a high acid-generating potential
The samples contain sufficient pyrite to generate acid, with the final pH values of these samples turning acidic upon com-plete oxidation, while others indicate a lower risk. The static tests on these core samples indicate that acid mine drainage will be produced upon oxidation in some of the samples; the data also indicates that there is sufficient calcite present to serve as a buffer to limit the amount of acid generated, but not enough to completely eliminate the potential for acid genera-tion. The net neutralising potential is summarised in Table 2.
Samples were also collected from boreholes in the south-east of the study area. Four core samples were collected from 1 borehole over a depth of 160 m (green area/full succession). One chip sample was collected from one other prospecting borehole (green area / full succession) and 4 additional samples from an area falling into the area that has been eroded in parts
(red areas/weathered in parts). The NNP for both closed and open systems is summarised in Table 3. The negative values indicate acid mine production, while the positive values indi-cate neutralising potential.
The percentage sulphur in the samples plotted against the NPR also indicates a high risk of acid production, with the GGS2 sample plotting in the red area (major of acid producer) and GGS4 plotting in the neutralising capacity region (green) (Fig. 5).
The XRD analysis indicates the dominant mineral as quartz and Ferroan Chlinochlore (Table 4). The sample containing 2-10% calcite (GGS4) is the only one with a base potential. No pyrite could be identified in any of these samples.
From the static tests conducted on the samples from the south-eastern site surrounding the Grootegeluk Mine, it is clear that acid mine drainage will be produced upon oxidation in some of the samples, although there is also some buffer-ing potential in other samples. The volume of production will depend on the thickness of the geology over the area. As these samples were taken from the area surrounding the currently active mine and which falls into the same weathering grouping
Table 3Interpretation of ABA Net Neutralising Potential results
Site Name Depth Net NP (Open)
Net NP (Closed)
Interpretation
GGS 1 33 m 16.12 -2.70 Verify with other testsGGS 2 52 m -53.97 -123.05 Potential Acid GeneratorGGS 3 150 m -5.26 -7.42 Verify with other testsGGS 4 156 m 77.25 68.40 Probably excess neutralising mineralsGGS 1A - 11.87 11.35 Verify with other testsGGSVZ 1 1 m -2.39 -2.56 Verify with other testsGGSVZ 2 2 m -2.93 -3.20 Verify with other testsGGSVZ 3 3 m -2.49 -2.64 Verify with other testsGGSVZ 4 4 m -3.74 -4.35 Verify with other tests

Available on website http://www.wrc.org.zaISSN 0378-4738 (Print) = Water SA Vol. 36 No. 5 October 2010
ISSN 1816-7950 (On-line) = Water SA Vol. 36 No. 5 October 2010536
as the mine, it is concluded that the rocks to be used as backfill for the mine will generate acidity; the volumes generated will accordingly depend on the thickness of the rocks placed back into the pit.
Middle Ecca and weathered Ecca
Chip samples were collected from boreholes in the northern site (Fig. 3). The samples were collected from 5 different prospecting boreholes on the farm Goedgedacht. The depths of the samples range from 1 m to 14 m below the surface. This area contains geology that has been eroded down to the middle Ecca.
The percentage sulphur in the samples plotted against the NPR also indicates a low risk of acid production, with no sam-ple plotting in the red area and a batch plotting in the neutralis-ing capacity region (green) (Fig. 6).
A set of sandstone samples, with a thickness of 60 m, was collected from beneath Coal Zone 2. This sandstone repre-sents the lowest economical boundary level to which opencast mining in the study area could be considered under present technology. The percentage sulphur in the samples plotted
against the NPR indicates a very low risk of acid production (Fig. 7).
Discard
Two composite samples over time of discard material from the 2 beneficiation plants at the Grootegeluk Mine were collected. The test conducted on the likely discard materials indicated that they will generate acid upon oxidation.
The percentage sulphur in the samples plotted against the NPR indicates a high risk of acid production, with sulphur percentages of over 1% (Fig. 8). All the samples have an NP:AP ratio of less than 1, indicating potential acid production. From the static tests conducted on the discards from the Waterberg area, it is clear that acid will be produced upon oxidation of the samples. This has also been observed in the field by Dreyer (2008; 2009), who indicated that there is acidic effluent flowing out from the discard dumps at the Grootegeluk Mine. Dreyer (2008; 2009) stated that the volume of effluent was small and that many of the primary polluting components have been removed via burning of the discard dumps due to spontaneous combustion.
NPR vs Sulphide -S
0.00001
0.0001
0.001
0.01
0.1
1
10
100
10000.0001 0.001 0.01 0.1 1 10
% Sulphide-S
NPR
NPR=4Samples0.3% SNPR=1
Very Low Probability of
Very High Probability of
Figure 5Percentage S vs. NPR for the south/eastern
core samples
Table 4XRD results for the south/eastern core samples
Sample Quartz Ferroan Clino chlore
Calcite Siderite Ankerite Goethite/Hematite
Illite
GGS1 XX X x x x xGGS2 XX X x x xx xxGGS3 XX xx xxGGS4 XX X xx x x x
GGS1A XX xx xGGSVZ1 XX X x xxGGSVZ2 XX xx xGGXVZ3 XX xx xGGSVZ4 XX xx xx
where: XX Dominant (>40% per volume)X Major (10-40% per volume)xx Minor (2-10% per volume)x Accessory (1-2% per volume)

Available on website http://www.wrc.org.zaISSN 0378-4738 (Print) = Water SA Vol. 36 No. 5 October 2010ISSN 1816-7950 (On-line) = Water SA Vol. 36 No. 5 October 2010 537
It is recommended that care should be taken when dealing with the spoil; the method currently used at the Grootegeluk Mine, in terms of replacing rock into the pit in the same succession as it was removed, should be maintained. Replacing of discard material in situ on the under-lying impervious sandstone layer will minimise groundwater pollu-tion as the unweathered sandstone may form a natural barrier against infiltration of acidified leachate. If this is not sufficient, other options, e.g. limestone dosage, should be considered.
Geohydrology
Water levels
Water level data are available for several of the boreholes in the study area (Fig. 9) Water levels range from artesian boreholes to as deep as 154 m below the surface, with the average pre-mining water level at 28 m below the surface. The artesian boreholes predominantly occur near the Mokolo River, where the groundwater level and the surface topography intersect, while deeper water levels occur near the centre of the study area, due to a rise in elevation.
The water elevation contour map (generated from data obtained from more than 2 000 boreholes in the study area.) indicate that the elevated central areas of the study area are the driving force for groundwater flow (Fig. 7), flowing away from the cen-tral part of the study area towards the low-lying areas near the boundaries, namely the 2 rivers. It can therefore be assumed that the predominant flow directions of groundwater in the study area are towards the east, west, and north.
Cross-sections of the coal seam and groundwater level are presented in Fig. 10. This illustrates the water level in relation to Coal Zone 2, the depth at which the pit floors will eventually end.
Aquifer parameters
Slug tests and pumping tests were conducted to determine the trend or divergence from the expected norms for Karoo-type rocks. A total of 46 boreholes (Table 5) located throughout the study area have been
NPR vs Sulphide -S
0.00001
0.0001
0.001
0.01
0.1
1
10
100
1000
10000
1000000.0001 0.001 0.01 0.1 1 10
% Sulphide-S
NPR
NPR=4Samples0.3% SNPR=1
Very Low Probability of
Very High Probability of
NPR vs Sulphide -S
0.00001
0.0001
0.001
0.01
0.1
1
10
100
10000.0001 0.001 0.01 0.1 1 10
% Sulphide-S
NPR
NPR=4Samples0.3% SNPR=1
Very Low Probability of
Very High Probability of
Figure 6Percentage S vs. NPR for the northern chip samples
Figure 7Percentage S vs. NPR for the sandstone samples
NPR vs Sulphide -S
0.00001
0.0001
0.001
0.01
0.1
1
10
100
10000.0001 0.001 0.01 0.1 1 10
% Sulphide-S
NPR
NPR=4Samples0.3% SNPR=1
Very Low Probability of
Very High Probability of
Figure 8
Percentage S vs. NPR for the discard samples

Available on website http://www.wrc.org.zaISSN 0378-4738 (Print) = Water SA Vol. 36 No. 5 October 2010
ISSN 1816-7950 (On-line) = Water SA Vol. 36 No. 5 October 2010538
pump-tested and the results of the tests were analysed by means of the FC software programme developed by the Institute for Groundwater Studies at the University of the Free State.
The pumping test results indicated that the transmis-sivities and yields of the boreholes in the study area vary greatly, with transmissivities generally being low (as low as 0.31 m2/d). Values as high as 600 m2/d were obtained near the fault zones. From the results it is evident that, depend-ing on the location of the mines, it is possible that they may experience high levels (if they intersect the faults), or very low levels, of groundwater influx. However, the area
Figure 10North/south (top) and west/east (bottom) cross-sections of the study area
Figure 9Contour map of water elevation data
has a very low average transmissivity, which results in the slow movement of water and subsequently slow influx of groundwater into the mines (30 000 m3 per month of influx is experienced at the currently active mine). These find-ings conform to typical Karoo aquifer parameters (Botha et al., 1998).
Recharge
The recharge for the study area was calculated by means of the Chloride method (Van Tonder and Xu, 2001) and the E.A.R.T.H. method (Extended model for Aquifer Recharge and soil moisture Transport through the unsaturated Hard rock). These methods were chosen due to the availability of data.
For the chloride method, each individual borehole was sampled and the harmonic mean (62.76 mg/ℓ) for the chloride values was obtained. For the E.A.R.T.H. method, 8 boreholes were used for the recharge determination and were selected due to availability of time series data. The recharge of the study area was determined to be 1.59% of the annual rainfall. This is in agreement with typical Karoo aquifers (Botha et al., 1998), and with maps for the study area produced by Vegter (1995), which indicated a recharge between 1.5% and 1.9%. From the data, a contour map was drawn (see Fig. 11).
The higher recharge value indi-cated in the south-east corner of Fig. 11 illustrates the effect of the existing developments in the area around Matimba Power Station and the Matimba Ash Dump. The shallow water levels in this area are due to artificial recharge as a result of irriga-tion of gardens, leaking dams and dust suppression. It has been observed that after extensive rainfall periods the water seeps from the ash dump into the shallow weathered strata of the Waterberg formations on which the dump is built. These values indicate that future devopment with have local-ised inf luence on increased recharge.
Water quality
Groundwater samples were sampled across the study area for chemical analyses, to determine the characteristics of the ambi-ent aquifers prior to commencement of new coal mining devel-opment. The analyses indicated that the groundwater in the study area has pH-values ranging from 6 to 8. The water shows high TDS values, ranging between 600 mg/ℓ and 2 500 mg/ℓ. All of these are illustrated in the Durov diagram in Fig. 12.
It was observed that groundwater is not used for irrigation, due to the high salt content. High chloride values are found in

Available on website http://www.wrc.org.zaISSN 0378-4738 (Print) = Water SA Vol. 36 No. 5 October 2010ISSN 1816-7950 (On-line) = Water SA Vol. 36 No. 5 October 2010 539
the water along with high levels of mag-nesium, potassium, sodium and sulphate. The sulphate is predominant in areas with shallow coal-bearing layers or in cases where the boreholes were drilled into the coal. The sulphate values in the vicinity of the Grootegeluk Mine and Matimba Power Station are elevated relative to the sur-rounding areas. This is clearly illustrated from the proportional distribution sulphate map (Fig. 13) produced from available data of more than 300 boreholes in the area. From this figure the elevation around Grootegeluk, Matimba Power Station as well as down-gradient from the Matimba Ash Dump can be seen. The radius of influ-ence is however relatively small (3 km for Grootegeluk after 28 years of mining). This is due to the small transmissivities of the underlying aquifers in the area. The pro-posed power stations, as well as the Medupi Power Station currently under construction, are located on the much denser Waterberg Group quartzites south and west of the Eenzaamheid fault. These quartzite forma-tions have very low transmissivities, result-ing in the slow movement of groundwater.
It is expected that the addition of new mines and power stations will negatively impact the quality of the groundwater in the study area. It is expected that the EC values will rise along with the sulphate values in the vicinity of the mines. The water quality of the study area that has remained unaffected by activities such as mining and power generation can be clas-sified as allowable in terms of the SANS 241:2006 Drinking Water Guidelines. Generally, the area as a whole has relatively high EC values (Fig. 14) because of the elevated chloride values present in the water, with near-neutral pH values. At present a fine line exists between usable groundwater and unusable
Table 5Results from pump-testing of some of the boreholes
Site Name T (m2/d) Yield (ℓ/d) Site Name T (m2/d) Yield (ℓ/d)OBS 2 4.4 5 000 WBR 15 19.64 7 200WB 33 26.64 168 000 WRB 16 8.95 2 880WB 35 8.78 160 000 WBR 17 507.85 12 000WB 36 3.5 62 068 WBR 18 1.53 1 200WBR 1 93.52 10 800 WBR 19 0.31 960WBR 2 10.02 7 200 WBR 20 0.93 2 400WBR 3 10.62 8 400 WBR 21 0.36 1 200WBR 4 9.16 4 200 WBR 22 1.19 2 040WBR 5 5.53 3 600 WB 24 0.35 3 785WBR 6 30.07 7 200 WB 27 124.06 44 400WBR 7 1.12 960 WBR 28 0.18 19 047WBR 8 0.57 1 200 SSPMT 1 600 22 860WBR 9 5.45 1 000 SSPMT 2 3 684WB 19B 15.5 11 356 SSPMT 4 15 2 592WBR 10 1.3 4 800 H21-0637 206.3 47 844WBR 13 0.19 1 200 H21-0638 143.2 56 412WBR 14 10.75 36 000 H21-0663 141.5 72 720
groundwater in the study area, for purposes such as domestic and agricultural use.
Modelling
Numerical modelling was done by means of the Processing Modflow for Windows (PMWin) software program, in order to determine if the mines would reach a level in the future at which they would decant. Three different fictitious scenarios were modelled, simulating different possible conditions present in the study area.
Figure 11
Recharge map of the study area (% recharge of rainfall)

Available on website http://www.wrc.org.zaISSN 0378-4738 (Print) = Water SA Vol. 36 No. 5 October 2010
ISSN 1816-7950 (On-line) = Water SA Vol. 36 No. 5 October 2010540
The scenarios modelled are as follows:• Scenario 1: A single pit (dewatering and decant) modelled
with layers which have different transmissivities (0.4 m3/d, 0.28 m3/d and 0.12 m3/d)
• Scenario 2: A single pit with a fault located through the pit from north to south (dewatering and decanting)
• Scenario 3: Three pits being mined with 2 major faults located in the study area (dewatering and decanting) as high transmissivity zones
Modelling results
Inflow of Water:For all the scenarios there is very little inflow into the pits.• Scenario 1: The inflow varies between 748.82 m3/d and
754.72 m3/d for Layers 1 and 4, respectively. This agrees with what has been observed in the presently active mine.
• Scenario 2: The inflow is predicted to be in the order of between 1 751.51m3/d and 1 870.52m3/d for Layers 1 and 4, respectively. This is a substantial increase. Care should be taken to avoid mining through major faults.
• Scenario 3: For Layer 4 of the northern pit located the fur-thest away from a fault the expected influx is 754.72 m3/d while the expected influx into the south-eastern pit is calcu-lated to be 1 282.58 m3/d in the same layer over 10 years
Drawdown cones:• Scenario 1: A drawdown cone was observed for a distance
of 2.8 km after 10 years.• Scenario 2: The extent of the cone varies due to the influ-
ence of the fault, generally being 3.2 km after 50 years. • Scenario 3: The influence of the different pits and faults can
clearly be seen with the drawdown cones varying between 3.2 km to 5.2 km after 50 years
The dewatering simulations indicated that there is very little groundwater in the study area and that the water moves slowly (due to the low transmissivities of the rocks), moving predomi-nantly along structures such as dykes, fractures and faults. The predominant geological structures in the study area (the 3 main faults) thus act as conduits for water movement. This was supported by the modelling outputs and by field observations
Value < 150.00150.00 < Value < 370.00Value > 370.00No Value
SANS 241:2005
EC [mS/m] (1-1000)
pH (3-10)
Cl
SO4
T.Alk Na+K
Mg
Ca
Electrical conductivity
Durov Diagram
Figure 12Durov diagram of the
latest measured values in the study area
Figure 13Proportional distribution
of sulphate

Available on website http://www.wrc.org.zaISSN 0378-4738 (Print) = Water SA Vol. 36 No. 5 October 2010ISSN 1816-7950 (On-line) = Water SA Vol. 36 No. 5 October 2010 541
of boreholes located near the structures showing higher yields than boreholes located further away from the structures. Accordingly, it is predicted that should a mine intersect a fault during mining operations, the volume of water expected to flow into the mines will increase.
There is no evidence that the pits will reach decant levels. The groundwater volumes measured are not large enough; the low transmissivities, relatively low rainfall and high levels of evaporation lead to the conclusion that the pits will not reach decant level.
Conclusions
It is predicted that the mining in the area will have a great impact on the groundwater quality and quantity, and that care-ful monitoring is needed to ensure that a balance is maintained. The small volumes of water that are available in the study area will be reduced by the excavation of new mines. The effects will be more visible in areas located west of the Daarby fault. The impermeable nature of the fault will prevent groundwater movement from the areas east of the fault to areas west of the fault. The same applies to the areas north of the Eenzaamheid fault, since this fault is also impermeable (Dreyer, 2008; 2009). Consequently, groundwater on the southern side of the fault will not be affected by abstraction on the northern side of the fault.
From the chemical analyses and the ABA analyses, it is clear that the rocks in the study area are prone to acid genera-tion, but that there is also potential for buffering.
The low transmissivities of the formations indicate that it is unlikely that the open pit mines planned for the study area will ever create problems in terms of large volumes of inflow from groundwater. This is due to the low rainfall and subsequently low recharge and the high evapotranspiration in the area. It is therefore predicted that the pits will fill up with water until such a time as the current water level has been reached. When the pits are back-filled, the water level may rise above the initial water level, but will never reach a point where the water will decant from the pits. It is recommended that location of ash dumps, and dirty water storage and/or disposal infrastructure should not be sited over fault lines, as any leaching will be rapidly transported into the groundwater.
Acknowledgements
This study would not have been possible without the financial support of the Water Research Commission of South Africa, and sound advice from the members of the reference group.
References
BOTHA JF, VERWEY JP, VAN DER VOORT I, VIVIER JJP, BUYS J, COLLISTON WP and LOOCK JC (1998) Karoo Aquifers: Their Geology, Geometry and Physical Properties. WRC Report No 487/1/98. Water Research Commission, Pretoria, South Africa.
DREYER C (2008) Personal communication, September 2001. Consulting geologist for Exxaro, Grootegeluk, Lephalale.
DREYER C (2009) Personal communication, May 2009. Consulting geologist for Exxaro, Grootegeluk, Lephalale.
HODGSON FDI, VERMEULEN PD, CRUYWAGEN LM and DE NECKER E (2007) Investigation of Water Decant from the Underground Collieries in Mpumalanga, with Special Emphasis on Predictive Tools and Long-Term Water Quality Management. WRC Report No 1263/1/07. Water Research Commision, Pretoria, South Africa.
HODGSON FDI and KRANTZ M (1998) Groundwater Quality Deterioration in the Olifants River Catchment above the Loskop Dam with specialised investigations in the Witbank Dam Sub-Catchment. WRC Report No. 291/1/98, Water Research Commission, Pretoria, South Africa.
RSA (REPUBLIC OF SOUTH AFRICA) (1998). National Water Act (Act No. 36 of 1998). Government Gazette No. 19182. Government printers. Pretoria.
SOUTH AFRICAN WEATHER SERVICE (2008) Rainfall Figures URL: http://www.weathersa.co.za (Accessed 13 July 2008).
SNYMAN CP (1998) Coal. In: WILSON MGC and ANHAEUSSER CR (ed.) The Mineral Resources of South Africa. Handbook 16, Council for Geosciences (6th edn.). Council for Geosciences, Pretoria.
VAN TONDER G and XU Y (2001) A guide for the estimation of groundwater recharge in South Africa. Presented at the Workshop on Recharge, University of Pretoria, June 2001.
VEGTER JR (1995) An Explanation of a Set of National Groundwater Maps. WRC Report No. TT 74/95. Water Research Commission, Pretoria, South Africa.
Figure 14Proportional
distribution of electrical conductivity

Available on website http://www.wrc.org.zaISSN 0378-4738 (Print) = Water SA Vol. 36 No. 5 October 2010
ISSN 1816-7950 (On-line) = Water SA Vol. 36 No. 5 October 2010542