Quantity Surveying Education and the Benchmarking of Future ...
378
“Quantity Surveying Education and the Benchmarking of Future Needs” Damilola Oluwajoyegbe Ekundayo PhD by Published Works University of Salford School of Science, Engineering and Environment July 2020
-
Upload
khangminh22 -
Category
Documents
-
view
2 -
download
0
Transcript of Quantity Surveying Education and the Benchmarking of Future ...

“Quantity Surveying Education and the Benchmarking of Future Needs”
Damilola Oluwajoyegbe Ekundayo
PhD by Published Works
University of Salford
School of Science, Engineering and Environment
July 2020
1
Contents
List of Tables .................................................................................................................... 3
List of Figures................................................................................................................... 4
List of Abbreviations ........................................................................................................ 5
Acknowledgements .......................................................................................................... 6
Abstract: ........................................................................................................................... 7
PART A – CRITICAL REVIEW ..................................................................................... 8
Chapter 1: Introduction..................................................................................................... 9
1.1 Nature of the research and aim ............................................................................... 9
1.1.1 Critical review .................................................................................................. 9
1.1.2 Nature of the problem/Background to the study .............................................. 9
1.1.3 Aim ................................................................................................................. 12
1.2 PhD by Published Works ...................................................................................... 12
1.2.1 Descriptor for a Level 8 qualification: Doctoral degree ................................ 12
1.2.2 Conceptualising, designing and implementing a research project ................. 13
1.2.3 Acquisition and understanding of a substantial body of knowledge .............. 14
1.2.4 Understanding of the applicable research techniques .................................... 14
1.2.5 Creation and interpretation of new knowledge and originality of research ... 16
1.3 Currency and coherence........................................................................................ 17
1.4 Summary ............................................................................................................... 19
Chapter 2: Competence-based Education ....................................................................... 21
2.1 Introduction ........................................................................................................... 21
2.2 The education versus training debate.................................................................... 23
2.3 RICS QS competency requirements ..................................................................... 27
2.4 Programme appraisal and benchmarking .............................................................. 35
2.5 Summary ............................................................................................................... 43
Chapter 3: Education for Sustainable Development ...................................................... 45
3.1 Introduction ........................................................................................................... 45
3.2 Greening the BE curricula: importance and challenges........................................ 46
2
3.3 Knowledge areas relevant to the QS Profession ................................................... 48
3.4 Sustainability mapping within the curriculum: stakeholder perspectives ............ 53
3.5 Summary ............................................................................................................... 56
Chapter 4: BIM and Multi-disciplinary Education ......................................................... 57
4.1 Introduction ........................................................................................................... 57
4.2 BIM implementation: drivers, benefits and barriers ............................................. 58
4.3 Challenges of integrating BIM into undergraduate curricula ............................... 62
4.4 Multi-disciplinary (BIM) education...................................................................... 65
4.5 Summary ............................................................................................................... 67
Chapter 5: Contribution to Knowledge and Conclusion ................................................ 69
5.1 Summary ............................................................................................................... 69
5.2 Contribution to knowledge ................................................................................... 70
5.3 Conclusion ............................................................................................................ 72
5.4 Recommendations and future research activities.................................................. 73
5.5 Final concluding remarks...................................................................................... 75
References ...................................................................................................................... 76
PART B – PORTFOLIO OF PUBLICATIONS ............................................................ 87
Annexe A ........................................................................................................................ 88
Overview of Papers & Declarations of Participation .................................................. 88
Annexe B ........................................................................................................................ 94
Supplementary Reports and Acknowledgements ....................................................... 94

3
List of Tables
Table 1: Profile of publications ...................................................................................... 16
Table 2: Outline of the work presented .......................................................................... 18
Table 3: Themes of publications .................................................................................... 19

4
List of Figures
Figure 1: RICS QS and construction pathway requirements (RICS, 2018a) ................. 31
Figure 2: Perception gap in graduate competency (Publication 2)................................. 34
Figure 3: Benchmark standard - knowledge and understanding of graduates with a BSc
(Hons) QS degree (QAA, 2019) ..................................................................................... 37
Figure 4: Competency benchmark interpretation and the need for a defined graduate
competency level (Publication S1) ................................................................................. 40
Figure 5: Missing link in the integration (triple constraint) triangle .............................. 41
Figure 6: Sample portion of the final benchmark (Publication 3) .................................. 42
Figure 7: Sustainability knowledge areas relevant to future QS professionals
(Publication 4) ................................................................................................................ 52
5
List of Abbreviations
AEC Architecture, engineering and construction
AIQS Australian Institute of Quantity Surveyors
APC Assessment of professional competence
BE Built environment
BIM Building information modelling
CBE Competence-based education
CHOBE Council of Heads of the Built Environment
CIOB Chartered Institute of Building
CMF Competency mapping framework
EfS Education for sustainability
EfSD Education for sustainable development
GCTB Graduate competency threshold benchmark
HE Higher education
HEI Higher education institution
PAQS Pacific Association of Quantity Surveyors
PSRBs Professional, statutory and regulatory bodies
QAA Quality Assurance Agency
QS Quantity surveying
RICS Royal Institution of Chartered Surveyors
SD Sustainable development
UG Undergraduate
UoS University of Salford

6
Acknowledgements
The helpful contributions of my research mentor (Professor Will Swan) and academic
mentor (Dr Gerard Wood) who motivated me to complete the PhD, together with the
financial support received from the School of Science, Engineering and Environment
(SEE) and the Dean of the School (Professor Sheila Pankhurst) and the essential backing
received from the Built Environment and Acoustics (BEA) Director (Brodie McAdam)
are all grateful acknowledged. Will and Ged gave useful advice and insights on the
peculiarities of a PhD by Published Works.
The detailed and constructive comments of my supervisor, Dr Mark Shelbourn, were
most helpful. Even after moving on to pastures new, Mark kindly agreed to continue as
my supervisor and was always there to help. You are a star!
Thanks are due to my co-supervisor, Professor Jason Underwood, for agreeing to act as
such; to Dr Richard Fitton for the offer of support during the early days; to Professor
Srinath Perera; to Dr Solomon Babatunde, and to Professor Chika Udeaja for the constant
encouragements throughout my doctoral journey.
To my supportive wife and toddler, I really am very grateful – you guys rock.
I would also like to thank Ms Hanneke van Dijk in SEE for her assistance with proofing
and editing, which greatly improved the final thesis. Much appreciated.
Thank you ALL…

7
Abstract:
The education and development needs of architecture, engineering and construction (AEC)
students has received a great deal of attention in recent years. The dynamic nature of the
construction industry coupled with the ever-changing needs of clients has put sustained
pressure on the AEC curricula of higher education institutions (HEIs). This is exacerbated
by the complexities of modern-day buildings/infrastructures and project teams. The
education and development needs of AEC professionals have never been more important.
As a vocational subject, the quantity surveying (QS) undergraduate courses delivered in
HEIs are designed to prepare students for the world of practice and to deal with emerging
challenges (or at least with those intentions). The extent to which graduates from these
programmes fulfil this expectation is open to debate and interpretation and continues to
generate considerable interest and investigation. The thesis draws upon the wide-ranging
perspectives in the field and beyond as the publications were explored from a wider
theoretical background and the findings compared with several other important studies.
The main finding associated with vocational QS education is that there is general
dissatisfaction with graduate attainments due to a tripartite pull on their training needs.
As with APC requirements, defining the levels of attainment of each RICS competency
and the extent of training required to cope with the critical challenges and emerging roles
in a dynamic industry should inform the development of an adaptable curriculum.
The principal conclusion relating to education for sustainability is that a lack of definition
and common agreement on what sustainable development entails is causing different
interpretations by HEIs and hindering the development of a structured QS curriculum. A
minimum standard which aligns the views of major stakeholders should produce
graduates with the required level of knowledge and skills in sustainability.
Regarding BIM education, the critical barriers include the trio of high cost, human factors
and inconsistent standards. Despite multi-disciplinary learning, knowledge gaps were
found in the collaborative behaviours of QS students. This thesis, thus, concludes that still
more needs to be done to move away from the speciality and insularity of the typical BE
discipline to the more pluralist and collaborative multi-disciplinary curricula of the future.

8
PART A – CRITICAL REVIEW
9
Chapter 1: Introduction
1.1 Nature of the research and aim
1.1.1 Critical review
This thesis has been submitted in partial fulfilment of the requirements of the University
of Salford’s Doctor of Philosophy (PhD) by Published Works. This PhD by publication
presents a body of work relating to understanding quantity surveying (QS) education and
developmental needs in the 21st century. There are two parts to the thesis, Part A and Part
B. The first part (i.e. Part A) presents a critical review of the published works submitted
for the PhD, whilst the second part of the thesis (i.e. Part B) presents a portfolio of those
publications which consists of 9 publications and 2 supplementary reports.
Part A, which is the critical review, explores the body of published works individually
and collectively in the context of the discipline. Relevant publications are discussed
within the three identified themes to help with the alignment of the publications, and the
comprehension and readability of the thesis. This allows for reflection on the
developmental needs of the QS profession within a broader built environment (BE)
context. The work draws upon wide-ranging perspectives in the field and beyond as the
publications were explored from a wider theoretical background and the findings
compared with other main studies. So, rather than reviewing each publication in isolation,
a holistic approach was considered appropriate for the work within the defined
parameters. The use of underlining (such as Publication X) has been used throughout the
review to maintain the visibility of the individual publications.
1.1.2 Nature of the problem/Background to the study
The education and developmental needs of architecture, engineering and construction
(AEC) students have received a great deal of attention in recent years. The dynamic
nature of the construction industry coupled with the ever-changing needs of clients has
put sustained pressure on the AEC curricula of higher education institutions (HEIs).
Graduates of these higher education (HE) programmes are expected to become the
custodian of the built and natural environments and be capable of designing, constructing,

10
managing, operating, maintaining and taking care of built assets in an increasingly
complex environment with dwindling capital and natural resources. This is exacerbated
by the complexities of modern-day buildings/infrastructures and project teams. The
education and development needs of AEC professionals have never been more important.
In fact, such education and development needs have long been a serious bone of
contention amongst different groups of stakeholders and have fuelled the continuing
education versus training debate, particularly in vocational disciplines.
This ancient, and sometimes cut and thrust, education versus training debate has become
a lens through which proponents view the importance of academic rigour and/or the
practical relevance of the HE curricula (Hill, Popovic, Eland, Lawton & Morton, 2010;
Hill, Popovic, Lawton, et al., 2010; Blair & Serafini, 2016; Palm & Staffansson Pauli,
2018). In an article, Wilson (2010) lamented upon this issue and at the number of people
who have ditched the importance of education in favour of more training for technology
students at US Universities. Unlike training, which is easy to describe and measure,
education can be perceived as abstract. Wilson (2010: 40) asserted that “training is
focussed on narrowly defined operational skills, usually relating to a specific job function
or technology”. Therefore, in the view of Wilson, a real world disconnect exists due to a
lack of understanding on the role of HE especially among industry practitioners.
Educators must be able to distil fundamentals from transitional knowledge and teach
these as well as the requisite basic competencies such as problem solving skills and
independent learning skills (Kim, 2006; Hale, 2007; Peach, 2010).
It can be argued that training can be a vital aspect of education because it provides the
specific skill sets required to accomplish a task rather than being mere knowledge. This,
therefore, uncovers a new debate on whether training should form a key part of education
and/or vice versa. According to Blair and Serafini (2016), “Is education training or is
training education?” is the cry and a further bone of contention. This idea of reconnecting
theory with practice was of utmost importance to Scott et al. (2013) in their
comprehensive study (which was conducted by several leading scholars and industry
practitioners in the built and natural environments). These major academic and industry
experts in the field strongly perceived and advocated that education and training should
be firmly seated within more pluralist and interdisciplinary curricula in place of the

11
singularity and constriction that is typical of, and which has plagued, most BE
programmes and associated professional bodies.
Scott (2016) put forward a rather strong and convincing case for pragmatism in
construction education theory and research. It is believed that architecture, engineering
and construction is deeply rooted in the pragmatic paradigm (Farmer & Guy, 2010;
McKenna & Baume, 2015; Scott, 2016). This philosophical position is based on the
practical nature of knowledge in the field of study. According to Scott, the philosophical
stance of pragmatism provides the opportunity to understand what construction education
really entails and gives the freedom to challenge existing phenomena in order to inform
future practice. The role of theory in practice, as well as the essence of education in the
training of students in vocationally oriented subjects, ties in with the notion of pragmatist
ontology and epistemology which aim to improve practice and solve real life problems
(Yin, 2018; Saunders, Lewis, & Thornhill, 2019).
The professional quantity surveyor, being a major actor in the construction industry, has
been caught up in an ongoing saga of stakeholder dissatisfaction and continuing tension
between industry and academia. Thus, undergraduate construction curricula are
constantly under intense scrutiny and continuous modernisation to keep abreast of
developments in the industry and to satisfy the needs of various stakeholders including
professional bodies, practitioners and students alike. As a vocational subject/discipline,
the QS undergraduate courses delivered in HEIs are designed to prepare their students
for the world of practice and emerging challenges (or at least with that intention). The
extent to which graduates of these programmes fulfil this expectation is open to debate
and interpretation and continues to generate considerable interest and investigation. The
gap in expectations between academics, industry practitioners and professional bodies is
brought into sharp focus as the order of the day seems to be confusion and dissatisfaction,
leading to disgruntled and incapable graduates confronting evolving roles who do not
meet stakeholders’ expectations, as explicated in Publications 1, 2 and 3.
Perhaps we should trust, unquestioningly, our education providers and HEIs as beacons
of knowledge and centres of excellence, or associated professional bodies as regulators
which set the pace for the development of QS vocational learning. Maybe industry
practitioners with current real-life experiences, as pacesetters, should take the lead, or
12
possibly students (who are the future practitioners and leaders themselves) should be
given more say on their learning and put in charge of their destiny. Irrespective of the
favoured school of thought, the one thing that is certain in all of this is that a healthy
academia-industry-professional body nexus is a relevant proposition for unifying the
perceptions and expectations (and thus satisfaction) of the various stakeholders involved.
1.1.3 Aim
The principle aim of this thesis is, therefore, to investigate the development of QS
undergraduate programmes in order to better prepare students (who meet stakeholders’
expectations) for practice. The aim is achieved through an evaluation of three major
themes which can be distilled from the published works submitted in the thesis, as
follows:
o the nature of vocational/professional education and the alignment of the views of
various stakeholders on RICS QS competencies;
o the nexus between sustainable development and the construction industry as
evident in academic journals, QS education and practices;
o the significance of building information modelling (BIM) integration and multi-
disciplinary learning in programme curricula within higher education.
In brief, the works examine three aspects of QS education and development needs
relating to the Royal Institution of Chartered Surveyors (RICS) QS competencies
(Publications 1, 2 and 3), sustainability knowledge areas (Publications 4, 5 and 6) and
BIM/multi-disciplinary learning (Publications 7, 8 and 9). The thesis focuses on each of
these aspects within chapters 2, 3 and 4.
1.2 PhD by Published Works
1.2.1 Descriptor for a Level 8 qualification: Doctoral degree
A PhD by published works thesis requires a retrospective approach to the overall
narrative and has to draw on several individual research projects, unlike a traditional PhD
thesis (Wood, 2012; Fitton, 2016). This thesis demonstrates the core skills and
competencies that have been developed by the researcher to achieve a PhD by
13
publication. Using the approach adopted in Wood (2012), and to help the reader, the
following sub-sections provide a preliminary sketch of the combined body of work
submitted in the nine publications, and how they fully meet the requirements of the
qualification descriptor for a Doctoral degree as defined by the Quality Assurance
Agency (QAA, 2014). These requirements, as stated within the QAA framework for
higher education qualifications, are:
o the general ability to conceptualise, design and implement a project for the
generation of new knowledge, applications or understanding;
o a systematic acquisition and understanding of a substantial body of knowledge
which is at the forefront of an academic discipline or area of professional practice;
o a detailed understanding of applicable techniques for research and advanced
academic enquiry, and
o the creation and interpretation of new knowledge, through original research, of a
quality to satisfy peer review, extend the forefront of the discipline, and merit
publication.
1.2.2 Conceptualising, designing and implementing a research project
Much of the research that has led to the portfolio of publications submitted for this thesis
required formulating a research problem, coming up with appropriate research questions
and objectives, and devising an implementation strategy on the part of the researcher. For
example, with reference to Publication 4, Mapping Sustainability in the QS Curriculum,
the research problem was conceptualised by the researcher, as well as the planning and
execution of the project. The broad theme for the research that led to Publications 2 and
3 was originally defined by a RICS Research Trust call out, however the bid was
submitted in competition with other researchers. This particular research still required
the streamlining of the research problem, the framing of the project goals and the
overarching aim, and the development of the methodological approach and planning its
implementation. The ability to do this led to the generation of new knowledge (see
section 1.2.5), and the project design was occasionally adjusted in the light of unforeseen
problems.
14
1.2.3 Acquisition and understanding of a substantial body of knowledge
The works have involved a critical review and evaluation of a substantial body of
literature to address the identified subject matter and areas. This involved searching and
analysing some 420 academic papers, industry reports and other publications. A
comprehensive understanding of the varied and existing work in the field frequently led
to the identification of a gap in knowledge that required further investigation and/or
analysis. Also, within the body of work presented, the analysis of some issues and
advanced scholarship from within Publication 1 led to Publications 2 and 3, whilst the
need for further academic inquiry from Publication 4 resulted in Publications 5 and 6
respectively. New research problems were formulated, and fresh data were collected, in
the portfolio of publications to address the perceived gap(s) in knowledge and to provide
a more accurate picture of current phenomena. The new insights gained from the reviews
and evaluations ensured that this body of work is at the forefront of academic discipline
and the associated area of professional practice. Additionally, the implications of the
reviews and evaluations for academia and industry were subsequently explored.
1.2.4 Understanding of the applicable research techniques
The research philosophy which is mostly adopted in the published works is pragmatism.
This philosophical position is based on the practical nature of knowledge in the field of
study. Scott (2016) put forward a rather strong and convincing case for pragmatism in
construction education theory and research. According to Scott, the philosophical stance
of pragmatism provides the opportunity to understand what construction education really
entails and gives the freedom to challenge existing phenomena in order to inform future
practice. The role of theory in practice, as well as the essence of education in the training
of students in vocationally oriented subjects such as quantity surveying, is vital to this
philosophical underpinning.
Whilst there may be other applicable research philosophies, it is believed that
architecture, engineering and construction is deeply rooted in the pragmatic paradigm
(Farmer & Guy, 2010; McKenna & Baume, 2015; Scott, 2016). The need to investigate
the problems within current QS practice and education in view of the future industry
requirements has informed the chosen pragmatic framework. This ties in with the notion
of pragmatist ontology and epistemology which aim to improve practice and solve real

15
life problems (Yin, 2018; Saunders et al., 2019). In accordance with this philosophical
underpinning and the exploratory nature of the research, the published works used a
variety of research strategies, inter alia, case study and survey. The exploratory case
study approach enabled an in-depth enquiry and a deeper understanding of the existing
phenomena in a real-life context (Creswell, 2009; Yin, 2018).
The nine publications submitted demonstrate a detailed understanding of applicable
techniques for research and advanced academic enquiry. Based on the nature of the
investigation in each individual study and the associated research strategy, appropriate
instruments were used for data collection and analysis. Triangulation, which according
to Creswell (2009) involves using more than one method or a variety of methods to
collect data on the same subject matter, in a qualitative research, was sometimes used to
develop a broad understanding of a phenomenon and/or to investigate the same thing.
The attitudes, perceptions, views, experiences and expectations of relevant stakeholders
on various issues relating to academia and industry were collected through a series of
semi-structured interviews carried out with 50 experts. The qualitative and quantitative
data within the nine publications were also collected from a total of 16 detailed
competency mapping case studies that were conducted, and from the 661 sets of fully
completed survey responses received. Those responding to the questionnaire surveys,
and the expert forum participants, comprised RICS officials, academics, students and
practitioners in the field of study.
The NVivo computer software package was used for organising and processing and for
content analysis of the qualitative data generated from the semi-structed interviews,
whilst the quantitative data in the works were analysed and presented using relevant
inferential and descriptive statistics. Descriptive statistical analysis was used to devise a
detailed map scoring system for the competency mapping case studies using a two-
dimensional matrix and scale. Using the Delphi technique explicated in Keeney (2011),
the views of the expert forum participants were extracted and harmonised to produce a
Graduate Competency Threshold Benchmark (GCTB).
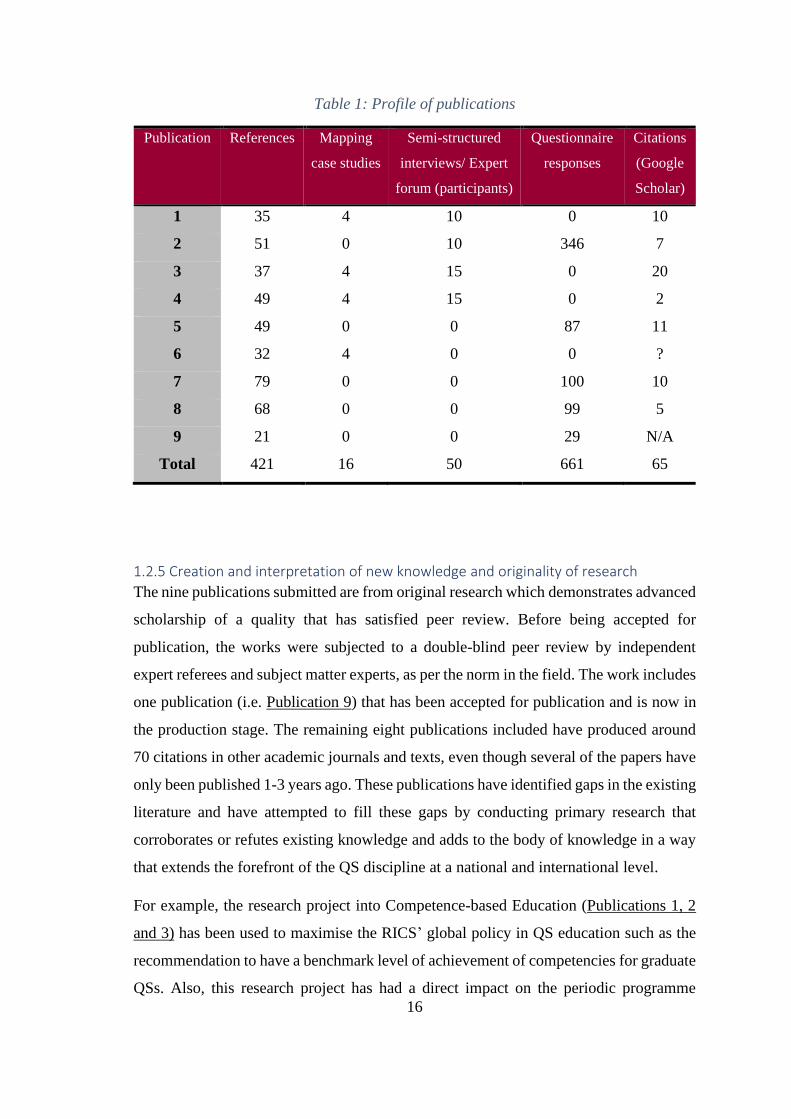
Table 1 provides a summary of statistics which gives a snapshot of the combined scope
of the work included.
16
Table 1: Profile of publications
Publication References Mapping
case studies
Semi-structured
interviews/ Expert
forum (participants)
Questionnaire
responses
Citations
Scholar)
1 35 4 10 0 10
2 51 0 10 346 7
3 37 4 15 0 20
4 49 4 15 0 2
5 49 0 0 87 11
6 32 4 0 0 ?
7 79 0 0 100 10
8 68 0 0 99 5
9 21 0 0 29 N/A
Total 421 16 50 661 65
1.2.5 Creation and interpretation of new knowledge and originality of research
The nine publications submitted are from original research which demonstrates advanced
scholarship of a quality that has satisfied peer review. Before being accepted for
publication, the works were subjected to a double-blind peer review by independent
expert referees and subject matter experts, as per the norm in the field. The work includes
one publication (i.e. Publication 9) that has been accepted for publication and is now in
the production stage. The remaining eight publications included have produced around
70 citations in other academic journals and texts, even though several of the papers have
only been published 1-3 years ago. These publications have identified gaps in the existing
literature and have attempted to fill these gaps by conducting primary research that
corroborates or refutes existing knowledge and adds to the body of knowledge in a way
that extends the forefront of the QS discipline at a national and international level.
For example, the research project into Competence-based Education (Publications 1, 2
and 3) has been used to maximise the RICS’ global policy in QS education such as the
recommendation to have a benchmark level of achievement of competencies for graduate
QSs. Also, this research project has had a direct impact on the periodic programme
17
review of the undergraduate QS programme at Northumbria University, to determine its
academic health and ensure its continuing currency and industry-relevance.
Similarly, based on knowledge from the research into Education for Sustainability
(Publications 4, 5 and 6), an aspect of environmental sustainability was introduced into
the design economics module taught to final year QS students at Northumbria University.
In addition, the research published in Publications 7 and 8 on BIM has provided impetus
for the development of QS undergraduate curricula in a developed and developing
country context, whilst the research project into multi-disciplinary learning in Publication
9 is helping to provide continued support for collaborative learning approaches and in
developing the key skills required on a multi-disciplinary project module undertaken by
all BE students at the University of Salford.
1.3 Currency and coherence As defined in the University of Salford (UoS) Academic Regulations for Research
Awards, the claim for PhD by Published Works is normally based on 5 – 8 publications.
More than the minimum number of publications required are included because of their
relevance to the overarching aim and key themes of this thesis. The regulations also
require that these publications should not have been published more than 10 years before
the date of registration of candidature (September 2019). This implies that published
work going back to 2009 can be included in the claim. However, apart from the works
published in 2013 (Publication 1) and 2015 (Publication 4), the remaining works have
been published only recently. This shows the timeliness, currency and relevance of the
body of work to the subject matter addressed in the thesis. The publications, through the
questions posed and the findings presented, also provide contemporary and fresh
perspectives on the age-old ongoing debate about professional education in general and
the QS discipline in particular.
18
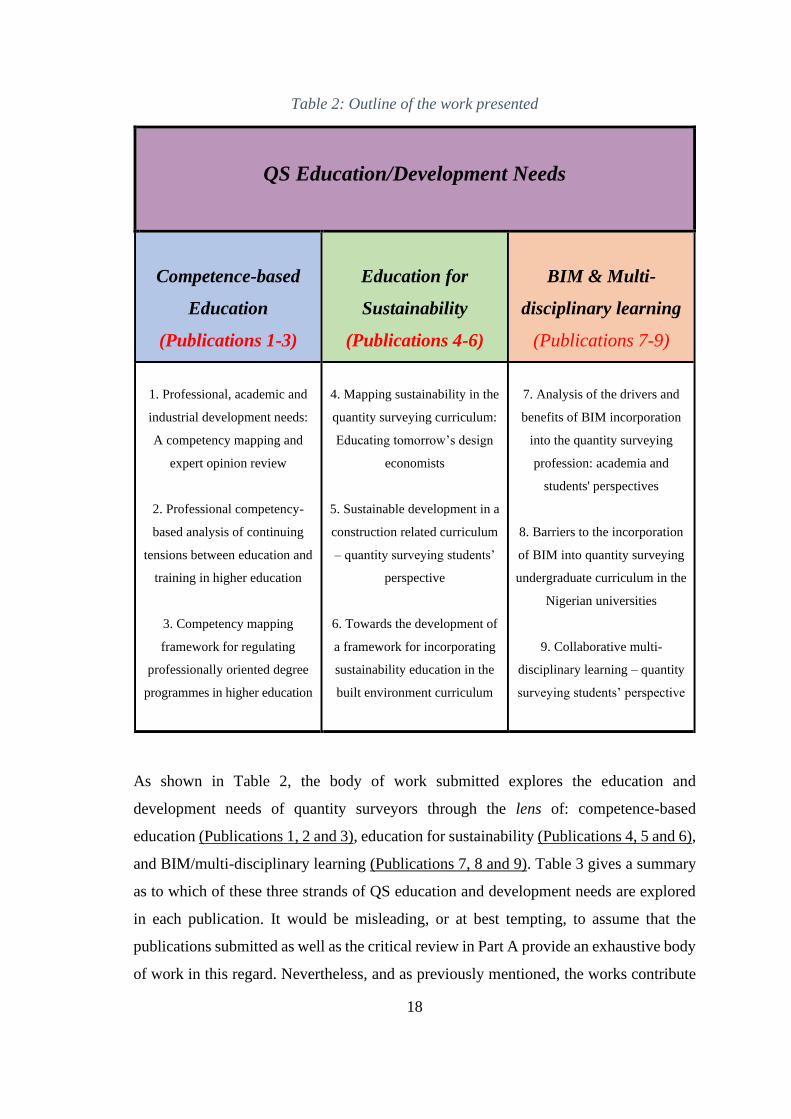
Table 2: Outline of the work presented
QS Education/Development Needs
Competence-based
Education
(Publications 1-3)
Education for
Sustainability
(Publications 4-6)
BIM & Multi-
disciplinary learning
(Publications 7-9)
1. Professional, academic and
industrial development needs:
A competency mapping and
expert opinion review
2. Professional competency-
based analysis of continuing
tensions between education and
training in higher education
3. Competency mapping
framework for regulating
professionally oriented degree
programmes in higher education
4. Mapping sustainability in the
quantity surveying curriculum:
Educating tomorrow’s design
economists
5. Sustainable development in a
construction related curriculum
– quantity surveying students’
perspective
6. Towards the development of
a framework for incorporating
sustainability education in the
built environment curriculum
7. Analysis of the drivers and
benefits of BIM incorporation
into the quantity surveying
profession: academia and
students' perspectives
8. Barriers to the incorporation
of BIM into quantity surveying
undergraduate curriculum in the
Nigerian universities
9. Collaborative multi-
disciplinary learning – quantity
surveying students’ perspective
As shown in Table 2, the body of work submitted explores the education and
development needs of quantity surveyors through the lens of: competence-based
education (Publications 1, 2 and 3), education for sustainability (Publications 4, 5 and 6),
and BIM/multi-disciplinary learning (Publications 7, 8 and 9). Table 3 gives a summary
as to which of these three strands of QS education and development needs are explored
in each publication. It would be misleading, or at best tempting, to assume that the
publications submitted as well as the critical review in Part A provide an exhaustive body
of work in this regard. Nevertheless, and as previously mentioned, the works contribute

19
to the ongoing training versus education debate in vocational disciplines, albeit with a
QS focus and bearing in mind the future industry needs and employer demands. The aim
here is an understanding of, and the alignment of, academic and industry views on the
attainment and expectations of QS graduates so as to develop undergraduate programmes
that meet the requirements and needs of the various stakeholders without compromising
the ability of the curriculum to adapt to ever-changing demands. The discussions in the
publications and the critical review are thus relevant and necessary if academic integrity
and sanity, student employability and satisfaction, as well as industry input and
engagement are to be preserved, encouraged and sustained. This relates not only to QS
but to all disciplines in the AEC/BE sector and to all subject areas in the vocational
domain.
Table 3: Themes of publications
Publication Relationship
1 Competence-based Education
2 Competence-based Education
3 Competence-based Education
4 Education for Sustainability
5 Education for Sustainability
6 Education for Sustainability
7 BIM & Multi-disciplinary Learning
8 BIM & Multi-disciplinary Learning
9 BIM & Multi-disciplinary Learning
1.4 Summary This chapter provides a general overview of the thesis, the nature of the problem
investigated, and the aim and principal themes of the 9 publications submitted. It also
demonstrates how this body of work addresses the requirements of both the UoS
academic regulations for PhD by publication and the QAA qualification descriptor. In
brief, the published works examine three aspects of QS education and developmental
needs relating to the RICS QS competencies (Publications 1-3), sustainability knowledge

20
areas (Publications 4-6) and BIM/multi-disciplinary learning (Publications 7-9). The
thesis focuses on each of these aspects within chapters 2, 3 and 4, as follows.
21
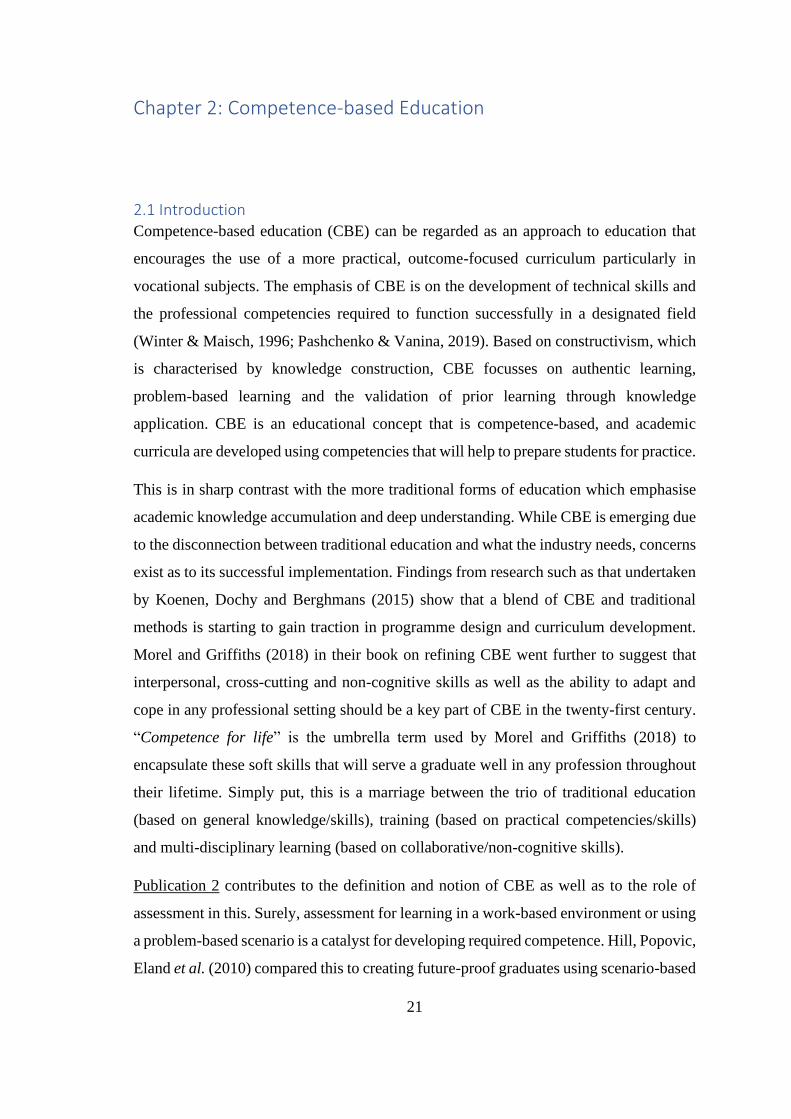
Chapter 2: Competence-based Education
2.1 Introduction Competence-based education (CBE) can be regarded as an approach to education that
encourages the use of a more practical, outcome-focused curriculum particularly in
vocational subjects. The emphasis of CBE is on the development of technical skills and
the professional competencies required to function successfully in a designated field
(Winter & Maisch, 1996; Pashchenko & Vanina, 2019). Based on constructivism, which
is characterised by knowledge construction, CBE focusses on authentic learning,
problem-based learning and the validation of prior learning through knowledge
application. CBE is an educational concept that is competence-based, and academic
curricula are developed using competencies that will help to prepare students for practice.
This is in sharp contrast with the more traditional forms of education which emphasise
academic knowledge accumulation and deep understanding. While CBE is emerging due
to the disconnection between traditional education and what the industry needs, concerns
exist as to its successful implementation. Findings from research such as that undertaken
by Koenen, Dochy and Berghmans (2015) show that a blend of CBE and traditional
methods is starting to gain traction in programme design and curriculum development.
Morel and Griffiths (2018) in their book on refining CBE went further to suggest that
interpersonal, cross-cutting and non-cognitive skills as well as the ability to adapt and
cope in any professional setting should be a key part of CBE in the twenty-first century.
“Competence for life” is the umbrella term used by Morel and Griffiths (2018) to
encapsulate these soft skills that will serve a graduate well in any profession throughout
their lifetime. Simply put, this is a marriage between the trio of traditional education
(based on general knowledge/skills), training (based on practical competencies/skills)
and multi-disciplinary learning (based on collaborative/non-cognitive skills).
Publication 2 contributes to the definition and notion of CBE as well as to the role of
assessment in this. Surely, assessment for learning in a work-based environment or using
a problem-based scenario is a catalyst for developing required competence. Hill, Popovic,
Eland et al. (2010) compared this to creating future-proof graduates using scenario-based

22
learning. The study in Publication 2 provides an indication that the definition of
competence covers the mix of knowledge, skills, abilities, behaviours and attitudes
required to do a job or task effectively and efficiently. The review in this particular study
shows that whilst there are clear benefits of CBE, its adoption is equally driven by the
awareness of, and the need for, HEIs to comply with professional body requirements and
industry practice in the design and delivery of programmes to gain necessary
accreditations. Also, with the mass production and supply of graduates to the market
(Scott, 2015), employers’ demands are starting to have a significant bearing on the
development of undergraduate curricula in order to maintain their relevance and improve
graduate employability in the fast-changing, competitive work environment. Publication
2 uncovers that CBE as an integrated approach has not been successfully implemented
in higher education and the reasons for this failure and the imperfections of CBE are
discussed in more detail later in this chapter.
CBE has been under sustained critique and scrutiny for some time now. Indeed, the
“competence for life” perspective put forward by Morel and Griffiths (2018) deviates
somehow from the norm in vocational education. Fast-forwarding to the current decade,
CBE is still a topic of much discourse because it is seen as a way of integrating education
with training, and theory with practice. It is often perceived that there is a gap between
what higher education provides and what the industry needs, hence the development in
CBE to improve connectivity (Schaap, de Bruijn, Van Der Schaaf & Kirschner, 2009;
Hill, Popovic, Eland et al., 2010; Hill, Popovic, Lawton et al., 2010; Wesselink, de Jong,
& Biemans, 2010; Morel & Griffiths, 2018; Palm & Staffansson Pauli, 2018).
With industry requirements remaining the central focus here, Edwards (2016) asserted
that CBE can lead to a narrowly defined curriculum where the deep knowledge and
understanding integral to academic inquiry and intellectual curiosity are side-lined. The
subsequent sections in this chapter, therefore, seek to explore the education versus
training debate typical of CBE; the RICS’ QS competency requirements; the mechanisms
for appraising and benchmarking in this area of practice, as well as the alignment
framework for closing the gap between what universities provide and what employers
want. To this end, reference will be made to wider disciplinary perspectives and the
literature, including the publications submitted in this thesis.
23
2.2 The education versus training debate The seemingly insoluble conundrum of education and/or training continues to dominate
pedagogy discussions and CBE. This ancient, and sometimes cut and thrust, education
versus training debate has become a lens through which proponents view the importance
of academic rigour and/or the practical relevance of the HE curricula. In an article,
Wilson (2010) lamented regarding this issue and at the number of people who have
ditched the significance of education in favour of more training for technology students
at US Universities. Unlike training, which is easy to describe and measure, education can
be perceived as abstract. Wilson asserts that “training is focussed on narrowly defined
operational skills, usually relating to a specific job function or technology”. Such an
operational skill could be learning a specific programming language to hit the floor
running with certain technology graduate employers. The essence of education, on the
one hand, must be to produce intelligent graduates that are highly flexible and adaptable
(for example, equipping students with the fundamental knowledge and an enduring
understanding of programming, so they can demonstrate to any future employer that they
can apply themselves well to any language). On the other hand, vocational training
mainly involves aspiring to meet the learning outcomes of an academic curriculum
through the achievement of specific job competencies at the required levels (Beckman,
Coulter, Khajenoori & Mead, 1997; McHardy & Allan, 2000; Gibbs, Brigden, &
Hellenberg, 2004).
Assessment of competencies for learners in vocational subjects, typical of CBE,
emanated from the concept of training. Indeed, if HEIs are not teaching fundamental
knowledge and specific skills which are germane to professional practice, an academic
programme will soon be outdated and archaic. So, surely university curricula must
involve some elements of training to be valid and to maintain their academic health,
currency and relevance. This was also the view in the research conducted into medical
education by Gibbs et al. (2004). But whether all aspects of training relating to a
discipline can be covered in an academic curriculum is another issue, which is open to
contentious debate and varied interpretation. If the answer is no, then does this reflect
badly on our education system? The response from Wilson (2010) is of course not, on
the premise that vocational learning is a lifelong endeavour. A real world disconnect, in

24
the view of Wilson, exists, therefore, due to a lack of understanding about the role of HE
especially among industry practitioners. Our educators must be able to distil
fundamentals from transitional knowledge and teach the former as well as the requisite
basic competencies, the problem-solving skills and the independent learning skills (Kim,
2006; Hale, 2007; Peach, 2010).
As reported in Wood (2012), a study which investigated research, practice and education
in the built environment, some educators, perhaps in the minority, still believe though
that training is best (and only) picked up in the workplace through placement and the
like, or during a person’s professional career. This view must be gravitating towards
extinction (Morel & Griffiths, 2018) as it is based on a limited understanding of what
education entails. On the contrary, Garcia (2008) pointed out the growing perception
among pedagogy scholars that specific competencies and skills can be taught through
vocational and practical education. Clearly, HEIs can do much more by teaching practical
skills and knowledge in a working environment context. Interestingly, the afore-mentioned
author is of the opinion that research and theoretical knowledge relevant to a specialism
should be construed as training, and thus he argued that education should focus on
academic enquiry, deep understanding, applied research and associated skills, believing
that the relevant job-related competencies can be gained in, and through, employment.
It is rather perplexing and perhaps invigorating to see a strong case being made in favour
of more education rather than training from a practitioner viewpoint. Even though the
importance of training is never discredited in Garcia’s article most failures in the fire
service industry, which is the focus of his study, were attributed to the inadequate
educational background of the firefighters and their lack of ability to think outside the
box (i.e. beyond their training). This is precisely why Garcia, an engineering contractor
and employer, would rather work with a conventionally educated professional capable of
innovating and of challenging the norms than a dogmatic well-trained individual.
Earlier, Cross (1996) made a vivid illustration of the clear difference between training
and education using the following analogy: if your teenage girl informs you of a course
on sex education that she would be undertaking at school, you might be satisfied with
this, right! However, what if your young teenager declares that she will be participating
in some sex training instead…? A person’s reactions to Cross’s illustration above, which

25
makes perfect sense hopefully, are rooted in, and guided by, the apparently distinct
differences between the two subjects, education and training. Education entails learning
the general facts, concepts, values, history and theory in the field of study, which together
help to build a person’s foundation or knowledge base and behaviour; hence, Blair and
Serafini (2016) maintained that education can help to develop the cognitive skills
required to flourish intellectually. Training, which is often regarded as learning by doing,
is where the general knowledge gained in the chosen field is taken to the next level and
applied to practical and job-related competencies (Hill, Popovic, Eland et al., 2010; Hill,
Popovic, Lawton et al., 2010; Blair & Serafini, 2016; Palm & Staffansson Pauli, 2018).
Training, which is based on practising and mastering the defined competencies at the
appropriate levels, can be viewed as a routine learning approach that uses an acquired
skill set to demystify practical known tasks and probable issues. Education, which can
be considered as a dynamic learning approach, is more exploratory since a deep
understanding of a subject helps to create guiding principles which help to solve
unknown problems and provides assistance when entering uncharted territories. One key
difference between these two subjects is, therefore, the present nature of training and the
future approach of education. Another distinct difference is the focus of training and of
education. In the case of the former, educators provide a work-related environment for
learners to master specific skills whilst in the later learner autonomy and self-discipline
is taught and encouraged.
In view of the above, it can be argued that training can be a vital aspect of education
because it provides the specific skill sets required to accomplish a task rather than being
mere knowledge. This, therefore, uncovers a new debate on whether training should form
a key part of education and/or vice versa. “Is education training or is training education?”
is the cry and a further bone of contention. Regardless of the preferred school of thought,
an integrated training and education approach to undergraduate curriculum development
remains the common denominator for most scholars in the field. What we cannot and
must not do is to take a literal, single-dimensional view of education and training.
In the words of Garcia (2008):
“We must have a deliberate mix of education and training to teach not only the How
(training) but also the When, Why, and Why Not (education)”.

26
This idea of reconnecting theory with practice was of utmost importance to Scott et al.
(2013) in their comprehensive study (which was conducted by several leading scholars
and industry practitioners in the built and natural environments). These major academic
and industry experts in the field strongly perceived, admonished and advocated that
education and training should be firmly seated within more pluralist and interdisciplinary
curricula rather than the singularity and constriction that is typical of, and which has
plagued, most BE programmes and associated professional bodies.
Whilst the words education and training are sometimes used interchangeably, many
proponents believe that training is part of education and they complement each other
(Beckman et al., 1997; Bishop, 1998; Gibbs et al., 2004; Hale, 2007; Wilson, 2010; Blair
& Serafini, 2016). Education, according to Gibbs et al. (2004) includes training,
information acquisition and initiation as well as thinking and problem-solving skills.
Consequently, some authors (Schaap et al., 2009; Peach, 2010) have suggested the
replacement of training with vocational education as an all-encompassing and a more
fitting term to reflect the desired attitude and approach to curriculum development whilst
others have argued that education and training should happen simultaneously rather than
being treated as antonymous as reported in Malamud and Pop-Eleches (2008) and Wood
(2012). This is particularly important in certain vocational subjects and disciplines such
as for doctors, nurses, lawyers and pilots where the prospect of educated professionals
with NO training is daunting and frightening, at best.
In the spirit of pluralism, creating an academic curriculum integrating both training and
education will result in a focussed experiential emphasis rooted in broader academic
learning and critical thinking skills (Kim, 2006; Scott et al., 2013). This judgement led
Hale (2007) to the assertion that while training is essential, this should not be at the cost
of education. Universities should, therefore, remain as a citadel of knowledge and
creativity (rather than a mere training camp) underpinned by intellectual dialogue and
applied research. A socially critical vocationalism (SCV) is the slogan used to define this
HE curriculum philosophy in Peach (2010). According to Peach, this is an academically
justifiable, experientially focussed and socially dynamic approach to curriculum
development that will go a long way to resolve the tensions caused by the pedagogy
debates. As its name indicates, experientially focussed education affirms the importance
of training, real tasks and practical experience within learning and development in HE

27
(Kolb, 1984; Healey & Jenkins, 2000), particularly with regard to BE vocational
disciplines (Shelbourn, Aouad, Hoxley & Stokes, 2000; Shelbourn, Aouad & Hoxley,
2001; Shelbourn, Hoxley & Aouad, 2004). Such education is critical to HE survival and
to the successful marketing of UG programmes which have a broader societal, industry
and student appeal.
Aligned to this debate, Publication 1 investigated the current and future needs of quantity
surveyors who satisfy the aspirations of various stakeholders. The study found that the
development needs of quantity surveyors are pulled in opposite triangular directions by
three different groups of stakeholders, namely academics, industry and professional
bodies. Further to the conflicting needs of the academic and industry stakeholders as
evident in the studies above, Publication 1 adds to the pedagogical debates through the
lens of construction programmes, but with the added dimension of professional body
expectations such as those of the RICS, arguably the most relevant body that accredits
Bachelor’s with honours QS degree courses in the UK and which has the most influence
on QS education globally (RICS, 2019). In addition, RICS, which is perceived to send
conflicting messages to industry and academia, is also interested in graduates that can
quickly progress to chartered membership status by passing the assessment of
professional competence (APC) within a few years of graduation (RICS, 2018a). A major
finding of Publication 1 is that the RICS accredited QS undergraduate courses are not fit
for purpose due to the tripartite pull. This culminates in less than satisfied graduates who
are perceived as not fulfilling expectations thereby causing dissatisfaction on the part of
the employer whilst HEIs are being dragged from pillar to post. The results of the
research discussed in Publication 1 indicate that the varying, and increasingly divergent,
demands from the three major group of stakeholders are the catalyst for the education
versus training debate and the resulting tension and discontent in the construction
industry. If nothing else, we must listen to the call for the better integration of subject
knowledge, academic skills and practical skills’ training in the design and development
of the QS undergraduate education system.
2.3 RICS QS competency requirements
The construction industry is one of the most valuable sectors contributing to the wealth
and prosperity of a nation (Yogeshwaran, Perera & Ariyachandra, 2018). The activities
28
of this vast industry help to build facilities and maintain infrastructure which are
considered to be the pillars and bedrock of developed nations. A successful and
invigorated construction industry is also capable of delivering the much-needed changes
in the built environment of emerging and developing countries; hence, the importance of
BE education to the economic growth and development of a country. Participants in the
construction industry are wide-ranging and they include, among others, architects,
planners, surveyors, engineers, managers, and archaeologists. Together, they help to
deliver a responsible and healthy built environment fit for the future (Crafford &
Smallwood, 2007). These disciplines and areas of practice inform the development of
AEC/BE courses at both undergraduate and postgraduate levels in higher education, for
example, Urban and Regional Planning, Architecture, Building Technology, Land
Surveying, QS, Civil Engineering, Construction and Project Management, etc.
QS is a profession that is well established in the UK and in certain British Commonwealth
developed countries (such as Australia and New Zealand) and developing countries (such
as Sri Lanka, Malaysia and Nigeria etc.). As Nkado and Meyer (2001) put it, a quantity
surveyor is part of the BE disciplines and an important member of the construction
industry globally, involved as a consultant in a private practice (often termed a PQS) or
as the commercial expert with a contracting organisation (often termed the CQS). They
can be seen working, either as cost engineers, construction economists or cost managers
(Male, 1990), in the real estate, heavy engineering and infrastructure sectors.
To be competent as a professional quantity surveyor is to have the skill sets and ability
to manage the overall cost of a project or facility from cradle to grave, that is, whole life.
Such competencies may include their involvement in development appraisals and
feasibility studies, procurement and tendering, cost planning, control and commercial
management as well as other duties (such as dispute resolution, value engineering, risk
and facility management among others) (Crafford & Smallwood, 2007; Owusu-Manu,
Edwards, Holt & Prince, 2014; Shafie, Syed Khuzzan & Mohyin, 2014; Yogeshwaran et
al., 2018). In addition, a professional quantity surveyor’s expertise is often valued during
the capital expenditure (CAPEX) phase, the operational expenditure (OPEX) phase and
even during the demolition phase of a development (RICS, 2018a).
29
The skills, knowledge and experience required of a qualified surveyor are defined by the
RICS. To enter the QS profession (which requires the successful completion of the
assessment of professional competence (i.e. APC)), candidates must be competent to
practice and to achieve a set of requirements in relevant technical and professional
practice, management, business and interpersonal skills (RICS, 2018b). Whilst some of
these required competencies are generic in nature and apply to several fields of practice
in the built environment and beyond, the technical competencies are QS and construction
focussed. These competencies, which form the basis of QS education and training in HE,
are achieved through a mix of academic knowledge, professional practice and relevant
experience.
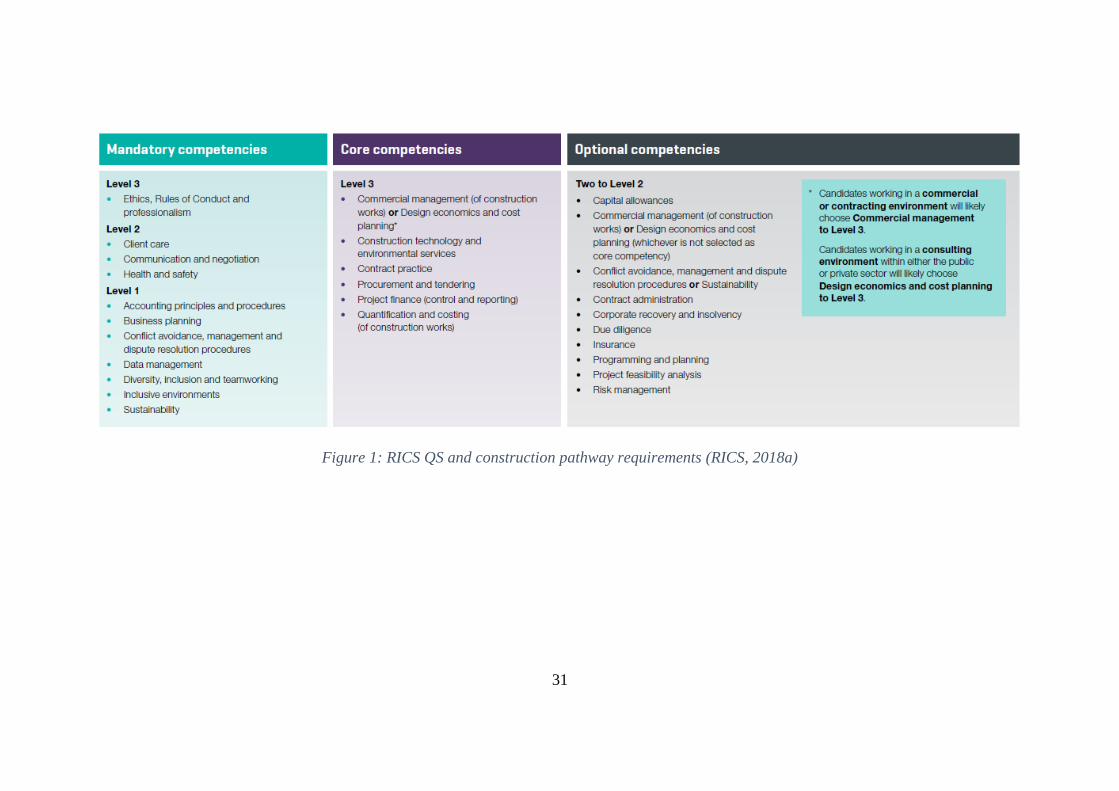
RICS (2018a)’s pathway guide for QS and construction presents the competencies
required for this area of practice, in order to qualify through the pathway. The guide also
sets out in detail examples of the plausible experience, skills and knowledge required by
an APC candidate to demonstrate the competencies. These competencies have been
grouped into three different categories, and the three levels of attainment of each
competency, as defined by RICS (2018b), are thus:
o Level 1 is having knowledge and understanding;
o Level 2 is the application of the knowledge gained;
o Level 3 is the ability to give reasoned advice and implement synthesised and in-
depth technical knowledge.
The three categories of competencies (RICS, 2018b) are:
o Mandatory competencies such as generic interpersonal, personal, business and
professional practice skills;
o The technical core such as the main “QS and construction” skills;
o Technical options which include some other designated skills relevant to QS
practice (e.g. sustainability, risk management, programming and planning).
Figure 1 provides a summary of the QS and construction competency requirements and
gives a snapshot of the expected level of competency achievement for an APC candidate
to become qualified as a chartered member of the RICS. Although APC can now be
completed without structured training by very experienced candidates with significant

30
(typically more than 10) years of experience working as a quantity surveyor, APC is
usually undertaken via a 24-month structured training (typically for recent QS graduates
with under five years of experience) or a via a 12-month training (for those with over
five years of experience), post qualification or graduation, which ensures candidates are
competent before sitting the final assessment. The former (the 24-month structured
training) is usually undertaken by recent graduates with a Bachelor’s degree from RICS
accredited programmes. The RICS has many sector pathways covering diverse fields of
practice which allow participants to specialise and become qualified. But the “QS and
construction” pathway is the most aligned in terms of reflecting the knowledge, skills
and experience gained through QS education and training.
31
Figure 1: RICS QS and construction pathway requirements (RICS, 2018a)
32
Yet, the findings of several studies (Nkado & Meyer, 2001; Perera & Pearson, 2011;
Shafie et al., 2014; Shayan, Kim, Ma, Freda & Liu, 2019) from around the world,
including the UK, reveal a “competency gap” in the skills of graduate quantity surveyors
produced by these academic institutions which carry an RICS Accreditation. Likewise
reports exist that discuss the mismatch between the actual, expected and perceived level
of achievement of competencies by graduate quantity surveyors, based on the views from
employers, academics and the graduate themselves (Crafford & Smallwood, 2007;
Hassan, Ismail, Zaini, Hassan & Maisham, 2011; Yogeshwaran et al., 2018). In the study
by Shafie et al. (2014), the competency gap is between the skills’ performance of QS
graduates and the expectations of their employers. In this study the QS graduates
produced by Malaysian HEIs are considered by employers to be particularly lacking in
generic mandatory competencies such as personal and interpersonal skills.
In their widely cited study on professional QS competencies, conducted in South Africa,
Nkado and Meyer (2001) reported a significant gap between practitioners’ current
attainment levels and the desired proficiency levels in the identified competencies. The
study which produced a damning self-appraisal of practitioner proficiency levels
concluded, based on the findings, that the present QS education and training system in
South Africa is not capable of producing graduates that can satisfy current employers’
wants and future industry needs. A similar study by Yogeshwaran et al. (2018) in Sri
Lanka exposed the deficiency of QS education there and how it does not live up to
expectations in terms of graduate competency attainments. This study identified a
mismatch between QS graduate competencies and industry expectations. Whilst a few
competencies were achieved at levels above industry expectations, the proficiency levels
for most competencies were below industry needs.
In a recent comprehensive study which examined the emerging challenges and the future
role of quantity surveyors, Shayan et al. (2019) asserted that competencies in
sustainability and BIM are of paramount importance. An earlier, but also recent, study
on the industry’s competency expectations of QS graduates by Yogeshwaran et al. (2018)
affirmed the same point, and asked for these competencies to be given utmost priority in
curriculum development. This is because, nowadays, the adoption of BIM and
sustainability can be pointed out as the two most important factors in the construction
industry worldwide. Yogeshwaran et al. (2018) maintained that the quantity surveyors
33
of the twenty-first century must possess specialist knowledge and the ability to advise on
sustainability issues regarding development and construction, and on BIM for cost
management. The above study which involved participants from regulatory professional
bodies like RICS, the Australian Institute of Quantity Surveyors (AIQS) and the Pacific
Association of Quantity Surveyors (PAQS), amongst others, provided useful insights into
challenges and the competencies required for quantity surveyors to cope in the
competitive, modern construction industry.
Unlike the QS competency requirements expected by RICS (2018a) and RICS (2018b),
which only have a subtle emphasis on (and references to) an advisory ability on
sustainability and BIM (under generic competencies), Yogeshwaran et al. (2018) and
Shayan et al. (2019) disclosed that these two specialist knowledge areas (dubbed as future
competencies in keeping with the global trend) should be treated as technical core and
primary QS skills. Essentially, further knowledge and experience in these subjects are
germane to meeting the future needs and demands of a dynamic, multi-disciplinary
construction industry, and the undergraduate QS curricula of HEIs must be developed to
reflect this. This is precisely why “education for sustainable development” as well as
“BIM and multi-disciplinary learning” are explored in subsequent chapters. The findings
of the publications included in this thesis would appear to mirror the above view and
reinforce the need for pedagogical diversification and continued curricula development.
The contributions that the publications submitted here have made to this debate relate to
a gap analysis in the undergraduate QS curricula of academic institutions in the UK,
which is relatively underresearched. Despite RICS guidance, HEIs in the UK still design
and deliver their QS courses differently, thus leading to graduates bringing different
levels of competencies into the workplace which confuses employers and causes
dissatisfaction. For example, in Publication 2 we learn that there is no defined and/or
agreed levels of competency attainment for QS graduates in RICS accredited institutions
in the UK. This assertion has been supported in the study by Yogeshwaran et al. (2018)
which examined the RICS accredited programmes in Sri Lanka. Both Publication 2 and
Yogeshwaran et al. (2018) agreed, at that time, that although the RICS has listed the
competencies, it has yet to define the proficiency levels that have to be achieved by
graduate quantity surveyors of accredited institutions.

34
Following on from Publication 1 which reveals tension and dissatisfaction in the
education and training of quantity surveyors as a result of a tripartite pull on QS
development needs, in Publication 2 we find a perception gap between industry and
academia, as illustrated in Figure 2. This RICS-funded study included a comprehensive
survey of nearly half of all the UK registered RICS chartered quantity surveyors working
in client, contracting and consultancy organisations in both the public and private sectors
as well as a survey of academics from all 26 HEIs which offer RICS accredited courses
in the UK. The responses from the industry experts indicated the unreasonably high
expectations that the construction industry has in terms of QS graduates achieving ‘APC
level’ proficiency in all mandatory, technical core and several optional competencies.
Contrasted with the academic responses, this shows a big gap in stakeholders’
expectations regarding the level of achievement of competencies for a new graduate. The
industry survey further indicated that employers are not reasonably satisfied with the
competencies achieved (i.e. competency attainment) by the current crop of QS graduates.
The study thus establishes, through empirical evidence, the mismatch that exists between
the importance attached to a competence and the relatively lower level of attainment, as
well as the mismatch between academic views and industry perceptions on the ranking
of importance, and the expected level of achievement, of competencies.
Figure 2: Perception gap in graduate competency (Publication 2)
On the one hand, this suggests that the industry may be ill-informed or does not
understand the role of educators in producing well-rounded graduates who require further
35
training before they become fully fledged surveyors. On the other hand, it appears that
employers, as a key stakeholder group involved in the training of QS graduates, might be
ducking their responsibilities in the highly-pressured and increasingly competitive
industry. In another observation, it could possibly be that the RICS accredited curricula
used to produce these graduates are not fit for purpose in responding to the needs and
demands of a dynamic industry in the 21st century? Or, maybe, more external
involvement in curriculum development through greater levels of collaboration between
industry and the academic community, or more prescriptive guidance from the governing
bodies could resolve the current competency requirements’ impasse? Whatever the case
might be, the perception gap has culminated in significant levels of frustration on all
sides. In view of this, and to try and answer some of the above questions, the next section
will review the process for appraising and benchmarking QS undergraduate courses in
the UK with the aim of aligning and/or integrating the views of key stakeholders.
2.4 Programme appraisal and benchmarking The validation and accreditation process in the UK requires HEIs to demonstrate how
their academic programmes, especially on vocationally focussed subjects, have achieved
the relevant competencies that support their degree awards. Programme appraisal and
benchmarking, which involves validation and/or accreditation, is, therefore, a way of
defining and determining the competency achievement of academic curricula.
Programme validation is the process by which education providers align their curricula
with internal standards and objectives or with national requirements, such as the QAA
benchmarks in the UK, whilst accreditation is a review process to gain professional body
endorsement by demonstrating that a certain course meets their academic standards.
The subject benchmark statement for ‘land, construction, real estate and surveying’ is a
document produced by the Quality Assurance Agency for Higher Education (QAA)
(QAA, 2019) in the UK and is written by subject specialists. Now in its fourth edition,
the most recent revision was published in October 2019 to cover a range of subjects, inter
alia, land surveying, planning and development, construction management, building
surveying, QS and commercial management, property and real estate. The document
provides a general guidance on the kind of study undertaken by, and academic standards
that can be expected from, graduates in the stated areas of practice (QAA, 2019). In other
36
words, they describe the knowledge, competencies/skills and understanding new
graduates should possess upon completion of their degrees. Consequently, this document
is used as a benchmark in the development, validation and periodic review of
undergraduate (i.e. BSc (Hons)) QS programmes and for the articulation of associated
learning outcomes. As pointed out by the QAA (2019), however, the benchmark is not
to be used as a national curriculum nor is it meant to prescribe specific course design and
delivery methods, thus allowing for creativity and adaptability in academic programmes.
On the downside, it might well be contributing to the existing mismatches and perception
gaps in graduate competency, as discussed previously (section 2.3).
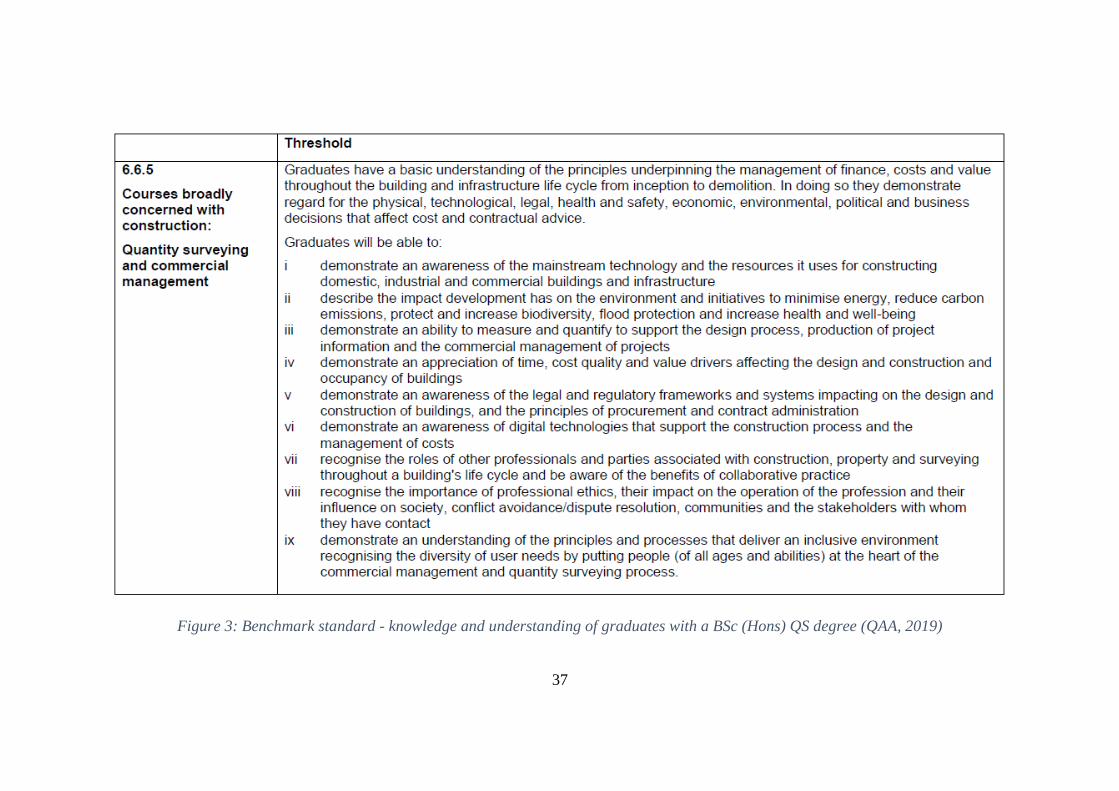
The benchmark standard in Figure 3 identifies a range of topics and knowledge
components particular to the QS subject area. Albeit with no expected levels of
attainment in competencies, graduates with a BSc (Hons) degree can achieve either a
threshold standard (basic knowledge and understanding), a typical standard (knowledge
application to a good level) or an excellent standard (high level understanding and
application). QS graduates are also expected to develop the following seven generic skills
and abilities in the course of their studies: communication; practical skills; digital
literacy; intellectual skills; interpersonal skills and teamwork; analytical and data
interpretation; self-management and professional development skills (QAA, 2019). The
level of inclusion, and the extent of coverage, of topics and generic skills/competencies
in course contents are based solely on the interpretation by the curriculum developer.
Academic institutions are, therefore, encouraged to use this QAA statement in addition
to any other applicable requirements to design, deliver and review programmes of study
to ensure their continuing currency. Such requirements include employer and industry
expectations as well as the demands of the professional, statutory and regulatory bodies
(PSRBs) such as the Chartered Institute of Building (CIOB) and RICS.
37
Figure 3: Benchmark standard - knowledge and understanding of graduates with a BSc (Hons) QS degree (QAA, 2019)
38
The CIOB is one of the aforementioned PSRBs which accredit and set expectations for
Bachelors’ degrees with honours in QS and construction. The CIOB undergraduate
education framework, which has been recently revised, is a wide-ranging document that
sets out academic standards and requirements for construction courses in general (CIOB,
2018). The framework assesses learning in the following six major areas: ethics and
professionalism; the construction environment; health, safety and welfare; construction
technology; construction management, and sustainability. It is designed to be used for
informing new, and reviewing existing, academic provisions in the built environment to
maintain relevance, and for the purposes of gaining professional accreditation. As this is
mainly a reference document, the framework provides guidance on learning outcomes
rather than being a prescriptive syllabus.
Following the findings published in Publication 3 and the work of other proponents in
the field (Nkado & Meyer, 2001; Perera & Pearson, 2011; Yogeshwaran et al., 2018) on
the lack of a defined graduate level of achievement in competencies, the CIOB, as well
as the RICS, subsequently conducted a review of its accreditation policy and process and
introduced some form of minimum threshold requirements for undergraduate studies. In
the case of CIOB, this is reflected in the latest education framework for UG programmes
(CIOB, 2018). Although this was considered a major change, the threshold learning
outcomes under each key theme are broad and not consistently or clearly defined in terms
of graduate competency levels. As a matter of fact, the threshold learning outcomes can
be treated as expectations rather than absolute requirements that must be met (i.e. the
skills and abilities that new graduates of such accredited degree programmes should
possess). Of course, having (rather woolly) minimum threshold requirements is a step in
the right direction and better than nothing. It helps academic providers achieve greater
autonomy in programme design at best, but it does little to address the specific needs of
the industry and employers’ expectations as regards graduate competency achievements.
As the body primarily responsible for regulating the surveying profession, the RICS is,
arguably, the most relevant PSRB which accredits Bachelor’s with honours QS degree
courses in the UK. It has the most influence on QS education globally. RICS accredited
courses satisfy the educational requirements en route to a professional qualification and
career in surveying. However, it remains contentious as to whether they fulfil the
aspirations of the industry in terms of these courses producing competent QS graduates.
39
To gain accreditation, the mapping of a course to a certain RICS pathway such as QS is
an important and a necessary criterion. The findings in Publications 1, 2 and 3 from the
two RICS-funded research projects influenced the recently published RICS global policy
in this regard. They provided the impetus for RICS to define, in a way, the competency
levels for graduates of accredited institutions. Academic institutions seeking
accreditation are now required to show how their course meets the Level 1 competencies
in the chosen field (RICS, 2019). Whilst this is a welcome development (in addition to
being a positive impact and a useful contribution by the body of work submitted),
emphasis is still on the coverage of competencies rather than levels of attainment, which
is the bone of contention, causing a gap in expectations.
It is worth pointing out that HEIs can still gain accreditation without meeting the defined
competency requirements if they can provide adequate justification. Although Level 1 is
the minimum threshold requirement set by the RICS, programmes can equally be
designed to develop graduate competencies at Levels 2 and 3 which, therefore, explains
the huge variability in the different RICS accredited courses as reported in Publication 1
and which is summarised in Figure 4 from supplementary Publication S1. As a vocational
subject, however, employers expect new QS graduates to perform at Level 2 (and/or even
Level 3) in several of the mandatory, core and optional competencies, as revealed in
Publication 2; hence, the mismatch between the professional body requirements and the
industry expectations of graduate competencies. With the education providers having to
steer a, sometimes, difficult path, much of the time is spent moving ‘from pillar to post’
in an attempt to obtain equilibrium and produce highly employable and fulfilled
graduates.
As shown in the supplementary report Publication S2, these concerns are shared by the
participants of the CHOBE QS workshop IX which was held at Birmingham City
University in 2012 and was attended by students, academics and industry experts. The
consequent report analysed the delegates’ views on how to educate quantity surveyors to
meet future needs. But several inconsistencies were found in the views of the respondents
with respect to: the role of professional bodies in setting course contents; the focus of
HEIs (be it education rather than training); the extent to which degree programmes should
allow for training, and even if QS programmes should include a compulsory placement
module to this end.

40
Figure 4: Competency benchmark interpretation and the need for a defined graduate
competency level (Publication S1)
Clearly, prescriptive benchmarks and requirements from the PSRBs will not help in the
quest for innovation and the need for a flexible and adaptive curriculum capable of
responding to the needs of a dynamic industry and global trends. However, close
alignment with the industry such as greater collaboration, specifically, between
construction employers and professional bodies is required to negotiate and agree on
undergraduate course curricula contents. This will help to manage industry and
practitioner expectations of graduate competency levels. In other words, it can help to
produce new graduates with the desired competencies and at the right levels.
To this end, a future emphasis should be on closing the professional body-industry-
academia gap. To date, much effort and research has been directed towards industry and
higher education integration, but what we learn from this body of work is that there is a
growing need to bridge the gap between what the professional bodies require from an
undergraduate curriculum and what the industry wants from its graduates. Paying more
attention to this can, subsequently, help to close the industry-academia gap and to resolve
the mismatch between the aspirations of the three key stakeholders, culminating in highly
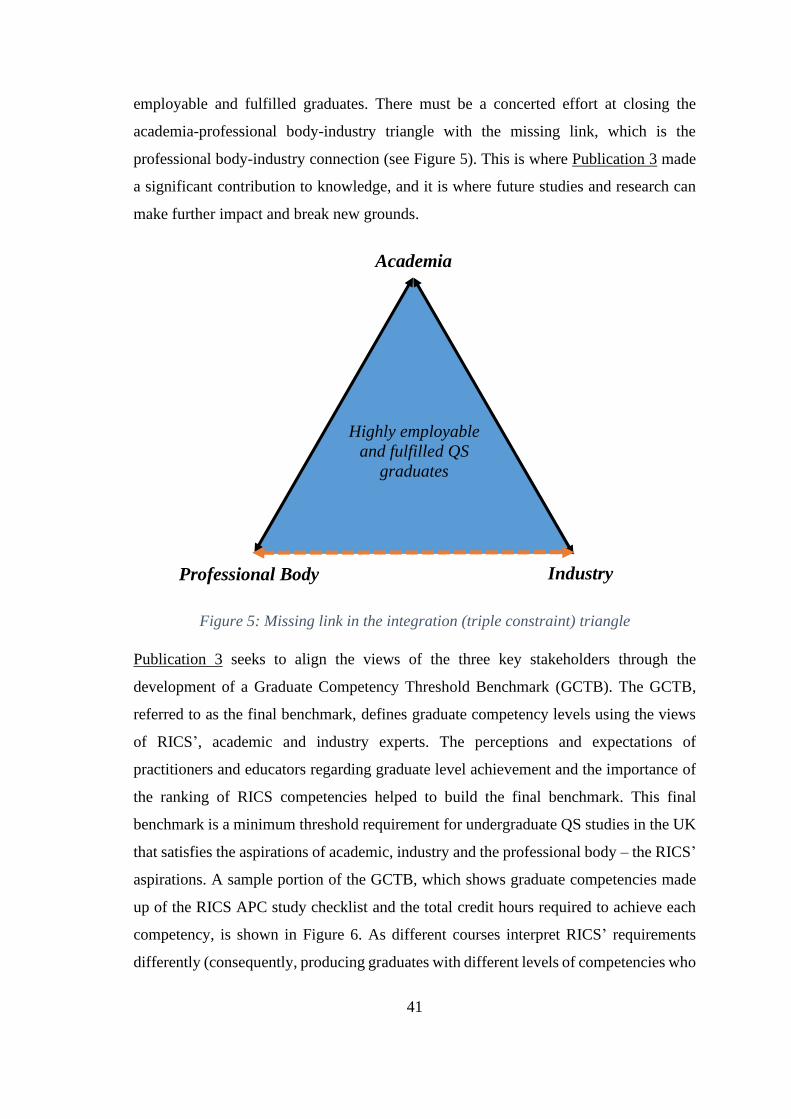
41
employable and fulfilled graduates. There must be a concerted effort at closing the
academia-professional body-industry triangle with the missing link, which is the
professional body-industry connection (see Figure 5). This is where Publication 3 made
a significant contribution to knowledge, and it is where future studies and research can
make further impact and break new grounds.
Figure 5: Missing link in the integration (triple constraint) triangle
Publication 3 seeks to align the views of the three key stakeholders through the
development of a Graduate Competency Threshold Benchmark (GCTB). The GCTB,
referred to as the final benchmark, defines graduate competency levels using the views
of RICS’, academic and industry experts. The perceptions and expectations of
practitioners and educators regarding graduate level achievement and the importance of
the ranking of RICS competencies helped to build the final benchmark. This final
benchmark is a minimum threshold requirement for undergraduate QS studies in the UK
that satisfies the aspirations of academic, industry and the professional body – the RICS’
aspirations. A sample portion of the GCTB, which shows graduate competencies made
up of the RICS APC study checklist and the total credit hours required to achieve each
competency, is shown in Figure 6. As different courses interpret RICS’ requirements
differently (consequently, producing graduates with different levels of competencies who
Highly employable
and fulfilled QS
graduates
Industry
Academia
Professional Body

42
the industry sees as not meeting expectations), the results of Publication 3 also included
a Competency Mapping Framework (CMF). The framework gives fresh perspectives on
how construction courses map against competencies and provides a system for
programme appraisal and evaluation. This framework has been used at Northumbria
University to modernise its QS undergraduate provision and also for the periodic
programme review of the QS programme to determine its academic health and ensure its
continuing currency and industry-relevance. The positive impact the framework is having
is reflected in the graduate employability score for this course and in the students’ overall
satisfaction with the course year-on-year.
Figure 6: Sample portion of the final benchmark (Publication 3)
43
2.5 Summary There is sharp contrast between the more traditional forms of education, such as teaching
for the sake of knowledge accumulation, and CBE which teaches students the ability to
apply knowledge in practice. CBE has its root in developing technical skills and
professional competencies (i.e. training for practice) in the chosen field. However, the
desire to include cross-cutting skills continues to reinforce the need for the deep
understanding and knowledge that higher education provides and/or offers. Undoubtedly,
it is increasingly clear that a better connectivity of employers’ wants with higher
education offerings will result in the successful provision of CBE. It is on this basis,
paired with a constructivist notion of CBE, that students should be given the chance to
develop their competencies in a professional environment like that of their future
workplace. Training is often the missing piece of the puzzle in academic pursuit, so
“education” and “training” should not be “mutually exclusive” but rather complimentary,
especially in vocationally focussed subjects such as QS.
One of the most important conclusions that can, therefore, be drawn from the above
review is that training should be part of what a stellar education provides but it is not
everything. Better still, marrying the positive aspects of both education and training
should be considered a step in the right direction in curriculum design and development.
The main conclusion here is that there is a need for improvement in the education and
training of future quantity surveyors, expediently. QS-related sustainability and BIM
education should be included in undergraduate courses in addition to achieving the right
mix of academic knowledge, and experiential and cross-cutting skills. A construction
sector-wide effort to boost the current and future competency attainment levels will not
go amiss.
The principal conclusion of the publications submitted in this thesis is the assertion that
there is dissatisfaction in the industry with the competency attainments of graduate
quantity surveyors due to the absence of a defined threshold benchmark. Whilst there is
now some clarity from the relevant PSRBs, the benefits are yet to be seen and/or
recorded. The recent changes to the accreditation documents could be a timely
intervention if appropriately applied and well received by both graduate employers and
HEIs alike, but it is more important for major stakeholders (especially PSRBs and
practitioners) to come together to mutually agree on the perceived and expected
44
competency levels for graduate quantity surveyors. Future research may be needed on
how to approach, and foster, this much needed collaboration and alignment of views.
The CMF, which includes the GCTB, developed in the body of work presented is a major
step to this end and one of the key contributions to knowledge. The GCTB can help to
connect QS graduate competencies better with industry needs and employers’
expectations. The claim that the CMF can be used in autonomous programme design,
appraisal and evaluation as well as for improving the outcomes of construction courses
whilst allowing for flexibility to accommodate global trends and future needs remains a
conclusion of this thesis. It is also an area by which the submitted body of work attempts
to make a valuable contribution to knowledge.
45
Chapter 3: Education for Sustainable Development
3.1 Introduction A broad definition of sustainable development (SD) is given in the widely cited report
by Brundtland and WCED (1987) which states that it is development that meets both the
present and future generation needs in an uncompromising measure and an unselfish
manner. According to Spence and Mulligan (1995), this is a tough ask based on the
rapidly depleting natural (both biological and mineral) resources in addition to the
alarming build-up of greenhouse gases causing climate change, infertile soil and famine,
the loss of biodiversity and degradation, and also due to the threat to the global ecosystem
and even human existence and security. It is on this premise that we must practically
examine the different human activities responsible for the current unsustainable path of
the global economy. The construction industry has been identified as a major contributor
to environmental stress and strain (Sev, 2009; Celik, 2013).
To prevent the breaking point being reached and to avoid the impending prophecies of
doom and the ugly scenes of disaster in all its forms, the construction industry as one of
the largest global emitters and producers of pollutants at all levels must act. The activities
of this industry and its supply chain (which shape our world and have a lasting effect on
the natural habitat) use both renewable and non-renewable capital (i.e. natural and
manmade) resources. The construction industry is, therefore, a major exploiter and heavy
user of the world’s scarce resources which include minerals and energy sources.
If we accept the above evidence, however controversial this may be, then there are
significant implications for the built environment at large and for QS education which is
the focus of this thesis. As such, the focus of this chapter is on: the importance, and likely
challenges, of embedding sustainability in the built environment and of greening the
academic curricula; the knowledge areas relevant to the QS profession in the light of its
current and future role as informed by the sustainability agenda, and the extent of
coverage of (including stakeholders’ perspectives on) sustainability education within the
BE undergraduate programme curricula.
46
3.2 Greening the BE curricula: importance and challenges Used interchangeably and intimately connected, “education for sustainability” (EfS),
“education for sustainable development” (EfSD), and “greening the curricula” are
phrases that have been bandied around in recent times (Cotgrave & Alkhaddar, 2006;
Forrant & Silka, 2006; Paraschivescu & Botez, 2011; Altomonte, Rutherford & Wilson,
2014; Thakran, 2015). As Publication 6 recently pointed out, although the period between
2005 and 2014 was the United Nations Decade of EfSD, there is still a growing need for
sustainability literacy in the BE, and curriculum greening must proceed as quickly as
possible. The importance and benefits of intensifying education on sustainability
concepts (especially in developing knowledge areas relevant to construction
professionals to improve their understanding of SD and how to achieve this in the built
environment) are well documented in the literature (Spence & Mulligan, 1995;
Paraschivescu & Botez, 2011).
The construction sector has a major role to play in achieving the sustainable development
agenda which, therefore, reinforces the need for developing the sustainability skills,
knowledge and understanding of BE professionals. Greening the curricula of their formal
education is vital to this end. In fact, the findings from Cotgrave and Alkhaddar (2006)
show, unequivocally, that UG construction programmes need to produce graduates with
a high level of sustainability literacy. In a nut shell, EfSD or EfS is a process of learning
that involves taking a long-term positive view of the ecosystem, social welfare and
economic prosperity of the earth (Paraschivescu & Botez, 2011; Thakran, 2015).
Curriculum greening is a means to an end, a way to embed or integrate SD concepts and
principles into education.
Indeed, education is vital in changing attitudes which, in turn, help to shape human
behaviour. As reported in Cotgrave and Alkhaddar (2006) and reiterated in Thakran
(2015), the importance of education on sustainability is rooted in the need to change
attitudes and halt the prevalent irresponsible behaviour that is the leading cause of most
of the environmental problems we have today. This notion clearly aligns with the
preliminary context provided in the Brundtland Report (Brundtland & WCED, 1987) that
maintained that mankind can make development sustainable only if we are determined
to do so. In other words, sustainable development is achievable with the right behaviour
which reflects our viewpoint as influenced by EfS. Publication 6 considers this as a battle
47
that will be won not in the field, but through education in the classrooms of academic
institutions. This is necessary if any concomitant government initiatives and policies are
to have any real impact and direct bearing on unsustainable practices, attitudes and
behaviours.
Greening the curricula is thus a philosophical term that has been coined to achieve EfS
and to ensure that academic programmes are churning out graduates, future practitioners
and policymakers with the capability to preserve ecology. This involves education and
training on sustainability concepts and practices to create awareness and to develop the
necessary skills and competencies in new graduates (Forrant & Silka, 2006). The
approaches to EfS, as Thakran (2015) puts it, must take into account the world’s well-
being from a local vantage point and should demonstrate how indigenous cultures and
disciplines can contribute, in their own way, to the common cause and greater good. In
the case of construction, sustainability-literate professionals can create a more
sustainable built environment i.e. buildings and facilities with reduced environmental
impact that do not cost the earth nor exhaust the world’s limited resources; a built
environment that complements and rejuvenates, rather than damages or diminishes, the
natural environment.
Despite the above and the promise of EfSD, there are several barriers preventing the
appropriate inclusion of environmental contents in programme curricula (Forrant &
Silka, 2006; Altomonte et al., 2014). The common barriers to the inclusion of
sustainability within professionally accredited construction related courses in the UK, as
revealed by Cotgrave and Alkhaddar (2006), are:
• the structure and funding of academic institutions do not incentivise change and
sustainable practices;
• academic resistance to changes in the curriculum especially beyond their core
area of expertise;
• lack of time and interest from academic staff;
• inadequate guidance from subject benchmarks and professional body
requirements;
• student attitudes, and
• the perceived importance of SD by practitioners.
48
Although, McFarlane and Ogazon (2011) and Abu-Hola and Tareef (2009) see the lack
of an agreed definition for SD in the literature as a principal challenge to curriculum
greening because it leads to different interpretations and fragmented practices, the other
barriers discovered by these authors reinforce the findings from previous research.
There is some resonance here with the findings of Publication 6 which identified some
further challenges to a sustainability-literate construction curriculum as:
• the teaching, learning and assessment approach;
• time constrictions;
• the supposed lack of expertise on the part of construction practitioners and
educators including quantity surveyors;
• the lack of a cogent strategy at university level (and from the industry);
• fragmentation and the gap between industry and academia;
• the funding structure and organisation of UK universities;
• staff attitudes, and indifferent behaviour.
So, whilst we can be united in advocating for the diffusion of sustainability principles
and concepts into QS degree programmes and, more generally, into the BE curricula
because of the accruing benefits, its enactment within the education process is not
straightforward. Although some progress has been made in addressing some of these
barriers such as, inter alia, defining the knowledge areas relevant to the QS profession
as well as sustainability mapping to the construction curriculum using stakeholders’
views, as explored in the later sections, more still needs to be done.
3.3 Knowledge areas relevant to the QS Profession This section explores the sustainability knowledge areas and the key themes that should
be embedded into a QS undergraduate curriculum, namely a programme designed with
the aim of producing sustainability-literate graduates who are competent and capable of
meeting current employer expectations and future industry needs. If we are to accept the
findings of both the study carried out by Shayan et al. (2019) and the review conducted
above, a most critical challenge for future QS graduates is to intensify their holistic
sustainability knowledge in relation to construction. As pointed out earlier in the previous
chapter, the ability to advise on sustainability is now perceived to be in the top two of the

49
required demands and vital in the emerging role of QS graduates in the 21st century; the
second one being the ability to use BIM for current QS practice, as explored in the next
chapter.
The sustainability-related contents in programme curricula, and the levels at which they
are taught, differ considerably from one university to another (Bhattacharjee, Ghosh,
Jones & Rusk, 2012). It was reported in Forrant and Silka (2006) and in Xia, Rosly, Wu,
Bridge and Pienaar (2016) that no two academic institutions provide the same
sustainability education, on the one hand, due to the intricacy involved and the lack of
specific guidance. On the other hand, the research culture of universities’ academic staff
was perceived as the reason for the variance in the sustainability-related contents in
architecture education (Edwards, 2004).
Also, compared with other BE programmes (such as building surveying, construction
management and the like) it was discovered that QS students have a lower level of the
understanding of sustainability concepts despite their crucial role in delivering SD (Xia
et al., 2016). In some cases, studies that examined the sustainability contents of BE
courses focused on the traditional disciplinary compartments within economic, social
and/or environmental aspects. Indeed, there are different interpretations of sustainability
concepts with no clear agreement as to what sustainability knowledge in construction
programmes should entail (Bhattacharjee et al., 2012). This is exacerbated by the mixed
messages coming from the industry and professional bodies alike (Blewitt & Cullingford,
2004; Forrant & Silka, 2006).
Whilst there is now a multitude of research in EfSD in the built environment, there is
limited study, with the exception of Xia et al. (2016), on investigating sustainable
construction knowledge attributes and requirements for undergraduate QS courses. Even,
the aforementioned study only investigated the sustainability attributes of a single
undergraduate QS course in Australia. It was never the intention in that study to explore
the sustainability contents and topics that should form an integral part of every future-
oriented QS curriculum. The guides and standards from PSRBs are not much use either
in terms of the specifics to be covered. Previous studies have typically suggested, from
the data analysed, that sustainability-related contents’ coverage in professionally
accredited QS courses is actually very low (Perera & Pearson, 2011; Xia et al., 2016).
50
More worrying, studies that define specific knowledge areas using high level (key
themes) and low level (topics/contents list) classifications for the purpose of
benchmarking and setting sustainability learning outcomes/objectives in QS curricula are
difficult to come by, if not rare. For example, Bhattacharjee et al. (2012) only provided
a bird’s eye view of the sustainability contents in construction programmes offered by
the Associated Schools of Construction (ASC) member universities in the United States.
Earlier, Cotgrave and Alkhaddar (2006) conducted a similar study but for the CIOB
accredited construction management programmes in the UK. Cotgrave and Alkhaddar
came to a similar conclusion that the broad approach to curriculum greening means there
is no discipline-specific model that could serve as best practice for educating the current
and future environmentally-literate professionals that the industry requires. In an
explorative study of construction management programmes in the UK and Australia,
Cotgrave and Kokkarinen (2010) could only develop an abstract model which shows
recommended reflective activities in sustainable construction curriculum design. The
process-orientated model is just a set of principles to help with sustainability
considerations when designing a construction curriculum; it is not proposed as a
sustainability framework which identifies knowledge areas relevant to construction.
This is where Publication 4 contributes to the existing literature, through the development
of a QS-specific sustainability framework as shown in Figure 7. An exploratory case
study approach was used to develop the framework which included a number of RICS
accredited QS courses in the UK and contacting key academics from these institutions,
selected based on geographical location. Although, the development process for the
framework was delimitated by some constraints, the identified knowledge requirements
can be used to map the sustainability contents in a QS curriculum. Additionally, the
framework can be used to develop new programmes capable of producing the
sustainability-literate quantity surveyors of the future, and also for the sustainability
alignment and the benchmarking of existing programmes. The framework was influenced
by the sustainability agenda, the future challenges for the QS profession, and global
trends. So therefore, its application in curriculum development should produce
responsible graduates that meet current industry expectations and the emerging role for
professional quantity surveyors in the new world of work focussed on achieving SD.
51
What the framework does not explain, however, is the level of proficiency required in
each of the identified themes and topics. Future research should incorporate industry
views on the framework and align academic perceptions with that of the industry
regarding graduate level attainments. Suffice it to say that sustainability is a global
phenomenon that requires international and local measures. Further study, in keeping
with the global trends (particularly with regard to the policies and regulations endorsed
to promote SD) will be required to extend the application of the framework in QS
curricula outside the scope of study or post any Brexit effects in the UK. Nevertheless,
the developed sustainability framework can, at least, serve as a springboard in any future
studies or academic-industry negotiations aimed at reaching a consensus on QS
curriculum greening. It can also be used in curriculum development/revision for
sustainability mapping in QS undergraduate education. Further studies will overcome the
limitations of the body of work presented and should trigger conversations about the
general applicability of the framework.
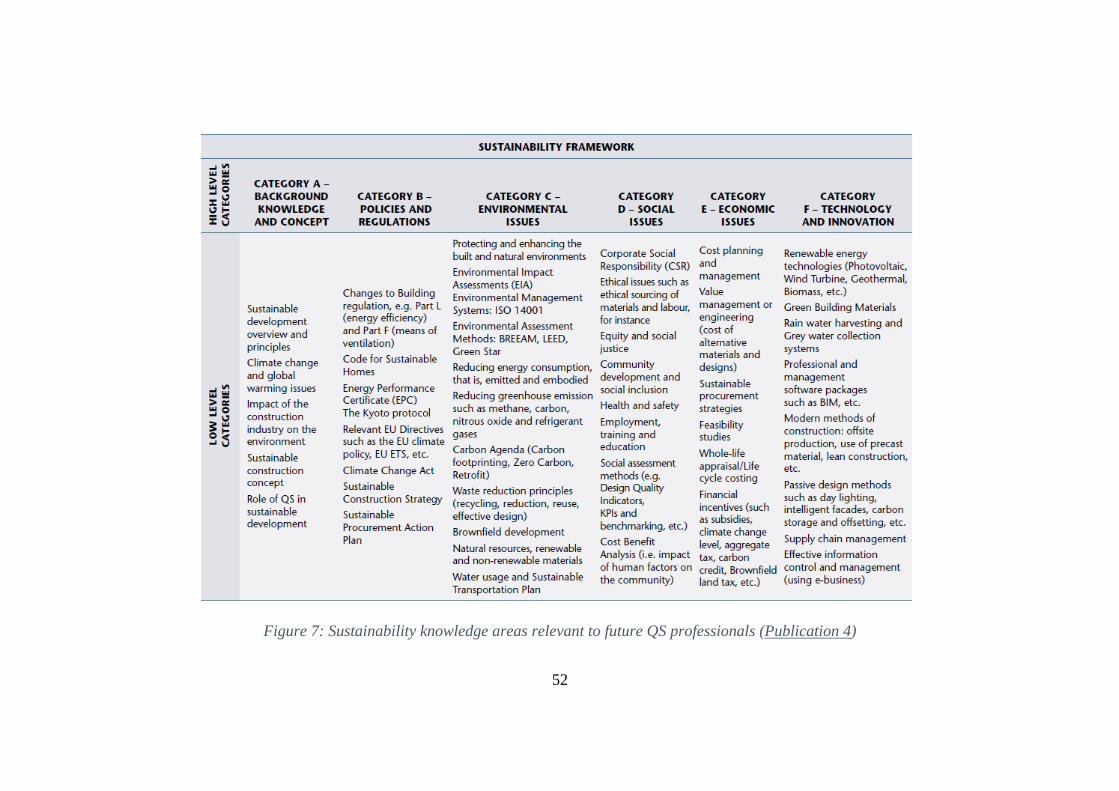
52
Figure 7: Sustainability knowledge areas relevant to future QS professionals (Publication 4)
53
3.4 Sustainability mapping within the curriculum: stakeholder perspectives This section examines academic and industry views with respect to the extent of the
coverage of sustainability education in undergraduate degree programmes in order to
understand the real picture. As the management thinker, Peter Drucker, once said, “If you
can't measure it, you can't improve it” (Drucker, 2002). The findings of the publications
submitted are also explored in this regard. Despite the increasing global awareness and
perceived importance of EfSD, a comprehensive survey of various construction
stakeholders and BE practitioners shows that existing degree programmes are mostly
inadequate and that there is much scope for improving their sustainability contents
(Altomonte et al., 2014). As revealed in this European Commission funded project
carried out by Altomonte et al. and conducted in some 40 different countries worldwide
and involving BE accreditation bodies, the practitioners questioned believe that there is
a sustainability skill gap with regard to both new graduates just entering the markets and
seasoned professionals, and these practitioners think curriculum greening is the solution
to the problem.
Other studies (Forrant & Silka, 2006; Bhattacharjee et al., 2012) that examined the views
of academic stakeholders on sustainability mapping within AEC education agree broadly
with this view from industry. For example, a recent study conducted by Trad (2019)
shows a low level of sustainability integration (about 7.7%) within undergraduate
programme curricula at an Australian university. The stated percentage is the average
score of sustainability integration across its suites of construction-related programmes.
Altomonte et al. (2014), Bhattacharjee et al. (2012), McFarlane and Ogazon (2011), Abu-
Hola and Tareef (2009), and Forrant and Silka (2006) also reported unsatisfactory levels
of coverage and/or a misalignment of sustainability contents in the AEC programmes
they examined. Even though the analyses of the data in these studies suggest that there is
inadequate coverage of sustainability in most programme curricula, it is not clear from
these studies what the acceptable level should be, and a reasonable conclusion cannot be
reached because there is no basis for comparison.
To help fill this gap, Publication 4 investigated the coverage of sustainability in RICS
accredited QS degree programmes in four UK universities using the framework
developed earlier. The results show notable differences in the extent of sustainability

54
education among the four case studies, with more prominent variations observed at the
category level. Drilling down into the results, the programmes that fared better in certain
knowledge areas had more research active staff/better organisational structure. This
confirms previous research presented in section 3.2 above that there is some synergy
between university culture/staff expertise and curriculum greening. For example, a
research-intensive university will develop more research active staff who have up-to-date
knowledge and thus feel more confident to teach contemporary topics in, say, technology
and innovation. If we link this back to the education versus training debate in chapter
two, the essence of universities as a strenuous protagonist of deep academic inquiry is
brought to the fore. Still, this does not undermine the value of experiential training in the
goal of achieving CBE. A typical example would be the industry expectation for new QS
graduates to be proficient in the use of BIM for cost management, as highlighted in
chapter two and discussed in the penultimate chapter.
The construction sector is a major driver of the economy but can also be a main antagonist
of the ecosystem by being a major polluter and a heavy user of the world’s natural and
manmade resources. As an integral part of the construction sector, professional quantity
surveyors have a key role to play in achieving SD and in delivering a sustainable future.
It is also important to know the extent of sustainability coverage in undergraduate
education from the perspective of QS students who are the future workforce and future
major industry stakeholders. As previously pointed out, one of the main barriers to
achieving sustainable construction and a sustainable future is irresponsible behaviour
influenced by negative attitudes (towards SD) which can be corrected through EfS. It is
against this backdrop that exploring student perception on their level of knowledge and
on the perceived importance of sustainability concepts and issues becomes critical. This
is important to see how well the curriculum is performing in training sustainability-
minded and literate future professionals.
A study by Boca and Saraçlı (2019) examined the perception, attitude and environmental
behaviour of engineering and management students at a university in a south eastern
European country, and found a positive relationship between these three variables.
Another study carried out by Cotgrave and Kokkarinen (2011) tested a previously
developed theoretical model at a UK university to see if it improved students’
sustainability knowledge, skills and attitudes. They concluded that the process-orientated
55
model, a set of recommended reflective activities, produced a positive and significant
change in students’ attitudes towards SD. Additionally, both an attitudinal survey from
an Australasian study led by Holdsworth and Sandri (2014) and an opinion survey from
a multi-national study fronted by Boarin, Martinez-Molina and Juan-Ferruses (2020)
yielded similar results.
The focus of Publication 5 is to identify knowledge gaps by establishing students’
knowledge levels and comparing them with the perceived importance of the
sustainability categories in the framework developed in Publication 4. An analysis of the
results shows that students place a high importance on sustainability education even
though their knowledge levels were found to be low across all categories. This was most
noticeable in the policies and regulations’ category where the gap was large. If our
students, the so-called future professionals, feel this way then it is understandable as to
why the current practitioners in the industry survey referred to above believe there is a
sustainability skill gap and the need for more education in this area.
Of course, education can influence the attitudes of the future workforce which, in turn,
might help to change behaviour over time. As ‘learning’ is a better barometer of
understanding rather than ‘what is being taught’, identifying students’ knowledge gaps
and where they lack confidence can help to better green the curriculum. But the real
litmus test must be whether sustainability education can change attitude from ‘knowing’
to ‘wanting to care and do something about preserving ecology’.
In concluding this chapter, it should be noted that Publications 4, 5 and 6 argue strongly
for the alignment of QS education with the sustainability needs of the industry to help
satisfy employers’ requirements and they have provided the impetus for updating QS
undergraduate courses at various UK universities; for example, the integration of
embodied carbon counting aspects in the quantification and costing module at both
Northumbria University and the University of Salford. Additionally, Publication 4 has
produced a framework that can be used for educating sustainability-literate QS
professionals who can, upon graduation, contribute to the effective delivery of SD in the
construction sector and society at large.
56
3.5 Summary Changing the attitudes of new graduates, who are the future custodians of the global
ecosystem, through education on sustainability is crucial. Sustainability-literate BE
professionals (such as quantity surveyors) can contribute a great deal to achieving SD in
the construction sector and beyond. The principal contribution of the publications
submitted in this thesis is that they reveal that there is no formal mapping process or a
set threshold standard for integrating a reasonable level of education on sustainability
into undergraduate construction curricula. In addition, a lack of a common
definition/common agreement on what SD should entail is causing different
interpretations by HEIs and is hindering the development of structured QS curricula.
The identified knowledge areas relevant to the QS profession identified in the
publications, which is one of the key contributions to knowledge, provide a set of well-
structured concepts that can be used for modelling sustainable curricula. They can form
an integral part of every future-oriented QS course. However, further research is required
to sample industry’s perceptions on the high- and low-level themes in the “framework”.
This is necessary to ascertain both the industry requirements and the employers’
expectations from new graduates through the ranking of importance of the identified
sustainability themes in the framework.
Reflecting on the common issues in Publications 4, 5 and 6, a sustainability threshold
benchmark like the GCTB in chapter 2 is suggested for the further integration of
sustainability literacy into BE education and to redress the skill gap in practice. A
minimum standard which aligns professional, academic and industry views and allows
for innovation can produce competent graduates with the required level of knowledge
and skills in sustainability. This assertion remains a conclusion of this thesis.
57
Chapter 4: BIM and Multi-disciplinary Education
4.1 Introduction The benefits of BIM are widely recognised and well documented in the literature but its
uptake in the multi-disciplinary construction industry is not as prominent as it could be.
BIM is an acronym for building information modelling, sometimes referred to as building
information management in some quarters. It can be argued that the core concept of
“BIM” is synergetic to “sustainability”, which is discussed in the previous chapter. In
other words, the implementation of BIM on a project can help to achieve sustainable
development and construction through inter alia whole life cycle thinking, carbon
reduction, waste minimization and process innovation (Zainon, Mohd-Rahim & Salleh,
2016; Georgiadou, 2019).
Whilst the uptake and implementation of BIM in the construction industry is currently
emerging and slow to take off, the ability to use BIM has become central to the QS
profession and, together with the synergetic sustainability knowledge, has been dubbed
as the most important skill for the future quantity surveyors working in a multi-
disciplinary environment (Wu, Wood, Ginige & Jong, 2014; Shayan et al., 2019); a
thought shared by the industry and professional bodies alike. RICS, which regulates the
profession, now has BIM themes running through its entire list of mandatory, core and
optional competencies in the latest QS pathway guide (RICS, 2018a, 2018b).
Against this backdrop, the findings from the literature and from the publications
submitted in this thesis on the interrelation between BIM theory and practice will be
presented and discussed. In particular, three main issues are explored:
o the potential of BIM in the global AEC sector as well as its drivers of, and benefits
for, the QS profession (section 4.2);
o the barriers to BIM incorporation into the AEC academic curricula, especially QS
undergraduate programmes (section 4.3), and
o the multi-disciplinary nature of BIM and the need for a collaborative multi-
disciplinary (BIM) education (section 4.4).

58
The multi-disciplinary education domain is a huge one and the body of work presented
in this thesis covers only part of the ground. It would be misleading or, at best, tempting
to assume that section 4.4 provides an exhaustive body of work in this regard. Whilst
multi-disciplinary education is never the focus in this chapter, its inclusion in section 4.4
does add to the understanding of BIM implementation (section 4.2), and of educational
challenges (section 4.3) and collaborative learning, particularly in the QS context which
is the focus of this thesis. The collaborative nature of BIM and how its full adoption can
help to achieve integrated project delivery in construction through multi-disciplinary
learning is briefly explored. In other words, BIM implementation in practice and its
integration into AEC undergraduate curricula can encourage and help to rekindle the
much-needed collaborative multi-disciplinary approach (Macdonald & Granroth, 2013;
Zhao, Sands, Wang & Ye, 2013; Puolitaival & Kestle, 2018).
4.2 BIM implementation: drivers, benefits and barriers BIM is often described either as a technology (software products) or a methodology
(process innovation) or, by most scholars, as a combination of the two. Irrespective of
the perceived schools of thought, there is a general consensus that BIM is an appraisal
framework used in a project’s life cycle for visual representation and digital information
management. The BIM process supports the creation, management and sharing of facility
life cycle data using visualisation model tools in a collaborative setting.
Özorhon and Karaciğan (2020) pronounced, based on the results from an industry survey
and a real-life case study, that project level factors account for up to 80% of BIM drivers.
An earlier study by Wong, Salleh and Rahim (2015) affirms this also; that BIM
implementation by a firm is mainly driven by the need to improve project performance
and outcomes. This includes the need for improved collaboration and coordination;
improving project performance (time, cost, quality, efficiency and risk reduction); design
improvement (visualisation and clash detection), improving construction productivity,
and reducing life cycle costing. Interestingly, government influence (industry level
factors) as well as the need for firms to gain competitive advantage and maintain a good
company image (firm level factors) only account for the remaining 20%.
59
This is in contrast with the findings from the literature that suggest government push and
requirements are the main drivers of BIM (Ghaffarianhoseini et al., 2017; Vass &
Gustavsson, 2017; Georgiadou, 2019). Although the above conflicting narratives may
seem perplexing, evidence suggests that the level of experience of the sample audience
will influence a study finding. For example, further probing of the studies reveals that
practitioners working for a large organisation or on major infrastructure projects see the
need to improve project outcomes as their main drivers of BIM. On the flip side, those
working for small and medium sized enterprises (SMEs) are reluctant to implement BIM
and perceive government influence and perhaps the need for a good public image as the
main driving force. The opinions also vary within public and private sector projects.
Nevertheless, the benefits of implementing BIM in practice on a project are quite
enormous. Some of the recorded benefits include lean construction and integrated project
delivery, quality assurance and on-time delivery, life cycle thinking and sustainability
(Georgiadou, 2019). Other reported benefits from projects that have utilised BIM include
clash detection, substantial time savings, process innovation, waste minimisation, cost
efficiency and whole life cycle cost reduction (Bryde, Broquetas & Volm, 2013). These
benefits, afforded to all AEC professionals, were grouped by Ghaffarianhoseini et al.
(2017) into technical, knowledge management, standardisation, diversity, economic,
integration, planning/scheduling, building life cycle analysis and decision support
benefits. It should be noted that BIM can be achieved or implemented to different levels
of competence, otherwise referred to as BIM Maturity, ranging from Levels 0 to 3 as
defined by the UK BIM Task Group (Underwood & Ayoade, 2015). The target set by the
UK government was Level 2 BIM on all centrally procured projects by 2016, which is
fully collaborative 3D BIM (Cabinet Office, 2011).
In particular, BIM presents unique challenges as well as huge opportunities for the QS
profession as declared by Wu et al. (2014). Starting with opportunities, BIM can be used
for, inter alia, quantification and costing, and the possibilities here are endless in terms
of whole life cycle costing and embodied carbon counting just to mention a few. Whilst
relevant BIM technology is key to performing the aforementioned emerging/future QS
role, it can equally support/enhance current QS practices through, for example,
automated quantity take-off and billing from digital models, (Stanley & Thurnell, 2014;
Wu et al., 2014; Ismail, Drogemuller, Beazley & Owen, 2016; Zainon et al., 2016).

60
It is apparent that some companies/practitioners now routinely deploy BIM capabilities
on their projects to improve outcomes, albeit at different maturity levels. BIM usage
globally can be attributed to governmental interventions and requirements for efficiency
in the AEC industry. This is the case, at least, in the UK, US and many other
European/developed countries around the world (Wu et al., 2014; Ghaffarianhoseini et
al., 2017; Vass & Gustavsson, 2017). In terms of taking the lead, BIM is now often used
on major infrastructure and government projects, although its adoption in the private
sector and for small projects is still widely restricted. Additionally, despite the growing
awareness of, and the importance of, BIM in the construction industry worldwide, many
developing countries are still lagging behind in the adoption and implementation of BIM.
Georgiadou (2019) uncovered from a study conducted with construction professionals in
the UK that life cycle/long time benefits are often ignored on a project primarily due to
short term thinking, industry fragmentation and skill shortage. According to Georgiadou,
the challenges concerning BIM implementation in the AEC industry can be broadly
classified into: financial barriers especially for SMEs (to buy software packages and train
staff); technological barriers (in terms of performance, interoperability and reliability);
cyber security and legal barriers (regarding confidentiality, integrity and protection of
electronic data); low client demand apart from that generally driven by the government,
and cultural barriers such as resistance to change and the reluctance to move from
traditional procurement to an integrated approach. BIM implementation requires
significant investments in hardware, software and staff training/upskilling to exploit the
full potentials and the benefits it can offer. Hence, cost is the most frequently reported
barrier in the literature, especially for SMEs. In addition, a lack of experience and proper
engagement is often cited as the leading cause of the low return on investment still typical
of BIM usage. This is why Bryde et al. (2013) professed that BIM education and training
is key to redressing this issue for future professionals.
Similarly, Wu et al. (2014) asserted that BIM is not systematically filtering through the
QS profession in the UK largely due to the incompatibility of the mainstream QS-related
software with UK measurement rules and building classification systems. As pointed out
by Ismail et al. (2016) BIM usage among BE professionals is lagging far behind the usage
by architects. In fact, it is reported that some quantity surveyors in the UK and abroad
are still not aware of BIM and that only a small percentage have used BIM (Wong et al.,

61
2015; Ismail et al., 2016). Despite BIM for cost management being identified as critical
in a future QS role, QS firms are yet to figure out how best to make use of BIM in their
practices. The main obstacles identified as being responsible for this slow adoption
rate/pace relates to poor quality models and insufficient information; data exchange
issues; varying standards and unsuitable billing formats (Wu et al., 2014). Stanley and
Thurnell (2014) concurred with the above findings and added that the more general
challenges of BIM implementation in the AEC industry equally applies to the QS
profession.
To overcome the challenges of BIM uptake and implementation in practice, a concerted
effort is required if progress is to be made. Whilst the above captures the rhetoric and
reality of BIM practice mostly from industry perspectives, the views of other
stakeholders are also vitally important. As there are limited studies which examine the
drivers and benefits of BIM implementation in QS practice from academic and students’
perspectives, especially in a developing country context, Publication 7 makes a useful
contribution to knowledge in this regard. Academics were specifically targeted for this
study because of their role in preparing students for practice, and final year QS students
were also sampled because of their appreciation of programme learning outcomes and
being the industry’s future practitioners. This approach is not uncommon especially when
trying to build a general consensus and trying to align the views of key players on global
issues that affect theory and practice such as EfS and BIM.
The most important driver, as identified from Publication 7, is the firm level factor such
as the need for innovation in order to gain competitive advantage. The project level factor
(such as developing the ability to provide whole life value to the client) came a close
second, and the availability of trained staff from industry and academia also featured in
the top five drivers. Out of the 12 identified BIM drivers, the industry level factor (such
as client demand for BIM usage on their projects) ranked least. The findings here make
interesting reading. Whilst some in the industry see the need to improve project outcomes
as the most important driver, which is commendable, academics perceive innovation by
firms to gain competitive advantage as the key motivating factor of BIM usage in the
industry. Although it is not the intention here to adjudicate, the academics being the
neutral party here might just be stating what they already know about companies’
motivation, in general. If improving project outcomes was the order of the day in the
62
construction industry, perhaps the adversarial culture would not be so rampant – just
some food for thought!
Moving on, it is reassuring to know that both academia and industry views can align
sometimes, for instance, with respect to low clients’ demand for BIM usage. Whilst
governments in developed nations, such as the UK, are taking action through policies
and legislation to improve this, developing countries, like Nigeria, can only engage in
wishful thinking for now. The desire to provide whole life value to clients using Level 3
BIM reinforces why BIM for cost management is considered as an emerging QS role.
Equally important is a skilled workforce to implement BIM in practice and competent
academics to train future professionals. These are areas where, as both academics and
practitioners agree, the current QS undergraduate education is lacking.
Regarding the benefits of BIM implementation, Publication 7 confirms the results from
previous studies (Bryde et al., 2013; Stanley & Thurnell, 2014; Ghaffarianhoseini et al.,
2017) but with an added caveat that BIM for cost management should be compulsory for
future QSs to remain relevant in the 21st century and to help deliver the sustainability
agenda in the AEC industry. The publication provides fresh insights into the fact that
BIM knowledge is critical to QS practices, be it in developing or developed countries, in
order to meet the future needs of the global construction industry in a sustainable manner.
4.3 Challenges of integrating BIM into undergraduate curricula BE programmes, both in developed and developing countries, strive to incorporate BIM
into their academic curricula. The motivations for this are well documented in the
previous section which explores the drivers, benefits and challenges of BIM adoption
and implementation in practice. Companies benefit from BIM usage, as do AEC
practitioners and, more widely, the global industry (Shelbourn, Macdonald, McCuen &
Lee, 2017). It has, indeed, never been so important to have a BIM trained workforce.
This is especially important because several of the challenges to BIM implementation in
the AEC sector (identified in the previous section) relate to lack of competence. Hence,
the role of academic institutions in educating future professionals who meet industry
demands cannot be overplayed (Chegu Badrinath, Chang & Hsieh, 2016). This section,
therefore, explores the challenges of integrating BIM into universities’ AEC curricula.
63
The report of the BIM Academic Forum (BAF) (Underwood & Ayoade, 2015) provides
some insights on this. BAF consists of academic members from several HEIs in the UK,
that have AEC provision, who have the shared objective of promoting BIM education,
training, learning and research in the built environment. The report, which was supported
by Advance HE (previously HEA) and the UK BIM Task Group, examines the existing
position and challenges of BIM education in UK HE. The likely challenges of embedding
BIM in BE education were grouped into four key areas related to staff upskilling, industry
engagement, learning framework, and keeping abreast of BIM developments
(Underwood & Ayoade, 2015). A BIM learning outcome framework was subsequently
developed for use in undergraduate and postgraduate BE curricula including QS degree
programmes. In a later study, Shelbourn, Macdonald and Mills (2016) also developed an
illustration, manipulation, application and collaboration (IMAC) framework to help
negate some of the issues impacting upon the learning and teaching of BIM to AEC
students in the HE sector.
Puolitaival and Forsythe (2016) investigated the challenges of HE in New Zealand in
producing BIM-ready construction graduates. The practical challenges faced in the
development and implementation of a BIM-focussed construction curriculum were
identified through an action research study. The main barriers discovered included: the
availability of suitable BIM learning and teaching resources; enhancing the professional
development of staff; mitigating between BIM theory and praxis; finding the sweet spot
between conventional practice and emerging methods, and between process and
technology. Finding suitable BIM models was reported as being particularly challenging
which was why the authors recommended further research in this area. An earlier but
similar study in the US which used academic and student views to reach its conclusions
broadly agreed with the above challenges of integrating BIM into construction-related
programmes (Woo, 2007).
Kocaturk and Kiviniemi (2013) focussed on the challenges of embedding BIM into UK
architectural education but found anxieties and resistance rooted in such issues as how it
would affect accreditation, and how staff could adapt to the required knowledge and skills
in the ever dynamic and rapidly evolving BIM environment. Also, it can be deduced from
the findings and the questions posed in the study that the perceived superiority and
autonomy of the architect is under threat with the collaborative approach of BIM. This
64
was seen as a major anxiety and one of the root causes of resistance to BIM integration
in architectural education. If anything, what we can learn from this likely tension is the
human factor/element at play which, without doubt, is an underestimated barrier.
Chegu Badrinath et al. (2016) usefully and succinctly classified the barriers of integrating
BIM into AEC curricula using the trio of policy, processes and technology. The policy
difficulties that could be faced include professional accreditation problems; inconsistent
global accreditation; variable BIM skill requirements; BIM learning outcome issues, and
lack of motivation. Technology issues relate to obtaining relevant object libraries;
software licences; appropriate tools, and IT facilities. Process barriers include the need
for collaboration and multi-disciplinary learning; inadequate BIM curricula, and the gap
between academia and industry. Evidence suggests that policy issues are externalities
and motivation will increase with favourable BIM polices. Similarly, technology barriers
are usually beyond the area of influence of a curriculum developer because these are cost
related. But process issues can, and should, be addressed through curriculum design.
Whilst the need for industry and HE integration has been reasonably explored in chapter
2, the concept of multi-disciplinary/team learning as germane to BIM education will be
explicated in the next section to help redress the inadequate BIM curricula.
The previously discussed research and studies have focussed on the challenges of
integrating BIM into undergraduate AEC curricula mainly in the UK and other developed
countries. As the emphasis is on the global QS profession, practised mostly in the UK
and several Commonwealth countries, it is, therefore, important to understand the
barriers for BIM incorporation into undergraduate curricula in both of these contexts. To
this effect, Publication 8 examines the challenges of integrating BIM into QS degree
programmes in a Nigerian context, based on the views of academics and students. This
concept of academic inquiry is not new; for example, a US study used both academic and
student views to investigate BIM pedagogical challenges in construction management
programmes (Woo, 2007). However, the concept of BIM adoption in the AEC curricula
of developing countries is a relatively new notion and, as such, studies in this area are
rare. The findings of Publication 8 are thus germane in gathering a complete and wide-
ranging perspective on the challenges of BIM education in undergraduate QS
programmes.

65
The results of the factor analysis in the study described in Publication 8 revealed that the
six mostly highly ranked barriers to the incorporation of BIM education into QS curricula
are: the extent of the culture change required; inadequate setting/enabling environment;
resistance from staff and a lack of industry experts; the non-existence of accreditation
standards/requirements; the significant investment required in terms of cost, and the huge
security risk. These results strongly resonate with the findings of previous studies with
respect to the challenges of integrating BIM in AEC curricula and QS degree
programmes. It also aligns with the findings of the CHOBE QS seminar IX report as
contained in supplementary Publication S2. The CHOBE workshop, held at Birmingham
City University in 2012, was attended by students, academics and industry experts. The
report analysed the delegates’ views on how to educate quantity surveyors to meet future
needs and found similar challenges.
Thus the contribution to knowledge of Publication 8 is three-fold. Firstly, the challenges
of BIM integration into AEC curricula are similar for both developed and developing
countries and this reflects the global nature of the QS profession. Secondly, the barriers
discovered for construction-related curricula are broadly the same as that for the QS
curricula and vice versa, which reflects the common struggle of the AEC programmes.
Thirdly, the trio of high cost, the human factor in its various forms, and a dearth in
recognisable appropriate standards by the PSRBs are critical barriers, which are
synergetic. Nevertheless, it is increasingly clear that the appropriate application of BIM
theory in practice can foster collaboration among the different disciplines involved in the
global AEC industry. Suffice to say that BIM is considered by the body of work presented
above to be integrated and multi-disciplinary in nature, more of which follows.
4.4 Multi-disciplinary (BIM) education The influence, or potential future effect, of BIM in the AEC sector and in the academic
curricula of related disciplines is profound. Learning methods (such as the project-based
method) and learning approaches (such as the collaborative (multi-disciplinary)
approach) have been rekindled as a result of BIM usage (Zhao, Sands, Wang & Ye, 2013;
Puolitaival & Kestle, 2018). Puolitaival and Kestle (2018) who carried out a data rich
global study on the BIM factor in global AEC education concluded that multi-
disciplinary delivery models have been encouraged due to the collaborative nature of
66
BIM. They professed that BIM has allowed the development of experiential learning in
AEC programme curricula. BIM enables students to work collaboratively with other
disciplines on simulated projects or on authentic tasks in order to solve complex practical
problems in a real world setting; hence why Scott (2015) argued that collaborative multi-
disciplinary education can be confined to the constructivist view of learning where AEC
educators act as learning coaches to students rather than as expert transmitters of
knowledge.
In view of this, Macdonald and Mills (2013) asserted that the current education system
of AEC professionals does not reflect the real world where they will be expected to work
as part of a multi-disciplinary team to solve complex problems. Traditionally, students
are often educated independently of other disciplines, by specialist academics who work
in silos, with no multi-disciplinary learning or interdisciplinary studies built into the
programme curricula (Wood, 1999). This results in an industry which does not fully
harness the benefits of the integrated project delivery (IPD) which BIM offers
(Macdonald & Granroth, 2013). Soetanto, Childs, Poh, Austin and Hao (2012) agreed
with the fact that construction is a multi-disciplinary activity which requires truly
integrated collaborative design and construction. Soetanto et al. thence concluded that
future BE professionals should be educated against this backdrop and to this end. This
can help to bridge the divide between the different AEC disciplines and between the
industry and HE, since none of these really exists in a vacuum (Scott, 2015). According
to Wijnia, Kunst, van Woerkom and Poell (2016), team learning typical of multi-
disciplinary education can also help to achieve CBE, which is particularly important in
the vocationally focussed AEC sector.
In drawing together the discussions on the importance of collaboration for future
construction professionals in the industry, Publication 9 was concerned with gathering
QS students’ perceptions of multi-disciplinary learning at a UK university. The results
of that study provide reflections on a collaborative multi-disciplinary learning project
offered as a compulsory module in the School of the Built Environment (University of
Salford) and studied at level 5 by architecture, architectural technology, quantity
surveying, construction project management, building surveying, and real estate and
property management students. The questionnaire which was used to glean QS students’
views was initially developed by the Behaviours4Collaboration (B4C) team, which

67
comprised both academic and industry practitioners. Indeed, the concept of using
students’ perceptions in academic inquiry is not new; this was used by Shelbourn et al.
(2017) to explicate a UK and US perspective of BIM education implementation in HE.
The findings of Publication 9 show knowledge gaps in all the key areas where an
individual has to be collaborative either as a project leader and/or as a project contributor.
The more damming results of the study showed that nearly half of the students perceived
collaborative behaviours to be of low importance despite the wave of transition initiated
by the multi-disciplinary (BIM) education revolution. In addition, Publication 9 also
found that whilst construction industry and BE education should, by their very nature,
endorse collaborative multi-disciplinary approaches (CMDA) and ways of working, it is
only recently through the entrance of BIM into the market and, thus, the recent growing
awareness that this is slowly starting to materialise. If this (i.e. the gradual endorsement
of CMDA in industry and academic practices) is still the most palpable effect of BIM,
then that can only be a good thing in a multifaceted construction environment renowned
for fragmentation and adversarial relationships.
Even though the opinions expressed in Publication 9 are obviously limited to a select
group of students within a single BE school, it does reflect the progression of thinking
from the industry and academia as explicated in the findings from the existing literature.
4.5 Summary The BIM/multi-disciplinary education domain is a huge one and the body of work
presented in this thesis covers only part of the ground. Nevertheless, it does add to the
understanding of BIM implementation in practice and the understanding of educational
challenges and collaborative learning, particularly in the QS context which is the focus
of this thesis. On the BIM implementation front, industry sees project level factors (such
as the need to improve project outcomes) as the most important drivers while academics
perceive firm level factors (such as innovation by firms to gain competitive advantage
and maintain a good company image) as the key motivating factor of BIM usage in the
industry. This is despite the general perception that an industry level factor such as
government push, at least in certain countries such as the UK and US, is the main driver.
68
With respect to BIM integration into AEC curricula, it is concluded that the educational
challenges encountered are similar for both developed and developing countries and this
reflects the global nature of the QS profession. Also, the barriers discovered for
construction-related curricula are broadly the same as that for the QS curricula and vice
versa, which reflects the common struggle of AEC programmes. Additionally, the trio of
high cost, the human factor in its various forms, and inconsistent standards/global
accreditation are critical barriers, which are synergetic.
Finally, in regard to multi-disciplinary (BIM) education, there are still knowledge gaps
in all the key areas where future QS practitioners have to be collaborative. A significant
proportion of these major actors in the future construction industry view collaborative
behaviours to be of low importance despite the wave of transition initiated by the multi-
disciplinary (BIM) education revolution. This implies that more still needs to be done in
this area. It also reinforces the need for AEC courses to continue the shift from the
narrow-minded and specialisation-oriented model, which has dominated and plagued the
sector for some time, to more pluralist (blend of education and training) and
multi/inter/trans-disciplinary (collaborative BIM) curricula in the future.

69
Chapter 5: Contribution to Knowledge and Conclusion
5.1 Summary Detailed conclusions have been drawn from the various publications presented in this thesis
based on their individual research and subjects of investigation. These have been considered
together with the observations and findings from other benchmark studies within the three
aspects (competence-based education, education for sustainable development, and BIM and
multi-disciplinary education) of this critical review and have been summarised (sub-
sections 2.5, 3.5 and 4.5).
The main findings linked to competence-based education, as explicated in Publications
1-3, are related to the general dissatisfaction with the competency attainment of QS
graduates due to a tripartite pull (from industry, academics and professional bodies) on
their training needs and to the absence of an agreed threshold benchmark and, thus, there
is a need for appropriate improvement in the education and training of future quantity
surveyors. Whilst the latest RICS accreditation policies might be a timely intervention in
addressing some of these issues, as they stand, the minor changes will only bring about
minor changes in outcomes.
The principal conclusion of this thesis with respect to education for sustainable
development (as further revealed in Publications 4-6) is that there is no formal mapping
process or a set threshold standard for integrating a reasonable level of sustainability
education into undergraduate construction curricula. In this context, a lack of definition
and common agreement on what sustainable development should entail is causing
different interpretations by HEIs and hindering the development of a structured QS
curriculum. Additionally, this has important implications for the relevant PSRBs which
set the requirements for the QS role and education.
Regarding BIM and multi-disciplinary education (explored in Publications 7 and 8), the
trio of high cost, human factors, and inconsistent standards are synergetic critical barriers.
Despite the general perception that governmental push is the main driver for BIM
implementation in practice, industry sees the need to improve project outcomes while
academics perceive the need for firms to gain competitive advantage as the key

70
motivating factors. This thesis ascertained from Publication 9 and the literature findings
that there are knowledge gaps in the collaborative behaviours of future QS experts despite
the wave of transition initiated by the multi-disciplinary (BIM) education revolution.
5.2 Contribution to knowledge One tangible output of the portfolio of publications submitted, particularly Publication 3,
is a competency mapping framework (CMF) which includes the graduate competency
threshold benchmark (GCTB). This has been used to maximise RICS policy in education
and is reflected in their latest accreditation policy published in 2019; thus the benefits are
yet to be seen/reported. Future research will no doubt investigate this. Another main
output of the published works is a sustainability framework which identifies QS-related
knowledge areas (as seen in Publication 4) and provides a set of well-structured concepts
that can be used for modelling sustainable curricula.
The overarching aim of this thesis was to investigate the development of QS undergraduate
programmes in order to better prepare students who will meet stakeholders’ expectations
regarding practice. The contribution to knowledge of this PhD by publication is gained
from the refinement of the three main themes contained within the portfolio of published
works submitted. The following three sections, thus, summarise the achievements of the
thesis and propose recommendations for improvement.
Competence-based Education
In order to produce satisfied graduates capable of meeting future demands, there is a need
to close the gap between what industry wants and what academia provides. Since
accreditation requirements provide the best incentive for curriculum development as
established in the literature, and in order to address the failure of previous policies
uncovered in Publications 1-3, it is proposed that the RICS should set a minimum
threshold benchmark for undergraduate programmes that is agreed with industry
practitioners and employers of QS graduates. The minimum standard, which can use the
developed GCTB as a starting framework, should use measurable outcomes to reflect the
level of competence and the extent of training required by QS graduates to overcome
critical challenges and meet the future demands of the industry. The minimum standard
71
should inform the development of an adaptable competency-based curriculum that can
adapt to the needs of the ever-changing industry.
Sustainable Development Education
A sustainability threshold benchmark like the GCTB (see Publication 3) is required for
the further integration of sustainability literacy into QS education and to redress the skills
gap in practice. This can build on the sustainability framework developed (in Publication
4 and tested/utilised in Publications 5 and 6) but it is necessary to ascertain both the
industry requirements and employers’ expectations from new graduates through the
ranking of the importance of the identified sustainability themes in the framework. A
minimum standard which aligns professional body, academic and industry views and
allows for innovation should produce competent graduates with the required level of
knowledge and skills in sustainability.
Multi-disciplinary (BIM) Education
In addition to fulfilling RICS competency requirements and that of other relevant PSRBs,
the QS profession and education has to accept emerging opportunities and overcome the
critical challenges presented by BIM and sustainability in order to remain relevant in the
21st century and to meet future industry demands. The idea of multi-disciplinary (BIM)
and team learning, which was explored in Publications 7-9 and other associated studies
in this field, is that it should help students to develop a broader appreciation of the
importance of their discipline in CBE, to understand how it relates to others in the wider
built environment sector, and to achieve the greater goal of integrated, collaborative
design and construction which offers sustainable development benefits. Also, such
learning should help to move away from the speciality and insularity of the typical BE
discipline to more pluralist and multi-disciplinary curricula in the future.
The above recommendations under the three themes are bold and necessary changes,
none of which can thrive without impetus from outside academic circles. The PSRBs and
government have an important role to play to this end and to bring the fragmented
stakeholders together. Such changes should address the everlasting dichotomy between

72
academic provisions and industry needs/expectations, between theory and practice, and
between education and training that has plagued the built environment and the QS
discipline.
5.3 Conclusion The aim of this thesis is to assist QS educators in curriculum and programme
design/development. This has been achieved through reflection on the current QS
education and skill requirements as well as on the critical challenges that are driving the
future industry needs and emerging roles in the profession. The findings from this thesis
have implications for QS degree programmes which cut across the BE/AEC disciplines,
HEIs and national boundaries. From the body of work presented, which includes findings
from the literature and the publications submitted, this thesis outlines the conclusions
formed to date about the development of undergraduate programme curricula. It also
provides a useful contribution to knowledge through appropriate recommendations and
describes where future research would make an impact.
Even though this study focussed on the built environment, especially QS education, it is
anticipated that some of the recommendations made in this thesis could be applied more
broadly in other disciplines for programme alignment and improvement. Indeed,
construction curricula that both equip professionals for future industry demands/global
trends and better prepare graduates to meet present employers’ struggles/expectations
will survive and maintain their continuing relevance. Such an education, which can be
achieved through effective curriculum design and benchmarking, will enhance graduate
employability and produce highly fulfilled graduates. This, then, is where the thesis
attempts to make a meaningful contribution to knowledge through the proposed
recommendations.
Reflecting on the above can help to draw together the three themes of this thesis, which
are: competence-based education, education for sustainable development, and BIM and
multi-disciplinary education. The following ultimate conclusion can, therefore, be drawn.
A truly multi-stakeholder perspective should be used for the development of BE
programme curricula rather than the old-fashioned, traditional top-down approach which
is clearly not working. As seen in the findings from the literature and the published
73
works, the current approach involves academic institutions designing their curricula to
meet the relevant QAA subject benchmark and the PSRBs’ competency requirements
(primarily developed by just a handful of academics and practitioners, at best). In view
of this, the following ultimate recommendation can, thus, be proposed. A holistic and
autonomous national syllabus that allows for flexibility and continuous improvement (in
keeping with any future competencies) should be negotiated with all affected and
interested stakeholders. These stakeholders should include relevant professional bodies,
major industry representatives and employers from different sectors, HEIs and recent
graduates of the discipline.
Unlike the QS competency requirements expected by RICS (2018a) and RICS (2018b),
which only have a subtle emphasis on (and references to) an advisory ability on
sustainability and BIM (under generic competencies), these two specialist knowledge
areas, dubbed as future competencies (inter alia the global trend), should be treated as
technical core and primary QS skills. Essentially, further knowledge and experience in
these subjects are germane to meeting the future needs and demands of a dynamic, multi-
disciplinary construction industry, and the undergraduate QS curricula of HEIs must be
developed to reflect this.
The education versus training debate is, no doubt, a consequence of the long existing
problematic relationship between academia and practice and this is likely to continue for
some time. Therefore, the immediate underlying challenge for QS education providers is
redefining the concept of CBE with respect to finding the right balance between the RICS
competency requirements and future industry demands regarding BIM and the
sustainability agenda. This thesis provides some thoughts for further reflection and can
serve as a useful consideration or framework on the conceptualisation and development
of effective QS undergraduate programmes for the education and training of future
professionals using the developed GCTB (in Publication 3), sustainability model (in
Publication 4), and Behaviours4Collaboration map (in Publication 9).
5.4 Recommendations and future research activities This section highlights a collated list of recommendations from the thesis, without being
verbose or repetitive, as follows.

74
o Since accreditation requirements provide the best incentive for curriculum
development, and in order to address the failure of previous policies, it is
proposed that the RICS should set a minimum threshold benchmark for
undergraduate programmes that is agreed with industry practitioners and
employers of QS graduates;
o A sustainability threshold benchmark (i.e. a minimum standard which aligns
professional body, academic and industry views and allows for innovation) such
as the GCTB is required for the further integration of sustainability literacy into
QS education and to redress the skills’ gap in practice;
o The QS profession and QS education have to accept emerging opportunities and
overcome the critical challenges presented by BIM and sustainability in order to
remain relevant in the 21st century, to meet future industry demands and to move
away from the speciality and insularity of the typical BE discipline to more
pluralist and collaborative multi-disciplinary curricula in the future;
o A holistic and autonomous national syllabus that allows for flexibility and
continuous improvement should be negotiated with all affected and interested
stakeholders to enhance graduate employability and student satisfaction. These
stakeholders include relevant professional bodies, major industry representatives
and employers from different sectors, HEIs and recent graduates of the discipline.
The above recommendations can and should, of course, inform future research activities.
As shown in the list of recommendations, it is vitally important for major stakeholders
(especially PSRBs and industry practitioners/AEC employers) to come together to
mutually agree on the perceived and expected competency levels for graduate quantity
surveyors. Thus, future research may be needed on how to approach, and foster, this
much needed collaboration and alignment of views. Whilst the latest RICS accreditation
policy (RICS, 2019) addresses some of the identified issues regarding the lack of a
defined graduate competency level, further studies should be conducted to investigate the
concomitant changes in graduate outcomes. Also, future research should incorporate
industry views in any QS-specific (sustainability and BIM) education or learning
outcome framework and align academic perceptions with that of the industry regarding
graduate level attainments to produce a future-proof threshold benchmark/standard.

75
5.5 Final concluding remarks This section provides some general observation and personal reflection. The
author/researcher, who has led and developed QS degree programmes in several UK
universities (including at Oxford Brookes) is currently a key academic member of the
Construction and Management Subject Group at the University of Salford as well as the
School Academic Misconduct Officer for the built environment. The author is fortunate
to be part of (and to have benefited from) the Education and Learning in the Built
Environment (ELBE) Research Group. It is reasonable to assume that such groups are
not so common nowadays and there are limited scholars in the field. The ELBE research
group, which was initiated by Dr Mark Shelbourn, comprises notable academics from far
and wide (UK, Republic of Ireland and USA), as well as industry practitioners, all with
the common goal of improving BE education in a global and digital AEC sector.
The author’s various academic roles to date (with regard to teaching, research, enterprise
activities, curriculum development, academic leadership and management) have
provided the impetus for this work. Of course, the journey has not always been easy,
particularly due to the peculiarities of a PhD by publication and having to combine this
work with several other commitments. Nevertheless, the thesis shows the development
of the researcher and demonstrates that a recognised standard has been achieved in line
with the QAA qualification descriptor and as defined in the UoS Academic Regulations
for Research Awards. The thesis also highlights a set of recommendations based on a
detailed critical reflection of the body of work presented and outlines where future studies
and research can make a further impact and/or break new ground. Overall, a worthwhile
and an enjoyable experience, and the author is excited about future prospects.

76
References Abu-Hola, I. R. M., & Tareef, A. B. (2009). Teaching for sustainable development in
higher education institutions: University of Jordan as a case study. College
Student Journal, 43(4), 1287-1305.
Altomonte, S., Rutherford, P., & Wilson, R. (2014). Mapping the Way Forward:
Education for Sustainability in Architecture and Urban Design. Corporate Social
Responsibility and Environmental Management, 21(3), 143-154.
doi:10.1002/csr.1311
Beckman, K., Coulter, N., Khajenoori, S., & Mead, N. (1997). Collaborations: Closing
the industry-academia gap. IEEE Software, 14(6), 49-57. doi:10.1109/52.636668
Bhattacharjee, S., Ghosh, S., Jones, J., & Rusk, B. (2012). Sustainability Education in
the United States: Analyses of the Curricula Used in Construction Programs.
Paper presented at the International Conference on Sustainable Design and
Construction (ICSDC) 2011, Reston, VA.
Bishop, J. (1998). Occupation-Specific versus General Education and Training. The
ANNALS of the American Academy of Political and Social Science, 559(1), 24-
38. doi:10.1177/0002716298559001003
Blair, R., & Serafini, T. M. (2016). Training versus Education: eLearning, Hybrid, and
Face-to-Face Modalities - a Participatory Debate. Journal of Systemics,
Cybernetics and Informatics, 14(5), 37-41.
Blewitt, J., & Cullingford, C. (Eds.). (2004). The sustainability curriculum: the challenge
for higher education. London: Earthscan.
Boarin, P., Martinez-Molina, A., & Juan-Ferruses, I. (2020). Understanding students’
perception of sustainability in architecture education: A comparison among
universities in three different continents. Journal of Cleaner Production, 248.
doi:10.1016/j.jclepro.2019.119237
Boca, G. D., & Saraçlı, S. (2019). Environmental Education and Student’s Perception,
for Sustainability. Sustainability, 11(6), 1553. doi:10.3390/su11061553

77
Brundtland, G. H., & WCED. (1987). Our common future : World Commission on
Environment and Development (WCED). Oxford: Oxford University Press.
Bryde, D., Broquetas, M., & Volm, J. M. (2013). The project benefits of Building
Information Modelling (BIM). International Journal of Project Management,
31(7), 971-980. doi:10.1016/j.ijproman.2012.12.001
Cabinet Office. (2011). Government Construction Strategy. London: Cabinet Office
Celik, B. G. (2013). Exploring Sustainable Development and Its Interpretation in the
Built Environment. Journal of Sustainable Development, 6(12), 83-91.
doi:10.5539/jsd.v6n12p83
Chegu Badrinath, A., Chang, Y.-T., & Hsieh, S.-H. (2016). A review of tertiary BIM
education for advanced engineering communication with visualization.
Visualization in Engineering, 4(1), 1-17. doi:10.1186/s40327-016-0038-6
CIOB. (2018). CIOB Undergraduate Education Framework. In. Bracknell, UK: The
Chartered Institute of Building
Cotgrave, A., & Alkhaddar, R. (2006). Greening the Curricula within Construction
Programmes. Journal for Education in the Built Environment, 1(1), 3-29.
doi:10.11120/jebe.2006.01010003
Cotgrave, A. J., & Kokkarinen, N. (2010). Developing a model promoting sustainability
literacy through construction curriculum design. Structural Survey, 28(4), 266-
280. doi:10.1108/02630801011070975
Cotgrave, A. J., & Kokkarinen, N. (2011). Promoting sustainability literacy in
construction students: Implementation and testing of a curriculum design model.
Structural Survey, 29(3), 197-212. doi:10.1108/02630801111148185
Crafford, G. J., & Smallwood, J. J. (2007). Clients' views on quantity surveying
competencies. Acta Structilia, 14(1), 33-55.
Creswell, J. W. (2009). Research Design: Qualitative, Quantitative, and Mixed Methods
Approaches (Third ed.): SAGE Publications.
Cross, J. (1996). Training vs. Education: A distinction that makes a difference.
78
Drucker, P. F. (2002). Managing in the next society (2nd ed. ed.). New York:
Butterworth-Heinemann.
Edwards, B. (2004). Sustainability and Education in the Built Environment. In J. Blewitt
& C. Cullingford (Eds.), The sustainability curriculum: the challenge for higher
education (pp. 129-140). London: Earthscan.
Edwards, R. (2016). Competence-based education and the limitations of critique.
International Journal of Training Research, 14(3), 244-255.
doi:10.1080/14480220.2016.1254366
Farmer, G., & Guy, S. (2010). Making morality: sustainable architecture and the
pragmatic imagination. Building Research & Information, 38(4), 368-378.
doi:10.1080/09613218.2010.482236
Fitton, R. (2016). The thermal energy performance of domestic dwellings in the UK.
(PhD by publication). University of Salford, UK.
Forrant, R., & Silka, L. (Eds.). (2006). Inside and Out: Universities and Education for
Sustainable Development. Amityville, NY: Baywood Publishing Company, Inc.
Garcia, K. (2008). Education vs. Training in Fire Space Control. Fire Engineering,
161(9), 125-126.
Georgiadou, M. C. (2019). An overview of benefits and challenges of building
information modelling (BIM) adoption in UK residential projects. Construction
Innovation, 19(3), 298-320. doi:10.1108/CI-04-2017-0030
Ghaffarianhoseini, A., Tookey, J., Ghaffarianhoseini, A., Naismith, N., Azhar, S.,
Efimova, O., & Raahemifar, K. (2017). Building Information Modelling (BIM)
uptake: Clear benefits, understanding its implementation, risks and challenges.
Renewable and Sustainable Energy Reviews, 75, 1046-1053.
doi:10.1016/j.rser.2016.11.083
Gibbs, T., Brigden, D., & Hellenberg, D. (2004). The Education versus Training and the
Skills versus Competency debate. South African Family Practice, 46(10), 5-6.
doi:10.1080/20786204.2004.10873146
79
Hale, W. B. (2007). Education vs. training in the twenty first century. Forum on Public
Policy: A Journal of the Oxford Round Table.
Hassan, F., Ismail, Z., Zaini, A. A., Hassan, S., & Maisham, M. (2011). An evaluation of
the competencies, skills and knowledge of Quantity Surveying graduates in
consultant Quantity Surveying firms in Malaysia. Paper presented at the 2011
IEEE Colloquium on Humanities, Science and Engineering, Penang, Malaysia.
Healey, M., & Jenkins, A. (2000). Kolb's Experiential Learning Theory and Its
Application in Geography in Higher Education. Journal of Geography, 99(5),
185-195. doi:10.1080/00221340008978967
Hill, A., Popovic, C., Eland, J., Lawton, R., & Morton, N. (2010). Creating future-proof
graduates using scenario-based learning. In E. P. Errington (Ed.), Preparing
graduates for the professions using scenario-based learning (pp. 27-38).
Australia: Post Pressed.
Hill, A., Popovic, C., Lawton, R., Eland, J., Morton, N., Curzon, R., . . . Tomas, C. (2010).
Using Critical Incidents to Create Learning Pathways Between the Real World
and Places of Learning: Findings from a 2 Year Funded Project Aimed at
Improving Understanding and Capability in Key Employability Skills.
International Journal of Learning, 16(12), 157-170.
Holdsworth, S., & Sandri, O. (2014). Sustainability Education and the Built
Environment: Experiences from the Classroom. Journal for Education in the
Built Environment, 9(1), 48-68. doi:10.11120/jebe.2014.00011
Ismail, N. A. A., Drogemuller, R., Beazley, S., & Owen, R. (2016). A Review of BIM
Capabilities for Quantity Surveying Practice. MATEC Web of Conferences, 66,
1-8. doi:10.1051/matecconf/20166600042
Keeney, S. (2011). The Delphi technique in nursing and health research. Chichester,
West Sussex: Wiley-Blackwell.
Kim, B. (2006). Training vs. Education in Forming Won Buddhist Kyomus in the USA.
Teaching Theology & Religion, 9(2), 109-114. doi:10.1111/j.1467-
9647.2006.00271.x

80
Kocaturk, T., & Kiviniemi, A. (2013). Challenges of Integrating BIM in Architectural
Education. Paper presented at the eCAADe 31 - Computation and Performance
Delft, The Netherlands. http://resolver.tudelft.nl/uuid:c5dcdf00-b2f6-4052-807e-
b4a3a0e81e10
Koenen, A.-K., Dochy, F., & Berghmans, I. (2015). A phenomenographic analysis of the
implementation of competence-based education in higher education. Teaching
and Teacher Education, 50, 1-12. doi:10.1016/j.tate.2015.04.001
Kolb, D. A. (1984). Experiential Learning: Experience as the Source of Learning and
Development. Englewood Cliffs, New Jersey: Prentice-Hall.
Macdonald, J., & Mills, J. (2013). An IPD approach to construction education.
Construction Economics and Building, 13(2), 93-103.
doi:10.5130/AJCEB.v13i2.3324
Macdonald, J. A., & Granroth, M. (Eds.). (2013). Multidisciplinary AEC Education
Utilising BIM / PLIM Tools and Processes (Vol. 409). Heidelberg, Berlin:
Springer.
Malamud, O., & Pop-Eleches, C. (2008). General Education vs. Vocational Training:
Evidence from an Economy in Transition. NBER Working Paper Series, 14155.
doi:10.3386/w14155
Male, S. (1990). Professional authority, power and emerging forms of 'profession' in
quantity surveying. Construction Management and Economics, 8(2), 191-204.
doi:10.1080/01446199000000016
McFarlane, D. A., & Ogazon, A. G. (2011). The Challenges of Sustainability Education.
Journal of Multidisciplinary Research, 3(3), 81-107.
McHardy, P., & Allan, T. (2000). Closing the gap between what industry needs and what
HE provides. Education + Training, 42(9), 496-508.
doi:10.1108/00400910010362923
McKenna, A., & Baume, G. (2015). Complex project conceptualization and the linguistic
turn: the case of a small Australian construction company. International Journal
of Project Management, 33(7), 1476-1483. doi:10.1016/j.ijproman.2015.06.005
81
Morel, N. J., & Griffiths, B. (2018). Redefining competency based education:
competence for life (First edition ed.). New York, USA: Business Expert Press.
Nkado, R., & Meyer, T. (2001). Competencies of professional quantity surveyors: A
South African perspective. Construction Management and Economics, 19(5),
481-491. doi:10.1080/01446193.2001.9709624
Owusu-Manu, D.-G., Edwards, D. J., Holt, G. D., & Prince, C. (2014). Industry and
Higher Education Integration: A Focus on Quantity Surveying Practice. Industry
and Higher Education, 28(1), 27-37. doi:10.5367/ihe.2014.0188
Özorhon, B., & Karaciğan, A. (2020). Drivers of BIM Implementation in a High Rise
Building Project. Paper presented at the Advances in Building Information
Modeling, Istanbul, Turkey.
Palm, P., & Staffansson Pauli, K. (2018). Bridging the Gap in real estate education :
higher-order learning and industry incorporation. Journal Of Real Estate Practice
And Education, 21(1), 59-75.
Paraschivescu, V., & Botez, N. (2011). Education for Sustainable Development.
Economy Transdisciplinarity Cognition, 15(2), 132-140.
Pashchenko, T., & Vanina, N. (2019). Competence-based education content forming
modality for future junior specialists of construction and auto industries.
Professional Pedagogy, 1(18), 148-155. doi:10.32835/2223-5752.2019.18.148-
155
Peach, S. (2010). A curriculum philosophy for higher education: socially critical
vocationalism. Teaching in Higher Education, 15(4), 449-460.
doi:10.1080/13562517.2010.493345
Perera, S., & Pearson, J. (2011). Alignment of professional, academic and industrial
development needs for quantity surveyors: The post-recession dynamics
Retrieved from UK:
https://www.isurv.com/downloads/download/1479/alignment_of_professional_a
cademic_and_industrial_development_needs_for_quantity_surveyors_the_post_
recession_dynamics_rics
82
Puolitaival, T., & Forsythe, P. (2016). Practical challenges of BIM education. Structural
Survey, 34(4/5), 351-366. doi:10.1108/SS-12-2015-0053
Puolitaival, T., & Kestle, L. (2018). Teaching and learning in AEC education–the
building information modelling factor. Journal of Information Technology in
Construction (ITcon), 23(10), 195-214. Retrieved from
https://www.itcon.org/2018/10
QAA. (2014). Part A: Setting and Maintaining Academic Standards: The Frameworks
for Higher Education Qualifications of UK Degree-Awarding Bodies. In UK
Quality Code for Higher Education. Retrieved from
https://www.qaa.ac.uk/docs/qaa/quality-code/qualifications-frameworks.pdf
QAA. (2019). Subject Benchmark Statement: Land, Construction, Real Estate and
Surveying. In. Gloucester, UK: The Quality Assurance Agency for Higher
Education.
RICS. (2018a). Pathway guide: Quantity Surveying and Construction. In (pp. 1-71).
Parliament Square, London: Royal Institution of Chartered Surveyors.
RICS. (2018b). RICS Requirements and Competencies guide. In (pp. 1-81). Parliament
Square, London: Royal Institution of Chartered Surveyors.
RICS. (2019). RICS Global Accreditation: Policy and Process. In. London, UK: Royal
Institution of Chartered Surveyors.
Saunders, M. N. K., Lewis, P., & Thornhill, A. (2019). Research methods for business
students (Eighth ed.). New York: Pearson.
Schaap, H., de Bruijn, E., Van Der Schaaf, M. F., & Kirschner, P. A. (2009). Students'
personal professional theories in competence-based vocational education: the
construction of personal knowledge through internalisation and socialisation.
Journal of Vocational Education & Training, 61(4), 481-494.
doi:10.1080/13636820903230999
Scott, A. J., Carter, C., Reed, M. R., Larkham, P., Adams, D., Morton, N., . . . Coles, R.
(2013). Disintegrated development at the rural–urban fringe: Re-connecting
83
spatial planning theory and practice. Progress in Planning, 83, 1-52.
doi:10.1016/j.progress.2012.09.001
Scott, L. (2015). The Changing Landscape of Construction Higher Education.
International Journal of Construction Education and Research, 11(2), 78-78.
doi:10.1080/15578771.2015.1022454
Scott, L. (2016). Theory and research in construction education: the case for pragmatism.
Construction Management and Economics, 34(7-8), 552-560.
doi:10.1080/01446193.2016.1151539
Sev, A. (2009). How can the construction industry contribute to sustainable
development? A conceptual framework. Sustainable Development, 17(3), 161-
173. doi:10.1002/sd.373
Shafie, H., Syed Khuzzan, S. M., & Mohyin, N. A. (2014). Soft Skills Competencies of
Quantity Surveying Graduates in Malaysia: Employers’ Views and Expectations.
International Journal of Built Environment and Sustainability, 1(1), 9-17.
doi:10.11113/ijbes.v1.n1.3
Shayan, S., Kim, K., Ma, T., Freda, R., & Liu, Z. (2019). Emerging Challenges and Roles
for Quantity Surveyors in the Construction Industry. Management Review : An
International Journal, 14(1), 82-96.
Shelbourn, M., Aouad, G., & Hoxley, M. (2001). Multimedia in construction education:
new dimensions. Automation in Construction, 10(2), 265-274.
doi:10.1016/S0926-5805(99)00036-9
Shelbourn, M., Aouad, G., Hoxley, M., & Stokes, E. (2000). Learning building pathology
using computers - a prototype application. Structural Survey, 18(2), 111-119.
doi:10.1108/02630800010330167
Shelbourn, M., Hoxley, M., & Aouad, G. (2004). Learning building pathology using
computers - evaluation of a prototype application. Structural Survey, 22(1), 30-
38. doi:10.1108/02630800410530909

84
Shelbourn, M., Macdonald, J., McCuen, T., & Lee, S. (2017). Students’ perceptions of
BIM education in the higher education sector: A UK and US perspective. Industry
and Higher Education, 31(5), 293-304. doi:10.1177/0950422217725962
Shelbourn, M., Macdonald, J., & Mills, J. (2016). Developing an international
framework for BIM education in the HE sector. Paper presented at the 10th
Academic Interoperability Coalition (AIC) BIM Symposium, Orlando, FL, USA
https://aicbimed.com/files/bimas2016proceedings.compressed-2.pdf#page=43
Soetanto, R., Childs, M., Poh, P., Austin, S., & Hao, J. (2012). Global Multidisciplinary
Learning in Construction Education: Lessons from Virtual Collaboration of
Building Design Teams. Civil Engineering Dimension, 14(3), 173-181.
doi:10.9744/ced.14.3.173-181
Spence, R., & Mulligan, H. (1995). Sustainable development and the construction
industry. Habitat International, 19(3), 279-292. doi:10.1016/0197-
3975(94)00071-9
Stanley, R., & Thurnell, D. P. (2014). The benefits of, and barriers to, implementation of
5D BIM for quantity surveying in New Zealand. Construction Economics and
Building, 14(1), 105-117. doi:10.5130/AJCEB.v14i1.3786
Thakran, S. (2015). Education for Sustainable Development. Educational Quest, 6(1),
55-60. doi:10.5958/2230-7311.2015.00009.4
Trad, S. P. (2019). A framework for mapping sustainability within tertiary curriculum.
International Journal of Sustainability in Higher Education, 20(2), 288-308.
doi:10.1108/IJSHE-09-2018-0151
Underwood, J., & Ayoade, O. A. (2015). Current position and associated challenges of
BIM education in UK higher education. Retrieved from Salford, UK:
Vass, S., & Gustavsson, T. K. (2017). Challenges when implementing BIM for industry
change. Construction Management and Economics, 35(10), 597-610.
doi:10.1080/01446193.2017.1314519
Wesselink, R., de Jong, C., & Biemans, H. J. A. (2010). Aspects of Competence-Based
Education as Footholds to Improve the Connectivity Between Learning in School
85
and in the Workplace. Vocations and Learning, 3(1), 19-38. doi:10.1007/s12186-
009-9027-4
Wijnia, L., Kunst, E. M., van Woerkom, M., & Poell, R. F. (2016). Team learning and
its association with the implementation of competence-based education. Teaching
and Teacher Education, 56, 115-126. doi:10.1016/j.tate.2016.02.006
Wilson, D. (2010). Training vs. education. American Printer, 127(7), 40.
Winter, R., & Maisch, M. (1996). Professional competence and higher education: the
ASSET programme. London, UK: Falmer Press.
Wong, P. F., Salleh, H., & Rahim, F. A. M. (2015). A Relationship Framework for
Building Information Modeling (BIM) Capability in Quantity Surveying Practice
and Project Performance. Informes de la Construccion, 67(540), e119.
doi:dx.doi.org/10.3989/ic.15.007
Woo, J. H. (2007). BIM (Building Information Modeling) and Pedagogical Challenges.
Paper presented at the 43rd ASC National Annual Conference., Washington,
District of Columbia.
http://citeseerx.ist.psu.edu/viewdoc/summary?doi=10.1.1.455.1159
Wood, G. (1999). Interdisciplinary working in built environment education. Education
+ Training, 41(8), 373-380. doi:10.1108/00400919910298648
Wood, G. (2012). Research, Practice and Education in the Built Environment. (PhD).
University of Salford, UK.
Wu, S., Wood, G. D., Ginige, K., & Jong, S. W. (2014). A technical review of BIM based
cost estimating in UK Quantity Surveying practice, standards and tools. ITcon,
19, 534-562. Retrieved from http://www.itcon.org/2014/31
Xia, B., Rosly, N., Wu, P., Bridge, A., & Pienaar, J. (2016). Improving sustainability
literacy of future quantity surveyors. Smart and Sustainable Built Environment,
5(4), 325-339. doi:10.1108/SASBE-07-2016-0015
Yin, R. K. (2018). Case study research and applications : design and methods. In (Sixth
ed.). Los Angeles: SAGE.
86
Yogeshwaran, G., Perera, B. A. K. S., & Ariyachandra, M. R. M. F. (2018).
Competencies expected of graduate quantity surveyors working in developing
countries. Journal of Financial Management of Property and Construction,
23(2), 202-220. doi:10.1108/JFMPC-06-2017-0019
Zainon, N., Mohd-Rahim, F. A., & Salleh, H. (2016). The Rise Of BIM in Malaysia And
Its Impact Towards Quantity Surveying Practices. MATEC Web of Conferences,
66. doi:10.1051/matecconf/20166600060
Zhao, D., Sands, K., Wang, Z., & Ye, Y. (2013). Building information modeling-
enhanced team-based learning in construction education. Paper presented at the
12th International Conference on Information Technology Based Higher
Education and Training (ITHET), Antalya, Turkey.

87
PART B – PORTFOLIO OF PUBLICATIONS
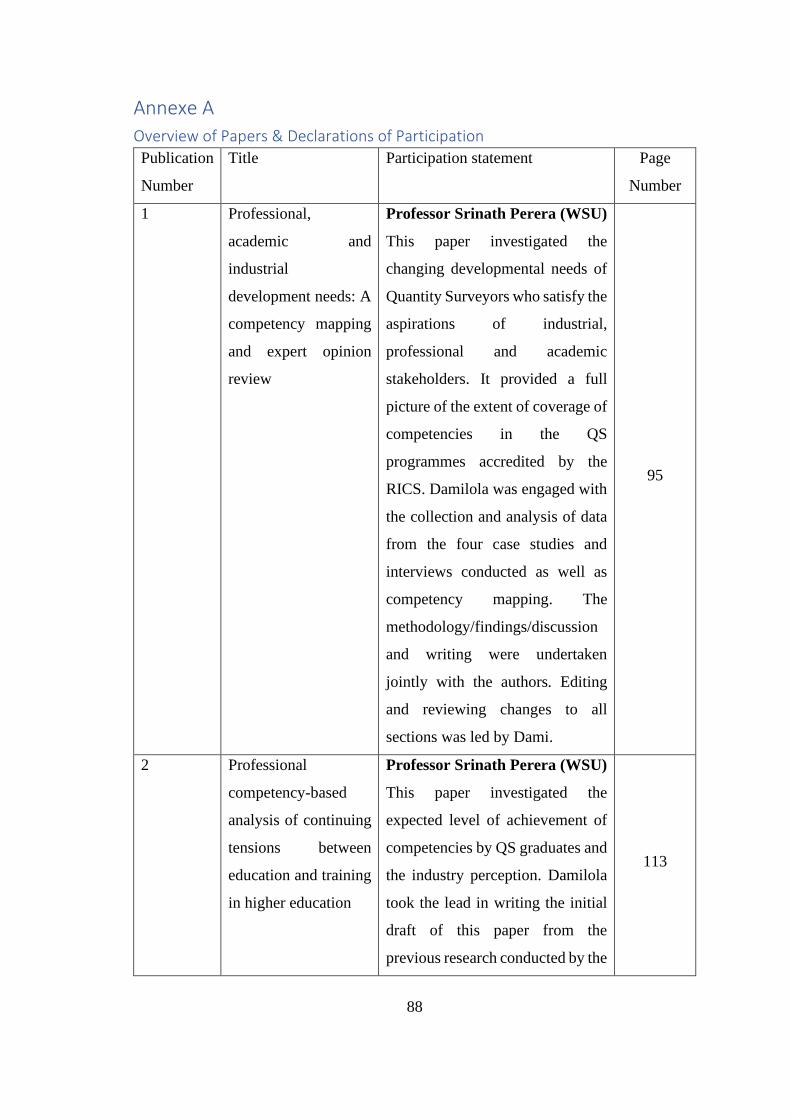
88
Annexe A
Overview of Papers & Declarations of Participation
Publication
Number
Title Participation statement Page
Number
1 Professional,
academic and
industrial
development needs: A
competency mapping
and expert opinion
review
Professor Srinath Perera (WSU)
This paper investigated the
changing developmental needs of
Quantity Surveyors who satisfy the
aspirations of industrial,
professional and academic
stakeholders. It provided a full
picture of the extent of coverage of
competencies in the QS
programmes accredited by the
RICS. Damilola was engaged with
the collection and analysis of data
from the four case studies and
interviews conducted as well as
competency mapping. The
methodology/findings/discussion
and writing were undertaken
jointly with the authors. Editing
and reviewing changes to all
sections was led by Dami.
95
2 Professional
competency-based
analysis of continuing
tensions between
education and training
in higher education
Professor Srinath Perera (WSU)
This paper investigated the
expected level of achievement of
competencies by QS graduates and
the industry perception. Damilola
took the lead in writing the initial
draft of this paper from the
previous research conducted by the
113
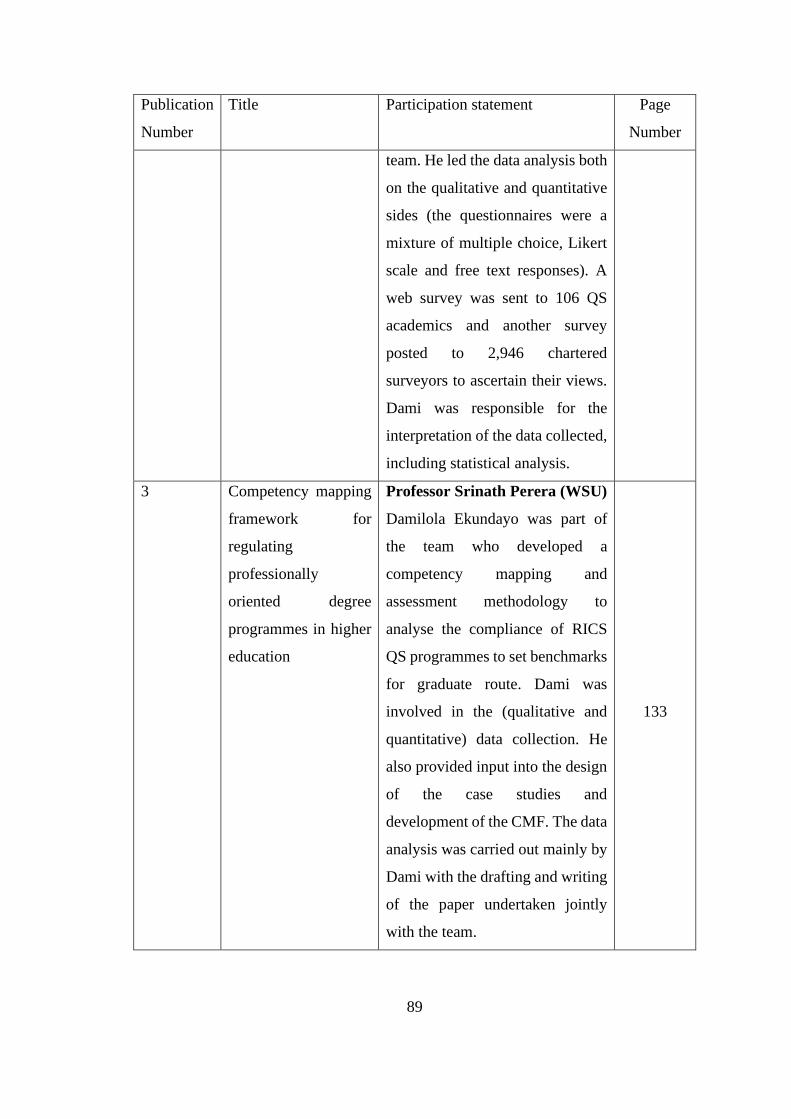
89
Publication
Number
Title Participation statement Page
Number
team. He led the data analysis both
on the qualitative and quantitative
sides (the questionnaires were a
mixture of multiple choice, Likert
scale and free text responses). A
web survey was sent to 106 QS
academics and another survey
posted to 2,946 chartered
surveyors to ascertain their views.
Dami was responsible for the
interpretation of the data collected,
including statistical analysis.
3 Competency mapping
framework for
regulating
professionally
oriented degree
programmes in higher
education
Professor Srinath Perera (WSU)
Damilola Ekundayo was part of
the team who developed a
competency mapping and
assessment methodology to
analyse the compliance of RICS
QS programmes to set benchmarks
for graduate route. Dami was
involved in the (qualitative and
quantitative) data collection. He
also provided input into the design
of the case studies and
development of the CMF. The data
analysis was carried out mainly by
Dami with the drafting and writing
of the paper undertaken jointly
with the team.
133

90
Publication
Number
Title Participation statement Page
Number
4 Mapping
sustainability in the
quantity surveying
curriculum: Educating
tomorrow’s design
economists (Book
Chapter)
Professor Chika Udeaja (LSBU)
These papers identified the quality
and quantity of sustainability-
related materials within the built
environment curriculum, mainly
QS degree programmes. The goal,
as initiated by Dami, was to
identify broad & specific changes
needed to develop competencies
relevant to QS practices. Dami’s
contributions include: background
literature review in the area of
sustainability education, mapping,
semi-structured interviews/gaining
ethical approval, arranging and
carrying out the interviews, data
analysis, and development of the
sustainability framework.
161
5 Sustainable
development in a
construction related
curriculum – quantity
surveying students’
perspective
Professor Chika Udeaja (LSBU)
This paper assessed the level of QS
students’ knowledge and identified
knowledge gaps in QS–relevant
sustainability knowledge areas.
Dami was responsible with me for
designing and putting together the
first draft of the paper, providing
guidance for the processing and
interpretation of the survey data,
editing and reviewing the final
paper. Dami’s expertise in this
176
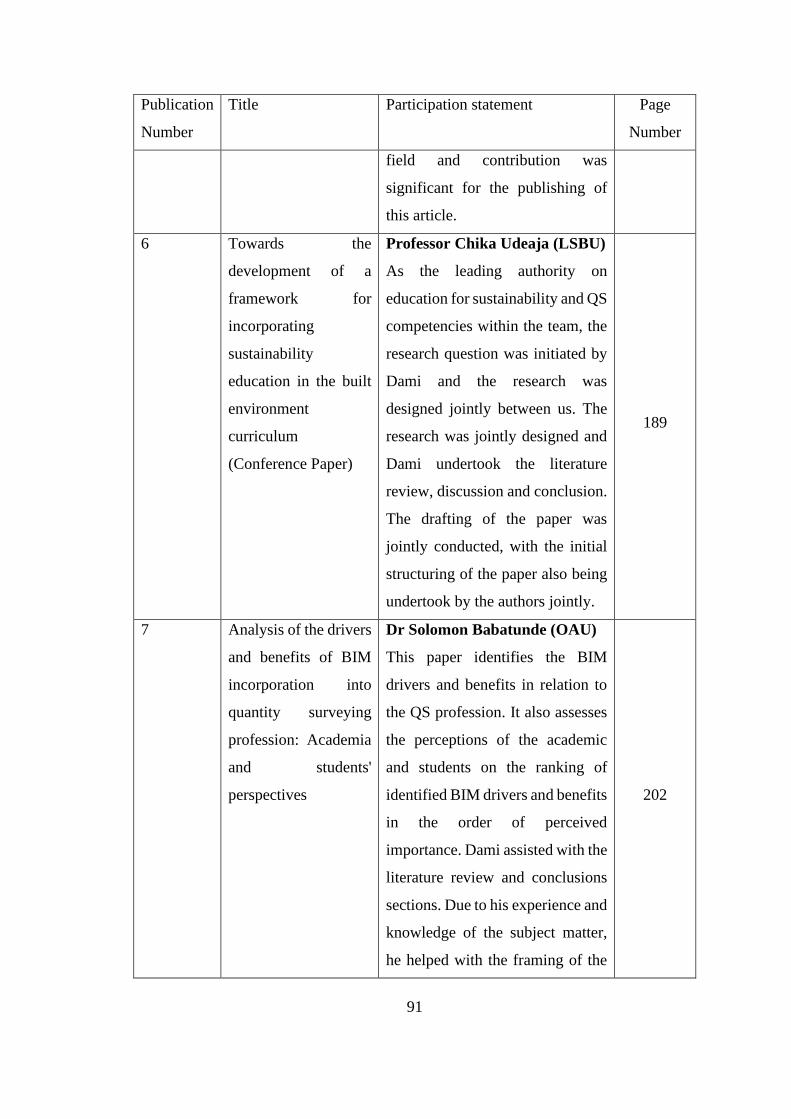
91
Publication
Number
Title Participation statement Page
Number
field and contribution was
significant for the publishing of
this article.
6 Towards the
development of a
framework for
incorporating
sustainability
education in the built
environment
curriculum
(Conference Paper)
Professor Chika Udeaja (LSBU)
As the leading authority on
education for sustainability and QS
competencies within the team, the
research question was initiated by
Dami and the research was
designed jointly between us. The
research was jointly designed and
Dami undertook the literature
review, discussion and conclusion.
The drafting of the paper was
jointly conducted, with the initial
structuring of the paper also being
undertook by the authors jointly.
189
7 Analysis of the drivers
and benefits of BIM
incorporation into
quantity surveying
profession: Academia
and students'
perspectives
Dr Solomon Babatunde (OAU)
This paper identifies the BIM
drivers and benefits in relation to
the QS profession. It also assesses
the perceptions of the academic
and students on the ranking of
identified BIM drivers and benefits
in the order of perceived
importance. Dami assisted with the
literature review and conclusions
sections. Due to his experience and
knowledge of the subject matter,
he helped with the framing of the
202
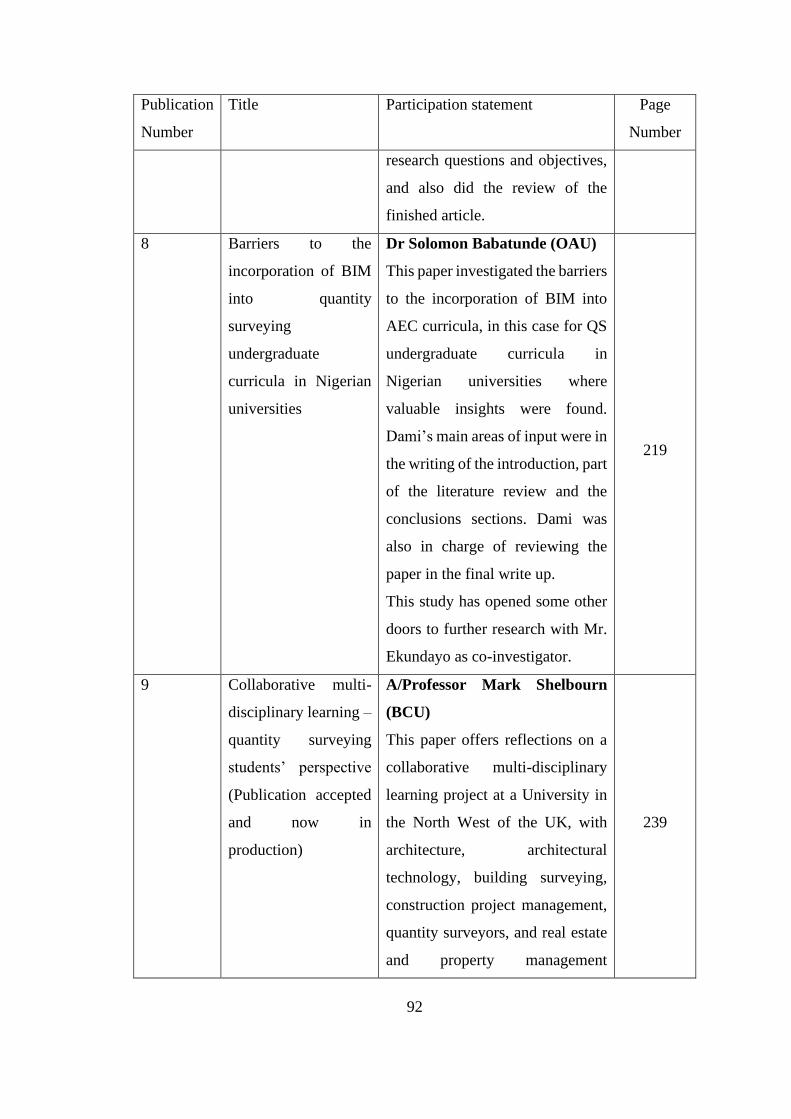
92
Publication
Number
Title Participation statement Page
Number
research questions and objectives,
and also did the review of the
finished article.
8 Barriers to the
incorporation of BIM
into quantity
surveying
undergraduate
curricula in Nigerian
universities
Dr Solomon Babatunde (OAU)
This paper investigated the barriers
to the incorporation of BIM into
AEC curricula, in this case for QS
undergraduate curricula in
Nigerian universities where
valuable insights were found.
Dami’s main areas of input were in
the writing of the introduction, part
of the literature review and the
conclusions sections. Dami was
also in charge of reviewing the
paper in the final write up.
This study has opened some other
doors to further research with Mr.
Ekundayo as co-investigator.
219
9 Collaborative multi-
disciplinary learning –
quantity surveying
students’ perspective
(Publication accepted
and now in
production)
A/Professor Mark Shelbourn
(BCU)
This paper offers reflections on a
collaborative multi-disciplinary
learning project at a University in
the North West of the UK, with
architecture, architectural
technology, building surveying,
construction project management,
quantity surveyors, and real estate
and property management
239
93
Publication
Number
Title Participation statement Page
Number
students, albeit with a QS focus.
Damilola did the majority of the
work so I had an overview of it and
helped digest the findings. Dami
also carried out the processing,
statistical analysis and
interpretation of the data collected
on this research project. He was
responsible for writing the findings
and discussion as well as the
conclusions and future research
sections for the paper.

94
Annexe B
Supplementary Reports and Acknowledgements
Report
Number
Title Acknowledgement Page
Number
S1 RICS professional competency
mapping framework for programme
appraisal and benchmarking (RICS
Research Report)
Part of research team 279
S2 Analysis of the delegate survey:
How to educate quantity surveyors
to meet future needs (CHOBE
Project Report)
Co-author 359
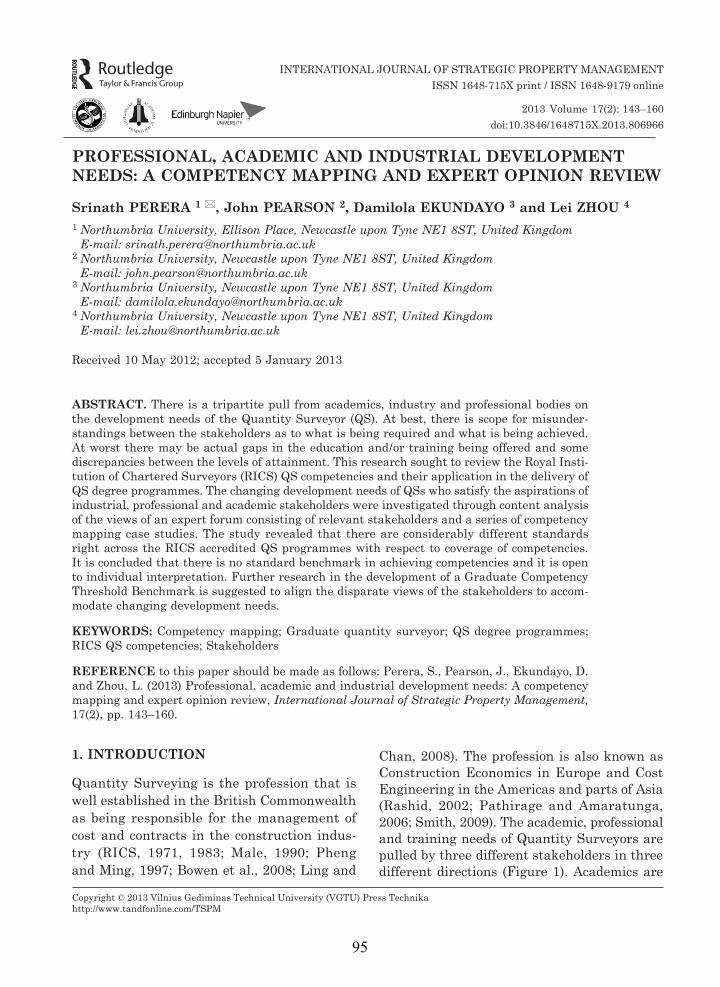
Copyright © 2013 Vilnius Gediminas Technical University (VGTU) Press Technikahttp://www.tandfonline.com/TSPM
INTERNATIONAL JOURNAL OF STRATEGIC PROPERTY MANAGEMENTISSN 1648-715X print / ISSN 1648-9179 online
2013 Volume 17(2): 143–160doi:10.3846/1648715X.2013.806966
PROFESSIONAL, ACADEMIC AND INDUSTRIAL DEVELOPMENT NEEDS: A COMPETENCY MAPPING AND EXPERT OPINION REVIEW
Srinath PERERA 1 , John PEARSON 2, Damilola EKUNDAYO 3 and Lei ZHOU 4
1 Northumbria University, Ellison Place, Newcastle upon Tyne NE1 8ST, United KingdomE-mail: [email protected]
2 Northumbria University, Newcastle upon Tyne NE1 8ST, United KingdomE-mail: [email protected]
3 Northumbria University, Newcastle upon Tyne NE1 8ST, United KingdomE-mail: [email protected]
4 Northumbria University, Newcastle upon Tyne NE1 8ST, United KingdomE-mail: [email protected]
Received 10 May 2012; accepted 5 January 2013
ABSTRACT. There is a tripartite pull from academics, industry and professional bodies on the development needs of the Quantity Surveyor (QS). At best, there is scope for misunder-standings between the stakeholders as to what is being required and what is being achieved. At worst there may be actual gaps in the education and / or training being offered and some discrepancies between the levels of attainment. This research sought to review the Royal Insti-tution of Chartered Surveyors (RICS) QS competencies and their application in the delivery of QS degree programmes. The changing development needs of QSs who satisfy the aspirations of industrial, professional and academic stakeholders were investigated through content analysis of the views of an expert forum consisting of relevant stakeholders and a series of competency mapping case studies. The study revealed that there are considerably different standards right across the RICS accredited QS programmes with respect to coverage of competencies. It is concluded that there is no standard benchmark in achieving competencies and it is open to individual interpretation. Further research in the development of a Graduate Competency Threshold Benchmark is suggested to align the disparate views of the stakeholders to accom-modate changing development needs.
KEYWORDS: Competency mapping; Graduate quantity surveyor; QS degree programmes; RICS QS competencies; Stakeholders
REFERENCE to this paper should be made as follows: Perera, S., Pearson, J., Ekundayo, D. and Zhou, L. (2013) Professional, academic and industrial development needs: A competency mapping and expert opinion review, International Journal of Strategic Property Management, 17(2), pp. 143–160.
1. INTRODUCTION
Quantity Surveying is the profession that is well established in the British Commonwealth as being responsible for the management of cost and contracts in the construction indus-try (RICS, 1971, 1983; Male, 1990; Pheng and Ming, 1997; Bowen et al., 2008; Ling and
Chan, 2008). The profession is also known as Construction Economics in Europe and Cost Engineering in the Americas and parts of Asia (Rashid, 2002; Pathirage and Amaratunga, 2006; Smith, 2009). The academic, professional and training needs of Quantity Surveyors are pulled by three different stakeholders in three different directions (Figure 1). Academics are
95

144 S. Perera et al.
interested in producing a rounded graduate with the basic foundation of knowledge for fur-ther development whereas professional bodies are interested in graduates who can be pro-gressed to full professional status through the achievement of the required core competencies (RICS, 2009a and 2009b; Perera and Pearson, 2011). The industry is looking for a graduate who can straight away contribute both to the daily functions of business activity and to its growth. Hence, there is a tripartite pull on the development needs of the Quantity Surveying Graduate. The present education system of the Quantity Surveyor does not recognise these multi-directional needs and hence often pro-duces a graduate whom the industry sees as not fulfilling their requirements (Wong et al., 2007; Lee and Hogg, 2009; Perera and Pear-son, 2011). This leads to many problems, with greater levels of employer and graduate dissat-isfaction and obstacles to early career develop-ment of the QS graduate.
These conflicting concerns have long fuelled the “education versus training” debate and some conflict between Educators and Employ-ers through which the RICS steers a some-times difficult path. On the one hand it sends messages to the universities that it wishes to see programmes which lean more towards the “academic” rather than the “technical”, whilst
Figure 1. Key stakeholders influence on quantity surveying education
on the other hand it sends messages to em-ployers that they should accept graduates is-suing from its accredited degree programmes as being appropriately qualified to take po-sitions at higher than technician grade (for which the RICS itself has a specific training route via the HND / Foundation Degree). This can create ambiguities and wrong impressions to the industry, creating conflicts in expecta-tions. For its own part, the RICS has created a set of Core Competencies which, if they are to be fully achieved by candidates for mem-bership, requires active cooperation between the academic sector (providers of basic subject knowledge and certain academic skills) and the industrial sector (providers of practical skills training) through the operation of their business.
1.1. Current needs of quantity surveying graduates
Significant growth in undergraduate level edu-cation of Quantity Surveyors stems from the late 1960’s and early 1970’s with the switch from Diplomas in Quantity Surveying, firstly to Ordinary degrees and, within a few years, to Honours Degrees. From the 1971 RICS report “The Future Role of the Quantity Surveyor” (RICS, 1971) identifying specific competencies at the time, the profession began to evolve rapidly and in 1983 a further report was pro-duced, “The Future of the Chartered Quantity Surveyor” (RICS, 1983) as if to further consol-idate the professional status of the QS. Just over twenty years ago, with the publication of the document “QS2000” (Davis Langdon and Everest, 1991) there was recognition of a num-ber of forces acting on the QS profession, high-lighting both the changes to the client body and to the construction industry (Fan et al., 2001a, 2001b; John, 2002; Fellows et al., 2003; Rick, 2005; Cartlidge, 2006; Ling and Chan, 2008; Senaratne and Sabesan, 2008; Maidin and Sulaiman, 2011).
Both the RICS and the educational sector show similarities in their lack of appreciation of the specific requirements industry may have
96
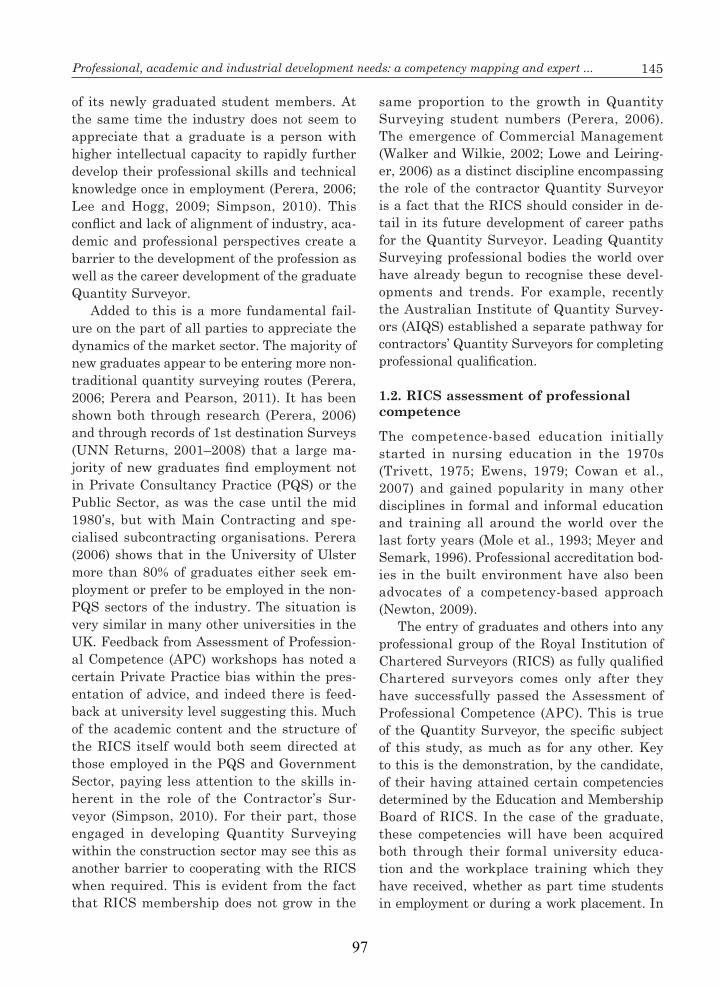
145Professional, academic and industrial development needs: a competency mapping and expert ...
of its newly graduated student members. At the same time the industry does not seem to appreciate that a graduate is a person with higher intellectual capacity to rapidly further develop their professional skills and technical knowledge once in employment (Perera, 2006; Lee and Hogg, 2009; Simpson, 2010). This conflict and lack of alignment of industry, aca-demic and professional perspectives create a barrier to the development of the profession as well as the career development of the graduate Quantity Surveyor.
Added to this is a more fundamental fail-ure on the part of all parties to appreciate the dynamics of the market sector. The majority of new graduates appear to be entering more non-traditional quantity surveying routes (Perera, 2006; Perera and Pearson, 2011). It has been shown both through research (Perera, 2006) and through records of 1st destination Surveys (UNN Returns, 2001–2008) that a large ma-jority of new graduates find employment not in Private Consultancy Practice (PQS) or the Public Sector, as was the case until the mid 1980’s, but with Main Contracting and spe-cialised subcontracting organisations. Perera (2006) shows that in the University of Ulster more than 80% of graduates either seek em-ployment or prefer to be employed in the non- PQS sectors of the industry. The situation is very similar in many other universities in the UK. Feedback from Assessment of Profession-al Competence (APC) workshops has noted a certain Private Practice bias within the pres-entation of advice, and indeed there is feed-back at university level suggesting this. Much of the academic content and the structure of the RICS itself would both seem directed at those employed in the PQS and Government Sector, paying less attention to the skills in-herent in the role of the Contractor’s Sur-veyor (Simpson, 2010). For their part, those engaged in developing Quantity Surveying within the construction sector may see this as another barrier to cooperating with the RICS when required. This is evident from the fact that RICS membership does not grow in the
same proportion to the growth in Quantity Surveying student numbers (Perera, 2006). The emergence of Commercial Management (Walker and Wilkie, 2002; Lowe and Leiring-er, 2006) as a distinct discipline encompassing the role of the contractor Quantity Surveyor is a fact that the RICS should consider in de-tail in its future development of career paths for the Quantity Surveyor. Leading Quantity Surveying professional bodies the world over have already begun to recognise these devel-opments and trends. For example, recently the Australian Institute of Quantity Survey-ors (AIQS) established a separate pathway for contractors’ Quantity Surveyors for completing professional qualification.
1.2. RICS assessment of professional competence
The competence-based education initially started in nursing education in the 1970s (Trivett, 1975; Ewens, 1979; Cowan et al., 2007) and gained popularity in many other disciplines in formal and informal education and training all around the world over the last forty years (Mole et al., 1993; Meyer and Semark, 1996). Professional accreditation bod-ies in the built environment have also been advocates of a competency-based approach (Newton, 2009).
The entry of graduates and others into any professional group of the Royal Institution of Chartered Surveyors (RICS) as fully qualified Chartered surveyors comes only after they have successfully passed the Assessment of Professional Competence (APC). This is true of the Quantity Surveyor, the specific subject of this study, as much as for any other. Key to this is the demonstration, by the candidate, of their having attained certain competencies determined by the Education and Membership Board of RICS. In the case of the graduate, these competencies will have been acquired both through their formal university educa-tion and the workplace training which they have received, whether as part time students in employment or during a work placement. In
97
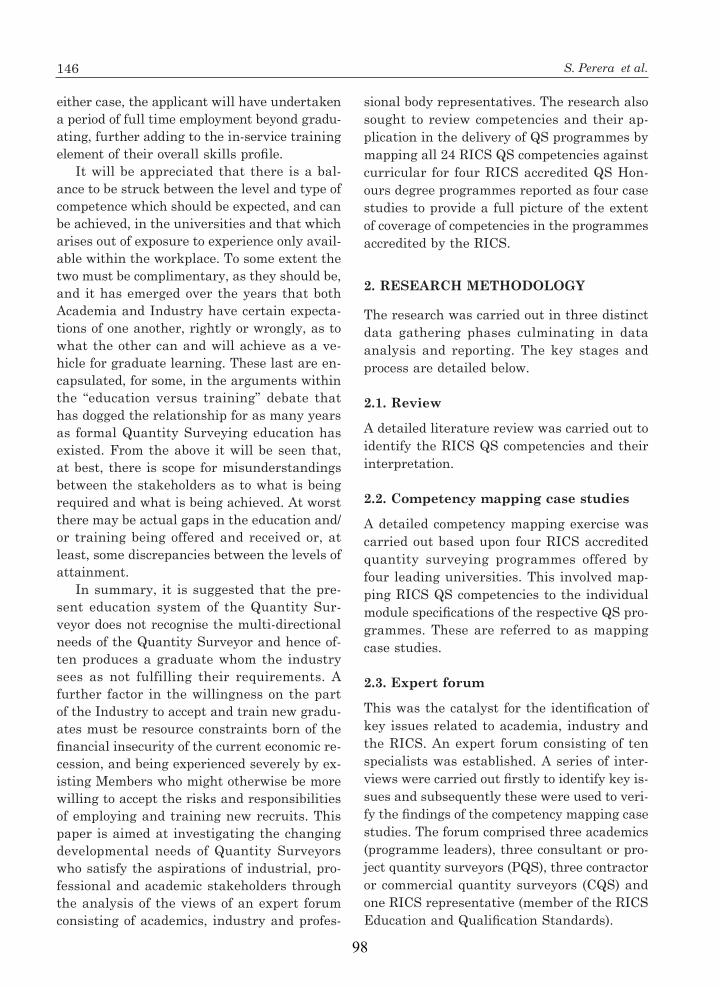
146 S. Perera et al.
either case, the applicant will have undertaken a period of full time employment beyond gradu-ating, further adding to the in-service training element of their overall skills profile.
It will be appreciated that there is a bal-ance to be struck between the level and type of competence which should be expected, and can be achieved, in the universities and that which arises out of exposure to experience only avail-able within the workplace. To some extent the two must be complimentary, as they should be, and it has emerged over the years that both Academia and Industry have certain expecta-tions of one another, rightly or wrongly, as to what the other can and will achieve as a ve-hicle for graduate learning. These last are en-capsulated, for some, in the arguments within the “education versus training” debate that has dogged the relationship for as many years as formal Quantity Surveying education has existed. From the above it will be seen that, at best, there is scope for misunderstandings between the stakeholders as to what is being required and what is being achieved. At worst there may be actual gaps in the education and/or training being offered and received or, at least, some discrepancies between the levels of attainment.
In summary, it is suggested that the pre-sent education system of the Quantity Sur-veyor does not recognise the multi-directional needs of the Quantity Surveyor and hence of-ten produces a graduate whom the industry sees as not fulfilling their requirements. A further factor in the willingness on the part of the Industry to accept and train new gradu-ates must be resource constraints born of the financial insecurity of the current economic re-cession, and being experienced severely by ex-isting Members who might otherwise be more willing to accept the risks and responsibilities of employing and training new recruits. This paper is aimed at investigating the changing developmental needs of Quantity Surveyors who satisfy the aspirations of industrial, pro-fessional and academic stakeholders through the analysis of the views of an expert forum consisting of academics, industry and profes-
sional body representatives. The research also sought to review competencies and their ap-plication in the delivery of QS programmes by mapping all 24 RICS QS competencies against curricular for four RICS accredited QS Hon-ours degree programmes reported as four case studies to provide a full picture of the extent of coverage of competencies in the programmes accredited by the RICS.
2. RESEARCH METHODOLOGY
The research was carried out in three distinct data gathering phases culminating in data analysis and reporting. The key stages and process are detailed below.
2.1. Review
A detailed literature review was carried out to identify the RICS QS competencies and their interpretation.
2.2. Competency mapping case studies
A detailed competency mapping exercise was carried out based upon four RICS accredited quantity surveying programmes offered by four leading universities. This involved map-ping RICS QS competencies to the individual module specifications of the respective QS pro-grammes. These are referred to as mapping case studies.
2.3. Expert forum
This was the catalyst for the identification of key issues related to academia, industry and the RICS. An expert forum consisting of ten specialists was established. A series of inter-views were carried out firstly to identify key is-sues and subsequently these were used to veri-fy the findings of the competency mapping case studies. The forum comprised three academics (programme leaders), three consultant or pro-ject quantity surveyors (PQS), three contractor or commercial quantity surveyors (CQS) and one RICS representative (member of the RICS Education and Qualification Standards).
98
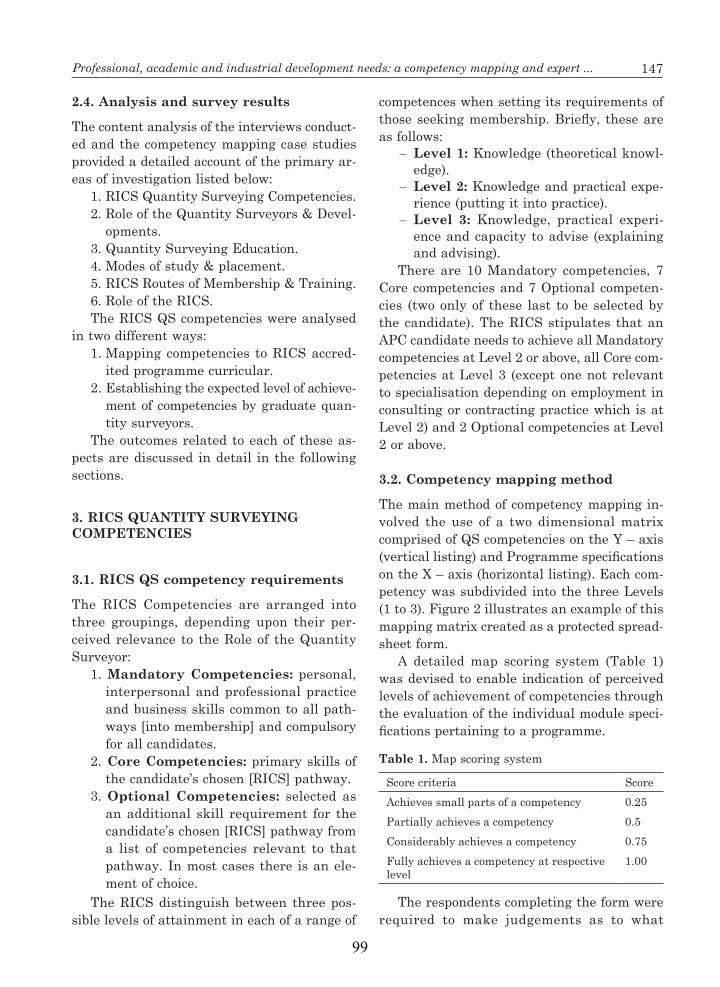
147Professional, academic and industrial development needs: a competency mapping and expert ...
2.4. Analysis and survey results
The content analysis of the interviews conduct-ed and the competency mapping case studies provided a detailed account of the primary ar-eas of investigation listed below:
1. RICS Quantity Surveying Competencies.2. Role of the Quantity Surveyors & Devel-
opments.3. Quantity Surveying Education.4. Modes of study & placement.5. RICS Routes of Membership & Training.6. Role of the RICS.The RICS QS competencies were analysed
in two different ways:1. Mapping competencies to RICS accred-
ited programme curricular.2. Establishing the expected level of achieve-
ment of competencies by graduate quan-tity surveyors.
The outcomes related to each of these as-pects are discussed in detail in the following sections.
3. RICS QUANTITY SURVEYING COMPETENCIES
3.1. RICS QS competency requirements
The RICS Competencies are arranged into three groupings, depending upon their per-ceived relevance to the Role of the Quantity Surveyor:
1. Mandatory Competencies: personal, interpersonal and professional practice and business skills common to all path-ways [into membership] and compulsory for all candidates.
2. Core Competencies: primary skills of the candidate’s chosen [RICS] pathway.
3. Optional Competencies: selected as an additional skill requirement for the candidate’s chosen [RICS] pathway from a list of competencies relevant to that pathway. In most cases there is an ele-ment of choice.
The RICS distinguish between three pos-sible levels of attainment in each of a range of
competences when setting its requirements of those seeking membership. Briefly, these are as follows:
– Level 1: Knowledge (theoretical knowl-edge).
– Level 2: Knowledge and practical expe-rience (putting it into practice).
– Level 3: Knowledge, practical experi-ence and capacity to advise (explaining and advising).
There are 10 Mandatory competencies, 7 Core competencies and 7 Optional competen-cies (two only of these last to be selected by the candidate). The RICS stipulates that an APC candidate needs to achieve all Mandatory competencies at Level 2 or above, all Core com-petencies at Level 3 (except one not relevant to specialisation depending on employment in consulting or contracting practice which is at Level 2) and 2 Optional competencies at Level 2 or above.
3.2. Competency mapping method
The main method of competency mapping in-volved the use of a two dimensional matrix comprised of QS competencies on the Y – axis (vertical listing) and Programme specifications on the X – axis (horizontal listing). Each com-petency was subdivided into the three Levels (1 to 3). Figure 2 illustrates an example of this mapping matrix created as a protected spread-sheet form.
A detailed map scoring system (Table 1) was devised to enable indication of perceived levels of achievement of competencies through the evaluation of the individual module speci-fications pertaining to a programme.
Table 1. Map scoring system
Score criteria ScoreAchieves small parts of a competency 0.25Partially achieves a competency 0.5Considerably achieves a competency 0.75Fully achieves a competency at respective level
1.00
The respondents completing the form were required to make judgements as to what
99
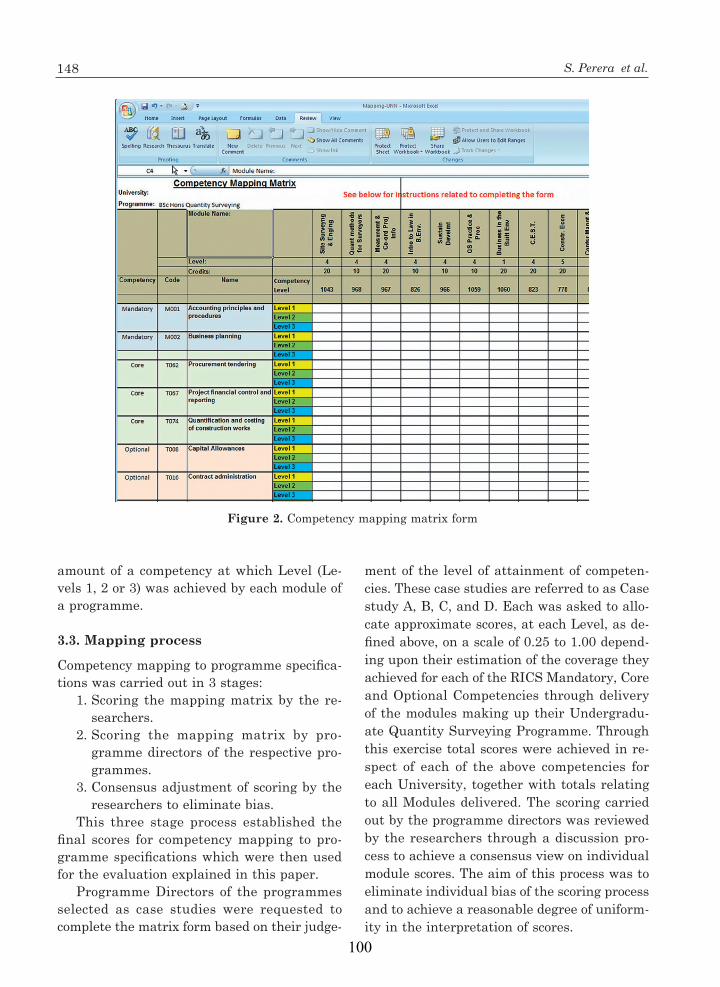
148 S. Perera et al.
amount of a competency at which Level (Le-vels 1, 2 or 3) was achieved by each module of a programme.
3.3. Mapping process
Competency mapping to programme specifica-tions was carried out in 3 stages:
1. Scoring the mapping matrix by the re-searchers.
2. Scoring the mapping matrix by pro-gramme directors of the respective pro-grammes.
3. Consensus adjustment of scoring by the researchers to eliminate bias.
This three stage process established the final scores for competency mapping to pro-gramme specifications which were then used for the evaluation explained in this paper.
Programme Directors of the programmes selected as case studies were requested to complete the matrix form based on their judge-
Figure 2. Competency mapping matrix form
ment of the level of attainment of competen-cies. These case studies are referred to as Case study A, B, C, and D. Each was asked to allo-cate approximate scores, at each Level, as de-fined above, on a scale of 0.25 to 1.00 depend-ing upon their estimation of the coverage they achieved for each of the RICS Mandatory, Core and Optional Competencies through delivery of the modules making up their Undergradu-ate Quantity Surveying Programme. Through this exercise total scores were achieved in re-spect of each of the above competencies for each University, together with totals relating to all Modules delivered. The scoring carried out by the programme directors was reviewed by the researchers through a discussion pro-cess to achieve a consensus view on individual module scores. The aim of this process was to eliminate individual bias of the scoring process and to achieve a reasonable degree of uniform-ity in the interpretation of scores.
100
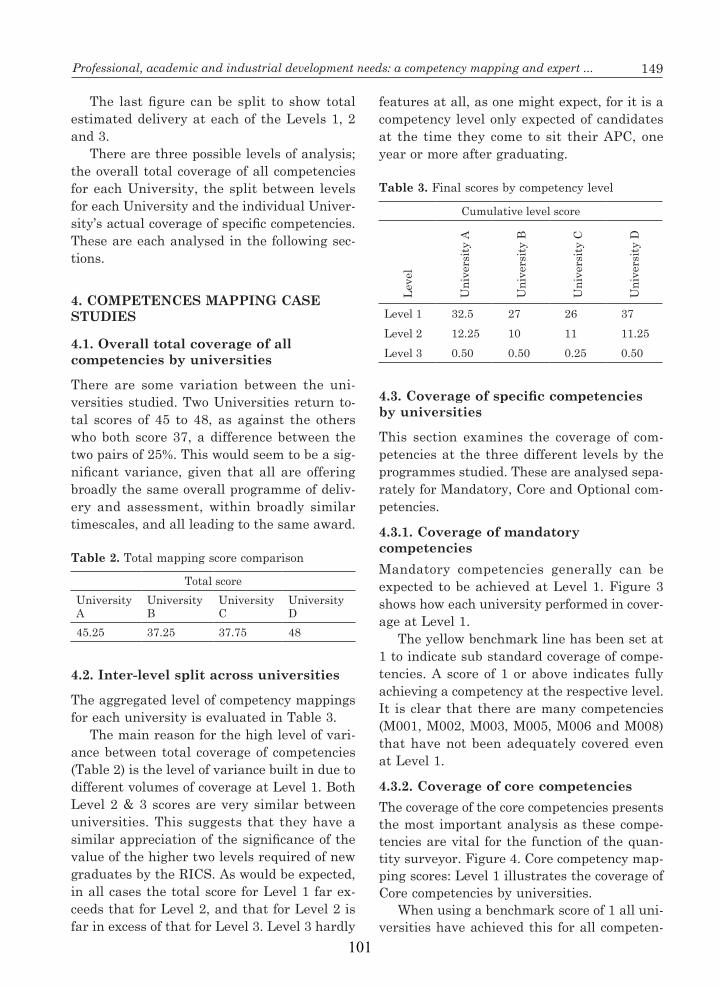
149Professional, academic and industrial development needs: a competency mapping and expert ...
The last figure can be split to show total estimated delivery at each of the Levels 1, 2 and 3.
There are three possible levels of analysis; the overall total coverage of all competencies for each University, the split between levels for each University and the individual Univer-sity’s actual coverage of specific competencies. These are each analysed in the following sec-tions.
4. COMPETENCES MAPPING CASE STUDIES
4.1. Overall total coverage of all competencies by universities
There are some variation between the uni-versities studied. Two Universities return to-tal scores of 45 to 48, as against the others who both score 37, a difference between the two pairs of 25%. This would seem to be a sig-nificant variance, given that all are offering broadly the same overall programme of deliv-ery and assessment, within broadly similar timescales, and all leading to the same award.
Table 2. Total mapping score comparison
Total scoreUniversity A
University B
University C
University D
45.25 37.25 37.75 48
4.2. Inter-level split across universities
The aggregated level of competency mappings for each university is evaluated in Table 3.
The main reason for the high level of vari-ance between total coverage of competencies (Table 2) is the level of variance built in due to different volumes of coverage at Level 1. Both Level 2 & 3 scores are very similar between universities. This suggests that they have a similar appreciation of the significance of the value of the higher two levels required of new graduates by the RICS. As would be expected, in all cases the total score for Level 1 far ex-ceeds that for Level 2, and that for Level 2 is far in excess of that for Level 3. Level 3 hardly
features at all, as one might expect, for it is a competency level only expected of candidates at the time they come to sit their APC, one year or more after graduating.
Table 3. Final scores by competency level
Cumulative level score
Leve
l
Uni
vers
ity A
Uni
vers
ity B
Uni
vers
ity C
Uni
vers
ity D
Level 1 32.5 27 26 37Level 2 12.25 10 11 11.25Level 3 0.50 0.50 0.25 0.50
4.3. Coverage of specific competencies by universities
This section examines the coverage of com-petencies at the three different levels by the programmes studied. These are analysed sepa-rately for Mandatory, Core and Optional com-petencies.
4.3.1. Coverage of mandatory competenciesMandatory competencies generally can be expected to be achieved at Level 1. Figure 3 shows how each university performed in cover-age at Level 1.
The yellow benchmark line has been set at 1 to indicate sub standard coverage of compe-tencies. A score of 1 or above indicates fully achieving a competency at the respective level. It is clear that there are many competencies (M001, M002, M003, M005, M006 and M008) that have not been adequately covered even at Level 1.
4.3.2. Coverage of core competenciesThe coverage of the core competencies presents the most important analysis as these compe-tencies are vital for the function of the quan-tity surveyor. Figure 4. Core competency map-ping scores: Level 1 illustrates the coverage of Core competencies by universities.
When using a benchmark score of 1 all uni-versities have achieved this for all competen-
101
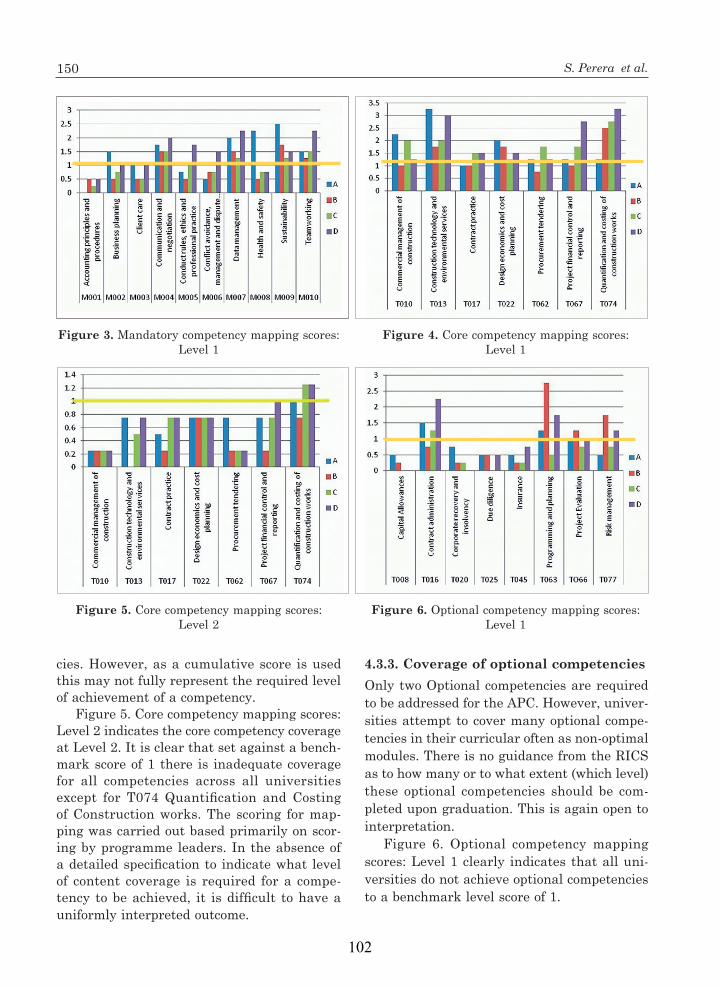
150 S. Perera et al.
cies. However, as a cumulative score is used this may not fully represent the required level of achievement of a competency.
Figure 5. Core competency mapping scores: Level 2 indicates the core competency coverage at Level 2. It is clear that set against a bench-mark score of 1 there is inadequate coverage for all competencies across all universities except for T074 Quantification and Costing of Construction works. The scoring for map-ping was carried out based primarily on scor-ing by programme leaders. In the absence of a detailed specification to indicate what level of content coverage is required for a compe-tency to be achieved, it is difficult to have a uniformly interpreted outcome.
Figure 3. Mandatory competency mapping scores: Level 1
Figure 4. Core competency mapping scores: Level 1
4.3.3. Coverage of optional competenciesOnly two Optional competencies are required to be addressed for the APC. However, univer-sities attempt to cover many optional compe-tencies in their curricular often as non-optimal modules. There is no guidance from the RICS as to how many or to what extent (which level) these optional competencies should be com-pleted upon graduation. This is again open to interpretation.
Figure 6. Optional competency mapping scores: Level 1 clearly indicates that all uni-versities do not achieve optional competencies to a benchmark level score of 1.
Figure 5. Core competency mapping scores: Level 2
Figure 6. Optional competency mapping scores: Level 1
102

151Professional, academic and industrial development needs: a competency mapping and expert ...
5. VIEWS OF THE EXPERT FORUM
5.1. Expected achievement of mandatory, core and optional competencies
The RICS QS competencies provide the basis on which a quantity surveyor will be judged as to their capability to act as an independent, professionally qualified chartered surveyor. The respondents were first asked to consider the competencies in general. The RICS repre-sentative noted that there are more prescribed core competencies for QS than for any other pathway. This was however to be combined with the understanding that not every com-petence need be met by the universities and that the RICS welcomed diversity to reflect the individual strengths of each. Industry CQS re-spondents noted that the competencies were relevant and “do adequately describe what we want”.
A summary of expected level of competency is presented in Table 4. These were extracted from 8 expert forum members who responded to this section. They include 3 academics, 3 CQS and 2 PQS. Also, not all the 8 respond-ents have graduate level expectation for some Optional competencies such as Capital allow-ances, Corporate recovery and insolvency, Due diligence and Programming and planning.
The RICS stipulates that an APC candidate needs to achieve all Mandatory competencies at Level 2 or above. Table 4 shows that some of the experts expect graduate QS to have achieved Mandatory competencies at Level 2 or even Level 3. For some competencies such as Communication and negotiation, Data management, and Teamworking, this may be expected due to hypothetical projects and multidisciplinary projects modules involving simulations in most QS degree programmes. But for other competencies such as Business planning, Client care, conduct rules, ethics and professional practice, Health and Safety, etc. it is difficult to see how graduate QS can achieve this through university education.
Table 4 also revealed that most Core com-petencies are expected to be achieved at Level
2 by graduate QS. It is however worrying that certain academics think that core QS skills such as Design economics and cost planning, Quantification and costing of construction works, etc. should be achieved to Level 1 de-spite possibilities for learning at Level 2. More worrying is the expectation of a few industry experts who think that graduate QSs should have achieved Level 3 in Commercial man-agement of construction, Construction tech-nology and environmental services, Contract practice, Design economics and cost planning and Quantification and costing of construction works. The RICS stipulates that an APC can-didate needs to achieve all Core competencies at Level 3 (except one not relevant to speciali-sation depending on employment in consulting or contracting practice which is at Level 2). To gain relevant experience and skills, an APC candidate must have worked for 3 years after graduation. Hence it is difficult to see how graduate QSs will have achieved Level 3 as some of the experts anticipated.
Furthermore, the RICS stipulates that an APC candidate needs to achieve two Optional competencies at Level 2 or above in the areas of specialisation. Table 4 shows the experts’ expected level of achievement of Optional com-petencies by graduate quantity surveyors at mainly Level 1 and 2. Whilst the expectation at Level 2 is questionable, it is interesting to see four experts aiming for Level 3 in Contract administration and Programming and plan-ning. The stated competencies are however popular specialisation areas for PQS and CQS respectively hence this is partly expected.
In conclusion, Table 4 shows that there is disparity in the expected level of competency. When viewed in relation to the mapping case studies, there appears to be inconsistency of views of the major construction stakeholders. There are indeed different interpretations of graduate level competency and actual attain-ment perhaps due to individual understanding of competencies, level definitions and the role of universities in the training of quantity sur-veyors.
103
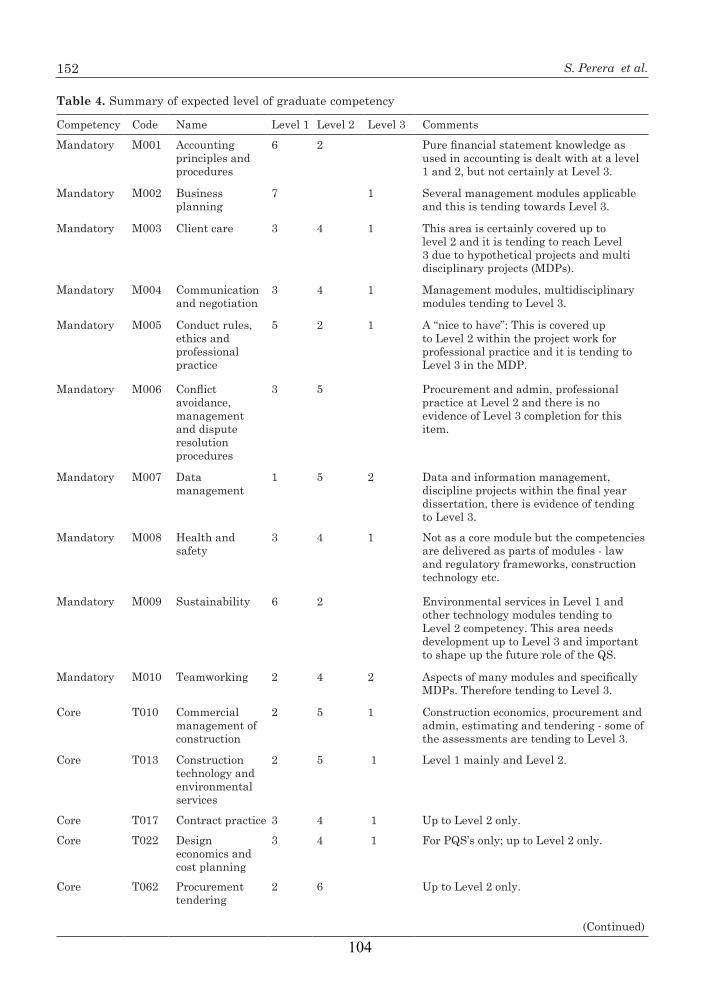
152 S. Perera et al.
Table 4. Summary of expected level of graduate competency
Competency Code Name Level 1 Level 2 Level 3 CommentsMandatory M001 Accounting
principles and procedures
6 2 Pure financial statement knowledge as used in accounting is dealt with at a level 1 and 2, but not certainly at Level 3.
Mandatory M002 Business planning
7 1 Several management modules applicable and this is tending towards Level 3.
Mandatory M003 Client care 3 4 1 This area is certainly covered up to level 2 and it is tending to reach Level 3 due to hypothetical projects and multi disciplinary projects (MDPs).
Mandatory M004 Communication and negotiation
3 4 1 Management modules, multidisciplinary modules tending to Level 3.
Mandatory M005 Conduct rules, ethics and professional practice
5 2 1 A “nice to have”: This is covered up to Level 2 within the project work for professional practice and it is tending to Level 3 in the MDP.
Mandatory M006 Conflict avoidance, management and dispute resolution procedures
3 5 Procurement and admin, professional practice at Level 2 and there is no evidence of Level 3 completion for this item.
Mandatory M007 Data management
1 5 2 Data and information management, discipline projects within the final year dissertation, there is evidence of tending to Level 3.
Mandatory M008 Health and safety
3 4 1 Not as a core module but the competencies are delivered as parts of modules - law and regulatory frameworks, construction technology etc.
Mandatory M009 Sustainability 6 2 Environmental services in Level 1 and other technology modules tending to Level 2 competency. This area needs development up to Level 3 and important to shape up the future role of the QS.
Mandatory M010 Teamworking 2 4 2 Aspects of many modules and specifically MDPs. Therefore tending to Level 3.
Core T010 Commercial management of construction
2 5 1 Construction economics, procurement and admin, estimating and tendering - some of the assessments are tending to Level 3.
Core T013 Construction technology and environmental services
2 5 1 Level 1 mainly and Level 2.
Core T017 Contract practice 3 4 1 Up to Level 2 only.Core T022 Design
economics and cost planning
3 4 1 For PQS’s only; up to Level 2 only.
Core T062 Procurement tendering
2 6 Up to Level 2 only.
(Continued)
104
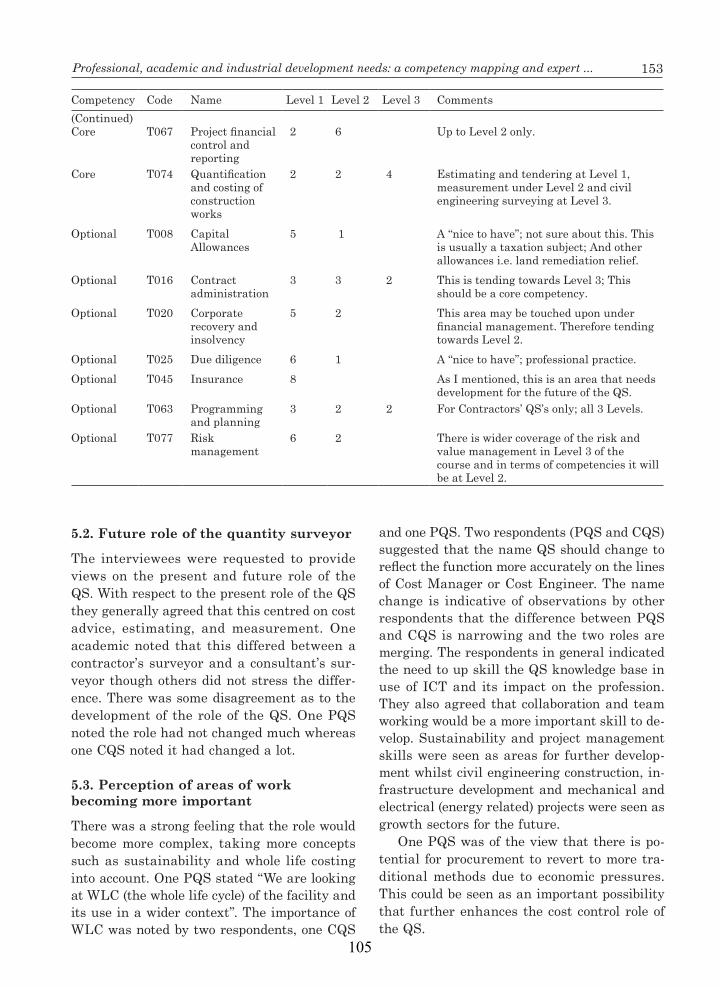
153Professional, academic and industrial development needs: a competency mapping and expert ...
Competency Code Name Level 1 Level 2 Level 3 Comments(Continued)Core T067 Project financial
control and reporting
2 6 Up to Level 2 only.
Core T074 Quantification and costing of construction works
2 2 4 Estimating and tendering at Level 1, measurement under Level 2 and civil engineering surveying at Level 3.
Optional T008 Capital Allowances
5 1 A “nice to have”; not sure about this. This is usually a taxation subject; And other allowances i.e. land remediation relief.
Optional T016 Contract administration
3 3 2 This is tending towards Level 3; This should be a core competency.
Optional T020 Corporate recovery and insolvency
5 2 This area may be touched upon under financial management. Therefore tending towards Level 2.
Optional T025 Due diligence 6 1 A “nice to have”; professional practice.Optional T045 Insurance 8 As I mentioned, this is an area that needs
development for the future of the QS.Optional T063 Programming
and planning3 2 2 For Contractors’ QS’s only; all 3 Levels.
Optional T077 Risk management
6 2 There is wider coverage of the risk and value management in Level 3 of the course and in terms of competencies it will be at Level 2.
5.2. Future role of the quantity surveyor
The interviewees were requested to provide views on the present and future role of the QS. With respect to the present role of the QS they generally agreed that this centred on cost advice, estimating, and measurement. One academic noted that this differed between a contractor’s surveyor and a consultant’s sur-veyor though others did not stress the differ-ence. There was some disagreement as to the development of the role of the QS. One PQS noted the role had not changed much whereas one CQS noted it had changed a lot.
5.3. Perception of areas of work becoming more important
There was a strong feeling that the role would become more complex, taking more concepts such as sustainability and whole life costing into account. One PQS stated “We are looking at WLC (the whole life cycle) of the facility and its use in a wider context”. The importance of WLC was noted by two respondents, one CQS
and one PQS. Two respondents (PQS and CQS) suggested that the name QS should change to reflect the function more accurately on the lines of Cost Manager or Cost Engineer. The name change is indicative of observations by other respondents that the difference between PQS and CQS is narrowing and the two roles are merging. The respondents in general indicated the need to up skill the QS knowledge base in use of ICT and its impact on the profession. They also agreed that collaboration and team working would be a more important skill to de-velop. Sustainability and project management skills were seen as areas for further develop-ment whilst civil engineering construction, in-frastructure development and mechanical and electrical (energy related) projects were seen as growth sectors for the future.
One PQS was of the view that there is po-tential for procurement to revert to more tra-ditional methods due to economic pressures. This could be seen as an important possibility that further enhances the cost control role of the QS.
105

154 S. Perera et al.
5.4. Relative importance of the QS competencies
Four respondents (three CQS, one PQS) not-ed that there were areas that were not given enough attention or that the students had poor knowledge of; valuation (1), measurement (1), building contracts (1), construction techno-logy (2), M and E services (1), environmental services (1), team working (1), and data man-agement (1).
When queried about possible additional competencies, three respondents (1 PQS, 1 RICS and 1 CQS) identified sustainability, business management and planning, account-ing, communication (language, report writing and team working), new building technolo-gies, pre-fabrication, civil and infrastructure engineering, life cycle costing as possible ad-ditional competencies. Some of these are al-ready covered in some competencies. Since competencies do not give lengthy descriptions of content, these are open for interpretation.
Three respondents (2 academic, 1 CQS) were happy with the coverage and felt that there should be no new additions to the com-petencies/skills. One PQS stated that contract administration is listed as optional but felt that it should be core. No respondents felt that there was any obsolete content taught.
5.5. Views on quantity surveying education
Six respondents shared their views on the pre-sent nature of QS education (1 RICS, 2 aca-demics, 2 PQS, 3 CQS). As class sizes get big-ger to make courses more economically viable opportunities for tutors to spend more contact time and give more feedback will be compro-mised by the numbers of students they have to work with.
One PQS expressed the view that there was too much mass teaching, with a mismatch where the learning outcome does not map to the industry requirement and also felt that some lecturers need to update their knowledge so that the graduates were appraised of the latest techniques. The respondent did however
note that it was not possible to make gener-alisations and there were differences between universities and individual lecturers. One PQS also felt that the RICS had less than adequate involvement in regulating curricular while an-other CQS felt that although there are many RICS accredited programmes they were not comparable in most respects.
5.5.1. Level of satisfaction with the curriculum used to produce graduate QSThe academic curricular content was comment-ed on by 5 respondents (1 academic, 1 PQS, 3 CQS). The academic noted that they were able to cover a lot of the core competencies in a 4 year degree and that they could map mod-ules that they teach to the core competencies. 2 respondents (1 PQS, 1 CQS) stated that the coverage was pretty good in general terms. However, the industry respondents felt that it was difficult to map modules taught at univer-sities to RICS competencies.
One PQS felt that some courses do not de-liver what employers want and one academic stated “students are going out without the nec-essary skills to undertake their basic job and that is where employees feel that the universi-ties are letting the system down”. This being said, the general view was that it is not easy to generalise and some courses are better than others and also it is down to other factors such as the student, mode of study, and employer.
5.5.2. Views on QS programme curriculum developmentOn aspects of curricular development 5 inter-viewees responded. Two identified measure-ment as an area that needs greater attention (1 CQS, 1 PQS). Other areas identified include taxation (CQS), understanding building tech-nology and construction (CQS), bill of quan-tities (PQS), cost planning, preconstruction estimating (CQS) while there was an over-emphasis on management of projects (1 PQS, 1 CQS).The aspect that caused most concern for one PQS was that graduates had a poor understanding about construction technol-ogy and no real understanding of on-site con-
106

155Professional, academic and industrial development needs: a competency mapping and expert ...
ditions. Reflecting on these views it is clear that greater attention is needed to some core areas of quantity surveying. If so, the academ-ics will be faced with the dilemma of identify-ing which areas to forego in lieu of areas of expansion.
5.5.3. The role of universities in producing a graduate quantity surveyorAll 10 respondents considered what a univer-sity should provide with regards to QS educa-tion. They were requested to choose between:
1. Provide an overall academic knowledge and a good foundation in Quantity Sur-veying, or
2. Concentrate on training students for di-rect QS employment.
Six respondents agreed with statement 1 (2 PQS, 1 CQS, 1 RICS, 2 academics). 2 re-spondents agreed with statement 2 (1 PQS, 1CQS). One CQS felt that it should be a bit of both, a balance of academia with vocational on a 50/50 basis. One academic was undecided. One CQS stated that over the last 30 years they have seen the quality of technical Quanti-ty Surveying become diluted and warned that if the trend continues we would lose technical standards forever.
In overall terms most wished to see a sound academic background for graduate quantity surveyors but did not want to see any com-promise on the level of knowledge. They also seem to expect improved technical competence in graduates going into the industry.
5.5.4. Industry – academia collaboration in QS programme deliveryTwo respondents (1 PQS, 1 CQS) commented that there is a reasonable level of employer en-gagement with the universities. However, the level and extent of engagement is one aspect that requires further exploration.
5.5.5. Industry – academia level of communicationCommunications between universities and in-dustry were generally seen to be reasonable although it was added that universities try the hardest and industry needs to be better at
communication. The state of the economy was seen as a factor that influences level of com-munication (1 academic). Greater involvement of the industry as a stakeholder in the devel-opment of programmes, face to face industry consultation and industry taking programme development and contributions as part of their corporate social responsibility were seen as steps that can be used to improve the situa-tion.
5.6. Modes of study and industry placement
5.6.1. Perceived success of modes of studyThe majority of respondents (9) stated that Part Time students were far better and more rounded than full time students, though this was usually in respect of their dedication to work and approach to the job.
5.6.2. Industry placement in quantity surveying educationAll 10 interviewees had contributions to make concerning their views on placement. This was unanimously seen as a positive, if not crucial, thing for a student to have. The experience the student gains from having practical experience cannot be replicated in any other way. The current economic situation is having a nega-tive impact on the availability of placements.
5.7. RICS membership routes and training
5.7.1. Routes of membershipThe RICS QS competencies (learned through education and industry experience) provide the basis on which a quantity surveyor will be judged as to their capability to act as an independent professionally qualified chartered surveyor. Graduate QS can become profession-ally qualified upon successful completion of the APC after 3 years of post-qualification indus-try experience. The graduate route is still ap-parently the most popular route to chartered membership. It is expected to breach the gap
107

156 S. Perera et al.
between what is learnt at university and what is needed to get chartered. As a result, it is useful to investigate the appropriateness of this membership route and others.
The RICS recently revised their member-ship pathways.
5.7.2. Level of awarenessAccordingly, two interviewees (1PQS, 1CQS) stated that they are not familiar with the new routes of membership other than the graduate route.
5.7.3. The appropriateness of routes of membershipA total of seven (1 RICS, 2 academic, 2 PQS, 2 CQS) expressed content with the graduate route of membership. One CQS did note that it was sometimes hard to push graduates into becoming chartered, suggesting that this was due to a combination of fee levels and their not seeing any advantage in becoming chartered. Another problem that exists is that more spe-cialised contractors did not give the graduate a wide enough experience in some competencies (1 academic, 1 RICS).
The new Associate pathway was stressed as not being a shortcut to becoming chartered surveyor by the RICS representative. One aca-demic said that it was a nice idea but did not see its relevance and felt that it was not clear enough where the cut off point was between the two levels while another expressed some reser-vations. One PQS felt that it may lead to people aiming for a minimum standard and that As-socRICS is not good enough to be recognised. 1 CQS noted that it was helpful to people who do not have degrees but to then progress to MRICS or FRICS was a very convoluted route. Another CQS said their company had looked at this route but gone back to the graduate route. These sentiments suggest there is lack of un-derstanding about the new route as well as some doubt as to the need for it.
There was a mixed response to the new Senior Professional route. Three respondents stated that they were not happy with this route. 1 academic viewed it as a “rubber stamping” exercise. One CQS said “my main problem with that route is that it does not test techni-
cal competence”. One PQS did not think that people should just be given MRICS for their long experience and although it provides an op-portunity to get practitioners into mainstream RICS, they should still fit the APC model and competencies. One academic warned that the RICS have to be careful not to be seen as an institution desperate to get new members in. On the positive side, one PQS noted that it was good and had worked well for them, adding that the CIOB are doing the same thing.
5.7.4. Availability and importance of a structured training programme for APCThe RICS representative noted that unless the company has signed up to the structured training programme they should not take on a graduate for APC. Three respondents (2 CQS, 1 PQS) stated that they did have a structured training programme. One PQS noted that there were very low completion rates for the APC and felt that this was due to very poor levels of basic knowledge, with big gaps be-tween what is learnt at university and what is needed to get chartered. One possible reason for this was seen as employers not considering it as important and that they lack a structured training programme. It was also noted that it is difficult to provide all the training in three years. Smaller companies often struggle as they do not have the volume or frequency of work types to enable them to have a smooth training process. One PQS was highly criti-cal of the APC process itself, stating that it is a daunting process that makes candidates unduly nervous. The RICS process compares with the CIOB less favourably as the CIOB process is friendlier and they help you to get through it.
5.8. Views on the role of RICS
5.8.1. Level of communications with the RICSThe level of communication and the respond-ents’ perception was analysed with respect to RICS Partnerships for programme accredita-tion, the RICS and Universities, the RICS and Industry communication, Industry and Uni-versities communication.
108
157Professional, academic and industrial development needs: a competency mapping and expert ...
With specific reference to the communica-tion between the RICS and universities 4 re-spondents (2 academic, 1 CQS, 1 PQS) made contributions. The 2 academics noted that they had a good rapport with the RICS. The CQS did not know about this while the PQS thought that some had good communication with the RICS and others did not.
The general consensus with respect to com-munications between the RICS and industry was that it is in need of much improvement, although it is beginning to move in the right direction. There is a need for increase in re-gional and local level of involvement (2 aca-demic), fees scales need to be more realistic (1 PQS), and RICS needs to be more in touch with leading edge work (1 PQS). Three re-spondents (1 PQS, 2 CQS) did not really have any contact with RICS through their role in the company with one commenting that RICS has lost its focus on members and become a business instead of an Institution (CQS).
5.8.2. Level of success of the RICS – university partnership agreementThe RICS partnership process was seen as facilitating greater discussion, but most com-munications still came down to personal re-lationships. One academic saw the accredita-tion partnership as a way to understand how the course is being assessed “so that students come out with the ability to be Quantity Sur-veyors”. These indicate the primary role of the RICS partnership agreement as regulat-ing RICS accredited programmes. However, the level and detail of regulation was criti-cised. One PQS felt that there was a conflict of interest within the RICS Education Board if there were academic members on the board and these influenced its decisions. But, this is questionable as the role of Board is not nec-essarily to project the view of industry alone. A balanced representation perhaps might be useful. Lack of consultation with the profes-sional group was also noted adding that RICS communication with industry was not good. One CQS did not know about the partnership arrangements. Another felt that there was a real inertia around working out solutions to
problems that were identified. There was rec-ognition of the difficulty involved in getting all three parties around the table and keeping the lines of communication open.
6. DISCUSSION
The research aimed at investigating the chang-ing developmental needs of Quantity Survey-ors who satisfy the aspirations of industrial, professional and academic stakeholders. It used several research instruments to achieve this:
1. Review of RICS QS competencies: pro-vides details of competencies.
2. Competency mapping cases studies in-volving 4 RICS accredited QS honours degree programmes: indicates how com-petencies are mapped to programme cur-ricular.
3. Expert views from a forum of experts (in-dustry, academic and the RICS): enlight-ens on level of competency to be achieved by a graduate and other contextual fac-tors.
The main research objectives sought to ascertain several key aspects related to QS education and development. These are sum-marised in the following sections.
6.1. Summary of the status of RICS QS competencies
The RICS has formulated clear and detailed documentation (RICS, 2009) identifying, classi-fying and explaining QS competencies. This is primarily aimed at providing guidance to APC candidates seeking full professional member-ship of the institution. There are 24 QS com-petencies classified as Mandatory (10), Core (7) and Optional (7). These competencies can be achieved at any of three levels as Level 1, 2 or 3. The RICS defines that an APC candidate needs to achieve all Mandatory competencies at Level 2 or above, all Core competencies at Level 3 (except one not relevant to specialisa-tion depending on employment in consulting or contracting practice which is at Level 2) and two Optional competencies at Level 2 or above.
109
158 S. Perera et al.
These competencies form the basis for de-scribing the knowledge-base of the quantity surveyor and at APC to ascertain the level of attainment. Therefore, they should form the basis on which QS degree programme curricu-lum is modelled. At each programme accredi-tation the RICS seeks to establish whether the programme in question deals with these com-petencies. There is no systematic approach or guidance as to what level of competency need be achieved by a graduate completing a RICS accredited programme. At present it is an es-timation of whether core competencies are ad-dressed in module specifications.
This process has led to RICS accredited honours degree programmes across the coun-try producing graduates demonstrating con-siderably varying degrees of competence. It is then left to the employers and graduates themselves to up skill to the required bench-mark specified for the APC. What was clear-ly found in this research is that this process produces a graduate less confident to face the industry and an employer less satisfied than they might otherwise be. This clearly confirms the findings of Lee and Hogg (2009).
6.2. Key findings of competency mapping
The main findings related to the competency mapping can be summarised as follows:
1. There is no prescribed threshold bench-mark standard for achieving competen-cies at graduate level.
2. There are no detailed specifications to in-dicate what content should be covered to achieve a competency.
3. Different universities aim to achieve competencies at different levels, based on their own interpretations.
4. In the absence of a detailed competency specification, the level of achievement of competencies as judged by our own in-terpretation seems satisfactory for the most part. There are inadequacies in the level of coverage of some competencies.
5. Programme leaders tend to interpret levels of achievement of competencies differently to one another, resulting in apparent differing levels of achievement
of competencies and different levels of coverage.
6. There is no standard way to interpret the actual achievement of competencies.
7. There is no formal competency mapping process available for universities in cur-ricular development or revision.
8. Most mandatory competencies are not achieved to a significant extent by the universities studied to date.
9. Core competencies are well achieved at Level 1 based on interpretations made by universities and some attempt made at Level 2. There is greater scope for achieving core competencies to some ex-tent at Level 2.
10. Optional competencies are not reason-ably achieved at Level 1 by most univer-sities. Some competencies are however dealt with to a considerably higher level by some universities. There is greater variation across universities.
6.3. Views of the expert forum
Most experts were of the opinion that compe-tencies in general should be achieved at Level 1 by graduates. However, some academic ex-perts were of the view that universities achieve more than Level 1 in some competencies and move greatly towards Level 2. One Consult-ant QS was of the view that both Mandatory and Core competencies should be achieved at Level 2.
The above situation is exactly reflected with respect to the coverage of competencies. There is no uniform view and it is very much open to individual interpretation. These tensions of interpretation are well evident in the above competency mapping case study analysis.
7. CONCLUSIONS
The development needs of quantity survey-ors are highly influenced by the needs of the industry and profession and shaped by the perception of academia that produces QS graduates to the profession. This research analysed RICS QS competencies and how they are mapped against degree programmes 110

159Professional, academic and industrial development needs: a competency mapping and expert ...
that produce QS graduates. It revealed that there is a huge variation in interpretation of competencies and levels of achievement. The documentation available is inadequate for this purpose probably because it is intended for APC candidate guidance. The competency mapping case studies revealed that there is a high level of variation in the mapping of com-petencies between programmes especially at Level 1. Although based on the views of pro-gramme directors the mapping indicated that most core competencies are well mapped but that there are deficiencies in mandatory and optional competencies. The net result is that there is significant variation in the quality and level of graduates produced by different degree programmes accredited by the RICS. This problem is exacerbated as the programme directors as well as industry experts have con-siderably varying degree of interpretation of competencies.
The absence of a threshold benchmark that clearly defines graduate level of competence has led the industry to have unrealistic expec-tations; academia to aspire for unattainable levels of competence, producing a less than satisfied graduate that defies direction.
The expert forum was also used to extract contextual factors that influence industrial, professional and academic development of QS graduates. Overwhelming majority of the ex-pert forum was of the view that the aim of universities’ should be to provide an overall academic knowledge and a good foundation in Quantity Surveying as opposed to provide training to produce a QS for the industry.
7.1. Limitations
The analysis of competencies was limited to the documents currently available for down-load from the RICS web portal. The mapping of competencies was limited to opinions of the programme directors moderated through cursory examination of module specifications. Therefore it is possible that there could be a reasonable degree of variation in the outcome of mappings. But the authors are of the opin-ion that this would not be to an extent that
would undermine the overall conclusions de-rived for the project.
7.2. Further research and directions
The focus of the research was to evaluate the views of the two main stakeholders of gradu-ate QS education; the universities and industry. The universities were represented by academics responsible for programme delivery while the industry was represented by consultant (PQS), contractor or commercial (CQS). The views of these stakeholders on the relationship with the RICS were also investigated. There is a con-siderable degree of differing views and lack of responsibility from all stakeholders, mainly arising out of inaccurate interpretations and lack of definition. This lack of a common bench-mark for the interpretation of achievement of competencies by graduates clearly contributes to the dissatisfaction and false expectations on the part of the industry and thus the demorali-sation of the graduate. In order to address this situation and thereby align the disparate views of industry, academia and the RICS, further re-search in the development of a Graduate Com-petency Threshold Benchmark and the Compe-tency Mapping Framework will be required.
REFERENCES
Bowen, P., Cattell, K., Distiller, G. and Edwards, P. J. (2008) Job satisfaction of South African quantity surveyors: An empirical study, Construction Man-agement and Economics, 26(7), pp. 765–780. http://dx.doi.org/10.1080/01446190801998724
Cartlidge, D. (2006) New aspects of quantity surveying practice. 2nd ed. Butterworth Heinemann.
Cowan, D. T., Norman, I. and Coopamah, V. P. (2007) Competence in nursing practice: A controversial con-cept – A focused review of literature, Accident and Emergency Nursing, 15(1), pp. 20–26. http://dx.doi.org/10.1016/j.aaen.2006.11.002
Davis Langdon and Everest (1991) Quantity surveying 2000. UK: Royal Institution of Chartered Surveyors (RICS).
Ewens, T. (1979) Transforming a liberal arts curricu-lum: Alverno College. In: Grant, G., et al. (ed.), On competence: A critical analysis of competence-based reforms in higher education. San Francisco: Jossey-Bass, pp. 259–298.
Fan, L. C. N., Ho, C. M. F. and Ng, V. C. M. (2001a) A stu dy of surveyors’ ethical behavior, Construction Management and Economics, 19(1), pp. 19–36. http://dx.doi.org/10.1080/014461901452058111

160 S. Perera et al.
Fan, L. C. N., Ho, C. M. F. and Ng, V. C. M. (2001b) Ef-fect of professional socialization on quantity survey-ors ethical perception in Hong Kong, Engineering, Construction and Architectural Management, 8(4), pp. 304–312. http://dx.doi.org/10.1108/eb021191
Fellows, R., Liu, A. and Fong, C. (2003) Leadership style and power relations in quantity survey-ing in Hong Kong, Construction Management and Economics, 21(8), pp. 809–818. http://dx.doi.org/10.1080/0144619032000174521
John, W. (2002) Challenges for the quantity surveying profession in the light of new developments, The Surveyor, 4, pp. 19–23.
Lee, C. C. T. and Hogg, K. (2009) Early career training of quantity surveying professionals. In: Proceedings of the RICS COBRA research conference, University of Cape Town, South Africa, 10–11 September 2009.
Ling, F. Y. Y. and Chan, A. H. M. (2008) Internationalising quantity surveying services, Engineering, Construc-tion and Architectural Management, 15(5), pp. 440–455. http://dx.doi.org/10.1108/09699980810902730
Lowe, D. and Leiringer, R. (2006) Commercial manage-ment of projects: Defining the discipline. Blackwell Publishing.
Male, S. (1990) Professional authority, power and emerg-ing forms of ‘profession’ in quantity surveying, Con-struction Management and Economics, 8(2), pp. 191–204. http://dx.doi.org/10.1080/01446199000000016
Maidin, A. J. and Sulaiman, S. S. (2011) Importance of legal education for quantity surveying professionals: A proposal for developing a legal studies module for Malaysian system, Journal of Applied Sciences Re-search, 7(13), pp. 2249–2256.
Meyer, T. and Semark, P. (1996) A framework for the use of competencies for achieving competitive advantage, South African Journal of Business Management, 27(4), pp. 96–103.
Mole, G., Plant, R. and Salaman, G. (1993) Develop-ing executive competencies: Learning to con-front, confronting to learn, Journal of European Industrial Training, 17(2), pp. 3–7. http://dx.doi.org/10.1108/03090599310027138
Newton, S. (2009) Transformational higher education in the built environment, Journal for Education in the Built Environment, 4(1), pp. 100–112. http://dx.doi.org/10.11120/jebe.2009.04010100
Pathirage, C. P. and Amaratunga, R. D. G. (2006) A vi-sion for the quantity surveying education in the 21st century: United Kingdom perspective. In: Custom-ising the quantity surveying education, Department of Building Economics, University of Moratuwa, Sri Lanka.
Perera, R. S. (2006) Views of prospective graduate survey-ors on their professional career plans. Final report, RICS NI, August 2006.
Perera, S. and Pearson, J. (2011) Alignment of profession-al, academic and industrial development needs for quantity surveyors: Post recession dynamics. [Online] RICS Education Trust funded research report, UK. Available at: http://www.northumbria-qs.org/RICS_
Alignment/Reports/Alignment_of_views_final_report.pdf [accessed 25 October 2011]
Pheng, L. S. and Ming, K. H. (1997) Formulating a strate-gic marketing mix for quantity surveyors, Marketing Intelligence & Planning, 15(6), pp. 273–280. http://dx.doi.org/10.1108/02634509710184857
Rashid, K. A. (2002) A study on the curricula for the bach-elor of quantity surveying courses in Malaysia, The Surveyor, 3, pp. 17–22.
Rick, B. (2005) How much measurement is enough? Quan-tity surveying education in Australia, The Building Economist, pp. 16–20.
RICS (1971) The future role of the quantity surveyor. RICS.RICS (1983) The future role of the chartered quantity sur-
veyor. RICS.RICS (2009a) RICS employability threshold consultation
document: Letter to partner institutions. RICS, Oc-tober 2009.
RICS (2009b) Requirements and competencies, RICS edu-cation and qualification standards. [Online] RICS. Available at: http://www.rics.org/site/scripts/down-load_info.aspx?fileID=3729&categoryID=98 [accessed 2010].
Rowe, G. and Wright, G. (2001) Expert opinions in fore-casting: Role of the Delphi technique. In: Arm-strong, J. S. (ed.), Principles of forecasting: A hand-book of researchers and practitioners. Boston: Kluwer Academic Publishers, pp. 125–144.
Senaratne, S. and Sabesan, S. (2008) Managing knowledge as quantity surveyors: An exploratory case study in Sri Lanka, Built-Environment Sri Lanka, 8(2), pp. 41–47.
Simpson, Y. (2010) Twenty first century challenges for the professional quantity surveyor. In: Proceedings of the RICS COBRA 2010 conference, Dauphine Université, Paris.
Smith, P. (2009) Trends in the Australian quantity survey-ing profession: 1995–2008. In: Proceedings of the 13th Pacific Association of Quantity Surveyors Congress (PAQS 2009), 17–18 August 2009, Kuala Lumpur, pp. 22–32.
Trivett, D. A. (1975) Competency programs in higher education. ERICI Higher Education Research Report No. 7. Washington, D.C.: American Association for Higher Education, (ED 118 023).
UNN Returns (2001–2008) UNN returns. Annual 1st Des-tination returns from the University of Northumbria to RICS Partnership Accreditation Board 2001–2008.
Walker, I. and Wilkie, R. (2002) Commercial management in construction. Blackwell Publishing.
Wong, J. M. W., Wong, F. K. W. and Hui, E. C. M. (2007) A study to improve higher education for surveying professionals in Hong Kong, Journal for Education in the Built Environment, 2(1), pp. 76–89. http://dx.doi.org/10.11120/jebe.2007.02010076
112

Professional competency-basedanalysis of continuing tensionsbetween education and training
in higher educationSrinath Perera
School of Computing Engineering and Mathematics,Western Sydney University, Sydney, Australia
Solomon Olusola BabatundeFaculty of Engineering and Environment, Northumbria University,
Newcastle upon Tyne, UKJohn Pearson
Department of Architecture and Built Environment,Northumbria University, Newcastle upon Tyne, UK, and
Damilola EkundayoDepartment of Real Estate and Construction, School of the Built Environment,
Oxford Brookes University, Oxford, UK
AbstractPurpose – The education and training of construction graduates are highly influenced by thehigher education institutions which produced them and the relevant professional bodies, which setthe competencies that guide both academic and industrial learning. Thus, it is important to ascertainwhat the key stakeholders perceive construction graduates should achieve in competencies. Constructionis a practice-oriented collection of professions, thus, this research focussed on the quantity surveying(QS) profession that is responsible for cost control and management of construction projects, andaccredited by the Royal Institution of Chartered Surveyors. The purpose of this paper is to identifyand analyse the expected level of competencies attained by QS graduates, assess the industry perceptionof the achievement of competencies by QS graduates, and the ranking of competencies in the order ofperceived importance.Design/methodology/approach – The study adopted three different data gathering phases to includeliterature review, expert forum, and two surveys – industry and academia.Findings – The research revealed unrealistically high expectations by the construction industry of QSgraduates achieving a high level of competency in ten mandatory, seven core, and seven optionalcompetencies. The research found that there were significant levels of dissatisfaction with the expected levelof achievement of mandatory, core, and optional competencies by the QS graduates. Thus, a perception gapwas identified between the academia and the industry.Practical implications – This research will provide a benchmarking tool for curricula alignment for theconstruction degree programmes in higher education.Originality/value – The identification of the exact nature of industry competencies requirementsand any variations will assist the construction graduates to connect more effectively to the industry.These research findings confirm the need for continued expansion of curricula and diversificationof pedagogies.Keywords Higher education, Training, Competencies, Stakeholder, Construction graduatesPaper type Research paper
Higher Education, Skills andWork-Based LearningVol. 7 No. 1, 2017pp. 92-111© Emerald Publishing Limited2042-3896DOI 10.1108/HESWBL-04-2016-0022
Received 29 April 2016Accepted 6 December 2016
The current issue and full text archive of this journal is available on Emerald Insight at:www.emeraldinsight.com/2042-3896.htm
The authors wish to acknowledge the RICS Research Trust, members of Construction Economics andManagement Research Group (CEMRG) in the Faculty of Engineering and Environment, andNorthumbria University for their support for this research.
92
HESWBL7,1
113

1. IntroductionStudies on quality in Higher Education Institutions (HEIs) have received significant attention inthe last decade. However, questions remain as to how well HEIs prepare graduates to meet thechallenges of constantly evolving and demanding work environments (Holmes, 2001; Hills et al.,2003; Rubin and Dierdorff, 2009). Concerns remain that undergraduate programmes may not beequipping graduates with the key skills needed to gain and maintain employment (Binks, 1996;De La Harpe et al., 2000; Cranmer, 2006; Holmes, 2015). For instance, Maharasoa and Hay (2001)asserted that there is an international concern about the relationship between higher education,employability, and the place of work. Mason et al. (2003) and Wilton (2008) claimed that theperceived lack of graduate employability appears rooted in the degree of mismatch betweenskills acquired in higher education vs those required for employment. This is corroborated by anumber of studies in different disciplines. For instance, Azevedo et al. (2012) found thatemployers were not very confident in the level of capability of business graduates in the eightcompetencies investigated in their study. In engineering education, Male (2010) found gapsbetween the competencies required for engineering work and those developed in engineeringeducation. Peng et al. (2016) found a mismatch between the educational attainment of a graduatewith aMaster of Engineering degree and the industry needs in China. It is against this backdropthat Nilsson (2010) averred that the role of higher education in the construction and developmentof the employability of the future workforce has been the subject of debate. This is affirmed byHolmes (2013) that graduate employability has become, and is likely to continue to be, a majorissue for a variety of stakeholders in HEIs. Against this backdrop, several studies have beenconducted in enhancing the employability of graduates, their preparedness for labour markettransition, and the role higher education has in preparing students (see Ropes, 2015; Monteiroet al., 2016; Thang and Wongsurawat, 2016) to mention a few.
Thus, HEIs need to identify different working patterns that graduates might engage in andensure that they possess employability skills that employers prefer them to possess(Wickramasinghe and Perera, 2010). Ropes (2015) opined that HEIs should develop curriculain collaboration with industry, in order to prepare graduates with competencies that will helpthem to function effectively in changing work environments. This backdrop necessitatedmany professional bodies nationally and internationally to develop both the policy andstandards for regulating various undergraduate programmes in HEIs. For example, in 2001,the Accreditation Board for Engineering and Technology, the sole agency responsible foraccrediting engineering degrees in the USA, specified 11 competencies for their engineeringgraduates to demonstrate (Accreditation Board for Engineering and Technology, 2008, 2014).Also, in the USA, American Council for Construction Education defines the standards andcriteria by which those construction education programmes seeking accreditation orre-accreditation shall be assessed (American Council for Construction Education, 2015).Similarly, in the UK, the Royal Institution of Chartered Surveyors (RICS) – the accreditingbody for quantity surveying (QS) and construction programmes, specified 24 competencies,which are grouped into ten mandatory competencies, seven core competencies, and sevenoptional competencies, when setting its requirements for those seeking membership (RICS,2009). Further, in the case of their graduate entrants, these competencies will have beenacquired both through their formal university education and the workplace training whichthey have received, whether as part-time students in employment or during a work placement.Also, the Accreditation Council for Graduate Medical Education identified six generalcompetencies in their accreditation criteria (Batalden et al., 2002) among others. Given this,construction, engineering, medical, and other professionally oriented programmes have begunto align their curricula with the outcomes stipulated by their respective criteria (see Bataldenet al., 2002; Lattuca et al., 2006).
Therefore, there is an increasing evidence for the need for information about graduates’transition to work shortly after graduation, and graduates’ early careers. It is on this premise
93
Education andtraining in
highereducation
114

that this research becomes necessary to ascertain what the key stakeholders’ perceivedconstruction graduates, particularly QS graduates, should achieve in competencies. In thisrespect, this research was guided by the following derived objectives:
• empirically investigate the expected level of achievement of competencies by QSgraduates;
• assess the industry perception of the achievement of competencies by QS graduates;and
• ranking of competencies in the order of perceived importance.
It is believed that this research will provide a benchmarking tool for curricula alignment forthe construction degree programmes in HEIs. Also, the identification of the exact nature ofindustry competencies requirements and any variations will assist the constructiongraduates to connect more effectively to the industry.
2. Competence-based education (CBE)Studies have shown that no greater impulse for learning exists than assessment(see Frederiksen, 1984), thus, a call is growing for the development of assessment methodsthat can adequately determine competence acquisition (Baartman et al., 2007). For instance,in the knowledge society, HEIs have an important role to play in professional development.Higher education providers have the awareness that design and delivery of studyprogrammes have to comply with industry practice and professional body requirements.The influence of industry on curriculum development is increasingly significant (Mekenzie,2010). Benner (1984) developed a five-stage professional development model such as novice,advanced beginner, competent, proficient, and expert, which could be used as a competenceframework for professional education programmes. CBE initially started in nursingeducation in the 1970s (Cowan et al., 2007). Over the last 40 years, CBE has been gainingpopularity in many disciplines in formal and informal education and training all around theworld. Professional accreditation bodies in the construction-oriented degrees have also beenadvocates of a competency-based approach (Newton, 2009). There are various definitions ofcompetence (Miller, 1990; Eraut, 1994; Parry, 1996; Verma et al., 2006).
Commonly, competence is described as the combination of knowledge, skills, and attitudesnecessary in certain job contexts or job situation (Eraut, 1994). CBE should address knowledge,skills, and attitudes in an integrated way since each of these separately is not sufficient for thedesired competent professional behaviour (Taconis et al., 2004). Verma et al. (2006) stated thatthe benefits of CBE are to foster empowerment, accountability, and performance evaluation.Evidently, CBE has been widely used in higher education. The competency-based curriculahave an integral set-up in which the profession is central (Boyatzis et al., 1996). It aims to assiststudents in obtaining high qualified professional competencies and increase graduateemployability. However, CBE in higher education is not perfect; there are some critics whoclaim that its diminished process inhibits deep understanding and knowledge capture. Barnett(1994) argued that CBE can lead to loosely designed curricula that undermine the quest fordeep understanding. On the other hand, curriculum design has to reflect current industrialpractice in a fast changing world.
3. RICS QS competency requirementsThe role of QS has evolved over the years since its origins in the mid-nineteenth century andmore recently through a series of reviews under the auspices of the RICS. The RICS reportpublished in 1971 defined the role of the QS in a succinct and clear manner (RICS, 1971).It sought to establish the profession as specialists in measurement and valuation ofconstruction works. This was then followed by the report on the future role of the chartered
94
HESWBL7,1
115

QS in 1983 (RICS, 1983) which identified the skills and knowledge base of the QS whileidentifying the scope for expansion and diversification of services. A greater level of detailand definition to the role of the QS was brought about by the RICS report on “the core skillsand knowledge base of the quantity surveyor” (RICS, 1992). These provided the basis for thedevelopment of the RICS (2009) QS competencies. Thus, the RICS (2009) defined the level ofachievement of competencies required of the chartered quantity surveyor as follows:
(1) Mandatory competencies: personal, interpersonal, professional practice and businessskills common to all pathways (into membership) and compulsory for all candidates.
(2) Core competencies: primary skills of the candidate’s chosen (RICS) pathway.
(3) Optional competencies: selected as an additional skill requirement for thecandidate’s chosen (RICS) pathway from a list of competencies relevant to thatpathway. In most cases there is an element of choice, though driven, usually, by theiremployer’s specialism.
Consequently, the RICS distinguishes between three possible levels of attainment in each ofa range of competencies when setting its requirements of those seeking membership.Briefly, these are as follows:
• Level 1: knowledge (theoretical knowledge);
• Level 2: knowledge and practical experience (putting it into practice); and
• Level 3: knowledge, practical experience, and capacity to advise (explaining andadvising).
There are ten mandatory competencies, seven core competencies, and seven optionalcompetencies (two only of these last to be selected by the candidate). The RICS stipulatesthat an assessment of professional competence candidate needs to achieve all mandatorycompetencies at Level 2 or above, all core competencies at Level 3 (except one not relevant tospecialisation depending on employment in consulting or contracting practice which is atLevel 2) and two optional competencies at Level 2 or above. However, there is no suchdefinition for the level of achievement of competencies for the graduate quantity surveyor(Perera and Pearson, 2011). This has resulted in individuals and organisations interpretinglevels of achievement of competencies in their own way. Therefore, the aforementioned RICSQS competencies were adopted for the graduate QS and analysed in the relation to theobjectives of this research as follows:
(1) establish the expected level of achievement of competencies by graduate QS;
(2) establish the perceived level of achievement of competencies by graduate QS; and
(3) ranking of competencies in the order of perceived importance.
The analysis and presentation of the findings are guided by aforementioned objectives.
4. Research methodologyPrevious studies conducted to identify important competencies for professionally orientedgraduates, most especially for engineering graduates, surveyed two or more key stakeholders toinclude the academic staff, industry, or professionals with over five years industrial experience,human resource, line managers, programme directors in HEIs (see Meier et al., 2000; Bodmeret al., 2002; Spinks et al., 2006; Brumm et al., 2006; Male et al., 2011). Also, few studies adoptedliterature review and conceptualization (see Woollacott, 2009; Male, 2010). Thus, this researchadopted a literature review, an expert forum, and two surveys, of industry and academia,culminating in data analysis and reporting. The key stages and process are detailed as follows.
95
Education andtraining in
highereducation
116

4.1 ReviewA detailed literature review was carried out to identify the RICS QS competencies andtheir interpretation.
4.2 Expert forumThis was conducted for the purpose of the identification of key issues related to academia,industry, and the RICS. A total of ten interviews were carried out comprising threeacademics (programme leaders), three consultant quantity surveyors, three contractorquantity surveyors, and one RICS official (member of the RICS Education and QualificationStandards). The views obtained from this forum informed the development of the academicand industry questionnaire surveys. Both surveys were first piloted among a small sampleof volunteers representing industry and academia. The review of the feedback obtainedthrough a discussion session led to the modification of the questionnaires.
4.3 Survey of the academiaThe issues identified from the literature and expert forum formed the basis of the surveyquestionnaire. The academic survey is one of the two surveys conducted. A comprehensivesurvey consisting of 41 questions was carried out to ascertain the views of the QSacademic community across academic institutions in the UK. According to the RICS, there are26 universities conducting a total of 51 programmes (31 undergraduate and 20 postgraduate)producing RICS accredited QS graduates. A total of 106 academic staff from all 26 universitieswhich conduct RICS accredited programmes were contacted and web-based surveyrequests were sent. The survey received 65 responses from which 20 were eliminated due tothe incompleteness of responses leaving 45 sets of fully completed survey responses.The survey data analysis is presented using the 45 fully completed survey responses received.The survey achieved response rates of 61 per cent overall and 42 per cent fully completed.
4.4 Survey of the industryThe issues identified from the literature and expert forum formed the basis of thesurvey questionnaire. A comprehensive survey consisting 39 questions was carried out toascertain the views of the QS industrial and professional community across firms in the UK.This included clients, consulting, and contracting firms representing both the privateand public sectors. According to the RICS, there are approximately 7,000 charteredquantity surveyors registered in the UK. The survey was posted to a sample of 2,946chartered surveyors with high levels of experience randomly selected from the RICS memberdatabase. A total of 615 responded from which 314 were eliminated due tothe incompleteness of responses leaving 301 sets of fully completed survey responses.The survey data analysis is presented using the 301 fully completed survey responsesreceived. The survey achieved a response rate of 21 per cent overall responses and 10 per centfully completed survey response rates. This was expected as the survey method did not useprior permission for the survey request which was mainly on a voluntary basis. However, thedata sample is quite adequate to carry out an analysis with over 99 per cent confidence levelas the population size is large (Bartlett et al., 2001).
5. Results5.1 Survey respondent profilesThe survey respondents for both surveys (industry and academia) were exceptionallyexperienced in QS work, with over 90 per cent have more than ten years professionalexperience (see Figures 1 and 2). No direct comparison could be made between the natures ofthe workloads of each group. The academics spent approximately 50 per cent of their time
96
HESWBL7,1
117
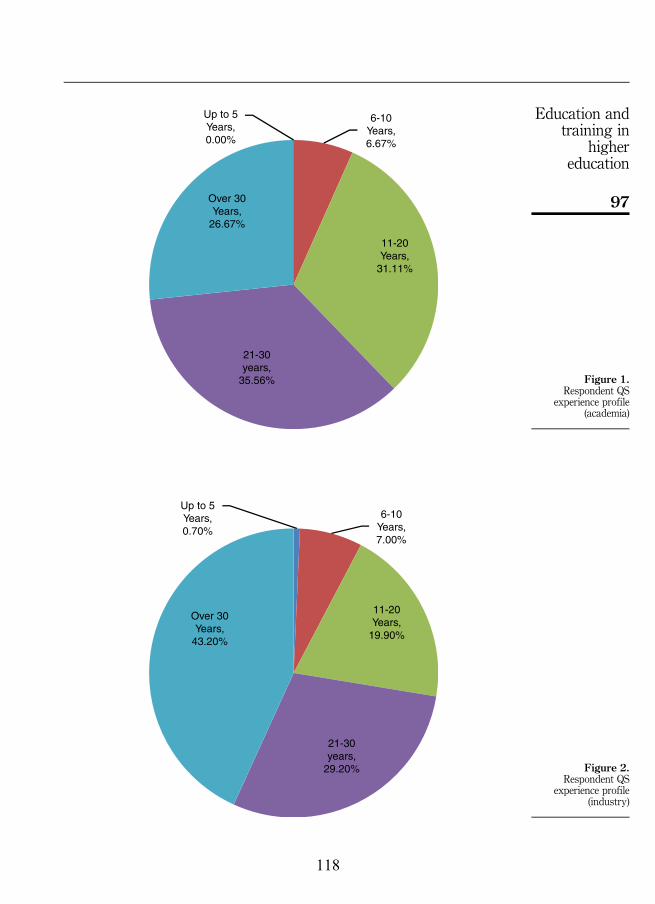
Up to 5Years,0.00%
6-10Years,6.67%
11-20Years,
31.11%
21-30years,
35.56%
Over 30Years,
26.67%
Figure 1.Respondent QS
experience profile(academia)
Up to 5Years,0.70%
6-10Years,7.00%
11-20Years,
19.90%
21-30years,
29.20%
Over 30Years,
43.20%
Figure 2.Respondent QS
experience profile(industry)
97
Education andtraining in
highereducation
118

engaged in teaching and assessment, followed by administration with 25 per cent andresearch 15 per cent (see Figure 3 for details). Similarly, 51.80 per cent of the industryrespondents were consultants that engaged in private practice. Others include contractingwith 17 per cent, the public sector 15 per cent (see Figure 4).
Teachingand
LearningActivities,49.62%
Research,15.04%
AcademicEnterprise,
5.09%
Administration,24.53%
Other,5.71%
Figure 3.Respondent workprofile (academia)
PrivatepracticeQuantitySurveyor
(consultant),51.80%
(CATEGORYNAME)
(VALUE)
PublicSector,14.60%
Specialistsub-
contractor,1.70%
Specialistsupplier,0.00%
Other,15.00%
Figure 4.Respondent workprofile (industry)
98
HESWBL7,1
119

5.2 Expected level of achievement of competencies by QS graduatesIt is important to ascertain what key stakeholders perceive a graduate should achieve inlevels of competency. Thus, this section analyses the views of academics and industry toestablish the expected level of achievement of competencies (i.e. mandatory, core, andoptional competencies) by QS graduates. Based on Levels 1-3, where:
• Level 1: knowledge (theoretical knowledge);
• Level 2: knowledge and practical experience (putting it into practice); and
• Level 3: knowledge, practical experience, and capacity to advise (explaining and advising).
5.2.1 Expected level for mandatory competencies. Figure 5 and Table I reveal the academicresponses on the ten mandatory competencies. It indicates that the academic are expecting thehighest level of experience to be at Level 2 with 46.44 per cent. For instance, the overallperception of academic on expected levels of mandatory competencies by QS graduates are37.33, 46.44, and 16.22 per cent for Levels 1-3, respectively (see Figure 5 and Table I fordetails). Also, Figure 6 and Table I indicate the industry responses, it shows that the industryexpecting the highest level of experience to be at Level 1 with 51.76 per cent. For example, theoverall views of industry are 51.76, 38.08, and 10.16 per cent (see Figure 6 and Table I fordetails). In both cases, the highest ratings were given in the areas of M010 Team working,M004 Communication and negotiating, and M007 Data management. It can be deduced thatthere was the difference in the perceptions of both the academic and industry on the expectedlevel of mandatory competencies by QS graduates. However, both the academic and industryconcurred on Level 3 being the least level of experience expected of newly QS graduates.
The final assessment of mandatory competencies was summarised in Table I as follows.Thus, it is recommended that mandatory competencies be achieved at Level 1 and
achieving Level 2 at least in part for some competencies as indicated in Table I.5.2.2 Expected level of core competencies. Figures 7-8 and Table II indicate the perceptions ofacademic and industry on the expected levels of core competencies. It reveals that the
0
0.1
0.2
0.3
0.4
0.5
0.6
0.7
0.8
0.9
M001 Accounting principles andprocedures
M002 Business planning
M003 Client care
M004 Communicationand negotiation
M005 Conduct rules, ethics andprofessional practice
M006 Conflict avoidance, managementand dispute resolution procedures
M007 Data management
M008 Health and safety
M009 Sustainability
M010 Team working
Level 1 Level 2 Level 3
Figure 5.Expected level ofachievement of
mandatorycompetencies for
new graduateQS (academic)
99
Education andtraining in
highereducation
120
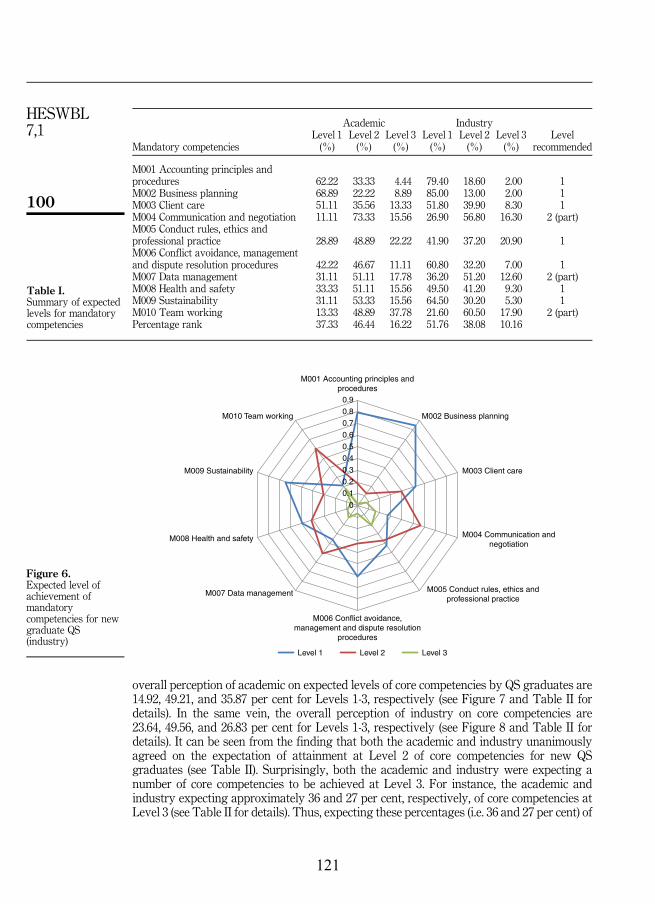
overall perception of academic on expected levels of core competencies by QS graduates are14.92, 49.21, and 35.87 per cent for Levels 1-3, respectively (see Figure 7 and Table II fordetails). In the same vein, the overall perception of industry on core competencies are23.64, 49.56, and 26.83 per cent for Levels 1-3, respectively (see Figure 8 and Table II fordetails). It can be seen from the finding that both the academic and industry unanimouslyagreed on the expectation of attainment at Level 2 of core competencies for new QSgraduates (see Table II). Surprisingly, both the academic and industry were expecting anumber of core competencies to be achieved at Level 3. For instance, the academic andindustry expecting approximately 36 and 27 per cent, respectively, of core competencies atLevel 3 (see Table II for details). Thus, expecting these percentages (i.e. 36 and 27 per cent) of
0
0.1
0.2
0.3
0.4
0.5
0.6
0.7
0.8
0.9
M001 Accounting principles andprocedures
M002 Business planning
M003 Client care
M004 Communication andnegotiation
M005 Conduct rules, ethics andprofessional practice
M006 Conflict avoidance,management and dispute resolution
procedures
M007 Data management
M008 Health and safety
M009 Sustainability
M010 Team working
Level 1 Level 2 Level 3
Figure 6.Expected level ofachievement ofmandatorycompetencies for newgraduate QS(industry)
Academic Industry
Mandatory competenciesLevel 1(%)
Level 2(%)
Level 3(%)
Level 1(%)
Level 2(%)
Level 3(%)
Levelrecommended
M001 Accounting principles andprocedures 62.22 33.33 4.44 79.40 18.60 2.00 1M002 Business planning 68.89 22.22 8.89 85.00 13.00 2.00 1M003 Client care 51.11 35.56 13.33 51.80 39.90 8.30 1M004 Communication and negotiation 11.11 73.33 15.56 26.90 56.80 16.30 2 (part)M005 Conduct rules, ethics andprofessional practice 28.89 48.89 22.22 41.90 37.20 20.90 1M006 Conflict avoidance, managementand dispute resolution procedures 42.22 46.67 11.11 60.80 32.20 7.00 1M007 Data management 31.11 51.11 17.78 36.20 51.20 12.60 2 (part)M008 Health and safety 33.33 51.11 15.56 49.50 41.20 9.30 1M009 Sustainability 31.11 53.33 15.56 64.50 30.20 5.30 1M010 Team working 13.33 48.89 37.78 21.60 60.50 17.90 2 (part)Percentage rank 37.33 46.44 16.22 51.76 38.08 10.16
Table I.Summary of expectedlevels for mandatorycompetencies
100
HESWBL7,1
121
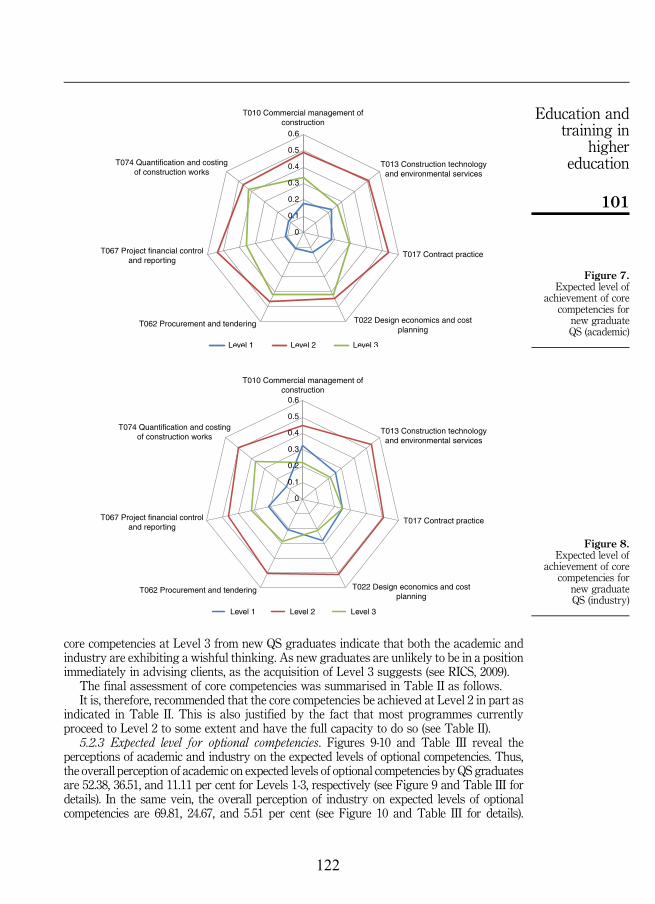
core competencies at Level 3 from new QS graduates indicate that both the academic andindustry are exhibiting a wishful thinking. As new graduates are unlikely to be in a positionimmediately in advising clients, as the acquisition of Level 3 suggests (see RICS, 2009).
The final assessment of core competencies was summarised in Table II as follows.It is, therefore, recommended that the core competencies be achieved at Level 2 in part as
indicated in Table II. This is also justified by the fact that most programmes currentlyproceed to Level 2 to some extent and have the full capacity to do so (see Table II).
5.2.3 Expected level for optional competencies. Figures 9-10 and Table III reveal theperceptions of academic and industry on the expected levels of optional competencies. Thus,the overall perception of academic on expected levels of optional competencies by QS graduatesare 52.38, 36.51, and 11.11 per cent for Levels 1-3, respectively (see Figure 9 and Table III fordetails). In the same vein, the overall perception of industry on expected levels of optionalcompetencies are 69.81, 24.67, and 5.51 per cent (see Figure 10 and Table III for details).
0
0.1
0.2
0.3
0.4
0.5
0.6
T010 Commercial management ofconstruction
T013 Construction technologyand environmental services
T017 Contract practice
T022 Design economics and costplanning
T062 Procurement and tendering
T067 Project financial controland reporting
T074 Quantification and costingof construction works
Level 1 Level 2 Level 3
Figure 7.Expected level of
achievement of corecompetencies for
new graduateQS (academic)
0
0.1
0.2
0.3
0.4
0.5
0.6
T010 Commercial management ofconstruction
T013 Construction technologyand environmental services
T017 Contract practice
T022 Design economics and costplanning
T062 Procurement and tendering
T067 Project financial controland reporting
T074 Quantification and costingof construction works
Level 1 Level 2 Level 3
Figure 8.Expected level of
achievement of corecompetencies for
new graduateQS (industry)
101
Education andtraining in
highereducation
122
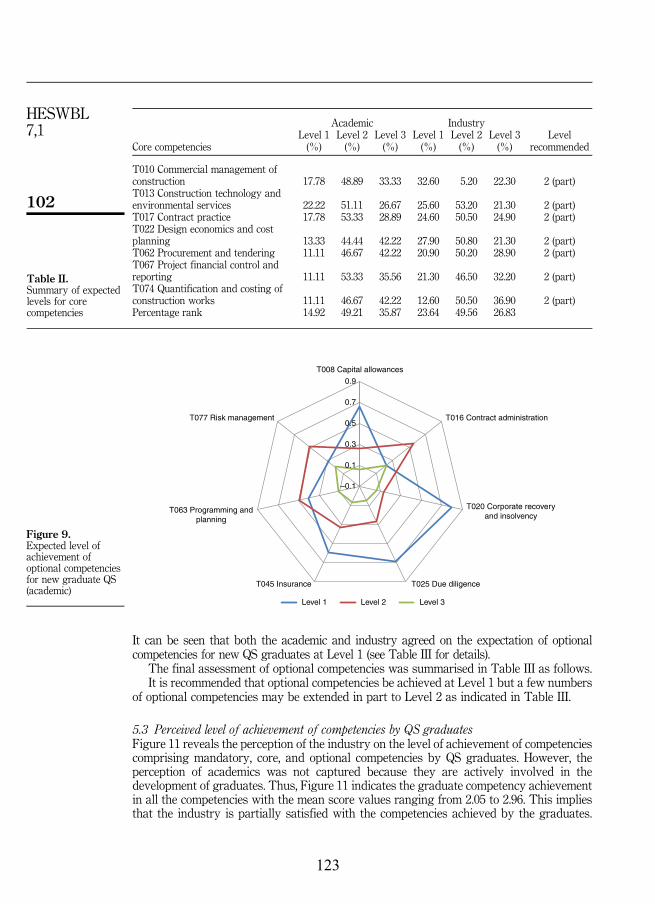
It can be seen that both the academic and industry agreed on the expectation of optionalcompetencies for new QS graduates at Level 1 (see Table III for details).
The final assessment of optional competencies was summarised in Table III as follows.It is recommended that optional competencies be achieved at Level 1 but a few numbers
of optional competencies may be extended in part to Level 2 as indicated in Table III.
5.3 Perceived level of achievement of competencies by QS graduatesFigure 11 reveals the perception of the industry on the level of achievement of competenciescomprising mandatory, core, and optional competencies by QS graduates. However, theperception of academics was not captured because they are actively involved in thedevelopment of graduates. Thus, Figure 11 indicates the graduate competency achievementin all the competencies with the mean score values ranging from 2.05 to 2.96. This impliesthat the industry is partially satisfied with the competencies achieved by the graduates.
Academic Industry
Core competenciesLevel 1(%)
Level 2(%)
Level 3(%)
Level 1(%)
Level 2(%)
Level 3(%)
Levelrecommended
T010 Commercial management ofconstruction 17.78 48.89 33.33 32.60 5.20 22.30 2 (part)T013 Construction technology andenvironmental services 22.22 51.11 26.67 25.60 53.20 21.30 2 (part)T017 Contract practice 17.78 53.33 28.89 24.60 50.50 24.90 2 (part)T022 Design economics and costplanning 13.33 44.44 42.22 27.90 50.80 21.30 2 (part)T062 Procurement and tendering 11.11 46.67 42.22 20.90 50.20 28.90 2 (part)T067 Project financial control andreporting 11.11 53.33 35.56 21.30 46.50 32.20 2 (part)T074 Quantification and costing ofconstruction works 11.11 46.67 42.22 12.60 50.50 36.90 2 (part)Percentage rank 14.92 49.21 35.87 23.64 49.56 26.83
Table II.Summary of expectedlevels for corecompetencies
–0.1
0.1
0.3
0.5
0.7
0.9
T008 Capital allowances
T016 Contract administration
T020 Corporate recoveryand insolvency
T025 Due diligenceT045 Insurance
T063 Programming andplanning
T077 Risk management
Level 1 Level 2 Level 3
Figure 9.Expected level ofachievement ofoptional competenciesfor new graduate QS(academic)
102
HESWBL7,1
123
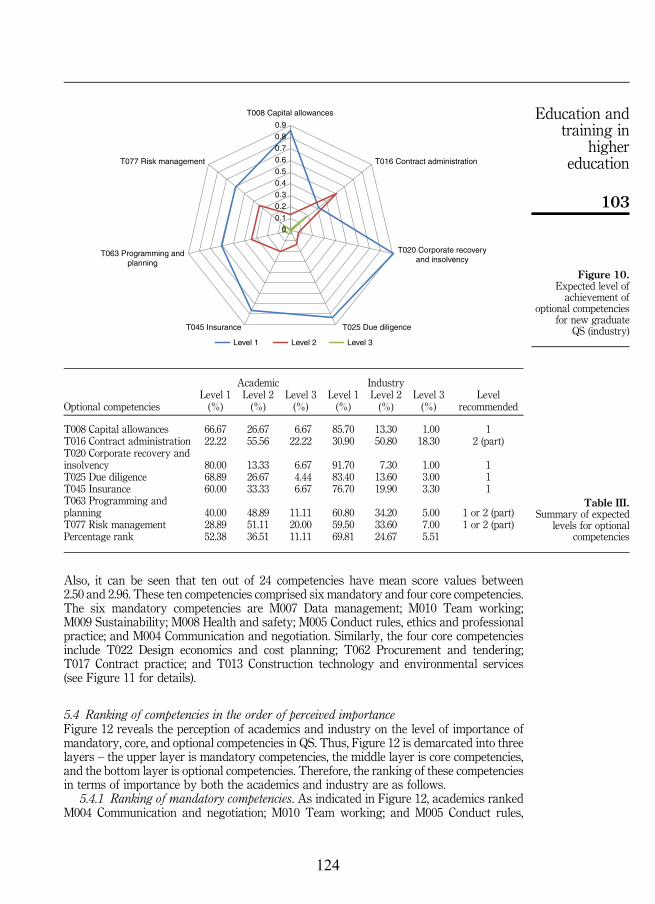
Also, it can be seen that ten out of 24 competencies have mean score values between2.50 and 2.96. These ten competencies comprised six mandatory and four core competencies.The six mandatory competencies are M007 Data management; M010 Team working;M009 Sustainability; M008 Health and safety; M005 Conduct rules, ethics and professionalpractice; and M004 Communication and negotiation. Similarly, the four core competenciesinclude T022 Design economics and cost planning; T062 Procurement and tendering;T017 Contract practice; and T013 Construction technology and environmental services(see Figure 11 for details).
5.4 Ranking of competencies in the order of perceived importanceFigure 12 reveals the perception of academics and industry on the level of importance ofmandatory, core, and optional competencies in QS. Thus, Figure 12 is demarcated into threelayers – the upper layer is mandatory competencies, the middle layer is core competencies,and the bottom layer is optional competencies. Therefore, the ranking of these competenciesin terms of importance by both the academics and industry are as follows.
5.4.1 Ranking of mandatory competencies. As indicated in Figure 12, academics rankedM004 Communication and negotiation; M010 Team working; and M005 Conduct rules,
0
0.1
0.2
0.3
0.4
0.5
0.6
0.7
0.8
0.9
T008 Capital allowances
T016 Contract administration
T020 Corporate recoveryand insolvency
T025 Due diligenceT045 Insurance
T063 Programming andplanning
T077 Risk management
Level 1 Level 2 Level 3
Figure 10.Expected level ofachievement of
optional competenciesfor new graduate
QS (industry)
Academic Industry
Optional competenciesLevel 1(%)
Level 2(%)
Level 3(%)
Level 1(%)
Level 2(%)
Level 3(%)
Levelrecommended
T008 Capital allowances 66.67 26.67 6.67 85.70 13.30 1.00 1T016 Contract administration 22.22 55.56 22.22 30.90 50.80 18.30 2 (part)T020 Corporate recovery andinsolvency 80.00 13.33 6.67 91.70 7.30 1.00 1T025 Due diligence 68.89 26.67 4.44 83.40 13.60 3.00 1T045 Insurance 60.00 33.33 6.67 76.70 19.90 3.30 1T063 Programming andplanning 40.00 48.89 11.11 60.80 34.20 5.00 1 or 2 (part)T077 Risk management 28.89 51.11 20.00 59.50 33.60 7.00 1 or 2 (part)Percentage rank 52.38 36.51 11.11 69.81 24.67 5.51
Table III.Summary of expected
levels for optionalcompetencies
103
Education andtraining in
highereducation
124
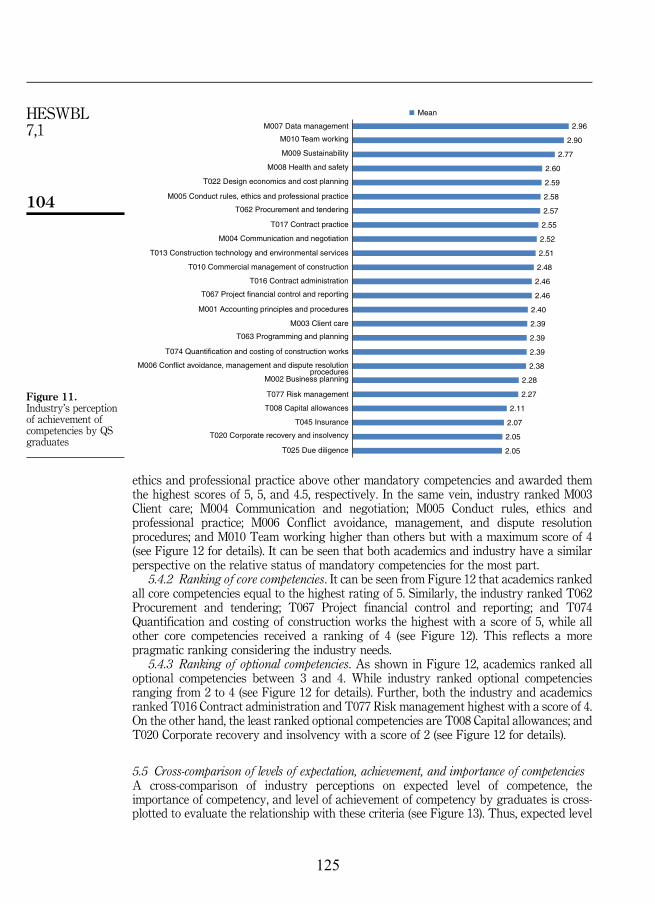
ethics and professional practice above other mandatory competencies and awarded themthe highest scores of 5, 5, and 4.5, respectively. In the same vein, industry ranked M003Client care; M004 Communication and negotiation; M005 Conduct rules, ethics andprofessional practice; M006 Conflict avoidance, management, and dispute resolutionprocedures; and M010 Team working higher than others but with a maximum score of 4(see Figure 12 for details). It can be seen that both academics and industry have a similarperspective on the relative status of mandatory competencies for the most part.
5.4.2 Ranking of core competencies. It can be seen from Figure 12 that academics rankedall core competencies equal to the highest rating of 5. Similarly, the industry ranked T062Procurement and tendering; T067 Project financial control and reporting; and T074Quantification and costing of construction works the highest with a score of 5, while allother core competencies received a ranking of 4 (see Figure 12). This reflects a morepragmatic ranking considering the industry needs.
5.4.3 Ranking of optional competencies. As shown in Figure 12, academics ranked alloptional competencies between 3 and 4. While industry ranked optional competenciesranging from 2 to 4 (see Figure 12 for details). Further, both the industry and academicsranked T016 Contract administration and T077 Risk management highest with a score of 4.On the other hand, the least ranked optional competencies are T008 Capital allowances; andT020 Corporate recovery and insolvency with a score of 2 (see Figure 12 for details).
5.5 Cross-comparison of levels of expectation, achievement, and importance of competenciesA cross-comparison of industry perceptions on expected level of competence, theimportance of competency, and level of achievement of competency by graduates is cross-plotted to evaluate the relationship with these criteria (see Figure 13). Thus, expected level
2.05
2.05
2.07
2.11
2.27
2.28
2.38
2.39
2.39
2.39
2.40
2.46
2.46
2.48
2.51
2.52
2.55
2.57
2.58
2.59
2.60
2.77
2.90
2.96
T025 Due diligence
T020 Corporate recovery and insolvency
T045 Insurance
T008 Capital allowances
T077 Risk management
M002 Business planning
M006 Conflict avoidance, management and dispute resolutionprocedures
T074 Quantification and costing of construction works
T063 Programming and planning
M003 Client care
M001 Accounting principles and procedures
T067 Project financial control and reporting
T016 Contract administration
T010 Commercial management of construction
T013 Construction technology and environmental services
M004 Communication and negotiation
T017 Contract practice
T062 Procurement and tendering
M005 Conduct rules, ethics and professional practice
T022 Design economics and cost planning
M008 Health and safety
M009 Sustainability
M010 Team working
M007 Data management
Mean
Figure 11.Industry’s perceptionof achievement ofcompetencies by QSgraduates
104
HESWBL7,1
125

has been re-scaled to a 1-5 scale to graphically compared with an importance ranking(scaled 1-5) and perceived achievement (scaled 1-5) (see Figure 13 for details). From thiscomparison, it is clear that whilst there is high importance attached to a competence,there may be a comparatively lower level of achievement. This is established in this study.
3.00
3.00
4.00
5.00
4.50
4.00
4.00
4.00
4.00
5.00
5.00
5.00
5.00
5.00
5.00
5.00
5.00
3.00
4.00
3.00
3.00
3.00
3.00
4.00
2.00
3.00
4.00
4.00
4.00
4.00
3.00
3.00
3.00
4.00
4.00
4.00
4.00
4.00
5.00
5.00
5.00
2.00
4.00
2.00
2.50
3.00
3.00
4.00
M001 Accounting principles and procedures
M002 Business planning
M003 Client care
M004 Communication and negotiation
M005 Conduct rules, ethics and professional practice
M006 Conflict avoidance, management and disputeresolution procedures
M007 Data management
M008 Health and safety
M009 Sustainability
M010 Team working
T010 Commercial management of construction
T013 Construction technology and environmentalservices
T017 Contract practice
T022 Design economics and cost planning
T062 Procurement and tendering
T067 Project financial control and reporting
T074 Quantification and costing of construction works
T008 Capital allowances
T016 Contract administration
T020 Corporate recovery and insolvency
T025 Due diligence
T045 Insurance
T063 Programming and planning
T077 Risk management
Median – Ac Median – Ind
Figure 12.Ranking of
competencies in theorder of perceived
importance
105
Education andtraining in
highereducation
126
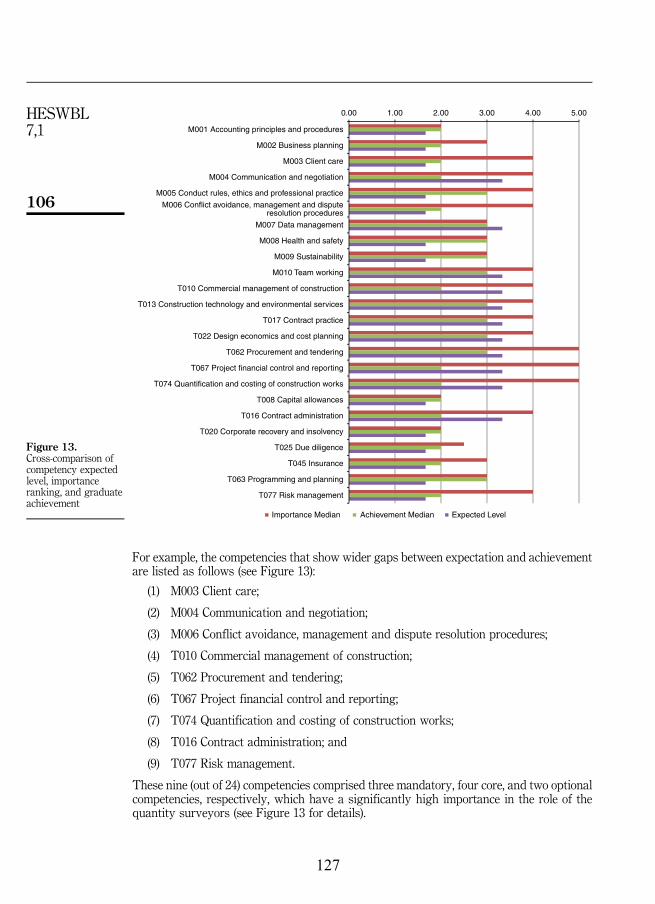
For example, the competencies that show wider gaps between expectation and achievementare listed as follows (see Figure 13):
(1) M003 Client care;
(2) M004 Communication and negotiation;
(3) M006 Conflict avoidance, management and dispute resolution procedures;
(4) T010 Commercial management of construction;
(5) T062 Procurement and tendering;
(6) T067 Project financial control and reporting;
(7) T074 Quantification and costing of construction works;
(8) T016 Contract administration; and
(9) T077 Risk management.
These nine (out of 24) competencies comprised three mandatory, four core, and two optionalcompetencies, respectively, which have a significantly high importance in the role of thequantity surveyors (see Figure 13 for details).
0.00 1.00 2.00 3.00 4.00 5.00
M001 Accounting principles and procedures
M002 Business planning
M003 Client care
M004 Communication and negotiation
M005 Conduct rules, ethics and professional practice
M006 Conflict avoidance, management and disputeresolution procedures
M007 Data management
M008 Health and safety
M009 Sustainability
M010 Team working
T010 Commercial management of construction
T013 Construction technology and environmental services
T017 Contract practice
T022 Design economics and cost planning
T062 Procurement and tendering
T067 Project financial control and reporting
T074 Quantification and costing of construction works
T008 Capital allowances
T016 Contract administration
T020 Corporate recovery and insolvency
T025 Due diligence
T045 Insurance
T063 Programming and planning
T077 Risk management
Importance Median Achievement Median Expected Level
Figure 13.Cross-comparison ofcompetency expectedlevel, importanceranking, and graduateachievement
106
HESWBL7,1
127
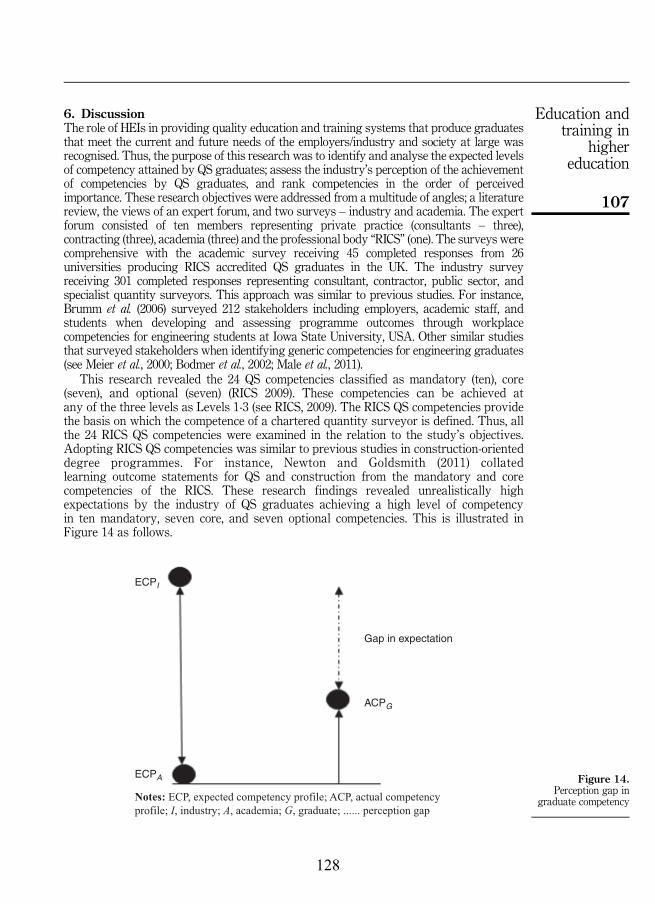
6. DiscussionThe role of HEIs in providing quality education and training systems that produce graduatesthat meet the current and future needs of the employers/industry and society at large wasrecognised. Thus, the purpose of this research was to identify and analyse the expected levelsof competency attained by QS graduates; assess the industry’s perception of the achievementof competencies by QS graduates, and rank competencies in the order of perceivedimportance. These research objectives were addressed from a multitude of angles; a literaturereview, the views of an expert forum, and two surveys – industry and academia. The expertforum consisted of ten members representing private practice (consultants – three),contracting (three), academia (three) and the professional body “RICS” (one). The surveys werecomprehensive with the academic survey receiving 45 completed responses from 26universities producing RICS accredited QS graduates in the UK. The industry surveyreceiving 301 completed responses representing consultant, contractor, public sector, andspecialist quantity surveyors. This approach was similar to previous studies. For instance,Brumm et al. (2006) surveyed 212 stakeholders including employers, academic staff, andstudents when developing and assessing programme outcomes through workplacecompetencies for engineering students at Iowa State University, USA. Other similar studiesthat surveyed stakeholders when identifying generic competencies for engineering graduates(see Meier et al., 2000; Bodmer et al., 2002; Male et al., 2011).
This research revealed the 24 QS competencies classified as mandatory (ten), core(seven), and optional (seven) (RICS 2009). These competencies can be achieved atany of the three levels as Levels 1-3 (see RICS, 2009). The RICS QS competencies providethe basis on which the competence of a chartered quantity surveyor is defined. Thus, allthe 24 RICS QS competencies were examined in the relation to the study’s objectives.Adopting RICS QS competencies was similar to previous studies in construction-orienteddegree programmes. For instance, Newton and Goldsmith (2011) collatedlearning outcome statements for QS and construction from the mandatory and corecompetencies of the RICS. These research findings revealed unrealistically highexpectations by the industry of QS graduates achieving a high level of competencyin ten mandatory, seven core, and seven optional competencies. This is illustrated inFigure 14 as follows.
ECPI
ECPA
ACPG
Gap in expectation
Notes: ECP, expected competency profile; ACP, actual competencyprofile; I, industry; A, academia; G, graduate; ...... perception gap
Figure 14.Perception gap in
graduate competency
107
Education andtraining in
highereducation
128

The views of both the industry and academia were logical to some extent on the expectations ofLevel 1 achievement for the most mandatory competencies and Level 2 for all the corecompetencies, and Level 1 for the most optional competencies. However, there were someworrying trends with over 35 per cent expecting Level 2 for mandatory competencies, Level 3 forsome core competencies and Level 2 for some optional competencies. These far exceed the levelsthat can be practicably achieved by a new graduate. For example, a Level 3 competency wouldrequire experience in advising clients and exhibiting expertise (RICS, 2009). These certainlycannot be achieved in a university (classroom) environment (see Figure 14 for details). Theresearch findings further indicated that there were markedly low levels of ranking of the currentstate of achievement of competencies by new graduates. On a scale of 1-5, the overwhelmingmajority indicated the midpoint for most competencies and a score of 2 for others. The scoringwas higher for mandatory competencies such as M010 Teamwork, M007 Data management, andM009 Sustainability. All core competencies were ranked much lower, the least satisfaction beingshownwith core competency T074 Quantification and costing of construction works, followed byT067 Project financial control and reporting. This finding was slightly similar to several studiesthat identified teamwork as most important amongst the generic competencies for engineeringgraduates (see Meier et al., 2000; Bodmer et al., 2002; Brumm et al., 2006; Reio and Sutton, 2006;Male et al., 2011). This research concludes that there were significant levels of dissatisfaction withthe expected level of achievement of mandatory, core, and optional competencies by theQS graduates. Thus, perception gap was identified between the academia and the industry.
7. ConclusionsThis research provided the empirical evidence on the competencies expected and attained bynew graduates upon entry into an early career in the case of QS profession. In achieving this,several research instruments such as a review, an expert forum, academic and industrysurveys were conducted. The results of the academic survey revealed that the academicsexpected the graduates would reach Level 2 of most mandatory competencies, Level 2 (or 3 insome cases) of core competencies and Levels 1 or 2 of optional competencies. It can be deducedthat these far exceed the levels that can be practicably achieved by a new graduate.For example, a Level 3 competency would require experience in advising clients andexhibiting expertise. These certainly cannot be achieved in a university (i.e. classroom)environment. The findings from the industry survey indicated that the competency levelexpectations of the industry were more pragmatic for the most part. However, there weresignificant levels of unrealistic expectations with over 35 per cent expecting Level 2 formandatory competencies, Level 3 for some core competencies and Level 2 for some optionalcompetencies. Also, the research revealed considerably low levels of ranking of the currentstate of achievement of competencies by new graduates. Based on these research findings, it isestablished that the current industry competence needs are not being adequately met bygraduate competencies falling short of industry expectations. Thus, the HEIs haveyet to respond effectively to the current and future challenges in addressing the “mismatch”between the industry expectations and the competencies of graduates in construction-orientedprogrammes. This research, therefore, advocates greater levels of university and industrycollaboration in developing and delivering construction programmes at large in HEIs.
References
Accreditation Board for Engineering and Technology (2008), “Going global accreditation takes offworldwide”, ABET, Baltimore, MD.
Accreditation Board for Engineering and Technology (2014), “Criteria for accrediting engineeringprograms: effective for reviews during the 2015-2016 accreditation cycle”, ABET, Baltimore, MD.
108
HESWBL7,1
129

American Council for Construction Education (2015), “Standards and criteria for accreditation ofpostsecondary construction education degree programs”, available at: www.acce-hq.org/images/uploads/Doc_103_OBS_final_042915.pdf (accessed 8 December 2015).
Azevedo, A., Apfelthaler, G. and Hurst, D. (2012), “Competency development in business graduates: anindustry-driven approach for examining the alignment of undergraduate business educationwith industry requirements”, International Journal of Management Education, Vol. 10 No. 1,pp. 12-28.
Baartman, L.K.J., Bastiaens, T.J., Kirschner, P.A. and Van der Vleuten, C.P.M. (2007), “Evaluationassessment quality in competence-based education: a qualitative comparison of twoframeworks”, Educational Research Review, Vol. 2 No. 2, pp. 114-129.
Barnett, R. (1994), The Limits of Competence, Open University Press, Buckingham.
Bartlett, J.E., Kottrlliikk, J.W. and Higgins, C. (2001), “Organizational research: determining appropriatesample size in survey research”, Information Technology, and Learning, and PerformanceJournal, Vol. 19 No. 1, pp. 43-50.
Batalden, P., Leach, D., Swing, S., Dreyfus, H. and Dreyfus, S. (2002), “General competencies andaccreditation in graduate medical education”, Health Affairs, Vol. 21 No. 5, pp. 103-111.
Benner, P. (1984), From Novice to Expert, Addison-Wesley, New York, NY.
Binks, M. (1996), “Enterprise in higher education and the graduate labour market”, Education+Training,Vol. 38 No. 2, pp. 26-29.
Bodmer, C., Leu, A., Mira, L. and Rütter, H. (2002), “SPINE: successful practices in international engineeringeducation”, available at: www.ingch.ch/pdfs/spinereport.pdf (accessed 24 December 2015).
Boyatzis, R., Leonard, D.C., Rhee, K.S. and Wheeler, J.V. (1996), “Competencies can be developed, butnot in the way we thought”, Capability, Vol. 2 No. 2, pp. 25-41.
Brumm, T.J., Hanneman, L.F. and Mickelson, S.K. (2006), “Assessing and developing programoutcomes through workplace competencies”, International Journal of Engineering Education,Vol. 22 No. 1, pp. 123-129.
Cowan, D.T., Norman, I. and Coopamah, V.P. (2007), “Competence in nursing practice: a controversialconcept – a focused review of literature”,Accident and Emergency Nursing, Vol. 15 No. 1, pp. 20-26.
Cranmer, S. (2006), “Enhancing graduate employability: best intentions and mixed outcomes”, Studiesin Higher Education, Vol. 31 No. 2, pp. 169-184.
De La Harpe, B., Radloff, A. and Wyber, J. (2000), “Quality and generic professional skills”, Quality inHigher Education, Vol. 6 No. 3, pp. 231-243.
Eraut, M. (1994), Developing Professional Knowledge and Competence, Routledge, London.
Frederiksen, N. (1984), “The real test bias: influences of testing on teaching and learning”, AmericanPsychologist, Vol. 39 No. 3, pp. 193-202.
Hills, J.M., Robertson, G., Walker, R., Adey, M.A. and Nixon, I. (2003), “Bridging the gap between degreeprogramme curricula and employability through the implementation of work-related learning”,Teaching in Higher Education, Vol. 8 No. 2, pp. 211-231.
Holmes, L. (2001), “Reconsidering graduate employability: the graduate identity approach”, Quality inHigher Education, Vol. 7 No. 2, pp. 111-119.
Holmes, L. (2013), “Competing perspectives on graduate employability: possession, position orprocess?”, Studies in Higher Education, Vol. 38 No. 4, pp. 538-554.
Holmes, L. (2015), “Becoming a graduate: the warranting of an emergent identity”, Education+Training,Vol. 57 No. 2, pp. 219-238.
Lattuca, L.R., Terenzini, P.T. and Volkwein, J.F. (2006), “Engineering change: a study of the impact ofEC2000”, final report, ABET, Baltimore, MD.
Maharasoa, M. and Hay, D. (2001), “Higher education and graduate employment in South Africa”,Quality in Higher Education, Vol. 7 No. 2, pp. 139-147.
109
Education andtraining in
highereducation
130

Male, S.A. (2010), “Generic engineering competencies: a review and modelling approach”, EducationResearch and Perspectives, Vol. 37 No. 1, pp. 25-51.
Male, S.A., Bush, M.B. and Chapman, E.S. (2011), “An Australian study of generic competenciesrequired by engineers”, European Journal of Engineering Education, Vol. 36 No. 2, pp. 151-163.
Mason, G, Williams, G., Cranmer, S. and Guile, D. (2003), “Howmuch does higher education enhance theemployability of graduates?”, Higher Education Funding Council for England, Bristol.
Meier, R.L., Williams, M.R. and Humphreys, M.A. (2000), “Refocusing our efforts: assessingnon-technical competency gaps”, Journal of Engineering Education, Vol. 89 No. 3, pp. 377-385.
Mekenzie, F. (2010), “Embrace this high level of industry engagement – it can benefit us all, the highereducation”, available at: www.timeshighereducation.co.uk/story.asp?storyCode=§ioncode=26 (accessed 4 December 2015).
Miller, G.E. (1990), “The assessment of clinical skills/competence/performance”, Academic Medicine,Vol. 65 No. 9, pp. 63-67.
Monteiro, S., Almeida, L. and Aracil, A.G. (2016), “Graduates’ perceptions of competencies andpreparation for labour market transition: the effect of gender and work experience during highereducation”, Higher Education, Skills and Work-Based Learning, Vol. 6 No. 2, pp. 208-220.
Newton, S. (2009), “Transformational higher education in the built environment”, Journal for Educationin the Built Environment, Vol. 4 No. 1, pp. 100-112.
Newton, S. and Goldsmith, R. (2011), “An analysis of stakeholder preferences for threshold learningoutcomes in construction management in Australia”, in Egbu, C. and Lou, E.C.W. (Eds),Proceedings 27th Annual ARCOM Conference, Bristol, Association of Researchers inConstruction Management, pp. 127-136.
Nilsson, S. (2010), “Enhancing individual employability: the perspective of engineering graduates”,Education+Training, Vol. 52 Nos 6/7, pp. 540-551.
Parry, S.B. (1996), “The quest for competencies: competence studies can help you make HR decisions,but the results are only as good as the study”, Training, Vol. 33 No. 7, pp. 48-56.
Peng, L., Zhang, S. and Gu, J. (2016), “Evaluating the competency mismatch between master ofengineering graduates and industry needs in China”, Studies in Higher Education, Vol. 41 No. 3,pp. 445-461.
Perera, S. and Pearson, J. (2011), “Alignment of professional, academic and industrial developmentneeds for quantity surveyors: post recession dynamics”, RICS Education Trust funded researchreport, available at: www.rics.org/uk/knowledge/research/research-reports/alignment (accessed20 March 2016).
Reio, T.G. and Sutton, F.C. (2006), “Employer assessment of work-related competencies and workplaceadaptation”, Human Resource Development Quarterly, Vol. 17 No. 3, pp. 305-324.
RICS (1971), The Future Role of the Quantity Surveyor, RICS.
RICS (1983), The Future Role of the Chartered Quantity Surveyor, RICS.
RICS (1992), The Core Skills and Knowledge Base of Quantity Surveyors, RICS.
RICS (2009), “Requirements and competencies: RICS education and qualification standards”,available at: www.rics.org/site/scripts/download_info.aspx?fileID=3729&categoryID=98(accessed 20 September 2014).
Ropes, D. (2015), “Management competencies anno 2025: consequences for higher education”, HigherEducation, Skills and Work-Based Learning, Vol. 5 No. 3, pp. 258-270.
Rubin, R.S. and Dierdorff, E.C. (2009), “How relevant is the MBA? Assessing the alignment of requiredcurricula and required managerial competencies”, Academy of Management Learning andEducation, Vol. 8 No. 2, pp. 208-224.
Spinks, N., Silburn, N. and Birchall, D. (2006), “Educating engineers for the 21st century: the industryview”, available at: www.raeng.org.uk/publications/reports/educating-engineers-for-the-21st-century (accessed 24 December 2015).
110
HESWBL7,1
131
Taconis, R., Van der Plas, P. and Van der Sanden, J. (2004), “The development of professionalcompetencies by educational assistants in school-based teacher education”, European Journal ofTeacher Education, Vol. 27 No. 2, pp. 215-240.
Thang, P.V.M. and Wongsurawat (2016), “Enhancing the employability of IT graduates in Vietnam”,Higher Education, Skills and Work-Based Learning, Vol. 6 No. 2, pp. 146-161.
Verma, S., Paterson, M. and Medves, J. (2006), “Core competencies for health care professionals: whatmedicine, nursing, occupational therapy, and physiotherapy share”, Journal of Allied Health,Vol. 35 No. 2, pp. 109-116.
Wickramasinghe, V. and Perera, L. (2010), “Graduates’, university lecturers’ and employers’perceptions towards employability skills”, Education+Training, Vol. 52 No. 3, pp. 226-244.
Wilton, N. (2008), “Business graduates and management jobs: an employability match made inheaven?”, Journal of Education and Work, Vol. 21 No. 2, pp. 143-158.
Woollacott, L.C. (2009), “Validating the CDIO syllabus for engineering education using the taxonomy ofengineering competencies”, European Journal of Engineering Education, Vol. 34 No. 6,pp. 545-559.
Further reading
Accreditation Board for Engineering and Technology (1998), “ABET 2000: criteria for accreditingprograms in engineering in the United States”, ABET, Baltimore, MD.
Dainty, A., Cheng, M.I. and Moore, D. (2004), “A competency-based performance model for projectmanagers”, Construction Management and Economics, Vol. 22 No. 8, pp. 877-889.
Perera, S. and Pearson, J. (2013), “RICS professional competency mapping framework for programmeappraisal and benchmarking, RICS research trust funded research main report RICS”, availableat: www.rics.org/uk/knowledge/research/research-reports/professional-competency-mapping-framework/ (accessed 20 September 2014).
Corresponding authorSolomon Olusola Babatunde can be contacted at: [email protected]
For instructions on how to order reprints of this article, please visit our website:www.emeraldgrouppublishing.com/licensing/reprints.htmOr contact us for further details: [email protected]
111
Education andtraining in
highereducation
132

Full Terms & Conditions of access and use can be found athttps://www.tandfonline.com/action/journalInformation?journalCode=cshe20
Studies in Higher Education
ISSN: 0307-5079 (Print) 1470-174X (Online) Journal homepage: https://www.tandfonline.com/loi/cshe20
Competency mapping framework for regulatingprofessionally oriented degree programmes inhigher education
Srinath Perera, Solomon Olusola Babatunde, Lei Zhou, John Pearson &Damilola Ekundayo
To cite this article: Srinath Perera, Solomon Olusola Babatunde, Lei Zhou, John Pearson &Damilola Ekundayo (2017) Competency mapping framework for regulating professionally orienteddegree programmes in higher education, Studies in Higher Education, 42:12, 2316-2342, DOI:10.1080/03075079.2016.1143926
To link to this article: https://doi.org/10.1080/03075079.2016.1143926
Published online: 25 Feb 2016.
Submit your article to this journal
Article views: 975
View related articles
View Crossmark data
Citing articles: 11 View citing articles
133
Competency mapping framework for regulating professionallyoriented degree programmes in higher education
Srinath Pereraa, Solomon Olusola Babatundea*, Lei Zhoua, John Pearsona andDamilola Ekundayob
aFaculty of Engineering & Environment, Northumbria University, Newcastle upon Tyne,UK; bFaculty of Technology, Design and Environment, Oxford Brookes University, Oxford,OX3 0BP, UK
Recognition of the huge variation between professional graduate degreeprogrammes and employer requirements, especially in the construction industry,necessitated a need for assessing and developing competencies that aligned withprofessionally oriented programmes. The purpose of this research is to develop acompetency mapping framework (CMF) in this case for quantity surveyinghonours degree programmes. The graduate competency threshold benchmark(GCTB) is a key component of the CMF. Therefore, the CMF contains themapping process, the template documents and the benchmark. The researchadopted literature review, pilot study, case studies (including semi-structuredinterviews) and expert forum in developing the framework. The frameworkdeveloped in this research provides new insight into how degree programmesmap against competencies. Thus, the framework can be applied more widely, toother professional degree programmes, for monitoring and improving the qualityand professional standards of construction degree programmes by accreditingbodies. This should connect construction graduates more effectively to the industry.
Keywords: Competencies; construction; curriculum; degree programmes; highereducation
1. Introduction
Educational strategies and policies at both the national and global levels contribute sig-nificantly to shaping the future direction of many professions and industries. Given thesector’s large diversified and dynamic nature, the updating of knowledge and skills forconstruction graduates becomes imperative. For instance, Keraminiyage and Lill(2013) asserted that studying at higher education institutions (HEIs) is a primarymode of knowledge and skills enhancement for construction professionals. Whilethis mode is broadly received and acknowledged, it has frequently been condemnedfor its feeble acknowledgement of and connection to the changing needs of industryand its failure to react quickly to emerging knowledge and skills demands (Kaklauskaset al. 2012). It is against this backdrop that Perera and Pearson (2013) stated that anyenterprise operating in today’s competitive climate should regularly be reviewingpotential markets for its products with a view to satisfying these and to long-term
© 2016 Society for Research into Higher Education
*Corresponding author. Email: [email protected]
Studies in Higher Education, 2017Vol. 42, No. 12, 2316–2342, https://doi.org/10.1080/03075079.2016.1143926
134

growth. In this respect, academic institutions are no different. Thus, those responsiblefor programme development in HEIs should be on the lookout for appropriate areas ofexpansion and provision must keep pace with the times, and adjust where possible tochanging professional needs (Perera and Pearson 2013). To this end, competency-based measures have become an important recourse for identifying and developingpotentially realistic and practical training requirements, especially as these measuresreflect a cyclical and continuous process of assessing, planning and taking correctiveaction (Dainty, Cheng, and Moore 2003).
The competence-based education initially started in nursing education in the 1970s(Cowan, Norman, and Coopamah 2007) and gained popularity in many other disci-plines in formal and informal education and training all around the world (Meyerand Semark 1996). The significance of competency-based measures in promoting thedevelopment of appropriate professional training requirements is well underscored(Tett et al. 2000; Gibb 2003). Therefore, an educational strategy based on competencieshas become a norm. For example, a robust competency model helps to align practiceand academic priorities. Some earlier studies support this. For instance, Getha-Tayloret al. (2013) argued that competency-based programmes provide students with theknowledge, skills and attitudes necessary for successful careers. Rissi and Gelmon(2014) claimed that the recognition of the substantial variation in professional rolesand employment settings that graduates enter necessitated the need to define pro-gramme contents that concentrate on creating and assessing competencies thataligned with programme mission and students’ career goals. Batterman et al. (2011)stated that educational competencies depict learning objectives and are utilised toplan educational programmes, develop curricula and assess existing programmes.Arain (2010) suggested that the essential competence of a construction programmein the core area of construction project management is in imparting to its studentsthe necessary expertise to practise professionally in the construction industry.
There is a considerable interest in identifying specific competencies for construc-tion-oriented degree programmes. For instance, Ahn, Annie, and Kwon (2012) exam-ined key competencies for construction graduates in the USA. Arain (2010) identifiedcompetencies for baccalaureate level construction education in Alberta, Canada. Batter-man et al. (2011) studied competencies for graduate education programmes in theenergy and sustainability area, among others. In spite of these studies of the competen-cies required of construction-related graduates in HEIs, there are hardly any studiesfound in the literature that provide an insight on how modules/courses in undergraduatestudies mapped against these. Also, construction industry employers have been vocal inreporting their perception of a lowering of employability of graduates. A recent studyinvestigating the views of both industry and academia concluded that there are signifi-cant levels of dissatisfaction with the quality of graduates (Perera and Pearson 2011). Itis identified that the root cause of the issue is that graduates produced from differentRoyal Institution of Chartered Surveyors (RICS) accredited degree programmes inHEIs have significantly different competency levels, often far below what the industryexpects. The lack of a mechanism to systematically evaluate programme modulecontent against RICS competencies and a benchmark for graduate competencies is,therefore, considered as the core cause of this problem (Perera and Pearson 2011).This research aims to fill this gap by developing a competency mapping framework(CMF) that comprises the graduate competency threshold benchmark (GCTB) forquantity surveying (QS) honours degree programmes. Achieving this is fundamental
Studies in Higher Education 2317
135
to success in aligning the views of industry, academia and the professional body –
RICS. In this respect, this research was guided by the following derived objectives:
. Examination of the mandatory, core and optional competencies and benchmark-ing the expected level of compliance for RICS accredited degree programmes.
. Development of a competency mapping and assessment methodology to analysethe compliance of programmes to set benchmarks for graduate route.
. Development of a competency mapping scoring system to analyse the level ofmapping and gaps.
. Development of the final benchmark (i.e. GCTB).
It is believed that the process used to develop the framework can be applied to anyprofessionally oriented degree programme in HEIs. Further, the framework would beuseful for the monitoring and management of existing degree programmes in any con-struction-related discipline. It is anticipated that this research will contribute to improv-ing the understanding of the knowledge and skills context, more efficient alignment ofHEI outputs with industrial needs and ultimately to the future positive development ofthe construction sector at large.
2. Subject area descriptions of construction education degrees
Subject area descriptions are best considered as benchmarking exercises for a particularfield of study or discipline group (Newton et al. 2012). Construction education in HEIsrepresents a field of study that encompasses the modern academy such as Architecture,Engineering and Law, among others. It is corroborated by Newton et al. (2012) that thediscipline of Building and Construction draws together a substantial range of distinctiveacademics and professional practice. Thus, at the core of the discipline are a number ofdiscrete professions such as Construction Management, QS, Building Surveying,Facilities Management and Property Development, united through a shared concernwith the initiation, provision, operation and sustainability of the built environment(Newton et al. 2012). Construction is a practice-oriented collection of professions.Therefore, the educational unit should establish an effective relationship with the indus-try (ACCE 2015). This backdrop necessitated the professional bodies nationally andinternationally to develop both the policy and practice for construction education.For instance, in the USA, bachelor degree programmes in construction managementare accredited by the American Council for Construction Education (ACCE). Thus,ACCE defines the academic standards and criteria by which those construction edu-cation programmes seeking accreditation or re-accreditation shall be assessed. In Aus-tralia, academic standards for building and construction professions are developed andrefined through national consultation involving all relevant professional bodies andhigher education providers (see Newton and Goldsmith 2011a). For example, in2010–2011, the Learning and Teaching Academic Standards project in building andconstruction established the Threshold Learning Outcomes (TLOs) that all graduatesof an Australian bachelor award in building and construction are expected to havemet or exceeded (ALTC 2011; Newton 2011; Newton et al. 2012). In the UK, in estab-lishing the benchmark standards for construction, property and surveying, the QualityAssurance Agency (QAA) for Higher Education makes reference to national occu-pational standards that have been developed by the Construction Industry Council,as well as to the accreditation policies produced by professional bodies such as the
2318 S. Perera et al.
136

Chartered Institute of Building and the RICS (QAA 2008). Thus, the single honoursdegree programmes in HEIs in the UK are formulated with reference to the QAAbenchmark statements in construction, property and surveying (2008) and accreditedby RICS–University Partnership Scheme for which it must meet quality thresholdsas identified in the RICS Assessment of Professional Competence (APC) in QS andConstruction (2009).
3. QS education
QS is a profession that is well established in the British Commonwealth as beingresponsible for the management of cost and contracts in the construction industry(RICS 1971, 1983; Male 1990; Pheng and Ming 1997; Bowen et al. 2008; Ling andChan 2008). The profession is also known as construction economics in Europe andcost engineering in the USA and parts of Asia (Rashid 2002; Pathirage and Amaratunga2006; Smith 2009). Over the years, QS education has evolved from being rather tech-nician related in nature into fully fledged honours degrees with a greater orientationtowards commercial management, cost, contracts and project management. In theUK, the current QS degrees grew from the early 1970s with the move from diplomato degree-level qualification for entry to the profession. This transition from diplomasto university degrees was in line with the general transformation of the higher educationsector of the British education system. The majority of these degrees were delivered bythe former polytechnics, most of which, in turn, became new universities in the early1990s (Perera and Pearson 2013).
In the UK, the RICS–university partnership agreement is the primary mechanism toensure the academic quality of accredited programmes. This process involves ensuringthat certain minimum standards, known as ‘thresholds’, as set out in the guidance andpolicy document on university partnerships are achieved (RICS 2008a). A stipulationregarding relevant employment of graduates was waived off late, due to the currenteconomic situation (RICS 2008a). At present, there is no formal obligation for pro-gramme teams to map their curricula against specific RICS QS competencies at specificlevels, although most seek this outcome to some extent. The guidance and policy docu-ment does list and refer to the APC requirements, suggesting the ‘likelihood of meetingthreshold standards and leading to an existing APC pathway’ as a factor in the accred-itation or otherwise of a programme (Perera and Pearson 2013). The 2010 ‘vision forhigh-quality education’ was set out by an education task force in 1999 (RICS2008a). This envisaged strong partnerships between the RICS and a limited numberof recognised centres of academic excellence, characterised by not only an appropriaterange of curricula at undergraduate and postgraduate levels, but also increased freedomfor selected universities to develop courses and methods of delivery at all academiclevels. This is far from a prescriptive recipe, which lacks consideration of matchingspecific levels to core competencies. It is against this backdrop that this research devel-oped a GCTB, which led to the development of a final CMF.
4. Research methods
The research adopted four distinct data gathering phases, which culminated in dataanalysis and reporting, to benchmark the expected level of achievement of competen-cies by the QS graduates produced by RICS accredited programmes. The key stagesand process are illustrated in Figure 1.
Studies in Higher Education 2319
137

The four stages and the main research instrument adopted in this research aredetailed as follows.
4.1. Stage 1: pilot study
A literature review was conducted to identify the full QS study checklist structured byRICS competencies. This was followed by developing a competency mapping scoringsystem that could provide a numerical scale mapping of competencies to degree pro-gramme curricula (Figure 1). A pilot study involving two senior academic staff andtwo industry experts was used to test the scoring system and develop the final compe-tency mapping template (CMT) (Figure 1). The CMT is a dual vector scale matrix witha ‘breadth scale and a depth scale’. The breadth scale contains study topics, while thedepth scale contains competencies. Therefore, the CMT formed the basis for carryingout case studies mapping competencies to existing degree programmes.
4.2. Stage 2: case studies
The selected four case studies (A, B, C and D) were leading QS honours degree pro-grammes in the UK all accredited by the RICS (Figure 1). The case studies, therefore,provided the basis for the development of the benchmark for graduate competencies.
Figure 1. Research method chart.
2320 S. Perera et al.
138
These include examination of four RICS accredited QS degree programmes. The CMTdeveloped in stage 1 provides the template to map curricula to RICS competencies. Thecurricula of these programmes (module specifications) were mapped against RICS QScompetencies at a detailed level using coverage (as a breadth scale) and amount of timespent in learning, that is, module credits (as a depth scale). The ensuing mapping wasthen verified for accuracy and consistency with the programme directors responsible fortheir delivery. Furthermore, descriptive statistical analysis was used to develop a con-ceptual competency benchmark using these four case studies, which is the final outputof this stage.
4.3. Stage 3: expert forum
An expert forum comprising 15 persons (12 industry experts and 3 academic experts)was constituted to revise and modify the conceptual competency benchmark developedin stage 2 of the research above. The identified industry experts come from large, Smalland Medium-sized Enterprises (SME) and micro-level organisations. These includedQS employer organisations from both traditional consulting and contracting sectors.A total of 15 interviews were conducted comprising 3 academics (programmeleaders), 6 consultant quantity surveyors (2 experts from each category of large,SME and micro) and 6 contractor quantity surveyors (2 experts from large, 3 fromSME and 1 from micro-level organisation) (see Table 4 for details). The resulting find-ings were analysed using relevant descriptive statistics and presented as a ratifiedbenchmark. Delphi technique (Rowe and Wright 2001) was used to extract and harmo-nise the views of the experts and to finalise the benchmark level of achievement of com-petencies for graduate QS.
4.4. Stage 4: review of existing processes to integrate CMF
The GCTB forms the basis of the final stage of the research, where it is incorporatedinto the existing programme curricular development and management process, creatingthe CMF. A detailed review of the existing programme validation and managementmethods was carried out. Three highly experienced RICS accredited QS honoursdegree programme directors (who are also full members of the RICS) were selectedto develop the mechanism to integrate the GCTB and create the final CMF. Thisstage provides insight on how the CMF can be used within these existing systems toensure academic quality standards.
5. RICS QS competencies
The RICS QS competencies provide the basis on which the competence of a charteredquantity surveyor is defined. These are arranged into three groups, depending upontheir perceived relevance to the role of the quantity surveyor as follows:
(1) Mandatory competencies: personal, interpersonal and professional practice andbusiness skills common to all pathways (into membership) compulsory for allcandidates.
(2) Core competencies: primary skills of the candidate’s chosen RICS pathway.(3) Optional competencies: selected as an additional skill requirement for the can-
didate’s chosen RICS pathway from a list of competencies relevant to that
Studies in Higher Education 2321
139
pathway. In most cases there is an element of choice, though usually driven bytheir employer’s specialism.
Similarly, the RICS distinguishes between three possible levels of attainment ineach of a range of competences when setting its requirements for those seeking fullmembership as follows:
. Level 1: Knowledge (theoretical knowledge).
. Level 2: Knowledge and practical experience (putting it into practice).
. Level 3: Knowledge, practical experience and capacity to advise (explaining andadvising).
There are 8 mandatory competencies, 7 core competencies and 10 optional compe-tencies. The RICS stipulates that an APC candidate needs to achieve all mandatorycompetencies at Level 2 or above, and all core competencies at Level 3 (except theone not relevant to their specialisation, consulting or contracting as the case may be,which must be at Level 2). The further requirement is for 2 optional competencies atLevel 2 or above.
6. The competency mapping scoring system
The competency mapping scoring system is developed as a dual vector scale matrixconsisting of a ‘breadth scale and a depth scale’. The breadth scale indicates theextent of coverage of competencies as mapped to the RICS QS study checklist(RICS 2008b). The check list provides 359 individual study topics categorised into25 different competencies. These signify the extent of coverage (breadth of knowledge)expected under the current set of competencies. The depth scale provides an indicationof the time spent on achieving competencies. These are briefly discussed as follows:
6.1. Breadth scale
RICS QS competencies were analysed at a detailed level using the QS study checklist(RICS 2008b). This checklist is used as the framework for developing the conceptualbenchmark where the binary alternatives 1 and 0 are used to indicate coverage of a topicunder a competency. For example,
. 1 – Reflects that the topic is dealt with by the degree programme concerned.
. 0 – Reflects that it is not dealt with by the degree programme concerned.
These are indicated against the three-level classification of level of achievement bythe RICS (RICS 2009), as follows:
. Level 1 – Knowledge and understanding.
. Level 2 – Application of knowledge and understanding.
. Level 3 – Reasoned advice and depth of technical knowledge.
A specific topic may be covered at both Levels 1 and 2. In this case, there is a value1 in both Level 1 and Level 2 columns. If a topic achieves Level 2 coverage, then it isassumed that there is always Level 1 coverage as well. In another topic, if the topic is
2322 S. Perera et al.
140
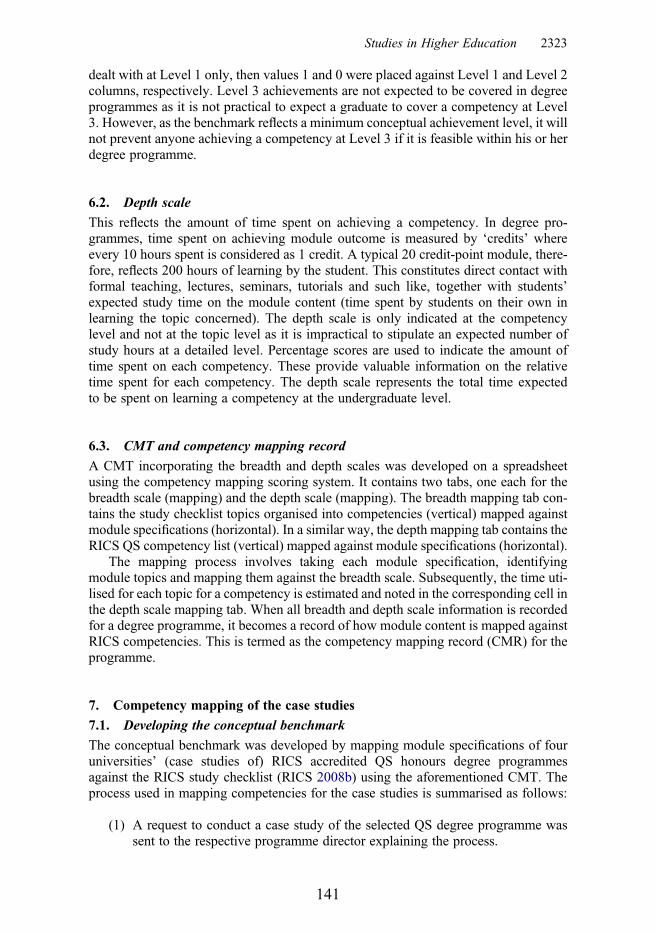
dealt with at Level 1 only, then values 1 and 0 were placed against Level 1 and Level 2columns, respectively. Level 3 achievements are not expected to be covered in degreeprogrammes as it is not practical to expect a graduate to cover a competency at Level3. However, as the benchmark reflects a minimum conceptual achievement level, it willnot prevent anyone achieving a competency at Level 3 if it is feasible within his or herdegree programme.
6.2. Depth scale
This reflects the amount of time spent on achieving a competency. In degree pro-grammes, time spent on achieving module outcome is measured by ‘credits’ whereevery 10 hours spent is considered as 1 credit. A typical 20 credit-point module, there-fore, reflects 200 hours of learning by the student. This constitutes direct contact withformal teaching, lectures, seminars, tutorials and such like, together with students’expected study time on the module content (time spent by students on their own inlearning the topic concerned). The depth scale is only indicated at the competencylevel and not at the topic level as it is impractical to stipulate an expected number ofstudy hours at a detailed level. Percentage scores are used to indicate the amount oftime spent on each competency. These provide valuable information on the relativetime spent for each competency. The depth scale represents the total time expectedto be spent on learning a competency at the undergraduate level.
6.3. CMT and competency mapping record
A CMT incorporating the breadth and depth scales was developed on a spreadsheetusing the competency mapping scoring system. It contains two tabs, one each for thebreadth scale (mapping) and the depth scale (mapping). The breadth mapping tab con-tains the study checklist topics organised into competencies (vertical) mapped againstmodule specifications (horizontal). In a similar way, the depth mapping tab contains theRICS QS competency list (vertical) mapped against module specifications (horizontal).
The mapping process involves taking each module specification, identifyingmodule topics and mapping them against the breadth scale. Subsequently, the time uti-lised for each topic for a competency is estimated and noted in the corresponding cell inthe depth scale mapping tab. When all breadth and depth scale information is recordedfor a degree programme, it becomes a record of how module content is mapped againstRICS competencies. This is termed as the competency mapping record (CMR) for theprogramme.
7. Competency mapping of the case studies
7.1. Developing the conceptual benchmark
The conceptual benchmark was developed by mapping module specifications of fouruniversities’ (case studies of) RICS accredited QS honours degree programmesagainst the RICS study checklist (RICS 2008b) using the aforementioned CMT. Theprocess used in mapping competencies for the case studies is summarised as follows:
(1) A request to conduct a case study of the selected QS degree programme wassent to the respective programme director explaining the process.
Studies in Higher Education 2323
141
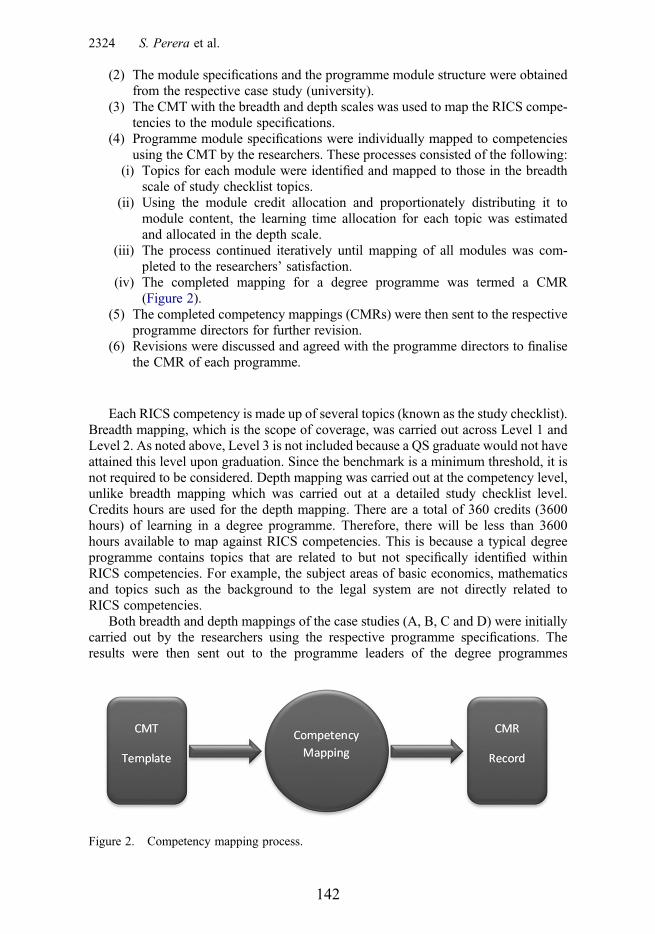
(2) The module specifications and the programme module structure were obtainedfrom the respective case study (university).
(3) The CMT with the breadth and depth scales was used to map the RICS compe-tencies to the module specifications.
(4) Programme module specifications were individually mapped to competenciesusing the CMT by the researchers. These processes consisted of the following:
(i) Topics for each module were identified and mapped to those in the breadthscale of study checklist topics.
(ii) Using the module credit allocation and proportionately distributing it tomodule content, the learning time allocation for each topic was estimatedand allocated in the depth scale.
(iii) The process continued iteratively until mapping of all modules was com-pleted to the researchers’ satisfaction.
(iv) The completed mapping for a degree programme was termed a CMR(Figure 2).
(5) The completed competency mappings (CMRs) were then sent to the respectiveprogramme directors for further revision.
(6) Revisions were discussed and agreed with the programme directors to finalisethe CMR of each programme.
Each RICS competency is made up of several topics (known as the study checklist).Breadth mapping, which is the scope of coverage, was carried out across Level 1 andLevel 2. As noted above, Level 3 is not included because a QS graduate would not haveattained this level upon graduation. Since the benchmark is a minimum threshold, it isnot required to be considered. Depth mapping was carried out at the competency level,unlike breadth mapping which was carried out at a detailed study checklist level.Credits hours are used for the depth mapping. There are a total of 360 credits (3600hours) of learning in a degree programme. Therefore, there will be less than 3600hours available to map against RICS competencies. This is because a typical degreeprogramme contains topics that are related to but not specifically identified withinRICS competencies. For example, the subject areas of basic economics, mathematicsand topics such as the background to the legal system are not directly related toRICS competencies.
Both breadth and depth mappings of the case studies (A, B, C and D) were initiallycarried out by the researchers using the respective programme specifications. Theresults were then sent out to the programme leaders of the degree programmes
Figure 2. Competency mapping process.
2324 S. Perera et al.
142
concerned for necessary adjustments and ratifications. Descriptive statistics such asmean and percentage scores were used to analyse and present the results of the casestudies as a conceptual framework.
7.2. Comparative analysis of case studies
The four case study competency mappings were collated and statistically analysed todevelop the conceptual benchmark for mapping graduate level QS competencies. Asummary of the depth mapping of case studies is provided (Table 1).
There are many variations on how the programme curricula of individual casestudies (universities) are mapped to competencies. Most variations are in themapping of a few core competencies and of the optional competencies. This is some-what expected as individual programmes have their own strengths and character. Theaverage total mapping of competencies stands at 78%, indicating that 22% of the cur-ricula in undergraduate programmes reflect knowledge content that does not directlymap against competencies. These are often fundamental and basic knowledge com-ponents that are essentially required in order to be able to deliver knowledge thatwould assist in the achievement of competencies. A detailed analysis of the weightingsfor mandatory, core and optional competencies across the four case studies is presentedin Figure 3.
As indicated in Figure 3, it is very clear that all universities have given overwhelm-ing priority to core competencies. Two universities have given the second level of pri-ority for either optional or mandatory competencies.
8. The conceptual benchmark for graduate route
The conceptual benchmark (Table 2) is a two-dimensional matrix reflecting overallaverage coverage and average depth of coverage of the four case studies. The concep-tual benchmark values reflect the levels of achievement of competencies by graduatescompleting a degree from the four case study QS programmes. It reveals under Level 1and Level 2 columns the topics covered in all the four RICS accredited degree pro-grammes examined. A value of 1 against a particular topic implies that at least oneof the case study degree programmes covers this. The credits hours’ column, whichis the average of the four case study values, indicates typical expected times (inhours) devoted to each competency, while the percentage column shows the relativetime proportion. Only a brief extract of the conceptual benchmark is shown (as thetable extends to several pages).
On the whole, the conceptual benchmark shows the average level of graduate com-petency achievement from four universities (case studies) of RICS accredited pro-grammes. Thus, the conceptual benchmark indicates graduate attainment of RICSQS competencies. This provided a basis for further investigation of industry and aca-demic views of the conceptual benchmark and their expectations. This is essential toharmonise diverse views and to generate a minimum graduate competency benchmarkthat satisfies the aspirations of all stakeholders. In order to provide a meaningful com-parison of the priorities of the conceptual benchmark, the summary of the depth andbreadth scales for competencies is provided.
Table 3 is derived from obtaining average figures from the four case studies com-pleted. The depth scale was developed using mean time periods utilised for each com-petency. The breadth scale was developed by considering the frequency of engagement
Studies in Higher Education 2325
143
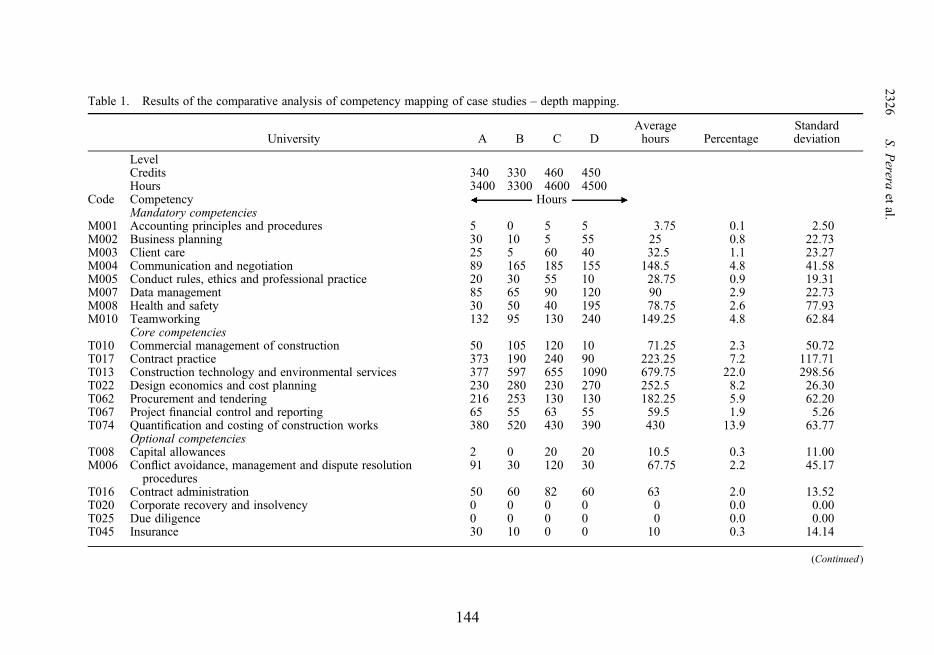
Table 1. Results of the comparative analysis of competency mapping of case studies – depth mapping.
University A B C DAveragehours Percentage
Standarddeviation
LevelCredits 340 330 460 450Hours 3400 3300 4600 4500
Code Competency HoursMandatory competencies
M001 Accounting principles and procedures 5 0 5 5 3.75 0.1 2.50M002 Business planning 30 10 5 55 25 0.8 22.73M003 Client care 25 5 60 40 32.5 1.1 23.27M004 Communication and negotiation 89 165 185 155 148.5 4.8 41.58M005 Conduct rules, ethics and professional practice 20 30 55 10 28.75 0.9 19.31M007 Data management 85 65 90 120 90 2.9 22.73M008 Health and safety 30 50 40 195 78.75 2.6 77.93M010 Teamworking 132 95 130 240 149.25 4.8 62.84
Core competenciesT010 Commercial management of construction 50 105 120 10 71.25 2.3 50.72T017 Contract practice 373 190 240 90 223.25 7.2 117.71T013 Construction technology and environmental services 377 597 655 1090 679.75 22.0 298.56T022 Design economics and cost planning 230 280 230 270 252.5 8.2 26.30T062 Procurement and tendering 216 253 130 130 182.25 5.9 62.20T067 Project financial control and reporting 65 55 63 55 59.5 1.9 5.26T074 Quantification and costing of construction works 380 520 430 390 430 13.9 63.77
Optional competenciesT008 Capital allowances 2 0 20 20 10.5 0.3 11.00M006 Conflict avoidance, management and dispute resolution
procedures91 30 120 30 67.75 2.2 45.17
T016 Contract administration 50 60 82 60 63 2.0 13.52T020 Corporate recovery and insolvency 0 0 0 0 0 0.0 0.00T025 Due diligence 0 0 0 0 0 0.0 0.00T045 Insurance 30 10 0 0 10 0.3 14.14
(Continued)
2326S.
Perera
etal.
144
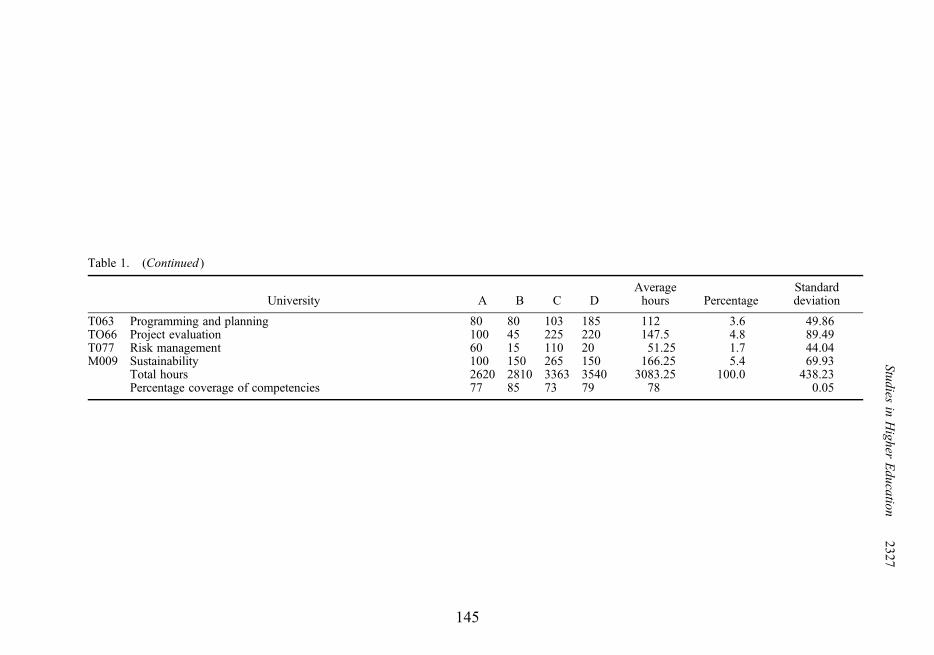
Table 1. (Continued )
University A B C DAveragehours Percentage
Standarddeviation
T063 Programming and planning 80 80 103 185 112 3.6 49.86TO66 Project evaluation 100 45 225 220 147.5 4.8 89.49T077 Risk management 60 15 110 20 51.25 1.7 44.04M009 Sustainability 100 150 265 150 166.25 5.4 69.93
Total hours 2620 2810 3363 3540 3083.25 100.0 438.23Percentage coverage of competencies 77 85 73 79 78 0.05
Studiesin
Higher
Education
2327
145
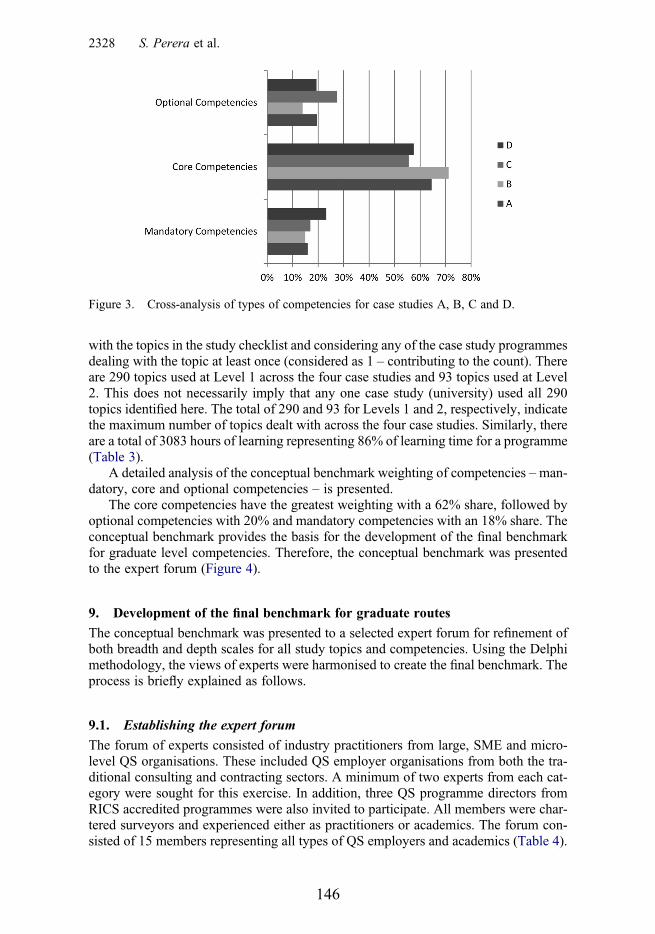
with the topics in the study checklist and considering any of the case study programmesdealing with the topic at least once (considered as 1 – contributing to the count). Thereare 290 topics used at Level 1 across the four case studies and 93 topics used at Level2. This does not necessarily imply that any one case study (university) used all 290topics identified here. The total of 290 and 93 for Levels 1 and 2, respectively, indicatethe maximum number of topics dealt with across the four case studies. Similarly, thereare a total of 3083 hours of learning representing 86% of learning time for a programme(Table 3).
A detailed analysis of the conceptual benchmark weighting of competencies –man-datory, core and optional competencies – is presented.
The core competencies have the greatest weighting with a 62% share, followed byoptional competencies with 20% and mandatory competencies with an 18% share. Theconceptual benchmark provides the basis for the development of the final benchmarkfor graduate level competencies. Therefore, the conceptual benchmark was presentedto the expert forum (Figure 4).
9. Development of the final benchmark for graduate routes
The conceptual benchmark was presented to a selected expert forum for refinement ofboth breadth and depth scales for all study topics and competencies. Using the Delphimethodology, the views of experts were harmonised to create the final benchmark. Theprocess is briefly explained as follows.
9.1. Establishing the expert forum
The forum of experts consisted of industry practitioners from large, SME and micro-level QS organisations. These included QS employer organisations from both the tra-ditional consulting and contracting sectors. A minimum of two experts from each cat-egory were sought for this exercise. In addition, three QS programme directors fromRICS accredited programmes were also invited to participate. All members were char-tered surveyors and experienced either as practitioners or academics. The forum con-sisted of 15 members representing all types of QS employers and academics (Table 4).
Figure 3. Cross-analysis of types of competencies for case studies A, B, C and D.
2328 S. Perera et al.
146

Table 2. Results of the sample of conceptual benchmark.
CompetencyLevel1
Level2
Level3
Credithours Percentage
Mandatory competenciesAccounting principles and procedures
(M001) – Level 13.75 0.1
Balance sheets/profit and loss account 0 0Taxation 1 0Revenue and capital expenditure 0 0Cash flows 1 0Profitability 1 0Insolvency 0 0Legislation 1 0Business planning (M002) – Level 1 25 0.8Legislation 1 0Short-/long-term strategies 1 0Market analysis 1 0Five-year plans 1 0Business support services –
administration, secretarial, HR, IT andso on
1 0
Staffing levels – recruitment/turnover 1 0Continued…
Core competenciesCommercial management of construction
(T010) – Level 371.25 2.3
Estimating 1 1Establishing budgets 1 1Cash flows 1 1Reporting financial progress against
budget1 1
Procurement of subcontracts 1 0Financial management of supply chain 1 0Financial management of multiple projects 1 0Contract practice (T017) – Level 3 223.25 7.2Principles of contract law 1 0Legislation 1 0Current case-law – lookout for cases
reported in journals1 0
Standard forms of main and subcontract –for example, JCT, NEC/ECC, GCWorks, ICE, ACA, IChemE, FIDIC andso on
1 1
Final accounts 1 1Completion 1 0Liquidated and ascertained damages 1 0Defects rectification period 1 1Construction technology and
environmental services (T013) – Level 3679.75 22.0
Construction technology 1 0Substructures – basements, types of piling
and so on1 0
Superstructures 1 0
(Continued)
Studies in Higher Education 2329
147

Table 2. (Continued )
CompetencyLevel1
Level2
Level3
Credithours Percentage
Comparison of concrete/steel frames 1 0External walls, windows and doors 1 0Cladding/glazing 1 0Planning legislation and procedures 0 0Party wall issues/rights of light 0 0Dangerous/banned substances – asbestos
and so on0 0
Prefabrication 1 0Disability legislation 1 0Design economics and cost planning
(T022) – Level 3252.5 8.2
Economics of design – site density, wall/floor ratio, storey heights, room sizes,letable/non-letable
1 1
Sources of cost data – BCIS/in-housedatabase/other external sources
1 1
Inflation (tender/construction) 1 1Location factors, regional variations 1 1Currency fluctuations 1 0Estimating 1 1Cost Plans 1 1Cost Planning 1 1Life cycle costing – capital/running costs/
replacement1 1
Value engineering 1 1Value management 1 1Continued…
Optional competenciesCapital allowances (T008) 10.5 0.3Current legislation 1 0Capital and revenue expenditure 1 0Taxation 1 0Capital allowances legislation 1 0Claiming capital allowances 1 0Plant and machinery 1 0Enhanced capital allowances 0 0Conflict avoidance, management and
dispute resolution procedures (M006)67.75 2.2
How standard forms of contract deal withconflict avoidance and disputeresolution
1 0
Conflict avoidance 1 0Partnering 1 0Negotiation 1 0Mediation 1 0Conciliation 1 0Adjudication 1 0Arbitration 1 0Expert witness 1 0Continued…
298 99 3083.25 100.0
Note: Building Cost Information Service, BCIS.
2330 S. Perera et al.
148
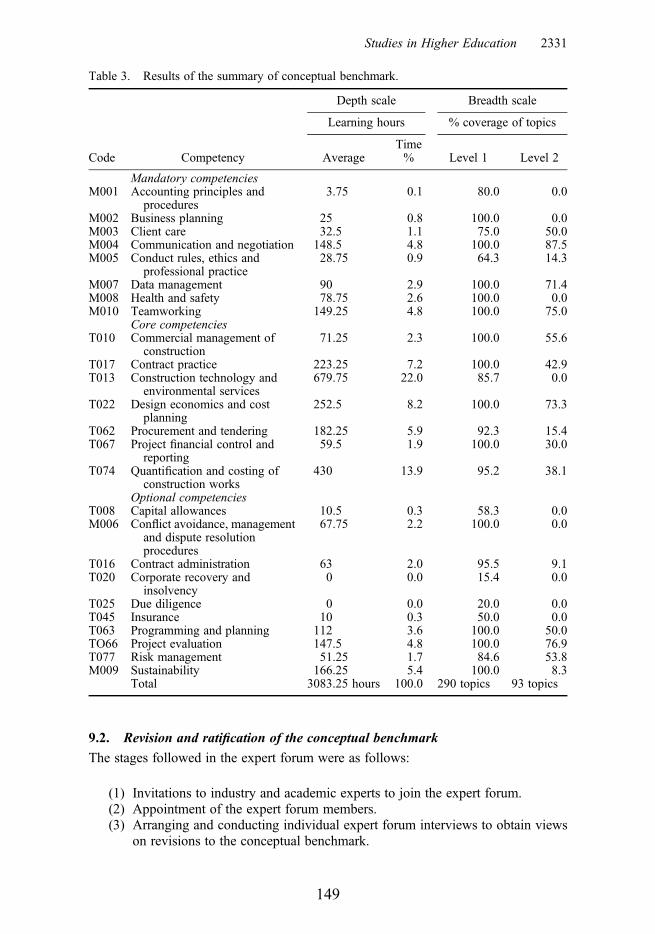
9.2. Revision and ratification of the conceptual benchmark
The stages followed in the expert forum were as follows:
(1) Invitations to industry and academic experts to join the expert forum.(2) Appointment of the expert forum members.(3) Arranging and conducting individual expert forum interviews to obtain views
on revisions to the conceptual benchmark.
Table 3. Results of the summary of conceptual benchmark.
Code Competency
Depth scale Breadth scale
Learning hours % coverage of topics
AverageTime% Level 1 Level 2
Mandatory competenciesM001 Accounting principles and
procedures3.75 0.1 80.0 0.0
M002 Business planning 25 0.8 100.0 0.0M003 Client care 32.5 1.1 75.0 50.0M004 Communication and negotiation 148.5 4.8 100.0 87.5M005 Conduct rules, ethics and
professional practice28.75 0.9 64.3 14.3
M007 Data management 90 2.9 100.0 71.4M008 Health and safety 78.75 2.6 100.0 0.0M010 Teamworking 149.25 4.8 100.0 75.0
Core competenciesT010 Commercial management of
construction71.25 2.3 100.0 55.6
T017 Contract practice 223.25 7.2 100.0 42.9T013 Construction technology and
environmental services679.75 22.0 85.7 0.0
T022 Design economics and costplanning
252.5 8.2 100.0 73.3
T062 Procurement and tendering 182.25 5.9 92.3 15.4T067 Project financial control and
reporting59.5 1.9 100.0 30.0
T074 Quantification and costing ofconstruction works
430 13.9 95.2 38.1
Optional competenciesT008 Capital allowances 10.5 0.3 58.3 0.0M006 Conflict avoidance, management
and dispute resolutionprocedures
67.75 2.2 100.0 0.0
T016 Contract administration 63 2.0 95.5 9.1T020 Corporate recovery and
insolvency0 0.0 15.4 0.0
T025 Due diligence 0 0.0 20.0 0.0T045 Insurance 10 0.3 50.0 0.0T063 Programming and planning 112 3.6 100.0 50.0TO66 Project evaluation 147.5 4.8 100.0 76.9T077 Risk management 51.25 1.7 84.6 53.8M009 Sustainability 166.25 5.4 100.0 8.3
Total 3083.25 hours 100.0 290 topics 93 topics
Studies in Higher Education 2331
149

(4) Collating the views of the expert forum members and developing the revisedbenchmark considering the average views of all experts.
(5) Distributing the revised benchmark to all experts to obtain views on furtherrevisions or concurrence with the revised benchmark.
(6) Collating all further revisions to develop the ratified benchmark.(7) Converting the ratified benchmark to the final benchmark; this comprises the
GCTB.
The details of how the revised benchmark values were developed from the concep-tual benchmark and the development of the ratified benchmark values from the revisedbenchmark are explained as follows.
For the breadth scale, mode was used to analyse expert forum views. A competencyconsists of several topics. At Level 1, a topic under a certain competency would eitherbe expected (i.e. by the experts) to be covered (i.e. marked as 1) or not expected to becovered (i.e. marked as 0), in graduate QS education. The same rules applied to Level 2
Table 4. Composition of the expert forum.
No. Type of organisation Abbreviation Size Code
1 Consulting practice PQS Large L2 Consulting practice PQS Large D3 Consulting practice PQS SME G4 Consulting practice PQS SME E5 Consulting practice PQS Micro F6 Consulting practice PQS Micro B7 Contracting CQS Large Q8 Contracting CQS Large K9 Contracting CQS SME A10 Contracting CQS SME J11 Contracting CQS Micro C12 Contracting CQS SME H13 Academia Academic University N14 Academia Academic University M15 Academia Academic University P
Figure 4. Conceptual benchmark – weighting of competencies.
2332 S. Perera et al.
150
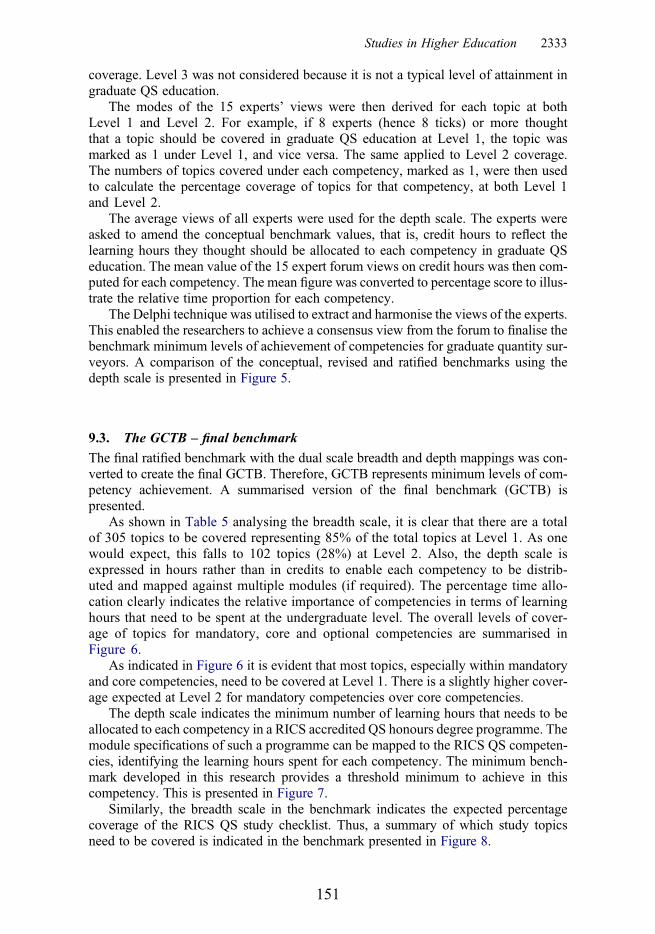
coverage. Level 3 was not considered because it is not a typical level of attainment ingraduate QS education.
The modes of the 15 experts’ views were then derived for each topic at bothLevel 1 and Level 2. For example, if 8 experts (hence 8 ticks) or more thoughtthat a topic should be covered in graduate QS education at Level 1, the topic wasmarked as 1 under Level 1, and vice versa. The same applied to Level 2 coverage.The numbers of topics covered under each competency, marked as 1, were then usedto calculate the percentage coverage of topics for that competency, at both Level 1and Level 2.
The average views of all experts were used for the depth scale. The experts wereasked to amend the conceptual benchmark values, that is, credit hours to reflect thelearning hours they thought should be allocated to each competency in graduate QSeducation. The mean value of the 15 expert forum views on credit hours was then com-puted for each competency. The mean figure was converted to percentage score to illus-trate the relative time proportion for each competency.
The Delphi technique was utilised to extract and harmonise the views of the experts.This enabled the researchers to achieve a consensus view from the forum to finalise thebenchmark minimum levels of achievement of competencies for graduate quantity sur-veyors. A comparison of the conceptual, revised and ratified benchmarks using thedepth scale is presented in Figure 5.
9.3. The GCTB – final benchmark
The final ratified benchmark with the dual scale breadth and depth mappings was con-verted to create the final GCTB. Therefore, GCTB represents minimum levels of com-petency achievement. A summarised version of the final benchmark (GCTB) ispresented.
As shown in Table 5 analysing the breadth scale, it is clear that there are a totalof 305 topics to be covered representing 85% of the total topics at Level 1. As onewould expect, this falls to 102 topics (28%) at Level 2. Also, the depth scale isexpressed in hours rather than in credits to enable each competency to be distrib-uted and mapped against multiple modules (if required). The percentage time allo-cation clearly indicates the relative importance of competencies in terms of learninghours that need to be spent at the undergraduate level. The overall levels of cover-age of topics for mandatory, core and optional competencies are summarised inFigure 6.
As indicated in Figure 6 it is evident that most topics, especially within mandatoryand core competencies, need to be covered at Level 1. There is a slightly higher cover-age expected at Level 2 for mandatory competencies over core competencies.
The depth scale indicates the minimum number of learning hours that needs to beallocated to each competency in a RICS accredited QS honours degree programme. Themodule specifications of such a programme can be mapped to the RICS QS competen-cies, identifying the learning hours spent for each competency. The minimum bench-mark developed in this research provides a threshold minimum to achieve in thiscompetency. This is presented in Figure 7.
Similarly, the breadth scale in the benchmark indicates the expected percentagecoverage of the RICS QS study checklist. Thus, a summary of which study topicsneed to be covered is indicated in the benchmark presented in Figure 8.
Studies in Higher Education 2333
151

10. Discussion
It is increasingly evident today that significant attention is paid to competency-basededucation for professionally oriented degree programmes in HEIs in many disciplinesacross the globe. The purpose of this research was to develop a CMF for the profes-sionally oriented degree programmes taking QS honours degree programme as an
Figure 5. Cross-comparison of ratified, revised and conceptual benchmarks for graduatecompetencies.
2334 S. Perera et al.
152
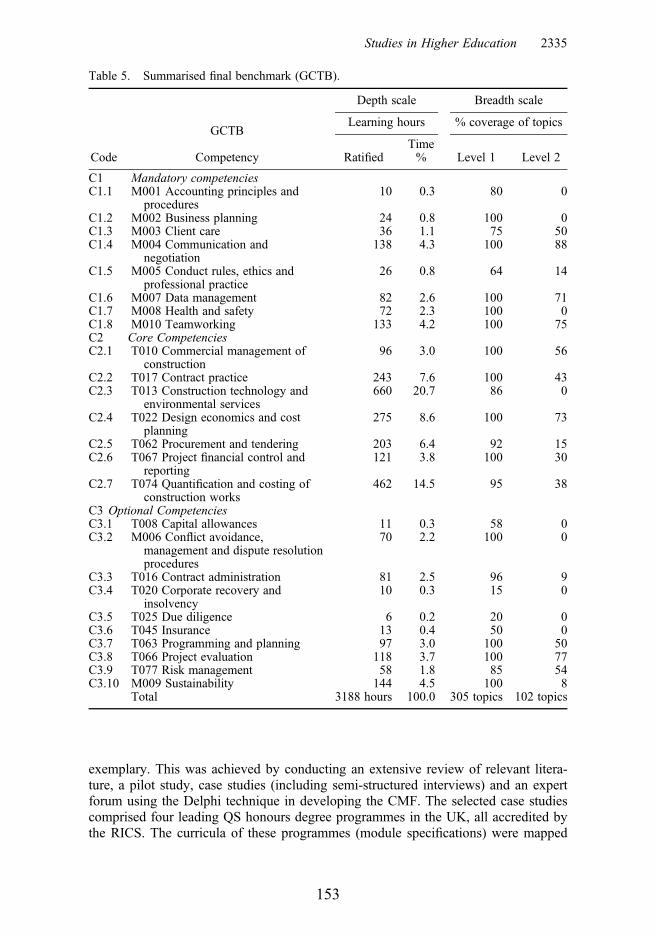
exemplary. This was achieved by conducting an extensive review of relevant litera-ture, a pilot study, case studies (including semi-structured interviews) and an expertforum using the Delphi technique in developing the CMF. The selected case studiescomprised four leading QS honours degree programmes in the UK, all accredited bythe RICS. The curricula of these programmes (module specifications) were mapped
Table 5. Summarised final benchmark (GCTB).
GCTB
Depth scale Breadth scale
Learning hours % coverage of topics
Code Competency RatifiedTime% Level 1 Level 2
C1 Mandatory competenciesC1.1 M001 Accounting principles and
procedures10 0.3 80 0
C1.2 M002 Business planning 24 0.8 100 0C1.3 M003 Client care 36 1.1 75 50C1.4 M004 Communication and
negotiation138 4.3 100 88
C1.5 M005 Conduct rules, ethics andprofessional practice
26 0.8 64 14
C1.6 M007 Data management 82 2.6 100 71C1.7 M008 Health and safety 72 2.3 100 0C1.8 M010 Teamworking 133 4.2 100 75C2 Core CompetenciesC2.1 T010 Commercial management of
construction96 3.0 100 56
C2.2 T017 Contract practice 243 7.6 100 43C2.3 T013 Construction technology and
environmental services660 20.7 86 0
C2.4 T022 Design economics and costplanning
275 8.6 100 73
C2.5 T062 Procurement and tendering 203 6.4 92 15C2.6 T067 Project financial control and
reporting121 3.8 100 30
C2.7 T074 Quantification and costing ofconstruction works
462 14.5 95 38
C3 Optional CompetenciesC3.1 T008 Capital allowances 11 0.3 58 0C3.2 M006 Conflict avoidance,
management and dispute resolutionprocedures
70 2.2 100 0
C3.3 T016 Contract administration 81 2.5 96 9C3.4 T020 Corporate recovery and
insolvency10 0.3 15 0
C3.5 T025 Due diligence 6 0.2 20 0C3.6 T045 Insurance 13 0.4 50 0C3.7 T063 Programming and planning 97 3.0 100 50C3.8 T066 Project evaluation 118 3.7 100 77C3.9 T077 Risk management 58 1.8 85 54C3.10 M009 Sustainability 144 4.5 100 8
Total 3188 hours 100.0 305 topics 102 topics
Studies in Higher Education 2335
153

against RICS QS competencies. The case studies, consequently, provided the basisfor the development of the benchmark for graduate competencies. The 25 RICS com-petencies identified in this research are grouped into three as follows: (1) 8 manda-tory competencies, (2) 7 core competencies and (3) 10 optional competencies (RICS2009). This approach is similar to that of previous studies. For instance, Ahn, Annie,and Kwon (2012) identified 14 key competencies for the US construction graduates.Through factor analysis the authors grouped the identified competencies into fourclasses of competencies for construction graduates as follows: (1) general compe-tency, (2) affective competency, (3) cognitive competency and (4) technicalcompetency.
Arain (2010) identified the graduate competencies for baccalaureate level con-struction education in Alberta, Canada. The author recommended that the breadthand depth of the core curricula ensured sufficient coverage of fundamental andextended topics in construction project management. This present researchmirrors similar research undertaken in Alberta, Canada (see Arain 2010), theUSA (see Ahn, Annie, and Kwon 2012), Australia (see Newton and Goldsmith2011a, 2011b; Newton et al. 2012), the UK (see Perera and Pearson 2011),Germany (see Schaeper 2009) and South Africa (see Nkado and Meyer 2001),but expands the works with increased attention to the mapping of the competenciesto the depth and breadth scales. Perlin (2011) recognised mapping as an approachfor the ‘evaluation and restructuring of an individual course and curriculum objec-tives for alignment with programme competencies and accreditation requirements’.The mapping process further provides an opportunity for evaluating how well theoverall curriculum reflects the programme’s stated competencies in terms ofbreadth and depth (Rissi and Gelmon 2014). Against this backdrop, this research
Figure 6. Overall comparison of coverage of topics (breadth scale) across competencycategories.
2336 S. Perera et al.
154

developed a CMF for programme appraisal and benchmarking. The CMF consistsof three essential instruments to include GCTB, CMT and CMR. In achieving theCMF, a logical learning credit-based competency mapping scoring system wasdeveloped as a dual scale matrix consisting of a ‘breadth scale’ and ‘a depthscale’. The breadth scale consists of four columns to include Level 1 and Level2 columns that indicate the level at which a topic is to be achieved at the under-graduate level. The other two columns present statistics of percentage coverage oftopics at Level 1 and Level 2, respectively. The depth scale consists of twocolumns to include, firstly, the credit hours and indicates the amount of time an
Figure 7. Benchmark minimum learning hours – depth scale.
Studies in Higher Education 2337
155

undergraduate student should spend in learning topics related to a competency, andsecondly, statistics of the percentage time allocated for a competency (see Figure 9for details). This approach is similar to the spreadsheet analysis adopted byNewton and Goldsmith (2011a) when developing TLOs to benchmark the graduateoutcomes from a Bachelor-level study in building and construction management inAustralia.
Therefore, the mapping process involves taking each module specification, identi-fying module topics and mapping them against the breadth scale. Subsequently, thetime utilised for each topic within a competency is estimated and noted in the depthscale. When all breadth and depth scale information is recorded for a degree pro-gramme, it becomes a record of how module content is mapped against competencies.As it is revealed in this research, CMF provides a minimum threshold benchmark levelof competency required in undergraduate studies in QS in the UK. The module contentswere mapped to competencies using the competency map scoring system incorporatingthe depth and breadth scales.
Figure 8. Benchmark minimum coverage of study topics – breadth scale.
2338 S. Perera et al.
156

11. Conclusions
This research seeks to usefully improve the relationship between that which is taught inHEIs and that which is sought by the industry, to align practice and academic priorities.Against this backdrop, this research developed a CMF for programme appraisal andbenchmarking. The CMF consists of three essential instruments to include a GCTB,a CMT and a CMR. These research findings revealed that having analysed thebreadth scale, it is clear that there is a total of 305 topics to be covered representing85% of all topics at Level 1. This figure falls to 102 topics (28%) at Level 2. It isevident that most topics, especially for mandatory and core competencies, need to becovered at Level 1. Furthermore, there is a slightly higher coverage expected atLevel 2 for mandatory competencies over core competencies. The depth scale isexpressed in hours rather than in credits to enable each competency to be distributedand mapped against multiple modules. Analysing the depth scale, it indicates thatthere is a total of 3188 hours of learning time expected on RICS QS competencies.It is obvious that CMF developed in this research have both theoretical and practicalimplications. The theoretical implication provides a useful methodology to map pro-gramme curricula to competencies, which can be replicated in any construction-
Figure 9. Sample portion of final GCTB.
Studies in Higher Education 2339
157

oriented degree programme. The practical implication indicates that CMF can be usedeffectively in programmes development and validation. The CMF would further beuseful in monitoring and improving quality and professional standards of any degreeprogrammes. It is believed that this research finding would align practice and academicpriorities, thus enhancing the employability of construction graduates.
AcknowledgementsThe authors wish to acknowledge the RICS Research Trust, members of Construction Econ-omics and Management Research Group (CEMRG) in the Faculty of Engineering and Environ-ment, and Northumbria University for their support for this research.
Disclosure statementNo potential conflict of interest was reported by the authors.
ReferencesACCE. 2015. “Standards and Criteria for Accreditation of Postsecondary Construction
Education Degree Programs.” Accessed December 8, 2015. http://www.acce-hq.org/images/uploads/Doc_103_OBS_final_042915.pdf
Ahn, Y., R. Annie, and H. Kwon. 2012. “Key Competencies for U.S. Construction Graduates:Industry Perspective.” Journal of Professional Issues in Engineering Education andPractice 138 (2): 123–30.
Arain, F. 2010. “Identifying Competencies for Baccalaureate Level Construction Education:Enhancing Employability of Young Professionals in the Construction Industry.”Construction Research Congress 2010: 194–204.
Australian Learning and Teaching Council (ALTC). 2011. “Learning and Teaching AcademicStandards Project: Building and Construction Academic Standards Statement.” AccessedDecember 8, 2015. http://disciplinestandards.pbworks.com/w/file/fetch/53056843/altc_standards_BUILDING.pdf
Batterman, S., A. Martins, C. Antunes, F. Freire, and M. da Silva. 2011. “Development andApplication of Competencies for Graduate Programs in Energy and Sustainability.”Journal of Professional Issues in Engineering Education and Practice 137 (4): 198–207.
Bowen, P., K. Cattell, G. Distiller, and P. J. Edwards. 2008. “Job Satisfaction of South AfricanQuantity Surveyors: An Empirical Study.” Construction Management and Economics 26(7): 765–80.
Cowan, D. T., I. Norman, and V. P. Coopamah. 2007. “Competence in Nursing Practice: AControversial Concept – A Focused Review of Literature.” Accident and EmergencyNursing 15 (1): 20–26.
Dainty, A. R. N., M. I. Cheng, and D. R. Moore. 2003. “Redefining Performance Measures forConstruction Project Managers: An Empirical Evaluation.” Construction Management andEconomics 21: 209–18.
Getha-Taylor, H., R. Hummert, J. Nalbandian, and C. Silvia. 2013. “Competency Model Designand Assessment: Findings and Future Directions.” Journal of Public Affairs Education 19(1): 141–71.
Gibb, S. 2003. “Information Advice and Guidance – Is It Time for a National Research Forum?”Career Development International 8 (4): 169–218.
Kaklauskas, A., A. Daniūnas, D. Amaratunga, V. Urbonas, I. Lill, R. Gudauskas, M. D‘amato,V.Trinkūnas, and I. Jackutė, 2012. “Life Cycle Process Model of a Market-Oriented andStudent Centered Higher Education.” International Journal of Strategic PropertyManagement 16 (4): 414–30.
Keraminiyage, K., and I. Lill. 2013. “Strategies to Address Gaps in the Supply and Demand ofSkills and Knowledge in Built Environment-Related Disciplines.” International Journal ofStrategic Property Management 17 (2): 111–13.
2340 S. Perera et al.
158
Ling, F. Y. Y., and A. H. M. Chan. 2008. “Internationalising Quantity Surveying Services.”Engineering, Construction and Architectural Management 15 (5): 440–55.
Male, S. 1990. “Professional Authority, Power and Emerging Forms of ‘Profession’ in QuantitySurveying.” Construction Management and Economics 8 (2): 191–204.
Meyer, T., and P. Semark. 1996. “A Framework for the Use of Competencies for AchievingCompetitive Advantage.” South African Journal of Business Management 27 (4): 96–103.
Newton, S. 2011. Building and Construction Learning and Teaching Academic StandardsStatement: Learning and Teaching Academic Standards Project. Strawberry Hills:Australian Learning and Teaching Council. Accessed December 8, 2015. http://www.altc.edu.au/
Newton, S., and R. Goldsmith (2011a). “Setting Academic Standards for Tertiary Education inthe Construction Industry.” Proceedings of 36th AUBEA conference, Melbourne. AccessedDecember 8, 2015. http://www2.bond.edu.au/about/faculties/bus/isda/aubea.html
Newton, S., and R. Goldsmith (2011b). “An Analysis of Stakeholder Preferences for ThresholdLearning Outcomes in Construction Management in Australia.” Proceedings 27th annualARCOM conference, edited by C. Egbu and E. C. W. Lou, Bristol, September 5–7.
Newton, S., M. Betts, R. Burt, and M. Lees. 2012. “Setting Global Academic Standards for theBuilding and Construction Industry: A Discussion Piece.” Proceedings of the joint CIBinternational conference: management of construction: research to practice, BirminghamSchool of the Built Environment, Birmingham City University.
Nkado, R., and T. Meyer. 2001. “Competencies of Professional Quantity Surveyors: A SouthAfrican Perspective.” Construction Management and Economics 19: 481–91.
Pathirage, C. P., and R. D. G. Amaratunga. 2006. “A Vision for the Quantity SurveyingEducation in the 21st Century: United Kingdom Perspective.” In Customising theQuantity Surveying Education, edited by R. Rameezdeen and I. Seneviratne, 23–32. SriLanka: Department of Building Economics, University of Moratuwa.
Perera, S., and J. Pearson. 2011. “Alignment of Professional, Academic and IndustrialDevelopment Needs for Quantity Surveyors: Post Recession Dynamics.” RICS EducationTrust Funded Research Report. Accessed September 20, 2014. http://www.rics.org/uk/knowledge/research/research-reports/alignment-of-professional-academics-and-industrial-development-needs-for-quantity-surveyors-the-post-recession-dynamics-/
Perera, S., and J. Pearson. 2013. “RICS Professional Competency Mapping Framework forProgramme Appraisal and Benchmarking.” RICS Research Trust Funded Research MainReport, RICS. Accessed September 20, 2014. http://www.rics.org/uk/knowledge/research/research-reports/professional-competency-mapping-framework/
Perlin, M. S. 2011. “Curriculum Mapping for Program Evaluation and CAHME Accreditation.”Journal of Health Administration Education 28 (1): 27–47.
Pheng, L. S., and K. H. Ming. 1997. “Formulating a Strategic Marketing Mix for QuantitySurveyors.” Marketing Intelligence & Planning 15 (6): 273–80.
QAA 2008. “Subject Benchmark Statement: Construction, Property and Surveying.” AccessedDecember 8, 2014. http://dera.ioe.ac.uk/id/eprint/7146
Rashid, K. A. 2002. “A Study on the Curricula for the Bachelor of Quantity Surveying Coursesin Malaysia.” The Surveyor 3: 17–22.
RICS. 1971. The Future Role of the Quantity Surveyor. London: RICS.RICS. 1983. The Future Role of the Chartered Quantity Surveyor. London: RICS.RICS. 2008a. Your Pathway to Qualifying in Quantity Surveying and Construction:
Supplemental Guidance. RICS Quantity Surveying and Construction Faculty in conjunctionwith RICS Education and Training. London: RICS.
RICS. 2008b. Policy and Guidance on University Partnerships. London: RICS Education andQualification Standards Department.
RICS. 2009. “Requirements and Competencies, RICS Education and Qualification Standards.”Accessed September 20, 2014. http://www.rics.org/site/scripts/download_info.aspx?fileID=3729&categoryID=98
Rissi, J. J., and S. B. Gelmon. 2014. “Development, Implementation, and Assessment of aCompetency Model for a Graduate Public Affairs Program in Health Administration.”Journal of Public Affairs Education 20 (3): 335–52.
Studies in Higher Education 2341
159

Rowe, G., and G. Wright. 2001. “Expert Opinions in Forecasting: Role of the DelphiTechnique.” In Principles of Forecasting: A Handbook of Researchers and Practitioners,edited by J. S. Armstrong, 125–44. Boston, MA: Kluwer Academic Publishers.
Schaeper, H. 2009. “Development of Competencies and Teaching-learning Arrangements inHigher Education: Finding from Germany.” Studies in Higher Education 34 (6): 677–97.
Smith, P. 2009. “Trends in the Australian Quantity Surveying Profession: 1995–2008.”Proceedings of the 13th Pacific Association of Quantity Surveyors Congress (PAQS2009), Kuala Lumpur, August 17–18.
Tett, R. P., H. L. Guterman, A. Bleier, and P. J. Murphy. 2000. “Development and ContentValidation of a ‘Hyperdimensional’ Taxonomy of Managerial Competence.” HumanPerformance 13 (3): 205–51.
2342 S. Perera et al.
160

Design Economics for the Built Environment: Impact of Sustainability on Project Evaluation, First Edition. Edited by Herbert Robinson, Barry Symonds, Barry Gilbertson and Benedict Ilozor. © 2015 John Wiley & Sons, Ltd. Published 2015 by John Wiley & Sons, Ltd.
Chapter 1Chapter 27
27.1 Introduction
The climate change debate has generated considerable interest in the sustainable development agenda throughout the world. The UK, like most other nations, is becoming increasingly aware of the significance and value of having a sustainable environment policy (Khalfan, 2006). In the built environment, the challenges are massive, given the size of the construction industry which accounts for 8% of the UK’s gross domestic product; consumes an enormous amount of resources with a major impact on the manufacturing industry that creates products for construction projects and society at large. The built environment’s contribution to the economic well-being of a country, the social well-being of people, and the impact on the environment is hugely significant (Cowling et al., 2007; BERR, 2008). Theron (2010) estimated that the built environment in its widest sense is responsible for 40% of CO2 emission, as well as 40% of all energy used. The Kyoto Protocol, EU Emission Scheme, recent changes in building regulations, and Climate Change legislation are a growing recognition of the need to minimise the consequences of human activities on the environment. These initiatives have created the need for a major reform in the UK construction industry with significant implications for the educational systems.
The green agenda and construction education are intricately linked (see e.g. Walton and Galea, 2005; Cotgrave and Alkhaddar, 2006; Hayles and Holdsworth, 2008; Theron, 2010; Ekundayo et al., 2011). The rationale, therefore, for embed-ding green issues within the construction curriculum is a powerful imperative for change. This is mainly as a result of policy drivers and in some cases existing research but the response from the academic community is less clear. However, it is increas-ingly recognised that the curriculum should incorporate sustainability, in order to produce graduates that will confidently take care of the environment and not dam-age it for future users. Hayles and Holdsworth (2008) argued that the twenty-first
Mapping Sustainability in the Quantity Surveying Curriculum: Educating Tomorrow’s Design EconomistsChika Udeaja, Damilola Ekundayo, Lei Zhou, John Pearson and Srinath Perera
161
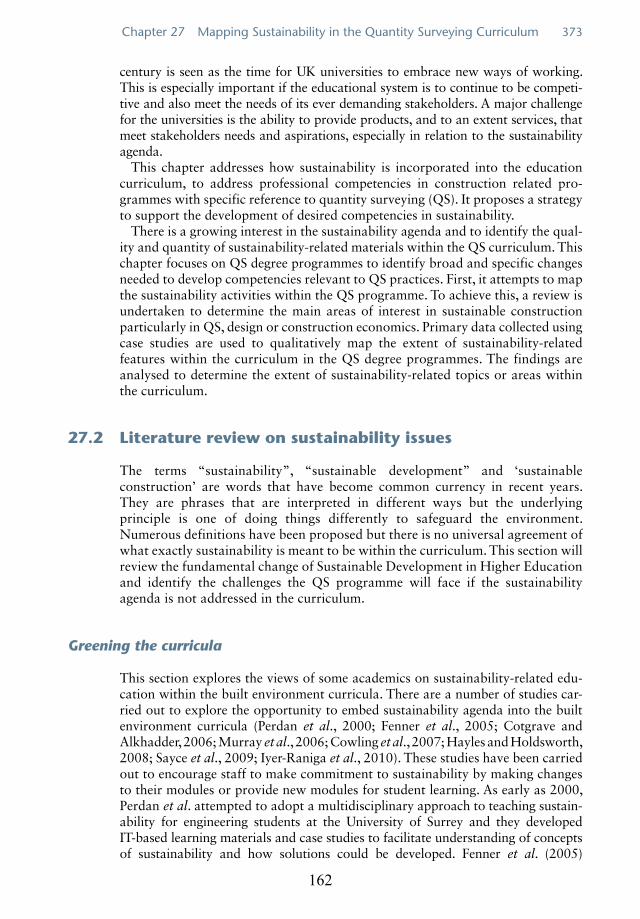
Chapter 27 Mapping Sustainability in the Quantity Surveying Curriculum 373
century is seen as the time for UK universities to embrace new ways of working. This is especially important if the educational system is to continue to be competi-tive and also meet the needs of its ever demanding stakeholders. A major challenge for the universities is the ability to provide products, and to an extent services, that meet stakeholders needs and aspirations, especially in relation to the sustainability agenda.
This chapter addresses how sustainability is incorporated into the education curriculum, to address professional competencies in construction related pro-grammes with specific reference to quantity surveying (QS). It proposes a strategy to support the development of desired competencies in sustainability.
There is a growing interest in the sustainability agenda and to identify the qual-ity and quantity of sustainability-related materials within the QS curriculum. This chapter focuses on QS degree programmes to identify broad and specific changes needed to develop competencies relevant to QS practices. First, it attempts to map the sustainability activities within the QS programme. To achieve this, a review is undertaken to determine the main areas of interest in sustainable construction particularly in QS, design or construction economics. Primary data collected using case studies are used to qualitatively map the extent of sustainability-related features within the curriculum in the QS degree programmes. The findings are analysed to determine the extent of sustainability-related topics or areas within the curriculum.
27.2 Literature review on sustainability issues
The terms “sustainability”, “sustainable development” and ‘sustainable construction’ are words that have become common currency in recent years. They are phrases that are interpreted in different ways but the underlying principle is one of doing things differently to safeguard the environment. Numerous definitions have been proposed but there is no universal agreement of what exactly sustainability is meant to be within the curriculum. This section will review the fundamental change of Sustainable Development in Higher Education and identify the challenges the QS programme will face if the sustainability agenda is not addressed in the curriculum.
Greening the curricula
This section explores the views of some academics on sustainability-related edu-cation within the built environment curricula. There are a number of studies car-ried out to explore the opportunity to embed sustainability agenda into the built environment curricula (Perdan et al., 2000; Fenner et al., 2005; Cotgrave and Alkhadder, 2006; Murray et al., 2006; Cowling et al., 2007; Hayles and Holdsworth, 2008; Sayce et al., 2009; Iyer-Raniga et al., 2010). These studies have been carried out to encourage staff to make commitment to sustainability by making changes to their modules or provide new modules for student learning. As early as 2000, Perdan et al. attempted to adopt a multidisciplinary approach to teaching sustain-ability for engineering students at the University of Surrey and they developed IT-based learning materials and case studies to facilitate understanding of concepts of sustainability and how solutions could be developed. Fenner et al. (2005)
162

374 Industry Perspective, Case Studies and Implications for Curriculum Development
reviewed the education for sustainable development in the Department of Engineering at the University of Cambridge and encouraged students’ self-reflective learning processes to obtain solutions for the challenges of sustainable development.
Cotgrave and Alkhaddar (2006) reviewed the undergraduates’ construction management curricula at Liverpool John Moores University and established that sustainable design and technology was superficial during the final year. Murray et al. (2006) implemented a full curriculum review to identify the gap in provision of sustainable construction education at Plymouth University. The study found that although discipline-specific environmental aspects were included in the cur-riculum, few generic aspects of sustainability such as citizenship or poverty were also covered.
Cowling et al. (2007) argued that education for sustainable development has become increasingly significant within the built environment curriculum at Kingston University. They explored students’ familiarity, understanding and interest in sustainable development and how these developed over their time at the university. The university’s emphasis on sustainable development pro-vided an opportunity to contribute greatly to the students’ awareness of the subject given that they are enrolled on courses with interest but often with a low knowledge base. Hayles and Holdsworth (2008) conducted an action research project at RMIT University, Australia to embed sustainability agenda into the core curriculum of the undergraduate programme at the School of Property, Construction and Project Management. The results showed how sustainability issues were embedded into three new modules. Iyer-Raniga et al. (2010) conducted research on construction management students at RMIT to compare sustainability activities between Melbourne and Singapore. The findings showed that there are no significant differences in the perceptions, knowledge and understanding of sustainability issues between the two sets of students.
While the list of previous research in the area of sustainability education is not exhaustive, it does indicate the wide range of challenges faced in incorporating sustainability-related education within the QS programme.
Challenges facing the QS professional
Previous research provided some understanding of the meaning and signifi-cance of QS (Lee and Hogg, 2009; Perera et al., 2010; Simpson, 2010). The role of the quantity surveyor as suggested by the Royal Institution of Chartered Surveyors (RICS, 1971) cited in Nkado and Meyer (2001) is associated with measurement and valuation. They argued that quantity surveyors provide cost management services for construction projects in the context of forecasting, analysing, planning, controlling and accounting. Others suggested that compe-tent quantity surveyors must have a range of skills and knowledge which can be applied in a range of projects and organisations. What is clear is that the roles of quantity surveyors have become extremely diversified, to match the changing needs of employers (Ashworth and Hogg, 2007). In the UK, a number of construction companies have rebranded themselves to respond to the needs of the sustainability agenda.
163
Chapter 27 Mapping Sustainability in the Quantity Surveying Curriculum 375
Achieving progress towards sustainability is critical to the future well-being of society which has long being recognised by the Higher Education Funding Council for England (HEFCE, 2010). They have placed sustainability as a major objective both organisationally and within their sphere of influence and activity. It is sug-gested that universities have a major role to play in tackling the sustainability agenda (Jones et al., 2008). The universities and colleges are in a unique position to lead the way and change the awareness of sustainability agenda (HEFCE, 2010). It is therefore expected that universities will be at the forefront of embed-ding sustainability both within their own institutional values and the curricula that they deliver.
Dixon (2009) argued that there has been progress made in recent years in linking sustainability into professional practice globally but suggested that the key barriers are lack of knowledge and expertise from graduates and experi-enced professionals. At the EcoBuild conference in 2010, Paul Morrell, the then government adviser on construction, stated that the government’s greatest con-cern is how to satisfy the carbon and green agenda. He went on to state that the construction industry does not have the capacity to meet the sustainability agenda because the universities are not producing graduates with adequate knowledge.
It is therefore crucial for the construction sector to make significant contribu-tions to sustainable development. Architects and engineers are providing leader-ship in sustainable construction in the world. However, there is lack of evidence showing that QS professionals are demonstrating sustainability leadership in the business environment. It is therefore of paramount importance to identify what types of new skills are required by quantity surveyors to tackle the sustainability agenda. The RICS (2007) review identified competencies and new skills required for QS to provide sustainability services through the life span of a building pro-ject. The areas identified are: value for money, whole life costing, cost of alterna-tive materials, renewable energy schemes, recycled content schemes, the ethical sourcing of materials and labour. Other key elements also discussed in the litera-ture include: sustainable procurement and sustainability performance measure-ment. Furthermore, the RICS also identified specific responsibilities for QS in sustainable development:
◼ Protecting and enhancing the natural environment ◼ Encouraging the sustainable use of resources ◼ Reducing waste generation and responsible disposal of waste ◼ Reducing energy consumption ◼ Promoting community development and social inclusion ◼ Minimising any negative social or environmental impacts of development ◼ Promoting sustainable land use and transportation planning and management ◼ Promoting sustainable design, development and construction practices, includ-
ing whole-life costing.
However there is a huge knowledge gap for those studying QS in higher education. Embedding sustainability within the QS curriculum will require an exploration of its three spheres: economic, environmental, and social dimensions. In addition, knowledge of regulatory and technological issues is important as cross-cutting themes. Dale and Newman (2005) argued that the key to achieving these skills is adaptability, and the ability to change, particularly in
164
376 Industry Perspective, Case Studies and Implications for Curriculum Development
an evolving economic climate with threats of climate change. Clearly universi-ties operating in the built environment have a vital role in shaping the future pattern of practice and policy in relation to the sustainability agenda. So, it is essential to map the curriculum to capture the sustainability content. This will enable staff to educate and, inspire and influence the new generation of quan-tity surveyors or design economists to be tomorrow’s leaders in sustainable development.
27.3 Development of the Sustainability Framework
In developing an appropriate strategy that will embed sustainability education within the built environment curriculum, a case study approach was adopted using three methods of data collection: use of published sources to identify the key components of sustainability education; structured interviews with academic staff involved in the decision making to establish the key categories of sustainability relevant to built environment professionals; and document analysis to determine the extent of sustainability topics in the curriculum based on the module descrip-tors. The coverage of sustainability in the current QS curriculum was identified and ideas on how to improve sustainability education in the QS degree pro-gramme were suggested.
The case studies include four RICS accredited QS degree programmes. The cur-ricular of the programmes (module specifications) were mapped at detailed level using amount of time spent, that is module credits (as a depth measurement). The ensuing mapping was then verified for accuracy and consistency with programme directors responsible for delivery of these programmes. The four case studies selected were leading QS honours degree programmes in the UK all accredited by the RICS. There are a total of 360 Credits equivalent to 3,600 hours of learning in a degree programme. The depth measure reflects the amount of time spent on achieving a competency. In degree programmes, time spent on achieving module outcome is stipulated as Credits. Where 10 hours spent is considered as 1 Credit, a typical 20 Credits point module reflects 200 hours of learning by the student. This constitutes direct contact with formal teaching; lectures, seminars, tutorials as well as students’ expected study time on the module content (time spent on their own). The depth measure is only indicated at competency level and not at topic level as it is impractical to stipulate expected number of study hours spent at a detailed topic level. A percentage score is used to indicate the proportion of time spent on each competency to provide a valuable measure to understand the relative time spent for each competency. The depth vector scale mappings of the four case studies were initially carried out using the respective module specifi-cations of programmes. The results were sent out to the programme leaders of the degree programmes for necessary adjustments and validation. Descriptive statis-tics such as mean and percentage scores were used to analyse the results of the case studies as a conceptual benchmark.
The literature findings, document analysis and the interviews led to the develop-ment of the final sustainability framework which identifies the knowledge areas relevant to the QS degree programme and the profession. The framework has been developed in the light of the current and future roles of the professional quantity surveyor as informed by the sustainability agenda. According to the findings from the research, QS graduates will need to have awareness and knowledge of the issues
165
Chapter 27 Mapping Sustainability in the Quantity Surveying Curriculum 377
identified in the framework (though to differing levels of detail) to be capable of delivering their professional responsibilities in the built and natural environments now and in the future. The refined framework (Table 27.1) categorises the sustain-ability-related knowledge areas relevant to QS education into six main categories (high level categories) with several sub-categories (low level categories).
Category A – background knowledge and concept
The low level categories identified in the framework under high level category A are relevant to QS education and should be taught but it is questionable whether they are being taught under the current education system. There is a need to understand the principles of sustainable development, to have a back-ground understanding of climate change and global warming issues which most students are already aware of. It is suggested that the latter should not take more than half a lecture and should not be taught in too much detail. Students need to be taught the history that led to sustainable development, and how it linked to climate change and global warming issues. The sustainable construction concept should have greater emphasis in QS education. Students need to know the link that exists between all the identified sub-categories and the roles of QS, why they are learning these and their application in the indus-try. It is agreed that the identified sub-categories are exhaustive and the advi-sory role of QS in sustainable development should be taught in more detail and greater depth under background knowledge and concept. All the sub-categories should always be linked to QS roles.
Category B – policies and regulations
The only module that will address the sub-categories identified is the Sustainable Development module taught at Level 4 or possibly any of the Technology mod-ules which will not be addressed to a satisfactory depth. Building regulations and Code for Sustainable Homes are not covered although Energy Performance Certificate (EPC) might be covered in the Building Services optional module taught at Level 5. Category B is vital and should be covered in the QS education especially the Building regulations and Code for Sustainable Homes which are central to the degree programme. QS students have to be able to advise the client accordingly. Students should also be familiar with the sustainable construction strategy and sustainable procurement action plan. However, the students are never examined on these topics and there have been possibly no exam questions in the past. Testing their knowledge on how they can advise clients in these areas is therefore important. Even though there is a piece of course work on the Sustainable Development module taught at Level 4, it is not QS specific.
Category C – environmental issues
Most of the sub-categories identified under this main category are not covered and at best it tends to receive a superficial treatment. Part-time students are sometimes aware of these issues based on their experience at work. Moreover,
166

Tab
le 2
7.1
Sust
aina
bilit
y fr
amew
ork
rele
vant
to
QS
degr
ee p
rogr
amm
e.
SUST
AIN
AB
ILIT
Y F
RA
MEW
OR
KHIGH LEVEL CATEGORIES
CA
TEG
OR
Y A
–
BA
CK
GR
OU
ND
K
NO
WLE
DG
E A
ND
CO
NC
EPT
CA
TEG
OR
Y B
–
PO
LIC
IES
AN
D
REG
ULA
TIO
NS
CA
TEG
OR
Y C
–
ENV
IRO
NM
ENTA
L
ISSU
ES
CA
TEG
OR
Y
D –
SO
CIA
L IS
SUES
CA
TEG
OR
Y
E –
ECO
NO
MIC
IS
SUES
CA
TEG
OR
Y
F –
TEC
HN
OLO
GY
A
ND
IN
NO
VA
TIO
N
LOW LEVEL CATEGORIES
Sust
aina
ble
deve
lop
men
t ov
ervi
ew a
nd
prin
cip
les
Clim
ate
chan
ge
and
glob
al
war
min
g is
sues
Imp
act
of t
he
cons
truc
tion
indu
stry
on
the
envi
ronm
ent
Sust
aina
ble
cons
truc
tion
conc
ept
Role
of Q
S in
su
stai
nabl
e de
velo
pm
ent
Cha
nges
to
Build
ing
regu
latio
n, e
.g. P
art
L (e
nerg
y ef
ficie
ncy)
an
d Pa
rt F
(m
eans
of
vent
ilatio
n)
Cod
e fo
r Su
stai
nabl
e H
omes
Ener
gy P
erfo
rman
ce
Cer
tific
ate
(EPC
)
The
Kyot
o p
roto
col
Rele
vant
EU
Dire
ctiv
es
such
as
the
EU c
limat
e p
olic
y, E
U E
TS, e
tc.
Clim
ate
Cha
nge
Act
Sust
aina
ble
Con
stru
ctio
n St
rate
gy
Sust
aina
ble
Proc
urem
ent
Act
ion
Plan
Prot
ectin
g an
d en
hanc
ing
the
built
and
nat
ural
env
ironm
ents
Envi
ronm
enta
l Im
pac
t A
sses
smen
ts (
EIA
) En
viro
nmen
tal M
anag
emen
t Sy
stem
s: IS
O 1
4001
Envi
ronm
enta
l Ass
essm
ent
Met
hods
: BRE
EAM
, LEE
D,
Gre
en S
tar
Redu
cing
ene
rgy
cons
umpt
ion,
th
at is
, em
itted
and
em
bodi
ed
Redu
cing
gre
enho
use
emis
sion
su
ch a
s m
etha
ne, c
arbo
n,
nitr
ous
oxid
e an
d re
frig
eran
t ga
ses
Car
bon
Age
nda
(Car
bon
foot
prin
ting,
Zer
o C
arbo
n,
Retr
ofit)
Was
te r
educ
tion
prin
cip
les
(rec
yclin
g, r
educ
tion,
reu
se,
effe
ctiv
e de
sign
)
Brow
nfie
ld d
evel
opm
ent
Nat
ural
res
ourc
es, r
enew
able
an
d no
n-re
new
able
mat
eria
ls
Wat
er u
sage
and
Sus
tain
able
Tr
ansp
orta
tion
Plan
Cor
por
ate
Soci
al
Resp
onsi
bilit
y (C
SR)
Ethi
cal i
ssue
s su
ch a
s et
hica
l sou
rcin
g of
m
ater
ials
and
labo
ur,
for i
nsta
nce
Equi
ty a
nd s
ocia
l ju
stic
e
Com
mun
ity
deve
lop
men
t an
d so
cial
incl
usio
n
Hea
lth a
nd s
afet
y
Emp
loym
ent,
tr
aini
ng a
nd
educ
atio
n
Soci
al a
sses
smen
t m
etho
ds (e
.g.
Des
ign
Qua
lity
Indi
cato
rs,
KPIs
and
be
nchm
arki
ng, e
tc.)
Cos
t Be
nefit
A
naly
sis
(i.e.
imp
act
of h
uman
fact
ors
on
the
com
mun
ity)
Cos
t p
lann
ing
and
man
agem
ent
Valu
e m
anag
emen
t or
en
gine
erin
g (c
ost
of
alte
rnat
ive
mat
eria
ls a
nd
desi
gns)
Sust
aina
ble
pro
cure
men
t st
rate
gies
Feas
ibili
ty
stud
ies
Who
le-li
fe
app
rais
al/L
ife
cycl
e co
stin
g
Fina
ncia
l in
cent
ives
(su
ch
as s
ubsi
dies
, cl
imat
e ch
ange
le
vel,
aggr
egat
e ta
x, c
arbo
n cr
edit,
Bro
wnf
ield
la
nd t
ax, e
tc.)
Rene
wab
le e
nerg
y te
chno
logi
es (
Phot
ovol
taic
, W
ind
Turb
ine,
Geo
ther
mal
, Bi
omas
s, e
tc.)
Gre
en B
uild
ing
Mat
eria
ls
Rain
wat
er h
arve
stin
g an
d G
rey
wat
er c
olle
ctio
n sy
stem
s
Prof
essi
onal
and
m
anag
emen
t
soft
war
e p
acka
ges
su
ch a
s BI
M, e
tc.
Mod
ern
met
hods
of
cons
truc
tion:
offs
ite
pro
duct
ion,
use
of p
reca
st
mat
eria
l, le
an c
onst
ruct
ion,
et
c.
Pass
ive
desi
gn m
etho
ds
such
as
day
light
ing,
in
telli
gent
faca
des,
car
bon
stor
age
and
offs
ettin
g, e
tc.
Sup
ply
cha
in m
anag
emen
t
Effe
ctiv
e in
form
atio
n co
ntro
l and
man
agem
ent
(usi
ng e
-bus
ines
s)
378 167
Chapter 27 Mapping Sustainability in the Quantity Surveying Curriculum 379
how much a quantity surveyor has to know about this category is questionable. Having general knowledge and awareness of the issues in this category may be enough. For example, Environmental Management Systems and Environmental Impact Assessment are relevant to a contractor, architects, other designers and clients who tend to be more aware of these issues. QS students need awareness of some of these issues in the Technology lectures but the traditional role of QS which involves the economic aspects still needs to be brought to focus. A minimum amount of understanding is required for this category so that a quantity surveyor could be effectively involved from project inception to completion.
Category D – social issues
Public sector clients are more likely to be interested in Category D, as private sec-tor clients are generally more interested in cost. A participant in the study argued that “Everyone knows the importance of local sourcing of labour and materials to support the local economy for instance, this is very obvious, but I am not inter-ested in the level at which we teach this to QS students”. Cost Benefit Analysis and other Social Assessment Methods are important and would be of interest to QS. It was further argued that the environmental issues, polices and regulations are more important aspects than social issues. Even though there is a sympathetic view on the impact of social aspects sustainability, the other areas are considered more relevant to QS education due to the time factor. Private sectors will need to be educated when it comes to social issues as they are more interested in cost, not the social impact of their development.
Category E – economic issues
These are far more relevant and very important to QS education; cost planning and management, value engineering, feasibility studies, life cycle costing and financial incentives. Quantity surveyors should be fully aware of the financial incentives avail-able so they can encourage their clients to use different sustainable technologies. Good examples include households that received some financial incentives as a result of using ground source heating. New graduates having this sort of up to date knowledge to take into the industry will be very beneficial for the companies they work for and their clients. The sub-category list for the Economic issues includes all relevant topics that should be taught under economic aspects of sustainability.
Category F – technology and innovation
All the sub-categories identified here are relevant and should be taught in line with Category E using the analogy of Measurement and Technology module where the students are taught the relevant construction techniques and later taught how to measure them. The different technologies that could achieve sus-tainable development should be taught to QS students in parallel with how to measure and cost them. This way the quantity surveyor will be able to advise clients on the life-cycle cost implications of sustainable design technologies, which is the ultimate goal.
168

380 Industry Perspective, Case Studies and Implications for Curriculum Development
27.4 Mapping of Sustainability Education in QS Degree Programmes
A method of mapping sustainability education to curricular was developed as there is no standard method to compare the level of attainment of sustainability. A scoring approach was devised to systematically analyse the extent of mapping of sustainability education to individual modules of four RICS accredited QS degree programmes (Case studies A, B, C and D). These results are presented in the following section.
Level of Sustainability Education in QS degree programmes
The analysis undertaken was to establish the extent of sustainability education in the different QS degree programmes. The analysis of the four case studies revealed that there are considerable variations in the degree programmes on how sustainability education is taught and delivered (Figure 27.1). Figure 27.1 shows a massive difference between the highest (Case study C) and the lowest (Case study B) coverage. The reason for this significant variation is attributed to the fact that Case studies C and D are considered as research intensive universities. Incorporating sustainability in their curricula was much easier and less demand-ing because the majority of the staff are active in research. Individual module contents also varied in greater detail than the generic comparison presented here.
Framework mapping in QS degree programmes
This research also considered how the formulated framework was mapped within the degree programmes (i.e. Case studies A, B, C and D). These also revealed massive variations in the various categories (Figure 27.2). Figure 27.2 shows that Category F (i.e. Technology and Innovation) received the most
9.5
10.0
10.5
11.0
11.5
12.0
12.5
13.0
13.5
AVarious degree programmes (case studies)
B C D
Cov
erag
e of
sus
tain
abili
ty in
deg
ree
prog
ram
me
(%)
Figure 27.1 Coverage of sustainability in QS degree programmes.
169

Chapter 27 Mapping Sustainability in the Quantity Surveying Curriculum 381
attention and understanding by the staff and the programmes. This can be attributed to the argument that there is some synergy between sustainability and technology/innovation in the construction field. Figure 27.2 also reveals that Category A (i.e. Background Knowledge and Concept) was also high on the agenda of most universities. However, it seems limited in Case study B which is a less research intensive university, and staff do not feel confident to teach contemporary issues because of lack of up-to-date knowledge and skill. This is one of the factors that hamper and prevent adequate coverage of sus-tainability education in the curriculum.
Mapping of sustainability education at various Stages (i.e. Levels 4, 5, 6)
It was considered imperative to consider at various stages of students’ development how the QS degree programmes mapped the sustainability agenda.
The next section presents a summary of the sustainability education, QS degree programme and sustainability framework, extent of coverage and ideas on pro-moting sustainability education in QS degree programme based on the literature review findings and content analysis of the interviews conducted.
Summary of key findings
◼ There is no prescribed threshold benchmark standard for achieving a decent level of sustainability education at undergraduate level.
◼ There is a clear lack of understanding or common agreement of what sustain-ability construction is or should be and this is hampering a structured agenda with the QS programmes.
0.0%0.5%1.0%1.5%2.0%2.5%3.0%3.5%4.0%4.5%5.0%
Backgroundknowledge and
concept
Policies andregulations
Environmental issues
Social issues
Economic issues
Technology andinnovation
A
B
C
D
Figure 27.2 Sustainability framework mapping in the four case studies.
170
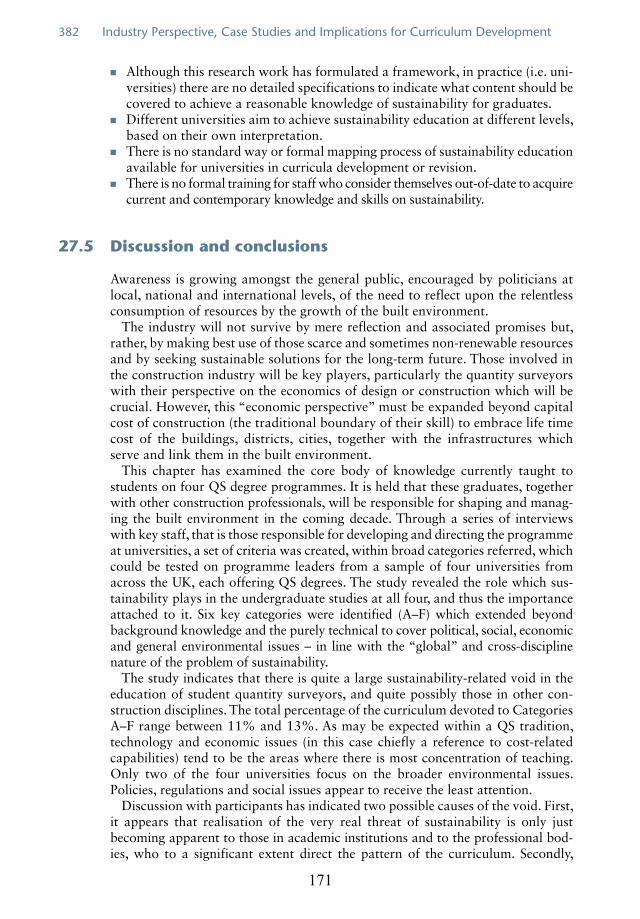
382 Industry Perspective, Case Studies and Implications for Curriculum Development
◼ Although this research work has formulated a framework, in practice (i.e. uni-versities) there are no detailed specifications to indicate what content should be covered to achieve a reasonable knowledge of sustainability for graduates.
◼ Different universities aim to achieve sustainability education at different levels, based on their own interpretation.
◼ There is no standard way or formal mapping process of sustainability education available for universities in curricula development or revision.
◼ There is no formal training for staff who consider themselves out-of-date to acquire current and contemporary knowledge and skills on sustainability.
27.5 Discussion and conclusions
Awareness is growing amongst the general public, encouraged by politicians at local, national and international levels, of the need to reflect upon the relentless consumption of resources by the growth of the built environment.
The industry will not survive by mere reflection and associated promises but, rather, by making best use of those scarce and sometimes non-renewable resources and by seeking sustainable solutions for the long-term future. Those involved in the construction industry will be key players, particularly the quantity surveyors with their perspective on the economics of design or construction which will be crucial. However, this “economic perspective” must be expanded beyond capital cost of construction (the traditional boundary of their skill) to embrace life time cost of the buildings, districts, cities, together with the infrastructures which serve and link them in the built environment.
This chapter has examined the core body of knowledge currently taught to students on four QS degree programmes. It is held that these graduates, together with other construction professionals, will be responsible for shaping and manag-ing the built environment in the coming decade. Through a series of interviews with key staff, that is those responsible for developing and directing the programme at universities, a set of criteria was created, within broad categories referred, which could be tested on programme leaders from a sample of four universities from across the UK, each offering QS degrees. The study revealed the role which sus-tainability plays in the undergraduate studies at all four, and thus the importance attached to it. Six key categories were identified (A–F) which extended beyond background knowledge and the purely technical to cover political, social, economic and general environmental issues – in line with the “global” and cross-discipline nature of the problem of sustainability.
The study indicates that there is quite a large sustainability-related void in the education of student quantity surveyors, and quite possibly those in other con-struction disciplines. The total percentage of the curriculum devoted to Categories A–F range between 11% and 13%. As may be expected within a QS tradition, technology and economic issues (in this case chiefly a reference to cost-related capabilities) tend to be the areas where there is most concentration of teaching. Only two of the four universities focus on the broader environmental issues. Policies, regulations and social issues appear to receive the least attention.
Discussion with participants has indicated two possible causes of the void. First, it appears that realisation of the very real threat of sustainability is only just becoming apparent to those in academic institutions and to the professional bod-ies, who to a significant extent direct the pattern of the curriculum. Secondly,
171

Chapter 27 Mapping Sustainability in the Quantity Surveying Curriculum 383
a limited number of academics have enough detailed knowledge of sustainability-related issues to incorporate into the subject confidently within the materials they deliver. They themselves were educated when the sustainability debate was not a top priority in the academic agenda. To some extent, education on matters of sustainability needs to be extended up the chain, to those academic programme leaders planning the curriculum, staff doing the teaching as well as down to the students who will be the future leaders.
One practical reason cited for the apparent failure to recognise and address the significance of the sustainability issue, often given in apology and sometimes as an excuse, is the lack of spare time or space within the existing curriculum. “So much to teach, so little time within which to teach it” is the cry. Indeed, this is already apparent from the varying emphasis placed upon the categories referred to above, the most time being afforded to the technical. However, awareness of the sustain-ability agenda and its importance is vital for the survival of the QS profession. Social and environmental issues drive the broader agenda. Therefore, whilst it is not suggested that academics should talk of nothing else, the research implica-tions suggest that they might plant an awareness of its relevance to most things, emphasising to a greater or lesser extent its importance across the whole of the existing curriculum. To certain subjects such as Law and Management it may indeed seem and be somewhat peripheral but to Construction Technology and Construction Economics, for example, it must surely be of fundamental importance.
The examination of the existing curriculum and of curriculum leaders’ percep-tions of its content and delivery at one institution suggests some uncertainty as to exactly where, and how, sustainability-related issues should be delivered. It is hoped that eventually it will be possible to produce a template, illustrating the relevance of sustainability to each key subject area, and ways even by which it may be effectively incorporated. A number of specific suggestions were made both as to the general direction teaching might take, and on specific areas worthy of increased emphasis within the syllabus. There is a general consensus and agreement of the appreciation of the sustainability agenda which should be a thread visible through all teaching at all levels. It was suggested that where a multidisciplinary School set-up existed, every opportunity should be taken for students of differing disciplines to work through the sustainability issues together, as they will have to in their professional careers. There was also an agreement that, where possible, classroom work should take as its model, data from local schemes which exempli-fied good practice in sustainability. Also, current research has much to offer and it is agreed that the technological and cost implications were crucial, together with the ability to transmit these concepts effectively to clients.
Participants agreed that: ‘[whilst] quantity surveyors are not there to advise on designs for sustainable development, which is the designers’ job really [they] should be trained as design economists to understand the technologies involved and their implications more in terms of costs’.
The current research supports the findings of RICS research by Perera and Pearson (2011), where sustainability was ranked low in terms of the content of the curriculum at present, although the same research shows that a growing body of professionals in practice do recognise the part it must play in their future workload. Surely academic institutions must do better to equip the quantity sur-veyors or tomorrow's design economists for what will undoubtedly be a pivotal role, in terms of the management of time, cost and quality in deciding the future costs to society of sustaining the built environment.
172
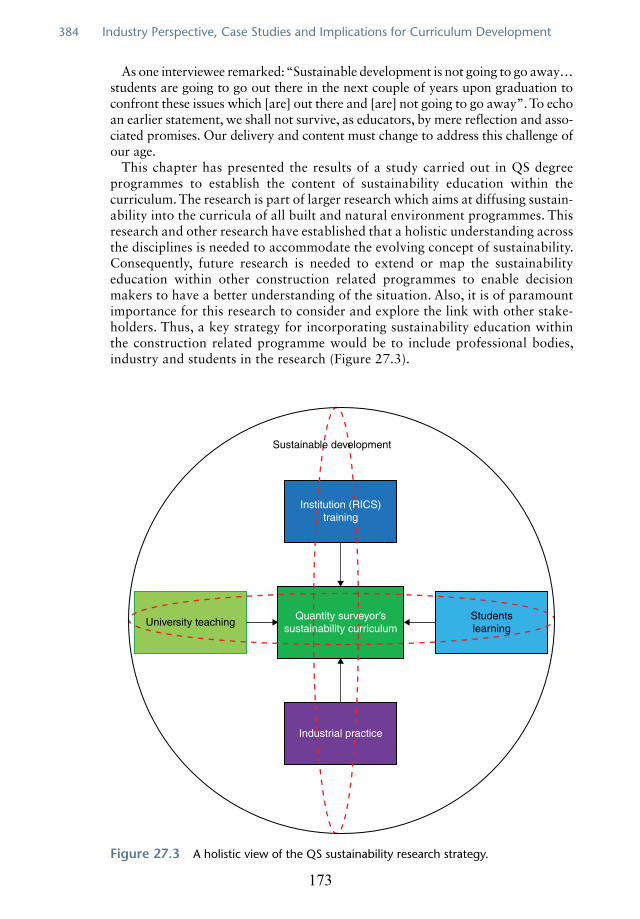
384 Industry Perspective, Case Studies and Implications for Curriculum Development
As one interviewee remarked: “Sustainable development is not going to go away… students are going to go out there in the next couple of years upon graduation to confront these issues which [are] out there and [are] not going to go away”. To echo an earlier statement, we shall not survive, as educators, by mere reflection and asso-ciated promises. Our delivery and content must change to address this challenge of our age.
This chapter has presented the results of a study carried out in QS degree programmes to establish the content of sustainability education within the curriculum. The research is part of larger research which aims at diffusing sustain-ability into the curricula of all built and natural environment programmes. This research and other research have established that a holistic understanding across the disciplines is needed to accommodate the evolving concept of sustainability. Consequently, future research is needed to extend or map the sustainability education within other construction related programmes to enable decision makers to have a better understanding of the situation. Also, it is of paramount importance for this research to consider and explore the link with other stake-holders. Thus, a key strategy for incorporating sustainability education within the construction related programme would be to include professional bodies, industry and students in the research (Figure 27.3).
Sustainable development
Institution (RICS)training
University teachingStudentslearning
Quantity surveyor’ssustainability curriculum
Industrial practice
Figure 27.3 A holistic view of the QS sustainability research strategy.
173

Chapter 27 Mapping Sustainability in the Quantity Surveying Curriculum 385
Figure 27.3 shows that for any meaningful strategy, the input from the various stakeholders is necessary to establish what is required and how the strategy will be implemented. Finally, it is anticipated that this strategy will lead to the development of a methodology that schools or universities generally can use to incorporate sus-tainability education within their curricula it is expected that there will be profound changes in the QS curriculum. This will ensure that the education and professional training of design economists is fit-for-purpose to continue to play a leading role in achieve sustainable design and cost effective solutions for the built environment.
References
Ashworth, A. and Hogg, K. (2007) Willis’s Practice and Procedure for the Quantity Surveyor, 12th edn, Blackwell Publishing Ltd, Oxford.
BERR (2008) Strategy for Sustainable Construction, Department for Business, Enterprise & Regulatory Reform, HM Government in association with Strategic Forum for Construction, pp. 1–64.
Cotgrave, A. and Alkhaddar, R. (2006) Greening the curricula within construction programmes. Journal for Education in the Built Environment, 1(1), 3–29.
Cowling, E., Lewis, A. and Sayce, S. (2007) Exploring the changing nature of students’ attitudes and awareness of the principles of sustainability. Built Environment Education Conference, CEBE, 12–13 September 2007, London.
Dale, A. and Newman, L. (2005) Sustainable development, education and literacy. International Journal of Sustainability in Higher Education, 6(4), 351–362.
Dixon, T. (2009) RICS Green Gauge 2008/09: RICS Members and the Sustainability Agenda. RICS research, summary report.
Ekundayo, D., Zhou, L., Udeaja, C., Pearson, J. and Perera, S. (2011), Mapping of sustain-ability education to construction related curricula: a case study of quantity surveying degree programme. Proceedings of RICS Construction & Property, COBRA, 12–13 September 2011, School of the Built Environment, University of Salford, UK.
Fenner, R.A., Ainger, C.M., Cruickshank, H.J. and Guthrie, P.M. (2005) Embedding Sustainable Development at Cambridge University Engineering Department. International Journal of Sustainability in Higher Education, 6(3), 229–241.
Hayles, C.S. and Holdsworth, S.E. (2008) Curriculum change for sustainability. Journal for Education in the Built Environment, 3(1), 25–48.
HEFCE (Higher Education Funding Council for England) (2010) Carbon Reduction Target and Strategies for Higher Education in England. Policy development statement, January 2010.
Iyer-Raniga, U., Arcari, P. and Wong, J. (2010) Education for sustainability in the built environment: what are students telling us?. Proceedings of 26th Annual ARCOM Conference, 6–8 September 2010, Leeds, UK, pp. 1–10.
Jones, P., Trier, C.J. and Richards, J.P. (2008) Embedding Education for Sustainability Development in higher education: A case study examining common challenges and opportunities for undergraduate programmes. International Journal of Education Research, 47, 341–350.
Khalfan, M.M. (2006) Managing sustainability within construction projects. Journal of Environmental Assessment Policy and Management, 8(1), 41–60.
Lee, C. and Hogg, K. (2009) Early career training of quantity surveying professionals. RICS COBRA, 10–11 September 2009, Cape Town, South Africa.
Murray, P., Goodhew, S. and Turpin-Brooks, S. (2006) Environmental Sustainability: Sustainable Construction Education: a UK case study. International Conference on Environmental, Cultural, Economic and Social Sustainability, 8–12 January 2006, Hanoi, Vietnam.
174

386 Industry Perspective, Case Studies and Implications for Curriculum Development
Nkado, R. and Meyer, T. (2001) Competencies of professional quantity surveyors: a South African perspective. Construction Management and Economics, 19(5), 481–491.
Perdan, S., Azapagic, A. and Clift, R. (2000) Teaching sustainable development to engineer-ing students. International Journal of Sustainability in Higher Education, 1(3), 267–279.
Perera, S. and Pearson, J. (2011) Alignment of Professional, Academic and Industrial Development Needs for Quantity Surveyors: Post Recession Dynamics. RICS Education Trust funded research report. http://www.northumbria-qs.org/RICS_Alignment/Reports/Alignment_of_views_final_report.pdf (accessed 29 June 2011).
Perera, S., Pearson, J. and Dodds, L. (2010) Alignment of professional, academic and indus-trial development needs for quantity surveyors. RICS COBRA, 2–3 September 2010, Dauphine University, Paris.
RICS (Royal Institution of Chartered Surveyors) (2007) Surveying Sustainability: a Short Guide for the Property Professional.’ Report, pp. 1–24.
Sayce, S., Clements, B. and Cowling, E. (2009) Are Employers seeking Sustainability Literate Graduates? C-SCAIPE, The Higher Education Academy. Final report, pp. 1–41.
Simpson, Y. (2010) Twenty first century challenges for the professional quantity surveyor. RICS COBRA, 2–3 September 2010, Dauphine University, Paris.
Theron, C. (2010) Surveying the sustainable and environmental legal and market chal-lenges for real estate. RICS COBRA, 2–3 September 2010, Dauphine University, Paris.
Walton, S.V. and Galea, C.E. (2005) Some considerations for applying business sustainabil-ity practices to campus environmental challenges. International Journal of Sustainability in Higher Education, 6(2), 147–160.
175
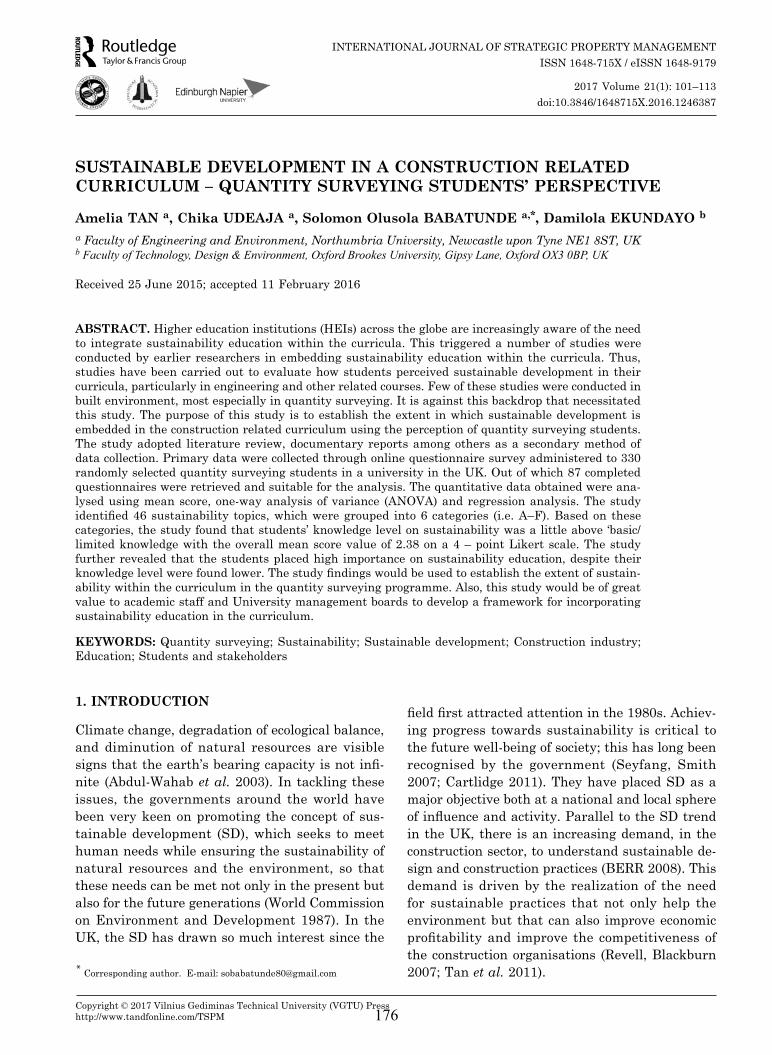
Copyright © 2017 Vilnius Gediminas Technical University (VGTU) Presshttp://www.tandfonline.com/TsPm
InternatIonal Journal of StrategIc ProPerty ManageMentISSn 1648-715X / eISSn 1648-9179
2017 Volume 21(1): 101–113doi:10.3846/1648715X.2016.1246387
SUSTAINABLE DEVELOPMENT IN A CONSTRUCTION RELATED CURRICULUM – QUANTITY SURVEYING STUDENTS’ PERSPECTIVE
Amelia TAN a, Chika UDEAJA a, Solomon Olusola BABATUNDE a,*, Damilola EKUNDAYO b
a Faculty of Engineering and Environment, Northumbria University, Newcastle upon Tyne NE1 8ST, UKb Faculty of Technology, Design & Environment, Oxford Brookes University, Gipsy Lane, Oxford OX3 0BP, UK
received 25 June 2015; accepted 11 february 2016
ABSTRACT. Higher education institutions (HeIs) across the globe are increasingly aware of the need to integrate sustainability education within the curricula. this triggered a number of studies were conducted by earlier researchers in embedding sustainability education within the curricula. thus, studies have been carried out to evaluate how students perceived sustainable development in their curricula, particularly in engineering and other related courses. few of these studies were conducted in built environment, most especially in quantity surveying. It is against this backdrop that necessitated this study. the purpose of this study is to establish the extent in which sustainable development is embedded in the construction related curriculum using the perception of quantity surveying students. the study adopted literature review, documentary reports among others as a secondary method of data collection. Primary data were collected through online questionnaire survey administered to 330 randomly selected quantity surveying students in a university in the uK. out of which 87 completed questionnaires were retrieved and suitable for the analysis. the quantitative data obtained were ana-lysed using mean score, one-way analysis of variance (anoVa) and regression analysis. the study identified 46 sustainability topics, which were grouped into 6 categories (i.e. A–F). Based on these categories, the study found that students’ knowledge level on sustainability was a little above ‘basic/limited knowledge with the overall mean score value of 2.38 on a 4 – point likert scale. the study further revealed that the students placed high importance on sustainability education, despite their knowledge level were found lower. The study findings would be used to establish the extent of sustain-ability within the curriculum in the quantity surveying programme. also, this study would be of great value to academic staff and university management boards to develop a framework for incorporating sustainability education in the curriculum.
KEYWORDS: Quantity surveying; Sustainability; Sustainable development; construction industry; education; Students and stakeholders
1. INTRODUCTION
climate change, degradation of ecological balance, and diminution of natural resources are visible signs that the earth’s bearing capacity is not infi-nite (abdul-Wahab et al. 2003). In tackling these issues, the governments around the world have been very keen on promoting the concept of sus-tainable development (SD), which seeks to meet human needs while ensuring the sustainability of natural resources and the environment, so that these needs can be met not only in the present but also for the future generations (World commission on environment and Development 1987). In the uK, the SD has drawn so much interest since the
field first attracted attention in the 1980s. Achiev-ing progress towards sustainability is critical to the future well-being of society; this has long been recognised by the government (Seyfang, Smith 2007; cartlidge 2011). they have placed SD as a major objective both at a national and local sphere of influence and activity. Parallel to the SD trend in the uK, there is an increasing demand, in the construction sector, to understand sustainable de-sign and construction practices (BERR 2008). This demand is driven by the realization of the need for sustainable practices that not only help the environment but that can also improve economic profitability and improve the competitiveness of the construction organisations (Revell, Blackburn 2007; tan et al. 2011).* corresponding author. e-mail: [email protected]
176
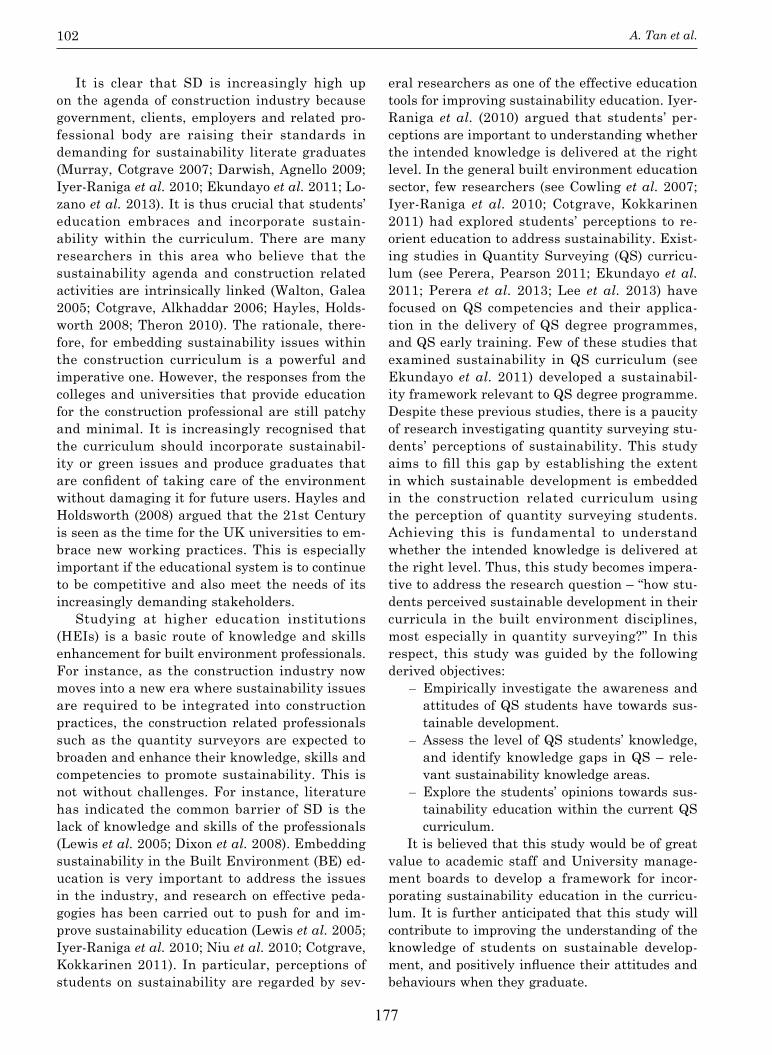
A. Tan et al.102
It is clear that SD is increasingly high up on the agenda of construction industry because government, clients, employers and related pro-fessional body are raising their standards in demanding for sustainability literate graduates (Murray, cotgrave 2007; Darwish, agnello 2009; Iyer-raniga et al. 2010; ekundayo et al. 2011; lo-zano et al. 2013). It is thus crucial that students’ education embraces and incorporate sustain-ability within the curriculum. there are many researchers in this area who believe that the sustainability agenda and construction related activities are intrinsically linked (Walton, galea 2005; cotgrave, alkhaddar 2006; Hayles, Holds-worth 2008; theron 2010). the rationale, there-fore, for embedding sustainability issues within the construction curriculum is a powerful and imperative one. However, the responses from the colleges and universities that provide education for the construction professional are still patchy and minimal. It is increasingly recognised that the curriculum should incorporate sustainabil-ity or green issues and produce graduates that are confident of taking care of the environment without damaging it for future users. Hayles and Holdsworth (2008) argued that the 21st century is seen as the time for the uK universities to em-brace new working practices. this is especially important if the educational system is to continue to be competitive and also meet the needs of its increasingly demanding stakeholders.
Studying at higher education institutions (HeIs) is a basic route of knowledge and skills enhancement for built environment professionals. for instance, as the construction industry now moves into a new era where sustainability issues are required to be integrated into construction practices, the construction related professionals such as the quantity surveyors are expected to broaden and enhance their knowledge, skills and competencies to promote sustainability. this is not without challenges. for instance, literature has indicated the common barrier of SD is the lack of knowledge and skills of the professionals (lewis et al. 2005; Dixon et al. 2008). embedding sustainability in the Built Environment (BE) ed-ucation is very important to address the issues in the industry, and research on effective peda-gogies has been carried out to push for and im-prove sustainability education (lewis et al. 2005; Iyer-raniga et al. 2010; niu et al. 2010; cotgrave, Kokkarinen 2011). In particular, perceptions of students on sustainability are regarded by sev-
eral researchers as one of the effective education tools for improving sustainability education. Iyer-raniga et al. (2010) argued that students’ per-ceptions are important to understanding whether the intended knowledge is delivered at the right level. In the general built environment education sector, few researchers (see cowling et al. 2007; Iyer-raniga et al. 2010; cotgrave, Kokkarinen 2011) had explored students’ perceptions to re-orient education to address sustainability. exist-ing studies in Quantity Surveying (QS) curricu-lum (see Perera, Pearson 2011; ekundayo et al. 2011; Perera et al. 2013; lee et al. 2013) have focused on QS competencies and their applica-tion in the delivery of QS degree programmes, and QS early training. few of these studies that examined sustainability in QS curriculum (see ekundayo et al. 2011) developed a sustainabil-ity framework relevant to QS degree programme. Despite these previous studies, there is a paucity of research investigating quantity surveying stu-dents’ perceptions of sustainability. this study aims to fill this gap by establishing the extent in which sustainable development is embedded in the construction related curriculum using the perception of quantity surveying students. achieving this is fundamental to understand whether the intended knowledge is delivered at the right level. thus, this study becomes impera-tive to address the research question – “how stu-dents perceived sustainable development in their curricula in the built environment disciplines, most especially in quantity surveying?” In this respect, this study was guided by the following derived objectives:
– empirically investigate the awareness and attitudes of QS students have towards sus-tainable development.
– assess the level of QS students’ knowledge, and identify knowledge gaps in QS – rele-vant sustainability knowledge areas.
– explore the students’ opinions towards sus-tainability education within the current QS curriculum.
It is believed that this study would be of great value to academic staff and university manage-ment boards to develop a framework for incor-porating sustainability education in the curricu-lum. It is further anticipated that this study will contribute to improving the understanding of the knowledge of students on sustainable develop-ment, and positively influence their attitudes and behaviours when they graduate.
177
Sustainable development in a construction related curriculum- quantity surveying students’ perspective 103
2. LITERATURE REVIEW
2.1. Sustainable development and the construction industry
Since the publication of the Brundtland Report (World commission on environment and Develop-ment 1987), sustainability has become an impor-tant topic in many industries both in the uK and globally. In the construction sector, the recognition of the importance of the construction industry for sustainability through agendas such as sustain-able development (SD), sustainable construction, sustainable building among others has gained widespread momentum. ganah et al. (2008) identi-fied that construction activities represent complex activities that place a significant strain on the wid-er environment and also one of the major factors that determine the sustainability of a community. ganah et al. (2008) further stated that buildings have a major environment impact over their entire lifecycle from construction to the demolition of the building structure. the relationship between the construction and SD is one which has been exten-sively explored and is well documented in research work (see Hill, Bowen 1997; Bourdeau 1999; Gil-ham 2001; Kibert 2007; edum-fotwe, Price 2009) among others. Kibert (2007) recognised the con-tribution of the construction sector to SD agenda could be immense. Boardman (2007) estimated that the construction in its widest sense is respon-sible for 40% of co2 emission, as well as 40% of all energy used. the industry faces ever-increasing problems in managing and dynamically respond-ing to changes in the environment (climate chang-es) and the needs of their clients, particularly in the building sector (Meikle 2008). Moreover, the SD principles are increasingly seen not just as an issue of SD but as a valuable argument to address the technical process that determines the likely performance of a building or construction project. this emerging role presents new and considerable challenges for construction or building projects during its whole life. to attain the goals of green construction requires that the industry intensi-fies its efforts in embedding sustainability issues within the construction field.
there has been several industry and uK gov-ernment attempts to encourage SD and, in par-ticular, sustainable construction. Such attempts include the development of various sustainabil-ity assessment techniques in buildings such as the code for sustainable homes (CfSH), Building research establishment environmental assess-ment Method (BREEAM), and the Green Guide.
udeaja et al. (2013) added that initiatives such as green supply chain management (gScM), green building, zero carbon homes, and carbon counting have been explored recently and they are all signs of growing recognition of the need for embedding SD in the construction field. Furthermore, the uK government have taken considerable meas-ures to promote sustainability in the construction industry by developing a range of environmental tax, levy, regulations, incentives, and formalised methods of managing carbon (Pellegrini-Masini et al. 2010; Monahan, Powell 2011). It is clear why the construction industry must respond accord-ingly and focus its attention on developing sus-tainable buildings which are economically viable, socially acceptable and environmentally friendly. In particular, there continues to be greater em-phasis on sustainable buildings with less impact on the environment (rIcS 2012). coupled with this is the increasing need for the judicious use of the irreplaceable, dwindling natural resources (Emmanuel, Baker 2012). Construction industry for a long time has worked tirelessly in achieving safe and SD in a cost effective, environmentally protective and socially responsible manner. the construction professionals of the future will need to be well equipped to account for all aspects of the construction given their broad roles from de-sign to deconstruction of the built environment. consequently, the construction industry must in-corporate principles of sustainability wholeheart-edly into each of its projects, so that its contribu-tion to SD will be influential and finally benefi-cial to both human and economic developments. this means that the construction industry needs professionals who through education systems are trained and mindful of the SD issues and have the knowledge and competency to participate and contribute to the industry that can sustain rather than degrade the environment, economy and soci-ety in the long run.
2.2. Importance of embedding sustainability in education
the importance of the construction sector in ad-dressing the issue of sustainable development (SD) is undeniable. The Brundtland report defines sus-tainable development (SD) as “development that meets the needs of the present without compromis-ing the ability of future generations to meet their own needs” (World commission on environment and Development 1987). also, SD seeks to address the balance between the environment, economy and
178
A. Tan et al.104
society without compromising the need for future generation (ganah et al. 2008). the three elements in the concept of SD – the environment, economy and society, are known as the “three pillars” of SD. thus, it is imperative that the built environment (BE) in general embed sustainability principles within the educational and training of the future graduates to ensure that they possess appropriate knowledge, skills and value sets (lewis et al. 2005; Murray, cotgrave 2007; Darwish, agnello 2009). further, Darwish and agnello (2009) emphasised the need to instil graduates with up-to-date knowl-edge and skills so that that they will be able to manage any uncertainties that may arise and also make a judgement on the available evidence in built environmental design and construction. cortese (2003) stated that the higher education institutions (HeI) have “profound moral responsi-bility to increase the awareness, knowledge, skills and values needed to create sustainable future”. HeIs are the most important primary sources of knowledge which are capable of enforcing and changing the attitudes, behaviours and practices of the professionals to embrace and promote SD. the argument for embedding sustainability in edu-cation is further reinforced by several initiatives around the world. for example, the earth Summit in 1992 gave high priority in its agenda 21 to the role of education in promoting sustainable devel-opment and improving the capacity of the people to address sustainable development issues (grubb et al. 1993). lozano et al. (2013) identified that the summit focused on the process of orienting and re-orienting education in order to foster val-ues and attitudes of respect for the environment. other initiative includes the 2002 Johannesburg Summit that has broadened the vision of SD and re-affirmed the educational objectives within the millennium development goals (MDg 2013). there is evidence that some progress in sustainability education has been made in the last decade, but much more remains to be done.
Despite the fact that progress has been made in incorporating sustainability education in cur-riculum, the extant literature have shown and re-vealed issues of irregular and inefficient engage-ment of the HeIs in delivering adequate competen-cies, knowledge, skills and attitudes required for achieving the goals of sustainability in the built environment (cotgrave, alkhaddar 2006; ganah et al. 2008; cotgrave, Kokkarinen 2010). the HeIs are facing challenges in embedding effective sus-tainability education into the curriculum. Hence, what is required is a suitable pedagogic strategy
for SD education. ekundayo et al. (2011) identified pedagogical strategy as an approach that collabo-rates with and gathers input from the industry, academia, students and professional bodies in or-der to reorient sustainability education.
2.3. Previous studies on students’ perceptions of SD
Students’ perceptions have long been recognised by the academia as one of the most important indicators of the effectiveness of education and a tool for overcoming shortcomings in education. their perceptions serve as an effective yardstick for judging the progress, as well as determining methods and identifying areas for improvement in teaching and learning. therefore, selected studies on students’ perceptions of SD by earlier research-ers are presented in table 1.
It is evident from table 1 that studies on stu-dents’ perceptions of SD available, but very few of these studies were conducted in the built environ-ment, especially from quantity surveying students’ perceptions of sustainability in their curriculum. assessing students’ perceptions of sustainability should be continuous to constantly evaluate and improve curricula in higher education institutions (HeIs). this would enable the educational system to be competitive and meet the needs of its ever demanding stakeholders. It is on this premise that this study becomes imperative with a view to investigating how extent quantity surveying stu-dents know about sustainable development and determine the possible implications for their cur-riculum. this would be of great value to academic staff and university management boards to have a better understanding of the students’ knowledge level on sustainability.
3. RESEARCH METHODOLOGY
this study adopted literature review, documentary reports, and questionnaire survey. a comprehen-sive literature review was conducted to identify sustainability topics. thus, few previous research has established the content of sustainability edu-cation within the curriculum and mapped sustain-ability education within QS degree programmes by evaluating academic and industry perception (ekundayo et al. 2011; Perera, Pearson 2011). this study, therefore, adopted the identified 46 sus-tainability topics in the sustainability education framework developed by ekundayo et al. (2011) in the uK. the rationale for adopting these 46 sustainability topics was that it has been used to
179

Sustainable development in a construction related curriculum- quantity surveying students’ perspective 105
table 1. Students perceptions to reorient education to address sustainability
author and year
focus Students discipline
Study area Methodology findings
Iyer-raniga et al. (2010)
Investigating & comparing the level of sustain-ability under-standing among graduating students
Property, construc-tion & Pro-ject Manage-ment
Singapore rMIt & Melbourne rMIt
Questionnaire survey
No significant differences in the per-ceptions, knowledge, and understand-ing of sustainability issue amongst Melbourne and Singapore students.the authors advocated for a new de-sign of higher education construction curricula that contains sustainability in a broader context.
cotgrave and alkhaddar (2006)
Developing cur-riculum that promoted sus-tainability
construction liverpool John Moores university, uK
literature review, Questionnaire sur-vey & Interviews
new curriculum was developed to ac-commodate sustainability.
cotgrave and Kokkarinen (2011)
testing stu-dents’ percep-tions and skills on sustain-ability after developing new curriculum
construction liverpool John Moores university, uK
Questionnaire survey
Significant changes of students’ to-wards sustainability.
cowling et al. (2007)
exploring sustainability perceptions of students over time
Kingston univer-sity School of Surveying (KuSS)
Kingston university, uK
Questionnaire survey
Students perceived environmental aspect of sustainability as the most important of sustainable development (SD).
azapagie et al. (2005)
exploring un-dergraduate students’ per-ceptions of SD
engineering 21 universities across the globe participated in the survey- 2 in australia, 1 in Brazil, 1 in france, 1 in ger-many, 1 in Italy, 1 in Sweden, 1 in thailand, 2 in the uSa, 2 in Vietnam, and 9 in the uK
Questionnaire survey
low understanding of SD. However, strong knowledge of environmental aspect but limited knowledge of social and economic aspects of SD.Identified that the students believed that SD is important for engineers but the students found it difficult in mak-ing a direct link between the theory of SD and engineering practice.the authors suggested new engineer-ing curriculum with a view to address-ing identified challenges among engi-neering students.
Hanning et al. (2012)
Students’ per-ceptions on SD
engineering chalmers uni-versity of tech-nology, Sweden
course document-ed text analysis, Questionnaire sur-vey, Interviews, and focus group discussion
It was found that industry demands a broader range of competencies in SD amongst engineers in general than what is currently provided.
nicolaou and conlon (2012)
final year stu-dents’ percep-tions about SD
engineering Dublin Institute of technology, Ireland
Questionnaire survey
It found that there were knowledge gaps in terms of society aspect.Identified the causes of knowledge gaps.
Kagawa (2007)
Students’ per-ceptions of SD
all faculties Plymouth uni-versity, uK
online question-naire survey
Identified that students’ perceptions were strong towards environmental aspect.Significant gaps existing in the knowl-edge of social and economic aspects of SD.Suggested new curriculum develop-ment to address sustainability in a holistic manner.
Drayson et al. (2013)
Students’ atti-tudes and skills for SD
first and the third year students in all faculties
universities across the uK
a two-phase methodology was conducted: Desk-based research i.e. reviews of existing policy-based re-search, and online questionnaire survey
Identified that over eight in every ten students were consistently believed that SD should be actively incorporat-ed and promoted by universities.Identified that over two-thirds of stu-dents believed that SD should be cov-ered by their universities courses.Identified that over 60% of students want to learn more about SD.
Watson et al. (2013)
examining stu-dents’ percep-tions of sustain-ability
civil and en-vironmental engineering
georgia Institute of technology, uSa
Questionnaire survey
Identified that students were interested in SD and there is potential for further enhancing sustainability learning.
180
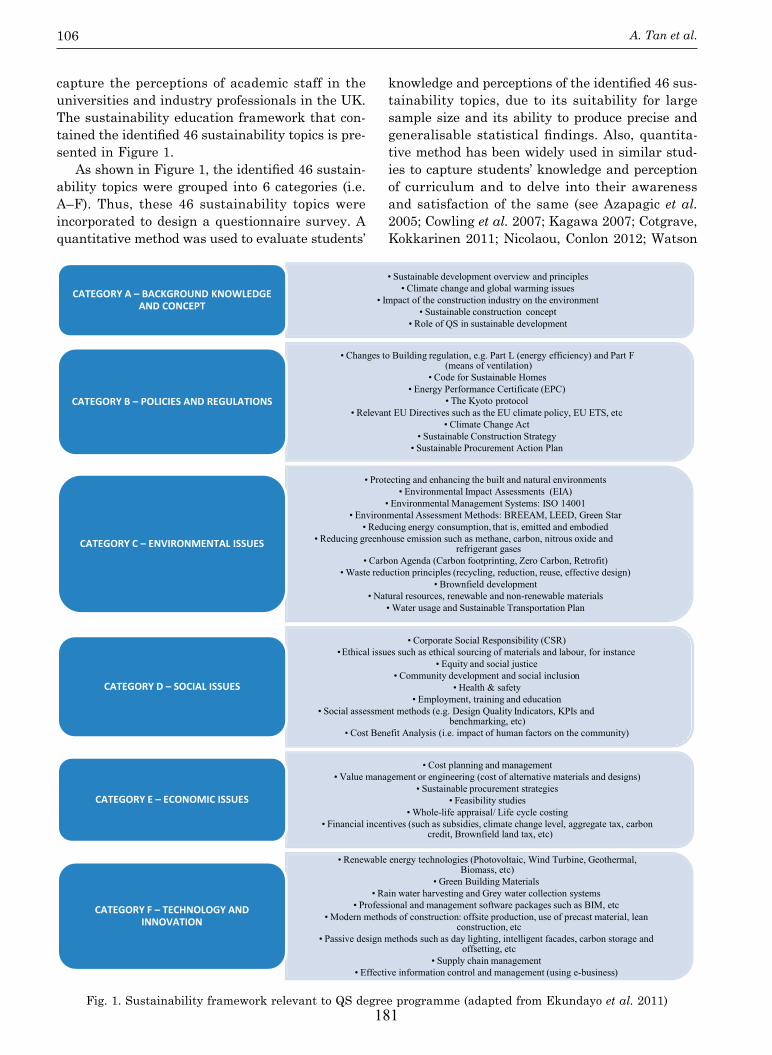
A. Tan et al.106
capture the perceptions of academic staff in the universities and industry professionals in the uK. the sustainability education framework that con-tained the identified 46 sustainability topics is pre-sented in figure 1.
As shown in Figure 1, the identified 46 sustain-ability topics were grouped into 6 categories (i.e. a–f). thus, these 46 sustainability topics were incorporated to design a questionnaire survey. a quantitative method was used to evaluate students’
knowledge and perceptions of the identified 46 sus-tainability topics, due to its suitability for large sample size and its ability to produce precise and generalisable statistical findings. Also, quantita-tive method has been widely used in similar stud-ies to capture students’ knowledge and perception of curriculum and to delve into their awareness and satisfaction of the same (see azapagic et al. 2005; cowling et al. 2007; Kagawa 2007; cotgrave, Kokkarinen 2011; nicolaou, conlon 2012; Watson
• Sustainable development overview and principles • Climate change and global warming issues
• Impact of the construction industry on the environment • Sustainable construction concept
• Role of QS in sustainable development
CATEGORY A – BACKGROUND KNOWLEDGE AND CONCEPT
• Changes to Building regulation, e.g. Part L (energy efficiency) and Part F (means of ventilation)
• Code for Sustainable Homes • Energy Performance Certificate (EPC)
• The Kyoto protocol• Relevant EU Directives such as the EU climate policy, EU ETS, etc
• Climate Change Act • Sustainable Construction Strategy
• Sustainable Procurement Action Plan
CATEGORY B – POLICIES AND REGULATIONS
• Protecting and enhancing the built and natural environments• Environmental Impact Assessments (EIA)
• Environmental Management Systems: ISO 14001• Environmental Assessment Methods: BREEAM, LEED, Green Star
• Reducing energy consumption, that is, emitted and embodied• Reducing greenhouse emission such as methane, carbon, nitrous oxide and
refrigerant gases• Carbon Agenda (Carbon footprinting, Zero Carbon, Retrofit)
• Waste reduction principles (recycling, reduction, reuse, effective design) • Brownfield development
• Natural resources, renewable and non-renewable materials• Water usage and Sustainable Transportation Plan
CATEGORY C – ENVIRONMENTAL ISSUES
• Corporate Social Responsibility (CSR)•Ethical issues such as ethical sourcing of materials and labour, for instance
• Equity and social justice • Community development and social inclusion
• Health & safety • Employment, training and education
• Social assessment methods (e.g. Design Quality Indicators, KPIs and benchmarking, etc)
• Cost Benefit Analysis (i.e. impact of human factors on the community)
CATEGORY D – SOCIAL ISSUES
• Cost planning and management • Value management or engineering (cost of alternative materials and designs)
• Sustainable procurement strategies• Feasibility studies
• Whole-life appraisal/ Life cycle costing• Financial incentives (such as subsidies, climate change level, aggregate tax, carbon
credit, Brownfield land tax, etc)
CATEGORY E – ECONOMIC ISSUES
• Renewable energy technologies (Photovoltaic, Wind Turbine, Geothermal, Biomass, etc)
• Green Building Materials • Rain water harvesting and Grey water collection systems
• Professional and management software packages such as BIM, etc• Modern methods of construction: offsite production, use of precast material, lean
construction, etc• Passive design methods such as day lighting, intelligent facades, carbon storage and
offsetting, etc• Supply chain management
• Effective information control and management (using e-business)
CATEGORY F – TECHNOLOGY AND INNOVATION
fig. 1. Sustainability framework relevant to QS degree programme (adapted from ekundayo et al. 2011)181

Sustainable development in a construction related curriculum- quantity surveying students’ perspective 107
et al. 2013). an online questionnaire survey was conducted to allow a large quantity of samples to be collected efficiently and within available resources. the online questionnaire survey adopted the de-sign used by azapagic et al. (2005) for engineering students but with modifications to suit this study. the target population for this study is quantity surveying (QS) students comprised both full-time and part-time undergraduate students in a univer-sity in the uK. the full-time course is 3 years, and the part-time course follows a similar study pattern to full-time but it takes a longer time of 5 years to complete the degree. therefore, 330 QS students at the undergraduate level of the study were ran-domly selected for this study in an rIcS accred-ited university in the north east of the uK. the reason for selecting a university is that this study is a follow-up of research conducted by ekundayo et al. (2011) in which a sustainability framework relevant to QS degree programme is developed from academic staff in a university and industry professionals’ perspectives without considering the perceptions of QS students of that university. It against this background that this study considered the QS students of that university with a view to capturing their perceptions on knowledge levels of sustainability topics already identified by Ekun-dayo et al. (2011). Prior to data collection, a pretest-ing study was initially undertaken to test the valid-ity of the questionnaire. the pretesting was con-ducted with a total of 8 final year undergraduate students and slight alterations were made based on the feedback. a minor issue arose following the pre-testing concerning whether the definitions of some terms be defined and explained in the survey. In the end, definitions of some terms were included in the cover email. furthermore, a reliability test using Statistical Package for the Social Sciences (SPSS) was conducted on the questionnaire. the result indicated the reliability coefficient value of cronbach’s alpha 0.851 signifying that the ques-tionnaire used was significantly reliable and indi-cates evidence of internal consistency (see george, Mallery 2003). thus, a total of 330 questionnaires were administered, out of which 87 representing 26.36% were completed and suitable for the anal-ysis. the effective response rate of 26.36% was slightly high compared to similar earlier studies. for instance, lee et al. (2013) achieved a response rate of 10% when administered questionnaires to quantity surveying graduates in their early careers in the UK. Also, based on Bartlett et al. (2001) cal-culation to determine an appropriate sample size in survey research for a population exceeding 300
is 85. therefore, the received response of 87 sat-isfies this requirement. The questionnaire for this study was divided into four main sections aiming to capture students’ demographic data; their level of awareness of sustainable development; their knowledge in QS-relevant sustainability topics; and their perception of sustainability education within the QS curriculum. a pilot study was initially un-dertaken to test the validity of the questionnaire. respondents were asked to rank their answers on a 4-point likert scale with 4 being the highest of the rating. Data collected were analysed using both descriptive and inferential statistics. Such as per-centiles, mean item score (MIS), one-way analysis of variance (anoVa) and regression statistics. MIS was used to establish the relative level of knowl-edge of the students and the perceived importance of the sustainability topics. MIS was used to rank the collected data to get the average of the obtained variables. Percentiles, that is, ratios multiplied by 100 were also used in rating a number of factors according to the degree of occurrence attached to them. the higher the percentage rating, the higher the importance or significance attached to such fac-tors. the essence of percentile is to allocate a value between 0–100 to a factor (100 being the highest possible value) using factor size and total size. the formula is; P = n*100/n, where P is the percentage of the factor, n is the size of the factor in considera-tion and n is the total size of the population. Mean item score (MIS) was used to analyse the likert-scale data and is calculated using the formula as follows:
1 1 4 3 2 1 0
4 3 2 1 0
n k 4n 3n 2n 1n 0nn n +n n nn
MIS + + + += =
+ + +∑∑
, (1)
where: MIS = Mean item score; n∑ = total num-ber of respondents; n4 = the number of respondents that choose 4, etc.; 0–4 = the various marks for the ranking of the factors as applicable in each case.
one-way analysis of variance (anoVa) test was used to test the difference in the level of sus-tainability knowledge of students in the different years of study. the test was undertaken at 95% confidence level, that is, the level of significance is 5%. Once the significance of relationship was es-tablished, the effect size measure for anoVa, also known as “eta squared (η²)”, was later used to test how large the differences are, using the formula:
η =Sum of squares for treatments²
Total sum of squares. (2)
the results generated from the “equation 2” above were then interpreted using cohen’s
182
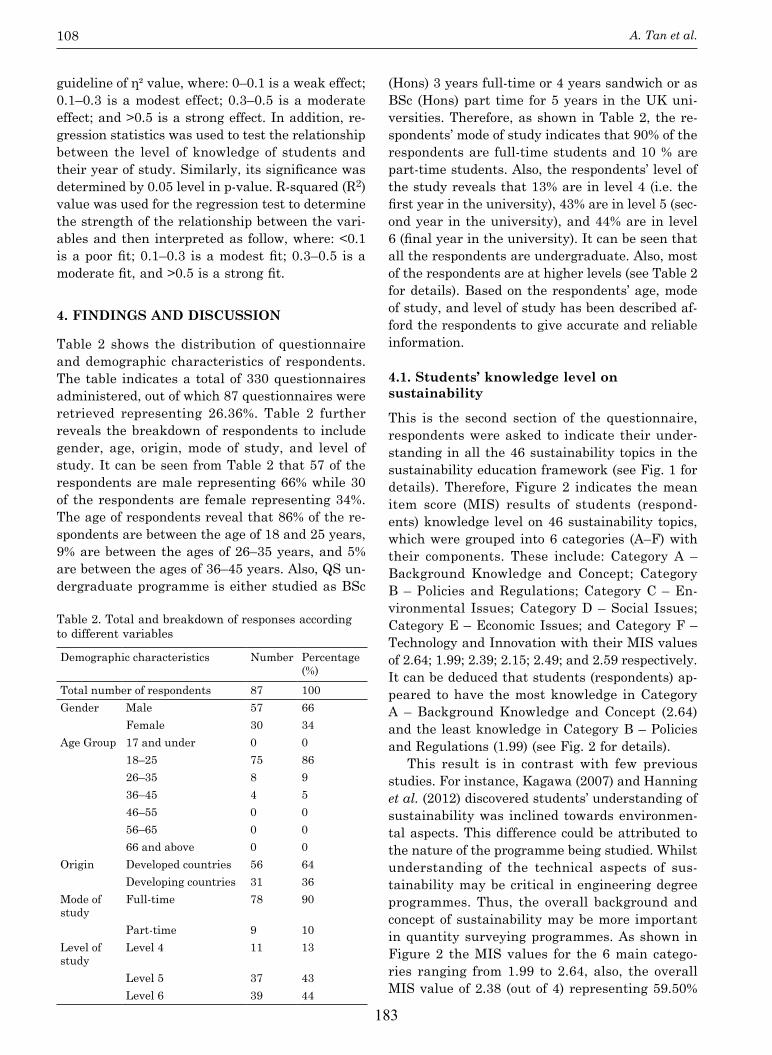
A. Tan et al.108
guideline of η² value, where: 0–0.1 is a weak effect; 0.1–0.3 is a modest effect; 0.3–0.5 is a moderate effect; and >0.5 is a strong effect. In addition, re-gression statistics was used to test the relationship between the level of knowledge of students and their year of study. Similarly, its significance was determined by 0.05 level in p-value. r-squared (r2) value was used for the regression test to determine the strength of the relationship between the vari-ables and then interpreted as follow, where: <0.1 is a poor fit; 0.1–0.3 is a modest fit; 0.3–0.5 is a moderate fit, and >0.5 is a strong fit.
4. FINDINGS AND DISCUSSION
table 2 shows the distribution of questionnaire and demographic characteristics of respondents. the table indicates a total of 330 questionnaires administered, out of which 87 questionnaires were retrieved representing 26.36%. table 2 further reveals the breakdown of respondents to include gender, age, origin, mode of study, and level of study. It can be seen from table 2 that 57 of the respondents are male representing 66% while 30 of the respondents are female representing 34%. the age of respondents reveal that 86% of the re-spondents are between the age of 18 and 25 years, 9% are between the ages of 26–35 years, and 5% are between the ages of 36–45 years. also, QS un-dergraduate programme is either studied as BSc
(Hons) 3 years full-time or 4 years sandwich or as BSc (Hons) part time for 5 years in the UK uni-versities. therefore, as shown in table 2, the re-spondents’ mode of study indicates that 90% of the respondents are full-time students and 10 % are part-time students. also, the respondents’ level of the study reveals that 13% are in level 4 (i.e. the first year in the university), 43% are in level 5 (sec-ond year in the university), and 44% are in level 6 (final year in the university). It can be seen that all the respondents are undergraduate. also, most of the respondents are at higher levels (see table 2 for details). Based on the respondents’ age, mode of study, and level of study has been described af-ford the respondents to give accurate and reliable information.
4.1. Students’ knowledge level on sustainability
this is the second section of the questionnaire, respondents were asked to indicate their under-standing in all the 46 sustainability topics in the sustainability education framework (see fig. 1 for details). therefore, figure 2 indicates the mean item score (MIS) results of students (respond-ents) knowledge level on 46 sustainability topics, which were grouped into 6 categories (a–f) with their components. these include: category a – Background Knowledge and Concept; Category B – Policies and Regulations; Category C – En-vironmental Issues; category D – Social Issues; category e – economic Issues; and category f – technology and Innovation with their MIS values of 2.64; 1.99; 2.39; 2.15; 2.49; and 2.59 respectively. It can be deduced that students (respondents) ap-peared to have the most knowledge in category A – Background Knowledge and Concept (2.64) and the least knowledge in Category B – Policies and regulations (1.99) (see fig. 2 for details).
this result is in contrast with few previous studies. for instance, Kagawa (2007) and Hanning et al. (2012) discovered students’ understanding of sustainability was inclined towards environmen-tal aspects. this difference could be attributed to the nature of the programme being studied. Whilst understanding of the technical aspects of sus-tainability may be critical in engineering degree programmes. thus, the overall background and concept of sustainability may be more important in quantity surveying programmes. as shown in figure 2 the MIS values for the 6 main catego-ries ranging from 1.99 to 2.64, also, the overall MIS value of 2.38 (out of 4) representing 59.50%
table 2. total and breakdown of responses according to different variables
Demographic characteristics number Percentage (%)
total number of respondents 87 100gender Male 57 66
female 30 34age group 17 and under 0 0
18–25 75 8626–35 8 936–45 4 546–55 0 056–65 0 066 and above 0 0
origin Developed countries 56 64Developing countries 31 36
Mode of study
full-time 78 90
Part-time 9 10level of study
level 4 11 13
level 5 37 43level 6 39 44
183

Sustainable development in a construction related curriculum- quantity surveying students’ perspective 109
(see fig. 2 for details). It can be deduced that stu-dents’ knowledge level on sustainability was just above “basic/limited knowledge”. this indicated that respondents had shown relatively balanced knowledge and understanding of the sustainabil-ity topics in this study (see fig. 2). the reason be-hind this moderate level of students’ sustainabil-ity knowledge may be partly due to the fact that the university of the respondents had approached sustainability education in a holistic and balanced way within a relevant context. Moreover, the pos-sibility of respondents gaining knowledge and
awareness from sources other than the university must also be taken into account, especially with regard to part-time students who have relevant industry experience.
Based on the respondents’ responses, the per-formance of students at different degree levels in sustainability knowledge was further analysed. figure 3 presents a gradual increasing trend of knowledge level among students in each sustain-ability category as they progressed higher in edu-cation level.
as shown in figure 3, the majority of the level 4 students (first-year students) had the lowest knowledge level whilst level 6 students (final year students) had the highest knowledge level on sus-tainability. to compare the sustainability knowl-edge level among students from all the levels of study, one-way analysis of variance (anoVa) and a measure of effect size were carried out. It was found that the differences in the average scores between the three levels of study (see fig. 3) were statistically significant (p = 0.000, <0.05) and η² of 0.54 (>0.5) suggested that the differences were large. In other words, the students at different lev-els of the study had a different level of access to sustainability knowledge. this may be explained by the university’s role in transferring more sus-tainability knowledge as students advance to high-er education level. also, other possibilities such as students interests or media influence cannot be disregarded as a contributory factor.
to test the relationship between students’ level of knowledge and their level of study, regression test and a measure of effect size were used. the p-value of 0.016 (p < 0.05) showed that the rela-tionship between both variables was statistically significant. The adjusted R2 value of 0.852 revealed
fig. 2. Students knowledge level on sustainability topics
*Note: lVl4–year 1 in the university; lVl5–year 2 in the university; lVl6–final year in the university.
fig. 3. the knowledge level of students according to their level of study
0.00
1.00
2.00
3.00
4.00
6LVL5LVL4LVL
MIS for all Categories
184
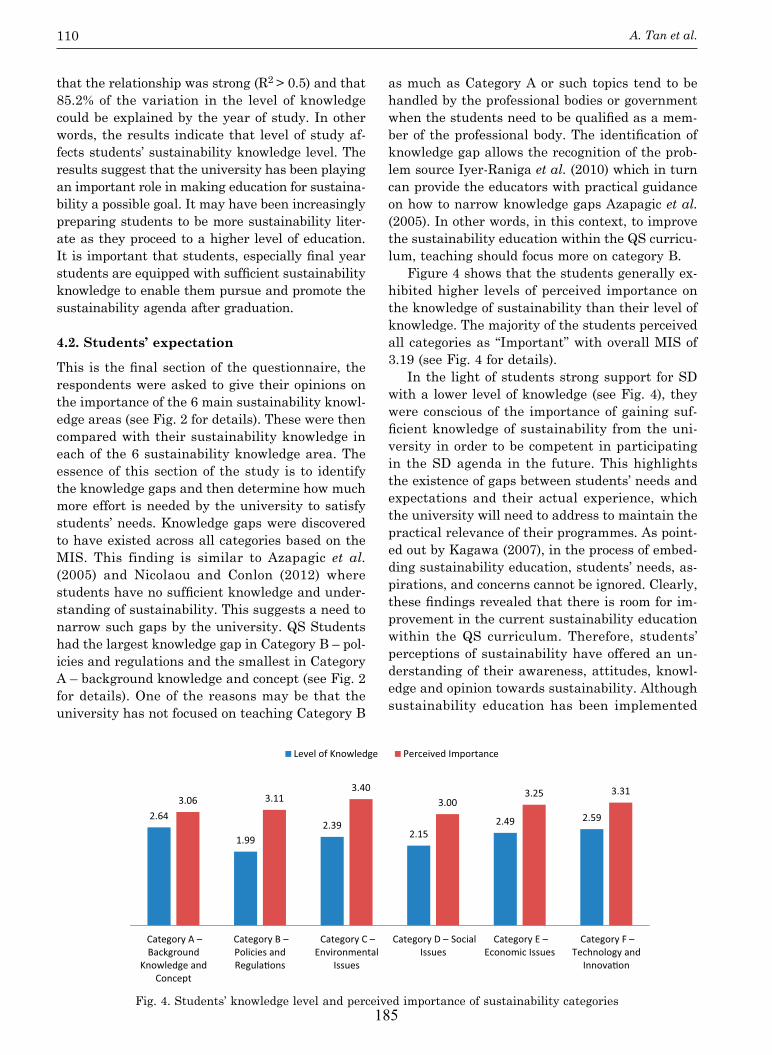
A. Tan et al.110
that the relationship was strong (r2 > 0.5) and that 85.2% of the variation in the level of knowledge could be explained by the year of study. In other words, the results indicate that level of study af-fects students’ sustainability knowledge level. the results suggest that the university has been playing an important role in making education for sustaina-bility a possible goal. It may have been increasingly preparing students to be more sustainability liter-ate as they proceed to a higher level of education. It is important that students, especially final year students are equipped with sufficient sustainability knowledge to enable them pursue and promote the sustainability agenda after graduation.
4.2. Students’ expectation
This is the final section of the questionnaire, the respondents were asked to give their opinions on the importance of the 6 main sustainability knowl-edge areas (see fig. 2 for details). these were then compared with their sustainability knowledge in each of the 6 sustainability knowledge area. the essence of this section of the study is to identify the knowledge gaps and then determine how much more effort is needed by the university to satisfy students’ needs. Knowledge gaps were discovered to have existed across all categories based on the MIS. this finding is similar to azapagic et al. (2005) and nicolaou and conlon (2012) where students have no sufficient knowledge and under-standing of sustainability. this suggests a need to narrow such gaps by the university. QS Students had the largest knowledge gap in Category B – pol-icies and regulations and the smallest in category a – background knowledge and concept (see fig. 2 for details). one of the reasons may be that the university has not focused on teaching Category B
as much as category a or such topics tend to be handled by the professional bodies or government when the students need to be qualified as a mem-ber of the professional body. The identification of knowledge gap allows the recognition of the prob-lem source Iyer-raniga et al. (2010) which in turn can provide the educators with practical guidance on how to narrow knowledge gaps azapagic et al. (2005). In other words, in this context, to improve the sustainability education within the QS curricu-lum, teaching should focus more on category B.
figure 4 shows that the students generally ex-hibited higher levels of perceived importance on the knowledge of sustainability than their level of knowledge. the majority of the students perceived all categories as “Important” with overall MIS of 3.19 (see fig. 4 for details).
In the light of students strong support for SD with a lower level of knowledge (see fig. 4), they were conscious of the importance of gaining suf-ficient knowledge of sustainability from the uni-versity in order to be competent in participating in the SD agenda in the future. this highlights the existence of gaps between students’ needs and expectations and their actual experience, which the university will need to address to maintain the practical relevance of their programmes. as point-ed out by Kagawa (2007), in the process of embed-ding sustainability education, students’ needs, as-pirations, and concerns cannot be ignored. clearly, these findings revealed that there is room for im-provement in the current sustainability education within the QS curriculum. therefore, students’ perceptions of sustainability have offered an un-derstanding of their awareness, attitudes, knowl-edge and opinion towards sustainability. although sustainability education has been implemented
2.64
1.992.39
2.152.49 2.59
3.06 3.113.40
3.003.25 3.31
Category A –Background
Knowledge andConcept
Category B –Policies andRegula�ons
Category C –Environmental
Issues
Category D – SocialIssues
Category E –Economic Issues
Category F –Technology and
Innova�on
Level of Knowledge Perceived Importance
fig. 4. Students’ knowledge level and perceived importance of sustainability categories185
Sustainable development in a construction related curriculum- quantity surveying students’ perspective 111
within QS curriculum to a certain extent accord-ing to this study, the findings suggest that there is an urgent need to improve the present curriculum to ensure that sustainability education meets the requirements of QS students, as well as to increase their knowledge and influence their behaviour for their future undertakings.
5. CONCLUSION AND FUTURE RESEARCH
Sustainable development (SD) has become an in-evitable trend in recent years, due to adverse envi-ronmental impacts, such as global climate change, degradation of ecological balance and diminution of natural resources. SD has gained its popularity and momentum within the uK and its construc-tion industry through recent heavy government imposed legislations and regulations, increased standards of competencies from professional bod-ies, and vigorous institutional educations and researchers. the construction industry has been deemed as the prime mover of the economy as well as the main protagonist of SD. thus, the quantity surveyors as part of the construction industry have an important role to play in order to help to bal-ance out the environmental, economic and social problems caused by the construction industry. this study revealed that the students were aware of the concept of SD and majority of students held posi-tive attitudes towards SD. this demonstrates that the role of the university in bringing awareness of SD to the students is successful and critical. It is also important that the university can nurture their positive attitudes further to enable them to engage in sustainability agenda more whole-heart-edly. about the students’ knowledge and under-standing aspects, the study showed that the imple-mentation of the curriculum has been successful to a certain extent in introducing SD holistically. this study further revealed that students in different years of study had a different level of knowledge and their level of knowledge was strongly related to their year of study. However, knowledge gaps were still found across all categories of sustainabil-ity knowledge areas. In particular, the largest gap was found in knowledge about policies and regula-tions endorsed by the government to promote SD. the study also revealed that the students placed a high importance of sustainability education de-spite knowledge level were found lower. this study is not without limitation. first, the respondents considered in this study were from only one rIcS accredited university in the north east of the uK, considering other rIcS accredited universities of-
fering Quantity Surveying programme in the uK would have enhanced the credibility of the find-ings. Second, although the use of questionnaire survey allows the large sample to be captured, having other methods together such as interviews and the use of case study approach may enrich the findings. Despite its limitations, the findings ema-nating from this study prove to be more reliable as they come about not merely from a library investi-gation but rather from field work approach which involved getting students shared their true expe-riences. thus, future research should be conduct-ed to involve several universities on a periodical basis, and comparisons could be made to monitor the progressions of the curriculum, as well as the students’ expectation of the sustainable develop-ment. also, in future surveys, new topics need to be included in line with environmental, technologi-cal, governmental, economic and social changes. Similarly, further research is needed to extend or map the sustainability education within other construction related programmes in the HeIs. It might also be useful for the university to conduct a survey to monitor whether knowledge gained by graduates is put into actual practice or is relevant to their working careers.
these study findings revealed room for im-provement in the current sustainability education within QS curriculum. thus, the study recom-mends that:
– teachings should focus more on category B – policies and regulations of sustainability knowledge areas.
– the task of embedding sustainability with-in QS curricula needs to be supported by a determined institutional ethos and continu-ously review.
– the university should be innovative and se-lective in teaching and imparting the knowl-edge deemed most important and least known to the students.
– reorienting QS education i.e. there is urgent need to reorient existing QS education poli-cies, programmes and practices so that they build the concepts, skills, motivation and com-mitment needed for sustainable development.
It is believed that this study would be of great value to academic staff and university manage-ment boards to develop a methodology for incorpo-rating sustainability education into their curricula. The professional bodies will also benefit through using the 46 sustainability topics to establish the relevant competencies required for a graduate quantity surveying professional.
186
A. Tan et al.112
REFERENCES
abdul-Wahab, S. a.; abdulraheem, M. y.; Hutchin-son, M. 2003. the need for inclusion of environmen-tal education in undergraduate engineering curricu-la, International Journal of Sustainability in Higher Education 4(2): 126–137.
https://doi.org/10.1108/14676370310467140azapagic, a.; Perdan, S.; Shallcross, D. 2005. How much
do engineering students know about sustainable de-velopment? The findings of an international survey and possible implications for the engineering curric-ulum, European Journal of Engineering Education 30(1): 1–19.
https://doi.org/10.1080/03043790512331313804Bartlett, J. E.; Kotrlik, J. W.; Higgins, C. C. 2001. Or-
ganisational research: determining appropriate sam-ple size in survey research, Information Technology, Learning and Performance Journal 19(1): 43–50.
BERR. 2008. Strategy for sustainable construction, de-partment for business, enterprise & regulatory re-form. HM government in association with Strategic forum for construction, 1–64.
Boardman, B. 2007. Examining the carbon agenda via the 40% house scenario, Building Research and In-formation 35(4): 363–378.
http://dx.doi.org/10.1080/09613210701238276Bourdeau, L. 1999. Sustainable development and the
future of construction: a comparison of visions from various countries, Building Research and Informa-tion 27(6): 355–367.
https://doi.org/10.1080/096132199369183cartlidge, D. 2011. New aspects of quantity surveying
practice. oxon: Spon Press.cortese, a. D. 2003. the critical role of higher education
in creating a sustainable future, Planning for Higher Education 31(3): 15–22.
cotgrave, a. J.; Kokkarinen, n. 2010. Developing a model promoting sustainability literacy through con-struction curriculum design, Structural Survey 28(4): 266–280. https://doi.org/10.1108/02630801011070975
cotgrave, a. J.; Kokkarinen, n. 2011. Promoting sus-tainability literacy in construction students: im-plementation, Structural Survey 29(3): 197–212. https://doi.org/10.1108/02630801111148185
cotgrave, a.; alkhaddar, r. 2006. greening the curricu-la with construction programs, Journal of Education in the Built Environment 1(1): 3–29.
https://doi.org/10.11120/jebe.2006.01010003cowling, e.; lewis, a.; Sayce, S. 2007. exploring the
changing nature of students’ attitudes and aware-ness of the principles of sustainability, in Proceed-ings of the Built Environment Education Annual Conference (BEECON 2007): Developing competent people, 12–13 September 2007, london, u.K.
Darwish, M. M.; agnello, M. f. 2009. enabling construc-tion engineering students in sustainable thinking: curricular changes to foster sustainability, in Pro-ceedings of the 7th LACCEI Latin American and Car-ibbean Conference for Engineering and Technology, 2–5 June 2009, San cristóbal, Venezuela.
Dixon, t.; colantonio, a.; Siers, D.; reed, r.; Wilkin-son, S.; gallimore, P. 2008. a green profession? a global survey of rIcS Members and their engage-ment with the sustainability agenda, Journal of Property Investment and Finance 26(6): 460–481. https://doi.org/10.1108/14635780810908352
Drayson, R.; Bone, E.; Agombar, J.; Kemp, S. 2013. Stu-dent attitudes towards and skills for sustainable devel-opment. the Higher education academy, york, u.K.
edum-fotwe, f. t.; Price, a. D. f. 2009. a social on-tology for appraising sustainability of construc-tion projects and developments, International Journal of Project Management 27: 313–322. https://doi.org/10.1016/j.ijproman.2008.04.003
ekundayo, D.; Zhou, l.; udeaja, c.; Pearson, J.; Perera, S. 2011. Mapping of sustainability education to construction related curricula: a case study of quantity surveying (QS) degree programme, in Pro-ceedings of RICS Construction and Property Confer-ence (COBRA 2011), 12–13 September 2011, School of the Built Environment, University of Salford, Manchester, u.K.
Emmanuel, M. R.; Baker, K. 2012. Carbon management in the built environment. london: routledge.
ganah, a.; Pye, a.; Hall, g. 2008. the role of knowledge transfer in sustainability research in the built envi-ronment discipline, in a. Dainty (ed.). Proceedings of 24th Annual ARCOM Conference, 1–3 September 2008, cardiff, uK, association of researchers in construction Management, 299–307.
george, D.; Mallery, P. 2003. SPSS for windows step by step: a simple guide and reference 11.0 update. Boston: Allyn and Bacon.
Gilham, A. V. 2001. Sustainable Buildings, in T. G. Car-penter (ed.). Environment, construction, and sustain-able development. new york: John Wiley and Sons ltd.
grubb, M.; Koch, M.; thomson, K.; Munson, a.; Sulli-van, f. 1993. The “Earth Summit” agreements – a guide to assessment, an analysis of the Rio’92 UN Conference on Environment and Development. earth-scan Publications ltd.
Hanning, a.; abelsson, a. P.; lundqvist, u.; Svan-strom, M. 2012. are we educating engineers for sus-tainability? comparison between obtained compe-tences and Swedish industry’s needs, International Journal of Sustainability in Higher Education 13(2): 305–320. https://doi.org/10.1108/14676371211242607
Hayles, c. S.; Holdsworth, S. e. 2008. curriculum change for sustainability, Journal for Education in the Built Environment 3(1): 25–48.
https://doi.org/10.11120/jebe.2008.03010025Hill, R. C.; Bowen, P. A. 1997. Sustainable construction:
principles and a framework for attainment, Con-struction Management and Economics 15: 223–239. https://doi.org/10.1080/014461997372971
Iyer-raniga, u.; arcari, P.; Wong, J. 2010. education for sustainability in the built environment: what are students telling us?’, in c. egbu (ed.). Proceedings of 26th Annual ARCOM Conference, 6–8 September 2010, leeds, uK, association of researchers in con-struction Management, 1447–1456.
187
Sustainable development in a construction related curriculum- quantity surveying students’ perspective 113
Kagawa, f. 2007. Dissonance in students’ perceptions of sustainable development and sustainability: implica-tions for curriculum change, International Journal of Sustainability in Higher Education 8(3): 317–338. https://doi.org/10.1108/14676370710817174
Kibert, c. J. 2007. the next generation of sustainable con-struction, Building Research and Information 35(6): 595–601. https://doi.org/10.1080/09613210701467040
lee, c. c.; Perera, S.; Hogg, K. 2013. an analysis of ear-ly career training requirements for quantity survey-ing professionals, International Journal of Strategic Property Management 17(2): 161–173.
https://doi.org/10.3846/1648715X.2013.805450lewis, a.; Sayce, S.; ellison, l. 2005. education for sus-
tainable development in the built environment disci-plines, CEBE Working Paper No. 9. the Higher edu-cation Academy, Centre for Education in the Built Environment (CEBE).
lozano, r.; lukman, r.; lozano, f. J.; Huisingh, D.; lambrechts, W. 2013. Declarations for sustain-ability in higher education: becoming better leaders, through addressing the university sys-tem, Journal of Cleaner Production 48: 10–19. https://doi.org/10.1016/j.jclepro.2011.10.006
MDg. 2013. Millennium development goals report 2013 [online]. united nations, new york. available at: www.un.org/millenniumgoals/pdf/report-2013/mdg-report-2013-english.pdf [accessed 20 December 2013].
Meikle, J. 2008. uK housebuilding, Building Research and Information 36(2): 200–202.
https://doi.org/10.1080/09613210701841616Monahan, J.; Powell, J. c. 2011. a comparison of the
energy and carbon implications of new systems of energy provision in new build housing in the uK, En-ergy Policy 39(1): 290–298. https://doi.org/10.1016/j.enpol.2010.09.041
Murray, P. e.; cotgrave, a. J. 2007. Sustainability liter-acy: the future paradigm for construction education?, Structural Survey 25(1): 7–23.
https://doi.org/10.1108/02630800710740949nicolaou, I.; conlon, e. 2012. What do final year engi-
neering students know about sustainable develop-ment? [online]. arrow@DIt. available at: http://ar-row.dit.ie/engineducart/1/ [accessed 5 october 2012].
niu, D.; Jiang, D.; li, f. 2010. Higher education for sustainable development in china, International Journal of Sustainability in Higher Education 11(2): 153–162. https://doi.org/10.1108/14676371011031874
Pellegrini-Masini, G.; Bowles, G.; Peacock, A. D.; Ahad-zi, M.; Banfill, P. F. G. 2010. Whole life costing of domestic energy demand reduction technologies: householder perspectives, Construction Management and Economics 28(3): 217–229.
https://doi.org/10.1080/01446190903480027
Perera, S.; Pearson, J. 2011. Alignment of professional, academic and industrial development needs for quan-tity surveyors: post recession dynamics [online]. rIcS education trust funded research report. available at: http://www.northumbria-qs.org/rIcS_alignment/reports/alignment_of_views_final_report.pdf [ac-cessed 29 June 2011].
Perera, S.; Pearson, J.; ekundayo, D.; Zhou, l. 2013. Professional, academic and industrial development needs: a competency mapping and expert opinion review, International Journal of Strategic Property Management 17(2): 143–160.
https://doi.org/10.3846/1648715X.2013.806966Revell, A.; Blackburn, R. 2007. The business case for
sustainability? an examination of small firms in the uK’s construction and restaurant sectors, Busi-ness Strategy and the Environment 16(6): 404–420. https://doi.org/10.1002/bse.499
rIcS. 2012. Assessment of professional competence [on-line]. rIcS. available at: www.rics.org/ [accessed 3
January 2013].Seyfang, g.; Smith, a. 2007. grassroots innovations for
sustainable development: towards a new research and policy agenda, Environmental Politics 16(4): 584–603. https://doi.org/10.1080/09644010701419121
tan, y.; Shen, l.; yao, H. 2011. Sustainable construc-tion practice and contractors’ competitiveness: a preliminary study, Habitat International 35(2): 225–230. https://doi.org/10.1016/j.habitatint.2010.09.008
theron, c. 2010. Surveying the sustainable and envi-ronmental legal and market challenges for real es-tate, in Proceedings of RICS COBRA, 2–3 September 2010, Dauphine université, Paris.
udeaja, c. e.; ekundayo, D.; Zhou, l.; Perera, S. 2013. Material waste in the construction industry: a review of the legislative and supply chain issues, in a. rich-ardson (ed.). Reuse of materials and by products in construction. london: Springer.
https://doi.org/10.1007/978–1-4471–5376–4_2Walton, S. V.; galea, c. e. 2005. Some considerations for
applying business sustainability practices to campus environmental challenges, International Journal of Sustainability in Higher Education 6(2): 147–160. https://doi.org/10.1108/14676370510589864
Watson, M.; noyes, c.; rodgers, M. 2013. Student perceptions of sustainability education in civil and environmental engineering at the georgia insti-tute of technology, Journal of Professional Issues in Engineering Education Practice 139(3): 235–243. https://doi.org/10.1061/(aSce)eI.1943–5541.0000156
World commission on environment and Development. 1987. Our common future [online]. the World com-mission on environment and Development. avail-able at: http://www.un-documents.net/ocf-02.htm [accessed 20 april 2015].
188
1 © Lloyd Scott and Chris Gorse
Sustainable Ecological Engineering Design for Society
(SEEDS)
Conference Proceedings from the Fourth International SEEDS
Conference
Conference Chairs
Professor Lloyd Scott
Professor Chris Gorse
6th and 7th September 2018
Dublin Institute of Technology
189

590 © Lloyd Scott and Chris Gorse
TOWARDS THE DEVELOPMENT OF A FRAMEWORK FOR INCORPORATING SUSTAINABILITY EDUCATION IN THE BUILT ENVIRONMENT CURRICULUM
Damilola Ekundayo, Chika Udeaja, Kwasi Gyau and Anthony Higham
School of the Built Environment, University of Salford, The Crescent, Salford, M5 4WT, UK
Keywords: Built Environment Curriculum, Framework, Sustainable Development, Sustainability Mapping.
Abstract
Many proponents believe that there is a linkage between the green agenda and built environment (BE) education. It is increasingly recognised that the BE education curriculum should incorporate sustainability and produce graduates that are confident of taking care of the environment without damaging it for future users. Achieving education for sustainable development within the quantity surveying curriculum and more generally in BE curriculum will require an exploration of the general definition of sustainable development and its three spheres; economic, environmental, and social. In addition, one must acquire knowledge of regulatory and technological issues that encompass both the parts and the whole in dynamic interaction. Clearly, universities operating in the BE field have a vital role in shaping the future pattern of practice and policy in relation to the sustainability agenda. So, it is vital to map the curriculum towards sustainability. This research has been developed in response to the growing need of education for sustainable development. Whilst the study identifies the quality and quantity of sustainability related materials within existing BE curriculum, future research is needed to develop a modular framework for further integration of sustainability education in BE programmes. This framework could serve as an evaluation and a benchmarking tool for those who engage in developing the content of BE degree programmes.
INTRODUCTION
The sustainability revolution, which occurred over three decades ago, has culminated in the realisation that the world runs the risk of unsurmountable challenges if it does not embrace sustainability (cf. Miller et al., 2014). From the perspectives of proponents, the concept, which hinges on the future of humankind and the relationship between society and its natural environment, offers economic, socio-cultural and ecological benefits (Crofts, 1999). These benefits, as argued by proponents, manifest in several indicators. These include: poverty eradication or reduction; gender equality; economic growth with creation of jobs and promotion of strong economies; better standard of education and healthcare particularly in relation to water quality and better sanitation; and resilience in terms of the effects of climate change among other indicators (Olsen and Fenhann, 2008; PrÜss-ÜstÜn, 2008; David et al., 2013). Accordingly, sustainability has become very popular and engaged the attention of policy makers and implementers, as well as industry players across all disciplines. Indeed, Bell and Morse (2008) note that sustainability has become central to development discourse in a manner that only few development initiatives or research proposals are able to secure
190
591 © Lloyd Scott and Chris Gorse
sponsorship or funding without the words “sustainability” or “sustainable” appearing in such proposals to funding agencies. Although various disciplines have adopted and are adopting the principles of sustainability, the attention on sustainability and its application within the built environment continue to intensify. This is because of the crucial role the built environment plays in the destruction of natural, human and social capital (Holdsworth & Sandri, 2014). For example, it is estimated that buildings and the building industry consume 32% of the world’s resources including between 40-50% of energy and up to 16% of the water used annually worldwide (IyerRaniga et al., 2010; Holdsworth & Sandri, 2014). Further, the building industry produces about 40% of waste that goes to landfill and accounts for 40% of air emissions (Holdsworth & Sandri, 2014). This implies that the intensification of the application of sustainability principles within the built environment is justified and there is a need for mechanisms for their implementation. At the heart of any strategy to implement or promote sustainability principles within the built environment is a well-crafted sustainable built environment education curriculum for stakeholders, such as built environment students and professionals (Iyer-Raniga et al., 2010). This is to equip graduates from higher education, professionals and other stakeholders to use and manage the built environment sustainably.
However, such a sustainable built environment education curriculum requires a suitable
framework given sustainability education is unique, differing immensely from other, more
conventional modes of education (Holdsworth & Sandri, 2014). This is compounded by the fact
that knowledge obtained from sustainability science and related fields to support transitions to
sustainability remains a critical theoretical and empirical question for basic and applied
research (Miller et al., 2014). Although several studies (Iyer-Raniga et al., 2010; Iyer-Raniga and
Andamon, 2012; Holdsworth & Sandri, 2014; Altomonte et al., 2014; Conte, 2016) have
examined the link between sustainability and the built environment education in an attempt to
prescribe a sustainable built environment education curriculum. The development of
comprehensive framework for the incorporation of sustainability in the built environment
education remains elusive.
Consequently, this study aims to contribute to the development of a comprehensive framework
to incorporate sustainability into the built environment education curriculum. The concept of
Sustainable Development within the Construction Industry is explored and literature relating
to the importance and challenges of embedding sustainability in built environment education
is explored before a series of four case studies are undertaken appraising existing RICS
accredited QS degree programmes to appraise levels of sustainability inclusion within the
curriculum. From this analysis, a modular framework for integration of sustainability education
in built environment programmes is proposed.
SUSTAINABLE DEVELOPMENT AND THE CONSTRUCTION INDUSTRY
Sustainability and sustainable development (SD) are inextricably linked. Environmental, industrial and manmade disasters continue to trouble human existence. It is generally accepted that some natural disasters caused by forces of nature are inevitable. However, proponents in this field believe that we must do something about manmade and environmental hazards such as the threat of global warming caused by human action or inaction (Spence & Mulligan, 1995; Azapagic, Perdan & Shallcross, 2005; IPCC, 2014; Yilmaz & Bakis, 2015; Zaid, Jones & Holgate,
191

592 © Lloyd Scott and Chris Gorse
2017). Apart from being the morally acceptable thing to do, the current generation as the custodian of the built environment owe it to future generations to preserve and maintain the natural habitat. This was the main theme in the report of the World Commission on Environment and Development (Brundtland, 1987), and several global events thereafter have reinforced the idea of SD (Ekundayo et al., 2011).
According to the Intergovernmental Panel on Climate Change (IPCC) Fifth Assessment Report (AR5), global warming otherwise referred to as climate change is caused by the emission of greenhouse gases (GHGs) mainly carbon dioxide (IPCC, 2014). There are different aspects to sustainability (Son et al., 2011; Gan et al., 2015; Yilmaz & Bakis, 2015), but the fundamental principle is for all development activities to be both less resourceintensive and less environmentally damaging (Spence & Mulligan, 1995; Sev, 2009). The crucial elements often referred to as the triple bottom line of SD are society, environment and economy. While the topic of sustainability remains highly contested, it is evident that the earth finite resources must be managed effectively whilst at the same time reducing GHG emissions accumulating in the biosphere. This is necessary for the survival of the earth and its current and future occupants.
As mentioned by Spence and Mulligan (1995), the rapid depletion of the world’s finite resources
and the build-up of GHGs in the habitat leading to global threat of climate change implies that
the construction industry has a vital role to play in achieving a sustainable future. Infrastructure
and its associated developments are key to economic growth and global competitiveness. The
construction industry and its extensive workforce help to build resilient infrastructures and
sustainable (built) environments that we all rely on. This multibillion pound industry is however
one of the largest exploiters of natural resources and a major producer of GHGs such as
embodied and operational carbon. Buildings and infrastructures make use of raw materials
produced from mineral and natural resources. The extraction, production, transportation and
recycling or disposal of these raw materials, are energy intensive. In addition, the buildings
lifecycle, from cradle to grave i.e. from construction to demolition, have negative impacts on
the environment (Tan et al., 2011).
According to Yilmaz & Bakis (2015), buildings use 45% of world energy and 50% of water. In a
similar study, Dixon (2010) highlights the environmental hazards caused by buildings such as
23% of air pollution, 50% of greenhouse gas production, 40% of water pollution and 40% of
solid waste in cities. As well as buildings contributing to 50% of raw material consumption, the
waste produced by the construction industry varies between 15 and 50% as reported by Sev
(2009). Clearly, the construction industry is resource-intensive and a major polluter of both
built and natural environments such that sustainability is now a key concept in development
thinking at all levels. This led to the assertion by Sev (2009) that the significance of the
construction industry in achieving economic growth, social progress and effective protection of
both built and natural environments cannot be overstated.
192
593 © Lloyd Scott and Chris Gorse
IMPORTANCE AND CHALLENGES OF EMBEDDING SUSTAINABILITY IN BUILT
ENVIRONMENT EDUCATION
The purpose of this section are twofold, that is, to review the importance and challenges of
embedding SD in built environment (BE) education. The construction industry has a vital role
to contribute to SD as the major energy, mineral and natural resources consumer.
Construction industry is responsible for the development of nations and buildings as well as
their associated infrastructures have numerous economic, social and environmental impacts.
According to Son et al. (2011) the construction sector has the greatest impact on national
economies and the environment. Structures can last for several decades and in some cases
centuries. However, sustainable construction is a notion that cannot materialise without a solid
understanding and knowledge of sustainability concepts.
Whilst the construction industry generates many benefits to the built environment and society
at large, the pressure of its activities on the natural habitat is alarming. Depletion of the
biological and mineral resources many of which are non-renewable and deterioration of the
physical environment such as loss of soil, forests and agricultural land, as well as increasing air
pollution, global temperature and sea level rise are only a few examples. The ambitious targets
set by the UK Government for all new domestic and commercial buildings to be zero carbon by
2016 and 2020 respectively is a step in the right direction to curb the irreversible damage being
done (Zaid et al., 2017). Consequently, we cannot leave this to our industry thinkers and policy-
makers alone to proffer solutions. Perhaps, we should focus more on BE stakeholders’
particularly higher education institutions (HEIs) that educate construction industry
professionals. The huge contribution that HEIs can make in achieving SD underlines the
importance of embedding sustainability in BE education. Whilst
Government initiatives are having a positive impact, it is believed that HEIs are imperative in
driving the sustainability agenda forward (Cotgrave & Kokkarinen, 2010; Sutrisna & Rowe,
2012; Fukukawa et al., 2013; Brennan & Cotgrave, 2014).
HEIs have been striving to incorporate sustainability into their BE curriculum in order to
maintain the currency of their programmes. This is reinforced by the need for the education
sector to ensure that construction graduates are fit for purpose and able to lead the design,
construction and management of sustainable structures (Sutrisna & Rowe, 2012). BE
professionals make decisions and engage in activities that can lead to physical alteration of the
natural environment. This has led to the surge in interest in sustainability and calls for BE
schools to educate economically aware, socially responsible and environmentally conscious
graduates. Although this has been a topic of discussion for much longer, for example the UN
declaration for the decade of education for sustainable development (ESD) 2005 to 2014 (UN,
2002), the development of a framework to embed sustainability into BE curriculum is long
overdue.
Despite the growing importance of ESD in HEIs around the world, its implementation in the
construction industry and BE sector remains a challenge (Brennan & Cotgrave, 2014). In a study
carried out by Fukukawa et al. (2013), barriers to the development of an SD curriculum for
degree programmes were identified. These include time constraints on the part of teaching
staff along with their perceived lack of expertise about SD, the need for a coherent strategy at
193
594 © Lloyd Scott and Chris Gorse
the school level, attitudes towards ESD and lack of university initiatives of this kind. Earlier,
Cotgrave & Kokkarinen (2010) classified the barriers into organisation and funding of UK
universities, academic indifference and approach to teaching and assessment, and lack of
communication between industry and academia. While the barriers are being addressed by
HEIs that promote ESD, there is need for a framework to enhance the creation, implementation
and delivery of ESD programmes in BE schools. Cotgrave & Kokkarinen (2010) describe this as
a sustainability literate construction curriculum. The proposed framework will address the
perceived lack of action from HEIs and will ensure that sustainability literacy is fully realised in
practice.
PREVIOUS RESEARCH ON SUSTAINABILITY EDUCATION
Sustainability is often perceived as a political propaganda inspired by environmental
consciousness and driven by socio-economic factors. Yet, the importance of ESD in the
construction curriculum is widely accepted. Sustainable development, green supply chain
management and sustainable construction are just a few of the lexicons bandied around in the
construction industry and other sectors as a means to an end, a way to achieve sustainability.
As such, different studies over the years have examined the nomenclature of sustainability, but
limited research exist on how this concept can be integrated into BE curriculum (Cotgrave &
Kokkarinen, 2010; Sutrisna & Rowe, 2012; Fukukawa et al., 2013).
A recent study by Tan et al. (2017) investigated the extent in which sustainable development is
embedded in the construction related curriculum based on the perception of quantity
surveying students. The findings from this study and a review of extant literature revealed that
students have basic/limited knowledge of sustainability despite the high importance placed on
sustainability education from different directions. This supports findings from previous studies,
which suggest that the level of inclusion of sustainability in the curricula appears to be low
(Azapagie et al., 2005; Cotgrave & Alkhaddar, 2006; Perera & Pearson, 2011; Ekundayo et al.,
2011). In the light of the above, it was suggested that there is the need for a framework for
embedding sustainability education in the curriculum.
Fukukawa et al. (2013) examines the implementation of ESD within a business school through
a case study approach. Similarly, Ekundayo et al. (2011) attempted to map sustainability
education to construction related curricula using a case study of quantity surveying degree
programme. Consequently, this led to the development of a sustainability framework relevant
to quantity surveying degree programme. The framework groups the sustainability-related
knowledge areas relevant to QS education into six main categories (such as background
knowledge and concept, policies and regulations, environmental issues, social issues, economic
issues, technology and innovation) with several subcategories. It is on this basis that this study
becomes imperative with a view to develop a framework for embedding sustainability
education into BE curriculum.
Sustainability is a global issue and human building activity has huge ramifications for current
and future generations. A truly sustainable project, which is economically viable, socially
acceptable and environmentally friendly, requires a concerted effort. Construction
194

595 © Lloyd Scott and Chris Gorse
professionals such as Architects, Quantity Surveyors and Project Managers, educated in BE
schools, are tasked with the responsibilities of designing, costing, constructing and managing
these structures. BE professionals thus have an important role to play in creating a healthy built
environment, juxtaposed within the natural habitat, which are affordable and accessible. To
this end, this research would be of great value and would eventually lead to the development
of a future paradigm for BE curriculum design.
RESEARCH METHODOLOGY
Previous research established that there is indeed a discourse and a gap on how the
sustainability issues are taught in built environment programmes in the UK. The current
research sought to develop a framework that satisfies the aspirations of the various
stakeholders (i.e. students, universities, professional bodies, industry, etc.). The main research
instrument used to achieve this include case studies. Detailed case studies of four universities,
which the authors have identified as A, B, C & D were used to generate a sustainability mapping
for the study.
The case studies include examination of four RICS accredited QS degree programmes. The
curricula of these programmes (module specifications, module handbooks, programme
specifications) were analysed to establish the common thread in all the programmes in the four
universities. The ensuing outcome of the analysis was then verified for accuracy and
consistency with programme directors and module tutors responsible for delivery of these
programmes and with some recommended industry liaison board members of the various
universities involved.
Case study uses a variety of data collection techniques, such as questionnaires, observations,
interviews and published documentary information etc. (Yin, 1994). The advantage of using this
method of data collection is that it takes into account the numerous literatures available by
narrowing down the scope in order to seek understanding of a particular phenomenon, which
is the aim of this study. The case study will be analysed from quantitative (i.e. descriptive
analysis) and theoretical point of view to create the sustainability mapping. The latter involves
searching-out of underlying themes in the materials being analysed and making critical
evaluation of the extracted themes (Bryman, 2008).
Case Studies
The four case studies selected were leading QS honours degree programmes in the UK all
accredited by the RICS. The QS undergraduate programme is either studied as BSc (Hons) Full
Time for 3 years full-time or 4 years sandwich. In Year 1, (otherwise known as Level 4), studies
focus on the principles of knowledge on which quantity surveying is based including
undertaking a UK-based residential field study visit. Year 2 (or Level 5) concentrates on the role
of the Quantity Surveyor in practice and prepares students for work in the optional placement
year. Students are strongly encouraged to undertake a placement year as it gives them the
opportunity to put into practice what they have learnt in the first 2 years of their study before
progressing onto the final year. In Final Year (otherwise referred to as Level 6), the broader role
of the Quantity Surveyor is investigated whilst further developing relevant academic skills and
undertaking an optional European-based residential study visit.
195

596 © Lloyd Scott and Chris Gorse
These four universities are the major providers of QS and construction related programmes and
training in the UK, therefore, their programmes have to be sound, up to date and at the fore
front of knowledge. This is critical if they are to maintain their absolute relevance well into the
future and to keep attracting applicants from within the UK and worldwide. The adequate
inclusion of sustainability education into their curriculum is of paramount importance to
produce graduates confident of taking care of the built and natural environments. It is therefore
necessary to examine the extent of coverage of sustainability within their QS curriculum, which
is the focus of this study.
Sustainability Mapping
Ekundayo et al. (2011) developed a sustainability framework (see figure 1), which identifies the
knowledge areas relevant to the QS degree programme and the profession. The framework,
developed based on current and future roles of the professional quantity surveyor as informed
by the sustainability agenda, categorises the sustainability-related knowledge areas relevant to
QS education into 6 main categories (high level categories) with several subcategories (low level
categories). The curricula (module specifications, module handbooks, programme
specifications) of the four universities were mapped against the sustainability framework to
evaluate the extent of coverage of sustainability education in these QS degree programmes.
Figure 1. Sustainability framework relevant to QS degree programme (Ekundayo et al., 2011)
RESEARCH RESULTS
The sustainability mapping of QS degree programmes, shown in figure 2, reflects the overall
coverage of depth and breadth of coverage of the sustainability issues within the four case
studies. The outcomes of the mapping illustrate how the sustainability issues are embedded in
196

597 © Lloyd Scott and Chris Gorse
the modules, specifications and the handbooks of the four case studies. As can be seen from
figure 2, all the pre-determined sustainability issues are present in all four universities,
however, how these attributes have been embedded are inconsistent across the four case
studies, and more alarmingly attainment often achieved in isolation, for instance through one
specific module. Rather than through a more considered and holistic curriculum design that
ensures sustainability and sustainable development are robustly addressed in contexts relevant
to the profession.
Figure 2. Sustainability mapping (high level categories) of QS degree programmes
DISCUSSION AND CONCLUSION
The quantitative results illustrate that the curriculum, at least in these four institutions,
emphasises technological and innovation aspects rather than broader sustainable development
issues and more than any other categories in the framework. While this is interesting, it is not
so surprising as subjects such as renewable energy technology, BIM, green supply chain
management and passive design methods among other things have become very popular and
central to the sustainability discourse. This finding is interesting because more than often,
sustainability-related literature (such as Spence & Mulligan, 1995; Azapagic et al., 2005; IPCC,
2014; Yilmaz & Bakis, 2015; Zaid et al., 2017) accord greater emphasis to the background
knowledge and concept subject areas as revealed in the literature.
As the mapping was done against QS degree programmes, it would also have been expected
that economic issues such as cost planning, value management, sustainable procurement
C
Technology and Innovation
Economic Issues
Social Issues B
Environmental Issues
Background Knowledge and Concept
Policies and Regulations
5.0% 4.5% 4.0% 3.5% 3.0% 2.5% 2.0% 1.5% 1.0% 0.5%
0.0% D
A
197

598 © Lloyd Scott and Chris Gorse
strategies, and whole-life appraisal be covered in the curriculum at a higher level than any other
sustainability issues in the framework. Nevertheless, this more or less emphasises the role of
technology and innovation in sustainability implementation. Also, technology is now often use
to enhance the role of a quantity surveyor. The somewhat disturbing part of the findings
however is that economic issues are covered at a relatively low level in some institutions, and
this cannot be right. Further investigation is thus required in this regard.
The coverage of environmental issues and policies and regulations in the curriculum is plausible
in the light of previous work and perspectives of proponents in the field such as Bell and Morse,
2008; Olsen and Fenhann, 2008; PrÜss-ÜstÜn, 2008 and David et al., 2013.
However, the very low coverage and emphasis on social issues is not so surprising.
Literature that discuss issues such as corporate social responsibility, ethical issues, equity and
social justice, cost benefit analysis and social assessment methods as an important part in the
sustainability discourse are rare. Consequently, this is reflected in the very low (and in some
cases non-existence) level of social issues in the QS curriculum.
Generally, the above findings support results from previous studies like Perera & Pearson
(2011) and Tan et al. (2017). Sustainability may be evident across only 0.5-4.5% of the curricula
of Quantity Surveying programmes, at least in these four institutions, and incorporated at a
basic level only. This is in spite of the need and relentless call for a framework for embedding
sustainability education in the curriculum as the literature review suggested (Azapagie et al.,
2005; Cotgrave & Alkhaddar, 2006; Ekundayo et al., 2011).
Professional institutions are increasingly placing more emphasis on broader issues of
sustainable development, and there have been explicit requirements of mapping BE curriculum
against addressing sustainable development issues. As such sustainable development should
be seen in such neat categories of competence areas as identified in the sustainability
framework. Understanding and addressing sustainable development is, however, a good
problem. Thus, this calls for multi-disciplinary and often innovative ways of teaching and
learning the ‘subject’. There needs to be some acknowledgement of this, and also progress
made especially in encouraging multidisciplinary approaches to education for sustainable
development. This research agrees with previous work (e.g. Ekundayo et al., 2011) that a
concerted effort across the disciplines is needed in order to integrate sustainability issues into
BE programmes. Including the views and input from other stakeholders such as students,
professional bodies and industry practitioners in this regard is also of paramount importance.
Findings from the literature review and relevant work previously discussed, as well as this study,
indicate that there are challenges to embedding sustainability in BE education. This study is
part of a larger research within the education for sustainable development, which aims at
diffusing sustainability into the curricula of BE programmes in UK universities. While this
research focussed mainly on mapping the inclusion of sustainability within the quantity
surveying curriculum, it is evident further investigation is now required to appraise the inclusion
of sustainability within other BE degree programmes. Furthermore, whilst the study identifies
the breadth and depth of sustainability-related materials within existing curriculum, future
research is needed to develop a modular framework for further integration of sustainability
198
599 © Lloyd Scott and Chris Gorse
education in BE programmes. The framework could serve as an evaluation and a benchmarking
tool for those who engage in developing the content of BE degree programmes, policy makers
and implementers, as well as industry players across all disciplines.
REFERENCES
Altomonte, S., Rutherford, P. and Wilson, R. (2014). Mapping the way forward: education for sustainability in architecture and urban design. Corporate Social Responsibility and Environmental Management, 21(3), 143-154.
Alwan, Z., Jones, P. and Holgate, P. (2017). Strategic sustainable development in the UK
construction industry, through the framework for strategic sustainable development, using
Building Information Modelling. Journal of Cleaner Production, 140(1), 349-358.
Azapagic, A., Perdan, S. and Shallcross, D. (2005). How much do engineering students know
about sustainable development? The findings of an international survey and possible
implications for the engineering curriculum. European Journal of Engineering Education,
30(1), 1-19.
Brennan, M.C. and Cotgrave, A.J. (2014) Sustainable development: A qualitative inquiry into the
current state of the UK construction industry. Structural Survey, 32(4), 315-330.
Brundtland Commission (1987). Report of the World Commission on Environment and Development: Our common future. Oxford University Press, UK.
Bryman, A. (2008). Social research methods. Third edition. Oxford University Press, UK.
Conte, E. (2016). Sustainability and Built Environment: The role of Higher Education in Architecture and Building Engineering. European Journal of Sustainable Development, 5(3) 110.
Cotgrave, A.J. and Kokkarinen, N. (2010). Developing a model promoting sustainability literacy
through construction curriculum design. Structural Survey, 28(4), 266-280.
Crofts, R. (1999). Sustainable development and environment: Delivering benefits globally,
nationally and locally. The Scottish Office for the Advisory Group on Sustainable Development
Occasional Paper No. 8.
David, K., Kruschwitz, N., Reeves, M. and Goh, E. (2013). The benefits of sustainability-driven
innovation. MIT Sloan Management Review, 54(2), 69-73.
Dixon, W. (2010). The impacts of construction and the built environment. Briefing Notes,
Willmott-dixon Group, UK.
Ekundayo, D., Zhou, L., Udeaja, C., Pearson, J. and Perera, S. (2011). Mapping of sustainability
education to construction related curricula: A case study of quantity surveying degree
programme. Proceedings of the RICS COBRA Research Conference, University of Salford,
UK, 12-13 September 2011, pp 698-707.
199
600 © Lloyd Scott and Chris Gorse
Fukukawa, K., Spicer, D., Burrows, S.A. and Fairbrass, J. (2013). Sustainable change: Education
for sustainable development in the business school. The Journal of Corporate Citizenship,
(49), 71-99.
Gan, X., Zuo, J., Ye, K., Skitmore, M. and Xiong, B. (2015). Why sustainable construction? Why
not? An owner's perspective. Habitat International, 47, 61-68.
Holdsworth, S. and Sandri, O. (2014). Sustainability Education and the Built Environment:
Experiences from the Classroom, Journal for Education in the Built Environment, 9(1), 48-
68.
IPCC (2014) Fifth assessment report (AR5) of the intergovernmental panel on climate change (IPCC). Cambridge: Cambridge University Press.
Iyer-Raniga, U. and Andamon, M.M. (2012). Sustainability education in the engineering and built environment curriculum: The case for Asia-Pacific. Fifth international conference of education, research and innovation (iCERI), 19-21.
Iyer-Raniga, U., Arcari, P. and Wong, J. (2010). Education for sustainability in the built environment: what are students telling us? In: Egbu, C. Proceedings of 26th Annual ARCOM Conference, Leeds, UK, 1-10.
Miller, T., Wiek, A., Sarewitz, D., Robinson, J. and Olsson, L. (2014). The future of sustainability
science: a solutions-oriented research agenda. Sustainability Science, 9(2), 239-246.
Olsen, K.H. and Fenhann, J. (2008). Sustainable development benefits of clean development
mechanism projects. A new methodology for sustainability assessment based on text
analysis of the project design documents submitted for validation. Energy Policy 36, 2819-
2830.
Perera, S. and Pearson, J. (2011). Alignment of professional, academic and industrial development needs for quantity surveyors: Post recession dynamics. RICS Education Trust funded research report.
Prüss-Üstün, A., Bos, R., Gore, F. and Bartram, J. (2008). Safer water, better health: costs, benefits and sustainability of interventions to protect and promote health. World Health Organization: Geneva.
Sev, A. (2009). How can the construction industry contribute to sustainable development? A
conceptual framework. Sustainable Development, 17(3), 161-173.
Simon, B. and Morse, S. (2008). Sustainability indicators: Measuring the immeasurable?
(Revised edition), Taylor and Francis: Abingdon.
Son, H., Kim, C., Chong, W.K. and Chou, J. (2011). Implementing sustainable development in the
construction industry: Constructors’ perspectives in the US and Korea. Sustainable
Development, 19(5), 337-347.
Spence, R. and Mulligan, H. (1995). Sustainable development and the construction industry.
Habitat International, 19(3), 279-292.
200
601 © Lloyd Scott and Chris Gorse
Sutrisna, M. and Rowe, A. (2012). Embedding sustainability into cross-disciplinary practice in
higher education: A case study of built environment and business. Paper presented at the
IADIS International Conference on Sustainability, Technology and Education, Perth,
Australia.
Tan, A., Udeaja, C., Babatunde, S.O. and Ekundayo, D. (2017). Sustainable development in a
construction related curriculum – quantity surveying students’ perspective. International
Journal of Strategic Property Management, 21(1), 101-113.
Tan, Y., Shen, L. and Yao, H. (2011). Sustainable construction practice and contractor’s
competitiveness: a preliminary study. Habitat International, 35, 225-230.
United Nations (2002). United Nations decade of education for sustainable development.
Resolution 57/254 adopted by the General Assembly.
Yilmaz, M. and Bakis, A. (2015). Sustainability in construction sector. Procedia - Social and
Behavioral Sciences, 195, 2253-2262.
Yin, R.K. (1994). Case study research: design and methods. Second edition. SAGE, London.
201

Analysis of the drivers andbenefits of BIM incorporation intoquantity surveying professionAcademia and students’ perspectives
Solomon Olusola BabatundeDepartment of Quantity Surveying, Obafemi Awolowo University,
Ile-Ife, Nigeria
Damilola EkundayoSchool of the Built Environment, University of Salford,
Greater Manchester, UK, and
Olubola Babalola and Jumoke Aduramigba JimohDepartment of Quantity Surveying, Obafemi Awolowo University,
Ile-Ife, Nigeria
AbstractPurpose – Building information modeling (BIM) inclusion in education pedagogy is crucial inpreparing skilled graduates for employment in the construction industry. Against this backdrop,studies on BIM education abound in architecture, engineering and construction (AEC) programmes inhigher education institutions (HEIs). However, there are limited empirical studies on BIM potentials inthe quantity surveying (QS) profession in HEIs, particularly in developing countries. The purpose ofthis study is to identify and assess the BIM drivers and benefits as important to the QS profession usingan empirical approach.
Design/methodology/approach – A comprehensive literature review was conducted to identify theBIM drivers and benefits in relation to the QS profession, which was used to design a questionnaire. Tocapture a broad perception, a questionnaire survey was carried out which targeted the academia andfinal year undergraduate students from two selected universities offering QS honour degreeprogrammes in Nigeria. Data collected were analysed using mean score, standard deviation and Mann–Whitney test.
Findings – The study identified 12 BIM drivers in relation to the QS profession and the analysis of theranking revealed that almost all the identified BIM drivers are considered by respondents as important.The study further identified 14 BIM benefits and the analysis of the ranking indicated that all theidentified BIM benefits are considered as important. The results of the Mann–Whitney test indicated aslight statistically significant difference, particularly in one of the selected universities on the ranking ofthe BIM drivers and benefits as important to the QS profession.
Practical implication – The findings of the study provide empirical evidence on the current perceptionsof the drivers and benefits of BIM to QS academia and students as they explore the concept for theadvancement of QS profession.
Originality/value – This study would provide practical insights to use BIM for QS practice. Also, thisstudy would contribute to improving the QS graduates and professional quantity surveyors understanding ofthe BIM knowledge applicable to QS profession.
Keywords Nigeria, BIM, Higher education institutions, Drivers, Quantity surveying
Paper type Research paper
JEDT16,5
750
Received 4 April 2018Revised 20 July 2018Accepted 31 July 2018
Journal of Engineering, Designand TechnologyVol. 16 No. 5, 2018pp. 750-766© EmeraldPublishingLimited1726-0531DOI 10.1108/JEDT-04-2018-0058
The current issue and full text archive of this journal is available on Emerald Insight at:www.emeraldinsight.com/1726-0531.htm
202

IntroductionBuilding information modelling (BIM) has been a growing trend in the constructionindustry, although BIM in some forms has existed over 20 years. Liu andHatipkarasulu (2014) described BIM as an emerging trend in the constructionindustry and a much-desired skill for Architecture, Engineering and Construction(AEC) students as they are preparing for their professional careers. Lee et al. (2013)described BIM as a process of creating an intelligent virtual model which integratesthe project data from design to construction and operation. Thus, it facilitates projectdocumentation, project quantification and estimation. Lee and Dossick (2012)asserted that BIM takes a major role during the design and construction phases of aproject, and there is a growing focus on the use of BIM for operations andmaintenance. For example, Young et al. (2009) found that about 50 per cent of theconstruction industry in the USA are using BIM and its adoption will increase thepositive returns from the use of BIM. BIM has become a central issue in theconstruction industry and many researchers currently explore the potential of BIM asa new ICT to improve productivity in the construction industry (Kim, 2012).
McGraw Hill (2010) reported that BIM inclusion in education pedagogy is crucial inpreparing skilled graduates for employment in the industry. This is affirmed by Han andBedrick (2015) that BIM adoption will suffer without its incorporation into education.Executing a BIM project requires new strands of expertise for all disciplines compared tomore traditional projects (Puolitaival and Forsythe, 2016). This creates an obvious need forAEC students to know more about BIM to be knowledgeable in an arising area of relevanceto both modern projects and the profession. Therefore, the incorporation of BIM in highereducation is not only served the increasing demand for BIM professionals but also producenew opportunities for students in their professional careers in the form of their ability todeal with new occupational challenges with high efficiency achieved by applying BIM(Wong et al., 2011).
The studies on BIM education abound in AEC programmes in higher educationinstitutions (HEIs) (Taylor et al., 2008; Clevenger et al., 2010; Lee and Dossick, 2012;Panuwatwanich et al., 2013; Sacks and Pikas, 2013; Shelbourn et al., 2017). Otherrelevant studies include Olawumi and Chan (2018) evaluated the perceived benefits ofintegrating BIM and sustainability practices in construction projects and authorsfound that the ability to enhance overall project quality and efficiency and improvethe ability to simulate building performances are the most important benefits. Wongand Yew (2017) investigated barriers to implementing BIM in quantity surveyingfirms in Sarawak, East Malaysia, and the authors found that high initial cost, lack oftraining and knowledge as the top ranked barriers. Ghaffarianhoseini et al. (2017)examined current benefits associated with the use of BIM and found that BIMdefinitive benefits have not been fully capitalized by industry stakeholders. Ali et al.(2015) developed BIM educational framework for quantity surveying students inMalaysia. In Nigeria, few studies have been conducted on the issues of BIMimplementation. For instance, Abdullahi et al. (2011) assessed the application of BIMin the Nigerian construction industry, and the authors found a low level of knowledgeof BIM in the Nigerian construction industry. Abubakar et al. (2013) examined thereadiness of building design firms to adopt BIM technologies and the study showedthat the design firms are very ready to implement BIM technologies in their practices.Abubakar et al. (2014) investigated the level of BIM awareness and barriers to itsadoption in the Nigerian construction industry from the contractors’ perspectives. Inspite of these previous studies, there is a limited occurrence of research into BIM
Drivers andbenefits of
BIMincorporation
751
203
potentials in the QS profession in HEIs (Fung et al., 2014). Also, prior studies thatconsidered BIM drivers and benefits into QS profession from perspectives ofacademia and students are not very common. Therefore, this study was guided by thefollowing derived objectives:
� identify the BIM drivers and benefits in relation to QS profession; and� assess the perceptions of the academic and students on the ranking of identified
BIM drivers and benefits in the order of perceived importance
It is anticipated that this study would contribute to improving the QS graduates andprofessional quantity surveyors understanding of the BIM knowledge applicable to QSprofession. Hence, this study would connect QS graduates more effectively to the industry.
Literature reviewBuilding information modelling drivers and benefits relating to quantity surveyingprofessionQuantity surveying (QS) is a profession that is well established in the BritishCommonwealth as being responsible for the management of cost and contracts in theconstruction industry (Pheng and Ming, 1997; Bowen et al., 2008; Ling and Chan, 2008). Theprofession is also known as construction economics in some European countries and in otherparts of the world. Further, the profession is term cost engineering in the North and SouthAmerica, China and some parts of Europe (Pathirage and Amaratunga, 2006; Smith, 2009).Due to the emergence of BIM, Ashworth and Hogg (2007) asserted that the traditional role ofquantity surveyors, which include estimating and cost planning, procurement advice,measurement, preparation of bills of quantities among others could be more effectively andefficiently achieved using BIM. This is affirmed by Olatunji et al. (2010) and Zhou et al.(2012) that BIM has the potential to remove mundane elements of traditional quantitysurveying, such as taking off and the production of bills of quantities, by automating orassisting in these tasks removing human error, increasing efficiency and promotingcollaboration. RICS (2011) reported that BIM enables the quantity surveyor to produce thebill of quantities in hours/days rather than weeks/months. This is supported by Whatmore(2012) that one of the key benefits of BIM is that it allows quantity surveyor to focus more onother value-adding services for their projects-rather than spending up to 80 per cent of theirtime measuring quantities.
It has been recognized that BIM has a high potential to inspire every aspect of thequantity surveying profession (Pittard, 2012). Hence, the quantity surveyors shouldfully embrace BIM to increase the cost-effectiveness and value of constructionprocesses. Olatunji et al. (2010) advocated the need for the full adoption of BIM acrossall disciplines. Therefore, it is important to understand the drivers for adopting BIM inquantity surveying practice. Thus, Table I indicates the selected drivers for BIMadoption in the quantity surveying profession.
It is important for the quantity surveyors to appreciate BIM, understand its potentialand develop effective processes to integrate BIM into their current practices (Cartlidge,2011). This is supported by Wu et al. (2014) that quantity surveyors should aware of theopportunities that BIM could bring in relation to their current and future roles.Therefore, Table II presents the selected BIM benefits relating to the quantitysurveying profession.
JEDT16,5
752
204

Table I.BIM drivers as
important to quantitysurveying profession
S/n BIM drivers Reference
1 Desire for innovation to remain competitive Ruikar et al., 2005; Eadie et al., 20132 Improving the capacity to provide whole life
value to clientAzhar, 2011; Deutsch, 2011; Eadie et al., 2013
3 Availability of trained staff (from academia andindustry) using BIM to teach the students
Macdonald, 2012; Badrinath et al., 2016
4 BIM software availability and affordability Macdonald, 2012; Eadie et al., 20135 Enabling environment-provision of IT
infrastructureOladapo, 2007
6 Cooperation and commitment of professionalbodies to its implementation
Oladapo, 2007; Becerik-Gerber et al., 2011
7 Government support through legislation Efficiency and Reform Group, 2011;buildingSMART Australasia, 2012; Eadie et al.,2013
8 Awareness of BIM tangible benefits National Building Specification (NBS) (2012)9 Strong support from university management
and industryBecerik-Gerber et al., 2011; Badrinath et al., 2016
10 Accreditation standards and requirements toguide the implementation of BIM within thecurriculum
Becerik-Gerber et al., 2011; Macdonald, 2012;Panuwatwanich et al., 2013; Badrinath et al.,2016;
11 Awareness of the IT among quantity surveyors Oladapo, 200712 Clients’ demand for the use BIM in their project Liu et al., 2010; Eadie et al., 2013
Table II.BIM benefits relating
to quantitysurveying profession
S/n BIM benefits Reference
1 BIM provides fast, effective and efficientquantity take-off and cost estimation
Aouad et al., 2007; Sabol, 2008; Cartlidge, 2011;Eastman et al., 2011; Zhou et al., 2012; Choi et al.,2014; Stanley and Thurnell, 2014
2 Produce reliable and accurate quantities as wellas competitive cost estimates
Azhar, 2011; Deutsch, 2011; Stanley andThurnell, 2014; Thurairajah and Goucher, 2013
3 It updates cost plans with more details as designis developed
Sylvester and Dietrich, 2010
4 It generates accurate cost estimates for variousdesign alternatives
Eadie et al., 2013; Thurairajah and Goucher,2013
5 Time savings in the preparation of estimatingcosts
Nassar, 2012; Bryde et al., 2013; Eadie et al.,2013; Wu et al., 2014
6 Reduction of requests for information Smith, 2014; Franco et al., 20157 Clash detection to reduce design errors Eadie et al., 2013; Fung et al., 2014; Franco et al.,
20158 Simplify cost checking and update Sylvester and Dietrich, 2010; Fung et al., 20149 Improved visualization for better understanding
of designs for measurement and minimizeomissions
Sylvester and Dietrich, 2010; Thurairajah andGoucher, 2013
10 Automatic quantification of BOQs preparation Aouad et al., 2007; Autodesk, 2012; Zhou et al.,2012
11 Data storage in central coordinated model Sylvester and Dietrich, 2010; Franco et al., 201512 Enhance communication and collaboration
amongst team membersShen and Issa, 2010; Efficiency and ReformGroup, 2011; Ahmad et al., 2012; Zhou et al.,2012; Bryde et al., 2013; Smith, 2014; Francoet al., 2015
13 Improve cost database management whichreduces loss of information
Shen and Issa, 2010; Bryde et al., 2013; Funget al., 2014
14 Rapid identification of design changes Azhar, 2011; Fung et al., 2014
Drivers andbenefits of
BIMincorporation
753
205
Existing studies have highlighted the reasons for integrating BIM into the QS profession(Sabol, 2008; Eastman et al., 2011). For instance, Thomas (2010) identified some reasons asfollows:
� 30 per cent of the projects do not meet the original programme or budget;� 37 per cent of materials used in construction become waste;� 10 per cent of the cost of a project is typically due to change orders; and� 38 per cent of carbon emissions are from buildings not cars.
Sabol (2008) described that during conventional (e.g. manual) project development,accurate, actionable costing information has been difficult to define during preliminaryproject phases. This process is prone to human error and tends to propagateinaccuracies. The quantification is time intensive, which requires 50 per cent to 80 percent of a cost estimator’s time on a project. However, the development of early costestimates is widely facilitated by BIM (Sabol, 2008). This is supported by Nagalingamet al. (2013) that BIM reduces the resources needed for a construction project and costsare saved on the reduction of resources. This is affirmed by Gier (2015) that BIM is ahelpful teaching tool for construction estimation, quantity take-off and highlycontribute to design comprehension skills and understanding of construction materials,methods and processes.
Research methodologyThe target population for this study comprised the academic staff and students in final yearat undergraduate level from two selected public federal universities in Southwestern Nigeriato include Obafemi Awolowo University, Ile-Ife, and the Federal University of Technology,Akure offering quantity surveying honours degree programmes. The basis for selectingonly this group (i.e. academics and students), for example, Perera et al. (2013) identified thekey stakeholders with influence on QS education and practice as academics, industry andprofessional bodies. Academic stakeholders were deliberately selected for this study due totheir accurate knowledge of QS programme and students in their final year were chosenbecause of their appreciation of the QS programme learning outcomes. Academics also playa significant role in designing and maintaining the curriculum used to teach QS students(Perera et al., 2017). This study established the drivers and benefits of BIM incorporationinto quantity surveying by evaluating academic and student perceptions. A similarapproach was adopted in a construction-related research conducted (Ekundayo et al., 2011;Tan et al., 2017). In addition, this approached was similar to previous studies on BIMeducation. For instance, Clevenger et al. (2010) administered questionnaires to studentswhen exploring the incorporation of BIM into the construction management curriculum.Hedayati et al. (2015) surveyed both the students and lecturers when exploring the obstaclesto implementing BIM in the educational system. Abbas et al. (2016) sampled only academicstaff when exploring the current state of BIM in the construction management programmeat the engineering universities in Pakistan.
The rationales for selecting these two universities are as follows:(1) The universities are the leading universities offering quantity surveying honours
degree programmes in Southwestern Nigeria.(2) Their QS programmes are fully accredited by both the National Universities
Commission and the Quantity Surveyors Registration Board of Nigeria.
JEDT16,5
754
206
(3) They have the highest number of quantity surveying students’ enrolment atundergraduate study. This study adopted a literature review and questionnairesurvey, which are detailed as follows.
Literature reviewAn extensive literature review was conducted to identify the BIM drivers and benefits asimportant to the QS profession. These were identified from the significant literature. Theoutcome of the literature review produced 12 BIM drivers and 14 BIM benefits relating to theQS profession (see Tables I and II for details). These were used to design the questionnairesurvey. This is, therefore, form the basis of inquiry for the data collection and analysis.
Questionnaire surveyThe data for the study were collected through the administration of questionnaires to both theacademic staff and final year students from the two selected universities to include quantitysurveying department at Obafemi Awolowo University (OAU), Ile-Ife and quantity surveyingdepartment at the Federal University of Technology Akure (FUTA). The total number ofacademic staff in the quantity surveying department from the two universities is 39 academicstaff comprised 13 academic staff at OAU and 26 academic staff at FUTA. Due to the smallsample size of the academic staff from both universities, the entire 39 academic staff weresampled. Out of which 27 completed responses were received comprising ten responses fromOAU and 17 responses from FUTA. Similarly, in 2016/2017 academic session, the total numberof final year undergraduate students in the quantity surveying department from the twouniversities was 161 students comprised 62 students at OAU and 99 students at FUTA. A totalof 81 students were randomly selected to include 31 students at OAU and 50 students atFUTA. The survey received 28 completed responses from OAU and 45 completed responsesfrom FUTA. This resulting in a total of 73 fully completed responses from students. The highresponse rate obtained in this studywas due to the fact that the questionnaires were distributedface-to-face (i.e. hand delivery) and follow-up through telephone contacts and text messages arecarried out to remind the respondents to complete the questionnaires.
The questionnaire designed for the study was structured and multiple-choice type. Thequestions were asked on a five-point Likert scale with 5 being the highest of the rating. Areliability test using Statistical Package for the Social Sciences (SPSS) was conducted. Theresult indicated the reliability coefficient values of Cronbach’s alpha 0.901 and 0.890 forthe BIM drivers and benefits, respectively. These Cronbach’s alpha values signifying thatthe questionnaire used for the study is reliable and indicates evidence of good internalconsistency. This is corroborated by George and Mallery (2003) that Cronbach’s alpha valueof greater than 0.6 is considered acceptable. This is affirmed by Pallant (2007, 2010) that thevalue for Cronbach’s alpha should be higher than 0.7 for the scale to be reliable. In thisstudy, both the descriptive and inferential statistics were conducted for the analysis. Thedescriptive statistics techniques used include the mean score and standard deviation. Themean score was used for the ranking of identified BIM drivers and benefits relating toquantity surveying practice. Also, the inferential statistics used was the Mann–Whitneytest. This is supported by Field and Miles (2012), and Field (2013), which stated that theMann–Whitney test was based on ranked data. In addition, Fellows and Liu (2008) assertedthat the Mann–Whitney test is used when there are two samples. Therefore, the Mann–Whitney test was conducted in this study to determine whether there is a statisticallysignificant difference in the ranking of the identified BIM drivers and benefits between theacademic staff and students. TheMann–Whitney test was undertaken at a significance level
Drivers andbenefits of
BIMincorporation
755
207
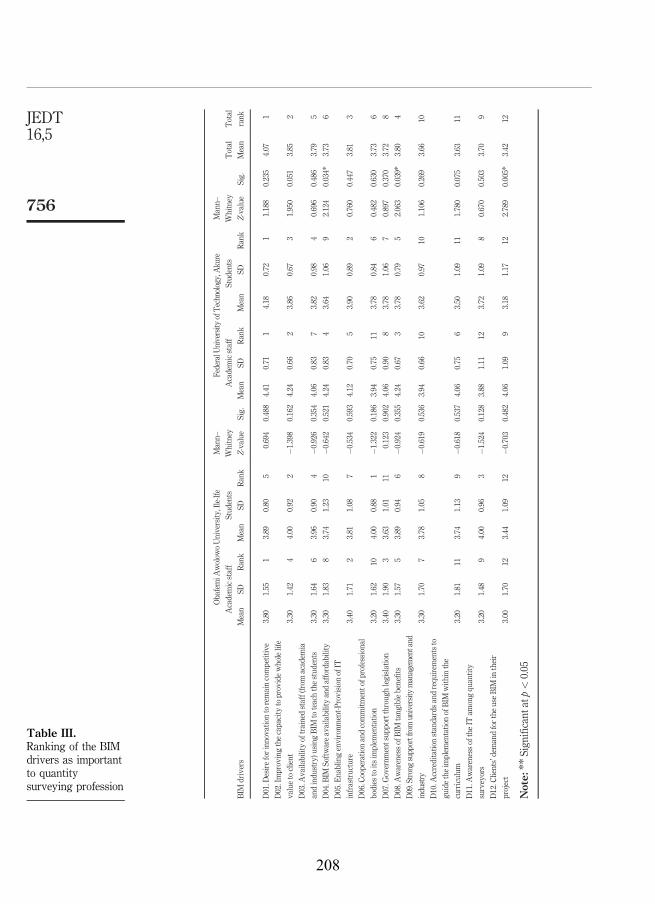
BIM
drivers
ObafemiA
wolow
oUniversity
,Ile-Ife
Mann–
Whitney
Z-value
Sig.
FederalU
niversity
ofTechnology,Akure
Mann–
Whitney
Z-value
Sig.
Total
Mean
Total
rank
Academicstaff
Stud
ents
Academicstaff
Stud
ents
Mean
SDRank
Mean
SDRank
Mean
SDRank
Mean
SDRank
D01.D
esireforinn
ovationto
remaincompetitive
3.80
1.55
13.89
0.80
50.694
0.488
4.41
0.71
14.18
0.72
11.188
0.235
4.07
1
D02.Improvingthecapacity
toprovidewholelife
valueto
client
3.30
1.42
44.00
0.92
2�1
.398
0.162
4.24
0.66
23.86
0.67
31.950
0.051
3.85
2
D03.A
vailabilityof
trainedstaff(from
academ
ia
andindu
stry)u
sing
BIM
toteachthestud
ents
3.30
1.64
63.96
0.90
4�0
.926
0.354
4.06
0.83
73.82
0.98
40.696
0.486
3.79
5
D04.B
IMSoftwareavailabilityandaffordability
3.30
1.83
83.74
1.23
10�0
.642
0.521
4.24
0.83
43.64
1.06
92.124
0.034*
3.73
6
D05.E
nablingenvironm
ent-P
rovision
ofIT
infrastructure
3.40
1.71
23.81
1.08
7�0
.534
0.593
4.12
0.70
53.90
0.89
20.760
0.447
3.81
3
D06.Cooperatio
nandcommitm
ento
fprofessional
bodies
toits
implem
entatio
n3.20
1.62
104.00
0.88
1�1
.322
0.186
3.94
0.75
113.78
0.84
60.482
0.630
3.73
6
D07.G
overnm
entsup
portthroug
hlegislation
3.40
1.90
33.63
1.01
110.123
0.902
4.06
0.90
83.78
1.06
70.897
0.370
3.72
8
D08.A
warenessof
BIM
tang
iblebenefits
3.30
1.57
53.89
0.94
6�0
.924
0.355
4.24
0.67
33.78
0.79
52.063
0.039*
3.80
4
D09.Strongsupportfromuniversity
managem
entand
industry
3.30
1.70
73.78
1.05
8�0
.619
0.536
3.94
0.66
103.62
0.97
101.106
0.269
3.66
10
D10.A
ccreditatio
nstandardsandrequ
irem
entsto
guidetheim
plem
entatio
nof
BIM
with
inthe
curriculum
3.20
1.81
113.74
1.13
9�0
.618
0.537
4.06
0.75
63.50
1.09
111.780
0.075
3.63
11
D11.A
warenessof
theIT
amongqu
antity
surveyors
3.20
1.48
94.00
0.96
3�1
.524
0.128
3.88
1.11
123.72
1.09
80.670
0.503
3.70
9
D12.Clients’demandforthe
useBIM
intheir
project
3.00
1.70
123.44
1.09
12�0
.703
0.482
4.06
1.09
93.18
1.17
122.789
0.005*
3.42
12
Note:**
Sign
ificant
atp<0.05
Table III.Ranking of the BIMdrivers as importantto quantitysurveying profession
JEDT16,5
756
208

BIM
benefits
ObafemiA
wolow
oUniversity,Ile-Ife
Mann–
Whitney
Z-value
Sig.
FederalU
niversity
ofTechn
ology,Aku
reMann–
Whitney
Z-value
Sig.
Total
Mean
Total
rank
Academicstaff
Stud
ents
Academicstaff
Stud
ents
Mean
SDRank
Mean
SDRank
Mean
SDRank
Mean
SDRank
B01.B
IMprovides
fast,effectiv
eand
efficientq
uantity
take-offandcost
estim
ation
3.90
1.10
54.52
0.70
1�1
.994
0.046
4.53
0.51
24.40
0.73
10.379
0.705
4.34
1B02.P
rodu
cereliableandaccurate
quantitiesas
wellascompetitivecost
estim
ates
3.90
1.20
64.30
0.82
3�0
.902
0.367
4.59
0.51
14.00
0.64
23.218
0.001*
4.20
3B03.Itu
pdates
costplanswith
moredetails
asdesign
isdeveloped
3.84
1.20
84.04
0.85
8�0
.036
0.971
4.12
0.99
103.92
0.63
51.625
0.104
3.98
7B04.Itg
enerates
accuratecostestim
ates
for
variousdesign
alternatives
4.00
1.15
34.11
0.80
50.1100.912
4.24
0.66
73.78
0.71
132.245
0.025
4.03
6B05.T
imesaving
sin
thepreparationof
estim
atingcosts
3.85
1.20
74.33
0.73
2�0
.983
0.326
4.29
0.59
54.00
0.88
31.115
0.265
4.12
5B06.R
eductio
nof
requ
estsforinformation
3.80
1.32
103.74
0.98
130.5340.593
3.76
0.83
133.88
0.82
7�0
.477
0.633
3.80
13B07.C
lash
detectionto
redu
cedesign
errors
3.80
1.40
113.81
0.92
120.4160.678
3.71
1.16
143.74
0.75
140.420
0.674
3.77
14B08.Sim
plify
costchecking
andup
date
3.70
1.16
134.00
0.78
10�0
.596
0.551
4.12
0.49
93.94
0.82
40.714
0.475
3.94
9B09.Improved
visualizationforb
etter
understand
ingof
design
sform
easurement
andminim
izeom
issions
3.70
1.33
144.07
0.96
7�0
.667
0.505
4.12
1.90
113.82
0.92
121.146
0.252
3.92
11B10.A
utom
aticqu
antifi
catio
nof
BOQs
preparation
3.80
1.55
124.04
1.02
9�0
.054
0.957
4.06
0.75
123.82
0.77
111.038
0.299
3.93
10B11.D
atastorageincentralcoordinated
model
3.80
1.23
93.85
1.10
11�0
.036
0.971
4.29
0.77
63.84
0.93
101.752
0.080
3.95
8B12.E
nhance
commun
icationand
collaboratio
nam
ongstteammem
bers
4.30
1.34
14.07
0.78
61.4070.159
4.47
0.72
43.88
0.87
82.467
0.014*
4.18
4B13.Improvecostdatabase
managem
ent
which
redu
cesloss
ofinform
ation
4.20
1.23
24.22
0.89
40.2780.781
4.53
0.62
33.92
0.88
62.563
0.010*
4.22
2B14.R
apid
identifi
catio
nof
design
changes
4.00
1.25
43.56
1.09
141.3500.177
4.18
0.64
83.86
0.93
91.225
0.221
3.90
12
Note:**
Sign
ificant
atp<0.05
Table IV.Ranking of the BIMbenefits as important
to quantitysurveying profession
Drivers andbenefits of
BIMincorporation
757
209
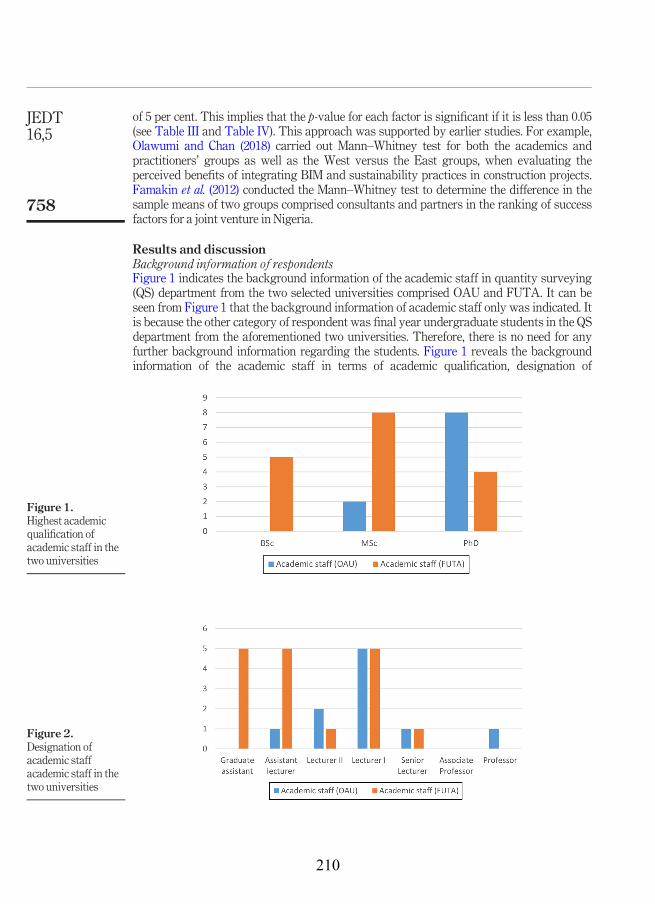
of 5 per cent. This implies that the p-value for each factor is significant if it is less than 0.05(see Table III and Table IV). This approach was supported by earlier studies. For example,Olawumi and Chan (2018) carried out Mann–Whitney test for both the academics andpractitioners’ groups as well as the West versus the East groups, when evaluating theperceived benefits of integrating BIM and sustainability practices in construction projects.Famakin et al. (2012) conducted the Mann–Whitney test to determine the difference in thesample means of two groups comprised consultants and partners in the ranking of successfactors for a joint venture in Nigeria.
Results and discussionBackground information of respondentsFigure 1 indicates the background information of the academic staff in quantity surveying(QS) department from the two selected universities comprised OAU and FUTA. It can beseen from Figure 1 that the background information of academic staff only was indicated. Itis because the other category of respondent was final year undergraduate students in the QSdepartment from the aforementioned two universities. Therefore, there is no need for anyfurther background information regarding the students. Figure 1 reveals the backgroundinformation of the academic staff in terms of academic qualification, designation of
Figure 1.Highest academicqualification ofacademic staff in thetwo universities
Figure 2.Designation ofacademic staffacademic staff in thetwo universities
JEDT16,5
758
210

academic staff and year of service as an academic staff undertaken by the respondents in thetwo selected universities. The academic qualifications of respondents revealed that themajority of the respondents had PhD, followed Master’s Degree. It can also be seen fromFigure 1 that the designation of the respondents cut across the academic staff cadre in auniversity (see Figures 1-3 for details).
Ranking of the building information modelling drivers in the order of perceived importanceto quantity surveying professionTable III indicates the ranking for each of the 12 identified BIM drivers from two differentgroups comprised academic staff and students in the two selected universities. Based on afive-point Likert scale, an attribute was deemed important if it had a mean value of 3.5 ormore (Badu et al., 2012; Babatunde et al., 2016). In each two group ranking, given two ormore identified factors (see Table III) with the same mean value, the one with the loweststandard deviation was assigned highest importance ranking (Field, 2005). In addition,based on the total ranking, the identified factors that have the same total mean values weregiven the same rank (see Table III). The analysis of the ranking in terms of the total meanscore values for the 12 identified BIM drivers ranging from 3.42 to 4.07, this indicates thatalmost all the identified BIM drivers are considered by respondents as important. Forinstance, it can be seen from Table III that 11 (out of 12) identified BIM drivers had totalmean values between 3.63 and 4.07, which are considered as important drivers for the BIMimplementation by the respondents. Also, as shown in Table III, the top five ranked BIMdrivers are: desire for innovation to remain competitive; improving the capacity to providewhole life value to client; enabling environment-provision of IT infrastructure; awareness ofBIM tangible benefits; and availability of trained staff from academia and industry withtheir total mean values of 4.07, 3.85, 3.81, 3.80 and 3.79, respectively.
The only factor that ranked least was clients’ demand for the use of BIM in their projectwith the total mean value of 3.42 (see Table III). This is not surprising because the adoptionof BIM is still at the infant stage in the Nigerian construction industry and the majority ofthe clients comprised public and private clients are not fully aware of BIM benefits, as it isdifficult to find the completed projects where BIMwas used in Nigeria. This study finding isin contrast with previous studies, particularly in the UK and Australia. For instance, in theUK and Australia, the government is widely cited as the key driving force for BIM adoption.For example, both the UK and Australia governments have set a target of 2016 forcompulsory BIM use on public sector projects (BuildingSMART Australasia, 2012; Eadieet al., 2013). In addition, National Building Specification (NBS) (2012) reported that from the
Figure 3.Year of service as
academic staff in thetwo universities
Drivers andbenefits of
BIMincorporation
759
211
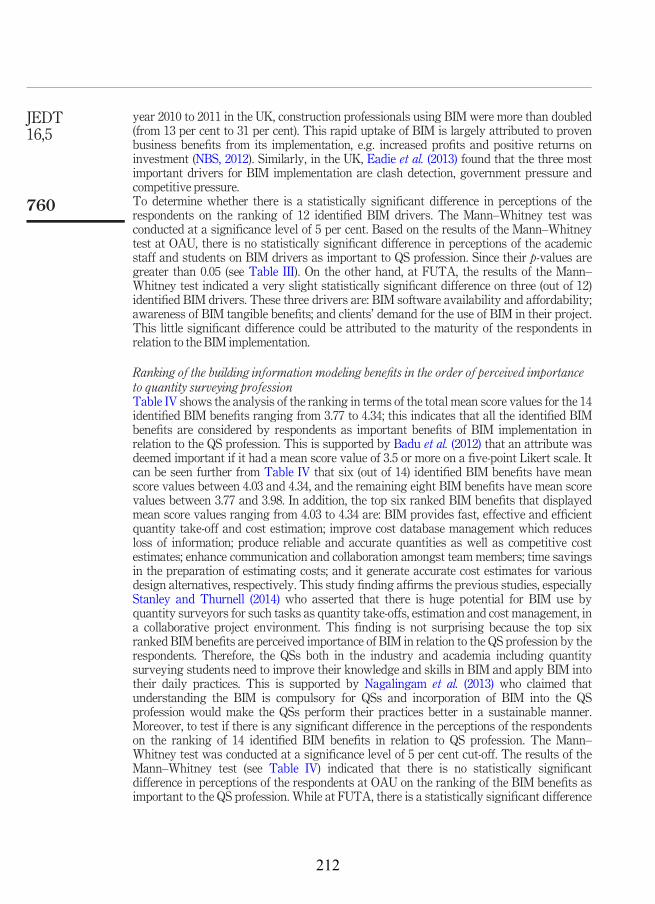
year 2010 to 2011 in the UK, construction professionals using BIM were more than doubled(from 13 per cent to 31 per cent). This rapid uptake of BIM is largely attributed to provenbusiness benefits from its implementation, e.g. increased profits and positive returns oninvestment (NBS, 2012). Similarly, in the UK, Eadie et al. (2013) found that the three mostimportant drivers for BIM implementation are clash detection, government pressure andcompetitive pressure.To determine whether there is a statistically significant difference in perceptions of therespondents on the ranking of 12 identified BIM drivers. The Mann–Whitney test wasconducted at a significance level of 5 per cent. Based on the results of the Mann–Whitneytest at OAU, there is no statistically significant difference in perceptions of the academicstaff and students on BIM drivers as important to QS profession. Since their p-values aregreater than 0.05 (see Table III). On the other hand, at FUTA, the results of the Mann–Whitney test indicated a very slight statistically significant difference on three (out of 12)identified BIM drivers. These three drivers are: BIM software availability and affordability;awareness of BIM tangible benefits; and clients’ demand for the use of BIM in their project.This little significant difference could be attributed to the maturity of the respondents inrelation to the BIM implementation.
Ranking of the building information modeling benefits in the order of perceived importanceto quantity surveying professionTable IV shows the analysis of the ranking in terms of the total mean score values for the 14identified BIM benefits ranging from 3.77 to 4.34; this indicates that all the identified BIMbenefits are considered by respondents as important benefits of BIM implementation inrelation to the QS profession. This is supported by Badu et al. (2012) that an attribute wasdeemed important if it had a mean score value of 3.5 or more on a five-point Likert scale. Itcan be seen further from Table IV that six (out of 14) identified BIM benefits have meanscore values between 4.03 and 4.34, and the remaining eight BIM benefits have mean scorevalues between 3.77 and 3.98. In addition, the top six ranked BIM benefits that displayedmean score values ranging from 4.03 to 4.34 are: BIM provides fast, effective and efficientquantity take-off and cost estimation; improve cost database management which reducesloss of information; produce reliable and accurate quantities as well as competitive costestimates; enhance communication and collaboration amongst team members; time savingsin the preparation of estimating costs; and it generate accurate cost estimates for variousdesign alternatives, respectively. This study finding affirms the previous studies, especiallyStanley and Thurnell (2014) who asserted that there is huge potential for BIM use byquantity surveyors for such tasks as quantity take-offs, estimation and cost management, ina collaborative project environment. This finding is not surprising because the top sixranked BIM benefits are perceived importance of BIM in relation to the QS profession by therespondents. Therefore, the QSs both in the industry and academia including quantitysurveying students need to improve their knowledge and skills in BIM and apply BIM intotheir daily practices. This is supported by Nagalingam et al. (2013) who claimed thatunderstanding the BIM is compulsory for QSs and incorporation of BIM into the QSprofession would make the QSs perform their practices better in a sustainable manner.Moreover, to test if there is any significant difference in the perceptions of the respondentson the ranking of 14 identified BIM benefits in relation to QS profession. The Mann–Whitney test was conducted at a significance level of 5 per cent cut-off. The results of theMann–Whitney test (see Table IV) indicated that there is no statistically significantdifference in perceptions of the respondents at OAU on the ranking of the BIM benefits asimportant to the QS profession. While at FUTA, there is a statistically significant difference
JEDT16,5
760
212

on three (out of 14) identified BIM benefits in relation to the QS profession. Since theirp-values are less than 0.05 (see Table IV for details).
ConclusionsThis study provided empirical evidence on the current perceptions of the drivers andbenefits of BIM implementation in relation to the QS profession. The study identified 12 BIMdrivers and the analysis of the ranking in terms of the total mean score values for the 12identified BIM drivers indicated that almost all the identified BIM drivers areconsidered by respondents as important. The study further revealed the top five rankedBIM drivers as follows: the desire for innovation to remain competitive; improving thecapacity to provide whole life value to the client; enabling environment-provision of ITinfrastructure; awareness of BIM tangible benefits; and availability of trained stafffrom academia and industry, respectively. The only factor that ranked least was clients’demand for the use of BIM in their project. This is not surprising because the adoptionof BIM is still at an infant stage in the Nigerian construction industry and the majorityof the clients comprised public and private clients are not fully aware of BIM benefits,as it is difficult to find the completed projects where BIM was used in Nigeria. Thisstudy finding is in contrast with previous studies, particularly in the UK and Australia,where the government is widely cited as the key driving force for BIM adoption.
Similarly, the study identified 14 BIM benefits and the analysis of the ranking in termsof the total mean score values indicated that all the identified BIM benefits are consideredby respondents as important benefits for the BIM implementation in relation to the QSprofession. In addition, the top six ranked BIM benefits that displayed mean score valuesranging from 4.03 to 4.34 are: BIM provides fast, effective and efficient quantity take-offand cost estimation; improve cost database management which reduces loss ofinformation; produce reliable and accurate quantities as well as competitive costestimates; enhance communication and collaboration amongst team members; timesavings in the preparation of estimating costs; and it generate accurate cost estimates forvarious design alternatives, respectively. This study finding affirms the previous studiesthat alluded to the huge potential for BIM use by quantity surveyors for such tasks asquantity take-offs, estimation and cost management, in a collaborative projectenvironment. Therefore, the QSs both in the industry and academia including quantitysurveying students need to improve their knowledge and skills in BIM and apply BIMinto their daily practices. Hence, understanding the BIM is compulsory for QSs andincorporation of BIM into the QS profession would make the QSs perform their practicesbetter in a sustainable manner.
In addition, the results of the Mann–Whitney test were conducted on both the BIMdrivers and benefits as important to the QS profession. The result indicated that there wasno statistically significant difference in perceptions of the respondents at OAU. While atFUTA, a very slight statistically significant difference was found. This could be attributedto the lived experience of the respondents and their familiarity with quantity surveyingpractice in the industry. This study is not without limitations. For instance, the respondentsconsidered in this study were academic and final year undergraduate students, consideringrespondents from the industry would have enhanced the credibility of the findings. Also, theuse of questionnaire survey allows a large sample to be captured, other methods such asinterviews might have been conducted to complement questionnaire survey with a view torevealing the country-specific BIM drivers and benefits as important to the QS profession,which may enrich the findings. However, the findings of this study provide useful insightsabout BIM to the QS professionals and students as they explore the concept for the
Drivers andbenefits of
BIMincorporation
761
213
advancement of the QS profession. Also, this study contributes to improving the QSgraduates and professional quantity surveyors understanding of the BIM knowledgeapplicable to the QS profession; thereby enable the QS understands the benefits of BIM totheir role. Further studies should be conducted in other countries to derive the specificcountry’s BIM drivers and benefits as important to the QS profession.
ReferencesAbbas, A., Din, Z. and Farooqui, R. (2016), “Integration of BIM in construction management
education: an overview of Pakistani engineering universities”, Procedia Engineering,Vol. 145, pp. 151-157.
Abdullahi, M., Ibrahim, Y.M. and Mohammed, S.M. (2011), “Assessment of the application of buildinginformation modelling in Nigerian construction industry”, Paper Presented at the InternationalConference and Home-Coming of the Department of Building, Ahmadu Bello University, Zaria.
Abubakar, M., Ibrahim, Y.M. and Bala, K. (2013), “Readiness of Nigerian building design firms to adoptBIM technologies”, Paper Presented at the 5th International Conference on ConstrictionsEngineering and Project Management (ICCEPM), Anaheim, CA.
Abubakar, M., Ibrahim, Y.M., Bala, K. and Kado, D. (2014), “Contractors perception of the barriers anddrivers of building information modelling (BIM) adoption in the Nigerian construction industry”,paper presented at the International Conference on Computing in Civil and Building Engineering(ICCCBE), ASCE, FL.
Ahmad, M.A., Demian, P., Price, A.D.F., (2012), “BIM implementation plans: a comparative analysis”,in. and Smith, S.D. (Ed.), proceedings 28th Annual ARCOM Conference, 3-5 September 2012,Edinburgh,UK. Association of Researchers in ConstructionManagement, pp. 33-42.
Ali, K.N., Mustaffa, N.E., Keat, Q.J. and Enegbuma, W.I. (2015), “Building information modelling (BIM)educational framework for quantity surveying students: the Malaysian perspective”, Journal ofInformation Technology in Construction (ITcon), Vol. 21, pp. 140-151.
Aouad, G., Wu, S. and Lee, A. (2007), “Advanced technology for quantity surveying”, Proceedings of theQuantity Surveyors International Convention, 4th- 5th September, International IslamicUniversity,Malaysia, pp. 313-322.
Ashworth, A. and Hogg, K. (2007),Willis’s Practice and Procedure for the Quantity Surveyor, BlackwellPublishing, Oxford.
Autodesk (2012), “How revit structure benefits the construction estimator”, available at: www.augi.com/library/how-revitstructure-benefits-the-construction-estimator (accessed 20March 2018).
Azhar, S. (2011), “Building information modelling (BIM): trends, benefits, risks, and challenges for theAEC industry”, Leadership andManagement in Engineering, Vol. 11 No. 3, pp. 241-252.
Babatunde, S.O., Perera, S., Zhou, L. and Udeaja, C. (2016), “Stakeholder perceptions on critical successfactors for public-private partnership projects in Nigeria”, Built Environment Project and AssetManagement, Vol. 6 No. 1, pp. 74-91.
Badrinath, A.C., Chang, Y.T. and Hsieh, S.H. (2016), “A review of tertiary BIM education for advancedengineering communication with visualization”, Visualization in Engineering, Vol. 4 No. 1,pp. 9-17.
Badu, E., Edwards, D.J., Owusu-Manu, D. and Brown, D.M. (2012), “Barriers to the implementation ofinnovative financing (IF) of infrastructure”, Journal of Financial Management of Property andConstruction, Vol. 17 No. 3, pp. 253-273.
Becerik-Gerber, B., Gerber, D.J. and Ku, K. (2011), “The pace of technological innovation in architecture,engineering, and construction education: integrating recent trends into the curricula”, Journal ofInformation Technology in Construction, Vol. 16, pp. 411-432.
JEDT16,5
762
214
Bowen, P., Cattell, K., Distiller, G. and Edwards, P.J. (2008), “Job satisfaction of South African quantitysurveyors: an empirical study”, Construction Management and Economics, Vol. 26 No. 7,pp. 765-800.
Bryde, D., Broquetas, M. and Volm, J.M. (2013), “The project benefits of building information modelling(BIM)”, International Journal of Project Management, Vol. 31 No. 7, pp. 971-980.
buildingSMART Australasia (2012), “National building informationmodelling initiative report”, availableat: www.innovation.gov.au/Industry/BuildingandConstruction/BEIIC/Documents/NBIMIReport.pdf(accessed 20March 2018).
Cartlidge, D. (2011),NewAspects of Quantity Surveying Practice, Spon Press, Oxon.Clevenger, C., Ozbek, M., Glick, S. and Porter, D. (2010), “Integrating BIM into construction
management education”, EcoBuild Conference Proceedings, EcoBuild 2010 BIM AcademicForum,Washington, DC D.C. pp. 6-10.
Choi, J. Kim, H. and Kim, I. (2014), “Open BIM-based quantity takeoff system for schematic estimationof building frame in early design stage”, available at: www.sciencedirect.com/science/article/pii/S2288430014000037 (accessed 20March 2018).
Deutsch, R. (2011), BIM and Integrated Design, JohnWiley and Sons, Hoboken.Eadie, R., Odeyinka, H., Browne, M., McKeown, C. and Yohanis, M. (2013), “An analysis of the drivers
for adopting building information modelling”, Journal of Information Technology inConstruction (ITcon), Vol. 18, pp. 338-352.
Eastman, C., Teicholz, P., Sacks, R. and Liston, K. (2011), BIM Handbook: A Guide to BuildingInformationModelling, JohnWiley and Sons, NJ.
Efficiency and Reform Group (ERG) (2011),Government Construction Strategy, Cabinet Office, London.Ekundayo, D., Zhou, L., Udeaja, C., Pearson, J. and Perera, S. (2011), “Mapping of sustainability
education to construction related curricula: a case study of quantity surveying degreeprogramme”, Proceedings of the RICS COBRA Research Conference, University of Salford, 12-13September, pp. 698-707.
Famakin, I.O., Aje, I.O. and Ogunsemi, D.R. (2012), “Assessment of success factors for joint ventureconstruction projects in Nigeria”, Journal of Financial Management of Property andConstruction, Vol. 17 No. 2, pp. 153-165.
Field, A. (2005),Discovering Statistics Using SPSS, Sage, London.Fellows, R.R. and Liu, A. (2008), ResearchMethods for Construction, Wiley-Blackwell Science, London.Field, A. andMiles, J. (2012),Discovering Statistics Using SAS, Sage, London.Field, A. (2013),Discovering Statistics Using IBMSPSS Statistics, Sage, London.Franco, J., Mahdi, F. and Abaza, H. (2015), “Using building information modelling (BIM) for
estimating and scheduling, adoption barriers”, Universal Journal of Management, Vol. 3No. 9, pp. 376-384.
Fung, W.P., Salleh, H. and Rahim, F.A.M. (2014), “Capability of building information modellingapplication in quantity surveying practice”, Journal of Surveying, Construction and Property,Vol. 5 No. 1, pp. 1-13.
George, D. and Mallery, P. (2003), SPSS for Windows Step by Step: A Simple Guide and Reference 11.0Update, Allyn and Bacon, Boston, MA.
Ghaffarianhoseini, A., Tookey, J., Ghaffarianhoseini, A., Naismith, N., Azhar, S., Efimova, O. andRaahemifar, K. (2017), “Building information modelling (BIM) uptake: clear benefits,understanding its implementation, risks and challenges”, Renewable and Sustainable EnergyReviews, Vol. 75, pp. 1046-1053.
Han, H. and Bedrick, J. (2015), “BIM education in asean: the demand for BIM practitioners”, 9th BIMAcademic Symposium and Job Task Analysis Review, 7-8 April,Washington, DC.
Drivers andbenefits of
BIMincorporation
763
215
Hedayati, A., Mohandes, S.R. and Preece, C. (2015), “Studying the obstacles to implementing BIM ineducational system and making some recommendations”, Journal of Basic Applied ScienceResearch, Vol. 5 No. 3, pp. 29-35.
Kim, J.L. (2012), “Use of BIM for effective visualization teaching approach in constructioneducation”, Journal of Professional Issues in Engineering Education and Practice, Vol. 138No. 3, pp. 214-223.
Lee, N. and Dossick, C.S. (2012), “Leveraging building information modelling technology inconstruction engineering and management education”, proceedings of 119th ASEE AnnualConference, San Antonio, 10-13th June, San Antonio:ASEE.
Lee, N., Dossick, C.S. and Foley, S.P. (2013), “Guideline for building information modelling inconstruction engineering and management education”, Journal of Professional Issues inEngineering Education and Practice, Vol. 139 No. 4, pp. 266-274.
Ling, F.Y.Y. and Chan, A.H.M. (2008), “Internationalising quantity surveying services”, Engineering,Construction and ArchitecturalManagement, Vol. 15 No. 5, pp. 440-455.
Liu, R., Issa, R. and Olbina, S. (2010), “Factors influencing the adoption of building informationmodelling in the AEC industry”, in Proceedings of the International Conference on Computing inCivil and Building Engineering, University of Nottingham, available at: www.engineering.nottingham.ac.uk/icccbe/proceedings/pdf/pf70.pdf (accessed 20March 2018).
Liu, R. and Hatipkarasulu, Y. (2014), “Introducing building information modelling course into a newlydeveloped construction program with various student backgrounds”, in Proceedings of 121stASEEAnnual Conference and Exposition. Indianapolis,ASEE, IN.
Macdonald, J.A. (2012), “A framework for collaborative BIM education across the AEC disciplines”,proceedings of AUBEA 2012, Sydney, Australia, 4-6th July, pp. 223-230.
McGraw Hill (2010), The Business Value of BIM in Europe: getting Building Information Modelling tothe Bottom Line in the United Kingdom, France and Germany, McGraw-Hill, Bedford.
Nagalingam, G., Jayasena, H.S. and Ranadewa, K.A.T.O. (2013), “Building information modelling andfuture quantity surveyor’s practice in Sri Lankan construction industry”, The Second WorldConstruction Symposium 2013: Socio-Economic Sustainability in Construction, 14-15 June 2013,Colombo, pp. 81-92.
Nassar, K. (2012), “Assessing building informationmodelling estimating techniques using data from the classroom”,Journal ofProfessional Issues inEngineeringEducationandPractice, Vol. 138No. 3, pp. 171-180.
National Building Specification (NBS) (2012),National BIMReport 2012, RIBA Enterprises, London.
Oladapo, A.A. (2007), “An investigation into the use of ICT in the Nigerian construction industry”,Journal of Information Technology in Construction (ITcon), Vol. 24 No. 1, pp. 261-277.
Olatunji, O.A., Sher, W. and Gu, N. (2010), “Building information modelling and quantity surveyingpractice”, Emirates Journals for Engineering Research, Vol. 15 No. 1, pp. 67-70.
Olawumi, T.O. and Chan, D.W.M. (2018), “Identifying and prioritizing the benefits of integrating BIMand sustainability practices in construction projects: a Delphi survey of international experts”,Sustainable Cities and Society, Vol. 40, pp. 16-27.
Pallant, J. (2007) SPSS Survival Manual: A Step by Step Guide to Data Analysis using SPSS forWindows, Open University Press, Berkshire.
Pallant, J. (2010) SPSS Survival Manual: A Step By Step Guide to Data Analysis Using SPSS ForWindows, McGraw-Hill, New York, NY.
Panuwatwanich, K., Wong, M., Doh, J., Stewart, R.A. and McCarthy, T.J. (2013), “Integrating buildinginformation modelling (BIM) into engineering education: an exploratory study of industryperceptions using social network data”, In C. Lemckert, G. Jenkins and S. Lemckert (Eds.),AAEE2013: Australasian Association for Engineering Education Conference, Griffith School ofEngineering, Griffith University, Australia, pp. 1-9.
JEDT16,5
764
216

Pathirage, C.P. and Amaratunga, R.D.G. (2006), “A vision for the quantity surveying education in the21st century: United Kingdom perspective”, in edited by Rameezdeen, R. and Seneviratne, I.,(Eds) Customising the Quantity Surveying Education, Department of Building Economics,University of Moratuwa, Sri Lanka, pp.23-32.
Perera, S., Pearson, J., Ekundayo, D. and Zhou, L. (2013), “Professional, academic and industrialdevelopment needs: a competency mapping and expert opinion review”, International Journal ofStrategic PropertyManagement, Vol. 17 No. 2, pp. 143-160.
Perera, S., Babatunde, S.O., Zhou, L., Pearson, J. and Ekundayo, D. (2017), “Competency mappingframework for regulating professionally oriented degree programmes in higher education”,Studies in Higher Education, Vol. 42 No. 12, pp. 2316-2342.
Pheng, L.S. and Ming, K.H. (1997), “Formulating a strategic marketing mix for quantity surveyors”,Marketing Intelligence and Planning, Vol. 15 No. 6, pp. 273-280.
Pittard, S. (2012), “What is BIM?”, available at http://fat.glam.ac.uk/media/files/documents/ (accessed25March, 2018).
Puolitaival, T. and Forsythe, P. (2016), “Practical challenges of BIM education”, Structural Survey,Vol. 34 Nos 4/5, pp. 351-366.
RICS (2011), “BIM report BCIS”, available at www.RICS_BIM_Survey.co.uk. (accessed 25March 2018).Ruikar, K., Anumba, C. and Carrillo, P. (2005), “End-user perspectives on use of project extranets in
construction organisations”, Engineering, Construction and Architectural Management, Vol. 12No. 3, pp. 222-235.
Sabol, L. (2008), “Challenges in cost estimating with building information modelling”, available at: www.dcstrategies.net/files/2_sabol_cost_estimating.pdf (accessed: 4August 2017).
Sacks, R. and Pikas, E. (2013), “Building information modelling education for construction engineeringand management. I: Industry requirements, state of the art, and gap analysis”, Journal ofConstruction Engineering andManagement, Vol. 139 No. 11, pp. 05013002.
Shelbourn, M., Macdonald, J., McCuen, T. and Lee, S. (2017), “Students perceptions of BIM education inthe higher education sector a UK and USA perspective”, Industry and Higher Education, Vol. 31No. 5, pp. 293-304.
Shen, Z. and Issa, R.R.A. (2010), “Quantitative evaluation of the BIM-assisted construction detailed costestimates”, Journal of Information Technology in Construction, Vol. 15, pp. 234-257.
Smith, P. (2009), “Trends in the Australian quantity surveying profession: 1995-2008”, proceedings of the13th Pacific Association of Quantity Surveyors Congress (PAQS),Kuala Lumpur, August 17-18.
Smith, P. (2014), “BIM and the 5D project cost manager”, Procedia - Social and Behavioural Sciences, 119(Selected papers from the 27th IPMA (International Project Management Association), WorldCongress, Dubrovnik, Croatia, pp. 475-484.
Stanley, R. and Thurnell, D. (2014), “The benefits of, and barriers to, implementation of 5D BIM forquantity surveying in New Zealand”, Australasian Journal of Construction Economics andBuilding, Vol. 14 No. 1, pp. 105-117.
Sylvester, K.E. and Dietrich, C. (2010), “Evaluation of building information modelling (BIM) estimatingmethods in construction education”, in 46th ASC Annual International Conference ProceedingsAssociated Schools of Construction Boston,MA.
Tan, A., Udeaja, C., Babatunde, S.O. and Ekundayo, D. (2017), “Sustainable development in aconstruction related curriculum – quantity surveying students’ perspective”, InternationalJournal of Strategic Property Management, Vol. 21 No. 1, pp. 101-113.
Taylor, J.M., Liu, J. and Hein, M.F. (2008), “Integration of building information modelling (BIM) into anACCE accredited construction management curriculum”, proceedings of the International 44thAnnual Conference Associated Schools of Construction, April 2-5.
Thomas, K. (2010) Innovation and Growth Team Report, Northumbria University, UK.
Drivers andbenefits of
BIMincorporation
765
217
Thurairajah, N. and Goucher, D. (2013), “Advantages and challenges of using BIM: a cost consultant’sperspective”, in 49th ASCAnnual International Conference Proceedings.
Whatmore, L. (2012), “Adding value”, RICS Construction Journal, Vol. 18 No. 19, The BIM Edition, Feb-March 2012.
Wong, K.A., Wong, K.F. and Nadeem, A. (2011), “Building information modelling for tertiaryconstruction education in Hong Kong”, Journal of Information Technology in Construction,Vol. 16, pp. 467-476.
Wong, S. and Yew, U. (2017), “Barriers in implementing building information modelling in quantitysurveying firms”, Proceedings for the 21st Annual Pacific Association of Quantity SurveyorsCongress (PAQS 2017) July 24-25,Vancouver, BC, pp. 24-29.
Wu, S., Wood, G., Ginige, K. and Jong, S.W. (2014), “A technical review of BIM based cost estimating inthe UK quantity surveying practice, standards and tools”, Journal of Information Technology inConstruction (ITcon), Vol. 19, pp. 534-563.
Young, N.W., Jones, S.A., Bernstein, H.M. and Gudgel, J.E. (2009), The Business Value of BIM: GettingBuilding Information Modelling to the Bottom Line, McGraw-Hill Construction SmartMarketReport, New York, NY.
Zhou, L., Perera, S., Udeaja, C. and Paul, C. (2012), “Readiness of BIM: a case study of a quantitysurveying organisation”, in First UK Academic Conference on BIM, 5-9 September 2012,Northumbria University,Newcastle-upon-Tyne, UK.
Further readingPallant, J. (2010), SPSS Survival Manual: A Step by Step Guide to Data Analysis Using SPSS for
Windows, McGraw-Hill, New York, NY.
Corresponding authorSolomon Olusola Babatunde can be contacted at: [email protected]
For instructions on how to order reprints of this article, please visit our website:www.emeraldgrouppublishing.com/licensing/reprints.htmOr contact us for further details: [email protected]
JEDT16,5
766
218
Barriers to the incorporation ofBIM into quantity surveying
undergraduate curriculum in theNigerian universities
Solomon Olusola BabatundeFaculty of Engineering and the Built Environment, University of Johannesburg,
Johannesburg, South Africa, and
Damilola EkundayoSchool of the Built Environment, University of Salford, Salford, UK
AbstractPurpose – In developing countries, adoption of building information modelling (BIM) concept within thearchitecture, engineering and construction (AEC) curricula in universities is a relatively new effort, andsubsequently, studies on the status of BIM implementation in universities are rare. This study, therefore,becomes imperative with a view to identifying and examining the barriers to the incorporation of BIM intoquantity surveying (QS) undergraduate curriculum in Nigerian universities.Design/methodology/approach – The study adopted a questionnaire survey, which was targeted at theacademia and students from two selected universities offering QS honours degree programme. Data collectedwere analysed usingmean score, Mann–Whitney test and factor analysis.Findings – The study identified 30 barriers, and the analysis of the ranking revealed that 17 (out of 30)identified barriers were considered as the most serious barriers. The study, through factor analysis, groupedthe 30 identified barriers into six major factors.Practical implications – The findings provide greater insights and empirical evidence on the majorbarriers to implementation of BIM education in developing countries.Originality/value – The identified barriers are relevant not only to QS education but also to other relateddisciplines within the AEC context. These findings would be of great value to academic staff and universitymanagement board to develop strategies for incorporating BIM into AEC disciplines curricula in developingcountries at large.
Keywords Higher education, BIM, Curriculum, Developing countries, Barriers, Quantity surveying
Paper type Research paper
IntroductionBuilding information modelling (BIM) has been widely acknowledged as an emergingtechnological and procedural shift within the architecture, engineering and construction(AEC) industry (Panuwatwanich et al., 2013). There is a growing demand for highereducation institutions (HEIs) to incorporate BIM into their construction education degreescurricula, in this case for quantity surveying (QS) honours degree programmes to equip newgraduates with such knowledge and preparing QS graduates for more employment in theindustry. This is aligned with the observation by Keraminiyage and Lill (2013) thatstudying at HEIs is a primary mode of knowledge and skills enhancement for constructionprofessionals. This is affirmed by Perera et al. (2017) that updating of knowledge and skillsfor construction graduates becomes imperative and it is a clarion call for those responsible
Incorporationof BIM
629
Received 17 October 2018Revised 23 January 2019
Accepted 8 February 2019
Journal of Engineering, Designand Technology
Vol. 17 No. 3, 2019pp. 629-648
© EmeraldPublishingLimited1726-0531
DOI 10.1108/JEDT-10-2018-0181
The current issue and full text archive of this journal is available on Emerald Insight at:www.emeraldinsight.com/1726-0531.htm
219
for programme development in HEIs to be on the lookout for appropriate areas of expansion,innovation and adjust where possible to changing professional needs. It is on this premisethat a number of universities around the world are offering courses for various BIMapplications.
Existing studies have reported the adoption of BIM technologies in many developedcountries such as USA, UK, Australia, The Netherlands, Singapore, Hong Kong and NewZealand (Isikdag and Underwood, 2010; Wong et al., 2011) with impressive outcomes,despite some challenges to the adoption of BIM. Olatunji et al. (2010) advocated for the fulladoption of BIM technologies across all disciplines. This is supported by Han and Bedrick(2015) that BIM adoption will suffer without its incorporation into education. Therefore, it isimportant for HEIs to incorporate BIM into their programmes with the support fromgovernment and industry (NATSPEC, 2013). This will ensure a continuous production ofBIM-ready graduates and prepared the graduates for more employment in the industry. It isagainst this backdrop that the UK Government mandated that all public building projectsare required to use BIM from the year 2016 (McGough et al., 2013; Eadie et al., 2015). Due tothis reason and to satisfy the AEC industry requirements, many of the UK universities havestarted integrating BIM concept into AEC education (Abbas et al., 2016). For instance,Adamu and Thorpe (2015) identified that some UK universities such as WestminsterUniversity, Middlesex, Salford, Liverpool (in London), the University of West of England,Northumbria University and the University of South Wales are already offering severalBIM-related courses in their AEC programmes.
In the USA, Sacks and Pikas (2013) indicated that very few of the universities haveincorporated BIM content into their AEC curricula. Some of these universities include AuburnUniversity, Philadelphia University, University of Washington, University of Arkansas atLittle, University of Southern California, MT State University and Purdue University. Othercountries like Australia, New Zealand and Hong Kong have also dealt with the integrationprocess of BIM into AEC curricula in some of their universities. Therefore, it is evident that anumber of universities worldwide are offering courses for various BIM applications withinAEC programmes, while several others are under the process of integrating BIM into theircurricula. In Nigeria, however, adoption of BIM concept in universities AEC curricula is arelatively new effort and studies on the status of BIM implementation in universities are notvery common. For instance, similar previous studies include that by Babatunde et al. (2018),who focused on the drivers and benefits of BIM incorporation into QS profession in Nigeria.The study found that understanding the BIM is compulsory for QS and incorporation of BIMinto the QS profession would make the quantity surveyors perform their practices better in asustainable manner. However, the study does not pay attention to the factors preventing theNigerian universities from incorporating BIM into their AEC curricula unlike some universitiesin the developed countries. It is on this premise that this study becomes imperative with a viewto identifying and examining the barriers to the incorporation of BIM into AEC curricula, inthis case for QS undergraduate curriculum in the Nigerian Universities. The findings of thisstudy would be of great value to academic staff and university management boards to developpractices for incorporating BIM concept into the QS curriculum in Nigeria and developingcountries at large.
Literature reviewBuilding information modelling in quantity surveying professionQS is a profession that is well established in the British Commonwealth as beingresponsible for the management of cost and contracts in the construction industry(Pheng and Ming, 1997; Bowen et al., 2008; Ling and Chan, 2008). The profession is also
JEDT17,3
630
220

known as construction economics in Europe and cost engineering in the USA and partsof Asia (Pathirage and Amaratunga, 2006; Smith, 2009). Traditionally, the role ofquantity surveyors is primarily associated with estimating and cost planning,procurement advice, measurement, preparation of bills of quantities, tenderdocumentation, construction cost control and preparation of valuations, contractualclaims and final accounts (Ashworth and Hogg, 2007). Following the emergence of BIM,some of the aforementioned quantity surveyor roles could be achieved through BIMmore efficiently (Ashworth and Hogg, 2007; Wu et al., 2014). Therefore, it is importantfor quantity surveyors to appreciate BIM, understand its potential, and developeffective processes to integrate BIM into their current practices (Cartlidge, 2011).
Existing studies in this area have highlighted the reasons of integrating BIM into the QSprofession (Sabol, 2008; Eastman et al., 2011). For instance, Thomas (2010) identified somereasons such as: 30 per cent of the projects do not meet original programme or budget; 37 percent of materials used in construction become waste; 10 per cent of the cost of a project istypically due to change orders; and 38 per cent of carbon emissions are from buildings notcars. Sabol (2008) described that during conventional (e.g. manual) project development,accurate, actionable costing information has been difficult to define during preliminaryproject phases. This process is prone to human error and tends to propagate inaccuracies.The quantification is time-intensive, and it requires 50 per cent to 80 per cent of a costestimator’s time on a project. However, the development of early cost estimates is widelyfacilitated by BIM (Sabol, 2008). This is supported by Nagalingam et al. (2013) who aversthat BIM reduces the resources needed for a construction project and costs are saved on thereduction of resources. This is affirmed by Gier (2015) that BIM is a helpful teaching tool forconstruction estimation, quantity take-off and highly contribute to design comprehensionskills and understanding of construction materials, methods, and processes.
State of building information modelling in the Nigerian construction industryThere is very little evidence that BIM is widespread in the Nigerian construction industry,and this is evident in the lack of literature precisely on the subject. Conversely, a number ofstudies have examined the uptake of information and communications technology (ICT) byconstruction professionals in Nigeria and the challenges to its implementation in practice.However, the review of extant literature revealed that some improvements are required toconstruction education as regards BIM implementation. According to Oladapo (2006, 2007),the main uses of ICT in the industry are word processing, internet communications, costingand work scheduling. Ibironke et al. (2011) examined the current state and use of ICT byquantity surveyors in Nigeria. The research revealed that despite the awareness of theimportance of ICT in improving service delivery and productivity, the level of adoption byquantity surveyors in Nigeria is still very low and BIM tools such as Auto Cad, Revit,Master Bill, QS Cad,Win QS and CATO are yet to be fully exploited.
Musa et al. (2010) concluded that harnessing appropriate ICT tools would improve thequality of QS services in the country. In addition, several other studies have buttressed thisassertion (Ibironke et al., 2011; Olanrewaju, 2016; Dada and Musa, 2016; Dada, 2017). Thereis a clear-cut evidence that ICT has numerous benefits but the implementation in practice isone of a different story in the Nigerian construction sector (Oladapo, 2006; Waziri et al.,2015). Perhaps we should look to the providers of construction-related education in Nigeriato instil students with increasing awareness of BIM. Conversely, it may be that there aregenuine and important barriers to the incorporation of ICT, especially BIM, into HEIcurricula. In the current era, the need for value-added services, complexity of modernconstruction infrastructure and on-time delivery of projects are few of the factors
Incorporationof BIM
631
221

necessitating the use of modern ICT as a viable tool to improve the quality of QS services.Although a limited number of construction firms in Nigeria have been adopting and usingbasic ICT for their services since late 1980s (Musa et al., 2010), the use and benefits of BIMhas not been fully realised in the sector as a whole (Ikediashi and Ogwueleka, 2016). Itbecomes pertinent therefore to explore the minimal uptake of BIM in the Nigerian AECsector. This is the focus of this study. It established empirical barriers to implementation ofBIM education in Nigerian higher education programmes.
Barriers to building information modelling incorporation into curricula in higher educationinstitutionsThere is no known conclusive empirical study on barriers to the incorporation of BIM intoQS education in Nigeria. Therefore, the research offers a fresh understanding aroundwhat ishappening in the Nigerian AEC sector as regards BIM implementation and the challenges ofits integration into construction curriculum not only in Nigeria but also elsewhere. Whilesome of the barriers to BIM implementation are common; others are peculiar to Nigeria as adeveloping nation. Despite the fact that progress has been made in incorporating BIM intoAEC curricula, particularly in developed countries such as the USA, the UK, Australia, NewZealand, Hong Kong and Singapore. The extant literature revealed the challenges ofintegrating BIM into the undergraduate curriculum, which are presented in Table I.
While reports abound on BIM education in the construction industry of developedcountries, very little exists for developing countries such as Nigeria. This study thereforeseeks to examine the barriers to the implementation of BIM education in Nigeria in thecontext of a developing economy. The constraints to the use of modern ICT in Nigeria,which this study focuses on include insufficient/irregular power supply, high cost of ICThardware and software, low job order for firms, fear of virus attacks and high rate ofobsolescence of ICT hardware and software amongst others (Oladapo, 2007). Musa et al.(2010) identified the lack of ICT infrastructural facilities, power supply in the country,education and training as some of the reasons limiting the uptake of BIM tools in practice.Other proponents in the field (Waziri et al., 2015; Dada, 2017) agreed that education andtraining are paramount to developing quantity surveyors’ ICT skills and knowledge andcontinuous professional development. Dada and Musa (2016) argued that educationaltraining can be considered an integral part of organisation learning, change and skilldevelopment. In general, a review of the existing literature of ICT adoption in Nigeriarevealed shortcomings in BIM implementation and education in comparison with what isobtained globally. In the light of the above, Dada (2017) opined that there is need tounderstand the identified gap in construction education provided by relevant stakeholders,especially the academic institutions offering QS programmes in Nigeria.
In developing countries such as Nigeria, adoption of BIM concept in universities AECcurricula is relatively a new effort and studies on the status of BIM implementation inacademia are not very common (Alkalbani et al., 2012; Olanrewaju, 2016). While the abovestudies have provided useful insights into the current state of ICT in the Nigerianconstruction industry and barriers to its implementation in practice, none has investigatedthe barriers to the implementation of BIM education in Nigerian HEIs. It is on this premisethat this study becomes imperative with a view to identifying and examining the barriers tothe incorporation of BIM into AEC curricula, in this case for QS undergraduate curriculumin the Nigerian universities. This was not done in previous studies. For the Nigerianquantity surveyors to attain the required competence standard in BIM practice, BIMeducation is crucial (Dada and Musa, 2016), and the barriers to its implementation in QSprogrammes need to be explored.
JEDT17,3
632
222
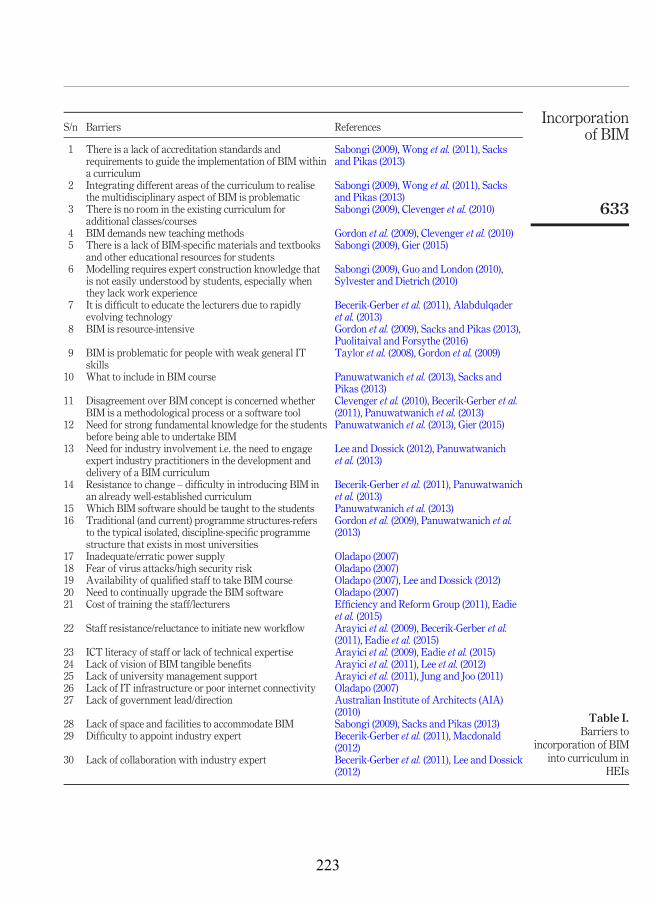
Table I.Barriers to
incorporation of BIMinto curriculum in
HEIs
S/n Barriers References
1 There is a lack of accreditation standards andrequirements to guide the implementation of BIM withina curriculum
Sabongi (2009), Wong et al. (2011), Sacksand Pikas (2013)
2 Integrating different areas of the curriculum to realisethe multidisciplinary aspect of BIM is problematic
Sabongi (2009), Wong et al. (2011), Sacksand Pikas (2013)
3 There is no room in the existing curriculum foradditional classes/courses
Sabongi (2009), Clevenger et al. (2010)
4 BIM demands new teaching methods Gordon et al. (2009), Clevenger et al. (2010)5 There is a lack of BIM-specific materials and textbooks
and other educational resources for studentsSabongi (2009), Gier (2015)
6 Modelling requires expert construction knowledge thatis not easily understood by students, especially whenthey lack work experience
Sabongi (2009), Guo and London (2010),Sylvester and Dietrich (2010)
7 It is difficult to educate the lecturers due to rapidlyevolving technology
Becerik-Gerber et al. (2011), Alabdulqaderet al. (2013)
8 BIM is resource-intensive Gordon et al. (2009), Sacks and Pikas (2013),Puolitaival and Forsythe (2016)
9 BIM is problematic for people with weak general ITskills
Taylor et al. (2008), Gordon et al. (2009)
10 What to include in BIM course Panuwatwanich et al. (2013), Sacks andPikas (2013)
11 Disagreement over BIM concept is concerned whetherBIM is a methodological process or a software tool
Clevenger et al. (2010), Becerik-Gerber et al.(2011), Panuwatwanich et al. (2013)
12 Need for strong fundamental knowledge for the studentsbefore being able to undertake BIM
Panuwatwanich et al. (2013), Gier (2015)
13 Need for industry involvement i.e. the need to engageexpert industry practitioners in the development anddelivery of a BIM curriculum
Lee and Dossick (2012), Panuwatwanichet al. (2013)
14 Resistance to change – difficulty in introducing BIM inan already well-established curriculum
Becerik-Gerber et al. (2011), Panuwatwanichet al. (2013)
15 Which BIM software should be taught to the students Panuwatwanich et al. (2013)16 Traditional (and current) programme structures-refers
to the typical isolated, discipline-specific programmestructure that exists in most universities
Gordon et al. (2009), Panuwatwanich et al.(2013)
17 Inadequate/erratic power supply Oladapo (2007)18 Fear of virus attacks/high security risk Oladapo (2007)19 Availability of qualified staff to take BIM course Oladapo (2007), Lee and Dossick (2012)20 Need to continually upgrade the BIM software Oladapo (2007)21 Cost of training the staff/lecturers Efficiency and Reform Group (2011), Eadie
et al. (2015)22 Staff resistance/reluctance to initiate new workflow Arayici et al. (2009), Becerik-Gerber et al.
(2011), Eadie et al. (2015)23 ICT literacy of staff or lack of technical expertise Arayici et al. (2009), Eadie et al. (2015)24 Lack of vision of BIM tangible benefits Arayici et al. (2011), Lee et al. (2012)25 Lack of university management support Arayici et al. (2011), Jung and Joo (2011)26 Lack of IT infrastructure or poor internet connectivity Oladapo (2007)27 Lack of government lead/direction Australian Institute of Architects (AIA)
(2010)28 Lack of space and facilities to accommodate BIM Sabongi (2009), Sacks and Pikas (2013)29 Difficulty to appoint industry expert Becerik-Gerber et al. (2011), Macdonald
(2012)30 Lack of collaboration with industry expert Becerik-Gerber et al. (2011), Lee and Dossick
(2012)
Incorporationof BIM
633
223

Research methodologyPrevious studies conducted on the integration of BIM within the AEC curricula surveyedbetween one and three key stakeholders to include the academic staff, students andprofessionals within AEC industry. For example, Clevenger et al. (2010) administeredquestionnaires to students when exploring the incorporation of BIM into the constructionmanagement curriculum. Hedayati et al. (2015) surveyed both the students and lecturerswhen exploring the obstacles to implementing BIM in educational system. Abbas et al.(2016) sampled only academic staff (i.e. faculty members) when assessing the current stateof BIM into the construction management programme within the engineering universities inPakistan. Also, few studies adopted literature review (Lee and Dossick, 2012; Elinwa andAgboola, 2013). Therefore, this study adopted a literature review, a desk review and twoquestionnaire surveys of academia and students within the case studies of two selectedpublic federal universities in southwestern Nigeria, Obafemi Awolowo University (OAU),Ile-Ife, and the Federal University of Technology Akure (FUTA), that offer QS honoursdegree programmes in Nigeria. The rationales for selecting these two universities are asfollows:
� They are the leading universities offering QS honours degree programmes for overthree decades in southwestern Nigeria.
� Their QS programmes are fully accredited by both the National UniversitiesCommission and the Quantity Surveyors Registration Board of Nigeria.
� They have the highest number of QS students’ enrolment at undergraduate study.� They already have a dedicated QS software packages laboratory for teaching
students measurement and estimating.
The methodology adopted for this study comprised a literature review, desk review, and twosurveys of academia and students, which are detailed as follows.
Literature reviewAn extensive literature review was carried out to identify the various barriers to theincorporation of BIM into the AEC programmes in HEIs. These were identified from thesignificant literature. Thus, the outcome of literature review produced 30 barriers (seeTable I for details).
Desk reviewThe identified 30 barriers from the literature review were subjected to a desk review whichcomprised three academia in the QS Department at OAU, Ile-Ife, Nigeria. These threeselected academia are actively involved in teaching students dedicated QS software formeasurement and estimating (QS CAD, Masterbill Elite, Ripac, etc.) at undergraduate study.The three selected academia have vast experience of QS softwares and their applications.Thus, the feedback obtained from these three academia informed the development of theacademia and student questionnaire surveys. This, therefore forms the basis of inquiry forthe data collection and analysis.
Survey of the academiaThe identified barriers from the literature and desk review formed the basis of the surveyquestionnaire. The academic survey is one of the two surveys conducted in the case studiescomprised two selected universities to include QS Department at OAU, Ile-Ife, and QSDepartment at FUTA. The total number of academic staff in the QS department from the
JEDT17,3
634
224
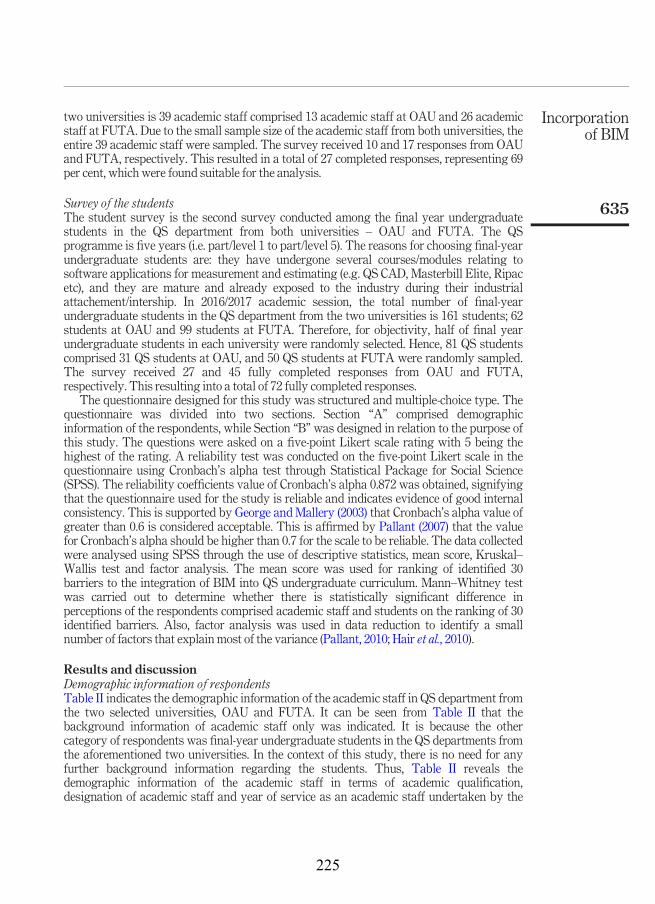
two universities is 39 academic staff comprised 13 academic staff at OAU and 26 academicstaff at FUTA. Due to the small sample size of the academic staff from both universities, theentire 39 academic staff were sampled. The survey received 10 and 17 responses from OAUand FUTA, respectively. This resulted in a total of 27 completed responses, representing 69per cent, which were found suitable for the analysis.
Survey of the studentsThe student survey is the second survey conducted among the final year undergraduatestudents in the QS department from both universities – OAU and FUTA. The QSprogramme is five years (i.e. part/level 1 to part/level 5). The reasons for choosing final-yearundergraduate students are: they have undergone several courses/modules relating tosoftware applications for measurement and estimating (e.g. QS CAD, Masterbill Elite, Ripacetc), and they are mature and already exposed to the industry during their industrialattachement/intership. In 2016/2017 academic session, the total number of final-yearundergraduate students in the QS department from the two universities is 161 students; 62students at OAU and 99 students at FUTA. Therefore, for objectivity, half of final yearundergraduate students in each university were randomly selected. Hence, 81 QS studentscomprised 31 QS students at OAU, and 50 QS students at FUTA were randomly sampled.The survey received 27 and 45 fully completed responses from OAU and FUTA,respectively. This resulting into a total of 72 fully completed responses.
The questionnaire designed for this study was structured and multiple-choice type. Thequestionnaire was divided into two sections. Section “A” comprised demographicinformation of the respondents, while Section “B” was designed in relation to the purpose ofthis study. The questions were asked on a five-point Likert scale rating with 5 being thehighest of the rating. A reliability test was conducted on the five-point Likert scale in thequestionnaire using Cronbach’s alpha test through Statistical Package for Social Science(SPSS). The reliability coefficients value of Cronbach’s alpha 0.872 was obtained, signifyingthat the questionnaire used for the study is reliable and indicates evidence of good internalconsistency. This is supported by George and Mallery (2003) that Cronbach’s alpha value ofgreater than 0.6 is considered acceptable. This is affirmed by Pallant (2007) that the valuefor Cronbach’s alpha should be higher than 0.7 for the scale to be reliable. The data collectedwere analysed using SPSS through the use of descriptive statistics, mean score, Kruskal–Wallis test and factor analysis. The mean score was used for ranking of identified 30barriers to the integration of BIM into QS undergraduate curriculum. Mann–Whitney testwas carried out to determine whether there is statistically significant difference inperceptions of the respondents comprised academic staff and students on the ranking of 30identified barriers. Also, factor analysis was used in data reduction to identify a smallnumber of factors that explain most of the variance (Pallant, 2010; Hair et al., 2010).
Results and discussionDemographic information of respondentsTable II indicates the demographic information of the academic staff in QS department fromthe two selected universities, OAU and FUTA. It can be seen from Table II that thebackground information of academic staff only was indicated. It is because the othercategory of respondents was final-year undergraduate students in the QS departments fromthe aforementioned two universities. In the context of this study, there is no need for anyfurther background information regarding the students. Thus, Table II reveals thedemographic information of the academic staff in terms of academic qualification,designation of academic staff and year of service as an academic staff undertaken by the
Incorporationof BIM
635
225

respondents in the two selected universities. The academic qualifications of respondentsrevealed that the majority of the respondents had PhD, followed by a master’s degree. It canalso be seen from Table III that the designation of the respondents cuts across the academicstaff cadre in university (see Table III for details).
Ranking of the barriers to the incorporation of building information modelling into quantitysurveying undergraduate curriculumTable III shows the analysis of the ranking for the 30 identified barriers to theincorporation of BIM into QS undergraduate curriculum as indicated by the respondents,which comprised academic staff and students in the two selected universities. Based onthe five-point Likert rating scale, an attribute was deemed critical if it had a mean valueof 3.5 or more (Badu et al., 2012; Babatunde et al., 2016). Given two or more identifiedbarriers (Table III) with the same mean values, the one with the lowest standarddeviation was assigned highest importance ranking (Field, 2005). The analysis of theranking in terms of the total mean score values for the 30 identified barriers ranged from2.96 to 4.01, indicating that not all the identified barriers are considered by respondentsas critical barriers influencing the incorporation of BIM into QS undergraduatecurriculum. It can be seen further from Table IV that 17 (out of 30) identified barriersscored mean values between 3.58 and 4.01, which are considered as important barriers(Badu et al., 2012; Babatunde et al., 2016).
Therefore, the highest total ranked 17 barriers that displayed mean score values rangingfrom 3.58 to 4.01 are as follows: lack of IT infrastructure or poor internet connectivity; BIMis resource-intensive; lack of government lead/direction; cost of training the staff/lecturers;availability of qualified staff to take BIM course; need to continually upgrade the BIMsoftware; lack of accreditation standards and requirements to guide the implementation of
Table II.Demographicinformation ofacademic staff
Academic staff profile Academic staff (OAU) Frequency (%) Academic staff (FUTA) Frequency (%)
Highest educational qualificationBSc – – 5 29.41MSc 2 20.00 8 47.06PhD 8 80.00 4 23.53Total 10 100.00 17 100.00
Designation of academic staffGraduate assistant – – 5 29.41Assistant lecturer 1 10.00 5 29.41Lecturer II 2 20.00 1 5.88Lecturer I 5 50.00 5 29.41Senior lecturer 1 10.00 1 5.88Associate professor – – – –Professor 1 10.00 –Total 10 100.00 17 100.00
Year of service as an academic staff<5 years 1 10.00 9 52.946-10 years 5 50.00 3 17.6511-15 years – – 1 5.8816-20 years 2 20.00 4 23.53>20 years 2 20.00 – –Total 10 100.00 17 100.00
JEDT17,3
636
226
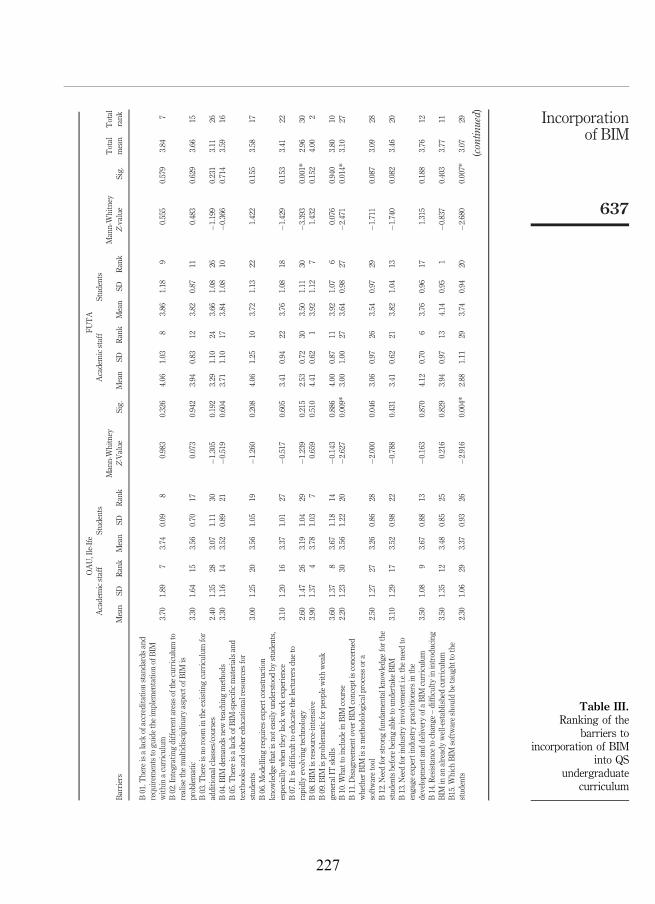
OAU,Ile-Ife
FUTA
Academicstaff
Stud
ents
Academicstaff
Stud
ents
Barriers
Mean
SDRank
Mean
SDRank
Mann-Whitney
Z-Value
Sig.
Mean
SDRank
Mean
SDRank
Mann-Whitney
Z-value
Sig.
Total
mean
Total
rank
B01.T
here
isalack
ofaccredita
tionstandardsand
requ
irem
entsto
guidetheim
plem
entatio
nof
BIM
with
inacurriculum
3.70
1.89
73.74
0.09
80.983
0.326
4.06
1.03
83.86
1.18
90.555
0.579
3.84
7B02.Integratin
gdifferenta
reas
ofthecurriculum
torealisethemultid
isciplinaryaspectof
BIM
isproblematic
3.30
1.64
153.56
0.70
170.073
0.942
3.94
0.83
123.82
0.87
110.483
0.629
3.66
15B03.T
here
isno
room
intheexistin
gcurriculum
for
additio
nalclasses/courses
2.40
1.35
283.07
1.11
30�1
.305
0.192
3.29
1.10
243.66
1.08
26�1
.199
0.231
3.11
26B04.B
IMdemands
newteaching
methods
3.30
1.16
143.52
0.89
21�0
.519
0.604
3.71
1.10
173.84
1.08
10�0
.366
0.714
3.59
16B05.T
here
isalack
ofBIM
-specificmaterialsand
textbooksandothere
ducatio
nalresources
for
stud
ents
3.00
1.25
203.56
1.05
19�1
.260
0.208
4.06
1.25
103.72
1.13
221.422
0.155
3.58
17B06.M
odellin
grequ
ires
expertconstructio
nkn
owledg
ethatisnoteasily
understood
bystud
ents,
especially
whenthey
lack
workexperience
3.10
1.20
163.37
1.01
27�0
.517
0.605
3.41
0.94
223.76
1.08
18�1
.429
0.153
3.41
22B07.Itisdifficultto
educatethelecturersdu
eto
rapidlyevolving
technology
2.60
1.47
263.19
1.04
29�1
.239
0.215
2.53
0.72
303.50
1.11
30�3
.393
0.001*
2.96
30B08.B
IMisresource-in
tensive
3.90
1.37
43.78
1.03
70.659
0.510
4.41
0.62
13.92
1.12
71.432
0.152
4.00
2B09.B
IMisproblematicforp
eoplewith
weak
generalITskills
3.60
1.37
83.67
1.18
14�0
.143
0.886
4.00
0.87
113.92
1.07
60.076
0.940
3.80
10B10.W
hattoinclud
ein
BIM
course
2.20
1.23
303.56
1.22
20�2
.627
0.009*
3.00
1.00
273.64
0.98
27�2
.471
0.014*
3.10
27B11.D
isagreem
ento
verB
IMconceptisconcerned
whether
BIM
isamethodologicalprocess
ora
softwaretool
2.50
1.27
273.26
0.86
28�2
.000
0.046
3.06
0.97
263.54
0.97
29�1
.711
0.087
3.09
28B12.N
eedforstrongfund
amentalknowledg
eforthe
stud
entsbefore
beingableto
undertakeBIM
3.10
1.29
173.52
0.98
22�0
.788
0.431
3.41
0.62
213.82
1.04
13�1
.740
0.082
3.46
20B13.N
eedforind
ustryinvolvem
enti.e.the
need
toengage
expertindu
stry
practitioners
inthe
developm
enta
nddeliv
eryof
aBIM
curriculum
3.50
1.08
93.67
0.88
13�0
.163
0.870
4.12
0.70
63.76
0.96
171.315
0.188
3.76
12B14.R
esistanceto
change
–difficulty
inintroducing
BIM
inan
alreadywell-establishedcurriculum
3.50
1.35
123.48
0.85
250.216
0.829
3.94
0.97
134.14
0.95
1�0
.837
0.403
3.77
11B15.W
hich
BIM
softwareshould
betaug
htto
the
stud
ents
2.30
1.06
293.37
0.93
26�2
.916
0.004*
2.88
1.11
293.74
0.94
20�2
.680
0.007*
3.07
29
(contin
ued)
Table III.Ranking of the
barriers toincorporation of BIM
into QSundergraduate
curriculum
Incorporationof BIM
637
227
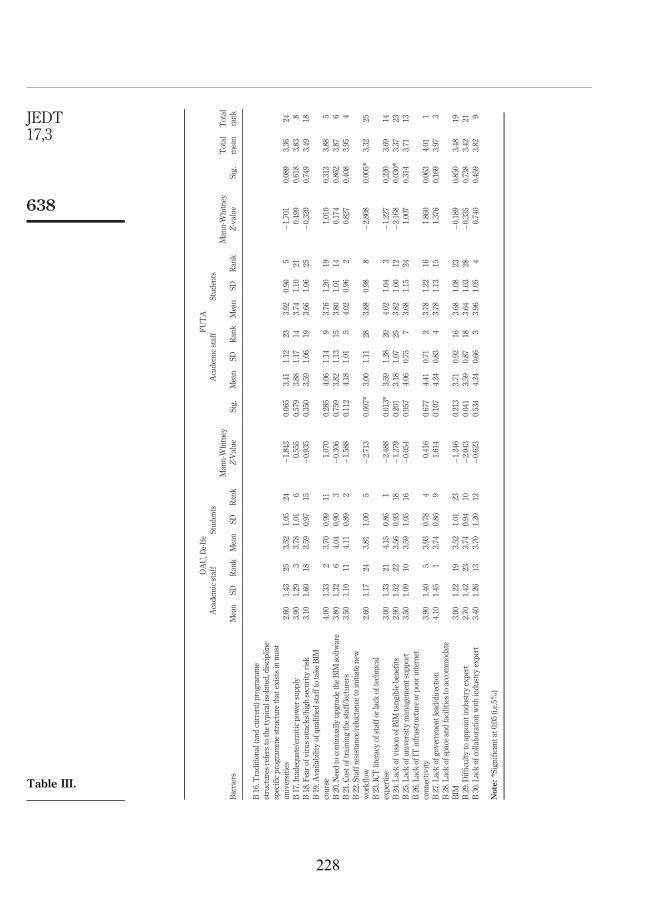
OAU,Ile-Ife
FUTA
Academicstaff
Stud
ents
Academicstaff
Stud
ents
Barriers
Mean
SDRank
Mean
SDRank
Mann-Whitney
Z-Value
Sig.
Mean
SDRank
Mean
SDRank
Mann-Whitney
Z-value
Sig.
Total
mean
Total
rank
B16.T
raditio
nal(andcurrent)programme
structures-refersto
thetypicalisolated,disciplin
e-specificprogrammestructurethat
existsin
most
universities
2.60
1.43
253.52
1.05
24�1
.843
0.065
3.41
1.12
233.92
0.90
5�1
.701
0.089
3.36
24B17.Inadequ
ate/erratic
power
supp
ly3.90
1.29
33.78
1.01
60.555
0.579
3.88
1.17
143.74
1.10
210.499
0.618
3.83
8B18.Fearof
virusattacks/high
security
risk
3.10
1.60
183.59
0.97
15�0
.935
0.350
3.59
1.06
193.66
1.06
25�0
.320
0.749
3.49
18B19.A
vailabilityof
qualified
stafftotake
BIM
course
4.00
1.33
23.70
0.99
111.070
0.285
4.06
1.14
93.76
1.20
191.010
0.313
3.88
5B20.N
eedto
continually
upgradetheBIM
software
3.80
1.32
64.04
0.90
3�0
.306
0.759
3.82
1.13
153.80
1.01
140.174
0.862
3.87
6B21.Costo
ftrainingthestaff/lecturers
3.50
1.10
114.11
0.89
2�1
.588
0.112
4.18
1.01
54.02
0.96
20.827
0.408
3.95
4B22.Staffresistance/reluctanceto
initiatenew
workfl
ow2.60
1.17
243.81
1.00
5�2
.713
0.007*
3.00
1.11
283.88
0.98
8�2
.808
0.005*
3.32
25B23.ICT
literacyof
stafforlackof
technical
expertise
3.00
1.33
214.15
0.86
1�2
.488
0.013*
3.59
1.28
204.02
1.04
3�1
.227
0.220
3.69
14B24.Lackof
vision
ofBIM
tang
iblebenefits
2.90
1.52
223.56
0.93
18�1
.279
0.201
3.18
1.07
253.82
1.00
12�2
.168
0.030*
3.37
23B25.Lackof
university
managem
entsup
port
3.50
1.09
103.59
1.05
16�0
.054
0.957
4.06
0.75
73.68
1.15
241.007
0.314
3.71
13B26.Lackof
ITinfrastructure
orpoor
internet
conn
ectiv
ity3.90
1.40
53.93
0.78
40.416
0.677
4.41
0.71
23.78
1.22
161.860
0.063
4.01
1B27.Lackof
governmentlead/direction
4.10
1.45
13.74
0.86
91.614
0.107
4.24
0.83
43.78
1.13
151.376
0.169
3.97
3B28.Lackof
spaceandfacilitiesto
accommodate
BIM
3.00
1.22
193.52
1.01
23�1
.246
0.213
3.71
0.92
163.68
1.08
23�0
.189
0.850
3.48
19B29.D
ifficulty
toappointind
ustryexpert
2.70
1.42
233.74
0.94
10�2
.043
0.041
3.59
0.87
183.64
1.03
28�0
.335
0.738
3.42
21B30.Lackof
collaboratio
nwith
indu
stry
expert
3.40
1.26
133.70
1.20
12�0
.623
0.534
4.24
0.66
33.96
1.05
40.740
0.459
3.82
9
Note:
*Significant
at0.05
(i.e.5%
)
Table III.
JEDT17,3
638
228

BIM within a curriculum; inadequate/erratic power supply; lack of collaboration withindustry expert; BIM is problematic for people with weak general IT skills; resistance tochange – difficulty in introducing BIM in an already well-established curriculum; need forindustry involvement, i.e. the need to engage expert industry practitioners in thedevelopment and delivery of a BIM curriculum; lack of university management support; ICTliteracy of staff or lack of technical expertise; integrating different areas of the curriculum torealise the multidisciplinary aspect of BIM is problematic; BIM demands new teachingmethods; and lack of BIM-specific materials and textbooks, as well as other educationalresources for students, respectively. The similar barriers were identified by several previousstudies. For instance, Sabongi and Arch (2009) and Panuwatwanich et al. (2013) found thatlack of time and resources to prepare a new curriculum, lack of space in establishedcurriculum to include new courses and lack of suitable materials for BIM-related training arethe main obstacles to integrating BIM into universities engineering undergraduatecurriculum in developed countries. Abbas et al. (2016) identified lack of trained BIM facultymembers, structure of existing education curriculum, need for the industry involvement,inadequate funding and unwillingness to change existing curriculum are top rankedbarriers to integrating BIM into construction management programmes in Pakistaniuniversities. In addition, it can be deduced from this study finding that there are moreimportant barriers influencing the integration of BIM into undergraduate curriculum in theNigerian universities.
The Mann-Whitney test was conducted to determine whether there is statisticallysignificant difference in the perception of the respondents on the ranking of 30 identifiedbarriers. The Mann–Whitney test was conducted at a significance level of 5 per cent. Theresults of the Mann–Whitney test indicated a very slight statistically significant differenceon four and five (out of 30) identified barriers in perceptions of the respondents at OAU andFUTA, respectively (Table III). This little significant difference is not surprising because itcould be connected with their lived experience of the respondents about the existinginfrastructure in their respective university and their familiarity with QS practices in theindustry.
Factor analysis of the barriers to the incorporation of building information modelling intoquantity surveying undergraduate curriculumIn an attempt to achieve more interpretable results and thereby determine theunderlying relationships among the identified 30 barriers to BIM incorporation into QSundergraduate curriculum (see Table III), factor analysis was conducted. In assessingthe suitability of data obtained for factor analysis, Kaiser–Meyer–Olkin (KMO) andBartlett’s test of sphericity were conducted using Statistical Package for the SocialSciences (SPSS).This approach was supported by Pallant (2010) who asserted thatbefore embarking on factor analysis, the data must be assessed for suitability for factoranalysis using KMO and Bartlett’s tests of sphericity. Table IV revealed the results ofKMO and Bartlett’s tests of sphericity. The KMO value indicated the samplingadequacy to be 0.872 (see Table IV). This shows a satisfactory for accurate completion
Table IV.KMO and Bartlett’s
test
KMO measure of sampling adequacy 0.872
Bartlett’s test of sphericityApprox. Chi-Square 1.817E3df 435Sig. 0.000
Incorporationof BIM
639
229
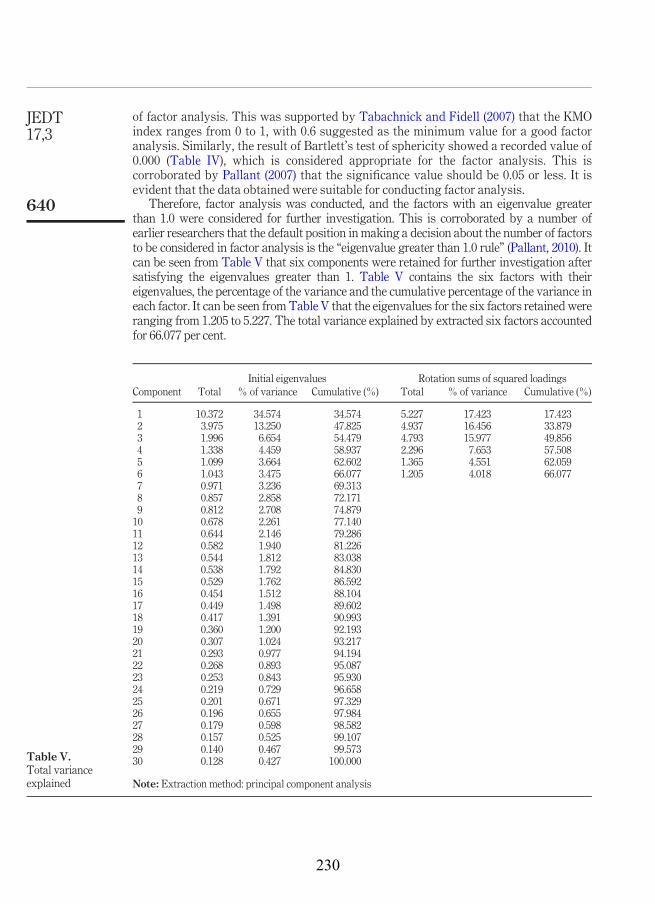
of factor analysis. This was supported by Tabachnick and Fidell (2007) that the KMOindex ranges from 0 to 1, with 0.6 suggested as the minimum value for a good factoranalysis. Similarly, the result of Bartlett’s test of sphericity showed a recorded value of0.000 (Table IV), which is considered appropriate for the factor analysis. This iscorroborated by Pallant (2007) that the significance value should be 0.05 or less. It isevident that the data obtained were suitable for conducting factor analysis.
Therefore, factor analysis was conducted, and the factors with an eigenvalue greaterthan 1.0 were considered for further investigation. This is corroborated by a number ofearlier researchers that the default position in making a decision about the number of factorsto be considered in factor analysis is the “eigenvalue greater than 1.0 rule” (Pallant, 2010). Itcan be seen from Table V that six components were retained for further investigation aftersatisfying the eigenvalues greater than 1. Table V contains the six factors with theireigenvalues, the percentage of the variance and the cumulative percentage of the variance ineach factor. It can be seen from Table V that the eigenvalues for the six factors retained wereranging from 1.205 to 5.227. The total variance explained by extracted six factors accountedfor 66.077 per cent.
Table V.Total varianceexplained
Initial eigenvalues Rotation sums of squared loadingsComponent Total % of variance Cumulative (%) Total % of variance Cumulative (%)
1 10.372 34.574 34.574 5.227 17.423 17.4232 3.975 13.250 47.825 4.937 16.456 33.8793 1.996 6.654 54.479 4.793 15.977 49.8564 1.338 4.459 58.937 2.296 7.653 57.5085 1.099 3.664 62.602 1.365 4.551 62.0596 1.043 3.475 66.077 1.205 4.018 66.0777 0.971 3.236 69.3138 0.857 2.858 72.1719 0.812 2.708 74.87910 0.678 2.261 77.14011 0.644 2.146 79.28612 0.582 1.940 81.22613 0.544 1.812 83.03814 0.538 1.792 84.83015 0.529 1.762 86.59216 0.454 1.512 88.10417 0.449 1.498 89.60218 0.417 1.391 90.99319 0.360 1.200 92.19320 0.307 1.024 93.21721 0.293 0.977 94.19422 0.268 0.893 95.08723 0.253 0.843 95.93024 0.219 0.729 96.65825 0.201 0.671 97.32926 0.196 0.655 97.98427 0.179 0.598 98.58228 0.157 0.525 99.10729 0.140 0.467 99.57330 0.128 0.427 100.000
Note: Extraction method: principal component analysis
JEDT17,3
640
230
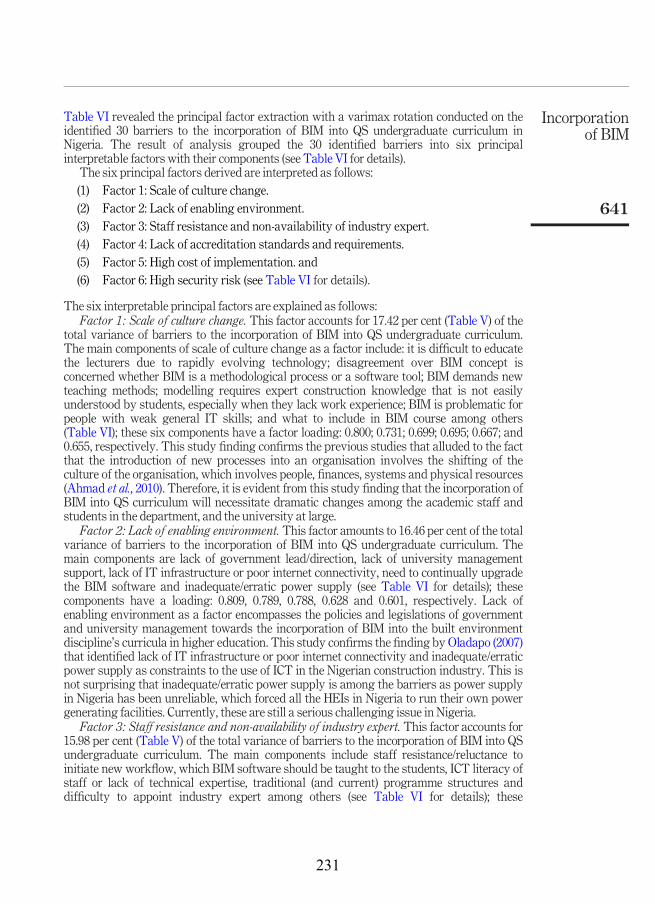
Table VI revealed the principal factor extraction with a varimax rotation conducted on theidentified 30 barriers to the incorporation of BIM into QS undergraduate curriculum inNigeria. The result of analysis grouped the 30 identified barriers into six principalinterpretable factors with their components (see Table VI for details).
The six principal factors derived are interpreted as follows:(1) Factor 1: Scale of culture change.(2) Factor 2: Lack of enabling environment.(3) Factor 3: Staff resistance and non-availability of industry expert.(4) Factor 4: Lack of accreditation standards and requirements.(5) Factor 5: High cost of implementation. and(6) Factor 6: High security risk (see Table VI for details).
The six interpretable principal factors are explained as follows:Factor 1: Scale of culture change. This factor accounts for 17.42 per cent (Table V) of the
total variance of barriers to the incorporation of BIM into QS undergraduate curriculum.The main components of scale of culture change as a factor include: it is difficult to educatethe lecturers due to rapidly evolving technology; disagreement over BIM concept isconcerned whether BIM is a methodological process or a software tool; BIM demands newteaching methods; modelling requires expert construction knowledge that is not easilyunderstood by students, especially when they lack work experience; BIM is problematic forpeople with weak general IT skills; and what to include in BIM course among others(Table VI); these six components have a factor loading: 0.800; 0.731; 0.699; 0.695; 0.667; and0.655, respectively. This study finding confirms the previous studies that alluded to the factthat the introduction of new processes into an organisation involves the shifting of theculture of the organisation, which involves people, finances, systems and physical resources(Ahmad et al., 2010). Therefore, it is evident from this study finding that the incorporation ofBIM into QS curriculum will necessitate dramatic changes among the academic staff andstudents in the department, and the university at large.
Factor 2: Lack of enabling environment. This factor amounts to 16.46 per cent of the totalvariance of barriers to the incorporation of BIM into QS undergraduate curriculum. Themain components are lack of government lead/direction, lack of university managementsupport, lack of IT infrastructure or poor internet connectivity, need to continually upgradethe BIM software and inadequate/erratic power supply (see Table VI for details); thesecomponents have a loading: 0.809, 0.789, 0.788, 0.628 and 0.601, respectively. Lack ofenabling environment as a factor encompasses the policies and legislations of governmentand university management towards the incorporation of BIM into the built environmentdiscipline’s curricula in higher education. This study confirms the finding by Oladapo (2007)that identified lack of IT infrastructure or poor internet connectivity and inadequate/erraticpower supply as constraints to the use of ICT in the Nigerian construction industry. This isnot surprising that inadequate/erratic power supply is among the barriers as power supplyin Nigeria has been unreliable, which forced all the HEIs in Nigeria to run their own powergenerating facilities. Currently, these are still a serious challenging issue in Nigeria.
Factor 3: Staff resistance and non-availability of industry expert. This factor accounts for15.98 per cent (Table V) of the total variance of barriers to the incorporation of BIM into QSundergraduate curriculum. The main components include staff resistance/reluctance toinitiate new workflow, which BIM software should be taught to the students, ICT literacy ofstaff or lack of technical expertise, traditional (and current) programme structures anddifficulty to appoint industry expert among others (see Table VI for details); these
Incorporationof BIM
641
231
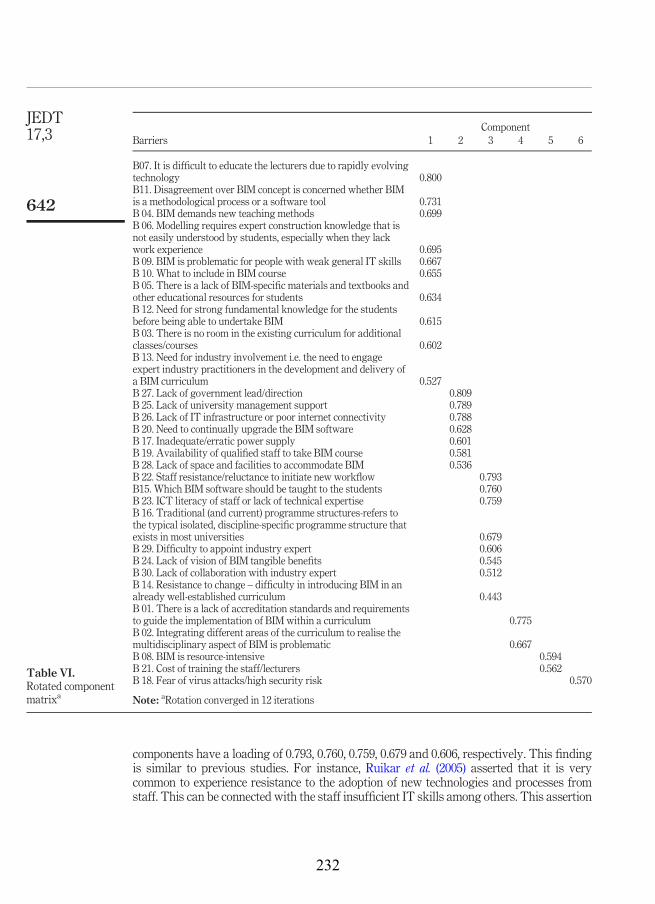
components have a loading of 0.793, 0.760, 0.759, 0.679 and 0.606, respectively. This findingis similar to previous studies. For instance, Ruikar et al. (2005) asserted that it is verycommon to experience resistance to the adoption of new technologies and processes fromstaff. This can be connected with the staff insufficient IT skills among others. This assertion
Table VI.Rotated componentmatrixa
ComponentBarriers 1 2 3 4 5 6
B07. It is difficult to educate the lecturers due to rapidly evolvingtechnology 0.800B11. Disagreement over BIM concept is concerned whether BIMis a methodological process or a software tool 0.731B 04. BIM demands new teaching methods 0.699B 06. Modelling requires expert construction knowledge that isnot easily understood by students, especially when they lackwork experience 0.695B 09. BIM is problematic for people with weak general IT skills 0.667B 10. What to include in BIM course 0.655B 05. There is a lack of BIM-specific materials and textbooks andother educational resources for students 0.634B 12. Need for strong fundamental knowledge for the studentsbefore being able to undertake BIM 0.615B 03. There is no room in the existing curriculum for additionalclasses/courses 0.602B 13. Need for industry involvement i.e. the need to engageexpert industry practitioners in the development and delivery ofa BIM curriculum 0.527B 27. Lack of government lead/direction 0.809B 25. Lack of university management support 0.789B 26. Lack of IT infrastructure or poor internet connectivity 0.788B 20. Need to continually upgrade the BIM software 0.628B 17. Inadequate/erratic power supply 0.601B 19. Availability of qualified staff to take BIM course 0.581B 28. Lack of space and facilities to accommodate BIM 0.536B 22. Staff resistance/reluctance to initiate new workflow 0.793B15. Which BIM software should be taught to the students 0.760B 23. ICT literacy of staff or lack of technical expertise 0.759B 16. Traditional (and current) programme structures-refers tothe typical isolated, discipline-specific programme structure thatexists in most universities 0.679B 29. Difficulty to appoint industry expert 0.606B 24. Lack of vision of BIM tangible benefits 0.545B 30. Lack of collaboration with industry expert 0.512B 14. Resistance to change – difficulty in introducing BIM in analready well-established curriculum 0.443B 01. There is a lack of accreditation standards and requirementsto guide the implementation of BIM within a curriculum 0.775B 02. Integrating different areas of the curriculum to realise themultidisciplinary aspect of BIM is problematic 0.667B 08. BIM is resource-intensive 0.594B 21. Cost of training the staff/lecturers 0.562B 18. Fear of virus attacks/high security risk 0.570
Note: aRotation converged in 12 iterations
JEDT17,3
642
232
is corroborated by Aouad et al. (2006), who identified lack of skilled BIM operatives in theindustry as a significant barrier to BIM adoption now in the developing countries.
Factor 4: Lack of accreditation standards and requirements. This factor accounts for7.65 per cent (Table V) of the total variance of barriers to the incorporation of BIM into QSundergraduate curriculum. The factor has two main components: lack of accreditationstandards and requirements to guide the implementation of BIM within a curriculum andintegrating different areas of the curriculum to realise the multidisciplinary aspect of BIM isproblematic; these two components have a factor loading of 0.775 and 0.667, respectively.This study affirmed few of the previous studies that identified inconsistency in theintegration of BIM into AEC curricula in higher education (Sabongi, 2009; Becerik-Gerberet al., 2011; Sacks and Pikas, 2013). However, properly structured BIM courses wouldprovide industry-required knowledge to prepare students for successful careers in theindustry.
Factor 5: High cost of implementation. This factor amounts to 4.55 per cent of the totalvariance of barriers to the incorporation of BIM into QS undergraduate curriculum. Thefactor has two main components: BIM is resource-intensive and cost of training the staff/lecturers; these two components have a factor loading 0.594 and 0.562, respectively. Thisfinding is similar to previous studies. For instance, Eadie et al. (2015) asserted thatimplementing BIM necessitates organisations to purchase the pertinent software andhardware and train their staff in the use of that software. It is on this premise that Ayariciet al. (2011) found that cost of training and high cost of software are the barriers to BIMadoption in the industry. This is affirmed by Lee et al. (2012) that software packages needupdates and it is necessary to consider the fact that BIM software packages will periodicallyneed to be updated, which is an added cost.
Factor 6: High security risk. This factor amounts to 4.02 per cent of the total variance ofbarriers to the incorporation of BIM into QS undergraduate curriculum. This factor has onlyone component, which is fear of virus attacks/high security risk with a factor loading of0.570 (see Table VI for details). This finding is similar to the ones by previous studies,especially Oladapo (2007), who identified fear of virus attacks as fourth top rankedconstraints to the use of ICT in the Nigerian construction industry. In developing countries,this is not surprising as the maintenance of BIM software becomes a serious challenge,which makes BIM software susceptible to virus attacks and other various security risks.
ConclusionsThis study provided empirical evidence on the barriers militating against the integration ofBIM into AEC curricula, in this case for QS undergraduate curriculum in the NigerianUniversities. The study identified 30 barriers to the incorporation of BIM into QSundergraduate curriculum. The analysis of the ranking in terms of the total mean scorevalues for the 30 identified barriers revealed that 17 (out of 30) identified barriers scoredmean values between 3.58 and 4.01, which are considered as serious barriers. It can bededuced from this study that there are more serious barriers influencing the integration ofBIM into QS undergraduate programme in Nigerian universities.
In addition, the top ten ranked barriers are as follows: lack of IT infrastructure or poorinternet connectivity; BIM is resource-intensive; lack of government lead/direction; cost oftraining the staff/lecturers; availability of qualified staff to take BIM course; the need tocontinually upgrade the BIM software; lack of accreditation standards and requirements toguide the implementation of BIMwithin a curriculum; inadequate/erratic power supply; lackof collaboration with industry expert; and BIM is problematic for people with weak generalIT skills. The results of Mann–Whitney test indicated a very slight statistically significant
Incorporationof BIM
643
233

difference on 4 and 5 (out of 30) identified barriers on perceptions of the respondents at OAUand FUTA, respectively. This little significant difference is not surprising because it couldbe connected with their lived experience of the respondents about the BIM concepts inrelation to the existing infrastructure in their respective university and their familiarity withQS practices in the industry.
The study, through factor analysis, grouped the 30 identified barriers to BIM incorporationinto QS programme into six major factors: scale of culture change; lack of enablingenvironment; staff resistance and non-availability of industry expert; lack of accreditationstandards and requirements; high cost of implementation; and high security risk. This study isnot without limitations. For instance, the respondents considered in this study were from twouniversities fully accredited by both the National Universities Commission and the QuantitySurveyors Registration Board of Nigeria in southwestern Nigeria. Considering other accrediteduniversities offering QS programme in Nigeria would have enhanced the credibility of thefindings. Also, the use of questionnaire survey allows a large sample to be captured; havingother methods together such as interviews may enrich the findings. Despite the limitations, thefindings of this study provide greater insights and empirical evidence on the major barriersthat both academia and students need to overcome to successfully incorporate BIM into acurriculum. The findings would be of great value to academic staff and universitymanagementto develop strategies for incorporating BIM into AEC disciplines curricula in developingcountries at large. Further, the barriers identified in this study are relevant to not only QSprofession but also other related disciplines within the AEC industry.
ReferencesAbbas, A., Din, Z. and Farooqui, R. (2016), “Integration of BIM in construction management education:
an overview of Pakistani engineering universities”, Procedia Engineering, Vol. 145, pp. 151-157.Adamu, Z.A. and Thorpe, T. (2015), “How should we teach BIM? A case study from the UK”,
Proceedings of 9th BIM Academic Symposium and Job Task Analysis Review, 7-8th April,Washington, DC, pp. 80-87.
Ahmad, I., Sein-Maung, K. and Panthi, K. (2010), “Challenges of integration and ICT’s potentials in theglobalised construction industry”, Proceedings of PICMET ‘10: Technology Management forGlobal Economic Growth (PICMET), 18-22 July, Phuket, pp. 1-7.
Alabdulqader, A., Panuwatwanich, K. and Doh, J.H. (2013), “Current use of building informationmodelling within Australian AEC industry”, paper presented at the 13th East Asia-PacificConference on Structural Engineering and Construction, 11-13 September, Sapporo.
Alkalbani, S., Rezgui, Y., Vorakulpipat, C. and Wilson, I. (2012), “ICT adoption and diffusion in theconstruction industry of a developing economy: The case of the sultanate of Oman”,Architectural Engineering and DesignManagement, Vol. 9 No. 1, pp. 1-14.
Aouad, G., Wu, S. and Lee, A. (2006), “nDimensional modelling technology: past, present, and future”,Journal of Computing in Civil Engineering, Vol. 20 No. 3, pp. 151-153.
Arayici, Y., Khosrowshahi, Y., Ponting, A.M. and Mihindu, S. (2009), “Towards implementation ofbuilding information modelling in the construction industry”, 5th International Conference onConstruction in the 21st Century (CITC-V), Collaboration and Integration in Engineering,Management and Technology, May 20-22, Istanbul.
Arayici, Y., Coates, P., Koskela, L., Kagioglou, M., Usher, C. and O’Reilly, K. (2011), “Technologyadoption in the BIM implementation for lean architectural practice”, Automation inConstruction, Vol. 20 No. 2, pp. 189-195.
Ashworth, A. and Hogg, K. (2007),Willis’s Practice and Procedure for the Quantity Surveyor, BlackwellPublishing Ltd, Oxford.
JEDT17,3
644
234

Australian Institute of Architects (AIA) (2010), BIM in Australia, Report on BIM/IPD Forums, October/November, Australian Institute of Architects, Consult Australia.
Babatunde, S.O., Perera, S., Zhou, L. and Udeaja, C. (2016), “Stakeholder perceptions on critical successfactors for public-private partnership projects in Nigeria”, Built Environment Project and AssetManagement, Vol. 6 No. 1, pp. 74-91.
Babatunde, S.O., Ekundayo, D., Olubola Babalola, O. and Jimoh, J.A. (2018), “Analysis of thedrivers and benefits of BIM incorporation into quantity surveying profession: academiaand students’ perspectives”, Journal of Engineering, Design and Technology, Vol. 16 No. 5,pp. 750-766.
Badu, E., Edwards, D.J., Owusu-Manu, D. and Brown, D.M. (2012), “Barriers to the implementation ofinnovative financing (IF) of infrastructure”, Journal of Financial Management of Property andConstruction, Vol. 17 No. 3, pp. 253-273.
Becerik-Gerber, B., Gerber, D.J. and Ku, K. (2011), “The pace of technological innovation in architecture,engineering, and construction education: integrating recent trends into the curricula”, Journal ofInformation Technology in Construction, Vol. 16, pp. 411-432.
Bowen, P., Cattell, K., Distiller, G. and Edwards, P.J. (2008), “Job satisfaction of South African quantitysurveyors: an empirical study”, Construction Management and Economics, Vol. 26 No. 7,pp. 765-800.
Cartlidge, D. (2011),NewAspects of Quantity Surveying Practice, Spon Press, Oxon.Clevenger, C., Ozbek, M., Glick, S. and Porter, D. (2010), “Integrating BIM into construction
management education”, Proceedings of EcoBuild BIM Academic Forum, Washington, DC,pp. 6-10.
Dada, J.O. (2017), “An appraisal of paradigm shifts required of competence of the Nigerian quantitysurveyors”, Engineering, Construction and Architectural Management, Vol. 24 No. 6,pp. 1269-1280.
Dada, J.O. and Musa, N.A. (2016), “Key factors affecting the competence of quantity surveyors: evidencefrom construction industry stakeholders in Nigeria”, Journal of Engineering, Design andTechnology, Vol. 14 No. 3, pp. 461-474.
Eadie, R., Browne, M., Odeyinka, H., McKeown, C. and McNiff, S. (2015), “A survey of current status ofand perceived changes required for BIM adoption in the UK”, Built Environment Project andAsset Management, Vol. 5 No. 1, pp. 4-21.
Eastman, C., Teicholz, P., Sacks, R. and Liston, K. (2011), BIM Handbook: a Guide to BuildingInformation Modelling for Owners, Managers, Designers, Engineers and Contractors, JohnWiley and Sons, NJ.
Efficiency and Reform Group (ERG) (2011),Government Construction Strategy, Cabinet Office, London.Elinwa, U.K. and Agboola, O.P. (2013), “Beyond BIM – a classroom approach to virtual design
education”, Procedia - Social and Behavioral Sciences, Vol. 83, pp. 393-397.Field, A. (2005),Discovering Statistics Using SPSS, Sage, London.George, D. and Mallery, P. (2003), SPSS for Windows Step by Step: A Simple Guide and Reference 11.0
Update, Allyn and Bacon, Boston, MA.Gier, D.M. (2015), “Integrating building information modelling (BIM) into core courses within a
curriculum: a case study”, International Journal of Engineering Research and General Science,Vol. 3 No. 1, pp. 528-543.
Gordon, C., Azambuja, M. and Werner, A.M. (2009), “BIM across the construction curriculum”,Associated Schools of Construction, Region III 2009 Conference, Southern IL University,Edwardsville, IL.
Guo, N. and London, K. (2010), “Understanding and facilitating BIM adoption in the AEC industry”,Automation in Construction, Vol. 19 No. 8, pp. 988-999.
Incorporationof BIM
645
235

Hair, J.F., Black, W.C., Babin, B.J. and Anderson, R.E. (2010), Multivariate Data Analysis: A GlobalPerspective, Pearson, Upper Saddle River, NJ, London.
Han, H. and Bedrick, J. (2015), “BIM education in Asean: the demand for BIM practitioners, 9th BIMacademic symposium and Job task analysis review”, 7-8 April, Washington, DC.
Hedayati, A., Mohandes, S.R. and Preece, C. (2015), “Studying the obstacles to implementing BIM ineducational system and making some recommendations”, Journal of Basic Applied ScienceResearch, Vol. 5 No. 3, pp. 29-35.
Ibironke, O.T., Ekundayo, D. and Awodele, O.A. (2011), “A survey on the use and impact of informationtechnology in quantity surveying service delivery in Nigeria”, Proceedings of the 27th AnnualARCOM Conference, 5-7 September 2011 University of the West of England, Bristol, Vol. 1,pp. 433-442.
Ikediashi, D.I. and Ogwueleka, A.C. (2016), “Assessing the use of ICT systems and their impact onconstruction project performance in the Nigerian construction industry”, Journal of Engineering,Design and Technology, Vol. 14 No. 2, pp. 252-276.
Isikdag, U. and Underwood, J. (2010), “A synopsis of the handbook of research in building informationmodelling”, Proceedings of the 18th CIB World Building Congress 2010, 10-13 May 2010 theLowry, Salford Quays, pp. 84-96.
Jung, Y. and Joo, M. (2011), “Building information modelling (BIM) framework for practicalimplementation”,Automation in Construction, Vol. 20 No. 2, pp. 126-133.
Keraminiyage, K. and Lill, I. (2013), “Strategies to address gaps in the supply and demand of skills andknowledge in built environment-related disciplines”, International Journal of Strategic PropertyManagement, Vol. 17 No. 2, pp. 111-113.
Lee, G., Harrison, K. and Won, J. (2012), “Economic impact of BIM-assisted design validation”,Automation in Construction, Vol. 22 No. 1, pp. 577-586.
Lee, N. and Dossick, C.S. (2012), “Leveraging building information modelling technology inconstruction engineering and management education”, proceedings of 119th ASEE AnnualConference, San Antonio, 10-13th June, San Antonio.
Ling, F.Y.Y. and Chan, A.H.M. (2008), “Internationalising quantity surveying services”, Engineering,Construction and ArchitecturalManagement, Vol. 15 No. 5, pp. 440-455.
McGough, D., Ahmed, A. and Austin, S. (2013), “Integration of BIM in higher education: case study ofthe adoption of BIM into Coventry university’s department of civil engineering, architecture andbuilding”, Sustainable Building Conference 2013, Coventry University.
Macdonald, J.A. (2012), “A framework for collaborative BIM education across the AEC disciplines”,Proceedings of AUBEA 2012, Sydney, 4-6th July, pp. 223-230.
Musa, N., Oyebisi, T. and Babalola, M. (2010), “A study of the impact of information andcommunications technology (ICT) on the quality of quantity surveying services in Nigeria”,Electronic Journal of Information Systems in Developing Countries, Vol. 42 No. 1, pp. 1-9.
Nagalingam, G., Jayasena, H.S. and Ranadewa, K.A. (2013), “BIM and future quantity surveyor’s in SriLankan construction industry”, The Second World Construction: Socio-Economic Sustainabilityin Construction, 14-15 June, Colombo.
NATSPEC (2013), “NATSPEC BIMmanagement plan template (v1.0)”, available at: www.bim.natspec.org/images/NATSPEC_Documents/BIM_Management_Plan_Template_v1.0.pdf (accessed 4August 2017).
Oladapo, A.A. (2006), “The impact of ICT on professional practice in the Nigerian construction industry”,Electronic Journal of Information Systems in Developing Countries, Vol. 24 No. 1, pp. 1-19.
Oladapo, A.A. (2007), “An investigation into the use of ICT in the Nigerian construction industry”,Journal of Information Technology in Construction (ITcon), Vol. 12, pp. 261-277.
Olanrewaju, A. (2016), “Measuring the service gaps in the roles of quantity surveyors in the emergingmarket”, Benchmarking: An International Journal, Vol. 23 No. 5, pp. 1111-1131.
JEDT17,3
646
236
Olatunji, O.A., Sher, W. and Gu, N. (2010), “Building information modelling and quantity surveyingpractice”, Emirates Journals for Engineering Research, Vol. 15 No. 1, pp. 67-70.
Pallant, J. (2007) SPSS Survival Manual: A Step by Step Guide to Data Analysis Using SPSS forWindows, Open University Press, Berkshire.
Pallant, J. (2010), SPSS Survival Manual: A Step by Step Guide to Data Analysis Using SPSS forWindows, McGraw-Hill, New York, NY.
Panuwatwanich, K., Wong, M., Doh, J., Stewart, R.A. and McCarthy, T.J. (2013), “Integrating buildinginformation modelling (BIM) into engineering education: an exploratory study of industryperceptions using social network data”, in Lemckert, C., Jenkins, G. and Lemckert, S. (Eds),Australasian Association for Engineering Education Conference, Griffith School of Engineering,Griffith University, pp. 1-9.
Pathirage, C.P. and Amaratunga, R.D.G. (2006), “A vision for the quantity surveying education in the21st century: United Kingdom perspective”, in Rameezdeen, R. and Seneviratne, I. (Eds),Customising the Quantity Surveying Education, Department of Building Economics, Universityof Moratuwa, Sri Lanka, pp. 23-32.
Perera, S., Babatunde, S.O., Zhou, L., Pearson, J. and Ekundayo, D. (2017), “Competency mappingframework for regulating professionally oriented degree programmes in higher education”,Studies in Higher Education, Vol. 42 No. 12, pp. 2316-2342.
Pheng, L.S. and Ming, K.H. (1997), “Formulating a strategic marketing mix for quantity surveyors”,Marketing Intelligence and Planning, Vol. 15 No. 6, pp. 273-280.
Puolitaival, T. and Forsythe, P. (2016), “Practical challenges of BIM education”, Structural Survey,Vol. 34 Nos 4/5, pp. 351-366.
Ruikar, K., Anumba, C. and Carrillo, P. (2005), “End-user perspectives on use of project extranets inconstruction organisations”, Engineering, Construction and Architectural Management, Vol. 12No. 3, pp. 222-235.
Sabol, L. (2008), “Challenges in cost estimating with building information modelling”, available at:www.dcstrategies.net/files/2_sabol_cost_estimating.pdf (accessed 4 August 2018).
Sabongi, F.J. (2009), “The integration of BIM in the undergraduate curriculum: an analysis ofundergraduate courses”, Proceedings of the 45th Annual Conference of ASC,Gainesville, FL.
Sabongi, F.J. and Arch, M. (2009), “The integration of bim in the undergraduate curriculum: an analysisof undergraduate courses”, available at: http://ascpro0.ascweb.org/archives/cd/2009/paper/CEUE90002009.pdf (accessed 20 August 2018).
Sacks, R. and Pikas, E. (2013), “Building information modelling education for construction engineeringand management. i: industry requirements, state of the art, and gap analysis”, Journal ofConstruction Engineering andManagement, Vol. 139 No. 11, p. 05013002.
Smith, P. (2009), “Trends in the Australian quantity surveying profession: 1995-2008”, Proceedings of the13th Pacific Association of Quantity Surveyors Congress (PAQS)August 17-18,Kuala Lumpur.
Sylvester, K.E. and Dietrich, C. (2010), “Evaluation of building information modelling (BIM) estimatingmethods in construction education”, 46th ASC Annual International Conference Proceedings,Associated Schools of Construction Boston,MA.
Tabachnick, B.G. and Fidell, L.S. (2007)UsingMultivariate Statistics, Pearson Education, Boston.Taylor, J.M., Liu, J. and Hein, M.F. (2008), “Integration of building information modelling (BIM) into an
ACCE accredited construction management curriculum”, Proceedings of the International 44thAnnual Conference, Associated Schools of Construction, 2-5 April,Boston, MA.
Thomas, K. (2010), Innovation and Growth Team Report, Northumbria University.Waziri, A.Y., Ali, K.N. and Aliagha, G.U. (2015), “The influence of transformational leadership style on
ICT adoption in the Nigerian construction industry”, Asian Social Science, Vol. 11 No. 18,pp. 123-133.
Incorporationof BIM
647
237
Wong, K.A., Wong, K.F. and Nadeem, A. (2011), “Building information modelling for tertiaryconstruction education in Hong Kong”, Journal of Information Technology in Construction,Vol. 16, pp. 467-476.
Wu, S., Wood, G., Ginige, K. and Jong, S.W. (2014), “A technical review of BIM based cost estimating inUK quantity surveying practice, standards and tools”, Journal of Information Technology inConstruction, Vol. 19, pp. 534-563.
Further readingAli, K.N., Mustaffa, N.E., Keat, Q.J. and Enegbuma, W.I. (2015), “Building information modelling (BIM)
educational framework for quantity surveying students: the Malaysian perspective”, Journal ofInformation Technology in Construction (ITcon), Vol. 21, pp. 140-151.
Badrinath, A.C., Chang, Y.T. and Hsieh, S.H. (2016), “A review of tertiary BIM education for advancedengineering communication with visualization”, Visualization in Engineering, Vol. 4 No. 9,pp. 1-17.
Liu, R. and Hatipkarasulu, Y. (2014), “Introducing building information modeling course into a newlydeveloped construction program with various student backgrounds”, Proceedings of 121stASEEAnnual Conference and Exposition, Indianapolis, IN.
Mathews, M. (2013), “BIM collaboration in student architectural technologist learning”, Journal ofEngineering, Design and Technology, Vol. 11 No. 2, pp. 190-206.
Shelbourn, M., Macdonald, J., McCuen, T. and Lee, S. (2017), “Students’ perceptions of BIM education inthe higher education sector a UK and USA perspective”, Industry and Higher Education, Vol. 31No. 5, pp. 293-304.
Corresponding authorSolomon Olusola Babatunde can be contacted at: [email protected]
For instructions on how to order reprints of this article, please visit our website:www.emeraldgrouppublishing.com/licensing/reprints.htmOr contact us for further details: [email protected]
JEDT17,3
648
238

For Peer Review
Collaborative multi-disciplinary learning: Quantity surveying (QS) students’ perspective
Journal: Industry and Higher Education
Manuscript ID IHE-19-0060.R1
Manuscript Type: Article
Keywords: Quantity Surveying, Collaborative Learning, Multi-disciplinary Education, BIM, University Curriculum, Behaviours for Collaboration Mapping
Abstract:
The construction industry is highly fragmented and is known for its adversarial culture, culminating in poor quality projects not completed on time or within budget. The aim of this study is thus to guide the design of QS programme curricula in order to help students develop the requisite knowledge and skills to work more collaboratively in their multi-disciplinary future workplaces. A qualitative approach was considered appropriate as the authors were concerned with gathering an initial understanding of what students think of multi-disciplinary learning. The data collection method used was a questionnaire which was developed by the Behaviours4Collaboration (B4C) team. Knowledge gaps were still found across all the key areas where a future QS practitioner needs to be collaborative (either as a project contributor or as a project leader) despite the need for change instigated by the multi-disciplinary (BIM) education revolution. The study concludes that universities will need to be selective in teaching, and innovative in reorienting, QS education so that a collaborative BIM education can be effected in stages, increasing in complexity as the students’ technical knowledge grows. This will help students to build the competencies needed to make them future leaders. It will also support programme currency and delivery.
https://mc.manuscriptcentral.com/ihe
Industry and Higher Education
239
For Peer Review
Collaborative multidisciplinary learning:
Quantity surveying students’ perspectivesAuthors:
Damilola Ekundayo
University of Salford, UK
Mark Shelbourn
Birmingham City University, UK
Solomon Olusola Babatunde
Obafemi Awolowo University, Nigeria
Corresponding author:
Damilola Ekundayo, School of Science, Engineering and Environment, University of Salford, The
Crescent, Salford M5 4WT, UK. Email: [email protected]
Abstract:The construction industry is highly fragmented and is known for its adversarial culture, culminating in
poor quality projects not completed on time or within budget. The aim of this study is thus to guide
the design of quantity surveying (QS) programme curricula in order to help students develop the
requisite knowledge and skills to work more collaboratively in their multidisciplinary future
workplaces. A qualitative approach was considered appropriate as the authors were concerned with
gathering an initial understanding of what students think of multidisciplinary learning. The data
collection method used was a questionnaire developed by the Behaviours4Collaboration (B4C) team.
Knowledge gaps were still found across all the key areas in which a future QS practitioner needs to be
collaborative (either as a Project Contributor or as a Project Leader), despite the need for change
instigated by the multidisciplinary revolution in building information modelling (BIM) education. The
study concludes that universities will need to be selective in teaching, and innovative in reorienting,
QS education so that a collaborative BIM education can be effected in stages, increasing in
complexity as the students’ technical knowledge grows. This will help students to build the
Page 1 of 39
https://mc.manuscriptcentral.com/ihe
Industry and Higher Education
123456789101112131415161718192021222324252627282930313233343536373839404142434445464748495051525354555657585960
240

For Peer Review
competencies needed to make them future leaders. It will also support programme currency and
delivery.
Keywords:
Quantity surveying, collaborative learning, multidisciplinary education, BIM, university curriculum,
behaviours for collaboration mapping
The construction industry is changing rapidly due to changing clients’ needs, global trends and the
gradual introduction of new and disruptive technologies and processes to improve efficiency (Shayan
et al., 2019; Celik, 2013). Yet it is widely believed, especially among industry practitioners, that built
environment curricula are slow to respond to these changes, as explicated in successive studies (for
example: Beckman et al., 1997; McHardy and Allan, 2000; Owusu-Manu et al., 2014 and Palm and
Staffansson Pauli, 2018, amongst others). The industry is highly fragmented and is known for its
adversarial culture and relationships, culminating in projects not being completed on time, not
completed within budget and not adhering to the defined quality criteria or parameters (Wood, 1999;
Macdonald and Mills, 2013).
Indeed, the process of designing, constructing and maintaining a building or facility requires
several individuals and built environment professionals working together to achieve the desired
project outcomes. Such professionals include architects, architectural technologists, engineers,
quantity surveyors and construction project managers. Macdonald and Mills (2013) strongly argue
that integrated project delivery employing collaboration and disruptive technologies (such as BIM)
have the potential to enhance collaboration between these various groups of stakeholders and to
improve efficiency in the industry (which is lagging behind other sectors, such as the manufacturing
industry). Thus, the education of practitioners to this end has never been so important and worthy of
further investigation (Scott, 2015; Scott, 2016; Babatunde et al., 2018; Beckman et al., 1997; Palm
and Staffansson Pauli, 2018).
Built environment graduates, particularly the quantity surveyors of the future, will need to be
highly technical, adaptable, good communicators and also lifelong learners undertaking continuing
professional development (CPD). This is the view of many proponents in this field, including Nkado
and Meyer (2001); Male (1990); Yogeshwaran et al. (2018); Shafie et al. (2014); and Perera et al.
(2013). Such a goal provides the modern academic with many challenges. Commentators suggest that
the current model of pedagogy, which is at the heart of the current higher education experience, is
Page 2 of 39
https://mc.manuscriptcentral.com/ihe
Industry and Higher Education
123456789101112131415161718192021222324252627282930313233343536373839404142434445464748495051525354555657585960
241

For Peer Review
becoming obsolete (Scott et al., 2013; Scott, 2015). In the industrial model of student mass
production, the teacher is the broadcaster. However, we hear calls for more constructivist learner-
centred approaches. A multidisciplinary learning approach has the potential to create the opportunity
to develop the skills, competences and understanding that graduates now require (Wood, 1999;
Soetanto et al., 2012; Macdonald and Granroth, 2013; Puolitaival and Kestle, 2018). A holistic,
multidisciplinary approach to the design, construction, production and operation of buildings is likely
to require changes in the way the process is arranged, resourced and managed in the future. There will
be a different kind of professional in the next five years, whose education and/or training will need to
enable them to make the many connections in thinking and take the actions required to solve complex
problems in a digital age (Shayan et al., 2019; Özorhon and Karaciğan, 2020).
Future built environment professionals will challenge the conventions of the past and will use
their creative and innovative capacities. From a learning front engaged with digital technology, it is
now possible to embrace new collaboration models that change the paradigms in fundamental ways
(Özorhon and Karaciğan, 2020; Bryde et al., 2013; Georgiadou, 2019; Stanley and Thurnell, 2014).
But this pedagogical change is not about technology per se; nor is it about distance learning, or the
ability of students to access lectures by some of the world's leading professors from free online sites;
rather, this represents a change in the relationship between student and teacher in the learning process.
The assessment of the learning in such an approach is easily measured from the academic’s
perspective; teachers will observe students grow in confidence, understanding and knowledge as they
experience a positive constructivist learning engagement. By becoming a ‘guide on the side’ educator,
a teacher can provide the motivation and appetite for future innovation.
This paper offers reflections on a collaborative multidisciplinary learning project at a
university in the North West region of the UK, undertaken by students of architecture, architectural
technology, building surveying, construction project management, quantity surveying (QS) and real
estate and property management. This paper concentrates on the QS perspective and is concerned with
gathering students’ perceptions of multidisciplinary learning. The continued support of
multidisciplinary learning at the selected university is seen as vital to the creation of future leaders in
the built environment. The concept of sampling students to develop an understanding of an existing
phenomenon to better improve academic practice in a constructivist learner-centred approach in the
built environment is not new (see Babatunde et al., 2018; Babatunde and Ekundayo, 2019).
Additionally, this approach was used in Shelbourn et al. (2017) to gather students’ perceptions of BIM
education.
A qualitative approach, using the initially developed Collaborative Behavioural Map, was
considered appropriate for this study as the authors were concerned with gathering a preliminary
understanding of what students thought about their multidisciplinary education in an academic
environment. The study aim is thus to guide the design of QS programme curricula in order to help
students develop the requisite knowledge, skills and competencies to work more collaboratively; that
Page 3 of 39
https://mc.manuscriptcentral.com/ihe
Industry and Higher Education
123456789101112131415161718192021222324252627282930313233343536373839404142434445464748495051525354555657585960
242

For Peer Review
is, to acquire the behaviours badly needed in their multidisciplinary future workplace. It is intended
that the findings will be used in programme team meetings to facilitate discussions regarding the
behaviours that can be used to coach students to develop a more collaborative style in a constructivist,
project-based learning environment.
Collaborative multidisciplinary team educationMcGraw Hill has published several reports on surveys of North American architecture, engineering
and construction (AEC) firms concerning their requirements with regard to skills for collaborative
BIM. In 2009 they reported that ‘more internal staff with BIM skills, more external firms with BIM
skills, more incoming entry-level staff with BIM skills and more readily available training in BIM
were required to realize the potential value of BIM’ (McGraw Hill, 2009: 17). By 2012, the updated
report (McGraw Hill, 2012) showed small decreases in the percentages allocated to the collaborative
BIM skills required (possibly reflecting uptake by the industry), but collaborative BIM training was
still placed among the top three targets for investment by industry.
These reports show similarities with the study by Henderson and Jordan (2009), who
suggested that some of the additional skill-sets (in addition to traditional single-discipline learning)
required by industry included: ‘…knowledge of data management, information technology, energy
and material conservation, integrated building design, systems thinking, life cycle analysis, the design
processes, business and marketing skills, and project finance’ (p. 35).
It is the role of educators to instil in students the concepts of collaborative design and the full
potential of collaborative team integration, before they learn about the ‘old ways’ of working once
they graduate (Shelbourn et al., 2017). The concept of creating job-ready graduates brings to the fore
the ‘training versus educating’ debate. Gerber et al. (2015) demonstrate that there has been resistance
in the past among educators in universities with regard to providing training in collaborative computer
technologies as many are unfamiliar with such technologies. This often means that educators expect
students to learn appropriate technologies themselves, as they do many other software applications
(Williams et al., 2009). Given these precedents, one can assume the same approach to learning for
collaborative BIM, meaning that students will tend to focus on the technological aspects rather than
on developing an understanding of how BIM principles and processes could enable them to work
more effectively with others in a collaborative team environment.
With regard to the training versus education debate, many educators still view BIM as just
another piece of computer-aided design (CAD) software that students should learn in their own time.
At the same time, Kocaturk and Kiviniemi (2013), Puolitaival and Forsythe (2016), Underwood and
Ayoade (2015) and Woo (2007) assert that the challenges of integrating BIM technologies into
academic curricula cannot, and should not be, underestimated. Irrespective of the pedagogical
challenges, many argue that it is not the university’s role to produce ‘CAD technicians’ and that there
is little educational value in using CAD, or that CAD threatens creativity (Becerik-Gerber et al.,
Page 4 of 39
https://mc.manuscriptcentral.com/ihe
Industry and Higher Education
123456789101112131415161718192021222324252627282930313233343536373839404142434445464748495051525354555657585960
243

For Peer Review
2011). These concerns may be justified as the adoption of computers and 2D CAD has coincided with
a decrease in documentation quality and productivity (Engineers Australia, 2005). However,
collaborative BIM is not merely a new CAD tool or a computer application: it is a new paradigm and
its benefits extend much further than 3D drafting (Chegu Badrinath et al., 2016). Students cannot be
expected to teach themselves BIM any more than they can be expected to teach themselves structural
engineering (Engineers Australia, 2005; Gledson et al., 2016). From a learning point of view, there is
little difference between learning manual drafting techniques and learning 2D or 3D CAD. However,
with collaborative BIM, every part of the design and construction process can be compared, with
building performance also modelled at this stage and monitored in the operational phase. Both 2D and
3D CAD merely provide a way of documenting information about the building, whereas collaborative
BIM actually represents the building virtually with critical information contained within it to help
optimise the operation of the facility throughout its life cycle (Hu et al., 2017).
In addition to the resistance to using new technologies in teaching, the faculties in which this
learning is taking place can also be a barrier to learning, as shown by Kocaturk and Kiviniemi (2013)
and reinforced by Shelbourn et al. (2016). Since engineering and architecture emerged as separate
professions from the historical job title of ‘Master Builder’, students of the different disciplines have
tended to be educated in isolation from each other. According to Pressman (2007: p. 3):
‘Many academic programs still produce students who expect they will spend their careers
working as heroic, solitary designers. But integrated practice is sure to stimulate a rethinking
of that notion. Pedagogy must focus on teaching not only how to design and detail, but also
how to engage with and lead others, and how to collaborate with the professionals they are
likely to work with later.’
Starzyk and McDonald (2010) identified a focus in architectural education on developing individual
skills, such as the ability to draw. They have also noted that the importance of personal skills is
yielding to the primacy of collective knowledge. Scott (2015) found little or no integration or
collaboration between the disciplines in the majority of universities in the USA, Europe and Australia.
Moreover, the first time students are exposed to working with team members from other disciplines is
in the workplace, post-graduation. Shelbourn et al. (2017: 295) discuss this further and argue that
‘…it is important for graduates to have an understanding of the roles played by other professionals
and the impact their decisions have on projects overall’. However, the lack of multidisciplinary
collaborative learning means that students are not provided with such an understanding in many
current curricula across these countries.
Another issue to consider is the complexity of modern building projects and the technologies
used in their design and construction: such complexity means that nobody can be a master of all.
Students learning in their silos lack a deep understanding of the information that is required at
different stages of a project (Shelbourn et al., 2017). What is required is for students to work
Page 5 of 39
https://mc.manuscriptcentral.com/ihe
Industry and Higher Education
123456789101112131415161718192021222324252627282930313233343536373839404142434445464748495051525354555657585960
244
For Peer Review
collaboratively and to learn the requirements of the other disciplines before they graduate, often in
multidisciplinary modules, projects and even student competitions such as those offered as part of the
Associated Schools of Construction in the USA.
The problem is not restricted to learning in disciplinary silos; different departments are often
in separate schools or faculties and can be located on separate campuses (Shelbourn et al., 2016).
Sharing learning across the different silos is a challenge that needs to be addressed if graduates are to
leave their studies with the key understanding of the importance of collaboration (Shelbourn et al.,
2016). The need for change instigated by the BIM revolution (Cabinet Office, 2011) provides a great
opportunity to rethink how teaching and learning are designed, according to Shelbourn et al. (2017).
This view is shared in the later studies by Babatunde et al. (2018), Puolitaival and Kestle (2018) and
Babatunde and Ekundayo (2019).
Continuing the more positive note, Hardy, quoted in Deutsch (2011: p. 202) stated, ‘When I
look at the logic of construction means and methods that collaborative BIM inherently teaches, I see
the potential to educate.’ Nawari (2010: 312) noted that ‘students need to know how each discipline is
related to the other and how one discipline impacts the other’. Collaborative BIM can offer a better
opportunity, therefore, to engage students more effectively and to help with their understanding of
how buildings are constructed.
Mark et al. (2001) proposed an ‘ideal computer curriculum’ for architectural education in
which computing technologies were added to the existing curriculum without removing or adding
subjects. Mark et al. (2001) offered two alternative approaches: one that merged technology into the
traditional curriculum, and the other a more radical approach that displaced some existing subjects.
The proposal was limited to teaching BIM modelling for visualization or analysis within the
architectural discipline alone. Scott (2016: p. 552) highlighted the case for setting education in the
pragmatic paradigm, pointing out that ‘the freedom to work within the pragmatic paradigm offers
diversity that can draw together some of the thoughts that challenge and build the arguments about the
role and position of theory in construction education’ – a useful consideration when looking at
collaborative multidisciplinary education.
The global construction industry is witnessing a move towards a more collaborative way of
working with the growing awareness of, and implementation of, BIM – see Bryde et al. (2013),
Zainon et al. (2016); Ghaffarianhoseini et al. (2017), Vass and Gustavsson (2017) and Özorhon and
Karaciğan (2020). Team learning, typical of multidisciplinary BIM education, has been seen as a way
of achieving competence-based education, especially in vocational studies such as built environment
disciplines. In the opinion of Wijnia et al. (2016) and many others, students’ involvement in collective
team learning activities is crucial to the development of the necessary knowledge, skills and
competencies. Zhao et al. (2013) referred to this as BIM-enhanced team-based learning, an approach
considered capable of meeting future needs and industry’s expectations of new construction
Page 6 of 39
https://mc.manuscriptcentral.com/ihe
Industry and Higher Education
123456789101112131415161718192021222324252627282930313233343536373839404142434445464748495051525354555657585960
245
For Peer Review
graduates. In other words, the incorporation of BIM into construction education is expected to
improve collaboration and multidisciplinary working in the industry.
The challenge for academics wanting to educate undergraduates so that they can work
effectively in collaborative teams, putting together virtual (and eventually real-life) buildings, is when
and how to introduce elements of multidisciplinary knowledge, BIM technologies and the
development of team working skills. Collaborative, multidisciplinary education should be effected in
stages (Shelbourn et al., 2016), increasing in complexity as the students’ knowledge of the building
design and construction process grows (Gordon et al., 2009).
Research methodologyThis study was concerned with gathering students’ perceptions of multidisciplinary learning. A
qualitative approach was considered appropriate as the authors wanted to obtain an initial
understanding of what students thought of their multidisciplinary education in an academic
environment. The data collection method was a questionnaire. The researchers were not looking for
the reasons why the participants chose what they did with regard to working collaboratively, but were
more interested in what they thought at that moment. The questionnaire used was developed by the
Behaviours4Collaboration (B4C) team, which came together from research carried out at the
University of the West of England in Bristol, UK. The B4C team is made up of academics, built
environment professionals, and human resource management professionals who have a vested interest
in improving multidisciplinary collaborative practices and productivity in projects. The team has been
in existence since 2011 and is currently working closely with the UK BIM Task Group, the Centre for
Digital Built Britain (CDBB), and Transforming Construction Network Plus in defining the Pedagogy
and Upskilling research agenda. Digital Built Britain is the next phase of implementing BIM in the
industry and is the new name for Level 3 BIM in the UK.
The participants were all enrolled in a multidisciplinary module at a North Western
University in the UK. This module is a level 5 module (year 2 of the undergraduate degree) and at the
time of the survey 207 students were enrolled in it. There were responses from 12 students in
Architectural Design Technology, 10 in Architecture, 8 in Building Surveying, 10 in Construction
Project Management, 6 in Property and Real Estate Management and 29 in Quantity Surveying. This
paper discusses the findings from the responses from the QS students who completed the
questionnaire.
The B4C MapThe B4C team designed and developed the Collaborative Behaviours Map through several workshops,
which included representatives from both industry and academia. As can be seen from Figure 1, the
Page 7 of 39
https://mc.manuscriptcentral.com/ihe
Industry and Higher Education
123456789101112131415161718192021222324252627282930313233343536373839404142434445464748495051525354555657585960
246
For Peer Review
map consists of various levels on the left-hand side depicting differing levels of maturity of
collaborative behaviour. Across the top of the map are roles people can hold in the architecture,
engineering and construction industries:
A ‘Project Contributor’ is any person who undertakes a role in a project, including sub-
contractors.
‘Project Leaders’ are those who take on a leading role during the project. The Project Leader
is likely to change as the project progresses through its different phases.
A ‘Group Leader’ leads a part of an organisation, for example a sector, service, department or
area, and has impacts wider than the project although is not leading the organisation.
The ‘Organisation Leader’ leads the organisation at a strategic level and sets the tone for the
organisation in all aspects of its business.
The ‘Industry Leader’ is recognised by peers in the industry as someone who has to lead a
number of initiatives to move the industry forward at the policy making level.
Each of these roles signifies a different level of responsibility in the industry. It was determined in the
workshops that these different roles would require a different level of collaborative behaviour. The
roles listed above were discussed at some length in the workshops held to develop the behavioural
map.
The workshops also determined that there were several key areas for which ‘collaborative
behaviours’, as defined by the B4C team, were needed. Figure 2 shows these different behaviours.
Figures 1 and 2 about here
The aim of the map is to guide and advise an array of professionals on how to develop their
behaviours to work more collaboratively. It is the intention of the B4C team that the map should be
used in team meetings to facilitate discussions about the behaviours that can be used and to coach
individuals to develop a collaborative style. When users look at the higher levels of maturity it is
hoped that they will assume that the lower levels are also necessary (although they may not be
present); therefore, the behaviours are cumulative as the levels of maturity increase. The same is also
true for the behaviours applying to specific roles; those behaviours specified for the Project
Contributor are also required for the Industry Leader. It should be borne in mind that these behaviours
need examining within each individual using the map.
The B4C map was adapted for the purposes of the research discussed in this paper. As the
participants were level 5 undergraduate QS students it was decided by the research team that the
descriptors of ‘Group Leader’, ‘Organisation Leader’, and ‘Industry/Subject Leader’ would be
Page 8 of 39
https://mc.manuscriptcentral.com/ihe
Industry and Higher Education
123456789101112131415161718192021222324252627282930313233343536373839404142434445464748495051525354555657585960
247
For Peer Review
removed, making the map simpler for them to complete. Data were collected during a scheduled
teaching tutorial at the university in the ‘Project Contributor’ and ‘Project Leader’ sections, and the
results from these sections are discussed in the paper. The participants were given a brief introduction
to the B4C map and why the research was being conducted. Ethical considerations were given high
priority, so that all the participants were fully aware of the reasons for the data collection.
Findings and discussionAs already noted, the data for the study were collected through the administration of the B4C map to
level 5 undergraduate QS students in a university in the North West of England. The university has
one of the largest multidisciplinary schools of the built environment in the UK. The map was
administered to students taking the multidisciplinary project (MDP) module. This module is
undertaken by different disciplines in the school, including Architecture; Architecture, Design and
Technology; Building Surveying; Construction Project Management; Property and Real Estate; and
Quantity Surveying. However, this study focuses on the QS students’ perspectives of collaborative
multidisciplinary learning.
The MDP module aims to provide students with an opportunity to work in multidisciplinary
teams and to enable them to perform in a role/discipline in the context of a team-based project. The
project is always defined by an industrial organisation that works closely with the Built Environment
(BE) School. The module is designed to promote reflection on individual and team working and the
multidisciplinary nature of built environment (BE) projects, so that students are encouraged to
practise and further develop both the discipline-based and the generic key skills required by a BE
professional, including collaborative working and interpersonal skills.
In all, 29 fully completed responses were received from the QS students, all of which were
found suitable for analysis. The B4C maps were hand-delivered to the QS students present at the
MDP module session. Based on the different roles students had assumed in previous projects set in the
MDP module, when they had to work with other disciplines, they were guided through the completion
of the map by engaging in detailed reflection on the key collaborative behaviours and differing
maturity levels. This detailed guidance helped to achieve a high response rate of almost 100%.
Descriptive statistics were conducted for the analysis (techniques used included frequencies
and percentages). Percentages were used to indicate the maturity level(s) of the respondents in each of
the identified collaborative behaviours. Table 1 shows the results of the collaborative behavioural
mapping. Additionally, graphs depict where the respondent’s strength lies, either as a Project
Contributor and/or a Project Leader, at differing levels of maturity of collaborative behaviour.
Figures 3–6 show a general pattern in the behaviours of QS students with regard to working
collaboratively. As indicated in Figure 1, maturity level 0 typifies non-collaborative behaviour.
However, none of these students saw themselves at this level, which begs the question of why projects
are not always successful. Similarly, most students saw themselves at the upper end of the scale, as
Page 9 of 39
https://mc.manuscriptcentral.com/ihe
Industry and Higher Education
123456789101112131415161718192021222324252627282930313233343536373839404142434445464748495051525354555657585960
248
For Peer Review
can be seen in the graphs which show a gradual increment in the maturity level of collaborative
behaviour. Since the behaviours are cumulative as the levels of maturity increase, the gradual
increment is to be expected. The only exception is the issue of trust/respect; QS students as Project
Contributors prefer to be seen as communicating necessary information (indicative of maturity level
1) and not allowing distraction (typical of maturity level 2). This is logical, as a lower level of
maturity may be considered attractive if it relates more to the primary role and responsibilities of a
quantity surveyor.
Table 1 and figures 3–6 about here
It can be seen from Figure 7 that QS students as Project Contributors accord more emphasis
to trust/respect at maturity level 1 than to any other collaborative behaviour – perhaps because of the
need for quantity surveyors to be seen as trustworthy from the outset to reinforce their authority when
working as part of a project team, advising on costs and contractual matters.
Openness/communications and interdependent goals/new ways of working followed as joint
second, while the leadership/interpersonal impact factor was seen as less of a necessity at maturity
level 1: however, as the maturity level increased this factor became more important, especially to
achieve the project objectives. Similarly, trust/respect and openness/communications are key to
achieving project objectives and so show a similar trajectory. Whilst interdependent goals/new ways
of working might be gaining momentum at the lower maturity levels, it became relatively stable at the
highest level when other collaborative behaviours are much needed and/or desired.
Figures 7 and 8 about here
Figure 8 shows the collaborative behaviours of QS students as Project Leaders. At maturity
level 1, most students perceived that trust/respect was far more important to a Project Leader than in
any other key area in which they needed to be collaborative. Openness/communication and
interdependent goals/new ways of working followed in second position while the
leadership/interpersonal impact factor was not present. At maturity level 2 though, the
leadership/interpersonal impact factor was considered most important, while openness/communication
was considered the least relevant of the four collaborative behaviours. Similarly, at maturity level 3,
the leadership/interpersonal impact factor was perceived to be the most important, whilst at level 4 the
remaining three collaborative behaviours prevailed. It is reassuring to know that students understood
that trust/respect are key collaborative behaviours and a must-have for any Project Leader no matter
the maturity level, as well as openness/communications and setting interdependent goals/new ways of
workings in equal measure.
As shown in Figure 9, QS students see themselves more as Project Contributors than as
Project Leaders. This is evidenced at the various maturity levels except for level 3, where some
Page 10 of 39
https://mc.manuscriptcentral.com/ihe
Industry and Higher Education
123456789101112131415161718192021222324252627282930313233343536373839404142434445464748495051525354555657585960
249
For Peer Review
believed they should be seen more as Project Leaders. The views of the students are consistent with
the thinking of the B4C team in that the person undertaking the Project Leader role is likely to change
from time to time. Whilst quantity surveyors may perform the role of a cost estimator on a project,
they may also be required to take a leading role, for example, in contract administration and the
overall cost management of a project from inception to completion. This is when a quantity surveyor
may assume the role of a Project Leader rather than simply acting as a Project Contributor.
Figure 9 about here
As the results show, the QS students believed they were mostly collaborative, as either
Project Leaders or Project Contributors, in all the key areas identified. In fact, none of them thought
they exhibited non-collaborative behaviours, although this is open to debate and interpretation. It
would be interesting to see what students of other disciplines think of the maturity levels of QS
students in the key areas in which they need to be collaborative. Also of interest is the collaborative
behaviour of other professionals in the built environment and how they compare with each other.
According to the literature, a lack of multidisciplinary collaborative learning in most BE
curricula and a lack of integration between the disciplines in BE schools are issues that most
participants in the education versus training debate are keen to see resolved (Scott, 2015; Shelbourn et
al., 2017; Starzyk and McDonald, 2010). At face value, it appears that the MDP module is providing
QS students with the opportunity to develop the necessary skills through collaborative
multidisciplinary learning and by working with team members from other disciplines. Further
research is required to ascertain the true effect of this positive development in the workplace post-
graduation.
Table 1 shows the different roles that a quantity surveyor can assume in the construction
industry and the different levels of collaborative behaviour attainable. It is worth noting that
approximately half of the respondents are still below maturity level 4 and are not as collaborative as
they could be. Though the behaviours are cumulative as the levels of maturity increase, other key
areas in which a person needs to be collaborative as a Project Leader or a Project Contributor are not
present in nearly half of the students. This is a rather disturbing finding in light of the importance of
collaboration and team working skills in the construction industry. These are the people who will be
required to collaborate with other professionals in the future to help us build and maintain the built
and natural environments.
The results of this study, therefore, affirm the findings of Pressman (2007) and Nawari (2010)
concerning the challenge for academics of teaching future BE professionals how to engage with and
lead others so they can work effectively in teams. There is a growing need for pedagogy to focus on
multidisciplinary collaborative BIM education if we are to produce graduates with the necessary
skills. Integrating the B4C map into the BE curriculum may help to facilitate teaching of the
Page 11 of 39
https://mc.manuscriptcentral.com/ihe
Industry and Higher Education
123456789101112131415161718192021222324252627282930313233343536373839404142434445464748495051525354555657585960
250

For Peer Review
behaviours needed to develop a collaborative approach and to equip our future BE professionals
accordingly.
Conclusions and future researchCollaborative multidisciplinary learning has become an inevitable trend in recent years due to the
need for academics to educate undergraduates so they can work effectively in collaborative teams,
putting together virtual (and eventually real-life) buildings and capable of taking care of our built and
natural environments. Collaborative education has gained in popularity and momentum in BE/AEC
curricula in the UK and abroad because of the industry’s requirement for skills for collaborative BIM,
the need for collaborative BIM training (which is a top priority for investment by industry), and the
changing role of educators in creating job-ready graduates.
The complexity of modern building projects and the technologies used in their design and
construction mean that students need to work collaboratively and learn the requirements of other
disciplines before they graduate, often in multidisciplinary modules and projects. Thus, quantity
surveyors, as part of the construction industry, have an important role to play in instigating the
necessary changes. This study found that the QS students surveyed were aware of the need to share
learning across disciplinary silos, and all respondents exhibited positive behaviours with regard to
collaboration, albeit at differing levels of maturity. This demonstrates that the critical role of the
university in bringing an understanding of the importance of collaboration to students has been
successful. It is also important that the university nurtures these positive attitudes to enable the
students to engage in collaborative multidisciplinary learning more wholeheartedly.
The study revealed that the implementation of the multidisciplinary module in the curriculum
has been successful to a certain extent in introducing collaborative behaviours holistically. It further
showed that students had differing levels of maturity in the key areas they need in order to be
collaborative. Several students believed that they showed high levels of maturity in the stated
collaborative behaviours and their level of maturity was strongly related to their discipline, even if
that discipline only required them to operate at a lower level of maturity. For example, quantity
surveyors placed higher importance on ‘communicating necessary information’ (typical of maturity
level 1) than on ‘not allowing distraction’ (typical of maturity level 2).
Of the identified collaborative behaviours, ‘trust and respect’ is a key area in which quantity
surveyors need to excel, whether working as a Project Contributor or a Project Leader. Trust and
respect are seen as the bedrock of any successful collaboration. At maturity levels 1, 2 and 4, students
saw themselves as Project Contributors, whilst at maturity level 3 they believed they should be seen
more as Project Leaders. Perhaps the only conclusion that can be drawn from these results is that
quantity surveyors can work either as a Project Contributor or as a Project Leader, depending on their
level of responsibility. The views of the students are consistent with the thinking of the B4C team
(which designed and developed the Collaborative Behaviours Map) in that the person undertaking the
Page 12 of 39
https://mc.manuscriptcentral.com/ihe
Industry and Higher Education
123456789101112131415161718192021222324252627282930313233343536373839404142434445464748495051525354555657585960
251

For Peer Review
Project Leader role is likely to change from time to time. However, knowledge gaps were found
across all the key areas for collaboration either as Project Contributor or as Project Leader. Almost
half of the students placed a low level of importance on collaborative behaviours despite the need for
change instigated by the BIM revolution.
This study has certain limitations. Firstly, considering what other disciplines think of the
maturity levels of quantity surveyors in the key areas where they need to be collaborative would have
enhanced the credibility of the findings. Secondly, although using a multidisciplinary learning project
allows collaborative behaviours to be tested, looking at how the other industry professionals compare
with each other may enrich the findings. Despite these limitations, however, the findings of this study
may be considered reliable as they are drawn from a fieldwork approach that involved getting students
to share their true experiences. Therefore, further research might be conducted involving several
universities and AEC firms on a periodical basis, and comparisons could be made to monitor progress
in the curriculum and changes in industry’s expectations of students’ collaborative behaviours. It
might also be useful for the university to conduct a survey to ascertain whether the knowledge and
skills gained by graduates are relevant to their working careers or are put into actual practice in the
workplace after graduation.
These findings show that there is room for improvement amid the continuing training versus
education debate in the BE curriculum. A multidisciplinary learning approach can create opportunities
to develop the competencies, knowledge and the key understanding of the importance of collaboration
that graduates now require. Also, the university should be selective in teaching and innovative in
reorienting QS education so that collaborative BIM education can be effected in stages, increasing in
complexity as the students’ technical knowledge grows. This will help students build the skills,
competences and understanding needed to make them future leaders in the built environment.
The study should, therefore, be of value to BE and AEC schools in assisting them to develop
a methodology for incorporating a multidisciplinary learning approach into their curricula. The B4C
map can be used for mapping understanding of the key skills in the QS curriculum to determine its
currency, as demonstrated in this study. Integrating the B4C map into the curriculum in this way will
help to establish and facilitate the teaching of the behaviours needed for collaborative work and so to
equip our future professionals effectively. The industry will also benefit through using the B4C
mapping framework to establish the key skills a graduate quantity surveyor needs in order to be
collaborative. Additionally, professional bodies can use the framework developed for regulating
professionally-oriented degree programmes in higher education.
ReferencesBabatunde S. O. and Ekundayo D. (2019) Barriers to the incorporation of BIM into quantity
surveying undergraduate curriculum in the Nigerian universities. Journal of Engineering,
Design and Technology 17: 629-648.
Page 13 of 39
https://mc.manuscriptcentral.com/ihe
Industry and Higher Education
123456789101112131415161718192021222324252627282930313233343536373839404142434445464748495051525354555657585960
252
For Peer Review
Babatunde S. O., Ekundayo D., Babalola O., et al. (2018) Analysis of the drivers and benefits of BIM
incorporation into quantity surveying profession: Academia and students’ perspectives.
Journal of Engineering, Design and Technology 16: 750-766.
Becerik-Gerber B., Gerber D. J. and Ku K. (2011) The pace of technological innovation in
architecture, engineering, and construction education: integrating recent trends into the
curricula. Journal of Information Technology in Construction 16: 411-432.
Beckman K., Coulter N., Khajenoori S., et al. (1997) Collaborations: Closing the industry-academia
gap. IEEE Software 14: 49-57.
Bryde D., Broquetas M. and Volm J. M. (2013) The project benefits of Building Information
Modelling (BIM). International Journal of Project Management 31: 971-980.
Cabinet Office (2011) Government Construction Strategy. Available at:
https://www.gov.uk/government/uploads/system/uploads/attachment_data/file/61152/Govern
ment-Construction-Strategy_0.pdf (accessed 18 April 2019).
Celik B. G. (2013) Exploring Sustainable Development and Its Interpretation in the Built
Environment. Journal of Sustainable Development 6: 83-91.
Chegu Badrinath A., Chang Y. T. and Hsieh S. H. (2016) A review of tertiary BIM education for
advanced engineering communication with visualisation. Visualisation in Engineering 4: 1-
17.
Deutsch R. (2011) BIM and Integrated Design: Strategies for Architectural Practice. New Jersey:
John Wiley & Sons.
Engineers Australia (2005) Getting it Right First Time: A Plan to Reverse declining standards in
project design documentation within the building and construction industry. Available at:
http://codebim.com/wp-content/uploads/2013/06/Getting-It-Right-The-First-Time.pdf
(accessed 18 April 2019).
Georgiadou M. C. (2019) An overview of benefits and challenges of building information modelling
(BIM) adoption in UK residential projects. Construction Innovation 19: 298-320.
Gerber D., Khashe S. and Smith I. (2015) Surveying the evolution of computing in architecture,
engineering, and construction education. Journal of Computing in Civil Engineering 29: 1-12.
Ghaffarianhoseini A., Tookey J., Ghaffarianhoseini A., et al. (2017) Building Information Modelling
(BIM) uptake: Clear benefits, understanding its implementation, risks and challenges.
Renewable and Sustainable Energy Reviews 75: 1046-1053.
Page 14 of 39
https://mc.manuscriptcentral.com/ihe
Industry and Higher Education
123456789101112131415161718192021222324252627282930313233343536373839404142434445464748495051525354555657585960
253
For Peer Review
Gledson B., Hilton D. and Rogage K. (2016) Benchmarking BIM Levels of Training and Education
amongst Construction Management Practitioners. In: 32nd Annual ARCOM Conference,
Manchester, UK, 5–7 September 2016.
Gordon C., Azambuja M. and Werner A. M. (2009) BIM across the construction curriculum. In: ASC
Region III Conference, Downers Grove, Illinois, 21–24 October 2009.
Henderson L. and Jordan N. L. (2009) A modest proposal for a transdisciplinary curriculum for the
design, construction, management and maintenance of architecture. Journal of Building
Information Modeling Fall 2009.
Hu Z. Z., Tian P. L., Li S. W., et al. (2018) BIM-based integrated delivery technologies for intelligent
MEP management in the operation and maintenance phase. Advances in Engineering
Software 115: 1-16.
Kocaturk T. and Kiviniemi A. (2013) Challenges of Integrating BIM in Architectural Education.
eCAADe 31 - Computation and Performance Delft, The Netherlands: Faculty of Architecture,
Delft University of Technology, 465-474.
Macdonald J. and Mills J. (2013) An IPD approach to construction education. Construction
Economics and Building 13: 93-103.
Macdonald J. A. and Granroth M. (2013) Multidisciplinary AEC Education Utilising BIM / PLIM
Tools and Processes. In: Bernard A,. Rivest L. and Dutta D. (eds) Product Lifecycle
Management for Society. PLM 2013. IFIP Advances in Information and Communication
Technology. Heidelberg, Berlin: Springer, 663-674.
Male S. (1990) Professional authority, power and emerging forms of 'profession' in quantity
surveying. Construction Management and Economics 8: 191-204.
Mark E., Martens B. and Oxman R. (2001) The ideal computer curriculum. In: Architectural
Information Management: 19th eCAADe Conference (ed H Penttila and H Penttillä), Helsinki,
Finland, pp. 168-175. Finland: Helsinki University of Technology (HUT).
McGraw Hill (2009) SmartMarket Report: The Business Value of BIM: Getting Building Information
Modeling to the Bottom Line. Bedford, MA: McGraw Hill Construction.
McGraw Hill (2012), SmartMarket Report: The Business Value of BIM in North America: Multi-Year
Trend Analysis and User Ratings (2007-2012). Bedford, MA: McGraw Hill Construction.
McHardy P. and Allan T. (2000) Closing the gap between what industry needs and what HE provides.
Education + Training 42: 496-508.
Page 15 of 39
https://mc.manuscriptcentral.com/ihe
Industry and Higher Education
123456789101112131415161718192021222324252627282930313233343536373839404142434445464748495051525354555657585960
254

For Peer Review
Nawari N. O. (2010) Intelligent Design in AEC Education. ITcon 15: 306-317.
Nkado R. and Meyer T. (2001) Competencies of professional quantity surveyors: A South African
perspective. Construction Management and Economics 19: 481-491.
Owusu-Manu D-G., Edwards D. J., Holt G. D., et al. (2014) Industry and Higher Education
Integration: A Focus on Quantity Surveying Practice. Industry and Higher Education 28: 27-
37.
Özorhon B. and Karaciğan A. (2020) Drivers of BIM Implementation in a High Rise Building Project.
In: Ofluoglu S., Ozener O. O. and Isikdag U. (eds) Advances in Building Information
Modeling. Istanbul, Turkey: Springer International Publishing, 28-39.
Palm P. and Staffansson Pauli K. (2018) Bridging the Gap in real estate education : higher-order
learning and industry incorporation. Journal Of Real Estate Practice And Education 21: 59-
75.
Perera S., Pearson J., Ekundayo D., et al. (2013) Professional, academic and industrial development
needs: a competency mapping and expert opinion review. International Journal of Strategic
Property Management 17: 143-160.
Pressman A. (2007) Integrated Practice in Perspective: A New Model for the Architectural Profession.
Architectural Record May 2007.
Puolitaival T. and Forsythe P. (2016) Practical challenges of BIM education. Structural Survey 34:
351-366.
Puolitaival T. and Kestle L. (2018) Teaching and learning in AEC education–the building information
modelling factor. ITcon 23: 195-214.
Scott A. J., Carter C., Reed M. R., et al. (2013) Disintegrated development at the rural–urban fringe:
Re-connecting spatial planning theory and practice. Progress in Planning 83: 1-52.
Scott L. (2015) The Changing Landscape of Construction Higher Education. International Journal of
Construction Education and Research 11: 78-78.
Scott L. (2016) Theory and research in construction education: the case for pragmatism. Construction
Management and Economics 34: 552-560.
Shafie H., Syed Khuzzan S. M. and Mohyin N. A. (2014) Soft Skills Competencies of Quantity
Surveying Graduates in Malaysia: Employers’ Views and Expectations. International Journal
of Built Environment and Sustainability 1: 9-17.
Page 16 of 39
https://mc.manuscriptcentral.com/ihe
Industry and Higher Education
123456789101112131415161718192021222324252627282930313233343536373839404142434445464748495051525354555657585960
255
For Peer Review
Shayan S., Kim K., Ma T., et al. (2019) Emerging Challenges and Roles for Quantity Surveyors in the
Construction Industry. Management Review : An International Journal 14: 82-96.
Shelbourn M., Macdonald J. and Mills J. E. (2016) Developing an international framework for BIM
education in the HE sector. In: 10th Academic Interoperability Coalition (AIC) BIM
Symposium, Orlando, Florida, USA, 4–5 April 2016.
Shelbourn M., Macdonald J., McCuen T., et al. (2017) Students’ perceptions of BIM education in the
higher education sector: a UK and US perspective. Industry and Higher Education 31: 293-
304.
Soetanto R., Childs M., Poh P., et al. (2012) Global Multidisciplinary Learning in Construction
Education: Lessons from Virtual Collaboration of Building Design Teams. Civil Engineering
Dimension 14: 173-181.
Stanley R. and Thurnell D. P. (2014) The benefits of, and barriers to, implementation of 5D BIM for
quantity surveying in New Zealand. Construction Economics and Building 14: 105-117.
Starzyk G. F. and McDonald M. (2010) The Collaborative Dance: Only Three Steps. In: BIM-Related
Academic Workshop (ed G Salazar and R Issa), Washington DC, 7-9 December 2010.
Underwood J. and Ayoade O. A. (2015) Current position and associated challenges of BIM education
in UK higher education. Salford, UK: BIM Academic Forum.
Vass S. and Gustavsson T. K. (2017) Challenges when implementing BIM for industry change.
Construction Management and Economics 35: 597-610.
Wijnia L., Kunst E. M, van Woerkom M., et al. (2016) Team learning and its association with the
implementation of competence-based education. Teaching and Teacher Education 56: 115-
126.
Williams A., Sher W., Simmons C., et al. (2009) Construction Education in Australia: a review of
learning and teaching challenges and opportunities. Australian Learning and Teaching
Council.
Woo J. H. (2007) BIM (Building Information Modeling) and Pedagogical Challenges. 43rd ASC
National Annual Conference. Washington, District of Columbia: Citeseer.
Wood G. (1999) Interdisciplinary working in built environment education. Education + Training 41:
373-380.
Page 17 of 39
https://mc.manuscriptcentral.com/ihe
Industry and Higher Education
123456789101112131415161718192021222324252627282930313233343536373839404142434445464748495051525354555657585960
256

For Peer Review
Yogeshwaran G., Perera B. A. K. S. and Ariyachandra M. R. M. F. (2018) Competencies expected of
graduate quantity surveyors working in developing countries. Journal of Financial
Management of Property and Construction 23: 202-220.
Zainon N., Mohd-Rahim F. A. and Salleh H. (2016) The Rise Of BIM in Malaysia And Its Impact
Towards Quantity Surveying Practices. MATEC Web of Conferences 66.
Zhao D., Sands K., Wang Z., et al. (2013) Building information modeling-enhanced team-based
learning in construction education. 12th International Conference on Information Technology
Based Higher Education and Training (ITHET). Antalya, Turkey, 1-5.
Page 18 of 39
https://mc.manuscriptcentral.com/ihe
Industry and Higher Education
123456789101112131415161718192021222324252627282930313233343536373839404142434445464748495051525354555657585960
257

For Peer Review
Figure captions
Figures are supplied in separate files (Figs 3-9 in both Word and Excel – please use whichever is best
for reproduction.)
Figure 1. A sample page from the B4C Collaborative Behavioural Map.
Figure 2. The 8 collaborative behaviours devised by the B4C team.
Figure 3. Students’ knowledge level on the leadership/interpersonal impact factor.
Figure 4. Students’ knowledge level on openness/communications.
Figure 5. Students’ knowledge level on interdependent goals/new ways of working.
Figure 6. Students’ knowledge level on trust/respect.
Figure 7. QS students as Project Contributors and the perceived importance of collaborative
behaviours.
Figure 8. QS students as Project Leaders and the perceived importance of collaborative behaviours.
Figure 9. The Collaborative Behavioural Map.
Table 1 is supplied in two separate files (Word and Excel) – please use whichever is best)
Page 19 of 39
https://mc.manuscriptcentral.com/ihe
Industry and Higher Education
123456789101112131415161718192021222324252627282930313233343536373839404142434445464748495051525354555657585960
258

For Peer Review
189x134mm (150 x 150 DPI)
Page 20 of 39
https://mc.manuscriptcentral.com/ihe
Industry and Higher Education
123456789101112131415161718192021222324252627282930313233343536373839404142434445464748495051525354555657585960 259
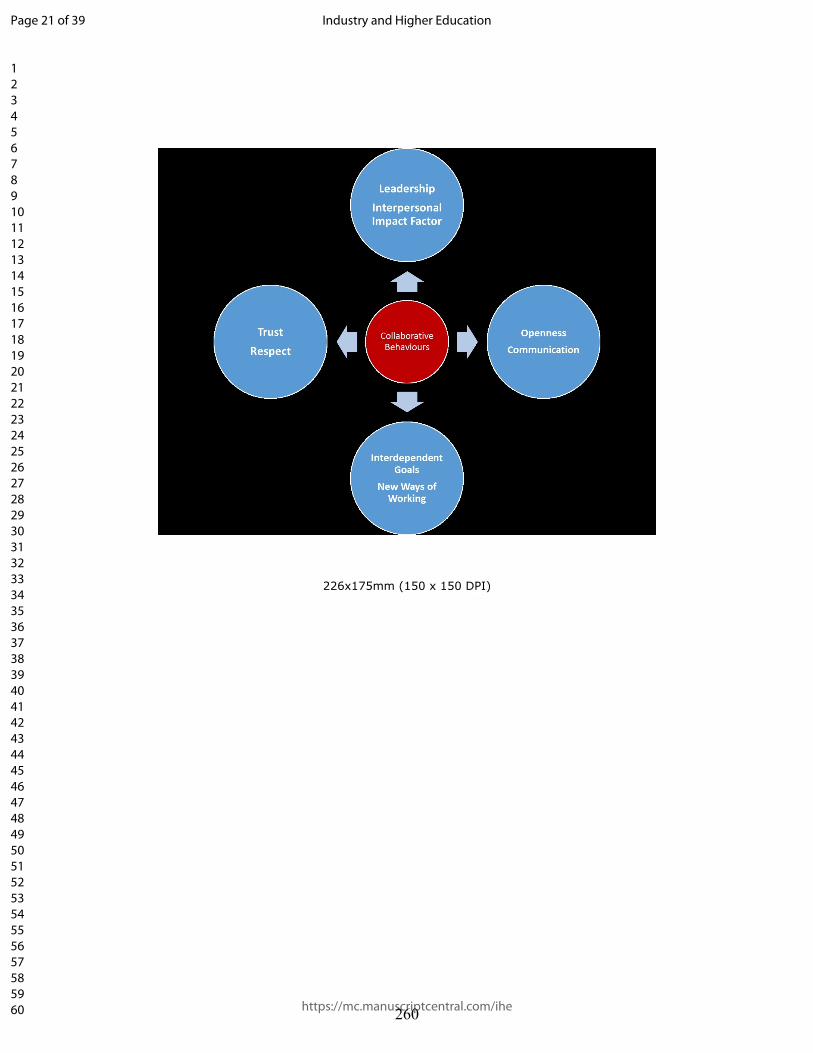
For Peer Review
226x175mm (150 x 150 DPI)
Page 21 of 39
https://mc.manuscriptcentral.com/ihe
Industry and Higher Education
123456789101112131415161718192021222324252627282930313233343536373839404142434445464748495051525354555657585960 260
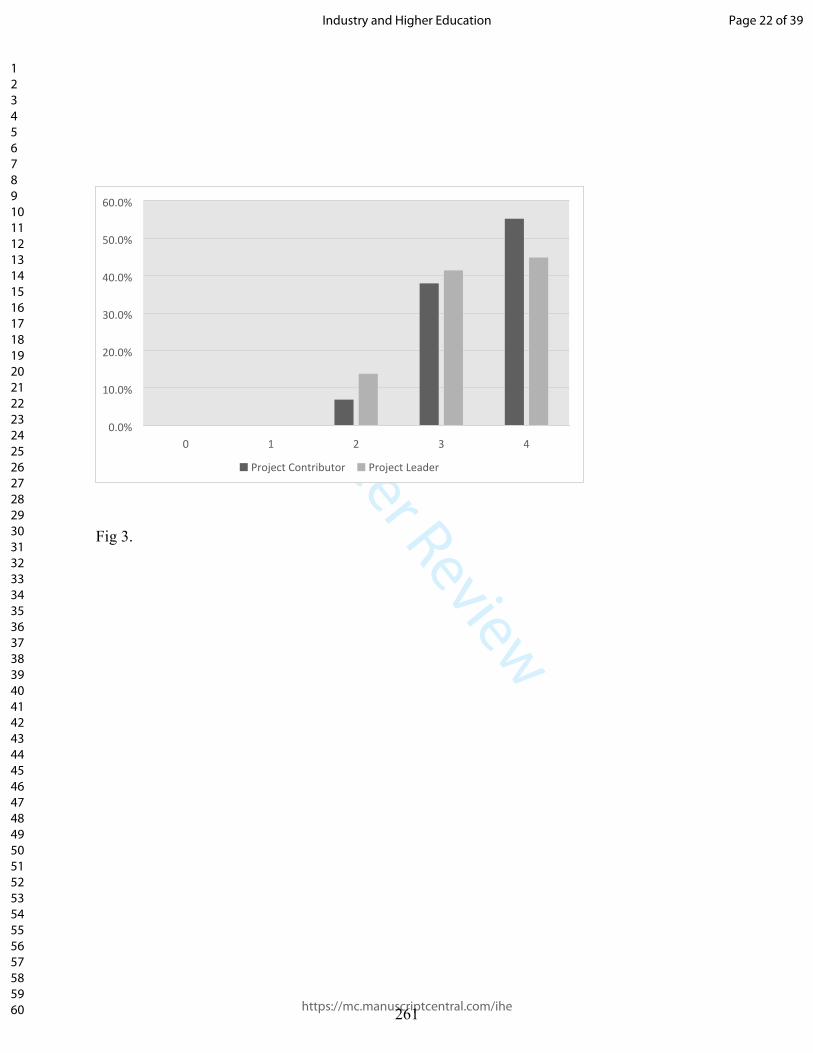
For Peer Review
0 1 2 3 40.0%
10.0%
20.0%
30.0%
40.0%
50.0%
60.0%
Project Contributor Project Leader
Fig 3.
Page 22 of 39
https://mc.manuscriptcentral.com/ihe
Industry and Higher Education
123456789101112131415161718192021222324252627282930313233343536373839404142434445464748495051525354555657585960 261
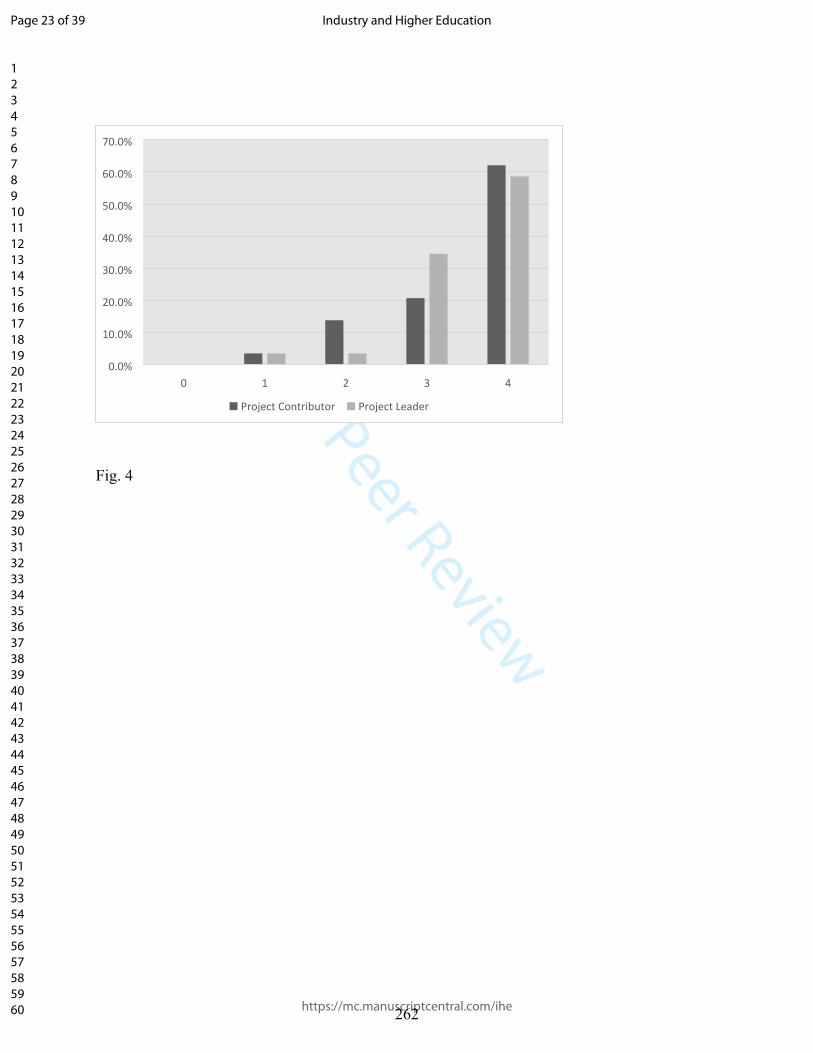
For Peer Review0 1 2 3 4
0.0%
10.0%
20.0%
30.0%
40.0%
50.0%
60.0%
70.0%
Project Contributor Project Leader
Fig. 4
Page 23 of 39
https://mc.manuscriptcentral.com/ihe
Industry and Higher Education
123456789101112131415161718192021222324252627282930313233343536373839404142434445464748495051525354555657585960 262
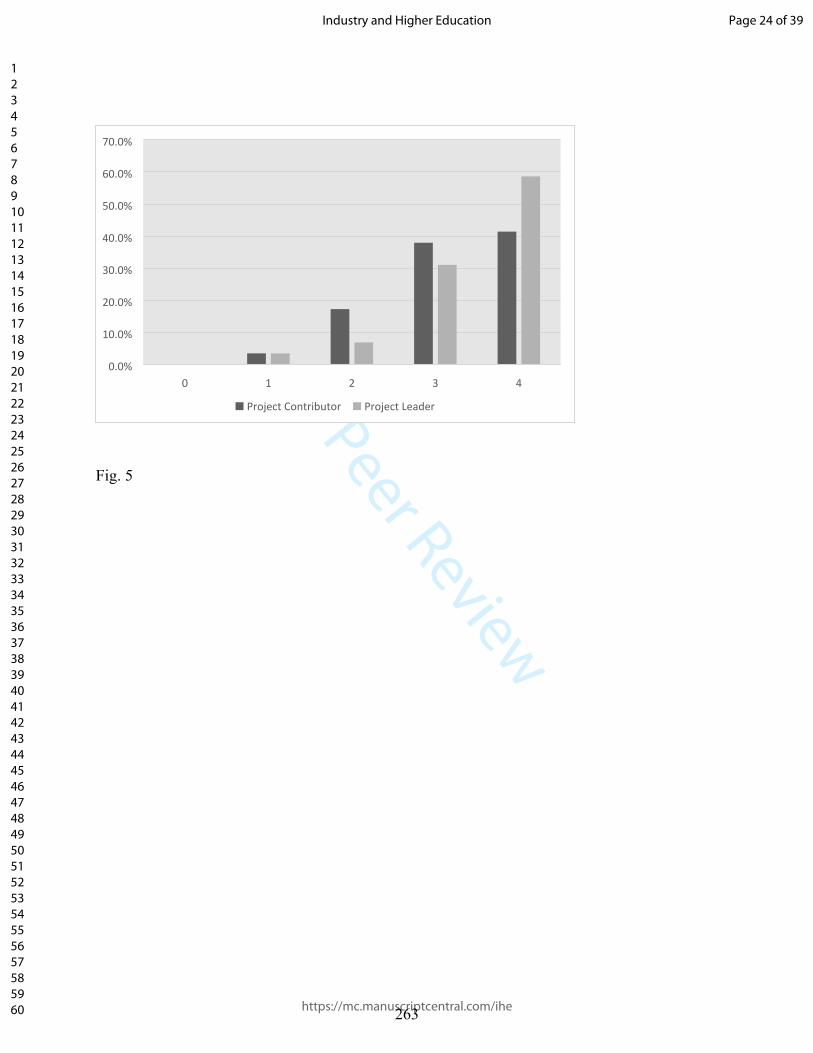
For Peer Review0 1 2 3 4
0.0%
10.0%
20.0%
30.0%
40.0%
50.0%
60.0%
70.0%
Project Contributor Project Leader
Fig. 5
Page 24 of 39
https://mc.manuscriptcentral.com/ihe
Industry and Higher Education
123456789101112131415161718192021222324252627282930313233343536373839404142434445464748495051525354555657585960 263
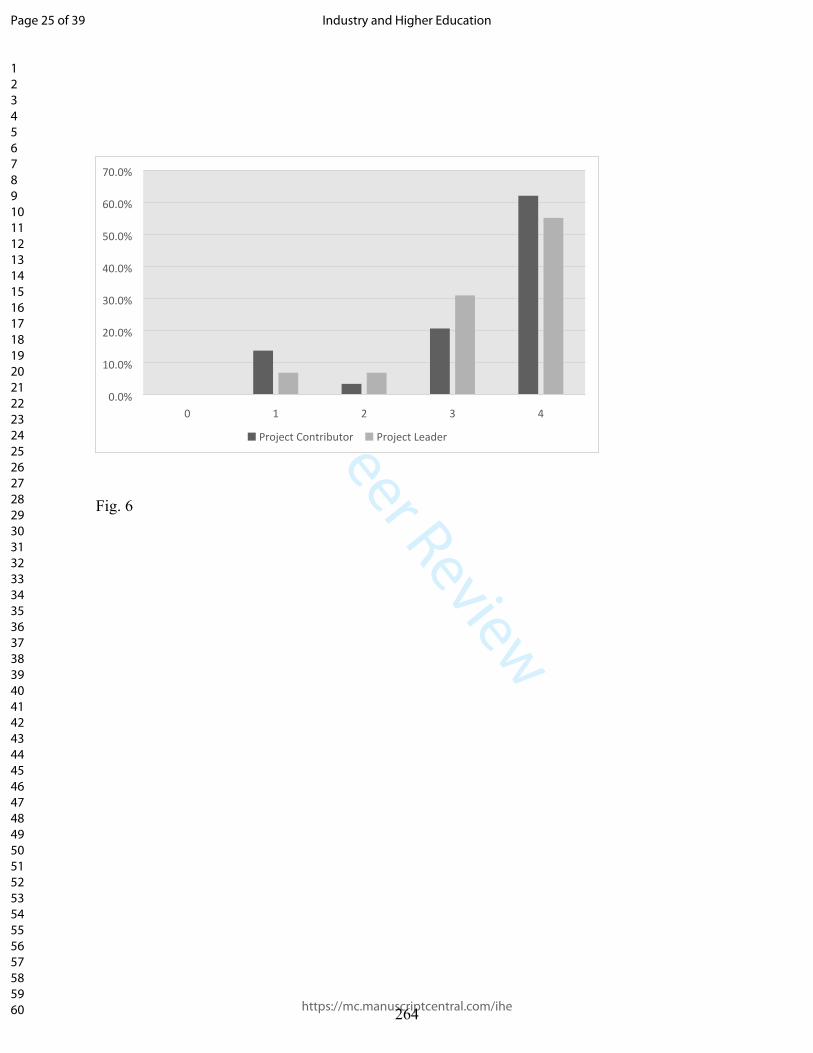
For Peer Review
0 1 2 3 40.0%
10.0%
20.0%
30.0%
40.0%
50.0%
60.0%
70.0%
Project Contributor Project Leader
Fig. 6
Page 25 of 39
https://mc.manuscriptcentral.com/ihe
Industry and Higher Education
123456789101112131415161718192021222324252627282930313233343536373839404142434445464748495051525354555657585960 264
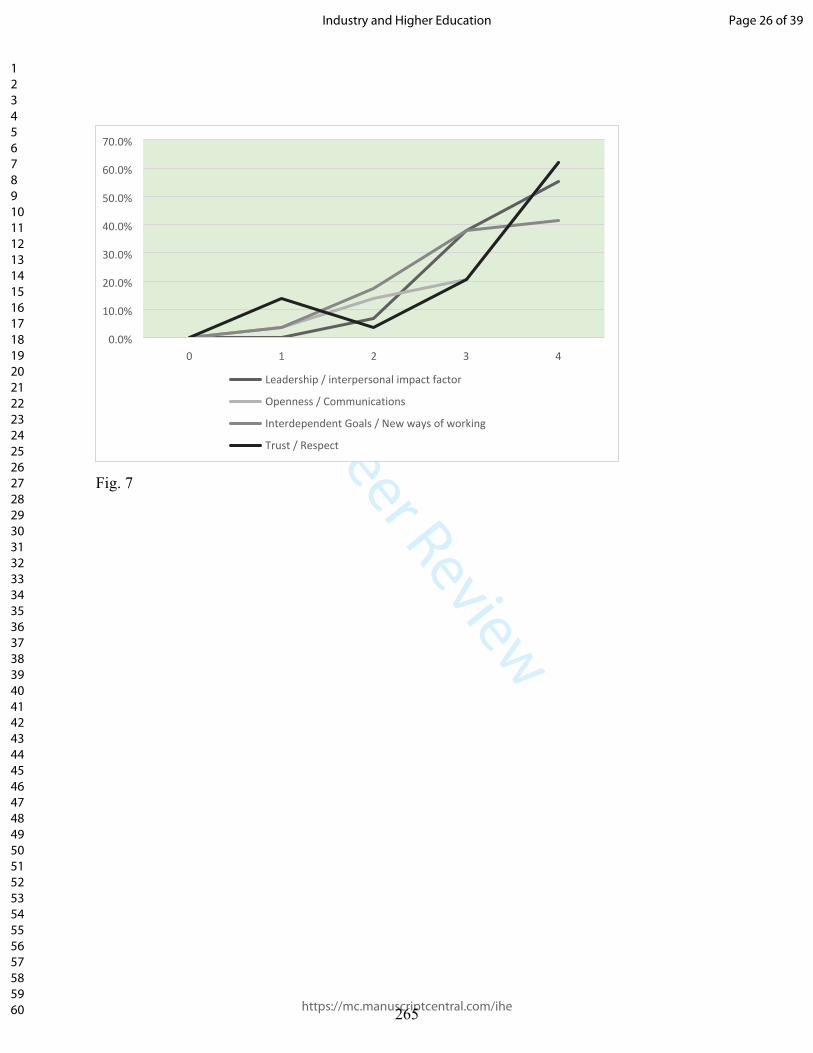
For Peer Review0 1 2 3 4
0.0%
10.0%
20.0%
30.0%
40.0%
50.0%
60.0%
70.0%
Leadership / interpersonal impact factor
Openness / Communications
Interdependent Goals / New ways of working
Trust / Respect
Fig. 7
Page 26 of 39
https://mc.manuscriptcentral.com/ihe
Industry and Higher Education
123456789101112131415161718192021222324252627282930313233343536373839404142434445464748495051525354555657585960 265

For Peer Review0 1 2 3 4
0.0%
10.0%
20.0%
30.0%
40.0%
50.0%
60.0%
70.0%
Leadership / interpersonal impact factor
Openness / Communications
Interdependent Goals / New ways of working
Trust / Respect
Fig. 8.
Page 27 of 39
https://mc.manuscriptcentral.com/ihe
Industry and Higher Education
123456789101112131415161718192021222324252627282930313233343536373839404142434445464748495051525354555657585960 266

For Peer Review0 1 2 3 4
0.0%
50.0%
100.0%
150.0%
200.0%
250.0%
Project Contributor Project Leader
Fig. 9
Page 28 of 39
https://mc.manuscriptcentral.com/ihe
Industry and Higher Education
123456789101112131415161718192021222324252627282930313233343536373839404142434445464748495051525354555657585960 267
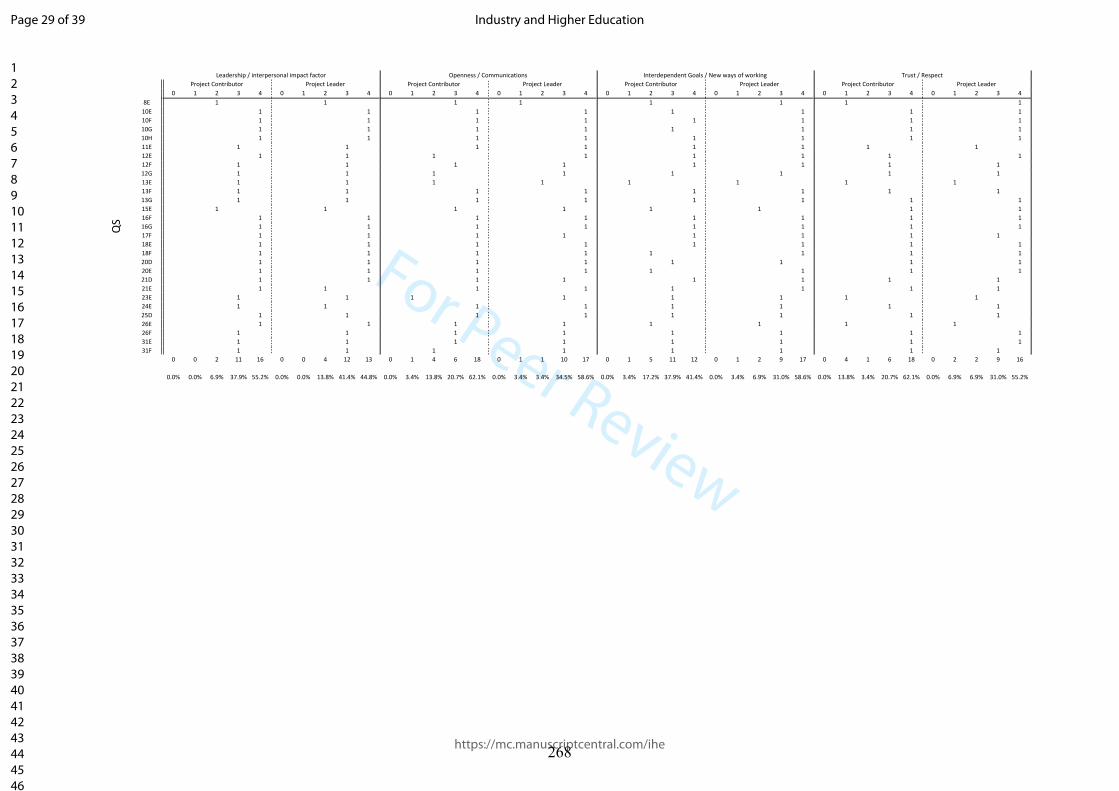
For Peer Review
Leadership / interpersonal impact factor Openness / Communications Interdependent Goals / New ways of working Trust / RespectProject Contributor Project Leader Project Contributor Project Leader Project Contributor Project Leader Project Contributor Project Leader
0 1 2 3 4 0 1 2 3 4 0 1 2 3 4 0 1 2 3 4 0 1 2 3 4 0 1 2 3 4 0 1 2 3 4 0 1 2 3 4
QS
8E 1 1 1 1 1 1 1 110E 1 1 1 1 1 1 1 110F 1 1 1 1 1 1 1 110G 1 1 1 1 1 1 1 110H 1 1 1 1 1 1 1 111E 1 1 1 1 1 1 1 112E 1 1 1 1 1 1 1 112F 1 1 1 1 1 1 1 112G 1 1 1 1 1 1 1 113E 1 1 1 1 1 1 1 113F 1 1 1 1 1 1 1 113G 1 1 1 1 1 1 1 115E 1 1 1 1 1 1 1 116F 1 1 1 1 1 1 1 116G 1 1 1 1 1 1 1 117F 1 1 1 1 1 1 1 118E 1 1 1 1 1 1 1 118F 1 1 1 1 1 1 1 120D 1 1 1 1 1 1 1 120E 1 1 1 1 1 1 1 121D 1 1 1 1 1 1 1 121E 1 1 1 1 1 1 1 123E 1 1 1 1 1 1 1 124E 1 1 1 1 1 1 1 125D 1 1 1 1 1 1 1 126E 1 1 1 1 1 1 1 126F 1 1 1 1 1 1 1 131E 1 1 1 1 1 1 1 131F 1 1 1 1 1 1 1 1
0 0 2 11 16 0 0 4 12 13 0 1 4 6 18 0 1 1 10 17 0 1 5 11 12 0 1 2 9 17 0 4 1 6 18 0 2 2 9 16
0.0% 0.0% 6.9% 37.9% 55.2% 0.0% 0.0% 13.8% 41.4% 44.8% 0.0% 3.4% 13.8% 20.7% 62.1% 0.0% 3.4% 3.4% 34.5% 58.6% 0.0% 3.4% 17.2% 37.9% 41.4% 0.0% 3.4% 6.9% 31.0% 58.6% 0.0% 13.8% 3.4% 20.7% 62.1% 0.0% 6.9% 6.9% 31.0% 55.2%
Page 29 of 39
https://mc.manuscriptcentral.com/ihe
Industry and Higher Education
123456789101112131415161718192021222324252627282930313233343536373839404142434445464748495051525354555657585960
268

For Peer Review
Number %Quantity Surveyor 29 100.0%
Figure 3. Students’ knowledge level on leadership / interpersonal impact factor
Maturity Level 0 1 2 3 4Project Contributor 0.0% 0.0% 6.9% 37.9% 55.2% 100.0%Project Leader 0.0% 0.0% 13.8% 41.4% 44.8% 100.0%
0 1 2 3 40.0%
10.0%
20.0%
30.0%
40.0%
50.0%
60.0%
Project Contributor Project Leader
Page 30 of 39
https://mc.manuscriptcentral.com/ihe
Industry and Higher Education
123456789101112131415161718192021222324252627282930313233343536373839404142434445464748495051525354555657585960
269
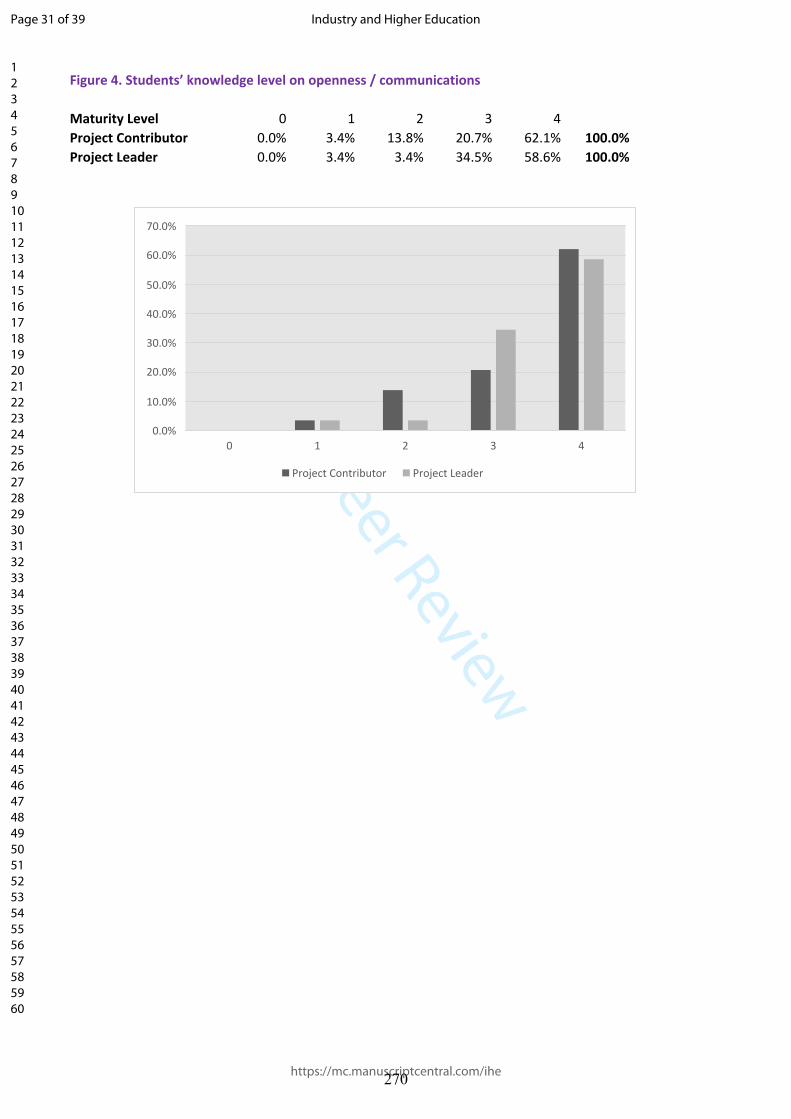
For Peer Review
Figure 4. Students’ knowledge level on openness / communications
Maturity Level 0 1 2 3 4Project Contributor 0.0% 3.4% 13.8% 20.7% 62.1% 100.0%Project Leader 0.0% 3.4% 3.4% 34.5% 58.6% 100.0%
0 1 2 3 40.0%
10.0%
20.0%
30.0%
40.0%
50.0%
60.0%
70.0%
Project Contributor Project Leader
Page 31 of 39
https://mc.manuscriptcentral.com/ihe
Industry and Higher Education
123456789101112131415161718192021222324252627282930313233343536373839404142434445464748495051525354555657585960
270

For Peer Review
Page 32 of 39
https://mc.manuscriptcentral.com/ihe
Industry and Higher Education
123456789101112131415161718192021222324252627282930313233343536373839404142434445464748495051525354555657585960
271

For Peer Review
Number %Quantity Surveyor 29 100.0%
Figure 5. Students’ knowledge level on interdependent goals / new ways of working
Maturity Level 0 1 2 3 4Project Contributor 0.0% 3.4% 17.2% 37.9% 41.4% 100.0%Project Leader 0.0% 3.4% 6.9% 31.0% 58.6% 100.0%
0 1 2 3 40.0%
10.0%
20.0%
30.0%
40.0%
50.0%
60.0%
70.0%
Project Contributor Project Leader
Page 33 of 39
https://mc.manuscriptcentral.com/ihe
Industry and Higher Education
123456789101112131415161718192021222324252627282930313233343536373839404142434445464748495051525354555657585960
272

For Peer Review
Figure 6. Students’ knowledge level on trust / respect
Maturity Level 0 1 2 3 4Project Contributor 0.0% 13.8% 3.4% 20.7% 62.1% 100.0%Project Leader 0.0% 6.9% 6.9% 31.0% 55.2% 100.0%
0 1 2 3 40.0%
10.0%
20.0%
30.0%
40.0%
50.0%
60.0%
70.0%
Project Contributor Project Leader
Page 34 of 39
https://mc.manuscriptcentral.com/ihe
Industry and Higher Education
123456789101112131415161718192021222324252627282930313233343536373839404142434445464748495051525354555657585960
273

For Peer Review
Page 35 of 39
https://mc.manuscriptcentral.com/ihe
Industry and Higher Education
123456789101112131415161718192021222324252627282930313233343536373839404142434445464748495051525354555657585960
274
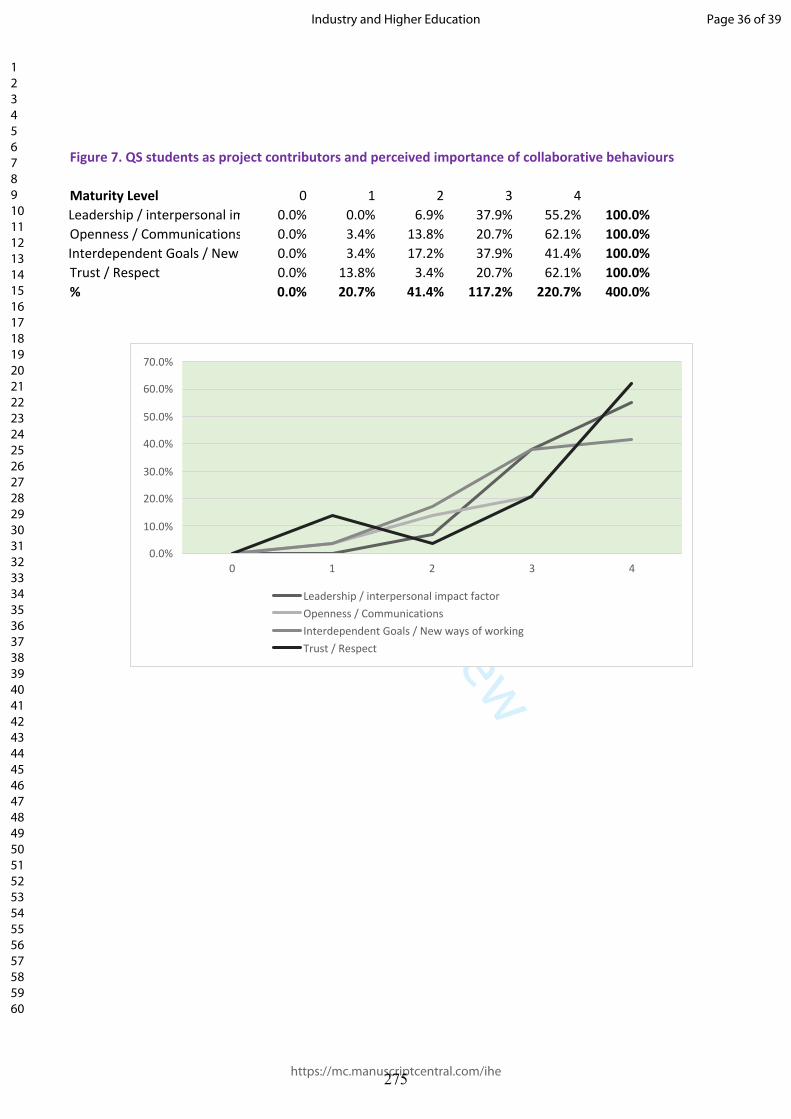
For Peer Review
Figure 7. QS students as project contributors and perceived importance of collaborative behaviours
Maturity Level 0 1 2 3 4Leadership / interpersonal impact factor0.0% 0.0% 6.9% 37.9% 55.2% 100.0%Openness / Communications 0.0% 3.4% 13.8% 20.7% 62.1% 100.0%Interdependent Goals / New ways of working0.0% 3.4% 17.2% 37.9% 41.4% 100.0%Trust / Respect 0.0% 13.8% 3.4% 20.7% 62.1% 100.0%% 0.0% 20.7% 41.4% 117.2% 220.7% 400.0%
0 1 2 3 40.0%
10.0%
20.0%
30.0%
40.0%
50.0%
60.0%
70.0%
Leadership / interpersonal impact factorOpenness / CommunicationsInterdependent Goals / New ways of workingTrust / Respect
Page 36 of 39
https://mc.manuscriptcentral.com/ihe
Industry and Higher Education
123456789101112131415161718192021222324252627282930313233343536373839404142434445464748495051525354555657585960
275
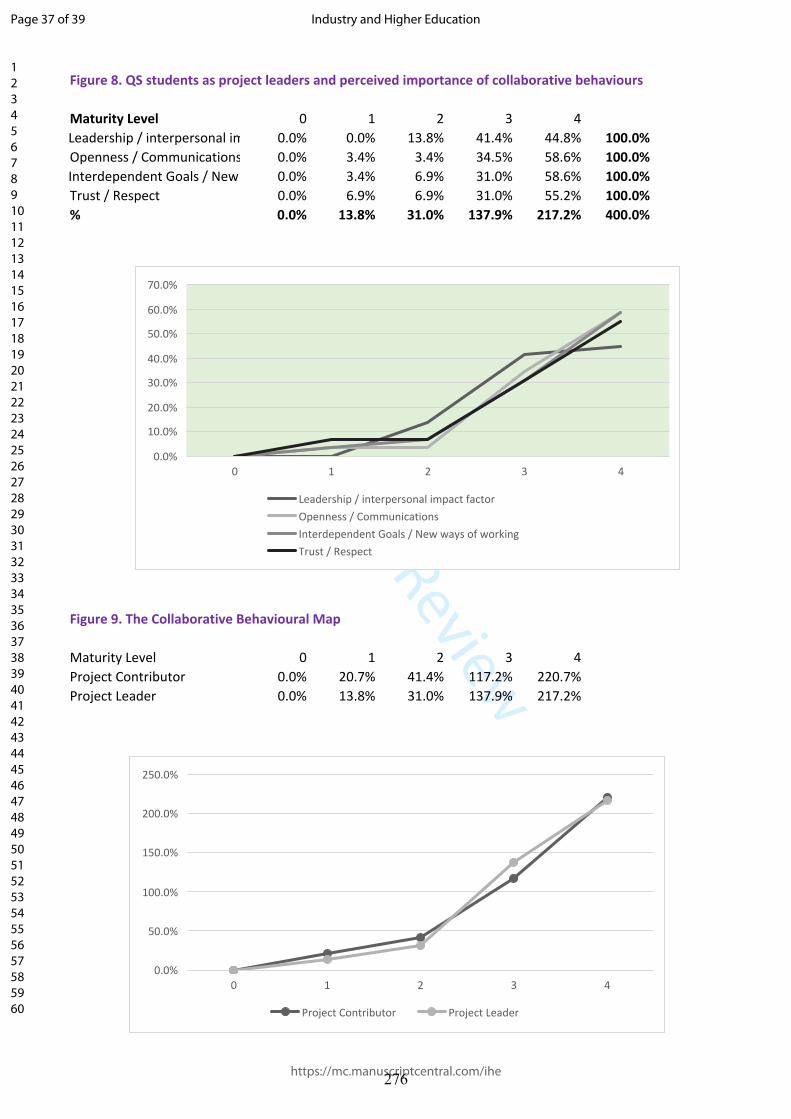
For Peer Review
Figure 8. QS students as project leaders and perceived importance of collaborative behaviours
Maturity Level 0 1 2 3 4Leadership / interpersonal impact factor0.0% 0.0% 13.8% 41.4% 44.8% 100.0%Openness / Communications 0.0% 3.4% 3.4% 34.5% 58.6% 100.0%Interdependent Goals / New ways of working0.0% 3.4% 6.9% 31.0% 58.6% 100.0%Trust / Respect 0.0% 6.9% 6.9% 31.0% 55.2% 100.0%% 0.0% 13.8% 31.0% 137.9% 217.2% 400.0%
Figure 9. The Collaborative Behavioural Map
Maturity Level 0 1 2 3 4Project Contributor 0.0% 20.7% 41.4% 117.2% 220.7%Project Leader 0.0% 13.8% 31.0% 137.9% 217.2%
0 1 2 3 40.0%
10.0%
20.0%
30.0%
40.0%
50.0%
60.0%
70.0%
Leadership / interpersonal impact factorOpenness / CommunicationsInterdependent Goals / New ways of workingTrust / Respect
0 1 2 3 40.0%
50.0%
100.0%
150.0%
200.0%
250.0%
Project Contributor Project Leader
Page 37 of 39
https://mc.manuscriptcentral.com/ihe
Industry and Higher Education
123456789101112131415161718192021222324252627282930313233343536373839404142434445464748495051525354555657585960
276
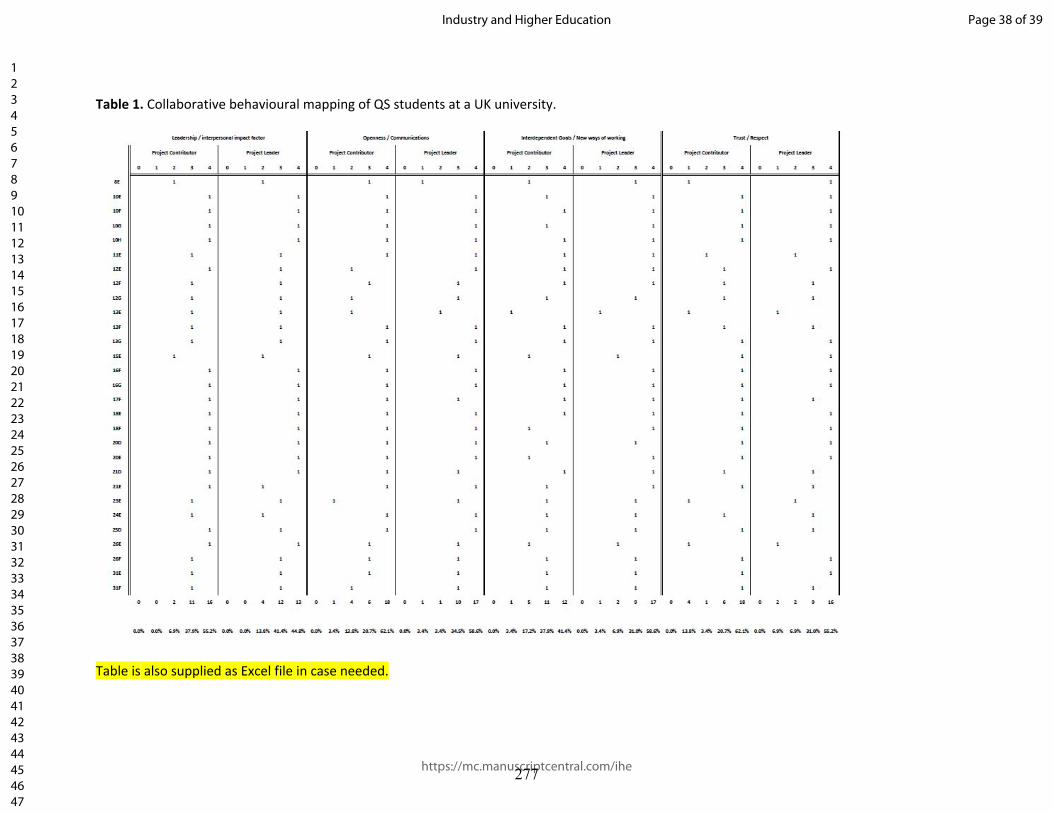
For Peer Review
Table 1. Collaborative behavioural mapping of QS students at a UK university.
Table is also supplied as Excel file in case needed.
Page 38 of 39
https://mc.manuscriptcentral.com/ihe
Industry and Higher Education
123456789101112131415161718192021222324252627282930313233343536373839404142434445464748495051525354555657585960
277

For Peer Review
Leadership / interpersonal impact factor Openness / Communications Interdependent Goals / New ways of working Trust / RespectProject Contributor Project Leader Project Contributor Project Leader Project Contributor Project Leader Project Contributor Project Leader
0 1 2 3 4 0 1 2 3 4 0 1 2 3 4 0 1 2 3 4 0 1 2 3 4 0 1 2 3 4 0 1 2 3 4 0 1 2 3 48E 1 1 1 1 1 1 1 1
10E 1 1 1 1 1 1 1 110F 1 1 1 1 1 1 1 110G 1 1 1 1 1 1 1 110H 1 1 1 1 1 1 1 111E 1 1 1 1 1 1 1 112E 1 1 1 1 1 1 1 112F 1 1 1 1 1 1 1 112G 1 1 1 1 1 1 1 113E 1 1 1 1 1 1 1 113F 1 1 1 1 1 1 1 113G 1 1 1 1 1 1 1 115E 1 1 1 1 1 1 1 116F 1 1 1 1 1 1 1 116G 1 1 1 1 1 1 1 117F 1 1 1 1 1 1 1 118E 1 1 1 1 1 1 1 118F 1 1 1 1 1 1 1 120D 1 1 1 1 1 1 1 120E 1 1 1 1 1 1 1 121D 1 1 1 1 1 1 1 121E 1 1 1 1 1 1 1 123E 1 1 1 1 1 1 1 124E 1 1 1 1 1 1 1 125D 1 1 1 1 1 1 1 126E 1 1 1 1 1 1 1 126F 1 1 1 1 1 1 1 131E 1 1 1 1 1 1 1 131F 1 1 1 1 1 1 1 1
0 0 2 11 16 0 0 4 12 13 0 1 4 6 18 0 1 1 10 17 0 1 5 11 12 0 1 2 9 17 0 4 1 6 18 0 2 2 9 16
0.0% 0.0% 6.9% 37.9% 55.2% 0.0% 0.0% 13.8% 41.4% 44.8% 0.0% 3.4% 13.8% 20.7% 62.1% 0.0% 3.4% 3.4% 34.5% 58.6% 0.0% 3.4% 17.2% 37.9% 41.4% 0.0% 3.4% 6.9% 31.0% 58.6% 0.0% 13.8% 3.4% 20.7% 62.1% 0.0% 6.9% 6.9% 31.0% 55.2%
Page 39 of 39
https://mc.manuscriptcentral.com/ihe
Industry and Higher Education
123456789101112131415161718192021222324252627282930313233343536373839404142434445464748495051525354555657585960
278
RICS Professional Competency Mapping Framework for Programme Appraisal and Benchmarking
RICS Research
Report September 2013
rics.org/research279
RICS Professional Competency Mapping Framework for Programme Appraisal and Benchmarking
Rep
ort f
or R
oyal
Inst
itutio
n of
Cha
rter
ed S
urve
yors
280
03
Rep
ort f
or R
oyal
Inst
itutio
n of
Cha
rter
ed S
urve
yors
rics.org/research
RICS Research team
Dr. Clare Eriksson FRICS Director of Global Research & [email protected]
James Rowlands Global Research & Policy Project [email protected]
Amanprit Johal Global Research & Policy Project [email protected]
Published by:
RICS, Parliament Square, London SW1P 3AD United Kingdom
The views expressed by the author(s) are not necessarily those of RICS nor any body connected with RICS. Neither the authors, nor RICS accept any liability arising from the use of this publication.
The RICS Research Trust, a registered charity established by RICS in 1955 to support research and education in the field of surveying.
Copyright RICS 2013
A report for Royal Institution of Chartered Surveyors
Report written by:
Prof. Srinath Perera MRICS [email protected] Northumbria University, Newcastle upon Tyne, UK
Mr John Pearson FRICS [email protected] University, Newcastle upon Tyne, UK
Research team:
Dr Lei Zhou and Damilola EkundayoNorthumbria University, Newcastle upon Tyne, UK
281

04
Con
tent
sRICS Research – RICS Professional Competency Mapping Framework
for Programme Appraisal and Benchmarking
Contents .....................................................................................................................................................................04
List of Abbreviations ...........................................................................................................................................06
Foreword .....................................................................................................................................................................07
Part 1 Executive Summary ...........................................................................................................................08
Background ......................................................................................................................................................................09
Research Method ..............................................................................................................................................................09
Competency Mapping Framework (CMF) ........................................................................................................................10
RICS QS Competencies .................................................................................................................................................10
Competency Mapping Scoring System ...........................................................................................................................10
Development Process of the GCTB ...................................................................................................................................10
Analysis of the GCTB ........................................................................................................................................................11
Incorporating and using CMF ............................................................................................................................................13
Conclusions and Recommendations .................................................................................................................................13
Part 2 Main Report ............................................................................................................................................14
1.0 Introduction ...............................................................................................................................................15
1.1 Background .........................................................................................................................................................15
1.2 Aim & Objectives ..................................................................................................................................................16
2.0 Research Method .................................................................................................................................17
2.1 Stage 1: Pilot Study .............................................................................................................................................18
2.2 Stage 2: Case Studies .........................................................................................................................................18
2.3 Stage 3: Expert Forum .........................................................................................................................................18
2.4 Stage 4: Review of existing processes to integrate CMF ......................................................................................19
3.0 Competency Mapping Framework ..........................................................................................20
3.1 RICS QS Competencies .......................................................................................................................................20
3.2 Competency Mapping Scoring System ................................................................................................................20
3.2.1 Breadth scale .......................................................................................................................................................20
3.2.2 Depth scale ..........................................................................................................................................................20
3.2.3 Competency Mapping Template (CMT) and Competency Mapping Record (CMR) ...............................................21
3.3 Competency Mapping Case Studies ....................................................................................................................22
3.3.1 Developing the Conceptual Benchmark ...............................................................................................................22
3.3.2 Comparative Analysis of Case Studies .................................................................................................................24
3.4 Conceptual Benchmark for Graduate Route.........................................................................................................25
3.5 Development of the Final Benchmark for Graduate Route ....................................................................................30
3.5.1 Pilot Study ...........................................................................................................................................................30
3.5.2 Establishing the Expert Forum ..............................................................................................................................30
3.5.3 Revision and the Ratification of the Benchmark ....................................................................................................32
282

05
rics.org/research
4.0 Detailed Analysis of the Graduate Competency Threshold Benchmark (GCTB) ....................................................................................................34
4.1 The GCTB - Final Benchmark ..............................................................................................................................34
4.2 An in depth Analysis of the Benchmark and Expert Forum Perspectives ..............................................................35
4.3 Analysis of Mandatory Competencies ..................................................................................................................39
4.3.1 Analysis of Mandatory Competencies by Depth Scale ..........................................................................................40
4.3.2 Analysis of Mandatory Competencies by Breadth Scale .......................................................................................40
4.4 Analysis of Core Competencies ............................................................................................................................41
4.4.1 Analysis of Core Competencies by Depth Scale ...................................................................................................42
4.4.2 Analysis of Core Competencies by Breadth Scale ................................................................................................42
4.5 Analysis of Optional Competencies ......................................................................................................................43
4.5.1 Analysis of Optional Competencies by Depth Scale .............................................................................................44
4.5.2 Analysis of Optional Competencies by Breadth Scale ..........................................................................................44
5.0 Competency Mapping Framework in the context of Existing Processes ........................................................................................45
5.1 Programme Development and Validation ..............................................................................................................45
5.1.1 Introduction ..........................................................................................................................................................45
5.1.2 Programme Development and the Validation Process ..........................................................................................46
5.1.3 Interview Analysis .................................................................................................................................................47
5.1.4 Further Development ............................................................................................................................................47
5.1.5 Summary .............................................................................................................................................................47
5.2 RICS Programme Accreditation............................................................................................................................48
5.2.1 Introduction ..........................................................................................................................................................48
5.2.2 The Accreditation Process ...................................................................................................................................48
5.2.3 Interview Analysis .................................................................................................................................................48
5.2.4 Further Development ............................................................................................................................................50
5.2.5 Summary .............................................................................................................................................................50
5.3 RICS University Partnership Process ....................................................................................................................51
5.3.1 Introduction ..........................................................................................................................................................51
5.3.2 The Partnership Process ......................................................................................................................................51
5.3.3 Interview Analysis .................................................................................................................................................51
5.3.4 Further Development ............................................................................................................................................52
5.3.5 Summary .............................................................................................................................................................52
5.4 Discussion ...........................................................................................................................................................53
5.4.1 Benchmarking; the ideal .......................................................................................................................................53
5.4.2 Benchmarks; acceptance and support ................................................................................................................54
6.0 Guidelines for using the CMF ......................................................................................................55
6.1 Using for Programme Development .....................................................................................................................55
6.2 Using for Programme Management .....................................................................................................................56
283
RICS Research – RICS Professional Competency Mapping Framework for Programme Appraisal and Benchmarking
rics.org/research
06
7.0 Conclusions...............................................................................................................................................57
7.1 The need and the research approach ...................................................................................................................57
7.2 The Competency Mapping Framework (CMF) ......................................................................................................58
7.3 Recommended use of the CMF ...........................................................................................................................60
7.4 Final Recommendations .......................................................................................................................................60
7.5 Limitations ............................................................................................................................................................61
7.6 Further Research .................................................................................................................................................61
Acknowledgements ............................................................................................................................................62
Part 3 References and Appendix ...........................................................................................................63
References ................................................................................................................................................................64
Appendix A Final Graduate Competency Threshold Benchmark (GCTB) ................65
List of AbbreviationsRICS Royal Institution of Chartered Surveyors
QS Quantity Surveying
CMF Competency Mapping Framework
CMT Competency Mapping Template
CMR Competency Mapping Record
GCTB Graduate Competency Threshold Benchmark
CNAA Council for National Academic Awards
HND Higher National Diploma
APC Assessment of Professional Competence
PQS Private sector consultant Quantity Surveyor
CQS Contractor’s Quantity Surveyor
Fore
wor
d
284

RICS Research – RICS Professional Competency Mapping Framework for Programme Appraisal and Benchmarking
rics.org/research
07
Fore
wor
d
The research undertaken has relevance for RICS in highlighting the importance of the links between the curricula of accredited courses and the APC competencies (Assessment of Professional Competence). The paper raises a number of pertinent recommendations, and through current developments in relation to RICS accreditation policy, have already been addressed in a proactive and positive way by the RICS. The research was independently carried out through the funding support of the RICS Research Trust and therefore provides an independent, arm’s length review of the issues surrounding competency mapping framework in RICS accredited courses.
It is a requirement of RICS accreditation that all courses must consistently map and align with an appropriate APC pathway. RICS has avoided adopting a prescriptive approach to ensure that there are no barriers to innovation in curricula, and providing universities with the flexibility to adapt to changes in professional practice, such as the evolution of new technology. RICS are currently advancing an approach that would benefit graduates in today’s world where transferable skills such as commercial skills are required in addition to complementary technical understanding and knowledge.
The competencies threshold benchmark concept detailed in this report provides RICS with some interesting food for thought and has obvious merits. However in practice it would be challenging to adopt the methodology on a worldwide basis given the diversity of RICS pathways and the need to maintain a consistent global accreditation policy. Other professional bodies tend to represent a single
homogeneous profession constituency and do not have to consider trying to develop policy which reflects RICS’ professional diversity on a global level. While recognising these challenges for RICS itself, RICS partner universities are welcome to adopt the merits of this methodology when reviewing their accredited provision to meet the current needs of students and employers.
The UK Education Standards Board (UKESB) is developing a new Quality Threshold which will increase the focus on course curricula and its relationship to the APC competencies. It is likely that a minimum threshold will be established for mapping curricula to APC competencies. Universities will also be required to provide mapping documents on a periodic basis in line with major course reviews. In addition guidance can be produced to help universities develop courses which closely align to the competencies. The new Quality Threshold will replace the entry threshold, and the current framework of four thresholds will remain. The UKESB is looking to enhance the quality assurance with a range of more relevant standards.
We are pleased to report that the RICS has now addressed many of the concerns and issues raised in the paper, through changes to the threshold standards to be globally applicable and we will continue to review these standards for our accredited courses worldwide. This allows future professionals to complete their APC successfully through university and the workplace.
Nick Evans RICS UK Higher Education Policy Manager
285

RICS Research – RICS Professional Competency Mapping Framework for Programme Appraisal and Benchmarking
rics.org/research
08
Exec
utiv
e S
umm
aryPart 1
Executive Summary
286

RICS Research – RICS Professional Competency Mapping Framework for Programme Appraisal and Benchmarking
rics.org/research
09
Exec
utiv
e S
umm
ary Background
Over the years QS education has evolved from being rather technical in nature into fully fledged honours degrees with greater orientation towards commercial management, cost, contracts and project management. The current network of Quantity Surveying Degrees grew from the early 1970’s with the move from Diploma to Degree level qualification for entry to the profession. This transition from diplomas to university degrees was in cognition with the general transformation of the higher education sector of the British education system. The majority of these degrees were delivered by the former Polytechnics, the most of which, in turn, became New Universities in the early 1990’s or thereabouts. With the conversion to University status came their right to validate and award degrees (previously validated by and awarded under the auspices of the Council for National Academic Awards (CNAA), to whom the former Polytechnics were answerable).
“Up until 1994, the RICS ran its own examinations, but since [then] there has been a progressive change towards qualification through accredited courses at undergraduate and postgraduate level” (RICS, 2008a) This process has recently taken a further turn with the introduction of the Assoc. RICS route.
During this period the construction industry has undergone many changes and is currently facing a double dip economic recession which has a severe impact on opportunities for graduate employment within the sector. Construction industry employers have been vocal in reporting their perception of a lowering of employability of graduates. A recent study investigating views on both industry and academia concluded that there are significant levels of dissatisfaction with the quality of graduates (Perera & Pearson, 2011). It identified the root cause of the issue as graduates produced from different RICS accredited degree programmes having significantly different competency levels, often far below what the industry expects. This research following from the recommendations of the above report, aims at developing a competency mapping framework for programme appraisal and benchmarking.
Research MethodThis research adopted a four stage research strategy to develop the CMF.
The four stages were:
Stage 1 – Pilot Study: A literature review of competencies was carried out which identified the RICS APC study checklist. It used two industry and academic experts to iteratively develop and modify a competency mapping template (CMT). The CMT is a dual vector scale matrix with a Breadth scale and a Depth scale each mapped against module descriptors. Breadth scale contains study topics while Depth scale contains competencies.
Stage 2 – Case Studies: Four leading RICS accredited QS degree programmes were analysed and their module specifications were mapped to competencies using the CMT. This created a CMR for each case study. Descriptive statistical analysis was used to develop a conceptual competency benchmark using these four case studies.
Stage 3 – Expert Forum: An expert forum with 15 experts (12 industry experts and 3 academic experts) was established to revise and modify the conceptual competency benchmark. The two stage Delphi process was used to record and harmonise the views of experts. This stage produced the final graduate competency threshold benchmark (GCTB).
Stage 4 – Review of Existing Processes to Integrate CMF:The final stage of the research involved reviewing existing programme development and validation methods, RICS programme accreditation and RICS – University partnership processes. This involved a document review as well as interviews of three QS degree programme directors to obtain their views on these processes and the proposed incorporation of GCTB within these. The report suggests how the CMF can be used within these existing systems to ensure academic quality standards.
287

RICS Research – RICS Professional Competency Mapping Framework for Programme Appraisal and Benchmarking
rics.org/research
10
RICS QS CompetenciesQS competencies are the most developed and well documented set of competencies produced by the RICS. There are 25 competencies categorised as Mandatory, Core or Optional.
Mandatory Competencies: Competencies that are generally required by most surveying professions. These provide a basic skill set that are required for working as a professional in the construction industry. There are 8 competencies in this category.
Core competencies: These define the core skill base of the QS and therefore essential for practicing as a QS. There are 7 unique competencies in this category.
Optional competencies: these are competencies that are desired in a QS. As such only two competencies are required to be satisfied from this category for completion at APC. However, at graduate level all these competencies become important as providing foundation level of knowledge.
The RICS distinguishes between three possible levels of attainment in each of a range of competences when setting its requirements for those seeking full membership. Briefly, these are as follows:
• Level 1: Knowledge (theoretical knowledge)
• Level 2: Knowledge and practical experience (putting it into practice)
• Level 3: Knowledge, practical experience and capacity to advise (explaining and advising)
Although there are clear guidelines for achieving competencies at APC, there is no stipulation as to the level of achievement of competencies at graduate level. In the absence of such a benchmark different universities achieve these competencies at different levels (Perera & Pearson, 2011) resulting in greater variation in level of quality of graduates.
Competency Mapping Scoring SystemA dual vector scale scoring matrix was developed to map programme curricula to RICS competencies. The scoring system is presented in a competency mapping template (CMT) on a MS Excel™ spreadsheet. It contains two tabs one each for the Breadth scale and Depth scale. The Breadth scale lists all study check list topics categorised to competencies vertically downwards with list of programme modules on the horizontal axis. The Depth scale consists of a matrix containing competencies on the vertical axis against programme modules on the horizontal axis.
Scoring on the Breadth scale tab is to indicate a mapping of which topics area dealt by which module with a mark-up of 1 or 0 to indicate topic covered and not covered scenarios respectively. The Breadth scale matrix is completed indicating achievement of a topic whether at Level 1 or 1 and 2. Scoring on the Depth scale tab is to indicate time spent on learning each topic summed to give total learning hours for each competency. Once CMT is completed for a degree programme, it is known as the CMR for that programme.
Development Process of the GCTBThe pilot study was used to develop the CMT and the scoring system described in the previous section. With the use of four case studies of the RICS accredited QS degree programmes a CMR was produced for each programme. These were used as the basis for the development of a conceptual benchmark.
The expert forum appointed was requested to review the conceptual benchmark established. Their judgements were collated to produce a revised benchmark. The expert forum was then requested to further modify or agree with the revised benchmark. Following Delphi methodology for harmonising the views of experts a verified benchmark was created. This was then further organised to produce the final GCTB.
Competency Mapping Framework (CMF)
288

RICS Research – RICS Professional Competency Mapping Framework for Programme Appraisal and Benchmarking
rics.org/research
11
Figure 1.1 Sample image of the Graduate Competency Threshold Benchmark (GCTB)
Analysis of the GCTBThe GCTB is the central construct in the CMF. The CMF consists of the competency mapping scoring system, CMT, CMR and the process of incorporating it in the RICS – University partnership.
A sample of the GCTB is presented in Figure 1.1.
The first column in GCTB presents a unique code allocated to each study topic in the GCTB. The study topics for the GCTB are derived from the RICS APC study checklist (RICS, 2008a). The Breadth scale consists of 4 columns. Level 1 and 2 columns indicate the level at which a topic is to be achieved at undergraduate level. The other
two columns present statistics of percentage coverage of topics at Levels 1 and 2 respectively. The Depth scale consists of two columns. The Credit hours column indicates the amount of time an undergraduate student should spend in learning topics related to a competency. The final column provides statistics of the percentage time allocation for a competency. The header row of the GCTB presents summary statistics applicable for the respective columns.
The summary statistics of the GCTB is presented in Table 1.1.
Code
RICS QS Study Check List Topics
Breadth Scale Depth Scale
Level 1 Level 2
% Topic Coverage
Level 1
% Topic Coverage
Level 2Credit hours
% Percentage
305 102 85% 28% 3188 100.0%
C1.8.7 Supply chain management 1 1
C1.8.8 Legislation on selecting project teams 1 0
C2 CORE COMPETENCIES 136 43 94.4% 29.9% 2060 65%
C2.1
Commercial management of construction (T010) – Level 3
9 5 100.0% 55.6% 96 3.0%
C2.1.1 Estimating 1 1
C2.1.2 Establishing budgets 1 1
C2.1.3 Cash flows 1 1
C2.1.4 Reporting financial progress against budget 1 1
C2.1.5 Procurement of labour 1 0
C2.1.6 Procurement of plant and materials 1 0
C2.1.7 Procurement of sub-contracts 1 1
C2.1.8 Financial management of supply chain 1 0
C2.1.9 Financial management of multiple projects 1 0
C2.2 Contract practice (T017) – Level 3 28 12 100.0% 42.9% 243 7.6%
C2.2.1 Principles of contract law 1 0
C2.2.2 Legislation 1 0
C2.2.3 Current case-law – look out for cases reported in journals 1 0
289

RICS Research – RICS Professional Competency Mapping Framework for Programme Appraisal and Benchmarking
rics.org/research
12
Analysing the Breadth scale it is clear that there are a total of 305 topics to be covered representing 85% of total topics at Level 1. As one would expect, this comes down to 102 topics (28%) at Level 2. Core competencies have 94% coverage of topics at Level 1. However, the highest coverage at Level 2 is for Mandatory competencies (41%). This is mainly because those Mandatory competencies represent generic skills and as such are expected to be covered to a higher degree of competence at graduate level.
Analysing the Depth scale, there are a total of 3188 hours of learning time expected on RICS competencies. This is out of possible 3600 hours representing 89% of time. In comparison to average values of the case studies this represents a 4% increase from 85% RICS competency mapped time. This is much higher than current provision of most RICS accredited programmes. As expected, 65% of the time is expected to be spent on Core competencies which accounts for 57% full credit allocation for a degree programme. There is 3% increase from the case studies.
However, this represents a reasonable content considering the specialist nature of the profession. This is then followed by Optional and Mandatory competencies.
Another notable change from the existing provision is the consequent reduction in time allocation with respect to learning related to Non RICS competencies. There is a 3% reduction in time. These learning primarily represent generic study areas such as basic economics, law, mathematical skills etc. However, one could argue as these underpin direct RICS competency related topics. It is for this reason that future revisions to competencies and the study checklist should consider the inclusion of such topics at Level 1.
The amount of time to be spent on any one topic is difficult to precisely stipulate. If prescribed, it will become too prescriptive creating a barrier for innovation in curricula. The uniqueness of individual degree programmes will therefore be defined on the lines of variations in the extent and level of coverage of topics. The GCTB facilitates adequate provision for innovation in individual degree programmes while ensuring minimum levels of satisfaction of competencies.
Table 1.1 Summary statistics of GCTB
Breadth Scale Depth Scale
Competency Type
Level 1 Topics
Level 2 Topics
% Topic Coverage
Level 1
% Topic Coverage
Level 2
Credit hours
% Percentage
C1 Mandatory Competencies 66 31 88% 41% 521 16%
C2 Core Competencies 136 43 94% 30% 2060 65%
C3 Optional Competencies 103 28 74% 20% 607 19%
Totals 305 102 85% 28% 3188 100.0%
Table 1.2 Comparison of proposed competency time allocations (GCTB)
Proposed on GCTB Existing Composition (Case Studies)
Competency Type Credit hours % Percentage Credit hours % Percentage
C1 Mandatory Competencies 521 15% 557 16%
C2 Core Competencies 2060 57% 1899 53%
C3 Optional Competencies 607 17% 628 17%
C4 Non RICS Competencies 412 11% 517 14%
Totals 3600 100% 3600 100%
290
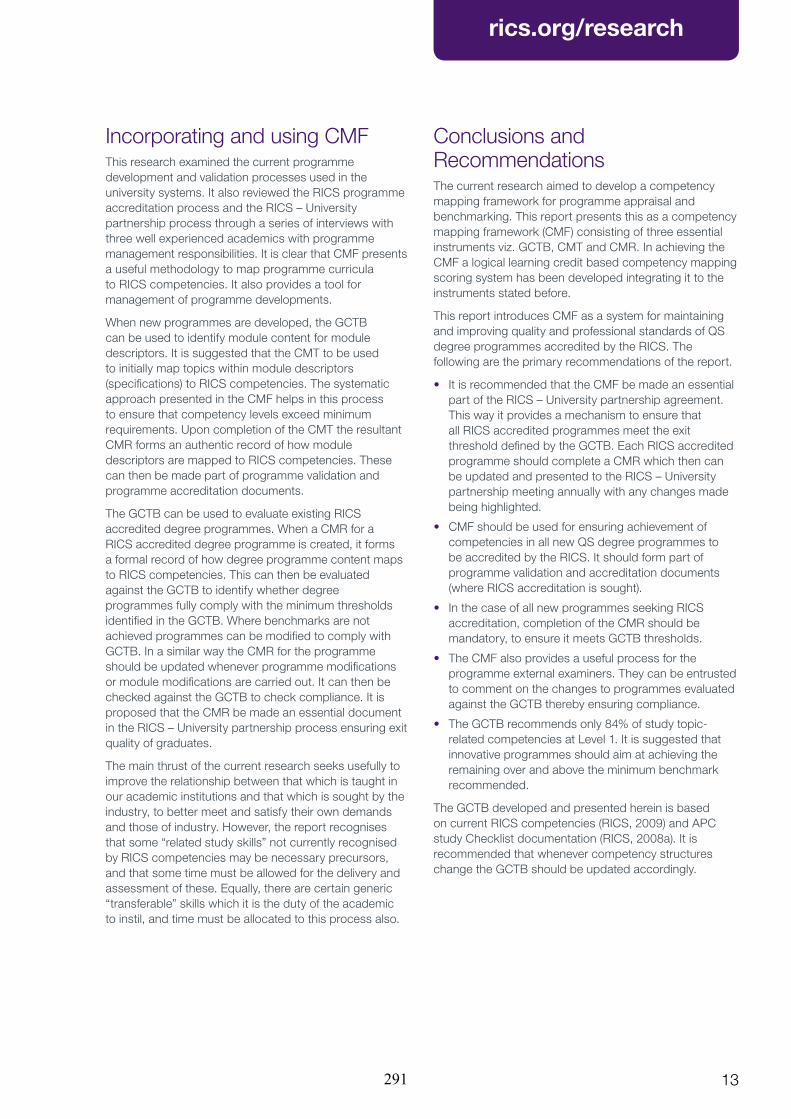
RICS Research – RICS Professional Competency Mapping Framework for Programme Appraisal and Benchmarking
rics.org/research
13
Incorporating and using CMFThis research examined the current programme development and validation processes used in the university systems. It also reviewed the RICS programme accreditation process and the RICS – University partnership process through a series of interviews with three well experienced academics with programme management responsibilities. It is clear that CMF presents a useful methodology to map programme curricula to RICS competencies. It also provides a tool for management of programme developments.
When new programmes are developed, the GCTB can be used to identify module content for module descriptors. It is suggested that the CMT to be used to initially map topics within module descriptors (specifications) to RICS competencies. The systematic approach presented in the CMF helps in this process to ensure that competency levels exceed minimum requirements. Upon completion of the CMT the resultant CMR forms an authentic record of how module descriptors are mapped to RICS competencies. These can then be made part of programme validation and programme accreditation documents.
The GCTB can be used to evaluate existing RICS accredited degree programmes. When a CMR for a RICS accredited degree programme is created, it forms a formal record of how degree programme content maps to RICS competencies. This can then be evaluated against the GCTB to identify whether degree programmes fully comply with the minimum thresholds identified in the GCTB. Where benchmarks are not achieved programmes can be modified to comply with GCTB. In a similar way the CMR for the programme should be updated whenever programme modifications or module modifications are carried out. It can then be checked against the GCTB to check compliance. It is proposed that the CMR be made an essential document in the RICS – University partnership process ensuring exit quality of graduates.
The main thrust of the current research seeks usefully to improve the relationship between that which is taught in our academic institutions and that which is sought by the industry, to better meet and satisfy their own demands and those of industry. However, the report recognises that some “related study skills” not currently recognised by RICS competencies may be necessary precursors, and that some time must be allowed for the delivery and assessment of these. Equally, there are certain generic “transferable” skills which it is the duty of the academic to instil, and time must be allocated to this process also.
Conclusions and RecommendationsThe current research aimed to develop a competency mapping framework for programme appraisal and benchmarking. This report presents this as a competency mapping framework (CMF) consisting of three essential instruments viz. GCTB, CMT and CMR. In achieving the CMF a logical learning credit based competency mapping scoring system has been developed integrating it to the instruments stated before.
This report introduces CMF as a system for maintaining and improving quality and professional standards of QS degree programmes accredited by the RICS. The following are the primary recommendations of the report.
• It is recommended that the CMF be made an essential part of the RICS – University partnership agreement. This way it provides a mechanism to ensure that all RICS accredited programmes meet the exit threshold defined by the GCTB. Each RICS accredited programme should complete a CMR which then can be updated and presented to the RICS – University partnership meeting annually with any changes made being highlighted.
• CMF should be used for ensuring achievement of competencies in all new QS degree programmes to be accredited by the RICS. It should form part of programme validation and accreditation documents (where RICS accreditation is sought).
• In the case of all new programmes seeking RICS accreditation, completion of the CMR should be mandatory, to ensure it meets GCTB thresholds.
• The CMF also provides a useful process for the programme external examiners. They can be entrusted to comment on the changes to programmes evaluated against the GCTB thereby ensuring compliance.
• The GCTB recommends only 84% of study topic-related competencies at Level 1. It is suggested that innovative programmes should aim at achieving the remaining over and above the minimum benchmark recommended.
The GCTB developed and presented herein is based on current RICS competencies (RICS, 2009) and APC study Checklist documentation (RICS, 2008a). It is recommended that whenever competency structures change the GCTB should be updated accordingly.
291

RICS Research – RICS Professional Competency Mapping Framework for Programme Appraisal and Benchmarking
rics.org/research
14
Part 2 Main Report
1.0
Intro
duct
ion
292
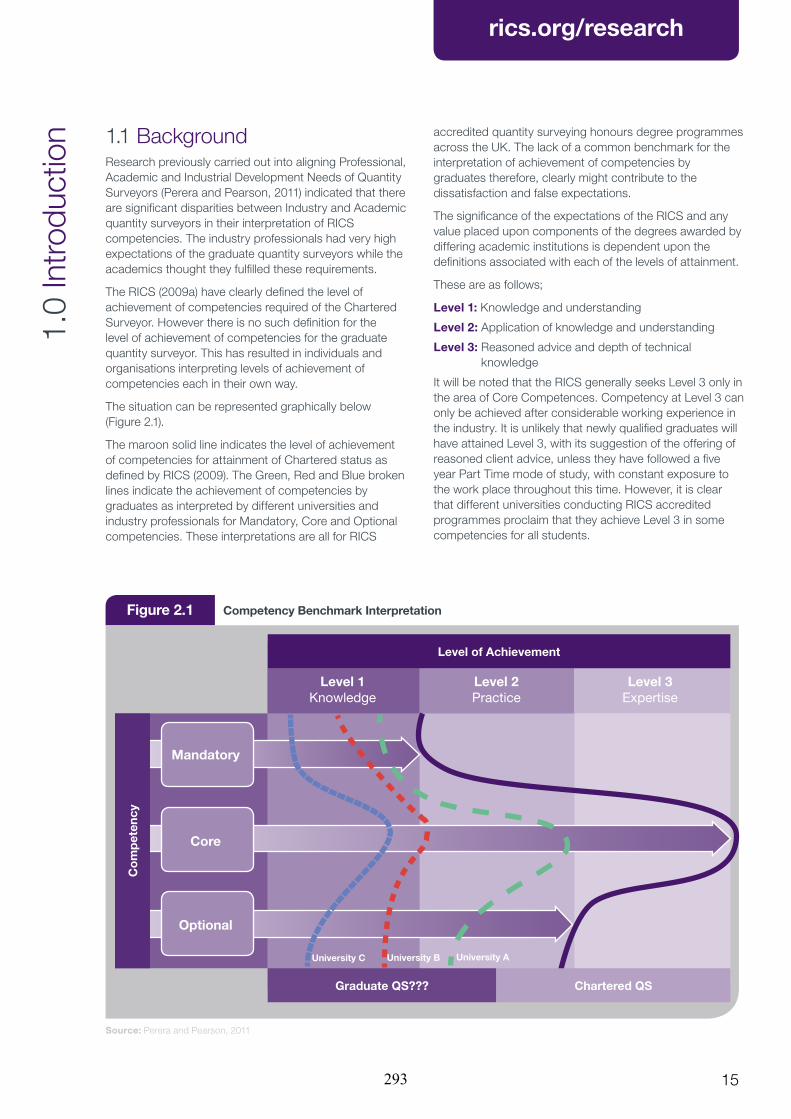
RICS Research – RICS Professional Competency Mapping Framework for Programme Appraisal and Benchmarking
rics.org/research
15
1.1 BackgroundResearch previously carried out into aligning Professional, Academic and Industrial Development Needs of Quantity Surveyors (Perera and Pearson, 2011) indicated that there are significant disparities between Industry and Academic quantity surveyors in their interpretation of RICS competencies. The industry professionals had very high expectations of the graduate quantity surveyors while the academics thought they fulfilled these requirements.
The RICS (2009a) have clearly defined the level of achievement of competencies required of the Chartered Surveyor. However there is no such definition for the level of achievement of competencies for the graduate quantity surveyor. This has resulted in individuals and organisations interpreting levels of achievement of competencies each in their own way.
The situation can be represented graphically below (Figure 2.1).
The maroon solid line indicates the level of achievement of competencies for attainment of Chartered status as defined by RICS (2009). The Green, Red and Blue broken lines indicate the achievement of competencies by graduates as interpreted by different universities and industry professionals for Mandatory, Core and Optional competencies. These interpretations are all for RICS
accredited quantity surveying honours degree programmes across the UK. The lack of a common benchmark for the interpretation of achievement of competencies by graduates therefore, clearly might contribute to the dissatisfaction and false expectations.
The significance of the expectations of the RICS and any value placed upon components of the degrees awarded by differing academic institutions is dependent upon the definitions associated with each of the levels of attainment.
These are as follows;
Level 1: Knowledge and understanding
Level 2: Application of knowledge and understanding
Level 3: Reasoned advice and depth of technical knowledge
It will be noted that the RICS generally seeks Level 3 only in the area of Core Competences. Competency at Level 3 can only be achieved after considerable working experience in the industry. It is unlikely that newly qualified graduates will have attained Level 3, with its suggestion of the offering of reasoned client advice, unless they have followed a five year Part Time mode of study, with constant exposure to the work place throughout this time. However, it is clear that different universities conducting RICS accredited programmes proclaim that they achieve Level 3 in some competencies for all students.
1.0
Intro
duct
ion
Figure 2.1 Competency Benchmark Interpretation
Level 1Knowledge
Level 2Practice
Level 3Expertise
Co
mp
eten
cy
Level of Achievement
Graduate QS??? Chartered QS
Mandatory
Core
Optional
Source: Perera and Pearson, 2011
University B University AUniversity C
293

RICS Research – RICS Professional Competency Mapping Framework for Programme Appraisal and Benchmarking
rics.org/research
16
Detailed analysis of RICS accredited programme curricula of different universities also exposed that there are significant gaps in competency mapping across different programmes. No such exercise can be deemed reliable and consistent unless there is a fairly precise scoring system or “template” against which to assess the extent of mapping of their curricula. Such a system must achieve two things: a precise accountable interpretation (a recognisable link between the curricula and the competencies) and a precise accountable value (a “score” which demonstrates the “Level” of competence achieved). The lack of a mechanism to systematically evaluate programme module content against RICS competencies and a benchmark for graduate competencies is therefore considered as the core cause of this problem.
Programme approval and validation of new or significantly changed programmes are carried out by the universities according to HEFCE (2010) guidelines. Each module on a new or revised programme will be scrutinised with regards to its learning outcomes, delivery etc. Most professionally oriented programmes sought approval of respective accrediting bodies, in this case the RICS, usually by reference to the External Examiners and validation panel members who will act on behalf of the RICS. The Education Committee of the RICS accredit programmes upon review of documentation for the programmes. In the absence of a systematic process to evaluate the extent of competency mapping it risks being carried out based only on subjective judgement and cursory inspection.
In the UK, the RICS-University partnership agreement is the main mechanism to ensure the academic quality of accredited programmes. This process involves ensuring that certain minimum standards, known as “thresholds” as set out in the guidance and policy document on University partnerships (RICS 2008b), are achieved. It governs the entry criteria for programmes, teaching quality and the attainment of the research and innovation threshold. A stipulation regarding relevant employment of graduates has been waived of late, due to the current economic situation (RICS, 2008b).
At present, there is no formal obligation for programme teams to map their curricula against specific RICS Competencies at specific Levels, although most will seek this outcome to some extent. The guidance and policy document (RICS, 2008b, p.26) does list and refer to the APC requirements, suggesting the “likelihood of meeting threshold standards and leading to an existing APC pathway” as a factor in the accreditation or otherwise of a programme.
The 2010 “vision for high quality education” was set out by an Education Task Force in 1999 (RICS, 2008b). This envisaged strong partnerships between the RICS and a limited number of recognised centres of academic excellence, characterised by not only “an appropriate range of curricula at undergraduate and postgraduate levels”, but also “increased freedom for selected universities to develop courses and methods of delivery” at all academic levels. This is a far from prescriptive recipe, which lacks consideration of matching specific levels to core competencies.
1.2 Aim & ObjectivesThese problems and drawbacks are the root cause of dissatisfaction with the quality of graduates expressed by industry professionals. This research aims to develop a RICS professional Competency Mapping Framework (CMF) for analysing the compliance of quantity surveying programme curricula with RICS QS competencies. Achieving this core aim is fundamental to success in aligning the views of industry, academia and the RICS.
The core aim of the research is further analysed into a set of objectives as follows:
• Examination of the mandatory, core and optional competencies and benchmarking the expected level of compliance for RICS accredited degree programmes.
• Development of a competency mapping and assessment methodology to analyse compliance of programmes to set benchmarks for Graduate route.
• Development of a competency mapping scoring system to analyse the level of mapping and gaps.
• Analysis of the current university programme approval and validation methods and the proposal of a methodology to incorporate a new competency mapping framework for programme approval and validation.
• Analysis of the RICS programme accreditation process to incorporate the competency mapping framework within programme accreditation.
• Analysis of and review of the RICS-University partnership agreement process and propose further developments to it incorporating the Competency Mapping Framework (CMF).
This report presents a detailed account of how these objectives were met and of the development and use of the CMF.
2.0
Res
earc
h M
etho
d
294
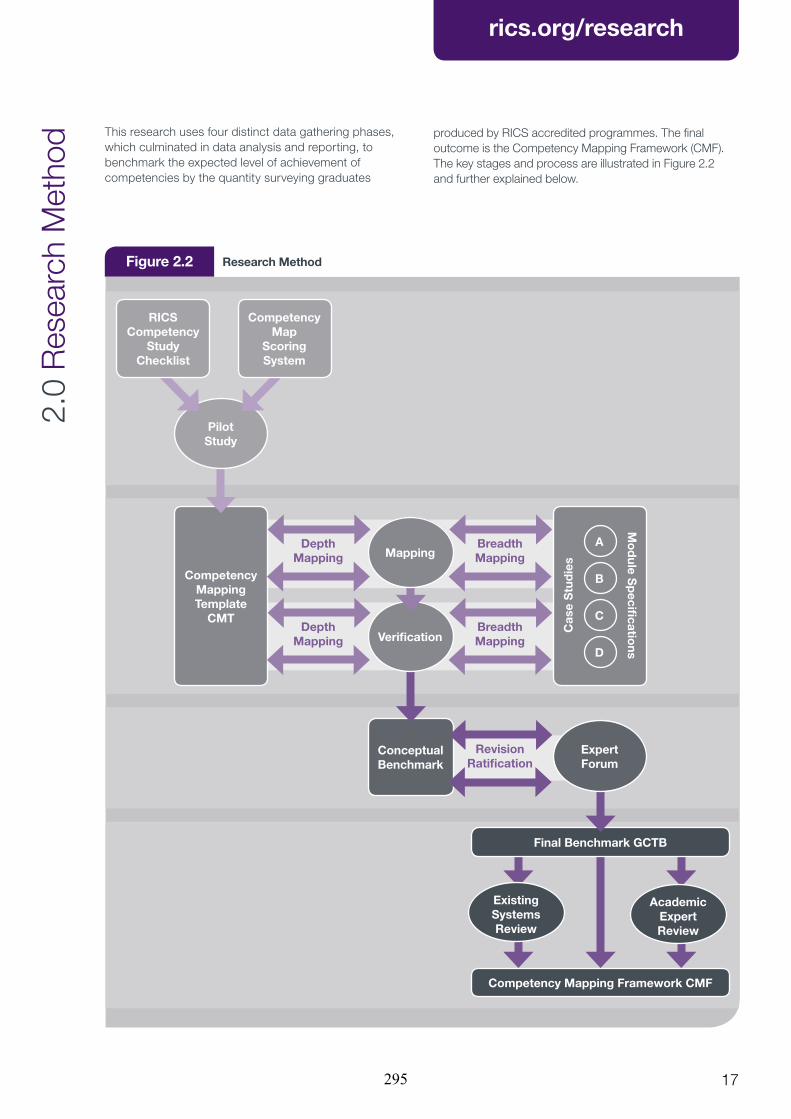
RICS Research – RICS Professional Competency Mapping Framework for Programme Appraisal and Benchmarking
rics.org/research
17
Competency Mapping Framework CMF
2.0
Res
earc
h M
etho
d
Figure 2.2 Research Method
This research uses four distinct data gathering phases, which culminated in data analysis and reporting, to benchmark the expected level of achievement of competencies by the quantity surveying graduates
produced by RICS accredited programmes. The final outcome is the Competency Mapping Framework (CMF). The key stages and process are illustrated in Figure 2.2 and further explained below.
Conceptual Benchmark
Existing Systems Review
Academic Expert Review
Final Benchmark GCTB
ExpertForum
Competency Mapping Template
CMT
Mo
dule S
pecifi
cations
Cas
e S
tud
ies
A
B
C
DVerification
Revision Ratification
Breadth Mapping
Depth Mapping
Breadth Mapping
Depth Mapping
Pilot Study
Competency Map
Scoring System
RICS Competency
Study Checklist
Mapping
295
RICS Research – RICS Professional Competency Mapping Framework for Programme Appraisal and Benchmarking
rics.org/research
18
The following section provides details of the four stages, and the main research instruments used to achieve the research objectives and to develop the graduate competency threshold benchmark (GCTB) and the competency mapping framework (CMF).
2.1 Stage 1: Pilot StudyA literature review was conducted to identify the full QS Study checklist structured by RICS QS competencies. This review was in addition to the results of the previous study (Perera and Pearson, 2011) which sets the framework for this research. This was followed by developing a competency mapping scoring system that could provide a numerical scale mapping of competencies to degree programme curricular (refer section 3.2). A pilot study (refer section 3.5.1) involving two academic and industry experts were used to test the scoring system and develop the final Competency Mapping Template (refer section 3.2.3). This template forms the basis for the carrying out of case studies mapping competencies to existing degree programmes.
2.2 Stage 2: Case StudiesThe case studies (A, B, C, and D) provide the basis for the development of the benchmark for graduate competencies. These include examination of four RICS accredited QS degree programmes. The CMT developed in stage 1 provides the template to map curricular to RICS competencies. The curricular of these programmes (module specifications) were mapped against RICS QS competencies at detailed level using coverage (as a breadth scale – section 3.2.1) and amount of time spent in learning i.e. module credits (as a depth scale – section 3.2.2). The ensuing mapping was then verified for accuracy and consistency with programme directors responsible for their delivery. The mapping method and process are
further detailed in section 3.3. The output of this stage is the Conceptual Benchmark (refer section 3.4) based on the analysis of the four case studies.
The four case studies selected were leading QS honours degree programmes in the UK all accredited by the RICS. The dual vector scale representing breadth and depth of coverage of competencies informs the current practice in academia. The mapping matrix CMT is an excel spreadsheet with two worksheets or tabs. The breadth mapping worksheet has over 400 rows as it contains the full QS Study checklist whilst the depth mapping worksheet has circa 40 rows since it only includes the RICS QS competencies. The two dimensional matrix thus comprised of QS Study checklist (for breadth mapping tab) and RICS QS competencies (for depth mapping tab) on the Y – axis (vertical listing) and Programme specifications on the X – axis for both tabs (horizontal listing). The rationale for breadth mapping at Study checklist level and depth mapping at competency level is explained in section 3.2.
Both breadth and depth vector scale mappings of the four case studies were initially carried out using the respective module specifications of the programmes. The results were then sent out to the programme leaders concerned for necessary adjustments and ratifications. Descriptive statistics such as mean and percentage scores etc. were used to analyse the results of the four case studies as conceptual benchmark. This forms the basis for the Stage 3 of the research.
2.3 Stage 3: Expert ForumAn expert forum comprising 15 industry and academic experts were formed with the objective of revising and refining the conceptual benchmark established in the Stage 2 of the research. The identified industry experts come from large, SME and micro level organisations.
296

RICS Research – RICS Professional Competency Mapping Framework for Programme Appraisal and Benchmarking
rics.org/research
19
These include quantity surveying employer organisations from both traditional consulting and contracting sectors. A total of 15 interviews were thus carried out comprising 3 academics (programme leaders), 6 consultant quantity surveyors (2 experts from each category of large, SME and micro) and 6 contractor quantity surveyors (2 experts from large, 3 from SME and 1 from Micro level organisation).
This forum was used to benchmark, through an iterative process, the expected level of achievement of competencies by the quantity surveying graduates produced by RICS accredited programmes. Initially, interviews were conducted with each expert using the conceptual benchmark. These interviews were conducted either face to face or using electronic communication with detailed guidance provided in each case. The views of the experts on the conceptual benchmark were sought. The interviews thus involved the experts revising the conceptual benchmark to reflect their expectations of a graduate level attainment of RCIS QS competencies. Analysis of these diverse views resulted in the development of a revised benchmark which has similar layout as the conceptual benchmark.
The final phase of the development process involved using the same identified experts to evaluate the revised benchmark in order to adjust and ratify the revised benchmark values. The revised benchmark was sent via email to the experts with detailed guidance of what is expected. A reminder email was sent accordingly at the end of the first week with a follow-up email in the subsequent week. With circa 80% response rate, around 70% of the experts who replied said they agree and are satisfied with the revised benchmark in which case they returned the revised benchmark with no correction. The remaining 30% of the experts have some minor corrections to make. In this case, they adjusted the revised benchmark values in a similar manner to the initial process. The experts were also asked to provide any further feedback they might have.
The resulting findings were analysed using relevant descriptive statistics and presented as a ratified benchmark. Delphi technique (Rowe and Wright, 2001) was used to extract and harmonise the views of the experts and to finalise the benchmark level of achievement of competencies for graduate quantity surveyors. The ratified benchmark was fine-tuned, adjusted and finalised to produce the minimum graduate competency threshold benchmark (GCTB).
2.4 Stage 4: Review of Existing Processes to Integrate CMF The GCTB forms the basis of the final stage of the research, where it is incorporated in to existing programme curricular development and management process creating the Competency Mapping Framework. A detailed review of the existing programme validation and management methods were carried out. Three well experienced RICS accredited QS honours degree programme directors (who are also full members of the RICS) were selected to develop the mechanism to integrate the GCTB to create the final CMF.
Interviews evaluated the programme approval and validation methods, programme accreditation process and RICS-University partnership agreement process, and how to further improve these processes through the incorporation of the GCTB developed in stage 3. These interview stages are further detailed in section 5. The content analysis of the interviews conducted was the catalyst for the identification of key issues related to the above processes. Accordingly a system to incorporate the developed graduate threshold competency benchmark as a fundamental part of the RICS-University partnership agreements was proposed. This is the CMF.
297

RICS Research – RICS Professional Competency Mapping Framework for Programme Appraisal and Benchmarking
rics.org/research
20
3.1 RICS QS CompetenciesThe RICS QS Competencies provide the basis on which the competence of a chartered quantity surveyor is defined. These are arranged into three groupings, depending upon their perceived relevance to the role of the quantity surveyor:
1 – Mandatory Competencies: personal, interpersonal and professional practice and business skills common to all pathways [into membership] compulsory for all candidates.
2 – Core Competencies: primary skills of the candidate’s chosen [RICS] pathway
3 – Optional Competencies: selected as an additional skill requirement for the candidate’s chosen [RICS] pathway from a list of competencies relevant to that pathway. In most cases there is an element of choice, though driven, usually, by their employer’s specialism.
The RICS distinguishes between three possible levels of attainment in each of a range of competences when setting its requirements for those seeking full membership. Briefly, these are as follows:
• Level 1: Knowledge (theoretical knowledge)
• Level 2: Knowledge and practical experience (putting it into practice)
• Level 3: Knowledge, practical experience and capacity to advise (explaining and advising)
There are 8 Mandatory competencies, 7 Core competencies and 10 Optional competencies. The RICS stipulates that an APC candidate needs to achieve all Mandatory competencies at Level 2 or above, all Core competencies at Level 3 (except the one not relevant to their specialisation, consulting or contracting, which must be at Level 2. The further requirement is for two Optional competencies at Level 2 or above.
There is no stipulation as to the level of achievement of competencies at graduate level. In the absence of such a benchmark different universities achieve these competencies at different levels (Perera & Pearson, 2010). The following sections discuss the development of a graduate level benchmark for RICS QS competencies.
3.2 Competency Mapping Scoring SystemThe competency mapping scoring system is developed as a dual scale matrix consisting of a Breadth scale and a Depth scale. The Breadth scale indicates the extent of coverage of competencies as mapped to RICS QS Study Checklist (RICS, 2008). The check list provides 359 individual study topics categorised in to 25 different competencies. These signify the extent of coverage (breadth of knowledge) expected under the current set of competencies. The Depth scale provides an indication of the time spent on achieving competencies. These are explored in detail in the following sub sections.
3.2.1 Breadth Scale RICS QS competencies were analysed at a detailed level using the QS Study Checklist (RICS, 2008a). This checklist is used as the framework for developing the conceptual benchmark where the binary alternatives 1 and 0 are used to indicate coverage of a topic under a competency.
1 – Reflects that the topic is dealt with by the degree programme concerned.
0 – Reflects that it is not dealt with by the degree programme concerned.
These are indicated against the three level classification of level of achievement by the RICS (RICS, 2009). These are as follows:
• Level 1: Knowledge and understanding
• Level 2: Application of knowledge and understanding
• Level 3: Reasoned advice and depth of technical knowledge
A specific topic may be covered at both Levels 1 and 2. In this case, there is a value 1 in both Level 1 and Level 2 columns. If a topic achieves Level 2 coverage then we assume there is always Level 1 coverage as well. In another topic, if the topic is dealt with at Level 1 only then values 1 and 0 were placed against columns Level 1 and Level 2 respectively. Level 3 achievements are not expected to be covered in degree programmes as it is not practical to expect a graduate to cover a competency at Level 3. However, as the benchmark reflects a minimum conceptual achievement level, it will not prevent anyone achieving a competency at Level 3 if it is feasible within their degree programme.
3.2.2 Depth scale This reflects the amount of time spent on achieving a competency. In degree programmes, time spent on achieving module outcome is stipulated as Credits where 10 hours spent is considered as 1 Credit. A typical 20 Credit point module reflects 200 hours of learning by the student. This constitutes direct contact with formal teaching; lectures, seminars, tutorials and such direct contact time as well as students expected study time on the module content (time spent by students on their own in learning a topic concerned). The depth scale is only indicated at competency level and not at topic level as it is impractical to stipulate an expected number of study hours at a detailed level. Percentage scores are used to indicate the amount of time spent on each competency. These provide valuable information on relative time spent for each competency. The Depth scale represents the time expected to be spent on learning a competency at undergraduate level.
3.0
Com
pete
ncy
Map
ping
Fra
mew
ork
298
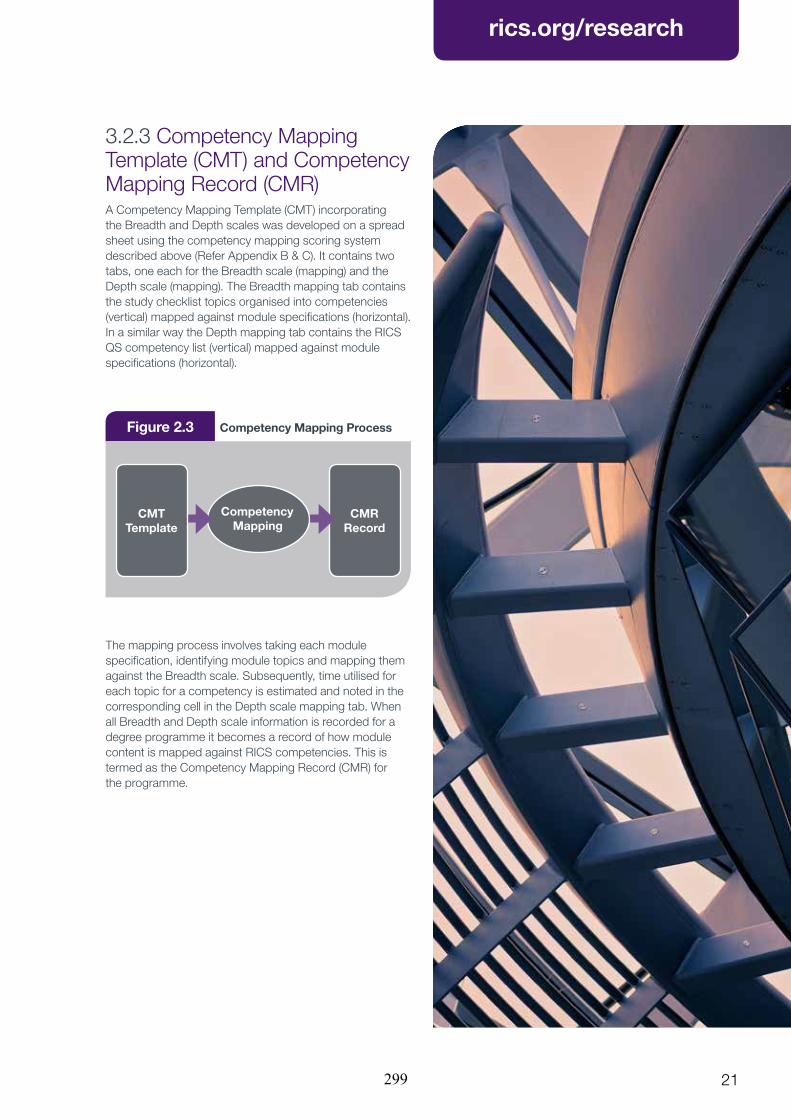
RICS Research – RICS Professional Competency Mapping Framework for Programme Appraisal and Benchmarking
rics.org/research
21
3.2.3 Competency Mapping Template (CMT) and Competency Mapping Record (CMR) A Competency Mapping Template (CMT) incorporating the Breadth and Depth scales was developed on a spread sheet using the competency mapping scoring system described above (Refer Appendix B & C). It contains two tabs, one each for the Breadth scale (mapping) and the Depth scale (mapping). The Breadth mapping tab contains the study checklist topics organised into competencies (vertical) mapped against module specifications (horizontal). In a similar way the Depth mapping tab contains the RICS QS competency list (vertical) mapped against module specifications (horizontal).
The mapping process involves taking each module specification, identifying module topics and mapping them against the Breadth scale. Subsequently, time utilised for each topic for a competency is estimated and noted in the corresponding cell in the Depth scale mapping tab. When all Breadth and Depth scale information is recorded for a degree programme it becomes a record of how module content is mapped against RICS competencies. This is termed as the Competency Mapping Record (CMR) for the programme.
Figure 2.3 Competency Mapping Process
CMR Record
Competency Mapping
CMTTemplate
299
RICS Research – RICS Professional Competency Mapping Framework for Programme Appraisal and Benchmarking
rics.org/research
22
3.3 Competency Mapping Case Studies
3.3.1 Developing the Conceptual Benchmark The conceptual benchmark was developed by mapping module specifications of four RICS accredited QS honours degree programmes to the RICS Study Checklist (RICS, 2008a) using the CMT described in section 3.2.3. The four degree programmes are considered as four case studies. The process used in mapping competencies for the case studies is summarised below:
1. Invitation for case study of the selected QS degree programme was sent to the respective programme director explaining the process.
2. The module specifications and the programme module structure were obtained from the respective case study (university).
3. The Competency Mapping Template (CMT) with the Breadth and Depth scales is used to map the RICS QS competencies to the module specifications.
4. Programme module specifications are individually mapped to competencies using the CMT by the research team.
a. Topics for each module were identified and mapped to those in the Breadth scale of study checklist topics.
b. Using the module credit allocation and proportionately distributing it to module content, the learning time allocation for each topic was estimated and allocated in the Depth scale.
c. The process continued iteratively until mapping of all modules was completed to researchers’ satisfaction.
d. The completed mapping for a degree programme is termed a competency mapping record (CMR).
5. The completed competency mappings (CMRs) were then sent to the respective programme directors for further revision.
6. Revisions were discussed and agreed with the programme directors to finalise the competency mapping record (CMR) of each programme.
Each RICS competency is made up of several topics (known as the study checklist). The breadth mapping, which is the scope of coverage, was carried out across Level 1 and Level 2. Level 3 is not included because a QS graduate would not have attained this level upon graduation. Since the benchmark is a minimum threshold it is not required to be considered. The depth mapping was carried out at competency level, unlike the breadth mapping which was carried out at detailed study checklist level. Credits hours are used for the depth mapping. There are a total of 360 Credits (3600 hours) of learning in a degree programme. Therefore typically there will be less than 3600 hours available to map against RICS competencies. This is because a typical degree programme contains topics that related to but not specifically identified within RICS competencies. For example, subject areas of basic economics, mathematics, or topics such as the background to the legal system are not directly related to RICS competencies.
Both breadth and depth mappings of the above case studies were initially carried out by the researchers using the respective programme specifications. The results were then sent out to the programme leaders of the degree programmes concerned for necessary adjustments and ratifications. Descriptive statistics such as mean and percentage scores were used to analyse and present the results of the case studies as conceptual framework.
300
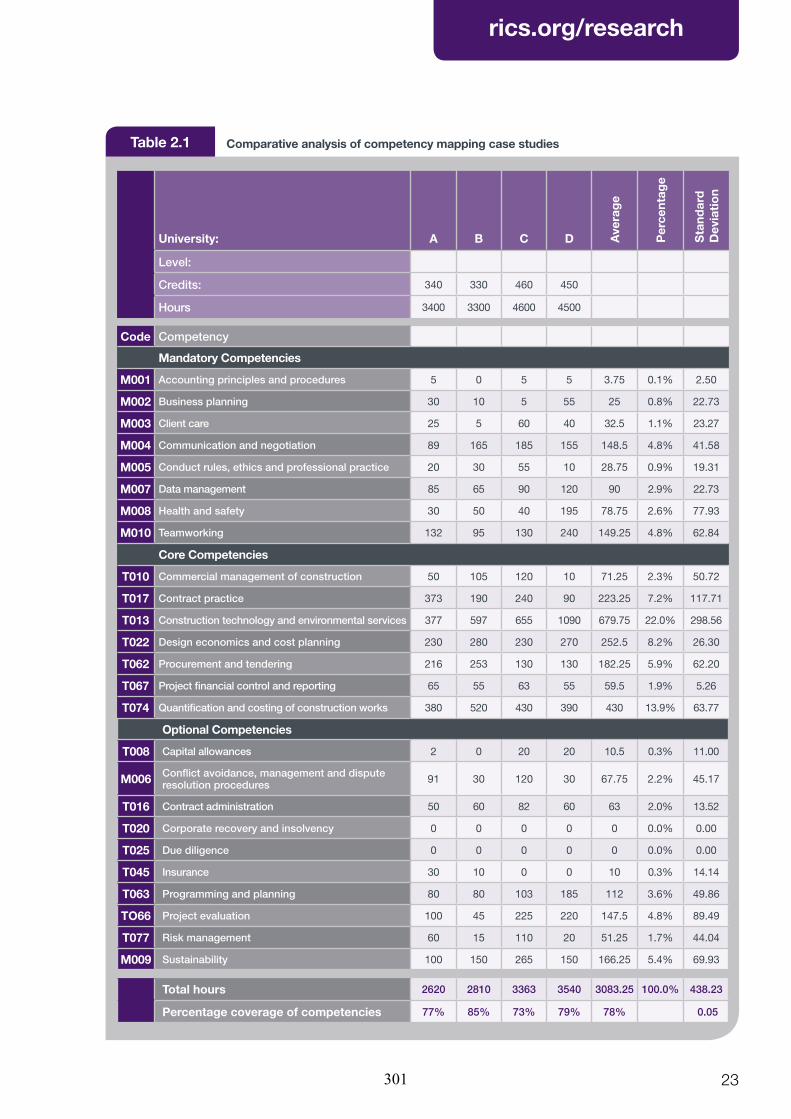
RICS Research – RICS Professional Competency Mapping Framework for Programme Appraisal and Benchmarking
rics.org/research
23
Table 2.1 Comparative analysis of competency mapping case studies
University: A B C D Ave
rag
e
Per
cent
age
Sta
ndar
d
Dev
iati
on
Level:
Credits: 340 330 460 450
Hours 3400 3300 4600 4500
Code Competency
Mandatory Competencies
M001 Accounting principles and procedures 5 0 5 5 3.75 0.1% 2.50
M002 Business planning 30 10 5 55 25 0.8% 22.73
M003 Client care 25 5 60 40 32.5 1.1% 23.27
M004 Communication and negotiation 89 165 185 155 148.5 4.8% 41.58
M005 Conduct rules, ethics and professional practice 20 30 55 10 28.75 0.9% 19.31
M007 Data management 85 65 90 120 90 2.9% 22.73
M008 Health and safety 30 50 40 195 78.75 2.6% 77.93
M010 Teamworking 132 95 130 240 149.25 4.8% 62.84
Core Competencies
T010 Commercial management of construction 50 105 120 10 71.25 2.3% 50.72
T017 Contract practice 373 190 240 90 223.25 7.2% 117.71
T013 Construction technology and environmental services 377 597 655 1090 679.75 22.0% 298.56
T022 Design economics and cost planning 230 280 230 270 252.5 8.2% 26.30
T062 Procurement and tendering 216 253 130 130 182.25 5.9% 62.20
T067 Project financial control and reporting 65 55 63 55 59.5 1.9% 5.26
T074 Quantification and costing of construction works 380 520 430 390 430 13.9% 63.77
Optional Competencies
T008 Capital allowances 2 0 20 20 10.5 0.3% 11.00
M006 Conflict avoidance, management and dispute resolution procedures 91 30 120 30 67.75 2.2% 45.17
T016 Contract administration 50 60 82 60 63 2.0% 13.52
T020 Corporate recovery and insolvency 0 0 0 0 0 0.0% 0.00
T025 Due diligence 0 0 0 0 0 0.0% 0.00
T045 Insurance 30 10 0 0 10 0.3% 14.14
T063 Programming and planning 80 80 103 185 112 3.6% 49.86
TO66 Project evaluation 100 45 225 220 147.5 4.8% 89.49
T077 Risk management 60 15 110 20 51.25 1.7% 44.04
M009 Sustainability 100 150 265 150 166.25 5.4% 69.93
Total hours 2620 2810 3363 3540 3083.25 100.0% 438.23
Percentage coverage of competencies 77% 85% 73% 79% 78% 0.05
301
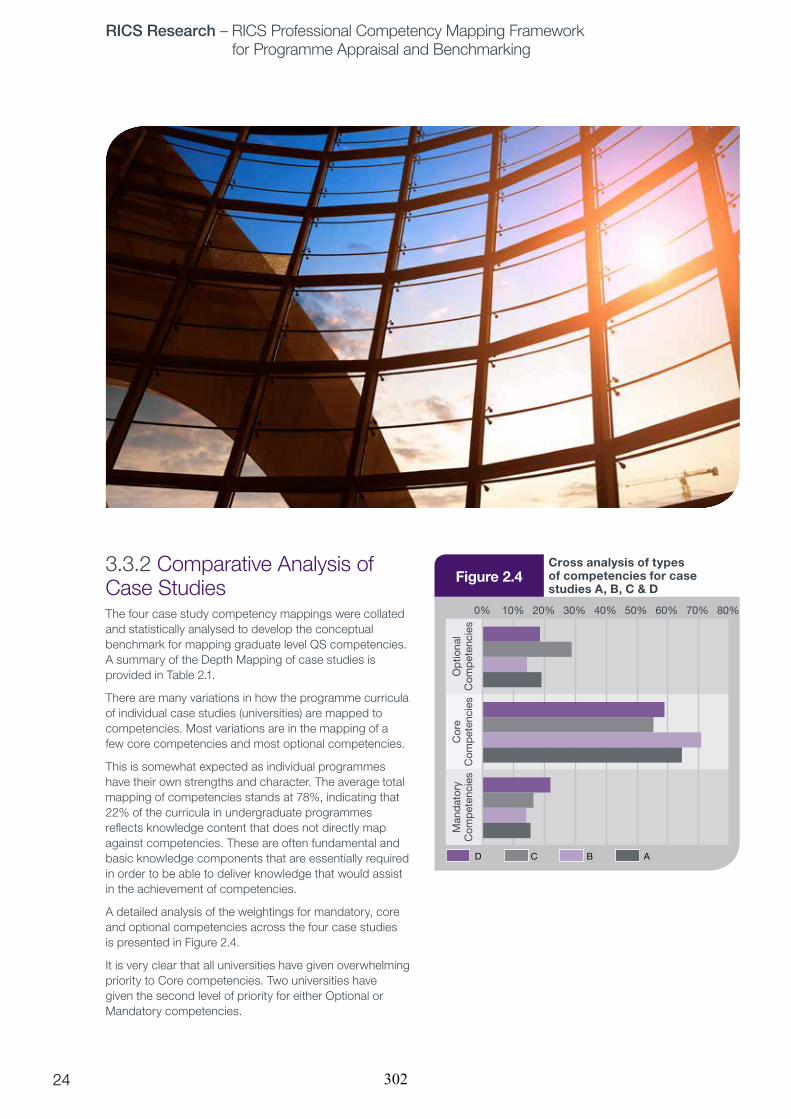
RICS Research – RICS Professional Competency Mapping Framework for Programme Appraisal and Benchmarking
rics.org/research
24
3.3.2 Comparative Analysis of Case Studies The four case study competency mappings were collated and statistically analysed to develop the conceptual benchmark for mapping graduate level QS competencies. A summary of the Depth Mapping of case studies is provided in Table 2.1.
There are many variations in how the programme curricula of individual case studies (universities) are mapped to competencies. Most variations are in the mapping of a few core competencies and most optional competencies.
This is somewhat expected as individual programmes have their own strengths and character. The average total mapping of competencies stands at 78%, indicating that 22% of the curricula in undergraduate programmes reflects knowledge content that does not directly map against competencies. These are often fundamental and basic knowledge components that are essentially required in order to be able to deliver knowledge that would assist in the achievement of competencies.
A detailed analysis of the weightings for mandatory, core and optional competencies across the four case studies is presented in Figure 2.4.
It is very clear that all universities have given overwhelming priority to Core competencies. Two universities have given the second level of priority for either Optional or Mandatory competencies.
Op
tiona
l C
omp
eten
cies
Cor
e C
omp
eten
cies
Man
dat
ory
Com
pet
enci
es
10% 20% 40%30% 50% 70%60% 80%
D C B A
Cross analysis of types of competencies for case studies A, B, C & D
Figure 2.4
0%
302

RICS Research – RICS Professional Competency Mapping Framework for Programme Appraisal and Benchmarking
rics.org/research
25
3.4 Conceptual Benchmark for Graduate RouteThe results of the previous research (Perera and Pearson, 2011) coupled with further issues identified from the literature and the competency mapping exercise formed the basis of the conceptual benchmark. The conceptual benchmark (see Table 2.2) is a two dimensional matrix reflecting overall average coverage and average depth of coverage of the four case studies. The conceptual benchmark values reflect the levels of achievement of competencies by graduates completing a degree from the
Table 2.2 Sample of Conceptual Benchmark
Leve
l 1
Leve
l 2
Leve
l 3
Cre
dit
s ho
urs
Per
cent
age
Mandatory Competencies
Accounting principles and procedures (M001) – Level 1 3.75 0.1%
Balance sheets / profit and loss account 0 0
Taxation 1 0
Revenue and capital expenditure 0 0
Cash flows 1 0
Profitability 1 0
Insolvency 0 0
Legislation 1 0
Business planning (M002) – Level 1 25 0.8%
Legislation 1 0
Short / long term strategies 1 0
Market analysis 1 0
Five year plans 1 0
Business support services – administration, secretarial, HR, IT etc. 1 0
Staffing levels – recruitment / turnover 1 0
Continued…
Core Competencies
Commercial management of construction (T010) – Level 3 71.25 2.3%
Estimating 1 1
Establishing budgets 1 1
Cash flows 1 1
Reporting financial progress against budget 1 1
Procurement of sub-contracts 1 0
Financial management of supply chain 1 0
Financial management of multiple projects 1 0
four case study QS programmes. It reveals under Level 1 and Level 2 columns the topics covered in all the four RICS accredited degree programmes examined. A value of 1 against a particular topic implies that at least one of the case study degree programmes covers this. The Credits hours’ column, which is the average of the four case study values, indicates typical expected times (in hours) devoted to each competency whilst the Percentage column shows the relative time proportion. Only a brief extract of the conceptual benchmark is shown in Table 2.2 as the table extends to several pages.
303
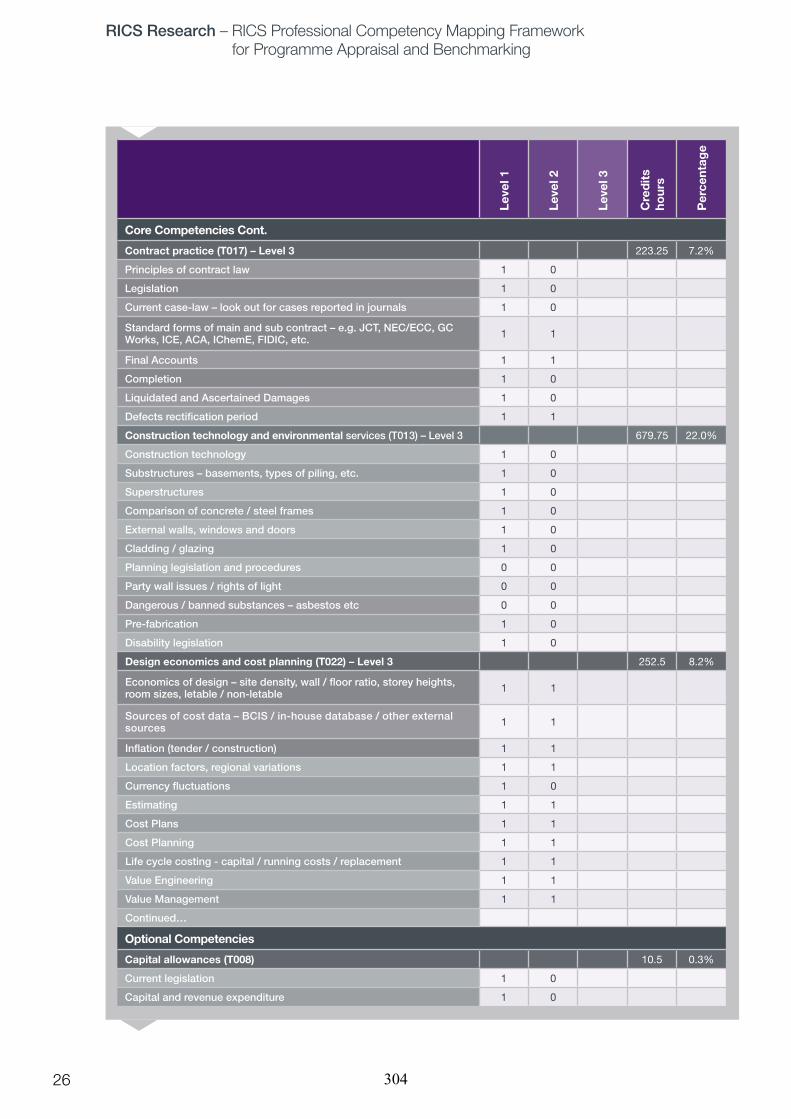
RICS Research – RICS Professional Competency Mapping Framework for Programme Appraisal and Benchmarking
rics.org/research
26
Leve
l 1
Leve
l 2
Leve
l 3
Cre
dit
s ho
urs
Per
cent
age
Core Competencies Cont.
Contract practice (T017) – Level 3 223.25 7.2%
Principles of contract law 1 0
Legislation 1 0
Current case-law – look out for cases reported in journals 1 0
Standard forms of main and sub contract – e.g. JCT, NEC/ECC, GC Works, ICE, ACA, IChemE, FIDIC, etc. 1 1
Final Accounts 1 1
Completion 1 0
Liquidated and Ascertained Damages 1 0
Defects rectification period 1 1
Construction technology and environmental services (T013) – Level 3 679.75 22.0%
Construction technology 1 0
Substructures – basements, types of piling, etc. 1 0
Superstructures 1 0
Comparison of concrete / steel frames 1 0
External walls, windows and doors 1 0
Cladding / glazing 1 0
Planning legislation and procedures 0 0
Party wall issues / rights of light 0 0
Dangerous / banned substances – asbestos etc 0 0
Pre-fabrication 1 0
Disability legislation 1 0
Design economics and cost planning (T022) – Level 3 252.5 8.2%
Economics of design – site density, wall / floor ratio, storey heights, room sizes, letable / non-letable 1 1
Sources of cost data – BCIS / in-house database / other external sources 1 1
Inflation (tender / construction) 1 1
Location factors, regional variations 1 1
Currency fluctuations 1 0
Estimating 1 1
Cost Plans 1 1
Cost Planning 1 1
Life cycle costing - capital / running costs / replacement 1 1
Value Engineering 1 1
Value Management 1 1
Continued…
Optional Competencies
Capital allowances (T008) 10.5 0.3%
Current legislation 1 0
Capital and revenue expenditure 1 0
304
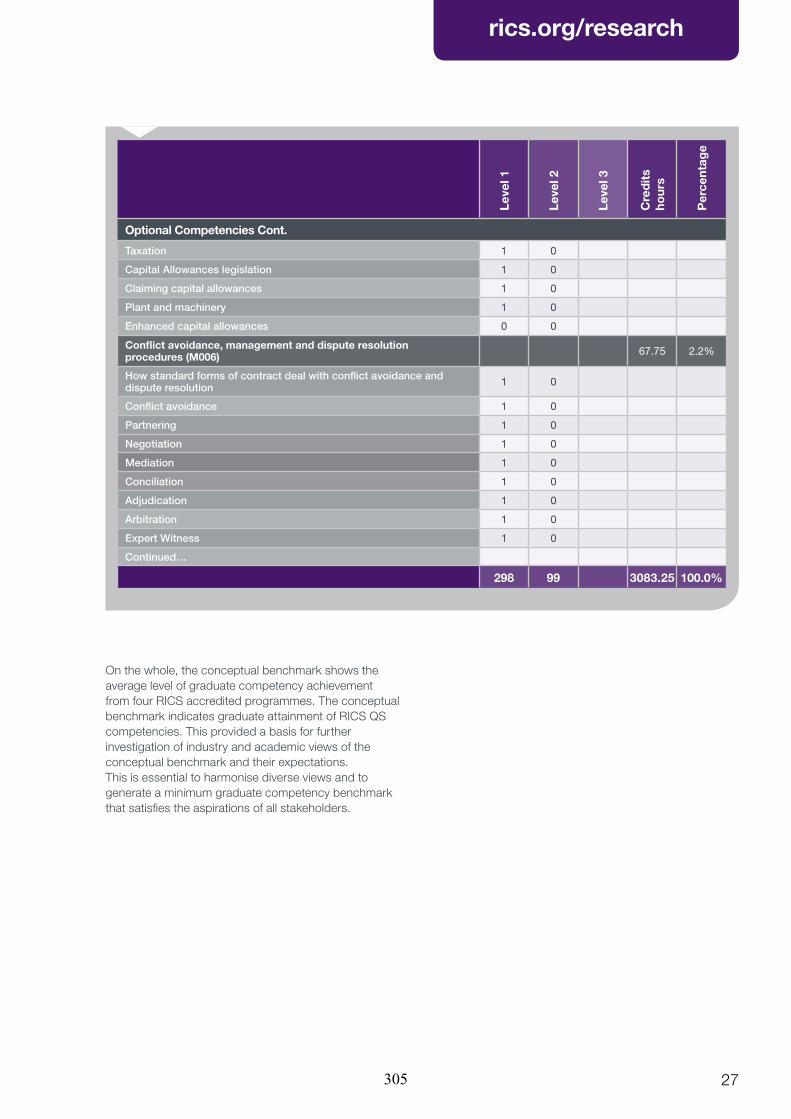
RICS Research – RICS Professional Competency Mapping Framework for Programme Appraisal and Benchmarking
rics.org/research
27
On the whole, the conceptual benchmark shows the average level of graduate competency achievement from four RICS accredited programmes. The conceptual benchmark indicates graduate attainment of RICS QS competencies. This provided a basis for further investigation of industry and academic views of the conceptual benchmark and their expectations. This is essential to harmonise diverse views and to generate a minimum graduate competency benchmark that satisfies the aspirations of all stakeholders.
Leve
l 1
Leve
l 2
Leve
l 3
Cre
dit
s ho
urs
Per
cent
age
Optional Competencies Cont.
Taxation 1 0
Capital Allowances legislation 1 0
Claiming capital allowances 1 0
Plant and machinery 1 0
Enhanced capital allowances 0 0
Conflict avoidance, management and dispute resolution procedures (M006) 67.75 2.2%
How standard forms of contract deal with conflict avoidance and dispute resolution 1 0
Conflict avoidance 1 0
Partnering 1 0
Negotiation 1 0
Mediation 1 0
Conciliation 1 0
Adjudication 1 0
Arbitration 1 0
Expert Witness 1 0
Continued…
298 99 3083.25 100.0%
305

RICS Research – RICS Professional Competency Mapping Framework for Programme Appraisal and Benchmarking
rics.org/research
28
Table 2.3 Summarised Conceptual Benchmark – Depth & Breadth Scales
Depth scale Breadth Scale
Learning Hours % Coverage of topics
Average Time % Level 1 Level 2
Mandatory Competencies
M001 Accounting principles and procedures 3.75 0.1% 80.0% 0.0%
M002 Business planning 25 0.8% 100.0% 0.0%
M003 Client care 32.5 1.1% 75.0% 50.0%
M004 Communication and negotiation 148.5 4.8% 100.0% 87.5%
M005 Conduct rules, ethics and professional practice 28.75 0.9% 64.3% 14.3%
M007 Data management 90 2.9% 100.0% 71.4%
M008 Health and safety 78.75 2.6% 100.0% 0.0%
M010 Teamworking 149.25 4.8% 100.0% 75.0%
Core Competencies
T010 Commercial management of construction 71.25 2.3% 100.0% 55.6%
T017 Contract practice 223.25 7.2% 100.0% 42.9%
T013 Construction technology and environmental services 679.75 22.0% 85.7% 0.0%
T022 Design economics and cost planning 252.5 8.2% 100.0% 73.3%
T062 Procurement and tendering 182.25 5.9% 92.3% 15.4%
T067 Project financial control and reporting 59.5 1.9% 100.0% 30.0%
T074 Quantification and costing of construction works 430 13.9% 95.2% 38.1%
Optional Competencies
T008 Capital allowances 10.5 0.3% 58.3% 0.0%
M006 Conflict avoidance, management and dispute resolution procedures 67.75 2.2% 100.0% 0.0%
T016 Contract administration 63 2.0% 95.5% 9.1%
T020 Corporate recovery and insolvency 0 0.0% 15.4% 0.0%
T025 Due diligence 0 0.0% 20.0% 0.0%
T045 Insurance 10 0.3% 50.0% 0.0%
T063 Programming and planning 112 3.6% 100.0% 50.0%
TO66 Project evaluation 147.5 4.8% 100.0% 76.9%
T077 Risk management 51.25 1.7% 84.6% 53.8%
M009 Sustainability 166.25 5.4% 100.0% 8.3%
Total 3083.25 hours 100.0% 290 topics 93 topics
306
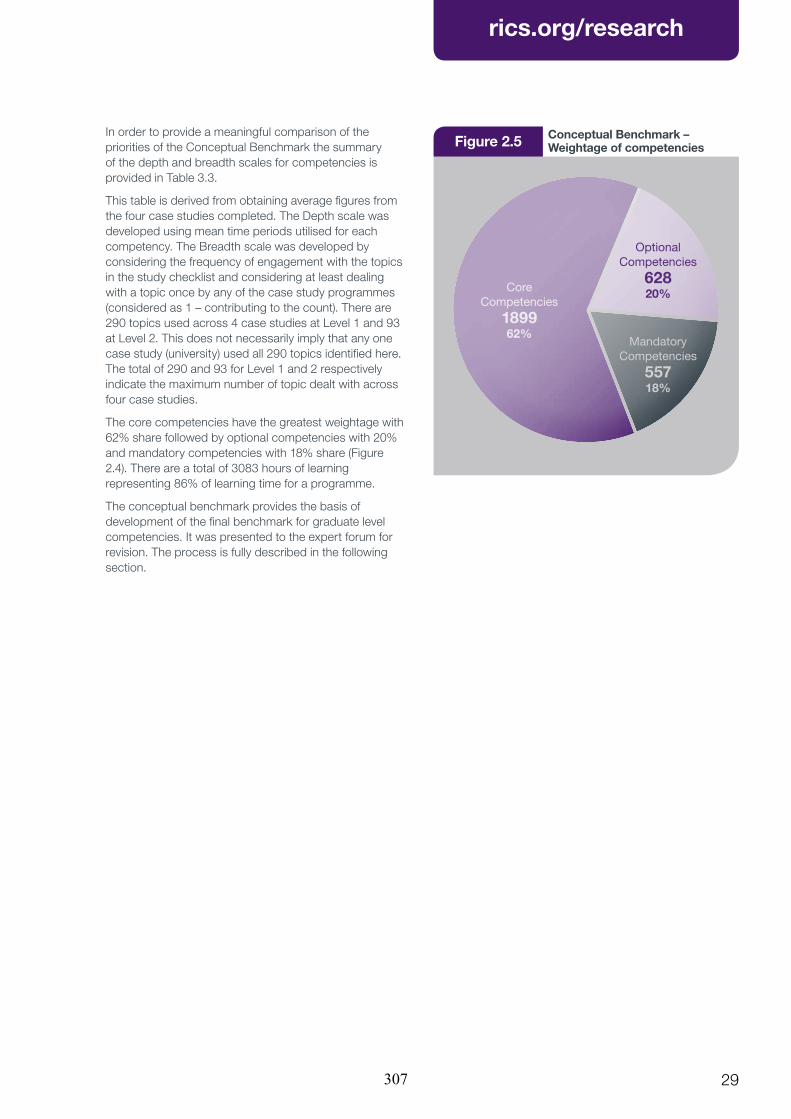
RICS Research – RICS Professional Competency Mapping Framework for Programme Appraisal and Benchmarking
rics.org/research
29
In order to provide a meaningful comparison of the priorities of the Conceptual Benchmark the summary of the depth and breadth scales for competencies is provided in Table 3.3.
This table is derived from obtaining average figures from the four case studies completed. The Depth scale was developed using mean time periods utilised for each competency. The Breadth scale was developed by considering the frequency of engagement with the topics in the study checklist and considering at least dealing with a topic once by any of the case study programmes (considered as 1 – contributing to the count). There are 290 topics used across 4 case studies at Level 1 and 93 at Level 2. This does not necessarily imply that any one case study (university) used all 290 topics identified here. The total of 290 and 93 for Level 1 and 2 respectively indicate the maximum number of topic dealt with across four case studies.
The core competencies have the greatest weightage with 62% share followed by optional competencies with 20% and mandatory competencies with 18% share (Figure 2.4). There are a total of 3083 hours of learning representing 86% of learning time for a programme.
The conceptual benchmark provides the basis of development of the final benchmark for graduate level competencies. It was presented to the expert forum for revision. The process is fully described in the following section.
Figure 2.5 Conceptual Benchmark – Weightage of competencies
Core Competencies
189962%
Mandatory Competencies
55718%
Optional Competencies
62820%
307
RICS Research – RICS Professional Competency Mapping Framework for Programme Appraisal and Benchmarking
rics.org/research
30
3.5 Development of the Final Benchmark for Graduate RouteThe conceptual benchmark was presented to a selected expert forum for revision of both breadth and depth scales for all study topics and competencies. Using the Delphi methodology the views of experts were harmonised to create the final benchmark. The process is explained in detail in the following sections.
3.5.1 Pilot StudyA two stage pilot study involving two experts was carried out to develop the framework for the conduct of the expert forum. The two experts selected were:
1. A very experienced senior academic
2. A very experienced senior practitioner with experience in both consulting and contracting practices.
The aim of the pilot study was twofold:
1. Further develop the map scoring system developed to carry out the competency mapping case studies and establish the conceptual benchmark. This was stage one of the pilot study process.
2. Carry out a preliminary run of the expert forum interviews in presenting conceptual benchmark and obtaining their views. This process helped in the development of the interview process to collect data for the revision of the conceptual benchmark. This was the second stage of the pilot study.
On completion of the pilot study the process protocol to follow in the expert forum was developed.
3.5.2 Establishing the Expert ForumThe forum of experts consists of industry practitioners from large, SME and micro level quantity surveying organisations. These include quantity surveying employer organisations from both the traditional consulting and contracting sectors. A minimum of two experts from each category were sought for this exercise. In addition, three Quantity Surveying programme directors from RICS accredited programmes were also invited to participate. All members were experienced academics and chartered surveyors. The forum consisted of 15 members representing all types of quantity surveying employers and academics (Table 2.4).
308

RICS Research – RICS Professional Competency Mapping Framework for Programme Appraisal and Benchmarking
rics.org/research
31
Table 2.4 The composition of the Expert Forum
Type of Organisation Abbreviation Size Code
1 Consulting practice PQS Large L
2 Consulting practice PQS Large D
3 Consulting practice PQS SME G
4 Consulting practice PQS SME E
5 Consulting practice PQS Micro F
6 Consulting practice PQS Micro B
7 Contracting CQS Large Q
8 Contracting CQS Large K
9 Contracting CQS SME A
10 Contracting CQS SME J
11 Contracting CQS Micro C
12 Contracting CQS SME H
13 Academia Academic University N
14 Academia Academic University M
15 Academia Academic University P
309

RICS Research – RICS Professional Competency Mapping Framework for Programme Appraisal and Benchmarking
rics.org/research
32
3.5.3 Revision and the Ratification of the BenchmarkThe stages followed in the expert forum are given below:
1. Invitations to industry and academic experts to join expert forum.
2. Appoint the expert forum members.
3. Arrange and conduct individual expert forum interviews arranged to obtain views on revisions to the conceptual benchmark.
4. Collate views of the expert forum and develop the revised benchmark considering the average views of all experts.
5. Distribute the revised benchmark to all experts to obtain views on further revisions or concurrence with the revised benchmark.
6. Collate all further revisions to develop the ratified benchmark.
7. Convert the ratified benchmark to the final benchmark (GCTB).
The details of how the revised benchmark values were developed from the conceptual benchmark are explained below. A similar pattern was followed for the development of the ratified benchmark values from the revised benchmark.
For the breadth scale, mode was used to analyse expert forum views. A competency consists of several topics. At Level 1, a topic under a certain competency can either be expected (i.e. by the experts) to be covered (i.e. marked as 1) or not expected to be covered (i.e. marked as 0), in graduate QS education. Same rules apply to Level 2 coverage. Level 3 is not considered because it is not a typical level of attainment in graduate QS education.
The mode of the 15 experts’ views is then derived for each topic at both Level 1 and Level 2. For example, if 8 experts (hence 8 ticks) or more think that a topic should be covered in graduate QS education at Level 1, the topic is marked as 1 under Level 1, and vice versa. Same applies to Level 2 coverage. The number of topics covered under each competency, marked as 1, is then used to calculate the percentage coverage of topics for that competency, at both Level 1 and Level 2.
The average views of all experts were used for the depth scale. The experts were asked to amend the conceptual benchmark values i.e. credits hours to reflect the learning hours they think should be allocated to each competency in graduate QS education. The mean value of the 15 expert forum views on credits hours was then computed for each competency. The mean figure is converted to percentage score to illustrate the relative time proportion for each competency.
The Delphi technique (Rowe and Wright, 2001) was utilised to extract and harmonise the views of the experts. This enabled the researchers to achieve a consensus view from the forum to finalise the benchmark minimum levels of achievement of competencies for graduate quantity surveyors.
A comparison of the conceptual, revised and ratified benchmarks using the depth scale is presented in Figure 2.7.
It is clear that there were some changes from a conceptual benchmark to a revised benchmark but there were minimal changes from the revised to the ratified benchmark (final GCTB).
The changes to the benchmark through the revision and ratification processes are summarised in Figure 2.6. This indicates a slight increase in the weighting for core competencies and a corresponding relative decrease in mandatory and core competencies. This also reflects a 3% increase in the total number of learning hours from 3083 hours to 3188 hours.
Summary of changes to the benchmark
Per
cent
age
(%)
50.0%
40.0%
20.0%
10.0%
30.0%
60.0%
Conceptual RatifiedRevised
Changes
70.0%
Figure 2.6
Mandatory competencies Core competencies
Optional competencies
0%
310

RICS Research – RICS Professional Competency Mapping Framework for Programme Appraisal and Benchmarking
rics.org/research
33
Figure 2.7 Cross comparison of ratified, revised and conceptual benchmarks for graduate competencies
M009 Sustainability
T077 Risk management
T066 Project evaluation
T063 Programming and planning
T045 Insurance
T025 Due Diligence
T020 Corporate recovery and insolvency
T016 Contract administration
M006 Conflict avoidance, management and dispute resolution procedures
T008 Capital allowances
T074 Quantification and costing of construction works
T067 Project financial control and reporting
T062 Procurement and tendering
T022 Design economics and cost planning
T013 Construction technology and environmental services
T017 Contract practice
T010 Commercial management of construction
M010 Teamworking
M008 Health and safety
M007 Data management
M005 Conduct rules, ethics and professional practice
M004 Communication and negotiation
M003 Client care
M002 Business planning
M001 Accounting principles and procedures
400 800700500 600300100 2000
Conceptual Revised Ratified
Com
pet
enci
es
Credit hours
311
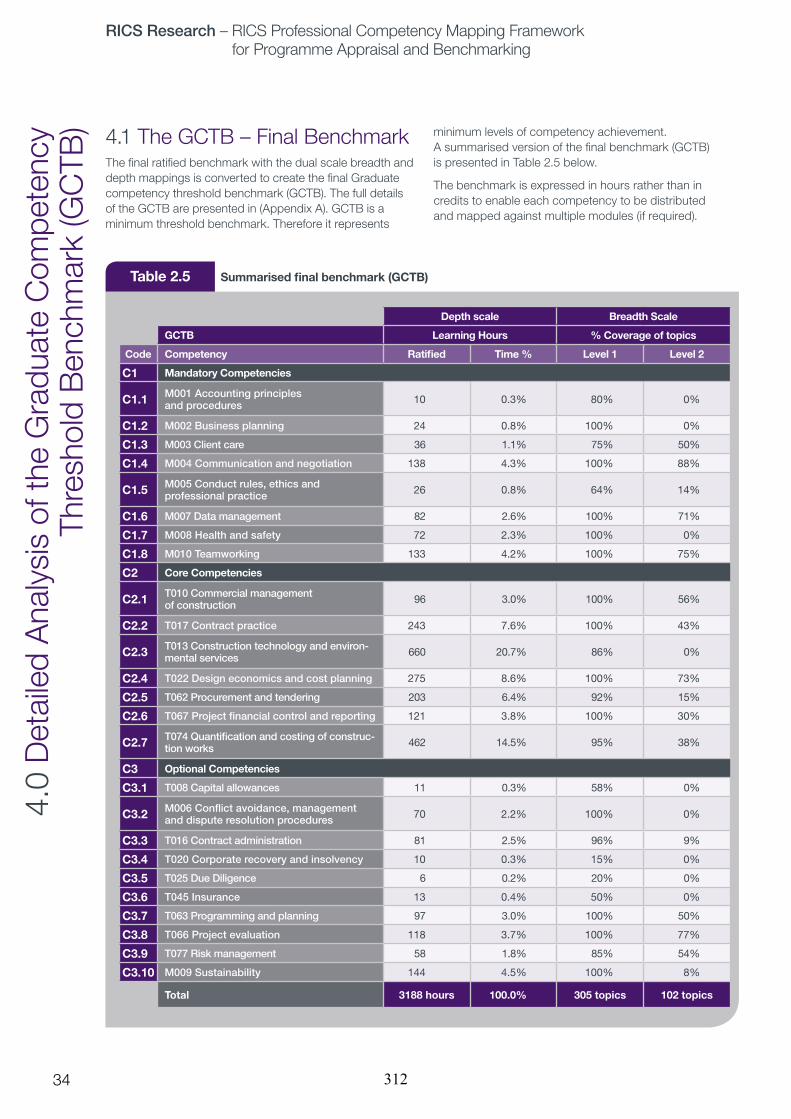
RICS Research – RICS Professional Competency Mapping Framework for Programme Appraisal and Benchmarking
rics.org/research
34
4.0
Det
aile
d A
naly
sis
of th
e G
radu
ate
Com
pete
ncy
Thre
shol
d B
ench
mar
k (G
CTB
) 4.1 The GCTB – Final BenchmarkThe final ratified benchmark with the dual scale breadth and depth mappings is converted to create the final Graduate competency threshold benchmark (GCTB). The full details of the GCTB are presented in (Appendix A). GCTB is a minimum threshold benchmark. Therefore it represents
Table 2.5 Summarised final benchmark (GCTB)
Depth scale Breadth Scale
GCTB Learning Hours % Coverage of topics
Code Competency Ratified Time % Level 1 Level 2
C1 Mandatory Competencies
C1.1 M001 Accounting principles and procedures 10 0.3% 80% 0%
C1.2 M002 Business planning 24 0.8% 100% 0%
C1.3 M003 Client care 36 1.1% 75% 50%
C1.4 M004 Communication and negotiation 138 4.3% 100% 88%
C1.5 M005 Conduct rules, ethics and professional practice 26 0.8% 64% 14%
C1.6 M007 Data management 82 2.6% 100% 71%
C1.7 M008 Health and safety 72 2.3% 100% 0%
C1.8 M010 Teamworking 133 4.2% 100% 75%
C2 Core Competencies
C2.1 T010 Commercial management of construction 96 3.0% 100% 56%
C2.2 T017 Contract practice 243 7.6% 100% 43%
C2.3 T013 Construction technology and environ-mental services 660 20.7% 86% 0%
C2.4 T022 Design economics and cost planning 275 8.6% 100% 73%
C2.5 T062 Procurement and tendering 203 6.4% 92% 15%
C2.6 T067 Project financial control and reporting 121 3.8% 100% 30%
C2.7 T074 Quantification and costing of construc-tion works 462 14.5% 95% 38%
C3 Optional Competencies
C3.1 T008 Capital allowances 11 0.3% 58% 0%
C3.2 M006 Conflict avoidance, management and dispute resolution procedures 70 2.2% 100% 0%
C3.3 T016 Contract administration 81 2.5% 96% 9%
C3.4 T020 Corporate recovery and insolvency 10 0.3% 15% 0%
C3.5 T025 Due Diligence 6 0.2% 20% 0%
C3.6 T045 Insurance 13 0.4% 50% 0%
C3.7 T063 Programming and planning 97 3.0% 100% 50%
C3.8 T066 Project evaluation 118 3.7% 100% 77%
C3.9 T077 Risk management 58 1.8% 85% 54%
C3.10 M009 Sustainability 144 4.5% 100% 8%
Total 3188 hours 100.0% 305 topics 102 topics
minimum levels of competency achievement. A summarised version of the final benchmark (GCTB) is presented in Table 2.5 below.
The benchmark is expressed in hours rather than in credits to enable each competency to be distributed and mapped against multiple modules (if required).
312

RICS Research – RICS Professional Competency Mapping Framework for Programme Appraisal and Benchmarking
rics.org/research
35
The percentage time allocation clearly indicates the relative importance of competencies in terms of learning hours that need to be spent at undergraduate level. The relative importance of competency categories is presented in Figure 2.8.
The overall levels of coverage of topics for mandatory, core and optional competencies are summarised in Figure 2.9. It is clear that most topics, especially for mandatory and core competencies, need to be covered at Level 1. There is a slightly higher coverage for mandatory competencies over core competencies which are expected at Level 2.
The depth scale indicates the minimum number of learning hours that needs to be allocated to each competency in a RICS accredited QS honours degree programme. The module specifications of such a programme can be mapped to the RICS QS competencies, identifying the learning hours spent for each competency. The minimum benchmark developed here provides a threshold minimum to achieve in this mapping (Figure 10).
The breadth scale (Figure 11) in the benchmark indicates the expected percentage coverage of the RICS QS Study Check list (RICS, 2008a). The detail of which study topics need to be covered is indicated in the full benchmark presented in Appendix A of this report.
4.2 An in depth Analysis of the Benchmark and Expert Forum PerspectivesThe expert forum consisted of 3 main groups of experts viz PQS, CQS and Academics. Figure 12 presents a cross analysis of these groups’ views against combined views (Ratified).
It is clear that there is a minimal difference of opinion between these groups. Since all three expert forum groups have expressed similar views, this is reflected in the combined view expressed in the ratified benchmark.
Optional Competencies608 hours
19%
Core Competencies2060 hours
65%
Mandatory Competencies521 hours
16%
Relative time allocations for competency categoriesFigure 2.8
Figure 2.9Overall comparison of coverage of topics (Breadth scale) across competency categories
0.0%
Mandatory Competencies
Core Competencies
Optional Competencies
20.0%
40.0%
60.0%
80.0%
100.0%
120.0%
Category
Per
cent
age
of r
esp
ond
ents
(%)
Level 1 Level 2
313

RICS Research – RICS Professional Competency Mapping Framework for Programme Appraisal and Benchmarking
rics.org/research
36
Figure 2.10 Benchmark minimum learning hours – Depth scale
M009 Sustainability
T077 Risk management
T066 Project evaluation
T063 Programming and planning
T045 Insurance
T025 Due Diligence
T020 Corporate recovery and insolvency
T016 Contract administration
M006 Conflict avoidance, management and dispute resolution procedures
T008 Capital allowances
T074 Quantification and costing of construction works
T067 Project financial control and reporting
T062 Procurement and tendering
T022 Design economics and cost planning
T013 Construction technology and environmental services
T017 Contract practice
T010 Commercial management of construction
M010 Teamworking
M008 Health and safety
M007 Data management
M005 Conduct rules, ethics and professional practice
M004 Communication and negotiation
M003 Client care
M002 Business planning
M001 Accounting principles and procedures
700500400 600300100 2000
Com
pet
enci
es
Minimum Learning Hours
314
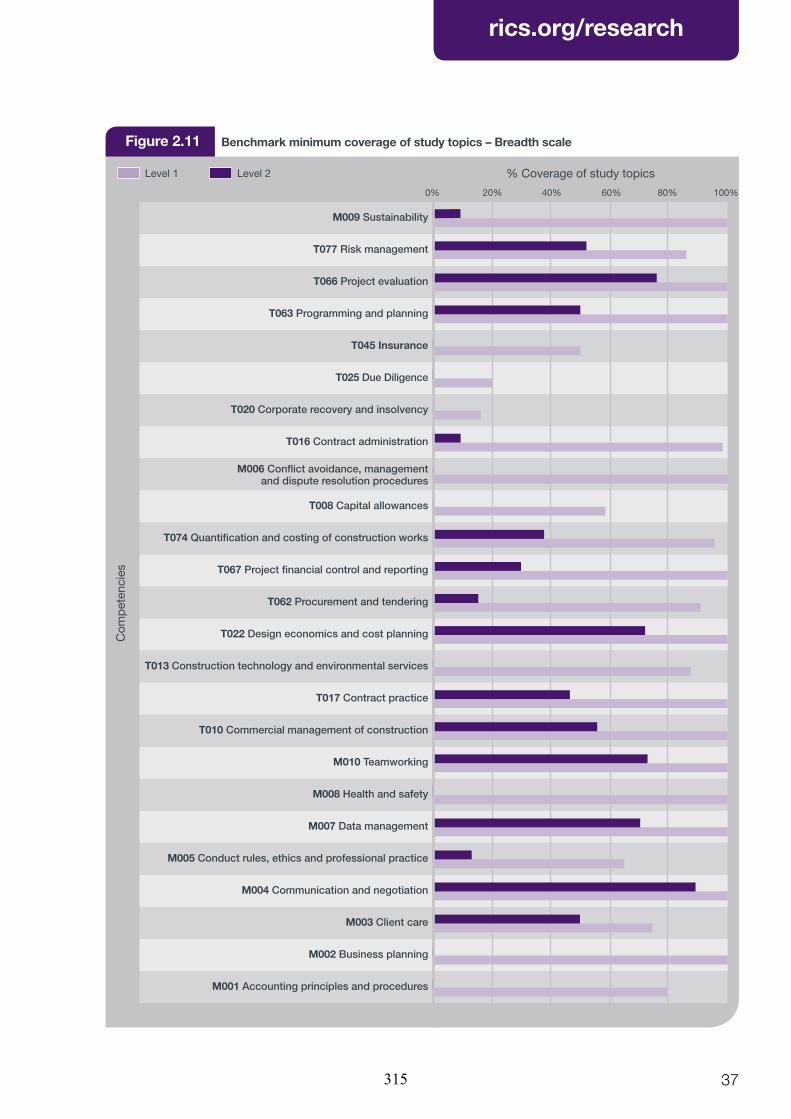
RICS Research – RICS Professional Competency Mapping Framework for Programme Appraisal and Benchmarking
rics.org/research
37
Figure 2.11 Benchmark minimum coverage of study topics – Breadth scale
M009 Sustainability
T077 Risk management
T066 Project evaluation
T063 Programming and planning
T045 Insurance
T025 Due Diligence
T020 Corporate recovery and insolvency
T016 Contract administration
M006 Conflict avoidance, management and dispute resolution procedures
T008 Capital allowances
T074 Quantification and costing of construction works
T067 Project financial control and reporting
T062 Procurement and tendering
T022 Design economics and cost planning
T013 Construction technology and environmental services
T017 Contract practice
T010 Commercial management of construction
M010 Teamworking
M008 Health and safety
M007 Data management
M005 Conduct rules, ethics and professional practice
M004 Communication and negotiation
M003 Client care
M002 Business planning
M001 Accounting principles and procedures
100%80%60%20% 40%0%
% Coverage of study topics
Com
pet
enci
es
Level 1 Level 2
315
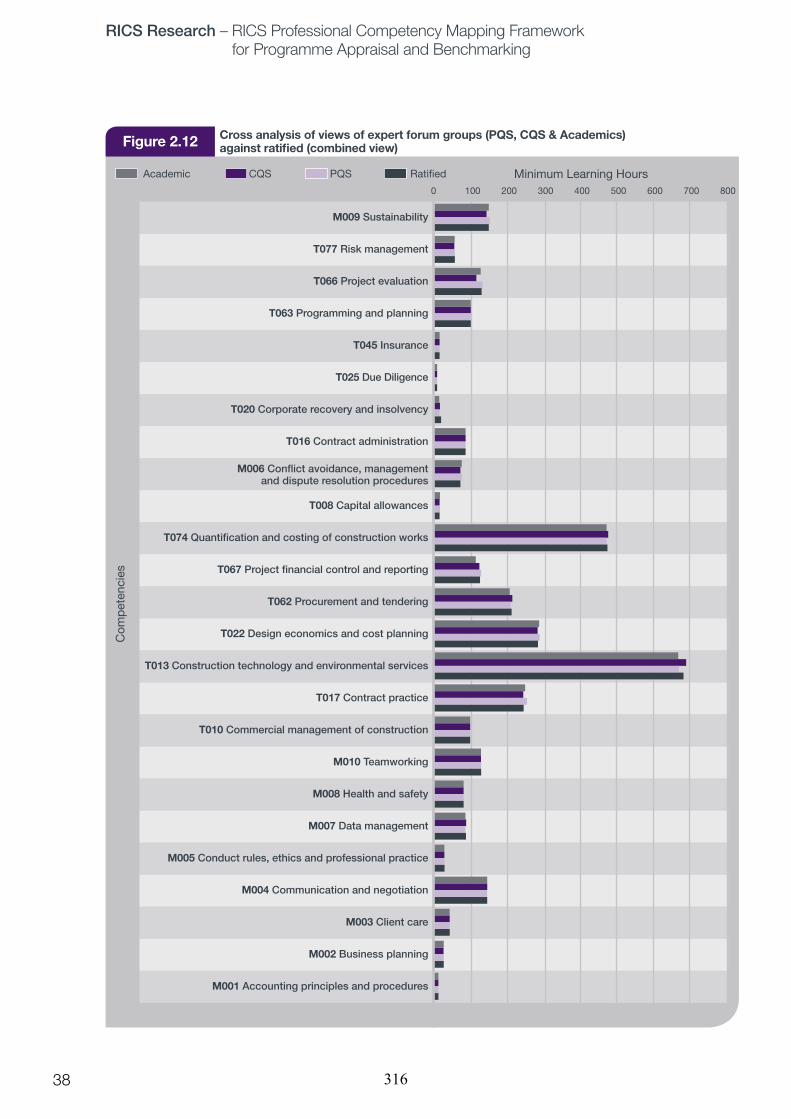
RICS Research – RICS Professional Competency Mapping Framework for Programme Appraisal and Benchmarking
rics.org/research
38
Figure 2.12 Cross analysis of views of expert forum groups (PQS, CQS & Academics) against ratified (combined view)
M009 Sustainability
T077 Risk management
T066 Project evaluation
T063 Programming and planning
T045 Insurance
T025 Due Diligence
T020 Corporate recovery and insolvency
T016 Contract administration
M006 Conflict avoidance, management and dispute resolution procedures
T008 Capital allowances
T074 Quantification and costing of construction works
T067 Project financial control and reporting
T062 Procurement and tendering
T022 Design economics and cost planning
T013 Construction technology and environmental services
T017 Contract practice
T010 Commercial management of construction
M010 Teamworking
M008 Health and safety
M007 Data management
M005 Conduct rules, ethics and professional practice
M004 Communication and negotiation
M003 Client care
M002 Business planning
M001 Accounting principles and procedures
800700500400 600300100 2000
Com
pet
enci
es
Minimum Learning HoursAcademic CQS PQS Ratified
316
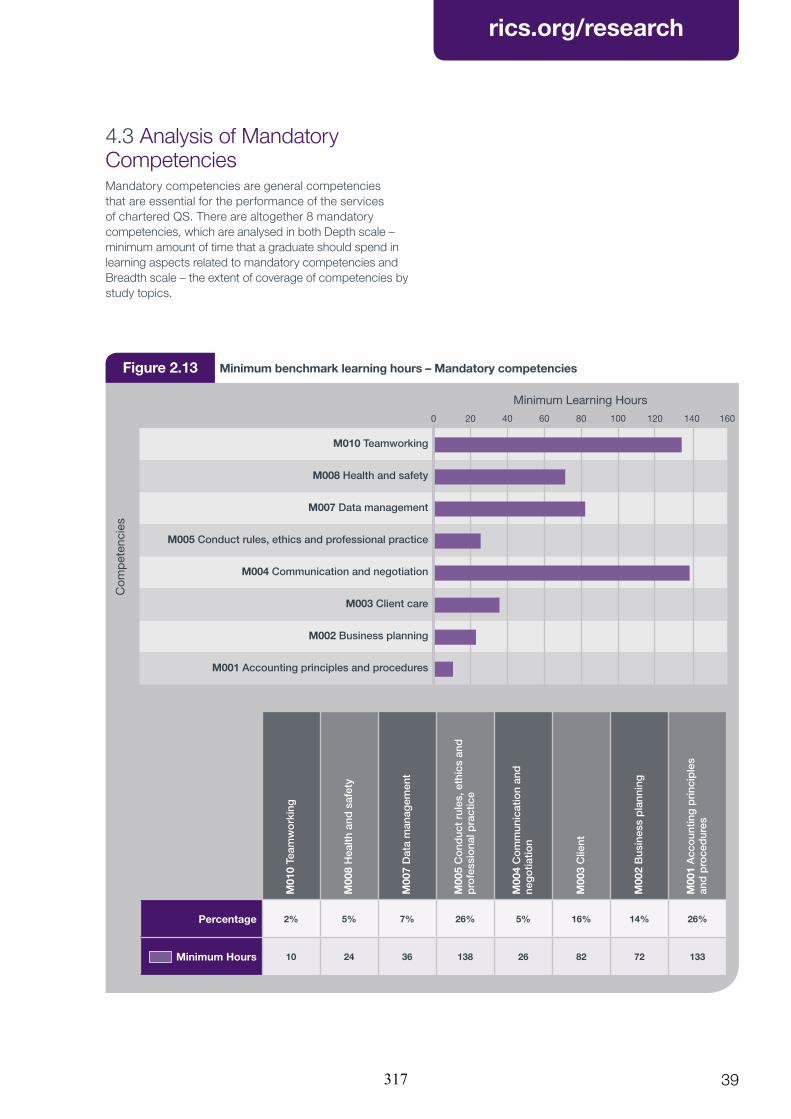
RICS Research – RICS Professional Competency Mapping Framework for Programme Appraisal and Benchmarking
rics.org/research
39
Figure 2.13 Minimum benchmark learning hours – Mandatory competencies
M010 Teamworking
M008 Health and safety
M007 Data management
M005 Conduct rules, ethics and professional practice
M004 Communication and negotiation
M003 Client care
M002 Business planning
M001 Accounting principles and procedures
16014010080 1206020 400
Minimum Learning Hours
M01
0 Te
amw
ork
ing
M00
8 H
ealth
and
saf
ety
M00
7 D
ata
man
agem
ent
M00
5 C
ond
uct
rule
s, e
thic
s an
d
pro
fess
iona
l pra
ctic
e
M00
4 C
om
mun
icat
ion
and
ne
go
tiatio
n
M00
3 C
lient
M00
2 B
usin
ess
pla
nnin
g
M00
1 A
cco
untin
g p
rinc
iple
s
and
pro
ced
ures
Percentage 2% 5% 7% 26% 5% 16% 14% 26%
Minimum Hours 10 24 36 138 26 82 72 133
Com
pet
enci
es
4.3 Analysis of Mandatory CompetenciesMandatory competencies are general competencies that are essential for the performance of the services of chartered QS. There are altogether 8 mandatory competencies, which are analysed in both Depth scale – minimum amount of time that a graduate should spend in learning aspects related to mandatory competencies and Breadth scale – the extent of coverage of competencies by study topics.
317
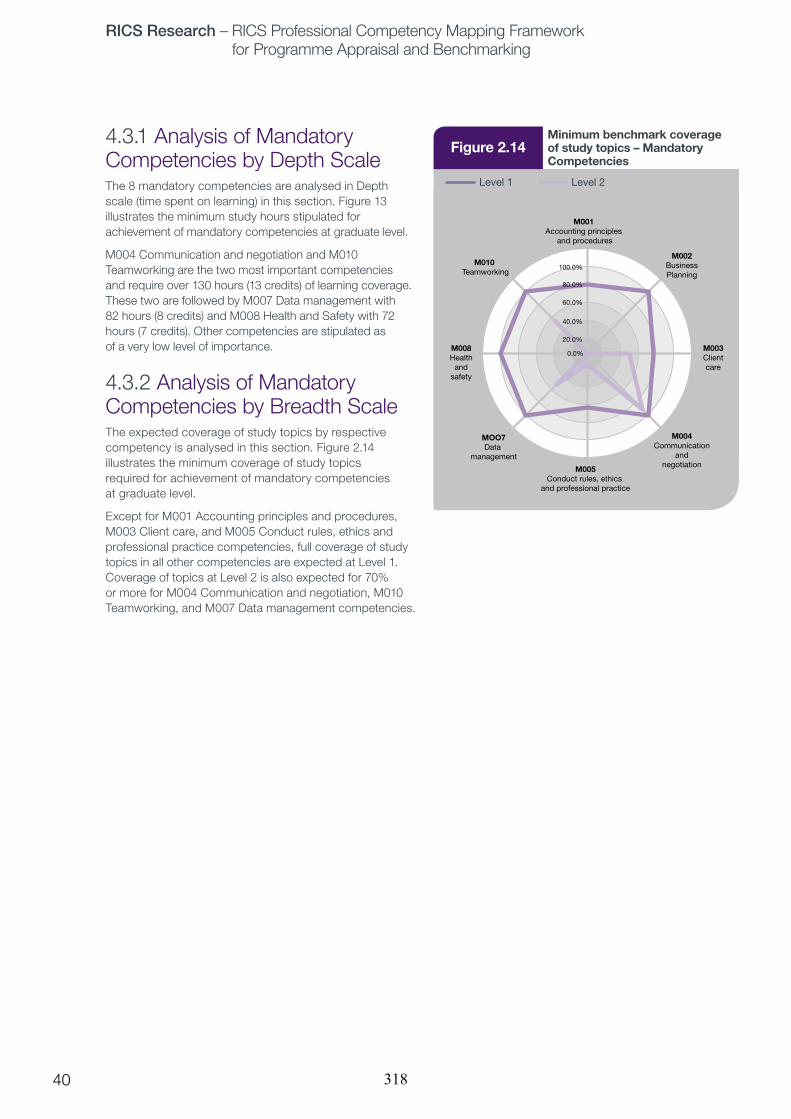
RICS Research – RICS Professional Competency Mapping Framework for Programme Appraisal and Benchmarking
rics.org/research
40
Figure 2.14Minimum benchmark coverage of study topics – Mandatory Competencies
M001 Accounting principles
and procedures
M002BusinessPlanning
M003Clientcare
M004Communication
andnegotiationM005
Conduct rules, ethics and professional practice
MOO7Data
management
M008Health
andsafety
M010 Teamworking
0.0%
20.0%
40.0%
60.0%
80.0%
100.0%
Level 1 Level 2
4.3.1 Analysis of Mandatory Competencies by Depth ScaleThe 8 mandatory competencies are analysed in Depth scale (time spent on learning) in this section. Figure 13 illustrates the minimum study hours stipulated for achievement of mandatory competencies at graduate level.
M004 Communication and negotiation and M010 Teamworking are the two most important competencies and require over 130 hours (13 credits) of learning coverage. These two are followed by M007 Data management with 82 hours (8 credits) and M008 Health and Safety with 72 hours (7 credits). Other competencies are stipulated as of a very low level of importance.
4.3.2 Analysis of Mandatory Competencies by Breadth ScaleThe expected coverage of study topics by respective competency is analysed in this section. Figure 2.14 illustrates the minimum coverage of study topics required for achievement of mandatory competencies at graduate level.
Except for M001 Accounting principles and procedures, M003 Client care, and M005 Conduct rules, ethics and professional practice competencies, full coverage of study topics in all other competencies are expected at Level 1. Coverage of topics at Level 2 is also expected for 70% or more for M004 Communication and negotiation, M010 Teamworking, and M007 Data management competencies.
318
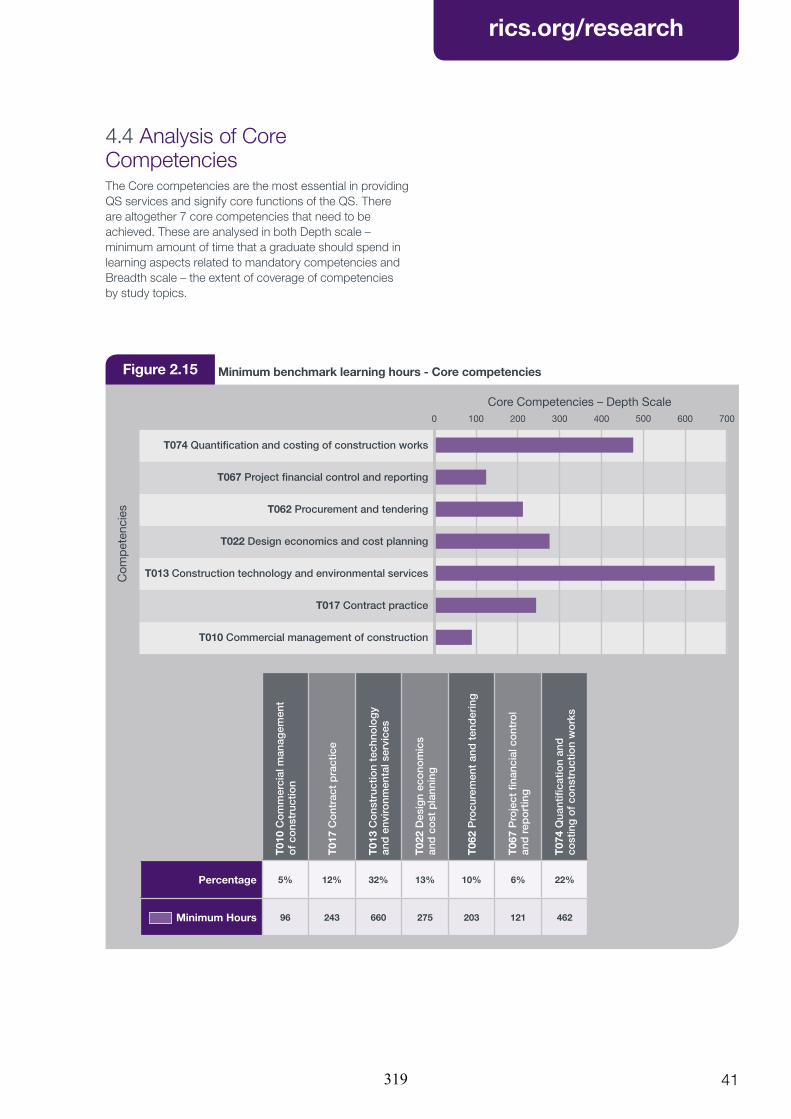
RICS Research – RICS Professional Competency Mapping Framework for Programme Appraisal and Benchmarking
rics.org/research
41
4.4 Analysis of Core CompetenciesThe Core competencies are the most essential in providing QS services and signify core functions of the QS. There are altogether 7 core competencies that need to be achieved. These are analysed in both Depth scale – minimum amount of time that a graduate should spend in learning aspects related to mandatory competencies and Breadth scale – the extent of coverage of competencies by study topics.
Figure 2.15 Minimum benchmark learning hours - Core competencies
T074 Quantification and costing of construction works
T067 Project financial control and reporting
T062 Procurement and tendering
T022 Design economics and cost planning
T013 Construction technology and environmental services
T017 Contract practice
T010 Commercial management of construction
700500400 600300100 2000
Core Competencies – Depth Scale
T01
0 C
om
mer
cial
man
agem
ent
o
f co
nstr
uctio
n
T01
7 C
ont
ract
pra
ctic
e
T01
3 C
ons
truc
tion
tech
nolo
gy
an
d e
nviro
nmen
tal s
ervi
ces
T02
2 D
esig
n ec
ono
mic
s
and
co
st p
lann
ing
T06
2 P
rocu
rem
ent
and
ten
der
ing
T06
7 P
roje
ct fi
nanc
ial c
ont
rol
and
rep
ort
ing
T07
4 Q
uant
ifica
tion
and
co
stin
g o
f co
nstr
uctio
n w
ork
s
Percentage 5% 12% 32% 13% 10% 6% 22%
Minimum Hours 96 243 660 275 203 121 462
Com
pet
enci
es
319

RICS Research – RICS Professional Competency Mapping Framework for Programme Appraisal and Benchmarking
rics.org/research
42
4.4.1 Analysis of Core Competencies by Depth ScaleThe 7 core competencies are analysed in Depth scale (time spent on learning) in this section. Figure 15 illustrates the minimum study hours stipulated for achievement of core competencies at graduate level.
T013 Construction technology and environmental services, is considered the single most important competence that needs to be achieved at graduate level education. It has a 32% weighting in time commitment, with 660 hours’ time allocated for the competence. This equates to 21% (66 credits) of an honours degree programme. The second most important competence in terms of time allocation is the T074 Quantification and costing of construction works, with 462 hours (46 credits) of time allocation. It is followed by T022 Design economics and cost planning, with 275 hours (28 credits), T017 Contract practice, with 243 hours (24 credits) and, T062 Procurement and tendering, with 203 hours (20 credits). These levels of importance corroborate well with importance rankings in previous research (Perera & Pearson, 2011).
4.4.2 Analysis of Core Competencies by Breadth ScaleThe expected coverage of study topics by respective competency is analysed in this section. Figure 16 illustrates the minimum coverage of study topics required for the achievement of core competencies at graduate level.
Almost 100% coverage of study topics is expected at Level 1 in all competencies except for T013 Construction technology and environmental services, T062 Procurement and tendering, and T074 Quantification and costing of construction works competencies. Even in these over 85% coverage is expected. At Level 2, over 73% coverage of topics is expected for T022 Design economics and cost planning, with the second highest on T010 Commercial management of construction (55%). This indicates that these two topics have the highest level of importance in terms of topic coverage. However, there is relative lesser emphasis on these two aspects in the Depth scale analysis.
Figure 2.16Minimum benchmark coverage of study topics – Core Competencies
T010Commercial management
of construction
T017Contractpractice
T013Construction technology
and environmental
services
T022Design economics and cost planning
T062Procurement and tendering
T067Project financial control
and reporting
T074 Quantification and
costing ofconstruction
works
0.0%
20.0%30.0%
10.0%
40.0%50.0%60.0%70.0%80.0%90.0%
100.0%
Level 1 Level 2
320
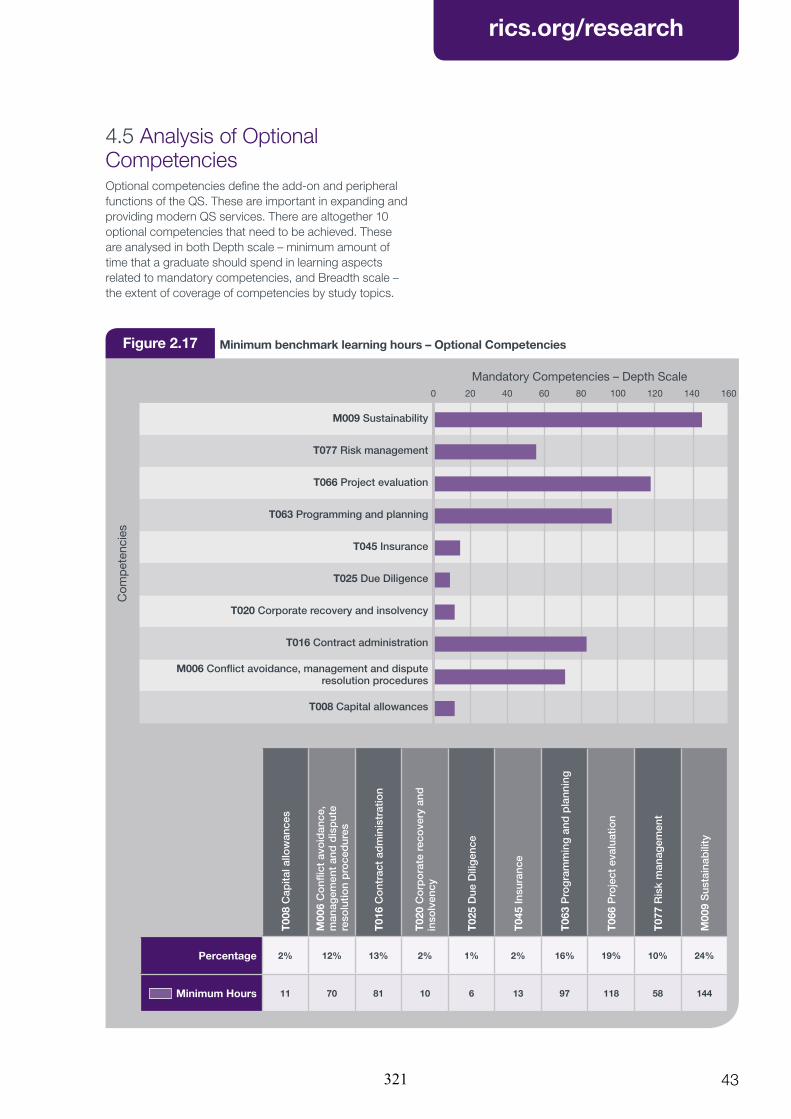
RICS Research – RICS Professional Competency Mapping Framework for Programme Appraisal and Benchmarking
rics.org/research
43
4.5 Analysis of Optional CompetenciesOptional competencies define the add-on and peripheral functions of the QS. These are important in expanding and providing modern QS services. There are altogether 10 optional competencies that need to be achieved. These are analysed in both Depth scale – minimum amount of time that a graduate should spend in learning aspects related to mandatory competencies, and Breadth scale – the extent of coverage of competencies by study topics.
Figure 2.17 Minimum benchmark learning hours – Optional Competencies
M009 Sustainability
T077 Risk management
T066 Project evaluation
T063 Programming and planning
T045 Insurance
T025 Due Diligence
T020 Corporate recovery and insolvency
T016 Contract administration
M006 Conflict avoidance, management and dispute resolution procedures
T008 Capital allowances
16014010080 1206020 400
Mandatory Competencies – Depth Scale
Com
pet
enci
es
T00
8 C
apita
l allo
wan
ces
M00
6 C
onfl
ict
avo
idan
ce,
man
agem
ent
and
dis
put
e
reso
lutio
n p
roce
dur
es
T01
6 C
ont
ract
ad
min
istr
atio
n
T02
0 C
orp
ora
te r
eco
very
and
in
solv
ency
T02
5 D
ue D
ilig
ence
T04
5 In
sura
nce
T06
3 P
rog
ram
min
g a
nd p
lann
ing
T06
6 P
roje
ct e
valu
atio
n
T07
7 R
isk
man
agem
ent
M00
9 S
usta
inab
ility
Percentage 2% 12% 13% 2% 1% 2% 16% 19% 10% 24%
Minimum Hours 11 70 81 10 6 13 97 118 58 144
321
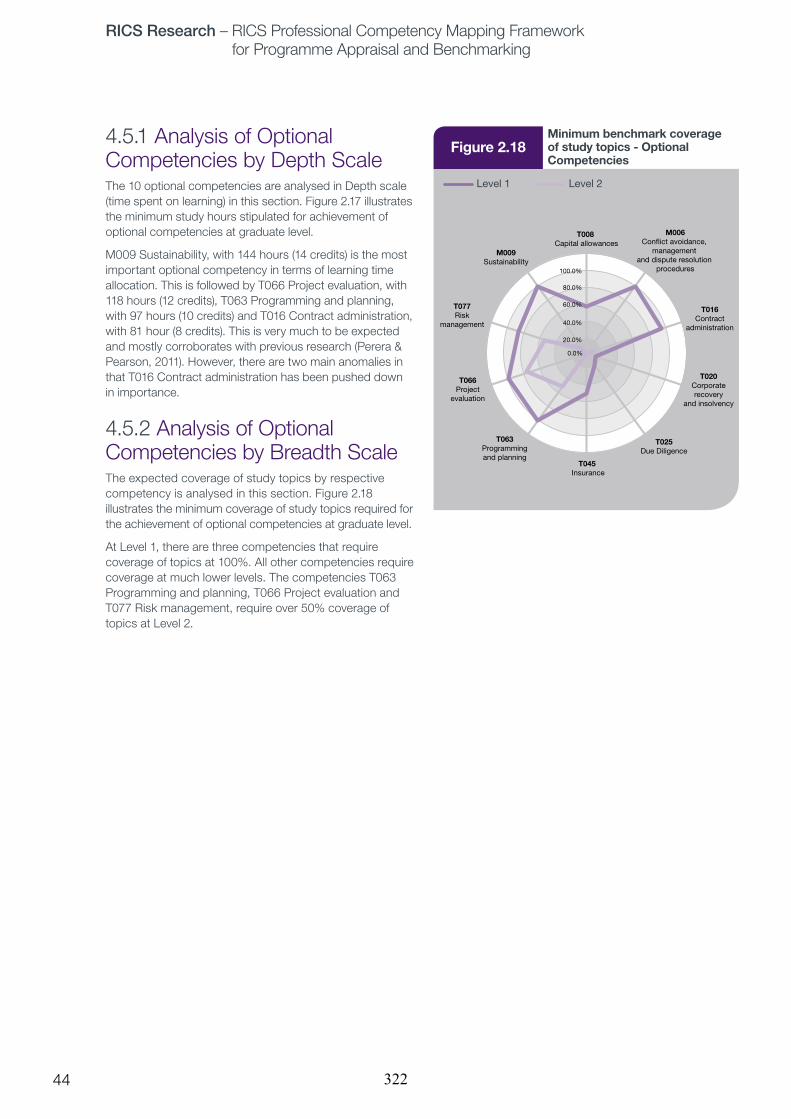
RICS Research – RICS Professional Competency Mapping Framework for Programme Appraisal and Benchmarking
rics.org/research
44
4.5.1 Analysis of Optional Competencies by Depth ScaleThe 10 optional competencies are analysed in Depth scale (time spent on learning) in this section. Figure 2.17 illustrates the minimum study hours stipulated for achievement of optional competencies at graduate level.
M009 Sustainability, with 144 hours (14 credits) is the most important optional competency in terms of learning time allocation. This is followed by T066 Project evaluation, with 118 hours (12 credits), T063 Programming and planning, with 97 hours (10 credits) and T016 Contract administration, with 81 hour (8 credits). This is very much to be expected and mostly corroborates with previous research (Perera & Pearson, 2011). However, there are two main anomalies in that T016 Contract administration has been pushed down in importance.
4.5.2 Analysis of Optional Competencies by Breadth ScaleThe expected coverage of study topics by respective competency is analysed in this section. Figure 2.18 illustrates the minimum coverage of study topics required for the achievement of optional competencies at graduate level.
At Level 1, there are three competencies that require coverage of topics at 100%. All other competencies require coverage at much lower levels. The competencies T063 Programming and planning, T066 Project evaluation and T077 Risk management, require over 50% coverage of topics at Level 2.
Figure 2.18Minimum benchmark coverage of study topics - Optional Competencies
T008 Capital allowances
M006Conflict avoidance,
management and dispute resolution
procedures
T016Contract
administration
T025Due Diligence
T020Corporaterecovery
and insolvency
T045 Insurance
T063Programmingand planning
T066Project
evaluation
T077Risk
management
M009Sustainability
0.0%
20.0%
40.0%
60.0%
80.0%
100.0%
5.0
Com
pete
ncy
Map
ping
Fra
mew
ork
in th
e co
ntex
t of e
xist
ing
Pro
cess
es
Level 1 Level 2
322
RICS Research – RICS Professional Competency Mapping Framework for Programme Appraisal and Benchmarking
rics.org/research
45
In this section, current academic and RICS processes and structures will be reviewed, in order to set the introduction and operation of the proposed benchmarking system within these. The review is based on an examination of available literature and interviews of three academics with extensive experience in QS programme development and management. The views of the interviewees are presented using numbers 1, 2 and 3 representing their respective views. The interviews were semi structured to enable free discussion but within the parameters of the report.
5.1 Programme Development and Validation
5.1.1 Introduction The current network of Quantity Surveying Degrees grew from the early 1970’s with the move from Diploma to Degree level qualification for entry to the profession. The following examines the general processes required of those seeking validation of a new programme or re-validation of an existing, considering how a benchmarking system might be incorporated within this for the general regulation and betterment of standards.
The majority of the above degrees were delivered by the former Polytechnics, most of which, in turn, became New Universities in the early 1990’s or thereabouts. With their conversion to University status came the right to validate and award degrees (previously validated by and awarded under the auspices of the Council for National Academic Awards (CNAA), to whom the former Polytechnics were answerable).
“Up until 1994, the RICS ran its own examinations, but since [then] there has been a progressive change towards qualification through accredited courses at undergraduate and postgraduate level” (RICS, 2008b). This process has recently changed with the introduction of the Assoc. RICS route.
5.0
Com
pete
ncy
Map
ping
Fra
mew
ork
in th
e co
ntex
t of e
xist
ing
Pro
cess
es
323

RICS Research – RICS Professional Competency Mapping Framework for Programme Appraisal and Benchmarking
rics.org/research
46
5.1.2 Programme Development and the Validation Process
5.1.2.1 Programme DevelopmentAny enterprise operating in today’s competitive climate should constantly be reviewing potential markets for its products with a view to satisfying these and to long term growth. Academic institutions are no different. And so it is that those responsible for programme development will be on the lookout for appropriate areas of expansion. Provision must keep pace with the times, and adjust where possible to changing professional needs. From this comes the process of the review of existing programmes by programme teams and, from time to time, the creation of new ones. As seen above, this process, known as Validation, is now almost universally one which is internal to the university concerned. Very few, if any, degree courses in surveying are franchised, and even they will be monitored and sanctioned by a “parent” university rather than by the RICS itself.
5.1.2.2 Validation“Validation is the act of academic approval by the university to confirm and verify an award in terms of the appropriate standard for the level of the award and the content as reflected in the award title …” ( Northumbria 2010). Based on one of the Universities studied, the following is an abridged account of the formal Validation requirements and procedures.
Validation will usually not come about except via a panel event, held within the School in question, for and at which all the relevant documentation will be considered. In the case of an undergraduate award the panel make-up will include a subject expert external to the university. In the case of surveying awards such an external expert will usually be a member of the RICS. In addition there will be a Panel Chair and two to four other internal panel members.
Documentation must include:• Programme Specification – a comprehensive document
presenting a contextual statement for the new course and covering its operation and composition precisely, including such matters as the delivery and assessment of each module.
• Full descriptive documents “Module Descriptors” will also be submitted for each new module associated with the programme. These last will each contain an outline syllabus, learning objectives, the proposed assessment rationale and a detailed split between class contact, directed learning, private study and assessment.
No Validation will be approved without the full satisfactory presentation of all documents, together with the execution of any corrections or amendments recommended by the School panel. Thus, quality standards across the School can be upheld, and all will be in line with university guidelines.
In the case of a new programme the proposal to develop such materials must be sanctioned by the relevant sub-committee of the University Learning and Teaching Committee. This will take into consideration overall university policies and guidelines regarding funding, resources and long term academic strategies. Only with and after the approval of this Committee can development go ahead at School level.
Stage Two of this process sees the first introduction of detailed proposals, created by course teams – the Programme Specification and other necessary documentation.
324
RICS Research – RICS Professional Competency Mapping Framework for Programme Appraisal and Benchmarking
rics.org/research
47
5.1.3 Interview AnalysisInterview responses all essentially illustrate and support the suggestion that Validation is a process internal to the University, one over which the RICS has no real control. The nearest that they come to having influence is through the external expert, who will tend to be a Chartered Surveyor attached to the discipline to which the programme relates. One interviewee (1) did liken the accreditation process (see Section 5.2, below) to “validation at course level”, for here the RICS can have some say over the continuation or otherwise of a course. Another supported this understanding;
“[RICS] is not directly involved in the validation process within the university but they are part of the process … under the banner of our partnership meetings” 3.
Two of the interviewees gave lengthy and detailed accounts of the processes operated within their own universities to achieve and maintain certain quality levels across their courses, both much along the lines of the above.
“There’s a standard procedure and whole list of documents actually produced, which evaluating the rationale for this … for the new course, providing [a] resource document obviously, proposing … an overall structure and … content, its curriculum and its modules and maybe writing quite a few new modules if it’s quite a new course … one of the things we do in terms of validation is prescribe to a certain format... the university requires us to put together an number of documents … we will have somebody who will be from another university or from practice” 2.
Both cases served to illustrate that rigour is applied, again as suggested by the example detailed above. Interviewees seemed satisfied in broad terms with the processes concerned, together with the part which they, colleagues and others played in it. Reference was also made to Periodic Reviews.
“At university level we have … every 5 years we have a review of specific programmes where they come in and there’s internal and external people involved in the visiting panel. They’ll be coming and look over all the content of the course …” 1.
These are held by all the Universities (usually on five yearly basis, as suggested), a further check on the maintenance of standards.
One interviewee, remarking in fact on benchmarks and what they ought to cover (but confusing these perhaps with thresholds) suggested that the RICS;
“should look at how many members of the academic staff are members of the RICS … because if you’ve got academic membership staff, members of the RICS, they understand the competencies which they feed back into the course developed” 1.
5.1.4 Further Development The RICS does not have direct influence over the actual award of degrees themselves, lost to it essentially with the granting of degree awarding rights to the New Universities. The degrees, together with the broad outline of their respective validation processes have an ever increasing role to perform. The RICS will have to work through and around the existing structures, exercising such influence as they can through external subject experts, external examiners, academic staff who are members, and the like.
As is suggested above, new developments (or fundamental changes to existing provision) arise out of perceived demand and first see light within a School and/or subject group setting. That is, they are born of academics who are associated with the discipline. These academics will be guided by subject experience, which should include influences from professionals and professional bodies with whom they are in contact. They should also draw on, and be guided by; any documentation produced by the professional body, in this case the RICS, from who they receive accreditation. This last may afford the opportunity for the introduction into the customary documentation the proposed GCTB perhaps as a part of the Programme Specification or as integral part of the set of programme validation documentation.
5.1.5 Summary Validation is, essentially, a private, in-house process, one in which the RICS has no specific involvement and over which it has no direct power. However, there is nothing in university regulations to prevent academics responsible for the design of new programmes/courses, and external subject experts party to the validation process (who in most cases will be themselves be members of the RICS), from heeding and being guided very specifically by benchmarks. Equally, as part of their documentation, universities declare their wish to be guided by good practice from industry. In due course, benchmarks such as those proposed and created as a result of this research may be regarded as embodying good industry practice. In due course the requirement for adherence to such benchmarks may become embedded in the paperwork without which no programme submission will be considered complete.
325
RICS Research – RICS Professional Competency Mapping Framework for Programme Appraisal and Benchmarking
rics.org/research
48
5.2 RICS Programme Accreditation
5.2.1 Introduction Accreditation is closely tied in with, and monitored through, the RICS. The RICS – University Partnership Process, (see Section 5.3, below), as the two are virtually synonymous. Accreditation, once achieved, is reviewed through the media of the Partnership.
5.2.2 The Accreditation Process As noted above, the majority of Quantity Surveying (and others surveying related) degree programmes are now quite long established, and the chief requirement appears to be that these continue to meet certain thresholds through certain specified reporting requirements. These last are tested through the report submitted at the time of the Partnership meeting.
In the case of new programmes seeking accreditation for the first time, or those seeking re-instatement, the requirements are set out in some detail in the document entitled “Policy and guidance on university partnerships” last published in April 2008 (RICS 2008).
The above document stipulates 18 sets of course details that are to be submitted for scrutiny, ranging from general course rationale and philosophy through to support resources. It gives curriculum guidance, but in very generic terms, chiefly through references to APC Mandatory, Core and Optional Competencies. There are no specific syllabi, benchmarks or the like adding further detail or measures to these requirements. Indeed, the document specifically states at one point that the
“RICS is not prescriptive in terms of course design. It positively welcomes a diversity of provision” (RICS 2008b).
This relatively “light touch” approach deliberately intends to encourage
“Universities with appropriate expertise, skills and resourcing … to design courses to their particular strengths“ (RICS 2008b)
However, it could be suggested that there is a need for greater consistency across curricula, where professionals have shown some dissatisfaction with graduates’ ability to exercise Core Skills and others (Perera and Pearson, 2011). Although flexibility to design unique programmes is encouraging, the lack of a minimum benchmark in achieving graduate level competencies removes the ability for the RICS to ensure at least minimum standards are met.
At present, the chief and only precise numerical measure of courses and thus their potential for producing effective surveyors appears to relate to entry qualifications. Here, a specific formula is stated; an average of 270 UCAS points across the top 75% of applicants or a minimum of 230 for any one applicant, a factor which each university may choose for itself. However, in recent communications from the RICS it appears that this threshold in entry criteria is to be removed as well.
5.2.3 Interview Analysis
5.2.3.1 Accreditation generallyAll three interviewees agreed that accreditation is important for their courses. It is a good market selling-point as one of the reasons why students join the course, because they want to be ‘RICS’ members.
“I attribute it [success of the course and conversion to membership] to the fact that our students come to our courses with the RICS membership as an objective” 2.
For this reason it was suggested that accreditation should link course contents more closely to the competencies, but, significantly, we feel, with some consideration of Industry requirements.
“I think it (accreditation) should be linked to the course content and competencies. But it should also be linked to the input that is coming in from the industry” 1.
Interviewees were questioned as to the relationship between their approach to course design and assessment in the light of RICS policy and guidance. Nobody considers their own university to be operating in conflict with these.
One interviewee suggested that there must be an appropriate balance between coursework and exams. The interviewee suggested that courses should have more formative assessment than summative assessment. Others agreed;
“We need to try to have a balance between coursework and exam. So we would have more formative assessment happening throughout the courses leading up to the exam that’s happening at the end of the semester. But students are still getting the feedback. They’re still getting encouragement of learning and development of knowledge and understanding. But the final assessment happens at the end by an exam” 3.
This, it is suggested, reflects RICS policy.
326
RICS Research – RICS Professional Competency Mapping Framework for Programme Appraisal and Benchmarking
rics.org/research
49
5.2.3.2 The introduction of benchmarking – in principle Interviewees were also asked their views, in the context of accreditation, towards the introduction of an exit-related benchmark, the testing of which would form a part of the accreditation and thus the partnership process. Responses were mixed. In one case there was outright support, the only reservation being that courses should still be allowed some scope for specialisation where appropriate.
“I absolutely support benchmarking … what it is you expect a graduate to do by the end of the course … there should be some set of skills that we should all be aiming for the graduates to do by the end of the year … I think students should have the knowledge of what the core competencies are by the time they leave the university”.1
“Yeah, I think it (benchmark) is useful. I think you have to be clever in what the benchmark is. And it’s something that [must be] understood and can be applied by all universities”.3
This is, in principle, agreement with the benchmarking. However, there were occasions where more caution expressed over its design and/or implementation.
“I wouldn’t be particularly happy with that .. because I think it goes down the CIOB approach … and APM … I am a bit cautious … because I have a feeling it tends to produce [a] homogenous product. [and they ] end of being very, very similar, which of course is the objective, isn’t it in a way?” 2
The interviewee previously expressed dissatisfaction over most other institutions adhering to a rigorous regime of quality control. He felt these resulted in more paper work and difficulty in administering programmes.
“I do have another problem with benchmarking using words. What does that word mean?” We’re making benchmark statements. The external examiners have got to confirm that you meet some benchmark. I mean how do you prove that, how do you? … Any benchmark which is essentially based on words is by definition very subjective … and even [in the] external examining process, two examiners might say two different things” 2
“I think it’s not right .. the QS have got some indication as part of their APC, a guidance of what to expect of a graduate. The problem is, how do you measure… ?” 3
“The more prescriptive you are, I think there’s a danger you become more of an HND than a degree, because of what a degree should really be about.” 3
The proposed benchmarking system does not make a degree more prescriptive; rather, provides a structure and a system to self-evaluate the level of compliance with RICS competencies. It does not bring a quality of a degree down; on the contrary quality standards are further pushed upwards. The aim is to harmonise the quality of a graduate with industry expectations and standards.
“… the problem is that if you want benchmarks, you may have to have less competencies. The more competencies you have the less you can be prescriptive … the whole point about that degree is not just teaching. It’s about the student developing” 3
The level of quality of a degree can be assessed by numerous indicators. Employability of graduates is one key indicator. The proposed GCTB aims to improve employability of graduate by making them more industry relevant and professional.
5.2.3.3 The introduction of benchmarking – content / coverage There was some discussion here, partly in the light of the above, of what topics should or should not be included within the Core Competencies, and, by implication, benchmarks. This was set in the context of the allocation of the overall delivery and assessment time of 3,600 hours, a figure common to most degree programmes though increased in Scottish universities. This reflects the need, as seen by certain academics, for the delivery of certain “basics” without which the students’ education to higher levels could not be undertaken or which, at a higher level, were thought an essential part in basic teaching but which did not feature in RICS competency study checklist.
“ … an employer would look at that and expect the graduate to come out and be able to meet the competencies of the RICS”.2
“we’ve been quite aggressive in making sure that the students understand the context, they understand what they’re being taught and how it’s covered with the APC.” 2
“I think there’s a requirement to have core competencies, but those also I think are requirement for the student to understand why they’re studying it and why it’s relevant to their profession career they’ve selected.” 1
Generally it was agreed by interviewees that 70-80% of the 3,600 hours (2520 – 2880 hours) should be dedicated to RICS Competencies. In practice, it appears that the average expenditure of hours on RICS competencies amounts to 3083 hours (85%). See discussion of these figures in section 5.4.1. below.
“And a lot of it is coming back to knowledge of construction, construction technology of residential and commercial buildings from which there’s a greater understanding and building on how you estimate, how you measure. So, I think 70 to 80 is fine.” 3
Some proportion at least of the 20 or 30% not devoted specifically to RICS Competencies might feature the unique flavour of the specific course. This last, presumably, would have to cover Mandatory Competencies at least.
327
RICS Research – RICS Professional Competency Mapping Framework for Programme Appraisal and Benchmarking
rics.org/research
50
“… that 20% or 20 or 30% allows the student or allows the course to give a slightly different flavour. And I think that flavour would depend upon (a) their region. Let’s say, for example, us being based in *****. We’ve got lots of global, commercial firms which we have to provide that sort of client focus, the client understanding. Then that 20 to 30% allows us to give flavour really.” 3
Such variations from the “norm” as envisaged by the RICS must give rise to negotiations if there is to be acceptance of the benchmarking system. They mirror, in part, certain discrepancies between the RICS Competencies and the core skills of the modern QS as identified by some members of the Expert Forum group.
5.2.4 Further DevelopmentIt would appear that the existing framework for the design and operation of courses is mostly operating to the satisfaction of the academics. This is partly because there is full freedom for them to decide on curricular content and method of delivery with hardly any imposition from the RICS. Unlike other professional bodies, there is hardly any intervention or requirement by the RICS to bind them to a mechanism of systematic checking. A change, incorporating exit –related benchmarks can only come about through co-operation between the parties. The GCTB is a key component of the CMF which aims to provide a mechanism to systematically incorporate RICS competencies in RICS accredited QS degree programmes. The CMF will only be successful if it comes through the RICS as a mandatory requirement for RICS accredited programmes. The process would involve greater level of cooperation from the academics. In the face of current economic crisis this would be an important change that the RICS and universities need to embrace to make graduates more industry relevant.
5.2.5 SummaryAccreditation, it has been shown, is the chief remaining point of control or influence offered to the RICS. Being centrally managed by the Institution it still offers the opportunity for standards or “benchmarks” to be set and to some extent imposed upon programmes at university level.
One of the interviewees in particular expresses concerns lest the benchmarks be too prescriptive, involving the use of wording open to different interpretations by different parties. In practice, the benchmark which we propose is something numerical, a “yardstick” against which the curricula of different courses can be measured. Like all quantitative measures (allowing reasonable margins) this must be less open to misinterpretation than a qualitative write-up of desirable provision.
328
RICS Research – RICS Professional Competency Mapping Framework for Programme Appraisal and Benchmarking
rics.org/research
51
5.3.3 Interview Analysis
5.3.3.1 ProcessGenerally speaking, interviewees were supportive of the partnership process, as they were partnership meetings.
“Really, the partnership meeting is the topping of the icing on the cake to make sure we’re doing the right thing and everybody is informed.” (3)
However, it could be read from this that there is a danger of such a meeting being seen as something of a mere formality, particularly if/when a programme is seen as performing adequately. One respondent, perhaps with something like this in mind, did query the necessity for this to take place on a yearly basis.
“I think because it happens so regularly, every year … you have to ask, why does it happen every year?” (1)
Others may welcome this face to face contact with the RICS, seen by some as an increasingly distant body (Perera and Pearson, 2011). As one interviewee remarked;
“I think the further away you are from the source of information, the less you can be influenced or influence that. So, I think the Partnership meeting is a good way of sort of hitting a milestone in a sense”. (2)
It was agreed that the agenda was standard one, but it was not felt to be too prescriptive;
“… in the sense that the agenda for this partnership meeting is jointly produced, then I mean I would imagine that if we had something that we wanted to talk about, we would just put it on the agenda”. (2)
It was noted that the Partnership meeting could act not just as a check on process and outcomes but as a spur to the development of new courses and course materials.
“An example … where the RICS have asked us to be proactive in developing a course” (3)
5.3.3.2 Expanding the brief There was some suggestion that by spending as long time as they did discussing thresholds, in particular those relating to entry, the relatively limited meeting time was not being put to best use;
“There are other things the RICS could be doing to look at courses and how we link work with curriculum; how we link the co-industry works and how we link with competencies as opposed to spending however many hours it takes to show us [RICS] what entry qualifications your students have got”. (1)
“I think this year they’re going to be talking to us about threshold and whether they‘re going to changing. And we also talk about External Examiner comment report. That’s generally what we talk about”. (2)
5.3 RICS University Partnership Process
5.3.1 IntroductionFor those academic institutions currently accredited by the RICS and therefore operating within a Partnership agreement, the continuing Partnership manifests itself through a fairly informal, essentially a “light touch” process. The principal interest and intervention on the part of the RICS is targeted at any proposed new programme or programme development(s) put forward by the member institution.
Reports on student numbers, progression, etc. (addressing “RICS partnership thresholds” – related issues) are submitted, but there is rarely any detailed scrutiny of Module content unless, as suggested above, some change or development is proposed
5.3.2 The Partnership ProcessThe outward form which partnership agreements and monitoring takes is through the annual partnership meeting; for these the agenda is essentially a standard one, as noted by interviewees. Exceptionally there may be a modification relating to issues specific to the institution under scrutiny.
The process is essentially one of on-going review and monitoring. The only specific point of measurement and/or control over programmes, linked directly to their continued accreditation, relates to “threshold standards”.
Currently, although these are under review at the time of writing, these are requirements for reporting in three areas;
• Numbers and qualifications of entrants to programmes of study. These should comply with the average or minimum requirements, 270 or 230 UCAS points respectively,
• Numbers of most recent graduates. An earlier requirement regarding their destination has been removed,
• Research activity within the academic department in question, and its relation to delivery and assessment.
It appears that there are no “internal” guidelines held or followed by the RICS team on the Panel. This was stated in a conversation with a key member of the RICS Education Committee and has since been confirmed by one of the current interviewees.
“I don’t think there is anything written down, but we did … have a meeting … and we spent a bit of time … discussing the role of the person involved as a Trustee” (1)
Therefore, the content and structure of any meeting will indeed be much as set out in the above agenda.
329
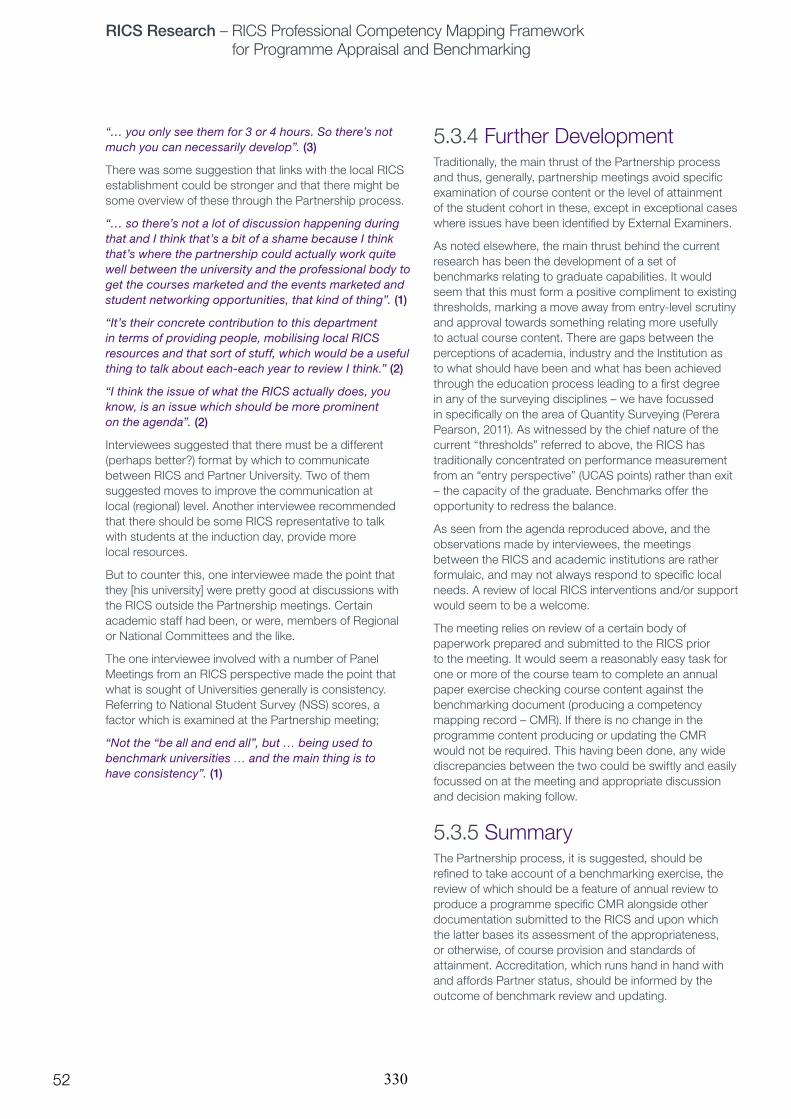
RICS Research – RICS Professional Competency Mapping Framework for Programme Appraisal and Benchmarking
rics.org/research
52
“… you only see them for 3 or 4 hours. So there’s not much you can necessarily develop”. (3)
There was some suggestion that links with the local RICS establishment could be stronger and that there might be some overview of these through the Partnership process.
“… so there’s not a lot of discussion happening during that and I think that’s a bit of a shame because I think that’s where the partnership could actually work quite well between the university and the professional body to get the courses marketed and the events marketed and student networking opportunities, that kind of thing”. (1)
“It’s their concrete contribution to this department in terms of providing people, mobilising local RICS resources and that sort of stuff, which would be a useful thing to talk about each-each year to review I think.” (2)
“I think the issue of what the RICS actually does, you know, is an issue which should be more prominent on the agenda”. (2)
Interviewees suggested that there must be a different (perhaps better?) format by which to communicate between RICS and Partner University. Two of them suggested moves to improve the communication at local (regional) level. Another interviewee recommended that there should be some RICS representative to talk with students at the induction day, provide more local resources.
But to counter this, one interviewee made the point that they [his university] were pretty good at discussions with the RICS outside the Partnership meetings. Certain academic staff had been, or were, members of Regional or National Committees and the like.
The one interviewee involved with a number of Panel Meetings from an RICS perspective made the point that what is sought of Universities generally is consistency. Referring to National Student Survey (NSS) scores, a factor which is examined at the Partnership meeting;
“Not the “be all and end all”, but … being used to benchmark universities … and the main thing is to have consistency”. (1)
5.3.4 Further DevelopmentTraditionally, the main thrust of the Partnership process and thus, generally, partnership meetings avoid specific examination of course content or the level of attainment of the student cohort in these, except in exceptional cases where issues have been identified by External Examiners.
As noted elsewhere, the main thrust behind the current research has been the development of a set of benchmarks relating to graduate capabilities. It would seem that this must form a positive compliment to existing thresholds, marking a move away from entry-level scrutiny and approval towards something relating more usefully to actual course content. There are gaps between the perceptions of academia, industry and the Institution as to what should have been and what has been achieved through the education process leading to a first degree in any of the surveying disciplines – we have focussed in specifically on the area of Quantity Surveying (Perera Pearson, 2011). As witnessed by the chief nature of the current “thresholds” referred to above, the RICS has traditionally concentrated on performance measurement from an “entry perspective” (UCAS points) rather than exit – the capacity of the graduate. Benchmarks offer the opportunity to redress the balance.
As seen from the agenda reproduced above, and the observations made by interviewees, the meetings between the RICS and academic institutions are rather formulaic, and may not always respond to specific local needs. A review of local RICS interventions and/or support would seem to be a welcome.
The meeting relies on review of a certain body of paperwork prepared and submitted to the RICS prior to the meeting. It would seem a reasonably easy task for one or more of the course team to complete an annual paper exercise checking course content against the benchmarking document (producing a competency mapping record – CMR). If there is no change in the programme content producing or updating the CMR would not be required. This having been done, any wide discrepancies between the two could be swiftly and easily focussed on at the meeting and appropriate discussion and decision making follow.
5.3.5 SummaryThe Partnership process, it is suggested, should be refined to take account of a benchmarking exercise, the review of which should be a feature of annual review to produce a programme specific CMR alongside other documentation submitted to the RICS and upon which the latter bases its assessment of the appropriateness, or otherwise, of course provision and standards of attainment. Accreditation, which runs hand in hand with and affords Partner status, should be informed by the outcome of benchmark review and updating.
330
RICS Research – RICS Professional Competency Mapping Framework for Programme Appraisal and Benchmarking
rics.org/research
53
5.4 Discussion Partnerships between the RICS and those who award its accredited degrees are seen as a good thing in general, although there may be disagreements over the frequency and mechanics of the annual meetings. These last do at least provide a face-to-face forum for the parties chiefly involved, which most welcome.
5.4.1 Benchmarking; the ideal In terms of the measurement of the capabilities of graduates and thus the suitability of the accredited degrees from which they issue, it is perhaps time to move away from an entry-related threshold for potential students to an exit-related threshold for potential members. This could be provided by benchmarking which would afford a certain uniformity of standards. This would remove the large knowledge and understanding gap which seems to exist in the measurement and quality control of the potential professional member, between their first entry onto an Accredited Degree programmes and their arrival for APC assessment some five or six years later.
It seems that if the benchmark (GCTB) is to meet with approval both of the RICS and of academic providers it must avoid wordy passages, open to varying interpretations, being instead a numerical measure of some sort, simple to test against Module content and delivery hours. The GCTB proposed herein, conforms to this ideal in that it is based on RICS competencies, as published for the APC and is a numeric measure with less opportunity for different interpretations.
One possible point for discussion, arising out of interviewees responses, is the actual proportion of the total 3600 hours available (in England) for delivery and assessment of the syllabus which should/ can be tied to benchmarks aimed, as they are, at addressing APC Competencies, at whatever level. At one point there is the suggestion that 70 or 80% of the 3600 hours should suffice for delivery of RICS Competencies, leaving 20 or 30% for everything else. That is, any other subjects not directly related to the latter. One interviewee, confirming this, suggests that the 20 or 30% be devoted to non-Competency related subjects, enabling his or her programme to give flavour. In fact, the current research has shown that the total hours spent on all three Competency-related areas (at whatever level) amounts to 3083 hours average across the universities, or 85%. This suggests that the actual proportion left “spare” in which to “give flavour” should be around 15%, or 540 hours. However, in the final GCTB this spare amount of hours has reduced to 412 hours making an increase in the RICS competency mapped content to 89% of 3600 maximum allowable hours for a degree.
Further consideration of certain Tutors’ expressed wishes, to see a certain percentage of degree content not tied into RICS competencies may suggest a number of considerations;
Firstly, there are certain basic skills and understandings referred to there as “related study topics” which, whilst not directly represented by or within RICS competencies, are none the less essential to the preparation of students for those competencies which are so represented.
Secondly, as suggested by the RICS itself, may indeed wish to impart some particular specialism, based on an expertise peculiar to a particular institution and/or its staff at any one time, where this may be seen to enrich the employment prospects of the students in one way or another.
Thirdly, in defence of academics generally, it is suggested, as discussed in an earlier report (Perera & Pearson, 2011) there may be underlying issues here born of the “Education versus Training” debate. At one level, educators must understand, accept and seek to meet certain demands made on them by the RICS and by Employers. Indeed one of the drivers behind the current research seeks from educators’ recognition of and a compliance with certain contents and standards determined largely by these latter stakeholders. However, it can be argued that it is the educator’s wider duty to act not just as a training organisation for industry but as educators – that is, persons who will teach their students to think and to solve problems outside the fairly strict confines of a particular and specialist set of guidelines. The very fact that, as has been noted elsewhere, the RICS competencies are undergoing review just as this report is being written should perhaps warn against too rigid a regime. Educators must always be allowed some space (in this case within the overall 3600 hour umbrella) in which to impart skills in their students which will equip the latter to operate effectively in a future professional role where any one of the current Core Competencies, for example, no longer has the significance which it has at present.
331
RICS Research – RICS Professional Competency Mapping Framework for Programme Appraisal and Benchmarking
rics.org/research
54
5.4.2 Benchmarks; acceptance and support Some interviewees expressed some potential resistance to the introduction of benchmarks. As this was a sample group there may be other institutions where this may be the reaction also. As with any system which is to be imposed top-down, so to speak, to prove a successful addition to existing quality systems the new benchmarks (GCTB) should be seen to be an easily operated system, and one that is itself validated by drawing on as wide a cross section of professional perspectives as is practicable. The GCTB produced have certainly achieved this with a wide participation of the representative cross section of the industry. As to ease of use, a numerical grid is proposed, one in which, as regards validation, hopefully this will have been addressed through the use of the professional forum. As to the enthusiasm or otherwise for implementation, this may depend upon how strict the measurement system appears to be, and how much it still allows for universities to express their individual strengths through their programme delivery whilst also meeting new minimum requirements as set by core benchmarks. The practicalities, including this permissible degree of flexibility have still to be determined.
It could be argued that the RICS relinquished a proportion of the automatic say it might otherwise have had over the content and conduct of its related programmes when it removed its requirement, as one of its “threshold standards” that a certain proportion of the staff teaching on a given programme be qualified members of the RICS. Whilst this in itself did not provide a mechanism for dictating Programme content, it seems fair to suggest that staff who were active members of this professional body might have had its interests and standards at heart rather more than those who were not? Such an attachment may make the introduction and management of Benchmarks more easily attainable. This point is specifically referred to by an interviewee reported in section 5.1 above.
On a similar note, it is stated that the
“RICS no longer approves UK partnership universities’ external examiner appointments”. (RICS, 2011)
Universities are merely required to inform the Institution of the names of Examiners (commercial and academic); together with any RICS qualifications they hold (if any).
Both of the above relaxations of previous requirements may open the door, it is suggested, to a less stringent enforcement of any benchmarks which are created as a result of current research, unless the RICS can take action to enforce the use of GCTB through RICS – University partnership.
6.0
Gui
delin
es fo
r usi
ng th
e C
MF
332
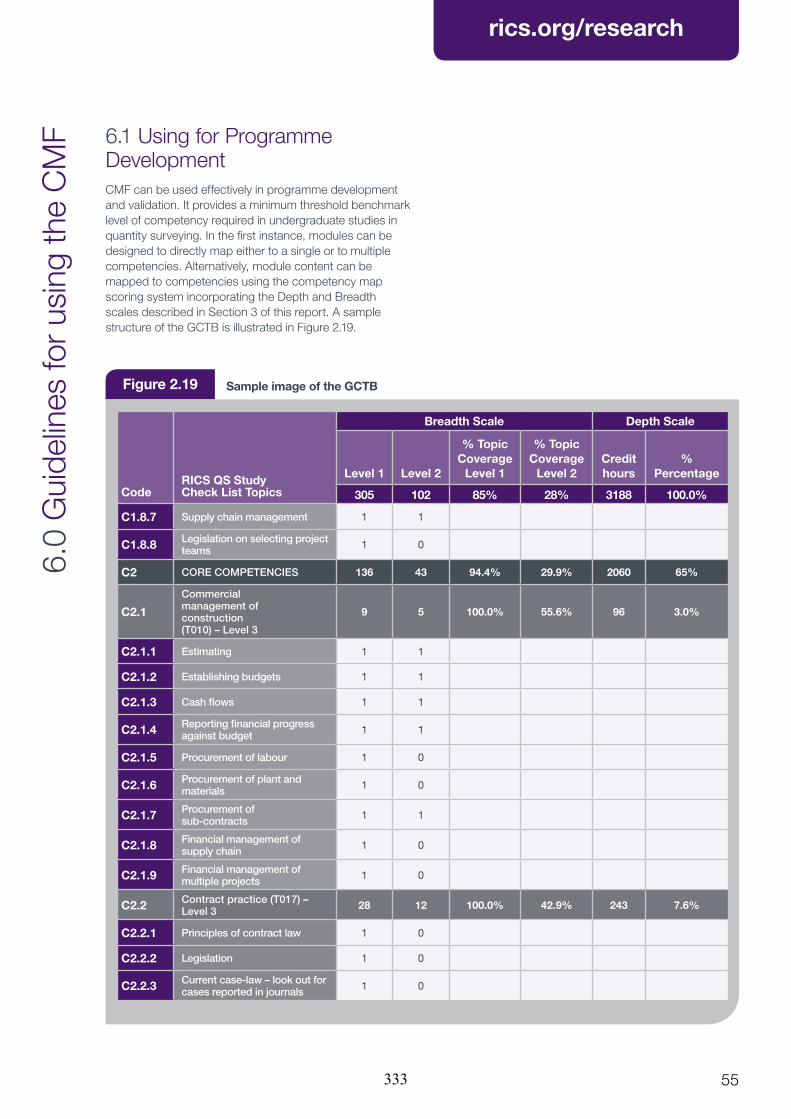
RICS Research – RICS Professional Competency Mapping Framework for Programme Appraisal and Benchmarking
rics.org/research
55
6.0
Gui
delin
es fo
r usi
ng th
e C
MF 6.1 Using for Programme
Development CMF can be used effectively in programme development and validation. It provides a minimum threshold benchmark level of competency required in undergraduate studies in quantity surveying. In the first instance, modules can be designed to directly map either to a single or to multiple competencies. Alternatively, module content can be mapped to competencies using the competency map scoring system incorporating the Depth and Breadth scales described in Section 3 of this report. A sample structure of the GCTB is illustrated in Figure 2.19.
Figure 2.19 Sample image of the GCTB
Code
RICS QS Study Check List Topics
Breadth Scale Depth Scale
Level 1 Level 2
% Topic Coverage
Level 1
% Topic Coverage
Level 2Credit hours
% Percentage
305 102 85% 28% 3188 100.0%
C1.8.7 Supply chain management 1 1
C1.8.8 Legislation on selecting project teams 1 0
C2 CORE COMPETENCIES 136 43 94.4% 29.9% 2060 65%
C2.1
Commercial management of construction (T010) – Level 3
9 5 100.0% 55.6% 96 3.0%
C2.1.1 Estimating 1 1
C2.1.2 Establishing budgets 1 1
C2.1.3 Cash flows 1 1
C2.1.4 Reporting financial progress against budget 1 1
C2.1.5 Procurement of labour 1 0
C2.1.6 Procurement of plant and materials 1 0
C2.1.7 Procurement of sub-contracts 1 1
C2.1.8 Financial management of supply chain 1 0
C2.1.9 Financial management of multiple projects 1 0
C2.2 Contract practice (T017) – Level 3 28 12 100.0% 42.9% 243 7.6%
C2.2.1 Principles of contract law 1 0
C2.2.2 Legislation 1 0
C2.2.3 Current case-law – look out for cases reported in journals 1 0
333
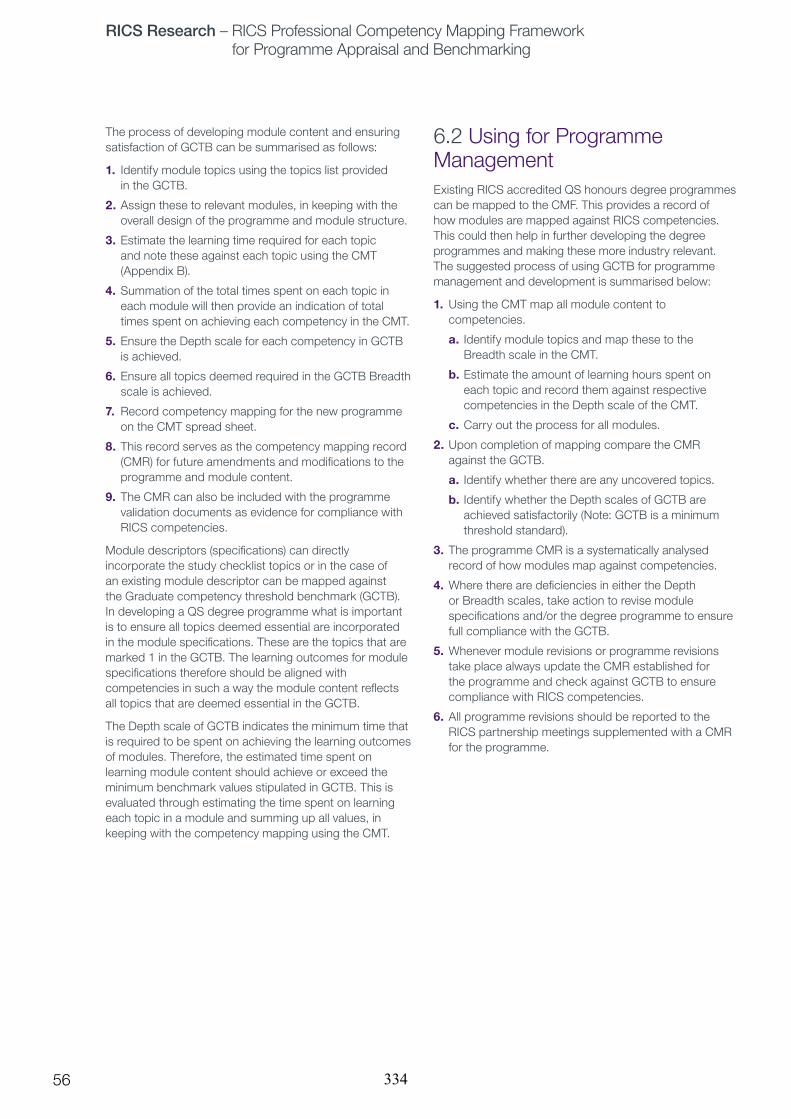
RICS Research – RICS Professional Competency Mapping Framework for Programme Appraisal and Benchmarking
rics.org/research
56
6.2 Using for Programme ManagementExisting RICS accredited QS honours degree programmes can be mapped to the CMF. This provides a record of how modules are mapped against RICS competencies. This could then help in further developing the degree programmes and making these more industry relevant. The suggested process of using GCTB for programme management and development is summarised below:
1. Using the CMT map all module content to competencies.
a. Identify module topics and map these to the Breadth scale in the CMT.
b. Estimate the amount of learning hours spent on each topic and record them against respective competencies in the Depth scale of the CMT.
c. Carry out the process for all modules.
2. Upon completion of mapping compare the CMR against the GCTB.
a. Identify whether there are any uncovered topics.
b. Identify whether the Depth scales of GCTB are achieved satisfactorily (Note: GCTB is a minimum threshold standard).
3. The programme CMR is a systematically analysed record of how modules map against competencies.
4. Where there are deficiencies in either the Depth or Breadth scales, take action to revise module specifications and/or the degree programme to ensure full compliance with the GCTB.
5. Whenever module revisions or programme revisions take place always update the CMR established for the programme and check against GCTB to ensure compliance with RICS competencies.
6. All programme revisions should be reported to the RICS partnership meetings supplemented with a CMR for the programme.
The process of developing module content and ensuring satisfaction of GCTB can be summarised as follows:
1. Identify module topics using the topics list provided in the GCTB.
2. Assign these to relevant modules, in keeping with the overall design of the programme and module structure.
3. Estimate the learning time required for each topic and note these against each topic using the CMT (Appendix B).
4. Summation of the total times spent on each topic in each module will then provide an indication of total times spent on achieving each competency in the CMT.
5. Ensure the Depth scale for each competency in GCTB is achieved.
6. Ensure all topics deemed required in the GCTB Breadth scale is achieved.
7. Record competency mapping for the new programme on the CMT spread sheet.
8. This record serves as the competency mapping record (CMR) for future amendments and modifications to the programme and module content.
9. The CMR can also be included with the programme validation documents as evidence for compliance with RICS competencies.
Module descriptors (specifications) can directly incorporate the study checklist topics or in the case of an existing module descriptor can be mapped against the Graduate competency threshold benchmark (GCTB). In developing a QS degree programme what is important is to ensure all topics deemed essential are incorporated in the module specifications. These are the topics that are marked 1 in the GCTB. The learning outcomes for module specifications therefore should be aligned with competencies in such a way the module content reflects all topics that are deemed essential in the GCTB.
The Depth scale of GCTB indicates the minimum time that is required to be spent on achieving the learning outcomes of modules. Therefore, the estimated time spent on learning module content should achieve or exceed the minimum benchmark values stipulated in GCTB. This is evaluated through estimating the time spent on learning each topic in a module and summing up all values, in keeping with the competency mapping using the CMT.
7.0
Con
clus
ions
334
RICS Research – RICS Professional Competency Mapping Framework for Programme Appraisal and Benchmarking
rics.org/research
57
7.0
Con
clus
ions 7.1 The need and the research
approachOver the years QS education has evolved from being rather technical in nature to fully fledged honours degrees with greater proportion of construction and project management orientation. The transition from diplomas to university degrees was in cognition with the general transformation of the higher education sector of the British education system. Subsequently the construction industry has undergone many changes and is currently facing a double dip economic recession causing a severe impact on opportunities for graduate employment within the sector. Construction industry employers have been vocal in identifying their perception of a lowering employability of graduates. A recent study investigating views on both industry and academia concluded that there are significant levels of dissatisfaction on quality of graduate (Perera & Pearson, 2011). It identified the root cause of the issue as graduates produced by different RICS accredited degree programmes have significantly different competency levels often far below what the industry expects.
A competency mapping framework (CMF) was proposed as a solution for achieving competencies at or above a minimum threshold benchmark. This research developed the CMF with a graduate competency threshold benchmark (GCTB) that uses the RICS competencies structure developed for the QS pathway to membership.
The research utilised a four stage research method using current RICS QS competencies along with the collaboration of industry and academic experts (refer section 2 for full details). The four stages were:
Stage 1 – Pilot Study A literature review of competencies and developing a competency mapping template (CMT). It used two industry and academic experts to iteratively develop and modify the CMT. The CMT is a dual vector scale matrix with a Breadth scale and a Depth scale each mapped against module descriptors. Breadth scale contains study topics while Depth scale contains competencies (refer Appendix B).
Stage 2 – Case Studies Four leading RICS accredited QS degree programmes were analysed and the module specifications were mapped to competencies using the CMT. This created a CMR for each case study. Descriptive statistical analysis was used to develop a conceptual competency benchmark using these four case studies.
Stage 3 – Expert ForumAn expert forum with 12 industry experts and 3 academic experts were established to revise and modify the conceptual competency benchmark. The two stage Delphi process was used to record and harmonise views of experts. This stage produced the final graduate competency threshold benchmark (GCTB).
Stage 4 – Review of Existing Processes to Integrate CMFThe final stage of the research involved reviewing existing programme development validation method, RICS programme accreditation and RICS – University partnership processes. This involved a document review as well as interviews of three QS degree programme directors to obtain their views on these processes and the GCTB. The report presents how the CMF can be used within these existing systems to ensure academic quality standards.
335
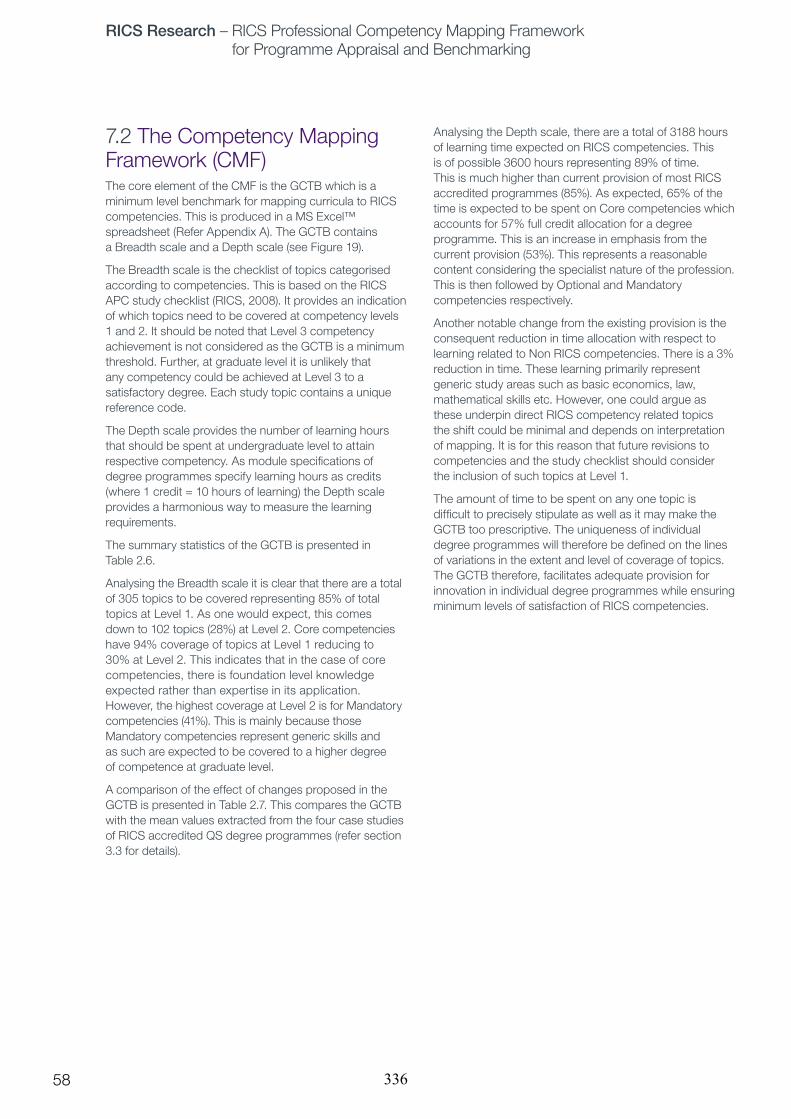
RICS Research – RICS Professional Competency Mapping Framework for Programme Appraisal and Benchmarking
rics.org/research
58
7.2 The Competency Mapping Framework (CMF)The core element of the CMF is the GCTB which is a minimum level benchmark for mapping curricula to RICS competencies. This is produced in a MS Excel™ spreadsheet (Refer Appendix A). The GCTB contains a Breadth scale and a Depth scale (see Figure 19).
The Breadth scale is the checklist of topics categorised according to competencies. This is based on the RICS APC study checklist (RICS, 2008). It provides an indication of which topics need to be covered at competency levels 1 and 2. It should be noted that Level 3 competency achievement is not considered as the GCTB is a minimum threshold. Further, at graduate level it is unlikely that any competency could be achieved at Level 3 to a satisfactory degree. Each study topic contains a unique reference code.
The Depth scale provides the number of learning hours that should be spent at undergraduate level to attain respective competency. As module specifications of degree programmes specify learning hours as credits (where 1 credit = 10 hours of learning) the Depth scale provides a harmonious way to measure the learning requirements.
The summary statistics of the GCTB is presented in Table 2.6.
Analysing the Breadth scale it is clear that there are a total of 305 topics to be covered representing 85% of total topics at Level 1. As one would expect, this comes down to 102 topics (28%) at Level 2. Core competencies have 94% coverage of topics at Level 1 reducing to 30% at Level 2. This indicates that in the case of core competencies, there is foundation level knowledge expected rather than expertise in its application. However, the highest coverage at Level 2 is for Mandatory competencies (41%). This is mainly because those Mandatory competencies represent generic skills and as such are expected to be covered to a higher degree of competence at graduate level.
A comparison of the effect of changes proposed in the GCTB is presented in Table 2.7. This compares the GCTB with the mean values extracted from the four case studies of RICS accredited QS degree programmes (refer section 3.3 for details).
Analysing the Depth scale, there are a total of 3188 hours of learning time expected on RICS competencies. This is of possible 3600 hours representing 89% of time. This is much higher than current provision of most RICS accredited programmes (85%). As expected, 65% of the time is expected to be spent on Core competencies which accounts for 57% full credit allocation for a degree programme. This is an increase in emphasis from the current provision (53%). This represents a reasonable content considering the specialist nature of the profession. This is then followed by Optional and Mandatory competencies respectively.
Another notable change from the existing provision is the consequent reduction in time allocation with respect to learning related to Non RICS competencies. There is a 3% reduction in time. These learning primarily represent generic study areas such as basic economics, law, mathematical skills etc. However, one could argue as these underpin direct RICS competency related topics the shift could be minimal and depends on interpretation of mapping. It is for this reason that future revisions to competencies and the study checklist should consider the inclusion of such topics at Level 1.
The amount of time to be spent on any one topic is difficult to precisely stipulate as well as it may make the GCTB too prescriptive. The uniqueness of individual degree programmes will therefore be defined on the lines of variations in the extent and level of coverage of topics. The GCTB therefore, facilitates adequate provision for innovation in individual degree programmes while ensuring minimum levels of satisfaction of RICS competencies.
336
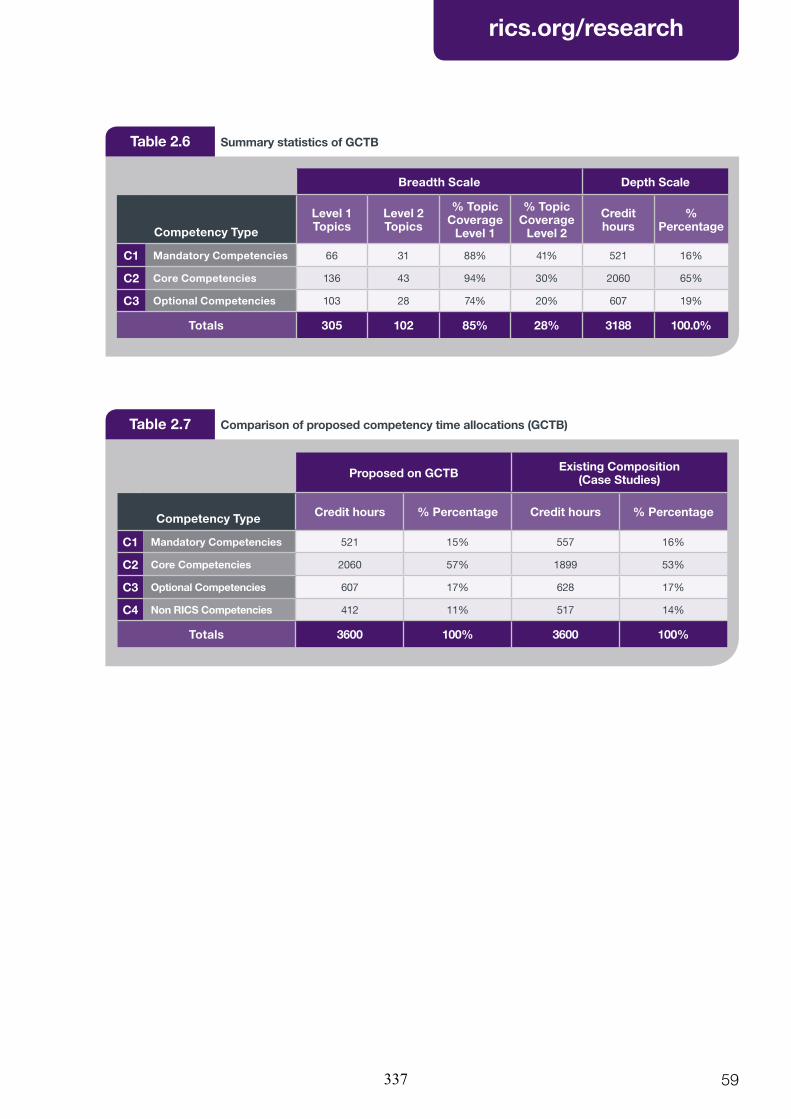
RICS Research – RICS Professional Competency Mapping Framework for Programme Appraisal and Benchmarking
rics.org/research
59
Table 2.6 Summary statistics of GCTB
Breadth Scale Depth Scale
Competency Type
Level 1 Topics
Level 2 Topics
% Topic Coverage
Level 1
% Topic Coverage
Level 2
Credit hours
% Percentage
C1 Mandatory Competencies 66 31 88% 41% 521 16%
C2 Core Competencies 136 43 94% 30% 2060 65%
C3 Optional Competencies 103 28 74% 20% 607 19%
Totals 305 102 85% 28% 3188 100.0%
Table 2.7 Comparison of proposed competency time allocations (GCTB)
Proposed on GCTB Existing Composition (Case Studies)
Competency Type Credit hours % Percentage Credit hours % Percentage
C1 Mandatory Competencies 521 15% 557 16%
C2 Core Competencies 2060 57% 1899 53%
C3 Optional Competencies 607 17% 628 17%
C4 Non RICS Competencies 412 11% 517 14%
Totals 3600 100% 3600 100%
337
RICS Research – RICS Professional Competency Mapping Framework for Programme Appraisal and Benchmarking
rics.org/research
60
7.3 Recommended use of the CMFIt is envisaged that CMF can be used primarily in two ways:
1. For the development of new degree programmes and validation
2. For monitoring and management of existing degree programmes.
These options are discussed in detail in section 6. When new programmes are developed, the GCTB can be used to identify module content for module descriptors. It is suggested that the CMT to be used to initially map topics of module descriptors (specifications) to RICS competencies. The systematic approach presented in the CMF helps in this process to ensure that competency levels exceed minimum requirements. Upon completion of the CMT the resultant CMR forms an authentic record of how module descriptors are mapped to RICS competencies.
The GCTB can be used to evaluate existing RICS accredited degree programmes. When a CMR for a RICS accredited degree programme is created it forms a formal record of how degree programme content maps to RICS competencies. This can then be evaluated against the GCTB to identify whether degree programmes fully comply with the minimum thresholds identified in the GCTB. Where benchmarks are not achieved programmes can be modified to comply with GCTB. In a similar way the CMR for the programme should be updated whenever programme modifications or module modifications are carried out. It can then be checked against the GCTB to check compliance.
7.4 Final RecommendationsThis report introduces CMF as a system for maintaining and improving quality and professional standards of QS degree programmes accredited by the RICS. The following are the primary recommendations of the report.
• It is recommended that the CMF be made an essential part of the RICS – University partnership agreement. This way it provides a mechanism to ensure that all RICS accredited programmes meet the exit threshold defined by the GCTB. Each RICS accredited programme should complete a CMR which then can be updated and presented to the RICS – University partnership meeting annually with any changes made being highlighted.
• CMF should be used for ensuring achievement of competencies in all new QS degree programmes to be accredited by the RICS. It should form part of programme validation and accreditation documents (where RICS accreditation is sought).
• In the case of all new programmes seeking RICS accreditation, completion of the CMR should be mandatory, to ensure it meets GCTB thresholds.
• The CMF also provides a useful process for the programme external examiners. They can be entrusted to comment on the changes to programmes evaluated against the GCTB thereby ensuring compliance.
• The GCTB recommends only 84% of study topic-related competencies at Level 1. It is suggested that innovative programmes should aim at achieving the remaining over and above the minimum benchmark recommended.
The GCTB developed and presented herein is based on current RICS competencies (RICS, 2009) and APC study Checklist documentation (RICS, 2008 a). It is recommended that whenever competency structures change the GCTB should be updated accordingly.
338
RICS Research – RICS Professional Competency Mapping Framework for Programme Appraisal and Benchmarking
rics.org/research
61
7.5 LimitationsThe GCTB created was based on existing set of RICS competencies and the APC study checklist of topics produced by the RICS. It was noted that this checklist had many limitations. There were many related study topics that were missing from the list. This indicates that it may not be up to date or fully reflect current practice. There is some repetition of topics, appearing on different competencies. Some topic descriptors were not clear as to the meaning or content.
Added to this one should perhaps recognise and accommodate the general duty of educators to prepare their students in the broadest sense, and not merely in respect of certain specified skills areas i.e. provide “education”.
The expert forum for the development of GCTB was limited to 15 industry and academic experts. A higher number would have achieved greater representation of views. However, in the selection of the expert forum care was exercised to achieve a good distribution of expertise from consulting to contracting, from practice based to academic and a distribution of different organisation sizes reflecting micro, SME and large organisations.
7.6 Further ResearchIt is proposed that further research should be undertaken to further develop the study check list to make it reflect the work profile of the modern QS as accurately as possible. This should attempt at re-classification of some of the study topics, using better descriptors for topics.
The same problem can be extrapolated to the situation where new entrants to RICS come through the Assoc RICS route. Those seeking Associate membership must pass the ATC for which they will be eligible upon successful completion of a Foundation Degree or equivalent, together with a specified period of approved work experience. A similar benchmark for such programmes the RICS seek to recognise will eliminate such problems of dissatisfaction and subjective interpretation of competencies as have been discussed above.
339

RICS Research – RICS Professional Competency Mapping Framework for Programme Appraisal and Benchmarking
rics.org/research
62
The authors would like to acknowledge the assistance they received from the following in the preparation of this report and in the conduct of the research;
Damilola Ekundayo, Graduate Tutor, Faculty of Engineering & Environment, Northumbria University, for his assistance in carrying out analysis of competency mappings and expert forum.
Dr Lei Zhou, Lecturer, Faculty of Engineering & Environment, Northumbria University, for his assistance with conducting and transcribing interviews and analysis of the same and for his assistance in the formulation of questionnaires.
Anushi Rodrigo, Doctoral Student, Faculty of Engineering & Environment, Northumbria University, for her assistance with numerous tasks related to the project.
Colleagues from the Quantity Surveying Subject Group within the Faculty of Engineering and Environment, Northumbria University, for support with the competency mapping.
All members of the Expert forum who gave time to be interviewed and participation in the ratification process.
The three QS programme directors, who participated in the semi structured interview process.
Academic staff from the four Schools of Built Environment, from the four universities comprising the Case Study Group, who completed the detailed programme related competency mapping exercise.
All members of the Construction Economics & Management research group of the Faculty of Engineering and Environment, Northumbria University (www.northumbria-qs.org)
Professor Allan Ashworth and Mr Chris Winks who continuously supported the research especially in formulating the scoring system and initial direction of the research,
Professor Glen McHale, Executive Dean of the new Faculty of Engineering and Environment, Steve Hodgson, former Dean of School and Professor David Greenwood, former Associate Dean (Research) of the School of the Built and Natural Environment, Northumbria University, for their help and encouragement with this work.
Srinath Perera and John PearsonAugust 2013
Ack
now
ledg
emen
ts
340

RICS Research – RICS Professional Competency Mapping Framework for Programme Appraisal and Benchmarking
rics.org/research
63
Part 3 References
and Appendix
Note: Appendices B & C indicated in this report and additional information is available at www.northumbria-qs.org/index.php/completed-projects/cmf
341

RICS Research – RICS Professional Competency Mapping Framework for Programme Appraisal and Benchmarking
rics.org/research
64
Northumbria (2010), Programme Approvals Handbook, Northumbria University Academic Registry, Update of February 2010.
HEFCE (2011) Provision of information about higher education: outcomes of consultation and next steps. Joint Report from HEFCE, Universities UK and GuildHE, June 2011/18.
Perera, S. and Pearson, J. (2011), Alignment of Professional, Academic and Industrial Development Needs for Quantity Surveyors: Post Recession Dynamics. [Online] RICS Education Trust funded research report, UK. Available at: http://www.rics.org/uk/knowledge/research/research-reports/alignment-of-professional-academics-and- industrial-development-needs-for-quantity-surveyors- the-post-recession-dynamics-/
RICS (2008a), Your pathway to qualifying in quantity surveying and construction: supplemental guidance. RICS Quantity Surveying and Construction Faculty in conjunction with RICS Education and Training: London.
RICS (2008b), Policy and Guidance on University Partnerships. RICS Education and Qualification Standards Department. April 2008
RICS (2009), Requirements and competencies, RICS Education and Qualification Standards, RICS, Available at: http://www.rics.org/site/scripts/download_info.aspx? fileID=3729&categoryID=98.
RICS (2011), UK partnership universities. Guide to threshold reporting (reduced) 2011 intake/ graduation. RICS Education and Qualification Standards. November 2011
Rowe and Wright (2001), Expert Opinions in Forecasting: Role of the Delphi Technique. In Armstrong (Ed.), Principles of Forecasting: A Handbook of Researchers and Practitioners. Boston: Kluwer Academic Publishers.
Appendix B & C: available at http://www.northumbria-qs.org/index.php/completed-projects/cmf.
Ref
eren
ces
App
endi
x A
342
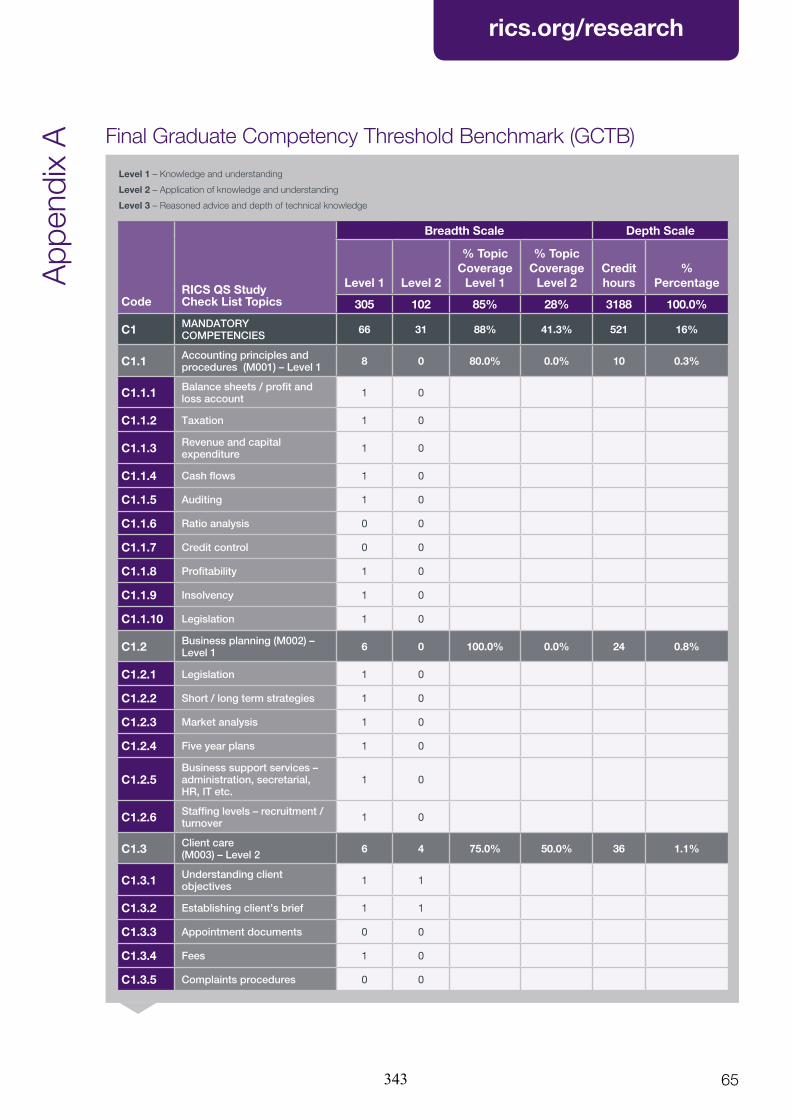
RICS Research – RICS Professional Competency Mapping Framework for Programme Appraisal and Benchmarking
rics.org/research
65
App
endi
x A Final Graduate Competency Threshold Benchmark (GCTB)
Code
RICS QS Study Check List Topics
Breadth Scale Depth Scale
Level 1 Level 2
% Topic Coverage
Level 1
% Topic Coverage
Level 2Credit hours
% Percentage
305 102 85% 28% 3188 100.0%
C1 MANDATORY COMPETENCIES 66 31 88% 41.3% 521 16%
C1.1 Accounting principles and procedures (M001) – Level 1 8 0 80.0% 0.0% 10 0.3%
C1.1.1 Balance sheets / profit and loss account 1 0
C1.1.2 Taxation 1 0
C1.1.3 Revenue and capital expenditure 1 0
C1.1.4 Cash flows 1 0
C1.1.5 Auditing 1 0
C1.1.6 Ratio analysis 0 0
C1.1.7 Credit control 0 0
C1.1.8 Profitability 1 0
C1.1.9 Insolvency 1 0
C1.1.10 Legislation 1 0
C1.2 Business planning (M002) – Level 1 6 0 100.0% 0.0% 24 0.8%
C1.2.1 Legislation 1 0
C1.2.2 Short / long term strategies 1 0
C1.2.3 Market analysis 1 0
C1.2.4 Five year plans 1 0
C1.2.5Business support services – administration, secretarial, HR, IT etc.
1 0
C1.2.6 Staffing levels – recruitment / turnover 1 0
C1.3 Client care (M003) – Level 2 6 4 75.0% 50.0% 36 1.1%
C1.3.1 Understanding client objectives 1 1
C1.3.2 Establishing client’s brief 1 1
C1.3.3 Appointment documents 0 0
C1.3.4 Fees 1 0
C1.3.5 Complaints procedures 0 0
Level 1 – Knowledge and understanding
Level 2 – Application of knowledge and understanding
Level 3 – Reasoned advice and depth of technical knowledge
343
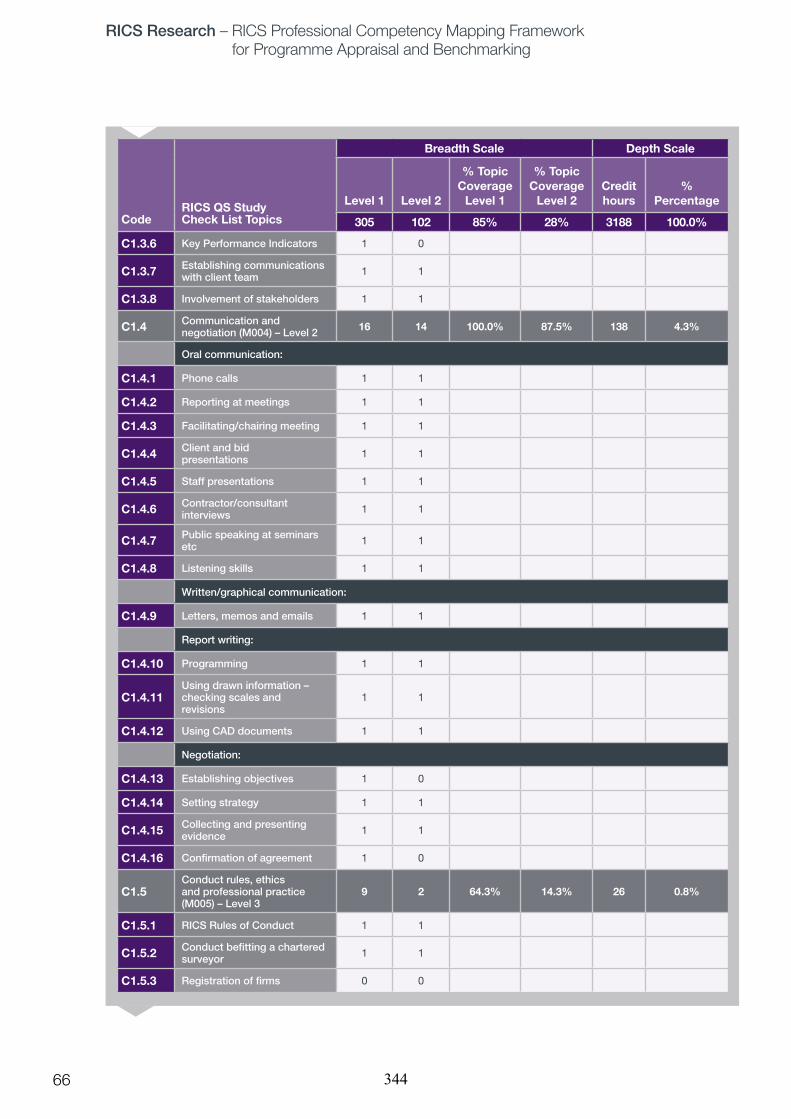
RICS Research – RICS Professional Competency Mapping Framework for Programme Appraisal and Benchmarking
rics.org/research
66
Code
RICS QS Study Check List Topics
Breadth Scale Depth Scale
Level 1 Level 2
% Topic Coverage
Level 1
% Topic Coverage
Level 2Credit hours
% Percentage
305 102 85% 28% 3188 100.0%
C1.3.6 Key Performance Indicators 1 0
C1.3.7 Establishing communications with client team 1 1
C1.3.8 Involvement of stakeholders 1 1
C1.4 Communication and negotiation (M004) – Level 2 16 14 100.0% 87.5% 138 4.3%
Oral communication:
C1.4.1 Phone calls 1 1
C1.4.2 Reporting at meetings 1 1
C1.4.3 Facilitating/chairing meeting 1 1
C1.4.4 Client and bid presentations 1 1
C1.4.5 Staff presentations 1 1
C1.4.6 Contractor/consultant interviews 1 1
C1.4.7 Public speaking at seminars etc 1 1
C1.4.8 Listening skills 1 1
Written/graphical communication:
C1.4.9 Letters, memos and emails 1 1
Report writing:
C1.4.10 Programming 1 1
C1.4.11Using drawn information – checking scales and revisions
1 1
C1.4.12 Using CAD documents 1 1
Negotiation:
C1.4.13 Establishing objectives 1 0
C1.4.14 Setting strategy 1 1
C1.4.15 Collecting and presenting evidence 1 1
C1.4.16 Confirmation of agreement 1 0
C1.5Conduct rules, ethics and professional practice (M005) – Level 3
9 2 64.3% 14.3% 26 0.8%
C1.5.1 RICS Rules of Conduct 1 1
C1.5.2 Conduct befitting a chartered surveyor 1 1
C1.5.3 Registration of firms 0 0
344

RICS Research – RICS Professional Competency Mapping Framework for Programme Appraisal and Benchmarking
rics.org/research
67
Code
RICS QS Study Check List Topics
Breadth Scale Depth Scale
Level 1 Level 2
% Topic Coverage
Level 1
% Topic Coverage
Level 2Credit hours
% Percentage
305 102 85% 28% 3188 100.0%
C1.5.4 Complaints procedure 0 0
C1.5.5 Conflicts of interest 1 0
C1.5.6 Gifts 1 0
C1.5.7 Professional Indemnity Insurance 1 0
C1.5.8 Client accounts 0 0
C1.5.9 Regulation 1 0
C1.5.10 Disciplinary procedures 1 0
C1.5.11 Lifelong learning – CPD 1 0
C1.5.12 Current RICS structure 0 0
C1.5.13 Faculties 0 0
C1.5.14 Current RICS issues and initiatives 1 0
C1.6 Data management (M007) – Level 1 7 5 100.0% 71.4% 82 2.6%
C1.6.1 BCIS / BMI or other external sources 1 1
C1.6.2 Elemental analyses 1 1
C1.6.3 Pricing books 1 1
C1.6.4 Data base use generally 1 1
C1.6.5 Employer’s in-house data storage and filing systems 1 0
C1.6.6 Scheduling 1 1
C1.6.7 Libraries 1 0
C1.7 Health and safety (M008) – Level 2 6 0 100.0% 0.0% 72 2.3%
Personal health and safety at work – RICS publication ‘Surveying Safely’ Personal safety procedures when visiting a construction site Common health and safety risks in construction Health and safety legislation:
C1.7.1 Generally 1 0
C1.7.2 At work 1 0
C1.7.3 Construction specific 1 0
C1.7.4 Sector specific 1 0
C1.7.5 Client specific 1 0
C1.7.6 Asbestos and other hazardous materials 1 0
C1.8 Teamworking (M010) – Level 1 8 6 100.0% 75.0% 133 4.2%
C1.8.1 Understand the role of team members 1 1
345

RICS Research – RICS Professional Competency Mapping Framework for Programme Appraisal and Benchmarking
rics.org/research
68
Code
RICS QS Study Check List Topics
Breadth Scale Depth Scale
Level 1 Level 2
% Topic Coverage
Level 1
% Topic Coverage
Level 2Credit hours
% Percentage
305 102 85% 28% 3188 100.0%
C1.8.2 Appointing the project team 1 1
C1.8.3 Relationships with other team members 1 1
C1.8.4 Communicating with other team members 1 1
C1.8.5 Partnering and collaborative working 1 1
C1.8.6 Strategic alliance 1 0
C1.8.7 Supply chain management 1 1
C1.8.8 Legislation on selecting project teams 1 0
C2 CORE COMPETENCIES 136 43 94.4% 29.9% 2060 65%
C2.1 Commercial management of construction (T010) – Level 3 9 5 100.0% 55.6% 96 3.0%
C2.1.1 Estimating 1 1
C2.1.2 Establishing budgets 1 1
C2.1.3 Cash flows 1 1
C2.1.4 Reporting financial progress against budget 1 1
C2.1.5 Procurement of labour 1 0
C2.1.6 Procurement of plant and materials 1 0
C2.1.7 Procurement of sub-contracts 1 1
C2.1.8 Financial management of supply chain 1 0
C2.1.9 Financial management of multiple projects 1 0
C2.2 Contract practice (T017) – Level 3 28 12 100.0% 42.9% 243 7.6%
C2.2.1 Principles of contract law 1 0
C2.2.2 Legislation 1 0
C2.2.3 Current case-law – look out for cases reported in journals 1 0
C2.2.4
Standard forms of main and sub contract – e.g. JCT, NEC/ECC, GC Works, ICE, ACA, IChemE, FIDIC, etc.
1 1
C2.2.5
Roles & responsibilities of parties – Client, Contract Administrator / Employer’s Agent / Project manager / Engineer, Contractor, Sub-contractors, Quantity Surveyor
1 1
346

RICS Research – RICS Professional Competency Mapping Framework for Programme Appraisal and Benchmarking
rics.org/research
69
Code
RICS QS Study Check List Topics
Breadth Scale Depth Scale
Level 1 Level 2
% Topic Coverage
Level 1
% Topic Coverage
Level 2Credit hours
% Percentage
305 102 85% 28% 3188 100.0%
C2.2.6 Assignment / Novation 1 0
C2.2.7 Third party rights – Legislation / Collateral Warranties 1 0
C2.2.8Letters of intent – Comfort letters / Consent to spend / Recognition of contract
1 0
C2.2.9Performance security – Bonds / Parent Company Guarantees
1 0
C2.2.10 Insurances 1 0
C2.2.11 Advance payments 1 0
C2.2.12 Interim valuations and payment provisions 1 1
C2.2.13 Materials on/off site 1 1
C2.2.14 Fluctuations 1 1
C2.2.15 Retention – retention bonds 1 1
C2.2.16 Change procedures 1 1
C2.2.17 Valuing change – variations / compensation events 1 1
C2.2.18 Extensions of time 1 1
C2.2.19 Claims / Loss and Expense 1 1
C2.2.20 Dispute avoidance and resolution 1 0
C2.2.21 Named / Nominated subcontractors 1 0
C2.2.22 Sectional Completion / Partial Possession 1 0
C2.2.23 Design Portions / Performance specified works 1 0
C2.2.24 Determination 1 0
C2.2.25 Final Accounts 1 1
C2.2.26 Completion 1 0
C2.2.27 Liquidated and Ascertained Damages 1 0
C2.2.28 Defects rectification period 1 1
C2.3Construction technology and environmental services (T013) – Level 3
30 0 85.7% 0.0% 660 20.7%
Construction technology
C2.3.1 Substructures – basements, types of piling, etc. 1 0
C2.3.2 Superstructures 1 0
347
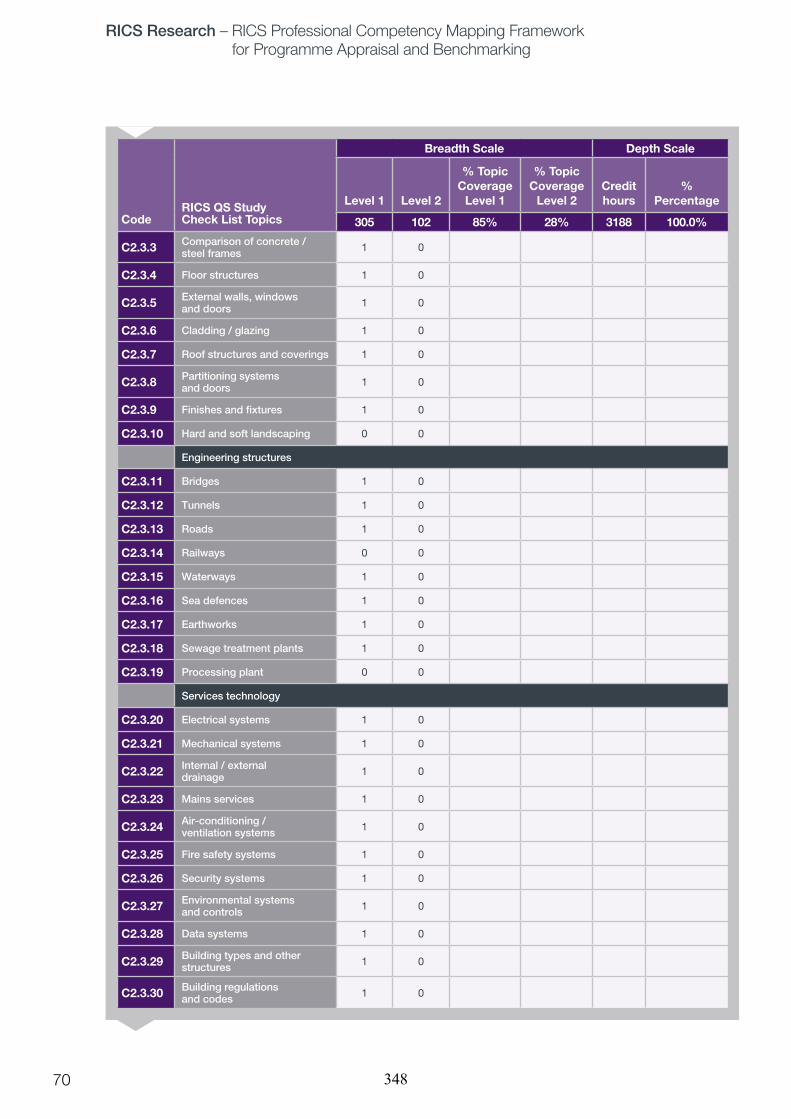
RICS Research – RICS Professional Competency Mapping Framework for Programme Appraisal and Benchmarking
rics.org/research
70
Code
RICS QS Study Check List Topics
Breadth Scale Depth Scale
Level 1 Level 2
% Topic Coverage
Level 1
% Topic Coverage
Level 2Credit hours
% Percentage
305 102 85% 28% 3188 100.0%
C2.3.3 Comparison of concrete / steel frames 1 0
C2.3.4 Floor structures 1 0
C2.3.5 External walls, windows and doors 1 0
C2.3.6 Cladding / glazing 1 0
C2.3.7 Roof structures and coverings 1 0
C2.3.8 Partitioning systems and doors 1 0
C2.3.9 Finishes and fixtures 1 0
C2.3.10 Hard and soft landscaping 0 0
Engineering structures
C2.3.11 Bridges 1 0
C2.3.12 Tunnels 1 0
C2.3.13 Roads 1 0
C2.3.14 Railways 0 0
C2.3.15 Waterways 1 0
C2.3.16 Sea defences 1 0
C2.3.17 Earthworks 1 0
C2.3.18 Sewage treatment plants 1 0
C2.3.19 Processing plant 0 0
Services technology
C2.3.20 Electrical systems 1 0
C2.3.21 Mechanical systems 1 0
C2.3.22 Internal / external drainage 1 0
C2.3.23 Mains services 1 0
C2.3.24 Air-conditioning / ventilation systems 1 0
C2.3.25 Fire safety systems 1 0
C2.3.26 Security systems 1 0
C2.3.27 Environmental systems and controls 1 0
C2.3.28 Data systems 1 0
C2.3.29 Building types and other structures 1 0
C2.3.30 Building regulations and codes 1 0
348

RICS Research – RICS Professional Competency Mapping Framework for Programme Appraisal and Benchmarking
rics.org/research
71
Code
RICS QS Study Check List Topics
Breadth Scale Depth Scale
Level 1 Level 2
% Topic Coverage
Level 1
% Topic Coverage
Level 2Credit hours
% Percentage
305 102 85% 28% 3188 100.0%
C2.3.31 Planning legislation and procedures 0 0
C2.3.32 Party wall issues / rights of light 0 0
C2.3.33 Dangerous / banned substances – asbestos etc 1 0
C2.3.34 Pre-fabrication 1 0
C2.3.35 Disability legislation 1 0
C2.4 Design economics and cost planning (T022) – Level 3 15 11 100.0% 73.3% 275 8.6%
C2.4.1
Economics of design –site density, wall / floor ratio, storey heights, room sizes, letable / non-letable
1 1
C2.4.2Sources of cost data – BCIS / in-house database / other external sources
1 1
C2.4.3 Inflation (tender / construction) 1 1
C2.4.4 Location factors, regional variations 1 1
C2.4.5 Currency fluctuations 1 0
C2.4.6 Estimating 1 1
C2.4.7 Cost Plans 1 1
C2.4.8 Cost Planning 1 1
C2.4.9 Life cycle costing – capital / running costs / replacement 1 1
C2.4.10 Value Engineering 1 1
C2.4.11 Value Management 1 1
C2.4.12 Risk Management and Analysis (contingency) 1 1
C2.4.13 State of the construction market 1 0
C2.4.14State of the economy generally – locally and globally
1 0
C2.4.15 Interest rates 1 0
C2.5 Procurement and tendering (T062) – Level 3 24 4 92.3% 15.4% 203 6.4%
Types of procurement:
C2.5.1 Traditional 1 1
C2.5.2 Design and Build 1 1
C2.5.3 Management Contracting 1 0
349

RICS Research – RICS Professional Competency Mapping Framework for Programme Appraisal and Benchmarking
rics.org/research
72
Code
RICS QS Study Check List Topics
Breadth Scale Depth Scale
Level 1 Level 2
% Topic Coverage
Level 1
% Topic Coverage
Level 2Credit hours
% Percentage
305 102 85% 28% 3188 100.0%
C2.5.4 Construction Management 1 0
C2.5.5 Measured Term 1 0
C2.5.6 Serial contracting 0 0
Financial basis:
C2.5.7 Lump sum 1 0 C2.5.8 Re-measured 1 0
C2.5.9 Reimbursable 1 0
C2.5.10 Target cost 1 0
C2.5.11 Guaranteed or Agreed Maximum Price 1 0
Tendering:
C2.5.12Standard rules of tendering – codes of practice, practice notes
1 0
C2.5.13 Single / two-stage tendering – competitive / negotiated 1 0
C2.5.14 Compilation of tender lists – pre-qualifying contractors 1 0
C2.5.15 Compilation of tender documents 1 0
C2.5.16 Tender analysis 1 0
C2.5.17 Tender reports 1 0
C2.5.18 Partnering – project and strategic 1 0
C2.5.19 Private Finance Initiative – PFI 1 0
C2.5.20 Public Private Partnership – PPP 1 0
C2.5.21 Prime contracting 0 0
C2.5.22 Best Value 1 1
C2.5.23 Whole life costing 1 1
C2.5.24 Supply Chain Management 1 0
C2.5.25 Lean Construction 1 0
C2.5.26 Key Performance Indicators – KPI 1 0
C2.6 Project financial control and reporting (T067) – Level 3 10 3 100.0% 30.0% 121 3.8%
C2.6.1 Post contract cost control 1 1
C2.6.2 Change control procedures 1 0
350

RICS Research – RICS Professional Competency Mapping Framework for Programme Appraisal and Benchmarking
rics.org/research
73
Code
RICS QS Study Check List Topics
Breadth Scale Depth Scale
Level 1 Level 2
% Topic Coverage
Level 1
% Topic Coverage
Level 2Credit hours
% Percentage
305 102 85% 28% 3188 100.0%
C2.6.3 Change control forms 1 0
C2.6.4 Cost reporting 1 1
C2.6.5 Final accounts 1 1
C2.6.6 Loss and expense 1 0
C2.6.7 Risk management 1 0
C2.6.8 Cash flows 1 0
C2.6.9 Value engineering 1 0
C2.6.10 Benchmarking / Best value 1 0
C2.7Quantification and costing of construction works (T074) – Level 3
20 8 95.2% 38.1% 462 14.5%
Methods of measurement:
C2.7.1 SMM / CESMM 1 1
C2.7.2 RICS Code of Measuring Practice 1 0
Preparation of pricing documents:
C2.7.3 Tender documents generally 1 1
C2.7.4 Bill of quantity 1 1
C2.7.5 Schedule of works 1 1
C2.7.6 Schedule of rates 1 1
C2.7.7 Provisional Sums / Prime Cost Sums 1 1
Analysis of price:
C2.7.8 Tender returns 1 0
C2.7.9 Guaranteed / Agreed Maximum Price 0 0
C2.7.10 Target cost – Pain / Gain mechanisms 1 0
C2.7.11 Loss and expense 1 0
C2.7.12 Preliminaries 1 0
C2.7.13 Dayworks 1 0
Valuation of works:
C2.7.14 Interim valuations 1 1
C2.7.15 Valuing change 1 0
C2.7.16 Loss and expense 1 0
C2.7.17 Final account 1 0
351
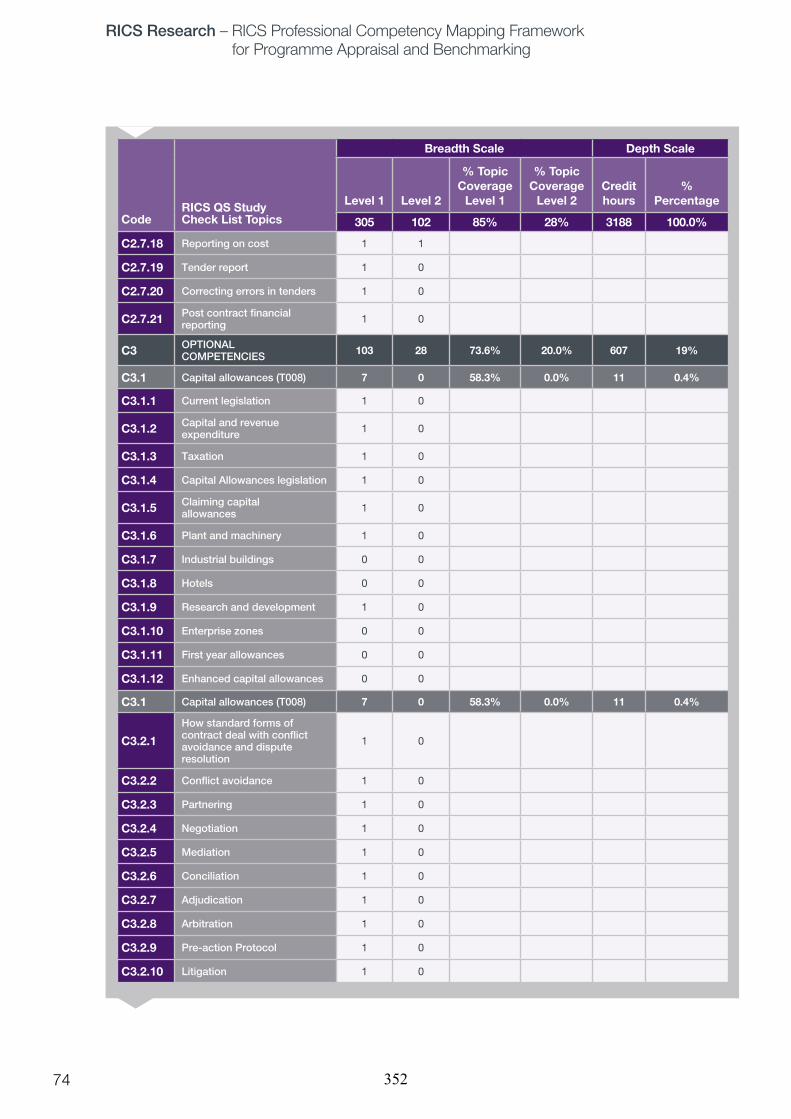
RICS Research – RICS Professional Competency Mapping Framework for Programme Appraisal and Benchmarking
rics.org/research
74
Code
RICS QS Study Check List Topics
Breadth Scale Depth Scale
Level 1 Level 2
% Topic Coverage
Level 1
% Topic Coverage
Level 2Credit hours
% Percentage
305 102 85% 28% 3188 100.0%
C2.7.18 Reporting on cost 1 1
C2.7.19 Tender report 1 0
C2.7.20 Correcting errors in tenders 1 0
C2.7.21 Post contract financial reporting 1 0
C3 OPTIONAL COMPETENCIES 103 28 73.6% 20.0% 607 19%
C3.1 Capital allowances (T008) 7 0 58.3% 0.0% 11 0.4%
C3.1.1 Current legislation 1 0
C3.1.2 Capital and revenue expenditure 1 0
C3.1.3 Taxation 1 0
C3.1.4 Capital Allowances legislation 1 0
C3.1.5 Claiming capital allowances 1 0
C3.1.6 Plant and machinery 1 0
C3.1.7 Industrial buildings 0 0
C3.1.8 Hotels 0 0
C3.1.9 Research and development 1 0
C3.1.10 Enterprise zones 0 0
C3.1.11 First year allowances 0 0
C3.1.12 Enhanced capital allowances 0 0
C3.1 Capital allowances (T008) 7 0 58.3% 0.0% 11 0.4%
C3.2.1
How standard forms of contract deal with conflict avoidance and dispute resolution
1 0
C3.2.2 Conflict avoidance 1 0
C3.2.3 Partnering 1 0
C3.2.4 Negotiation 1 0
C3.2.5 Mediation 1 0
C3.2.6 Conciliation 1 0
C3.2.7 Adjudication 1 0
C3.2.8 Arbitration 1 0
C3.2.9 Pre-action Protocol 1 0
C3.2.10 Litigation 1 0
352
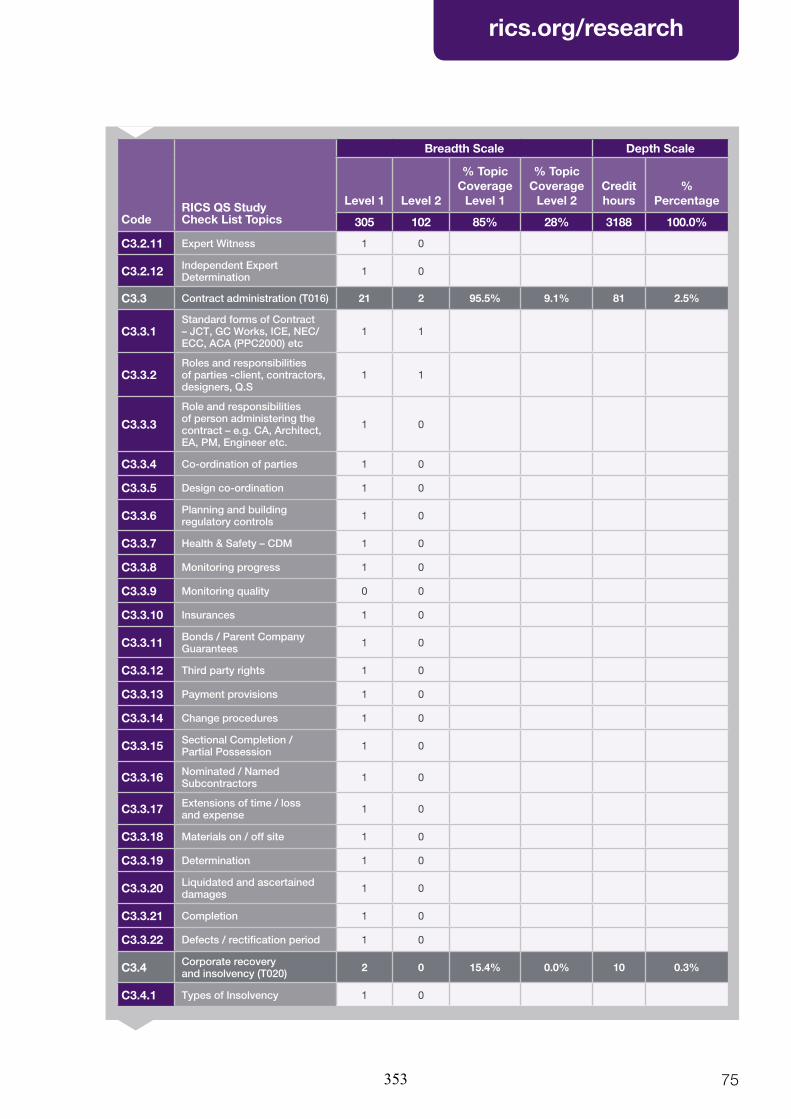
RICS Research – RICS Professional Competency Mapping Framework for Programme Appraisal and Benchmarking
rics.org/research
75
Code
RICS QS Study Check List Topics
Breadth Scale Depth Scale
Level 1 Level 2
% Topic Coverage
Level 1
% Topic Coverage
Level 2Credit hours
% Percentage
305 102 85% 28% 3188 100.0%
C3.2.11 Expert Witness 1 0
C3.2.12 Independent Expert Determination 1 0
C3.3 Contract administration (T016) 21 2 95.5% 9.1% 81 2.5%
C3.3.1Standard forms of Contract – JCT, GC Works, ICE, NEC/ECC, ACA (PPC2000) etc
1 1
C3.3.2Roles and responsibilities of parties -client, contractors, designers, Q.S
1 1
C3.3.3
Role and responsibilities of person administering the contract – e.g. CA, Architect, EA, PM, Engineer etc.
1 0
C3.3.4 Co-ordination of parties 1 0
C3.3.5 Design co-ordination 1 0
C3.3.6 Planning and building regulatory controls 1 0
C3.3.7 Health & Safety – CDM 1 0
C3.3.8 Monitoring progress 1 0
C3.3.9 Monitoring quality 0 0
C3.3.10 Insurances 1 0
C3.3.11 Bonds / Parent Company Guarantees 1 0
C3.3.12 Third party rights 1 0
C3.3.13 Payment provisions 1 0
C3.3.14 Change procedures 1 0
C3.3.15 Sectional Completion / Partial Possession 1 0
C3.3.16 Nominated / Named Subcontractors 1 0
C3.3.17 Extensions of time / loss and expense 1 0
C3.3.18 Materials on / off site 1 0
C3.3.19 Determination 1 0
C3.3.20 Liquidated and ascertained damages 1 0
C3.3.21 Completion 1 0
C3.3.22 Defects / rectification period 1 0
C3.4 Corporate recovery and insolvency (T020) 2 0 15.4% 0.0% 10 0.3%
C3.4.1 Types of Insolvency 1 0
353
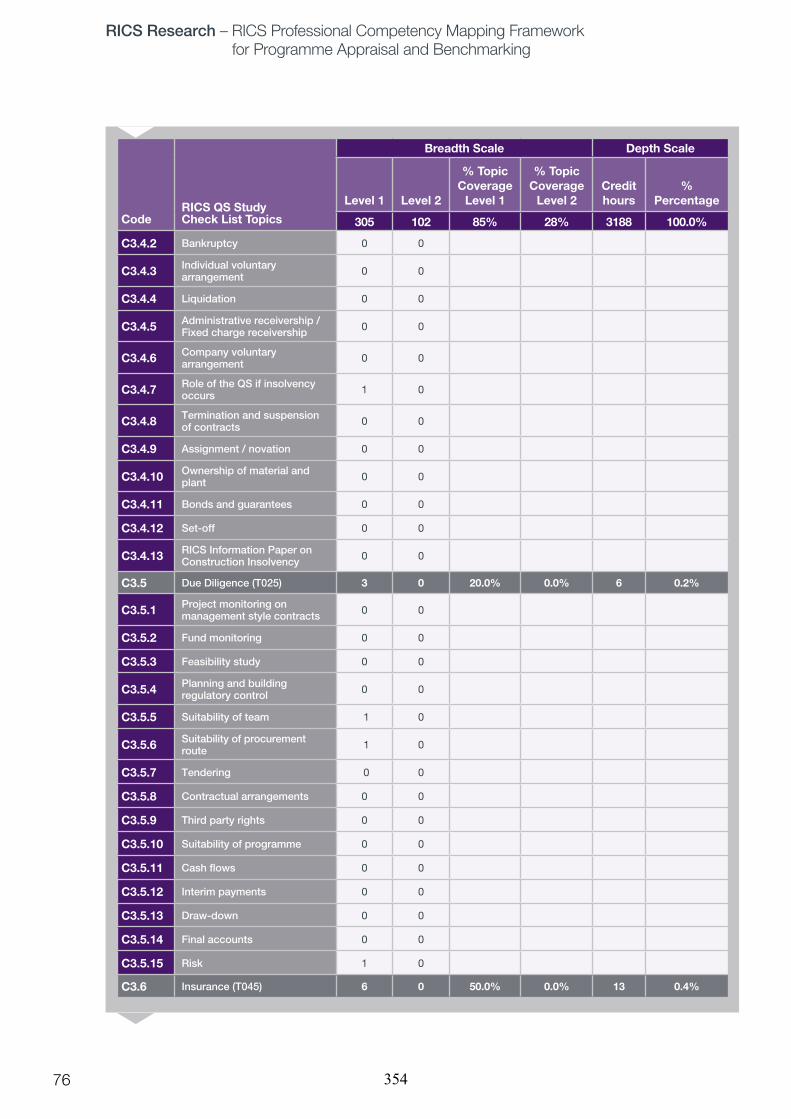
RICS Research – RICS Professional Competency Mapping Framework for Programme Appraisal and Benchmarking
rics.org/research
76
Code
RICS QS Study Check List Topics
Breadth Scale Depth Scale
Level 1 Level 2
% Topic Coverage
Level 1
% Topic Coverage
Level 2Credit hours
% Percentage
305 102 85% 28% 3188 100.0%
C3.4.2 Bankruptcy 0 0
C3.4.3 Individual voluntary arrangement 0 0
C3.4.4 Liquidation 0 0
C3.4.5 Administrative receivership / Fixed charge receivership 0 0
C3.4.6 Company voluntary arrangement 0 0
C3.4.7 Role of the QS if insolvency occurs 1 0
C3.4.8 Termination and suspension of contracts 0 0
C3.4.9 Assignment / novation 0 0
C3.4.10 Ownership of material and plant 0 0
C3.4.11 Bonds and guarantees 0 0
C3.4.12 Set-off 0 0
C3.4.13 RICS Information Paper on Construction Insolvency 0 0
C3.5 Due Diligence (T025) 3 0 20.0% 0.0% 6 0.2%
C3.5.1 Project monitoring on management style contracts 0 0
C3.5.2 Fund monitoring 0 0
C3.5.3 Feasibility study 0 0
C3.5.4 Planning and building regulatory control 0 0
C3.5.5 Suitability of team 1 0
C3.5.6 Suitability of procurement route 1 0
C3.5.7 Tendering 0 0
C3.5.8 Contractual arrangements 0 0
C3.5.9 Third party rights 0 0
C3.5.10 Suitability of programme 0 0
C3.5.11 Cash flows 0 0
C3.5.12 Interim payments 0 0
C3.5.13 Draw-down 0 0
C3.5.14 Final accounts 0 0
C3.5.15 Risk 1 0
C3.6 Insurance (T045) 6 0 50.0% 0.0% 13 0.4%
354
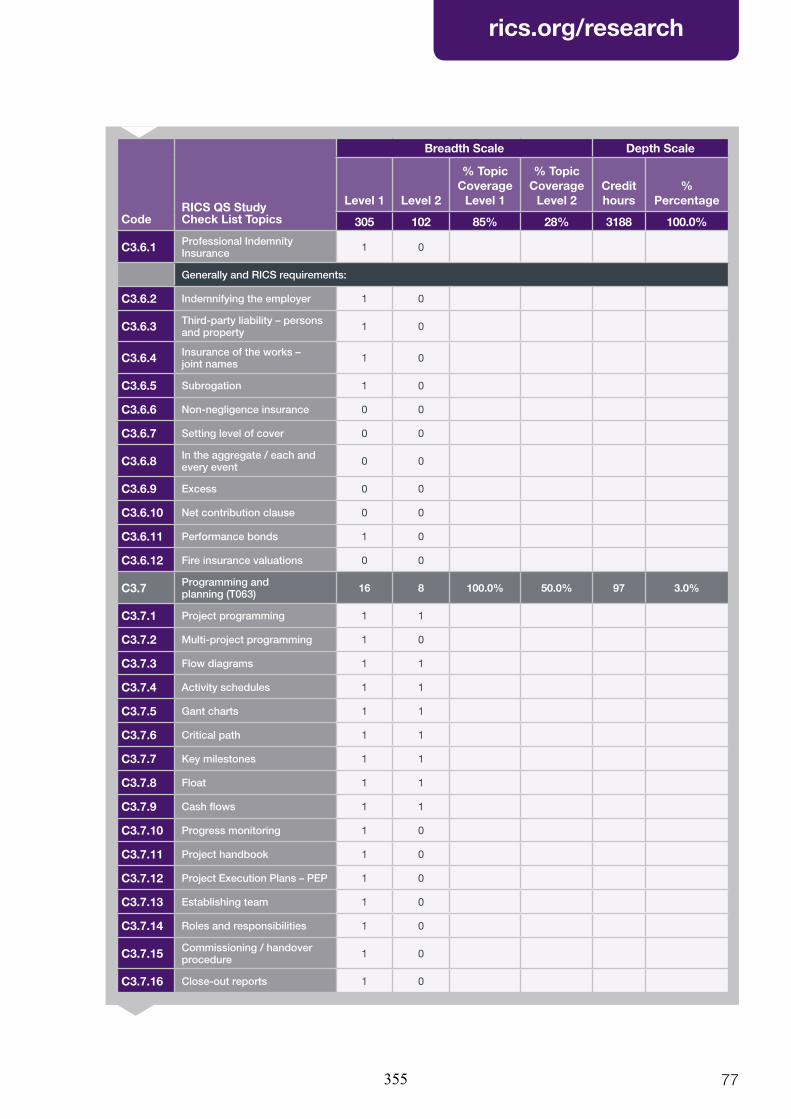
RICS Research – RICS Professional Competency Mapping Framework for Programme Appraisal and Benchmarking
rics.org/research
77
Code
RICS QS Study Check List Topics
Breadth Scale Depth Scale
Level 1 Level 2
% Topic Coverage
Level 1
% Topic Coverage
Level 2Credit hours
% Percentage
305 102 85% 28% 3188 100.0%
C3.6.1 Professional Indemnity Insurance 1 0
Generally and RICS requirements:
C3.6.2 Indemnifying the employer 1 0
C3.6.3 Third-party liability – persons and property 1 0
C3.6.4 Insurance of the works – joint names 1 0
C3.6.5 Subrogation 1 0
C3.6.6 Non-negligence insurance 0 0
C3.6.7 Setting level of cover 0 0
C3.6.8 In the aggregate / each and every event 0 0
C3.6.9 Excess 0 0
C3.6.10 Net contribution clause 0 0
C3.6.11 Performance bonds 1 0
C3.6.12 Fire insurance valuations 0 0
C3.7 Programming and planning (T063) 16 8 100.0% 50.0% 97 3.0%
C3.7.1 Project programming 1 1
C3.7.2 Multi-project programming 1 0
C3.7.3 Flow diagrams 1 1
C3.7.4 Activity schedules 1 1
C3.7.5 Gant charts 1 1
C3.7.6 Critical path 1 1
C3.7.7 Key milestones 1 1
C3.7.8 Float 1 1
C3.7.9 Cash flows 1 1
C3.7.10 Progress monitoring 1 0
C3.7.11 Project handbook 1 0
C3.7.12 Project Execution Plans – PEP 1 0
C3.7.13 Establishing team 1 0
C3.7.14 Roles and responsibilities 1 0
C3.7.15 Commissioning / handover procedure 1 0
C3.7.16 Close-out reports 1 0
355

RICS Research – RICS Professional Competency Mapping Framework for Programme Appraisal and Benchmarking
rics.org/research
78
Code
RICS QS Study Check List Topics
Breadth Scale Depth Scale
Level 1 Level 2
% Topic Coverage
Level 1
% Topic Coverage
Level 2Credit hours
% Percentage
305 102 85% 28% 3188 100.0%
C3.8 Project evaluation (T066) 13 10 100.0% 76.9% 118 3.7%
C3.8.1 Appraisal methods 1 1
C3.8.2 Residual value 1 1
C3.8.3 Value / income 1 1
C3.8.4 Valuation of property / rental values 1 0
C3.8.5 RICS Red Book 1 0
C3.8.6 Costs 1 1
C3.8.7 Land acquisition 1 0
C3.8.8 Construction costs 1 1
C3.8.9 Fees 1 1
C3.8.10 Finance costs 1 1
C3.8.11 Taxation, grants, capital allowances 1 1
C3.8.12 Profitability 1 1
C3.8.13 Planning 1 1
C3.9 Risk management (T077) 11 7 84.6% 53.8% 58 1.8%
C3.9.1 Workshops 1 1
C3.9.2 Identification 1 1
C3.9.3 Register 1 1
C3.9.4 Management plan 1 1
C3.9.5 Mitigation 1 0
C3.9.6 QS contribution to risk management 1 1
C3.9.7 Risk analysis 1 1
C3.9.8 Probability and impact 1 1
C3.9.9 Expected Monetary Value – EMV 1 0
C3.9.10 Monte Carlo Simulation 1 0
C3.9.11 Central Limit Theory – CLT 0 0
C3.9.12 Route Mean Square – RMS 0 0
C3.9.13 Contingency 1 0
C3.10 Sustainability (M009) 12 1 100.0% 8.3% 144 4.5%
C3.10.1 Sustainable development / construction 1 1
C3.10.2 National and international regulations 1 0
356

RICS Research – RICS Professional Competency Mapping Framework for Programme Appraisal and Benchmarking
rics.org/research
79
Code
RICS QS Study Check List Topics
Breadth Scale Depth Scale
Level 1 Level 2
% Topic Coverage
Level 1
% Topic Coverage
Level 2Credit hours
% Percentage
305 102 85% 28% 3188 100.0%
C3.10.3Environmental assessment methods – e.g. LEED, BREEAM etc.
1 0
C3.10.4 Building Regulations and Codes 1 0
C3.10.5 Contaminated land 1 0
C3.10.6 Waste management 1 0
C3.10.7 Recyclable materials 1 0
C3.10.8 Sustainable materials 1 0
C3.10.9 Building environmental management systems 1 0
C3.10.10 Water conservation 1 0
C3.10.11 Energy generation 1 0
C3.10.12 Energy conservation 1 0
Total Topics = 359 305 102 85% 28% 3188 100%
Level 1 – Knowledge and understanding
Level 2 – Application of knowledge and understanding
Level 3 – Reasoned advice and depth of technical knowledge
357
rics.org/research
RICS HQ
Parliament Square London SW1P 3AD United Kingdom
Worldwide media enquiries:
Contact Centre:
e [email protected] t +44 (0)24 7686 8555 f +44 (0)20 7334 3811
Advancing standards in land, property and construction.
RICS is the world’s leading qualification when it comes to professional standards in land, property and construction.
In a world where more and more people, governments, banks and commercial organisations demand greater certainty of professional standards and ethics, attaining RICS status is the recognised mark of property professionalism.
Over 100 000 property professionals working in the major established and emerging economies of the world have already recognised the importance of securing RICS status by becoming members.
RICS is an independent professional body originally established in the UK by Royal Charter. Since 1868, RICS has been committed to setting and upholding the highest standards of excellence and integrity – providing impartial, authoritative advice on key issues affecting businesses and society.
RICS is a regulator of both its individual members and firms enabling it to maintain the highest standards and providing the basis for unparalleled client confidence in the sector.
RICS has a worldwide network. For further information simply contact the relevant RICS office or our Contact Centre.
Asia Room 2203 Hopewell Centre 183 Queen’s Road East Wanchai Hong Kong
t +852 2537 7117 f +852 2537 2756 [email protected]
Americas One Grand Central Place 60 East 42nd Street Suite 2810 New York 10165 – 2810 USA
t +1 212 847 7400 f +1 212 682 1295 [email protected]
Oceania Suite 2, Level 16 1 Castlereagh Street Sydney, NSW 2000 Australia
t +61 2 9216 2333 f +61 2 9232 5591 [email protected]
Europe (excluding United Kingdom and Ireland) Rue Ducale 67 1000 Brussels Belgium
t +32 2 733 10 19 f +32 2 742 97 48 [email protected]
Africa PO Box 3400 Witkoppen 2068 South Africa
t +27 11 467 2857 f +27 86 514 0655 [email protected]
Middle East Office G14, Block 3 Knowledge Village Dubai United Arab Emirates
t +971 4 375 3074 f +971 4 427 2498 [email protected]
India 48 & 49 Centrum Plaza Sector Road Sector 53, Gurgaon – 122002 India
t +91 124 459 5400 f +91 124 459 5402 [email protected]
United Kingdom Parliament Square London SW1P 3AD United Kingdom
t +44 (0)24 7686 8555 f +44 (0)20 7334 3811 [email protected]
Ireland 38 Merrion Square Dublin 2 Ireland
t +353 1 644 5500 f +353 1 661 1797 [email protected]
SE
PTE
MB
ER
201
3/D
ML/
1850
0/R
ES
EA
RC
H
358

Quantity Surveying Seminar Number 9
Analysis of the Delegate Survey How to educate quantity surveyors to meet future needs
Professor Srinath Perera Dr Lei Zhou Damilola Ekundayo Construction Economics & Management Research Group www.northumbria-qs.org Northumbria University
Professor Allan Ashworth Barry Symonds CHOBE Executive
359
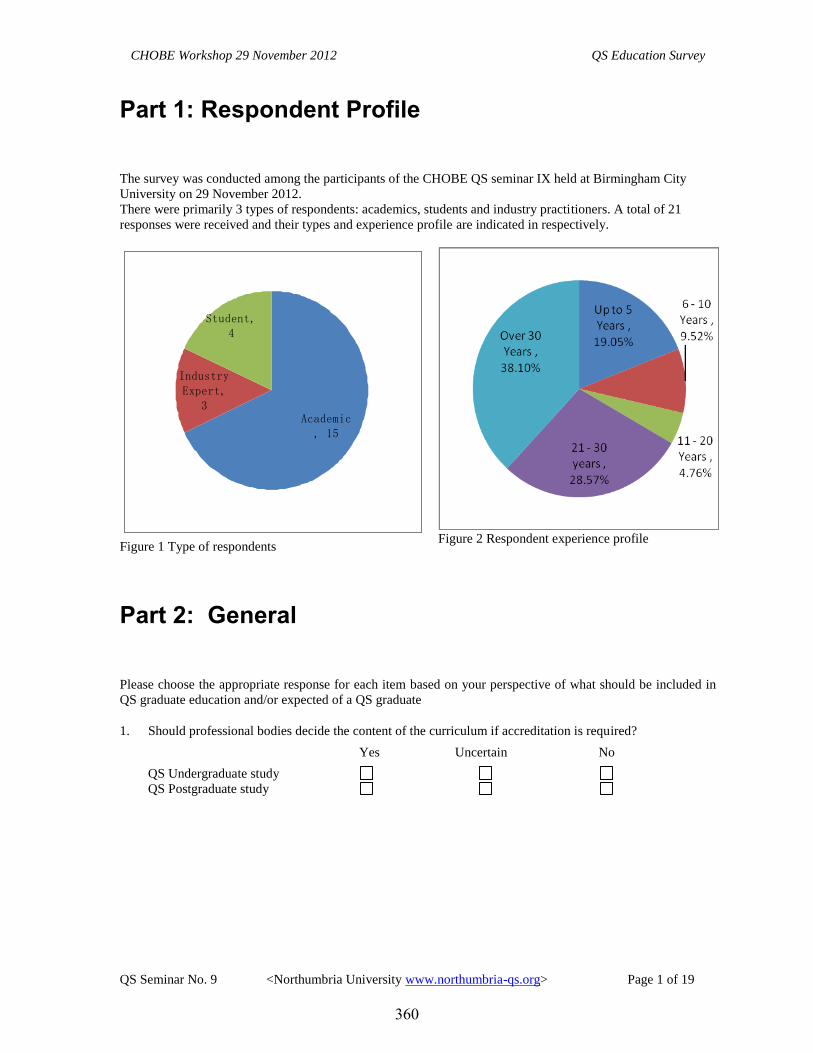
CHOBE Workshop 29 November 2012 QS Education Survey
QS Seminar No. 9 <Northumbria University www.northumbria-qs.org> Page 1 of 19
Part 1: Respondent Profile
The survey was conducted among the participants of the CHOBE QS seminar IX held at Birmingham City
University on 29 November 2012.
There were primarily 3 types of respondents: academics, students and industry practitioners. A total of 21
responses were received and their types and experience profile are indicated in respectively.
Figure 1 Type of respondents
Figure 2 Respondent experience profile
Part 2: General
Please choose the appropriate response for each item based on your perspective of what should be included in
QS graduate education and/or expected of a QS graduate
1. Should professional bodies decide the content of the curriculum if accreditation is required?
Yes Uncertain No
QS Undergraduate study
QS Postgraduate study
Academic, 15
Industry Expert,
3
Student, 4
360
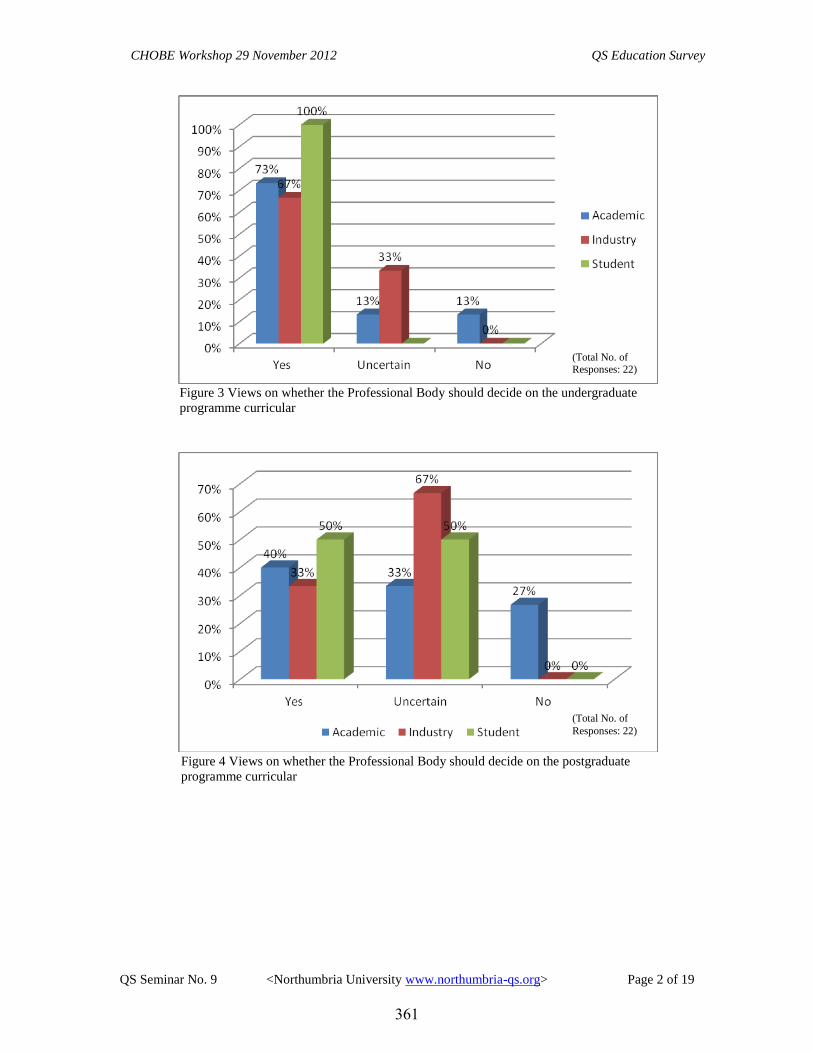
CHOBE Workshop 29 November 2012 QS Education Survey
QS Seminar No. 9 <Northumbria University www.northumbria-qs.org> Page 2 of 19
Figure 3 Views on whether the Professional Body should decide on the undergraduate
programme curricular
Figure 4 Views on whether the Professional Body should decide on the postgraduate
programme curricular
(Total No. of Responses: 22)
(Total No. of
Responses: 22)
361

CHOBE Workshop 29 November 2012 QS Education Survey
QS Seminar No. 9 <Northumbria University www.northumbria-qs.org> Page 3 of 19
2. Should universities focus more on education rather than training?
Yes Uncertain No
QS Undergraduate study
QS Postgraduate study
Figure 5 Views on whether focus should be on Education or Training at undergraduate level
Figure 6 Views on whether focus should be on Education or Training at postgraduate level
(Total No. of
Responses: 22)
(Total No. of
Responses: 22)
362
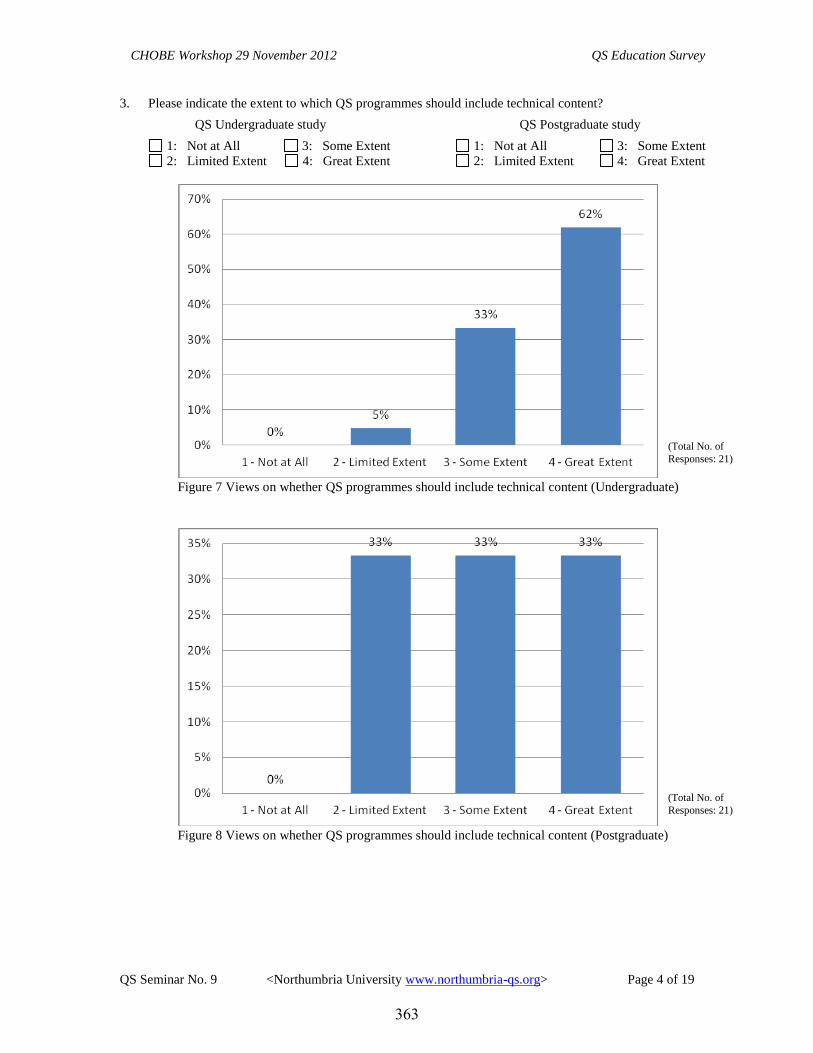
CHOBE Workshop 29 November 2012 QS Education Survey
QS Seminar No. 9 <Northumbria University www.northumbria-qs.org> Page 4 of 19
3. Please indicate the extent to which QS programmes should include technical content?
QS Undergraduate study QS Postgraduate study
1: Not at All 3: Some Extent 1: Not at All 3: Some Extent
2: Limited Extent 4: Great Extent 2: Limited Extent 4: Great Extent
Figure 7 Views on whether QS programmes should include technical content (Undergraduate)
Figure 8 Views on whether QS programmes should include technical content (Postgraduate)
(Total No. of
Responses: 21)
(Total No. of
Responses: 21)
363

CHOBE Workshop 29 November 2012 QS Education Survey
QS Seminar No. 9 <Northumbria University www.northumbria-qs.org> Page 5 of 19
4. Should QS Undergraduate study include a mandatory placement module?
Yes Uncertain No
Figure 9 Views on whether placement should be compulsory
5. Should a QS master’s programme be about (Please choose only one answer):
Learning advance technology and techniques applicable to industry
Developing and advancing theoretical knowledge and understanding
Advancing technical ability in a specific area
Figure 10 Nature of QS master’s programmes
(Total No. of Responses: 22)
(Total No. of
Responses: 22)
364
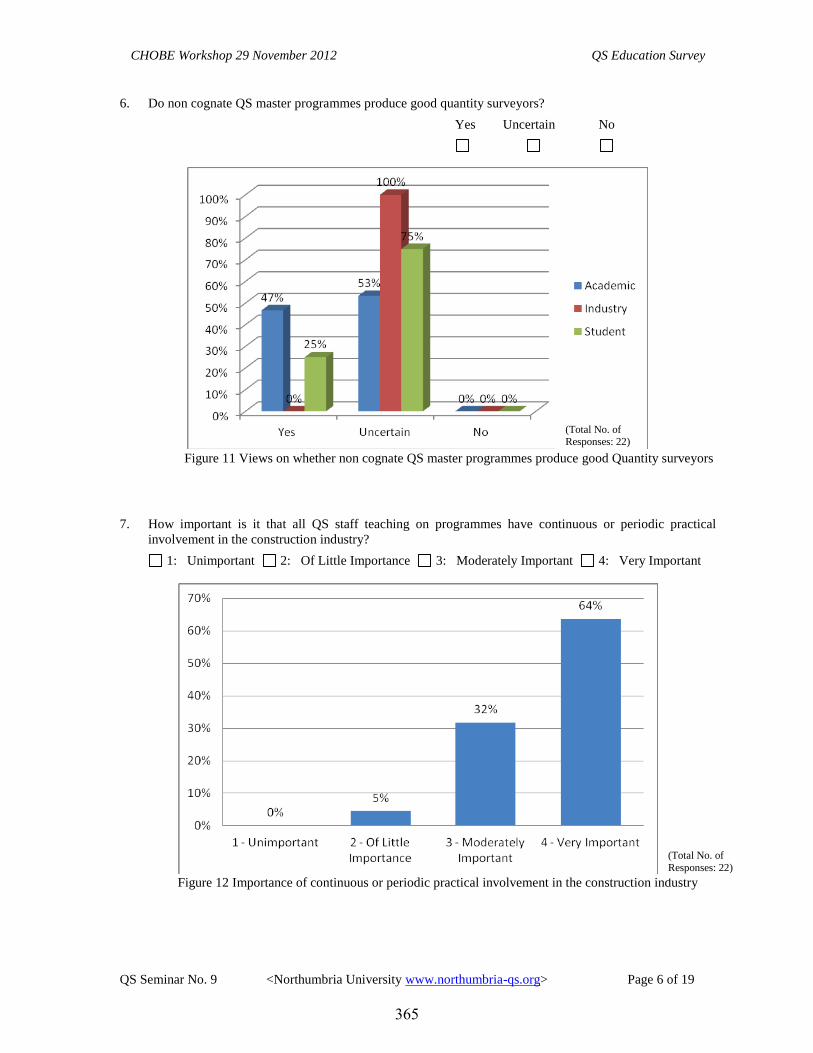
CHOBE Workshop 29 November 2012 QS Education Survey
QS Seminar No. 9 <Northumbria University www.northumbria-qs.org> Page 6 of 19
6. Do non cognate QS master programmes produce good quantity surveyors?
Yes Uncertain No
Figure 11 Views on whether non cognate QS master programmes produce good Quantity surveyors
7. How important is it that all QS staff teaching on programmes have continuous or periodic practical
involvement in the construction industry?
1: Unimportant 2: Of Little Importance 3: Moderately Important 4: Very Important
Figure 12 Importance of continuous or periodic practical involvement in the construction industry
(Total No. of Responses: 22)
(Total No. of
Responses: 22)
365

CHOBE Workshop 29 November 2012 QS Education Survey
QS Seminar No. 9 <Northumbria University www.northumbria-qs.org> Page 7 of 19
8. How important is it for staff teaching on QS programmes to be involved in ongoing research?
1: Unimportant 2: Of Little Importance 3: Moderately Important 4: Very Important
Figure 13 Importance of involvement in research
9. If there is a shortage of research-active QS staff, is there a danger that QS programmes could be relegated
to teaching only technical universities in the future?
1: Not at All 2: Probably Not 3: Probably 4: Definitely
Figure 14 Level of probability that QS programmes could be relegated to teaching only
technical universities in the future
(Total No. of
Responses: 22)
(Total No. of
Responses: 22)
366
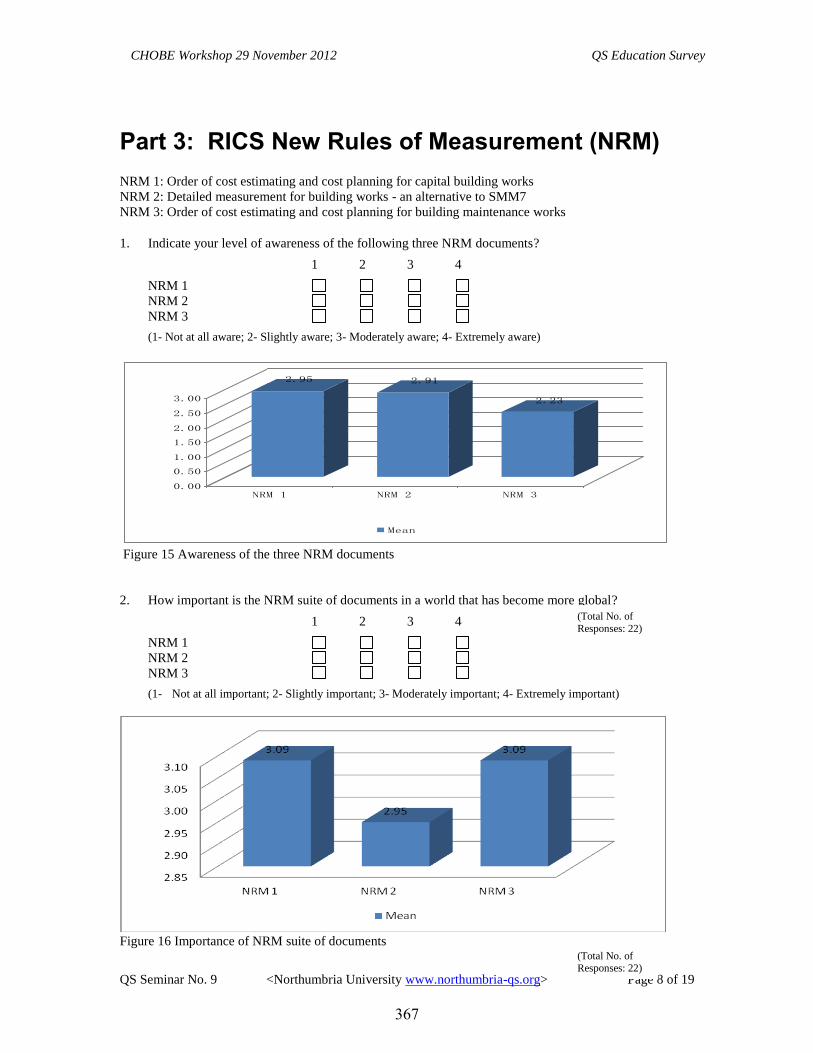
CHOBE Workshop 29 November 2012 QS Education Survey
QS Seminar No. 9 <Northumbria University www.northumbria-qs.org> Page 8 of 19
Part 3: RICS New Rules of Measurement (NRM)
NRM 1: Order of cost estimating and cost planning for capital building works
NRM 2: Detailed measurement for building works - an alternative to SMM7
NRM 3: Order of cost estimating and cost planning for building maintenance works
1. Indicate your level of awareness of the following three NRM documents?
1 2 3 4
NRM 1
NRM 2
NRM 3
(1- Not at all aware; 2- Slightly aware; 3- Moderately aware; 4- Extremely aware)
Figure 15 Awareness of the three NRM documents
2. How important is the NRM suite of documents in a world that has become more global?
1 2 3 4
NRM 1
NRM 2
NRM 3
(1- Not at all important; 2- Slightly important; 3- Moderately important; 4- Extremely important)
Figure 16 Importance of NRM suite of documents
2.95 2.91
2.23
0.00
0.50
1.00
1.50
2.00
2.50
3.00
NRM 1 NRM 2 NRM 3
Mean
(Total No. of
Responses: 22)
(Total No. of
Responses: 22)
367
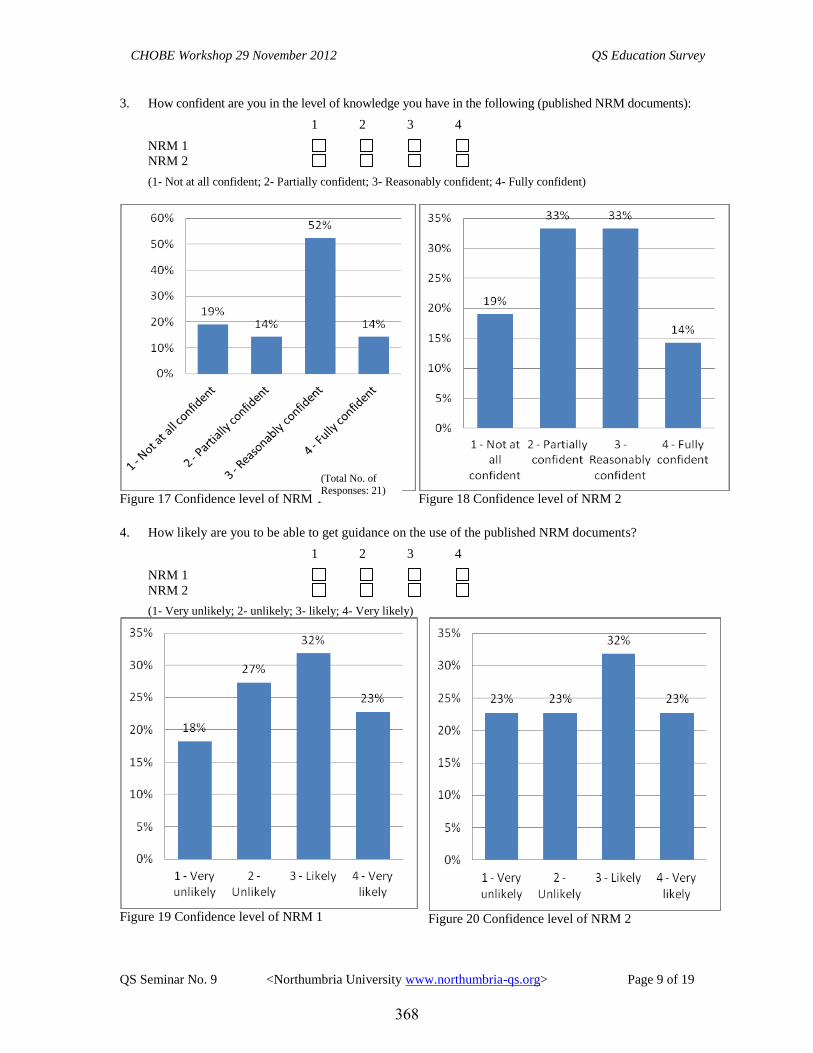
CHOBE Workshop 29 November 2012 QS Education Survey
QS Seminar No. 9 <Northumbria University www.northumbria-qs.org> Page 9 of 19
3. How confident are you in the level of knowledge you have in the following (published NRM documents):
1 2 3 4
NRM 1
NRM 2
(1- Not at all confident; 2- Partially confident; 3- Reasonably confident; 4- Fully confident)
Figure 17 Confidence level of NRM 1
Figure 18 Confidence level of NRM 2
4. How likely are you to be able to get guidance on the use of the published NRM documents?
1 2 3 4
NRM 1
NRM 2
(1- Very unlikely; 2- unlikely; 3- likely; 4- Very likely)
Figure 19 Confidence level of NRM 1
Figure 20 Confidence level of NRM 2
(Total No. of Responses: 21)
368
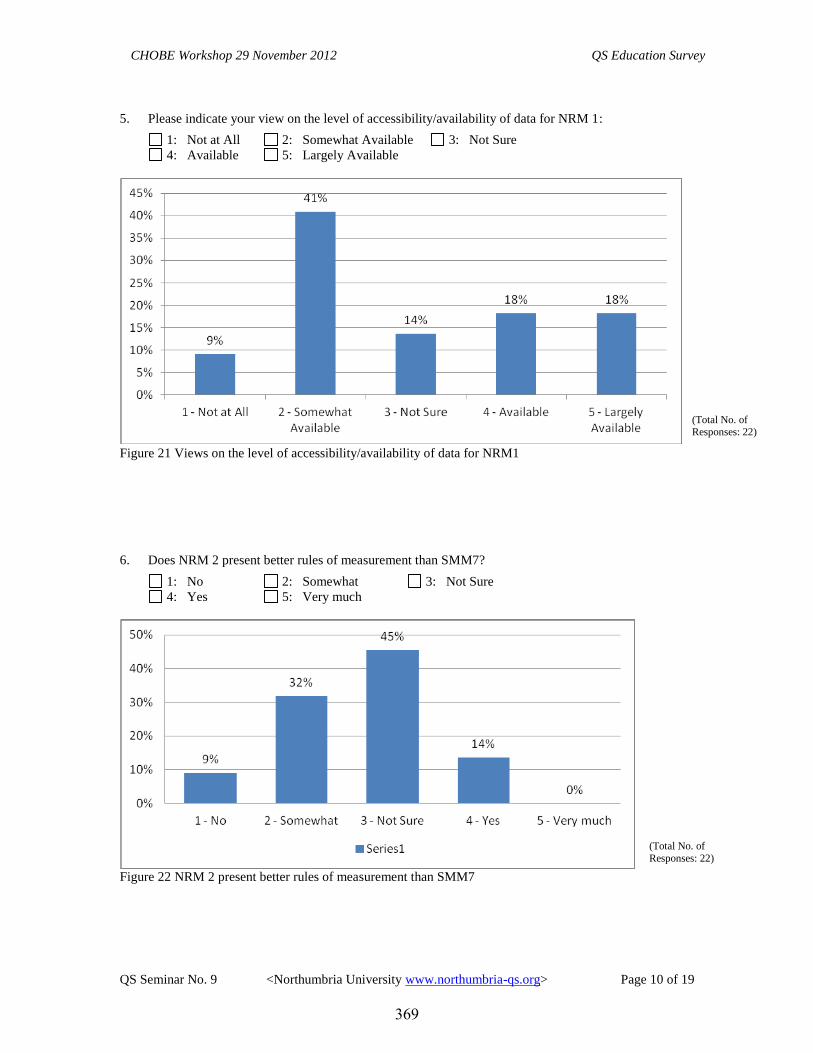
CHOBE Workshop 29 November 2012 QS Education Survey
QS Seminar No. 9 <Northumbria University www.northumbria-qs.org> Page 10 of 19
5. Please indicate your view on the level of accessibility/availability of data for NRM 1:
1: Not at All 2: Somewhat Available 3: Not Sure
4: Available 5: Largely Available
Figure 21 Views on the level of accessibility/availability of data for NRM1
6. Does NRM 2 present better rules of measurement than SMM7?
1: No 2: Somewhat 3: Not Sure
4: Yes 5: Very much
Figure 22 NRM 2 present better rules of measurement than SMM7
(Total No. of Responses: 22)
(Total No. of
Responses: 22)
369
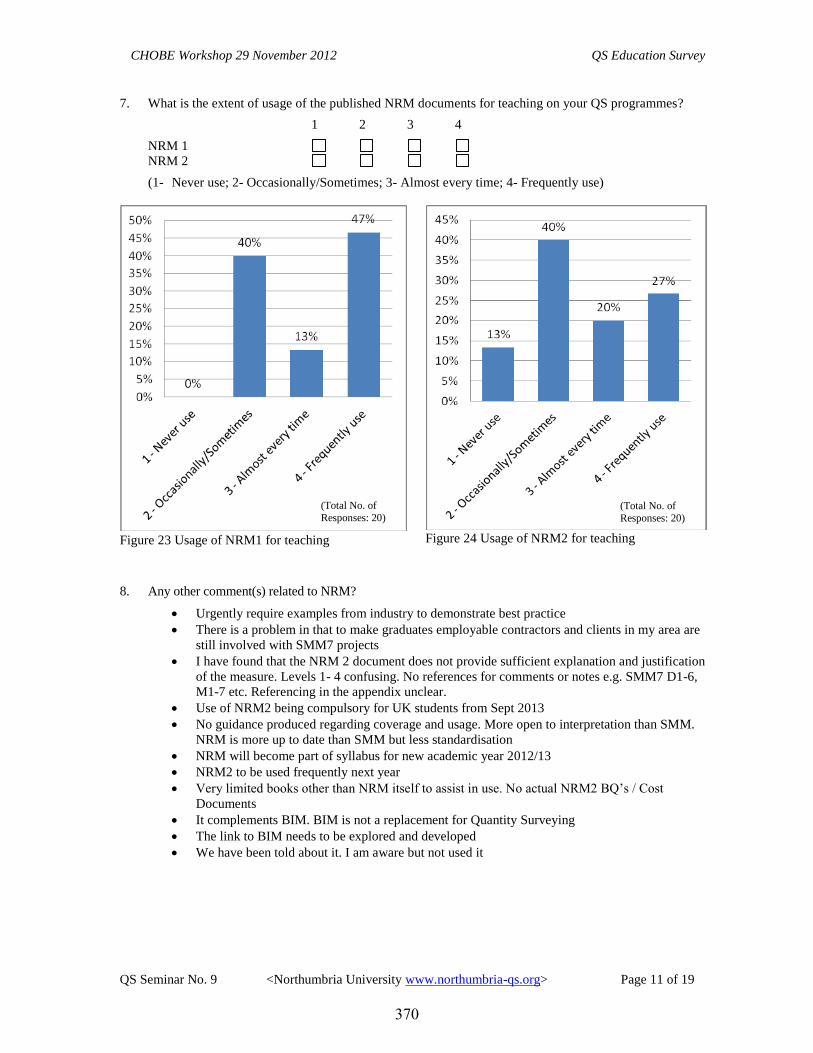
CHOBE Workshop 29 November 2012 QS Education Survey
QS Seminar No. 9 <Northumbria University www.northumbria-qs.org> Page 11 of 19
7. What is the extent of usage of the published NRM documents for teaching on your QS programmes?
1 2 3 4
NRM 1
NRM 2
(1- Never use; 2- Occasionally/Sometimes; 3- Almost every time; 4- Frequently use)
Figure 23 Usage of NRM1 for teaching
Figure 24 Usage of NRM2 for teaching
8. Any other comment(s) related to NRM?
Urgently require examples from industry to demonstrate best practice
There is a problem in that to make graduates employable contractors and clients in my area are
still involved with SMM7 projects
I have found that the NRM 2 document does not provide sufficient explanation and justification
of the measure. Levels 1- 4 confusing. No references for comments or notes e.g. SMM7 D1-6,
M1-7 etc. Referencing in the appendix unclear.
Use of NRM2 being compulsory for UK students from Sept 2013
No guidance produced regarding coverage and usage. More open to interpretation than SMM.
NRM is more up to date than SMM but less standardisation
NRM will become part of syllabus for new academic year 2012/13
NRM2 to be used frequently next year
Very limited books other than NRM itself to assist in use. No actual NRM2 BQ’s / Cost
Documents
It complements BIM. BIM is not a replacement for Quantity Surveying
The link to BIM needs to be explored and developed
We have been told about it. I am aware but not used it
(Total No. of
Responses: 20) (Total No. of
Responses: 20)
370
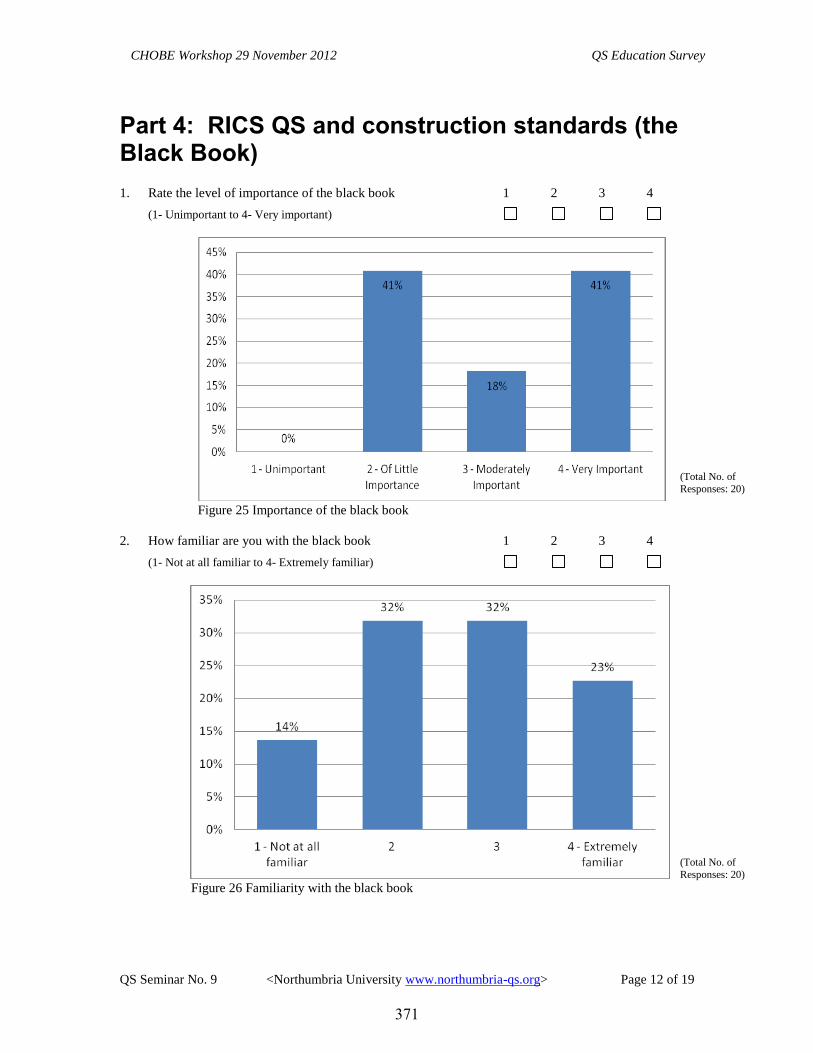
CHOBE Workshop 29 November 2012 QS Education Survey
QS Seminar No. 9 <Northumbria University www.northumbria-qs.org> Page 12 of 19
Part 4: RICS QS and construction standards (the Black Book)
1. Rate the level of importance of the black book 1 2 3 4
(1- Unimportant to 4- Very important)
Figure 25 Importance of the black book
2. How familiar are you with the black book 1 2 3 4
(1- Not at all familiar to 4- Extremely familiar)
Figure 26 Familiarity with the black book
(Total No. of
Responses: 20)
(Total No. of
Responses: 20)
371
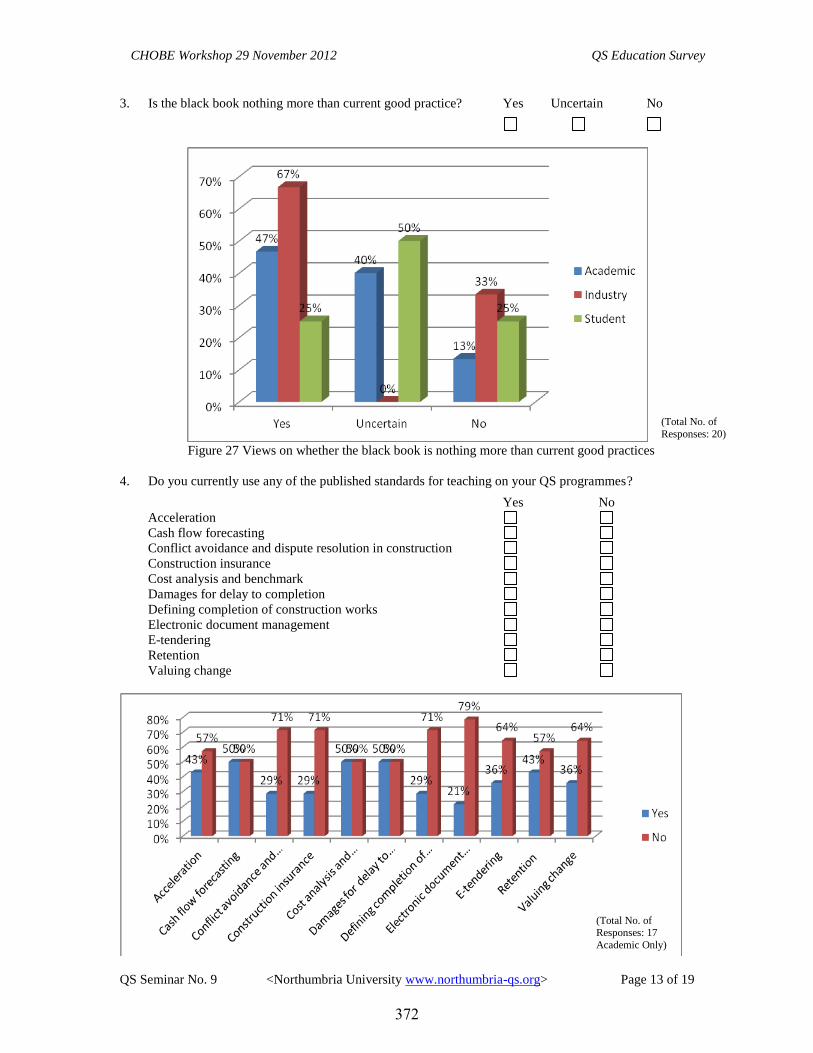
CHOBE Workshop 29 November 2012 QS Education Survey
QS Seminar No. 9 <Northumbria University www.northumbria-qs.org> Page 13 of 19
3. Is the black book nothing more than current good practice? Yes Uncertain No
Figure 27 Views on whether the black book is nothing more than current good practices
4. Do you currently use any of the published standards for teaching on your QS programmes?
Yes No
Acceleration
Cash flow forecasting
Conflict avoidance and dispute resolution in construction
Construction insurance
Cost analysis and benchmark
Damages for delay to completion
Defining completion of construction works
Electronic document management
E-tendering
Retention
Valuing change
(Total No. of
Responses: 20)
(Total No. of Responses: 17
Academic Only)
372
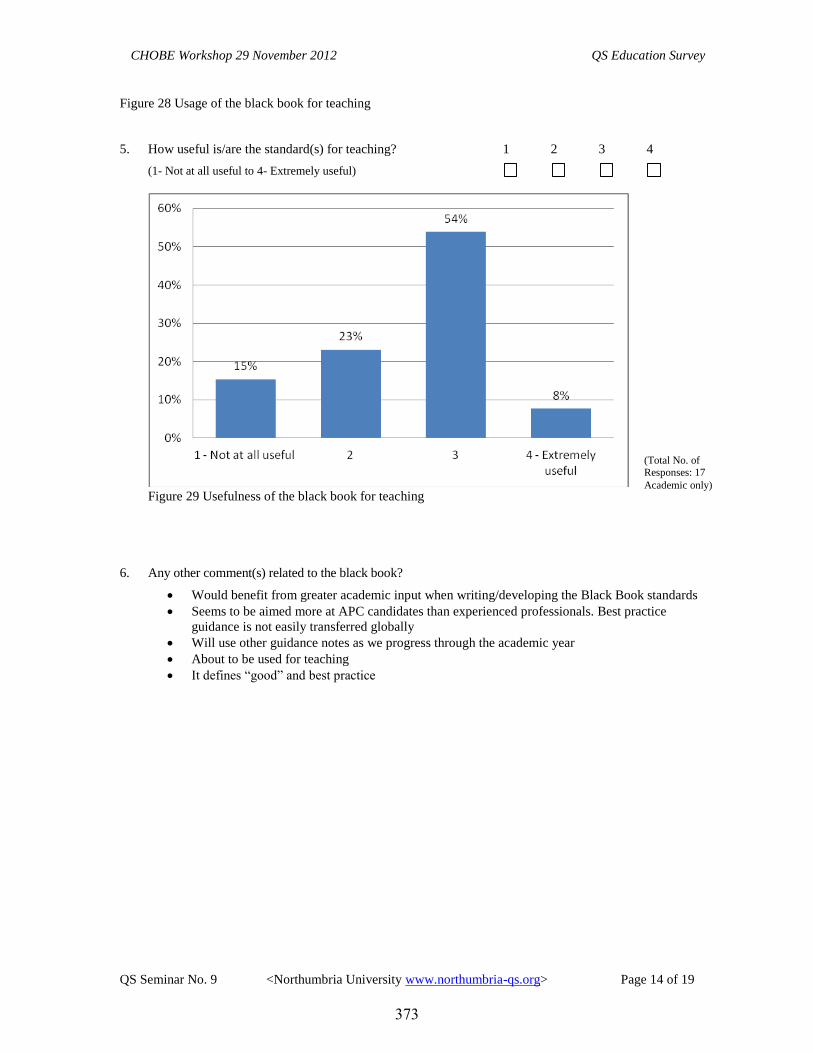
CHOBE Workshop 29 November 2012 QS Education Survey
QS Seminar No. 9 <Northumbria University www.northumbria-qs.org> Page 14 of 19
Figure 28 Usage of the black book for teaching
5. How useful is/are the standard(s) for teaching? 1 2 3 4
(1- Not at all useful to 4- Extremely useful)
Figure 29 Usefulness of the black book for teaching
6. Any other comment(s) related to the black book?
Would benefit from greater academic input when writing/developing the Black Book standards
Seems to be aimed more at APC candidates than experienced professionals. Best practice
guidance is not easily transferred globally
Will use other guidance notes as we progress through the academic year
About to be used for teaching
It defines “good” and best practice
(Total No. of Responses: 17
Academic only)
373

CHOBE Workshop 29 November 2012 QS Education Survey
QS Seminar No. 9 <Northumbria University www.northumbria-qs.org> Page 15 of 19
Part 5: Building Information Modeling (BIM)
1. Please choose which of the following definitions most closely describes BIM (please select one):
BIM is the process of generating and managing information about a building during its entire life cycle
BIM is essentially a design tool
BIM is a process involving the generation and management of digital representations of physical and
functional characteristics of a facility
BIM is an integrated tool for planning, design, construction and management of projects
Figure 30 BIM Definitions
2. How familiar are you with BIM? 1 2 3 4
(1- Not at all familiar to 4- Extremely familiar)
Figure 31 Familiarity with BIM
(Total No. of
Responses: 21)
(Total No. of Responses: 22)
374

CHOBE Workshop 29 November 2012 QS Education Survey
QS Seminar No. 9 <Northumbria University www.northumbria-qs.org> Page 16 of 19
3. What is your perception on the importance of BIM to the role of QS?
1 2 3 4
(1- Unimportant to 4- Very important)
Figure 32 Importance of BIM to the role of QS
4. If BIM is to be included in QS curricula should it be:
Appreciation Application Both Other, please specify:
Figure 33 Including BIM in QS curricula
5. How should BIM be introduced to QS programme? (Please choose only one answer):
Replacing existing module with 10 credits BIM module
Replacing existing module with 20 credits BIM module
Integrating it with relevant existing modules
Taught as an optional module
Taught at postgraduate level
Should not be taught in universities
(Total No. of
Responses: 22)
(Total No. of
Responses: 22)
375
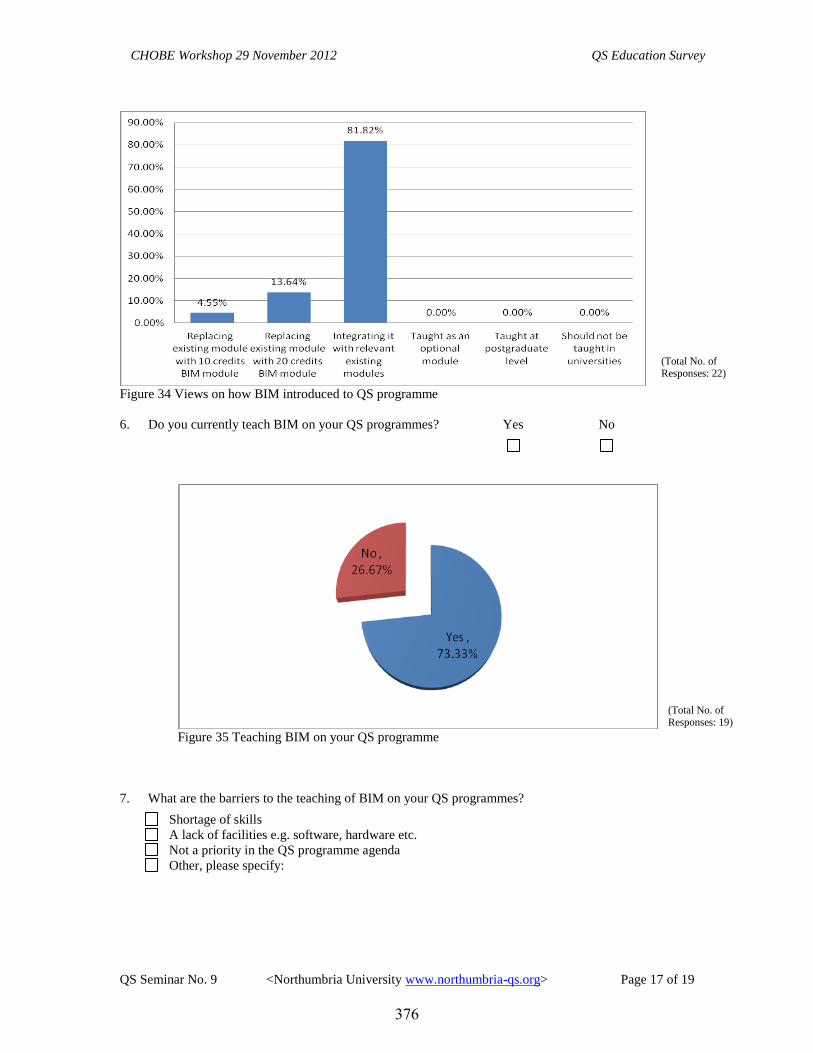
CHOBE Workshop 29 November 2012 QS Education Survey
QS Seminar No. 9 <Northumbria University www.northumbria-qs.org> Page 17 of 19
Figure 34 Views on how BIM introduced to QS programme
6. Do you currently teach BIM on your QS programmes? Yes No
Figure 35 Teaching BIM on your QS programme
7. What are the barriers to the teaching of BIM on your QS programmes?
Shortage of skills
A lack of facilities e.g. software, hardware etc.
Not a priority in the QS programme agenda
Other, please specify:
(Total No. of Responses: 22)
(Total No. of Responses: 19)
376

CHOBE Workshop 29 November 2012 QS Education Survey
QS Seminar No. 9 <Northumbria University www.northumbria-qs.org> Page 18 of 19
Figure 36 Barriers to the teaching BIM on your QS programme
8. Any other comment(s) related to BIM?
BIM is fundamental to QS education as the overall understanding of the process of construction is
vital - the QS …… in cost management are therefore crucial and they need to appreciate the value
of BIM and integrated working
Which classification system to use? Purchase?
Funding - to develop software BIM/QS Slant. It would be excellent if universities all come
together and funded the development of a model that was linked to BCIS/CATO etc. to support
the QS role.
Still only used to a limited extent in practice, therefore difficult to predict whether industry will
adopt it on a wide range of projects
As more people become aware of its use and availability (software) then it will be a better tool
There is too much hype about BIM. Concentrate on teaching the basics of Quantity Surveying
first!
The growth of ‘BIM’ based tools is inevitable. The application of a project ‘level 2’ BIM will be
adopted by the government, its under application is less certain
We want it to be incorporated into our studies
BIM is not easy to teach, as the industry is still not aware of how it will work within the current
construction industry
(Total No. of
Responses: 19)
377


![109 – [2] Wave Overtopping Quantity](https://static.fdokumen.com/doc/165x107/6333c268e3da70449d01c8d7/109-2-wave-overtopping-quantity.jpg)