Higher Surveying
37
Higher Surveying Dr. Ajay Dashora Department of Civil Engineering Indian Institute of Technology, Guwahati Module - 01 Lecture - 01 Introduction to Higher Surveying Hello everyone. Welcome to the course on higher surveying. This is a NPTEL massive open online course. Well, before this course we have already done one course on basic surveying, and that course is also available on NPTEL. The idea here is based on the fundamental concepts that we learnt in the basic surveying, we are going to develop few more concepts for higher surveying course. So, that is why the course on basic surveying a prerequisite for this higher surveying. Well so, let us go ahead this is the introductory lecture on higher surveying. And so, in this lecture we are going to develop an appropriate context for this course. That why do we need that higher surveying for various problems that is related to the 3D measurement and other information. So, let us take some few problems that I come across in last couple of years. (Refer Slide Time: 01:25) The first problem is related to the forest study. The forest study requires that there is a big area around 1500 square kilo meter. With this area given to me, I want to find out
-
Upload
khangminh22 -
Category
Documents
-
view
4 -
download
0
Transcript of Higher Surveying

Higher SurveyingDr. Ajay Dashora
Department of Civil EngineeringIndian Institute of Technology, Guwahati
Module - 01Lecture - 01
Introduction to Higher Surveying
Hello everyone. Welcome to the course on higher surveying. This is a NPTEL massive
open online course. Well, before this course we have already done one course on basic
surveying, and that course is also available on NPTEL. The idea here is based on the
fundamental concepts that we learnt in the basic surveying, we are going to develop few
more concepts for higher surveying course.
So, that is why the course on basic surveying a prerequisite for this higher surveying.
Well so, let us go ahead this is the introductory lecture on higher surveying. And so, in
this lecture we are going to develop an appropriate context for this course. That why do
we need that higher surveying for various problems that is related to the 3D
measurement and other information. So, let us take some few problems that I come
across in last couple of years.
(Refer Slide Time: 01:25)
The first problem is related to the forest study. The forest study requires that there is a
big area around 1500 square kilo meter. With this area given to me, I want to find out
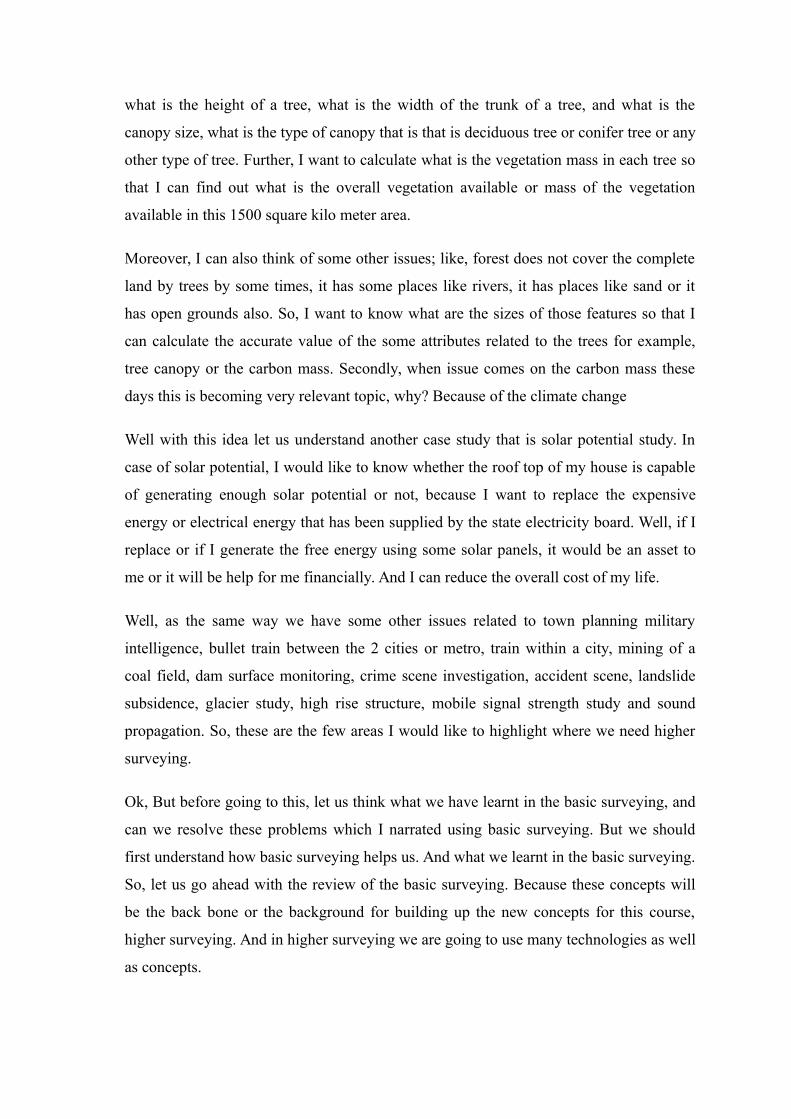
what is the height of a tree, what is the width of the trunk of a tree, and what is the
canopy size, what is the type of canopy that is that is deciduous tree or conifer tree or any
other type of tree. Further, I want to calculate what is the vegetation mass in each tree so
that I can find out what is the overall vegetation available or mass of the vegetation
available in this 1500 square kilo meter area.
Moreover, I can also think of some other issues; like, forest does not cover the complete
land by trees by some times, it has some places like rivers, it has places like sand or it
has open grounds also. So, I want to know what are the sizes of those features so that I
can calculate the accurate value of the some attributes related to the trees for example,
tree canopy or the carbon mass. Secondly, when issue comes on the carbon mass these
days this is becoming very relevant topic, why? Because of the climate change
Well with this idea let us understand another case study that is solar potential study. In
case of solar potential, I would like to know whether the roof top of my house is capable
of generating enough solar potential or not, because I want to replace the expensive
energy or electrical energy that has been supplied by the state electricity board. Well, if I
replace or if I generate the free energy using some solar panels, it would be an asset to
me or it will be help for me financially. And I can reduce the overall cost of my life.
Well, as the same way we have some other issues related to town planning military
intelligence, bullet train between the 2 cities or metro, train within a city, mining of a
coal field, dam surface monitoring, crime scene investigation, accident scene, landslide
subsidence, glacier study, high rise structure, mobile signal strength study and sound
propagation. So, these are the few areas I would like to highlight where we need higher
surveying.
Ok, But before going to this, let us think what we have learnt in the basic surveying, and
can we resolve these problems which I narrated using basic surveying. But we should
first understand how basic surveying helps us. And what we learnt in the basic surveying.
So, let us go ahead with the review of the basic surveying. Because these concepts will
be the back bone or the background for building up the new concepts for this course,
higher surveying. And in higher surveying we are going to use many technologies as well
as concepts.

But the backbone will remain the basic surveying, right. So, let us do a small simple
review.
(Refer Slide Time: 04:36)
We have learnt most of the instruments like tape, shown here, then we have compass,
theodolite. Then we have plane table, which is a graphical method total station which is
unit for 3D measurement, then we have level, which is auto level higher and GPS were
this is a GPS here, right. We have learnt most of the instruments which are generally
used in the basic surveying nowadays.
Right we can see that here tape used for the linear measurement, compass for the
direction measurement, theodolites for angle measurement, plane table is a graphical
method for mapping. Total station for 3D measurement level for the 1D vertical
measurement or vertical height measurement or reduce level measurement and GPS for
this 3D measurement in global coordinate system.
So, these instruments we already learned. How do they work and how to use them and
under what circumstance we should use them?
(Refer Slide Time: 05:43)

So, using this instrument we want to identify the geoinformation. So, what is a
geoinformation? The 3D coordinates, and any additional information about a point on
surface of earth. Now using this geoinformation after capturing it I would like to create
map.
So, I would like to create topographic map, and that is called the topographic information
map or the 3D map where 3D information is minimum X Y and Z. If any additional
information comes along with this 3D information I would like to rather I would love to
record that also.
So, first we need to establish reference system in order to record my geoinformation,
why because we are preliminary requirement is my X Y and Z information. And hence I
need to establish a reference system. The reference system is characterized by 2
attributes. The first is origin of reference system suppose I am showing the origin is X 0
Y 0 Z 0 of the reference system X Y and Z. Secondly, the orientation of the reference
axes, you can see there are 2 reference systems have been shown here. So, one is
originated at X 0 Y 0 Z 0 and it is indicated by X Y and Z axis.
The second one has origin at X 1, Y 1, Z 1. And it has coordinate axes represented by X
dash, Y dash, Z dash. Thirdly there is a point P, and I want to locate the point P in the 2
reference systems, ok. I can easily measure it because they are orthogonal systems. So
with respect to particular axis if I measure the perpendicular distance with respect to

axis, I can find out at least one coordinate. And then using such 3 measurements, I can
find out what is the 3D coordinate value of point P in the 2 reference system.
Now, I want to refer this point P in the 2 coordinate system simultaneously. If you see the
2 reference system right now I am using word coordinate system also anonymously, but
they are different terms. So, let us see that they are reference system only. So, and we
should not use coordinate system right now.
We will use it later in some of the modules. So, there if I want to transform the
coordinate of point P in 4th reference system given to me to the second reference system.
What I need to do? I need to first understand that on the surface of earth point P is going
to remain stable; point P is not going to change. All this aspect we will look into the
some of the module in this course, but I am just giving you some introduction here.
Well, now after that if I want to do coordinate transformation or I want to find out the
coordinate of point P in 2 reference systems, I need to do, I need to rotate and I need to
translate one coordinate system into another. Or I can say so let us transfer the X dash, Y
dash, Z dash to X, Y, Z. For that first I need to do translation, where I will bring the
origin of the X dash, Y dash, Z dash reference system to the origin of another system,
rather I will bring X 1, Y 1, Z 1 point to the point X 0, Y 0, Z 0.
And after that I will rotate my coordinate axis X dash Y dash Z dash such that it will
meet the axeses X Y and Z at point X 0 Y 0 Z 0. And after by this rotation if I calculate
this mathematically I can find out what is the value of point P in any of the coordinate
system right now. That means in the current position of the reference systems what are
the coordinate of point P. So, basically in this process I am trying to find out the
coordinates or the coordinates of X dash Y dash Z dash reference system in X, Y, Z
reference system. Well, that is the idea here.
(Refer Slide Time: 09:46)

So, let us see this there is another reference system which is which has the same origin X
0, Y 0, Z 0, ok. And now, but we see that orientation is different. So, here I need not do
any translation, I need only do the rotation. So, once I rotate X dash to X, Y dash to Y
and Z dash to Z I am done. So, this is the idea about the reference system and coordinate
system.
(Refer Slide Time: 10:09)
Then we talked about shape of the earth. The shape of the earth are there was first is to
geoid. Geoid is nothing but an equipotential surface. So, if I assume that earth is a
equipotential surface and if I plot the gravity values on the surface of earth. It will be
shown like the figure given. It is very common figure available internet.
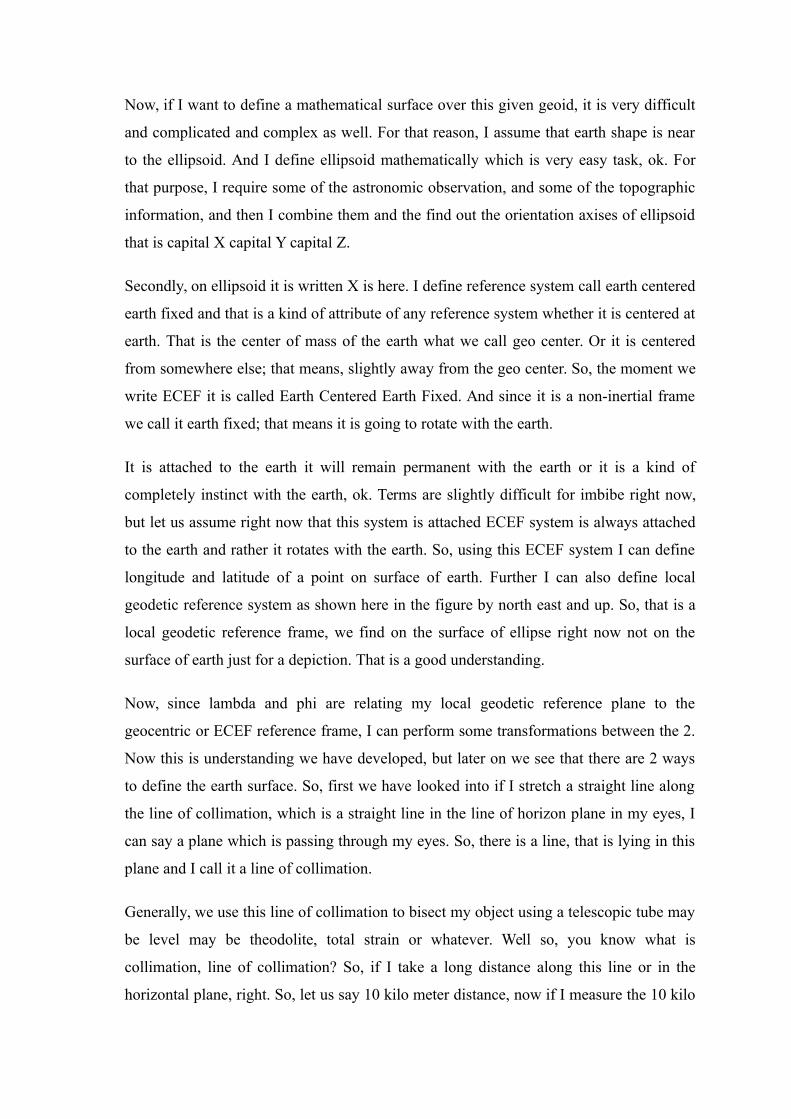
Now, if I want to define a mathematical surface over this given geoid, it is very difficult
and complicated and complex as well. For that reason, I assume that earth shape is near
to the ellipsoid. And I define ellipsoid mathematically which is very easy task, ok. For
that purpose, I require some of the astronomic observation, and some of the topographic
information, and then I combine them and the find out the orientation axises of ellipsoid
that is capital X capital Y capital Z.
Secondly, on ellipsoid it is written X is here. I define reference system call earth centered
earth fixed and that is a kind of attribute of any reference system whether it is centered at
earth. That is the center of mass of the earth what we call geo center. Or it is centered
from somewhere else; that means, slightly away from the geo center. So, the moment we
write ECEF it is called Earth Centered Earth Fixed. And since it is a non-inertial frame
we call it earth fixed; that means it is going to rotate with the earth.
It is attached to the earth it will remain permanent with the earth or it is a kind of
completely instinct with the earth, ok. Terms are slightly difficult for imbibe right now,
but let us assume right now that this system is attached ECEF system is always attached
to the earth and rather it rotates with the earth. So, using this ECEF system I can define
longitude and latitude of a point on surface of earth. Further I can also define local
geodetic reference system as shown here in the figure by north east and up. So, that is a
local geodetic reference frame, we find on the surface of ellipse right now not on the
surface of earth just for a depiction. That is a good understanding.
Now, since lambda and phi are relating my local geodetic reference plane to the
geocentric or ECEF reference frame, I can perform some transformations between the 2.
Now this is understanding we have developed, but later on we see that there are 2 ways
to define the earth surface. So, first we have looked into if I stretch a straight line along
the line of collimation, which is a straight line in the line of horizon plane in my eyes, I
can say a plane which is passing through my eyes. So, there is a line, that is lying in this
plane and I call it a line of collimation.
Generally, we use this line of collimation to bisect my object using a telescopic tube may
be level may be theodolite, total strain or whatever. Well so, you know what is
collimation, line of collimation? So, if I take a long distance along this line or in the
horizontal plane, right. So, let us say 10 kilo meter distance, now if I measure the 10 kilo

meter distance along the surface of the earth which is curvilinear. I will find that the
difference between the 2 lines that is one is a line that is line of collimation, and the line
that is laid on the surface of the earth.
So, difference between the 2 lines over a distance of 10 kilo meter is very less is in the
order of millimeters. And because of that, we say that, earth can be assumed flat. But at
the same time we find another problem. The problem is over the distance of 10 kilo
meter if I measure the vertical height of 2 points they are away from almost in the level
of meters close to 8 meters or so. It is very dangerous; I cannot assume the earth as flat if
I want to measure the vertical heights on the surface of earth.
And as a result we have separated 2 surface; we call for a planimetric where I need to
calculate X and Y position of a point, I will use earth as a flat surface. Secondly, if I want
to develop a the vertical control survey, that is I want to calculate the height of a point
with respect to certain reference, I will use vertical survey and vertical survey will not
assume earth as a flat. Rather it will assume earth as a curvilinear object, ok.
So, with this idea we have started the vertical survey and horizontal survey. For
horizontal survey, we can have a reference system on the surface of earth where we can
define our origin 0 0 or X 0 Y 0 something like that. But for the vertical survey we
assume there is some equipotential surface, and that surface is parallel to the geoid at a
given area. And so, if I measure the distance with respect to that equipotential surface, I
can find out the heights of all the points safely and I can report them on the surface of
map, ok.
So, map what I call as an identity, or an entity that contains X and Y coordinate the
planimetric coordinates. If I call this 3D map then it will contain Z information or the
vertical information, but the Z information is collected with respect to the equipotential
surface. And X and Y surface X and Y information is collected in the X Y flat plane. So,
with this idea we started with the fundamental principles of survey.
(Refer Slide Time: 15:39)

The first principle was the reconnaissance survey and what we call is recy in short.
In reconnaissance survey we try to understand the terrain features and undulations.
Rather, because I want to conduct the survey I want to travel over the surface I want to
collect the information, I should know how this terrain is behaving so that I can plan the
survey in advance. So, basically it is the part of the planning then we go we try to feel
terrain, rather we always say I want to feel it, how does it look like, how does it behave,
ok. I will give you a simple example if you go to some area near to New Delhi.
Because the areas are very, very flat there or hills are very minimum there. And as a
result you find that it is recy survey is just roaming around the area, but you will be
surprised to know one particular example of IIT Guwahati, because when I was listening
to our founding director when he came here for the first time. And the land of IIT
Guwahati which was allotted to the IIT Guwahati campus, it was completely submerged
in the water. And for the first time when he came he came with the boat. And you will
surprise there were only hills and there were only lakes. And the where the buildings are
there today constructed those buildings are constructed after lot of field work.
And the first field work was to remove the water from the lakes and fill those lakes with
the help of sand or may be some kind of different material so that the level of these lakes
are raised by at least 6 to 7 meters here first. So, that decision was taken during the
reconnaissance survey that we need to do something. Then we had considered the whole
to part approach. In the whole to part approach, we say that we will start from the largest

possible extent of area. And then we will try to come gradually for the smaller areas
within that given area. And that was the whole to part approach. And the idea was to
establish the control network.
Once I establish the control network for the highest of the possible area or the largest of
the possible area that control stations are going to guide or rather than going to control
the rest of the survey. Because they have will have certain accuracies or inaccuracies or
whatever. So, that accuracy is going to control the rest of the survey for the smaller areas
within that area. So, that is the reason we say that we always go whole to part and not
part to whole.
Then we say that let us start with the measurements, because we have decided control
point locations and I want to do now the measurements. So, we have done the redundant
measurement; that means, instead of measuring a variable that can be distance. That can
be angle, but I will measure that distance or angle not only one time. I will do it multiple
times so that I will have more confidence in my measurement. I can show you
mathematically, that if you take multiple measurement and if you take the average of
those value, you will have higher confidence compared to single value. And that was the
idea behind the redundant observations.
Then realize that we need to validate our work also. So, we have proposed something
called check lines. Check lines are the distances which we measure in the field, and then
we come to the lab again, and try to see whatever map I have developed whether it
contains the correct distances or not. Because I have measured some distances during the
redundant measurement.
I will use these redundant measurement I will develop a map, then I will go to the field I
will take some other distances which I have not measured earlier. Now I will measure
those unknown distances in the field, ok. Reduce them according to scale of the map.
Come to the lab, see my map and try to measure those unknown distances in the map as
well.
Now, I try to compare the 2 lengths; the length which I observed in the field and the in
map to this map and the originally what is coming in the map after development. So, if
these 2 distances are matching with certain guarantee or accuracy, I can understand that
my work is correct. Otherwise, I need to repeat my work or else I committed some
mistakes in my original work, ok. So, whatever remedial measures are there I need to
take into account those. Further after being all these things we have discussed about the
skill of the map or the resolution of the map and the plotting accuracy.
We say that, we can plot a certain point or certain length or certain thickness of line on
map. So, under that line there is no details available to me. For example, if I plot 0.5
millimeter point or the thickness of line is minimum 0.5 millimeter and if I multiply with
the scale of the map. That is the distance or that is the linear distance in the ground,
within which I cannot note any detail.
Or even I note a detail that will be expressed within one line, right. And the thickness of
line is 0.5 mm; I cannot dig out any information on the map in 0.5 mm, because that is
one single line. Well, with this idea we have learnt what is the concept of plotting
accuracy, and what is the concept of scale of map and how are they correlated.
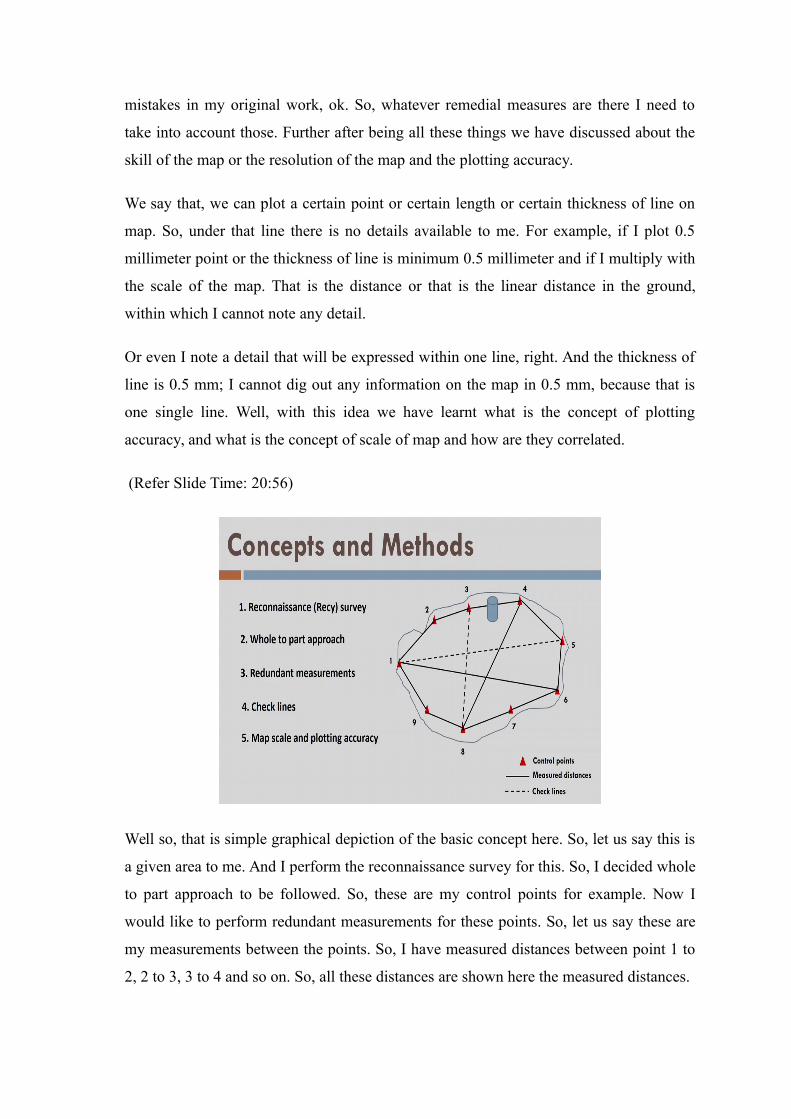
(Refer Slide Time: 20:56)
Well so, that is simple graphical depiction of the basic concept here. So, let us say this is
a given area to me. And I perform the reconnaissance survey for this. So, I decided whole
to part approach to be followed. So, these are my control points for example. Now I
would like to perform redundant measurements for these points. So, let us say these are
my measurements between the points. So, I have measured distances between point 1 to
2, 2 to 3, 3 to 4 and so on. So, all these distances are shown here the measured distances.

Later I want to perform check lines. So, before that I have developed my map, and I have
plotted these details on the surface of map that measured distance. Not only the measured
distance I have already plotted my control points also which I measured in the field,
which I decided in the field. So now, I know in field where these points are located on.
Now and developing their geometrical relationship, and after development of geometric
relationship between the time and plotting them on the map.
So, this is the plotted position of all the 9 control points. Now I would like to confirm
whether I have done the correct job or not. So, what will I do I will take few other
distances which I have not measured earlier. So, these dotted lines are my check lines I
will measure them in the field, reduce them to the map scale. Come to the laboratory and
try to measure again, these distances on the map. So, the distance measured between 0.3
and 8, I will confirm whether I get the same distance from field or not. If I get the same
distance my work is ok. And if they are considerably different, I need to reconsider, or I
have to give a another opinion to my work. May be, I need to repeat some of the job
again in the field.
Further, this is the map scale and plotting accuracy concept here, where I say that let us
see there is a building shown by cylinder here. This cylindrical building let us say it is
kind of cylindrical building or a water tank. Not overhead water tank, or it can be any
feature like that, let us say auditorium. So, will it be available or it can be a cylindrical
pole that flag pole also.
So, will it be visible to me on this map or not. So, depending on this scale and depending
on the feature size on the ground, I need to decide this thing. If it is not visible, in the
map there is no need to measure in the field. So, I should have this kind of understanding
also, ok. So, it was the basic concepts what is the 5 fundamental concepts of the basic
surveying.
(Refer Slide Time: 23:29)

After that we learned what is errors and what are accuracies. So, what are the sources of
errors? The first source we will discuss was natural caused by the reasons. For example,
air temperature or ambient conditions, may be noise, what are the instrumental reasons
caused by the instruments. For example, and instrument is not behaving or it is
malfunctioning.
Third and personal reasons personal reasons might commuted by the person’s errors that
are committed by individual persons, ok. After that we classified our errors in major 3
types. The first error is the gross error what we call as mistakes or blunder. So, with help
of enough care if I remain enough careful in the field, I can avoid gross errors. And one
should stay careful there, because detecting errors or gross errors are not that easy or in
the laboratory by others. So, once a person who goes to field he comes back and then he
forget after few days what did he do. So, in that case gross it is very difficult to detect the
gross errors.
Secondly, then we say that after removal of the gross errors. We have systematic errors in
case of systematic errors may follow some mathematical rule. So, by doing some
physical experiment, I can find out the formula or mathematical logic and I can remove
those errors. So, even after removing systematic errors, I will have some errors which are
beyond the control of a individual user or group of user or human being. And these are
such called random errors. So, these are the classification of the errors in 3 types.

Then we say that only random errors are present, because I was carefully enough in the
field to avoid gross errors. I came to the laboratory then I conducted some experiment
detected my systematic errors. I removed them ultimately random errors are only present
or they still persistent in my observation. Now on the basis of that let me define some
quality of the data. The first was precision and accuracy; precision as we said it is the
closeness among the observations. Accuracy it is closeness of the observed values to the
true value; well that was the concept we have understood. Fine, then we will look it into
the adjustment principles, then we said what is error, further we said what is a correction
if I remove the error I need to apply correction.
What is the true error or absolute error? If I have kind of true value of the variable, I can
find out the true error then we define that since it is not possible to find out the true value
of a variable, or the true error of a variable most probable value. So, the most probable
value is the value that has maximum chances of occurring in the observations. And then
we also find out the mean of the observation is the most probable value we proved it
systematically also.
Further, instead of defining the true error we will define the relative error, then we have
defined the term called residual what is the mean, weighted mean error distribution and
so on. And then we treated the material completely and different statistical manner.
(Refer Slide Time: 26:41)

Then after that we started with linear measurements. Because before that we understand
what are the concept of error and accuracy. So now, I can do my measurements, ok. So,
with the linear measurement we started with the chain and we defined 2 terms chainage
and offset. If I measure a length between 2 points a and b, or other if I spread the chain
between 2 points a and b. So, if I measure any length along the chain, a tape, it is called
chainage. And if I measure any distance perpendicular to the chain I call that
perpendicular distance as offset; so, that is kind of simple definition we have.
Then we use what is the tape length, errors of the tape, and then corrections should apply.
Remember, those corrections versus systematic corrections for the tape. So, those
corrections were temperature correction, pool correction, sack correction and standard
length correction. Well, and sometimes if tape is inclined we also put the correction for
slow. Then we have looked into the field practices; first is the ranging, direct ranging and
indirect ranging. Suppose, I want to align 2 points along a straight line in the field that is
what I call the direct ranging if the points are visible. But if points are not visible and still
want to perform the ranging exercise, I need to do indirect ranging methods, ok.
Later on, I also learn how to develop parallel lines in the field, how to develop
perpendicular lines in the field and using cross staff and ranging rod what other practices
are possible in the field. Further, in the continuation in linear distances we learned
electronic distance measurement, and what are the fundamental principles of EDMI, ok.
So, time measurement based system and phase measurement based systems we looked
into. There we say that time may systems, in case of phase based measurement system,
we see that we need to measure the phase difference of travelling and it is a transmitted
wave and arrival of the wave.
So, by this idea we started measuring the distances that very high accuracy, level of 2
millimeter to 10 millimeter. And that is an excellent, why because these distances are
measured, or these errors we have encountered over a distance of 2 to 3 kilo meters of a
distance, ok. Before that using a tape it was not possible and so now, happy to have the
total station with us. Then will it going to what are the errors that is repeating the use of
the total station or any EDMI.
EDMI is used for angle measurement as well as distance measurement. The moment we
combine angle and distance measurement together in one station or one equipment we

call it total station, fine. So, then we also looked into the calibration and accuracy of the
EDMI, or only random errors are left there, fine.
(Refer Slide Time: 29:41)
Then we looked into the combined linear and angular measurement. What does it mean?
First we started with the compass survey. In case of compass survey, we measure the
bearing. Bearing is the direction of a line with respect to the north and north is indicated
by a magnetic needle.
Well so, then we realize that what is the fore bearing and back bearing concept. Then we
said that there are possible errors are local attraction, and magnetic declination which
influences the performance of a magnetic compass. Then we say how to adjust the errors
using a close polygon concept for the compass survey. Well, further we try to see
traversing where we have done linear and angular measurements.
In the linear and angular measurement, we have learned how to use open and closed
traverses, in order to find out the coordinate X and Y of a point. That is the way we have
developed the control station network. In the control station network, we have
determined the coordinate X and Y using close traverses using traversing technique.
Then using Bowditch and transit rules we have adjusted those traverses. We have find
out the errors, and then in the whole game we have learned few terms like latitudes and
departure, which are nothing but the change in the X coordinate change in the Y

coordinate in a orthogonal system. But it is this system is 2 dimensional system right.
Then we have done the combined linear angular and bearing measurement so, what was
the purpose of that ok.
So, let us say I have 5 groups working in my laboratory. And these 5 groups are of
students each group has fixed number of students. So, let us say 7 group 7 students in
one group so, total 35 students of one laboratory batch. And they have been doing a work
where I have assigned them one area to map, ok.
They have the total station tape chain everything and varying compass. And they have
angular measurement device; say total station and the compass or the simple one. Now
they have developed their maps using latitude departure and close towers and so on. Now
I want to compare their maps, how can I compare them? First of all, they have one thing
that is a false easting and false northing, if you remember it carefully. So, if they have
different different false easting and false northing I have different different origin, and
different different coordinate values of their same control stations. So, what do I do? In
order to develop the correct orientation or the uniform orientation I gave them device
called a compass.
Now they have measured the bearings of one line all the lines using compass. So now,
using the compass they have whatever values they have measured. They are using it in
traversing and they are calculating latitude and departure. Now if they give each and
every group give, the same latitude same value of false easting and false northing, I
should think, and I can confidently say you they should develop the same map. Where
there each and every control station, if they are same the control stations are same for all
5 groups, but the coordinates should also be the same or within plus minus some
accuracy
So, this is the way I am evaluating the performance of each and every group. Now I am
also doing some kind of redundant observations for evaluation well. So, that was a idea
of the combined linear angular and bearing measurement.
(Refer Slide Time: 33:11)

Further now I want to extent the concepts for the large area. So, I use a technique called
triangulation, where I can measure the angle between all the lines. So, first I develop a
network of triangles between the selected control points, ok. Then I prefer the angle
measurement over distance measurement. And using sin rule I can extend the major
distance to measure the distances of or determine the distances of other side of the
triangles, ok.
So, then we have find out what is the order of triangulation and the strength of the figure
ok. So, let us see there are some care also; that means, my triangle should be well
conditioned; that means the angle should be within 30 degree to 120 degree, interior
angles of each triangle, each angle of each triangle. Then we say that will measure these
lines. So, let us look this thing graphically here.
(Refer Slide Time: 34:03)

Let us say these are the control points that you have decided for your triangulation.
So now these are this is the network of triangle, and let us say these are 3 angles of
triangle that I want to measure so, I will measure all this angles. And now I will measure
one distance, and what we call this line so, let us take this base line. Remember, it is the
base line which is shown here in the figure not necessarily a correct base line. They are
just a graphical depiction of that triangulation concept.
Well, that was the idea to do the triangulation and this distances between the control
points could be in order of some kilometers may be 2 kilometers, 3 kilometers, 5
kilometers and so on. So, we have this kind of surveys are developed for the whole
country earlier.
(Refer Slide Time: 34:50)

Now, it is another concept called trilateration; where I measure the distances only, ok. So,
with the same number of control points with the same location of control points on the
field I am performing trilateration. So, this is my network of triangle, and here I have
measured all the distances in the each triangular mesh here. So, for the each triangle all
the edges have measured so, that is the concept of trilateration.
(Refer Slide Time: 35:16)
Ok now, after establishing my triangulation and trilateration or the planimetric control, I
realize let us do some kind of survey for some features like buildings or may be some
other features, ok. So, let us say there are 3 points A, B and C and now I want to measure
this building, or I want to map this building on a planimetric map. But we realize that it

is not possible, because in between this control point in the building there is a treble
market. Or there is a terrible traffic is there and for the whole lay I can reduce any
instruments. So, what is the remedy here? But we realize so, what is the remedy here ok,
we have detected one point in the field which is like this green point, from this point my
control stations are visible, as well as this building is also visible or I can have a control
over both.
So, then we say that there could be 2 ways to find out coordinate of this point which is
my unknown point. And once we find out the coordinates of this point, I will do the
survey of building. So how to find out this point, coordinate of this point? There are 2
techniques. One is called resection, and another is called intersection. In case of resection
what do we do? We measure this 3 control points from this unknown point; that means, I
am going to measure distances and I am going to measure angles. And I will find out the
x y coordinate of my point which is unknown control point, and then I will do survey of
my building.
(Refer Slide Time: 36:54)
There is another technique called intersection. In intersection, situation is same, but I
have a point A and B as control points. There is a building, now let us say this is the
control point that I need to establish in the field so, that I can do the survey for my
building, ok. Then what will I do? In case of resection we have measured we have taken
some measurement from this point. However, in intersection you will do the

measurements from control points. To this unknown point; that means, we will keep the
instruments here and here, and we will do our measurements, fine.
So, we will also do the measurement between the points and will measure this distances;
this distances, this distances and this 2 angle. And there I will determine the x and y
coordinate of unknown control point before we start the survey of the building. So, that
was the intersection technique. So, using the information I will now collect the
information about the building.
(Refer Slide Time: 37:54)
Well after doing all this 2D survey, I have completed my planimetric survey, then we
have shifted to the third dimension, that is the vertical dimension that I want to measure
using leveling and controlling. So, in the leveling what we have defined one is reference
surface. And with respect to this reference surface what we call datum, I want to measure
the coordinates or the vertical heights, I should not say coordinates, I should say the term
vertical heights.
With respect to the reference surface or datum and in order to do that what we have done
we have first find out a point for which I already know the elevation and we call it
benchmark when such elevation point is not available, or the point of non-elevation is
not available, what you call as benchmark, we say it some relative value; that means, let
say 100 meter assume it because we are interested in the relative levels of the points with
respect to some equipotential surface.

So, even giving an arbitrary elevation point to a benchmark is also ok. Well, then we
thought that there is some equipotential surface passing through the benchmark and we
are measuring the distances with that arbitrary surface, which is equipotential in nature.
And in fact, that is a good assumption for a small area. Now we have said the height
which you measured orthometric height, ok. And then we used the term called reviews
level, and we have determined this orthometric heights and reviews level are along the
plumb line or the gravity direction, ok.
Then this is an example is shown here where the instrument is like on the point P and
then we have a benchmark which has tough reading of one meter and other points A B
and C have different different staff readings. So, using the reading at benchmark I can
find out what are the vertical level of point A B and C with respect to an equipotential
surface. So, that was the idea about leveling and contouring.
(Refer Slide Time: 39:52)
Later we see contouring, but before that we have put the corrections for curvature and
reflection. That is applicable for a large distance. And then we also learned the concept of
balancing fore sight and back sight; that means, if I have back sight and fore sight in case
of leveling exercise, I should have a same distance from the instrument to the staff for
fore sight as well as back sight. That will avoid all the possible errors if at all some errors
are still present in the instrument.
Well, then we understand what are the sensitivity of bubble tube; that means, how bubble
tube will behave or if my vertical axis. The plumb line of the instrument is slightly tilted,
and what will be its effect on this staff reading. And that we call somehow we framed a
concept called sensitivity of the bubble tube of instrument we characterized by that.
Later we have learnt 2 methods called height of instrument method rise and fall method
for leveling exercise. Then we have also learnt them different type of leveling in a given
different different situations like reciprocal leveling, fly levelling, precise levelling
etcetera.
Then we have developed concept of close network or the closed net. In the closed net
concept, we start our survey from one point that is my let say benchmark. And an again
we close at the same point, and again we say that they should be the difference of vertical
heights between the same points should be equal to 0. I am using that if I get some error I
will distribute this error in the vertical height to all the points which I have measured on
the closed net. And that is what we call the adjustment of the closed net. Then so, once
we have determined all the vertical heights of all the possible points or all the point of
interest on the field, then we say that how to represent that data on the topo sheet, that is
a map.
So because the topographic information consist of 3D information; X Y we have already
got from the planimetric survey. The third dimension we got from the levelling exercise,
now in order to represent the values of the elevation points at which could be a unknown
point on a topo sheet. We have device a technique called contouring where we connect
the points of same elevation by align. So, we realize that these are the close lines. Then
we see that on the topo sheet we have deviced method called contouring, but now in the
digital era today we are using lot of detail computers. I should be able to depict the same
map in the computers also. And for that reason we have developed a concept called
digital elevation model.
And the digital elevation model, what we do? I will take a topo sheet or the 3D
information directly from the field. And try to plot this information X Y and Z in terms
of n model. So, we can understand that my DEM consist of some boxes having different
different heights ok. So, there are 2 ways to represent this thing one is DEM and one is
contouring is for the hard copy maps digital elevation model for soft copy maps. So, we

have seen lot of applications of the contour including inter visibility between the 2 points
across a terrain.
(Refer Slide Time: 43:06)
Later, after that we have realized that, this is a kind of local survey we have done using
levelling and using planimetric survey. So, let us go for the global survey we can where I
can co relate the 2 points which I acquired in the field using a unique way of survey. So,
we have learnt global positioning system GPS. So, the basic concepts about the
coordinate system for the earth; where we are learned about ECEF earth centered earth
fixed coordinate system, latitude, longitude, local geodetic horizon, and so on
Then we have what is the geodetic coordinate system; that is, as I said longitude latitude
and ellipsoidal height, where I understand what is the difference between a ellipsoidal
height and orthometric height. Orthometric heights are measured with respect to the
plumb line or in the direction of plumb line, but ellipsoidal heights are measured in the
direction of perpendicular to the ellipsoidal, ok.
So, then we have converted the geodetic coordinate system into Cartesian coordinate
system capital X Y Z ECEF. Again then we also learned what is the geocentric what is
the non-geocentric ellipsoid and topocentric reference frame or ellipsoid. I am sorry,
there is no topocentric ellipsoid rather topocentric reference system. So, we discussed all
this things in the GPS.

(Refer Slide Time: 44:30)
Later we have also learnt; what is the satellite receiver communication, what is the
pseudo random code, satellite constellations.
Because NAVSTAR is the first one satellite constellation, that started the GPS facility.
Then we also understand what is almanac and ephemeris. So, what are the GPS signals;
which are frequency based, and code based, code acquisition code, t code L 1, L 2
frequencies, and navigation message, and how do we modulate them and how do we
send this to the user and how user depict or user receiver decode information to get his
own value of the coordinates, where he is standing with GPS device.
We learn all this things, then we also learned what are the GPS segment. Space based
segment, control segment and the user segment. Further, we tried to see what are the
advantages and limitations of GPS. Then we finally, saw that what is error budget and
what is the kind of limitation or what is the kind of accuracy is should expect from the
GPS. We also learnt concept of DGPS; Differential Global Positioning System, where we
can find out the base lines or that different length of align or the coordinates with
millimeter level accuracy.
Further, we saw various applications of GPS. Most famous application was that how to
measure the plate movement on the surface of earth. That is not possible with the help of
total stretch and, but it is possible with the help of GPS.

(Refer Slide Time: 45:59)
Well additional topics are also there, like map projection for survey of India. And then
other applications where we use whatever concept we learned so far up to GPS for
planning and education, road curves and building projects. So, this was the total thing we
have learnt in the basic surveying course and that was kind of review.
Now, let us come back again to the forest study.
(Refer Slide Time: 46:26)
In this forest study, we want to know many things like, what is the height of the tree,
diameter of the tree, canopy size, volume of the canopy, mass of the canopy, vegetation
mass and so on, ok. One more thing I would like to highlight here that in 2016
considering the climate change at very rapid rate, United Nations as declared that each
and every country on this planet has to increase their forest area by 5 percent, in year
2030. So, by 2030 we should have increased our area of forest in India by 5 percent and
it is applicable to all the countries in the world right, ok.
So, first question is what is the area of forest in my country right. This is very surprising
query, and I want to respond to that. Try to use basic surveying, can you do it? Ok so,
what is the carbon storage, or I can say what is the; I can say ok, vegetation mass let say
for example, ok. So, what are the type of trees are available in those forest? Deciduous,
conifer and many many species are there, ok. Then again heights and diameter are
important one.
So, what about tree forests are they having only the forest or they having some open
grounds, some rivers, some kind of barren land also, some kind of non-vegetated land
also? I want to verify all these thing. Can I do it with the basic surveying? No the
concept what you have learned and this is the way we are trying to understand not only
the limitations. But our upcoming requirements or our you know high requirements, and
that is why we are going for high surveying or advanced surveying course.
So, let us further develop what is an appropriate context and you can decide when to use
the higher surveying.
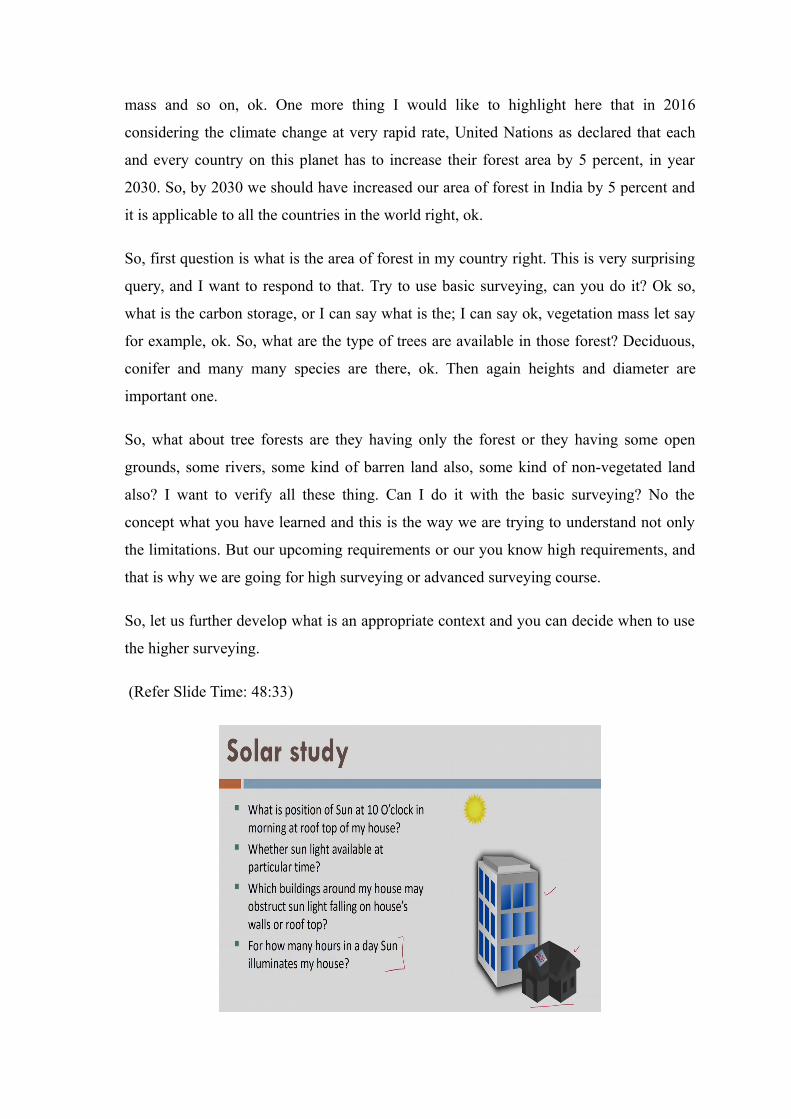
(Refer Slide Time: 48:33)

The next study is my solar study; that is, what is the position of sun, ok. In case of solar
study let us say this is my home, and this is a high rise building around that. I want to
generate the solar energy on my roof top, like this, I have placed one solar panel, and I
want to develop solar energy, ok. The question is what is the position of sun around 10 O
clock? Because I believe that from morning 8 O clock to let say evening 10 O clock, sun
should generate energy for me, or rather I should be able to utilize the sun energy to
generate electricity so that I can you know reduce the electricity which is generated by
other source. For example, thermal energy and may be other energies coal energy and
petrol energy and so on, right.
So, the idea here is whether my building which is here or the bungalow will receive the
solar energy or not. Because it is near to the high rise building, right and sun light will be
available or not ao, sunlight is available what will be the intensity. Will it be direct or it
will be diffused? We do not know right now. So, with basic surveying it is difficult to
answer. For how many hours sun is available to illuminate a particular panel at my roof
top? All these are relevant questions in coming days.
Now, let us go for the town planning.
(Refer Slide Time: 50:07)
In case of an existing town, a town planning generally extend the town in certain area,
ok. Let us say they have decided to extend the town in X direction, but are we able to
provide some kind of amenities there easily? For example, road, sanitation, schools,

drinking water, electricity, highways and any other basic communities we can think of
right, ok. So, all these are very, very relevant questions, fine. So, in such a case what
should we do? Can we respond to these questions using basic surveying concepts only or
we should do something extra now, right.
(Refer Slide Time: 50:58)
Ok, Let us go for the military intelligence. Military want to develop or they want to
establish another check post or may be another base station, which ever place they like to
develop can they reach that easily, what is the shortest pass to reach there is there,
already a road available nearby or this area is so aloaf so, that they have to develop the
road there, to reach there? So, all these questions we should be able to answer now.
Because area is very big, and I need to provide many many facilities I need to provide a
complete map of high accuracy, as well as large area is there right. Try to think that how
can we do it using may be whatever instrument you like GPS or total station or whatever.
(Refer Slide Time: 51:49)
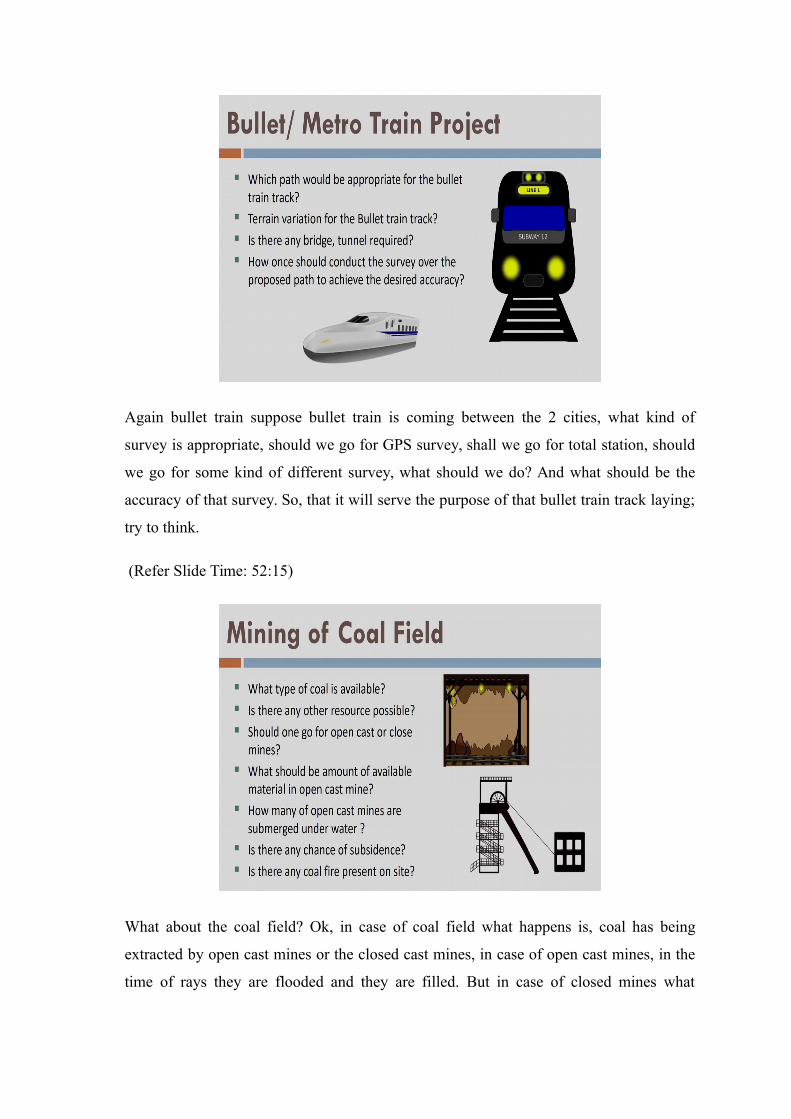
Again bullet train suppose bullet train is coming between the 2 cities, what kind of
survey is appropriate, should we go for GPS survey, shall we go for total station, should
we go for some kind of different survey, what should we do? And what should be the
accuracy of that survey. So, that it will serve the purpose of that bullet train track laying;
try to think.
(Refer Slide Time: 52:15)
What about the coal field? Ok, in case of coal field what happens is, coal has being
extracted by open cast mines or the closed cast mines, in case of open cast mines, in the
time of rays they are flooded and they are filled. But in case of closed mines what

happens is, it is kind of subsidence is possible there inside the mine, and there is always
danger to the life of person who is working inside the mines.
So, for that reason, we need to understand first thing that how can we deal with such
problems, using basic surveying or may be higher surveying. Apart from that we should
also be able to tell what is the estimated amount of the coal per day or per month
whatever right. And that has been sold out or that has been loaded away from the mines.
We should be able to respond to this things, right.
(Refer Slide Time: 53:10)
Now, glaciers, glaciers are very, very important. It is a sea that all the water available in
our perennial river, like Ganga, Yamuna or any river like Brahmaputra, they are just
because of the Himalayan glaciers. But because of the climate change, glaciers have been
retreating every year at very fast rate now. And as a result climatologist say that, there is
a threat to the earth and the existence of the human life. And what will be the problems?
Problems will be because if ice is melting, it will lead to more water, the sea level will
raise, and it will submerge everything on the coast. And gradually it will reach to the
other parts of the land. And that is somehow problem they expect to come. And that is a
reason they say that we should not raise the temperature of the earth.
Suppose temperature still raising. So, what is the flow, or what is the melt away of the
water from the glacier. Can we calculate, how to calculate for a such a large areas of
glacier in all in Himalaya, san we use basic surveying there also or not or do we need

something better than that, think again. Now similarly we have other studies also like
dam surface monitoring, which means that under the set of hydrostatic pressure how then
surface is be forming.
(Refer Slide Time: 54:36)
I want to measure that, and I want to avoid any type of caramaterial; that means, my dam
should not fail at any cost.
Similarly, what about the landslides? Is land slide is occurring due to some natural
reason, or it is occurring due to some kind of manmade reason. In case of manmade
reasons, it is effect will be smaller; however, in case of natural region let us say the
earthquake itself, an earthquake is triggering the landslide. So, what will be the fact data
and what will be the extent of the land slide? Fine using basic surveying it is very, very
difficult to respond, to understand first of all phenomenon itself, ok. Then let us say at
place; then there are some studies are also possible related to high rise structures.
Further, what is this mobile signal strength ok.
You might have observed even in a crowded city, big cities like metro cities, at some
places signals are not available, mobile signals are not available. And you might have
cursed many of the service providers there, right. You might have thought of many many
good ideas there, but the idea is in the presence of some structures in the metro cities,
how to map this mobile signals strength.

So, that if required, we can put some boosters that will boost the mobile signals if
required right; that means, I need to do some kind of 3D mapping there of the buildings
of the structures so that I can find out that under given circumstances, if there is a
transponder that is sending some kind of power, how much power is reaching to each and
every point. Whether this power is minimum one to detect the signal.
So, that is all about the mobile strength mapping, and similarly sound propagation. You
might be coming across some situations where you need to propagate the sound. A
simple example is the class room. In some cases, when class rooms acoustics are not
good, what may happen students are not able to listen the voice of the teacher properly.
Similarly, situation could be in auditorium where a singer is singing a song, but it is not
reaching properly to the audiences, right. In that case we should understand what is the
effect of my 3D structures or 3D data or the overall structure around this audience or
overall structure of the auditorium right?
So, that is what we call the sound propagation study, ok. In nut shell so far I hope that
you might have understood by this time that we need a 3D topographic data for large
area with considerably high accuracy. Whether it is a bullet train survey, whether it is a
army, or whether it is a forest or whether it is dam surface or whatever. Not only that if
any additional information is there for example, photograph; it will help me further. Not
only that, we have one more requirement that this data which is massive in nature should
we acquired in minimum time.
So, I hope that now we are trying to understand, what is the context what is an
appropriate context for this course. Now let us once again review what are the
instruments we have used so far.
(Refer Slide Time: 58:20)

And we have realized that it has some limitations, ok. And most of the instruments are
optical except GPS, further we can observe only one-point data at a time. So now, using
total station or GPS or whatever, what you have to do? You have to reach the point
access, the point there in the field. And then you will try to observe that point. And even
if after that you have observed only one point at a time.
So, understand that you want to do some kind of forest survey; where you want to
measure the 3 diameter for each. And every tree and the per kilometer square. Let us say
there are 50 trees which is very conservative number, which is less number. But still if
this number is there; that means, if there is area of 1600 kilometer square. You cannot
measure the tree diameter for each and every tree. And there you need to have some kind
of understanding that we need something better, something more advanced, something
on a higher level or a higher scale. And that is what we say that we are developing the
appropriate context for the higher surveying, right.
And then accuracies are also lower, if I use some kind of gross methods like plane
tabling. Although, I can use total station I will have higher accuracy, but accuracy comes
at some cost. And if I justify the cost per point I cannot justify the cost with the classical
survey, right. So, the basically if areas are very large I need real accurate data, I need
massive data in minimum time. Then we need to develop some more understanding and
some more concepts, some more instruments some more technology so that we can
address the needs of those projects, well.

Now, I hope that I have developed a complete context for the course of higher surveying.
So, if you are a registered student, you might be thinking that what can you obtain from
this course, what will be your learning from this course, right. And there now I would
like to disclose so, what is the course content.
(Refer Slide Time: 60:40)
And the course content here is we have total 10 modules, first module is today’s lecture
and that is introduction to higher surveying. Further, we have coordinate system and
reference frame, then we have astronomy and time then we will be talking about
adjustments computations, then we talk about GPS photogrammetry, LiDAR,
RADARgrammetry, Bathymetry or Hydrographic Survey. And then we will finally,
cover last survey navigation. So, there are total we have listed here 35 lectures. And then
we will conclude all these thing in last one lecture. So, total it is a 36 lecture course of 12
weeks.
I hope this information is vey very useful to you, if you are trying to register or if you are
planning to register for this course. Or you might have registered for this course, right
and what about the books. Well, first of all I would like to say that books will be
changing according to the module.
So, each module we will be recommending different book because the module itself will
be different. And there will become completely different from the another module. So,
there is as such there is no text book for that so, you can refer these videos again and

again if you want. However, we will still recommend you some books one can refer for
more knowledge. If someone wants deeper knowledge, once you refer the book, ok.
What about the some other material? I think that lecture itself will be good enough for
the any reference.
So, this is about books on this thing. One more thing I would like to specify very clearly
that books are very, very expensive. And that is the reason we ask you rather I request
you or urge you to go to some library. Some public library or may be some institute
library, and try to find these books there. Refer those books there prepare your notes if
you want better knowledge.
Or more knowledge or enhanced knowledge, whatever right. And that is somehow the
reason I am not specifying the books right now with this thing. At final thing these are
my 3 students Miss Dhrithilekha Deka, U Chandrasekhar and Apurba Das.
(Refer Slide Time: 63:05)
And they have been helping me in the course development. Also, if you are registered
student and if you raise some question, one of them will be responding to you.
So, that is a reason I would like to thank them before we start this course. Well, with this
I would like to say you once again the welcome in the course of higher surveying. And
we will start the module 2 in the next lecture, till then bye.
Thank you very much.