Nutrient gradients from the eutrophic Changjiang (Yangtze River) Estuary to the oligotrophic...
30
Nutrient gradients from the eutrophic Changjiang (Yangtze River) Estuary to the oligotrophic Kuroshio waters and re-evaluation of budgets for the East China Sea Shelf J. Zhang a,b, * , S.M. Liu b , J.L. Ren b , Y. Wu a , G.L. Zhang b a State Key Laboratory of Estuarine and Coastal Research, East China Normal University, 3663 Zhongshan Road North, Shanghai 200062, PR China b College of Chemistry and Chemical Engineering, Ocean University of China, 238 Songling Road, Qingdao 266100, PR China Received 27 July 2006; received in revised form 10 April 2007; accepted 15 April 2007 Available online 5 May 2007 Abstract Eutrophication has become an overwhelming phenomenon in the coastal environment off the Changjiang (Yangtze River) Estuary, illustrated by an increase in nutrient concentration, frequent red-tide events and hypoxia in near-bottom waters, while the open East China Sea Shelf and Kuroshio waters remain oligotrophic. Observations made in the Chang- jiang Estuary and the East China Sea in 1999–2003 cover a broad range of hydrographic and chemical properties. The concentration gradients of nutrients across the shelf indicate that high levels from land-sources are constrained to the coastal and inner-shelf region by the complex circulation regime. In surface waters, nutrient species gradually decrease from eutrophic coastal to oligotrophic open shelf waters, depending on the hydrographic stages of the Changjiang, although biological uptake and regeneration in the upper water column can produce patchy character of nutrient distri- bution. Taiwan Current Warm Water and Kuroshio Surface Water are devoid of nutrients. Remineralization of nutrient species takes place in the near-bottom waters in the inner-shelf following extensive bacterial demand for organic matter. Hence the burial efficiency is low with regard to the biogenic species, either allochthonous or autochthonous, or both. The Kuroshio Sub-surface Waters are rich in nutrients, and their incursion into the East China Sea can be tracked by salinity and temperature, reaching within water depth of 50–100 m at mid-shelf. Relative to shelf waters, the Kuroshio intrusion is characterized by high NO 3 =ðNH þ 4 þ DONÞ and DIP/DOP ratios. In the water column, the ratio of DIP/DOP to NO 3 =ðNH þ 4 þ DONÞ is higher than the Redfield P/N value, suggesting rapid regeneration of phosphorus relative to nitro- gen in the East China Sea. The results of a box-model suggest that the East China Sea Shelf do likely not export substantial amounts of dissolved biogenic elements to the open Northwest Pacific Ocean. Ó 2007 Elsevier Ltd. All rights reserved. Keywords: Nutrients distribution; Changjiang Estuary; East China Sea Shelf; Kuroshio; Box-model; Budget 0079-6611/$ - see front matter Ó 2007 Elsevier Ltd. All rights reserved. doi:10.1016/j.pocean.2007.04.019 * Corresponding author. Address: State Key Laboratory of Estuarine and Coastal Research, East China Normal University, 3663 Zhongshan Road North, Shanghai 200062, PR China. Tel.: +86 21 62233009/532 66782005; fax: +86 21 62546441/532 66781810. E-mail addresses: [email protected], [email protected] (J. Zhang). Progress in Oceanography 74 (2007) 449–478 Progress in Oceanography www.elsevier.com/locate/pocean
-
Upload
independent -
Category
Documents
-
view
0 -
download
0
Transcript of Nutrient gradients from the eutrophic Changjiang (Yangtze River) Estuary to the oligotrophic...

Progress in Oceanography 74 (2007) 449–478
Progress inOceanography
www.elsevier.com/locate/pocean
Nutrient gradients from the eutrophic Changjiang(Yangtze River) Estuary to the oligotrophic Kuroshio
waters and re-evaluation of budgets for the East China Sea Shelf
J. Zhang a,b,*, S.M. Liu b, J.L. Ren b, Y. Wu a, G.L. Zhang b
a State Key Laboratory of Estuarine and Coastal Research, East China Normal University, 3663 Zhongshan Road North,
Shanghai 200062, PR Chinab College of Chemistry and Chemical Engineering, Ocean University of China, 238 Songling Road, Qingdao 266100, PR China
Received 27 July 2006; received in revised form 10 April 2007; accepted 15 April 2007Available online 5 May 2007
Abstract
Eutrophication has become an overwhelming phenomenon in the coastal environment off the Changjiang (YangtzeRiver) Estuary, illustrated by an increase in nutrient concentration, frequent red-tide events and hypoxia in near-bottomwaters, while the open East China Sea Shelf and Kuroshio waters remain oligotrophic. Observations made in the Chang-jiang Estuary and the East China Sea in 1999–2003 cover a broad range of hydrographic and chemical properties. Theconcentration gradients of nutrients across the shelf indicate that high levels from land-sources are constrained to thecoastal and inner-shelf region by the complex circulation regime. In surface waters, nutrient species gradually decreasefrom eutrophic coastal to oligotrophic open shelf waters, depending on the hydrographic stages of the Changjiang,although biological uptake and regeneration in the upper water column can produce patchy character of nutrient distri-bution. Taiwan Current Warm Water and Kuroshio Surface Water are devoid of nutrients. Remineralization of nutrientspecies takes place in the near-bottom waters in the inner-shelf following extensive bacterial demand for organic matter.Hence the burial efficiency is low with regard to the biogenic species, either allochthonous or autochthonous, or both. TheKuroshio Sub-surface Waters are rich in nutrients, and their incursion into the East China Sea can be tracked by salinityand temperature, reaching within water depth of 50–100 m at mid-shelf. Relative to shelf waters, the Kuroshio intrusion ischaracterized by high NO�3 =ðNHþ4 þDONÞ and DIP/DOP ratios. In the water column, the ratio of DIP/DOP toNO�3 =ðNHþ4 þDONÞ is higher than the Redfield P/N value, suggesting rapid regeneration of phosphorus relative to nitro-gen in the East China Sea. The results of a box-model suggest that the East China Sea Shelf do likely not export substantialamounts of dissolved biogenic elements to the open Northwest Pacific Ocean.� 2007 Elsevier Ltd. All rights reserved.
Keywords: Nutrients distribution; Changjiang Estuary; East China Sea Shelf; Kuroshio; Box-model; Budget
0079-6611/$ - see front matter � 2007 Elsevier Ltd. All rights reserved.
doi:10.1016/j.pocean.2007.04.019
* Corresponding author. Address: State Key Laboratory of Estuarine and Coastal Research, East China Normal University, 3663Zhongshan Road North, Shanghai 200062, PR China. Tel.: +86 21 62233009/532 66782005; fax: +86 21 62546441/532 66781810.
E-mail addresses: [email protected], [email protected] (J. Zhang).

450 J. Zhang et al. / Progress in Oceanography 74 (2007) 449–478
1. Introduction
Eutrophication has become a serious problem of coastal environments world-wide, and hence hasreceived increased societal attention and has been subject to extensive scientific research. Further off-shore,most of open shelf waters remain oligotrophic and the production of the food web depends strongly on theextraneous supply of nutrients, e.g., from atmospheric and oceanic sources. While processes that regulatethe food production in marine ecosystems can be diverse, including both natural and anthropogenic factors,eutrophication is believed to have a negative impact on the biogeochemistry and food–web interactions inthe coastal ocean. Eutrophication has increased globally following changes in land-use in many drainagebasins and the discharge of excess nutrients into marine waters (cf. Zhang et al., 1999b; Seitzinger et al.,2002).
Water quality of some coastal environments in Europe and North America has improved over the lastfew decades, following restrictive regulation of wastewater, industrial and point-source effluents, protectionof marine habitats, and increased awareness by the public (Nolting et al., 1999; Behrendt et al., 2002). Phy-toplankton of coastal ecosystems may be primarily limited by nitrogen, but phosphorus may also be limitedat some locations and seasons especially under high flow conditions from adjoining watersheds (Turneret al., 2002). The ecosystems in the coastal waters of Europe and North America may have a strong signa-ture of nitrogen limitation with photosynthesis showing a strong response to land-source inputs (Andersonet al., 2002). In the case of the Gulf of Mexico, for example, the nutrient loading (e.g., nitrogen) from theMississippi River promotes blooming of photosynthetic species in coastal waters, followed by the develop-ment of hypoxia (i.e., dissolved oxygen <2 mg l�1) of ca. 20 · 103 km2 (Rabalais et al., 2002; Scavia et al.,2003). Rabalais et al. (2002) show phosphorus limitation at high flow of the Mississippi River near thedelta; nitrogen mostly limiting in summer; and silica being limiting at various seasons and locations onthe continental shelf.
The land-source input of the East and South Asian Rim is characterized by high nutrient concentrationsand elevated N/P ratios, owing most likely to extensive agricultural activities over the watersheds (Talaue-McManus et al., 2001; Hong et al., 2002). Recent technological innovation, economic growth and populationincrease in Asia place the adjacent coastal waters under strong stress of anthropogenic perturbation (e.g.,over-fishing and pollution), which is imposed on the already stressed marine ecosystems affected by climatechange. This greatly modifies the function of coastal environments in the context of global biogeochemicalcycles, as they interact closely and in complex ways with the continents, atmosphere and the open ocean (Rab-ouille et al., 2001). For instance, depletion of dissolved oxygen (DO) has been discovered in the coastal near-bottom waters in Southeast Asia, including the Mekong Delta (DO: 2–3 mg l�1) and the Pearl River Estuary(DO: 1–2 mg l�1) (Lin et al., 1998). Similar hypoxia has been reported recently in the region off the ChangjiangEstuary, with DO of 1–2 mg l�1 over an area of 15 · 103 km2 in near-bottom waters, but its impact on themarine ecosystem is poorly understood (Li et al., 2002).
In this study, we examine nutrient concentrations across the East China Sea, from the eutrophicChangjiang Estuary to the oligotrophic Kuroshio Waters. Field observations in 1999–2003 provide exten-sive data sets of nutrient forms. Historical data are used to make inter-annual comparisons of the nutrientregime. It is expected that the nutrient discharges of the Changjiang Estuary under increasing anthropo-genic perturbation over the drainage basin may result in coastal eutrophication and its associated symp-toms as seen in similar coastal areas receiving excess nutrients. In addition, the incursion of the Kuroshioacross the shelf-break is hypothesized to regulate the water exchange and nutrient replenishment of theEast China Sea. Enhanced observational data are used to re-evaluate the nutrient budgets for the broadshelf region.
2. Study area and geographic setting
The Changjiang (Yangtze River) empties into the East China Sea (ECS) near 32�N latitude. The fresh waterdischarge and total suspended matter (TSM) burden of the Changjiang account for 90–95% of the total riv-erine input to the East China Sea. Over the last 50–60 years, the maximal water flow was recorded in 1954,with a value of 1.5 · 1012 m3 yr�1, while the minimal discharge of 676.0 · 109 m3 yr�1 occurred in 1978. In this

J. Zhang et al. / Progress in Oceanography 74 (2007) 449–478 451
period, the TSM load ranged from 0.24 · 109 tons yr�1 in 1994 to 0.68 · 109 tons yr�1 in 1964, varying by3-fold (cf. Changjiang Water Conservancy, 2000). More recently, the sediment load of the Changjiang hasdropped to 0.35 · 109 tons yr�1 in the 1990s, decreasing by 30–40% relative to the 1960s–1970s (Yanget al., 2002).
Over the East China Sea, the buoyant plume from the Changjiang disperses over an area up to ca.85 · 103 km2. In summer, when the Changjiang is in flood, the plume spreads eastwards over the broad EastChina Sea, reaching as far as Cheju Island and the shelf-break. In winter, the broad shelf region is domi-nated by high salinity water from the Taiwan Current Warm Water, which is mainly an incursion from theKuroshio east of Taiwan. In the low discharge season (i.e., winter), the northerly monsoon prevails over theECS, and the Changjiang effluents are then restricted to the western side of the East China Sea and movesouthward forming a narrow but turbid belt along the coast of China and reach the Taiwan Strait (cf. Su,1998).
Off the shelf break, the Kuroshio flows northward transporting ca. 25–30 Sv (Fig. 1). Extensive waterexchange between the ECS and Kuroshio occurs across the shelf break through upwelling and frontal pro-cesses (Su, 1998). The Taiwan Current Warm Water is composed of waters flowing north through TaiwanStrait and of waters from the Kuroshio intruding over the East China Sea Shelf from the area north of Taiwan(Fig. 1). The incursion of the Kuroshio sustains upwelling conditions, enhanced by the summer southerlywinds. In the broad shelf region, the patchy distribution of hydrographic properties relates to distinctivesource water masses (cf. Su, 1998).
3. Materials and methods
3.1. Field observation and sample collection
The data were obtained on 12 cruises during 1999–2003 in four areas, the Changjiang Estuary, coastalregion, East China Sea Shelf and Okinawa Trough. The water depths of 5–10 to 2000 m and associatedresearch programs with different logistical requirements resulted in several observational techniques.
In July 2001 and February 2002, field measurements in the Changjiang Estuary started from the lowerreaches of the river and crossed the coastal region to sites with salinity of ca. 30 psu (Fig. 2). An anchor stationwas set in the upper estuary (salinity: �0) where ADCP, OBS (OBS-3A: Optical Backscatter Sensor fromD&A Instrument Company, USA, to measure depth, conductivity, temperature and turbidity), CTD andYSI (YSI 6000: Multi-Parameter Water Quality Sonde from YSI Incorporated, USA, to measure depth, con-ductivity, temperature, pH, dissolved oxygen, turbidity and chlorophyll-a) profiles were taken over 26 h forboth spring and neap tides. In the coastal area, a mooring station was maintained for 15 days for ADCP,OBS, CTD and YSI measurements and a tripod with ADCP and temperature–salinity assembly nearby. Dur-ing this period, CTD, OBS and YSI profiles were measured at 45 grid stations in the estuary. Water samplesfor total suspended matter (TSM) and chemical parameters were taken with 10-l Niskin bottles, at discretedepths determined from the CTD profile and at selected sites in the horizontal gradients of salinity alongthe estuary. Bottom sediments were collected with a Van-Veen type Grab.
In the coastal environment, five cruises covered the Changjiang Delta eastward in the region of 29.0–32.5�Nout to 123.5–124.0�E from April 2002 to May 2003 (Fig. 2). Profiles by CTD and YSI were made for 30–40grid stations on each cruise; discrete water samples were taken by 10-l Niskin bottles from various depths cho-sen from CTD readings. Sediment core samples (diameter B = 110 mm) with undisturbed overlying waterwere taken with a Soutar-type box sampler and a multi-corer.
Over the broader East China Sea, five cruises were carried out between August 1999 and September 2003at 40–50 grid stations over depths of 15–20 m to the Okinawa Trough (Fig. 2), and included anchor stationsin the coastal area (E4 at 20–25 m) and at mid-shelf (E6 at 85–90 m) for over 25 h. Profiles of temperature,salinity, dissolved oxygen, turbidity, and in vivo fluorescence were made by Sea-Bird 911plus CTD Rosette.Water samples were collected by 10-l Niskin rosette bottles attached to the CTD. Bottom sediments weretaken by a Van-Veen type Grab, sediment cores were collected by Benthos gravity and piston corers anda Soutar type box sampler, and a multi-corer was used to take cores of undisturbed surface sediments withoverlying water.
5
10
15
20
25
30
Salinity
Tem
per
atu
re (
)
3534333231305 15 24
CDW
TCWW
SMW
KSW
KIW
KSSW
C
Fig. 1. (Upper panel) Location of the East China Sea, with illustrations of circulation regimes, including Yellow Sea Coastal Water(YSCW), Changjiang Diluted Water (CDW), East China Sea Coastal Current (ECSCC), Taiwan Current Warm Water (TCWW), andKuroshio. (Lower panel) A plot of salinity–temperature data for ECS, which include the Changjiang Diluted Water (CDW), TaiwanCurrent Warm Water (TCWW), Shelf Mixed Water (SMW), Kuroshio Surface Water (KSW), Kuroshio Subsurface Water (KSSW), andKuroshio Intermediate Water (KIW).
452 J. Zhang et al. / Progress in Oceanography 74 (2007) 449–478
3.2. Sample preparation and chemical analysis
Water samples for determination of nutrients were filtered through acid-cleaned acetate cellulose filters(pore-size: 0.45 lm). Those for dissolved organic carbon were filtered through pre-cleaned Whatman GF/F

0 9 18km
121 Eo '00 121o '30 122o '00 122o '30
31º '30
31º '00
-10m
0m
-5m
-5m
-5m
N32 00 Nº '
BZ2 BZ3
ZDD3 ZDD5
ZDD9
CY4CY7
XWH3XWH5
XYZ2-1FDD1FDD3
FDD11FDD15ZHER1
XYZ10XYZ9
XYZ8XYZ5
XYZ4XYZ3
WY3WY2
ZJ1 ZJ3CY1
XYZ21XYZ22
XYZ7
XYZ6
XLJ
East China Sea
Chongming Island
HPJ
Shanghai
Jiangsu
a
121° 122° 123°29°
30°
31°
32°DA-2 DA-3 DA-4
DB-5 DB-6 DB-7 DB-8
DC-9 DC-10 DC-11 DC-12
DD-13 DC-14
2D-34
DD-15 DD-16
DE-17 DE-18 DE-19 DE-20
DF-21 DF-22 DF-23 DF-24
DG-25 DG-26 DG-27 DG-28
Changjiang
Hangzhou BayZSI
East China Sea
b
E
N
118º 120˚ 122º 124º 126º 128º 130º26º
28º
30º
32º
34º
36º
QC
CC
A
PN (1999)
PN
B
1-1
1-3
1-5
1-71-8
2-52-4A1
A3A5
A7A9
A11
B4E5
3-7
AS
YT
PN1PN3
PN5PN7
E6P8-1
SS1
AS1
AS3
AS5
Y2 Y4Y6 Y8
China
Korea
Changjiang
N
E
E4P8
Y
4-54-3
4-1
5-7
5-6
5-9
5-2
c.
East China Sea
Yellow Sea
Fig. 2. Map of field observations in this study, including (a) measurements in the Changjiang Estuary in July 2001, (b) sampling transectsin the coastal areas of the East China Sea in August 2002 and February 2003 (ZSI: Zhoushan Islands), and (c) cruises in the period ofAugust 1999 to September 2002 across the East China Sea Shelf.
J. Zhang et al. / Progress in Oceanography 74 (2007) 449–478 453

454 J. Zhang et al. / Progress in Oceanography 74 (2007) 449–478
filters (pore-size: 0.7 lm). The Whatman filters were pre-cleaned by combustion at 450 �C for 12 h. The fil-trates were poisoned by HgCl2, and stored in the dark at 0–4 �C for nutrients and �20 �C for organic carbon,respectively. The filters were stored at �20 �C until analyzed. Duplicate samples were taken to estimate theamount of TSM, for which the salts trapped on the cellulose filters were removed by distilled water. Bottomsediment samples were stored at �20 �C and later freeze-dried in the laboratory. Core sediment samples weresectioned at 1–2 cm intervals in N2 and then freeze-dried.
In the laboratory, nutrients, including NO�3 , NO�2 , NHþ4 , PO3�4 (DIP) and dissolved silicate (SiO2�
3 ) weredetermined photometrically by auto-analyzer (Model: Skalar SANplus) with precision of <5–10%. Seawaterreferences were run with each batch of samples to check the precision of nutrient analysis. Concentrationof dissolved inorganic nitrogen (DIN) is the sum of NO�3 , NO�2 and NHþ4 . The total dissolved nitrogen(TDN) and total dissolved phosphorus (TDP) were measured according to the methods of Grasshoff et al.(1999). The concentrations of dissolved organic nitrogen (DON) and dissolved organic phosphorus (DOP)are estimated by subtraction of DIN from TDN and PO3�
4 from TDP, respectively. The detection limitsand precision of nutrient analysis were reported by Zhang et al. (1999a). Dissolved organic carbon (DOC)was determined by Shimadzu ASI-V TOC Analyzer, with precision of 5%. Particulate organic carbon(POC) and nitrogen (PN) were determined by Elementar Vario EL III CHNOS Analyzer, with precision of<5% (Wu et al., 2003). Chlorophyll-a (Chl-a) was extracted by 90% acetone at 4 �C in darkness for 24 h,and the extractions were measured on a HITACHI-850 Fluorescence Spectrophotometer, with standard devi-ation of 5–10% (Zou et al., 2001). Pico-plankton species, including Synechococcus spp., Prochlococcus spp.,picoeukaryotes and heterotrophic bacteria were counted on board by a FACScan Flow Cytometer (BectonDickinson, San Jose, CA); triplicate measurements were made for each of the samples with precision betterthan 7.2% (Pan, 2005).
The biogenic silica (BSi) in sediment samples was determined using combined alkaline leaching methods ofMortlock and Froelich (1989) and DeMaster (1981) (Liu et al., 2002). The standard deviation for five parallelextractions and measurements was 1.9%. Four sediment samples from inter-laboratory comparisons were ana-lyzed together with bulk sample batches, indicating satisfactory recovery of BSi (cf. Conley, 1998; Liu et al.,2002).
Inorganic phosphorus (IP) in sediment samples was measured photometrically after 1 M HCl extraction for24 h at room temperature. The total phosphorus (TP) in core samples was measured by 1.0 M HCl extractionafter ignition of the sediments at 550 �C for 24 h. Organic phosphorus (OP) was determined by the differencebetween TP and IP (Aspila et al., 1976). Analysis of the Chinese Standards for coastal sediment (GBW 07314)gives TP concentrations of 19.30 ± 0.08 lmol g�1, which compares well with the certified value(20.85 ± 1.97 lmol g�1). The analytical precision for the P extractions is better than 0.07% for IP, 17% forOP and 0.42% for TP, respectively (Liu et al., 2004). Samples were run in duplicate and/or triplicate.
The analysis of hydrographic and chemical data was performed using SPSS (Statistical Package of theSocial Sciences) Software for Windows (SPCC Co., 2001). Determination of nutrients in this study was partof the inter-laboratory comparison with research groups of University of Hamburg and Alfred-Wegener Insti-tute for Polar and Marine Research.
4. Results
4.1. The Changjiang Estuary: July 2001 observations
The riverine end-member for nitrate and dissolved silicate concentrations were similar through the 10–20 mwater column, i.e. surface and near-bottom values were within 5–10% (Table 1). Concentrations of nitrate anddissolved silicate were also comparable between spring and neap tides in the upstream sector of the Changji-ang Estuary. Concentrations of phosphate at the surface were comparable to near-bottom waters, but differ-ences between spring and neap tides can be up to 10–20%. Nitrite and ammonium concentrations werecomparable through the water column, but concentrations of both forms ranged up to 5-fold for springand 10-fold for neap tides, respectively (Table 1).
Tributaries in this region had different nutrient levels relative to the main stream. For instance, in Table 1the Huangpujiang (i.e., HPJ in Fig. 2a), a tributary flowing through Shanghai before discharging into the

Table 1Concentrations (lM) of nutrient species in the Changjiang Estuary comparing with the main stream and its tributary (i.e., Huangpujiang)
Station NO�3 NO�2 NHþ4 PO3�4 SiO2�
3
Panel A: Range of nutrient species (lM) in the fresh water end-member (i.e., XLJ in Fig. 2a) in the Changjiang Estuary and Huangpujiang
(i.e., WSK in Fig. 2a) in July 2001 observations
Xuliujing (XLJ)Spring tide
Surface water 104–114 0.22–0.41 0.75–3.73 0.59–0.71 130–135Near-bottom water 105–113 0.18–0.28 0.70–2.13 0.62–0.78 130–134
Neap tideSurface water 102–111 0.39–3.29 0.19–7.55 0.49–0.73 126–138Near-bottom water 102–111 0.37–2.89 0.23–5.53 0.48–0.74 124–133
Wusongkou (WSK)Surface water 83.6–86.4 5.52–31.1 10.7–57.0 0.95–4.85 147–149Near-bottom water 82.5–89.0 4.69–30.8 4.80–62.1 0.79–4.79 147–149
Water source NO�3 NO�2 NHþ4 PO3�4 SiO2�
3
Panel B: Comparison of nutrient species (lM) between the main stream (i.e., XLJ in Fig. 2a) and the tributary (i.e., WSK in Fig. 2a) in the
Changjiang Estuary
Xuliujing (XLJ)Surface water 107 1.05 2.80 0.64 131Near-bottom water 107 1.09 2.40 0.66 131
Wusongkou (WSK)Surface water 85.3 19.5 29.4 2.75 148Near-bottom water 85.5 16.2 32.6 2.38 148
See Fig. 2a for sample locations.
J. Zhang et al. / Progress in Oceanography 74 (2007) 449–478 455
upper part of estuary, had nitrate and dissolved silicate concentrations that could be 20% lower and 10%higher, respectively, when compared to the Changjiang. With regard to other nutrient species, concentrationsin the Huangpujiang were even 5–10-fold higher than the Changjiang mainstream (Table 1).
In the estuarine mixing zone, nitrate and dissolved silicate were conservatively mixed over a salinity rangeof 0–30 psu (Fig. 3). Surface and near-bottom samples had nearly identical concentration–salinity relation-ships for nitrate and dissolved silicate. With regard to dissolved phosphorus, the fresh water end-members var-ied by 25–50% during the period of field measurements (Table 1 and Fig. 3). In the estuary, concentrations ofphosphate varied considerably when plotted against salinity, but the dominance of linear dilution could still betracked, within the data resolution, in the mid- and lower estuary with an apparent freshwater end-member of1.0–1.5 lM, ca. two-times higher than the measurements in the river. This suggests that the remobilization ofphosphorus, if there is any, most likely takes place in the early stages of mixing, but in any case it is not assignificant as that described by previous studies (cf. Zhang, 1996). Again, nitrite and ammonium illustratedconsiderable variations for the riverine end-member, which obscures the discrimination of real mixing patternsin the Changjiang Estuary. Therefore, simple linear relationships were not established against salinity withconfidence. Quite often, the near-bottom concentrations were higher than those in the surface, particularlyin the salinity range 20–30 psu (Fig. 3).
Measurements from the mooring station in the lower estuary indicated that off-shore waters affected thisregion in the near-bottom layer, with salinity >30 psu. The Changjiang buoyant plume capped the upper0–2 m of the water column with salinity <20–25 psu; mid-depth waters were 25–30 psu salinity (Fig. 4).The oscillation of salinity in 0–2 m was most likely due to the tidal forcing of the Changjiang plume(Fig. 4). The water column tended to be stratified in neap-tide periods, but was well mixed in spring-tides.
Nitrate and dissolved silicate concentrations decreased 2-fold from surface to near-bottom waters; dis-solved phosphorus tended to be vertically well-mixed for both spring and neap tides at the mooring station(Fig. 4). Ammonium concentrations oscillated in surface waters similar to salinity in response to the semidi-urnal tide. The concentration of NHþ4 could be 50–100% higher in the near-bottom than in the surface waters(Fig. 4). Nitrite concentrations were generally well-mixed in the water column, with levels of NO�2 at the moor-ing station also within the range of concentrations observed from the Changjiang (Table 1 and Fig. 4).

Changjiang Estuary (07/01) Changjiang Estuary (07/01)
Changjiang Estuary (07/01) Changjiang Estuary (07/01)
Changjiang Estuary (07/01) Changjiang Estuary (07/01)
[NO3-] = -2.77 [S] + 99.1
r 2 = 0.840
50
100
150
0 10 20 30
Nit
rate
(µM
)
Surface
Near-bottom
0
5
10
15
0 10 20 30
Nit
rite
(µM
)
Surface
Near-bottom
0
5
10
15
20
25
0 10 20 30Salinity (psu)
Am
mon
ium
(µM
)
Surface
Near-bottom
0.0
0.5
1.0
1.5
2.0
2.5
0 10 20 30Salinity (psu)
Salinity (psu) Salinity (psu)
Salinity (psu) Salinity (psu)
Pho
spha
te (
µM) Surface
Near-bottom
[SiO2] = -3.69 [S] + 138.8
r 2 = 0.960
50
100
150
200
0 10 20 30Dis
solv
ed S
ilica
te (
µM)
Surface
Near-bottom
0
50
100
150
200
250
300
0 10 20 30
DIN
/DIP
Surface
Near-bottom
Fig. 3. Longitudinal profiles of nutrients (NO�3 , NO�2 , NHþ4 , PO3�4 , and dissolved SiO2�
3 ) and DIN/DIP in the Changjiang Estuary in July2001 across the estuarine mixing zone from its freshwater end-member at Xuliujing (XLJ) to the coast at salinity of �30 psu.
456 J. Zhang et al. / Progress in Oceanography 74 (2007) 449–478
4.2. Comparison between wet (08/2002) and dry (02/2003) seasons in coastal waters
The average water discharge was 53.0 · 103 m3 s�1 in July and 51.5 · 103 m3 s�1 in August, 2002. In theadjacent coastal area, nitrate, phosphate and dissolved silicate concentrations were high in surface waters overthe inner shelf out to 123.5–124.0�E (Fig. 2). In the coastal region, the near-bottom concentrations of nitrate,phosphate and dissolved silicate were often higher than the surface water values, showing different curveswhen plotted against seawater proportions, particularly for samples with salinity >25 psu (Fig. 5). Forinstance, near-bottom concentrations of phosphate could be up to 5-fold higher than in surface for salinityof 25.0–34.2 psu (Fig. 5). Nitrite and ammonium showed considerable scatter in the concentration vs. salinityrelationship in coastal waters, but differed little between surface and near-bottom (Fig. 5).
In the coastal area, oxidized (i.e., NO�3 ) to reductive (i.e., NHþ4 þDON) nitrogen forms decreased almostlinearly with increasing salinity, from ca. 4–5 at salinity of 10–20 psu to <0.5 when salinity is >30 psu. NO�2was omitted in the ratio because the concentration was low and rather stable relative to other nitrogen forms.Similarly, the DIP to DOP ratio also decreased as salinity increased in the water column, but with higher var-iability. The ammonium to DON ratio increased, however, with salinity in a complex manner, approaching anonlinear relationship.
In January–February, the Changjiang water flow decreased to (15–20) · 103 m3 s�1, the minimum in 2003.Nitrate, phosphate and dissolved silicate show similar linear relationships with salinity for both surface and

207 208 209 210197 198 199 200 201 202 203
0
H
0.5H
H
0.5H
0
0
H
0.5H
10
12
14
16
18
Dep
th (
m)
Nit
rate
Nit
rite
Am
mon
ium
Julian Day
0
0.5H
H
0
0.5H
H
0
0.5H
H
Salin
ity
Pho
spha
teD
isso
lved
Sili
cate
10
12
14
16
18
Dep
th (
m)
207 208 209 210197 198 199 200 201 202 203
Julian Day4-1 4-2
Fig. 4. Vertical profiles of (4-1) dissolved inorganic nitrogen (i.e., NO�3 , NO�2 , NHþ4 ) (lM), and (4-2) salinity (psu), PO3�4 and dissolved
SiO2�3 (lM) at a mooring station off-shore (30�41.417 0N, 122�18.9950E) for 15 days in July 2001. The depth profile at the upper part of the
figure shows the variation of water surface at mooring station and the ‘‘H’’ in the lower part of figure represents the depth. Measurementswere made hourly for hydrographic parameters; sample collections for nutrients were made every 3 h from surface (0H), 0.5H and near-bottom (H). Note that measurements were interrupted from July 23 to 25 because of bad weather and harsh sea conditions.
J. Zhang et al. / Progress in Oceanography 74 (2007) 449–478 457
near-bottom waters (Fig. 5). In winter, the concentrations of nutrients from surface and near-bottom samplesare more similar compared to the larger differences found in summer observations. Nitrite and ammoniumshowed comparable trends in concentration vs. salinity plots for surface and near-bottom waters, but highervalues near the bottom, relative to surface samples, could still be found in the region of salinity >30 psu(Fig. 5).
On the February 2003 Cruise, the ratio of NO�3 to ðNHþ4 þDON) was lower at higher salinities, much asfor the summer observations. Similarly, the DIP to DOP ratio decreased with increasing salinity, but in anexponential pattern. The ratio of NHþ4 to DON increased with higher salinity nonlinearly, comparable tothe pattern found in summer.
4.3. Across the East China Sea Shelf
The September 2002 data covered the various water masses of the ECS, including Changjiang DilutedWater (CDW), Taiwan Current Warm Water (TCWW), Shelf Mixed Water (SMW), Kuroshio Surface Water(KSW), Kuroshio Subsurface Water (KSSW) and Kuroshio Intermediate Water (KIW) (Fig. 1). In summer2002, the effluents from the Changjiang (CDW) dispersed eastward at the surface as far as 126�E, outlined by

458 J. Zhang et al. / Progress in Oceanography 74 (2007) 449–478
the isohaline of salinity = 30 psu. The TCWW became the major component in mid-shelf, together with ShelfMixed Waters with salinity of 30–34 psu (Figs. 1 and 6). Off the shelf break were the KSW, KSSW and KIW,differing in temperature and depth of occurrence (Figs. 6a and b). The invasion of the Kuroshio upward alongthe shelf can be tracked shoreward to water depths of ca. 50 m.
On the PN Section from Changjiang Estuary southeastwards across the East China Sea to the Okino-Erabu-Shima (i.e., Amami Island), high nutrient concentrations eastward from the shallow coastal region
Coastal waters of ECS (08/02)
[NO3-]=-3.15 [S]+97.2
r 2=0.73
[NO3-]=-2.80 [S]+104.5
r 2=0.82
0
20
40
60
80
100
0 10 20 30 40
Salinity (psu)
Nit
rate
(µM
)
Surface
Near-bottom
Coastal waters of ECS (08/02)
[NO2-]=-0.023 [S]+1.40
r 2=0.030[NO2
-]=-0.023 [S]+1.10
r 2=0.13
0
1
2
3
4
0 5 10 15 20 25 30 35
Salinity (psu)
Nit
rite
(µM
)
Surface
Near-bottom
Coastal waters of ECS (08/02)
[NH4+]=-0.044 [S]+6.51
r 2=0.018
[NH4+]=-0.032 [S]+7.05
r 2=0.0047
0
5
10
15
0 5 10 15 20 25 30 35
Salinity (psu)
Am
mon
ium
(µM
) Surface
Near-bottom
Coastal waters of ECS (08/02)
[PO43-]=0.011 [S]+0.30
r 2=0.041
[PO43-]=-0.026 [S]+0.93
r 2=0.260.0
0.2
0.4
0.6
0.8
1.0
1.2
1.4
0 5 10 15 20 25 30 35
Salinity (psu)
Pho
spha
te (
µM) Surface
Near-bottom
Coastal waters of ECS (08/02)
[SiO2]=-1.77 [S]+70.7
r 2=0.58
[SiO2]=-3.82 [S]+113.4
r 2=0.600
20
40
60
80
100
120
0 10 20 30 40
Salinity (psu)
Dis
solv
ed S
ilica
te (
µM)
Surface
Near-bottom
Coastal waters of ECS (08/02)
[DON]= -0.94 [S] + 29.67
r 2 = 0.57
[DON]= -0.64 [S] + 24.91
r 2 = 0.20
0
5
10
15
20
0 5 10 15 20 25 30 35
Salinity (psu)
DO
N (
µM)
Surface
Near-bottom
Coastal waters of ECS (08/02)
[DOP] = -0.0072 [S] + 0.33
r 2 = 0.074
y = 0.11 [S]-2.49
r 2 = 0.20
0
1
2
3
4
5
6
0 5 10 15 20 25 30 35
Salinity (psu)
DO
P (
µM)
Surface
Near-bottom
5-1
Fig. 5. Nutrient species (NO�3 , NO�2 , NHþ4 , PO3�4 , and dissolved SiO2�
3 ) plotted against salinity in coastal waters for (5-1) August 2002 (08/2002), and (5-2) February 2003 (02/2003), respectively. For comparison, samples from surface and near-bottom (i.e. 1–2 m above sea-bed)are selected to show the nutrient–salinity relationships.

Coastal waters of ECS (02/03) Coastal waters of ECS (02/03)
Coastal waters of ECS (02/03)Coastal waters of ECS (02/03)
Coastal waters of ECS (02/03) Coastal waters of ECS (02/03)
Coastal waters of ECS (02/03)
[NO3-]=-3.79 [S]+132.6
r 2=0.94
[NO3-]=-3.20[S]+113.4
r 2=0.910
20
40
60
80
100
120
0 10 20 30 40Salinity (psu)
Nit
rate
(µM
)Surface
Near-bottom
[NO2-]=-0.023 [S]+1.06
r 2=0.21
[NO2-]=-0.038 [S]+1.53
r 2=0.31
0.0
0.5
1.0
1.5
2.0
2.5
0 10 20 30 40Salinity (psu)
Nit
rite
(µM
)
Surface
Near-bottom
[NH4+]=-0.23 [S]+11.8
r 2=0.24
[NH4+]=-0.24 [S]+11.6
r 2=0.44
0
3
6
9
12
15
18
0 10 20 30 40Salinity (psu)
Am
mon
ium
(µM
) Surface
Near-bottom
[PO43-]=-0.035 [S]+1.50
r 2=0.75
[PO43-]=-0.038 [S]+1.56
r 2=0.71
0.0
0.5
1.0
1.5
0 10 20 30 40Salinity (psu)
Pho
spha
te (
µM) Surface
Near-bottom
[SiO2]=-2.62 [S]+95.0
r 2=0.94[SiO2]=-2.47 [S]+89.8
r 2=0.94
0
10
20
30
40
50
60
70
0 10 20 30 40Salinity (psu)
Dis
solv
ed S
ilica
te (µ
M)
Surface
Near-bottom
[DON] = -0.77 [S] + 26.853
r 2 = 0.57
[DON] = -1.26 [S]+ 44.98
r 2 = 0.24
0
5
10
15
0 10 20 30 40Salinity (psu)
DO
N (
µM)
Surface
Near-bottom
[DOP]= 0.0066 [S] + 0.077
r 2 = 0.097
[DOP] = 0.0031 [S] + 0.17
r 2 = 0.021
0
0.1
0.2
0.3
0.4
0.5
0.6
0 10 20 30 40Salinity (psu)
DO
P (
µM)
Surface
Near-bottom
5-2
Fig. 5 (continued)
J. Zhang et al. / Progress in Oceanography 74 (2007) 449–478 459
affected by the Changjiang effluent were high, while over the broad shelf surface water was depleted of nitrate(i.e., 0.2–2 lM), phosphate (i.e., 0.1–0.2 lM) and dissolved silicate (i.e., 1–2 lM) (Figs. 6c and e). The incur-sion of KSSW across the shelf was evident with high nitrate (10–20 lM), phosphate (0.5–1.5 lM) and dis-solved silicate (10–20 lM) (Table 2 and Fig. 6), similar to previous studies (cf. Zhang and Su, 2006). Overthe broad East China Sea Shelf, ammonium was relatively high compared to oxidized nitrogen forms up to1–2 lM in surface waters (Fig. 6f). There was no difference in NHþ4 between surface and deep waters acrossthe pycnocline that was 20 m deep near the coast and 70–80 m deep at the shelf break, although the KSSW

2002.9-PN-Temperatureb
A14E4P11 P10 P9 P8 E6 P7 P6 P5 P4 P3
2002.9-PN-Phosphated
2002.9-PN-Ammoniumf
-1200
Dep
th (m
)
-100
-150
-450
-700
-900
-200
0
-50
2002.9-PN-Salinity
a
A14E4P11 P10 P9 P8 E6 P7 P6 P5 P4 P3
Dep
th (m
)
2002.9-PN-DOPi
-1200
-100
-150
-450
-700
-900
-200
0
-50
Dep
th (m
)
2002.9-PN-Nitrite
g-1200
-100
-150
-450
-700
-900
-200
0
-50
Dep
th (m
)
2002.9-PN-Dissolved Silicate
e-1200
-100
-150
-450
-700
-900
-200
0
-50
Dep
th (m
)
2002.9-PN-Nitratec
22
-1200
-100
-150
-450
-700
-900
-200
0
-50
2002.9-PN-DONh
14
Fig. 6. Plots of salinity (a), temperature (b) and nutrients NO�3 (c), PO3�4 (d), SiO2�
3 (e), NHþ4 (f), NO�2 (g), DON (h), and DOP (i) (lm)along the PN Section in September 2002 (09/02). The PN Section is identified in Fig. 2. Note that different scales are used for the depthaxes.
460 J. Zhang et al. / Progress in Oceanography 74 (2007) 449–478

J. Zhang et al. / Progress in Oceanography 74 (2007) 449–478 461
had low concentrations of ammonium (i.e., <0.5 lM) at the open boundary region (Fig. 6). Nitrite at the PNSection decreased gradually from the coast (0.5–1.0 lM) to the mid-shelf (0.01–0.1 lM), where concentrationswere comparable between surface and near-bottom samples (Fig. 6g). DON was relatively low in the near-shore and mid-shelf waters, then increased toward the open waters of the Kuroshio, where the DON couldbe up to 10–15 lM at the surface. DOP was low for KSW at �0.1 lM, but it could be twice as high at themid-shelf and reach �0.4 lM for near-bottom waters (Figs. 6h and i). Other parts of the East China Sea weresimilar in nutrient distributions across the broad shelf as observed along the PN Section.
Nutrient molar ratios of the East China Sea were summarized as:
� The ratio of nitrate to ammonium decreased in surface waters from the Changjiang Estuary along the salin-ity gradients (S = 10–20 psu). In the open shelf region the ratio of NO�3 =NHþ4 could be much higher in sam-ples from below the pycnocline (i.e., KSSW: 0.5–3.5) than at the surface (i.e., 0.05–0.1 for KSW) (Fig. 7a).Concurrently, the NHþ4 to DON ratio could be 0.05–0.2 in the coastal area, which was statistically higherthan �0.1 for surface waters of the Kuroshio, and than 0.05–0.1 for KSSW (Fig. 7b).
Table 2Concentrations of nutrients (lM) in the East China Sea and Kuroshio Waters along the PN Section, September 2002
Water Mass NO�3 NO�2 NHþ4 PO3�4 SiO2�
3
Panel A: Measurements at PN Section in September 2002 Cruise
East China Sea ShelfSurface water 0.19 0.043 0.71 0.18 2.12Near-bottom water 7.62 0.075 0.68 0.63 10.5
KuroshioKSW 0.24 0.087 0.48 0.27 2.91KSSW 4.84 0.092 0.59 0.45 5.99KIW 17.9 0.011 0.43 1.58 27.8
Season NHþ4 NO�3 PO3�4 SiO2�
3
Panel B: Nutrient concentration data for shelf mixed-water (SMW) of the East China Sea and boundary systems, showing the range of
concentrations (lM) with mean values in parentheses used for box-model calculation
East China Sea Shelfa
Summer 0.32–1.1(0.71)
0.5–6.1(3.5)
0.07–0.38(0.17)
5.95–13.2(6.0)
Winter 0.32 2.4–8.8(5.6)
0.23–0.65(0.44)
6.0–16.0(11.0)
Kuroshio water (KSW and KSSW)b
Summer 0.25–0.97(0.53)
5.33–26.1(6.1)
0.38–1.61(0.43)
6.97–70.6(6.97)
Winter 0.54 6.94–26.1(6.94)
0.38–1.61(0.51)
10.7–70.6(13.1)
Yellow Sea (YS)c
Summer 0.13–2.5(0.91)
0.51–5.75(2.96)
0.11–0.60(0.47)
2.75–12.0(11.9)
Winter 0.01–1.9(0.99)
0.73–9.1(4.1)
0.15–0.78(0.43)
0.2–17.8(8.5)
Taiwan Straitd
Summer 0.566 1.0–4.93(2.97)
0.13–0.49(0.15)
4.5–7.8(6.15)
Winter 0.566 2.0–4.70(4.70)
0.31–0.45(0.38)
8.3–21.0(14.7)
a Gong et al. (2003), Zhang and Su (2006) and this study.b Liu et al. (2000), Zhang and Su (2006) and this study.c KORDI (1998) and Zhang and Su (2006).d Gu et al. (1992), Wang and Huang (1998) and Liu et al. (2000).

462 J. Zhang et al. / Progress in Oceanography 74 (2007) 449–478
� The DIP to DOP ratio was low in the coastal areas, particularly at the surface, then increased with distanceoff-shore. DIP/DOP values (i.e., 5–10) were higher in the Kuroshio Region (i.e., over water depths >200 m)for both surface and subsurface water masses (Fig. 7c). High DIP/DOP ratios were also seen at the shelfbreak and at the mid-shelf at water depths of 50–100 m.� The DIN/DIP ratio reached 100–150 or higher at the coast and over the inner shelf, while in the region
affected by the Kuroshio the ratio dropped to 10–20 at the surface and to <10 for sub-surface and inter-mediate water masses (Fig. 7d). An important gradient of DIN/DIP occurred in the mid-shelf region, sug-gesting that denitrification could be important off-shore to draw the DIN/DIP ratio down (Fig. 7d). Asimilar pattern was not found for the DIN=SiO2�
3 ratio, although the ratio from the Kuroshio regionwas higher (i.e., 1–2) than those from the mid-shelf (i.e., <1), particularly for KSSW at depths of 100–400 m (Fig. 7e).
4.4. Anchor stations on the shelf
Station E4 was located off the Changjiang Estuary, where the cross-shelf observations started in September2002. Salinity (i.e., 31.00–31.30 psu) and temperature (i.e., 25.15–25.60 �C) varied minimally, typical for a mix-ture of the Changjiang plume and TCWW in summer (Fig. 1). High salinity and low temperature wereobserved at flood tide with strong vertical mixing in the water column, while a weak stratification feature with
Dep
th (m
)
2002.9-PN-Nitrate/Ammoniuma
A14E4P11 P10 P9 P8 E6 P7 P6 P5 P4 P3
-1200
-100
-150
-450
-700
-900
-200
0
-50
2002.9-PN-Ammonium/DONb
A14E4P11 P10 P9 P8 E6 P7 P6 P5 P4 P30.1
2002.9-PN-DIN/DIPd
Dep
th (m
)
2002.9-PN-DIP/DOPc
-1200
-100
-150
-450
-700
-900
-200
0
-50
Dep
th (m
)
2002.9-PN-DIN/Dissolved Silicate
e-1200
-100
-150
-450
-700
-900
-200
0
-50
Fig. 7. Ratios among various nutrient forms across the East China Sea Shelf from the Changjiang Estuary to the Kuroshio along the PNSection: NO�3 =NHþ4 (a), NHþ4 /DON (b), DIP/DOP (c), DIN/DIP (d), and DIN=SiO2�
3 (e).

J. Zhang et al. / Progress in Oceanography 74 (2007) 449–478 463
relatively low salinity and slightly higher temperature occurred in ebb tide periods (Figs. 8a and b). Nitratewas 6.0–8.5 lM with an almost well-mixed vertical profile throughout the water column; surface and near-bot-tom values differed by <10% (Fig. 8c). Nitrite was low (0.65–1.45 lM) and vertically well-mixed. Ammoniumwas 0.5–1.0 lM, and high relative to riverine concentrations. The NHþ4 to NO�3 ratio was 0.1–0.2 at StationE4, much higher than for the Changjiang (i.e., <0.05) (Fig. 8e). Phosphate concentrations at Station E4 werecomparable to the fresh water inflow from the Changjiang, or even higher (Table 1 and Fig. 8). Unlike nitrate,PO3�
4 was up to 50% higher in near-bottom than surface waters. High levels (e.g., 1.0 lM) of phosphate werealso found at flood tide, up to twice as high as at ebb tide (Fig. 8f). The DIN/DIP ratio at Station E4 was 6–25.Dissolved silicate (7–10 lM) was vertically well-mixed through the tidal cycle (Fig. 8g). This resulted in esti-mates of SiO2�
3 =DIN molar ratio of �1 and SiO2�3 =DIP of 6–22.
High DON concentrations of 10–20 lM comprised up to 60% of the total dissolved nitrogen (Fig. 8h). TheNO�3 =ðNHþ4 þDON) ratios at Station E4 were comparable between surface and near-bottom waters, i.e.,0.31–0.82 with an average of 0.57. DOP was 0.05–0.5 lM, with a DOP/DIP ratio of 0.1–0.5, making the over-all pattern of distribution for DOP similar to that of DIP, with a well-mixed vertical profile (Fig. 8i).
Station E6 at mid-shelf in 85–90 m was stratified with a pynocline and nutricline at 40–50 m (Figs. 9a andb). Surface waters over the shelf were 33.4–33.8 psu for salinity and 26–28 �C for temperature. The deep waterwas a mixture of TCWW and KSSW with salinity 34.0–34.1 psu and temperature 22–25 �C (Figs. 9a and b).Nitrate was 0.1–1.0 lM in the surface layer, and increased with depth, reaching 10 lM in near-bottom waters(Fig. 9c). Nitrite and ammonium concentrations were variable through the water column, but 2-fold higher inthe near-bottom samples than in the surface (Figs. 9d and e). Dissolved inorganic phosphorus in near-bottomwater was 3–4-fold higher than in surface waters (Fig. 9f). Concentrations of dissolved silicate increased stea-dily with depth from 1.5–2.0 lM at the surface to 10–15 lM in waters beneath the pycnocline (Fig. 9g). DONwas up to 45-fold greater than that for DIN, and was the major fraction of TDN, while DOP was comparableto or lower than DIP through the water column (Figs. 9h and i).
Station E6 nutrient ratios of NO�3 =ðNHþ4 þDONÞ averaged 0.02 for surface mixed water and 0.7–0.8beneath the pycnocline, and DOP/TDP could be twice as high on average in surface waters (0.7) than inwaters beneath the pycnocline (0.3). The DIN/DIP ratio in the water column at Station E6 decreased from0.9–41 in surface mixed waters (average: 7) to 0.7–23 below the pycnocline (average: 13). The SiO2�
3 =DIN ratiowas 1.6–6.2 at the surface (average: 3.3) and 0.2–14 (average: 1.7) beneath the pycnocline (Fig. 9).
4.5. Records from core sediments in coastal environment
Data from sediment core samples revealed the distinctive feature of biogenic elements in coastal environ-ments affected by high turbidity land-source inflow (e.g. Changjiang). Station DB-6, off the mouth of theChangjiang at 10–20 m, showed concentrations of 99–183 lmol g�1 (i.e. dry weight) for TOC (i.e., totalorganic carbon), 10.7–19.0 lmol g�1 for TN (i.e., total nitrogen) and 0.20–0.42% for BSi over a core depthof 10 cm (Figs. 2b and 10). The TOC showed an increase of 50–100% at 7–10 cm with a slight increase inthe TOC/TN atomic ratio down core. Taking the silt-clay character of bottom sediments into account, thedown-core distributions of TOC, TN, and BSi indicated rapid unloading of TSM in the Changjiang deltaregion. Radio isotopes (i.e. 210Pb and 137Cs) indicate that Station DB-6 was located in a transition zone ofsedimentation from 2–4 cm yr�1 to ca. 1.0 cm yr�1 (cf., Chen et al., 2004). Hence samples at this station pro-vided records for recent sedimentation, within 5–10 years.
Farther to the south at Station 2D-34, the IP (13.5–16.2 lmol g�1) and TP (17.4–20.8 lmol g�1) bothremained stable over a core depth of ca. 40 cm (Figs. 2b and 10). The OP was 3.55–6.18 lmol g�1 in the sed-iment core, accounting for 20–30% of TP (Fig. 10). The vertical distributions of TOC (319–414 lmol g�1) andTN (21.7–51.1 lmol g�1) showed weak decrease down-core, while BSi (0.32–0.71%) remained stable within thedata resolution. The TOC/OP and TN/OP molar ratios were rather stable in core samples at Station 2D-34(Fig. 10).
At Station E4, BSi showed comparable concentrations between upper and lower parts of sediment cores,although variability was high (Figs. 2b and 10). Samples from core depths of 20–30 cm had TOC and TN val-ues that were 50% lower than in the surface sediments, but simple concentration gradients could not be dis-criminated over the whole core (Fig. 10). This induced a rather smooth vertical profile of TOC/TN molar ratio

0 2 4 6 8 10 12 14 16 18 20 22 24
Dep
th (m
)-1.6
-8
-16
-20
-4
-12
Time(hour) 2002-9-E4-Temperature
a
0 2 4 6 8 10 12 14 16 18 20 22 24Time(hour) 2002-9-E4-Salinity
b
0 2 4 6 8 10 12 14 16 18 20 22 24Time (Hour) 2002-9-E4-Nitrite
d
0 2 4 6 8 10 12 14 16 18 20 22 24Time (Hour) 2002-9-E4-Phosphate
f
0 2 4 6 8 10 12 14 16 18 20 22 24Time (Hour) 2002-9-E4-DON
h
0 2 4 6 8 10 12 14 16 18 20 22 24Time (Hour)
Dep
th (m
)
2002-9-E4-DOP
i-1.6
-8
-16
-20
-4
-12
0 2 4 6 8 10 12 14 16 18 20 22 24Time (Hour)
Dep
th (m
)
2002-9-E4-Ammonium
e-1.6
-8
-16
-20
-4
-12
0 2 4 6 8 10 12 14 16 18 20 22 24Time (Hour)
Dep
th (m
)
2002-9-E4-Dissolved Silicate
g-1.6
-8
-16
-20
-4
-12
0 2 4 6 8 10 12 14 16 18 20 22 24Time (Hour)
Dep
th (m
)
2002-9-E4-Nitrate
c-1.6
-8
-16
-20
-4
-12
Fig. 8. Changes over 26 h for temperature (a), salinity (b) and nutrients (lM): NO�3 (c), NO�2 (d), NHþ4 (e), PO3�4 (f), SiO2�
3 (g), DON (h),and DOP (i), at Station E4 in Fig. 2.
464 J. Zhang et al. / Progress in Oceanography 74 (2007) 449–478

0 2 4 6 8 10 12 14 16 18 20 22 24
Dep
th (m
)-14
-28
-56
-70
-84
Time(hour) 2002-9-E6-Temperature
-1.2
-42
0 2 4 6 8 10 12 14 16 18 20 22 24
Dep
th (m
)
Time(hour) 2002-9-E6-Nitrate
c-14
-28
-56
-70
-84
-1.2
-42
0 2 4 6 8 10 12 14 16 18 20 22 24Time (Hour)
Dep
th (m
)
2002-9-E6-Ammonium
e-14
-28
-56
-70
-84
-1.2
-42
g
0 2 4 6 8 10 12 14 16 18 20 22 24
Dep
th (m
)
Time(hour) 2002-9-E6-Dissolved Silicate
-14
-28
-56
-70
-84
-1.2
-42
i
0 2 4 6 8 10 12 14 16 18 20 22 24
Dep
th (m
)
Time(hour) 2002-9-E6-DOP
-14
-28
-56
-70
-84
-1.2
-42
0 2 4 6 8 10 12 14 16 18 20 22 24Time (Hour) 2002-9-E6-DON
h
f
0 2 4 6 8 10 12 14 16 18 20 22 24Time(hour) 2002-9-E6-Phosphate
0 2 4 6 8 10 12 14 16 18 20 22 24Time(hour) 2002-9-E6-Nitrite
d0 2 4 6 8 10 12 14 16 18 20 22 24Time(hour) 2002-9-E6-Salinity
Fig. 9. Changes over 26 h for temperature (a), salinity (b) and nutrients (lM): NO�3 (c), NO�2 (d), NHþ4 (e), PO3�4 (f), SiO2�
3 (g), DON (h),and DOP (i), for Station E6 in Fig. 2.
J. Zhang et al. / Progress in Oceanography 74 (2007) 449–478 465

Station DB6
0
2
4
6
8
10
0 0.25 0.5 0.75 1
BSi (%)
Dep
th (
cm)
Station DB6
0
2
4
6
8
10
0 2.5 5 7.5 10
TOC/TN Atomic Ratio
Dep
th (
cm)
0
2
4
6
8
10
0 0.1 0.2 0.3 0.4 0.5
Concentrations (%)
Dep
th (
cm)
TN
TOC
0
2
4
6
8
10
0 50 100 150 200
Concentrations (µmol/g)
Dep
th (
cm)
Dep
th (
cm)
Dep
th (
cm)
Dep
th (
cm)
Dep
th (
cm)
TN
TOC
Station 2D-34
0
5
10
15
20
25
30
35
40
10 15 20 25
Phosphorus (µmol/g)
IP
TP
Station 2D-34
Station DB6 Station DB6 Station 2D-34 Station 2D-34
0
5
10
15
20
25
30
35
40
0 100 200 300 400 500
Concentrations (µmol/g)
TN
TOC
0
5
10
15
20
25
30
35
40
0 0.2 0.4 0.6 0.8 1
BSi (%)
0
5
10
15
20
25
30
35
40
0 50 100 150
Element Molar Ratio
TN/OP
TOC/OP
Station E4
0
10
20
30
40
50
0 0.25 0.5 0.75 1
BSi (%)
Dep
th (
cm)
Station E4
0
10
20
30
40
50
0 10 15
TOC/TN Atomic Ratio
Dep
th (
cm)
Station E4
0
10
20
30
40
50
0 0.25 0.5 0.75 1
Concentrations (%)
Dep
th (
cm)
TOC
TN
Station E4
0
10
20
30
40
50
0 200 400 600
Concentrations (µmol/g)
Dep
th (
cm) TN
TOC
5
10-1 10-2
10-3
Fig. 10. Sediment core measurements from the coastal region off the Changjiang Estuary, including organic carbon (TOC) and nitrogen(TN), biogenic silica (BSi), inorganic and total phosphorus (i.e. IP and TP) from three stations, which were DB-6 (10-1), 2D-34 (10-2), andE4 (10-3).
466 J. Zhang et al. / Progress in Oceanography 74 (2007) 449–478

J. Zhang et al. / Progress in Oceanography 74 (2007) 449–478 467
in sediments at Station E4. Data of 210Pb revealed a sedimentation rate of ca. 3 cm yr�1 at Station E4, whichimplies that our samples corresponded to sedimentary records of up to 15–20 years.
5. Discussion
5.1. On the biogeochemical dynamics of the East China Sea
The extremely high water and sediment loads from the Changjiang directly influence the circulation, nutri-ent dynamics, phytoplankton community, and trophic structure in the adjacent coastal region (Zhang and Su,2006). The influence of the Changjiang on the surface water nutrient regime can be tracked up to 300–400 kmeastward over the shelf during high discharge in summer (Zhang, 2002). The DIN in the Changjiang hasincreased 2-fold since 1980, proportional to the increased fertilizer use in farm lands; nation-wide applicationof chemical fertilizers was 40 · 106 tons yr�1 in the late 1990s, of which �25 % was used within the Changjiangwatershed (Zhang, 2002). This increase in nitrogen has created a skewed DIN/DIP ratio of Changjiang waterwell above the Redfield ratio at 150–200 with DIN=SiO2�
3 ratio of 0.85 (Figs. 3–5), indicating the likelihood ofphosphorus limitation of phytoplankton production. In mid-shelf waters the DIN/DIP ratio is 10–20, which ismuch closer to the Redfield ratio and indicates that either N might be limiting (Zhang et al., 1999b). Thereduction in the DIN/DIP ratio in the off-shore direction results from interacting biological and physicalprocesses.
Concentration of total phosphorus in suspended particulates in the Changjiang is 5–10 lmol g�1 during lowflow and �25 lmol g�1 during high flow with an IP/TP ratio of 0.8 and an OP/TP ratio of �0.2 for total sus-pended matter (Liu et al., 2003b, and unpublished data). The summer riverine TP is 25–30% higher than thesediment core samples in coastal areas adjacent to the Changjiang Estuary, with a correspondingly lower IP/TP value by ca. 10%. This is presumably due to the removal of IP from terrigenous source material (e.g., apa-tite detritus) via rapid deposition of riverine TSM in the delta region. The comparison with Changjiang TSMreveals that concentrations of IP and TP in coastal sediment cores are both less by 20–30%. Concentrations ofOP in a sediment core at Station 2D-34 are 3.55–6.18 lmol g�1, with an average of 5.03 lmol g�1 that is sim-ilar to the riverine level of 5.22 lmol g�1. Given that phosphate in the Changjiang Estuary tends to be con-servative in flood season, the decrease in IP/TP values in sediment samples should lead to an increase inOP/TP ratio. The relatively stable profiles for BSi, POC, PN and phosphorus from sediment cores indicatea continuum of the records, without significant modification in early diagenesis (e.g., mineralization), at leastwithin the data resolution.
The sediment cores (i.e., DB-6, 2D-34 and E4) show TOC/TN ranges of 6.99–10.1 with averages of 7.7–8.3.The TOC/OP is 39.1–107 with an average of 72.5 at Station 2D-34. These values are comparable to POC/PN(i.e., 7.78–9.71) but a factor of two lower for POC/OP (i.e., 136–189) when compared to the TSM compositionfrom the Changjiang. It should be noted that the POC/PN atomic ratio was 7.1–12.5, with an average of9.3 ± 1.7, in the Changjiang before the closure of the Three Gorges Dam (TGD) (Zhang et al., 2002). Inthe open ECS, the POC/PN molar ratio varies from 5.8 to 6.8, similar to the Redfield ratio, in surface watersof the mid-shelf and Kuroshio Region. Previous studies of the POC/PN ratio and isotopic composition (i.e.,d13C and d15N) traced terrestrial particles from the Changjiang in surface waters over a distance of 250 kmeastward across the ECS Shelf (Wu et al., 2003).
The difference in phosphate concentration between near-bottom and surface samples in the salinity range30–35 psu is �0.5 lM, which corresponds to 5–10 lM of regenerated nitrogen found in the water column, tak-ing into account the Redfield ratio for N/P � 10–20 (Fig. 5). Data from in situ sediment-core incubationsindicate exchange fluxes of 0.4–1.3 mmol m�2 d�1 for DIN, 0.006–0.078 mmol m�2 d�1 for PO3�
4 , and0.7–3.2 mmol m�2 d�1 for dissolved silicate, respectively, with DIN/DIP ratio of 15–60 and DIN/Si ratio of0.4–0.5, attributable to processes at the sediment–water interface in coastal environments off the ChangjiangEstuary. The Chl-a in surface sediments averages 0.54 lg g�1 (dry weight) with phaeo-pigments (Pha-a) aver-aging 2.5 lg g�1, indicating considerable uptake of nutrients by benthic algae and, hence, modified nutrientprofiles in the water column (Li et al., 2003; Qi et al., 2003).
The gradient of chlorophyll biomass and phytoplankton production across the shelf reflects the highnutrient inputs of the Changjiang. The Chl-a concentration is 30–40 lg l�1 in surface waters adjacent to

468 J. Zhang et al. / Progress in Oceanography 74 (2007) 449–478
the Changjiang Estuary, then decreases rapidly eastward to the open shelf, where values are 0.1–0.5 lg l�1 oreven lower in the oligotrophic KSW (Zou, 2000) (Fig. 11). Chl-a concentrations are much lower in subsurfaceand bottom waters in mid-shelf, beneath the pycnocline (Zou, 2000). Primary production in the coastaldomain is seasonal in nature, with values up to 500–1000 mg C m�2 d�1 occurring in summer during peak dis-charge; primary production was stable at �400 mg C m�2 d�1 in the East China Sea (Gong et al., 2003).
The ratio of inorganic to organic-bound phosphorus (i.e., DIP/DOP) on the PN Section across the ECSreveals depletion of DIP (PO3�
4 ) in euphotic waters over the shelf, where DIP/DOP < 0.2 suggests an impor-tant organic pool of phosphorus. The DIP/DOP ratio can be as high as 5–10 in the KSW and the KSSWincursion on to mid-shelf waters. This underlines that replenishment of DIP is likely sustained by extensivedegradation of organic matter (e.g., relative to DOP). Over the broad shelf there appears to be a counter-bal-ance between limited uptake of phosphate on one side, and metabolic regeneration to sustain low primary pro-duction on another. The increase in PO3�
4 concentration relative to TP in the water column of the KuroshioRegion, compared to shelf waters, provide potentially allochthonous sources of labile phosphorus (i.e., DIP)depending on process of exchange over shelf-break, although concentration of dissolved phosphorus (i.e.,TDP) in surface layers illustrates decreases across East China Sea Shelf.
Nitrate is depleted relative to NHþ4 þDON in the ECS, with NO�3 =ðNHþ4 þDONÞ of 0.05–0.5, includingthe shelf-break region and KSW. In the deep waters beneath the pycnocline in the mid- and open shelf,NO�3 =ðNHþ4 þDONÞ increases up to 1.0–1.5, which is comparable to KSSW and KIW (Fig. 12a). Thus,incursion of the Kuroshio (e.g. KSSW) over the shelf brings waters with higher nitrate than NHþ4 þDON,a feature similar to the DIP/DOP ratio. This distributional regime is consistent with the change in biomassof picoplankton. As shown by the data of Pan et al. (2005), ratio of auto-trophic picoplankton to hetero-tro-phic bacteria increases from the eutrophic coastal waters to the oligotrophic open shelf, but decreases fromsurface to bottom waters. For example, the biomass ratio between auto-trophic to hetero-trophic species
28º
30º
32º
34º
36º Korea
China
N
E
20m
120º 125º 130º
28º
30º
32º
34º
36º Korea
China
Bottom
N
E
120º 125º 130º 120º 125º 130º
28º
30º
32º
34º
36º Korea
China
Surface
N
E
Fig. 11. Distribution (lg l�1) of Chl-a in the Yellow Sea and East China Sea (a) at the surface, (b) at 20 m and in (c) near-bottom waters inAugust–September 1999. When the water is deeper than 200 m at the shelf break, samples from 175 m were used to draw the contours.Redrawn from the data of Zou (2000).
Dep
th (m
)
2003.9-PN-(DIP/DOP)/(Nitrate/(DON+Ammonium))
P12 P11 P10 P9 P8-1 P8 P7 P6 P5 P4 P30
-50
-100
-150
-200
-450
-600
-850
-1100
20
-1100
Dep
th (m
)
2003.9-PN-Nitrate/(Ammonium+DON)
P12 P11 P10 P9 P8-1 P8 P7 P6 P5 P4 P30
-50
-100
-150
-200
-450
-600
-850
Dep
th (m
)
auto-trophic phytoplankton/hetero-trophic bacteria biomass2003.9-PN
<1
(x10 )-3
P12 P10 P8-1 P7 P5 P4 P30
-50
-100
-150
-200
-450
-600
-850
-1100
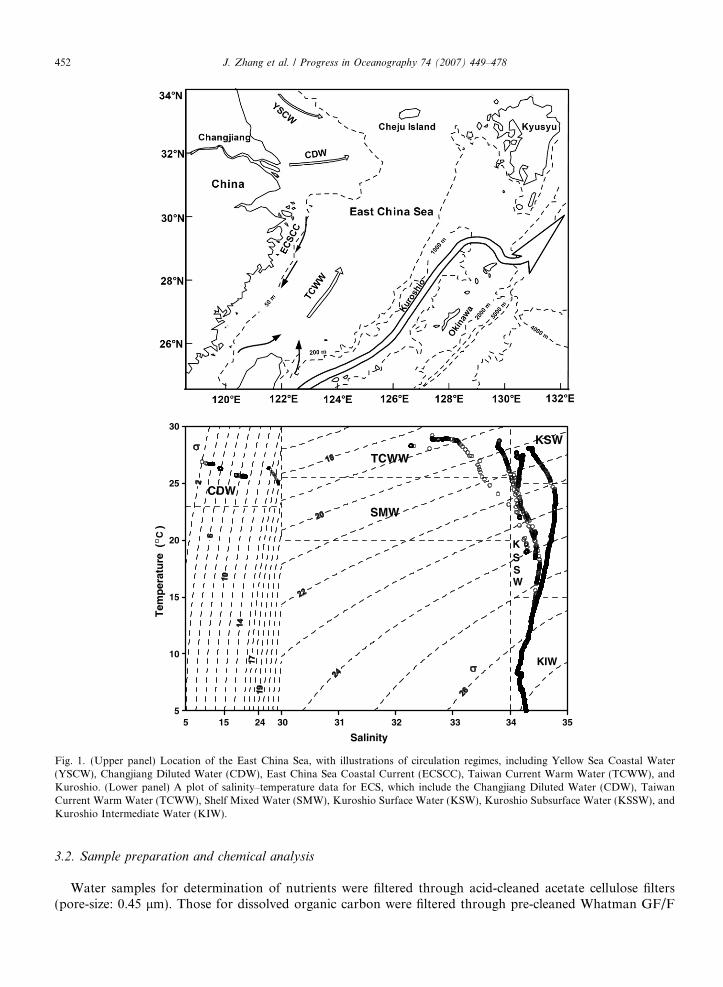
Fig. 12. Characteristics of the relative differences between nutrient species and change in picoplankton biomass along the PN Section.Shown are (a) NO�3 =ðNHþ4 þDONÞ, (b) auto-trophic phytoplankton to hetero-trophic bacteria biomass ratio and (c) DIP/DOP versusNO�3 =ðNHþ4 þDONÞ. Data for picoplankton biomass are extracted from Pan et al. (2005).
J. Zhang et al. / Progress in Oceanography 74 (2007) 449–478 469
increases from 0.02 in the region off the Changjiang to ca. 0.4 for KSW along the PN Section, i.e., it changes20-fold, with values of 0.2 at mid-shelf. In the Kuroshio Region, the auto-trophic to hetero-trophic biomassratio decreases from 0.4 at the surface to <0.001 at depths >150 m (Fig. 12b).
If we further compare between oxidized and reduced fractions of nutrients (i.e., ratios of DIP/DOP andNO�3 =ðNHþ4 þDONÞ), the ratio of DIP/DOP over NO�3 =ðNHþ4 þDONÞ is lower in coastal and mid-shelfwaters than at the shelf-break or in KSW. Indeed, over the East China Sea Shelf DIP/DOP relative toNO�3 =ðNHþ4 þDONÞ is ca. 10–20 in the upper parts of water column. Lower values (i.e., <1) can be foundat the coastal and in near-bottom waters (Fig. 12c). Moreover, in KSW, the ratio of DIP/DOP relative toNO�3 =ðNHþ4 þDONÞ is up to 100–200, i.e., 5–10-fold higher than in shelf waters or KSSW. The plot ofDIP/DOP against NO�3 =ðNHþ4 þDONÞ along the PN Section reveals that almost all data points are abovethe Redfield ratio of P/N = 1/16 (Fig. 12). Assuming that in open shelf waters, DIP is produced by degrada-tion of DOP, and NO�3 is produced from NHþ4 þDON (e.g., nitrification), then the comparison of DIP/DOPover NO�3 =ðNHþ4 þDONÞ sheds light on the different regeneration rates of nitrogen and phosphorus. It canbe summarized that regeneration of phosphorus can be faster than that of nitrogen in the ECS if the gas spe-cies (e.g., N2 and N2O) are omitted. Incursion of KSSW carries more oxidized nitrogen relative to inorganicphosphorus, when compared to the chemical composition of waters across the shelf-break, which is in agree-ment with shorter residence time (i.e., by 10–20%) of phosphorus relative to carbon and nitrogen (cf. Hunget al., 2003).
Sediment trap measurements at PN Section show higher flux of settling particulate matter at the coastalenvironment (water depth: <50 m) than over the mid-shelf (water depth: �100 m) and shelf-break (waterdepth: P150–200 m) year-round, and the deposition fluxes decrease consistently with distance seaward in sur-face and subsurface waters (Iseki et al., 2003). The organic carbon of setting particulate matter is lower, how-ever, on average at the coastal (�1%) than over the open shelf (10–20%) regions. The POC/PN ratio increaseswith depth in the water column at the PN Section, while BSi/POC is higher at coastal stations than in the off-shore and Okinawa samples (Iseki et al., 2003). This observation underlines that increase in POC/PN ratio

Table 3Water flow data used for budget calculation in the East China Sea Shelf; ‘‘�’’ stands for outflow and ‘‘+’’ for inflow; 1 Sv = 106 m3 s�1
Water mass Time Transport Period Reference
Taiwan Strait Annual 1.8 1999–2001 Wang et al. (2003)Summer 2.7Winter 0.9Spring 1.6 Isobe (1999))Summer 2Winter 2Fall 0.8October–December 0.14 1999 Teague et al. (2003)Spring 2 1999 Chung et al. (2001)Summer 2.2May–October 0.514 Chen (1998)November–April 0.206Annual 0.50 Hung et al. (2003)Summer 1.88 1994–1997 Liu et al. (2000)Winter 2.74Summer 3.16 Zhao and Fang (1991)Winter 1.05
Korea Strait October–December �3.17 1999 Teague et al. (2003)May–March �2.7 1999–2000
Tsushima Strait Summer �3.6 Miita and Ogawa (1984)Winter �1.3 Toba (1992)
Kuroshio Incursion May–October 0.94 Liu (1998)November–April 1.70
KSW May–October 0.78 Chen (1996)November–April 0.23Annual 0.51May–October 0.358 Chen (1998)November–April 1.07Annual 0.183 Hung et al. (2003)
KSSW May–October 0.586 Chen (1996)November–April 0.084Annual 0.54May–October 0.358 Chen (1998)November–April 0.402Annual 0.487 Hung et al. (2003)Summer (August) 0.83 1994 Liu et al. (2000)Winter (March) 0.59
KIW May–October 0.39 Chen (1996)November–April 0.028May–October 0.119 Chen (1998)November–April 0.134
YS-ECS Summer 0.009 Wei et al. (2002)Winter 0.013Annual 0.01 1998 Liu et al. (2003a)
River input Summer 0.026 Chen (1998)Winter 0.013
SMW Winter (January) �0.17 1981–1992 Ichikawa and Chaen (2000)Spring (April) �0.66Summer (July) �2.37Fall (October) �0.94Annual �0.95May–October �1.84 Chen (1996)November–April �0.35May–October �1.43 Chen (1998)November–April �1.82Annual �1.21 Hung et al. (2003)Summer (August) �0.83 1994 Liu et al. (2000)Winter (March) �0.22
470 J. Zhang et al. / Progress in Oceanography 74 (2007) 449–478

J. Zhang et al. / Progress in Oceanography 74 (2007) 449–478 471
results most likely from consistent remineralization of nitrogen relative to carbon in the water column and aplanktonic community shift from high BSi/POC in the coastal waters (e.g., large-size group domain) seawardsto low BSi/POC (e.g., small-size group domain) ratios in the open shelf, and/or a shift of higher diatom bio-mass versus a lower diatom biomass, consistent with the data of phytoplankton data and sedimentary recordsin the ECS, reflecting that most of the land-derived materials (e.g., allochthonous particulate nutrients) areretained in the inner-shelf, but the autochthonous contributions to the deposition fluxes increases acrossthe shelf.
5.2. Nutrient budgets for the East China Sea Shelf
The nutrient budgets for the East China Sea Shelf are currently evaluated by box-models based on the con-cept of the conservation of water and salt masses (Liu et al., 2003c; Zhang et al., 2004). We update the esti-mates of nutrient budgets by adding data for both summer (June to August) and winter (December toFebruary), respectively, instead of constructing budgets for yearly averages of previous efforts (cf. Chenand Wang, 1999; Liu et al., 2003a), because of important seasonal nature for hydrographic processes (e.g. cir-culation) and regime of chemical properties (e.g. nutrients) in this region (Zhang and Su, 2006). First, themass-balance principle is applied to check the water and salt budgets. In Table 3 we show the data for waterflow on the East China Sea Shelf that are available from the literature and used by previous studies, includingdiagnostic analyses and model simulations. Table 3 and Fig. 1 show considerable variability in hydrographicparameters (i.e., salinity and temperature), partly because of disagreement in water flow data from differentsources and/or studies. In Tables 2 and 4 we have summarized the water flow, salinity and nutrient budgetcalculations used in this study, which are primarily based on in situ measurements. The values used are inagreement with the recent numerical model diagnosis (cf. Guo et al., 2006). The water balance, salinity andnutrient budgets for the East China Sea Shelf include:
TableWater
Season
KurosSumWin
TaiwaSumWin
YellowSumWin
AtmosSumWin
RiverinSumWin
SMWSumWin
Data foutput
Xn
i¼1
WFi þ DQ ¼ 0 ð1Þ
4(Sv), salinity and nutrient (kmol s�1) fluxes for the East China Sea Shelf
Water Salinity NO�3 NHþ4 PO3�4 SiO2�
3
hiomer 0.84–0.94 34.2–34.8 4.25–24.5 0.21–0.91 0.32–1.51 5.82–66.4ter 1.61–1.81 34.4–34.9 11.2–47.2 0.968 0.61–2.91 17.2–128
n Straitmer 1.88–3.16 33.6–34.2 1.88–15.6 1.06–1.79 0.24–1.55 8.46–24.6ter 0.14–2.74 33.3–34.0 0.28–12.9 0.08–1.55 0.04–1.23 1.16–57.5
Seamer 0.009 31.15–32.75 0.005–0.052 0.001–0.023 0.001–0.005 0.025–0.108ter 0.013 32.1–33.15 0.01–0.118 0.0001–0.025 0.002–0.010 0.003–0.231
pheric depositionsmer 0.024–0.027 0 0.16–0.59 0.10–1.49 0.0004–0.003 0.008–0.086ter 0.004–0.018 0 0.22–1.20 0.67–1.87 0.0003–0.005 0.010–0.024
e inputmer 0.036–0.046 0 0.75–8.65 0.035–0.63 0.001–0.041 0.34–9.19ter 0.011–0.014 0 0.10–1.82 0.054–0.43 0.0002–0.011 0.25–2.32
mer 2.77–4.16 31.15–34.30 1.39–25.5 0.89–4.59 0.20–1.59 16.6–55.1ter 1.77–4.56 33.40–34.70 4.25–40.1 0.57–1.46 0.41–2.96 10.6–72.9
or individual pathways are classified for summer (June to August) and winter (December to February) seasons. The box-modelaverages are shown in Fig. 13.

472 J. Zhang et al. / Progress in Oceanography 74 (2007) 449–478
and
Xn
i¼1
WFi � Ci þ DMi ¼ 0 ð2Þ
where WFi represents the water flux for inputs (+) and outflows (�) over the shelf, DQ stands for the watermass due to sea level change in ECS, Ci are the salinity and nutrient concentrations for a given water mass (i),DMi represents the accumulation and/or removal of species, including at the sediment–water interface, air–seaexchange, sediment deposition and off-shelf particle export. This approach to nutrient budgetary calculationdiffers from previous LOICZ (Land–Ocean Interactions in the Coastal Zone) procedures (Gordon et al.,1996), because the limited data sets from the ECS do not allow specifying the ‘‘mixing terms’’ for water chan-nels/straits and/or at the open boundary. The inflow to the East China Sea Shelf includes the water fluxthrough the Taiwan Strait (TCWW), riverine input from the land-mass (of which the Changjiang accountsfor ca. 90–95% or greater), precipitation, and the incursion of the Kuroshio from north of Taiwan and overthe broad shelf mainly composed of KSW (i.e., 25%) and KSSW (i.e., 75%). The boundary between the ECSand the Yellow Sea (YS) is set from the northern tip of the mouth of the Changjiang to Cheju Island, and theexchange between these two water bodies is taken into account as well, which is largely compensated by theCheju Current (Lee and Chao, 2003; Teague et al., 2003). The outflow includes currents through the Tsu-shima/Korea Strait and water loss owing to evaporation. The influence of groundwater is not incorporatedat present, because no data are available for the ECS. With regard to the nutrients, the atmospheric dryand wet depositions are included based on data from ship-board measurements and observations from islandstations (Zhang, 2004b; Zhang et al., 2005, and unpublished data). Data for riverine nutrients are from ouron-going monitoring project at Changjiang, together with measurements from other rivers emptying intothe East China Sea, including, Qiantangjiang, Oujiang, Minjiang and Jiulongjiang, farther to China’s south(Zhang, 2002). The nutrient flux for sediment–water interface exchange is from measurements of this studyand within the GLOBEC-China Project (1999–2004) (Liu et al., 2005). Tables 2–4 provide the major charac-teristics of water masses and nutrient species for the East China Sea Shelf and Fig. 13 summarizes the resultsof budgetary calculations.
When examining the water budgets of the East China Sea Shelf, the total water inflow in summer is3.35 Sv, of which the incursion of Kuroshio represents 26% and water through the Taiwan Strait is 70%;the land-source input via river is 0.04 Sv, and precipitation accounts for 0.03 Sv, respectively (Table 4and Fig. 13). The outflow in summer is essentially through Tsushima/Korea Strait, and the out-flux intothe YS through water exchange is �0.01 Sv. In winter the inflow from Taiwan Strait is reduced to1.2 Sv, Kuroshio shelf incursion increases to 1.8 Sv, riverine inflow drops to 0.01 Sv, and the ECS receives�0.01 Sv influx from the YS. Consequently the outflow through the Tsushima/Korea Strait decreases to3.1 Sv (Table 4 and Fig. 13).
The silicate carried by the Kuroshio incursion is 6.20 kmol s�1 in summer and 23.7 kmol s�1 in winter,which is 2–20 times that the supply via river inflow, but comparable on an annual basis with input throughTaiwan Strait (Fig. 13). The total input and output differ by 25–30%, indicating that the East China Sea Shelfserves as a sink for dissolved silicate (Liu et al., 2005). The Kuroshio’s incursion transports phosphate at0.38 kmol s�1 in summer, which compares well with the supply from Taiwan Strait (i.e., 0.36 kmol s�1). Inwinter the Kuroshio’s intrusion across the shelf-break brings 0.92 kmol s�1 of phosphate on to the ECS Shelf,i.e., twice that through the Taiwan Strait (0.46 kmol s�1). The Kuroshio waters carry 25–100-fold more phos-phate than the delivery by rivers and the atmosphere (i.e., dry and wet) depositions (Fig. 13), and hence shouldbe considered a major source for support of primary and new production over the ECS. The total input andoutflow differ by 5% for phosphate in winter and 25% in summer, indicating substantial removal (e.g., biolog-ical uptake and sediment associated processes that is not included) of PO3�
4 over the East China Sea Shelf.The Kuroshio brings 5.43 kmol s�1 of nitrate to the ECS Shelf in summer, which is �75% of that delivered
by waters from the Taiwan Strait. In winter nitrate flux of the Kuroshio incursion (12.6 kmol s�1) can be twiceas high as through the Taiwan Strait (5.73 kmol s�1). Riverine input in this region is 2.76 kmol s�1 for nitratein summer, which is 3-fold higher than in winter (Zhang, 2004b). Atmospheric wet plus dry deposition delivers0.37 kmol s�1 of nitrate in summer, but in winter the atmospheric wet and dry depositions are comparable to

a. Summer
River
NO3-:2.76
NH4+: 0.182
PO43-: 0.013
SiO32-: 3.94
Bottom sediment
NO3-: 0.11
NH4+: 1.01
PO43-: 0.025
SiO32-: 2.51
Taiwan Strait
NO3-: 7.10
NH4+: 1.35
PO43-: 0.359
SiO32-: 14.7
Kuroshio
NO3-: 5.43
NH4+: 0.47
PO43-: 0.384
SiO32-: 6.20
Yellow Sea
NO3-: 0.027
NH4+: 0.008
PO43-: 0.004
SiO32-: 0.107
Atmosphere
NO3-: 0.37
NH4+: 0.80
PO43-: 0.002
SiO32-: 0.047
Outflow
NO3-: 11.8
NH4+: 2.38
PO43-: 0.57
SiO32-: 20.1
East China Sea Shelf
River
NO3-:0.765
NH4+: 0.195
PO43-: 0.006
SiO32-: 1.37
East China Sea Shelf
Bottom sediment
NO3-: 0.11
NH4+: 1.01
PO43-: 0.025
SiO32-: 2.51
Kuroshio
NO3-: 12.6
NH4+: 0.97
PO43-: 0.92
SiO32-: 23.7
Atmosphere
NO3-: 0.71
NH4+: 1.27
PO43-: 0.003
SiO32-: 0.017
Outflow
NO3-: 17.1
NH4+: 0.98
PO43-: 1.34
SiO32-: 33.6
b. Winter
Taiwan Strait
NO3-: 5.73
NH4+: 0.69
PO43-: 0.46
SiO32-: 17.9
Yellow Sea
NO3-: 0.053
NH4+: 0.013
PO43-: 0.006
SiO32-: 0.111
Kuroshio
1.81 Sv
Outflow
3.05 Sv
Taiwan Strait
1.22 Sv
Evaporation
0.010 Sv
Precipitation
0.0062 Sv
b. Winter
East China Sea Shelf
Yellow Sea
0.013 Sv
River
0.0122 Sv
a. Summer
River
0.0393Sv
Kuroshio
0.89Sv
Taiwan Strait
2.39Sv
Outflow
3.33Sv
Yellow Sea
–0.009Sv
Precipitation
0.031Sv
Evaporation
0.0068Sv
East China Sea Shelf
13-1 13-2
Fig. 13. Box-model output, which shows (13-1) water budgets (Sv) for the East China Sea Shelf and (13-2) nutrient (NO�3 , NHþ4 , PO3�4 and
SiO2�3 ) fluxes (kmol s�1) in summer (upper panel) and winter (lower panel), respectively. For comparison, the previous estimates of water
budgets in literature and ranges of nutrient fluxes in box-model calculations are provided in Tables 3 and 4.
J. Zhang et al. / Progress in Oceanography 74 (2007) 449–478 473
the riverine input (Fig. 13). For both winter and summer, nitrate inflow from and outflow to the YS can be 1–2orders of magnitude lower than other pathways. The incursion of Kuroshio Waters carries 0.47 kmol s�1 insummer and 0.97 kmol s�1 in winter of ammonium, and ammonium arriving through Taiwan Strait is1.35 kmol s�1 in summer and 0.69 kmol s�1 in winter (Fig. 13). Atmospheric deposition of ammonia is0.80 kmol s�1 in summer and 1.27 kmol s�1 in winter, which can be 4–5-fold higher than riverine input(Zhang, 2004b). The export of nutrients is most likely in SMW (Shelf Mixed Water) through the Tsu-shima/Korea Strait. Overall outflow of NHþ4 off the shelf can be half the influx in winter, suggesting the impor-tance of the nitrification that takes place when the water column becomes well mixed, stirred by the northeastmonsoon over the East China Sea (Table 4). The nitrogen budget is more difficult to calculate relative to dis-solved silicate and phosphate in the East China Sea, because anaerobic processes (e.g., denitrification) convertnitrate and fixed nitrogen to NH3, N2 and N2O, which then degas at the surface, whereas nitrogen fixation bycertain phytoplankton species (e.g., cyanobacteria) utilizes N2, for which very few data exist from this region.
The significance of the Kuroshio incursion to the nutrient budgets over the East China Sea Shelf was rec-ognized in prior studies (e.g., Chen and Wang, 1999; Liu et al., 2003a) and is reinforced by this study based onnewer and more extensive data sets.
An independent check on the nutrient budgets can be performed by examining the sediment–water interfaceexchange fluxes based on the data of sediment cores, and comparison of primary production with sedimentdeposition and export of particulate materials off the shelf. The average primary productivity for the ECS

474 J. Zhang et al. / Progress in Oceanography 74 (2007) 449–478
is 145 g C m�2 yr�1 (Gong et al., 2003). Given the surface area of �0.55 · 106 km2 over the shelf region atwater depths <200 m, the total primary production would be �80 · 106 tons C yr�1. Taking into accountthe Redfield stoichiometric ratio for plant macronutrients (C:N:P = 106:16:1), primary producers would fix1.0 · 1012 mol yr�1 of nitrogen and 0.063 · 1012 mol yr�1 of phosphorus.
Data from in situ incubations and pore-water profiles provide estimates of sediment to water exchange fluxover the entire shelf of 3.6 · 109 mol yr�1 for NO�3 , 32 · 109 mol yr�1 for NHþ4 , 0.8 · 109 mol yr�1 for PO3�
4
and 79 · 109 mol yr�1 for dissolved silicate (S.M. Liu, unpublished data).Sediment accumulation rate varies considerably in the East China Sea Shelf, with 1.5–2 g cm�2 yr�1 on the
inner-shelf off the Changjiang Estuary, 0.2–0.4 g cm�2 yr�1 on the mid-shelf, 0.1–0.15 g cm�2 yr�1 in the slopearea, and decreasing to 0.050 g cm�2 yr�1 in the Okinawa Trough (Iseki et al., 2003; Oguri et al., 2003). Theorganic carbon concentration in surface sediments increases steadily from 0.2% on the inner-shelf to 1.5–2.0%in the trough area (Oguri et al., 2003 and this study). The resulting organic carbon accumulation rates are�3 mg C cm�2 yr�1 on the inner-shelf, 0.77–1.3 mg C cm�2 yr�1 on the open shelf and 0.42–2.0 mg C cm�2 yr�1 in the Okinawa Trough (Oguri et al., 2003 and this study). Using the average organic car-bon accumulation rate (�1.0 mg C cm�2 yr�1) and surface area of East China Sea Shelf, organic carbon depo-sition would be 0.46 · 1012 mol yr�1, corresponding to the burial of 69.2 · 109 mol yr�1 for nitrogen and4.3 · 109 mol yr�1 for phosphorus. The N and P burial rates are in fair agreement with the sediment–waterexchange flux plus the difference between in-flux and out-flow of 3.8 · 109 mol yr�1 for phosphate (total:4.6 · 109 mol yr�1) in the East China Sea Shelf, but leaves an �50% deficit for input less outflow forNO�3 þNHþ4 (Fig. 13). Hung et al. (2003) indicate an export of 0.81 ± 2.03 · 109 mol yr�1 of dissolved organicphosphorus off the shelf. Moreover, based on the TOC/OP ratio of 75.5 ± 10.5 from sediment cores of thisstudy and the estimated organic carbon accumulation rate, the burial of phosphorus is estimated at 5.3–6.9 · 109 mol yr�1, which compares well with the budgetary difference in Table 4 and Fig. 13. These data alsoindicate that on an annual average only 5–10% of photosynthetic fixed phosphorus can reach the sea bottomin the East China Sea Shelf.
The output and input differ by 15–25% for nitrate and 15–70% for ammonium, with the larger differenceoccurring for NHþ4 in winter, presumably owing to strong vertical mixing accompanied by nitrification. Mea-surements from some compartments (e.g., gas species) are not complete and/or transformation processes (e.g.,nitrification and denitrification) are poorly understood for nitrogen relative to phosphorus and dissolved sil-icate. If nitrate and ammonia are combined, the export and input terms differ by only 15% on an annual basis,a much better result for the nitrogen mass-balance. This implies that transformation between oxidized (i.e.,NO�3 ) and reduced (e.g., NHþ4 ) forms may affect the nitrogen budgets for the entire ECS Shelf. The POC/PN ratio in our samples for settling particles and sediment cores shows a wide range of 5–10, with an averageof 8.3 in the mid-shelf, which produces nitrogen burial of 67.8 · 109 mol yr�1, accounting for 5–10% of nitro-gen fixation by photosynthesis and confirming an earlier estimate of organic nitrogen burial within 10% (cf.Oguri et al., 2003). In previous budgets, Chen and Wang (1999) assumed 30 · 109 mol yr�1 of atmosphericdeposition and �50 · 109 mol yr�1 as degassing of N2 by denitrification. Liu et al. (2003a) estimate denitrifi-cation at 37 · 109 mol yr�1 in order to maintain a mass-balance. Sediment trap data (POC/PN: �6.5) allowsan estimate of nitrogen deposition of 65–75 · 109 mol yr�1 on the shelf (Iseki et al., 2003). Hung et al. (2003)estimate an export flux of 28.7 ± 45.5 · 109 mol yr�1 for dissolved organic nitrogen (DON) off the shelf. Thusthe sediment burial of nitrogen and DON off-shelf export in combination account for �60% of the in-flux andoutflow difference plus sediment pore-water nutrient contribution for NO�3 þNHþ4 . Because the imbalance ofin-flux and outflow for nitrate is 40% higher than for NHþ4 and a high DIN/DIP ratio occurs in coastal waters,denitrification is assumed to be an important compensatory mechanism over the shelf, but its significance inbalancing the nitrogen budget at all spatial and temporal scales remains poorly documented.
In addition, the East China Sea Shelf is a net source of atmospheric N2O. Field measurements in 2003showed that sea-to-air fluxes of N2O ranged from �0.515 lmol m�2 d�1 to 81.4 lmol m�2 d�1 with an averageof 14.8 ± 23.9 lmol m�2 d�1, for estimates made using the LM86 equation (Zhang, 2004a). The flux estimateis �0.988 lmol m�2 d�1 to 143 lmol m�2 d�1 with an average of 25.7 ± 39.5 lmol m�2 d�1 using the W92equation (Zhang, 2004a). Sea-to-air flux of N2O decreases from the eutrophic coastal waters adjacent tothe Changjiang Estuary to the open East China Sea Shelf, with a shelf-wide average of 61.2 ± 33.0lmol m�2 d�1 (LM86 equation) or 100.1 ± 53.9 lmol m�2 d�1 (W92 equation). The emission rate of N2O

J. Zhang et al. / Progress in Oceanography 74 (2007) 449–478 475
from the East China Sea Shelf can be 2.97 · 109 mol yr�1 to 5.16 · 109 mol yr�1, respectively, taking the resultby LM86 as a lower limit and that of W92 as an upper limit (Zhang, 2004a).
Sediment trap data show biological silica (BSi) concentration of 1–2% in the upper water column over theshelf, and 0.4–0.5% in bottom waters (Iseki et al., 2003), which compares well to the down-core distribution ofBSi in Fig. 10. This in combination with data for sedimentation rate (0.3 g cm�2 yr�1), results in265 · 109 mol yr�1 for BSi burial in surface sediments of the East China Sea Shelf. The BSi burial rate matches�85–90% of the budgetary calculation for influx less output plus sediment–water interface exchange. Themissing amount is presumably due to the off-shelf export of particles, which is not well known.
The application of box models has an implicit assumption of steady state of flux-related hydrographic andchemical properties, and the biogeochemistry related to any dynamic process is not considered. To better con-strain the uncertainty of budget calculations, more observations are required to understand the biogeochem-ical processes of the East China Sea.
6. Summary and concluding remarks
The coastal waters of the East China Sea receive an ever increasing input of land- and air-source nutrientsand other pollutants, with likely consequences to the ecosystem. The fate of these increasing inputs of nutri-ents is important to better understand the nutrient budgets on a continental shelf with symptoms ofeutrophication.
The regeneration of nutrient species takes place in the near-bottom waters of the inner-shelf, although thesimple dilution of riverine concentrations dominates the nutrient regimes in surface waters, particularly insummer when the Changjiang floods. This leads to the scattering of nutrient data when plotted against salinityfor samples taken from beneath the pycnocline, and shows a concentration gradient when surface and near-bottom samples are compared. In winter, the concentrations of nutrients from surface and near-bottom sam-ples become closer, compared to the more disperse distributions found in summer observations. This suggeststhat regeneration of nutrient species is probably weak in winter, presumably owing to the temperature regu-lation of mineralization. Alternatively, strong vertical mixing in winter can effectively reduce differences inconcentration–salinity plots between surface and near-bottom waters. Mixing also decreases the flushing timeof water parcels.
The Changjiang buoyant plume disperses eastward and reaches as far as the shelf break. The incursion ofthe Kuroshio can be seen in the deep waters beneath the pycnocline at 50–100 m over the mid-shelf. Relativeto the eutrophic coastal waters, the incursion of Kuroshio has higher DIP/DOP and NO�3 =ðNHþ4 þDONÞratios, hence more labile phosphorus and oxidized nitrogen to support biological uptake. The comparisonof DIP/DOP and NO�3 =ðNHþ4 þDONÞ suggests that regeneration of phosphorus can be faster than nitrogenin the East China Sea Shelf, and the DIP/DIN ratio also has higher values at the surface than in deep waters ofthe open shelf beneath the pycnocline.
Given the short flushing time of waters on the East China Sea Shelf, pumping of nutrients via shelf incur-sion of Kuroshio Sub-surface Waters in autumn and winter can be an important source sustaining phyto-plankton blooms and peak rates of primary production in spring over the East China Sea Shelf. This isfavored by vertical mixing driven by the northeast monsoons starting in late autumn and winter. Also in win-ter, the riverine influx is at the annual minimum in this region, and circulation drives land-source nutrientssouthward along the coast of China, rather than their dispersal over the broad open shelf region. Thus, itappears that increases in nutrients to the shelf from land- and air-based sources are the drivers in the eutro-phication of the shelf, and the Kuroshio intrusion maintains the natural (e.g., annual) cycle for this system. Insummer the dispersal of river plumes over the shelf increases buoyancy effects, and the southern monsooninduces coastal upwelling. Large rivers emptying into the East China Sea have extremely high DIN/DIPratios. Although the land-source supplies abundant nutrients, they have a skewed ratio of replete nitrogen rel-ative to phosphorus (i.e., P limitation), so that the primary production relies on the contribution and/or com-pensation by KSSW intrusion that provides with allochthonous sources for phosphate and/or dissolvedsilicate relative to nitrogen. This off-shore phosphorus source, however, is inhibited by the strong stratification(i.e., pycnocline) on the shelf in summer. At the surface TCWW and KSW are both devoid of plant nutrients,diluting the abundant nutrients (i.e., nitrogen) from the Changjiang. Hence the broad ECS Shelf behaves as a

476 J. Zhang et al. / Progress in Oceanography 74 (2007) 449–478
transition region where photosynthesis changes from P-limitation in the coast to the N-limitation and/or evenSi-limitation further off-shore in the open Kuroshio, particularly in summer when the riverine (e.g., Changji-ang) influx is maximum. Additionally, the high nitrate relative to phosphate from land input promotes hetero-trophic denitrification in coastal waters, with an important sea-to-air emission of N2O and probably also N2
transfer to the atmosphere, seen by previous observations.Revised nutrient box-model budgets for the East China Sea Shelf take into account monitoring and field
observation data for river inputs, atmospheric dry and wet depositions, and sediment–water interfaceexchange fluxes. The revised budgets separate nitrate and ammonium, whereas previous studies consideredeither only nitrate or these two forms combined. The Yellow Sea and East China Sea are separated in ourbox model, while until recently the budgetary approaches have combined these two different water bodies.The deficit of outflow relative to influx has been identified for nitrogen species (�40%) and to a lesser extentfor dissolved silicate (�10–15%), indicating that the East China Sea Shelf is a sink of nutrients and hence car-bon in terms of material flux from land (i.e., Asia) to the open ocean (i.e., NW Pacific). However, these resultscan also be affected by uncertainties in estimates of organic fractions of nutrients and particulate forms in thisand/or previous studies. Also, the air–sea flux of gaseous nitrogen forms is not yet well constrained. Even withthe updated nutrient data and refinement of water flux, it is still difficult to balance nutrients at monthly toseasonal scales in the East China Sea Shelf, with uncertainties better than 10–20%. However, based on theavailable data, it is unlikely that East China Sea Shelf actually exports substantial amounts of biologicallyactive elements (e.g., nutrients) to the Northwest Pacific Ocean.
Acknowledgements
This work was funded by the Ministry of Science and Technology of China through Contract Nos.2006GB400601 and 2001CB409703, by Ministry of Education of China (No. IRT0427) and Natural ScienceFoundation of China (No. 40476036). We thank Drs. Q. He, L.X. Dong, X.N. Li, H. Wei, and colleaguesfrom Marine Biogeochemistry Laboratory (OUC), and State Key Laboratory of Estuarine and CoastalResearch (ECNU) for the assistance in field observations and laboratory sample analyses. The authors expresstheir gratitude to Profs. C.B. Miller, C. Werner and anonymous reviewers for the critical comments, correc-tions and suggestions, which helped improve the original manuscript.
References
Anderson, D.M., Glibert, P.M., Burkholder, J.M., 2002. Harmful algal blooms and eutrophication: nutrient sources, composition, and
consequences. Estuaries 25, 704–726.
Aspila, K.I., Agemian, H., Chau, A.S.W., 1976. A semi-automated method for the determination of inorganic, organic and total
phosphate in sediments. Analyst 101, 187–197.
Behrendt, H., Kornmilch, M., Opitz, D., Schmoll, O., Scholz, G., 2002. Estimation of the nutrient inputs into river systems – experiences
from German rivers. Reg. Environ. Change 3, 107–117.
Changjiang Water Conservancy, 2000. The 1998 Changjiang Floods, Hydrographic Monitoring and Prediction. China Hydraulic and
Electric Press, Beijing, 200 pp (in Chinese).
Chen, C.T.R., 1996. The Kuroshio intermediate water is the major source of nutrients on the East China Sea continental shelf. Oceanol.
Acta 19, 523–527.
Chen, C.T.R., 1998. Response to Liu’s comments on The Kuroshio Intermediate Water is the major source of nutrients on the East China
Sea continental shelf’’ by Chen (1996). Oceanol. Acta 21, 713–716.
Chen, C.T.R., Wang, S.L., 1999. Carbon, alkalinity and nutrient budgets on the East China Sea continental shelf. J. Geophys. Res. 104,
20675–20686.
Chen, Z.Y., Saito, Y., Kanai, Y., Wei, T.Y., Li, L.Q., Yao, H.S., Wang, Z.H., 2004. Low concentration of heavy metals in the Yangtze
estuarine sediments, China: a diluting setting. Est. Coast. Shelf Sci. 60, 91–100.
Chung, S.-W., Jan, S., Liu, K.-K., 2001. Nutrient fluxes through the Taiwan Strait in Spring and Summer 1999. J. Oceanogr. 57, 47–53.
Conley, D.J., 1998. An inter-laboratory comparison for the measurement of biogenic silica in the sediments. Mar. Chem. 63, 39–48.
DeMaster, D.J., 1981. The supply and accumulation of silica in the marine environment. Geochim. Cosmochim. Acta 45, 1715–1732.
Gong, G.Q., Wen, Y.H., Wang, B.W., Liu, G.J., 2003. Seasonal variation of chlorophyll-a concentration, primary production and
environmental conditions in the subtropical East China Sea. Deep-Sea Res. II 50, 1219–1236.
Gordon, D.C., Boudreau, P.R., Mann, K.H., Ong, J.-E., Silver, W.L., Smith, S.V., Wattayakorn, G., Wulff, F., Yanagi, T., 1996. LOICZ
Biogeochemical Modeling Guidelines. LOICZ Reports and Studies 5, LOICZ, Texel, The Netherlands, 96 pp.
Grasshoff, K., Kremling, K., Ehrhardt, M., 1999. Methods of Seawater Analysis, third ed. WILEY-VCH, Weinheim, 600 pp.

J. Zhang et al. / Progress in Oceanography 74 (2007) 449–478 477
Gu, D.Y., Chen, L.Z., Guo, S.H., 1992. Temporal and special variations of nutrients in western part of Taiwan Strait and their relations to
hydrological and biological factors. Tropic Oceanol. 11, 96–100 (in Chinese).
Guo, X.Y., Miyazawa, Y., Yamagata, T., 2006. The Kuroshio onshore intrusion along the shelf break of the East China Sea: the origin of
the Tsushima Warm Current. J. Phys. Oceanogr. 36, 2205–2231.
Hong, G.H., Kremer, H.H., Pacyna, J., Chen, C.T.A., Behrendt, H., Salmons, W., Marshall Crossland, J.I., 2002. East Asian Basins:
LOICZ Global Change Assessment and Synthesis of River Catchment – Coastal Sea Interaction and Human Dimensions. LOICZ
Reports & Studies No. 26: ii+262 pages, LOICZ, Texel, The Netherlands.
Hung, J.-J., Chen, C.-H., Gong, G.-C., Sheu, D.-D., Shiah, F.-K., 2003. Distributions, stoichiometric patterns and cross-shelf exports of
dissolved organic matter in the East China Sea. Deep-Sea Res. II 50, 1127–1145.
Ichikawa, H., Chaen, M., 2000. Seasonal variation of heat and freshwater transports by the Kuroshio in the East China Sea. J. Mar. Syst.
24, 119–129.
Iseki, K., Okamura, K., Kiyomoto, Y., 2003. Seasonality and composition of downward particulate fluxes at the continental shelf and
Okinawa Trough in the East China Sea. Deep-Sea Res. II 50, 457–473.
Isobe, A., 1999. On the origin of the Tsushima Warm Current and its seasonality. Cont. Shelf Res. 19, 117–133.
KORDI, 1998. Study on Water Circulation and material Flux in the Yellow Sea. Korean Ocean Research and Development Institute,
Seoul, 97-LO-01-A-03, p. 437 (in Korean).
Lee, H.J., Chao, S.Y., 2003. A climatological description of circulation in and around the East China Sea. Deep-Sea Res. II 50, 1065–1084.
Li, D.J., Zhang, J., Huang, D.J., Wu, Y., Liang, J., 2002. Oxygen depletion off the Changjiang (Yangtze River) Estuary. Sci. China 45D,
1137–1146.
Li, X.N., Zhou, W.H., Liu, S.M., Zhang, J., 2003. Sediment chlorophyll pigments in HABs (Harmful Algal Blooms) area of the East
China Sea. Chin. J. Appl. Ecol. 14, 1102–1106 (in Chinese).
Lin, H.Y., Han, W.Y., Cai, Y.Y., Wu, X.L., Rong, R.G., Huang, X.N., 1998. Chemistry of coastal waters in the South China Sea. In:
Han, W.Y. (Ed.), Chemistry of the South China Sea. Science Press, Beijing, pp. 40–166 (in Chinese).
Liu, K.-K., 1998. Comments on ‘‘The Kuroshio Intermediate Water is the major source of nutrients on the East China Sea continental
shelf’’ by Chen (1996). Oceanol. Acta 21, 709–712.
Liu, K.-K., Tang, T.Y., Gong, G.-C., Chen, L.-Y., Shiah, F.-K., 2000. Cross-shelf and along-shelf nutrient fluxes derived from flow fields
and chemical hydrography observed in the southern East China Sea off northern Taiwan. Cont. Shelf. Res. 20, 493–523.
Liu, S.M., Ye, X.W., Zhang, J., Zhao, Y.F., 2002. Problems with biogenic silica measurement in marginal seas. Mar. Geol. 192, 383–392.
Liu, K.-K., Gong, G.-C., Wu, C.-R., Lee, H.-J., Lee, B.-S., 2003a. Biogeochemistry of the Kuroshio and the East China Sea. In: Liu,
K.K., Atkinson, L., Quinones, R., Talaue-McManus, L. (Eds.), Carbon and Nutrient Fluxes in Continental Margins: A Global
Synthesis. Springer-Verlag, New York.
Liu, S.M., Zhang, J., Chen, H.T., Wu, Y., Xiong, H., Zhang, Z.F., 2003b. Nutrients in the Changjiang and its tributaries. Biogeochemistry
62, 1–18.
Liu, S.M., Zhang, J., Chen, S.Z., Chen, H.T., Hong, G.H., Wei, H., Wu, Q.M., 2003c. Inventory of nutrient compounds in the Yellow Sea.
Cont. Shelf Res. 23, 1161–1174.
Liu, S.M., Zhang, J., Li, D.J., 2004. Phosphorus cycling in sediments of the Bohai and Yellow Seas. Est. Coastal Shelf Sc. 59, 209–218.
Liu, S.M., Zhang, J., Li, R.X., 2005. Ecological significance of biogenic silica in the East China Sea. Mar. Ecol. Prog. Ser. 290, 15–26.
Miita, T., Ogawa, Y., 1984. Tsushima Current Measured with Current Meters and Drifters Ocean Hydrodynamics of the Japan and East
China Sea. Elsevier, Amsterdam, pp. 66–76.
Mortlock, R.A., Froelich, P.N., 1989. A simple method for the rapid determination of biogenic opal in pelagic marine sediments. Deep-
Sea Res. 36, 1415–1426.
Nolting, R.F., Helder, W., De Baar, H.J.W., Gerringa, L.L.A., 1999. Contrasting behavior of trace metals in the Scheldt Estuary in 1978
compared to recent years. J. Sea Res. 42, 275–290.
Oguri, K., Matsumoto, E., Yamada, M., Saito, Y., Iseki, K., 2003. Sediment accumulation rates and budgets of depositing particles of the
East China Sea. Deep-Sea Res. II 50, 513–528.
Pan, L.A., 2005. Preliminary study of microbial community structure in the East China Sea Shelf and the front region of the northern part
of South China Sea. Thesis for MSc., East China Normal University, Shanghai, p. 141.
Pan, L.A., Zhang, L.H., Zhang, J., Gasol, J.M., Chao, M., 2005. On board flow cytometric observations of picoplankton community
structure in the East China Sea during the fall of different years. FEMS Microbiol. Ecol. 52, 243–253.
Qi, X.H., Liu, S.M., Zhang, J., Chen, H.T., 2003. Nutrient regeneration rate of sediments in HABs (Harmful Algal Blooms) area of the
East China Sea. Chin. J. Appl. Ecol. 14, 1112–1116 (in Chinese).
Rabalais, N.N., Turner, R.E., Dortch, Q., Justic, D., Bierman Jr., V.J., Wiseman Jr., W.J., 2002. Nutrient-enhanced productivity in the
northern Gulf of Mexico: past, present and future. Hydrobiologia 176, 39–63.
Rabouille, C., Mackenzie, F.T., Ver, L.M., 2001. Influence of the human perturbation on carbon, nitrogen, and oxygen biogeochemical
cycles in the global coastal ocean. Geochim. Cosmochim. Acta 65, 3615–3641.
Scavia, D., Rabalais, N.N., Turner, E.R., Justic, D., Wiseman Jr., W.J., 2003. Predicting the response of Gulf of Mexico hypoxia to
variations in Mississippi River nitrogen load. Limnol. Oceanogr. 48, 951–956.
Seitzinger, S.P., Kroeze, C., Bouwman, A.F., Caraco, N., Dentener, F., Styles, R.V., 2002. Global patterns of dissolved inorganic and
particulate nitrogen inputs to coastal systems: recent conditions and future projections. Estuaries 25, 640–655.
SPCC Co., 2001. SPSS for Windows in Medical Science (Ed. B.R. Ma), Science Press, Beijing, 207 pp (in Chinese).
Su, J.L., 1998. Circulation dynamics of the China Seas north of 18�N. In: Robinson, A.R., Brink, K.H. (Eds.), The Sea, vol. 11. John
Wiley & Sons Inc., New York, pp. 483–505.

478 J. Zhang et al. / Progress in Oceanography 74 (2007) 449–478
Talaue-McManus, L., Kremer, H.H., Marshall Crossland, J.I., 2001. SARCS/WOTRO/LOICZ, Biogeochemical and human dimensions
of coastal functioning and change in Southeast Asia. Final report of the SARCS/WOTRO/LOICZ project 1996–1999, LOICZ Reports
& Studies No. 17, ii+277 pages, LOICZ, Texel, The Netherlands.
Teague, W.J., Jacobs, G.A., Ko, D.S., Tang, T.Y., Chang, K.-I., Suk, M.-S., 2003. Connectivity of the Taiwan, Cheju, and Korea straits.
Cont. Shelf Res. 23, 63–77.
Toba, Y., 1992. Seasonal and year-to-year variability of the Tsushima–Tsugaru Warm Current system with its possible cause. Lame 20,
41–51.
Turner, R.E., Rabalais, N.N., Justic, D., Dortch, Q., 2002. Global patterns of dissolved N, P, and Si in large rivers. Biogeochemistry 64,
297–317.
Wang, S.J., Huang, Z.Q., 1998. Fluxes of seawater and some nutrients in summer in Taiwan Strait. J. Oceanogr. Taiwan Strait 17, 275–277
(in Chinese).
Wang, Y.H., Jan, S., Wang, D.P., 2003. Transport and tidal current estimates in the Taiwan Strait from shipboard ADCP observations
(1999–2001). Est. Coast. Shelf Sci. 57, 193–199.
Wei, H., Su, J., Tian, T., Sun, W.X., 2002. Nutrients transport in the Yellow Sea. In: Hong, G.H., Zhang, J., Chung, C.S. (Eds.), Impact of
Interface Exchange on the Biogeochemical Processes of the Yellow and East China Seas. Bum Shin Press, Seoul, pp. 85–499.
Wu, Y., Zhang, J., Li, D.J., Wei, H., Lu, R.X., 2003. Isotope variability of particulate organic matter at the PN section in the East China
Sea. Biogeochemistry 65, 31–49.
Yang, S.L., Zhao, Q.Y., Belkin, I.M., 2002. Temporal variation in the sediment load of the Yangtze River and the influences of the human
activities. J. Hydrol. 263, 56–71.
Zhang, J., 1996. Nutrient elements in the Chinese estuaries. Cont. Shelf Res. 16, 1023–1045.
Zhang, J., 2002. Biogeochemistry of Chinese estuarine and coastal waters: nutrients, trace metals and biomarkers. Reg. Environ. Change
3, 65–76.
Zhang, G.L., 2004a. Studies on biogeochemistry of dissolved methane and nitrous oxide in the coastal waters of China. Ph.D Thesis,
Ocean University of China, Qingdao, p. 158 (in Chinese).
Zhang, G.S., 2004b. Impact of atmospheric dry and wet depositions on the ecosystems of the Yellow Sea and East China Sea. M.Sc Thesis,
Ocean University of China, Qingdao, p. 75 (in Chinese).
Zhang, J., Su, J.L., 2006. Nutrient dynamics of the China Seas: the Bohai Sea, Yellow Sea, East China Sea and South China Sea. In:
Robinson, A.R., Brink, K.H. (Eds.), The Sea, vol. 14. Harvard University Press, Cambridge, pp. 637–671.
Zhang, J., Xu, J., Liu, S.M., Xu, H., Yu, Z.G., Xue, D.Q., 1999a. Nutrient element distributions in the meso-tidal Shuangtaizihe Estuary
from North China. J. Coastal Res. 15, 526–536.
Zhang, J., Zhang, Z.F., Liu, S.M., Wu, Y., Xiong, H., Chen, H.T., 1999b. Human impacts on the large world rivers: would the Changjiang
(Yangtze River) be an illustration? Global Biogeochem. Cycles 13, 1099–1105.
Zhang, J., Cooper, L.W., Wu, Y., Hong, G.H., Liu, S.M., Chung, C.S., Kim, S.H., Kim, Y.I., 2002. Elemental and isotopic composition
of carbon and nitrogen of organic matter in plant and soils in the river bank and suspended particulate matter of the Changjiang
(Yangtze River). In: Hong, G.H., Zhang, J., Chung, C.S. (Eds.), Impact of Interface Exchange on the Biogeochemical Processes of the
Yellow and East China Seas. Bum Shin Press, Seoul, pp. 189–232.
Zhang, J., Yu, Z.G., Raabe, T., Liu, S.M., Starke, A., Zou, L., Gao, H.W., Brockmann, U., 2004. Dynamics of inorganic nutrient species
in the Bohai seawaters. J. Mar. Syst. 44, 189–212.
Zhang, J., Zhang, G.S., Liu, S.M., 2005. Dissolved silicate in coastal marine rain-waters: comparison between the Yellow Sea and East
China Sea on the impact and potential link with primary production. J. Geophys. Res. 110, D1634. doi:10.1029/2004JD0054.
Zhao, B.R., Fang, G.H., 1991. On the water flux of major channels of the East China Sea. Oceanol. Acta Sinica 13, 169–178 (in Chinese).
Zou, L., 2000. An experimental study on the relationship between nutrients and phytoplankton in the coastal waters of North China.
Ph.D. Thesis, Ocean Univ. Qingdao, Qingdao, p. 134.
Zou, L., Zhang, J., Pan, W.X., Zhan, Y.P., 2001. In situ nutrient enrichment experiment in the Bohai and Yellow Sea. J. Plankton Res. 23,
1111–1119.