Three-Dimensional Velocity Field and Cross-Frontal Water Exchange in the Kuroshio Extension
14
79 Journal of Oceanography, Vol. 56, pp. 79 to 92. 2000 Keywords: ⋅ Kuroshio Exten- sion, ⋅ Kuroshio front, ⋅ isopycnal move- ment, ⋅ cross-frontal exchange. Three-Dimensional Velocity Field and Cross-Frontal Water Exchange in the Kuroshio Extension SUSANA SAINZ-TRÁPAGA and TAKASHIGE SUGIMOTO Ocean Research Institute, University of Tokyo, 1-15-1 Minamidai, Nakano-ku, Tokyo 164-8639, Japan (Received 17 December 1998; in revised form 12 May 1999; accepted 17 May 1999) A spread of warm water from the first crest of the Kuroshio Extension is periodically enhanced by northward warm water intrusions from the main current. The water type in the spread area was previously found to be the same as that in the Kuroshio front at depth. In looking for the possible mechanism responsible for the northward warm water intrusions, a dynamic analysis in the Kuroshio front was carried out by using CTD, ADCP, AVHRR and ARGOS buoy data, obtained in 1996 by the R.V. Hakuho Maru. Downstream, cross-stream and vertical velocities in the Kuroshio Extension were found by using a “stream coordinate system”. The velocity field in the Kuroshio front at the first crest showed a double structure with two surface ve- locity maxima. In the inner part of the front, relatively high cross-stream (north- ward) and vertical (upward) velocities were found. Thus, this study suggests that while water particles flow downstream along the first stationary meander of the Kuroshio Extension, they also experience lateral and vertical movements which al- low the deeper water from an upstream location to rise to the surface layer, and in certain locations to deflect northward. By assuming isopycnal movement and conser- vation of potential vorticity, it was found that in those locations where anticyclonic curvature of the meander increases, warm water is more likely to deflect northward. High ageostrophic components observed in the first 300 m of the water column are probably related to the relatively high cross-stream and vertical velocities in the in- ner part of the front. Gulf Stream (GS) are controlled by very similar physical constraints. In spite of the different topography, the ex- istence of stationary or low-frequency wavelike patterns in the eastward extension of these currents appears to be a common feature (Campos and Olson, 1991). The desire for accurate tracking of fluid parcels and to measure ver- tical velocity directly in the GS led to the construction of the isopycnal drifters called RAFOS, which have nearly the same compressibility as the sea water and can thus follow the vertical motion of fluid parcels along density surfaces (Rossby et al., 1985). Some of the results of the application of this new instrument launched in the main thermocline of the GS are summarized below. A system- atic pattern of vertical motion, closely linked to the me- andering path, was reported by Bower and Rossby (1989), Fig. 1, and cross-frontal exchange was observed to take place as a result of this meander-induced circulation, whereby fluid parcels from the center of the stream are brought close to the edges and are often lost to the sur- roundings. Due to the slope of isopycnals across the 1. Introduction A northward spread of warm water from the Kuroshio Extension is constantly present in the transitional area between the Kuroshio and Oyashio fronts, and the warm water supply seems to occur not in a continuous way but through intermittent intrusions of Kuroshio water, with periods of around 20–40 days (Sainz-Trápaga and Sugimoto, 1998). In our previous study, the T-S proper- ties of the Spread Kuroshio Water were observed to be the same as those found below 300–400 m depth at the Kuroshio front. Thus, to gain an insight into the mecha- nism responsible for the warm water intrusions from the Kuroshio Extension, a detailed analysis is needed of the three-dimensional structure of the velocity field in the Kuroshio front, from which it originates. As western boundary currents, the Kuroshio and the Corresponding author e-mail: [email protected] Copyright © The Oceanographic Society of Japan.
Transcript of Three-Dimensional Velocity Field and Cross-Frontal Water Exchange in the Kuroshio Extension
79
Journal of Oceanography, Vol. 56, pp. 79 to 92. 2000
Keywords:⋅ Kuroshio Exten-sion,
⋅ Kuroshio front,⋅ isopycnal move-ment,
⋅ cross-frontalexchange.
Three-Dimensional Velocity Field and Cross-FrontalWater Exchange in the Kuroshio Extension
SUSANA SAINZ-TRÁPAGA and TAKASHIGE SUGIMOTO
Ocean Research Institute, University of Tokyo,1-15-1 Minamidai, Nakano-ku, Tokyo 164-8639, Japan
(Received 17 December 1998; in revised form 12 May 1999; accepted 17 May 1999)
A spread of warm water from the first crest of the Kuroshio Extension is periodicallyenhanced by northward warm water intrusions from the main current. The watertype in the spread area was previously found to be the same as that in the Kuroshiofront at depth. In looking for the possible mechanism responsible for the northwardwarm water intrusions, a dynamic analysis in the Kuroshio front was carried out byusing CTD, ADCP, AVHRR and ARGOS buoy data, obtained in 1996 by the R.V.Hakuho Maru. Downstream, cross-stream and vertical velocities in the KuroshioExtension were found by using a “stream coordinate system”. The velocity field inthe Kuroshio front at the first crest showed a double structure with two surface ve-locity maxima. In the inner part of the front, relatively high cross-stream (north-ward) and vertical (upward) velocities were found. Thus, this study suggests thatwhile water particles flow downstream along the first stationary meander of theKuroshio Extension, they also experience lateral and vertical movements which al-low the deeper water from an upstream location to rise to the surface layer, and incertain locations to deflect northward. By assuming isopycnal movement and conser-vation of potential vorticity, it was found that in those locations where anticycloniccurvature of the meander increases, warm water is more likely to deflect northward.High ageostrophic components observed in the first 300 m of the water column areprobably related to the relatively high cross-stream and vertical velocities in the in-ner part of the front.
Gulf Stream (GS) are controlled by very similar physicalconstraints. In spite of the different topography, the ex-istence of stationary or low-frequency wavelike patternsin the eastward extension of these currents appears to bea common feature (Campos and Olson, 1991). The desirefor accurate tracking of fluid parcels and to measure ver-tical velocity directly in the GS led to the construction ofthe isopycnal drifters called RAFOS, which have nearlythe same compressibility as the sea water and can thusfollow the vertical motion of fluid parcels along densitysurfaces (Rossby et al., 1985). Some of the results of theapplication of this new instrument launched in the mainthermocline of the GS are summarized below. A system-atic pattern of vertical motion, closely linked to the me-andering path, was reported by Bower and Rossby (1989),Fig. 1, and cross-frontal exchange was observed to takeplace as a result of this meander-induced circulation,whereby fluid parcels from the center of the stream arebrought close to the edges and are often lost to the sur-roundings. Due to the slope of isopycnals across the
1. IntroductionA northward spread of warm water from the Kuroshio
Extension is constantly present in the transitional areabetween the Kuroshio and Oyashio fronts, and the warmwater supply seems to occur not in a continuous way butthrough intermittent intrusions of Kuroshio water, withperiods of around 20–40 days (Sainz-Trápaga andSugimoto, 1998). In our previous study, the T-S proper-ties of the Spread Kuroshio Water were observed to bethe same as those found below 300–400 m depth at theKuroshio front. Thus, to gain an insight into the mecha-nism responsible for the warm water intrusions from theKuroshio Extension, a detailed analysis is needed of thethree-dimensional structure of the velocity field in theKuroshio front, from which it originates.
As western boundary currents, the Kuroshio and the
Corresponding author e-mail: [email protected]
Copyright © The Oceanographic Society of Japan.
80 S. Sainz-Trápaga and T. Sugimoto
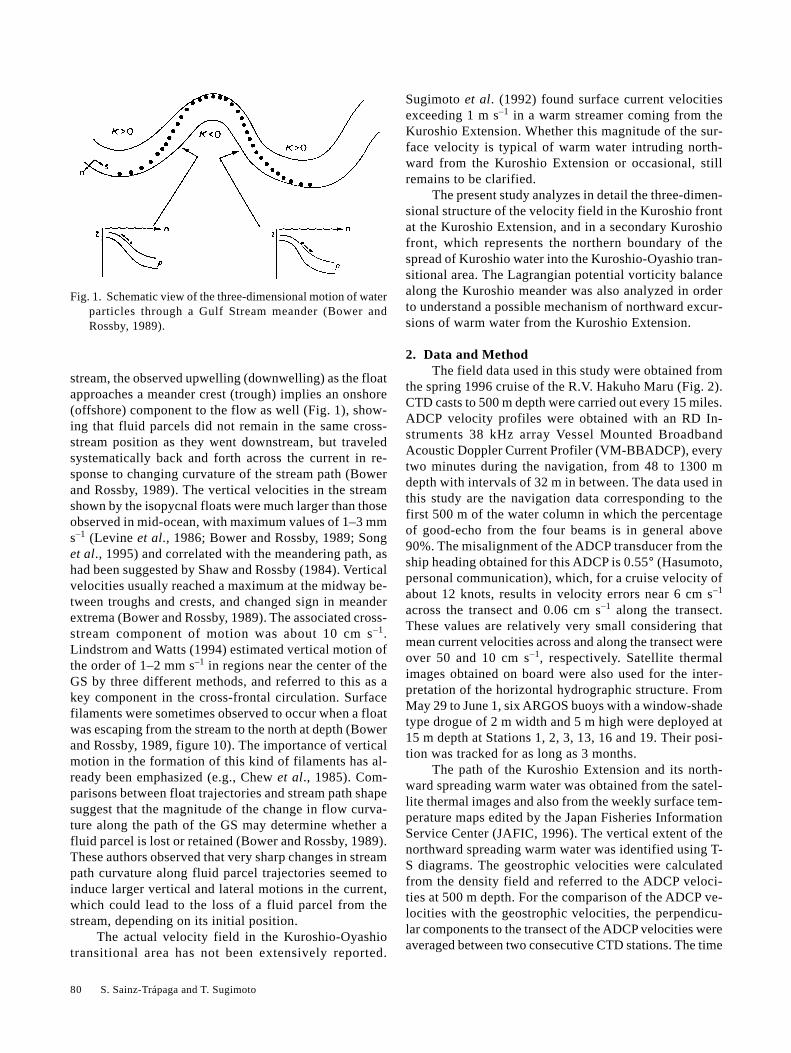
stream, the observed upwelling (downwelling) as the floatapproaches a meander crest (trough) implies an onshore(offshore) component to the flow as well (Fig. 1), show-ing that fluid parcels did not remain in the same cross-stream position as they went downstream, but traveledsystematically back and forth across the current in re-sponse to changing curvature of the stream path (Bowerand Rossby, 1989). The vertical velocities in the streamshown by the isopycnal floats were much larger than thoseobserved in mid-ocean, with maximum values of 1–3 mms–1 (Levine et al., 1986; Bower and Rossby, 1989; Songet al., 1995) and correlated with the meandering path, ashad been suggested by Shaw and Rossby (1984). Verticalvelocities usually reached a maximum at the midway be-tween troughs and crests, and changed sign in meanderextrema (Bower and Rossby, 1989). The associated cross-stream component of motion was about 10 cm s–1.Lindstrom and Watts (1994) estimated vertical motion ofthe order of 1–2 mm s–1 in regions near the center of theGS by three different methods, and referred to this as akey component in the cross-frontal circulation. Surfacefilaments were sometimes observed to occur when a floatwas escaping from the stream to the north at depth (Bowerand Rossby, 1989, figure 10). The importance of verticalmotion in the formation of this kind of filaments has al-ready been emphasized (e.g., Chew et al., 1985). Com-parisons between float trajectories and stream path shapesuggest that the magnitude of the change in flow curva-ture along the path of the GS may determine whether afluid parcel is lost or retained (Bower and Rossby, 1989).These authors observed that very sharp changes in streampath curvature along fluid parcel trajectories seemed toinduce larger vertical and lateral motions in the current,which could lead to the loss of a fluid parcel from thestream, depending on its initial position.
The actual velocity field in the Kuroshio-Oyashiotransitional area has not been extensively reported.
Sugimoto et al. (1992) found surface current velocitiesexceeding 1 m s–1 in a warm streamer coming from theKuroshio Extension. Whether this magnitude of the sur-face velocity is typical of warm water intruding north-ward from the Kuroshio Extension or occasional, stillremains to be clarified.
The present study analyzes in detail the three-dimen-sional structure of the velocity field in the Kuroshio frontat the Kuroshio Extension, and in a secondary Kuroshiofront, which represents the northern boundary of thespread of Kuroshio water into the Kuroshio-Oyashio tran-sitional area. The Lagrangian potential vorticity balancealong the Kuroshio meander was also analyzed in orderto understand a possible mechanism of northward excur-sions of warm water from the Kuroshio Extension.
2. Data and MethodThe field data used in this study were obtained from
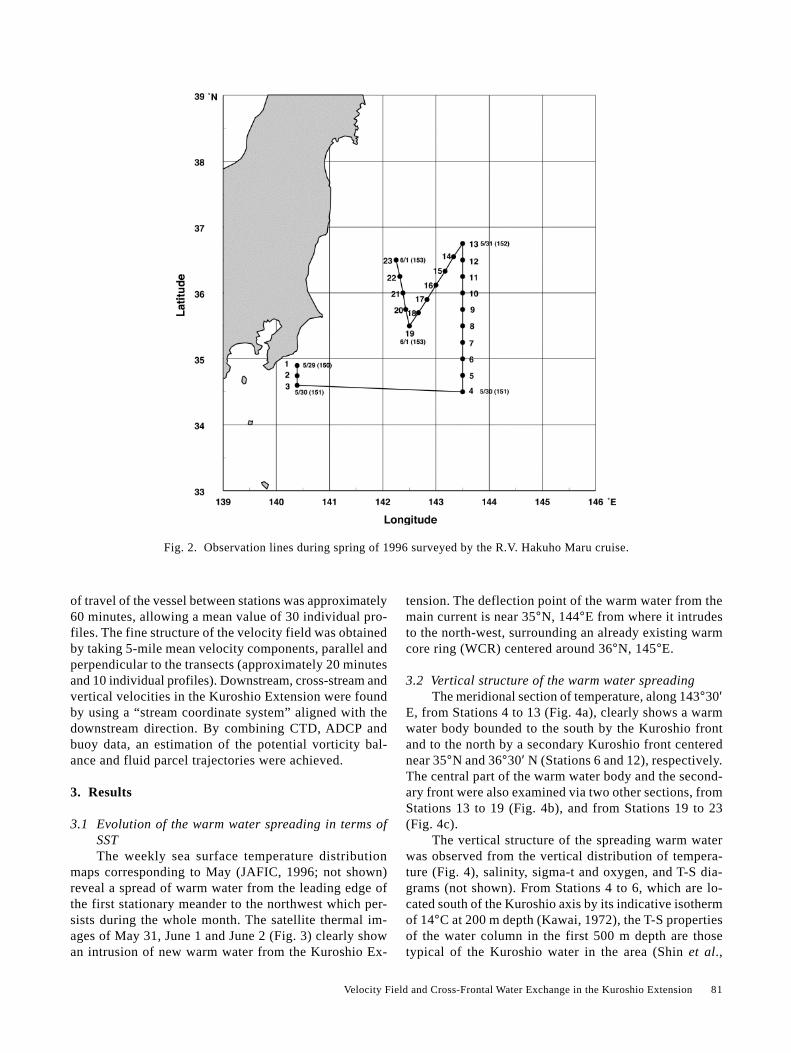
the spring 1996 cruise of the R.V. Hakuho Maru (Fig. 2).CTD casts to 500 m depth were carried out every 15 miles.ADCP velocity profiles were obtained with an RD In-struments 38 kHz array Vessel Mounted BroadbandAcoustic Doppler Current Profiler (VM-BBADCP), everytwo minutes during the navigation, from 48 to 1300 mdepth with intervals of 32 m in between. The data used inthis study are the navigation data corresponding to thefirst 500 m of the water column in which the percentageof good-echo from the four beams is in general above90%. The misalignment of the ADCP transducer from theship heading obtained for this ADCP is 0.55° (Hasumoto,personal communication), which, for a cruise velocity ofabout 12 knots, results in velocity errors near 6 cm s–1
across the transect and 0.06 cm s–1 along the transect.These values are relatively very small considering thatmean current velocities across and along the transect wereover 50 and 10 cm s–1, respectively. Satellite thermalimages obtained on board were also used for the inter-pretation of the horizontal hydrographic structure. FromMay 29 to June 1, six ARGOS buoys with a window-shadetype drogue of 2 m width and 5 m high were deployed at15 m depth at Stations 1, 2, 3, 13, 16 and 19. Their posi-tion was tracked for as long as 3 months.
The path of the Kuroshio Extension and its north-ward spreading warm water was obtained from the satel-lite thermal images and also from the weekly surface tem-perature maps edited by the Japan Fisheries InformationService Center (JAFIC, 1996). The vertical extent of thenorthward spreading warm water was identified using T-S diagrams. The geostrophic velocities were calculatedfrom the density field and referred to the ADCP veloci-ties at 500 m depth. For the comparison of the ADCP ve-locities with the geostrophic velocities, the perpendicu-lar components to the transect of the ADCP velocities wereaveraged between two consecutive CTD stations. The time
Fig. 1. Schematic view of the three-dimensional motion of waterparticles through a Gulf Stream meander (Bower andRossby, 1989).
Velocity Field and Cross-Frontal Water Exchange in the Kuroshio Extension 81
of travel of the vessel between stations was approximately60 minutes, allowing a mean value of 30 individual pro-files. The fine structure of the velocity field was obtainedby taking 5-mile mean velocity components, parallel andperpendicular to the transects (approximately 20 minutesand 10 individual profiles). Downstream, cross-stream andvertical velocities in the Kuroshio Extension were foundby using a “stream coordinate system” aligned with thedownstream direction. By combining CTD, ADCP andbuoy data, an estimation of the potential vorticity bal-ance and fluid parcel trajectories were achieved.
3. Results
3.1 Evolution of the warm water spreading in terms ofSSTThe weekly sea surface temperature distribution
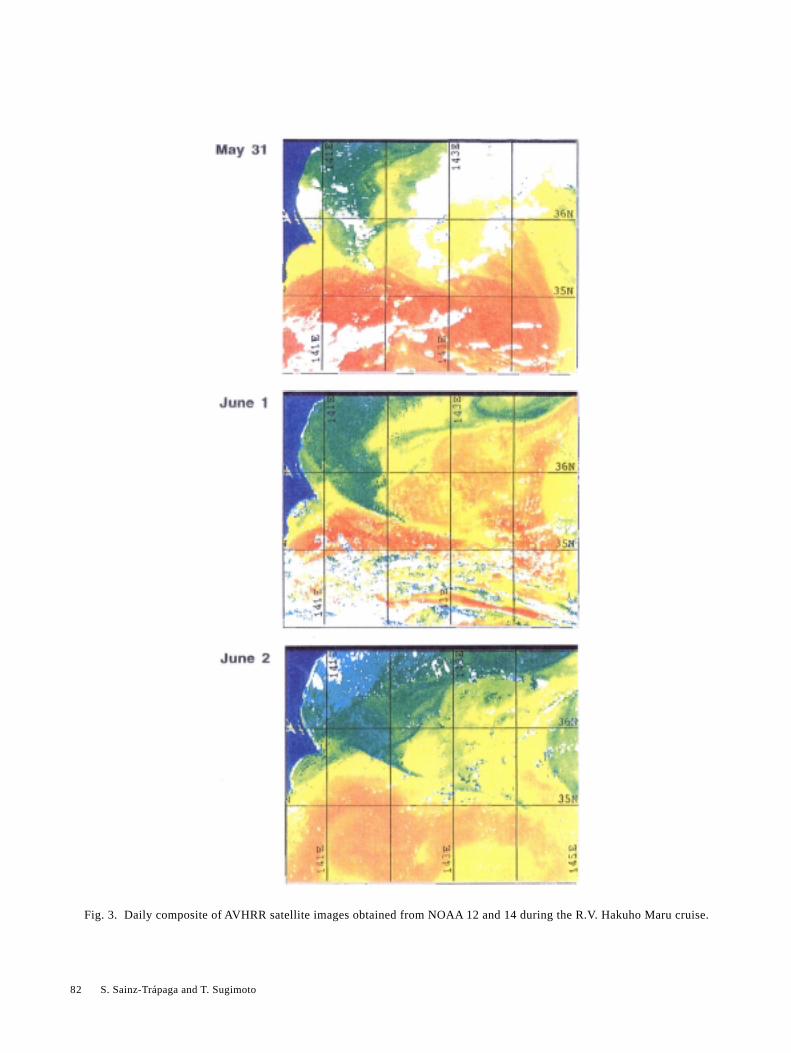
maps corresponding to May (JAFIC, 1996; not shown)reveal a spread of warm water from the leading edge ofthe first stationary meander to the northwest which per-sists during the whole month. The satellite thermal im-ages of May 31, June 1 and June 2 (Fig. 3) clearly showan intrusion of new warm water from the Kuroshio Ex-
tension. The deflection point of the warm water from themain current is near 35°N, 144°E from where it intrudesto the north-west, surrounding an already existing warmcore ring (WCR) centered around 36°N, 145°E.
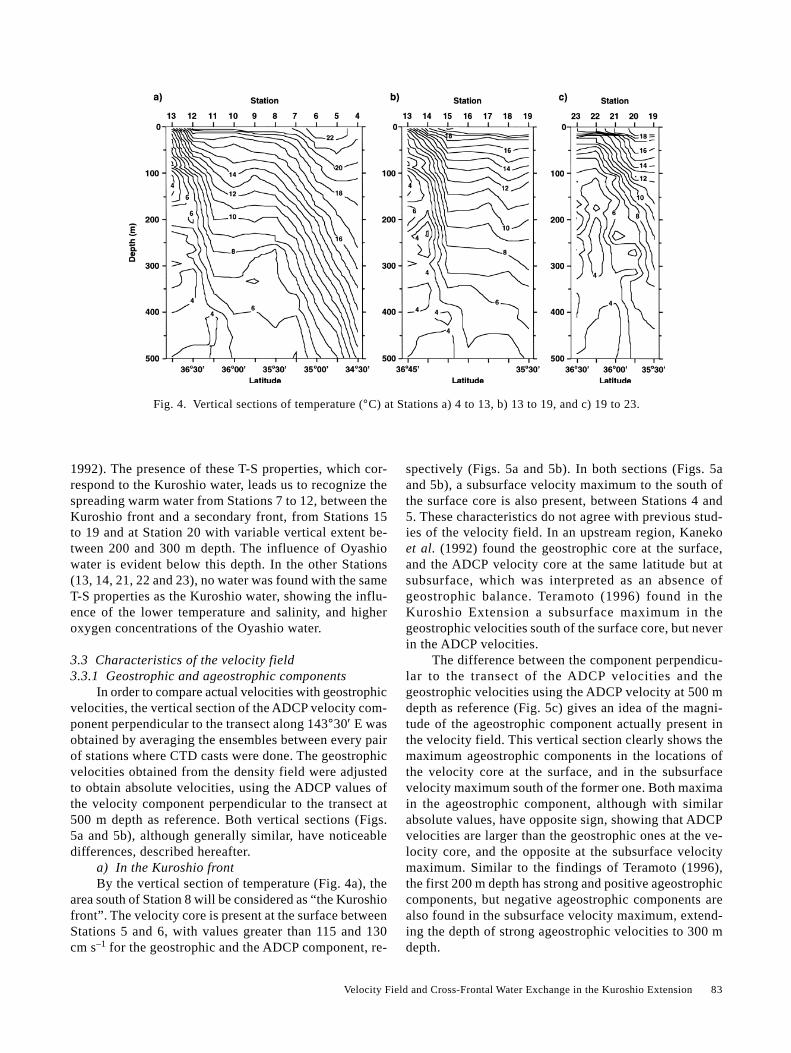
3.2 Vertical structure of the warm water spreadingThe meridional section of temperature, along 143°30′
E, from Stations 4 to 13 (Fig. 4a), clearly shows a warmwater body bounded to the south by the Kuroshio frontand to the north by a secondary Kuroshio front centerednear 35°N and 36°30′ N (Stations 6 and 12), respectively.The central part of the warm water body and the second-ary front were also examined via two other sections, fromStations 13 to 19 (Fig. 4b), and from Stations 19 to 23(Fig. 4c).
The vertical structure of the spreading warm waterwas observed from the vertical distribution of tempera-ture (Fig. 4), salinity, sigma-t and oxygen, and T-S dia-grams (not shown). From Stations 4 to 6, which are lo-cated south of the Kuroshio axis by its indicative isothermof 14°C at 200 m depth (Kawai, 1972), the T-S propertiesof the water column in the first 500 m depth are thosetypical of the Kuroshio water in the area (Shin et al.,
Fig. 2. Observation lines during spring of 1996 surveyed by the R.V. Hakuho Maru cruise.
82 S. Sainz-Trápaga and T. Sugimoto
Fig. 3. Daily composite of AVHRR satellite images obtained from NOAA 12 and 14 during the R.V. Hakuho Maru cruise.
Velocity Field and Cross-Frontal Water Exchange in the Kuroshio Extension 83
1992). The presence of these T-S properties, which cor-respond to the Kuroshio water, leads us to recognize thespreading warm water from Stations 7 to 12, between theKuroshio front and a secondary front, from Stations 15to 19 and at Station 20 with variable vertical extent be-tween 200 and 300 m depth. The influence of Oyashiowater is evident below this depth. In the other Stations(13, 14, 21, 22 and 23), no water was found with the sameT-S properties as the Kuroshio water, showing the influ-ence of the lower temperature and salinity, and higheroxygen concentrations of the Oyashio water.
3.3 Characteristics of the velocity field3.3.1 Geostrophic and ageostrophic components
In order to compare actual velocities with geostrophicvelocities, the vertical section of the ADCP velocity com-ponent perpendicular to the transect along 143°30′ E wasobtained by averaging the ensembles between every pairof stations where CTD casts were done. The geostrophicvelocities obtained from the density field were adjustedto obtain absolute velocities, using the ADCP values ofthe velocity component perpendicular to the transect at500 m depth as reference. Both vertical sections (Figs.5a and 5b), although generally similar, have noticeabledifferences, described hereafter.
a) In the Kuroshio frontBy the vertical section of temperature (Fig. 4a), the
area south of Station 8 will be considered as “the Kuroshiofront”. The velocity core is present at the surface betweenStations 5 and 6, with values greater than 115 and 130cm s–1 for the geostrophic and the ADCP component, re-
spectively (Figs. 5a and 5b). In both sections (Figs. 5aand 5b), a subsurface velocity maximum to the south ofthe surface core is also present, between Stations 4 and5. These characteristics do not agree with previous stud-ies of the velocity field. In an upstream region, Kanekoet al. (1992) found the geostrophic core at the surface,and the ADCP velocity core at the same latitude but atsubsurface, which was interpreted as an absence ofgeostrophic balance. Teramoto (1996) found in theKuroshio Extension a subsurface maximum in thegeostrophic velocities south of the surface core, but neverin the ADCP velocities.
The difference between the component perpendicu-lar to the transect of the ADCP velocities and thegeostrophic velocities using the ADCP velocity at 500 mdepth as reference (Fig. 5c) gives an idea of the magni-tude of the ageostrophic component actually present inthe velocity field. This vertical section clearly shows themaximum ageostrophic components in the locations ofthe velocity core at the surface, and in the subsurfacevelocity maximum south of the former one. Both maximain the ageostrophic component, although with similarabsolute values, have opposite sign, showing that ADCPvelocities are larger than the geostrophic ones at the ve-locity core, and the opposite at the subsurface velocitymaximum. Similar to the findings of Teramoto (1996),the first 200 m depth has strong and positive ageostrophiccomponents, but negative ageostrophic components arealso found in the subsurface velocity maximum, extend-ing the depth of strong ageostrophic velocities to 300 mdepth.
Fig. 4. Vertical sections of temperature (°C) at Stations a) 4 to 13, b) 13 to 19, and c) 19 to 23.

84 S. Sainz-Trápaga and T. Sugimoto
Fig. 5. Vertical sections of a) geostrophic velocity using the ADCP velocity component perpendicular to the transect at 500 mdepth as reference, b) ADCP velocity component perpendicular to the transect, and c) difference between b) and a). Unit: cms–1.
Fig. 6. The three velocity components of the velocity field using a “stream coordinate system” at the Kuroshio front: a) down-stream component u (cm s–1), b) cross-stream component v (cm s–1), and c) vertical component w (mm s–1). The dashed linerepresents the σt = 25.8 isopycnal surface.
b) In the secondary Kuroshio frontThe warm water spreading is bounded to the north
by a secondary Kuroshio front. This secondary front wassurveyed by the three sections between Stations 11–13,13–15, and 19–22 (Fig. 4). The velocity core at this sec-ondary front is always at the surface with actual velocity
components perpendicular to the meridional section (Fig.5a) greater than 50 cm s–1 (Stations 11 and 12). This sec-ondary front appears to be perfectly geostrophic (Fig. 5c).3.3.2 Fine structure of the actual velocity field
A more detailed picture of the velocity field wasobtained by averaging the ADCP velocities every 5 miles.
Velocity Field and Cross-Frontal Water Exchange in the Kuroshio Extension 85
In order to obtain the downstream and cross-stream com-ponents of the velocity field it is necessary to use a “streamcoordinate system” aligned with the current. Here, weapplied a similar method to that used by Halkin andRossby (1985) in the Gulf Stream region. The volumetransport from 50 to 500 m depth across the transect wascalculated every 5 miles width. The four largest valuesof water transport were vectorially added, and the result-ant vector of the mean directions of this water transportwas considered as the downstream direction. The result-ant vertical sections of the downstream and cross-streamvelocity components at the Kuroshio front (Stations 4 to8, now labeled from 1 to 11) (Figs. 6a and 6b) reveal thatthe Kuroshio front is not as uniform as was observed inFigs. 4 and 5, but presents a double structure, with two
velocity maxima at the surface and a clear double shearstructure below 200 m depth. The cross-stream compo-nent almost vanishes in the locations of highest down-stream velocities, and has maximum positive values(northward) in the inner part of the front near 200 m depth.
Following a similar procedure to that found in Bowerand Rossby (1989) and Song et al. (1995), the verticalvelocity component of a water particle, assumingisopycnal movement, was computed as
w vz
y= ∆
∆
where v is the cross-stream component and ∆z/∆y is theisopycnal slope (Fig. 6c). This vertical velocity is verysmall in the location of the two velocity maxima (5–6and 8–9), and positive (upward) in between, with maxi-mum values near 2 mm s–1 at 200 m depth.3.3.3 The velocity field by Lagrangian drifters
Satellite tracked drifters have proved to be effectivetools for examining ocean dynamics over a wide range oftime and space scales (McNally et al., 1983; Niiler et al.,1987; Krauss and Böning, 1987; Thomson et al., 1990).Recently, Ishikawa et al. (1997) reported that the use ofdrifting buoys provides the best opportunity to measuremesoscale surface circulation fields. They also observedthat, although the satellite altimeter offers another effec-tive means of obtaining the surface circulation due to its
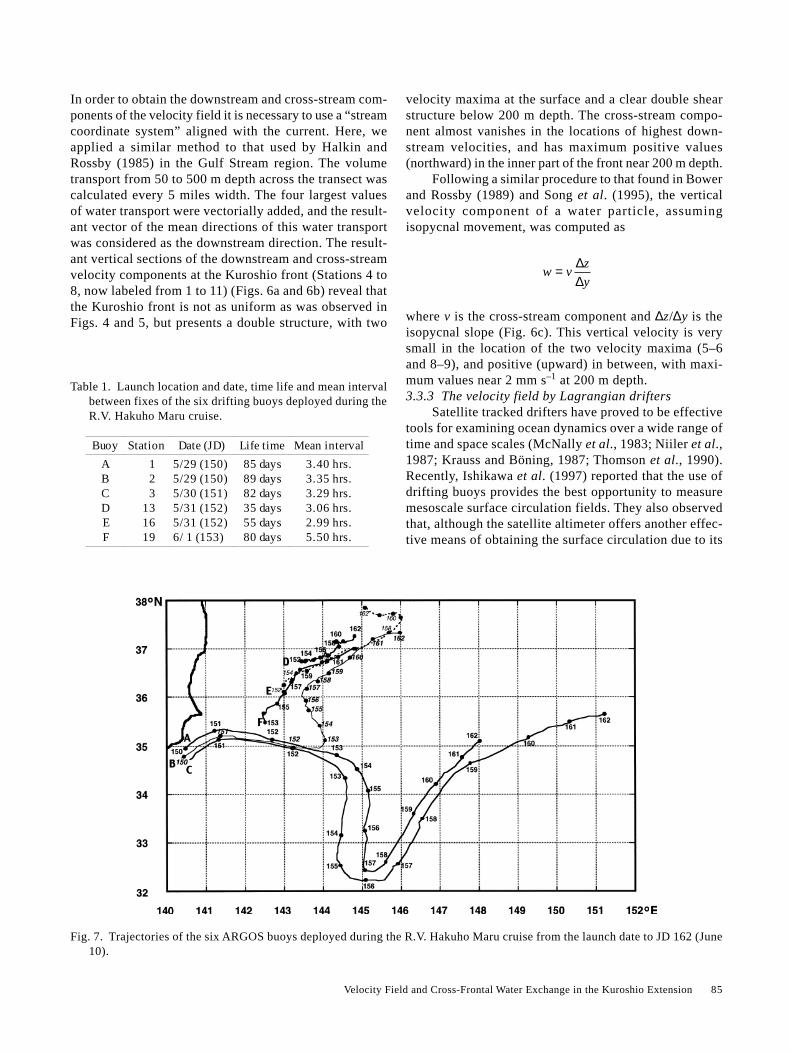
Buoy Station Date (JD) Life time Mean interval
A 1 5/29 (150) 85 days 3.40 hrs.B 2 5/29 (150) 89 days 3.35 hrs.C 3 5/30 (151) 82 days 3.29 hrs.D 13 5/31 (152) 35 days 3.06 hrs.E 16 5/31 (152) 55 days 2.99 hrs.F 19 6/ 1 (153) 80 days 5.50 hrs.
Fig. 7. Trajectories of the six ARGOS buoys deployed during the R.V. Hakuho Maru cruise from the launch date to JD 162 (June10).
Table 1. Launch location and date, time life and mean intervalbetween fixes of the six drifting buoys deployed during theR.V. Hakuho Maru cruise.
86 S. Sainz-Trápaga and T. Sugimoto
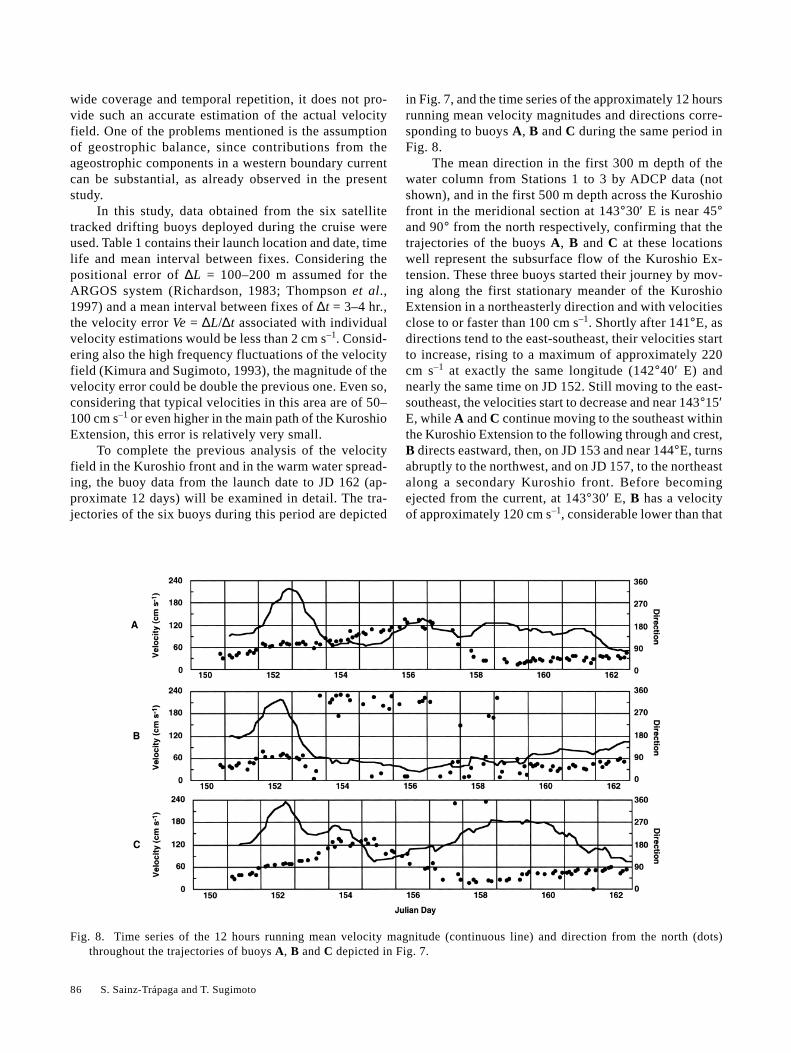
Fig. 8. Time series of the 12 hours running mean velocity magnitude (continuous line) and direction from the north (dots)throughout the trajectories of buoys A, B and C depicted in Fig. 7.
wide coverage and temporal repetition, it does not pro-vide such an accurate estimation of the actual velocityfield. One of the problems mentioned is the assumptionof geostrophic balance, since contributions from theageostrophic components in a western boundary currentcan be substantial, as already observed in the presentstudy.
In this study, data obtained from the six satellitetracked drifting buoys deployed during the cruise wereused. Table 1 contains their launch location and date, timelife and mean interval between fixes. Considering thepositional error of ∆L = 100–200 m assumed for theARGOS system (Richardson, 1983; Thompson et al.,1997) and a mean interval between fixes of ∆t = 3–4 hr.,the velocity error Ve = ∆L/∆t associated with individualvelocity estimations would be less than 2 cm s–1. Consid-ering also the high frequency fluctuations of the velocityfield (Kimura and Sugimoto, 1993), the magnitude of thevelocity error could be double the previous one. Even so,considering that typical velocities in this area are of 50–100 cm s–1 or even higher in the main path of the KuroshioExtension, this error is relatively very small.
To complete the previous analysis of the velocityfield in the Kuroshio front and in the warm water spread-ing, the buoy data from the launch date to JD 162 (ap-proximate 12 days) will be examined in detail. The tra-jectories of the six buoys during this period are depicted
in Fig. 7, and the time series of the approximately 12 hoursrunning mean velocity magnitudes and directions corre-sponding to buoys A, B and C during the same period inFig. 8.
The mean direction in the first 300 m depth of thewater column from Stations 1 to 3 by ADCP data (notshown), and in the first 500 m depth across the Kuroshiofront in the meridional section at 143°30′ E is near 45°and 90° from the north respectively, confirming that thetrajectories of the buoys A, B and C at these locationswell represent the subsurface flow of the Kuroshio Ex-tension. These three buoys started their journey by mov-ing along the first stationary meander of the KuroshioExtension in a northeasterly direction and with velocitiesclose to or faster than 100 cm s–1. Shortly after 141°E, asdirections tend to the east-southeast, their velocities startto increase, rising to a maximum of approximately 220cm s–1 at exactly the same longitude (142°40′ E) andnearly the same time on JD 152. Still moving to the east-southeast, the velocities start to decrease and near 143°15′E, while A and C continue moving to the southeast withinthe Kuroshio Extension to the following through and crest,B directs eastward, then, on JD 153 and near 144°E, turnsabruptly to the northwest, and on JD 157, to the northeastalong a secondary Kuroshio front. Before becomingejected from the current, at 143°30′ E, B has a velocityof approximately 120 cm s–1, considerable lower than that
Velocity Field and Cross-Frontal Water Exchange in the Kuroshio Extension 87
of A and C in the same location, where both have veloci-ties above 170 cm s–1.
Buoys D, E and F started their journey within thewarm water spread area in a northeasterly direction, then,near 145°E, following the previously mentioned second-ary Kuroshio front and joining B along it. The trajecto-ries of the buoys at the secondary Kuroshio front are co-incident with a peak of maximum velocities close to orexceeding 1 m s–1 (buoy B on JD 162 and 163; buoy E onJD 158; and buoy F on JD 162 and 163).
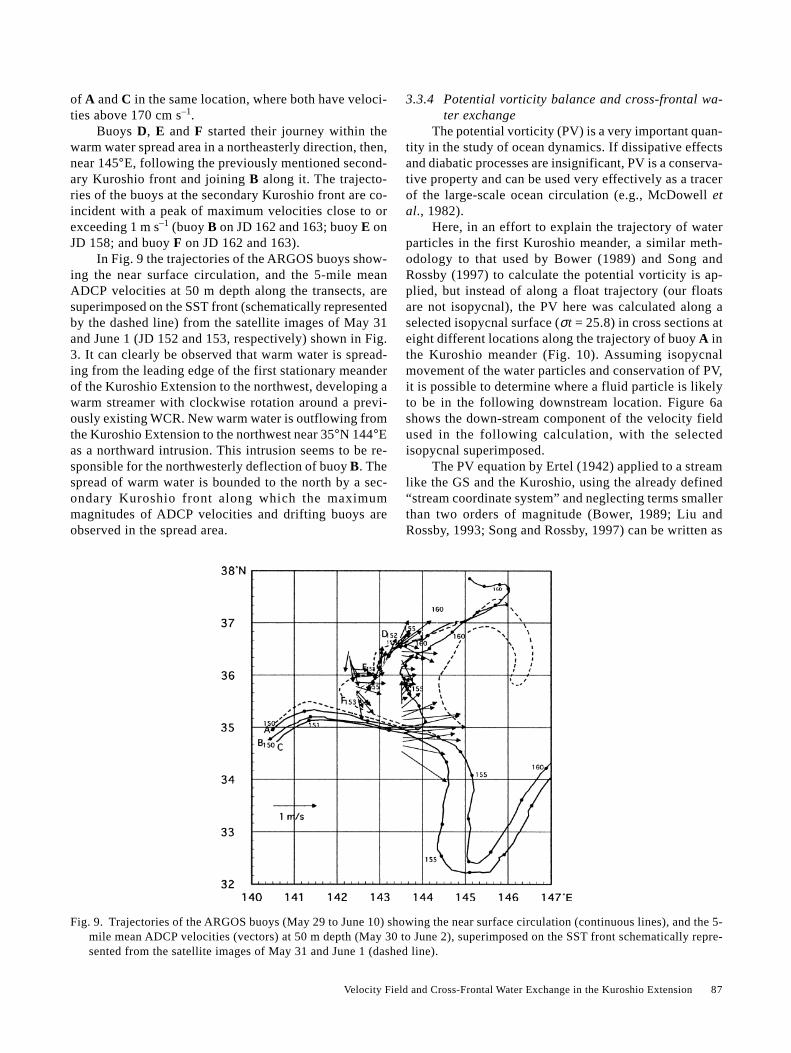
In Fig. 9 the trajectories of the ARGOS buoys show-ing the near surface circulation, and the 5-mile meanADCP velocities at 50 m depth along the transects, aresuperimposed on the SST front (schematically representedby the dashed line) from the satellite images of May 31and June 1 (JD 152 and 153, respectively) shown in Fig.3. It can clearly be observed that warm water is spread-ing from the leading edge of the first stationary meanderof the Kuroshio Extension to the northwest, developing awarm streamer with clockwise rotation around a previ-ously existing WCR. New warm water is outflowing fromthe Kuroshio Extension to the northwest near 35°N 144°Eas a northward intrusion. This intrusion seems to be re-sponsible for the northwesterly deflection of buoy B. Thespread of warm water is bounded to the north by a sec-ondary Kuroshio front along which the maximummagnitudes of ADCP velocities and drifting buoys areobserved in the spread area.
3.3.4 Potential vorticity balance and cross-frontal wa-ter exchange
The potential vorticity (PV) is a very important quan-tity in the study of ocean dynamics. If dissipative effectsand diabatic processes are insignificant, PV is a conserva-tive property and can be used very effectively as a tracerof the large-scale ocean circulation (e.g., McDowell etal., 1982).
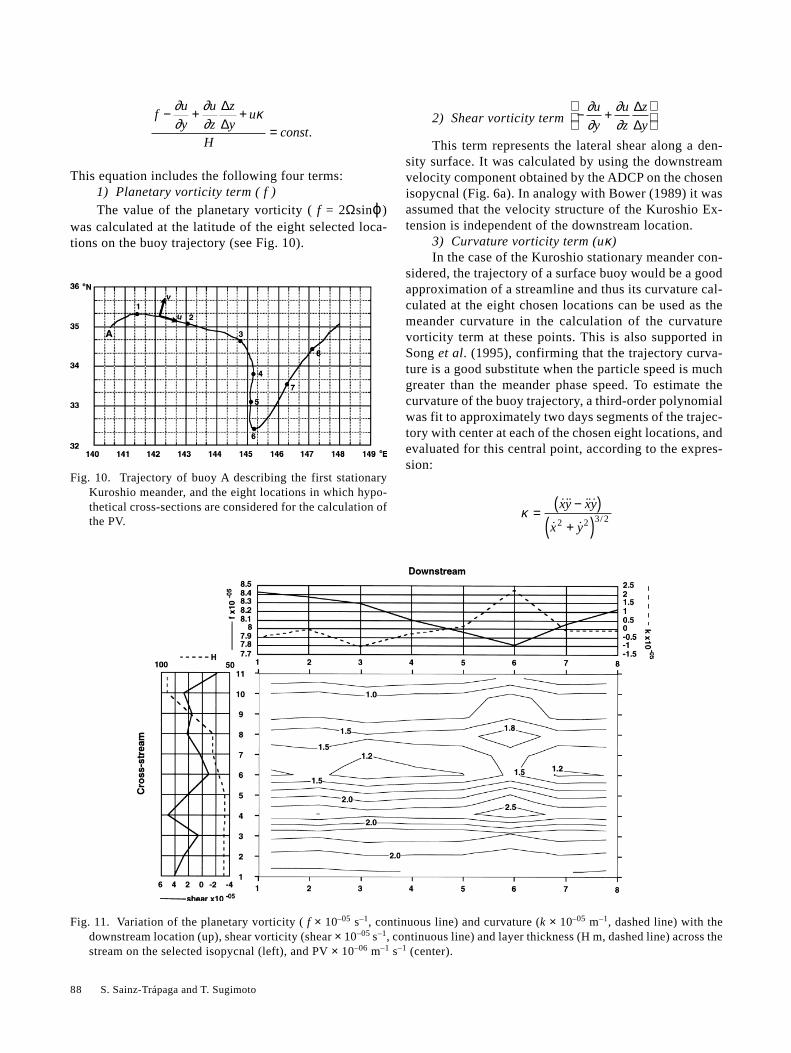
Here, in an effort to explain the trajectory of waterparticles in the first Kuroshio meander, a similar meth-odology to that used by Bower (1989) and Song andRossby (1997) to calculate the potential vorticity is ap-plied, but instead of along a float trajectory (our floatsare not isopycnal), the PV here was calculated along aselected isopycnal surface (σt = 25.8) in cross sections ateight different locations along the trajectory of buoy A inthe Kuroshio meander (Fig. 10). Assuming isopycnalmovement of the water particles and conservation of PV,it is possible to determine where a fluid particle is likelyto be in the following downstream location. Figure 6ashows the down-stream component of the velocity fieldused in the following calculation, with the selectedisopycnal superimposed.
The PV equation by Ertel (1942) applied to a streamlike the GS and the Kuroshio, using the already defined“stream coordinate system” and neglecting terms smallerthan two orders of magnitude (Bower, 1989; Liu andRossby, 1993; Song and Rossby, 1997) can be written as
Fig. 9. Trajectories of the ARGOS buoys (May 29 to June 10) showing the near surface circulation (continuous lines), and the 5-mile mean ADCP velocities (vectors) at 50 m depth (May 30 to June 2), superimposed on the SST front schematically repre-sented from the satellite images of May 31 and June 1 (dashed line).
88 S. Sainz-Trápaga and T. Sugimoto
Fig. 10. Trajectory of buoy A describing the first stationaryKuroshio meander, and the eight locations in which hypo-thetical cross-sections are considered for the calculation ofthe PV.
2) Shear vorticity term − +
∂∂
∂∂
u
y
u
z
z
y
∆∆
This term represents the lateral shear along a den-sity surface. It was calculated by using the downstreamvelocity component obtained by the ADCP on the chosenisopycnal (Fig. 6a). In analogy with Bower (1989) it wasassumed that the velocity structure of the Kuroshio Ex-tension is independent of the downstream location.
3) Curvature vorticity term (uκ)In the case of the Kuroshio stationary meander con-
sidered, the trajectory of a surface buoy would be a goodapproximation of a streamline and thus its curvature cal-culated at the eight chosen locations can be used as themeander curvature in the calculation of the curvaturevorticity term at these points. This is also supported inSong et al. (1995), confirming that the trajectory curva-ture is a good substitute when the particle speed is muchgreater than the meander phase speed. To estimate thecurvature of the buoy trajectory, a third-order polynomialwas fit to approximately two days segments of the trajec-tory with center at each of the chosen eight locations, andevaluated for this central point, according to the expres-sion:
κ =−( )
+( )˙˙ ˙ ˙
˙ ˙/
xy xy
x y2 2 3 2
Fig. 11. Variation of the planetary vorticity ( f × 10–05 s–1, continuous line) and curvature (k × 10–05 m–1, dashed line) with thedownstream location (up), shear vorticity (shear × 10–05 s–1, continuous line) and layer thickness (H m, dashed line) across thestream on the selected isopycnal (left), and PV × 10–06 m–1 s–1 (center).
fu
y
u
z
z
yu
Hconst
− + +=
∂∂
∂∂
κ∆∆
.
This equation includes the following four terms:1) Planetary vorticity term ( f )The value of the planetary vorticity ( f = 2Ωsinϕ)
was calculated at the latitude of the eight selected loca-tions on the buoy trajectory (see Fig. 10).
Velocity Field and Cross-Frontal Water Exchange in the Kuroshio Extension 89
where dots represent derivatives with respect to time(Thomas, 1972).
4) Layer thickness term (H)The PV was calculated on the selected isopycnal
correspondent with σt = 25.8. This isopycnal was almostcoincident with the 14°C isotherm which, at 200 m depth,indicates the location of the Kuroshio axis. As expected,this location agreed with the surface velocity core (Fig.6a). The layer thickness was determined as the verticaldistance between σt = 25.6 and σt = 26.0.
Once each of the previous terms had been deter-mined, the PV was calculated on the selected isopycnalin the cross-stream plane at each of the chosen eight lo-cations. In Fig. 11 the variation of planetary vorticity andcurvature with the downstream location (up), the shearvorticity and layer thickness across the stream (left), andthe resultant PV (center) are depicted. The particlestraveling from locations 1 to 8 on the σt = 25.8 isopycnalsurface, assuming conservation of PV, are expected tofollow the isolines of PV. In Fig. 11 the scale of eachterm is the same (all divided by 10–5), making it possible
to compare their relative changes. The planetary vorticitychanges little compared to curvature and shear vorticity.The curvature vorticity uκ (not shown) alternates signaccording to changes in sign of the trajectory curvature(κ), being positive in cyclonic meanders troughs and nega-tive in anticyclonic meander crests.
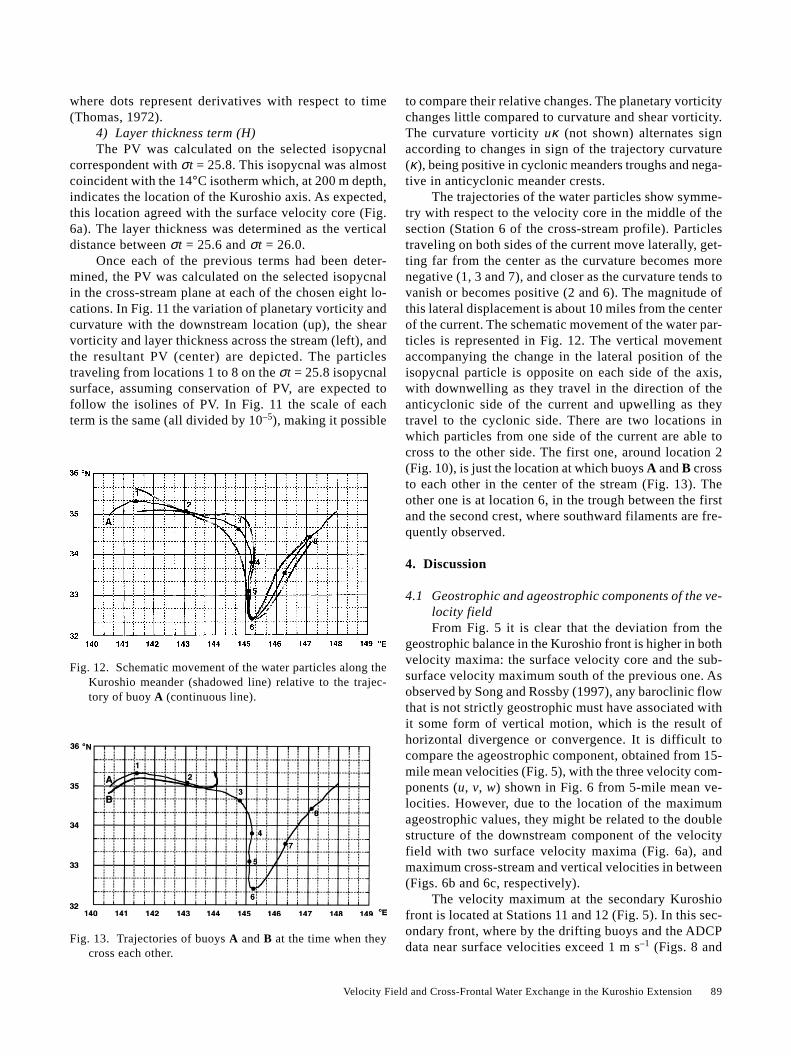
The trajectories of the water particles show symme-try with respect to the velocity core in the middle of thesection (Station 6 of the cross-stream profile). Particlestraveling on both sides of the current move laterally, get-ting far from the center as the curvature becomes morenegative (1, 3 and 7), and closer as the curvature tends tovanish or becomes positive (2 and 6). The magnitude ofthis lateral displacement is about 10 miles from the centerof the current. The schematic movement of the water par-ticles is represented in Fig. 12. The vertical movementaccompanying the change in the lateral position of theisopycnal particle is opposite on each side of the axis,with downwelling as they travel in the direction of theanticyclonic side of the current and upwelling as theytravel to the cyclonic side. There are two locations inwhich particles from one side of the current are able tocross to the other side. The first one, around location 2(Fig. 10), is just the location at which buoys A and B crossto each other in the center of the stream (Fig. 13). Theother one is at location 6, in the trough between the firstand the second crest, where southward filaments are fre-quently observed.
4. Discussion
4.1 Geostrophic and ageostrophic components of the ve-locity fieldFrom Fig. 5 it is clear that the deviation from the
geostrophic balance in the Kuroshio front is higher in bothvelocity maxima: the surface velocity core and the sub-surface velocity maximum south of the previous one. Asobserved by Song and Rossby (1997), any baroclinic flowthat is not strictly geostrophic must have associated withit some form of vertical motion, which is the result ofhorizontal divergence or convergence. It is difficult tocompare the ageostrophic component, obtained from 15-mile mean velocities (Fig. 5), with the three velocity com-ponents (u, v, w) shown in Fig. 6 from 5-mile mean ve-locities. However, due to the location of the maximumageostrophic values, they might be related to the doublestructure of the downstream component of the velocityfield with two surface velocity maxima (Fig. 6a), andmaximum cross-stream and vertical velocities in between(Figs. 6b and 6c, respectively).
The velocity maximum at the secondary Kuroshiofront is located at Stations 11 and 12 (Fig. 5). In this sec-ondary front, where by the drifting buoys and the ADCPdata near surface velocities exceed 1 m s–1 (Figs. 8 and
Fig. 12. Schematic movement of the water particles along theKuroshio meander (shadowed line) relative to the trajec-tory of buoy A (continuous line).
Fig. 13. Trajectories of buoys A and B at the time when theycross each other.
90 S. Sainz-Trápaga and T. Sugimoto
9), the geostrophic balance is achieved (Stations 11 and12). Thus, the water intrusion through which buoy B de-flects northward would reach geostrophic balance aroundJD 161, less than one week after its departure from theKuroshio Extension.
4.2 Velocity structure in the Kuroshio frontThe common presence of a double structure of the
Kuroshio front in the Kuroshio Extension was previouslyfound from temperature, salinity, density and dissolvedoxygen distributions by Nagata (1970) and Nagata et al.(1986); but nothing was said about its velocity structure.As the previously studies reported, such a double struc-ture of the Kuroshio front is difficult to identify from rou-tine observations, which usually indicate that the Kuroshiofront is a single band of sharp horizontal temperature andsalinity gradients, as in Fig. 4. Ocean fronts have verysmall lateral scales, for which standard techniques forsurveying the velocity field are not very effective (Liuand Rossby, 1993). The possibility of continuously ob-taining ADCP data during the navigation, discloses thatthe velocity field also presents a double structure. Thisdouble structure, Fig. 6, is represented in the surface layerby two velocity maxima and in the subsurface by twobands of strong horizontal velocity gradients for the down-stream component. These two bands of strong horizontalvelocity gradients probably correspond with the two nar-row zones having sharp horizontal temperature gradientsinside the Kuroshio front found by Nagata (1970). Thecross-stream component is very small to the south andalmost vanishes in the location of the highest downstreamvelocities, and to the north in the inside zone with a maxi-mum near 30 cm s–1 at 200 m depth. Vertical velocities ofwater particles with isopycnal movement also have maxi-mum positive values of 2 mm s–1 in the inside zone ataround 200 m depth. These figures are comparable tothose obtained for the GS near the center of the stream(Levine et al., 1986; Bower and Rossby, 1989; Lindstromand Watts, 1994; Song et al., 1995). The upwelling in theinner part of the Kuroshio front has already been reportedby Nagata et al. (1986) and Shin et al. (1992), who re-gard this area as the origin of the thermostad water ofWCR. This is also supported by the results obtained bySainz-Trápaga and Sugimoto (1998), which suggest thatwater below 300–400 m depth in the Kuroshio front isuplifted to the surface layer where it intrudes northwardfrom the Kuroshio Extension.
4.3 Potential vorticity balance and cross-frontal ex-change in the Kuroshio meanderThe comparison between the relative variation of
each term in the PV balance gives an idea of the domi-nant terms and thus those that are mainly responsible forthe PV changes. The maximum variations (all the values
are ×10–5) in the planetary vorticity, shear vorticity andcurvature vorticity are around 0.6, 6 and 3, respectively.This shows that the PV would be mainly controlled bythe cross-stream velocity shear, and therefore by the ve-locity structure of the current, and by the curvature of theKuroshio meander. While the water particle flows down-stream inside the Kuroshio Extension, it experienceschanges in planetary vorticity and curvature vorticity ac-cording to its relative location with respect to the Kuroshiomeander. In order to conserve PV, these changes must becompensated by changing horizontal velocity shear and/or layer thickness, and thus its cross-stream position. Ifcurvature increases (as in location 6, Fig. 11), the waterparticle would tend to move towards an area of lowervelocity shear or higher layer thickness, depending on itsoriginal position. If curvature decreases, as in location 3,the opposite would occur.
By assuming that water particles move on isopycnalsurfaces while flowing downstream along the Kuroshiomeander, conserving PV, their trajectories would be thoserepresented in Fig. 12. The trajectories are symmetric withrespect to the center of the current due to the presence ofthe inflection point in the downstream velocity profilewhere the sign of the shear changes (Fig. 11, upper panel).For water particles traveling near the center of the cur-rent, like buoys A and B, as the curvature of the meanderbecomes more negative the water particle moves awayfrom the center of the current, and as the curvature van-ishes or becomes positive the water particle approachesthe center of the current. This symmetry of the water par-ticle trajectories (Fig. 12) is similar to that described bySong and Rossby (1997) for the case of “growing ampli-tude meanders”. In that case, in contrast with that inBower (1989), the downstream velocity profile on anisopycnal surface at crests also has an inflection pointwhere the cross-stream velocity shear vanishes.
The lateral displacement of the water particle is ac-companied by vertical velocities according to theirisopycnal movement, upwelling as they direct to the cy-clonic side of the current and downwelling as they directto the anticyclonic one.
The trajectories of the water particles represented bythe isolines of PV in Fig. 11, in the vicinity of location 2(Fig. 10), allows particles to cross from one side of thecurrent to the other. This is the place where buoy B crossedthe trajectory of buoy A, becoming exposed to the warmwater intrusion that carries it to the northwest (Fig. 13).What causes buoy B to escape and not A? The velocity ofbuoy B at the time of crossing the vertical profile wasconsiderable lower than the velocity of buoy A and thus,as mentioned in Bower and Rossby (1989), Bower (1991),Song et al. (1995), and Song and Rossby (1997), has moretime to respond to the vertical and lateral motional fieldsand can more easily escape. Song and Rossby (1995) also
Velocity Field and Cross-Frontal Water Exchange in the Kuroshio Extension 91
noticed that floats that escape due to meandering clearlyhave a larger cross-stream velocity component than thoseremaining in the current. From the vertical profile of thecross-stream component of the velocity field (Fig. 6),buoy B seems to be exposed to higher northward veloci-ties, too. However, the presence of the lateral displace-ment of the water particles, although a necessary condi-tion is not enough for the generation of northward intru-sions of warm water. The short-term variability inducedby frontal disturbances and the presence of a WCR, as inthis case, also plays a decisive role.
4.4 On the approximations in the calculation of the PVThe results obtained from the PV calculation are
based on the assumptions that the velocity structure andthe layer thickness across the stream, using a stream co-ordinate system, are independent of the downstream lo-cation; and that the trajectory of a surface drifter can beused as representative of a streamline along the KuroshioExtension meander.
For the GS, Song et al. (1995), using trajectories ofthe RAFOS floats, obtained a velocity profile where thepath curvature is negative (crest) and positive (trough),respectively. The two profiles look very similar, the ve-locity maximum is independent of curvature and about10 db (10 km to the north) shallower in crests than introughs. From hydrographic data obtained by the R.V.Hakuho Maru in 1998, we confirmed that the layer thick-ness at different vertical sections with negative curvature(at the crest and at the backward edge of the KuroshioExtension meander) is conserved. In the case of theKuroshio Extension the difference between the velocityprofile and the density structure at crests and troughs isstill unknown and the use of a frozen structure would bethe closest approximation.
At the two places where ADCP data were obtainedduring the cruise crossing the buoy trajectories, they ac-curately represent the mean direction of the KuroshioExtension. However, there are no data available to esti-mate its accuracy as representative of the streamlines allalong the Kuroshio Extension meander.
An intensive observation program, including the sur-vey of the short-term variability in the area, is being per-formed in order to verify all these approximations in fu-ture work.
5. Summary and ConclusionsFrom a previous study we know that the water type
of the northward spread of warm water by its T-S proper-ties is the same as that in the Kuroshio front at depth,south of the Kuroshio axis. In looking for the possiblemechanism responsible for the northward warm waterintrusions and the water source, it is essential to under-stand the dynamics of the Kuroshio front. Here, a detailed
analysis of the velocity field in the Kuroshio front nearthe first crest of the first stationary meander shows that itpresents a double structure. This double structure has thefollowing characteristics: a) two surface velocity maximain the downstream component, being the stronger one (thevelocity core), which represents the location of theKuroshio axis, coincident with its indicative isotherm of14°C at 200 m depth; b) in the vertical section of thedownstream component, two bands of intense horizontalvelocity shear with a zone of weak horizontal shear inbetween; c) in the inner part of the front, between the twovelocity maxima, relatively high cross-stream and verti-cal components. Their maximum values, 30 cm s–1 and 2mm s–1 for the cross-stream and the vertical componentsrespectively, occur around 200 m depth. These positivevalues represent a northward flow for the cross-streamcomponent and upwelling for the vertical component.Therefore, the T-S properties of the spread Kuroshio wa-ter and the velocity field inside the Kuroshio front sug-gest that while the water particles flow downstream alongthe first stationary meander of the Kuroshio Extension,they also experience lateral and vertical movement whichallows the deeper water from an upstream location in theKuroshio Extension to rise the surface layer, and in cer-tain locations to deflect northward. The trajectories of thewater particles as they travel downstream, under the as-sumption of isopycnal movement and conservation of PV,are symmetric with respect to the center of the current. Inthose locations where the anticyclonic curvature of themeander increases, warm water was more likely to bedeflected northward.
In the Kuroshio front, the velocity field in the first300 m of the water column looks highly ageostrophic.Although an accurate comparison with the vertical struc-ture of the velocity field is not possible due to differentspatial scale of the data sampling, the maximum valuesof the ageostrophic velocities might be located in the in-ner part of the front, where cross-stream and vertical ve-locities are at a maximum. The secondary Kuroshio front,the northern boundary of the warm water spreading fromthe Kuroshio Extension, is in geostrophic balance. In thecase of the warm water intrusion tracked in this study bya surface buoy, it would take less than one week to reachgeostrophic balance after its departure from the main cur-rent.
AcknowledgementsWe wish to express our thanks to Dr. Hideaki Nakata,
Dr. Michio Kishi and Dr. Shingo Kimura for their fruitfuldiscussions. We are particularly grateful to the reviewersof the manuscript for their valuable comments and sug-gestions. We also thank Youichi Jinno, Captain of R.V.Hakuho Maru during the spring cruise of 1996, and Mr.Hideo Nagae and the graduate students of the Fisheries
92 S. Sainz-Trápaga and T. Sugimoto
Oceanography Division of the Ocean Research Institute,University of Tokyo, for their help during the cruise.
ReferencesBower, A. S. (1989): Potential vorticity balances and horizon-
tal divergence along particle trajectories in Gulf Streammeanders east of Cape Hatteras. J. Phys. Oceanogr., 19,1669–1681.
Bower, A. S. (1991): A simple kinematic mechanism for mix-ing fluid parcels across a meandering jet. J. Phys. Oceanogr.,21, 173–180.
Bower, A. S. and H. T. Rossby (1989): Evidence of cross-fron-tal exchange processes in the Gulf Stream based onisopycnal RAFOS float data. J. Phys. Oceanogr., 19, 1177–1190.
Campos, E. and D. Olson (1991): Stationary Rossby waves inwestern boundary current extensions. J. Phys. Oceanogr.,21, 1202–1224.
Chew, F., J. M. Bane, Jr. and D. A. Brooks (1985): On verticalmotion, divergence and the thermal wind balance in cold-dome meanders: A diagnostic study. J. Geophys. Res., 90,3173–3183.
Ertel, H. (1942): Ein neuer hydrodynamischer Wirbelsatz. Me-teor. Z., 59, 277–282.
Halkin, D. and T. Rossby (1985): The structure and transportof the Gulf Stream at 73°W. J. Phys. Oceanogr., 15, 1439–1452.
Ishikawa, Y., T. Awaji and K. Akitomo (1997): Global surfacecirculation and its kinetic energy distribution derived fromdrifting buoys. J. Oceanogr., 53, 489–516.
JAFIC (1996): Fisheries and Oceanographic Chart of the Pa-cific Ocean, No. 1485–1490.
Kaneko, A., S. Mizuno, W. Koterayama and R. Lee Gordon(1992): Cross-stream velocity structures and their down-stream variation of the Kuroshio around Japan. Deep-SeaRes., 39, 1583–1594.
Kawai, H. (1972): Hydrography of the Kuroshio Extension. p.235–352. In Kuroshio, Its Physical Aspects, ed. by H.Stommel and K. Yoshida, University of Tokyo Press.
Kimura, S. and T. Sugimoto (1993): Short-period fluctuationsin meander of the Kuroshio’s path off Cape Shiono Misaki.J. Geophys. Res., 98, 2407–2418.
Krauss, W. and C. W. Böning (1987): Lagrangian properties ofeddy fields in the northern North Atlantic as deduced fromsatellite-tracked buoys. J. Mar. Res., 45, 259–291.
Levine, E. R., D. N. Connors, P. C. Cornillon and H. T. Rossby(1986): Gulf Stream kinematics along an isopycnal floattrajectory. J. Phys. Oceanogr., 16, 1317–1328.
Lindstrom, S. S. and D. R. Watts (1994): Vertical motion in theGulf Stream near 68°W. J. Phys. Oceanogr., 24, 2321–2333.
Liu, M. and H. T. Rossby (1993): Observations of the velocityand vorticity structure of Gulf Stream meanders. J. Phys.Oceanogr., 23, 329–345.
McDowell, S., P. B. Phines and T. Keffer (1982): North Atlan-tic potential vorticity and its relation to the general circula-
tion. J. Phys. Oceanogr., 12, 1417–1436.McNally, G. J., W. C. Patzert, A. D. Kirwan and A. C. Vastano
(1983): The near-surface circulation of the North Pacificusing satellite tracked drifting buoys. J. Geophys. Res., 88,7507–7518.
Nagata, Y. (1970): Detailed temperature cross section of thecold water belt along the northern edge of the Kuroshio. J.Mar. Res., 28, 1–14.
Nagata, Y., J. Yoshida and H.-R. Shin (1986): Detailed struc-ture of the Kuroshio front and the origin of the water inwarm-core rings. Deep-Sea Res., 33, 1509–1526.
Niiler, P. P., R. E. Davis and H. J. White (1987): Water-follow-ing characteristics of a mixed-layer drifter. Deep-Sea Res.,Part A, 34, 1867–1881.
Richardson, P. (1983): Eddy kinetic energy in the North Atlan-tic Ocean from surface drifters. J. Geophys. Res., 88, 4355–4367.
Rossby, H. T., E. R. Levine and D. N. Connors (1985): Theisopycnal Swallow float—A simple devise for trackingwater parcels in the ocean. Progress in Oceanography, Vol.14, 511–525, Pergamon.
Sainz-Trápaga, S. and T. Sugimoto (1998): Spreading of warmwater from the Kuroshio Extension into the Perturbed Area.J. Oceanogr., 54, 257–271.
Shaw, P. T. and H. T. Rossby (1984): Towards a Lagrangiandescription of the Gulf Stream. J. Phys. Oceanogr., 14, 528–540.
Shin, H. R., Y. Nagata and J. Yoshida (1992): Detailed struc-ture and water-type distribution of the warm-core ring 86B,September 1987. Deep-Sea Res., 39, Suppl. 1, S115–S130.
Song, T. and H. T. Rossby (1997): Analysis of Lagrangian po-tential vorticity balance and lateral displacement of waterparcels in Gulf Stream meanders. J. Phys. Oceanogr., 27,325–339.
Song, T., H. T. Rossby and E. Carter (1995): Lagrangian stud-ies of fluid exchange between the Gulf Stream and the sur-rounding waters. J. Phys. Oceanogr., 25, 46–63.
Sugimoto, T., K. Morinaga and Y. Endo (1992): Appearance,behavior and oceanic structure of warm streamers in theKuroshio Oyashio frontal region. PORSEC-’92 in Okinawa,Proceedings of the Conference for Pacific Ocean Environ-ments & Probing, 1, 249–254.
Teramoto, T. (1996): The delineation of dynamical characteris-tics of circulations and their changes in the surface, subsur-face, mid-depth and deep layers of the westernmost part ofthe North Pacific. J. Oceanogr., 52, 633–653.
Thomas, G., Jr. (1972): Calculus and Analytical Geometry. Alt.Ed., Addison-Wesley, 1034 pp.
Thomson, R., P. LeBlond and W. Emery (1990): Analysis ofdeep-drogued satellite-tracked drifter measurements in thenortheast Pacific. Atmosphere-Ocean, 28, 409–443.
Thomson, R., P. LeBlond and A Rabinovich (1997): OceanicOdyssey of a satellite-tracked drifter: North Pacific vari-ability delineated by a single drifter trajectory. J. Oceanogr.,53, 81–87.