Turbulence as a driver for vertical plankton distribution in the subsurface upper ocean
Upload
independentCategory
view
1download
0
Journal of Plankton Research Vol. 12 nO.2 pp.41S-422, 1990
The size-abundance distribution and taxonomic composition ofplankton in an oligotrophic, high mountain lake (La Caldera, SierraNevada, Spain)
Fidel Echevarría, Presentación Carrillo], Francisco Jimenez, Pedro Sanchez-Castillo", Luis Cruz-Pizarro ' and Jaime RodriguezUnidad de Ecología, Universidad de Málaga, 29071-Málaga, J Departamento deBiología Animal, Genética y Ecología and 2Departamento de Biología Vegetal,Universidad de Granada, Spain
Abstract. In this paper we de cribe tbe main features of th.e size-abundance distribution andtaxonomic structure of plankton in an oligotrophic, high mountain lake (La Caldera, Sierra Nevada,Spain). The distribution is characterized by a discontinuity in the size range between -2000 and32000 fLm3 (cell volurne). Phytoplankton are numerically dominated by the cyanobacteriaCyanarcus sp., followed by the chrysophyte Chromulina nevadensis and the diatom Cyclotellaoce/lata. Some microplanktonic species such as the diatom Navicula radiosa were observedsporadically. The size spectrum and composition of the zooplanktonic community are dominated bythe copepod Mixodiaptomus laciniatus. On con idering biomass, however, the maximum values areassociated with the largest size clas es, dorninated by the cladoceran Daphnia pulex, Both the sizestructure and taxonomic compo ition of the planktonic cornmunity srudied are consistent withexpectations ba ed on theories relating the pattern of energy flow and trophic status in lakes.
Introduction
The analysis of the size-abundance distribution of planktonic organisms is amost useful tool for the study of both marine and freshwater pelagic ecosystems.As an ataxonomic way of analyzing ecosystem structure, the approach wasstimulated by the development of electronic particle counters in oceanography(Sheldon and Parsons, 1967; Sheldon el al., 1972) and the theoretical modelsproposed by Kerr (1974) and Platt and Denman (1977, 1978). Since then, theamount of information about particular ecosystems has increased rapidly both infreshwater (e.g. Sprules et al., 1983; Sprules and Knoechel, 1984; Sprules andMunawar, 1986) and marine ecosystems (e.g. Rodríguez and Mullin, 1986a,b;Sheldon el al. 1986; Rodríguez et al., 1987; Warwick and Joint, 1987). Theapproach was also extended to the study of benthic community structure bySchwinghammer (1981) and Warwick (1984). Later, benthic and pelagic sizespectra have been interpreted in terms of interactions between the two systems(Schinghammer, 1985; Warwick et al., 1986).
To obtain a better understanding of the sources of variability which affect thesize structure of planktonic communities, it is still necessary to investigateindividual ecosystems by methods that, at the same time, permit controlling thetaxonomic cornposition of the cornmunity under study.
La Caldera, an oligotrophic lake with alpine characteristics, was chosen withthe aim of making a functional interpretation of the planktonic size-abundancedistribution because it was a small-size ecosystem with asevere physical controlof a low-diversity biological community (Martínez, 1977, 1980; Cruz-Pizarro,
© Oxford University Press 415

F. Echevarría el al.
1981; Sanchez-Castillo el al. 1989). The distribution found is characterized bythe biomass dominance of large grazers and the presence of a persistentdiscontinuity which principally affect the microphytoplanktonic organisms.This agrees with previous theories about the patterns of energy flow in lakes(Hillbricht-I1kowska, 1977) and observations about the relationships betweensize structure and lake characteristics (Sprules and Knoechel, 1984; Sprules andMunawar, 1986).
Material and methods
The study zone
Lake La Caldera is a typical alpine, oligotrophic lake with a surface area-23 000 m2, situated on the southern slopes of the Sierra Nevada mountains insouthern Spain; the average depth varies between 4.5 and 5.0 m during surnmer.For at least 8 months of the year it is covered with ice. During 1987 the ice-freeperiod lasted from the end of June to the middle of October.
Field and laboratory methods
Forty-four samples of phytoplankton and 18 samples of zooplankton collectedduring August and September were analyzed in this work. Sampling was carriedout at a fixed station using 8 I van Dorn bottles at five depths: 0,2,4,6 and 8 m.To study the nanoplankton and part of the microplankton, a sub- ample of125 mI was removed from each sample immediately after agitation and fixed inacetic Lugol's solution. The remaining sample in each case was filtered through a45 urn mesh and the retained material fixed in 5% formaldehyde. This materialwas used to quantitatively determine the remaining part of the microplanktonand the mesoplankton.
In the laboratory 50 or 100 ml of the first ample were allowed to settle for 24or 48 h. The sediment was examined at three levels with an inverted microscope.The initial transect was made at x 1000, concentrating on the smaller sizedorganisms and counting at least 300 cells; econd and third scans at x400 andx 100 respectively extended the range of individual size to include microplank-tonic organisms. One aliquot, or the whole of the material of the second sample,was also studied with the inverted microscope at x40 and x 100 to quantify thelarger-sized microplankton and the mesoplankton group.
The inverted microscope was connected through a television camera to anAMS (VIDS IV) semi-automatic image analyzer. The organisms were identifiedand then measured. The size-descriptive variable in this study is volume,expressed as f.Lm3; this was derived frorn the length of the long axis and theheight of the mean cross-section, considering the organisms as either spherical orellipsoidal. The computer program output is a classification of the organismsobserved into 32 size-classes arranged in octaves (Iogarithms to the base 2) of theindividual volume. Class 1 includes organisms between 0.5 and 1 f.Lm3(-0.3 and0.0 in the octave, logarithmic scale) and class 32 includes organisms between 1and 2 x 10⁹ f.Lm3. The abundance values obtained for the extremes of
416

Plankton in an oligotrophic, high mountain lake
distribution may be underestimations and could be a so urce of error if used todetermine mathematical relationships between abundance and ize, but thispotential error does not affect their use in the present work.
Results
Figure 1 shows the average size distribution of abundance derived from all themeasurements for each size class. Logically, the values of deviation influencingthe average distribution are high because, in addition to sampling and analyticalerrors, the spatial and temporal dimensions may introduce ecologicallysignificant variability. For example, for class 1 the coefficient of variation of themean is 53% whereas for class 32 the coefficient is 400%.
The frequency of the different size classes (Figure lB) illustrates theoccurrence of a discontinuity in the size spectrum. Organisms between -500(the lower limit of class 11) and 32000 fLm3 (the upper limit of class 16) arepresent only sporadically. Even organisms as small as those in class 9(128-256 urrr') are present only in the 50% of the measurements.
The frequency discontinuity comprises part of the nanoplankton (up to-4000 urrr') and the part of the microplankton between 4000 and 32 000 fLm3.
108 A
•• 6u1: 4••"1:
" 2~••CI Oo..J
-2-4
O 2 3 4 5 6 7 8 9 log V (um 3)
100B
80é•.. 60u1:••" 40~LL
20
OO 2' 3 4 5 6 7 8 9 log V (Ilm3 )
i i i i Class number2 7 12 1 7 22 27 32I I I I I ESO (urn)2 10 50 200 1000
Fig. 1. (A) The average (time interrated) size-abundance pectrum. Density is expressed asindividuals 1-1 and biomass as j.l.m31- . (B) Frequency of the different ize classes during the periodof study.
417

F.Echevarría el al.
I NANOPLANKTON I MICROPLANKTON I MESOPLANKTON
-D CYANOPHYTES
---D- CHRYSOPHYTES
----c::J----.---- OTHERS
-D--- CRYPTOPHYTES
-D-----------.- DIATOMS
D- CHLOROPHYTES
0·--·--·-----·--·- DINOFLAGELLATES
EGGS -c::r-----c::J-NAUPLlI ~
ROTIFERS --- DPROTOZOA -D---
COPEPODS -D---
CLADOCERANS ----cJ- ~0,3 0,8 1,5 2,1 2,7 3,3 3,8 4,5 5,1 5,7 6,3 6,8 7,5 8,1 ',7
log V (~rn'l)
Fig. 2. Distributioo of the maio taxooomic groups aloog the size range studied. The positioo of theabuodance mode is represented by the small rectaogle. Discootinuous bar illustrates the sporadic,qualitative presence of certain groups.
In tenns of abundance, it was not possible to obtain reliable numbers forpotentially autotrophic organisms >-8000 I-Lm3,and this limit causes the clearstep in the distribution around this value. The combination of Figures 1 and 2illustrates the sparsity of microphytoplankton in the ecosystem studied.Qualitatively, some representatives of this compartrnent appeared sporadicallyin the material retained by the 45 I-Lmmesh. Mainly, these were unicellularconjugates such as Staurastrum (-9500 I-Lm3), Cosmarium (-8500 I-Lm3)andEuastrum (-6500 I-Lm3),together with filaments of Spirogyra, Mougeotia andZygnema. Some species such as Navicula radiosa, Cymbella minuta, Nitzschiahantzschiana and Diatoma hiemale are indicative of littoral influence (Martínez,1977, 1980; Sanchez-Castillo, 1988; Sanchez-Castillo et al., 1989) and they alsoappeared sporadically and qualitatively. The first species has an approximatevolume of 7000 I-Lm3and would fall within the range of the discontinuity,
In tenns of numerical density, the quantifiable group of the community(Figure 3) could be said to be characterized by the cyanobacteria Cyanarcus sp.,the chrysophyte Chromulina nevadensis and the diatom Cyclotella ocellata. Thelarger-sized cells to the left of the di continuity are usually dinoflagellates(Amphidinium) and the cryptophyte Rhodomonas minuta. To the right of thediscontinuity the quantifiable group is composed entirely of zooplankton(Figures 1 and 2), The density peak at 107 I-Lm3in Figure l(A) is dominated by
418
PHYTOPLANKTON (cells/ml)
-900-
700
::l..> .,500 :z:.. .....o >z :z:.. ..¡¡ o '" e'" f------ w
300 > ~ ..a: :z:~x '"u '" ..
2 O sO
.. ~ e.. ~ ~-e a: OlO;100 i5 u~ zo
Plankton in an oligotrophic, high mountain lake
ZOOPLANKTON (inds/l)
h ¡p,O
16,0
1,0
.,~r--.....ou
2,0f------
1----:-ffiuoo~u
..2o..o[
.,eS
r l
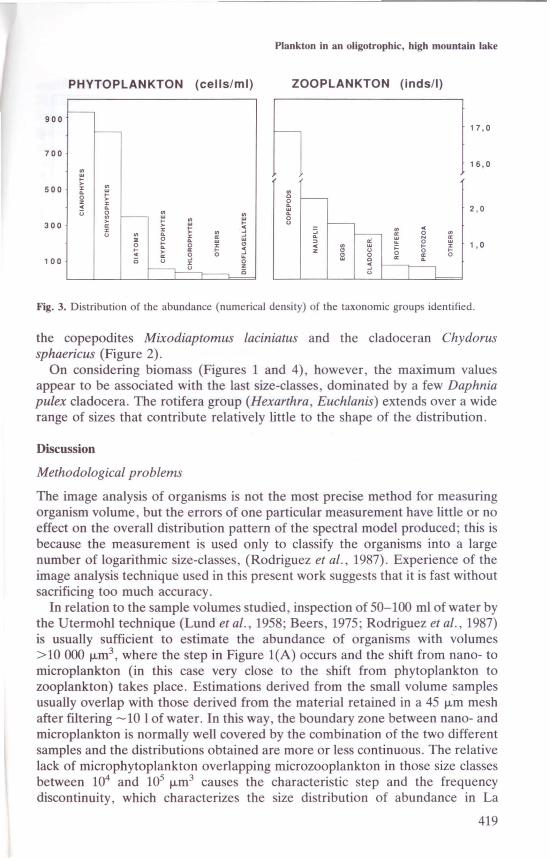
Fig. 3. Distribution of the abundance (numericaJ density) of the taxonomic groups identified.
the copepodites Mixodiaptomus laciniatus and the cladoceran Chydorussphaericus (Figure 2).
On considering biomass (Figures 1 and 4), however, the máximum valuesappear to be associated with the last size-classes, dorninated by a few Daphniapulex cladocera. The rotifera group (Hexarthra, Euchlanis) extends over a widerange of sizes that contribute relatively little to the shape of the distribution.
Discussion
Methodological problems
The image analysis of organisms is not the most preci e method for measuringorganism volume, but the errors of one particular measurement have little or noeffect on the overall distribution pattern of the spectral model produced; this isbecause the measurement is used only to classify the organisms into a largenumber of logarithmic size-classes, (Rodriguez et al., 1987). Experience of theimage analysis technique used in this present work suggests that it is fast withoutsacrificing too much accuracy.
In relation to the sample volumes studied, inspection of 50-100 ml of water bythe Utermohl technique (Lund el al., 1958; Beers, 1975; Rodriguez el al., 1987)is usually sufficient to estima te the abundance of organisms with volumes>10 000 urrr', where the step in Figure l(A) occurs and the shift from nano- tomicroplankton (in this case very close to the shift from phytoplankton tozooplankton) takes place. Estimations derived from the small volume samplesusualIy overlap with those derived from the material retained in a 45 urn meshafter filtering -10 l of water. In this way, the boundary zone between nano- andrnicroplankton is normally well covered by the combination of the two differentsamples and the distributions obtained are more or less continuous. The relativelack of rnicrophytoplankton overlapping microzooplankton in those size classesbetween 104 and lOS ,..,m3 causes the characteristic step and the frequencydiscontinuity, which characterizes the size distribution of abundance in La
419
F.Echevarría el al.
lOG BIOMASS PHYTOPlANKTON (11m3 Iml)
5
r---
r---
- f---f- -VI
VI -VI W VI ew ~ :1 w VI... o... w ...
>- x >- ~ ..x .. ... x VI ..... o .. .. x o: ...o VI o o .. w wz >- ... o x "o: .. o: ... i.. x >- s oÜ o o:
o x oo z
¡¡
4
3
2
lOG BIOMASS ZOOPlANKTON (11m3 Iml)
- -
VIZ..o:
VI wo _r--- o~ oow :5..o oo
:; VI.. §"..z
5
4
3
2
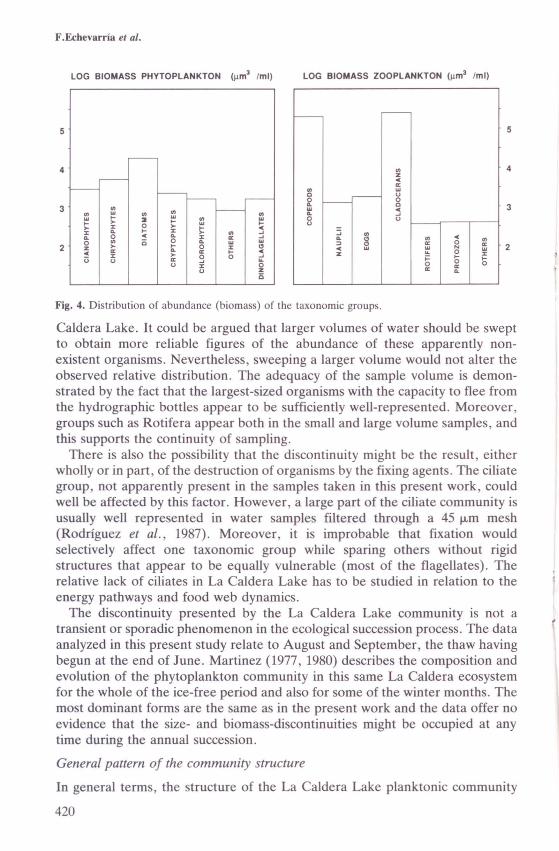
Fig. 4. Distribution of abundance (biomass) of the taxonomic groups.
Caldera Lake. It could be argued that larger volumes of water should be sweptto obtain more reliable figures of the abundance of these apparently non-existent organisms. Nevertheless, weeping a larger volume would not alter theobserved relative distribution. The adequacy of the sample volume is demon-strated by the fact that the largest-sized organisms with the capacity to flee fromthe hydrographic bottles appear to be sufficiently well-represented. Moreover,groups such as Rotifera appear both in the small and large volume samples, andthis supports the continuity of sampling.
There is also the possibility that the discontinuity might be the result, eitherwholly or in part, of the destruction of organisms by the fixing agents. The ciliategroup, not apparently present in the samples taken in this present work, couldweIl be affected by this factor. However, a large part of the ciliate community isusuaIly well represented in water samples filtered through a 45 urn mesh(Rodríguez el al., 1987). Moreover, it is improbable that fixation wouldselectively affect one taxonomic group while sparing others without rigidstructures that appear to be equalIy vulnerable (most of the flagellates). Therelative lack of ciliates in La Caldera Lake has to be studied in relation to theenergy pathways and food web dynamics.
The discontinuity presented by the La Caldera Lake cornmunity is not atransient or sporadic phenomenon in the ecological succession process. The dataanalyzed in this present study relate to August and September, the thaw havingbegun at the end of June. Martinez (1977, 1980) describes the composition andevolution of the phytoplankton community in this same La Caldera ecosystemfor the whole of the ice-free period and also for some of the winter months. Themost dominant forms are the same as in the present work and the data offer noevidence that the size- and biomass-discontinuities might be occupied at anytime during the annual succession.
General pattern of the community structure
In general terms, the structure of the La Caldera Lake planktonic community
420

Plankton in an oligotrophic, higb mountain lake
conforrns with the theoretical predictions for oLigotrophic lakes (Hillbricht-I1kowska, 1977, cited by Sprules and Knoechel, 1984). According to these, inlow-productivity lakes tbe phytoplanktonic cornrnunity should be dorninated bytbe nanoplankton and not by 'non-edible' algae. I1rnavirta (1974) reports that invery oligotrophic lakes the phytoplankton is dorninated by organisrns <15 urn.On the otber hand, this idea can be extended to the rnarine ecosystern (Malone,1971, 1980; Takahashi and Bienfang, 1983) if the terrn 'non-grazable' issubstituted by 'net plankton'. It would seern that the dorninance of thenanoplankton is a consequence of the nutritive character of the ecosystern, or inother words, of the existence of a 'bottorn-upwards' control (McQueen el al.,1986). The strong influence of this type of control rnechanisrn causes theexcJusive dorninance of the cornrnunity by the nanoplankton and generates thecharacteristic discontinuity observed in the present study.
Sprules and Knoechel (1984) surnrnarized tbe pattern of variation in biornassspectra for 37 Ontario lakes (the LEWG lakes) varying in rnorphornetric andchemical characteristics. They fall into four relatively distinct groups, rangingfrorn those dorninated by phytoplankton to those dorninated by zooplankton.Although precise comparison is difficult beca use of the different data display(their size scale cornprises 10 size-classes defined by the máximum lineardimension of the organisrns), the distribution found in La Caldera correspondscJearly with the group characterized by the dorninance of zooplankton biornass.The question of how high standing crops of zooplankton can persist given acornparatively low algal biornass (Sprules and Knoechel, 1984) is pertinent in thecase of La Caldera, where, a priori the oLigotrophic character would irnply theslow turnover rate of phytoplankton population. The possibility of unusuallyslow turnover at the zooplankton level resulting frorn the non-existence of fishpopulations in the lake has to be taken into account. We are now alsoconsidering the possibility that zooplankton exploits rnicrophytobenthic popu-lations in this shallow ecosystern. This irnpLies that we analyze the benthic sizedistribution of biornass using the frarnework of the hypothesis of benthic-pelagiccoupLing proposed by Schingharnrner (1985).
Acknowledgements
Financial support was provided by the Junta de Andalucía (Project no. 9/88),CICYT Project no. PPA86-0401 and FPI grants to F.Echevarría and P.Carrillo.Discussion and revision of the manuscript also benefited frorn the NATOCollaboration Research Grant no. 0732/88. V.Rodríguez, FcJiménez-Gómezand two anonyrnous referees made helpful cornrnents.
References
Beers,J.R., Reid,T.M.H. and Stewart,G.L. (1975) Microplankton of the North Pacific CentralGyre. Population structure and abundance, June, 1973. InI. Rev. Ges. Hydrobiol., 60, 607-638.
Cruz-Pizarro.L, (1981) Estudio de la comunidad zooplanctónica de un lago de alta montaña (LaCaldera, Sierra Nevada) PhD Thesis, Uoiver ity Granada, 186 p.
HilIbricht-I1kowska,A. (1977) Trophic relations and energy Ilow in pelagic plankton. Polo Eco/.su«, 3, 3-98.
Ilmavirta,I. (1974) Electronic particle counting applied in phytoplankton studies in three southernFinnish lakes. Ann. BOl. Fenn., 11, 105-111.
421
F.Echevarría el al.
Kerr,S.R. (1974) Tbeory of size distribution in ecological communities. J. Fish. Res. Bd Can., 31,1859-1862.
Luod,J.W.G., Kipling,C. and LeCren,E.D. (1958) The inverted micro cope method of estimatingalgal numbers and the statistical basis of estimations by counting. Hydrobiologia, 11, 143-170.
Malooe,T.C. (1971) The relative importance of nanoplankton and netplankton as primaryproducers in tropical oceanic and neritic phytoplankton communities. Limnol. Oceanogr., 16,633-639.
Malone,T.C. (1980) Algal size. In Morris,!. (ed.), The Physiological Ecology of Phytop/ankton.Blackwell Scientific, Oxford, pp. 443-463.
Martínez,R. (1977) Phytoplankton species, biomass and diversity in lake La Caldera (SierraNevada). Aeta Hydrobiol., 19,95-107.
Martínez.R, (1980) Seasonal variation of phytoplankton biomass and photosynthesis in the highmountain lake La Caldera. Dev/. Hydrobio/., 3,111-148.
McQueen,D.G., Post,J.R. aod MilIs,E.L. (1986) Trophic relation hip in freshwater pelagicecosystems. Can. J. Fish. Aquat. Sci., 43, 1571-1581.
Platt,T. and Denmann,K. (1977) Organization in the pelagic ecosystem. He/go/. Wiss. Meeres-unters., 30, 575-581.
Platt,T. and Denmann.K. (1978) The structure of pelagic marine ecosystem. Rapp. P.-v. Reun.Cons. Perm. u« Exp/. Mer., 173,60-65.
Rodriguez,J. and Mullin,M.M. (1986a) Diel and interannual variation of size distribution of oceaniczooplanktonic biomass. Ecology, 67, 215-222.
Rodríguez,J. and Mullin,M.M. (J986b) Relation between biomass and body weight of plankton in asteady-state oceanic ecosystem. Limno/. Oeeanogr., 31, 361-370.
Rodríguez,J., Jiménez,F., Bauti ta,B. and Rodríguez,V. (1987) Planktonic biomass spectradynamics during a winter production pulse in Mediterranean coastal waters. 1. P/ankton Res., 9,1183-1194.
Saochez-Castillo,P.M. (1988) Algas de las laguna de alta montaña de Sierra Nevada (Granada,España). Aeta Bot. Ma/ae., 13, 21-52.
Sanchez-Castillo,P.M., Cruz-Pizarro,L. and Carrillo P. (1989) Caracterizacíon del fitoplancton delas lagunas de alta montaña de Sierra Nevada (Granada, España) en relación con lascaracterísticas físicoquímicas del medio. Limnetiea, 5, 37-50.
Schwinghamer,P. (1981) Characteristic size distribution of integral benthic communities. Can. J.Fish. Aquat. Sei., 38, 1255-1263.
Schwinghamer.P. (1985) Observations 00 size structure and pelagic coupling of some shelf andabyssal benthic commuoities. In Gibbs,P.E. (ed.), Proceedings of the Nineteenth European MarineBiology Symposium. Cambridge University Press, Cambridge, pp. 347-359.
Sheldon,R. W. and Parsons,T.R. (1967) A continuous size spectrum for particulate matter in the sea.J. Fish. Res. Bd Can., 24(5), 909-915.
Sheldon,R. W., Prakash,A. and Sutcliffe, W.H. (1972) The size distribution of particles in the ocean.Limnol. Oceanogr., 17,327-340.
Sheldoo,R.W., Nival,P. and Rassoulzadegan,F. (1986) An experimental inve tigation of af1agellate-ciliate-copepod food chain with some observations relevant to the linear biomasshypothesis. Limno/. Oceanogr., 31(1),184-188.
Sprules,W.G. and Knoechel,R. (1984) Lake eco y tern dynamics based on functional represen-tations of trophic components. lo Meyer ,D.G. and Strickler,J.R. (eds). Trophie lnteraetionsWithin Aquatie Eeosystems. Westview Press, Boulder, CO, pp. 383-403.
Sprules, W.G., Casselmao,J.M. and Shuter ,B.1. (1983) Size distribution of pelagic particles in lakes.Can. J. Fish. Aquat. Sei., 40,1761-1769.
Sprules,W.G. and Munawar,M. (1986) Plankton size spectra in relation to ecosystem productivity,size and perturbation. Can. J. Fish. Aquat. Sci., 43, 1789-1794.
Takahashi,M. and Bienfang,P.K. (1983) Size structure of phytoplankton biomass and photosyn-thesis in subtropical Hawaian waters. Mar. Biol., 76, 203-211.
Warwick,R.M. (1984) Species ize distributions in marine benthic communities. Oecologia, 61,32-41.
Warwick,R.M., Collios,N.R., Gee,J.M. and George,C.L. (1986) Species size distributions ofbenthic and pelagic metazoa: evidence for interaction? Mar. Ecol. Prog. Ser., 34, 63-68.
Warwick,R.M. and Joiot,I.R. (1987) Tbe di tribution of organisms in the Celtic Sea: from bacteriato Metazoa. Oecologia, 73, 185-191.
Received on July 7, 1989; accepted on November 9, 1989
422
Copyright © 2022 FDOKUMEN