A quantitative study of the water quality and plankton of Upper ...
97
University of the Pacific University of the Pacific Scholarly Commons Scholarly Commons University of the Pacific Theses and Dissertations Graduate School 1974 A quantitative study of the water quality and plankton of Upper A quantitative study of the water quality and plankton of Upper Blue Lake, Lower Blue Lake, and the Oaks Arm of Clear Lake in Blue Lake, Lower Blue Lake, and the Oaks Arm of Clear Lake in Lake County, California Lake County, California Stephen Patrick Hayes University of the Pacific Follow this and additional works at: https://scholarlycommons.pacific.edu/uop_etds Part of the Biology Commons Recommended Citation Recommended Citation Hayes, Stephen Patrick. (1974). A quantitative study of the water quality and plankton of Upper Blue Lake, Lower Blue Lake, and the Oaks Arm of Clear Lake in Lake County, California. University of the Pacific, Thesis. https://scholarlycommons.pacific.edu/uop_etds/1853 This Thesis is brought to you for free and open access by the Graduate School at Scholarly Commons. It has been accepted for inclusion in University of the Pacific Theses and Dissertations by an authorized administrator of Scholarly Commons. For more information, please contact mgibney@pacific.edu.
-
Upload
khangminh22 -
Category
Documents
-
view
4 -
download
0
Transcript of A quantitative study of the water quality and plankton of Upper ...
University of the Pacific University of the Pacific
Scholarly Commons Scholarly Commons
University of the Pacific Theses and Dissertations Graduate School
1974
A quantitative study of the water quality and plankton of Upper A quantitative study of the water quality and plankton of Upper
Blue Lake, Lower Blue Lake, and the Oaks Arm of Clear Lake in Blue Lake, Lower Blue Lake, and the Oaks Arm of Clear Lake in
Lake County, California Lake County, California
Stephen Patrick Hayes University of the Pacific
Follow this and additional works at: https://scholarlycommons.pacific.edu/uop_etds
Part of the Biology Commons
Recommended Citation Recommended Citation Hayes, Stephen Patrick. (1974). A quantitative study of the water quality and plankton of Upper Blue Lake, Lower Blue Lake, and the Oaks Arm of Clear Lake in Lake County, California. University of the Pacific, Thesis. https://scholarlycommons.pacific.edu/uop_etds/1853
This Thesis is brought to you for free and open access by the Graduate School at Scholarly Commons. It has been accepted for inclusion in University of the Pacific Theses and Dissertations by an authorized administrator of Scholarly Commons. For more information, please contact [email protected].
A QUAJ.'JTITATIVE STUDY OB' THE HATER QUALITY f"lJ."'jD PLP.JfKTON
OF UPPER BLUE. LAKE, LOHER BLUE J.,AKE, A.ND THE O.AKS ARM
OF CLEAR LAKE IN LAKE. COUNTY, CALIFORNIA
-----------'--------'-----"4..~T-he-s.is._---------------'---------
Presented to.
the Graduate. Faculty
of the.
University of the Pacific
·rn Partial. Fulfillment
of the Requirements for the Degree
Master of Science
by
Stephen Patrick.Hayes;
May_-1974.
ACK.NO\VLEDGENENTS
L wish to acknowledge. rnY gratitude to Dr. Lee E.
Christianson whose. encouragement,_ constructive criticism,.
and helpful. suggestions ena-bled me to. complete my research
with a genuine feeling of accomplishment. I also want to
thank Dr. Francis R •. Hunter,_ Dr. Dale W. HcNea:l, and Dr.
David. G •. vlolter.. for their capable .. assistance which was
willingly offered throughout:. my r.esearch. Art and· Ruby
Erickscin graciously offered me lo~ging, and also generously
p_ermitted me to take samples. from the fishing pier in front
of their lodge on Lmver Blue. Lake. My wife, Pegi, helped
me_take and.analyze many of the water quality-samples and
typed. the manuscript., L sincerely apprec1ate her .qommit·~
ment and understanding from the conception through the
completion of this:. thesis: •.
iii

CHAPrER
I •.
II •..
· III. •..
IV •.
vr •..
TABLE OF CONTENTS.
.. . . . . • • • • •· . INTRODUCTION: • • • , •.•
lvlATERIALS AND HETHODS . . . . .. . . . ' .. . . Samp_ling Area and Sarnplj_ng Stations. . . ...
Field. Procedures. ... • • • • • • • • . . . .. Field Record~ • • • . . . - ... • • • • • •
Laboratory Procadures. • • • • • • • • • •
Laboratory Records. • • • • • • • • • • • •
Methods of Data Analysis; . . . . • • • • •
RESULTS. • •
DISCUSSION •
. . ' . • • • • • 0 • • 0 • • $
• • • • • • • • • • • • • • • •
Sl.JM1.1ARY AND CONCLUSION • • • • • • . . . . • •
- LITERATURE CITED. • • • • • • • • • • • • • •
APPENDICES • • • • . •· . . . . . . . . . . . . . . . . . A. A Map. of the Clear Lake Area • • • • • • • •
PAGE
1
7
7
7
12
12
17
18
20
22
. 45
4'7
51 51
B~ Sample Field and Laboratory Data Sheets: • • 52
D •..
List·: of References Utilized to Identify Plankton • • • • • • • • • • • • • • • • •
Plankton Identification and Count Sheet.. • •
PJ.ankter/11.3 of \vater Sampled Summary Sheet •
F.. Surface Water Quality and. Plankton
53
54 58
~easurements. Taken at Upper Blue Lake • • • 62
G.,. Surfac·e Water Quality and Plankton Measurements Taken at Lower Blue Lake • " • 64·
iv
APPENDICES.
H •.
J: •.
Surface.Water Quality and Plankton Measurements Taken at th~ Oaks Arm of Cl.ear Lal{:e__ • • • • · • • •. , •- .,~. • • •
Mid-Depth \>later Quality and Planlcton Measurements Taken. at Upper_Blue Lake
Mid-Depth Water Quality and Plankton Measurements Taken. at Lov1er Blue Lake
K~ Mid-Depth vlater Quality and Plankton
PAG;E
• • 66
68
.. .. 70
.fleasurertien t-s--:-T aken-:-at-t-n~e-o-a-k.--s-Arm,----------of Clear Lake •. •.. • • • • • • • • • • . ·- .. 72.
L.. Bottom Water Quality and Plankton Measurements.Taken at Upper Blue Lake .. •·· 74
M... Bottom Water Quality and Plankton Measurements Taken at Lovrer Blue Lake ... •... 76
N~. Bottom \•later Quality and Plankton Measurements. Taken at the. Oaks Arm of Clear Lake. • • • • . • • • . • • . • . •. •. •. •. 78
o. Matrix of Part'ialCorrelations Between Each Plankton.Measurement and Each Water_QualityMeasurement of All. Surface Sa..."llples •.•.• ··•. • • • • • • .•. • • 80
P.., Matrix of PartiaL Correlations Between.
Q ...
Each Plankton Heasurement and Each Water Quality Measurement of All Hid-Depth Samples • • •.• , • •. • • •. •. • .. 81
Matrix of Partial Correlations; Between Each Plankton Measurement and Each Water Quality l4easurement of All Bottom Samples. •. •. •. • • • • • . • • • • • •. 82.
R... The Significant Partial. Correlations Between the Numbers of Plankters and Measurements of Water Quality in the Surface Samples of Upper Blue. Lake, Lov1er Blue Lake, and the Oaks Arm of. Clear Lake, and the Levels of Significance. of Thes.e Correlations • • •.•. · 83
... ·:.~.
APPENDICES
s. Figures. Shovring Honthly Changes l.n Plankton Density and Neasurements. of \vater Quality of the Surface \<later Samples of Upper Blue Lake.,. Lower Blue Lake, and the Oaks Arm of Clear Lake. .. • • • • • • • • G
FIGURE
... ·~ . .
1.. Monthly Changes in the Dissolved
vi
PAGE
84
----------------------------~oxygen Cont~n~~f-th~-surra~e~.------~----~----
Water Samples of Upper Blue Lake, Lower Blue Lake,. and the Oaks Arm of Clear Lake • • • • • • 85
Monthly Changes in the. Cyanophyta Density of the Surface Water Samples of Upper Blue Lake, Lower Blue Lake,. and the Oaks Arm of Cl.ear Lake •. • . • • • • • •
3., Monthly Changes in the Chlorophyta.
85
· Density of the Surface \'iater Samples of Upper Blue Lake, Lower Blue Lake, and the Oaks: Arm of Clear Lake • • . • • • • •. • 86
Monthly Changes in the Copepoda Density of the ·surface 1tlater Samples of Upper Blue Lake, ·Lower Blue Lake,~ and the Oaks Arm of Clear Lake • • • • • . •. •· . 86
5.. Monthly Changes in the Orthophosphate. Content of the Surface Samples. of Upper Blue Lake, Lower Blue. Lake,: and the Oaks Arm of Clear Lake •. • . • • • • 41· • 87
6 ... Monthly Changes in the Dissolved. Carbon Dioxide. Content of the Surface Samples of Upper Blue. Lake, Lower Blue Lake, and the Oaks Arm of Clear. Lake • . • • • . • • 87
7 •. Monthly Changes in the Bacil~ lariophyceae Density of the Surface Water Samples of Upper Blue. Lake, Lower Blue Lake, and the Oaks Arm of Clear Lake • • • • · 88
APP:ENDICES (cont.).
S., FIGURE
8. Monthly Changes in the Water Temperature of the Surface ~'later Samples of Upper Blue Lake, Lovrer Blue Lake, and the Oaks Arm of Clear Lake •
9. Monthly Changes in the Ciliata Density of the Surface Water
vii.
PAGE
•· . . 88
_______________ s_ampl_e_s_o_f_llp_p_e_r~Rlne_La.ke_7 __________ _
Lower Blue Lake,. and the
'
Oaks Arm of Clear Lake • . • • •. • • 89
10.. Monthly Changes in the Nitrite Nitrogen Content of the Surface \'later Samples of Upper Blue Lake, Lo-vrer Blue Lake, and the Oaks Arm of Clear Lake.. •. •. •. • • • •. • •.
11... Monthly Changes in the Nitrate Nitrogen Content of the Surface Water Samples of Upper Blue Lake, Lmv-er Blue Lake,. and the Oaks Arm of
. ... ,
Clear Lal{e • . • • • • •. e • • • • •. 90
12:. Honthly Changes. in the Cladocera Density of the Surface ~/later Samples of Upper Blue Lake,
. LovTer Blue Lake , and the Oaks Arm of Clear Lake •. • • • • • • • 90 ' .
. ~ ..
INTRODUCT.ION
Upper Blue. Lake, Lmver Blue Lake, and Clear Lake
are located. in Lake. County, __ California, and li.e. at an- eleva- _
tion o.f lt.OD. meters. in the. midst of the northern. Coast Range
about 70. miles. north of San Francisco Bay, midvray between
the. Pacific Ocean and the. Sacramento. Valleyo.. Appendix A
shows; the relative p_osi tion and size. of the lakes.. Upper
Blue. Lake is 2 •. 1 km long -r,v-ith a mean_ breadth of 0 •. 19 km,
and a .. mean depth of 12. meters. (Report of NSli' Study 9639,
t97.2).. Lower Blue Lake is the smallest .. of the three lakes,
and i.s. only 0.8 km long vii th a mean. breadth of 0.-13 km (inap
measurement). and. a mean· depth of 3. 5 meters i>· Clear Lake~-·'
the largest natural. lake lying wholly within California:, is·
31;1.6: km long With a. mean breadth of 6.-0 km {Davis;, 1933
~-~auldin, 1960.). and a. mean depth of 6.5 meters (Goldman and
Wetzel,, 1963).,
The three. lakes- are all part of _the mountain-rim.rned ::,.
Clear Lake basin drainage system which now flowa southeast
ward. through Cache Creek. and the. eastern gorge into. the
Sacramento River.. In the. Jurassic and Cretaceous periods '
of the Mesozoic era, the sedimentary strata.making up the
Franciscan, Knoxville, and Cretaceous formations were depos
ited, and covered the area where the northern Coas.t Range
and the Clear Lake. basin now. exist- The northern Coast
1~
2
Range vras formed largely from the uplifting, folding, and
faulting of these strata during the late·Tertiary and early
Quaternary periods of the Cenzoic era (Weaver, 1949; Hiller,
1957), accompanied by moderate volcanic activity in the
Clear Lake area (Anderson, 1936; Brice, 1953). During this I
era, the Clear Lake drainage system originally consisted of
two lakes, the lower one draining into the Sacramento River
through Cache Creek, and the upper one draining through
Cold Creek and the western gorge into the Russian River.. A
low range of hills. at "'.vhat is now the Clear .Lake Narrows
separated the tvTO lakes. A lava flow from a nearby fis-
sure· formed a lava dam called Red Bank vThich blocked the
outflow through Cache. Creek and led to the raising of the
water level in the lower Clear Lake. The \vater eventually
broke through a low area in the range of hills; at what is
now Buckingham Peninsula and flowed into the upper Clear
Lake system draining through Cold Creek.
Approximately 250 years ago, a massive landslide
originating on the north side. of Cow Hountain, descended
from the southern side of the "iiestern gorge vTest of the:
Blue. Lakes. The landslide filled the. gorge to a level high
er. than the .. Red Bank lava flow at the eastern end of the.
upper Clear Lake, and the water broke through a low saddle
in the lava. cutting a gorge., called. Red bank Gorge, across
the lava •. Water once again.flowed through CacQ.e Creek and
the eastern gorge,; butnow from a single Clear Lake· composed

of the original lovrer and upper Clear r~akes: (Davis, 1933;
Hauldin, 1960) ...
3
The overflovr through Red Bank Gorge lowered the
level of Clear Lake about 18 meters below its hj.ghest level e
The wuter level of the western. gorge "'.·Tas lowered sufficient
ly to permit the sep_aration of the tvro Blue Lakes lying i.n
~------~~ill~~o~cL_f~~m Clear Lake by the combined deltas of Middle
Creek and Scott Creel~ (Davis, 19331. Ho\'rever, as late as:
1873, C8 A. Menifee wrote that during the winter, when the
input of rainfall is at a maximum, the Blue. I,akes were one
with Clear Lake. The Blue Lakes are presently connected to.
Clear La.ke only by the meandering intermittent flow of
Scotts Creek •.
Clear Lake appears to have had a long eutrophic ..... ,,\,
history because of its shallo\'T lake basin, intermittent, :.
thermal stratification,. and warm summer "'.vaters (Horne, per
sonal commvnication). The lake waters have long been en
riehed by seasonal runoff from the vlatershed especially- dur
ing the vTinter rainy season from November through March
when almost 85% of the mean annual. rainfall of 28 inches
occurs. (Carpenter, et al.,. 1927; Stetson~ 1957). Except
for brlef periods during the summer months, the warm, large
ly unstra.tifJ.ed, and enriched -vmters are maintained in. cir
culation by· considerable. wave development created by wind.
The wind is funneled across the lake by the surrounding
mountains, a.nd the large surface area of Clear Lake allovrs,
for a. long fetch (Goldman. and. Wetzel,: 1963). 11.11 of thes·e
fa.c.to!':.:: have favored the development of. turbid waters and
high standing crop of phytoplankton that. are character~~
istic of. Clear Lals::e •.
SJmilar conditions have existed on a much smaJ.ler ·
scale at I.ov:er Blue Lake, and it is probable. that. j_t has.·
l(.m.g been e.ut:rophic. also. Upper Blue Lake, ·vii th :i.ts <leG per
lake bash1 and vrell established. summer thermal. stratifi.ca~·
tion~does not yet demonstrate the turbidity and large pop
ulations of pb.ytoplankteJ~s characteristic of Low·er Blue
I~a.ke and Clear Lake"
Eutrophication is regarded as thenatural aging pro
c~ess of a lake and it normally takes many thousands of
years'". Younger oligotrophic or nutrient--poor lakes a::nd
mesotrophic or moderately enriched lakes generally become
rich in nutrients, more p;roductive, and shallov.rer as' they
mature j_nto eutrophj.c or m.:ttrie.nt~·r:lch lakes (Hasler? 194·7).
Eutrophication has' progressed at an accelerated pa.ce
in ro.c-..:r1y European and Arnerica.11. lakes in recent years appa:r-·
ently due to increased enrichment from drainage of fertil
ized e:gricul tural lands or frC>m urban se\·rage (Hasler 5 1947) ..
Tbc increase in the rate of eutroph1cation due to the en"'·
rtchment of lake vraters by the activities of mEm is c:alled
cultural eutrophication.
Ctlitural eutrophication can be considered to be a;
factor augment.ing the' naturally occurring enrichment of ·the
lakes under study. The lakes, hot springs, mineral vraters,
abundant fish, and mild climate of Lake County combined to
lure settlers in increasing numbers after· the 1850's, and
many cleared the land and began farming (Palmer, 1881;
Carpenter et. al., 19.31}. The populatlon. of' Lake County in
1877 \vas approxima:tely 7,000, and ll+,676 acres· of land -vrere
The, pppulati~n had grown to 21,600: in 19.72~, and the farm
land and orchard acerage in Lake County had grown to 26,105
acres:. in 1969. (California Statistical. Abstract, 1972). The
runoff from this fertilized.agricultural land and the sew
age. from settlements around Clear Lake, and to a lesser ex
tent ar01.md Upper and Lo\oJ"er· Blue Lake, have. been and are
no-vr adding to. the. naturallY. occurring enrichment of these
lakes .•.
There has been recent work done on the primary pro
ductivity of Clear Lake (Goldman and Wetzel, 1963), ori phy
toplankton blooms in Clear Lake (Horne et. al., 1971), and
on nitrogen fixation by blue-green algae in Clear Lake
(Horne and Goldman,: 1972; Horne et. al., 1972). So.me vlater
quality and plankton studies have been completed on Upper
Blue Lake (Bl.ue Lake Project,. 1971; NSF StudY, 9'639', 1972).
Hovrever,. there has not been a previous study includmg the
concurrent sampling of the water quality and plankton of
Upper Blue LakeL Lower Blue Lake, and Clear Lake.
This study was undertaken to examine any possible
6
associations between the measurements oi' vrater ·quality and
lake conditions, and the quantity and C·Omposi tion of plank
ton present in Upper Blue Lake, L011er Blue Lake, and the ('l Oaks Arm of Clear Lake during the sampling :period. L_A sec-
ond?:J;"'J_ .. oJ2.jgQt.i.Y._~: .. Q£,.ttJJ.§ ...... §tJJ.9:~."-~[§:.§ . .,~~g_.,,P,.!RYi9~~.-.. ~ ..... +:.~.9.2.rf.'t",9,.f ... ·
'· th.~~~~<-··~·~·~·~.El:.~.~~.~.~~.~-.~;~,.jThese measurements, '·Then taken collect-
ively, are important in:a:lcators of~"Cb:e troprri-c-s-t-a-t--e-u-r-------
nutrj_ent condition of the vTaters of the three lakes from
February through October 1972.

7
MATERIALS AND HETHODS
£g,lllJ2J..~ng .LV·ea and s_~mJ2ling Sta,:t;J.Q.n~~
Three sampli.ng stations \vere chosen for this study
and are represented in Appendix A. Station 1 (39°10'll"N. x
123°00' 26i•W.) \-ras off of a s,,rimming raft in front of Blue
Lakes Lodga on the southeastern end of Upper Blue Lake,
close to the outflo''' leading to Lovrer Blue Lake.. Station 2
(39°09 i 45 N·. x 122°5'9' 5l 11vl.) was. located at the end of a
fishing pier in front of Foster 1·s Resort located in the cen
ter of the south-vrestern shore of Lm1er Blue Lake. Station 3
(39°08' 27uN. x 122°43 '14n\•l.,) was the end of a long pier ex
tending from a private beach opposite Star Dust Court.in the \
OaksArm of Clear Lake.
A boat was available only at Upper Blue'Lake, and it
was used to· reach Station 1.. Station 2 on Lovrer Blue Lake,
and Station 1 on the Oaks Arm of Clear Lake were chosen to
provide. the maximum sampling depth possible in the absence
of an available. boat ..
Field Procedures
\'later· and plankton samples were collected during the
last weekof each month at all stations from February 1972
through October 1972. ·Before. sampling began. at each statj_on,
certain pertinent information was recorded on a field data
sheet (Appendix B). The date and time sampling began vras·
recorded at each station, along vlith the ai:r· temperature
and weather conditions.. The depth of the .,..,ater vras th,en
determined by lowering a Kemmerer vmter sampler gently to
the: bottom,. and then reading the depth from the line vThich
had previously been marked off in meters.
Fifteen· water samples were collected at each station
I
were obtained from the waters just above the station bottom,
at the station mid-depth,. and just belm'l the water surface.
Each of the first three of these samples at each depth '!!TaS:
immediately analyzed at the station for vrater temperature,
dissolved oxygen, and dissolved carbon dioxide.
\'later temperature v.ias found by quickly inserting a
thermometer ~der the raised upper valve of the Kemmerer
sampler into the water sample immediately a:fter the Kemmer
er was removed from the v/ater.. The thermometer was read one
minute: after insertion and the results \vere recorded. in de-
grees: C on the field data sheet for the station. Readings
from the temperature probe of a Yellow Springs Instrument
(YSI) Model 54 Oxygen Meter, ·available during the_months of
July and August,, were within lC of the thermometer readingsa
The oxygen.meter was calibrated at the University of.the
Pacific according to the instruction manual prior to the be
ginning of sampling during these months to insure that it
provided accurate temperature readings.
Dissolved oxygen in the second sample from each
depth at each station was measured vri th a Hach portable
field test kit, Nodel AL 36 \ffi*, using a modified azide
Winkler method vli th a drop count titration (Hach, 1972) ..
The calibrated oxygen probe. of the YSI Nodel 5li
Oxygen Heter provided dissolved. oxygen readings that v1ere
9
within one ml per liter of the Ha.Q.h_ki_t__t_e_s_t_s_at_t_h_a_s_a_m_e, _____ ---:
station and depth during July and August •. To furtherde-
termine if the Hach kit: tests were giving accurate readings,
a precise determination of the dj.ssolved oxygen present in
the water samples taken during the month of October was at-
tempted ustng a 200 ml sample and "the Winkler method for use
in the laboratory (APHA, 1971).. Biological activity that
would utilize and modify the. dissolved oxygen content of the
samples was arrested in the field. by the addition of 1 ml of
2% sodium azide and 0-.7 ml of concentrated sulfuric acid
(.AP~, 1971). The samples were placed in a· styrofoam cooler,
and were maintained at collection temperature until analysis.
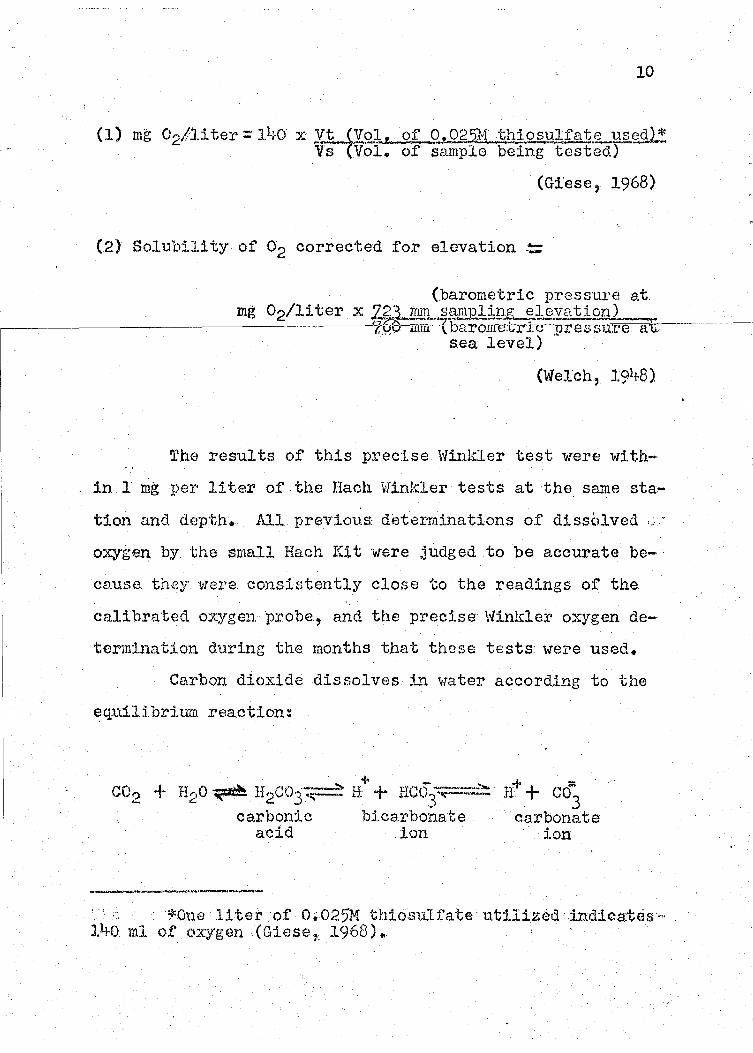
The mg of dissolved oxygen per liter in each of the
surface samples. tested was determined using the following
formulas:.
*The. Hach kit, Model AL 36 WR, will hereafter be r.eferred to as the small. Hach .kit.
10
(1) mg 02/li ter = J.L;.O X YU:Vo:).~., o£:...9.!r...Qr~.5}L~:h_iosulfat§...._1J§.g§.J.:! Vs (Vol. of' sample being tested)
·(Gfese, 1968)
(2) Solubility of 02 corrected for elevation .;
(barometric pressure at mg o2/liter x ~~lJd1.L-~QE1£l~J.ey.f!:.ii9Jl!_
1---------------------'tl.yi'J~rom~tbaro1m;;trrc---pressure at;;...·,----~ · . sea level)
(\1/elch, 1948)
The results of this precise v/inkler test were w:i.th
in .1 mg per lite.r of the Hach \'l'inlcler tests at ·the same sta-
tion and depth. All previous deter.mi.nations of dissblved .;·
oxygen by.the small Hach Kit ·were judged to be accurate be-·
cause. they· vrere consistently close to the readings of the
calibrated oxygen probe, and the prec:i.se \vinkler oxygen de
term:i.nation during the months: that these tests: were used.
Carbon dioxide dissolves in v~ater according to the
. , -., . ti eql.'l.J....~..:torJ.t:rm reac on:
.... + -H20 ~ H2COj~-.,. H + Hco3~;;:==.:::~
carbonic b1carbon.ate acid ion
--------·-·----
It+ co~ carbonate
ion
- · ·.: ~One liter of· 0•025M thiosulfate· utiliz0d .indicates·· 140. ml of oxygen (Giese,; 1968) ...

11
The amount of. carbon dioxide that dissolves in the water de
termines the amount of carbonic acid that is formed, and the
degree. to which the pH is .. reduced in. the water sample.-
The dissolved. carbon .dioxide. present in a third
Kemmerer vrater sample frc;>m each depth at. each station was
measured vTith the small. Hach, kit. using sodium. hydroxide as
--~-~a titrant__and. 0 ._1%-_p_hen.ol_p.hti:tal_e_in_s_Qlllt_i~on__a_s_a_n_end_p_o_in..t,_· ____ _
indicator (Hach, 1972) •.
A fourth Kemmerer \vater sample from each depth at
each s.tation was run through a phytoplankton net into a: la
beled plankton sample bottle.. The plankton in each bottle
vras. immediately killed and preserved by the addition of 8 to
10. drops. of a 7 part. 70% methanol and 3. p_art 5% formalin v/v
solution (Welch,; 19.48)... All nine plankton sample bottles:
were then· transported, to the laboratory for analys.is.
The. fifth and final Kemme~er vrater sample taken from·
each station,, was: run- into a~ cl·ean, dry; 3.00 ml water sample
bottle,_ maintained at-.collection temperature. in a styrofoam
cooler with ice as needed,: and _analyzed in the laboratory
within 36 hoursc for dissolved orthophosphate, metaphosphate,
and· nitrate and nitrite. nitrogen •.
A SecchL disk. was" available during the months of
August,_ September,. and. October,_ and vms. used to measure the
depth of.visibility·or.water. transparency at all three sta-
tions-.,_
I
12
Field Records
The field data sheet was desl.gned to be utilized to
conveniently record all pertinent. information and measure-
ments at each station.
La,'Qg_ratory .:e.r.ocedtp;:~
A. Hach Portable. \<later Engineer's Kit, Hodel DR-EL,
emp).oying colorimetric procedures, v.ms used to measure d:Ls·~
solved orthophosphate, metaphosphate, and nitrate nitrogen
in the samples returned to the laboratory ..
Orthophosphate. or inorganic phosphorous UP04_)-~ \-tas. measured by the stannous chloride method and direct.
colorimetric analysis (Hach,, 1972).
r; 3 -5] The amount of soluble metaphospha te eP207 ); (P3CiO)
present.in each water sample was measured using the test for
total inorganic phosphate (ortho plus meta) (Hach, 1972) ..
·The metaphosphate~were first converted to orthophosphates
by boiling, and then measured by. the · stann~::ms chloride meth
od and direct colorirrietric. analysis to give total inorganic
phosphate. Finally, the orthophosphate value for the sample
determined by the previous test was subtracted from the. · ·. :"
tbtal.: inorganic ::.phosphate· value tb ·give;. the . amount of . meta-
p_hosphi:rte present.
The dissolved nitratenitrogen.and nitrite nitrogen
in. each water sample was measured by the cadmium reduction
13
method with modified d1azotization using 1-naphthylarnine
sulfani}..ic acid follovred by direct colorimetric analysis
(Hach, 1972}.
The nitrite nitrogen in the vrater samples was meas
ured by the diazotization method using 1-naphthylamine-·.
sulfanilic acid and direct colorimetric analysis (Hach, 1972).
Tne results of this test gave the mg per liter of nitrite
nitrogen in each -vmter sample. This value is then subtract
ed from the mg per liter of total nitrate and nitrite nitro
gen value obtained from the previous test to give the mg per
liter of nitrate nitrogen present in each water sample.
All glassware used in . the field laboratory tests: 1tras
cleaned by immersion in an acid cleaning flui.d made of one
part potassium dichromate, five parts distilled water, and
five parts concentrated sulfuric acid (Johansen, 19~·0).
After immersion for an hour, the glass-vmre vras \vashed thor
oughly under running tap \vater, soaked for a fevr minutes in
distilled water, rinsed with distilled water, and finally
allowed to drip dry on paper toweling.
Each 25 ml plankton sample bottle was smoothly and
slowly shaken to freely suspend all of the plankton organ
isms in the sample. One ml of this freely suspended sample
v1as obtained using a one ml. tuberculin plastic syringe viith
out the needle.. Half of this one ml sample vias. then deliver
ed into each of the two open corners of a Sedgewick-Rafter
Counting Chamber which had a cover. glass placed obliquely
across. the cell~ The coverglass then rotated, sometimes
with assistance, to fit squarely over and seal the counting·
chamber. The Sedgevrick: Rafter Conntlng Chamber vras then
ready to be. counted.. This procedure \vas redone if air bub
bles, were p_resent.. The plankton organ:i.sms. were allovred to
settle·. for ·ten minutes, and the counting chamber ·Has then
and studied at 125x. The stage -vras moved fo!'1N"ard and back-
ward. (~ 1 ~ j t,: and plankton was connted in strips the \vidth
of the microscopic field at 125 magnification, for a dis
tance of 20 mm which is the width of the counting chamber.
During the first two months of this study, the whole count
ing chamber of 36 stripswas counted. This method proved
impractical due to the excessive counting time required for
each sample,: and it was decided to count a portion of the
chamber and then adjust the results· to represent the number
or.· organisms. present in the whole counting chamber.. D_uring
the month of April,_ three of the samples for February were
analyzed by counting the whole chamber (36 strips),._ by count
ing half of the chamber (lB strips), by counting one third
of the chamber (12: strips), and by counting one quarter of
the chamber (9 strips}. I.t was found that by counting every
third strip in the chamber and then multiplying the results
by three,, a: representation. of the_ kind and total number of
r>lankton present in the chamber \vas obtained that \vas not
significantly different than the results obtained \vhen the
15
\vhole chamber was counted.. It \vas then decided to count
one third of the counting chamber and multiply the results
by three to determine the number of each kind of plankton
present per ml of \·later. sample tested.
Certain, guidelines vlere follo\ved in identifying and
coun:ting plankton. They are as follm·Ts:
dead before the sample was preserved \vere no·~ counted be
cause in a large percentage of these cases the plankter
could not be identified.
b. Plankters,_ especially zooplankters, at the edge
of the. microscopic field were counted if more than half of
their. body viaS included in the field, and not counted if
·less than half of their body was included •.
c.. The average size. of a strand or clump of cer
tain phytoplankters was determined and counted as one •. Spec
imens·,~ strands, or clumps of each phytoplankter that \vere.
shorter or smaller than this average were counted as. propor-
tionally less than one, while those longer or larger than ·_ ·
the· average were counted. as proportionately· greater than one.
d. Since most of the plankters either sunk to the
bottom of the. chamber or rose to the top_,, each strip was;
·counted twice •. The first count was made of all plankton ly
ing on the. bottom of the chamber and the second count was.
made· of all. p_lankton lying just belovl the cover slip along I
this strip.,

16
e.- Plankters were identified to genera in almost.
all cases, and to species when possible... Appendix C list:r
the referen,~es utilized to identify the plankters. Occa~
sionallyit was not possible to key out a plankter to genus,
an<1 this plankter was placed in the. most appropriata family
and class so that it would still be. counted in the division·
totals· for plankters •.
f. A _comma '\•ras. placed after each plankter listed on
the. plankton count sheet after a strip vtas completed even if
the planltter did not appear in the strip. This procedure
eliminated confusion about which row viaS being counted and
permitted the counting of many plankters concurrently.
g ~ Samples \vi th dense a.mounts of plankters v1ere.
diluted 10:1 .•.
The number of each plankter per cubic meter of
vTater \·las fotmd using the follow:lng series of calculations:
(1) No •. of each plankter/ml of sample
= no. of each plankter counted_x 3 §ne third of chamber counteill
(2) No~ of each plankter/sample
= no f> of each planl\:ter /ml of sam:Qle x 25 fYoltune of sample bottle= 25 mJJ
17
(31 No. of each plankter/:tvi3 of 1vater sampled
no •. of each planl{ter/sample + water volume sampled in H3
(§rater volume sampled by Kemmerer used (0.0012N3l] (.Darnell, 1971)
water quality analysis and plankton counts. The results; of
the laboratory analysis of 'IITater quality were recorded on
the laboratory data sheet included in .t'.l..ppendix J3 of this:
study., The initial. plankton counts for each sample were
tabulated on plankton identification and counting sheets
(Appendix:D) designed by the investigator which listed the
major divisions and classes. of the. phytoplankters and zoo
plankters found during a previous study of Blue Lake.,
(Blue Lake P:roject, 1971). Belm-I each division or class,
the generic and specific names of the most commonly occur
ring plankters of the grouping viere listed. After the num
ber of each plankter present per M3or v.rater v.ras determined,
the number 1·-Tas entered across from the appropriate genus or
species listing on a plankter per M3 summary sheet (Appendix
~)-for each station. The genus and species listings on
Appendix E are identical to the. listings on Appendix J;J, but
are follot,red by the appropriate. division or class so that.
the sum of the plankters in each grouping can be easily ob--
18
tained.. A master data sheet of results (Appendices F.
through N) was obtained by combining the. results for each
depth at each station on. the. field. and laboratory data
sheets. (Appendix B)_ with the. appro.priate results listed on
the plankter per meter3: of· water sampled summary sheet
(Appendix. E) •
MetJl2~o1~~~a..~l¥si§~:--------------~--------~--------~------
An examination of the. master data sheet revealed. the
probability_ of numerous: correlations.. To facilitate the ex
amination of the. correlations; the data. on the master data
sheet were placed. on punch cards.. The data cards vlere then
arranged to present the data from.Eebruarythrough October
i.n Upper Blue Lake, I.mver Blue Lake, and the Oaks Arm of
Clear. Lake in the follmving sequence:. (1) all surface data,.
(2) all mid~depth data:·.,. (3) all: bottom~ data ..
- A multiple correlation analysis was· performed on
each of tha.three data; segments at the University of the
Pacifi.c Computer Center using aBurroughs ASSIST package with
a~ Burroughs B-3:500 Computer.. Each of the 10 plankton meas.
urements served. separately as'. the dependent variable in 8
analyses utilizing the seven water qualitymeasurements as
independent variables.. Partial correlations were obtained
between each plankton measurement and each water quality
measurement (Appendic'es, u, P., and Q}.. The partial correla
tions represent the degree to which the two. measurements
under study are. associated, and excludes any indirect
associations via. the remaining measurements. The signifi-

1-
19
cance of the part tal correlations \vas determined by using t
value test statistics provided by the mul tip1e co relation_
program.
The partial correlations bet\~Teen the ll'-1Ulbers of
plankters and the measurem~nts of vmter qual.j_ ty vli th levels
of significance. less than 5% \vera considered to have assocj.-
20
RESUIJfS
The. surface water quality and plankton measurements
obtained in Upper Blue Lake,. Lo-v;er Blue. Lake, and the Oaks·
Arm of Clear Lake are listed .. in Appendices F, G, and H .. ·
Themid-depth water quality_ and plankton measurements for
these lakes are listed in. Appendices r,. ~,. and K' v-rhile the
measurements. of ;,-rater q11ali ty and plankton .for the bottom
samples of these .. lakes .are listed in Appendices L, M, and
N' •.
The partial correlations between.each plankton
measurement and each :.-;ater quality measurement in the sur
face samples ,.;ere obtained from the multiple correlation
. analysis: of the surface data: from all three. lakes.. The·
multiple correlation analysis of all mid-depth data: and of
all bottom data. yielded partial correlations bet,veen each
pLankton measurement and each water quality measurement of
the mid-depth samples~ and the. bottom samples of all .three
lakes. Hatrices of all. surface, mid-d_epth, and bottom
sample: partial correlations. are given in appendices o, P,
and Q_ respectively •.
Those surface. planktonand water quality measure
ment pairs. having partial.correlations with levels of
significance less. than 5% are listed in Appendix R. The
·plankton and water q1.J.ality measurement making up each of
~-------
21
these correlation pairs in the surface samples are graphed
to. display, the association visually (Appendix s, Figures 1.
through 12) •.
22
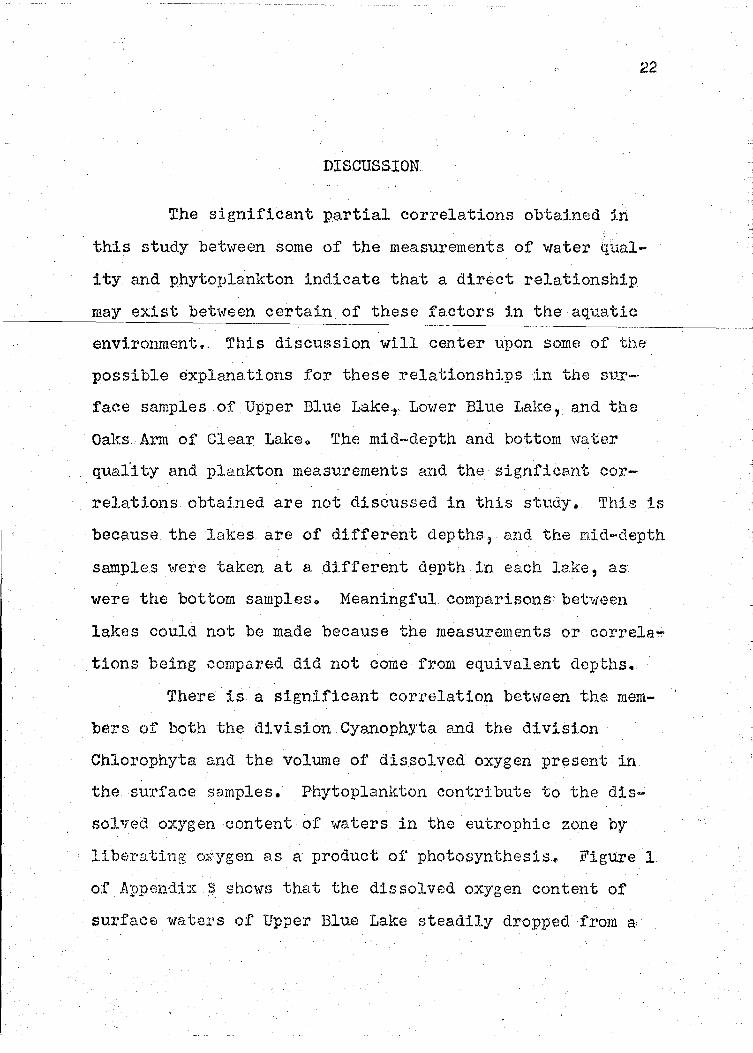
DISCUSSION.
The significant partial correlations obtained :i.n
this study betvreen some of the measurements of vwter qual
ity and phytoplankton indicate that a direct relationship
may exist between certain of these factors in the aquatic
environment... This discussion will center upon some of the
possible explanations for these relationsh:i.ps :in the ~rur-·
face samples of Upper Blue Lake,. Lm,rer Blue Lake, and the
Oaks: Arm of Clear Lake.., The mid-depth and bottom \-Tater
qual"i ty and pla.nkton measurements and the signficant cor
rela.tions obtained are not discussed in this study. TM.s is
beeP-use the lakes are of different depths, a.nd the m.id-depth
samples \>Jere taken at a different d~pth in each le.ke, as
were the bottom samples.. Heaningful comparisons betw·een
lakes could not be made because the measurements or correla..;.
tions being compared did not come from equivalent depths •.
There is: a significant correlation between the mem
bers of both the dtvision Cyanophyta and the division
Chlorophyta and the volume of dissolved oxygen present in
the surface samples. Phytoplankton contribute to the dis
solved oxygen content of waters in the eutrophic zone by
libr:rating oxygen as a product of photosynthesis.. Figure 1
o:f Appendix ? shows that the dissolved oxygen content of
surfaee ,.,ators of Upper Blue Lake steadily dropped from a
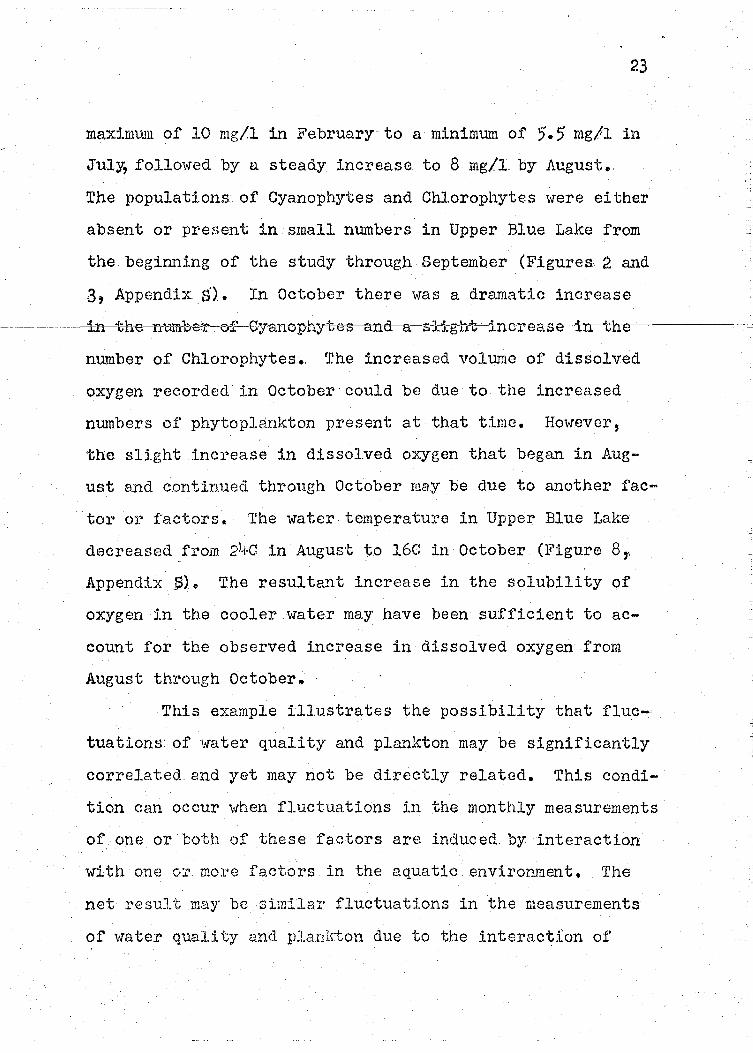
23
maximum of 10 mg/1 in Februaryto a minimum of 5.5 mg/1 in
July, followed by a steady increase to 8 mg/1_ by August •.
The populations of Cyanophytes and Chlorophytes were either
absent or present in small numbers in Upper Blue Lake from
the beginning of the study through September (Figures; 2 and
3, Appendix S). In October there \vas a dramatic increase
number of Chlorophytes. The increased volume of dissolved
oxygen recorded j_n October· could be due· to the increased
numbers of phytople .. nkton present at that time. However,
the slight increase in dissolved oxygen that began in Aug
ust and continued through October ma.y be due to another fac
tor or factors. The water temperature in Upper Blue Lake
decreased from 2l.J-C in August to 16G in October (Figure 8, ..
Appendix .S) o The resultant increase in the solubility of
oxygen j_n the cooler water may have been sufficient to ac
count for the observed increase in dissolved oxygen from
August through October.
This example illustrates the possibility that fluc
tuations: of vrater quality and plankton may be significantly
correlated and yet may not be directly related. This condi
tion can occur v1hen fluctuations in the monthly measurements
of one or·both of these factors are induced by interaction
with one o:r mo1•e factors in the aquatic environment. The
net result may be similar fluctuations in the measurements
of \vater quality and planlrton due to the interaction of
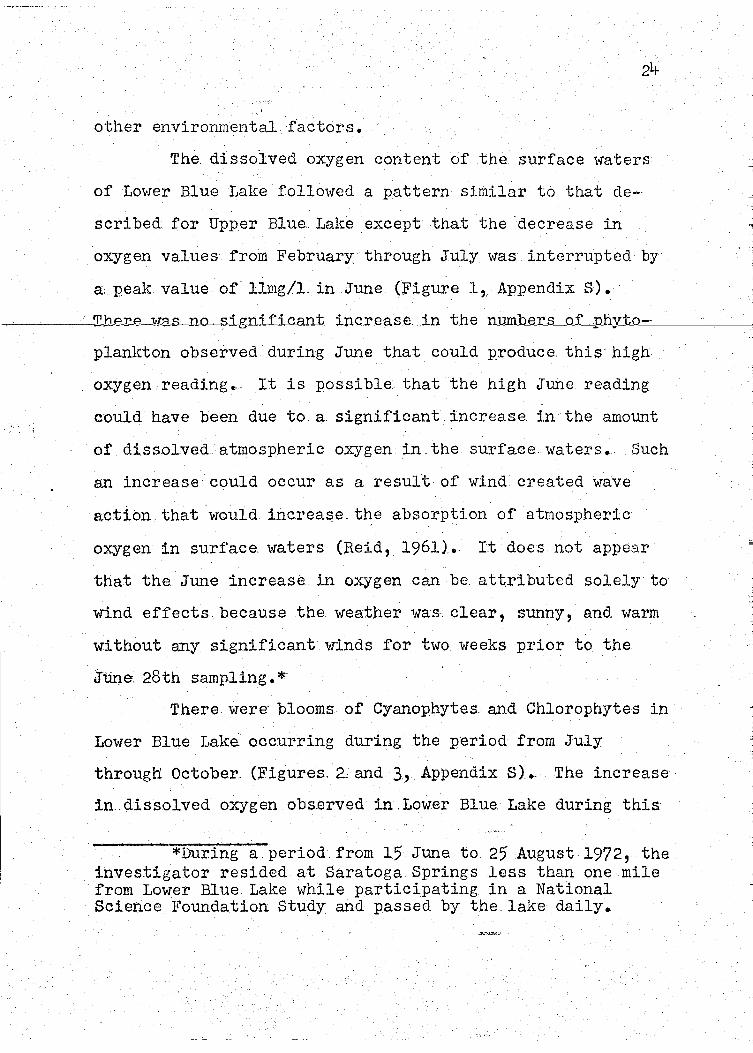
other environmental factors.
The. dis~oived oxygen content of the surface iiaters
of Lm-rer Blue Lake follmved a pattern similar to that cle-
scri bed. for Upper Blue Lake except that the -decrease in
oxygen values from February through July was interrupted by
a. peak value of llmg/1. in June (Figure 1,. Appendix S). ·
plankton observed during June that could produce this· high
oxygen.reading.,. It is possible that the high June reading
could have been due to. a. significant increase. in the amount
of dissolved atmospheric oxygen in. the surface ivaters. Such
an increase could occur as a result of wind created wave
action that -vrould increa::;e _ t~e absorption of atmospheric
oxygen in surface ivaters (;Reid, 1961}.. It does not appear
that the June increase in oxygen can be attributed solely to
wind effects because the weather ivas.: clear, sunny, and warm
without any significant.winds for two weeks prior to the
Jtine: 28th sampling.*-
There were· blooms of Cyanophytes: and Chlorophytes in
Lmver Blue Laka occurring during the period from July
througti October. (Figures. 2- and 3, Appendix S). •- . The increase
in .. dissolved oxygen obs.erved in .Lower Blue. Lake during this
*During a. period from 15 June to 25 August 1972, the investigator resided at Saratoga.Springs less than one mile from Lower Blue Lake while participating in a National Science Foundation Study and passed by the. lake daily.
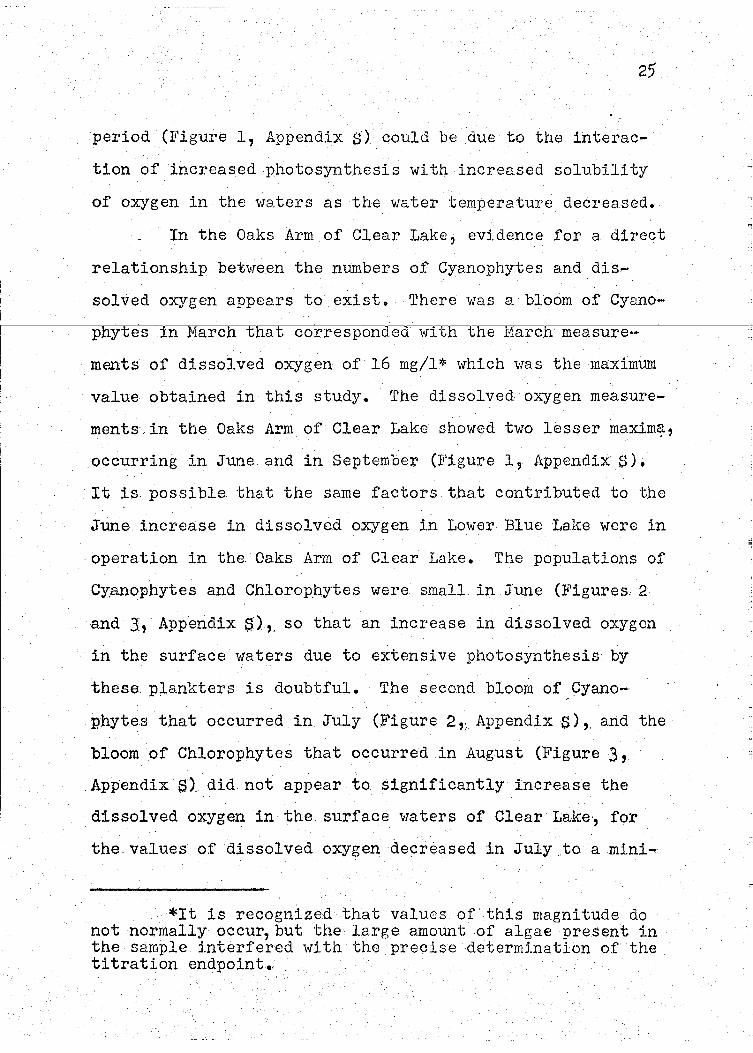
25
period (Figure 1, Appendix S) could be due to the interac
tion of increased photosynthesis with increased solubility
of oxygen in the vraters as the vrater temperature decreased •.
In the Oaks Arm of Clear Lake, evidence for a direct
relationship between the numbers of Cyanophytes and dis
solved oxygen appears to exist. There was a bloom of Cyano
p ytes in Harch that correspondeawi--:Eh the Harch measure··
ments of dissolved oxygen of 16 mg/1* \vhich \vas the maximum
value obtained in this study. The dissolved oxygen measure
ments.· in the Oaks Arm of Clear Lake showed two -lesser maxim9-,
occurring in June and in September (F'igure 1, Appendix S).
It is possible. that the same factors that contributed to the
June increase in dissolved oxygen in Lower Blue I~ake were in
operation in the Oaks Arm of' Clear Lake. The populations of
Cy,anophytes and ChloroP.hytes were small in June (:fi"'igures; 2
and 3, Appendix$),_ so that an increase in dissolved oxygen
in the surface waters due to extensive photosynthesis by
these plankters is doubtful. The second bloom of pyano
phytes- that occurred in July (~igure 2 ,:. Appendix S) ,. and the
bloom of Chlorophytes that occurred in August (Figure 3,
Appendix S1 did not appear to. significantly increase the
dissolved oxygen in the surface \vaters of Clear Lake·, for
the. values of dissolved oxygen decreased in July .. to a mini-
*It is recognized that values of this magnitude do not normally occur, but the large amount of algae present in the sample interfered with the precise determination of the titration endpoint.
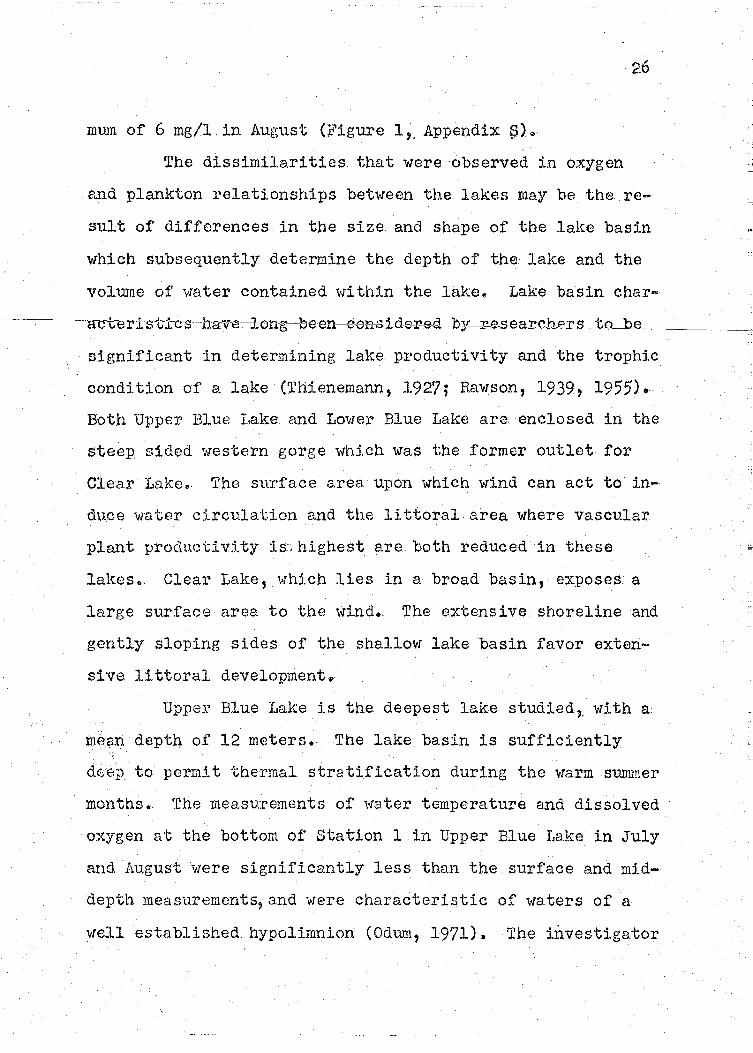
mum of 6 mg/1 in August (li'igure 1,: Appendix S)~
The dissimilarities that were ·observed in oxygen
and plankton relationships between the lakes may be the re
sult of differences in the size and shape of the lake basin
which subsequently determine the depth of the- lake and the
vol~ne of water contained within the lake* Lake basin char-
significant in determining lake productivity and the trophic
condition of' £1. lake (r.l?hien.emann, 1927; RavTson, 1939, 1955) •.
Both Upper Blue Lake and LovTer Blue Lake are: enclosed in the
steep sided western gorge which was the former outlet for
Clear Lake~ The surface area upon which wind can act to in
duce water circulation and the littoralarea where vascular
plant produeti vi ty is:; highest are both reduced in these
lalces ~- Clear Lake, which lies in a broad basin, exposes a
large surface area to the wind.. The extensive shoreline and
gently sloping sides of the shallow lake basin favor exten
sive littoral developmentv
Upper Blue Lake is the deepest lake studied,_ \'lith a
mean depth of 12 meters. The lake basin is sufficiently
dc3ep_ to permit thermal stratification during the \<Tarm sununer
months. The measurements of \vater temperature and dissolved
oxygen at the bottom of Station 1 in Upper Blue IJake in July
and August vtere significantly less than the surface and mid-
depth measurements, and were characteristic of \vaters of a
well established hypolimnion (Odum,. 1971).. The j_nvestigator
27
verifi.ed the presence or the. hypolimnion beginning at ap
proximately 10 meters in depth during three SCUBA dives to
the. bottom of Station.l. in late. July and. early .August.,
The mean depth of the Oaks Arm of Clear Lake is 7.1
meters (Horne and Goldman, 1972) •.. All of Clear Lake strati
fies only for very brief peri.ods in mid-and late summer be
cause of the shallovT lake basin and because 1vind originated
vmve. motion keeps the lake mixing (Goldman and vletzel, 1963).
The mean. depth of Lower Blue Lake is only 3 • .5 meters which
appears to be sufficiently shallm.r to prevent stratifica
tion ..
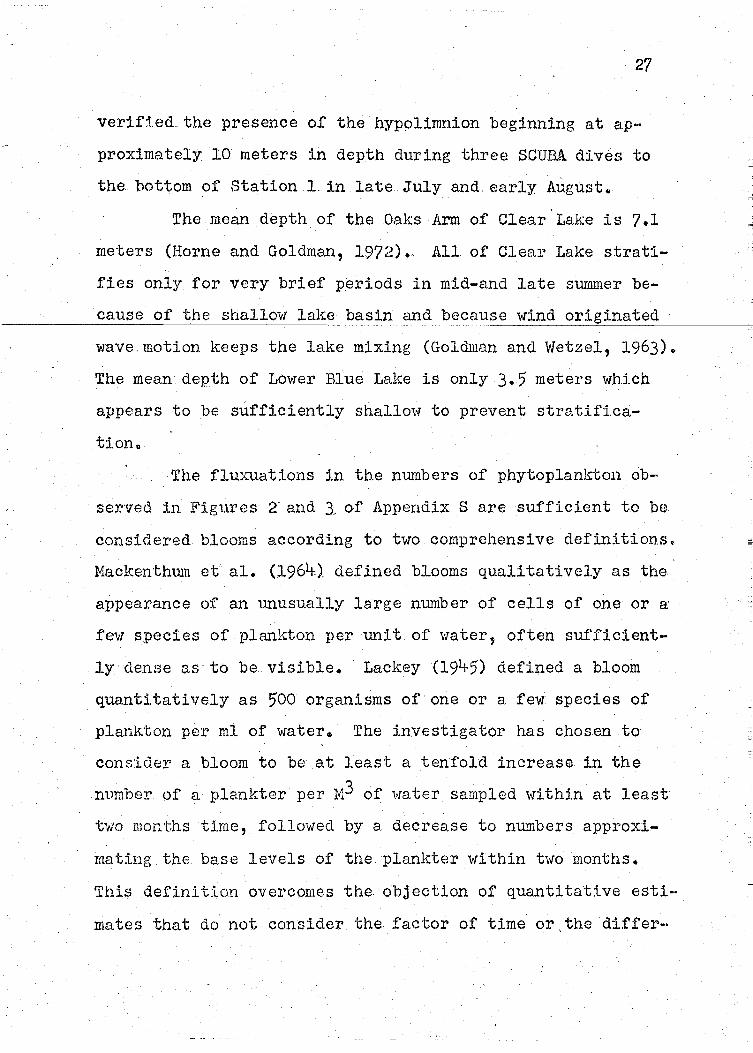
The flu.x-uations in the numbers of phytoplankton ob
served in Figures 2· and 3_ of Appendix S are sufficient to be
considered blooms according to two comprehensive definitions.
Mackenthum et. al. (1964). defined blooms qualitatively as the
appearance of an unusually large number of cells of one or a
fe\v species of plankton per unit of vrater, often suffic:tent-
ly·dense as to be visible. Lackey (1945) defined a bloom
quantitatively as 500 organisms of one or a few species of
plankton per ml of vrater. The investigator has chosen to·
consider a bloom to be at least a tenfold increase in the
number of a plankter per 1Yf3 of 't·rater sampled within at least
two rnonths time, follm.ved by a decrease to numbers approxi
mating the base levels of the plankter vii thin bvo months.
This definition overcomes the objection of quantitative esti
mates that do not consider the factor of time or.the differ-
28
ences in volume. of individual. plankters when an arbitrary
number is chosen to represent a bloom. In addition, it
eliminates the subjectives estimations of size and color
that vary from investigator to investigator inherent· in the
qualitative definitions of.a bloom.
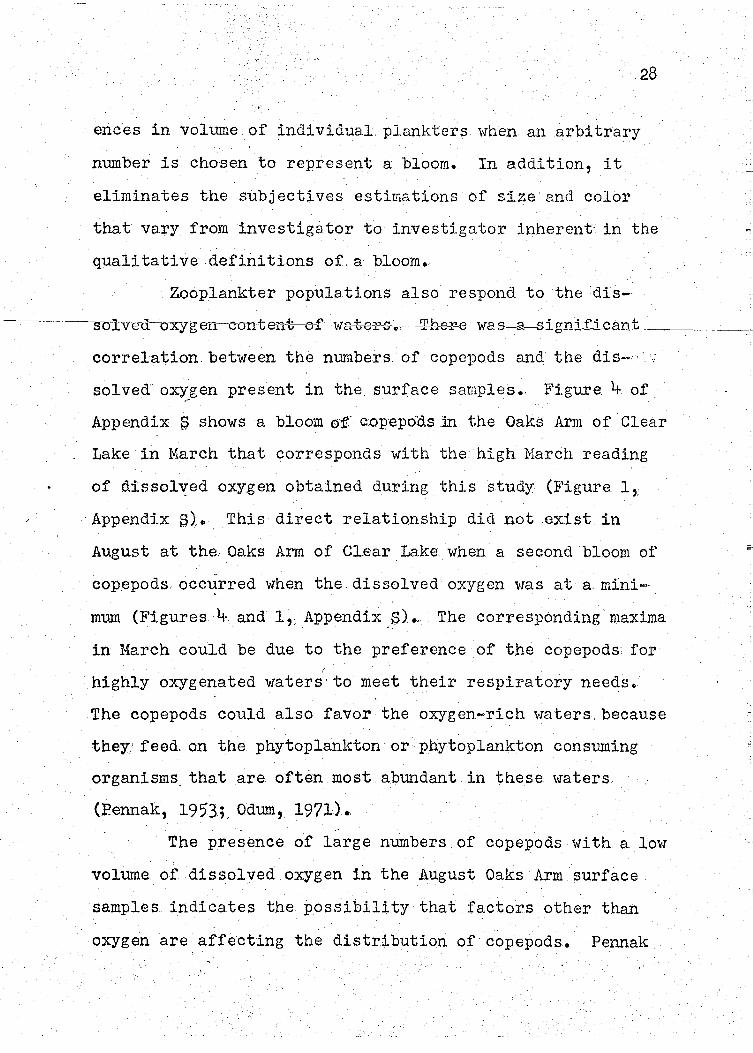
Zooplankter populations also respond to the dis-
correlation. between the numbers of copepods and the dis-·'·.,
solved ox~:gen present in the. surface samples.. li'igure. 4 of_
Appendix 9 shows a bloom o!T c:o.pepoas m the Oaks Arm of Clear
Lake in :t-iarch that corresponds with the high March reading
of dissolved oxygen obtained during this study (li'igure. lr
·Appendix S) •. This direct relationship did not .exist in
August at the. Oaks Arm of Cl.ear Lake when a second bloom of
copepods. occ~rred \fhen the dissolved oxygen vias at a. mini-·
mum (Flgures ~·.and 1,: Appendix _S) •. · The corresponding· maxima
in March could be due to the preference of the copepods: for I
highly oxygenated vraters · to meet their respiratory needs.
The copepods could also favor the oxygen-rich vraters. because
they,' feed. on the phytoplankton or-phytoplankton consuming
organisms. that are often most.abundant in these waters
(Pennak, 1953;, Odum,_ 1971) •.
The presence. of large numbers of copepods with a low
volume. of dissolved. oxygen in the August Oaks Arm surface
samples indicates the possibility that factors other than
oxygen are affecting the distribution of copepods. Pennak
29
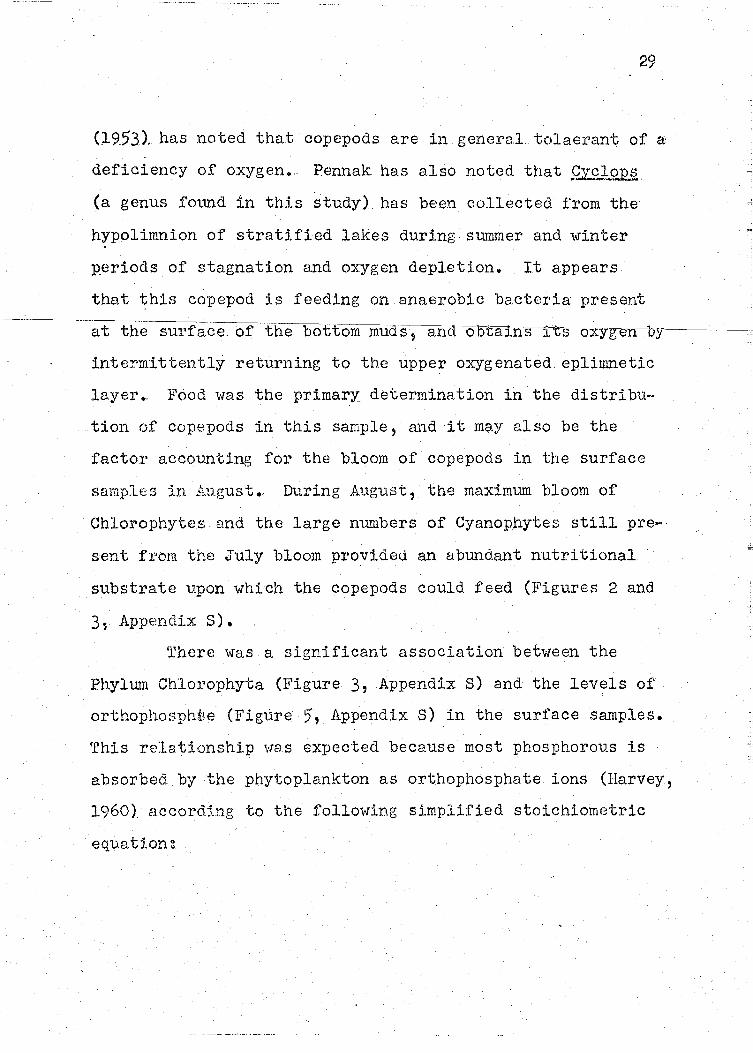
(19531 has noted that copepods are in general. tolaerant of a
deficiency of oxygen... Pennak has also noted that fL~:J-.9..122.
(a genus found in this studyt has been collected from the
hypolimnion of stratified lakes during summer and winter
p_eriods of stagnation and oxygen depletion. It appears
that ~his copepod is feeding on anaerobic bacteria present
a·i:; the surface. of the bottom muds, and---ootains i-ts-mtyg-en~by·---
intermittently returning to the upper oxygenated. epli.mnetic
layer.. Food was the primary determination in· the distribu-
tion of copepods in this sample, and it m(ly also be the
factor accounting for the bloom of copepods in the surface
samples in ,!-\,ugust. During August, the maximum bloom of
Chlorophytes.and the large numbers of Cyano:phytes still pre-
sent f'r·om the July bloom pro:vided an abundant nutritional
substrate upon which the copepods could feed (Figures 2 and
3 ~ AppE:ndix S) •
There was a significant association between the
Phylmn Chlorophyta (Figure 3, Appendix S) and the levels of
orthophosphte (Figure 5, Appendix S) in the surface samples.
rrhis rela.tionship 1:18 s expected because most phosphorous is
absorbed by the phytoplankton as orthophosphate ions (Harvey,
1960} according to the following simplified stoichiometric
equat1on:
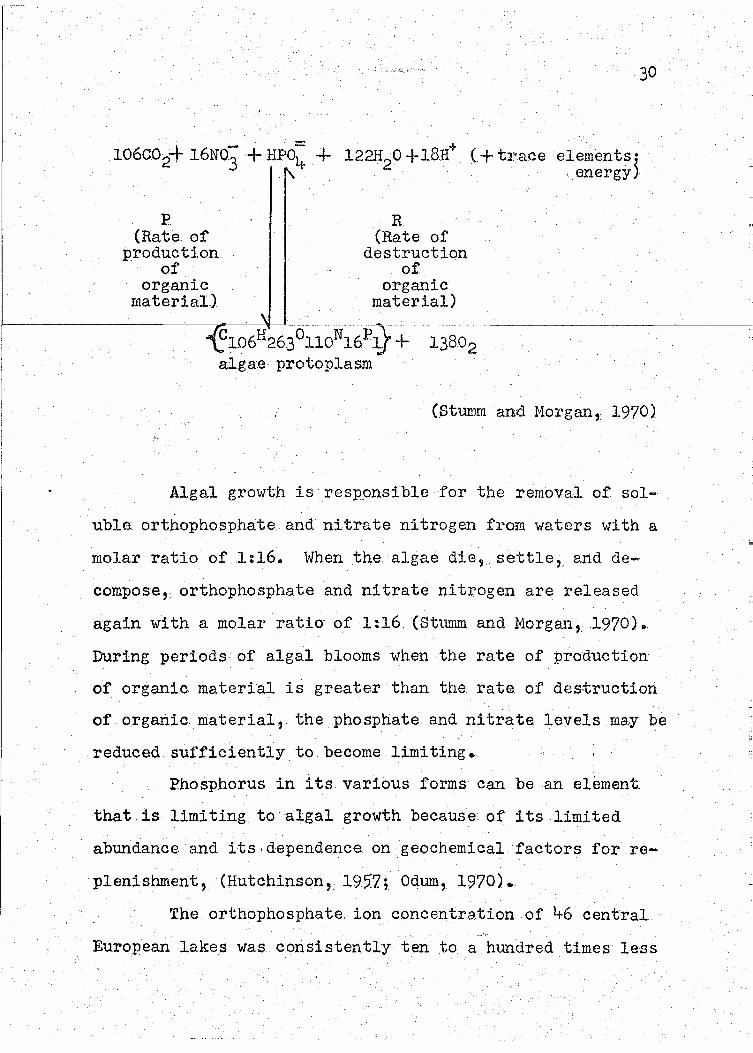
- + ' 106Go2+ 16N03 + HPo4 + l22H20 +lBli (+trace element~~
. ;energy)
p (Rate of
production of
organic material)
R (Rate of
destruction of
organic material)
~106H~63°110N16p:0-+ 13802 algae protoplasm
30
(Stumm and Horgan,: 1970)
Alga:l grov1th is responsible for the removal of sol
uble: orthophosphate and nitrate nitrogen from vraters with a
molar ratio of 1:16. \\Then the. algae die,, settle,, and de
compose,, orthophosphate and nitrate nitrogen are released
again with a molar ratio· of 1:16 (Stumm and Morgan, 1970).
During periods of algal blooms when the rate of production
of organic material is greater than the rate of destruction
of organic material, the phosphate and nitrate levels may be
reduced sufficiently to become limiting •.
Phosphorus in its various forms can be an element~
that is limiting to algal growth because of its limited
abundance and its.dependence on geochemical factors for re-
plenishment, (Hutchinson,: 195.7; Odum, 1970).
The orthophosphate. ion concentration of 46 central ~---·,,
European lakes was consistently ten _to a hundred times less

31
than the nitrate ion concentration, and, during the summer
when most of these lakes were stratlfied,. the. orthophosphate
ion concentration was reduced to traces less than 0.001 mg/1
(Thomas, 1969) •. Sawyer (1952) concluded that phosphorus is
the limiting factor in algal growth based on his study of
17 southern Wisconstn lakes, and because of a laboratory
study in vlhi.ch he obtained increased growth of blue-green
algae in natural water with a plentiful.supply of phosphorus
and a deficiency of nitrogen •.
I obtained some evidence indicating that ortho
phosphate enrichm€mt of lake vmters results in increased
algal bloOL!1So The results of extensive laboratory algal
c:ul ture in media prepared to match the condi.tions present
in natural vraters by Chu. (1942) support this interpretation •.
Chu found that 14 different plankton1c algae representative
of the divisions Chlorophyta, Cyanophyta, and Crysophyta had
fairly similar requirements for nitrogen and phosphor01.1.s o
All of the algae flourished and were maintained for over two
years in a media with nitrogen_ranging from l.D to 7.0 mg/1
and phosphorus from 0 .• 1 to 2.0. mg/1. Their grovith vlas bin~
dered when the concentration of nitrogen was less than 0.2
mg/1. and phosphorus was less than 0.05 mg/1, and also when
the concentrations of nitrogen or phosphorus exceeded 20.0
mg/1. Figure 5 of Appendix S shm..rs that the concentration
of orthophosphate at Station 1 in Upper Blue Lake vias great
er than this minimum during four months o.f the sampling
32
··- . ~ . period at Station 2. in Lm-rer Blue Lake,: vlhile at Station 3
in the Oaks Arm of Clear Lake it was above this minimum
during eight months of the nine month nampling period.
Figures 3 and 4 of Appendix. P. show. that the nur.r1bers of
Chlorophytes and Cyanophytes '· the tvTo most abundant phyto
plankters found during most of this study, YTere lm1est in
theOaks Arm of Clear Lake., This increase appears to be in
response to the concentration of orthophosphate which ex
ceeded the minimum established by Chu the least often in
Upper Blue Lake, more often in Lower Blue Lake' and most
often in the Oaks Arm of Clear Lakeo- The correlation be-
tvTeen- orthophosphata c·onten t and Chlorophyta populations;
supports this observation.
There \vas a significant correlation between the
:Qopulations of the Class. Bacillariophyceae and the dissolved
carbon. dioxide. present in the surface samples.. Figure. 7
of Appendix 9 shows a bloom of Bacillariophyceae occurring
in Upper Blue Lake in April,, and maximum numbers of Bacil
lariophyceae .. occurring in Lower Blue Lake in February and
continuing in slightly ·reduced numbers through Jtme.
Throughout this period the dissolved carbon.dioxide in both
lakes was never less than 10 mg/l (Figure 6,. Appendix g) •
. In addition,. the maximum p_opulation of Bacillariophyceae in
the. Oaks Arm of Clear Lake occurred in Narch which corre
sponded. with the. maximum level of dissolved carbon dioxide
33
observed. in the. Oaks Arm of Clear Lake$ F:r.•om July through
October the populations of Bacillariophyceae remained con-
-stant. and at a: lower level than the fluxuating populations
characterist:l.c ·of the. period from Feb1~uary through June in
Upper and Lower Blue Lake.. At no time. during the later
period did the measured. carbon dioxide concentration jn
the. surface waters of these two lakes.ex.ceed 5 mk/1 .. -~~----------------
Although Prescott (1960} observed that excessive
growths or.· phytoplankton can occur only in lakes vrhich are.
amply Bupplied \<Ti tb. co2 or with bicarbonates from vihich car
bon dioxide necessary· for photosynthesis; can be extracted,.
-(~arbon dj.oxide is not often a limiting factor.- 'I'he: level
of dissolved carbon dioxide. ""\vi thin most lakes· :l.s usually be~
ing- sufficiently replenished by absorption from the atmos
phe.re, and as a respiratory by product of lake organisms:
(Reid, 1961).. Because of this, it is possible that the de
crease in the numbers of Bacillariophyceae and the: corre-·
spending decrease in the amount of dissolved carbon dioxide
observed in Upper Blue Lalce, Lower Blue. Lake, and to a less
er extent in the Oaks Arm of Clear Lake is the result of in
teraction w:i..th other factors iii the aquatic environment.
Ga.ufin and McDonald (1965} observed that water tem
peratura. appeared to. be. the primary factor correlated with
diatom populations during the summer months.. As the tem
perature o.f Deer Creek Reservoir in Utah approached 21C,. the
populatlon of the diatoms of theo g(mera A§1£.rionella and
SJeJ?h.§:_noqi,scus declined rapidly~ During the winter these
same diatoms, along with Fragillari ... ~ and .Qx.£1.9..:'~.?1]&, ·became
dominant· in the. colder ice. covered waters. Representatives
of these same genera were dominant in Upper Blue Lake, Low
er Blue Lalce:, and the. Oaks Arm of Clear Lake. A study of
Figures 7 and 8. of Appendix: S .sho-w:: that the maximum numbers
-----o1'-Ba-c-i-l-l-ru.-.rol=rlryc~e-a-~o~b~s~erv-e~d-in~tnj~s-s-tuuy-o-c-curreaam·ing
the months; of February through April. when the measured \!Tater
temperature 1.-ras. 16C or less,1 and the minimum populations.~
occurred inJuly: through.September when the measured water
temperature was: 20C or greater •.
Another factor that can interact 1vi th and influence
the volume. of dissolved carbon dioxide present in the sur
face. samples is the assimilation of carbon dioxide in photo
synthesis. by algae. The lower concentration of dissolved
carbon.dioxide that was measured in Upper and Lower Blue
Lake from July through October may be the result. of in
creased~ daylight assimilation of carbon dioxide in photosyn
thesis.: by· the increased. numbers of Cyanophytes and Chloro
phytes. present during this. period. (Figures. 2- and 3:,. Appendix
Sl.. In the Oaks. Arm of Clear Lake, the dissolved carbon
dioxide.levels fluxuated between.5 and 15 mg/1 throughout
the study \vith maximum levels. occurring in. March and July
(;Figure 6,: Appendix. S). There ,1ere corresponding peaks in
the. numbers· of Cyanophytes during these months; (Figura 2,
Appendix s).. It appears that the photosynthetic C01113Ulnption
35
of dissolved carbon. dioxide by tbe Cyanophyt·as, and other
algae present in the Oaks .Arm. surface srunples Has not as
significant a factor in reducing the dissolved carbon diox
ide content as it was in Upper and Lovwr Blue Lake •. · It is·
possible that tl;le large and shallow lake basin of Clear
Lake is a significant factor in determining the dissolved
across Clear Lake has a long fetch,, and is able to create
small waves and induce. surface \vater circulation throughout
the lake permitting maximum absorption of atmospheric car
bon dioxide.. The fluxuations in the dissolved carbon diox-·
ide measurements in the. Oaks Arm could then be. due to vary
ing wind conditions, across. the lakeo·
The correlation bet\-reen the numbers of the Class:
Ciliata and surface water temperature. indicate that z.oo-·
plankters also respond to temperature changes..,. Tbe maximum
surface water temperatures were recorded in this study on
all three lakes from June throu~h August,: and ranged from
23C to 28C. (Figure 8 ,: Appendix. S) •. During this three month
P.eriod,_ ciliates were present in small numbers during July
in Upper Blue Lake. and ·Lmver Blue. Lake.. Pennak (1953) has:
noted that the optimum temperatures. for protozoans generally
lie between .16C. and 25C.,; which indicates that they favor
warm waters. Noland (192.5}.noted that most free living
species· of protozoa, of which ciliates are predominant, show·
wide ranges of tolerance to single environmental factors
such as_ temperature,_ dissolved oxygen, dissolved carbon
dioxide, and water pH.. The combined. effect. of these physia•
cal factors in different localities favored the production
of bacterial grO'I.•tth or algal grmvth in varying degrees.
Most of the 65 species of ciliates that Noland studied were
holozoic, and ingested algae,. bacteria, and other zooplankters,
----J.::l-~:U.ho_tig)l_s_pecific ciliates favored one of these food, sources.'!
Because one o~ more of the physical factors described previ
ously consistently correlated -v.ri th the food habits of the
ciliates: studied, Nolan. concluded that the nature and amount
of food available. in an aquatic environment was-the most
s:tgni.ficant factor studied in determining the distribution
of ciliates. In addition, the food source \vas: often ob
served to be less tolerant to. changes in the factors studied
than v1ere the ciliates feeding upon them and linli ted the
distribution of the ciliates.
In both Upper and Lov1er Blue Lake, the dissolved
oxygen content and nutrient levels \vere sufficient to favor
the growth of algae, a.nd it is probable that the maximum
population of Ciliata that developed in these lakes was due
to the algal food source that became available at that time.
The correlation between populations of ciliates and vmter
temperature could then have. been due to the response of the
cil:lates to fluxua.tions of the food supply partially brought
about by changes in the \•rater temperature •.
There -vms a correlation between the Class ·ciliata
37
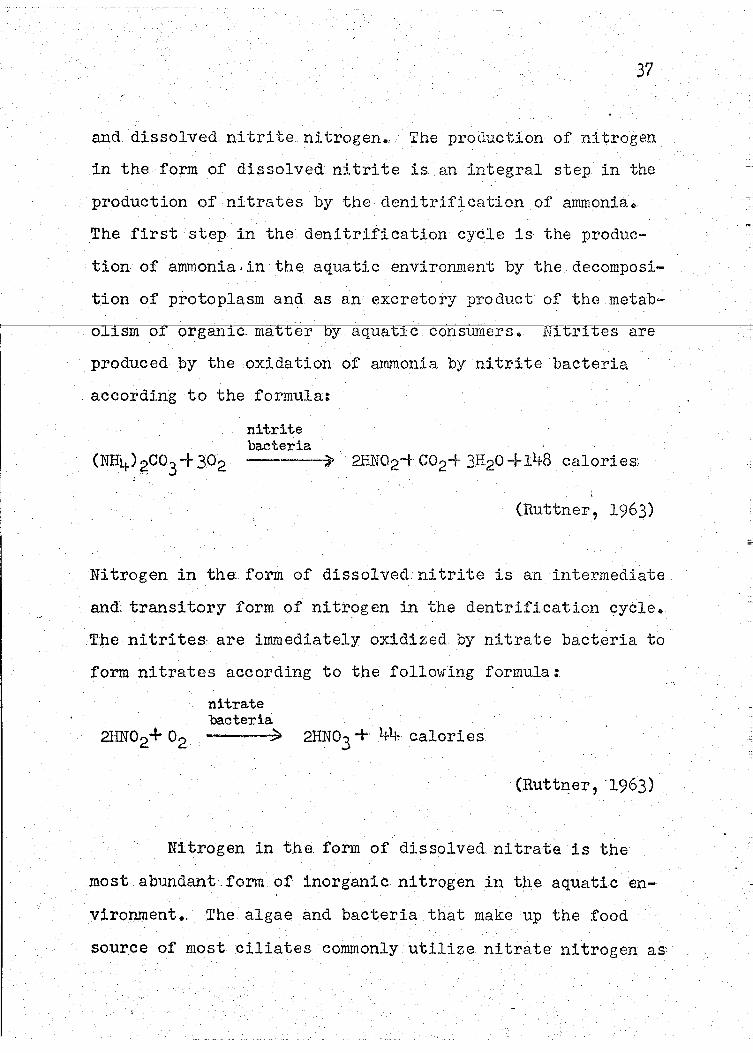
ru1d dissolved nitrite nitrogen., The production of nitrogen
in the form of dissolvednitrite is an integral step in the
production of nitrates by the denitrif~cation of ammoniac.
The first step in the denitrification cycle is the produc
tion of ammonia. in the aquatic environment by the decomposi
tion of protoplasm and as an excretory product of the metab
olism of organic. matter by aquatic consumers.. £U-tri tes are
produced by the oxidation of ammonia by nitrite bacteria
accord1ng to the formula:
nitrite bacteria --~ 2HN02-+ co2+ 3H20+148 calories;
(Ruttner, 1963)
Nitrogen in thaform of dissolved.nitrite is an intermediate
and~ transitory form of nitrogen in the dentrification cycle.
1'he nitrites are immediately oxidized by nitrate bacteria to
form nitrates according to the follmv-ing formula:
nitrate bacteria
2HN02+ 02 ~ 2HN03 +· 41,~- calories.
(RuttD;er, ·1963)
Nitrogen in the form of dissolve.d.nitrate. is the
most abundant.form of inorganic. nitrogen in the aquatic en
virop.ment.. The algae and bacteria that make up the food
source of most ciliates commonly utilize nitrate nitrogen as:
a source. of nitrogen for growth (Odum,, 19711. The ciliate
food supply would respond to fluxuations in the levels of
nitrate nitrogen rather than nitrite nitrogen, and the in
fluence of the food supply on the association betvreen
ciliates and· nitrate nitrogen v10uld not exist~
There were small population of ciliates in July ih 1-----------'------~-----c:---~-::-:-------~------;---------------.·-
Upper and Lower Blue Lake (Figure 9, Appendix S_) ... - The
nitrite nitrogen levels in all three lakes 1>1ere consistently
0.015 mg/1 or les~ except.for two higher reaqings in· the
Oaks, Arm of Clear Lake (Figure 10,. Appendix $). Evidence
for the. association between ciliates and nitrite nitrogen
is not clear from a study of :F'igures 9 and 10 of Appendix s, §..rid· is ··nat. supported .. in the. literature ....
A negative. correlation betvreen the Phylum Cladocera.
and nitrate nitrogen .indicates . that 1vhen the value of one
increases, the value of the other decreases. Cladocerans
are filter feeders, and digest bits of algae, protozoans,
bacteria, and organic detritus (Pennak,~ 1953) •. A reduction
in· the concentration of pitrate nitrogen could occurwith an
increase in the population of cladocerans· if:·_these _. cladoc-
erans were responding to an increase in an algal food supply.
Nitrate nitrogen would be utilized and reduced by the algae,
and the cladocerans would thrive on the.algae or other food .
organisms. associated with the algae.. Ruttner (1963) _ ob--
served that the utilization of nitrate nitrogen during the
summer stratification of moderately eutrophic lakes can lead
39
to the reduction and complete disappearance of nitrate from .~·
the epilimnion •.
There was a reduced amount of nitrate nitrogen in
all three lakes in June (Figure. 11,: Appendix S) ,_ and in
creased numbers of cladocerans at Upper Blue. IJake and Lower
Blue Lake durj.ng this month... There were increasing numbers
and greater numbers of Bacillariophyceae in Upper and Lovrer
Blue Lake (Figure 7 ,_Appendix S}.. In all cases, the numbers
were less than the maximum populations observed during trds
study. Large. numbers of chlorophytes did not appear until
August (Figure 3., Appendix S).. The algae could have been
reduced to the modest numbers observed by grazing by the
abundant cladocerans and other zooplankters present. Hovr--
ever,. the algae present could have been sufficient to reduce
the nitrate nitrogen to the levels observed in June.
Meny investigators -have searched for one or two lake
characteristics that·would provide an accurate estimation of
the trophic state or nutrient condition of. the lake -yraters.
Lakes have been classif1ed by trophic type on the basis of
mean depth, water transparency, bottom sediments, total dis
solved solids, electrical conductivity, oxygen, benthic
faun.a, and algae.. No one of. these variables provided a con
sistent, comprehensive, and accurate determination of the
trophic state of lake waters.
~~his study gives an indication of' the difficulty in-

40
volved with attempting to classify lakes by trophic type by
using . a~ single variable.. The. small. numbers of signif:i..cant
partial correlations obtained between water quality measure
ments. and plankton populations indicate that fevr factors act ·
independently of other factors to produce a direct ~ffect on
another· factor.. Most of the factors studied .interacted with
lake. It is therefore difficult to apply a .. single measure
ment of a lake characteristic that would provide an accurate
estimation of the. trophic. state of lake. waters ...
The investigator has chosen to make a statement
about the trophic state of each lake studied by considering
some of the factors: that enrich lake vraters,- and those fac
tors. within the lake that respond to or are affected. by en
richment. · Ra\vson (1960) has:. been successful in classifying
lakes by considering more. than ona variable and the .investi-·
gator feels that this procedure should be emphasized in fu
ture:. research·-
Upper Blue Lake appears to have the least potential
for enrichment of the lakes studied because of its deep lake
basin.. This basin permits. the development of a deep hypo
limnion that: retains. nutrients. received from the epilimnion
throughout s1.unmer stratification. These nutrients would not
be available to phytoplankters and zooplankters until the
stratification of the. vraters of Blue Lake was reduced suf
ficiently by the cooler fall surface water temperatures to
ltl
permit. circulation of the. waters once again by surface
winds.
The shallovrer lake basins of Lower Blue Lake and
Clear Lake are not sufficient enough to permit strong st1Jll
mer stratification of their vraters, and to permit hypo
limnetic development. A.. large portion of th.e total volume
similar to the waters of the epil.imnion of Upper Blue Lake.
The waters are more enriched with nutrients throughout the
summer because nutrients are being recirculated rather than
migrating vertically downward and being absorbed. by a colder
noncirculating hypolimnion. The waters of Clear Lake are
particularly rich in nutrients because of runoff from sur-
rounding fertilized farm and orchard land during the winter
rainy season,_ and. because of the. large input of sewage from
many shoreline settlements~
The limited Secchi disk readings taken from August
through October (Appendices F, ~G.:,., and :n) show a decrease
in water transparency as one progresses. from Upper Blue Lake
to. Lmver Blue Lake,_ and finally to the Oaks Arm of Clear
Lake... Hooper (1969 )_ observed that changes in· the trans-
p~rency_ of the water column not due to suspended sediments )
can be indicative of the abundance of plankton organisms,_
and. _that transparency changes have been used to. assess. the
rate and degree of eutrophication. Figures 2 and 3 of
Appendix S show that Upper Blue Lake has: the least amounts·
1~2
of Cyanophyta and Chlorophyta, the tvro most common divisions
phytoplankters observed in this. study 0· The maximum trans ....
parency obtained ln Upper Blue Lake vms .. 5 meters which is
characteristic of a lake that is:moderately enriched. Lower
Blue Lake, with larger amounts of Cyanophyta and Chlorophyta
in the surface waters (Figures 2 and 3, Appendix S), had a.
____ _.._e_du.ced maximum transparency of l meter and is much more:
eutrop1.'.1ic than Upper Blue Lake. The investigator noted
from plankton counts and the green color of the surface
waters that the reduction in transparency in Lower Blue Lake
was due to extensive growth of algae and not due to an in-
crease in suspended sedimentsn
The Oaks Arm of Clear Lake had the largest amounts
of Cyanophyta and Chlorophyta. in the surface waters (li'igures.:
2. and 3, Appendix S), and had a maximum transparency of only
0.,5 meters.. 'rhe reduction of water transparency to less:
than a meter because of extensive algal grmvth in the Oaks.
Arm of Clear Lake indicates that this basin of Clear Lake is:
markedly eutrophic ..
Changes l.n the quantity and composition of plankton
within. a lake ca.n serve as an index of the enrichment and
eutrophic state of a lake., Phytoplankton respond to in
creases i.n essentiaL nutrients,_ especially of nitrogen and
phosphorus, 1<Ii th increased growth,, and excessive blooms of
phytoplankters are often the result of enrichment. Hasler I
(l9LJ·7) descr:l. bed many lakes which received increased amounts
of nitrates and phosphates in recent years from runoff from
fertilized agricultural land,. or from increased se'l.vage in
put from nearby settlements.. The characteri,stic response
of these lakes was increased plankton blooms, especially of
Cyanophytes ,; during the SU.l"!IDler months.. Hrumner (196tr) found
Cyanophytes to be. the most common bloom producers in tvrenty-
algae found 1trere: @.qb_a_en,?,:, Ivlic.r.ocysti:~,;· and ~ni.JlQ,_rgg_IJ.9]l,
and Hammer studied the effect of orthophosphate on these
plankters.~ He found that .Anaba.ena. blooms lagged orthophos
phate peaks by one to t\110 \ITeeks, while the concentrations of
orthophosphatR appeared to influence the grmvth of ~n5~
..zqm.§ll_.Q!1 directly vli tb the highest blooms developing in
lakes with the highest orthophosphate concentration. Be,...
cause of the response of Cyanophytes to increased nutrient
availability,_ some. investigators; feel that they are usefuJ.
indicators of ·cultural enrichment . (Prescott, 1951+; Brooks.
1969}.
Cyanophytes vTere present in all of the lakes. studied.
However,; the quantity of Cyanophytes in Upper Blue Lake viaS.
slightly less than the.: quantity in Lower Blue Lake, and
significantly less than the q~antity in tha Oaks Arm of
Clear Lake. (Figure 2,. Appendix 3}.. The composition of Cyano-·
phytes, in all. lakes was similar to that found by Hammer vlith
Jmabae~., !i!£rocystis, and Aphanizomenon, common.
The orthophosphate concentration of Upper Blue Lake

\vas also slightly less than the. concentration of orthophos.
phate in Lmv-er Blue Lake,_ and significantly less than the.
orthophosphate concentration of the Oaks .. llrm of Clear Lake.
It is possible that the. Cyanophytes.were responding to the
increased levelq of orthophosphate in a manner similar to
that described by Hammer.
concentration of orthophosphate \vithin the three lakes
studied indicates.that there is.a progressive enrichment of
the lake waters as one considers Upper Blue Lake, then Lower
Blue Lake,; and finally the Oaks Arm of Clear Lake ..
SUHHARY AND CONCLUSI-ON
Upper Blue Lake, Lmv-er Blue Lake,_ and Clear Lal~:e are
three pop1.1lar recreational lakes in Lake County,, California.
The geological history of the lakes was briefly traced.
Surface,. mid-depth, and bottom vrater quality and plankton
populations of the.lakes.were studied during anine month
p~riod. from February through October,. 1972 ... · Heasurements
were taken o.f'water temperature, dissolved oxygen, dissolved
carbon dioxide, orthophosphate, metaphosphate, nitrite
nitrogen, and nitrate nitrogen. All plankters were identi
fied, classified, and the number/£.13 of vrater sampled v1as .
. determined •.
A.partial correlation analysis was performed on all
of the water quality and plankton data.. Each of the major
plankton groupings served separately as the dependent vari~·
able. and the water quality measurements served as. indepen
dent variables. In the surface. samples, the following posi
tive correlations. were found to be significant:. Cyanophyta
density with dissolved oxygen, Chlorophyta density with dis
solved oxygen,. and with orthophosphate,, Bacillariophyceae
density with dissolved carbon dioxide,_ Ciliata density with
temperature,. and with nitrite, and Copepoda density with
dissolved o::cygen. In addition,; Cladocera density was in
versely correlated with nitrate ni trag en •.
46
Th~ few significant correlations among the large
number of .. water quality and plankton measur€ment pairs cor-·
related indicate that fe1v factors act independently of
other factors to produce a dir~ct effect or1 another factor.
Most of the factors studied interacted 1.vi th other factors to
produce the observed characteristics of each lake.
Upper Blue Lake, Lm·Ter Blue Lake, and the Oaks Arm
of Clear Lake differ in the characteristics of the Lake
basin,_ in the composition and quality of the plankton ob
served,_ and in the measurements of water quality.. All of
these factors contributed to the determination of the
trophic state or nutrient condition of the lake waters.
Evidence from this study indicates that Upper Blue Lake has:
the least amount of enrichment of its vraters, \vhile Lower
Blue Lake .has a slightly greater amount of enrichment,: and
the Oaks Arm of Clea·r Lake has: the greatest amount of en':"'
richment of its- vraters •·
LIT.ERATURE CITED
American Public Healtl:l Association, Inc. 1971. Standard Methods; for the Examination of lf!ater and \·iastevrater. 13th ed. American Public Health Association Publication Office,. Washington, D •. c •
.Anderson, C •. A. 1936.. Volcanic. history of the Clear Lake ______ ___.a~r.,_.e.,.,.,a~ .. - California: Geol .•. So.c •. America Bull •. 47:629-66lt-,..
Blue. Lake. Proj e.ct Report.. 1971.. Biology Dept. Univ" of the Pacific,: Stockton, California. (Unpublished data).
Brice.,: J". c.. 1963.. Geology of Lmver Lake quadrangle, California •. Calif •. Div.- Mines. Bull.. No ... 166~
Brooks,. J. L. 1969. Eutrophication and. changes in the composition of. the zooplankton.. Pages. 236-255 in G. E. Rohlich,. Chairman, Eutrophication: Causes, Consequences, Correctives. National.Academy of Sciences, \•lashing ton, D. c •.
California: Statistical. Abstra.ct. 1972. Senate of the State of California, Sacramento, California.
Carpenter, E. J.,. R. W. Storie,: and S. V.I. Cosby. 1927 .. Soil. Survey of the. Clear Lake Area, California. U. s •. Dept. Agr., Bur. Chern. and Soils. Ser. 1927. No. 13. u •. s •. Government Printing Office, Washington, D •. c.
Chu, s •. P.. 1942:. The influence of the mineral composition of the. mediUm on the growth of planktonic algae .. 1 •. Methods and culture media ... J. Ecol .. 30:284-325 •.
Darnell,. R .. 11.. 1.971. Organism and Environment:. A Nanual of Quantitative Ecology. W •. H., Freeman and Company, San Francisco,, California •..
Davis, W. M... 1933.• The lakes of California_. California J. Mine.s and Geol.. 29 :.1t'?5-2.3.6 •.
Gaufin,. A., R •. ,. and. D •. B •.. McDonald. 1965. Factors influencing algal. productivity in Deer. Creek Reservoir, Utah •. Trans •.. Am. Micro:sc •. Soc •. 84.:.269~279.
Giese,, A. c. 1968. Laboratory Nanual. in Cell. Physiology. 3:rd ed •. B·oxwood Press:, Pi ttsbu,rgh, Pennsylvania:.
48
Goldman, c. R .. , and R. G. Wetzel. 1963. A study of primary productivity of Clear Lake, Lake County, California.. Ecology 44:283-294-. -
Hach Chemical.Co. 1972. Hethods.Hanual for Bach DR-EL Series Portable Water Engineer's Labora~ory. . 8th ed.,. Ames, Iowa.
Hammer,_ u •. T •. 1964.. The succession of "bloomtt· species of blue-green algae and some causal factors. Verh. Int ... Verein. Theor. Angew. Limnol •. 15:829-836 ..
r---~~~_,lJ.Jatr_y_ey,; H. W. 1960. The Chemistry and Fertility of Sea Waters •. Cambridge University· Press, New York, New. York~.~~~-
I .
Has1er, A.o D." 1947... Eutrophication of lakes by domestic drainage.,. Ecology 2.8:383-395 •.
'
Hooper 1. F. F. 1969.. Eutrophication indices and their relat~on to other indices of ecosystem change. Pages' 225-235 in G. E. Rohlich, Chairman, Eutrophication: Causes:, Consequences,_ Correctives.. National. Academy of Sci-
. ences, \>lashing ton, D. c.
Horne, A •. J. Personal Communication. August 1973
Horne, A • .r., P. Ja:vornicky,_ and c. R •. Goldman. 1971.. A freshwa:ter ttred. tide11 on.Clear Lake, California.. Lironol. Oceanogr •. 16:684-6-89. ·
--~.....-··, and c •. R •. Goldman. 1972. Nitrogen fixation in Clear Lake, California:. I. Seasonal variation and the role of heterocysts. Limnol •. Oceanogr. 17:678-692.
--~:-::::· , .. J. E. Dillard, D. K •. Fujita,, and c •. R. Goldman. 1972. Nitrogen fixation in Clear Lake, California:. II. Synoptic studies on the autumn Anabaena bloom. Limnol. Oceanogr. 17 ;.693-703.
Hutchinson, G. E., 1957 .... A. Treatise of Limnology. Vol. I .. ·- John Wiley and Sons, Inc.r New, York,: N.ew York.
Johansen, D. A. 1940.. Plant Microtechnique.. McGraw-Hill Book. Company, New, York,. New York •.
Lackey, J. B.. 1945 •.. Plankton productivity of certain southeastern Wisconsin lakes as related. to fertilization. li ... Productivity.. Sewage Wks. J •. 17.:.795-802.
Ma.ckenthun, K. M., · W. M. Ingram, and R. Porges •. Limnological. Aspects of Recreational. Lakes •. Serv.,_ Publs •. Wash •. , No. 1167.
1964. Publ. Hlth.

Mauldin, H. K. 1960. History of Lake County., Vol~ I. Clear Lake and Ht. KonocktL. \:Vest Wind Printers, San Francisco,_ California.
Menefee, C .. A.. 1873. Historj.cal and Descriptive Sl{etch~ book of Napa, Sonoma, I.ake, and He:.o,docino Countries .. Reporter Publishing House,_ California.
Miller, vl .. ,J. 1957. California Through the Ages, The Geologic Story of a Great State. Westernlore Press, Los Angeles, California.
t------'N=o=l=a=n~d=;, Lv E. 1925. .Factors influencing the distribution I. o:t fresh '\vater ciliates. J1;cology 6:±F3-7-lf5-2-.----------
.. Odum, E. P. 1971. Fvndamentals of Ecology. 3rd ed. w. B. Saunders Co., Philadelphi~, Pennsylvania.
Palmer, 1. L. 1881. History of Napa and La.ke Counties, California} and Biographical Sl.:etcb.es.. Slocum, Bowen ru1d Coo, California. ·
Pennak, R. 1JJ. 1953.. Fresh vJater Invertebrates of the · United States. Ronald Press Co., Nevi York, Nevi York.
Prescott, G .. W. 1954. How to Knm·! the Fresh-vJater Alga. e • . \tim. c .. Brovm Co., Dubuque, Im·ra.
--·-· 1960. Biological disturbances resulting from algal populatj.ons in stancling '~;mters. Pages 22-37 in The Bcology of Algae, Spec. Pub~ No. 2 P~1atuning Laboratory of F'ield Biology, University of Pittsburg.
Ravrson, D~ · s. 1939.. Some physical and chemical factors in the metabolism of lakes~ Pages 9-26 in F. R. Moulton, ed. Problems in Lake Biology. Amer. Assoc. Adv. Sci., Pub. 10.
-----· 1955. Horphometry as a dominant factor in the productivity of large lakes. Verh~ Int. Verein. Theor. Angm'l. Limnol. 12:164-175.
~ 1960. A limnological comparison of twelve large ---lakes in northern Saskatche'\1an. Linmol. Oceanogr.
5:159-211.
Reid, G. K. 1961. Ecology of Inland itJa.ters and 'Estuaries. ·Reinhold Publishing Corp., Nevi York, Ne\11' York.
Report of N'SF Study No. 9639. 1972.. Analysis of the Cultural eutrophication of Blue Lake for causes and effects. National Science Foundation, Vfashington, DG C.
I
I
I
50
Ruttner, F'. 1963. Fundamentals of Limnology. 3rd ed. (Transl. by D. G. Frey and F .• E. J. Fry) University of Toronto Press, Toronto, Canada.
Sawyer, c. N.. 1952~. Some new aspects of phosphates in relation to. lake fertilization ..... Sewage and Ind. Hastes 24:768-776. .
Stetson, T .• M.. 1957.. Lake County Investigation. Galif. Dept. Y.later Res.,. Div.;. Res •. Planning Bull. 14. .
Stumm, W., and J~ J. Morgan.. 1970;. Aquatic Chemistry •. Wiley-Inter science, .. New York,~. -"-'N'-=e~w---=Y-=--o=--rlc..:.:e:.... ___________ _
Thienemann, A. 1927.. Der Bau. des Seebeckens in seiner · Bedeutung fur den Ablauf des Lebens. im See. Verh~- Zool •.
Bot. Ges., 77~87-91.
Thomas., E. A. 1969. The process· of eutrophication in CentraL European Lakes. Pages 29-49 in G •. E. Rohl.ich, Chairman,:, Eutrophication:.. Causes,_ Cons·equences, Correctives.. National. Academ~ of Sciences, ~1/ashington, D. C.,
Weaver, c. E. 19t~9.. Geology of the Coast Ranges Immediately North of the. San Franci·sco Bay Region, California. Geol. Soc. of America,_ Mem., 3.5. Waverly Press,. Baltimore, Haryland •.
Welchl. P •. s. 1948. Limnological. Methods. McGraw-Hill Book Gompany; New York, .. New. York.
·-
.:; ... ·.· .. -.. -- ...
,·
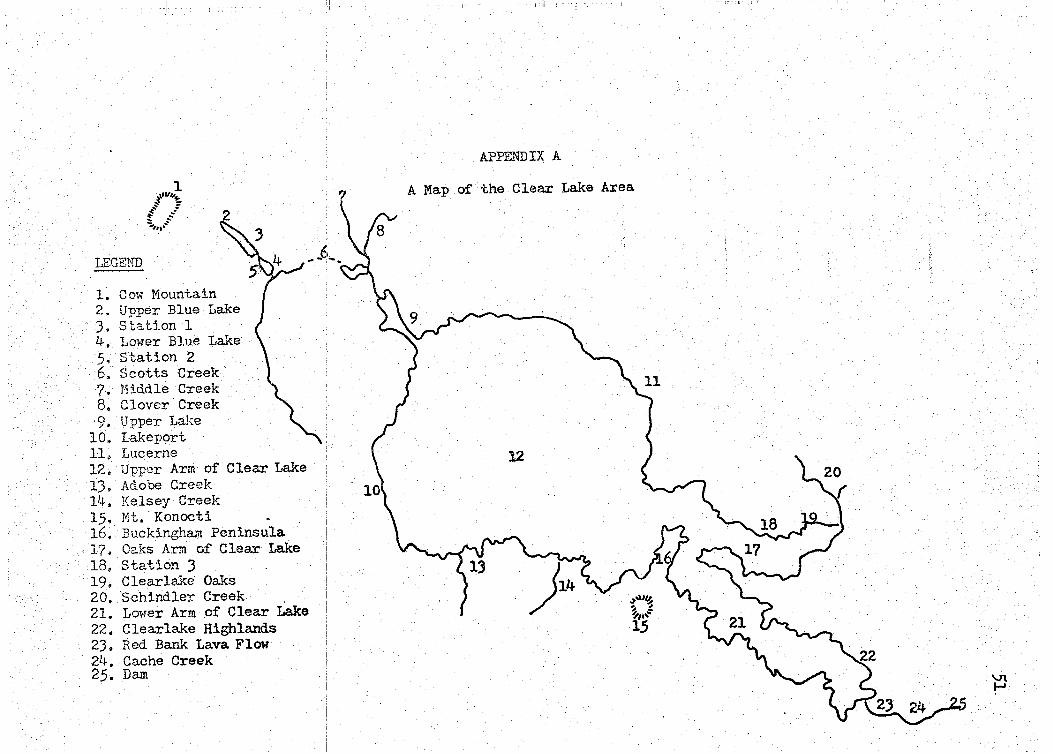
LEGEND
I . I'
1 f'""+~ ::
~' .· ~ .:: :;,'"'".:-...
1. Cow Mountain
:t:
2. Upper Blue Lake 3. StaUon 1 4. I. ower Blue Lake 5. Station 2 6. Scotts Creek ?. Hiddle Creek 8. Clover Creek · 9. Upper Lake
10.· Lakeport 11. Lucerne 12. Upper Arm of Clear Lake 13. Adobe Creek 14. Kelsey Creek 15. Mt. · Konocti 16. Buckingham Peninsula 17. Oaks Arm of Clear Lake 18. Station 3 19. Clearlake Oaks 20. Schindler Creek 21. Lower Arm of Clear Lake 22. Clearlake Highlands 23. Red Bank Lava Flow 24. Cache Creek 25. Dam
II I ',l,i
APPENDIX A
A Map of the Clear Lake Area
~

52
.APPENDIX. B.
Sample Field and Laboratory Data Sheets
Field. Data.
Station No •. ------- Location ------
Date,.--------
Weather -------- Air TE3mp. (°C) ----,_."'... :..:. --~ .
Sample Depth (M). S1;1rfaca __ Mid-Depth. ___ Bottom __
Water T~mperature, (~C)
O.xygen (mgfli ter}
Carbon Dioxide (mg/liter) __
WateT Sample Bottle Nos •. __
Sec chi. Disk Clarity (}1) _ _,( \
General .. Notes.;.
Laboratory Data
Sample Depth 0.1) Surface __ ~1id-Depth __ Bottom __
Sample Bottle-Nb.
Orthophosphate (mg/11 ter) __
Metaphosphate · (mg/li ter) __
Nitrata (mg/liter}.
Nitrite (mg/1iter1.
GeneraL Notes: ..

APPENDIX C
List of References. Utilized to Identify Plankton
Eddy'· S. and A. c. Hodson. 1961. Taxonomic Keys to the
53
· Common Animals of the North Central States:. Burgess Publishing Co.,_ J.vlinneapolis, Minn.
Edmondsen,: \v. T., ed. 1959~ ll'resh-\1ater Biology. 2nd ed. John \'Iiley· & Sons',, New York, New York •.
Needham, J. G •. and P •. H. Nee.dham... 1970. A Guide to the Study of :Et,reshwater Biology •. 5th ed .. Holden-Day,. San Francisco, California.
Pennak, R. W~ 1953. Fresh Water Invertebrates of the United States. Ronald Pr.ess: Co •. , Nmv York, New York ...
P.res.cott, G •. W. 195.4. How to. Know the. Fresh-Water Algae,. 'lflm. c •. Brown Co.'· Dubuque,_ Io\va.
Smith, G. M.. 1950 ... The Fresh-\'later Algae of the United States,. 2nd ed. McGra\v-Hill, New York, New York.
Ward,, H~ B., and G. c. \vhipp1e. 1918.. Fresh-\1ater Biology. Jobn_Wiley & Sons, Ne\&T York,, Ne\vYork.
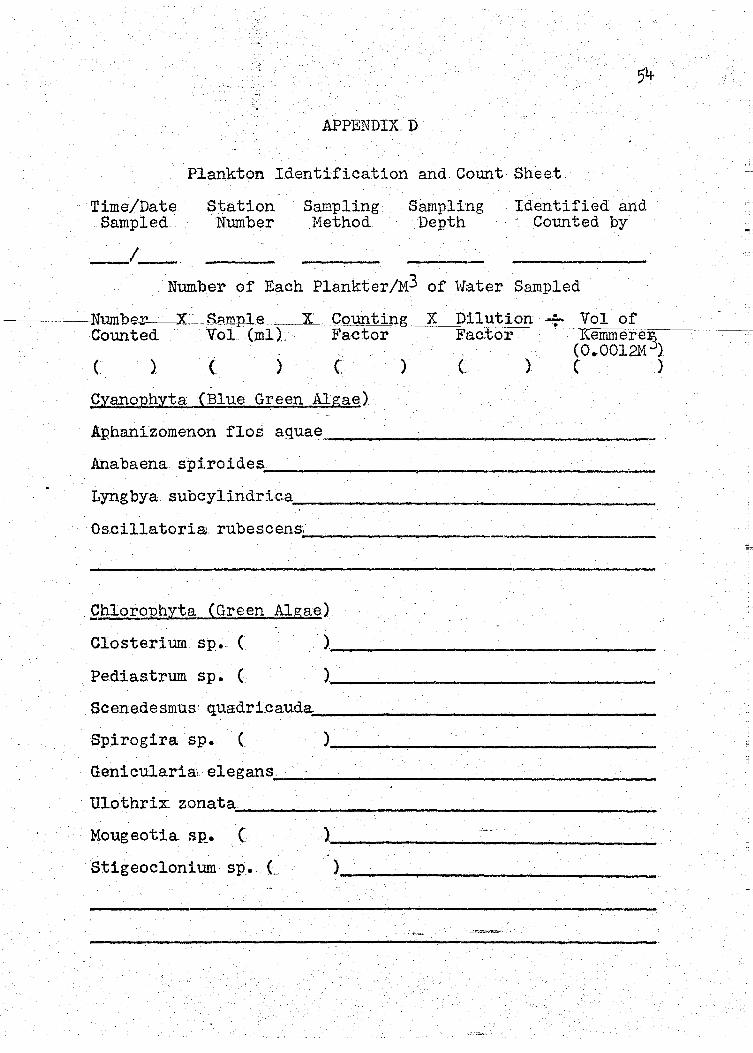
APPENDIX D
Plankton Identification andCount Sheet
Time/Date . Sampled.
_I __
Station Sampling Sampling 'Number _Method Depth
Identified and ·· Counted by
Number of Each Plankter/M3 of \vater Sampled
X Countin,;,~X=" -----;D;::.:~=·l~u~t=-=i=-=o=-=n=--· ~-~-:~Vol of Factor Factor - Kemmere13
---~Num~be-r.~- ~~X~· S.e_mp_l__e Counted _- VoL (ml).
( ( ) c ) GyanoJ;>hYta. (Blue Green Algae)
( J (0.001211 } ( )
Aphanizomenon flos aquae _______________ _
Anabaena. spiroides-.;...----------------~-·,___
Lyngbya. subcylindrica._· ----------------~---
Os.cillatoria. rubescens.:...; ------------------
fhlorophyta (Green Algae)
Closteriu.m sp •. ( . )
Pediastru.m sp • c )
. Scenedesmus: quadri.cauda....__ _________________ _
Spirogira sp. C. · l-----------------G.enicularia: elegans . .;... ___________ __..; _____ _
_ Ul.othrix zonata . ..._ ___________________ _
Mouge()tia. SP._. C ) _______________ _
Stigeoclonium sp •. C >---------------
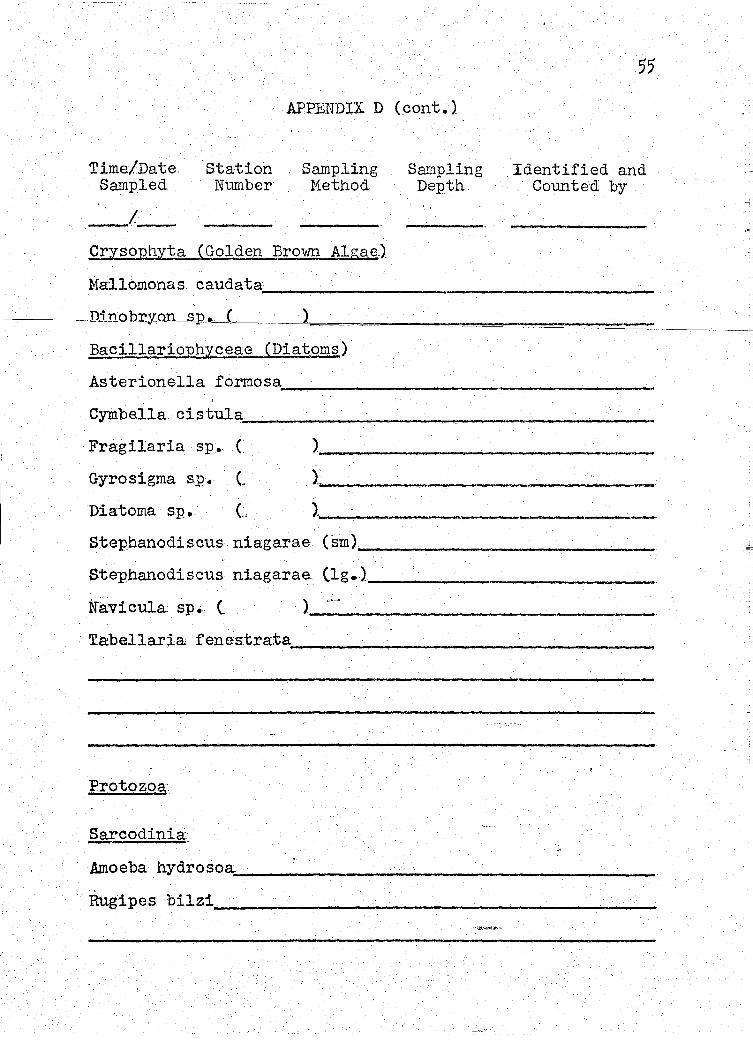
APPENDIX D (cont.}
Time/Date. Station Sampling Sampled Number }1ethod
_( __ __ Crysonhyta (Golden Brown Algae_)_
Sampling Depth
55
Identified and Connted by
Hallomonas caudata ... _. --------------------
____ -JJn1noJu~.,-wn_s_p_..~C )c·~ =~.,.._, ___ ......,.,...,...,.,..,.,......,.=====~~~----
Bacillariophyceae (Diatoms)·
Asterionella formosa~-----------------------------------
Cymbella cistula~-------------------~~-----------------
·Fragilaria sp •. ( )_--------·-----------
Gyrosigma sp •. C 1.· .... ----------------Diatoma s.p •. c 1~----------------------·------Stephanodiscus niagarae (sm) ______________ _
Stephanodiscus. niagarae (lg •. ) _____________ _
N~vicula sp •.. (_ · ) ...... -----------------
. Tabellaria fenes.trata.~. -----------------
Protozoa
.§.s.rcodinia
Amoeba hydrosoa_·-----------------------------------------Rugipes bilzi . ........_ ______________________ _
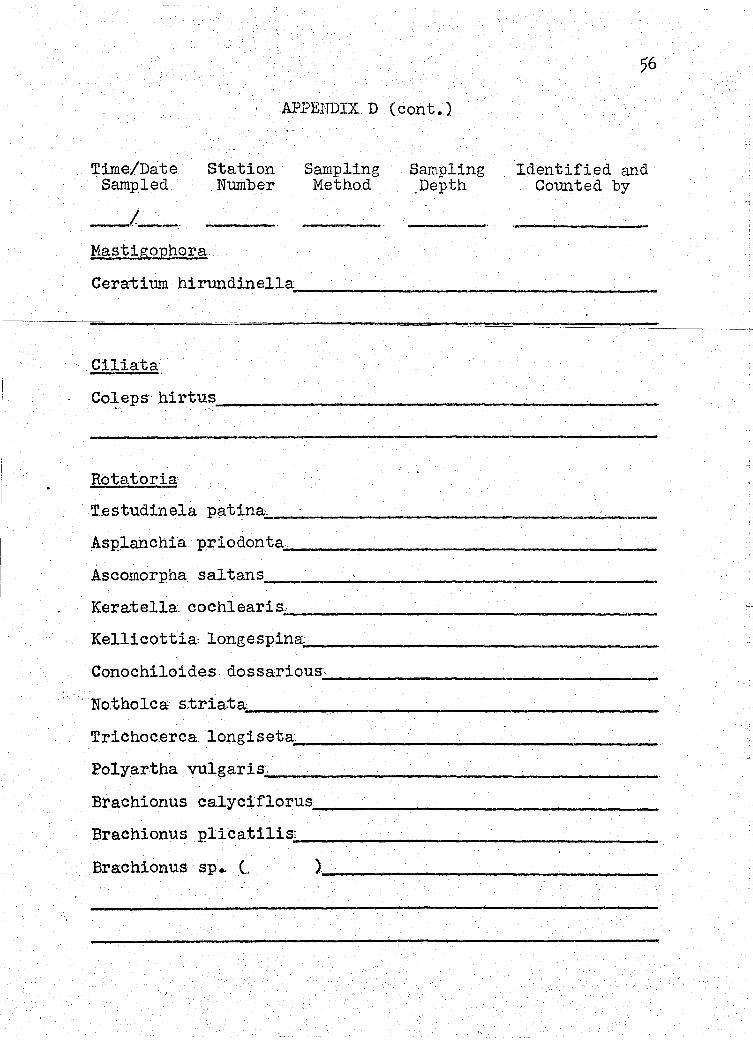
Time/Date Station Sampled Number
_!_. Mastig_ophora
APPENDIX D (cont.}
Sampling Method
Sampling .Depth
Identified and Counted by
Ceratium hirundinella._· ------------------
Ciliata·.
Coleps:hirtus. ________________________________________ ~---..... " .,,
Rota to ria
Testudinela patina.._·------------------Asplanchia priodonta. ____________________________________ __
Ascomorpha saltans. ____________________ _
Keratella cochlearis~~-------------------------------------
Kellicottia, longe.spina._· ------------------
Conochiloides. dossarious_·. ------------------
. ··. No.tholca s.triata-: ---------------------
Trichocerca longiseta .... ·, -----------------
Eolyar.tha vulgaris_·. --------------------
Brachionus calyciflorus_. ----------------
Brachionus plicatilis.~'------------------------------------
Brachionus sp .. (. 1------------------

Time/Date Sampled _! ____ _
Arthropoda
Cladocera
APPENDIX D (cont.)
Station Sampling Ntunber .Hethod.
Sampling Depth
57
Identified and Counted by
Daphriia pUiex~--~--~--------------------------~-------Bosmina corregoni ______________________________________ ___
Latona setifera~·------------------------------------------
----------------------------------------------------------Copepoda
CJ7clops vernalis. _____________ _
Naup.lius.;...: ------------------------
QiHtera.
Chao borus: astictopus. __________________ _
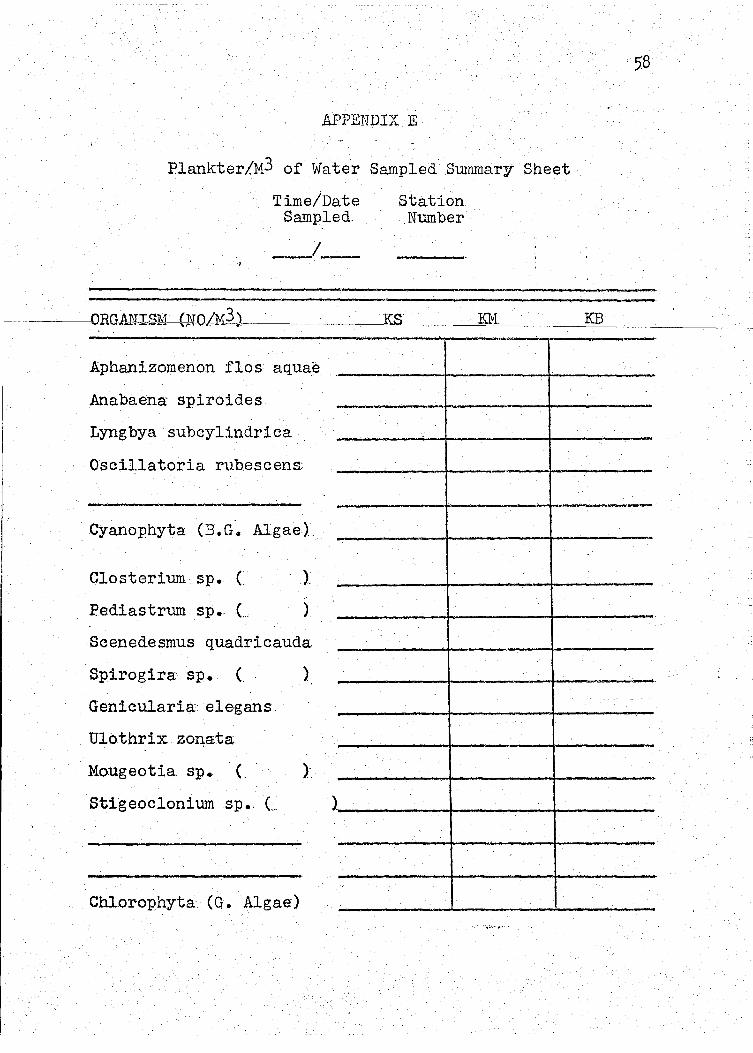
.tlPPENDIX E
Plan.kter/M3 of Water Sampled S1.umnary Sheet
Time/Date Sampled.
_! __
Station Number
58
---------------------------------------------------------
Aphanizomenon flos aquae
Anabaena spiroides
Lyngbya subcylindrica
Oscillatoria rubescens:
- - -Cyanophyta (B.G·. Algae).
Closterium sp. c l
Pediastrum sp •. L )
Scenedesmus quadricauda.
Spirogira sp. (. ). -· Genicularia elegans
Ulothrix zon,ata
Mougeotia sp .. ( l
Stigeoclonium sp •. c ).
Chlorophyta· (G. Algae)
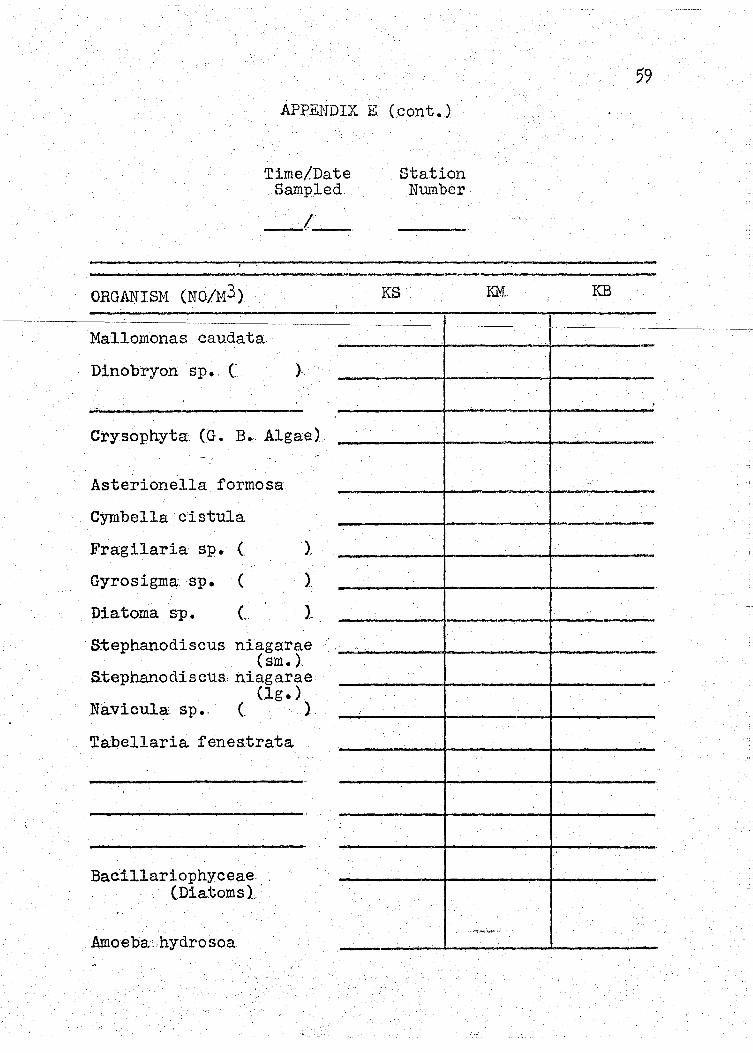
.
'
APPENDDC E (cont.)
Time/Date .Sampled
_;_·_
ORGANISH (NO/!Y13)
Mallomonas caudata
Dinobryon sp •. c )
·-
Crysophyta~ (G • B. Algae) -- ..
Asterionella formosa
Cymbella·cistula
Fra:gilaria sp. ( ),
Gyrosigma. sp. ( )
Diatoma sp •. c l
Stephanodiscus niagarae (sm.)
'. ·--..
atephanodiscus;niagarae
Navicull!t- sp •. (. (lg.)_
).
Tabellaria feneatrata
I
Baciillariophyceae (Diatoms).·
.Amoeba:.hydrosoa -
Station Number
KS
j
59
KM KB
-
;<;1.:...r. . ....l..,,
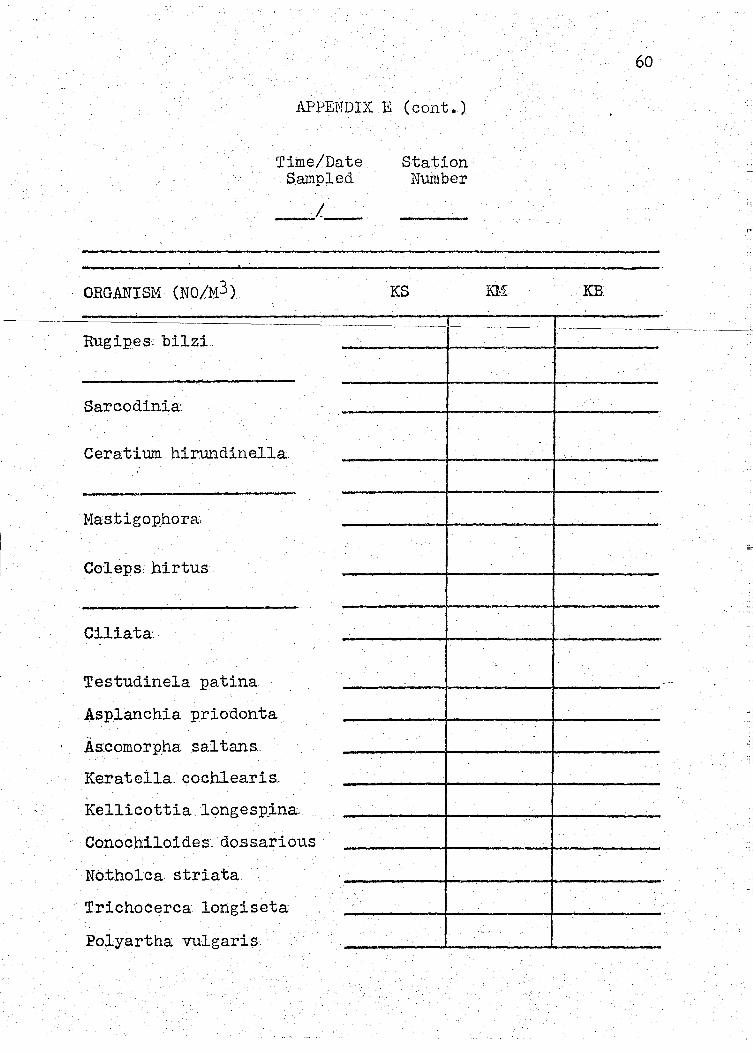
'
1\PPENDIX E (cont.)
ORGANISM (NO/M3}
Rugipes bilzL
Sarcodinia·
Time/Date .Sampled
_I_
Ceratium. hirundinella.
Mastigophora,
Col eps, hirtus .
Ciliata.
Testudinela patina
. Asplanchia priodonta
As:comorpha sal tans_
Kerate1la. co.chlearis..
Kellicottia longesp_i.na
Conochilo.ides. do.ssarious
Notholca striata.
Trichocerca longiseta
Polyartha vulgaris.
Station Number
KS
60
KB
-
-
~
-
c
-
.. --
-
--
V·'
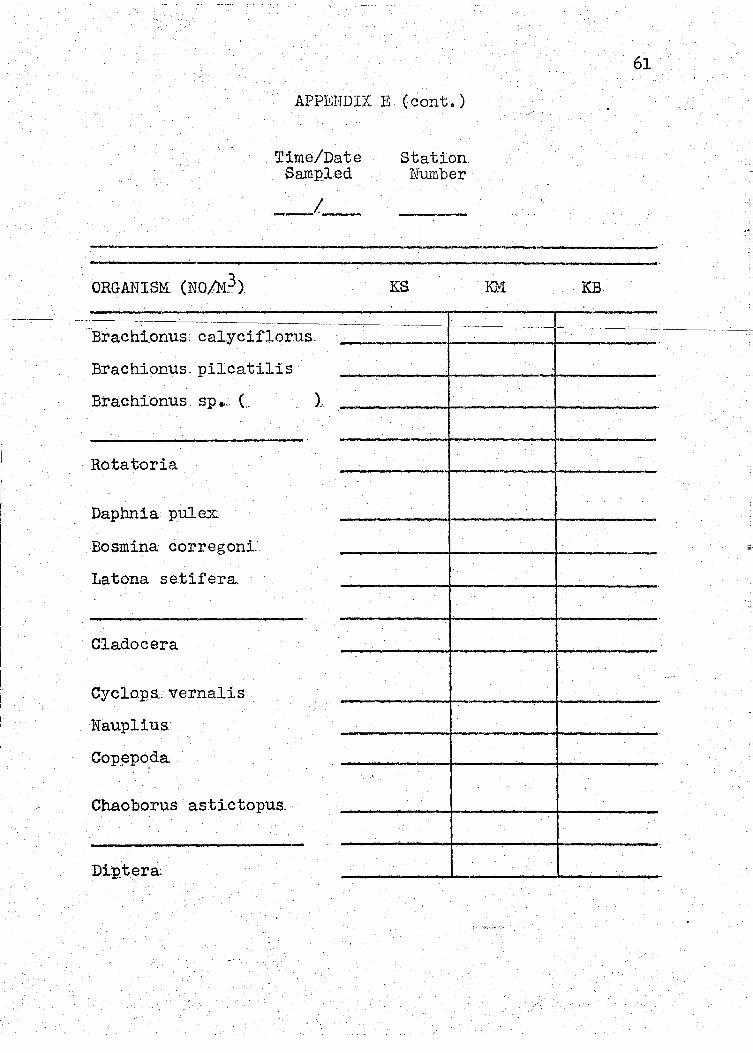
I
'
-
APPENDIX E (cont.)
ORGANISM_ (NO/M.:J).
Time/Date . Sampled
_I_
.. Brachi.onus. cal.yciflorus.
Brae hi onus pilcatilis -Brae hi-onus sp •.. c ).
..
Rotatoria
Daphnia pulex
Bosmina corregonL
Latona setifera.
Cladocera
Cyclops .. vernalis.
Nauplius
Cop.~po_da '
Chaoborus astictopus.
Diptera.
:
Station . Number
KS
61.
KB
----
•_;,,, .. :,.·.··-
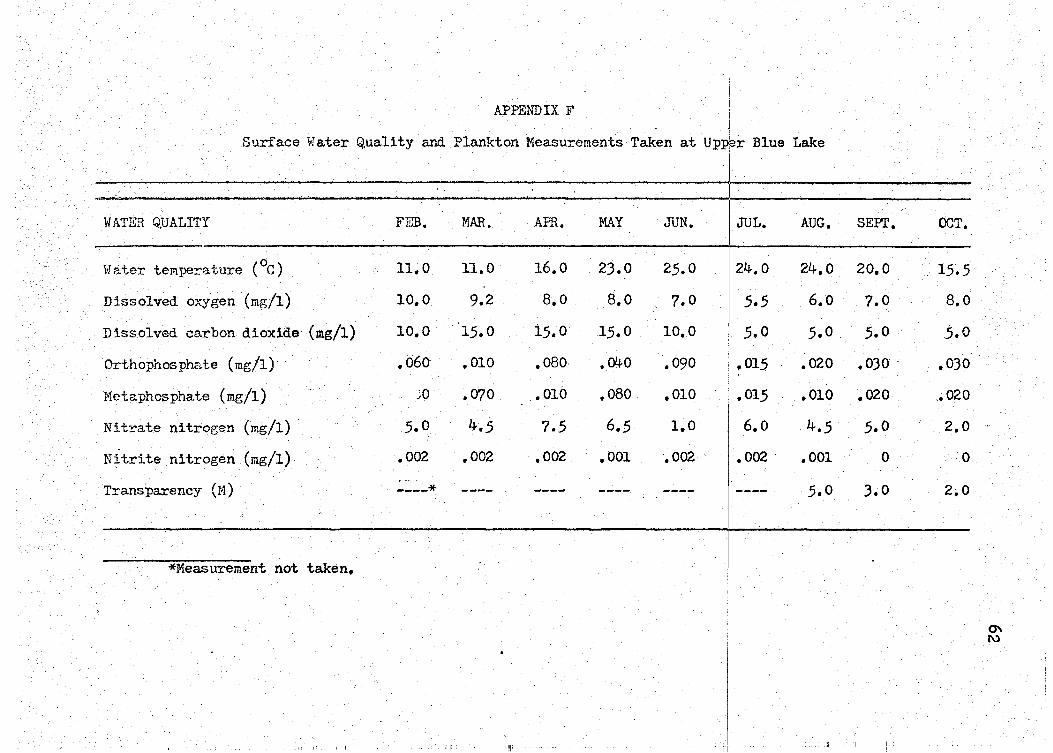
APPEh'DIX F
Surlace Water Quality and Plankton Measurements Taken at Up1r Blue Lake
-~-"'-·- -·-· --····-··- " --··---___ j
WATER Q.UALITY FEB, MAR. APR, MAY JUN, I JUL. AUG,
1~ater temperature (°C) 11.0 11,0 16.0 23.0 25.0 124.0 24,0
Dissolved oxygen (mg/1) 10,0 9.2 8,0 8,0 7.0 I .5.5 6.0
Dissolved carbon dioxide (mg/1) 10,0 15.0 i.5.0 1.5,0 10,0 I 5,0 .5.0
Orthophosphate (mg/1)· .060 ,010 ,080 .O!to • 090 ,015 .020 I'
Metaphospha.te (mg/1) :.;o • 070 • 010 ,080 ,010 ,015 ,010
Nitrate nitrogen (mg/1) 5.0 4.5 7.5 6.5 1,0 I 6.0 4.5
Nitrite nitrogen (mg/1) ,002 ,002 ,002 ,001 ,002 I • 002 ,001
Transparency (?•1) ----* ---- ---- ---- ---- 1---- 5.0
*Measurement not taken,
111: il
SEPI',
20,0
7.0
5.0
,030
,020
5.0
0
3.0
i:
OCT.
15.5
8,0
5.0
,030
,020
2.0
0
2,0
()'\ 1\.)
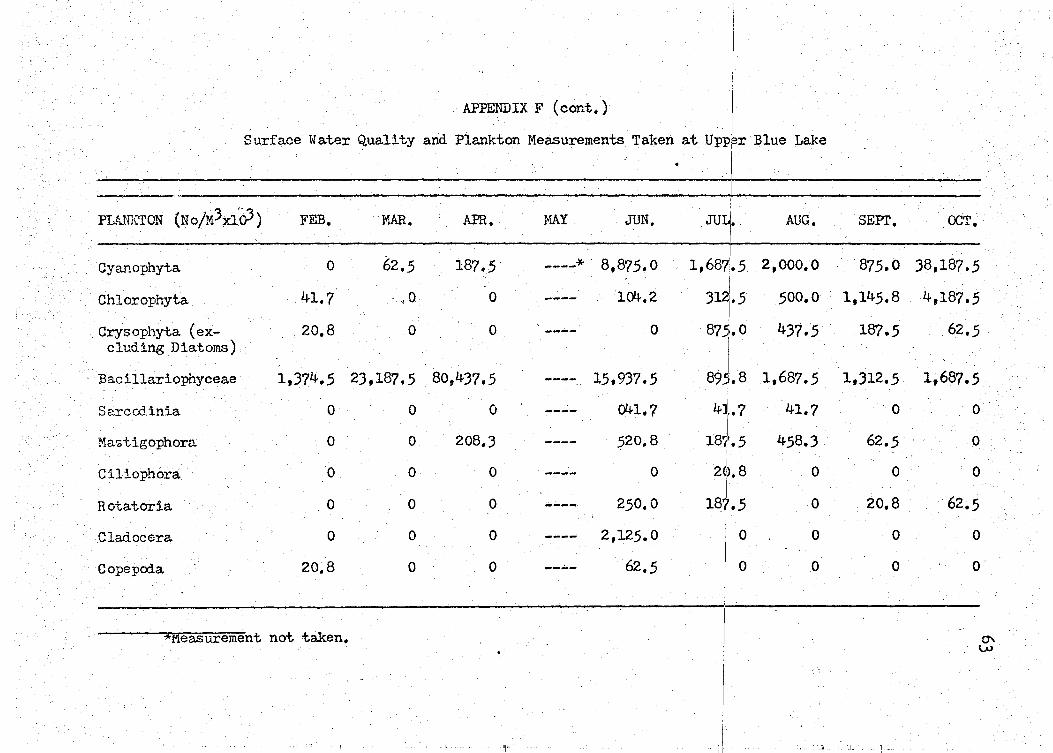
APPENDIX F (cont. )
Surface Water Quality and Plankton Measurements. Taken• at Uptr Blue Lake
I PLNWiTON (NojM3~l0J) FEB. MAR. APR. VJAY JUN. . JuL/ .. AUG.
Cyanophyta 0 62.5 187.5. ----*. 8,875.0 1,6871.5 2,ooo.o
41.7 ',0 0 '104.2 500.0 Chlorophyta ---- ,,.5 Crysophyta (ex- 20.8 0 0 ---- 0
87 ro 437.5 eluding Diatoms)
· Bacillariophyceae 1,374.5 23,187.5 . 80,437.5 15,937.5 1,687.5 ---- 895.8
4JI .• 7 Sarcodinia 0 0 0 ---- 041.7 41.7
208.3 520,8 I
458.3 Maztigophora 0 0 ---- 181'.5
Ciliophora 0 0 0 ---- 0 2~>. 8 0
18J.5 Rota.toria 0 0 0 ---- 250.0 0
Cladocera 0 0 0 ---- 2,125.0 I o 0
Copepoia 20.8 0 0 ---- 62.5 I o 0
*Ffeas-u.rement not taken,
Ill: lr
SEPI'.
875.0
1,145.8
187.5
1,312.5
0
62.5
0
20.8
0
0
I C I
OCT.
38,187.5
4,187.5
62.5
1,68'7.5
0
0
0
62.5
0
0
~ w
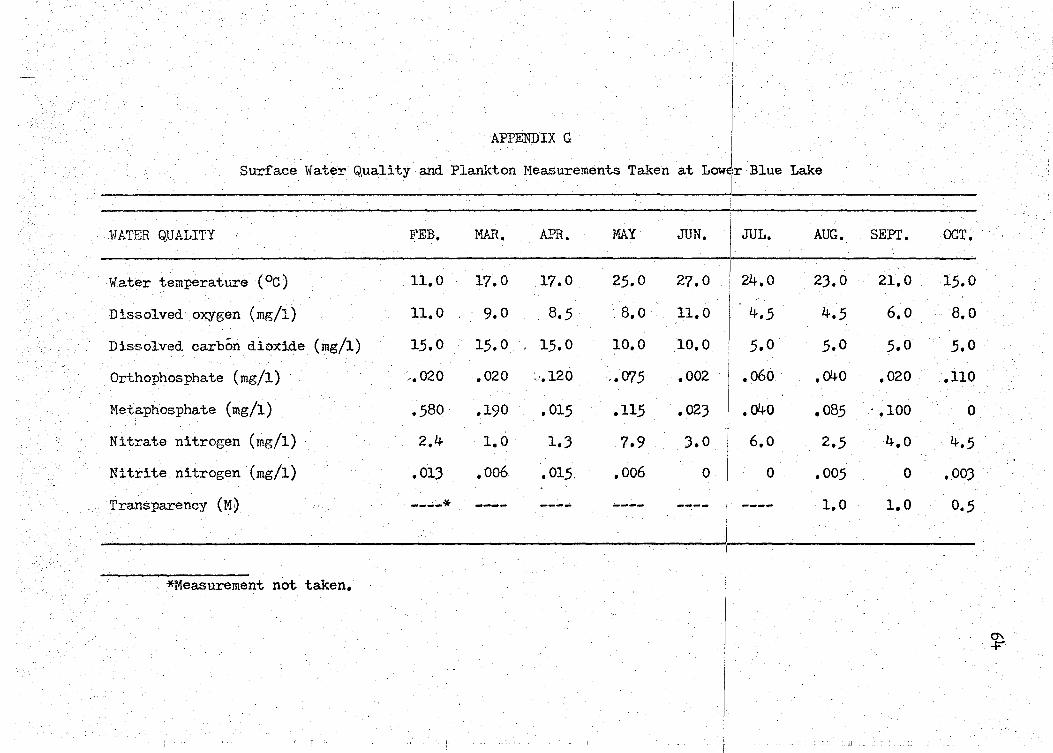
APPE1"D IX G
Surface Water Q.uality and Plankton Measurements Taken at LowJ~r Blue Lake . . . I 1.
I-TATER QUALITY FEB. MAR. APR. MAY JUN. r JUL. AUG.
Water temperature ( °C) 11.0 17.0 17.0 25.0 27.0 24.0 23.0
Dissolved oxygen (mg/1) 11.0 9.0 ' 8.5 • 8. 0 11.0 4.5 4.5
Dissolved carbon dioxide (mg/1) 15.0 15.0 15.0 10.0 10.0 5.0 5.0
Orthophosphate (mg/1) -.020 ,020 ~'.120 ... 075 • 002 .060 .040
Metaphosphate (mg/1) .580 .190 • 015 ,115 • 023 I .04o .085
Nitrate nitrogen (mg/1) 2.4 1,0 1.3 7.9 3.0 6.0 2.5
Nitrite nitrogen (mg/1) .013 .oo6 .015. .oo6 0 0 .005
Transparency (M) ----* ---- ---- ---- ---- ---- 1.0
*Measurement not taken.
II
SEPI'.
21.0
6.0
5.0
.020
. ,100
4.0
0
1.0
OCT.
15.0
8.0
5.0
.110
0
4.5
• 003
0.5
0'\ -F"
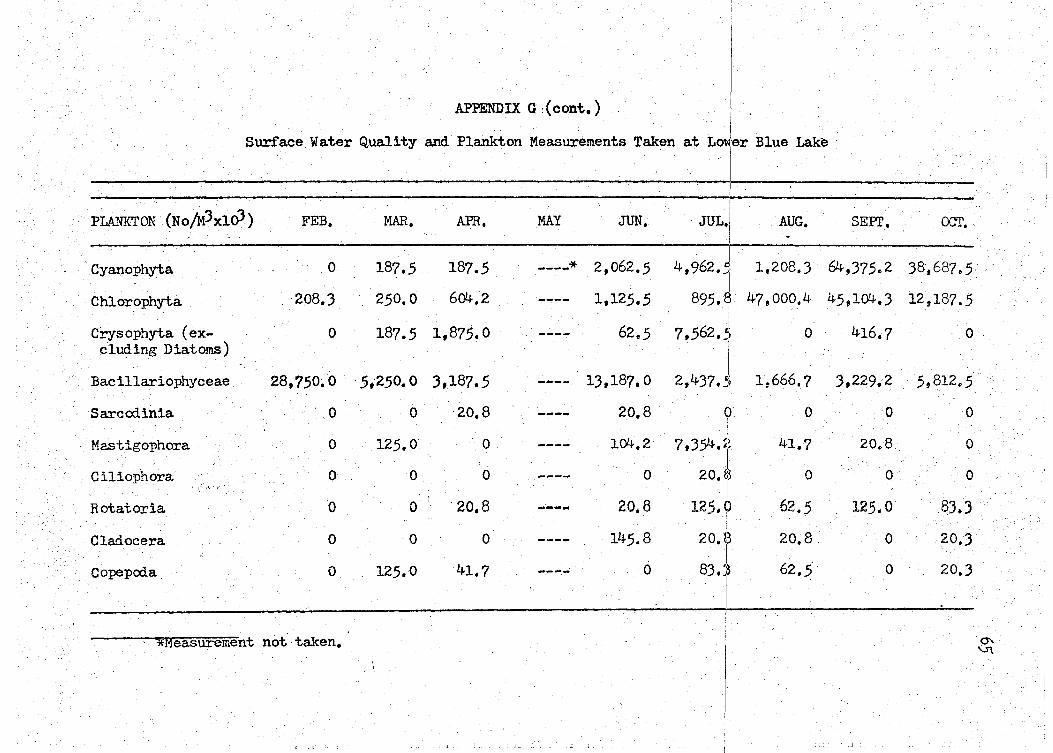
APPENDIX G :(cont.)
Surface Water Quality and Plankton Measurements Taken at L<Ytl1·er Blue Lake ·
. ' . . J. .
(
. PLANKTON (No/MJxloJ) FEB. MAR. APR. MAY JUN. JUL. AUG. SEPI'. OCT.
Cyanophyta 0 187.5 187 • .5 ----* 2,062 • .5 --~ -l,
1,208.3 64,375.2 38',687.5' 4,962,_.,11
Chlorophyta 208.3 250.0 604.2 ---- 1,125 • .5 895.EI 47,000.4 45,104.3 12,187 • .5 . I
Ccys ophyta (ex- 187 • .5 1,87.5.0 62.5 0 ---- 7,562.5 0 416.7 0 eluding Diatoms)
I Bacillariophyceae 28,7.50,0 . .5,2.50. 0 3,187 • .5 ---- 13,187,0 2,437.l) 1:666.7 3,229,2 .5t812.5
Sarccx:linia 0 0 ·20,8 ---- 20.8 (1) 0 0 0 I ·o 104.2 '41.7 Mastigophora 0 12.5.0 ---- 7,354.1 20~8 0
Ciliophora 0 0 0 ---- 0 20. S3 0 0 0 I
Rotatoria 0 0 '20.8 ----
20.8 125. (i) 62 • .5 125.0 .83.3 . I .
Cladocera 0 0 0 ---- 145.8 20. t3 20.8 0 20.3
41.7 I
62 • .5' Co:pepcx:la 0 125.0 ---- 0 83::~ 0 20.3
1
*Meas-urement not taken, I 0' 'J1
Till: I L 'I .1 . I
II

APPENDIX If . . I
Surface Water Quality and Plankton Measurements Taken at the 01· Arm of Clear Lake
vJATER QUALrrY FEB. MAR. APR. MAY
Water temperature (OC) 10.0 17,0 16,0 22,0
Dissolved oxygen (mg/1) 9.5 16.0 ' 8. 0 10,0.
Dissolved carbon dioxide (mg/1) 10.0 15.0 5.0 5.0
Orthophosphate (mg/1) .• 160 .150 • 025 ,140
Metaphosphate (mg/1) 0 ,)00 ,145. .170
Nitrate nitrogen (mg/1) 7.0 1.5 4.5 4.0
Nitrite nitrogen (mg/1) .030 ,014 ,015· • 005 (
Tra,ns parency ( M) ----* ---- ---- ----
*Measurement not taken,
1'1'
1.
. JUN. I JUL •
27.0 28,0
10.5 9.5
5.0 15.0
.070 I .oso
,080 ,140
).0 I ),0
.070 I ,002
---- ----
il
AUG,
25.0
6.0
10,0
.250
.190
4,0
,004
0,5
SEPI'.
22,0
8,0
5.0
.170
• 050
7.0
,002
0,5
I . I
OCT.
15,0
7.0
1o.o·
,180
0
4.5
• 007
0.)
0\ 0\
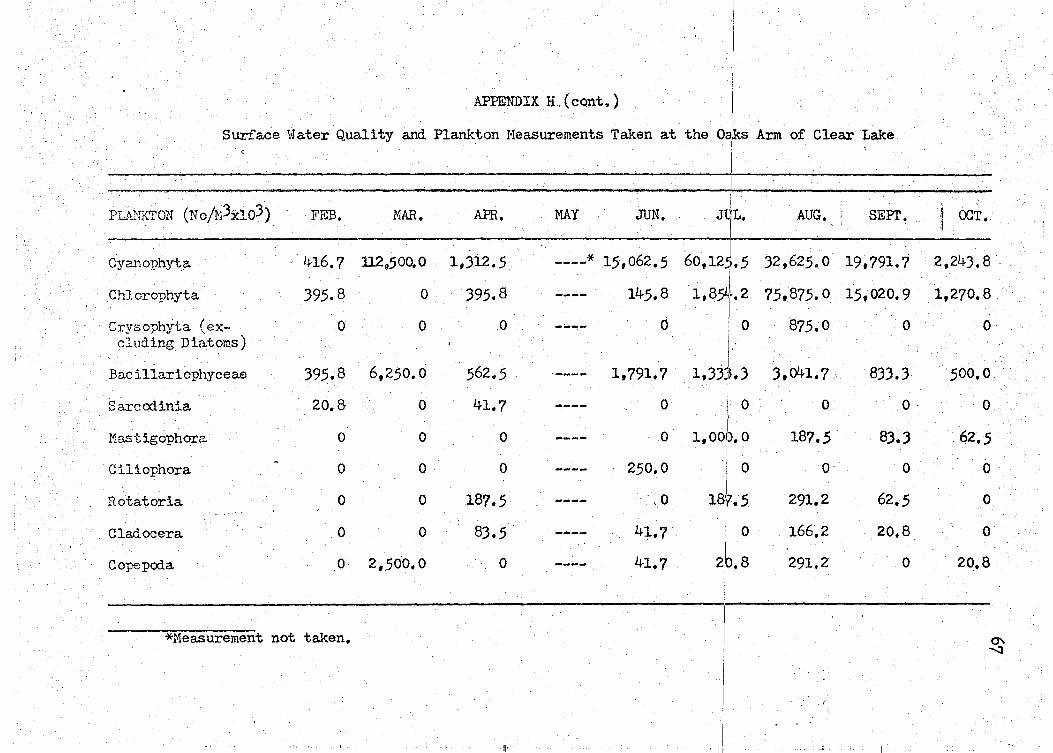
APPENDIX H.(cont.)
S~ac~ Wat~r Quality and Plankton M~a.sur~nt~nts Taken at the T Arm of Cl~ar Lake
PLANKTON (NojMJJUoJ) FEB, MAR, APR, MAY JUN, JjL. AUG. , SEPI'.
Cyanophyta
Chlorophyta
Crysophyta (excluding Diatoms)
BD.ci1lariophyceae
Sarcod.inia
Mastigophora
Ciliophora
Rotatoria
C1ad.ocera
Co:pepcda
416.7 .• ll2,500.0
395.8 0
0 0
395.8 6,250.0
20.8 0
0 0
0 0
0 0
0 0
0 2,500,0
*Measurement not taken,
1,312.5
395.8
0
562.5 .
41.7
0
0
187.5
8).5
0
!11,'
. I ----* 15,062.5 60,125.5 32,625.0 19,791.7
I 145.8 1,B1•.2 75,875.0 15,020,9
0 0 875.0 0
1,791,7 1,333.3 3,01H,7 833.3
I o 0 0 0
I 0 1,001), 0 187.5 83.3
---- 250.0 I 0 o· 0
62.5 ---- .,0 18',7;5 291.2
---- 41.7
2f.: 166.2 20,8
---- 41.7 291.2 0
r
. '
il
! CX::T •
2,243.8
1,270.8
0
500.0 .
0
62.5
0
0
0
20,8
C1' .....:1
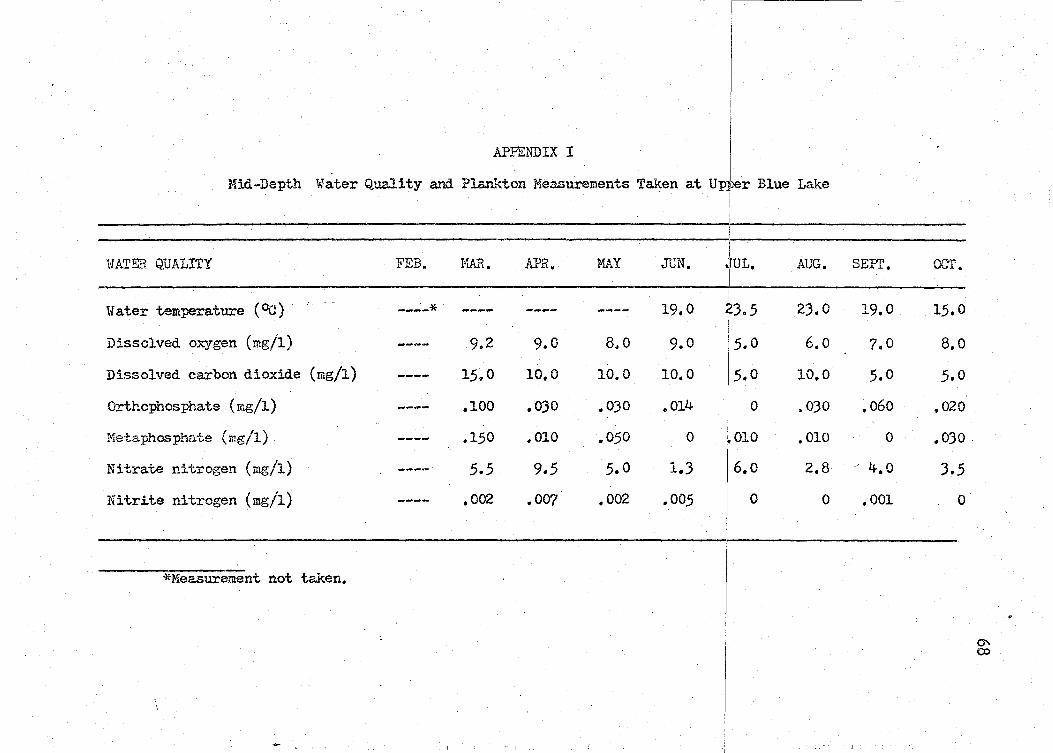
APPENDIX I
:r-ad-Depth Water Quality and Plankton Measurements Taken at Uprr Blue Lake
VI A'rER Q.UALITY FEB. HAR. AP.a. MAY JUN. .1
~ruL.
I AUG.
'{ ater temperature ( OC) ----* 19,0 j)3 5 /.., 0. 23,0
Dissolved o:> ... ygen (mg/1) --..-- 9.2 9.0 8.0 9.0 15.0 6.0
Dissolved carbon dioxide (mg/1) ---- 15.0 10,0 10.0 10.0 15.0 10,0
Orthophosphate (mg/1) ---- .100 • 030 .030 .014 0 • 030
Metaphosphate (mg/1) ---- .150 .010 .050 0 !,010 • 010
Nitrate nitrogen (mg/1) ---- 5.5 9.5 5.0 1.3 16.0 2.8
NitrLte nitrogen (mg/1) ---- ,002 .007 • 002 .005 I 0 0
*Measurement not taken.
ITILI I i1 li
SEPI'.
19.0
7.0
5.0
.060
0
4.0
• 001
I . I
OC'T •
1_5,0
8.0
_5.0
• 020
• 030
3.5
0
"' o:>
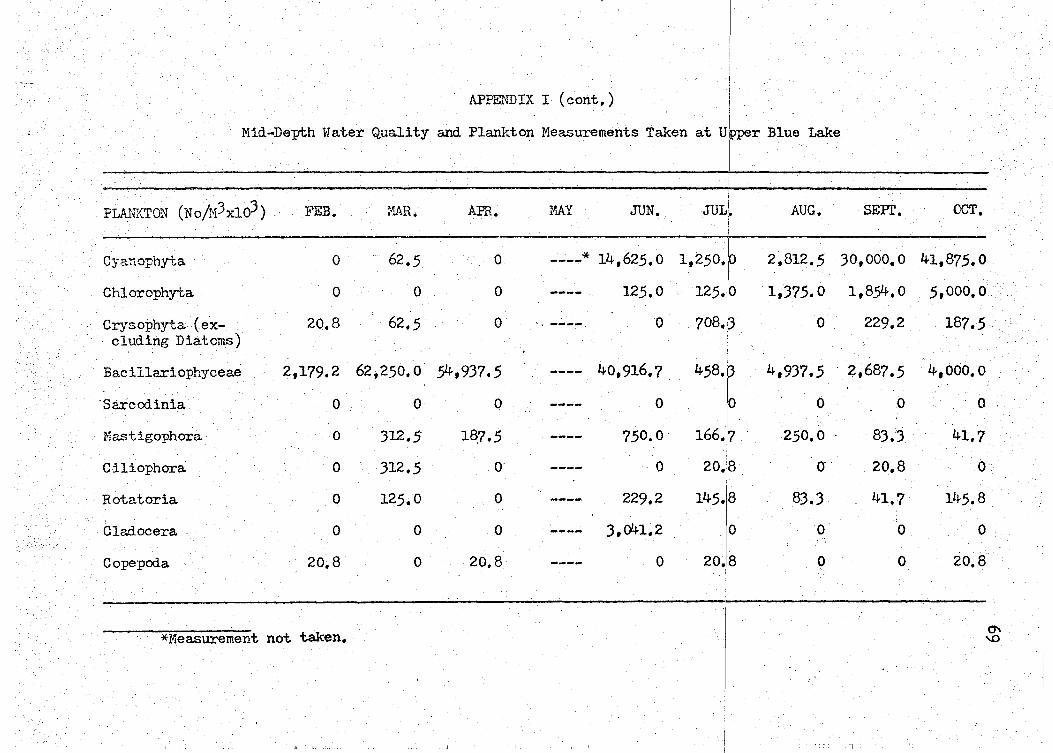
APPENDIX I (cont,)
Mid-Depth vlater Quality and Plankton Measurements Taken at Ujpper Blue Lake . I
PLANKTON (NojH3xlo3) FEB. f1AR. APR. MAY JUN. JULf AUG, SEPI', OCT,
Cyanophyta 0 62.5 0 ----* 14,625.0 1,250.~6 2,812.5 30,000,0 41,875.0
Chlorophyta
Crysophyta (excluding Diatoms)
0
20,8
0 0
62.5 0
Bacil1ariophyceae 2,179.2 62,250.0 54,937.5
·sarcodinia 0 0 0
Mastigophora· 0 312.5 18_7 .5
Ciliophora 0 312.5 o·
Rotatoria 0 125.0 0
Cladocera 0 0 0
Copepoda 20,8 0 20,8
*Measurement not taken.
!rl
125.0 125.0 1,375.0
' ' ----. 0 708. 0
I 40,916.7 . 458.:3 4,937.5
---- 0 /0 0
---- 750.0 166.7 250,0
---- ·0 20.8 0
---- 229.2 145.18 83.3
---- 3,041,2 0 0
---- 0 20. 8 0
• il
1,854.0
229.2
2,687.5
.b
83.3
20,8
41.7
0
0
5,000,0
187.5
4,ooo.o
0
41.7
0
145.8
0
20.8
0'\
"'
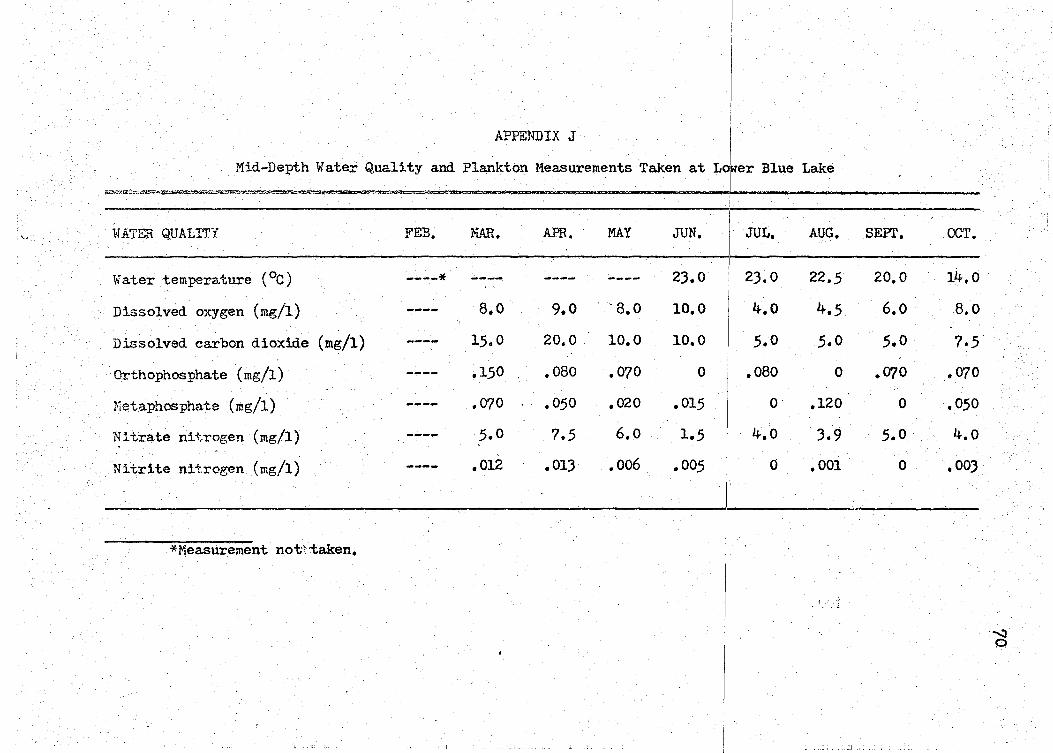
,v
APPENDIX J
Mid-Depth Water Q.uality and Plankton Measurements Taken at Ldwer Blue Lake ·
'=-...,.,.."'"'~-====-•o==··• ""'~""' . "· =- _..,,_.,,...,.. """"" ' .,,.[. ·-----~·--------------- -·---I
'loiATE:.R QUALITY FEB. l-iAR. APR. MAY JUN. JUL. AUG. SEPI'. OCT.
\-later temperature (°C) ----* ---- ---- ---- 2).0 2).0 22.5 20.0 14.0
Dissolved oxygen (mg/1) ---- 8.0 9.0 . 8.0 10.0 4.0 4.5 6.0 8.0
Dissolved carbon dioxide (mg/1) ---- 15.0 20.0 . 10.0 10.0 5.0 5.0 5.0 7.5
Orthophosphate {mg/1) ---- .150 • 080 .070 0 .080 0 .070 .070
Hetaphosphate {mg/1) ---- .070 .050 ,020 .015 I o· .120 0 .050
Nitrate nitrogen (mg/1) ---~ 5.0 7.5 6.0 1.5 I 4.0 ).9 5.0 4.0
Nitrite nitrogen (mg/1) ---- .012 ,013 • 006 .005 0 .001 0 ,003
*Measurement not·".:taken.
Ill' li
" 0
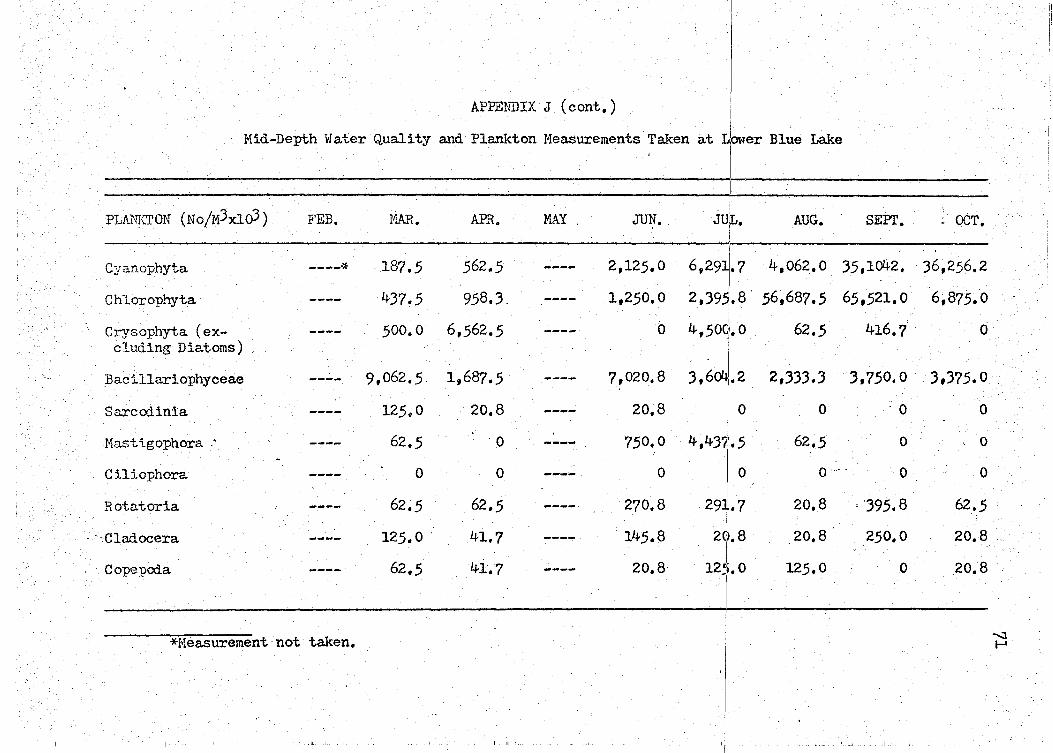
APPE:t-11HX J (cent. )
Mid-Depth Water Q.uaJ.ity and Plmlkton Measurements Taken at Lrer Blue Lake
I .
PLANKTON (No/M3xlo3) FEB. MAR, APR, MAY . JUN. JUf. AUG, SEPr, . OCT,
Cyanophyta ----* 187.5 562.5 2,125.0 6,2911.7 4,062,0 35,1042. 36,256.2
1,250,0 2,39l8 56,687.5 65,521,0 6,875.0
0 4,],0 62.5 416.7 (j
7,020,8 3,6 r·: 2,333.3 ·3,750.0 . 3,375. 0
20,8 0 ·o 0
Chlorophyta ---- 437.5 958.3.
Crysophyta (ex- ---- 500,0 6,562.5 eluding Diatoms)
Bacillariophyceae ---- 9,062.5. 1,687.5
Sarccdinia ---- 125.0 20.8
!-1astigophora. .· ---- 62.5 0 750,0 4,431'.5 62.5 0 0 -
Ciliophora ---- 0 0 0 0 o···. 0 0
270.8 291.7 20.8 . '395. 8 62.5
145.8 I
20.8 20,8 20.8 250.0
12lo 20,8 125,0 0 20.8
I
Rotatoria ---- 62.5 62.5
· · Cladocera ---- 125.0 . 41.7
Copepoda ---- 62.5 41 .• 7
I *Neasurement · not taken,
-...;] ~
Hill,,' i il
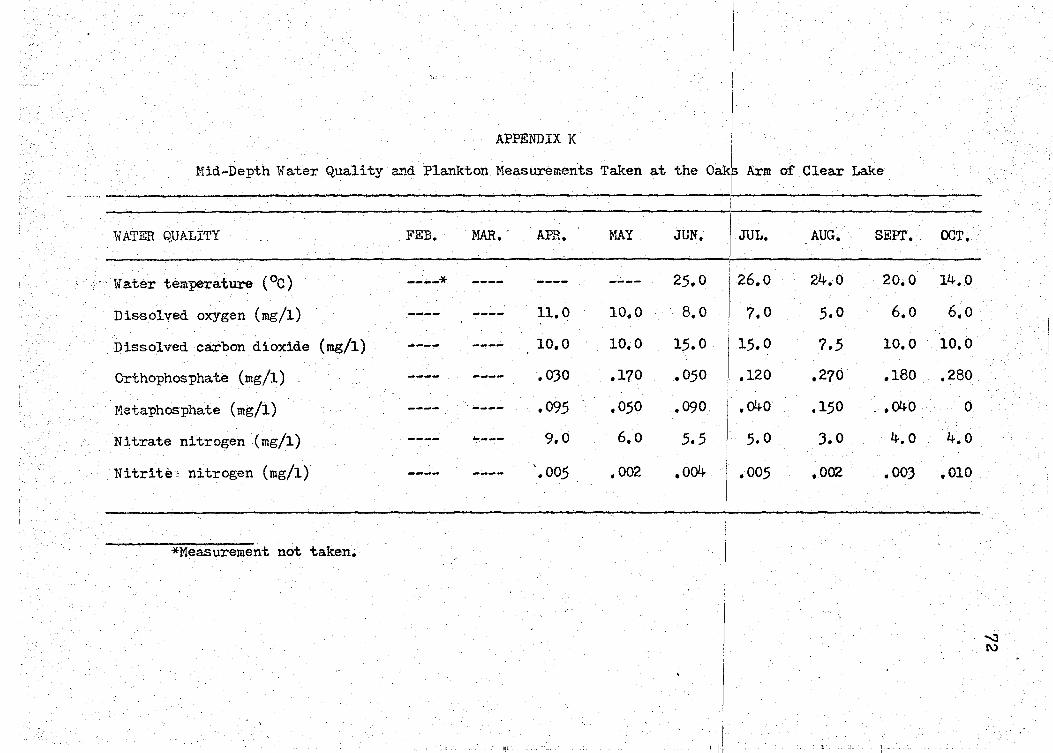
'•
APPENDIX K
WATER Q.UALITY FEB. MAR.- APR. MAY
• ··Water temperature (°C) ----* ---- ---- ----Dissolved oxygen (mg/1) ---- ---- 11.0 10,0
Dissolved carbon dioxide (mg/1) ---- ---- 10,0 10,0
Orthophosphate (mg/1) ---- ---- • 030 .170
Metaphosphate (mg/1) ---- ---- • 09.5 ,050
Nitrate nitrogen (mg/1) . ---- ._ ___ .9.0 6,0
Nitrite: nitrogen (mg/1) ---- ---- \. 00.5 • 002
*Measurement not taken•
m:
JUN, I JUL. AUG.
25.0 26,0 24.0
8.0 7.0 5.0
15.0 1_5,0 7.5
• 0.50 .120 ,270
,090. .040 .1.50
5 • .5 r 5.0 3.0
,004 • 00.5 ,002
' ir
SEPI',
20,0
6,0
10,0
,180
. ,040
4.0
.003
I. !
OCT.
14.0
6,0
10.0
.280
0
4,0
,010
-..:1 1\)
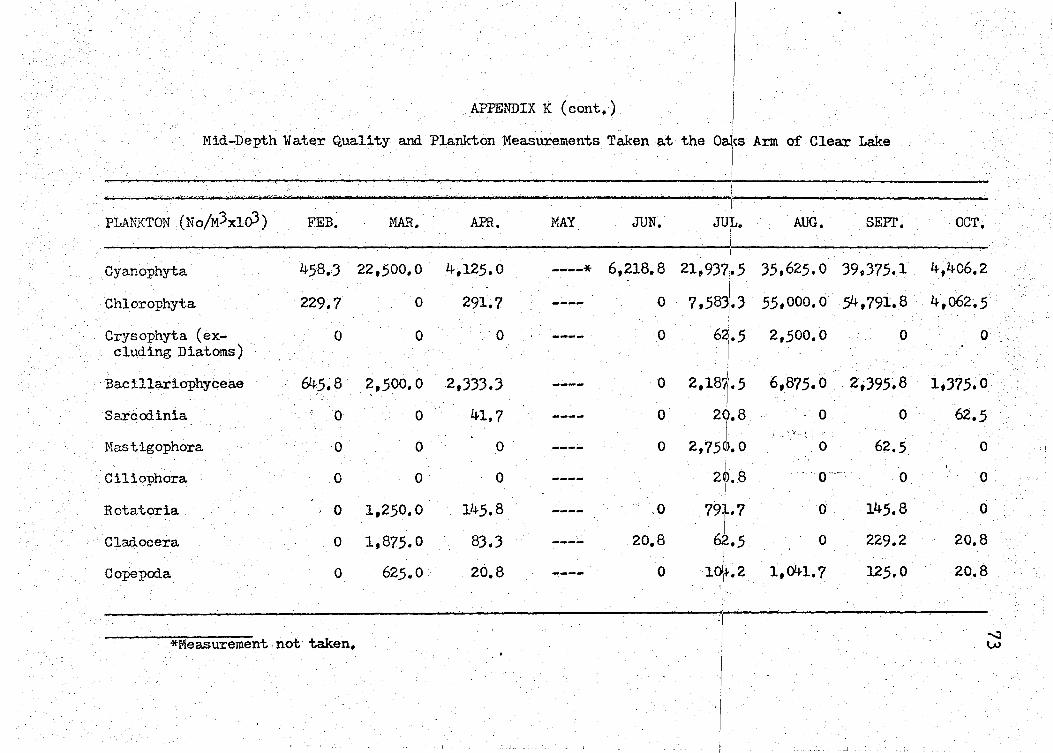
APPENDIX K (cont. )
· Mid-Depth Water Q.uality and Plankton Measurements Taken at the Oaks Arm of Clear Lake
···" .. ,"·~•·••·'·"•"• , __ ,_,_, v••-•~-~~-~-o=·-~~-"~~~~-. ~ . . - · ···· ... I
PLANKTON (No/M3xlo3) FEB. MAR. APR.
Cyanophyta 458.3 22,.500,0 4,12.5.0
Chlorophyta 229.7 0 291.7
CrJs ophyta. (ex- 0 0 0 eluding Diatoms)
Bacillariophycea.e 64.5. 8 2,.500.0 2,333.3
Sarccxiinia 0 0 41,7
Hastigophora 0 0 0
Ciliophora. 0 0 0
Rotatoria. 0 1,250.0 14.5.8
Clad.ocera ·o 1,87.5.0 83.3
C o:pepod.a 0 62.5.0 20.8
*Measurement not taken, .
Ill:
MAY JUN.
r·~-
JU:L. AUG. SEPI'. · OCT.
I
----* 6,218. 8 21,937/ • .5 3.5,625. 0 39,37.5.1 4,406.2
0
0
0
0
0
.0
20,8
0
7,58l3
6r 2,18'1"5
20.8 I
2,75~>.0
I 20.8
I 791.7
6f.5
ll2
il
.5.5,000.0 54,791.8
2,.500.0 0
6,8?.5.0 2;39.5.8
0 0
.0 62.5
0 .. 0
0 145.8
0 229.2
1,C~+l.7 12.5. 0
4,062 • .5
0
1.37.5.0
62 • .5
0
0
.0
20,8
20.8
--.::1 w
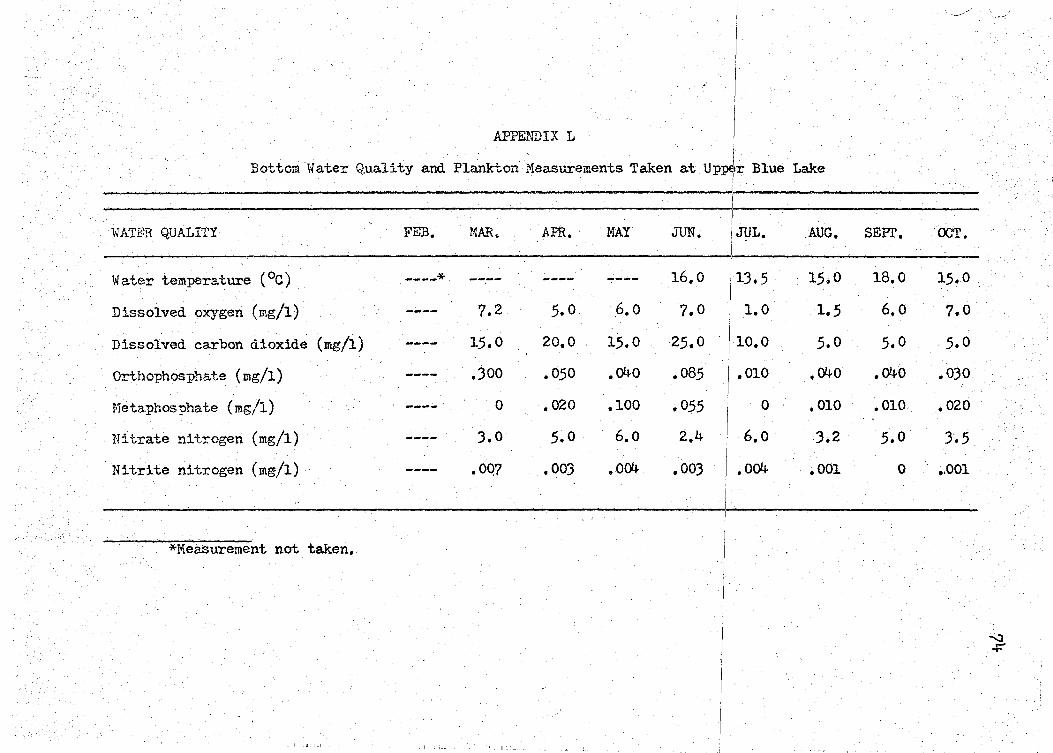
APPENDIX L
Bottom Water Q.uality and Plankton Measurements Taken at UppE!r Blue Lake
f
vJ ATER QUALITY FEB. ~.AR. APR.· MAY JUN. I JUL. AUG.
Water temperature (°C) ----* ---- ---- 16,0 [13.5 . 15.0
Dissolved oxygen (mg/1) ---- 7.2 5.0 6.0 7.0 1.0 1.5
Dissolved carbon dioxide (mg/1) ---- 15,0 20.0 15,0 25.0 10,0 5,0
Orthophosphate (mg/1) ---- .300 .050 .040 ,085 ,010 ,040
Heta.phosphate (mg/1) ---- 0 • 020 ,100 ,055 0 • 010
Nitrate nitrogen (mg/1) ---- 3.0 5.0 6.0 2,4 6.0 3.2
Nitrite nitrogen (mg/1) ---- .OQ7 • 003 .004 ,003 I ,o04 ,001
*Measurement not taken,
II, H
SEPI'.
18.0
6,0
5.0
,040
,010
5.0
0
_ _./ j
OCT.
15.0
7.0
5.0
.030
,020
3'.5
•. 001
.._;]
+
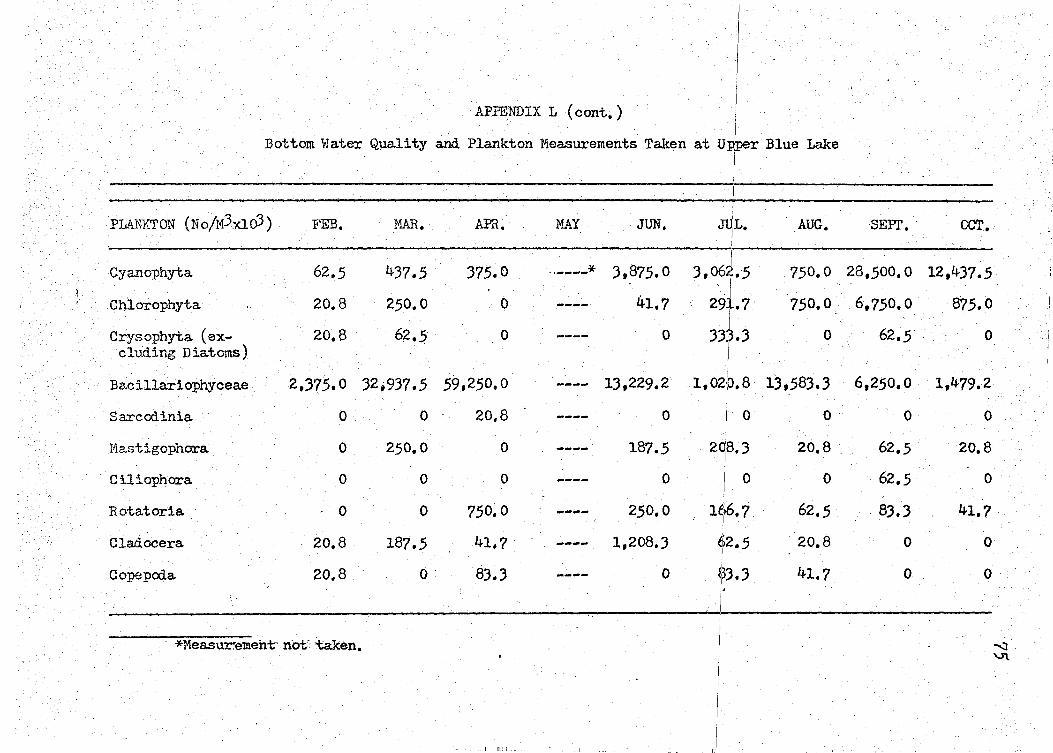
APPENDIX L (cont.)
Bottom Water Quality and Plankton Measurements Taken at Urr Blue Lake
PLANKTON (NojM3.uoJ) FEB. MAR. APR. MAY
Cya..11o:phyt,a 62.5 437.5 375.0 -·----* Chlorophyta 20.8 250.0 0 ----Crysophyta (ex- 20.8 62 • .5 0 ----
eluding Diatoms)
. Ba.cillariophyceae 2,375.0 32,937.5 59,250.0 ----Sarcod.inia 0 0 20.8 ----IIJ:astigophora 0 250,0 0 ----Ciliophora 0 0 0 ----Rotatoria 0 0 750.0 -----Cladocera 20,8 187.5 41.7 ----Co:pepOO.a 20.8 0 83.3 ----
*Measur.-ement·· nOt' taken.
I
·JUN.
3,875.0
41.7
0
13,229.2
0
187.5
0
250.0
1,208.3
0
I I IL.
6) 3,0 4.5 . I ' .
291.7'
33t3
I 1,02p.8
2J8.: 0
ll:6· 7 62.5
I I
I . t33.3 j·
AUG.
750.0
750.0 .
0
13,583.3
0
20.8 .
0
62.5
20.8
41.7
SEPI'. ·
28,500.0
6,750.0
62.5
6,250.0
0
62.5
62.5
.. 83.3
0
0
CCT.
12,437.5
875.0
0
1,479.2
0
20.8
0
41.7
0
0
""' \.J\

APPENDIX M
vi A:TER QUALITY FEB. MAR. A...'PR. MAY
\>later tem:pera.t ure ( °C) ----* ---- ---- ----Dissolved oxygen (mg/1) ---- 8.0 7.0 2.0
Dissolved carbon dioxide (mg/1) ---- 15.0 20.0 15.0
Orthophosphate (mg/1) ---- • 080 ,060 .080
Netaphosphate (mg/1) ---- .130 ,065 .090
Nitrate nitrogen (mg/1) ---- 3.5 6 • .5 4 . .5
Nitrite nitrogen (mgil) ----· ,005 ,017 ,015
*Measurement not taken_.
111:.1
JUN. I JUL. AUG,·
22. o . I 23. o 22.5
4,0 3.0 3.5
25.0 I 5.0 7.5
.~o I ,040 ,025
0 I .030 .085
0.8 I 5.0 4.5
• 004 0 ,001
lr
SEPI'.
19.0
4.0
5.0
.060
.030
6.0
0
'
OC'T •
14.0
7.0
5.0
,020
.070
3.0
,006
....::) ~
·I

APPENDIX l1 (cant,)
Bottom Water Q.uali ty and Plankton Measurements Taken at Ldwer Blue Lake
. . . I
PLANKTON (NO/H3xlfr3) FEB. MAR. APR. MAY JUN. ,L. AUG. SEPT. OCT.
Cyanophyta . ...;~~-* .. 125.0 2,083.3
Chlorophyta ---- 562,5 1,604,2
2,062.5 j 1,468.8 3,187.5 42,812.5 5,37 .. h 0
437.5 . I
20,395.8 28,812.5 14,812.5 9371.5
Crysophyta (ex- ---- 250.0 8,812.5 0 166.7 125.0 62.5 0 eluding Diatoms)
Bacillariophyceae ---- 15,312.5 5,145~3
S.arccdinia ---- 62. 5 \ 20;8
5,604.2 1,541.7 2,625.0 2,312.5 6,562.0
20.8 lo 0 0 0
Mastigophora ---- 312.5''. ..... ·~ ~: ·o 0 1,87~~. 0 62.5 0 20.8
Ciliophora ---- 0 .·.o
Rotatoria ---- :o 299.2
Cla.docera ---- .· .. 0 62.5
Copepoia ---- ' ~. 0 41~7
---- 0 I 0
0 .... 0 0
0 166.7 166!7 41,7 437.5 I .
83.3
11:: 0 0 62,5
62.5 41,7 20,8 62.5 I
I .......::J .......::J *Measurement not taken,
m: !-1
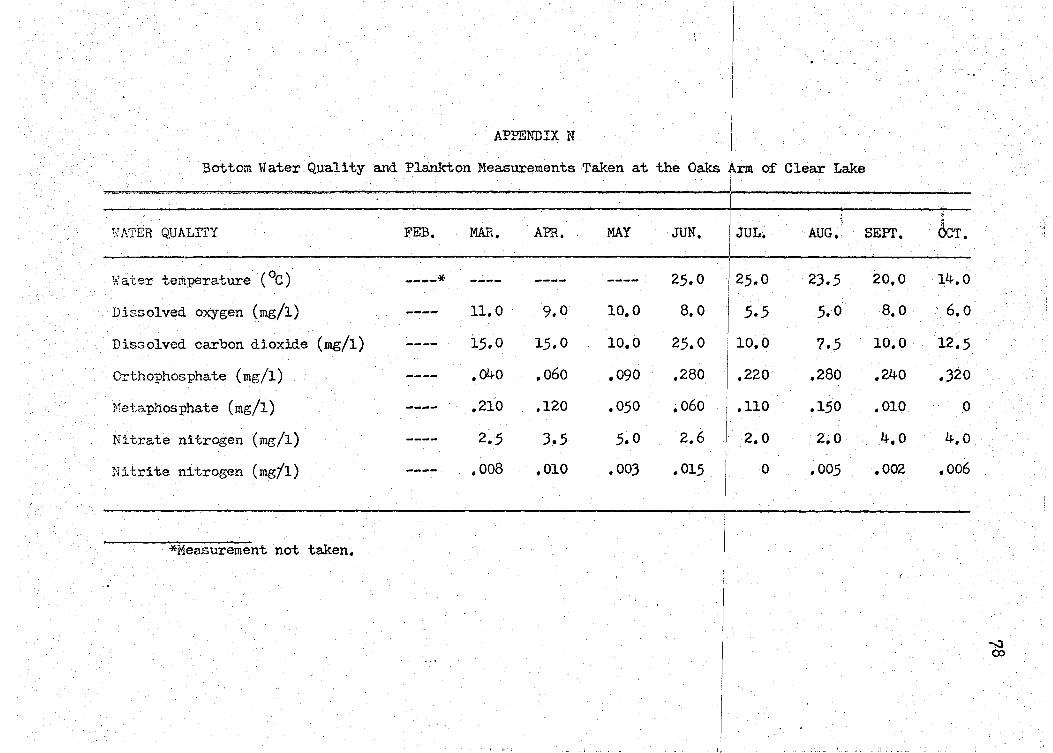
APPE1"'DIX N
Bottom Hater Quality and Plankton Measurements Taken at the Oaks Arm of Clear Lake . -I
,.,=. w ... zu,--.. ·-·~·""'· ... ·= ""-- ·-' · • = .. • · · · · · · · · · · · .. I
'k7ATER QUALITY FEB. MAR, APR. MAY JUN. I JUL~ AUG, SEPI'.
\>later temperature ( °C) ----* ---- ---- ---- 25.0 125.0 23.5 20,0
Dissolved oxygen (mg/1) ---- 11.0 ' 9.0 10.0 8.0 I 5.5 5.0 8,0
Dissolved carbon dioxide (mg/1) ---- 15.0 15.0 10,0 25.0 /10,0 7.5 10,0
Orthophosphate (mg/1) ---- ,040 .060 .090 .280 I .220 ,280 .240
Hetaphosphate (mg/1) ---- ,210 .120 ,050 • o6o · 1 .110 .150 • 010
Nitrate nitrogen (mg/1) ---- 2.5 3.5 5.0 2,6 I 2.0 2,0 4,0
Nitrite nitrogen (mgf1) ---- • 008 ,010 • 003 • 015 I 0 • 005 ,002
*Measurement not taken,
!, II .•
&T. 14,0
6,0
12.5
.320
0
4.0
.oo6
-..:) CP

APPENDIX N (cont.)
Bottom Wat.er Quality and Plankton Measurements Ta..l{en at the Oaks Abn of Clear Lake . . . . . I ·--~---~---------------------------- ---~-------
1.
PLANKTON (No/M3xlo3) FEB. MAR. APR~ MAY JUN.· JUL. I AUG. SEP!'. OC:T.
Cyanophyta 458.3 312.5 6,966.7 ---- 5,375.0 1,625. OJ 16,875.0 140,000.4 6,739.6
Chlorophyta 780.8 62.5 62.5 ---- 291.7 7,166.21 84,563.3 32,604.3 875.0
Crysophyta (ex-· 20.8 0 0 ---- 0 o: 0 0 0 eluding Diatoms)
Bacillariophyceae 541.7 1,187.5 7;708.3 ---- 7,125.0 187 .5i 6,875.0 1,979.2 833.3
Sarcod:1nia 0 0 0 ---- 0 0 0 0 0
729.~ Mastigophora 0 62.5 0 ---- 0 0 83.3 0
Ciliophora 0 0 0 ---- 0 0 0 0 0
83.~ Rotatoria 0 0 20.8 ---- 20.8 416.7 62.5 0
Cladocera 0 0 83.3 ---- 20.8 (j) 0 62.5 0
2o.J Copepoda 0 250.0 20.8 ---- 0 0 41.7 0
J
*Measurement not taken. ..... I '1
'-0
I,

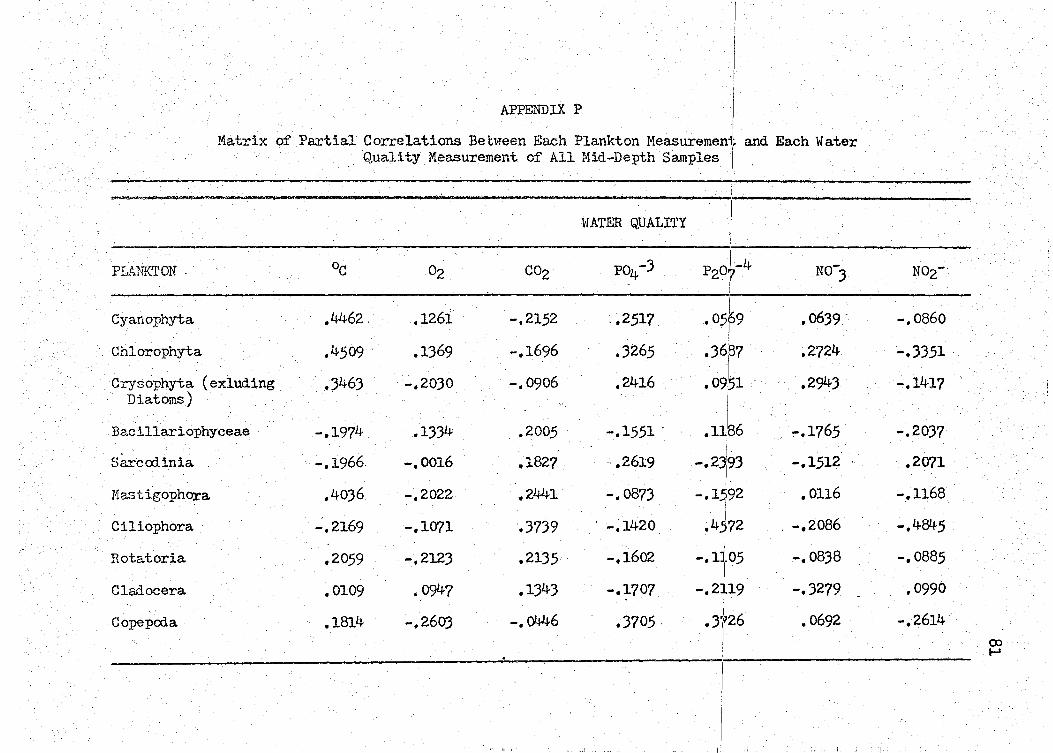
APPENDIX P
WATER Q:UALITY I
PLANKTON- oc o2 C02 po4-3 f .
P2<?r-4 N0-3 No2-·
,4462. .1261 -.2152 '02517 r .0639 . -,0860 Cyanophyta • 0569 I
Chlorophyta .4509 . .1369 -.1696 .3265 .3r .2724 -.3351
Crysophyta (exluding .3463 -,2030 -.0906 ,2416 .0951 .2943 -.1417 Diatoms)
_::f~ Bacillariophyceae -.1974 .1334 . ,2005 -.1551 . ~.1765 -.2037
Sarccdinia -.1966 -,0016 .1827 --.2619 -.1512 . ,20'71
:Hastigophora ,4036 ,2441 -.0873 ,0116 -.1168 -. 2022 -,1_592
Ciliophora .:.,2169 .3739 ' -.1420 (
. -,2086 -,4845 -.1071 ,4572
Rotatoria .2135 -,1602 I
-. 0838 -,0885 ,2059 -.2123 -.1105 I
Cladocera ,0109 • 0947 .1343 -.1707 -.2119 -.3279 • 0990
Copepoda • 1814 -.2603 -.0446 .3705 . .3~~26 • 0692 -,2614
I CP .....,
i'
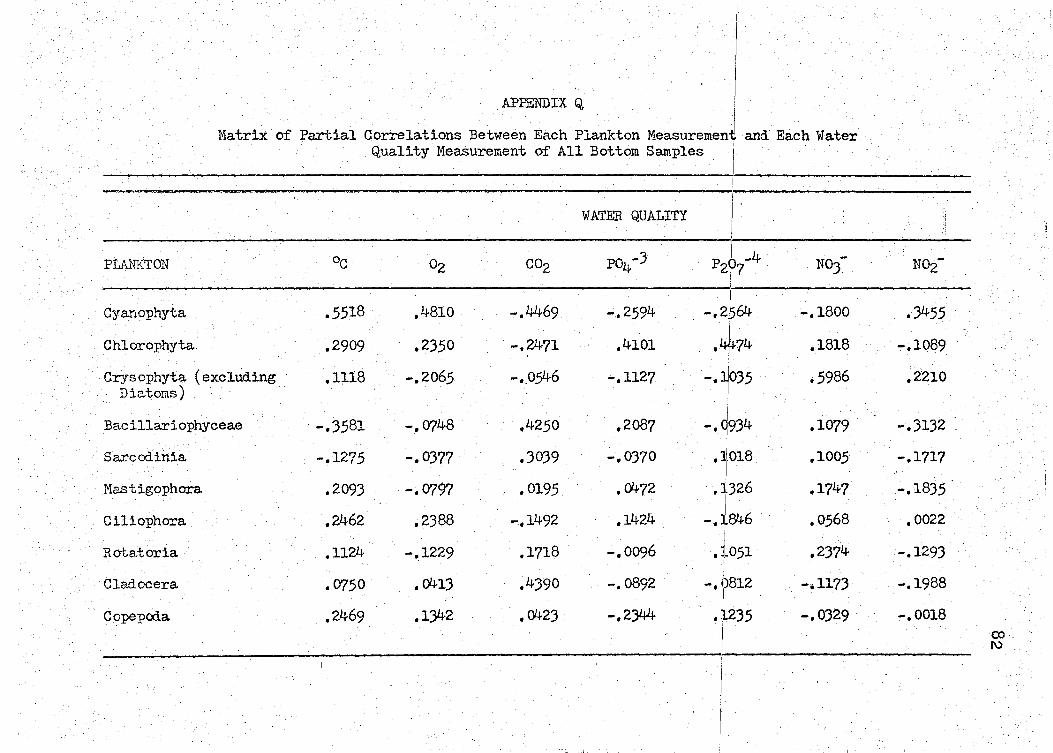
APPENDIX Q.
il I: I
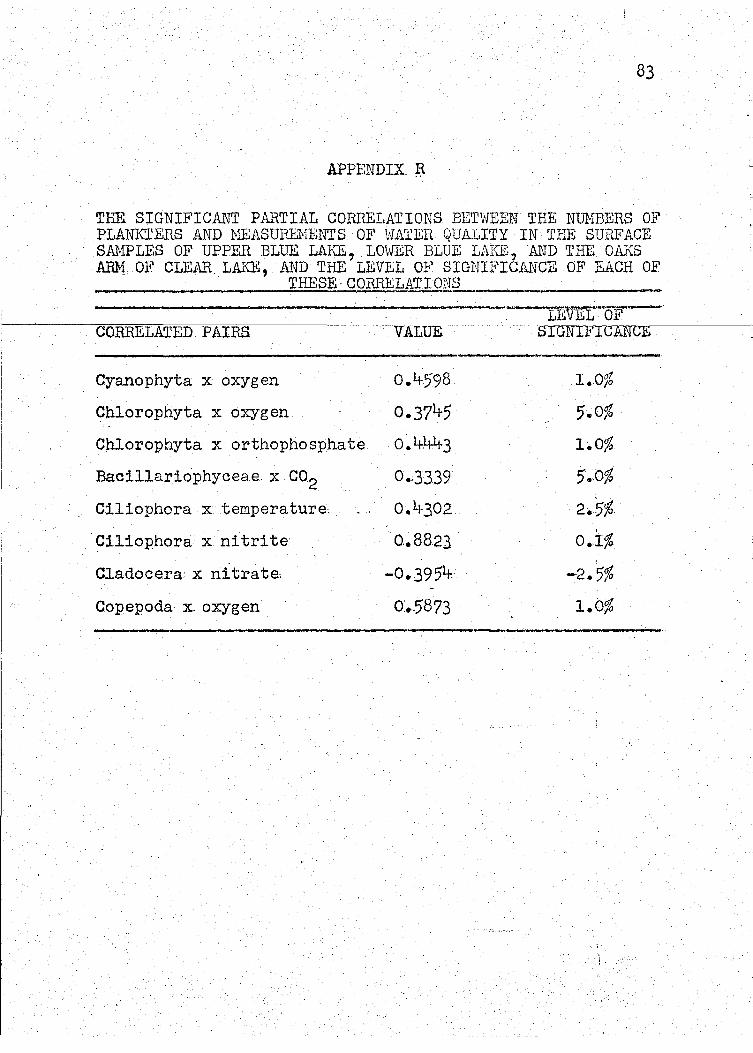
83
APPENDIX_ ~
THE SIGNIFICANT PARTIAL CORRELATIONS BETVIEEN THE NUMBERS OF PLANKTEHS AND HEASURENENTS OF HATER QUALITY IN THE SURFACE SAHPLES OF UPPER. BLtlli LAKE, LO\tJER BLUE LAKE, AND THE OAKS ~1 OF CLEAR. LAKE, AND THE LEVEL OF SIGNIFICtiliCE OF EACH OF
THESE·CORREL4TJQN~S-------------------
LE'V"ErrF-CORREh~TED PAIRS VALUE SIGNIJ:t,TCP.J:TCE
Cyanophyta x oxygen 0.4598 I.O%
Chlorophyta x oxygen 0.3745 5.0% Chlorophyta x orthophosphate 0.4443 1.0%
Bacillariophyceae. x co2 0.-3339 5 •. 0%
Ciliophora x temperature, 0.4302. 2..5%
Ciliophora x nitrita 0.8823 o.i% Cladoce.ra: x nitrate, -0.3954.- -2.5%
Copepoda x. oxygen o.-5873 1.0%
;·
APPENDIX S. Figures Showing Honthly Changes i.n Plankton Density and Heasurements of \iater Qua.1i ty of the Surface Water Samples of Upper Blue Lake, I,O\ver Blue Lake, and the Oalw Arm of Clear Lake .•
84
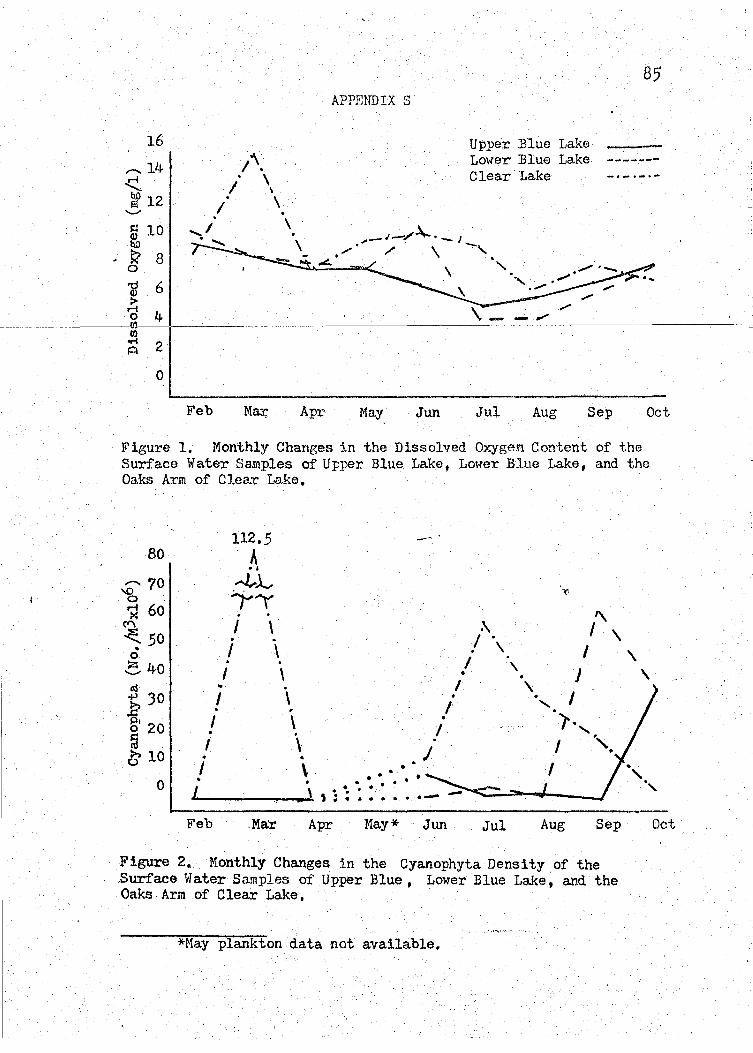
85 APPENDIX S
16
,...., 14 ~
/'. . \ I \ . \
I
Upper Blue Lake __ Lower Blue Lake ------Clear ·Lake - ·- ·- ·-
~ 12
Feb Max; Apr May·· Jun Jul Aug Sep Oct
Figure 1. Monthly Changes in the Dissolved Oxygen Content of the Surface Water Samples of Upper Blue Lake, Lower Blue I.ake, and the Oaks Arm of Clea:r Lake.
80
.:;;- ?o 0 .
~ 60 . (""\
~50 0 c4o
aS of-) 30 .f? ~ 20 ~ ~ 10
0
112.5 - A ... ,J...l., i-'~ . I \ .
I \ . . . I \ .
I . I
I . I
Feb .Ma:r
I \ ~
. l
\ . .
I \ . I \
Apr ~lay* Jun
~
/ \ I
Jul
' \ .
'\ I \
'
Aug Sep
Figure 2. Monthly Changes in the Cyanophyta Density of the .Surface rfater Samples of Upper Blue, Lower Blue Lake, and the Oaks Arm of Clear Lake.
*Hay plankton data not available.
\ \
Oct
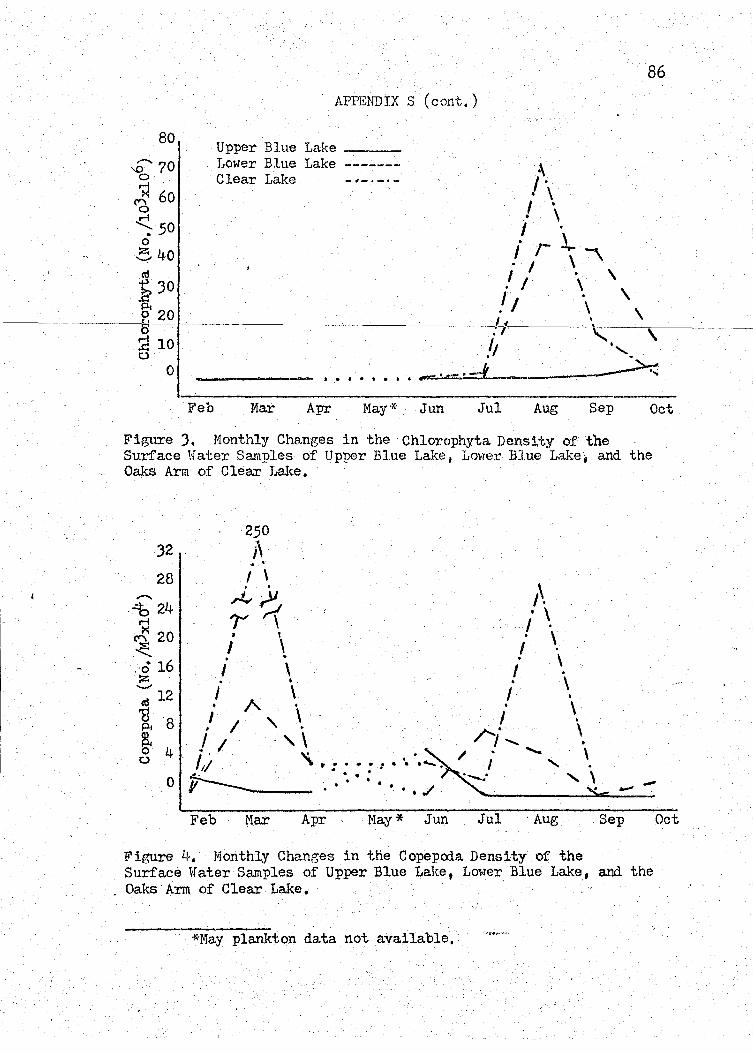
86 APPENDIX S (cont.)
80 Upper Blue Lake ---
._;;) 70 Lower Blue Lake ------- ~ o Clear Lake -·-·-·- 1· ~ 60 • \ ~ 1 . n • \ '::- 50 I · 3 4o i r .\.. "-\
. I \ t 30 /I \ \ ~ ,, . \ ~ 20 • \ \
-------~<-·-·---------------'--~--.' ~ I :7 . ~~--~,---------
~~ ·, :d 10
········-=·-·-L~ t.>
0
Feb Mar Apr May* Jun Jul Aug Sep Oct
Figure 3. Monthly Changes in the Chlorophyta Density of the Surface Hater Samples of Upper Blue Lake, LoHer BJue Lake, and the Oa,ks Arm of Clear Lake,
250 32 j\
·• . 28 I \
~ ~~ A ~24 r~ .i\ ~ 20 • t • \
~ I \ I · 6 . .. . .\ .ol I \ I · :z; • • • \ ':;' 12 I \ I · 1 .8 / 1 A' \ ·. j \ 8. I I · ' \ /'1 ....... \ o . /,; . ' .. : • • : : • ·• •'-, I '- . 0 4 ·. ~ . ~· ....... \
·- . ·. . . . ......... : ' \ 0 v-----_ . . . . . . ./ '{.,.... - -
Feb Mar Apr May* Jun Jul ·Aug Sep
Figure 4. 1'1onthly Changes in the Copepcda. Density of the Surface Water Samples of Upper Blue Lake, Lower. Blue Lake, and the Oaks Arm of Clear Lake.
*~lay plankton data not available,
Oct

87
32
0J28 0
'>J 2LJ. ~ ~20
Q) 16
APPENDIX S (cont.)
Up:r)er Blue Lake -~Lower Blue Lake -------Clea-r Lake
"· . ' I ., I ·'--·-·-
1\\ -·-·\ "'- I -a 12 \ , 1· , I , ~ ' . / ,. . . . /
----------::~8-;------"; /'..._ / '~ ~ . -· _j / ~ 4 ~v·~)-;"· _-----------/----L ___ ___:_ __
' / ~~-----:>/. --0 . . ./ ..
Feb Mar Apr May· Jun Jul Aug Sep
Figure 5. Monthly Changes in the Orthophosphate Content of the Surface Water Samples. of Upper Blue Lake, Lower Blue Lake, and the Oaks Arm of Clear Lake.
20
\
\
' . L·.- ._.. .__.·-.I
0
Feb Mar Apr May- Jun Jul Sep Sep
Oct
Oct
Figure 6. Monthly Changes in the Dissolved Carbon Dioxide Content Of the Surface Water Samples of Upper Blue Lake, Lower Blue Lake,
· and the Oaks Arm of Clear Lake.
_, _,._
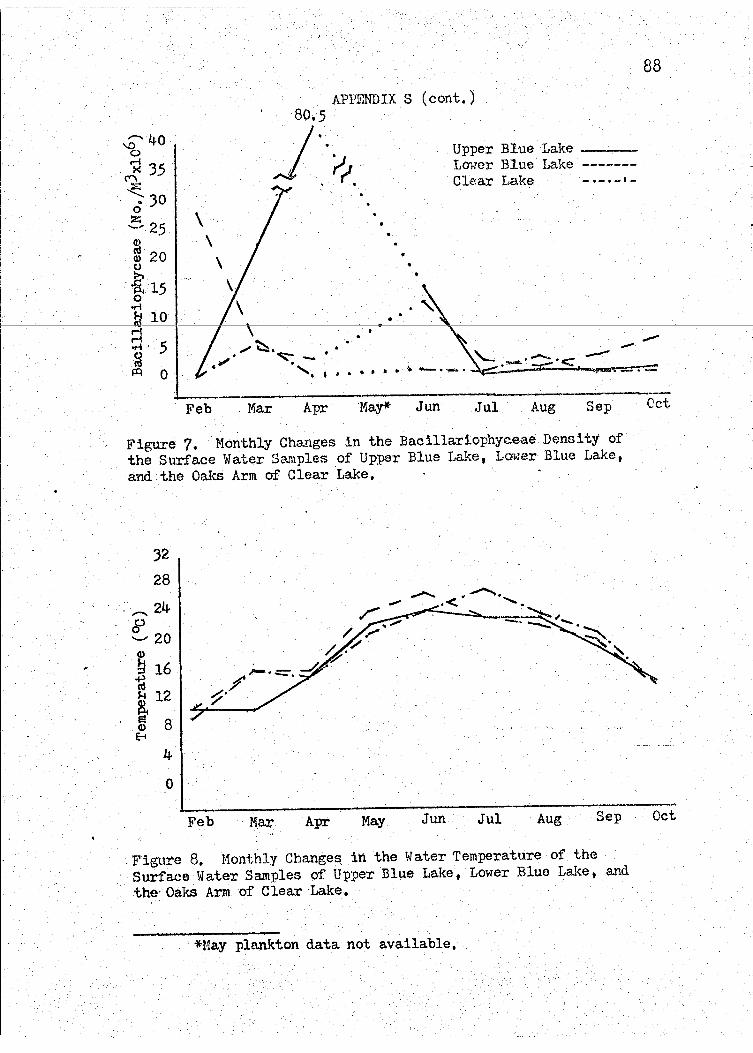
......... 40 "b ~ 3.5
(""\ :;;.::
·':- 30 0 z ._ ... 25 (!)
~ 20 C) :>. . -a. 15
\ \
• ..
(cont.)
Upper Blue Lake --Lower Blue Lake Clear Lake -·-·-·-
88
j---,----'----~ 10 . \ •••• \
~ 50 /...--.\".«: ~-. . ·. \~-'---.-,_-. :::::.--.-<------.----_.------...... ' ' .. • • • • ..... ..._.- • ~ • J "!!~,-~-.-..::::-
Feb . Mar Apr MaY* Jun Jul Aug Sep
Figure 7. Monthly Cha..nges in the Bacillariophyceae Density of the Surface Water Samples of Upper Blue Lake, Lo•rer Blue Lake, and the Oaks Arm of Clear I.ake.
32 28
. ,.;....... 24 fl ...._., 20
Q)
~ 16 ~ ~ 12
~ 8 E-1
4
0
Feb Mar Apr May Jun Jul ·Aug Sep
. Figure 8. }1onthly Changes. in the Water Temperature of the Surface Water Samples of Upper Blue Lake, Lower Blue Lake, and the· Oaks Arm of Clear Lake.
~May plankton data not available.
Oct
Oct
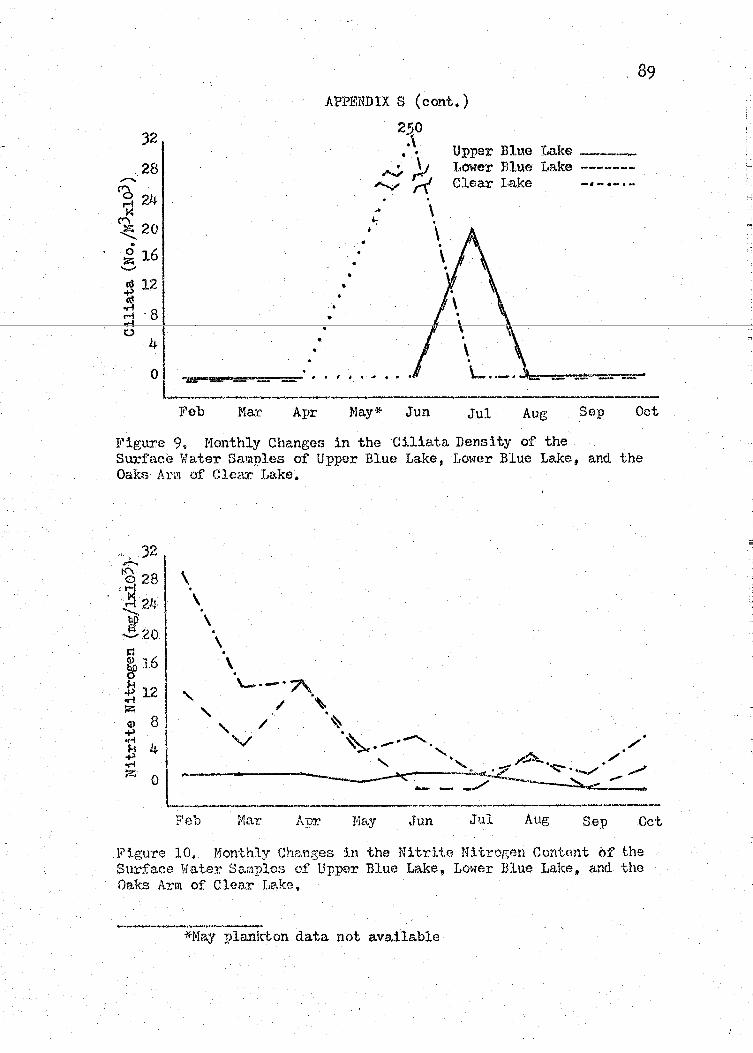
32
.. 28 ..........
'~ 24 X
~ 20 -......:.. . ~ 16 ..._., cd 12 ~ ;.1 . 8
4 ..
. 89
APPENDIX S (cont.)
2')0 :\
.. ..
Upper Blue I.a.ke -I,ower Blue Lake ------Clear l.ake -·-·-·-
OL~-=·-__ _ . . ' . . .. . . Feb Mar Nay* Jun Jul Aug Sep Oct
Figure 9. Monthly Changes in the Ciliata Density of the Surface Water Samples of Upper Blue La.ke, Lo...rt~r Blue Lake, and the Oaks Arm 1:>f Clcax Lt.:<.ke.
\ . \
Fe1J Mar. Apr .Tun Jul Aug Sep Oct
l''igure 10. t1onthly Changes in the Nitrlte Nitrogon Contnnt of the Surface 1tiater So.m}Jles of Upper Blue Lake, Lower Blue I,ake, and the Oaks Arm of Clear Lake,
*May plankton data not available
L
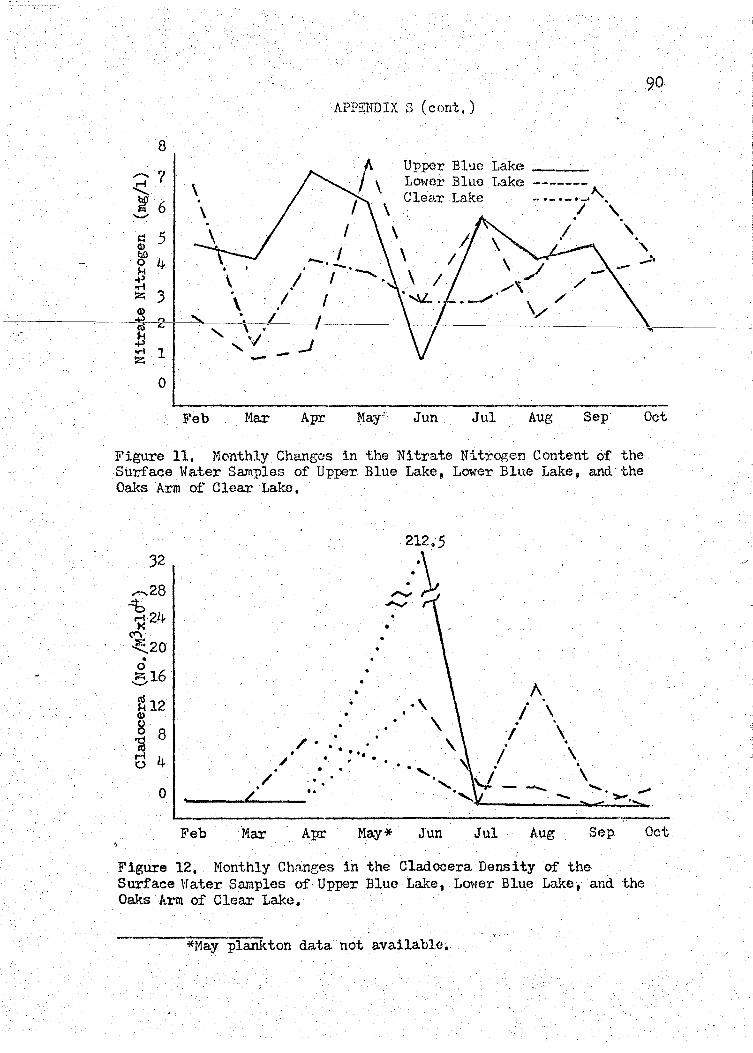
8
~ 5 Q)
~ 4 ~ \ I z J . /
APPENDIX S (cont.)
Upper Blue Lake __ _
I I
Lmrer Blue Lake Clear Lake
-------" - ·- ·-·--- .. I \
/ '
Q) ' \ •
-------~2-~~-··-1 ''-----1 co ' \ • , ~ '•/ I orll -~ z -
0
Feb Ma.r Apr May·' Jun Jul Aug Sep Oct
li'igure 11. Honthly Changes in the Nitrate Nitrogen Content of the Surface Water Samples of Upper Blue Lake, Lower Blue Lake, and the O~~s Arm of Clear Lake.
32
...,.....28
~24 X
("'\
~20 . 0 Zl6 .._.,
~12 Q)
8 8
~ 0 4
• ~
/
\
/• \ . . . .... \ . . . .
• . .. '· ' . . . . 0
. .. ...._ ' ..,; --
Feb Ma.r Apr May* Jun Jul Aug Sep
Figure 12. Nonthly Ch:mges in the Cladocera Density of the Surface Hater Samples of Upper Blue Lake, LO'tler Blue Lake• and the Oaks Arm of Clear Lake.
*May plankton data not available.
Oct
,,_ .. --