Sensitivity of the Penman–Monteith reference evapotranspiration to key climatic variables in the...
10
Sensitivity of the Penman–Monteith reference evapotranspiration to key climatic variables in the Changjiang (Yangtze River) basin Lebing Gong a,c , Chong-yu Xu b,d, * , Deliang Chen c,e , Sven Halldin a , Yongqin David Chen f a Department of Earth Sciences, Uppsala University, Villavagen 16, S-75236 Uppsala, Sweden b Department of Geosciences, University of Oslo, Sem Saelands vei 1, P.O. Box 1047, Blindern, NO-0316 Oslo, Norway c Department of Earth Sciences, Gothenburg University, Sweden d Nanjing Institute of Geography and Limnology, Chinese Academy of Sciences, China e Laboratory for Climate Studies/National Climate Center, China Meteorological Administration, Beijing, China f Department of Geography and Resource Management, The Chinese University of Hong Kong, Hong Kong Received 29 August 2005; received in revised form 13 March 2006; accepted 14 March 2006 Summary Sensitivity analysis is important in understanding the relative importance of climatic variables to the variation of reference evapotranspiration (ET ref ). In this study, a non- dimensional relative sensitivity coefficient was employed to predict responses of ET ref to pertur- bations of four climatic variables in the Changjiang (Yangtze River) basin. ET ref was estimated with the FAO-56 Penman–Monteith equation. A 41-year historical dataset of daily air tempera- ture, wind speed, relative humidity and daily sunshine duration at 150 national meteorological observatory stations was used in the analysis. Results show that the response of ET ref can be pre- cisely predicted under perturbation of relative humidity or shortwave radiation by their sensi- tivity coefficients; the predictive power under perturbations of air temperature and wind speed depended on the magnitude of the perturbation, season and region. The prediction errors were much smaller than the seasonal and regional variation of their sensitivity coefficients. The sen- sitivity coefficient could also be used to predict the response of ET ref to co-perturbation of sev- eral variables. The accuracy of the prediction increases from the lower to the upper region. Spatial variations of long-term average monthly and yearly sensitivity coefficients were obtained by interpolation of station estimates. In general, relative humidity was the most sen- sitive variable, followed by shortwave radiation, air temperature and wind speed. The actual KEYWORDS Penman–Monteith reference evapotranspiration; Sensitivity coefficient; Changjiang basin; China 0022-1694/$ - see front matter c 2006 Elsevier B.V. All rights reserved. doi:10.1016/j.jhydrol.2006.03.027 * Corresponding author. Address: Department of Geosciences, University of Oslo, Sem Saelands vei 1, P.O. Box 1047, Blindern, NO-0316 Oslo, Norway. Tel.: +47 22 855825; fax: +47 22 854215. E-mail address: [email protected] (C.-y. Xu). Journal of Hydrology (2006) 329, 620– 629 available at www.sciencedirect.com journal homepage: www.elsevier.com/locate/jhydrol
-
Upload
independent -
Category
Documents
-
view
3 -
download
0
Transcript of Sensitivity of the Penman–Monteith reference evapotranspiration to key climatic variables in the...

Journal of Hydrology (2006) 329, 620–629
ava i lab le at www.sc iencedi rec t . com
journal homepage: www.elsevier .com/ locate / jhydro l
Sensitivity of the Penman–Monteith referenceevapotranspiration to key climatic variables in theChangjiang (Yangtze River) basin
Lebing Gong a,c, Chong-yu Xu b,d,*, Deliang Chen c,e, Sven Halldin a,Yongqin David Chen f
a Department of Earth Sciences, Uppsala University, Villavagen 16, S-75236 Uppsala, Swedenb Department of Geosciences, University of Oslo, Sem Saelands vei 1, P.O. Box 1047, Blindern, NO-0316 Oslo, Norwayc Department of Earth Sciences, Gothenburg University, Swedend Nanjing Institute of Geography and Limnology, Chinese Academy of Sciences, Chinae Laboratory for Climate Studies/National Climate Center, China Meteorological Administration, Beijing, Chinaf Department of Geography and Resource Management, The Chinese University of Hong Kong, Hong Kong
Received 29 August 2005; received in revised form 13 March 2006; accepted 14 March 2006
Summary Sensitivity analysis is important in understanding the relative importance ofclimatic variables to the variation of reference evapotranspiration (ETref). In this study, a non-dimensional relative sensitivity coefficient was employed to predict responses of ETref to pertur-bations of four climatic variables in the Changjiang (Yangtze River) basin. ETref was estimatedwith the FAO-56 Penman–Monteith equation. A 41-year historical dataset of daily air tempera-ture, wind speed, relative humidity and daily sunshine duration at 150 national meteorologicalobservatory stations was used in the analysis. Results show that the response of ETref can be pre-cisely predicted under perturbation of relative humidity or shortwave radiation by their sensi-tivity coefficients; the predictive power under perturbations of air temperature and wind speeddepended on the magnitude of the perturbation, season and region. The prediction errors weremuch smaller than the seasonal and regional variation of their sensitivity coefficients. The sen-sitivity coefficient could also be used to predict the response of ETref to co-perturbation of sev-eral variables. The accuracy of the prediction increases from the lower to the upper region.Spatial variations of long-term average monthly and yearly sensitivity coefficients wereobtained by interpolation of station estimates. In general, relative humidity was the most sen-sitive variable, followed by shortwave radiation, air temperature and wind speed. The actual
KEYWORDSPenman–Monteithreferenceevapotranspiration;Sensitivity coefficient;Changjiang basin;China
0d
O
022-1694/$ - see front matter �c 2006 Elsevier B.V. All rights reserved.oi:10.1016/j.jhydrol.2006.03.027
* Corresponding author. Address: Department of Geosciences, University of Oslo, Sem Saelands vei 1, P.O. Box 1047, Blindern, NO-0316slo, Norway. Tel.: +47 22 855825; fax: +47 22 854215.E-mail address: [email protected] (C.-y. Xu).

Sensitivity of the Penman–Monteith reference evapotranspiration to key climatic variables in the Changjiang basin 621
rank of the four climatic variables in terms of their sensitivity varied with season and region.The large spatial variability of the sensitivity coefficients of all the climatic variables in themiddle and lower regions of the basin was to a large extent determined by the distinct wind-speed patterns in those two regions.
�c 2006 Elsevier B.V. All rights reserved.
Introduction
Reference evapotranspiration (ETref), defined as the poten-tial evapotranspiration of a hypothetical surface of greengrass of uniform height, actively growing and adequatelywatered, is one of the most important hydrological variablesfor scheduling irrigation systems, preparing input data tohydrological water-balance models, and calculating actualevapotranspiration for a region and/or a basin (Blaney andCriddle, 1950; Dyck, 1983; Hobbins et al., 2001a,b; Xu andLi, 2003; Xu and Singh, 2005). ETref is a measure of the evap-orative demand of the atmosphere independent of croptype, crop development and management practices. Onlyclimatic factors affect ETref. Consequently, ETref is a cli-matic parameter and can be computed from meteorologicaldata (Allen et al., 1998). Different categories of methodshave been developed in attempts to model ETref, including(Xu and Singh, 2002): (1) water budget (e.g., Guitjens,1982), (2) mass-transfer (e.g., Harbeck, 1962), (3) combina-tion (e.g., Penman, 1948), (4) radiation (e.g., Priestley andTaylor, 1972), and (5) temperature-based (e.g., Thornthwa-ite, 1948; Blaney and Criddle, 1950) equations. The Pen-man–Monteith (P–M) method is recommended by FAO asthe sole method to calculate reference evapotranspirationwherever the required input data are available (e.g., Allenet al., 1998; Droogers and Allen, 2002). The FAO methodis a physically-based approach that can be used globallywithout any need for additional adjustments of parameters.Xu et al. (2006a,b) and Chen et al. (2005) studied the Pen-man–Monteith ETref in the Changjiang basin in detail andfound that the spatial pattern and temporal trend of ETrefagreed with pan evaporation.
A major drawback to apply the P–M method is its rela-tively high data demand. The method requires, apart fromsite location, air temperature, wind speed, relative humid-ity, and shortwave radiation data. The number of meteoro-logical stations where all of these parameters are observedis limited in many areas of the globe. The number of stationswhere reliable data for these parameters exist is even smal-ler, especially in developing countries (Droogers and Allen,2002). A sensitivity analysis of ETref to perturbations (allsorts of data errors or, actual climatic changes) associatedwith one or more climatic variables is important to improveour understanding of the connections between climatic con-ditions and ETref variability, and between data availabilityand estimation accuracy of ETref.
Studies on regional and seasonal behaviour of the sensi-tivity of reference evapotranspiration to climatic variablesare rare in the literature, and no study has been done forthe Changjiang basin. A recent study of the sensitivity ofETref was reported by Hupet and Vanclooster (2001) at a sin-gle station in a moderate humid climatic zone in Belgium.
Because of different approaches used in parameterising ETmodels, there are different definitions of the sensitivitycoefficients and the different spatial-temporal scales in pre-vious studies (e.g., McCuen, 1974; Saxton, 1975; Colemanand DeCoursey, 1976; Beven, 1979; Ley et al., 1994; Ranaand Katerji, 1998; Qiu et al., 1998). This makes it difficultto compare literature results. In addition, these studiesare often suffering from sparse station data and limitedtemporal coverage. Thus, a common framework for sensitiv-ity analysis of ETref with long-term spatially dense datasetwould be useful in connecting the spatial variability of sen-sitivity with regional climate conditions. The aim of thepresent study was to provide reliable sensitivity coefficientsof ETref for the Changjiang basin based on meteorologicaldata of 150 National Meteorological Observatory (NMO) sta-tions for the period 1960–2000. This paper presents resultsof an on-going study of the impact of climate change onfloods in the Changjiang (Yangtze River) basin in China.The ongoing and planed research include investigation andquantification of natural and human effects on the changingtrend of meteorological variables, calculation and regionalmapping of actual evapotranspiration in the basin by usingthe complementary-evaporation approach (Xu and Singh,2005) and water-balance models, investigation of effectsof changes in evapotranspiration on flooding and the hydro-logical cycle in the region. ETref provides a measure of theintegrated effect of radiation, wind, temperature andhumidity on evapotranspiration. In humid climate, refer-ence evapotranspiration provides an upper limit for actualevapotranspiration and in an arid climate it indicates the to-tal available energy for actual evapotranspiration. Quanti-tative estimation of the effect of different meteorologicalvariables on reference evapotranspiration is also an impor-tant step in studying the impact of climate change onevapotranspiration and water-balance components.
Study area, data and method
The Changjiang basin
The Changjiang River is about 6380 km long with a drainagearea of 1.8 · 106 km2 (Fig. 1). Originating from the TibetanPlateau, the terrain of the basin is shaped like a ladder withthree stairs. The Qinghai-Tibet Plateau in the west, thehighest stair, has an average elevation of over 3000 m abovesea level; the second stair, where the Sichuan basin is lo-cated, has an average elevation of 1000 m; the third stairin east China Plain has an average elevation of about100 m. In this study, the basin is divided into three sub-re-gions that correspond to the three stairs, the upper the mid-dle and the lower regions, respectively. The classification ofthe upper, middle and lower regions of the basin in this

Figure 1 Location of the Changjiang (Yangtze River) basin and the meteorological stations used in this study (white dots).
622 L. Gong et al.
study is different from what is determined by the ‘‘Changji-ang River Water Resources Commission (CWRC)’’ in China,where flood control is the main concern for the classifica-tion. According to CWRC, the section above Yichang station(where the three gorges dam is located) is called the UpperReach, 4500 km long, with a controlled catchment area of1 million km2 accounting for 70.4% of Yangtze’s total area.From Yichang to Hukou is the Middle Reach, 955 km longwith a catchment area of 680,000 km2. The remaining partfrom Hukou to the estuary is called the Lower Reach,938 km long with a catchment area of 120,000 km2.
Meteorological stations
A data set of 150 National Meteorological Observatory sta-tions (Fig. 1) with daily observations of maximum, minimumand average air temperature at 2 m height, wind speedmeasured at 10 m height, relative humidity (2 m height)and daily sunshine duration for the period 1960–2000 wasused in this study. Data were provided by the National Cli-matic Centre (NCC) of China Meteorological Administration(CMA). The wind-speed measurements were transformedto wind speed at 2 m height by the wind profile relationshipintroduced in Chapter 3 of the FAO paper 56 (Allen et al.,1998). The Changjiang basin climate is characterised by(1) a seasonal variation of relative humidity in the upper re-gion that is much greater than those in the other regions; (2)the maximum wind speed occurs in March for all the regionsand the seasonal variation is much stronger in the upper re-gion; (3) the highest shortwave radiation is in May in theupper region, and in July in the other two regions; (4) theupper region is distinct from the rest in its significantly low-er temperature and relative humidity. The major differencebetween the middle and the lower regions is that the latterhas a significantly higher wind speed (Fig. 2).
Penman–Monteith reference evapotranspirationand the sensitivity coefficient
The FAO Penman–Monteith methodThe P–M method for calculating daily reference evapotrans-piration (Allen et al., 1998) is:
ETref ¼0:408DðRn � GÞ þ c 900
TAþ273u2ðes � eaÞ
Dþ cð1þ 0:34u2Þð1Þ
where: ETref is reference evapotranspiration (mm day�1), Rnnet radiation at the crop surface (MJ m�2 day�1), G soil heatflux (MJ m�2 day�1), TA average daily air temperature at 2-m height (�C), u2 wind speed at 2-m height (m s�1), es satu-ration vapor pressure (kPa), eA actual vapor pressure (kPa)and (es � eA) saturation vapor pressure deficit (kPa), D isslope of the saturated water–vapor-pressure curve(kPa �C�1), and c is psychrometric constant (kPa �C�1).The computation of all data required for the calculationof the reference evapotranspiration followed the methodand procedure given in Chapter 3 of the FAO paper 56 (Allenet al., 1998).
Original measurements of air temperature (TA), windspeed (WD), and relative humidity (HD) were chosen forsensitivity analyses. The forth variable that was analysedis shortwave radiation (RS). This is because shortwave radi-ation is one of the input variables in a number of semi-phys-ical and semi-empirical equations that are used to derivethe net energy flux required by the Penman method. Follow-ing the procedure described by Allen et al. (1998), RS can beestimated with the Angstrom formula that relates surfaceshortwave radiation to extraterrestrial radiation and dailysunshine duration:
RS ¼ as þ bsn
N
� �Ra ð2Þ
0 50 100 150 200 250 300 3500
5
10
15
20
25
30
Day
Air
tem
pera
ture
( o C
)
0 50 100 150 200 250 300 350
0.8
1
1.2
1.4
1.6
1.8
2
2.2
Day
Win
d sp
eed
(m s
1)
0 50 100 150 200 250 300 35050
55
60
65
70
75
80
Day
Rel
ativ
e hu
mid
ity (
%)
0 50 100 150 200 250 300 3506
8
10
12
14
16
18
20
22
Day
Sol
ar r
adia
tion
(MJ
day
1 m
2)
U
L
M
U
L
M
U
L
MU
L
M
(a)
(d)(c)
(b)
Figure 2 Mean daily variations of the major climatic variables in the upper (U), middle (M) and lower regions (L) of the Changjiangbasin.
Sensitivity of the Penman–Monteith reference evapotranspiration to key climatic variables in the Changjiang basin 623
where RS is solar or shortwave radiation (MJ m�2 day�1), n isdaily sunshine duration (h), N is maximum possible durationof sunshine or daylight hours (h), n/N is relative sunshineduration, Ra is extraterrestrial radiation (MJ m�2 day�1), asand bs are regression constants. The recommended valuesas = 0.25 and bs = 0.50 were used in this study.
The sensitivity coefficientsIn evaporation studies (e.g., McCuen, 1974; Saxton, 1975;Coleman and DeCoursey, 1976; Beven, 1979), as well as inother hydrological (e.g., Anderton et al., 2002) and ecolog-ical (e.g., Beres and Hawkins, 2001) applications, a numberof sensitivity coefficients have been defined depending onthe purpose of the analyses. A simple but practical way ofpresenting a sensitivity analysis is to plot relative changesof a dependent variable against relative changes of an inde-pendent variables as a curve (e.g., McKenney and Rosen-berg, 1993; Singh and Xu, 1997; Goyal, 2004), denoted asthe ‘‘sensitivity curve method’’ in the following text. Moreoften, however, a mathematically defined sensitivity coef-ficient (e.g., McCuen, 1974; Saxton, 1975; Coleman andDeCoursey, 1976; Beven, 1979; Rana and Katerji, 1998;Qiu et al., 1998; Hupet and Vanclooster, 2001) is used tocharacterise sensitivity. For multi-variable models (e.g.,the P–M method), different variables have different dimen-sions and different ranges of values, which makes it difficult
to compare the sensitivity by partial derivatives. Conse-quently, the partial derivative is transformed into a non-dimensional form (e.g., Beven, 1979):
SVi¼ lim
DVi!0
DETref=ETref
DVi=Vi
� �¼ oETref
oVi� Vi
ETrefð3Þ
SViis sensitivity coefficient and Vi is the ith variable. The
transformation that gives the ‘‘non-dimensional relativesensitivity coefficient’’ (denoted as ‘‘sensitivity coeffi-cient’’ in the following text), was first adopted by McCuen(1974) and is now widely used in evapotranspiration studies(e.g., Coleman and DeCoursey, 1976; Beven, 1979; Rana andKaterji, 1998; Qiu et al., 1998; Hupet and Vanclooster,2001). Basically, a positive/negative sensitivity coefficientof a variable indicates that ETref will increase/decrease asthe variable increases. The larger the sensitivity coefficient,the larger effect a given variable has on ETref. In graphicalform, the sensitivity coefficient is the slope of the tangentat the origin of the sensitivity curve. Practically, the coeffi-cient is accurate enough to represent the slope of the sen-sitivity curve within a certain ‘‘linear range’’ around theorigin. The width of the range depends on the degree ofnon-linearity of the sensitivity curve. If a sensitivity curveis linear, the sensitivity coefficient is able to representthe change in ETref caused by any perturbation of the vari-able concerned. A sensitivity coefficient of 0.2 for a variable
624 L. Gong et al.
would in this case mean that a 10% increase of that variable,while all other variables are held constant, may increaseETref by 2%. If the sensitivity curve is significantly non-lin-ear, the predictive power of the sensitivity coefficient willbe limited to small perturbations only.
Sensitivity coefficients were calculated on a daily basisfor air temperature, wind speed, relative humidity andshortwave radiation. Monthly and yearly average sensitivitycoefficients were obtained by averaging daily values. Repre-sentative regional sensitivity coefficients were obtained byaveraging station values. Spatial patterns of monthly andyearly sensitivity coefficients were obtained by interpolat-ing station values to the whole basin in ArcGIS. The partialderivatives, needed for the determination of the sensitivitycoefficients, were calculated analytically by means of sym-bolic calculation of MatlabTM. The analytical expressions canbe found in the online supplementary materials alongsidethe electronic version of the article.
The transmitting curve and the predictive power ofsensitivity coefficients
The predictive power of sensitivity coefficients may be lim-ited by the non-linearity of the sensitivity curve. It is thususeful to provide the sensitivity coefficients together withtheir predictive power. The predictive power of the coeffi-cients was studied by a simple transformation of the sensi-tivity curve. Each point on the sensitivity curve relates therelative change of a climatic variable to ETref. The transfor-mation was done by dividing each point on the sensitivecurve, except at the origin, by its x-coordinate. If the sen-sitivity curve has the form y = f(x), the resulting curve hasthe form y 0 = f(x)/x. Each point on the resulting curve (de-fined as the transmitting curve) relates the relative changeof a climatic variable (x-coordinate) to a ‘‘transmitting fac-tor’’ (y-coordinate). By multiplying the relative change ofthe climatic variable and its transmitting factor, the rela-tive change of ETref was obtained. The origin of the trans-mitting curve, which was left blank in the transformation,can be filled by the sensitivity coefficient SVi
. The transmit-ting factor, which is a function of the magnitude of pertur-bation itself, transmits perturbation of climatic variables tochanges in ETref in a more precise way than the sensitivitycoefficients themselves. At the same time, the flatness ofthe transmitting curve provides a direct way of measuringthe predictive power of the sensitivity coefficients. The flat-ter the transmitting curve, the more representative the sen-sitive coefficient becomes, and therefore the larger itspredictive power.
The predictive power of the sensitivity coefficient foreach meteorological variable was examined for each stationand each month (obtained by averaging daily values), undera one-at-a-time perturbation (i.e., one variable was chan-ged while all others were held constant). It is well estab-lished in sensitivity studies that significant effects can beproduced by a pair of variables acting in concert (Burgmanet al., 1993). Such combined effects can be larger thanthe sum of the individual effects of the two variables. How-ever, the applications of the sensitivity coefficient in evap-oration studies are always limited in the ‘‘one-at-a-time’’case. Perturbations of more than one variable are likely tohappen at the same time in real life. In this work, the pre-
dictive power of sensitivity coefficients for co-perturbationof all climatic variables was tested in three climatically dis-tinct regions of the Changjiang basin. A Monte-Carlo simula-tion based on the definition of the sensitivity coefficient(SVi
) was implemented for this purpose. The test simulationconsisted of four steps: (1) Perturbated climatic data weregenerated. For each of the 150 stations, 100 random pertur-bation scenarios were generated for TA, WD, HD and RS,respectively. The range of perturbation was between(�20%, 20%) for each variable; (2) In each scenario, the ac-tual response of ETref was obtained by recalculating ETrefusing the perturbed data with the Penman–Monteith equa-tion; (3) The predicted change in ETref was calculated bysumming up the sensitivity-coefficient-estimated perturba-tion of ETref, i.e.,
DETref
ETref
� �ffi DTA
TA
� �� STA þ
DWD
WD
� �� SWD þ
DHDHD
� �� SHD þ
DRSRS
� �� SRS
ð4Þ
(4) The 100 pairs of actual and estimated responses of ETrefwere plotted for each station and their coefficients ofdetermination (R2) were calculated.
Results
Daily variation of the sensitivity coefficients
Daily sensitivity coefficients exhibit large fluctuations dur-ing the year (Fig. 3). The same feature has also been re-ported by Hupet and Vanclooster (2001). Daily variationpatterns of STA agree with those of air temperature. ETrefis insensitive to TA in winter and the sensitivity gradually in-creases and achieves its maximum value in summer(Fig. 3a). ETref is significantly less sensitive to air tempera-ture in the upper region compared to the other two regionsthroughout the year. For the middle and lower regions, thesensitivity is similar in winter and early spring, but itachieves a much higher value in summer in the lower region.The similar patterns of STA and TA indicate that TA deter-mines the extent of the seasonal variation of STA. Fig. 3bshows that ETref is most sensitive to wind in winter time.Relatively strong negative sensitivity coefficients were ob-tained for relative humidity (Fig. 3c). There was also a con-siderable difference among the three sub-regions. Strongnegative sensitivity coefficients indicated that increases inrelative humidity greatly reduce the evapotranspiration po-tential. Similar results are obtained in previous studies,where relative humidity is a major limiting factor. Zengand Heilman (1997) conclude that the impact of climatechange may be minimal if warming is accompanied by higherhumidity. Daily variation patterns of SRS were very similarthroughout the basin; minimum and maximum values werefound in winter and summer, respectively (Fig. 3d). Likeair temperature, the sensitivity coefficient for shortwaveradiation also showed a pronounced seasonal cycle, similarto the seasonal cycle of the measured shortwave radiation.A decrease in the energetic term appeared to be associatedwith an increased significance of the aerodynamic term,which led to the decrease of the sensitivity coefficientsfor the shortwave radiation corresponded to an increase inthe sensitivity coefficient for the wind speed at the end of

0 50 100 150 200 250 300 350
0.2
0.3
0.4
0.5
0.6
0.7
Day
ST
A
0 50 100 150 200 250 300 3500
0.05
0.1
0.15
0.2
Day
SW
D
0 50 100 150 200 250 300 350
–1.5
–1
–0.5
Day
SH
D
0 50 100 150 200 250 300 3500.2
0.4
0.6
0.8
Day
SR
S
0 50 100 150 200 250 300 3500
0.2
0.4
0.6
0.8
1
Day
Sen
sitiv
ity c
oeffi
cien
ts
L
U
M
L
U
ML
U
M
L
U
M
TA
HD
WD
RS
(a)
(e)
(d)(c)
(b)
Figure 3 Mean daily sensitivity coefficients for air temperature (STA) (a), wind speed (SWD) (b), relative humidity (SHD) (c) andshortwave radiation (SRS) (d) in the upper (U), middle (M) and lower (L) regions of Changjiang basin. (e) Comparison of mean dailysensitivity coefficients for major climatic variables in the whole Changjiang basin (SHD is multiplied by �1 to facilitate visualcomparison).
Sensitivity of the Penman–Monteith reference evapotranspiration to key climatic variables in the Changjiang basin 625
the year. Similar findings were reported elsewhere (Saxton,1975; Beven, 1979; Rana and Katerji, 1998; Hupet and Vanc-looster, 2001). STA and SRS had a similar pattern while oppo-site patterns were found for SHD and SWD. In general,relative humidity was the most sensitive variable at the dai-ly scale. In winter, a 10% change in HD could cause approx-imately a 15% change in ETref in the lower region. Shortwaveradiation and air temperature were less influential to ETref,and their sensitivities were similar to each other. Similarlyto other studies (e.g., McKenney and Rosenberg, 1993; Leyet al., 1994), we found wind speed to be the least sensitivevariable in all regions throughout the year.
Spatial distribution of monthly and yearlysensitivity coefficients
A large spatial variability was found for the monthly sensitiv-ity coefficients for all climatic variables. As an example,opposite spatial patterns for SWD in March and Septemberare shown in Fig. 4. After mapping the spatial distributionsof average yearly sensitivity coefficients for TA, WD, HDand RS (Fig. 5a–d) we found (1) increasing trends exist fromupper to lower region for STA and SHD; (2) opposite spatialpatterns are for SWD and SRS. The magnitude of spatial vari-
ations of SWD and SRS were relatively small compared tothe other two variables; (3) the rank of the average yearlysensitivity coefficient throughout the basin was the sameas the daily are.
Air temperature and relative humidity were expected tobe more influential in the lower region than in the rest ofthe basin (Figs. 2 and 3). Since all climatic variables exceptwind speed in the middle and lower regions did not have anysignificant regional variations (Fig. 2), the spatial variabilityof sensitivity coefficients there could be explained by thelarge variability of wind speed (Fig. 2). In fact, strong posi-tive spatial correlation between WD and SHD (0.80 and 0.88)and negative correlation between WD and SRS (�0.62 and�0.67) were found in the middle and lower regions,respectively.
Predictive power for a one-at-a-time perturbationof variables
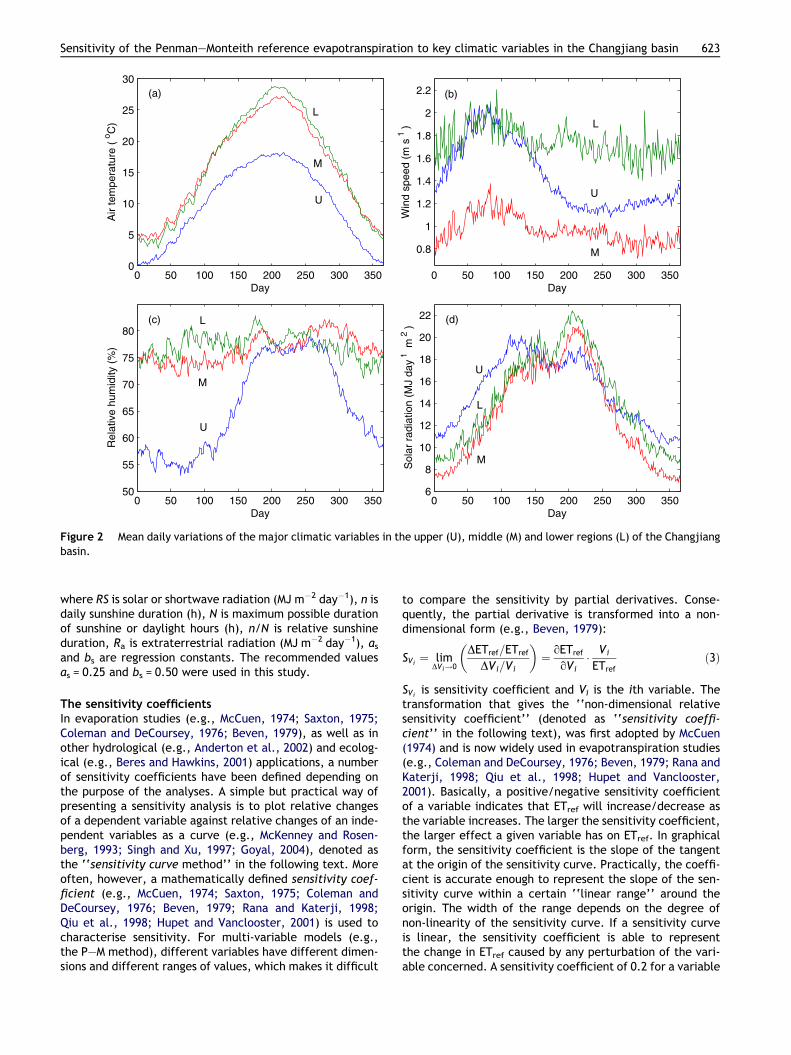
Results for January and July are presented in Fig. 6 for illus-trative purpose. A large slope of the transmitting curve indi-cates a limited predictive power of sensitivity coefficient.For example, for the lower region in July, a transmittingfactor of 0.65, rather than the sensitivity coefficient of

Figure 4 Spatial distributions of sensitivity coefficients for wind speed in March (left) and September (right).
Figure 5 Spatial distribution of mean yearly sensitivity coefficients for air temperature (STA), wind speed (SND), relative humidity(SHD) and shortwave radiation (SRS) in Changjiang basin.
626 L. Gong et al.
0.62, should be used to transform the 20% relative change ofclimatic variables to the relative change of ETref (Fig. 6b).The predictive power of the sensitivity coefficient of windspeed in January was also somewhat limited. The predictivepower of the sensitivity coefficient of shortwave radiationwas not influenced by the magnitude of the relative change.In general, sensitivity coefficients work as well as transmit-ting factors within a reasonable range of perturbation. Theerrors brought by the non-linearity of the sensitivity curve,as showed in Fig. 6, were much smaller compared to sea-sonal and regional variations of the sensitivity coefficients.
However, for some specific region/season and for certainvariables such as air temperature in the summer in the low-er region, inappropriate use of sensitivity coefficients mightcause a significant underestimation of ETref under a largetemperature perturbation.
Predictive power for co-perturbation of variables
Results showed that the predictive power of the sensitivitycoefficient for co-perturbation of variables increased fromthe lower to the upper region (Fig. 7). This might be due
0% 10% 20%
0.2
0.25
0.3
0.35
0.4
STA
, January
0% 10% 20%
0.35
0.4
0.45
0.5
0.55
0.6
0.65
0.7
STA
, July
0% 10% 20%0.12
0.13
0.14
0.15
0.16
0.17
0.18
SWD
, January
0% 10% 20%0
0.01
0.02
0.03
0.04
0.05
SWD
, July
–20% –10% 0% 10% 20%
–0.2
–0.3
–0.4
–0.5
–0.6
–0.7
–0.8
–0.9
Relative changes
Tra
nsm
ittin
g fa
ctor
SHD
, January
–20% –10% 0% 10% 20%–0.44
–0.42
–0.4
–0.38
–0.36
–0.34
–0.32
–0.3
SHD
, July
–20% –10% 0% 10% 20%
0.285
0.29
0.295
0.3
0.305
0.31
0.315
0.32
SRS
, January
–20% –10%
–20% –10%–20% –10%–20% –10%–20% –10%
0% 10% 20%0.7
0.71
0.72
0.73
0.74
0.75
0.76
SRS
, July
M
L
U(a)
(h)
(g)
(f)(e)
(d)(c)(b)
Figure 6 Transmitting curves of January and July for each climatic variable and each region of the basin. Solid, dashed and dash-dotted lines stand for upper, middle and lower regions, respectively.
Sensitivity of the Penman–Monteith reference evapotranspiration to key climatic variables in the Changjiang basin 627
to the fact that inter-dependence among the climatic vari-ables in the upper region is limited by the relatively low tem-perature and humidity. Although the plots get more scatterin the middle and lower regions, R2 values were still quitesatisfactory, and the plots showing the average regional re-sults (Fig. 7f, i) indicated that no significant systematic devi-ation was found from the actual perturbation for theestimated perturbation of ETref by sensitivity coefficient.
It appears that the non-dimensional relative sensitivitycoefficient (SVi
) could give satisfactory prediction of theETref response of the perturbation of one or more climaticvariables in the Changjiang basin, although the predictionaccuracy may vary with variable, region and season. Themethod had an advantage over the sensitivity-curve methodby its explicitly defined mathematical formulation, and alsoby its convenience in spatial graphic presentation.
Summary and conclusions
Sensitivities of reference evapotranspiration to four majorclimatic variables were studied in the Changjiang (YangtzeRiver) basin using a 41-year dataset. The basin was dividedinto three sub-regions with distinct geographic and climaticconditions, which gave rise to large spatial and temporal
variations of sensitivity. Long-term average sensitivitieswere mapped regionally. The study showed that relativehumidity was the most sensitive variable in general for thebasin, followed by shortwave radiation and air temperature,which had similar sensitivities. Wind speed has the least im-pact. In the middle and lower regions, the spatial variationsof sensitivities to air temperature, relative humidity andshortwave radiation were determined to a large extent bythe large spatial variability of the wind speed.
The results of this work can be used as a theoretical basisfor future research on the response of reference evapo-transpiration to climatic change. The large spatial-temporalvariability of the sensitivity coefficients indicated that theETref response to climate change will differ with regionand season. Generally, the non-dimensional relative sensi-tivity coefficient (SVi
) gave satisfactory prediction of theETref response to a perturbation of one or more climaticvariables.
Acknowledgements
The authors thank the National Climate Center of Chinaor providing the climatic data. The Outstanding Overseas

–20% –10% 0% 10% 20%–20%
–10%
0%
10%
20%
–20% –10% 0% 10% 20%–20%
–10%
0%
10%
20%
–20% –10% 0% 10% 20%–20%
–10%
0%
10%
20%
–20% –10% 0% 10% 20%–20%
–10%
0%
10%
20%
–20% –10% 0% 10% 20%–20%
–10%
0%
10%
20%
–20% –10% 0% 10% 20%–20%
–10%
0%
10%
20%
–20% –10% 0% 10% 20%–20%
–10%
0%
10%
20%
Actual relative changes of ETref
Est
imat
ed r
elat
ive
chan
ges
of E
Tre
f
–20% –10% 0% 10% 20%–20%
–10%
0%
10%
20%
–20% –10% 0% 10% 20%–20%
–10%
0%
10%
20%
R2=0.99
R2=0.92 R2=0.99R2=0.92
R2=0.99R2=0.97R2=0.97
R2=0.99R2=0.99
Zhongdian,upper region
Mean,lower region
Jingzhou,lower region
Shuangfeng,lower region
Mean,middle region
Emeishan,middle region
Kuaize,middle region
Mean,upper region
Dege,upper region
(a)
(h)(g)
(f)(e)(d)
(c)(b)
(i)
Figure 7 Predictive power of the sensitivity coefficients under simultaneous co-perturbation of variables. a, b, d, e, g, h: show theplot of actual vs. estimated perturbation of ETref of two randomly selected stations from upper, middle and lower parts of the basin,respectively. c, f, i: show the mean condition for the three regions.
628 L. Gong et al.
Chinese Scholar Fund of the Chinese Academy of Sciences,the Research Grants Council of the Hong Kong SpecialAdministrative Region, China (Project No. CUHK4247/03H), and the key project (KZCX3-SW-331) of the ChineseAcademy of Sciences jointly funded field work and datagathering in the Yangtze river and an exchange visit inChina. The Swedish Research Council (VR), the SwedishFoundation for International Cooperation in Research andHigh Education (STINT), the Chinese Ministry of Scienceand Technology, the Swedish International DevelopmentCooperation Agency (Sida) and the China MeteorologicalAdministration partly supported the research (CCSF2005-2-QH02). The authors thank the two anonymous reviewersfor their detailed and constructive comments, whichimproved the quality of the paper greatly.
Appendix A. Supplementary data
Supplementary data associated with this article can befound, in the online version, at doi:10.1016/j.jhydrol.2006.03.027.
References
Allen, R.G., Pereira, L.S., Raes, D., Smith, M., 1998. Cropevapotranspiration – guidelines for computing crop waterrequirements – FAO Irrigation and Drainage Paper 56. FAO,1998. ISBN 92-5-104219-5.
Anderton, S., Latron, J., Gallart, F., 2002. Sensitivity analysis andmulti-response, multi-criteria evaluation of a physically baseddistributed model. Hydrological Processes 16, 333–353.doi:10.1002/hyp.336.
Beres, D.L., Hawkins, D.M., 2001. Plackett–Burman technique forsensitivity analysis of many-parametered models. EcologicalModelling 141, 171–183.
Beven, K., 1979. A sensitivity analysis of the Penman–Monteithactual evapotranspiration estimates. Journal of Hydrology 44,169–190.
Blaney, H.F., Criddle, W.D., 1950. Determining Water Require-ments in Irrigated Area from Climatological Irrigation Data, USDepartment of Agriculture, Soil Conservation Service, TechicalPaper No. 96, p. 48.
Burgman, M.A., Ferson, S., Akcakaya, H.R., 1993. Risk Assessmentin Conservation Biology. Chapman & Hall, London, p. 314.
Chen, D., Gao, G., Xu, C.-Y., Gao, J., Ren, G., 2005. Comparison ofThornthwaite method and Pan data with the standard Penman–

Sensitivity of the Penman–Monteith reference evapotranspiration to key climatic variables in the Changjiang basin 629
Monteith estimates of potential evapotranspiration for China.Climate Research 28, 123–132.
Coleman, G., DeCoursey, D.G., 1976. Sensitivity and modelvariance analysis applied to some evaporation and evapotrans-piration models. Water Resource Research 12 (5), 873–879.
Droogers, P., Allen, R.G., 2002. Estimating reference evapotrans-piration under inaccurate data conditions. Irrigation and Drain-age Systems 16, 33–45.
Dyck, S. 1983. Overview on the present status of the concepts ofwater balance models. New Approaches in Water BalanceComputations. In: Van der Beken, A., Herrmann, A. (Eds.),Proceedings of the Hamburg Workshop, IAHS Publication No.148, pp. 3–19.
Goyal, R.K., 2004. Sensitivity of evapotranspiration to globalwarming: a case study of arid zone of Rajasthan (India).Agricultural Water Management 69, 1–11.
Guitjens, J.C., 1982. Models of Alfalfa Yield and Evapotranspira-tion. Journal of the Irrigation and Drainage Division, Proceedingsof the American Society of Civil Engineers 108(IR3), pp. 212–222.
Harbeck, Jr., G.E., 1962. A Practical Field Technique for MeasuringReservoir Evaporation Utilizing Mass-transfer Theory, US Geo-logical Survey, Paper 272-E, pp. 101–105.
Hobbins, M.T., Ramirez, J.A., Brown, T.C., 2001a. The comple-mentary relationship in estimation of regional evapotranspira-tion: an enhanced advection-aridity model. Water ResourceResearch 37 (5), 1389–1403.
Hobbins, M.T., Ramirez, J.A., Brown, T.C., Claessens, L.H.J.M.,2001b. The complementary relationship in estimation of regionalevapotranspiration: the complementary relationship arealevapotranspiration and advection-aridity models. WaterResource Research 37 (5), 1367–1387.
Hupet, F., Vanclooster, M., 2001. Effect of the sampling frequencyof meteorological variables on the estimation of the referenceevapotranspiration. Journal of Hydrology 243, 192–204.
Ley, T.W., Hill, R.W., Jensen, D.T., 1994. Errors in Penman–Wrightalfalfa reference evapotranspiration estimates: I. Model sensi-tivity analysis. Transactions American Society of AgriculturalEngineers 37 (6), 1853–1861.
McCuen, R.H., 1974. A sensitivity and error analysis of proceduresused for estimating evaporation. Water Resource Bulletin 10 (3),486–498.
McKenney, M.S., Rosenberg, N.J., 1993. Sensitivity of somepotential evapotranspiration estimation methods to climatechange. Agricultural and Forest Meteorology 64, 81–110.
Penman, H.L., 1948. Natural evaporation from open water, baresoil and grass. Proceedings of the Royal Society of London 193,120–145.
Priestley, C.H.B., Taylor, R.J., 1972. On the assessment of thesurface heat flux and evaporation using large-scale parameters.Monthly Weather Review 100, 81–92.
Qiu, G., Yanob, T., Momiic, K., 1998. An improved methodology tomeasure evaporation from bare soil based on comparison ofsurface temperature with a dry soil surface. Journal of Hydrol-ogy 210, 93–105.
Rana, G., Katerji, N., 1998. A measurement based sensitivityanalysis of the Penman–Monteith actual evapotranspirationmodel for crops of different height and in contrasting waterstatus. Theoretical and Applied Climatology 60, 141–149.
Saxton, K.E., 1975. Sensitivity analysis of the combination evapo-transpiration equation. Agricultural and Meteorology 15, 343–353.
Singh, V.P., Xu, C.-Y., 1997. Sensitivity of mass transfer-basedevaporation equations to errors in daily and monthly input data.Hydrological Processes 11, 1465–1473.
Thornthwaite, C.W., 1948. An approach toward a rational classifi-cation of climate. Geographical Review 38, 55–94.
Xu, Z.X., Li, J.Y., 2003. A distributed approach for estimating basinevapotranspiration: comparison of the combination equationand the complementary relationship approaches. HydrologicalProcess 17, 1509–1523.
Xu, C.-Y., Singh, V.P., 2002. Cross-comparison of empirical equa-tions for calculating potential evapotranspiration with data fromSwitzerland. Water Resources Management 16, 197–219.
Xu, C.-Y., Singh, V.P., 2005. Evaluation of three complementaryrelationship evapotranspiration models by water balanceapproach to estimate actual regional evapotranspiration indifferent climatic regions. Journal of Hydrology 308, 105–121.
Xu, C.-Y., Gong, L., Jiang, T., Chen, D., Singh, V.P., 2006a. Analysisof spatial distribution and temporal trend of reference evapo-transpiration in Changjiang (Yangtze River) basin. Journal ofHydrology, in press.
Xu, C.-Y., Gong, L., Jiang, T., Chen, D., 2006b. Decreasingreference evapotranspiration in a warming climate – a case ofChangjiang (Yangtze River) catchment during 1970–2000.Advances in Atmospheric Sciences, in press.
Zeng, W., Heilman, J.L., 1997. Sensitivity of evapotranspiration ofcotton and sorghum in west Texas to changes in climate andCO2. Theoretical and Applied Climatology 57 (3–4), 245–254.