Water Balance and Evapotranspiration Monitoring in Geotechnical and Geoenvironmental Engineering
16
ORIGINAL PAPER Water Balance and Evapotranspiration Monitoring in Geotechnical and Geoenvironmental Engineering Yu-Jun Cui Jorge G. Zornberg Received: 21 July 2005 / Accepted: 19 September 2007 Ó Springer Science+Business Media B.V. 2008 Abstract Among the various components of the water balance, measurement of evapotranspiration has probably been the most difficult component to quantify and measure experimentally. Some attempts for direct measurement of evapotranspiration have included the use of weighing lysimeters. However, quantification of evapotranspiration has been typi- cally conducted using energy balance approaches or indirect water balance methods that rely on quanti- fication of other water balance components. This paper initially presents the fundamental aspects of evapotranspiration as well as of its evaporation and transpiration components. Typical methods used for prediction of evapotranspiration based on meteoro- logical information are also discussed. The current trend of using evapotranspirative cover systems for closure of waste containment facilities located in arid climates has brought renewed needs for quantification of evapotranspiration. Finally, case histories where direct or indirect measurements of evapotranspiration have been conducted are described and analyzed. Keywords Evapotranspiration Water balance Cover system Unsaturated soils Measurement 1 Introduction The interaction between ground surface and the atmosphere has not been frequently addressed in geotechnical practice. Perhaps the applications where such evaluations have been considered the most are in the evaluation of landslides induced by loss of suction due to precipitations (e.g., Alonso et al. 1995; Shimada et al. 1995; Cai and Ugai 1998; Fourie et al. 1998; Rahardjo et al. 1998). Yet, the quantification and measurement of evapotranspiration has recently received renewed interest. This is the case, for example, due to the design of evapotranspirative cover systems for waste containment and mining sites. In cases like this, quantification of the flow boundary condition at the earth-atmosphere interface becomes an integral aspect of the analysis and design of the geotechnical system. Paradoxically, examination of the atmospheric water balance in different regions through the world has shown that evapotranspiration often exceeds precipitation (Blight 1997). This is the case of arid or semi-arid regions over most of the year as well as of most regions with temperate climate over long portion of the year. Recent assessment on hazards caused by droughts showed that the evapotranspiration is an Y.-J. Cui (&) ENPC, 6 et 8 av. Blaise Pascal, Cite ´ Descartes, Champs-sur-Marne, 77455 Marne La Vallee cedex 2, France e-mail: [email protected] J. G. Zornberg The University of Texas, Austin, TX, USA 123 Geotech Geol Eng DOI 10.1007/s10706-008-9198-z
Transcript of Water Balance and Evapotranspiration Monitoring in Geotechnical and Geoenvironmental Engineering
ORIGINAL PAPER
Water Balance and Evapotranspiration Monitoringin Geotechnical and Geoenvironmental Engineering
Yu-Jun Cui Æ Jorge G. Zornberg
Received: 21 July 2005 / Accepted: 19 September 2007
� Springer Science+Business Media B.V. 2008
Abstract Among the various components of the
water balance, measurement of evapotranspiration
has probably been the most difficult component to
quantify and measure experimentally. Some attempts
for direct measurement of evapotranspiration have
included the use of weighing lysimeters. However,
quantification of evapotranspiration has been typi-
cally conducted using energy balance approaches or
indirect water balance methods that rely on quanti-
fication of other water balance components. This
paper initially presents the fundamental aspects of
evapotranspiration as well as of its evaporation and
transpiration components. Typical methods used for
prediction of evapotranspiration based on meteoro-
logical information are also discussed. The current
trend of using evapotranspirative cover systems for
closure of waste containment facilities located in arid
climates has brought renewed needs for quantification
of evapotranspiration. Finally, case histories where
direct or indirect measurements of evapotranspiration
have been conducted are described and analyzed.
Keywords Evapotranspiration � Water balance �Cover system � Unsaturated soils �Measurement
1 Introduction
The interaction between ground surface and the
atmosphere has not been frequently addressed in
geotechnical practice. Perhaps the applications where
such evaluations have been considered the most are
in the evaluation of landslides induced by loss of
suction due to precipitations (e.g., Alonso et al. 1995;
Shimada et al. 1995; Cai and Ugai 1998; Fourie et al.
1998; Rahardjo et al. 1998). Yet, the quantification
and measurement of evapotranspiration has recently
received renewed interest. This is the case, for
example, due to the design of evapotranspirative
cover systems for waste containment and mining
sites. In cases like this, quantification of the flow
boundary condition at the earth-atmosphere interface
becomes an integral aspect of the analysis and design
of the geotechnical system.
Paradoxically, examination of the atmospheric
water balance in different regions through the world
has shown that evapotranspiration often exceeds
precipitation (Blight 1997). This is the case of arid or
semi-arid regions over most of the year as well as of
most regions with temperate climate over long portion
of the year. Recent assessment on hazards caused by
droughts showed that the evapotranspiration is an
Y.-J. Cui (&)
ENPC, 6 et 8 av. Blaise Pascal,
Cite Descartes, Champs-sur-Marne,
77455 Marne La Vallee cedex 2, France
e-mail: [email protected]
J. G. Zornberg
The University of Texas, Austin, TX, USA
123
Geotech Geol Eng
DOI 10.1007/s10706-008-9198-z
important phenomenon that should be accounted for in
natural hazards analysis. In France, the extensive
drought from 1989 to 1990 affected shallowly founded
buildings of 216 communes in 17 departments (Van-
dangeon 1992). In the decree of November 1, 2005
(French Official Journal 1.2), more than 870 com-
munes were considered affected by the 2003 drought.
In other countries, a number of case studies involving
the effect of prolonged periods of evapotranspiration
were performed (Driscoll 1983; Biddle 1983; Williams
and Pidgeon 1983; Ravina 1983; Holtz 1983; Gao
1995; Allman et al. 1998). It is now recognized that
hazards related to droughts have an important eco-
nomical impact, and deserve additional research.
In addition to the geotechnical engineering prob-
lems associated with the changes in mechanical
properties of soil induced by infiltration and evapo-
transpiration, current advances in geoenvironmental
engineering have often focused on the effect of
infiltration and evapotranspiration on the hydraulic
properties of soils. Quantification of evapotranspira-
tion has been particularly relevant for the design of
cover systems, which is one of the key engineered
components of municipal and hazardous waste land-
fills as well as mine disposal sites. The cover system
should be designed to minimize percolation of rain-
water into the waste and prevent leachate generation
that may lead to environmental contamination of soil
and groundwater. A conventional ‘‘resistive barrier’’
type cover system involves a liner (e.g., a compacted
clay layer) constructed with a low saturated hydraulic
conductivity (typically 10-9 m/s or less) to reduce
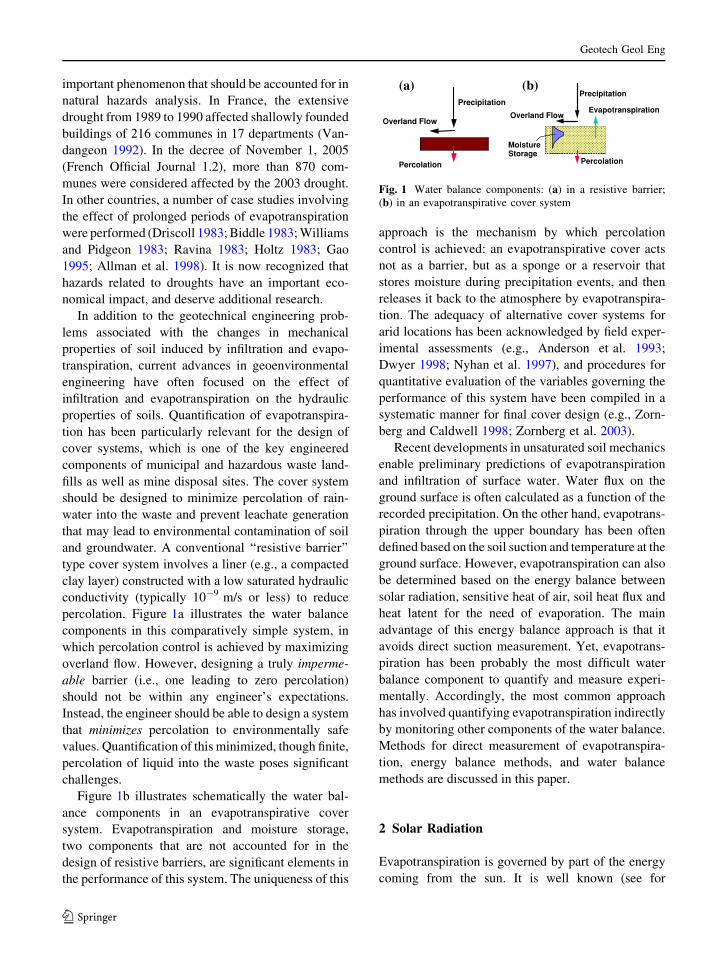
percolation. Figure 1a illustrates the water balance
components in this comparatively simple system, in
which percolation control is achieved by maximizing
overland flow. However, designing a truly imperme-
able barrier (i.e., one leading to zero percolation)
should not be within any engineer’s expectations.
Instead, the engineer should be able to design a system
that minimizes percolation to environmentally safe
values. Quantification of this minimized, though finite,
percolation of liquid into the waste poses significant
challenges.
Figure 1b illustrates schematically the water bal-
ance components in an evapotranspirative cover
system. Evapotranspiration and moisture storage,
two components that are not accounted for in the
design of resistive barriers, are significant elements in
the performance of this system. The uniqueness of this
approach is the mechanism by which percolation
control is achieved: an evapotranspirative cover acts
not as a barrier, but as a sponge or a reservoir that
stores moisture during precipitation events, and then
releases it back to the atmosphere by evapotranspira-
tion. The adequacy of alternative cover systems for
arid locations has been acknowledged by field exper-
imental assessments (e.g., Anderson et al. 1993;
Dwyer 1998; Nyhan et al. 1997), and procedures for
quantitative evaluation of the variables governing the
performance of this system have been compiled in a
systematic manner for final cover design (e.g., Zorn-
berg and Caldwell 1998; Zornberg et al. 2003).
Recent developments in unsaturated soil mechanics
enable preliminary predictions of evapotranspiration
and infiltration of surface water. Water flux on the
ground surface is often calculated as a function of the
recorded precipitation. On the other hand, evapotrans-
piration through the upper boundary has been often
defined based on the soil suction and temperature at the
ground surface. However, evapotranspiration can also
be determined based on the energy balance between
solar radiation, sensitive heat of air, soil heat flux and
heat latent for the need of evaporation. The main
advantage of this energy balance approach is that it
avoids direct suction measurement. Yet, evapotrans-
piration has been probably the most difficult water
balance component to quantify and measure experi-
mentally. Accordingly, the most common approach
has involved quantifying evapotranspiration indirectly
by monitoring other components of the water balance.
Methods for direct measurement of evapotranspira-
tion, energy balance methods, and water balance
methods are discussed in this paper.
2 Solar Radiation
Evapotranspiration is governed by part of the energy
coming from the sun. It is well known (see for
Precipitation
Percolation
Overland Flow
(a) Precipitation
Evapotranspiration
Percolation
Overland Flow
MoistureStorage
(b)
Fig. 1 Water balance components: (a) in a resistive barrier;
(b) in an evapotranspirative cover system
Geotech Geol Eng
123
instance Pidwirny 2006) that the emission rate of the
sun is estimated as 63 million W/m2. However, as this
radiation travels away from the sun, the amount that
strikes another object depends on its distance from the
sun. The portion that reaches the earth’s atmosphere is
called the solar constant (approximately 1380 W/m2).
Once solar radiation reaches the top of the atmo-
sphere, it is absorbed, scattered, or transmitted
through the atmosphere. Since 30% is scattered back
to space (earth’s albedo), the earth’s atmosphere only
receives 70% of the incoming (incident) radiation.
Of the 70% radiation that is transmitted through
the atmosphere, 19% get absorbed by gases, primarily
molecular oxygen and ozone. The remaining 51% is
transmitted to the earth’s surface. The solar constant
can be used to calculate the possible limit to daily
evapotranspiration. Specifically, assuming that (i)
51% energy flux (i.e. 704 W/m2) is used for evapo-
ration of pure water (it is of course not the case as
discussed subsequently), (ii) the solar power is
parabolically distributed during the day, and (iii)
from zero at dawn to zero at sunset, the albeto is 15%
(the value can be vary variable according to the soil
surface nature, from 5% to 50% in most cases), the
maximum solar energy needed to produce evapora-
tion is 17.2 MJ/m2 for a 12 h day (i.e. 2/3 9 704 9
0.85 9 12 9 3600 = 17233917 J/m2). The latent
heat of evaporation of water is about 2.47 MJ/kg
and hence the maximum possible evapotranspiration
6.9 mm of water (i.e. 17.234/2.47 = 6.9 kg water/m2).
The balance at the earth’s surface between
incoming and outgoing components of radiant energy
is characterized by the net radiation Rn (W/m2):
Rn ¼ Sþ Dð Þ 1� að Þ þ Ldown � Lup
� �ð1Þ
where S (W/m2) is the direct shortwave radiation
corresponding to the shortwave radiation penetrating
directly to the surface without being affected by the
atmosphere constituents; D (W/m2) is the diffuse
shortwave radiation corresponding to the shortwave
radiation scattered or diffused by atmosphere con-
stituents (clouds, dust etc.); a is the albedo
corresponding to the proportion of radiation reflected
from the ground surface, governed primarily by
surface color and incitation angle of the sun; Lup (W/
m2) is the terrestrial radiation corresponding to the
longwave radiation emitted by the earth’s surface;
Ldown (W/m2) is the atmospheric counter radiation
corresponding to the longwave radiation emitted by
the atmosphere directed towards the surface. The
magnitudes of Lup and Ldown depend on the temper-
ature of the emitting body.
3 Soil Water Balance
The soil water balance can be represented as follows:
P� Int þ Roffð Þ ¼ ET þ Rwt þ DS ð2Þ
where P (mm/day) is precipitation; Int (mm/day) is
interception; Roff (mm/day) is the runoff on ground
surface; ET (mm/day) is evapotranspiration; Rwt
(mm/day) is the water recharged to the water table;
DS is the change in soil water storage.
Interception corresponds to the storage of water
above the ground surface, mostly in vegetation. It is
usually negligible but can reduce precipitation inten-
sity in case of dense forest canopy. The term (Rwt + S)
represents the water infiltration I, therefore:
I ¼ Rwt þ Sð Þ ¼ P� Int þ ET þ Roffð Þ ð3ÞIn soil water balance, the evapotranspiration term
ET is governed by the energy and mass exchanges
between soil and atmosphere. It is discussed in more
detail in Sect. 4.
4 Evapotranspiration
Evapotranspiration is composed of the direct evapo-
ration, which takes place from the soil surface, and of
the transpiration from vegetation. The roots of
vegetation capture soil water, part of which evapo-
rates through the stomata (micropores) of the leaves,
while the rest is used for photosynthesis. Evapotrans-
piration depends on two elements: the heat supplied
by solar radiation and the water available in the soil.
While the quantity of solar energy reaching the
ground surface is approximately constant, evapo-
transpiration is very sensitive to the climate
variations and plant characteristics.
4.1 Evaporation
Evaporation involves the change in water state from
liquid to water vapor due to an increase of water
kinetic energy. During evaporation, hydrogen bonds
Geotech Geol Eng
123
are broken and water vapor is diffused from regions
of higher to lower vapor pressure, i.e., from the
ground surface to the surrounding air. Water vapor
consists entirely of free water molecules, while liquid
water consists of both free and bonded molecules.
Evaporation from soils is an important phenome-
non that should be quantified in order to define the
surface flux boundary condition in an unsaturated flow
analysis. Evaluation methods based on either soil
water balance or experimental characterization have
been proposed by Philip (1957), Gardner and Hillel
(1962), Gardner (1973), Brutsaert (1982), Boast
(1986), Evett et al. (1994), Wilson et al. (1994,
1999) and Raghuywanshi and Wallender (1998).
Evaporative processes are typically modeled isother-
mally. This is a simplified analysis because thermally
induced flow of water through unsaturated soil may
also occur by vapor diffusion. A more realistic
evaporation analysis requires consideration of thermal
effects. The phenomenon of thermally induced water
flow was investigated by Milly (1996) and Kampf and
Von der Hude (1995). Heat flux phenomena in soils
that lead to thermally induced flow was also investi-
gated by Qualls and Brutsaert (1996a, b). Fischer
et al. (1996) modeled soil vapor extraction, and
compared experimental data to calculation results.
Additional discussion on surface flux boundary con-
ditions was provided by Wilson (1997, 2000).
Evaporation rate is governed by several factors, as
follows (see Dingman 1994):
(1) General factors, including: (i) latent heat for
evaporation, the major source of which is the
solar energy so that the distribution of radiation
and evaporation is strongly correlated (maxi-
mum evaporation in the tropics and during the
warmest part of the day); (ii) sensitive heat of
air; (iii) air temperature, which is a measure of
heat energy and of the capacity of air to hold
water vapor (i.e. the saturation vapor pressure
increases with increasing air temperature); (iv)
air humidity, an increase of which causes a
decrease in the rate of evaporation; (v) wind,
which causes eddy (turbulent diffusion) and
thereby maintains the vapor pressure gradient
between air and the evaporation surface (evap-
oration increases dramatically with increasing
turbulence, which is function of wind speed and
surface roughness).
(2) Additional factors controlling the rate of evap-
oration from water bodies, such as water
salinity.
(3) Additional factors controlling the rate of evap-
oration from soil, including: (i) soil water
potential, as the rate of evaporation decreases
significantly as soil dries out; (ii) depth of water
table, as evaporation rate decreases significantly
with increasing depth to the water table to a
critical depth below which groundwater does no
longer affect the evaporation rate, this critical
depth depending on the nature of the soils
involved; (iii) soil color, with greater absorption
of heat and thus evaporation for dark soils
(small albedo); (iv) vegetation, which reduces
evaporation by shading soil, reducing wind at
the ground surface and increasing vapor pres-
sure by transpiring water pressure.
4.2 Transpiration
Transpiration is the evaporation from the vascular
system of plants. Water absorbed by the roots raises
by capillary action to stomata cavities in the leaves,
from where it evaporates. The vapor pressure gradi-
ent between the leaf tissue (and bark, to a lesser
extent) and the surrounding air draws water from soil
into the roots and up the plant through the xylem. As
water evaporates within the leaves tissue, salt can
precipitate and further attract water by osmotic effect.
However, if the soil is saline, the salt concentration
gradient is reversed and water may be even drawn out
of plants.
Water uptake by plants and rooting depth of the
plant cover are another issue of relevance in the
analysis of evapotranspirative covers. Transpiration is
also used as boundary conditions in unsaturated flow
analyses. Ritchie (1972), Ritchie and Burnett (1971),
and Tratch et al. (1995) provide a summary of plant
transpiration in terms that engineers are familiar with.
The combination of evaporation and transpiration
into evapotranspiration has been discussed by Harg-
reaves (1994) and Pereira et al. (1999), and has been
modeled by Chudhury et al. (1986), Levitt et al.
(1996), Xu and Qiu (1997), etc. The ecology of plant
systems used for transpiration has also been a topic of
significant relevance, studied by Anderson et al.
(1987) and Anderson (1997). These studies
Geotech Geol Eng
123
concluded that a diverse group of plant species of
different heights and rooting depths are required for a
stable plant population.
Transpiration from different plants has been eval-
uated by Anderson et al. (1987, 1993), and Waugh
et al. (1991). Wu and Oster (1997) provide details on
several instruments used by agricultural scientists for
management of plants and soil water. Because of the
difficulty in measuring evaporation and transpiration
in the field, a common approach has been to conduct
water balance back calculation using lysimeters.
Nonetheless, Evett (1994) has used time domain
reflectrometry (TDR) to investigate thermal proper-
ties in soil, which is related to the amount of potential
evaporation. Evett (1993) used TDR and neutron
scattering to measure evapotranspiration.
5 Prediction of Evapotranspiration
Numerous predictive methods have been developed
to estimate evapotranspiration, including Penman’s
method, Penman–Monteith’s method, and Turc’s
method (see Guyot 1997 for a comprehensive
review). These methods are based on the concept of
Potential Evapotranspiration (PET). According to
Penman (1948), PET corresponds to the evapotrans-
piration rate from a large area completely and
uniformly covered with growing vegetation which
has unlimited supply of water without advection
(wind) and heat––storage effects. Since evapotrans-
piration depends on the type of vegetation, short grass
was adopted. Penman (1948) proposed the following
equation for PET (kg water/m2/day, i.e. mm/day)
calculation:
PET ¼ 1000DRn=ðqwLvÞ þ cEa
Dþ cð4Þ
where D ¼ 4099Pvs
Tþ237:3ð Þ2 (Pa/�C) is the slope of the curve
of saturated vapor pressure (Pa) versus temperature
(�C) at the prevailing temperature; Ea = 0.165
(Pvs - Pv) (0.8 + u2/100) (mm/day) where Rn is
the net radiation flux (J/(m2day)); qw is water density
(kg/m3); Lv is the latent heat of vaporization of water
(J/kg); c is the psychrometric constant (Pa/�C); Pvs is
the saturated vapor pressure (mbar); Pv is the actual
vapor pressure in air (mbar); u2 is the wind speed
at 2 m elevation (km/day). When wind speed is
measured at elevations other than 2 m, the speed at
2 m can be estimated as:
u2 ¼ uz4:87
ln 67:8z� 5:42ð Þ
� �ð5Þ
where uz is the wind speed at elevation z above the
ground surface. Note that in Penman’s equation, no
vegetation parameters are used even though short
grass is referred to.
6 Measurement of Evapotranspiration
6.1 Direct Measurement
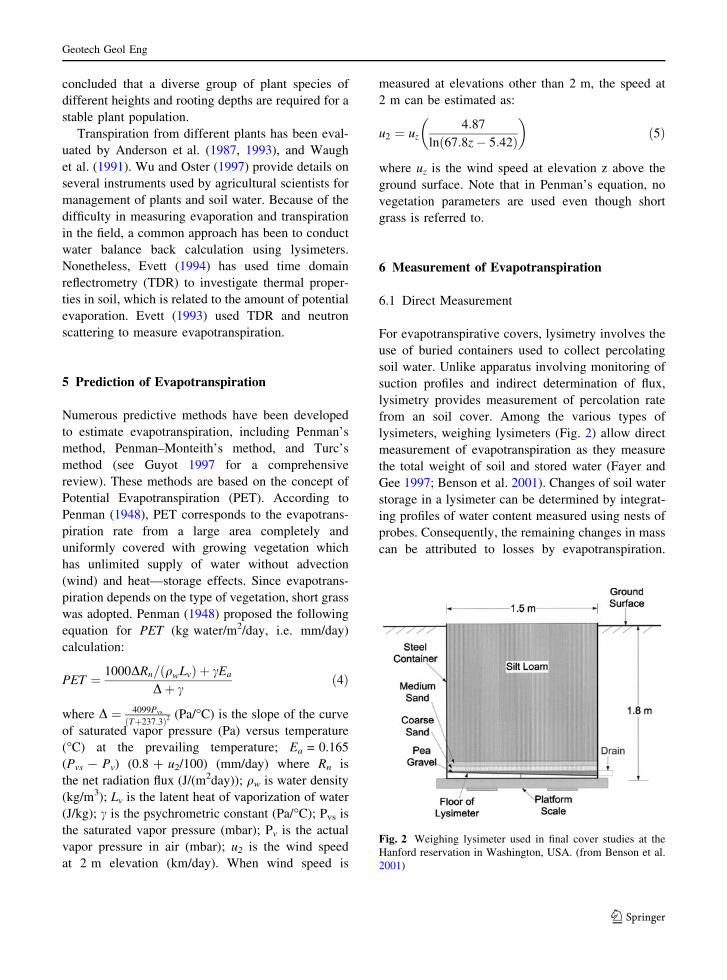
For evapotranspirative covers, lysimetry involves the
use of buried containers used to collect percolating
soil water. Unlike apparatus involving monitoring of
suction profiles and indirect determination of flux,
lysimetry provides measurement of percolation rate
from an soil cover. Among the various types of
lysimeters, weighing lysimeters (Fig. 2) allow direct
measurement of evapotranspiration as they measure
the total weight of soil and stored water (Fayer and
Gee 1997; Benson et al. 2001). Changes of soil water
storage in a lysimeter can be determined by integrat-
ing profiles of water content measured using nests of
probes. Consequently, the remaining changes in mass
can be attributed to losses by evapotranspiration.
Fig. 2 Weighing lysimeter used in final cover studies at the
Hanford reservation in Washington, USA. (from Benson et al.
2001)
Geotech Geol Eng
123
Weighing lysimeters are typically limited to small
test sections (1–2 m2) because of the limited capacity
of scales (Waugh et al. 1991).
6.2 Energy Balance Approach
This approach involves quantification of exchanges
between soil and atmosphere. Specifically, these
exchanges involve energy (heat) and mass exchanges,
mostly by convection. The energy balance in the
earth-atmospheric system can be presented as:
Rn ¼ Le þ H þ G ð6Þ
where Le is the latent energy transfer (positive for
evaporation and negative for condensation); H is the
sensitive heat transfer (positive when energy is used
to warm the air and negative when the air loses
energy due to cooling); G is the ground heat transfer
(positive when energy is transferred to the subsurface
and negative when energy is transferred to the
atmosphere).
There are several methods for evapotranspiration
measurement: eddy correlation, flux profiles, residual
method and Bowen ratio method Kolle (1996).
Consistent with the Bowen ratio method, the sensitive
heat flux within a few meters of the surface, H, can be
expressed as:
H ¼ qaCpkHoT
ozð7Þ
where qa (kg/m3) = 1.2929 (273.13/T (K)) [(P
(mm) - 0.3783 Pv (mm))/760] is air density which
depends on vapor pressure; the value of dry air is
generally considered: qa (kg/m3) = 1.2929 (273.13/T
(K)); Cp is specific heat of air (also the value for dry
air, 1.01 kJ/(kg K), can be generally assumed); T is
temperature (K); z is elevation (m); kH, eddy diffu-
sivity for air. The latent heat flux Le can be expressed
as follows
Le ¼Lvqekv
P
oPv
ozð8Þ
where Lv (kJ/kg) = 2501 - 2.361T (�C) is latent
heat of vaporization; e is the ratio of molecular
weight of water to molecular weight of air
(e = 0.622); kv (m2/s), is eddy diffusivity for vapor;
Pv (kPa) is vapor pressure; P (kPa) is atmospheric
pressure which depends on elevation, as follows
(Wallace and Hobbs 1977):
P ¼ 101:325 1� z
44307:69231
� �5:25328
ð9Þ
In general, kv and kH are not known but are
assumed to be equal (Blight 1997). The ratio of H to
Le is then used to partition the available energy at the
surface into sensitive and latent heat flux. This ratio
was first defined by Bowen (1926), and is known as
the Bowen ratio b:
b ¼ H
Le¼ PCp
LveoT
oPv¼ c
oT
oPvð10Þ
where c = PCp/(Lve) is the psychrometric constant.
Knowing the net radiation flux Rn, the total soil
heat flux G and the Bowen ratio b, the latent heat flux
can be obtained as:
Le ¼Rn � G
1þ bð11Þ
Bowen ratio can be determined by measuring the
temperature T and the vapor pressure Pv at two
elevations: water vapor pressure is often measured
with a single cooled mirror dew point hygrometer
(e.g., Campbell Scientific BR023 1998). Air temper-
ature can be measured using different thermocouples.
For example, Campbell Scientific uses two chrome––
constantan thermocouples. Soil heat flux can be
measured using heat flux plates buried in the soil at a
fixed depth. The plates are typically buried at a depth
of 8 cm (Campbell Scientific 1998). The average
temperature of the soil layer above the plate is
measured using 2–4 thermocouples. The heat flux at
the surface can be calculated by adding the heat flux
measured by the plates to the energy stored in the soil
layer. The storage term is calculated by multiplying
the soil heat capacity Cs by the change in soil
temperature DT over the averaging period t:
S ¼ DTCsd
tð12Þ
where d is the plate depth. The soil heat capacity can
be calculated by adding the specific heat of the dry
soil Cd to that of the soil water Cw:
Cs ¼ qd Cd þ wCwð Þ ¼ qdCd þ hqwCw ð13Þ
where qd and qw are soil dry density (kg/m3) and
water density (kg/m3) respectively; w and h are
gravimetric and volumetric water content respec-
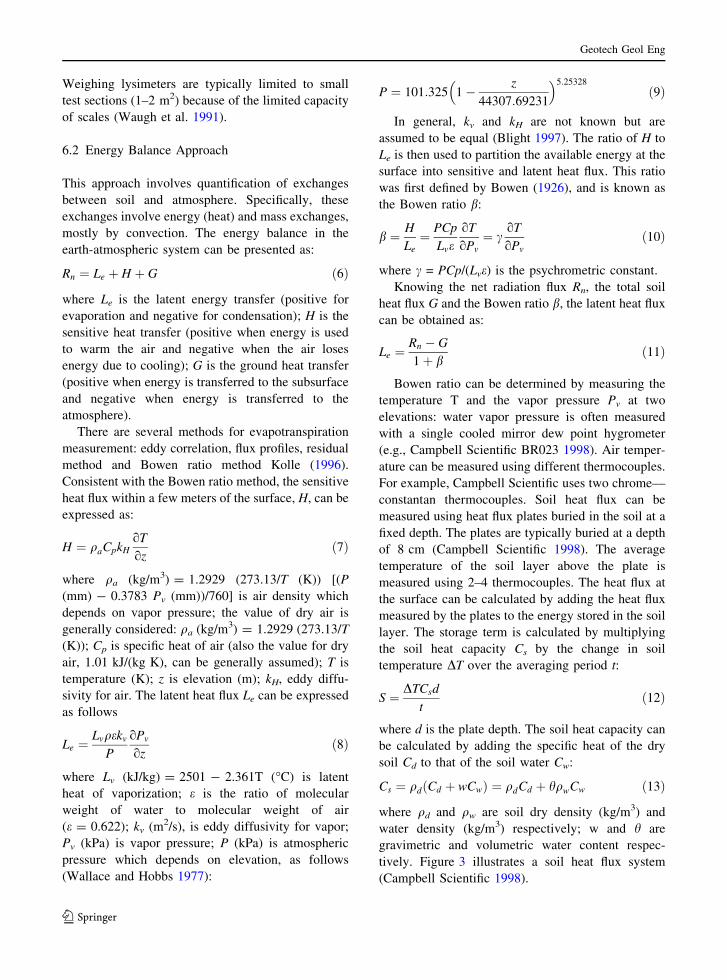
tively. Figure 3 illustrates a soil heat flux system
(Campbell Scientific 1998).
Geotech Geol Eng
123
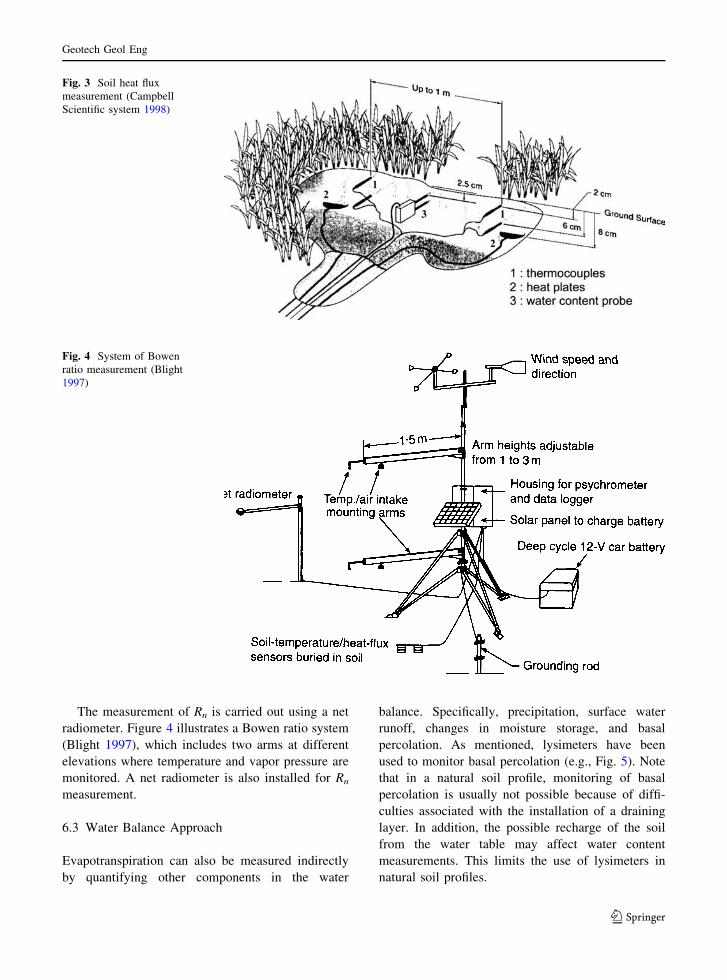
The measurement of Rn is carried out using a net
radiometer. Figure 4 illustrates a Bowen ratio system
(Blight 1997), which includes two arms at different
elevations where temperature and vapor pressure are
monitored. A net radiometer is also installed for Rn
measurement.
6.3 Water Balance Approach
Evapotranspiration can also be measured indirectly
by quantifying other components in the water
balance. Specifically, precipitation, surface water
runoff, changes in moisture storage, and basal
percolation. As mentioned, lysimeters have been
used to monitor basal percolation (e.g., Fig. 5). Note
that in a natural soil profile, monitoring of basal
percolation is usually not possible because of diffi-
culties associated with the installation of a draining
layer. In addition, the possible recharge of the soil
from the water table may affect water content
measurements. This limits the use of lysimeters in
natural soil profiles.
Fig. 3 Soil heat flux
measurement (Campbell
Scientific system 1998)
Fig. 4 System of Bowen
ratio measurement (Blight
1997)
Geotech Geol Eng
123
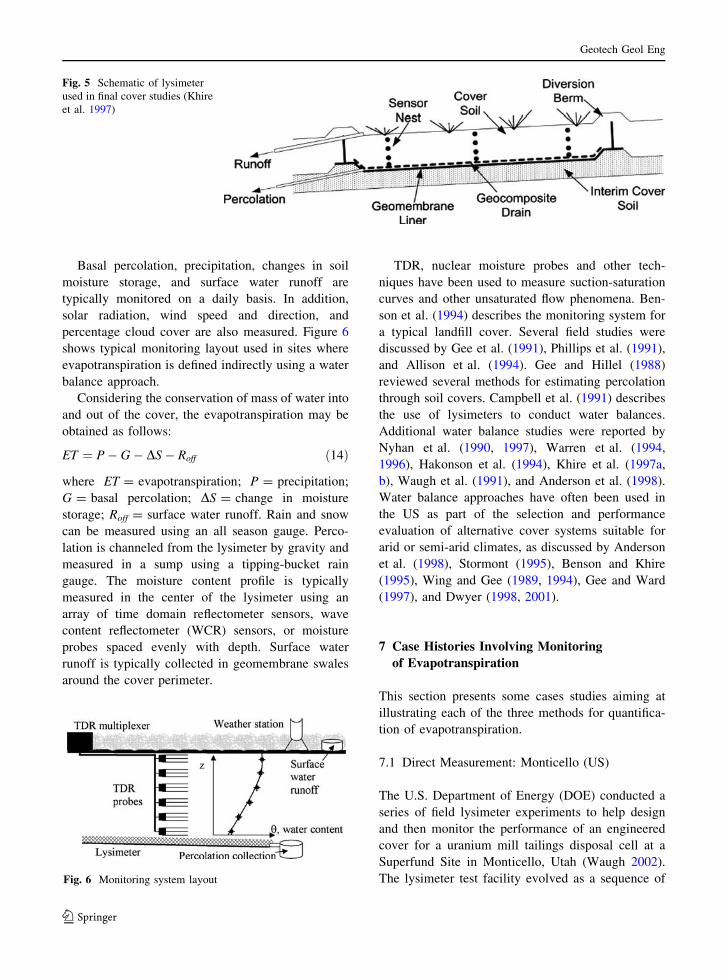
Basal percolation, precipitation, changes in soil
moisture storage, and surface water runoff are
typically monitored on a daily basis. In addition,
solar radiation, wind speed and direction, and
percentage cloud cover are also measured. Figure 6
shows typical monitoring layout used in sites where
evapotranspiration is defined indirectly using a water
balance approach.
Considering the conservation of mass of water into
and out of the cover, the evapotranspiration may be
obtained as follows:
ET ¼ P� G� DS� Roff ð14Þ
where ET = evapotranspiration; P = precipitation;
G = basal percolation; DS = change in moisture
storage; Roff = surface water runoff. Rain and snow
can be measured using an all season gauge. Perco-
lation is channeled from the lysimeter by gravity and
measured in a sump using a tipping-bucket rain
gauge. The moisture content profile is typically
measured in the center of the lysimeter using an
array of time domain reflectometer sensors, wave
content reflectometer (WCR) sensors, or moisture
probes spaced evenly with depth. Surface water
runoff is typically collected in geomembrane swales
around the cover perimeter.
TDR, nuclear moisture probes and other tech-
niques have been used to measure suction-saturation
curves and other unsaturated flow phenomena. Ben-
son et al. (1994) describes the monitoring system for
a typical landfill cover. Several field studies were
discussed by Gee et al. (1991), Phillips et al. (1991),
and Allison et al. (1994). Gee and Hillel (1988)
reviewed several methods for estimating percolation
through soil covers. Campbell et al. (1991) describes
the use of lysimeters to conduct water balances.
Additional water balance studies were reported by
Nyhan et al. (1990, 1997), Warren et al. (1994,
1996), Hakonson et al. (1994), Khire et al. (1997a,
b), Waugh et al. (1991), and Anderson et al. (1998).
Water balance approaches have often been used in
the US as part of the selection and performance
evaluation of alternative cover systems suitable for
arid or semi-arid climates, as discussed by Anderson
et al. (1998), Stormont (1995), Benson and Khire
(1995), Wing and Gee (1989, 1994), Gee and Ward
(1997), and Dwyer (1998, 2001).
7 Case Histories Involving Monitoring
of Evapotranspiration
This section presents some cases studies aiming at
illustrating each of the three methods for quantifica-
tion of evapotranspiration.
7.1 Direct Measurement: Monticello (US)
The U.S. Department of Energy (DOE) conducted a
series of field lysimeter experiments to help design
and then monitor the performance of an engineered
cover for a uranium mill tailings disposal cell at a
Superfund Site in Monticello, Utah (Waugh 2002).
The lysimeter test facility evolved as a sequence of
Fig. 5 Schematic of lysimeter
used in final cover studies (Khire
et al. 1997)
Fig. 6 Monitoring system layout
Geotech Geol Eng
123

installations, first to test the concept of using an
evapotranspirative cover at Monticello, next to eval-
uate the soil–water balance of the final engineered
design, and finally to monitor the hydrologic perfor-
mance of a large facet of the completed disposal cell
cover. Small weighing lysimeters were installing
containing intact, 100-cm-deep profiles of undis-
turbed silt loam soil (monoliths) overlying a pea-
gravel capillary barrier and supporting mature native
grasses. Leaf water potential and leaf transpiration of
plants on and adjacent to the lysimeters were
compared to evaluate the effect of the small weighing
lysimeter design on plant behavior. Because of
favorable monolith lysimeter results, 15 additional
small weighing lysimeters were installed to test the
effects of varying soil types and soil layer thickness
on soil-water balance and water-storage capacity.
This study evolved into the construction of large
caisson lysimeters to evaluate the water balance of
the final cover design for the Monticello disposal cell.
The cover layer constructed inside the caissons
matched as-built engineering parameters for the
actual cover.
Plants growing on and adjacent to the lysimeters
(P. smithii) were sampled to evaluate the effects of
isolating a soil monolith on plant water status.
Predawn leaf water potential values were measured
monthly during the growing season using a pressure
chamber technique (Scholander et al. 1965). Predawn
potential values for P. smithii growing on and
adjacent to the lysimeters were similar early in the
growing season, diverged significantly during the
mid-summer moisture depletion period, and then
reconverged following the late-summer monsoons
(Fig. 7).
Some divergence of predawn potential values for
P. smithii on and adjacent to the lysimeters was
observed, indicating that plants were seasonally more
stressed inside the lysimeters than in the adjacent
plant community. This suggests that small lysimeters
moderately underestimates ET. However, for screen-
ing tests consisting of multiple treatments and
replications, it was concluded that the small lysime-
ters provided reasonable comparisons of the
hydrologic performance of evapotranspirative cover
designs.
Overall, the use of weighing lysimeters allowed
direct quantification of the ET; on the other hand, the
use of small devices may have compromised quan-
tification of flow through macro-fractures as cracks.
Fig. 7 Predawn leaf water
potential values for
P. smithii growing on and
adjacent to the small
monolith lysimeters
between May and
November 1991 and
between May and October
1993 (Waugh 2002)
Geotech Geol Eng
123
The use of large lysimeters (without weighing
capabilities) is discussed in the case history presented
in Sect. 7.3.
7.2 Energy Balance Approach: Boissy-le-Chatel
(France)
In a common meteorology station only data at 2 m
elevation are available and thus the Bowen ratio is
generally not measured. In this case, it is necessary to
use numerical methods to determine Le indirectly.
From a point of view of geotechnical engineering,
knowing Le is essential to subsequently analyze the
soil settlement and slope stability problem due to
evapotranspiration, because it is possible to deter-
mine the variations of soil temperature and water
content using an appropriate method. Cui et al.
(2005) used the two coupled equations (Eq. 15 and
Eq. 16) proposed by Wilson et al. (1994) to calculate
b and determine the temperature and water content
profiles in the soil:
ohW
ot¼ C1
W
o
oykW
ohW
oy
� �þ C2
W
o
oyDV
oPV
oy
� �ð15Þ
with C1W ¼ 1
qW gmW2
and C2W ¼ PþPV
P qWð Þ2gmW2
where
hw = water head; kw = water permeability depending
on the suction; Dv, = vapour diffusivity; Pv = vapour
partial pressure; P = atmospheric pressure; mW2 =
slope of the water retention curve expressed in terms
of volumetric water content versus suction;
y = elevation.
Ch ¼oT
ot¼ o
oykoT
oy
� �� LV
Pþ PV
P
o
oyDV
oPV
oy
� �
ð16Þ
where Ch = soil heat capacity; T = temperature,
t = time; k = soil thermal conductivity. Note that
because of the lack of information, a constant value
of G/H ratio was adopted in the calculation, suggest-
ing that the heat fluxes through soil and air remain
proportional. An initial b value of 0.01 was consid-
ered, enabling the calculation of H and Le from the
energy balance equation (Eq. 6), and thus the
determination of initial upper boundary condition at
the ground surface. The numerical resolution of the
two-coupled equations (Eqs. 15 and 16) provided a
profile of temperature T and of partial vapour
pressure Pv that allowed the calculation of vapour
flux or evaporation at the ground surface. This
evaporation was compared with the target value
calculated from field data using Penman–Monteith
equation and the difference was compared to a
maximum acceptable value taken equal to 0.01. In
case of a larger difference, the iterative process was
renewed based on a different value of b, until the
required convergence was reached. The profiles of
temperature, volumetric water content were then
determined.
Data from the site of Boissy-le-Chatel (France)
were evaluated using this method. The site is located
about 50 km East of Paris in the South of the Orgeval
basin. Main meteorology data of 2003 (air temper-
ature, air relative humidity and solar radiation) are
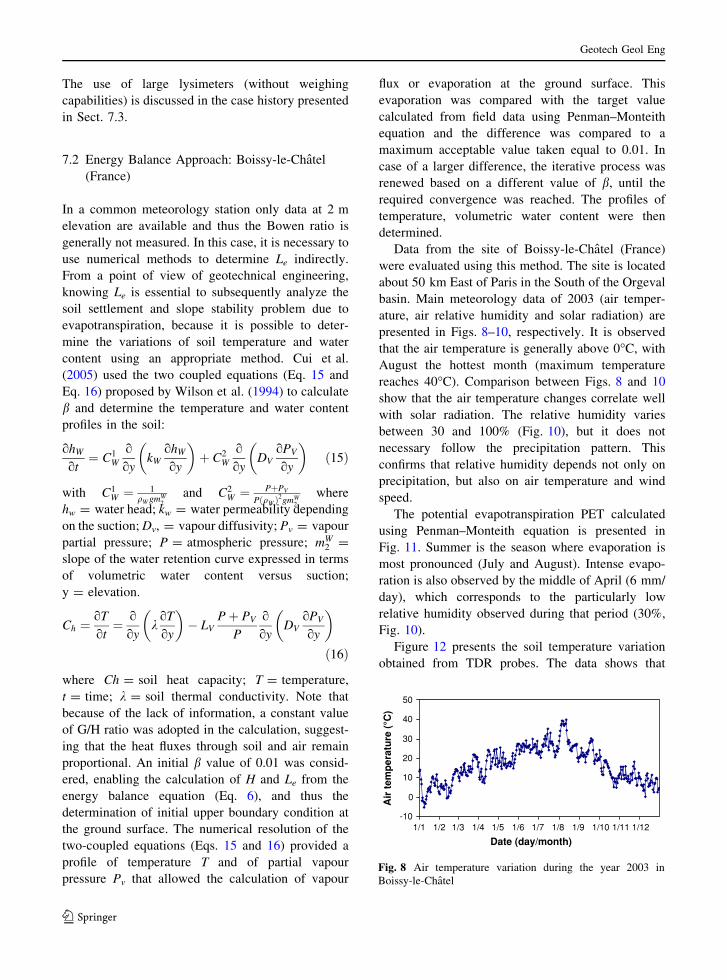
presented in Figs. 8–10, respectively. It is observed
that the air temperature is generally above 0�C, with
August the hottest month (maximum temperature
reaches 40�C). Comparison between Figs. 8 and 10
show that the air temperature changes correlate well
with solar radiation. The relative humidity varies
between 30 and 100% (Fig. 10), but it does not
necessary follow the precipitation pattern. This
confirms that relative humidity depends not only on
precipitation, but also on air temperature and wind
speed.
The potential evapotranspiration PET calculated
using Penman–Monteith equation is presented in
Fig. 11. Summer is the season where evaporation is
most pronounced (July and August). Intense evapo-
ration is also observed by the middle of April (6 mm/
day), which corresponds to the particularly low
relative humidity observed during that period (30%,
Fig. 10).
Figure 12 presents the soil temperature variation
obtained from TDR probes. The data shows that
-10
0
10
20
30
40
50
Air
tem
per
atu
re (
°C)
Date (day/month)1/1 1/2 1/3 1/4 1/5 1/6 1/7 1/8 1/9 1/10 1/11 1/12
Fig. 8 Air temperature variation during the year 2003 in
Boissy-le-Chatel
Geotech Geol Eng
123
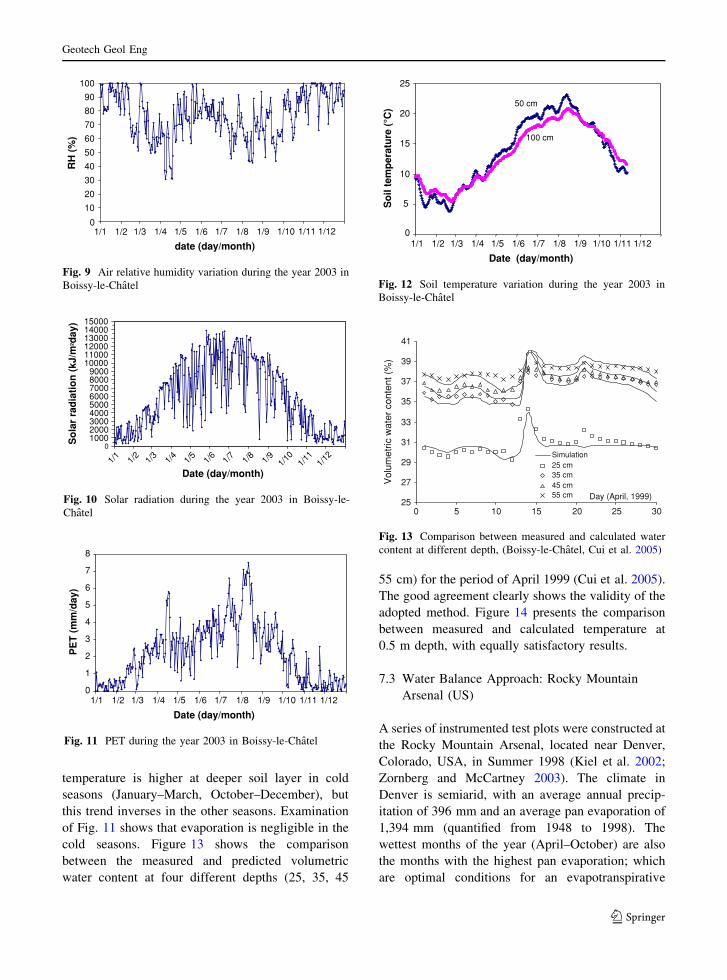
temperature is higher at deeper soil layer in cold
seasons (January–March, October–December), but
this trend inverses in the other seasons. Examination
of Fig. 11 shows that evaporation is negligible in the
cold seasons. Figure 13 shows the comparison
between the measured and predicted volumetric
water content at four different depths (25, 35, 45
55 cm) for the period of April 1999 (Cui et al. 2005).
The good agreement clearly shows the validity of the
adopted method. Figure 14 presents the comparison
between measured and calculated temperature at
0.5 m depth, with equally satisfactory results.
7.3 Water Balance Approach: Rocky Mountain
Arsenal (US)
A series of instrumented test plots were constructed at
the Rocky Mountain Arsenal, located near Denver,
Colorado, USA, in Summer 1998 (Kiel et al. 2002;
Zornberg and McCartney 2003). The climate in
Denver is semiarid, with an average annual precip-
itation of 396 mm and an average pan evaporation of
1,394 mm (quantified from 1948 to 1998). The
wettest months of the year (April–October) are also
the months with the highest pan evaporation; which
are optimal conditions for an evapotranspirative
0
10
20
30
40
50
60
70
80
90
100
date (day/month)
RH
(%
)
1/1 1/2 1/3 1/4 1/5 1/6 1/7 1/8 1/9 1/10 1/11 1/12
Fig. 9 Air relative humidity variation during the year 2003 in
Boissy-le-Chatel
0100020003000400050006000700080009000
100001100012000130001400015000
1/1
1/2
1/3
1/4
1/5
1/6
1/7
1/8
1/9
1/10
1/11
1/12
Date (day/month)
So
lar
rad
iati
on
(kJ
/m²d
ay)
Fig. 10 Solar radiation during the year 2003 in Boissy-le-
Chatel
0
1
2
3
4
5
6
7
8
Date (day/month)
PE
T (
mm
/day
)
1/1 1/2 1/3 1/4 1/5 1/6 1/7 1/8 1/9 1/10 1/11 1/12
Fig. 11 PET during the year 2003 in Boissy-le-Chatel
0
5
10
15
20
25
1/1 1/2 1/3 1/4 1/5 1/6 1/7 1/8 1/9 1/10 1/11 1/12
Date (day/month)
So
il te
mp
erat
ure
(°C
)
100 cm
50 cm
Fig. 12 Soil temperature variation during the year 2003 in
Boissy-le-Chatel
0 5 10 15 20 25 3025
27
29
31
33
35
37
39
41
Day (April, 1999)
Vol
umet
ric w
ater
con
tent
(%
)
Simulation25 cm35 cm45 cm55 cm
Fig. 13 Comparison between measured and calculated water
content at different depth, (Boissy-le-Chatel, Cui et al. 2005)
Geotech Geol Eng
123
cover. The test cover analyzed in this study was
constructed by placing a 1,168 mm layer of low
plasticity clay soil atop a large pan lysimeter (9.1 m
by 15.2 m). The soil was placed at 70% relative
compaction with respect to standard proctor maxi-
mum dry density (1,960 kg/m3). The lysimeter
consists of a geocomposite for water collection
(consisting of a geonet for in-plane drainage sand-
wiched between two geotextiles) underlain by a
geomembrane. The lysimeter was placed on a 3%
grade, which allows gravity drainage through the
geocomposite. The soil used was a low plasticity clay
(CL), with an average fines content of 43%, and an
average plasticity index (PI) of 15.4. The cover and
surrounding buffer zone were vegetated with local
grasses and shrubs, such as Cheatgrass.
Measurements obtained for water balance compo-
nents in the evapotranspirative cover at the Rocky
Mountain Arsenal were used to define the evapo-
transpiration component. The indirectly measured
evapotranspiration was subsequently compared
against predictions obtained using energy balance
methods and numerical simulations. Monitoring
commenced on July 10, 1998 (day 1), and continued
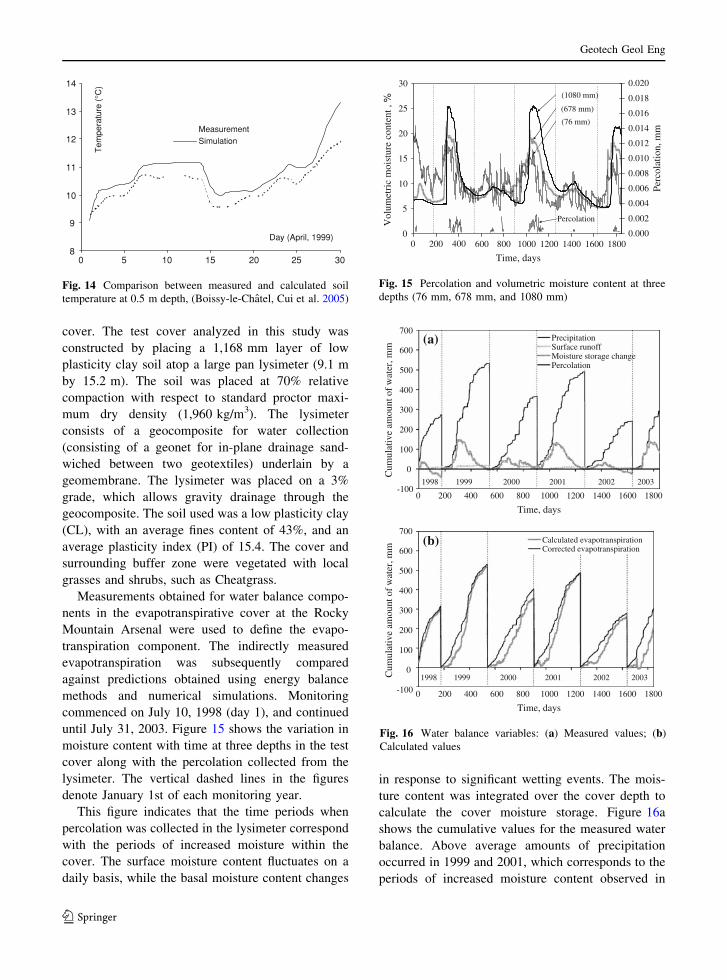
until July 31, 2003. Figure 15 shows the variation in
moisture content with time at three depths in the test
cover along with the percolation collected from the
lysimeter. The vertical dashed lines in the figures
denote January 1st of each monitoring year.
This figure indicates that the time periods when
percolation was collected in the lysimeter correspond
with the periods of increased moisture within the
cover. The surface moisture content fluctuates on a
daily basis, while the basal moisture content changes
in response to significant wetting events. The mois-
ture content was integrated over the cover depth to
calculate the cover moisture storage. Figure 16a
shows the cumulative values for the measured water
balance. Above average amounts of precipitation
occurred in 1999 and 2001, which corresponds to the
periods of increased moisture content observed in
Day (April, 1999)
80 5 10 15 20 25 30
9
10
11
12
13
14
Tem
pera
ture
(°C
)
MeasurementSimulation
Fig. 14 Comparison between measured and calculated soil
temperature at 0.5 m depth, (Boissy-le-Chatel, Cui et al. 2005)
0 200 400 600 800 1000 1200 1400 1600 18000
5
10
15
20
25
30
Time, days
Vol
umet
ric
moi
stur
e co
nten
t , %
0.000
0.002
0.004
0.006
0.008
0.010
0.012
0.014
0.016
0.018
0.020
Perc
olat
ion,
mm
(76 mm)
(678 mm)
(1080 mm)
Percolation
Fig. 15 Percolation and volumetric moisture content at three
depths (76 mm, 678 mm, and 1080 mm)
-100
0
100
200
300
400
500
600
700
0 200 400 600 800 1000 1200 1400 1600 1800
Time, days
0 200 400 600 800 1000 1200 1400 1600 1800
Time, days
Cum
ulat
ive
amou
nt o
f w
ater
, mm
-100
0
100
200
300
400
500
600
700
Cum
ulat
ive
amou
nt o
f w
ater
, mm
PrecipitationSurface runoffMoisture storage changePercolation
1998 1999 2000 2001 2002 2003
(a)
(b) Calculated evapotranspirationCorrected evapotranspiration
1998 1999 2000 2001 2002 2003
Fig. 16 Water balance variables: (a) Measured values; (b)
Calculated values
Geotech Geol Eng
123
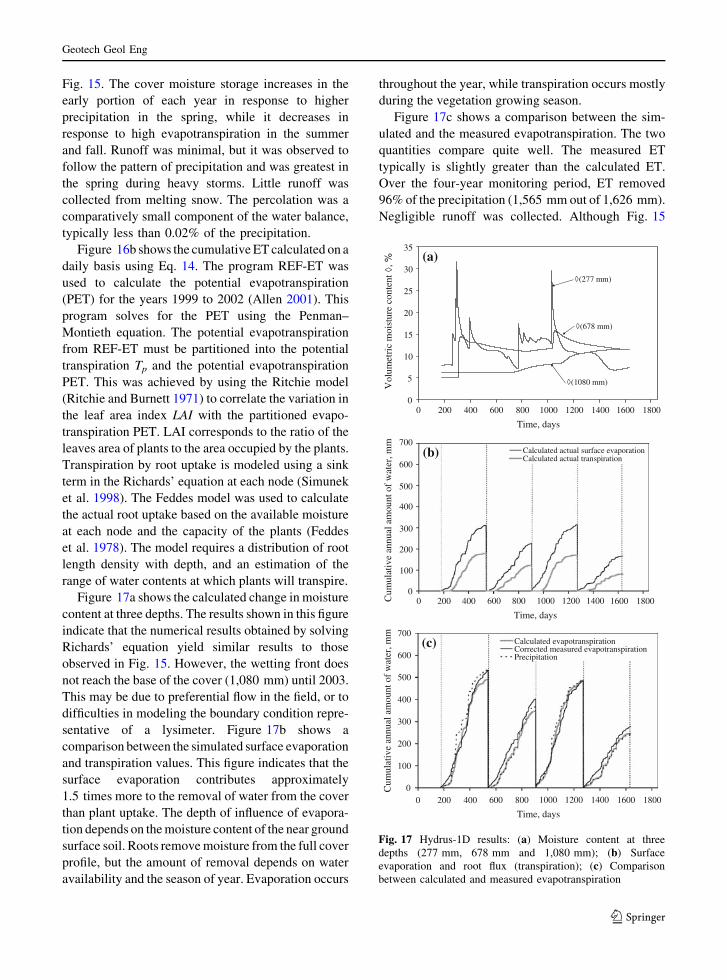
Fig. 15. The cover moisture storage increases in the
early portion of each year in response to higher
precipitation in the spring, while it decreases in
response to high evapotranspiration in the summer
and fall. Runoff was minimal, but it was observed to
follow the pattern of precipitation and was greatest in
the spring during heavy storms. Little runoff was
collected from melting snow. The percolation was a
comparatively small component of the water balance,
typically less than 0.02% of the precipitation.
Figure 16b shows the cumulative ET calculated on a
daily basis using Eq. 14. The program REF-ET was
used to calculate the potential evapotranspiration
(PET) for the years 1999 to 2002 (Allen 2001). This
program solves for the PET using the Penman–
Montieth equation. The potential evapotranspiration
from REF-ET must be partitioned into the potential
transpiration Tp and the potential evapotranspiration
PET. This was achieved by using the Ritchie model
(Ritchie and Burnett 1971) to correlate the variation in
the leaf area index LAI with the partitioned evapo-
transpiration PET. LAI corresponds to the ratio of the
leaves area of plants to the area occupied by the plants.
Transpiration by root uptake is modeled using a sink
term in the Richards’ equation at each node (Simunek
et al. 1998). The Feddes model was used to calculate
the actual root uptake based on the available moisture
at each node and the capacity of the plants (Feddes
et al. 1978). The model requires a distribution of root
length density with depth, and an estimation of the
range of water contents at which plants will transpire.
Figure 17a shows the calculated change in moisture
content at three depths. The results shown in this figure
indicate that the numerical results obtained by solving
Richards’ equation yield similar results to those
observed in Fig. 15. However, the wetting front does
not reach the base of the cover (1,080 mm) until 2003.
This may be due to preferential flow in the field, or to
difficulties in modeling the boundary condition repre-
sentative of a lysimeter. Figure 17b shows a
comparison between the simulated surface evaporation
and transpiration values. This figure indicates that the
surface evaporation contributes approximately
1.5 times more to the removal of water from the cover
than plant uptake. The depth of influence of evapora-
tion depends on the moisture content of the near ground
surface soil. Roots remove moisture from the full cover
profile, but the amount of removal depends on water
availability and the season of year. Evaporation occurs
throughout the year, while transpiration occurs mostly
during the vegetation growing season.
Figure 17c shows a comparison between the sim-
ulated and the measured evapotranspiration. The two
quantities compare quite well. The measured ET
typically is slightly greater than the calculated ET.
Over the four-year monitoring period, ET removed
96% of the precipitation (1,565 mm out of 1,626 mm).
Negligible runoff was collected. Although Fig. 15
00 200 400 600 800 1000 1200 1400 1600 1800
5
10
15
20
25
30
35
Time, days
0 200 400 600 800 1000 1200 1400 1600 1800
Time, days
0 200 400 600 800 1000 1200 1400 1600 1800
Time, days
Vol
umet
ric
moi
stur
e co
nten
t , %
(277 mm)
(678 mm)
(1080 mm)
(a)
Calculated actual surface evaporationCalculated actual transpiration(b)
0
100
200
300
400
500
600
700
Cum
ulat
ive
annu
al a
mou
nt o
f w
ater
, mm
0
100
200
300
400
500
600
700
Cum
ulat
ive
annu
al a
mou
nt o
f w
ater
, mm
Calculated evapotranspirationCorrected measured evapotranspirationPrecipitation
(c)
Fig. 17 Hydrus-1D results: (a) Moisture content at three
depths (277 mm, 678 mm and 1,080 mm); (b) Surface
evaporation and root flux (transpiration); (c) Comparison
between calculated and measured evapotranspiration
Geotech Geol Eng
123
indicates an increase in moisture content on several
occasions, ET led to relatively low moisture contents
throughout the soil profile at the end of the simulation.
Also, the percolation throughout the four-year simu-
lation period was less than 0.1 mm (0.02% of the
precipitation), indicating that the ET adequate enough
to lead to satisfactory cover performance.
8 Final Remarks
Among the various components of the water balance,
the evapotranspiration component has probably been
the most difficult component to quantify and measure
experimentally. Some attempts for direct measure-
ment of evapotranspiration have included the use of
weighing lysimeters. However, quantification of
evapotranspiration has been typically conducted
using energy balance approaches or indirect water
balance methods that rely on quantification of all
other water balance components. This report initially
presented the fundamental aspects of evapotranspira-
tion as well as of its evaporation and transpiration
components. Typical methods used for prediction of
evapotranspiration based on meteorological informa-
tion were also discussed. The current trend of using
evapotranspirative cover systems for closure of waste
containment facilities located in arid climates has
brought renewed needs for quantification of evapo-
transpiration. Accordingly, a brief overview of
evapotranspirative cover systems was presented in
this paper. Finally, case histories in which direct or
indirect measurements of evapotranspiration have
been conducted are described and analyzed.
Overall, significant improvements have been
recently made regarding monitoring of evapotranspi-
ration using direct methods (weighing lysimeter),
energy balance methods, and water balance
approaches. However, significant additional advances
should be made towards integrating the unsaturated
soil mechanics concepts with other areas such as
meteorology, agronomy, and biology in order to further
advance our ability to predict evapotranspiration.
References
Allen RG (2001) REF-ET: reference evapotranspiration cal-
culation software for FAO and ASCE standardized
equations. Version 2. The University of Idaho
Allison GB, Gee GW, Tyler SW (1994) Vadose-zone tech-
niques for estimating groundwater recharge in arid and
semiarid regions. Soil Sci Soc Am J 58:6–14
Allman MA, Delaney MD, Smith DW (1998) A field study of
seasonal ground movement in expansive soils. In: Pro-
ceedings of the second international conference on
unsaturated soils UNSAT’98, Beijing, pp 309–314
Alonso E, Gens A, Lloret A, Delahaye C (1995) Effect of rain
infiltration on the stability of slopes. In: Proceedings of
the first international conference on unsaturated soils
UNSAT’95, vol. 1. Paris, pp 241–256
Anderson JE (1997) Soil-plant cover systems for final closure
of solid waste landfills in arid regions. Landfill capping in
the semi-arid west: problems. Perspectives and Solutions,
Idaho Falls, pp 27–38
Anderson JE, Shumar ML, Toft NL (1987) Control of soil
water balance by sagebrush and three perennial grasses in
a cold-desert environment. Arid Soil Res Rehabil 1:229–
244
Anderson JE, Nowak RS, Ratzlaff TD, Markham OD (1993)
Managing soil moisture on waste burial sites in arid
regions. J Environ Qual 22:62–69
Anderson JE, Ratzlaff TD, Duffin E, Morris A (1998) Com-
parisons of four protective cap designs for burial of
hazardous waste at the idaho national engineering and
environmental laboratory. In: Reynolds TD, Warren RW
(eds) Environmental science and research foundation
annual technical report for 1997. ESRF, Idaho Falls, ID
Benson CH, Khire MV (1995) Earthen covers for semi-arid and
arid climates. In: Proceedings ASCE convention, landfill
closures––environmental protection and land recovery.
San Diego, CA, pp 201–217
Benson CH, Bosscher PJ, Land DT, Pliska RJ (1994) Moni-
toring system for hydrologic evaluation of landfill final
covers. ASTM Geotech Test J 17(2):138–149
Benson CH, Abichou T, Albright WH, Gee G, Roesler AC
(2001) Field evaluation of alternative earthen final covers.
Int J Phytoremediation 3(1):105–127
Biddle PG (1983) Patterns of soil drying and moisture deficit in
the vicinity of trees on clay soils. Geotechnique
33(2):107–126
Blight GE (1997) Interaction between the atmosphere and the
earth. Geotechnique (47):715–767
Boast CW (1986) Evaporation from Bare Soil Measured with
High Spatial Resolution. In: Dinauer RC (ed) Methods of
soil analysis, part I: physical and mineralogical methods.
SSSA, pp 889–899
Bowen IS (1926) The ratio of heat losses by conduction and by
evaporation from any water surface. Phys Rev 27:779–
787
Brutsaert W (1982) Evaporation into the atmosphere: theory,
history, and applications. Kluwer Academic Publishers
Cai F, Ugai K (1998) Finite element analysis of rainfall effects
on slope stability. In: Proceedings of the second interna-
tional conference on unsaturated soils UNSAT’98, vol 1.
Beijing, pp 200–205
Campbell Scientific Inc (1998) BR023 Bowen ratio system
instrumentation manual. http://weather.austincollege.edu/
ACWX.manuals/bowen.pdf
Campbell MD, Gee GW, Kirkham RR, Phillips SJ, Wing NR
(1991) Water balance lysimetry at a nuclear waste site.
Geotech Geol Eng
123
Lysimeters for Evapotranspiration and Environmental
Measurements, Honolulu, HI, pp 125–132
Choudhury BJ, Reginato RJ, Idso SB (1986) An analysis of
infrared temperature observations over wheat and calcu-
lation of latent heat flux. Agric Forest Meteorol 37:75–88
Cui YJ, Lu YF, Delage P, Riffard M (2005) Field simulation of
in-situ water content andtemperature changes due to
ground––atmospheric interactions. Geotechnique 55(7):
557–567
Dingman SL (1994) Physical hydrology. Prentice Hall, p 575
Driscoll R (1983) The influence of vegetation on the swelling
and shrinking of clay soils in Britain. Geotechnique
33(2):93–105
Dwyer SF (1998) Alternative landfill covers pass the test. Civil
Eng, ASCE 68(9):50–52
Dwyer SF (2001) Finding a better cover. Civil Eng, ASCE
71(1):59–63
Evett SR (1993) Evapotranspiration by soil water balance using
tdr and neutron scattering. In: Management of irrigation
and drainage systems conference, Park City Utah
Evett SR (1994) TDR-temperature arrays for analysis of field
soil thermal properties. In: Symposium on time domain
reflectrometry in environmental, infrastructure and mining
applications. Northwestern University, Evanston, IL
Fayer M, Gee G (1997) Hydrologic model tests for landfill
covers using field data. In: Proceedings landfill capping in
the semi-arid west: problems, perspectives, and solutions.
Environmental Science and Research Foundation, Idaho
Falls, ID, pp 53–68
Feddes RA, Kowalik PJ, Zaradny H (1978) Simulation of field
water use and crop yield. Wiley, Inc
Fischer V, Schulin R, Keller M (1996) Experimental and
numerical investigation of soil vapor extraction. Water
Resour Res 32:3413–3427
Fourie AB, Bhana Y, Blight GE (1998) The contribution of
matric suction to the stability of an ash dump. In: Pro-
ceedings of the second international conference on
unsaturated soils UNSAT’98, vol. 1. Beijing pp 225–230
Gao DZ (1995) The cause of a large number of houses damage.
In: Proceedings of the first international conference on
unsaturated soils UNSAT’95. Paris, pp 863–867
Gardner HR (1973) Prediction of evaporation from homoge-
nous soil based on the flow equation. Soil Sci Soc Am J
37:513–516
Gardner HR, Hillel DI (1962) The relation of external evapo-
rative conditions to the drying of soils. J Geophys Res
67(11):4319–4325
Gee GW, Hillel DI (1988) Groundwater recharge in arid
regions: review and critique of estimation methods.
Hydrol Processes 2:255–266
Gee GW, Ward AL (1997) Still in quest of the perfect cap. In:
Landfill capping in the semi-arid West: problems, per-
spectives and solutions, Idaho Falls, pp. 145–164
Gee GW, Campbell MD, Link SO (1991) Arid site water
balance using monolith lysimeters. In: Lysimeters for
evapotranspiration and environmental measurements,
Honolulu, HI, pp 219–227
Guyot G (1997) Climatologie de l’environnement. De la plante
aux ecosystemes. In: Masson (ed) Elsevier, Paris, 505 p,
ISBN 2-225-85514-5
Hakonson TE, Bostick KV, Trujillo G, Manies K, Warren RW,
Lane L, Kent J, Wilson W (1994) Hydrologic evaluation
of four landfill cover designs at hill air force base. LA-ur-
93-4469, Sandia National Laboratory, DOE Mixed Waste
Landfill Integrated Demonstration, Albuquerque
Hargreaves GH (1994) Defining and using reference evapo-
transpiration. J Irrig Drain Eng, ASCE 120(6):1132–1139
Holtz WG (1983) The influence of vegetation on the swelling
and shrinking of clays in the United States of America.
Geotechnique 33(2):159–163
Kampf M, Von der Hude N (1995) Transport phenomena in
capillary barriers: influence of temperature on flow pro-
cesses. In: Proceedings Sardinia 95, fifth international
landfill symposium, II, pp 565–576
Khire M, Benson C, Bosscher P (1997) Water balance mod-
eling of earthen final covers. J Geotech Eng, ASCE
123(8):744–754
Khire MV, Benson CH, Bosscher PJ (1997) Water balance of
two earthen landfill caps in a semi-arid climate. ICTCE,
pp 1–9
Kiel RE, Chadwick DG, Lowrey J, Mackey CV, Greer LM
(2002) Design of evapotranspirative (ET) covers at the
Rocky Mountain Arsenal. In: Proceedings: SWANA 6th
annual landfill symposium
Kolle O (1996) Long-term comparison of energy flux calcu-
lation methods over an agriculture field. Phys Chem Earth
21:111–117
Levitt DG, Sully MJ, Lohrstorfer CF (1996) Modeling
evapotranspiration from arid environments: literature
review and preliminary model results. Bechtel Nevada
Milly PCD (1996) Effects of thermal vapor diffusion on sea-
sonal dynamics of water in the unsaturated zone. Water
Resour Res 32:509–518
Nyhan JW, Hakonson TE, Drennon BJ (1990) A water balance
study of two landfill cover designs for semi-arid regions. J
Environ Qual 19:281–288
Nyhan JW, Schofield TG, Starmer RH (1997) A water balance
study of four landfill cover designs varying in slope for
semi-arid regions. J Environ Qual 16:1385–1392
Penman HL (1948) Natural evaporation from open water, bare
soil and grass. Proc R Soc London, Ser A 193:120–146
Pereira LS, Perrier A, Allen RG, Alves I (1999) Evapotrans-
piration: concepts and future trends. J Irrig Drain Eng,
ASCE 125(2):45–51
Philip JR (1957) Evaporation and moisture and heat flow in the
soil. Meteorol J 14:354–366
Phillips SJ, Relyea JF, Kemp CJ, Wing NR, Campbell MD,
Gee GW, Graham MJ, Kirkham RR, Ruben MS (1991)
Development of Hanford site lysimeter facilities. In:
Lysimeters for evapotranspiration and environmental
measurements, Honolulu, HI, pp 19–27
Pidwirny M (2006) Fundamentals of physical geography,
2nd edn. http://www.physicalgeography.net/fundamentals/
contents.html
Qualls RJ, Brutsaert W (1996a) Effect of vegetation density on
the parameterization of scalar roughness to estimate spa-
tially distributed sensitive heat fluxes. Water Resour Res
32(3):645–652
Qualls RJ, Brutsaert W (1996b) Evaluation of spatially dis-
tributed ground-based and remotely sensed data to
Geotech Geol Eng
123
estimate spatially distributed sensitive heat fluxes. Water
Resour Res 32(8):2489–2495
Raghuywanshi NS, Wallender WW (1998) Converting from
pan evaporation to evapotranspiration. J Irrig Drain Eng,
ASCE 124(5):275–277
Rahardjo H, Leong EC, Gasmo JM, Tang SK (1998) Assess-
ment of rainfall effects on stability of residual soil slopes.
In: Proceedings of the second international conference on
unsaturated soils UNSAT’98, vol. 1. Beijing, pp 78–83
Ravina I (1983) The influence of vegetation on moisture and
volume changes. Geotechnique 33(2):151–163
Ritchie JT (1972) Model for predicting evaporation from a row
crop with incomplete cover. Water Res Res 8(5):1204–
1213
Ritchie JT, Burnett E (1971) Dry-land evaporative flux in a
sub-humid climate, 2, plant influences. Agron J 63:56–62
Scholander PF, Hammel HT, Bradstreet ED, Hemmingsen EA
(1965) Sap pressure in vascular plants. Science 148:339–
346
Shimada K, Fujii H, Nishimura S, Morii T (1995) Stability
analysis of unsaturated slopes considering changes of
matric suction. In: Proceedings of the first international
conference on unsaturated soils UNSAT’95, vol. 1, Paris,
pp 293–299
Simunek J, Sejna M, van Genuchten M (1998) HYDRUS-1D:
code for simulating the one-dimensional of water, heat,
and multiple solutes in variably saturated porous media.
Version 2.02. International Groundwater Modeling Cen-
ter. Colorado School of Mines. Golden, CO
Stormont JC (1995) Alternative barrier layers for surface
covers in dry climates. asce special geotechnical publi-
cation no.7: geo-environmental issues facing the
Americas, ASCE, pp 150–155
Tratch DJ, Wilson GW, Fredlund G (1995) An introduction to
analytical modeling of plant transpiration for geotechnical
engineers. In: 48th Annual Canadian Geotechnical Con-
ference, Vancouver BC, pp 771–780
Vandangeon P (1992) Exemple de sinistres en region parisi-
enne. Revue Francaise de Geotechnique, n�58, pp 7–14
Wallance JM, Hobbes PV (1977) Atmospheric science : a
introductory survey. Academic Press, 350 p
Warren RW, Hakonson TE, Trujillo G (1994) Water balance
relationships in four alternative cover designs for radio-
active and mixed waste landfills. Los Alamos National
Laboratories, DOE, Los Alamos
Warren RW, Hakonson TE, Bostick KV (1996) The hydrologic
evaluation of four cover designs for hazardous waste
landfills at Hill Air Force Base. Federal Facilities Environ
J, Winter, 91–110
Waugh WJ (2002) Monticello field lysimetry: Design and
monitoring of an alternative cover. In: Proceedings of the
waste management ‘02 conference, Tucson, AZ
Waugh WJ, Thiede ME, Cadwell LL, Gee GW, Freeman HD,
Sackschewsky MR, Relyea JF (1991) Small lysimeters for
documenting arid site water balance. Lysimeters for
evapotranspiration and environmental measurements.
Honolulu, HI, pp 151–159
Williams AAB, Pidgeon JT (1983) Evapo-transpiration
and heaving clays in South Africa. Geotechnique 33(2):
141–150
Wilson GW (1997) Surface flux boundary modeling for
unsaturated soils. Unsaturated Soil Eng Pract 38–65
Wilson GW (2000) The role of climate and soil properties in
the evaluation of flux boundary conditions for application
to unsaturated soil mechanics. XI PANAM, Brasil, pp.
209–218
Wilson GW, Fredlund G, Barbour SL (1994) Coupled soil
atmosphere modeling for soil evaporation. Can Geotech J
31:151–161
Wilson GV, Albright WH, Gee GW, Fayer MJ, Ogan B (1999)
Alternative cover assessment project, phase I report.
August 1999, prepared for the U.S. Environmental Pro-
tection Agency
Wing NR, Gee GW (1989) Protective barrier development:
overview. In: 28th Hanford symposium, environmental
monitoring, restoration, and assessment: what have we
learned? (DOE), Richland, WA, pp 1–8
Wing NR, Gee GW (1994) Quest for the perfect cap. Civil Eng,
ASCE, pp 38–41
Wu L, Oster J (1997) Instruments for water and plant man-
agement. University of California, Riverside
Xu Q, Qiu CJ (1997) A variational method for computing
surface heat fluxes from ARM surface energy and radia-
tion balance systems. J Appl Meteorol 36(1):3–11
Zornberg JG, Caldwell JA (1998) Design of monocovers for
landfills in arid locations.In: Seco e Pinto PS, Balkema
AA (eds) Proceedings of the third international conference
on environmental geotechnics, , vol. 1. Lisbon, Portugal,
September 1998, pp 169–174
Zornberg JG, McCartney JS (2003) Analysis of monitoring
data from the evapotranspirative test covers at the Rocky
Mountain Arsenal. Geotechnical research report, US
Environmental Protection Agency, Region 8, December
2003, 227 p
Zornberg JG, LaFountain L, Caldwell JC (2003) Analysis and
design of evapotranspirative cover for hazardous waste
landfill. J Geotech Geoenviron Eng, ASCE 129(5):427–
438
Geotech Geol Eng
123