Satellite-based estimation of evapotranspiration of an old-growth temperate mixed forest
Upload
khangminh22Category
view
0download
0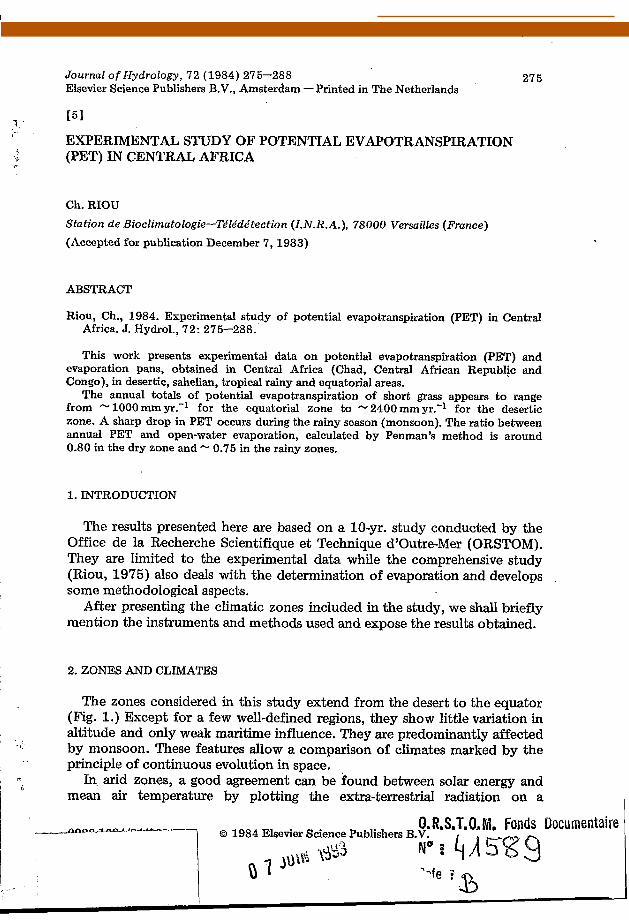
C
I '
?!
I'
( 1
'. 1'
Journal of Hydrology, 72 (1984) 275-288 Elsevier Science Publishers B.V., Amsterdam - Printed in The Netherlands
27 5
EXPERIMENTAL STUDY OF POTENTIAL EVAPOTRANSPIRATION (PET) IN CENTRAL AFRICA
Ch. RIOU Station de Bioclimatologie-Télédétection (I.N.R.A.), 78000 Versailles (France) (Accepted for publication December 7, 1983)
ABSTRACT
Riou, Ch., 1984. Experimental study of potential evapotranspiration (PET) in Central Africa. J. Hydrol., 72: 275-288.
This work presents experimental data on potential evapotranspiration (PET) and evaporation pans, obtained in Central Africa (Chad, Central African Republic and Congo), in desertic, sahelian, tropical rainy and equatorial areas.
The annual totals of potential evapotranspiration of short grass, appears to range from - 1000 mm yr,-I for the equatorial zone to - 2400 mm yr.-1 for the desertic zone. A sharp drop in PET occurs during the rainy season (monsoon). The ratio between annual PET and open-water evaporation, calculated by Penman's method is around 0.80 in the dry zone and 0.75 in the rainy zones.
1. INTRODUCTION
The results presented here are based on a 10-yr. study conducted by the Office de la Recherche Scientifique et Technique d'Outre-Mer (ORSTOM). They are limited to the experimental data while the comprehensive study (Riou, 1975) also deals with the determination of evaporation and develops some methodological aspects.
After presenting the climatic zones included in the study, we shall briefly mention the instruments and methods used and expose the results obtained.
2. ZONES AND CLIMATES
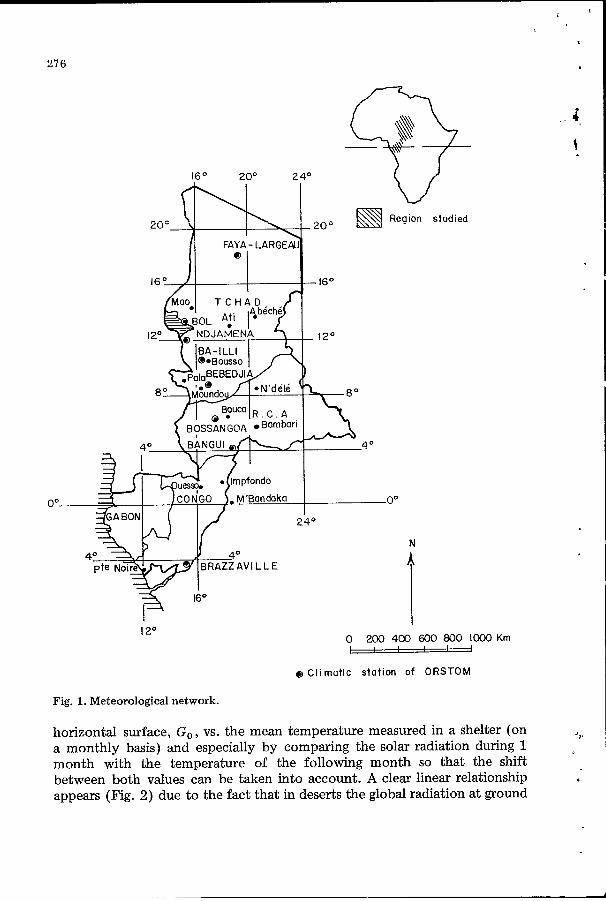
The zones considered in this study extend from the desert to the equator (Fig. 1.) Except for a few well-defined regions, they show little variation in altitude and only weak maritime influence. They are predominantly affected by monsoon. These features allow a comparison of climates marked by the principle of continuous evolution in space.
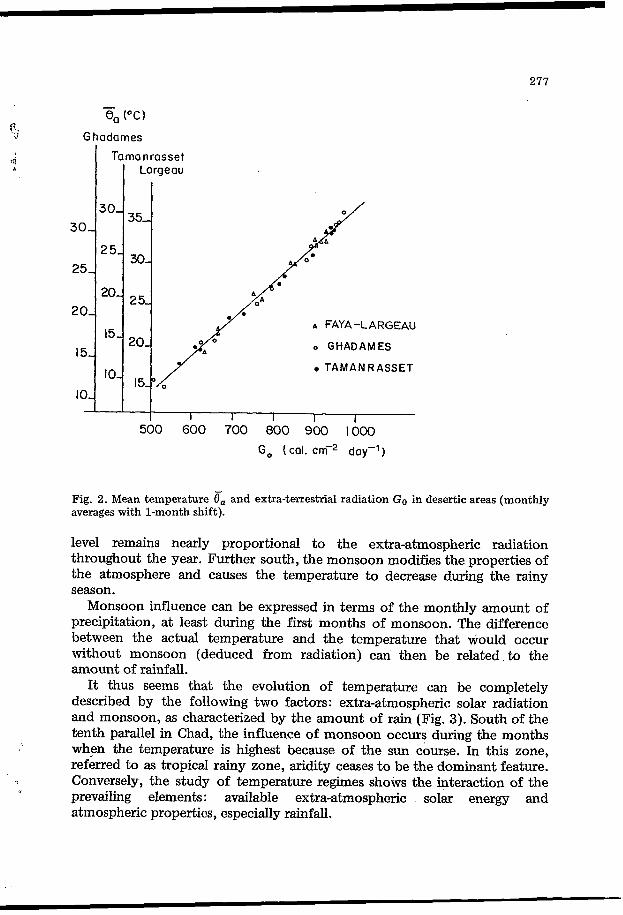
In. arid zones, a good agreement can be found between solar energy and mean air temperature by plotting the extra-terrestrial radiation on a
O.R.S.T.O,M. Fonds Documentaire 0 1984 Elsevier Science Publishers B.V. /a--
N'I GASg 33
CORE Metadata, citation and similar papers at core.ac.uk
Provided by Horizon / Pleins textes
276
1 6 O ZOO 2 4 O
0°-
1 6 O
1 2 O
4
4 I 4 I ,""I
-% K" I I 4 O
AVILLE
-4 o
-O0
N
t o 200 400 600 800 loo0 w
Q Climatic station of ORSTOM
Km
Fig. 1. Meteorological network.
horizontal surface, Go, vs. the mean temperature measured in a shelter (on a monthly basis) and especially by comparing the solar radiation during 1 month with the temperature of the following month so that the shift between both values can be taken into account. A clear linear relationship appears (Fig. 2) due to the fact that in deserts the global radiation at ground
G hadames
Tamanrasset 1 Largeau
A FAYA-LARGEAU
o GHADAMES
TAMANRASSET
500 600 700 800 900 I Ö 0 0 Go (cal. cm-2 day-')
Fig. 2. Mean temperature ëa and extra-terrestrial radiation Go in desertic areas (monthly averages with 1-month shift).
level remains nearly proportional to the extra-atmospheric radiation throughout the year. Further south, the monsoon modifies the properties of the atmosphere and causes the temperature to decrease during the rainy season.
Monsoon influence can be expressed in terms of the monthly amount of precipitation, at least during the first months of monsoon. The difference between the actual temperature and the temperature that would occur without monsoon (deduced from radiation) can then be related, to the amount of rainfall.
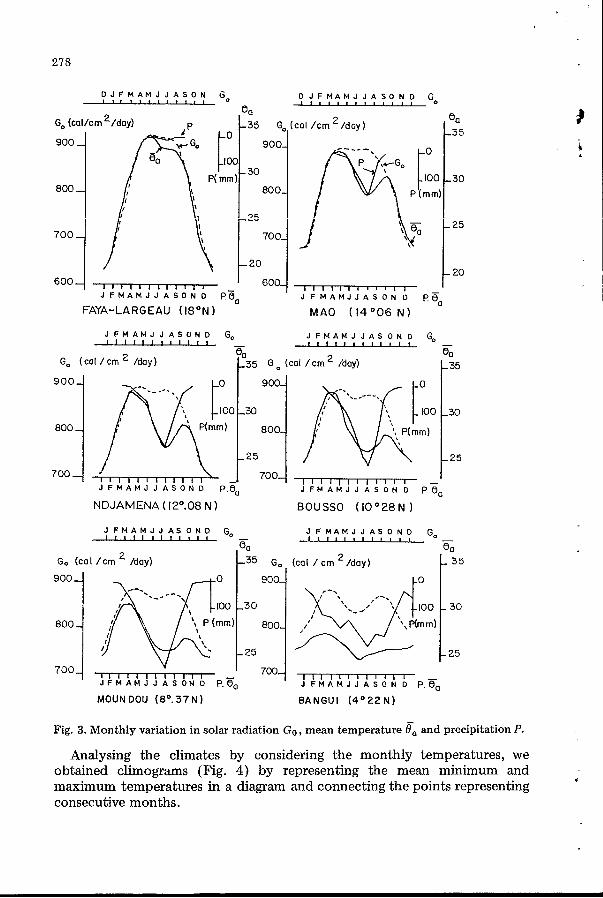
It thus seems that the evolution of temperature can be completely described by the following two factors: extra-atmospheric solar radiation and monsoon, as characterized by the amount of rain (Fig. 3). South of the tenth parallel in Chad, the influence of monsoon occurs during the months when the temperature is highest because of the sun course. In this zone, referred to as tropical rainy zone, aridity ceases to be the dominant feature. Conversely, the study of temperature regimes shows the interaction of the prevailing elements: available extra-atmospheric solar energy and atmospheric properties, especially rainfall.
278
O J F M A M J J A S O N Go O J F M A M J J A S O N O Go I I , , I , , , , , , ,
P
U
FAYA-LARGEAU (18ON) MAO ( 1 4 O O 6 N )
J F M A M J J A S O N O Go J F M A M J J A S O N O Go 1 1 1 1 1 1 1 1 1 1 1 1 1 1 1 1 1 1 1 1 1 1 1 1 - -
00 %I
c35 G o (cal /cm /day) L35 Go (cal /cm /day)
N D J A M E N A ( 1 2 O . 0 8 N 1 BOUSSO ( I O " 2 8 N 1
J F M A M J J A S O N O J F M A M J J A S O N O Go I l I I I I I I I t l l I I l l I I I , I I I
G o (cal /cm /day)
900
800
700 ;;A;t!l:;A::t!4 b P.ëa
MOUN DOU (So. 37 N) BANGUI (4O22 N)
- Fig. 3. Monthly variation in solar radiation Go, mean temperature Ba and precipitation P.
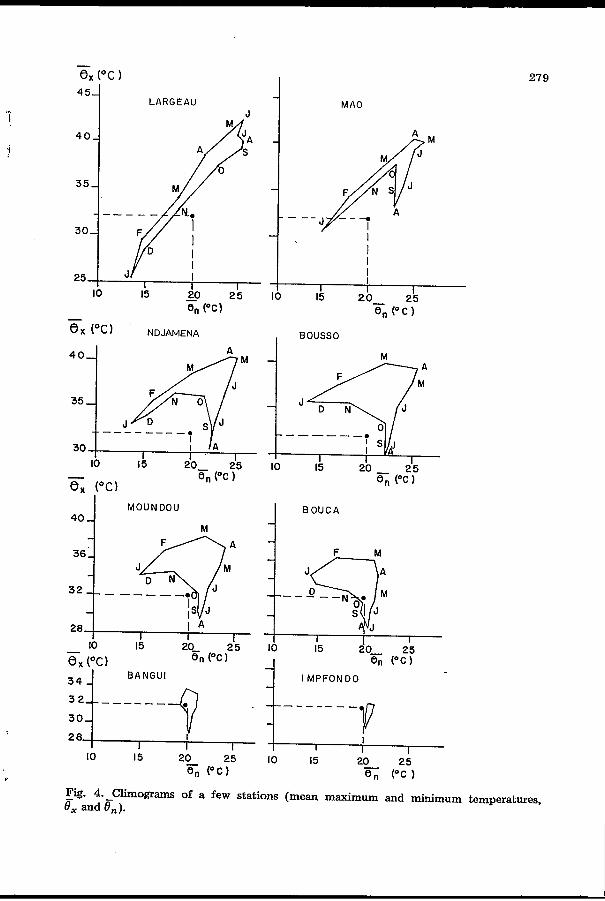
Analysing the climates by considering the monthly temperatures, we obtained climograms (Fig. 4) by representing the mean minimum and maximum temperatures in a diagram and connecting the points representing consecutive months.
I
-I ,
~ .a..,:.
I 'i 1 '
I I
- ex (OC l 45-i LARGEAU
40 J
30
25 IO
J
MOUNDOU
M
10 15 20 25 - 8, ("Cl
279
MAO
M A
M
I 2 0 - 2 5 10 15
en ("Cl
EOUCA 1 F M
u I
Fig. 4.-Climograms of a few stations (mean maximum and minimum temperatures, Ox and On).
280
L a t i t u d e ( d e g r e e s N o r d )
*O1; 15 -
IO -
5 - I
\
I
R
Roiny season Cool season
=Worm seoson Average months
Moderately Moderately cool season worm season
Tronsition period
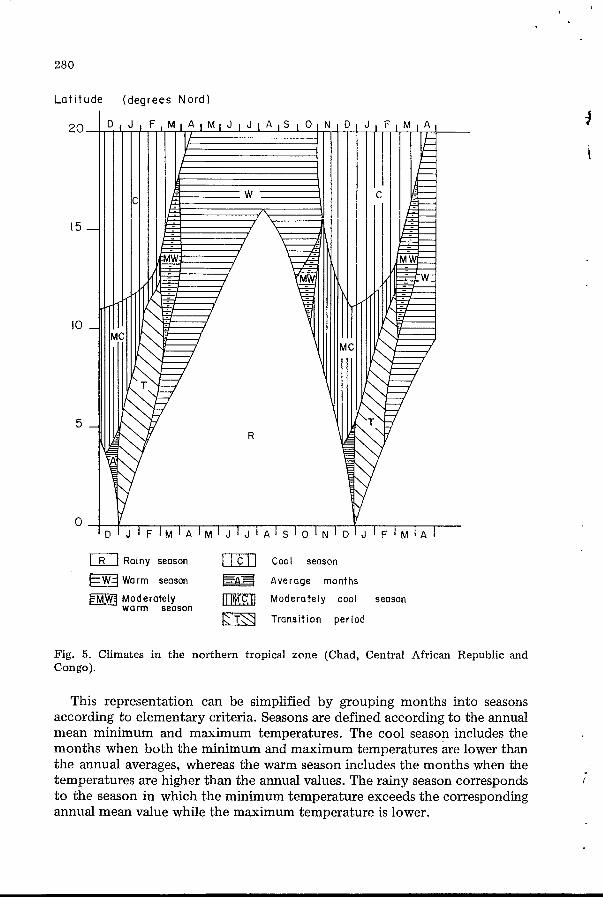
Fig. 5. Climates in the northern tropical zone (Chad, Central African Republic and Congo).
This representation can be simplified by grouping months into seasons according to elementary criteria. Seasons are defined according to the annual mean minimum and maximum temperatures. The cool season includes the months when both the minimum and maximum temperatures &e lower than the annual averages, whereas the warm season includes the months when the temperatures are higher than the annual values. The rainy season corresponds to the season in which the minimum temperature exceeds the corresponding annual mean value while the maximum temperature is lower.
i
!
281
Some features revealed by a schematic representation of the studied area enable a better definition of the climatic zones. The following areas can be distinguished (Fig. 5) :
(1) desertic zone with only two seasons (cool and warm) (2) zone with three pronounced seasons (cool, warm and rainy) (3) further south, the cool season disappears: the climate is marked by one warm and
(4) Closer to the equator, all months become similar one rainy season
These four zones can be referred to as “desertic”, “sahelian”, “tropical rainy” and “equatorial”, respectively.
The seven climatic stations (Fig. 1) located between the eighteenth parallel (17”55‘N) and the first parallels south of the equator (4’15‘s) cover all four zones described above.
3. INSTRUMENTS AND PROCEDURES FOR MEASURING AND EVALUATING EVAPORATION
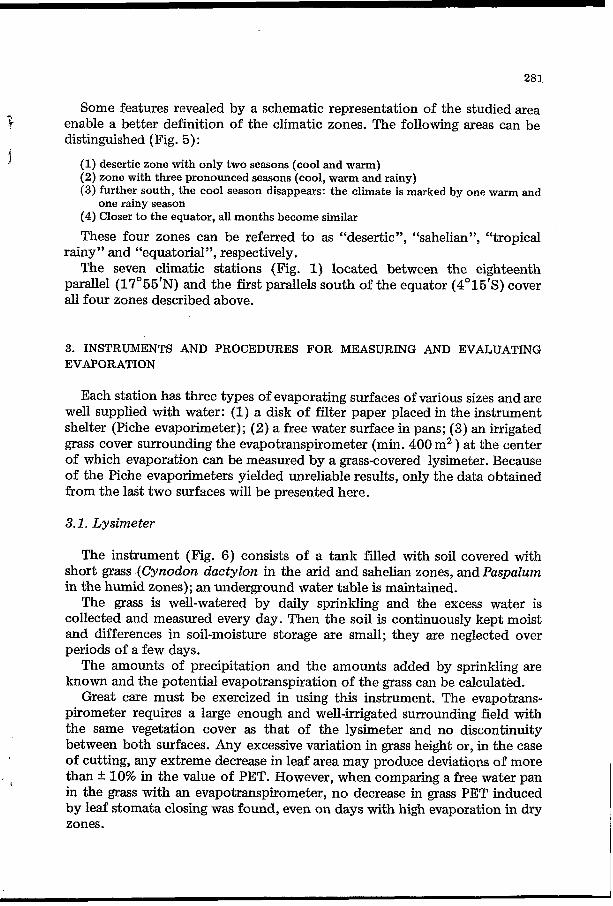
Each station has three types of evaporating surfaces of various sizes and are well supplied with water: (1) a disk of filter paper placed in the instrument shelter (Piche evaporimeter); (2) a free water surface in pans; (3) an irrigated grass cover surrounding the evapotranspirometer (min. 400 m2 ) at the center of which evaporation can be measured by a grass-covered lysimeter. Because of the Piche evaporimeters yielded unreliable results, only the data obtained from the last two surfaces will be presented here.
3.1. Lysimeter
The instrument (Fig. 6) consists of a tank filled with soil covered with short grass (Cynodon dactylon in the arid and sahelian zones, and Paspalum in the humid zones); an underground water table is maintained.
The grass is well-watered by daily sprinkling and the excess water is collected and measured every day. Then the soil is continuously kept moist and differences in soil-moisture storage are small; they are neglected over periods of a few days.
The amounts of precipitation and the amounts added by sprinkling are known and the potential evapotranspiration of the grass can be calculated.
Great care must be exercized in using this instrument. The evapotrans- pirometer requires a large enough and well-irrigated surrounding field with the same vegetation cover as that of the lysimeter and no discontinuity between both surfaces. Any excessive variation in grass height or, in the case of cutting, any extreme decrease in leaf area may produce deviations of more than k 10% in the value of PET. However, when comparing a free water pan in the grass with an evapotranspirometer, no decrease in grass PET induced by leaf stomata closing was found, even on days with high evaporation in dry zones.
I
l
.. -
282
.-ra . _ . . . . : L ; . . . -
I
.\f y Cement supports O Im
P - . 1
Lys¡ meter
Fig. 6. Diagram of the lysimeters used.
3.2. Evaporation pans
c
?
t
Due to their easy use and suitability for measurements, evaporation pans are the basic instrument of evaporation networks in the U.S.A. and U.S.S.R., and several other countries. Arguments against their use are not always justified. For instance, they are said to be sensitive to the heat flux exchange between the walls and the outer environment. This might be true for above- ground pans, but less so for sunken pans. The ORSTOM network pan was derived from the US. Colorado sunken pan. It has a 1-m2 surface area, 0.6-m depth, with a 10-cm rim above ground level. Trials in Ndjamena
,
. . i
!
i
283
showed that such a pan, which is lined with 16-cm thick polystyrene on its five buried faces and therefore well insulated, had only a 7% evaporation decrease in the warm and dry season; this decrease virtually ceased after the beginning of the rainy season. Another drawback of the pans is their rim which acts upon water ventilation. Results show the sensitivity of evaporation pans to wind speed, as expressed by Dalton’s equation applied to a pan. Furthermore, the field surrounding the pan is at least as important a factor as the rim with respect to the wind, so that the actual measuring instrument is not the pan itself, but the pan plus the surrounding field. The small dispersion of the measurements between several identical pans confirms the quality of this instrument.
P 4
3.3. Water-balance method
After deducting the rainfall runoff, the water balance of a watershed shows a term that represents the s u m of AET, deep percolation, and increase in soil-water storage of the watershed (the latter is considered negligible for an annual balance).
If the deep percolation is small, this balance gives a good approximation of AET and, under heavy and well-distributed rainfall, of PET. This was the case in large watersheds covered with forest equatorial Congo, where the runoff deficits could be compared with PET (1000-1100 mm yr.-’ in each case).
3.4. Energy balance and Penman’s equation
Penman’s equation was calculated here with coefficients established in Central Africa for evaluating the net radiation and for Dalton’s equation.
The comparison between net radiation (one of the elements of Penman’s equation) and PET shows that in the dry zone evaporation energy is much higher than net radiation, whereas it represents only 4 of this radiation in the rainy zone.
PET can be evaluated on the basis of Penman’s equation, by writing PET = fEp , where E, represents the evaporation calculated for a free water surface according to Penman’s formula, and PET the values measured by the lysimeters.
The values of the coefficent f are related to season and latitude. They are listed in Table I. For Brazzaville (southern hemisphere), the months have been shifted by 4 yr. to’ account for the reversed seasons.
The coefficient f decreases in the cool and in the rainy seasons. It reaches a maximum in the warm and dry season, but shows a rather small variation. A constant value of 0.80 in the dry zone and 0.75 in the rainy zone would produce no major error in PET computation. Such a regularity also confirms the concept of PET.
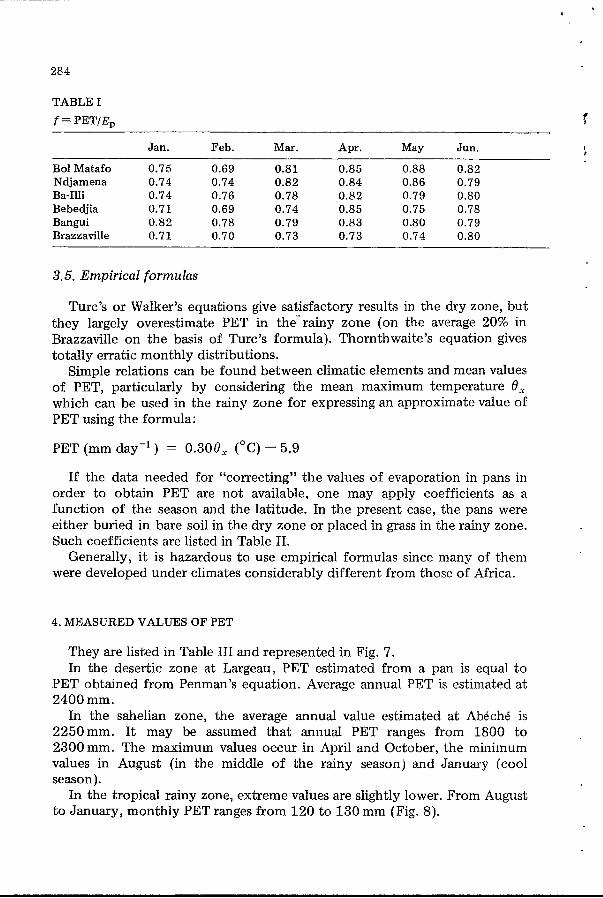
284
TABLE I f = PETIE, 3
Jan. Feb. Mar. Apr.
Bol Matafo 0.75 0.69 0.81 0.85 Ndjamena 0.74 0.74 0.82 0.84 Ba-Illi 0.74 0.76 0.78 0.82 Bebedjia 0.71 0.69 0.74 0.85 Bangui 0.82 0.78 0.79 0.83 Brazzaville 0.71 0.70 0.73 0.73
May Jun.
0.88 0.82 0.86 0.79 0.79 0.80 0.75 0.78 0.80 0.79 0.74 0.80
I t
3.5. Empirical formulas
Turc’s or Walker’s equations give satisfactory results in the dry zone, but they largely overestimate PET in therainy zone (on the average 20% in Brazzaville on the basis of Turc’s formula). Thornthwaite’s equation gives totally erratic monthly distributions.
Simple relations can be found between climatic elements and mean values of PET, particularly by considering the mean maximum temperature 8, which can be used in the rainy zone for expressing an approximate value of PET using the formula:
PET (mm day-’ ) = 0.308, (OC) - 5.9
If the data needed for “correctingyy the values of evaporation in pans in order to obtain PET are not available, one may apply coefficients as a function of the season and the latitude. In the present case, the pans were either buried in bare soil in the dry zone or placed in grass in the rainy zone. Such coefficients are listed in Table II.
Generally, it is hazardous to use empirical formulas since many of them were developed under climates considerably different from those of Africa.
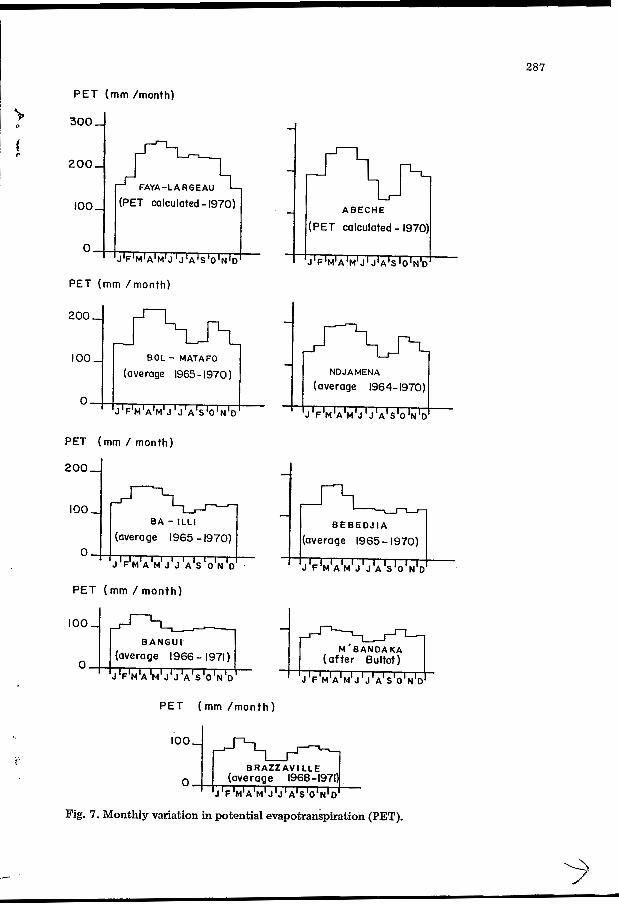
4. MEASURED VALUES OF PET
They are listed in Table III and represented in Fig. 7. In the desertic zone at Largeau, PET estimated from a pan is equal to
PET obtained from Penman’s equation. Average annual PET is estimated at 2400 mm.
In the sahelian zone, the average annual value estimated at AbCché is 2250”. It may be assumed that annual PET ranges from 1800 to 2300”. The maximum values occur in April and October, the minimum values in August (in the middle of the rainy season) and January (cool season).
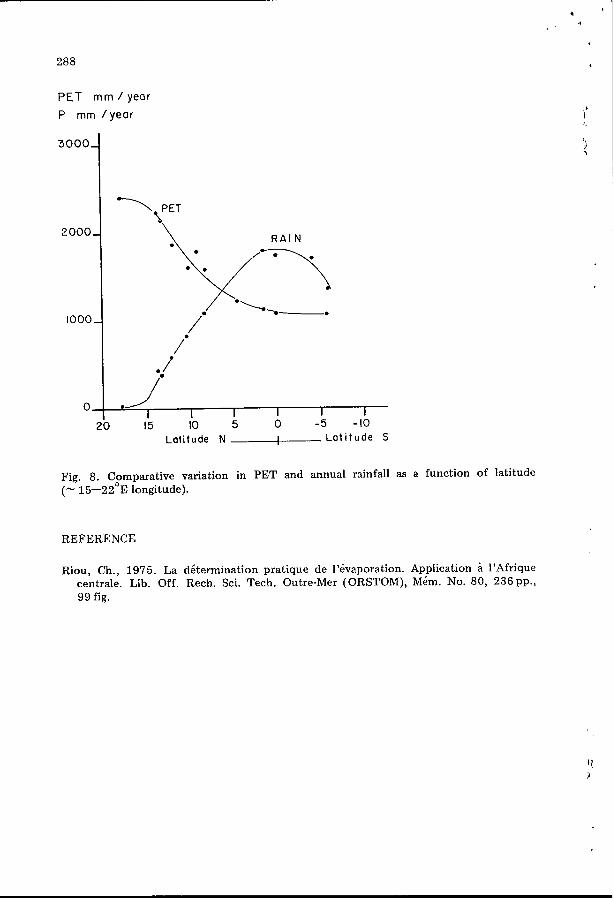
In the tropical rainy zone, extreme values are slightly lower. From August to January, monthly PET ranges from 120 to 130 mm (Fig. 8).
285
.Jul. Aug. Sep. oct. Nov. Dec. Yearly ~ ~ ~- ~ ~~~~
0.78 0.72 0.75 0.86 0.84 0.75 0.80 0.72 0.70 0.72 0.87 0.92 0.85 0.80 0.71 0.65 0.71 0.72 0.75 0.74 0.75 0.82 0.79 0.77 0.76 0.67 0.70 0.75 0.81 0.73 0.73 . 0.76 0.74 0.80 0.78 0.84 0.81 0.79 0.77 0.75 0.74 0.75
In the equatorial zone, monthly PET is - 100 mm. Annual variability of PET is small. In Ndjamena, the maximum
deviation from the interannual mean is +- 5% over 6 yr. For monthly values, the deviation hardly exceeds k 10% over 5 yr. Extreme values registered over shorter periods are 86" per decade both in Bol-Mataf0 and Ndjamena. In the tropical rainy zone, the maximum decade value is 67 mm in Ba-Illi, vs. < 51 mm in Bangui and 42 mm in Brazzaville.
The comparison between PET and annual rainfall shows that the curves intersect at - 6"N latitude and 1350-mm precipitation. This does not mean that all the water needs are met at this point since the rainfall distribution also plays a role.
5. CONCLUSION
i
These experimental data on PET illustrate the climatic contrasts between warm and dry zones on the one hand and rainy zones with strong haze on the other hand. They show how expensive irrigated farming would be in the sahelian zone which has persistently high water requirements. For the desertic zone, however, we obtained lower values than those reported by some workers who overestimated evaporation (data from Piche evaporimeter or free water pans without irrigated surrounding field).
These data which were used together with rainfall in water-balance studies provide information on the duration of dry periods, the evolution of the soil-water content storage and the amount of water needed for irrigation. They also contribute to a better understanding of the climates.
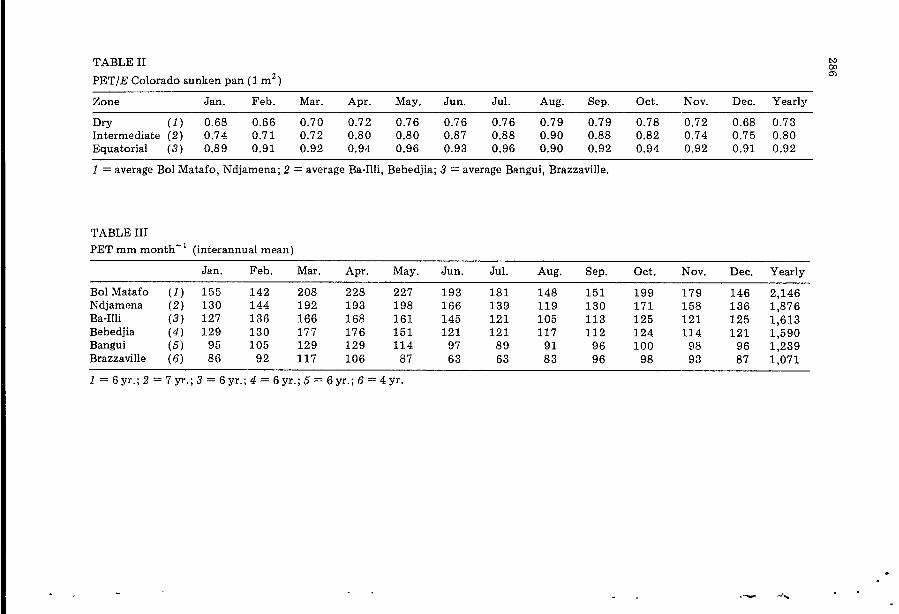
TABLE II PETIE Colorado sunken pan (1 m2)
Zone Jan. Feb. Mar. Apr. May. Jun. Jul. Aug. Sep. Oct. Nov. Dec. Yearly
Dry ( 1 ) 0.68 0.66 0.70 0.72 0.76 0.76 0.76 0.79 0.79 0.78 0.72 0.68 0.73 Intermediate (2) 0.74 0.71 0.72 0.80 0.80 0.87 0.88 0.90 0.88 0.82 0.74 0.75 0.80 Equatorial (3) 0.89 0.91 0.92 0.94 0.96 0.93 0.96 0.90 0.92 0.94 0.92 0.91 0.92
1 = average Bol Matafo, Ndjamena; 2 = average Ba-Illi, Bebedjia; 3 = average Bangui, Brazzaville,
TABLE III PET mm month-’ (interannual mean)
Jan. Feb. Mar. Apr. May. Jun. Jul. Aug. Sep. Oct. Nov. Dec. Yearly
BolMatafo ( 1 ) 155 142 208 228 227 193 181 148 151 199 179 146 2,146 Ndjamena (2) 130 144 192 193 198 166 139 119 130 171 158 136 1,876 Ba-Illi (3) 127 136 166 168 1 6 1 145 121 105 113 125 1 2 1 125 1,613 Bebedjia ( 4 ) 129 130 177 176 151 121 1 2 1 117 112 124 114 121 1,590 Bangui (5) 95 105 129 129 114 97 89 9 1 96 100 98 96 1,239 Brazzaville (6) 86 92 117 106 87 63 63 83 96 98 93 87 1,071
1 = 6 yr. ; 2 = 7 yr. ; 3 = 6 yr.; 4 = 6 yr. ; 5 = 6 yr.; 6 = 4 yr.
- *
L
. . .- 2.
P E T (mm /month)
7
i I
, ,
(PET calculated - 1970)
O
P E T (mm /month)
I O0 BOL - MATAF0
(average 1965- 1970)
O
PET ( mm / mon th)
200 4 100
O
BA - ILL1
(average 1965 -1970) BA - ILL1
(average 1965 -1970)
PET (mm / m o n t h )
O
i :
P E T (mm /month)
287
1
ABECHE
(PET calculated - 197c
-Ir-!- { (NDJAME? (overage 1964- 1970)
-I
B E B E D J I A
(average 1965 - 1970)
M 'BANDA UA (of ter Bultot )
O
Fig. 7. Monthly variation in potential evapotranspiration (PET).
. .c
288
PET m m / yeor P mm /year
zool 1000
R A I N
/
*/*
O I I I I 1 20 15 IO 5 O -5 -10
Lotitude N ~b, Lotitude S
Fig. 8. Coomparative variation in PET and annual rainfall as a function of latitude (- 15-22 E longitude).
REFERENCE
Riou, Ch., 1975. La détermination pratique de l’évaporation. Application i l’Afrique centrale. Lib. Off. Rech. Sci. Tech. Outre-Mer (ORSTOM), Mém. No. 80, 236pp., 99 fig.
Copyright © 2022 FDOKUMEN