Serum UPLC-MS/MS metabolic profiling in an experimental model for acute-liver injury reveals...
27
Serum UPLC-MS/MS metabolic profiling in an experimental model for acute-liver injury reveals potential biomarkers for hepatotoxicity Esperanza Gonzalez, Metabolomics Unit, CIC bioGUNE, CIBERehd, Bizkaia Technology Park, 48160 Derio, Bizkaia, Spain Sebastiaan van Liempd, Metabolomics Platform, CIC bioGUNE, CIBERehd, Bizkaia Technology Park, 48160 Derio, Bizkaia, Spain Javier Conde-Vancells, Metabolomics Unit, CIC bioGUNE, CIBERehd, Bizkaia Technology Park, 48160 Derio, Bizkaia, Spain Virginia Gutierrez-de Juan, Metabolomics Unit, CIC bioGUNE, CIBERehd, Bizkaia Technology Park, 48160 Derio, Bizkaia, Spain Miriam Perez-Cormenzana, OWL Genomics, Bizkaia Technology Park, 48160 Derio, Bizkaia, Spain Rebeca Mayo, OWL Genomics, Bizkaia Technology Park, 48160 Derio, Bizkaia, Spain Agustin Berisa, R&D and Innovation Department, FAES FARMA S.A., 48940 Leioa, Bizkaia, Spain Cristina Alonso, OWL Genomics, Bizkaia Technology Park, 48160 Derio, Bizkaia, Spain Cesar A. Marquez, MD Renal, Bizkaia Technology Park, 48160 Derio, Bizkaia, Spain Jonathan Barr, OWL Genomics, Bizkaia Technology Park, 48160 Derio, Bizkaia, Spain Shelly C. Lu, Division of Gastrointestinal and Liver Diseases, Keck School of Medicine, University Southern California, Los Angeles, CA 90033, USA Jose M. Mato, and Metabolomics Unit, CIC bioGUNE, CIBERehd, Bizkaia Technology Park, 48160 Derio, Bizkaia, Spain Juan M. Falcon-Perez Metabolomics Unit, CIC bioGUNE, CIBERehd, Bizkaia Technology Park, 48160 Derio, Bizkaia, Spain, IKERBASQUE, Basque Foundation for Science, 48011 Bilbao, Spain © Springer Science+Business Media, LLC 2011 Correspondence to: Juan M. Falcon-Perez, [email protected]. NIH Public Access Author Manuscript Metabolomics. Author manuscript; available in PMC 2012 November 06. Published in final edited form as: Metabolomics. 2012 ; 8(6): 997–1011. doi:10.1007/s11306-011-0329-9. $watermark-text $watermark-text $watermark-text
Transcript of Serum UPLC-MS/MS metabolic profiling in an experimental model for acute-liver injury reveals...

Serum UPLC-MS/MS metabolic profiling in an experimentalmodel for acute-liver injury reveals potential biomarkers forhepatotoxicity
Esperanza Gonzalez,Metabolomics Unit, CIC bioGUNE, CIBERehd, Bizkaia Technology Park, 48160 Derio, Bizkaia,Spain
Sebastiaan van Liempd,Metabolomics Platform, CIC bioGUNE, CIBERehd, Bizkaia Technology Park, 48160 Derio,Bizkaia, Spain
Javier Conde-Vancells,Metabolomics Unit, CIC bioGUNE, CIBERehd, Bizkaia Technology Park, 48160 Derio, Bizkaia,Spain
Virginia Gutierrez-de Juan,Metabolomics Unit, CIC bioGUNE, CIBERehd, Bizkaia Technology Park, 48160 Derio, Bizkaia,Spain
Miriam Perez-Cormenzana,OWL Genomics, Bizkaia Technology Park, 48160 Derio, Bizkaia, Spain
Rebeca Mayo,OWL Genomics, Bizkaia Technology Park, 48160 Derio, Bizkaia, Spain
Agustin Berisa,R&D and Innovation Department, FAES FARMA S.A., 48940 Leioa, Bizkaia, Spain
Cristina Alonso,OWL Genomics, Bizkaia Technology Park, 48160 Derio, Bizkaia, Spain
Cesar A. Marquez,MD Renal, Bizkaia Technology Park, 48160 Derio, Bizkaia, Spain
Jonathan Barr,OWL Genomics, Bizkaia Technology Park, 48160 Derio, Bizkaia, Spain
Shelly C. Lu,Division of Gastrointestinal and Liver Diseases, Keck School of Medicine, University SouthernCalifornia, Los Angeles, CA 90033, USA
Jose M. Mato, andMetabolomics Unit, CIC bioGUNE, CIBERehd, Bizkaia Technology Park, 48160 Derio, Bizkaia,Spain
Juan M. Falcon-PerezMetabolomics Unit, CIC bioGUNE, CIBERehd, Bizkaia Technology Park, 48160 Derio, Bizkaia,Spain, IKERBASQUE, Basque Foundation for Science, 48011 Bilbao, Spain
© Springer Science+Business Media, LLC 2011
Correspondence to: Juan M. Falcon-Perez, [email protected].
NIH Public AccessAuthor ManuscriptMetabolomics. Author manuscript; available in PMC 2012 November 06.
Published in final edited form as:Metabolomics. 2012 ; 8(6): 997–1011. doi:10.1007/s11306-011-0329-9.
$waterm
ark-text$w
atermark-text
$waterm
ark-text

Juan M. Falcon-Perez: [email protected]
AbstractA key interest in clinical diagnosis and pharmaceutical industry is to have a repertoire ofnoninvasive biomarkers to—individually or in combination—be able to infer or predict the degreeof liver injury caused by pathological conditions or drugs. Metabolomics—a comprehensive studyof global metabolites—has become a highly sensitive and powerful tool for biomarker discoverythanks to recent technological advances. An ultra-performance liquid chromatography/time-of-flight tandem mass spectrometry (UPLC/TOF MS/MS)-based metabolomics approach wasemployed to investigate sera from galactosamine-treated rats to find potential biomarkers for acuteliver injury. Hepatic damage was quantified by determining serum transaminase activity and insitu liver histological lesions. Principal component analysis in combination with coefficient ofcorrelation analysis was used for biomarker selection and identification. According to the data,serum levels of several metabolites including glucose, amino acids, and membrane lipids weresignificantly modified, some of them showing a high correlation with the degree of liver damagedetermined by histological examination of the livers. In conclusion, this study supports thatUPLC-MS/MS based serum metabolomics in experimental animal models could be a powerfulapproach to search for biomarkers for drug- or disease-induced liver injury.
KeywordsGalactosamine; Hepatotoxicity; Acute-liver injury; DILI; Biomarkers; Serum metabolic profiling;UPLC-MS/MS metabolomics
1 IntroductionDrug-induced liver injury (DILI) remains a major cause of worldwide mortality (Boelsterliand Lim 2007; Ulrich 2007) and represents a serious clinical and financial problem becauseit is the single greatest cause of attrition in drug development and withdrawal of approveddrugs from the market (Kaplowitz 2001). The cost of introducing a new drug to the market(estimated at hundred of millions of dollars) generates a high socio-economical pressure togenerate new tools and approaches for the identification of highly sensitive biomarkers ofliver toxicity. Currently, besides liver biopsy the activity of a series of hepatic enzymes andproteins released into the blood by damaged liver cells are the most useful tools available indetecting liver damage in a non-invasive manner. Hepatic screening test measuring bilirubin(total and unconjugated), alkaline phosphatase, aspartate aminotransferase (AST), alanineaminotransferase (ALT), albumin, gamma-glutamyl transferase (GGT), prothrombin timeand glutathione-S-transferase are routinely used in both preclinical and human clinical drugstudies (Ozer et al. 2008). The inherent deficiencies and limitations in sensitivity orspecificity of each of these existing markers preclude the use of any one marker as the“standard” for detecting liver damage or DILI (Ozer et al. 2008; Muller and Dieterle 2009).The development of novel diagnostic biomarkers with greater sensitivity and specificity canenhance the efficiency in the detection of low-degree liver damage, increasing theconfidence of drug safety for release into the market.
Metabolomics refers to the comprehensive analysis of endogenous small molecules presentin a biological system. The recent technological development of analytical instrumentscombined with rapid progress in bioinformatics has led to new opportunities to quickly andsimultaneously measure and model huge numbers of metabolites in biological samples(Nicholson and Wilson 2003; Fernie et al. 2004; Chen et al. 2007; Clarke and Haselden2008). In consequence, metabolomics has found broad application in the identification ofbiomarkers, and in the unravelling of pathophysiological mechanism in many scientific
Gonzalez et al. Page 2
Metabolomics. Author manuscript; available in PMC 2012 November 06.
$waterm
ark-text$w
atermark-text
$waterm
ark-text

fields, such as plant biology (Schauer and Fernie 2006), toxicology (Coen et al. 2007; Clarkeand Haselden 2008) and disease diagnosis (Brindle et al. 2002). Currently, metabolomicprofiling has been performed using a number of techniques, including high-field nuclearmagnetic resonance (NMR) (Nicholls et al. 2003; Duarte et al. 2005; Coen et al. 2007), andgas or liquid chromatography/mass spectrometry (GC–MS, LC-MC)(Lin et al. 2010; Lutz etal. 2006; Major et al. 2006; Zhang et al. 2007; Kushnir et al. 2009). While NMRdemonstrates its advantages in highly selective and non-destructive analysis, LC–MSpossesses much higher sensitivity and resolution. The development of ultra-performanceliquid chromatography (UPLC) has made it possible to achieve even higher resolutions,higher sensitivities, and rapid separations when compared to conventional LC methods(Nordstrom et al. 2006; Novakova et al. 2006). UPLC combined with orthogonalacceleration time-of-flight mass spectrometry (oaTOF–MS), which enables the exact massmeasurements, is undoubtedly a suitable system for metabolomics (Chan et al. 2007).However, because of this high sensitivity and capacity to detect subtle changes, the use ofwell-characterized in vitro (Dan and Yeoh 2008; Gomez-Lechon et al. 2008) and in vivo(Newsome et al. 2000; Tunon et al. 2009) experimental models are advisable in order tominimize the impact of variables such as age, gender, genetic and lifestyle heterogeneity.
For the identification of non-invasive biomarkers enabling direct inference of the extent ofliver-injury, an UPLC/TOF-MS-based metabolomics approach was applied to characterizethe serum metabolic profile associated with acute liver injury. D-galactosamine (galN)-treated rats were chosen as the experimental model for two reasons. First, it is a classical“model” hepatotoxin resembling human viral hepatitis (Keppler et al. 1968) that has beenwidely used in studies on different aspects such as mechanism of damage induction,biomarker discovery and therapy of acute liver injury (El-Mofty et al. 1975; Stramentinoli etal. 1978; Maezono et al. 1996; Coen et al. 2007; Feng et al. 2007; Lv et al. 2007; Komano etal. 2008; Miller et al. 2008; Yovchev et al. 2008; Kitazawa et al. 2009). Second, studies inrats revealed an extreme inter-animal variability in the extent of the induced liver injury(Coen et al. 2007; Miller et al. 2008), which is convenient since it gives the opportunity tocorrelate different changes in metabolite levels to different stages of liver injury. Our resultsindicate that serum levels of many membrane lipids including mono anddiacylglycerolphospholipids, and sphingomyelins were significantly affected by thetreatment with the hepatotoxin. Remarkably, a number of them were identified by usingexact mass measurements, and found to be in high correlation with the degree of cell deathin the liver as assessed by histological examination. These results constitute a clear supportto use UPLC-MS-based metabolomics to identify non-invasive biomarkers for liver damage.
2 Materials and methods2.1 Animal model and samples collection
All the animal experimentation was conducted in accordance with the Spanish Guide for theCare and Use of Laboratory Animals (RD 1201/2005—BOE 21/10/05). Twenty-three maleWistar rats (14 weeks old, body weight 300–400 g), were maintained in an environmentallycontrolled room at 22°C on a 12 h light/dark cycle and provided with standard diet (RodentMaintenance Diet, Harlan Teklad Global Diet 2014) and water ad libitum. The rats wererandomly allocated in two groups. The test group (n = 11) received an intraperitonealinjection of 1 g/kg/5 ml of D(+)-galactosamine (2-amino-2-deoxy-D-galactose)hydrochloride (Sigma-Aldrich Chemical Co., Steinheim Germany) while animals in thecontrol group (n = 12) were injected with the same volume of saline solution (5 ml/Kg of0.9% NaCl sterile). Four days before (untreated samples) and 18-h after the injection,individualized blood samples of each animal were drawn under anesthesia (4% isoflurane),after a 12-h food fasting period and, the samples were quickly processed to obtain the seraby using gel serum separator tubes (BD Microtainer SST Tubes). The obtained sera were
Gonzalez et al. Page 3
Metabolomics. Author manuscript; available in PMC 2012 November 06.
$waterm
ark-text$w
atermark-text
$waterm
ark-text
transferred to a fresh Eppendorf tubes and stored at −80°C. Immediately after bloodextraction, the liver of each animal was excised and stored in 10% formalin forhistopathological analysis.
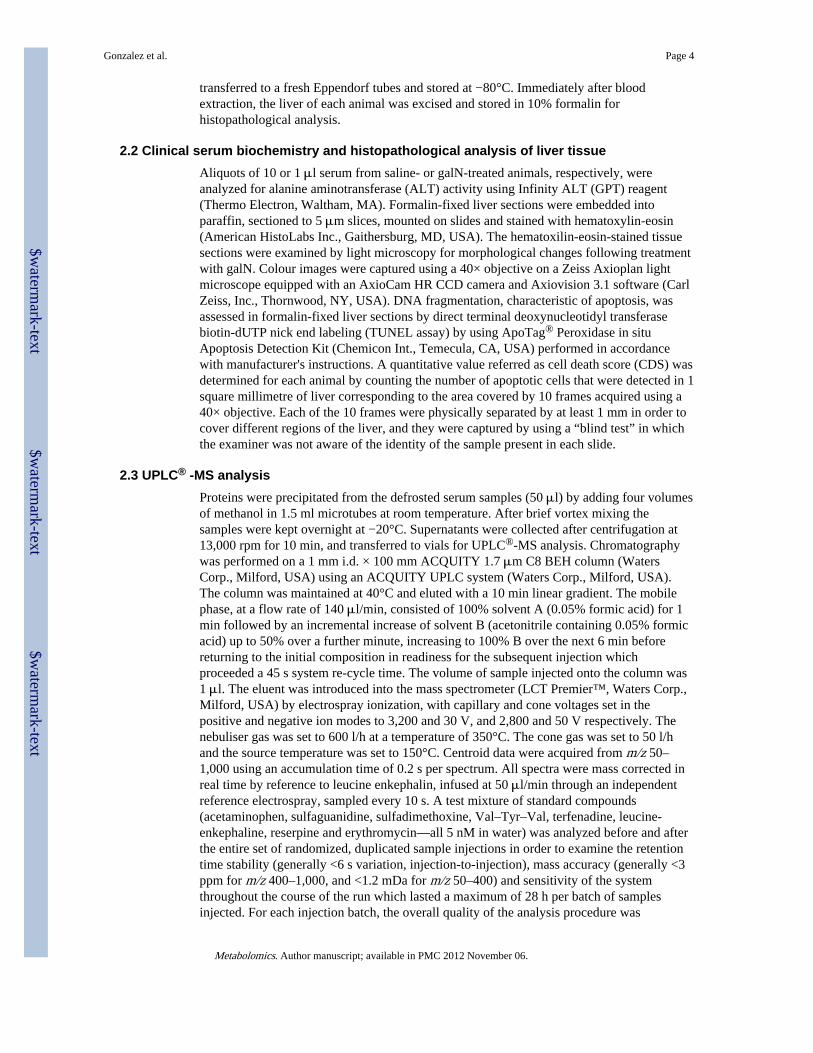
2.2 Clinical serum biochemistry and histopathological analysis of liver tissueAliquots of 10 or 1 μl serum from saline- or galN-treated animals, respectively, wereanalyzed for alanine aminotransferase (ALT) activity using Infinity ALT (GPT) reagent(Thermo Electron, Waltham, MA). Formalin-fixed liver sections were embedded intoparaffin, sectioned to 5 μm slices, mounted on slides and stained with hematoxylin-eosin(American HistoLabs Inc., Gaithersburg, MD, USA). The hematoxilin-eosin-stained tissuesections were examined by light microscopy for morphological changes following treatmentwith galN. Colour images were captured using a 40× objective on a Zeiss Axioplan lightmicroscope equipped with an AxioCam HR CCD camera and Axiovision 3.1 software (CarlZeiss, Inc., Thornwood, NY, USA). DNA fragmentation, characteristic of apoptosis, wasassessed in formalin-fixed liver sections by direct terminal deoxynucleotidyl transferasebiotin-dUTP nick end labeling (TUNEL assay) by using ApoTag® Peroxidase in situApoptosis Detection Kit (Chemicon Int., Temecula, CA, USA) performed in accordancewith manufacturer's instructions. A quantitative value referred as cell death score (CDS) wasdetermined for each animal by counting the number of apoptotic cells that were detected in 1square millimetre of liver corresponding to the area covered by 10 frames acquired using a40× objective. Each of the 10 frames were physically separated by at least 1 mm in order tocover different regions of the liver, and they were captured by using a “blind test” in whichthe examiner was not aware of the identity of the sample present in each slide.
2.3 UPLC® -MS analysisProteins were precipitated from the defrosted serum samples (50 μl) by adding four volumesof methanol in 1.5 ml microtubes at room temperature. After brief vortex mixing thesamples were kept overnight at −20°C. Supernatants were collected after centrifugation at13,000 rpm for 10 min, and transferred to vials for UPLC®-MS analysis. Chromatographywas performed on a 1 mm i.d. × 100 mm ACQUITY 1.7 μm C8 BEH column (WatersCorp., Milford, USA) using an ACQUITY UPLC system (Waters Corp., Milford, USA).The column was maintained at 40°C and eluted with a 10 min linear gradient. The mobilephase, at a flow rate of 140 μl/min, consisted of 100% solvent A (0.05% formic acid) for 1min followed by an incremental increase of solvent B (acetonitrile containing 0.05% formicacid) up to 50% over a further minute, increasing to 100% B over the next 6 min beforereturning to the initial composition in readiness for the subsequent injection whichproceeded a 45 s system re-cycle time. The volume of sample injected onto the column was1 μl. The eluent was introduced into the mass spectrometer (LCT Premier™, Waters Corp.,Milford, USA) by electrospray ionization, with capillary and cone voltages set in thepositive and negative ion modes to 3,200 and 30 V, and 2,800 and 50 V respectively. Thenebuliser gas was set to 600 l/h at a temperature of 350°C. The cone gas was set to 50 l/hand the source temperature was set to 150°C. Centroid data were acquired from m/z 50–1,000 using an accumulation time of 0.2 s per spectrum. All spectra were mass corrected inreal time by reference to leucine enkephalin, infused at 50 μl/min through an independentreference electrospray, sampled every 10 s. A test mixture of standard compounds(acetaminophen, sulfaguanidine, sulfadimethoxine, Val–Tyr–Val, terfenadine, leucine-enkephaline, reserpine and erythromycin—all 5 nM in water) was analyzed before and afterthe entire set of randomized, duplicated sample injections in order to examine the retentiontime stability (generally <6 s variation, injection-to-injection), mass accuracy (generally <3ppm for m/z 400–1,000, and <1.2 mDa for m/z 50–400) and sensitivity of the systemthroughout the course of the run which lasted a maximum of 28 h per batch of samplesinjected. For each injection batch, the overall quality of the analysis procedure was
Gonzalez et al. Page 4
Metabolomics. Author manuscript; available in PMC 2012 November 06.
$waterm
ark-text$w
atermark-text
$waterm
ark-text

monitored using ten repeat extracts of a pooled serum sample. Corresponding root meansquare coefficients of variation were 15.3% over all variables detected in the positive ionmode, and 11.7% in the negative ion mode. Online tandem mass spectrometry (MS/MS)experiments for metabolite identification were performed on a Waters QTOF Premier™(Waters Corp., Milford, USA) instrument operating in both the positive and negative ionelectrospray modes; source parameters were identical to those employed in the profilingexperiments, except for the cone voltage which was increased (30–70 V) when pseudo MS/MS/MS data were required. During retention time windows corresponding to the elution ofthe compounds under investigation the quadrupole was set to resolve and transmit ions withappropriate mass-to-charge values. The selected ions then traversed an argon-pressurizedcell, with a collision energy voltage (typically between 5 and 50 V) applied in accordancewith the extent of ion fragmentation required. Subsequent TOF analysis of the fragment ionsgenerated accurate mass (generally <3 ppm for m/z 400–1,000, and <1.2 mDa for m/z 50–400) MS/MS or pseudo MS/MS/MS spectra corrected in real time by reference to leucine-enkephalin, infused at 50 μl/min through an independent reference electrospray, sampledevery 10 s. Centroid data were acquired between m/z 50–1,000 using an accumulation timeof 0.2 s per spectrum.
2.4 Data processingAll data were processed using the MarkerLynx application manager for MassLynx 4.1software (Waters Corp., Milford, USA). The LC/MS data were peak-detected and noise-reduced in both the LC and MS domains such that only true analytical peaks were furtherprocessed by the software (e.g., noise spikes are rejected). A list of intensities(chromatographic peak areas) of the peaks detected was then generated for the firstchromatogram, using the Rt-m/z data pairs as identifiers. This process was repeated for eachLC-MS analysis and the data sorted such that the correct peak intensity data for each Rt-m/zpair were aligned in a table. Detected variables that were found to be zero in both injectionsof any serum extract corresponding to untreated animals were then removed from thedataset. Although this process would be expected to remove variables associated withxenobiotic metabolites, the influence of these species still has a strong impact on theanalysis by way of ion suppression effects. In order to remove this interference, all variablesco-eluting with xenobiotic metabolites, found in the retention time region 2.75–3.55 min,were eliminated. In the case of the positive ion mode, the resulting variable ion intensitieswere then normalized within each injection, to the sum of peak intensities in that injection.In the negative ion mode the normalization factor for each injection was calculated from theratio of the median intensity to the median intensity of a reference serum injection, asobtained from all variables contained in the retention time bin 6–8 min. All zeros containedwithin the normalized dataset were substituted with missing values to form a single matrixwith Rt-m/z pairs for each injection. The final dataset was mean centered and pareto scaledduring multivariate data analysis.
2.5 Multivariate statistical analysisThe first objective in the data analysis process is to reduce the dimensionality of thecomplex data set to enable easy visualization of any metabolic clustering of the differentgroups of samples. This has been achieved by principal components analysis (PCA) wherethe data matrix is reduced to a series of principal components (PCs), each a linearcombination of the original Rt-m/z pair peak areas. Each successive PC explains themaximum amount of variance possible, not accounted for by the previous PCs. Hence thescores plots shown in the PCA figures—where the first two principal components, t[1] andt[2], are plotted—represent the most important metabolic variation in the samples capturedby the analysis. The corresponding loadings (p[1], p[2] etc.) for each model are theprojections of the model variables onto each of the principal components; i.e., variables with
Gonzalez et al. Page 5
Metabolomics. Author manuscript; available in PMC 2012 November 06.
$waterm
ark-text$w
atermark-text
$waterm
ark-text

positive loadings, p[A], correlate with positively scoring, t[A], samples (injections) on thesame component, A. The performance levels of the PCA models were evaluated using theR2X (variance modeled) and Q2 (cross-validated R2X) parameters. Robust trends capturedby PCA models are reflected by similar values of R2X and Q2.
2.6 Metabolite identificationExact molecular mass data from redundant m/z peaks corresponding to the formation ofdifferent parent (e.g., cations in the positive ion mode, anions in the negative ion mode,adducts, multiple charges) and product (formed by spontaneous “in-source” CID) ions werefirst used to help confirm the metabolite molecular mass. This information was thensubmitted for database searching, either in-house or using the online ChemSpider databasewhere the Kegg, Human Metabolome Database and Lipid Maps data source options wereselected. MS/MS data analysis highlights neutral losses or product ions, which arecharacteristic of metabolite groups and can serve to discriminate between database hits.Specific metabolite group MS/MS characterization methods have been described previously(Barr et al. 2010). Regiochemistry [e.g., PC(18:0/0:0), PC(0:0/18:0)] was only specified if itcould be corroborated by mass spectral evidence. However, in many instances thesedifferences can be inferred by relative abundance and retention time information, e.g., ingeneral sn-1 monoacylglycerophosphocholine [PC(X:X/0:0)] is usually much moreabundant, and chromatographically retained, than sn-2 monoacylglycerophosphocholine[PC(0:0/X:X)].
2.7 StatisticsThe strength of the relationship between the different parameters for liver damagequantization was estimated by a Pearson correlation coefficient. The correlation betweeneach of the serum metabolites detected and the degree of liver damage was assessed bycalculation of Spearman rank correlation coefficients. Value of the correlation coefficientsbeing very near to zero, shows that no significant correlation exists between the comparedparameters. Fisher's exact test was used to assess the significance of the association betweenmetabolite and degree of liver damage. A statistical significant difference was consideredwhen P value was less than 0.01.
A regression model based on the logistic function f(z) was created to predict the risk ofsuffering acute-liver injury.
where:
Gonzalez et al. Page 6
Metabolomics. Author manuscript; available in PMC 2012 November 06.
$waterm
ark-text$w
atermark-text
$waterm
ark-text

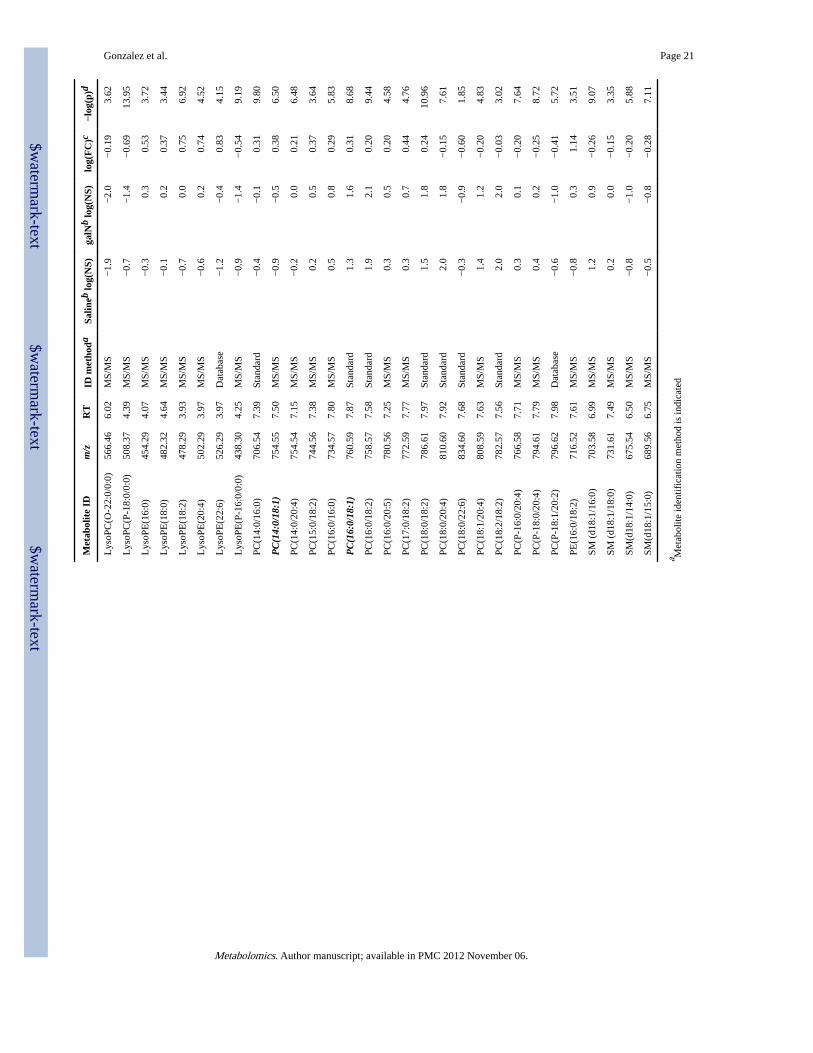
The logit (z) in this model was calculated using the intensity (Imetabolite) of a set ofmetabolites significantly affected by galN treatment (Table 1, in bold). The arbitrarilychosen metabolites have in common a small relative standard deviation between animals(<2.5%) before treatment with saline solution or galN, and after treatment with the salinesolution. The calculated means for the intensity of these metabolites differ significantly(>1.9 times) between animals treated with galN and those treated with the saline solution inall cases.
The regression coefficients (βi) were defined as follows:
where Īuntreated samples represents the mean intensity of the chosen metabolite (i) in allsamples before treatment. The values in the quotient (ΣIn) represent the sum of intensitiesobserved for a set of stable metabolites, and it is used as an internal normalizing step tofacilitate inter-individual evaluation. The set includes six metabolites that showed a minimalrelative standard deviation (<2.5%) between all samples before and after saline or galNtreatments, and it is formed by those with m/z 328,318; 358,367; 372,381; 450,750; 516,788and 696,649. These metabolites were detected in all injected samples but discarded in theidentification process of PCA analysis, a tool used to identify significant altered metabolites.This normalization step in the algorithm used allows the grouping of information andprecludes the possible variations due to different instrumental setup. It is a normalization ofsignals within an experiment, so it is done for every animal sample independently.
3 Results3.1 Serum metabolomics profiling of galN-treated rat model for acute liver injury
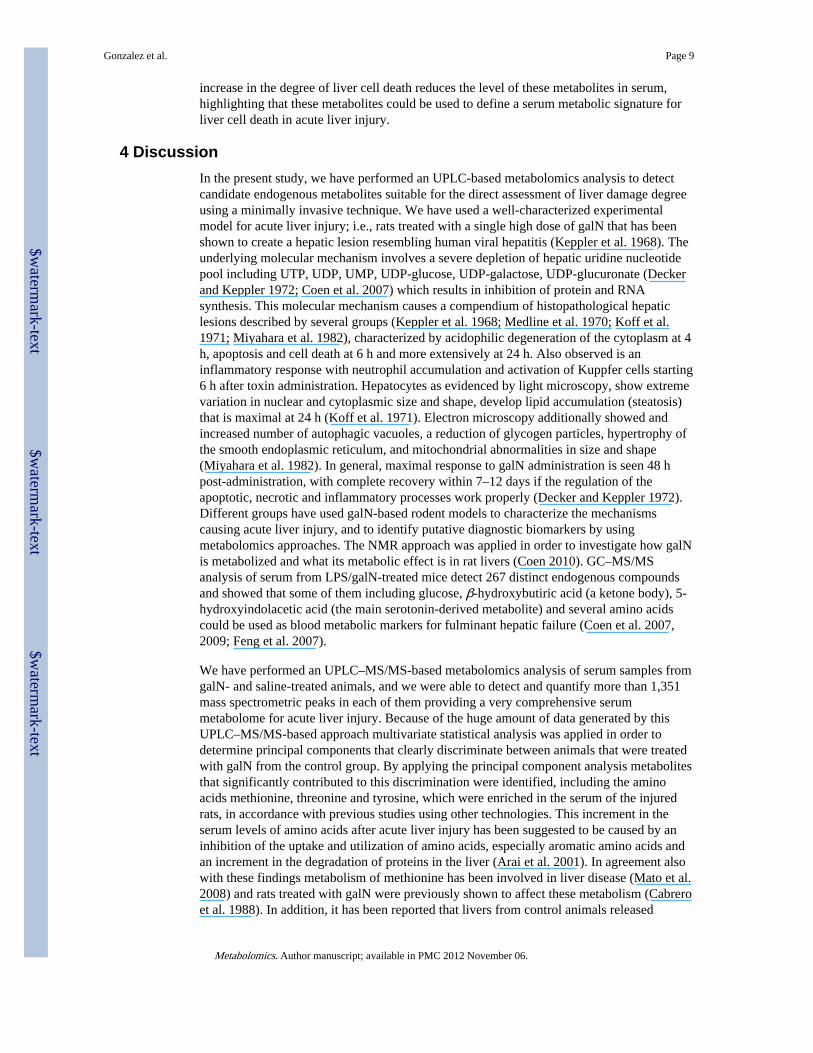
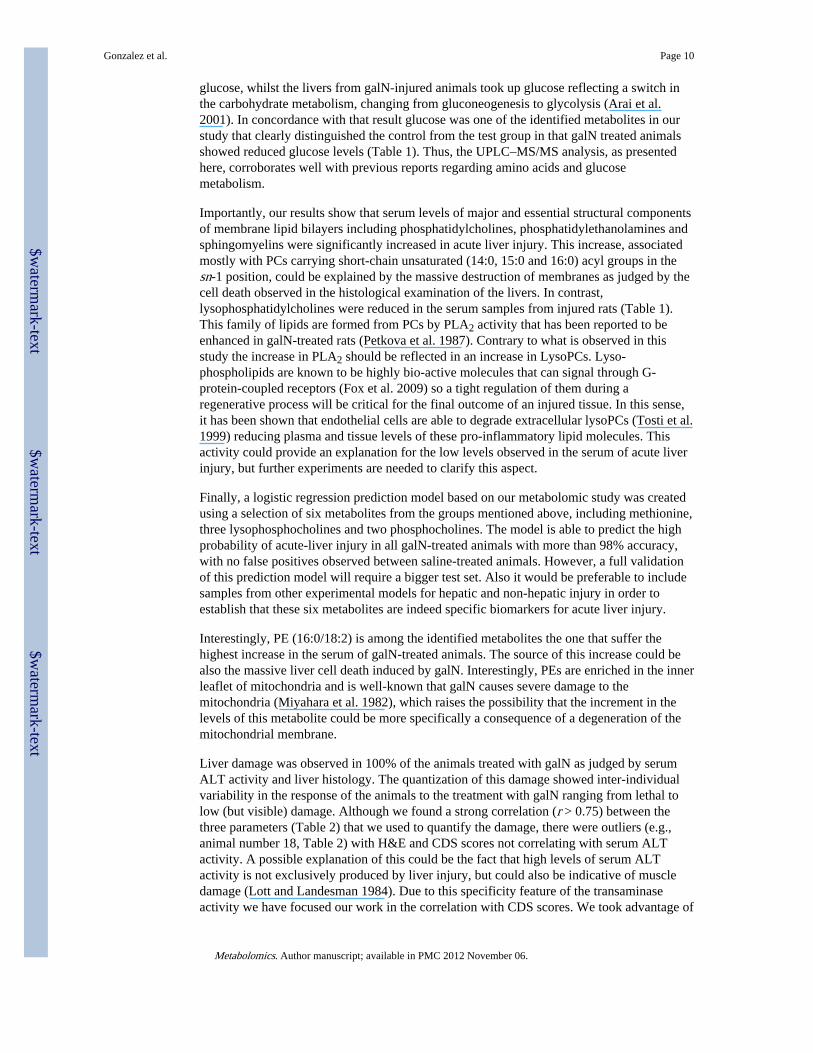
Acute liver injury in a group of male rats was induced by one-single intraperitoneal injectionof galN. The control group received an injection of saline solution only. After 18 h, one ofthe galN-treated rats died and was not further considered in the subsequent study.Individualized blood samples from the remaining of the animals were drawn, analysed byUPLC-MS/MS and subjected of multivariate data analysis. Due to the larger number ofmass spectrometric peaks (1,351) detected in the mass spectrometer working in the positivemode compared to the negative one (143), only data obtained in the former mode wasfurther considered. Principal component analysis (PCA) of these data clearly discriminatedbetween sera of galN-treated rats (Fig. 1, open triangles) and sera of saline-treated rats (opensquares). In addition, PCA analysis showed that saline solution injections did notsignificantly modify the metabolic profile of rat sera as judged by the clustering togetherwith the serum samples of untreated rats (Fig. 1, filled triangles and squares). This supportsthe idea that modifications in the endogenous serum metabolome of the different groupswere mainly due to the treatment with the hepatotoxin. The loading plot of the PCA analysis(Fig. 2) reveals more than 100 serum metabolites grouped in different chemical familieswith a significant weight in the separation of the galN-treated from saline-treated rats. Theyincluded mainly membrane lipids such as phosphatidylcholine, phosphatidylethanolamine,lysophosphatidylcholine or lysophosphatidylethanolamine (Table 1). The serum levels ofsphingomyelins, amino acids (methionine, threonine or tyrosine) and free fatty linoleic(18:2) acid were also significantly altered by the treatment with galN (Table 1). Amongst themetabolites that were identified by MS/MS or analytical standards, a number of cleartendencies were observed; in general sn-1 monoacylglycerophosphocholine, sn-2arachidonyl diacylglycerophosphocholine and sphingolipids were less abundant in animals
Gonzalez et al. Page 7
Metabolomics. Author manuscript; available in PMC 2012 November 06.
$waterm
ark-text$w
atermark-text
$waterm
ark-text
treated with galN, whilst diacylglycerophosphocholines,monoacylglycerophosphoethanolamines and amino acids showed the opposite trend.
A prediction model was created based on the intensity (I) of a set of metabolites (Table 1, inbold) to predict the risk of suffering acute-liver injury. A logit (Table 2) calculated by theequation described in Sect. 2 was able to differentiate both groups, and the probability ofsuffering acute-liver injury changes dramatically only for those animals treated with galN,all of them showing liver injury although with different severity.
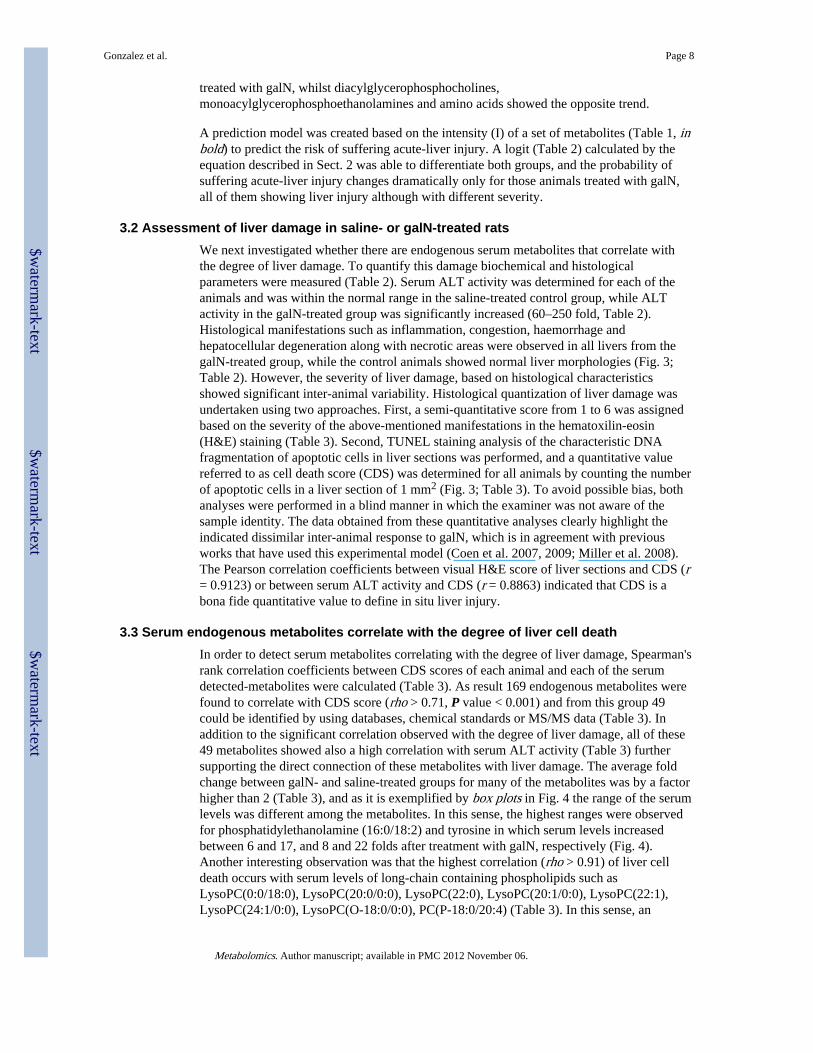
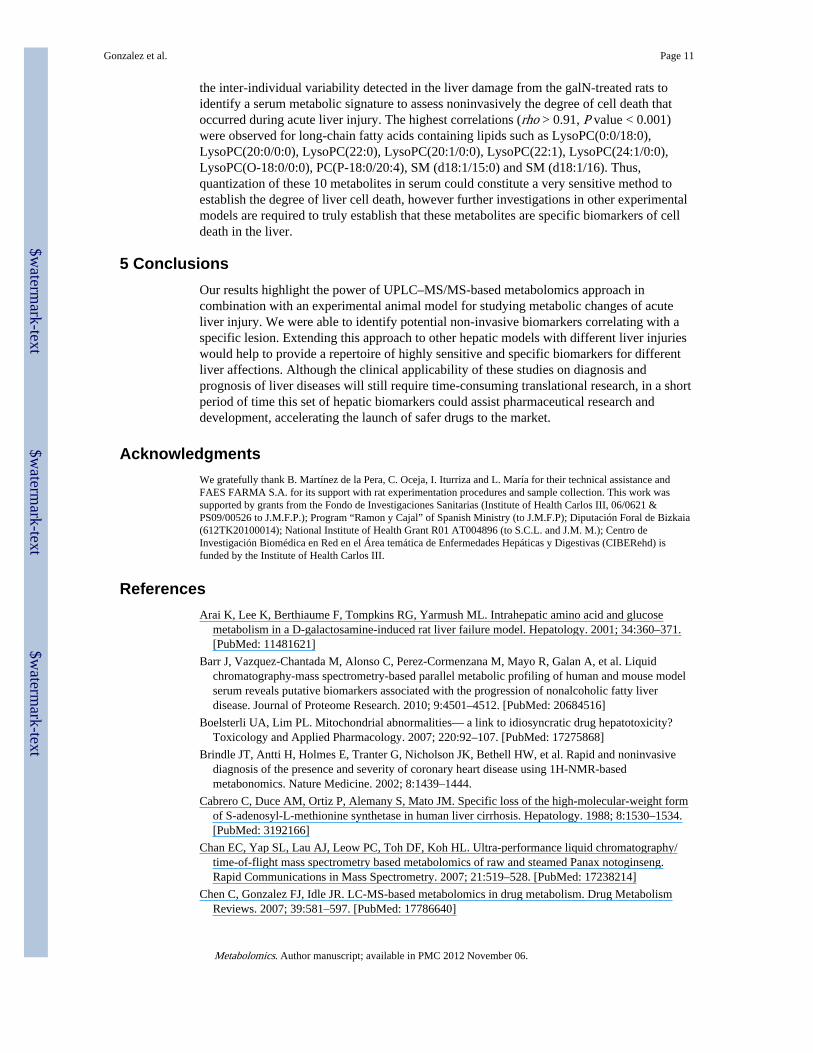
3.2 Assessment of liver damage in saline- or galN-treated ratsWe next investigated whether there are endogenous serum metabolites that correlate withthe degree of liver damage. To quantify this damage biochemical and histologicalparameters were measured (Table 2). Serum ALT activity was determined for each of theanimals and was within the normal range in the saline-treated control group, while ALTactivity in the galN-treated group was significantly increased (60–250 fold, Table 2).Histological manifestations such as inflammation, congestion, haemorrhage andhepatocellular degeneration along with necrotic areas were observed in all livers from thegalN-treated group, while the control animals showed normal liver morphologies (Fig. 3;Table 2). However, the severity of liver damage, based on histological characteristicsshowed significant inter-animal variability. Histological quantization of liver damage wasundertaken using two approaches. First, a semi-quantitative score from 1 to 6 was assignedbased on the severity of the above-mentioned manifestations in the hematoxilin-eosin(H&E) staining (Table 3). Second, TUNEL staining analysis of the characteristic DNAfragmentation of apoptotic cells in liver sections was performed, and a quantitative valuereferred to as cell death score (CDS) was determined for all animals by counting the numberof apoptotic cells in a liver section of 1 mm2 (Fig. 3; Table 3). To avoid possible bias, bothanalyses were performed in a blind manner in which the examiner was not aware of thesample identity. The data obtained from these quantitative analyses clearly highlight theindicated dissimilar inter-animal response to galN, which is in agreement with previousworks that have used this experimental model (Coen et al. 2007, 2009; Miller et al. 2008).The Pearson correlation coefficients between visual H&E score of liver sections and CDS (r= 0.9123) or between serum ALT activity and CDS (r = 0.8863) indicated that CDS is abona fide quantitative value to define in situ liver injury.
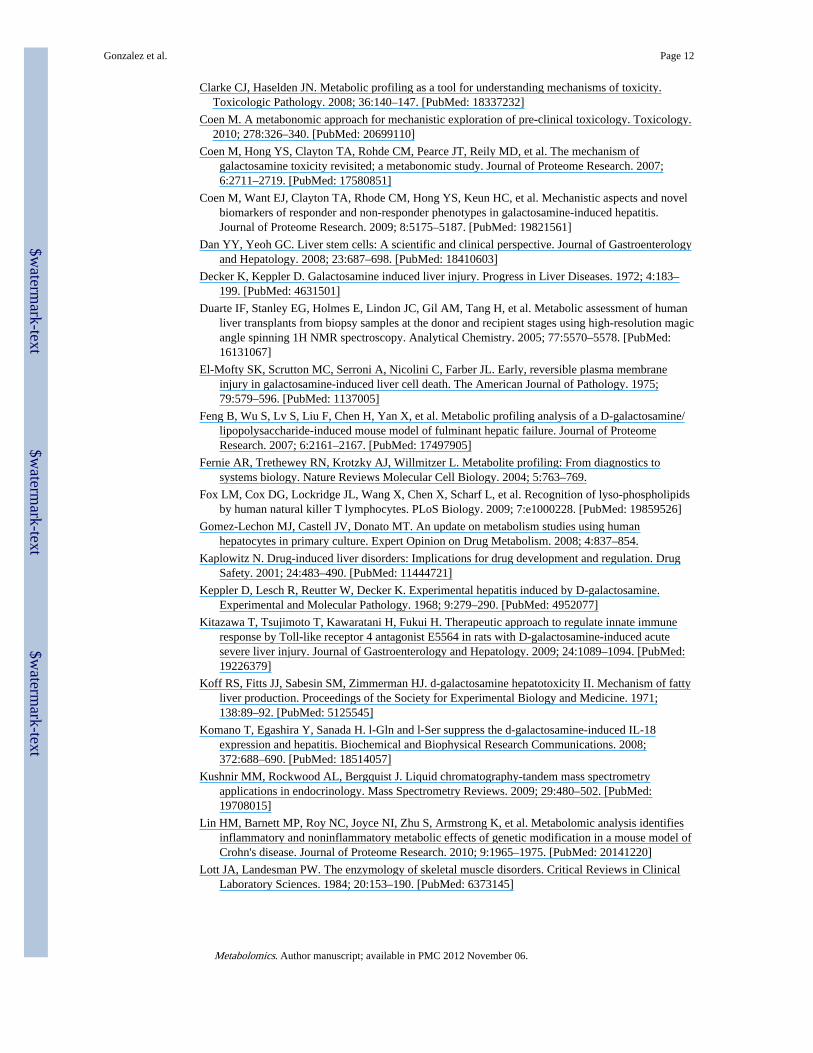
3.3 Serum endogenous metabolites correlate with the degree of liver cell deathIn order to detect serum metabolites correlating with the degree of liver damage, Spearman'srank correlation coefficients between CDS scores of each animal and each of the serumdetected-metabolites were calculated (Table 3). As result 169 endogenous metabolites werefound to correlate with CDS score (rho > 0.71, P value < 0.001) and from this group 49could be identified by using databases, chemical standards or MS/MS data (Table 3). Inaddition to the significant correlation observed with the degree of liver damage, all of these49 metabolites showed also a high correlation with serum ALT activity (Table 3) furthersupporting the direct connection of these metabolites with liver damage. The average foldchange between galN- and saline-treated groups for many of the metabolites was by a factorhigher than 2 (Table 3), and as it is exemplified by box plots in Fig. 4 the range of the serumlevels was different among the metabolites. In this sense, the highest ranges were observedfor phosphatidylethanolamine (16:0/18:2) and tyrosine in which serum levels increasedbetween 6 and 17, and 8 and 22 folds after treatment with galN, respectively (Fig. 4).Another interesting observation was that the highest correlation (rho > 0.91) of liver celldeath occurs with serum levels of long-chain containing phospholipids such asLysoPC(0:0/18:0), LysoPC(20:0/0:0), LysoPC(22:0), LysoPC(20:1/0:0), LysoPC(22:1),LysoPC(24:1/0:0), LysoPC(O-18:0/0:0), PC(P-18:0/20:4) (Table 3). In this sense, an
Gonzalez et al. Page 8
Metabolomics. Author manuscript; available in PMC 2012 November 06.
$waterm
ark-text$w
atermark-text
$waterm
ark-text
increase in the degree of liver cell death reduces the level of these metabolites in serum,highlighting that these metabolites could be used to define a serum metabolic signature forliver cell death in acute liver injury.
4 DiscussionIn the present study, we have performed an UPLC-based metabolomics analysis to detectcandidate endogenous metabolites suitable for the direct assessment of liver damage degreeusing a minimally invasive technique. We have used a well-characterized experimentalmodel for acute liver injury; i.e., rats treated with a single high dose of galN that has beenshown to create a hepatic lesion resembling human viral hepatitis (Keppler et al. 1968). Theunderlying molecular mechanism involves a severe depletion of hepatic uridine nucleotidepool including UTP, UDP, UMP, UDP-glucose, UDP-galactose, UDP-glucuronate (Deckerand Keppler 1972; Coen et al. 2007) which results in inhibition of protein and RNAsynthesis. This molecular mechanism causes a compendium of histopathological hepaticlesions described by several groups (Keppler et al. 1968; Medline et al. 1970; Koff et al.1971; Miyahara et al. 1982), characterized by acidophilic degeneration of the cytoplasm at 4h, apoptosis and cell death at 6 h and more extensively at 24 h. Also observed is aninflammatory response with neutrophil accumulation and activation of Kuppfer cells starting6 h after toxin administration. Hepatocytes as evidenced by light microscopy, show extremevariation in nuclear and cytoplasmic size and shape, develop lipid accumulation (steatosis)that is maximal at 24 h (Koff et al. 1971). Electron microscopy additionally showed andincreased number of autophagic vacuoles, a reduction of glycogen particles, hypertrophy ofthe smooth endoplasmic reticulum, and mitochondrial abnormalities in size and shape(Miyahara et al. 1982). In general, maximal response to galN administration is seen 48 hpost-administration, with complete recovery within 7–12 days if the regulation of theapoptotic, necrotic and inflammatory processes work properly (Decker and Keppler 1972).Different groups have used galN-based rodent models to characterize the mechanismscausing acute liver injury, and to identify putative diagnostic biomarkers by usingmetabolomics approaches. The NMR approach was applied in order to investigate how galNis metabolized and what its metabolic effect is in rat livers (Coen 2010). GC–MS/MSanalysis of serum from LPS/galN-treated mice detect 267 distinct endogenous compoundsand showed that some of them including glucose, β-hydroxybutiric acid (a ketone body), 5-hydroxyindolacetic acid (the main serotonin-derived metabolite) and several amino acidscould be used as blood metabolic markers for fulminant hepatic failure (Coen et al. 2007,2009; Feng et al. 2007).
We have performed an UPLC–MS/MS-based metabolomics analysis of serum samples fromgalN- and saline-treated animals, and we were able to detect and quantify more than 1,351mass spectrometric peaks in each of them providing a very comprehensive serummetabolome for acute liver injury. Because of the huge amount of data generated by thisUPLC–MS/MS-based approach multivariate statistical analysis was applied in order todetermine principal components that clearly discriminate between animals that were treatedwith galN from the control group. By applying the principal component analysis metabolitesthat significantly contributed to this discrimination were identified, including the aminoacids methionine, threonine and tyrosine, which were enriched in the serum of the injuredrats, in accordance with previous studies using other technologies. This increment in theserum levels of amino acids after acute liver injury has been suggested to be caused by aninhibition of the uptake and utilization of amino acids, especially aromatic amino acids andan increment in the degradation of proteins in the liver (Arai et al. 2001). In agreement alsowith these findings metabolism of methionine has been involved in liver disease (Mato et al.2008) and rats treated with galN were previously shown to affect these metabolism (Cabreroet al. 1988). In addition, it has been reported that livers from control animals released
Gonzalez et al. Page 9
Metabolomics. Author manuscript; available in PMC 2012 November 06.
$waterm
ark-text$w
atermark-text
$waterm
ark-text
glucose, whilst the livers from galN-injured animals took up glucose reflecting a switch inthe carbohydrate metabolism, changing from gluconeogenesis to glycolysis (Arai et al.2001). In concordance with that result glucose was one of the identified metabolites in ourstudy that clearly distinguished the control from the test group in that galN treated animalsshowed reduced glucose levels (Table 1). Thus, the UPLC–MS/MS analysis, as presentedhere, corroborates well with previous reports regarding amino acids and glucosemetabolism.
Importantly, our results show that serum levels of major and essential structural componentsof membrane lipid bilayers including phosphatidylcholines, phosphatidylethanolamines andsphingomyelins were significantly increased in acute liver injury. This increase, associatedmostly with PCs carrying short-chain unsaturated (14:0, 15:0 and 16:0) acyl groups in thesn-1 position, could be explained by the massive destruction of membranes as judged by thecell death observed in the histological examination of the livers. In contrast,lysophosphatidylcholines were reduced in the serum samples from injured rats (Table 1).This family of lipids are formed from PCs by PLA2 activity that has been reported to beenhanced in galN-treated rats (Petkova et al. 1987). Contrary to what is observed in thisstudy the increase in PLA2 should be reflected in an increase in LysoPCs. Lyso-phospholipids are known to be highly bio-active molecules that can signal through G-protein-coupled receptors (Fox et al. 2009) so a tight regulation of them during aregenerative process will be critical for the final outcome of an injured tissue. In this sense,it has been shown that endothelial cells are able to degrade extracellular lysoPCs (Tosti et al.1999) reducing plasma and tissue levels of these pro-inflammatory lipid molecules. Thisactivity could provide an explanation for the low levels observed in the serum of acute liverinjury, but further experiments are needed to clarify this aspect.
Finally, a logistic regression prediction model based on our metabolomic study was createdusing a selection of six metabolites from the groups mentioned above, including methionine,three lysophosphocholines and two phosphocholines. The model is able to predict the highprobability of acute-liver injury in all galN-treated animals with more than 98% accuracy,with no false positives observed between saline-treated animals. However, a full validationof this prediction model will require a bigger test set. Also it would be preferable to includesamples from other experimental models for hepatic and non-hepatic injury in order toestablish that these six metabolites are indeed specific biomarkers for acute liver injury.
Interestingly, PE (16:0/18:2) is among the identified metabolites the one that suffer thehighest increase in the serum of galN-treated animals. The source of this increase could bealso the massive liver cell death induced by galN. Interestingly, PEs are enriched in the innerleaflet of mitochondria and is well-known that galN causes severe damage to themitochondria (Miyahara et al. 1982), which raises the possibility that the increment in thelevels of this metabolite could be more specifically a consequence of a degeneration of themitochondrial membrane.
Liver damage was observed in 100% of the animals treated with galN as judged by serumALT activity and liver histology. The quantization of this damage showed inter-individualvariability in the response of the animals to the treatment with galN ranging from lethal tolow (but visible) damage. Although we found a strong correlation (r > 0.75) between thethree parameters (Table 2) that we used to quantify the damage, there were outliers (e.g.,animal number 18, Table 2) with H&E and CDS scores not correlating with serum ALTactivity. A possible explanation of this could be the fact that high levels of serum ALTactivity is not exclusively produced by liver injury, but could also be indicative of muscledamage (Lott and Landesman 1984). Due to this specificity feature of the transaminaseactivity we have focused our work in the correlation with CDS scores. We took advantage of
Gonzalez et al. Page 10
Metabolomics. Author manuscript; available in PMC 2012 November 06.
$waterm
ark-text$w
atermark-text
$waterm
ark-text
the inter-individual variability detected in the liver damage from the galN-treated rats toidentify a serum metabolic signature to assess noninvasively the degree of cell death thatoccurred during acute liver injury. The highest correlations (rho > 0.91, P value < 0.001)were observed for long-chain fatty acids containing lipids such as LysoPC(0:0/18:0),LysoPC(20:0/0:0), LysoPC(22:0), LysoPC(20:1/0:0), LysoPC(22:1), LysoPC(24:1/0:0),LysoPC(O-18:0/0:0), PC(P-18:0/20:4), SM (d18:1/15:0) and SM (d18:1/16). Thus,quantization of these 10 metabolites in serum could constitute a very sensitive method toestablish the degree of liver cell death, however further investigations in other experimentalmodels are required to truly establish that these metabolites are specific biomarkers of celldeath in the liver.
5 ConclusionsOur results highlight the power of UPLC–MS/MS-based metabolomics approach incombination with an experimental animal model for studying metabolic changes of acuteliver injury. We were able to identify potential non-invasive biomarkers correlating with aspecific lesion. Extending this approach to other hepatic models with different liver injurieswould help to provide a repertoire of highly sensitive and specific biomarkers for differentliver affections. Although the clinical applicability of these studies on diagnosis andprognosis of liver diseases will still require time-consuming translational research, in a shortperiod of time this set of hepatic biomarkers could assist pharmaceutical research anddevelopment, accelerating the launch of safer drugs to the market.
AcknowledgmentsWe gratefully thank B. Martínez de la Pera, C. Oceja, I. Iturriza and L. María for their technical assistance andFAES FARMA S.A. for its support with rat experimentation procedures and sample collection. This work wassupported by grants from the Fondo de Investigaciones Sanitarias (Institute of Health Carlos III, 06/0621 &PS09/00526 to J.M.F.P.); Program “Ramon y Cajal” of Spanish Ministry (to J.M.F.P); Diputación Foral de Bizkaia(612TK20100014); National Institute of Health Grant R01 AT004896 (to S.C.L. and J.M. M.); Centro deInvestigación Biomédica en Red en el Área temática de Enfermedades Hepáticas y Digestivas (CIBERehd) isfunded by the Institute of Health Carlos III.
ReferencesArai K, Lee K, Berthiaume F, Tompkins RG, Yarmush ML. Intrahepatic amino acid and glucose
metabolism in a D-galactosamine-induced rat liver failure model. Hepatology. 2001; 34:360–371.[PubMed: 11481621]
Barr J, Vazquez-Chantada M, Alonso C, Perez-Cormenzana M, Mayo R, Galan A, et al. Liquidchromatography-mass spectrometry-based parallel metabolic profiling of human and mouse modelserum reveals putative biomarkers associated with the progression of nonalcoholic fatty liverdisease. Journal of Proteome Research. 2010; 9:4501–4512. [PubMed: 20684516]
Boelsterli UA, Lim PL. Mitochondrial abnormalities— a link to idiosyncratic drug hepatotoxicity?Toxicology and Applied Pharmacology. 2007; 220:92–107. [PubMed: 17275868]
Brindle JT, Antti H, Holmes E, Tranter G, Nicholson JK, Bethell HW, et al. Rapid and noninvasivediagnosis of the presence and severity of coronary heart disease using 1H-NMR-basedmetabonomics. Nature Medicine. 2002; 8:1439–1444.
Cabrero C, Duce AM, Ortiz P, Alemany S, Mato JM. Specific loss of the high-molecular-weight formof S-adenosyl-L-methionine synthetase in human liver cirrhosis. Hepatology. 1988; 8:1530–1534.[PubMed: 3192166]
Chan EC, Yap SL, Lau AJ, Leow PC, Toh DF, Koh HL. Ultra-performance liquid chromatography/time-of-flight mass spectrometry based metabolomics of raw and steamed Panax notoginseng.Rapid Communications in Mass Spectrometry. 2007; 21:519–528. [PubMed: 17238214]
Chen C, Gonzalez FJ, Idle JR. LC-MS-based metabolomics in drug metabolism. Drug MetabolismReviews. 2007; 39:581–597. [PubMed: 17786640]
Gonzalez et al. Page 11
Metabolomics. Author manuscript; available in PMC 2012 November 06.
$waterm
ark-text$w
atermark-text
$waterm
ark-text
Clarke CJ, Haselden JN. Metabolic profiling as a tool for understanding mechanisms of toxicity.Toxicologic Pathology. 2008; 36:140–147. [PubMed: 18337232]
Coen M. A metabonomic approach for mechanistic exploration of pre-clinical toxicology. Toxicology.2010; 278:326–340. [PubMed: 20699110]
Coen M, Hong YS, Clayton TA, Rohde CM, Pearce JT, Reily MD, et al. The mechanism ofgalactosamine toxicity revisited; a metabonomic study. Journal of Proteome Research. 2007;6:2711–2719. [PubMed: 17580851]
Coen M, Want EJ, Clayton TA, Rhode CM, Hong YS, Keun HC, et al. Mechanistic aspects and novelbiomarkers of responder and non-responder phenotypes in galactosamine-induced hepatitis.Journal of Proteome Research. 2009; 8:5175–5187. [PubMed: 19821561]
Dan YY, Yeoh GC. Liver stem cells: A scientific and clinical perspective. Journal of Gastroenterologyand Hepatology. 2008; 23:687–698. [PubMed: 18410603]
Decker K, Keppler D. Galactosamine induced liver injury. Progress in Liver Diseases. 1972; 4:183–199. [PubMed: 4631501]
Duarte IF, Stanley EG, Holmes E, Lindon JC, Gil AM, Tang H, et al. Metabolic assessment of humanliver transplants from biopsy samples at the donor and recipient stages using high-resolution magicangle spinning 1H NMR spectroscopy. Analytical Chemistry. 2005; 77:5570–5578. [PubMed:16131067]
El-Mofty SK, Scrutton MC, Serroni A, Nicolini C, Farber JL. Early, reversible plasma membraneinjury in galactosamine-induced liver cell death. The American Journal of Pathology. 1975;79:579–596. [PubMed: 1137005]
Feng B, Wu S, Lv S, Liu F, Chen H, Yan X, et al. Metabolic profiling analysis of a D-galactosamine/lipopolysaccharide-induced mouse model of fulminant hepatic failure. Journal of ProteomeResearch. 2007; 6:2161–2167. [PubMed: 17497905]
Fernie AR, Trethewey RN, Krotzky AJ, Willmitzer L. Metabolite profiling: From diagnostics tosystems biology. Nature Reviews Molecular Cell Biology. 2004; 5:763–769.
Fox LM, Cox DG, Lockridge JL, Wang X, Chen X, Scharf L, et al. Recognition of lyso-phospholipidsby human natural killer T lymphocytes. PLoS Biology. 2009; 7:e1000228. [PubMed: 19859526]
Gomez-Lechon MJ, Castell JV, Donato MT. An update on metabolism studies using humanhepatocytes in primary culture. Expert Opinion on Drug Metabolism. 2008; 4:837–854.
Kaplowitz N. Drug-induced liver disorders: Implications for drug development and regulation. DrugSafety. 2001; 24:483–490. [PubMed: 11444721]
Keppler D, Lesch R, Reutter W, Decker K. Experimental hepatitis induced by D-galactosamine.Experimental and Molecular Pathology. 1968; 9:279–290. [PubMed: 4952077]
Kitazawa T, Tsujimoto T, Kawaratani H, Fukui H. Therapeutic approach to regulate innate immuneresponse by Toll-like receptor 4 antagonist E5564 in rats with D-galactosamine-induced acutesevere liver injury. Journal of Gastroenterology and Hepatology. 2009; 24:1089–1094. [PubMed:19226379]
Koff RS, Fitts JJ, Sabesin SM, Zimmerman HJ. d-galactosamine hepatotoxicity II. Mechanism of fattyliver production. Proceedings of the Society for Experimental Biology and Medicine. 1971;138:89–92. [PubMed: 5125545]
Komano T, Egashira Y, Sanada H. l-Gln and l-Ser suppress the d-galactosamine-induced IL-18expression and hepatitis. Biochemical and Biophysical Research Communications. 2008;372:688–690. [PubMed: 18514057]
Kushnir MM, Rockwood AL, Bergquist J. Liquid chromatography-tandem mass spectrometryapplications in endocrinology. Mass Spectrometry Reviews. 2009; 29:480–502. [PubMed:19708015]
Lin HM, Barnett MP, Roy NC, Joyce NI, Zhu S, Armstrong K, et al. Metabolomic analysis identifiesinflammatory and noninflammatory metabolic effects of genetic modification in a mouse model ofCrohn's disease. Journal of Proteome Research. 2010; 9:1965–1975. [PubMed: 20141220]
Lott JA, Landesman PW. The enzymology of skeletal muscle disorders. Critical Reviews in ClinicalLaboratory Sciences. 1984; 20:153–190. [PubMed: 6373145]
Gonzalez et al. Page 12
Metabolomics. Author manuscript; available in PMC 2012 November 06.
$waterm
ark-text$w
atermark-text
$waterm
ark-text
Lutz U, Lutz RW, Lutz WK. Metabolic profiling of glucuronides in human urine by LC-MS/MS andpartial least-squares discriminant analysis for classification and prediction of gender. AnalyticalChemistry. 2006; 78:4564–4571. [PubMed: 16808466]
Lv S, Wei L, Wang JH, Wang JY, Liu F. Identification of novel molecular candidates for acute liverfailure in plasma of BALB/c murine model. Journal of Proteome Research. 2007; 6:2746–2752.[PubMed: 17569552]
Maezono K, Kajiwara K, Mawatari K, Shinkai A, Torii K, Maki T. Alanine protects liver from injurycaused by F-galactosamine and CCl4. Hepatology. 1996; 24:185–191. [PubMed: 8707260]
Major HJ, Williams R, Wilson AJ, Wilson ID. A metabonomic analysis of plasma from Zucker ratstrains using gas chromatography/mass spectrometry and pattern recognition. RapidCommunications in Mass Spectrometry. 2006; 20:3295–3302. [PubMed: 17044115]
Mato JM, Martinez-Chantar ML, Lu SC. Methionine metabolism and liver disease. Annual Review ofNutrition. 2008; 28:273–293.
Medline A, Schaffner F, Popper H. Ultrastructural features in galactosamine-induced hepatitis.Experimental and Molecular Pathology. 1970; 12:201–211. [PubMed: 4907704]
Miller TJ, Knapton A, Adeyemo O, Noory L, Weaver J, Hanig JP. Cytochrome c: A non-invasivebiomarker of drug-induced liver injury. Journal of Applied Toxicology. 2008; 28:815–828.[PubMed: 18418843]
Miyahara M, Enzan H, Shiraishi N, Kawase M, Yamamoto M, Hara H, et al. Mitochondrial damage ingalactosamine-induced liver intoxication in rats. Biochimica et Biophysica Acta. 1982; 714:505–515. [PubMed: 7059614]
Muller PY, Dieterle F. Tissue-specific, non-invasive toxicity biomarkers: Translation from preclinicalsafety assessment to clinical safety monitoring. Expert Opinion on Drug Metabolism. 2009;5:1023–1038.
Newsome PN, Plevris JN, Nelson LJ, Hayes PC. Animal models of fulminant hepatic failure: Acritical evaluation. Liver Transplantation. 2000; 6:21–31. [PubMed: 10648574]
Nicholls AW, Mortishire-Smith RJ, Nicholson JK. NMR spectroscopic-based metabonomic studies ofurinary metabolite variation in acclimatizing germ-free rats. Chemical Research in Toxicology.2003; 16:1395–1404. [PubMed: 14615964]
Nicholson JK, Wilson ID. Opinion: Understanding ‘global’ systems biology: Metabonomics and thecontinuum of metabolism. Nature Reviews Drug Discovery. 2003; 2:668–676.
Nordstrom A, O'Maille G, Qin C, Siuzdak G. Nonlinear data alignment for UPLC-MS and HPLC-MSbased metabolomics: Quantitative analysis of endogenous and exogenous metabolites in humanserum. Analytical Chemistry. 2006; 78:3289–3295. [PubMed: 16689529]
Novakova L, Solichova D, Solich P. Advantages of ultra performance liquid chromatography overhigh-performance liquid chromatography: Comparison of different analytical approaches duringanalysis of diclofenac gel. Journal of Separation Science. 2006; 29:2433–2443. [PubMed:17154123]
Ozer J, Ratner M, Shaw M, Bailey W, Schomaker S. The current state of serum biomarkers ofhepatotoxicity. Toxicology. 2008; 245:194–205. [PubMed: 18291570]
Petkova DH, Momchilova AB, Markovska TT, Koumanov KS. d-galactosamine induced changes inrat liver plasma membranes lipid composition and some enzyme activities. The InternationalJournal of Biochemistry. 1987; 19:289–291. [PubMed: 3036613]
Schauer N, Fernie AR. Plant metabolomics: Towards biological function and mechanism. Trends inPlant Science. 2006; 11:508–516. [PubMed: 16949327]
Stramentinoli G, Gualano M, Ideo G. Protective role of S-adenosyl-L-methionine on liver injuryinduced by D-galactosamine in rats. Biochemical Pharmacology. 1978; 27:1431–1433. [PubMed:697884]
Tosti E, Dahl L, Endresen MJ, Henriksen T. Endothelial degradation of extracellular lyso-phosphatidylcholine. Scandinavian Journal of Clinical and Laboratory Investigation. 1999;59:249–257. [PubMed: 10463463]
Tunon MJ, Alvarez M, Culebras JM, Gonzalez-Gallego J. An overview of animal models forinvestigating the pathogenesis and therapeutic strategies in acute hepatic failure. World Journal ofGastroenterology. 2009; 15:3086–3098. [PubMed: 19575487]
Gonzalez et al. Page 13
Metabolomics. Author manuscript; available in PMC 2012 November 06.
$waterm
ark-text$w
atermark-text
$waterm
ark-text

Ulrich RG. Idiosyncratic toxicity: A convergence of risk factors. Annual Review of Medicine. 2007;58:17–34.
Yovchev MI, Grozdanov PN, Zhou H, Racherla H, Guha C, Dabeva MD. Identification of adulthepatic progenitor cells capable of repopulating injured rat liver. Hepatology. 2008; 47:636–647.[PubMed: 18023068]
Zhang Q, Wang G, Du Y, Zhu L, Jiye A. GC/MS analysis of the rat urine for metabonomic research.Journal of Chromatography B, Analytical Technologies in the Biomedical and Life Sciences.2007; 854:20–25.
Gonzalez et al. Page 14
Metabolomics. Author manuscript; available in PMC 2012 November 06.
$waterm
ark-text$w
atermark-text
$waterm
ark-text
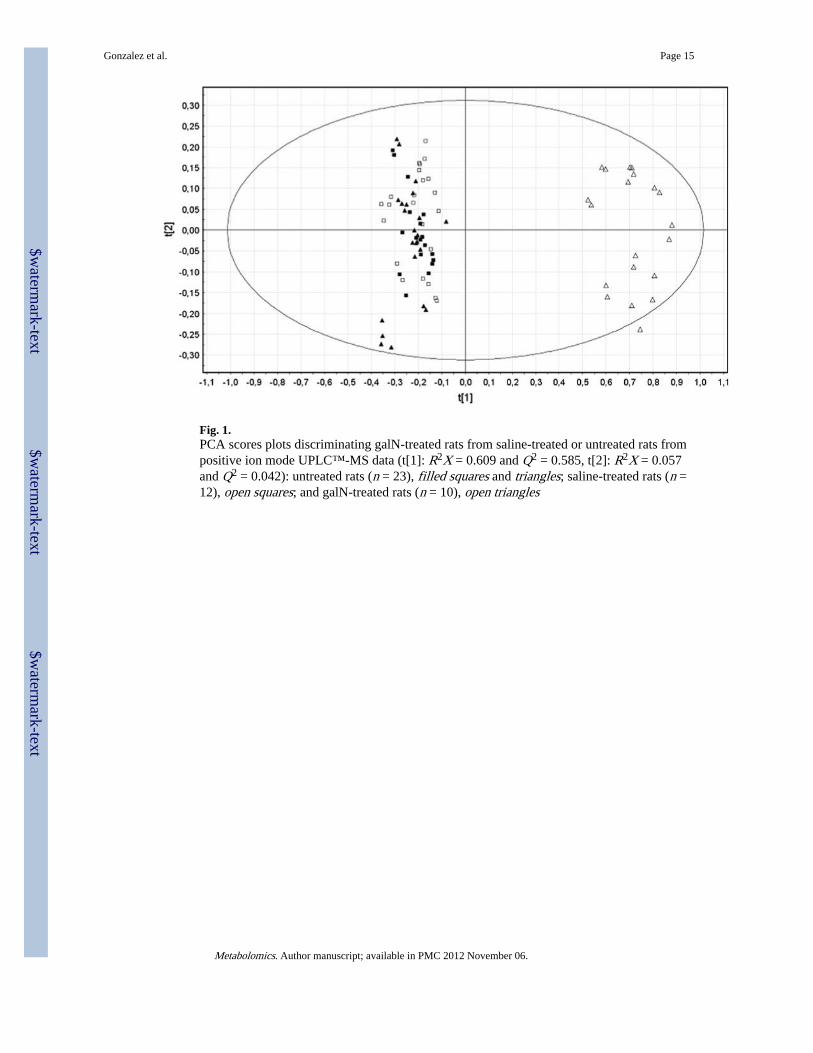
Fig. 1.PCA scores plots discriminating galN-treated rats from saline-treated or untreated rats frompositive ion mode UPLC™-MS data (t[1]: R2X = 0.609 and Q2 = 0.585, t[2]: R2X = 0.057and Q2 = 0.042): untreated rats (n = 23), filled squares and triangles; saline-treated rats (n =12), open squares; and galN-treated rats (n = 10), open triangles
Gonzalez et al. Page 15
Metabolomics. Author manuscript; available in PMC 2012 November 06.
$waterm
ark-text$w
atermark-text
$waterm
ark-text

Fig. 2.Loading plot for PCA mode positive. The ions with highest contribution to the variance inthe scores plot are indicated on the loadings plot. The peaks are labelled according to theiridentifications; open square PC, filled square LysoPC, open diamond PE, filled diamondLysoPE, filled triangle FA, open triangle SM, open inverted triangle Bile Acid, invertedfilled triangle AA, asterisk No determinated
Gonzalez et al. Page 16
Metabolomics. Author manuscript; available in PMC 2012 November 06.
$waterm
ark-text$w
atermark-text
$waterm
ark-text
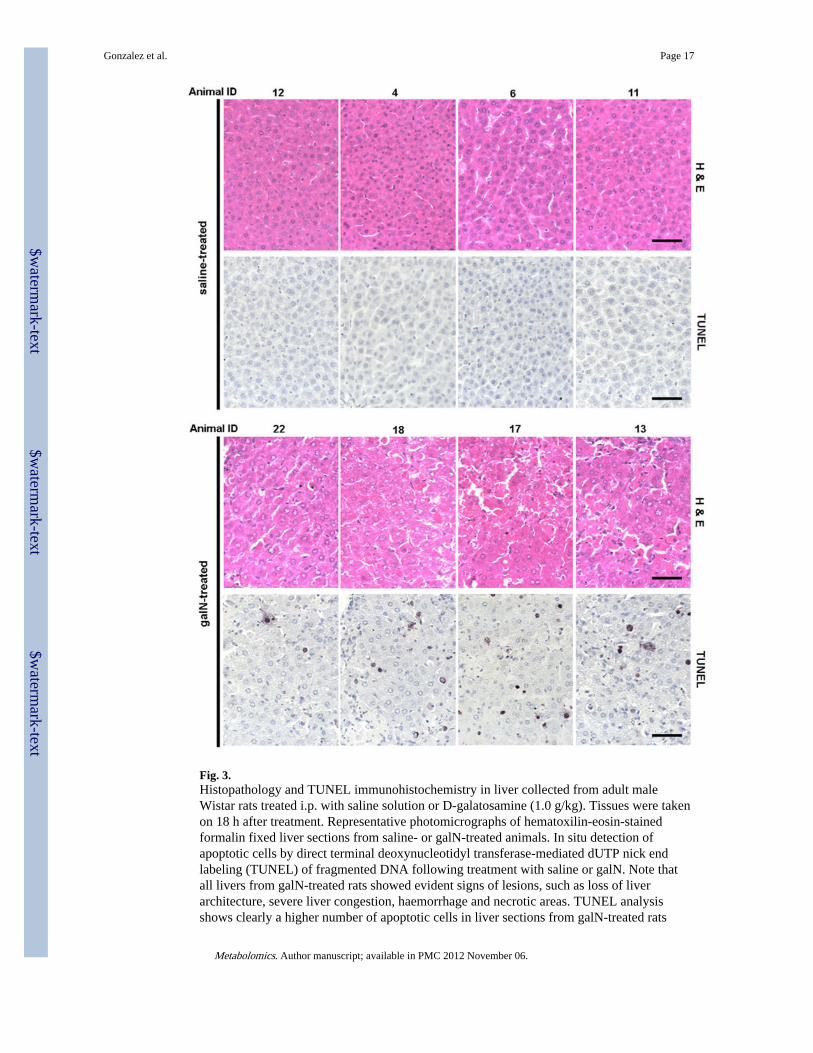
Fig. 3.Histopathology and TUNEL immunohistochemistry in liver collected from adult maleWistar rats treated i.p. with saline solution or D-galatosamine (1.0 g/kg). Tissues were takenon 18 h after treatment. Representative photomicrographs of hematoxilin-eosin-stainedformalin fixed liver sections from saline- or galN-treated animals. In situ detection ofapoptotic cells by direct terminal deoxynucleotidyl transferase-mediated dUTP nick endlabeling (TUNEL) of fragmented DNA following treatment with saline or galN. Note thatall livers from galN-treated rats showed evident signs of lesions, such as loss of liverarchitecture, severe liver congestion, haemorrhage and necrotic areas. TUNEL analysisshows clearly a higher number of apoptotic cells in liver sections from galN-treated rats
Gonzalez et al. Page 17
Metabolomics. Author manuscript; available in PMC 2012 November 06.
$waterm
ark-text$w
atermark-text
$waterm
ark-text
compared to saline-treated animals. The darker stains fragmented DNA commonly observedin apoptotic cells
Gonzalez et al. Page 18
Metabolomics. Author manuscript; available in PMC 2012 November 06.
$waterm
ark-text$w
atermark-text
$waterm
ark-text

Fig. 4.Representative serum metabolites significantly altered by galN-induced acute liver injury.Examples of metabolites showing high correlation with CDS score are represented by boxplots. For the box plots the top and bottom of the boxes represent the 75th and 25thpercentile, respectively. The top and bottom bars (whiskers) represent the entire spread ofthe data points for the animals. The hyphen indicates the median value. The y-axis is thelevel of metabolite relative to the average of the level of that metabolite in serum of saline-treated animals
Gonzalez et al. Page 19
Metabolomics. Author manuscript; available in PMC 2012 November 06.
$waterm
ark-text$w
atermark-text
$waterm
ark-text

$waterm
ark-text$w
atermark-text
$waterm
ark-text
Gonzalez et al. Page 20
Tabl
e 1
End
ogen
ous
seru
m m
etab
olit
es s
igni
fica
ntly
aff
ecte
d by
gal
N-t
reat
men
t
Met
abol
ite
IDm
/zR
TID
met
hoda
Salin
eb lo
g(N
S)ga
lNb
log(
NS)
log(
FC
)c−l
og(p
)d
AA
Met
hion
ine
150.
060.
87St
anda
rd−
3.3
−2.
80.
583.
21
AA
Pro
line
116.
070.
61St
anda
rd−
0.7
−0.
20.
562.
75
AA
Thr
eoni
ne12
0.06
0.59
Stan
dard
−1.
1−
0.7
0.42
2.50
AA
Tyr
osin
e18
2.08
0.98
Stan
dard
0.0
1.0
1.00
4.25
FFA
Lin
olei
c ac
id28
1.25
5.52
Stan
dard
−0.
8−
0.7
0.11
1.92
Glu
cose
383.
120.
59St
anda
rd−
0.1
−0.
3−
0.16
2.74
Lys
oPC
(0:0
/18:
0)52
4.37
4.54
MS/
MS
0.3
−0.
3−
0.64
13.4
5
Lys
oPC
(14:
0/0:
0))
468.
313.
60St
anda
rd−
0.4
−0.
7−
0.30
7.91
Lys
oPC
(15:
0/0:
0)48
2.32
3.83
Stan
dard
−0.
3−
0.7
−0.
337.
31
Lys
oPC
(16:
0/0:
0))
496.
344.
09St
anda
rd1.
71.
3−
0.42
11.1
4
Lys
oPC
(16:
1/0:
0)49
4.32
3.77
MS/
MS
0.0
−0.
2−
0.15
2.86
Lys
oPC
(17:
0/0:
0)51
0.36
4.37
Stan
dard
−0.
1−
0.6
−0.
477.
14
Lys
oPC
(18:
1/0:
0)52
2.36
4.28
Stan
dard
0.9
0.5
−0.
348.
75
Lys
oPC
(18:
3)51
8.32
3.98
Dat
abas
e−
1.5
−2.
1−
0.54
7.40
Lys
oPC
(19:
0/0:
0)53
8.38
4.96
Stan
dard
−0.
5−
1.0
−0.
516.
39
Lys
oPC
(20:
0/0:
0)55
2.40
5.26
Stan
dard
−0.
8−
1.2
−0.
417.
31
Lys
oPC
(20:
1/0:
0)55
0.39
4.81
MS/
MS
−0.
2−
1.0
−0.
7510
.16
Lys
oPC
(20:
2/0:
0)54
8.37
4.44
MS/
MS
−0.
7−
1.1
−0.
406.
73
Lys
oPC
(20:
3)54
6.36
4.54
Dat
abas
e−
1.2
−1.
5−
0.31
6.50
Lys
oPC
(20:
4)54
4.34
3.99
MS/
MS
1.2
1.0
−0.
224.
34
Lys
oPC
(22:
0)58
0.43
5.86
Dat
abas
e−
1.1
−1.
3−
0.23
6.83
Lys
oPC
(22:
1/0:
0)57
8.42
5.38
MS/
MS
−1.
3−
1.7
−0.
388.
85
Lys
oPC
(22:
5/0:
0)57
0.36
4.12
MS/
MS
−1.
1−
0.9
0.21
2.71
Lys
oPC
(24:
0)60
8.46
6.46
Dat
abas
e−
0.9
−1.
0−
0.09
1.71
Lys
oPC
(24:
1/0:
0)60
6.45
5.96
MS/
MS
−1.
0−
1.3
−0.
358.
93
Lys
oPC
(O-1
6:0/
0:0)
482.
364.
21M
S/M
S−
0.6
−1.
1−
0.57
12.5
9
Lys
oPC
(O-1
8:0/
0:0)
510.
394.
80M
S/M
S−
1.1
−1.
6−
0.48
11.6
1
Lys
oPC
(O-2
0:0/
0:0)
538.
425.
41M
S/M
S−
1.5
−1.
8−
0.37
9.32
Metabolomics. Author manuscript; available in PMC 2012 November 06.
$waterm
ark-text$w
atermark-text
$waterm
ark-text
Gonzalez et al. Page 21
Met
abol
ite
IDm
/zR
TID
met
hoda
Salin
eb lo
g(N
S)ga
lNb
log(
NS)
log(
FC
)c−l
og(p
)d
Lys
oPC
(O-2
2:0/
0:0)
566.
466.
02M
S/M
S−
1.9
−2.
0−
0.19
3.62
Lys
oPC
(P-1
8:0/
0:0)
508.
374.
39M
S/M
S−
0.7
−1.
4−
0.69
13.9
5
Lys
oPE
(16:
0)45
4.29
4.07
MS/
MS
−0.
30.
30.
533.
72
Lys
oPE
(18:
0)48
2.32
4.64
MS/
MS
−0.
10.
20.
373.
44
Lys
oPE
(18:
2)47
8.29
3.93
MS/
MS
−0.
70.
00.
756.
92
Lys
oPE
(20:
4)50
2.29
3.97
MS/
MS
−0.
60.
20.
744.
52
Lys
oPE
(22:
6)52
6.29
3.97
Dat
abas
e−
1.2
−0.
40.
834.
15
Lys
oPE
(P-1
6:0/
0:0)
438.
304.
25M
S/M
S−
0.9
−1.
4−
0.54
9.19
PC(1
4:0/
16:0
)70
6.54
7.39
Stan
dard
−0.
4−
0.1
0.31
9.80
PC
(14:
0/18
:1)
754.
557.
50M
S/M
S−
0.9
−0.
50.
386.
50
PC(1
4:0/
20:4
)75
4.54
7.15
MS/
MS
−0.
20.
00.
216.
48
PC(1
5:0/
18:2
)74
4.56
7.38
MS/
MS
0.2
0.5
0.37
3.64
PC(1
6:0/
16:0
)73
4.57
7.80
MS/
MS
0.5
0.8
0.29
5.83
PC
(16:
0/18
:1)
760.
597.
87St
anda
rd1.
31.
60.
318.
68
PC(1
6:0/
18:2
)75
8.57
7.58
Stan
dard
1.9
2.1
0.20
9.44
PC(1
6:0/
20:5
)78
0.56
7.25
MS/
MS
0.3
0.5
0.20
4.58
PC(1
7:0/
18:2
)77
2.59
7.77
MS/
MS
0.3
0.7
0.44
4.76
PC(1
8:0/
18:2
)78
6.61
7.97
Stan
dard
1.5
1.8
0.24
10.9
6
PC(1
8:0/
20:4
)81
0.60
7.92
Stan
dard
2.0
1.8
−0.
157.
61
PC(1
8:0/
22:6
)83
4.60
7.68
Stan
dard
−0.
3−
0.9
−0.
601.
85
PC(1
8:1/
20:4
)80
8.59
7.63
MS/
MS
1.4
1.2
−0.
204.
83
PC(1
8:2/
18:2
)78
2.57
7.56
Stan
dard
2.0
2.0
−0.
033.
02
PC(P
-16:
0/20
:4)
766.
587.
71M
S/M
S0.
30.
1−
0.20
7.64
PC(P
-18:
0/20
:4)
794.
617.
79M
S/M
S0.
40.
2−
0.25
8.72
PC(P
-18:
1/20
:2)
796.
627.
98D
atab
ase
−0.
6−
1.0
−0.
415.
72
PE(1
6:0/
18:2
)71
6.52
7.61
MS/
MS
−0.
80.
31.
143.
51
SM (
d18:
1/16
:0)
703.
586.
99M
S/M
S1.
20.
9−
0.26
9.07
SM (
d18:
1/18
:0)
731.
617.
49M
S/M
S0.
20.
0−
0.15
3.35
SM(d
18:1
/14:
0)67
5.54
6.50
MS/
MS
−0.
8−
1.0
−0.
205.
88
SM(d
18:1
/15:
0)68
9.56
6.75
MS/
MS
−0.
5−
0.8
−0.
287.
11
a Met
abol
ite id
entif
icat
ion
met
hod
is in
dica
ted
Metabolomics. Author manuscript; available in PMC 2012 November 06.
$waterm
ark-text$w
atermark-text
$waterm
ark-text
Gonzalez et al. Page 22b L
og o
f th
e no
rmal
ized
sig
nal (
NS)
c Log
of
the
aver
age
fold
cha
nge
(FC
) be
twee
n ga
lN v
s sa
line-
trea
ted
rats
(ne
gativ
e va
lue
= d
own
regu
latio
n, p
ositi
ve v
alue
= u
p re
gula
tion)
d −lo
g(p)
val
ue o
f W
elch
's t-
test
bet
wee
n ga
lN a
nd s
alin
e-tr
eate
d ra
ts
Metabolomics. Author manuscript; available in PMC 2012 November 06.

$waterm
ark-text$w
atermark-text
$waterm
ark-text
Gonzalez et al. Page 23
Tabl
e 2
Liv
er d
amag
e as
sess
men
t. S
erum
AL
T a
ctiv
ity
and
cellu
lar
deat
h sc
ore
(CD
S) in
live
r se
ctio
ns f
rom
sal
ine-
or
galN
-tre
ated
rat
s
Ani
mal
ID
Inje
ctio
nP
redi
ctio
naV
isua
l sco
reb,
d H
&E
CD
Sb,d
(ce
lls/m
m2 )
AL
Tc,
d (U
/L)
Log
itM
odel
1Sa
line
−2.
360.
081
626
.61
2Sa
line
−2.
380.
101
629
.55
3Sa
line
−2.
060.
101
526
.08
4Sa
line
−1.
710.
161
325
.15
5Sa
line
−1.
690.
181
318
.35
6Sa
line
−2.
600.
071
220
.01
7Sa
line
−2.
760.
061
625
.15
8Sa
line
−1.
680.
161
1014
.68
9Sa
line
−2.
030.
111
615
.97
10Sa
line
−1.
830.
151
817
.80
11Sa
line
−1.
800.
111
318
.72
12Sa
line
−2.
070.
111
118
.90
13G
alN
8.86
1.00
625
458
07.6
4
14G
alN
5.05
0.99
518
713
21.5
8
15G
alN
7.63
1.00
614
931
86.4
7
16G
alN
6.13
1.00
419
747
90.7
2
17G
alN
4.21
0.98
316
016
00.5
8
18G
alN
4.13
0.99
287
2654
.17
19G
alN
4.11
0.98
210
328
48.7
3
20G
alN
4.76
0.99
210
436
82.0
6
21G
alN
6.77
1.00
314
238
43.5
9
22G
alN
3.91
0.98
211
236
01.3
0
a App
licat
ion
of a
bin
omia
l pre
dict
ion
mod
el b
ased
on
six
met
abol
ites
(bol
d, T
able
1)
to p
redi
ct a
cute
live
r-in
jury
. “L
ogit”
val
ue f
or e
ach
anim
al is
cal
cula
ted
as in
dica
ted
in S
ect.
2 co
nsid
erin
g th
e in
tens
ityof
sel
ecte
d m
etab
olite
s, a
nd “
Mod
el”
indi
cate
s th
e pr
obab
ility
that
the
anim
al s
uffe
rs a
cute
-liv
er in
jury
(A
val
ue e
qual
to o
r cl
ose
to 1
is in
dica
tive
of h
igh
prob
abili
ty o
f ac
ute-
liver
inju
ry w
hile
a v
alue
of
0or
clo
se m
eans
low
pro
babi
lity
to h
ave
acut
e-liv
er in
jury
)
b 18-h
aft
er in
trap
erito
neal
inje
ctio
n of
sal
ine
solu
tion
or g
alN
ani
mal
s w
ere
sacr
ific
ed a
nd li
vers
wer
e ex
trac
ted,
for
mal
in-f
ixed
and
pro
cess
ed f
or h
isto
logy
. Liv
er s
ectio
ns w
ere
stai
ned
with
Hem
atos
ylin
-
eosi
n (H
&E
), a
nd a
naly
zed
for
the
pres
ence
of
apop
totic
cel
ls b
y us
ing
Apo
pTag
® P
erox
idas
e In
Situ
Apo
ptos
is D
etec
tion
Kit.
Liv
er in
jury
was
ass
esse
d by
vis
ual e
xam
inat
ions
of
H&
E-s
tain
ed s
ectio
ns
Metabolomics. Author manuscript; available in PMC 2012 November 06.

$waterm
ark-text$w
atermark-text
$waterm
ark-text
Gonzalez et al. Page 24an
d sc
ored
1–6
bas
ed o
n he
mor
ragi
e, n
ecro
sis
appe
aran
ce. L
iver
inju
ry w
as f
urth
er q
uant
ifie
d by
cou
ntin
g ap
opto
tic c
ells
in 1
0 di
ffer
ent r
ando
mly
cho
sen
fiel
ds c
over
ing
a to
tal a
rea
of 1
mm
2 ; t
his
valu
e is
refe
rred
as
cellu
lar
deat
h sc
ore
(CD
S). B
oth
anal
yses
wer
e do
ne in
a b
lind
test
in w
hich
the
anal
yzer
was
not
aw
are
on th
e sa
mpl
e id
entit
y
c Seru
m a
lani
ne a
min
otra
nsfe
rase
(A
LT
) le
vels
wer
e as
saye
d w
ith th
e In
fini
ty A
LT
liqu
id s
tabl
e re
agen
t
d Cor
rela
tion
anal
ysis
(Pe
arso
n r c
oeff
icie
nt):
H&
E w
ith C
DS
(0,9
1), H
&E
with
AL
T (
0,75
), C
DS
with
AL
T (
0,88
)
Metabolomics. Author manuscript; available in PMC 2012 November 06.

$waterm
ark-text$w
atermark-text
$waterm
ark-text
Gonzalez et al. Page 25
Tabl
e 3
End
ogen
ous
seru
m m
etab
olit
es c
orre
late
wit
h liv
er d
amag
e in
dica
tors
RT
m/z
ION
ID m
etab
olit
eC
onfi
denc
eaF
old
chan
geSD
CD
SdA
LT
d
rhoe
P v
alue
frh
oeP
val
uef
7.39
706.
5384
[M+
H]+
PC(1
4:0/
16:0
)St
anda
rd2.
00.
160.
712.
2E-0
40.
747.
4E-0
5
7.80
734.
5724
[M+
H]+
PC(1
6:0/
16:0
)M
S/M
S1.
90.
060.
791.
5E-0
50.
703.
0E-0
4
7.50
754.
5466
[M+
Na]
+PC
(14:
0/18
:1)
MS/
MS
2.4
0.44
0.72
1.8E
-04
0.77
2.5E
-05
7.87
760.
5910
[M+
H]
PC(1
6:0/
18:1
)St
anda
rd2.
10.
230.
676.
5E-0
40.
731.
3E-0
4
7.38
744.
5561
[M+
H]+
PC(1
5:0/
18:2
)M
S/M
S2.
40.
820.
703.
0E-0
40.
721.
6E-0
4
7.58
758.
5671
[M+
H]
PC(1
6:0/
18:2
)St
anda
rd1.
60.
140.
702.
9E-0
40.
731.
3E-0
4
7.77
772.
5880
[M+
H]+
PC(1
7:0/
18:2
)M
S/M
S2.
80.
780.
676.
5E-0
40.
764.
1E-0
5
7.97
786.
6082
[M+
H]
PC(1
8:0/
18:2
)St
anda
rd1.
70.
240.
711.
9E-0
40.
814.
7E-0
6
7.15
754.
5386
[M+
H]
PC(1
4:0/
20:4
)M
S/M
S1.
60.
320.
755.
0E-0
50.
703.
0E-0
4
7.71
766.
5758
[M+
H]+
PC(P
-16:
0/20
:4)
MS/
MS
0.6
0.09
−0.
862.
2E-0
7−
0.70
3.2E
-04
7.79
794.
6074
[M+
H]
PC(P
-18:
0/20
:4)
MS/
MS
0.6
0.10
−0.
961.
2E-1
2−
0.80
6.5E
-06
7.92
810.
6025
[M+
H]
PC(1
8:0/
20:4
)St
anda
rd0.
70.
09−
0.90
1.1E
-08
−0.
747.
4E-0
5
7.25
780.
5568
[M+
H]
PC(1
6:0/
20:5
)M
S/M
S1.
60.
350.
772.
4E-0
50.
854.
7E-0
7
7.98
796.
6198
[M+
H]+
PC(P
-18:
1/20
:2)
Dat
abas
e0.
40.
19−
0.78
1.7E
-05
−0.
831.
5E-0
6
3.60
468.
3075
[M+
H]
Lys
oPC
(14:
0/0:
0)St
anda
rd0.
50.
14−
0.85
6.2E
-07
−0.
712.
4E-0
4
3.83
482.
3231
[M+
H]
Lys
oPC
(15:
0/0:
0)St
anda
rd0.
50.
16−
0.87
1.3E
-07
−0.
703.
2E-0
4
4.21
482.
3602
[M+
H]
Lys
oPC
(O-1
6:0/
0:0)
MS/
MS
0.3
0.10
−0.
863.
5E-0
7−
0.74
9.0E
-05
4.09
496.
3378
[M+
H]
Lys
oPC
(16:
0/0:
0)St
anda
rd0.
40.
10−
0.88
5.8E
-08
−0.
703.
1E-0
4
3.98
496.
3406
[M+
H]+
Lys
oPC
(0:0
/16:
0)M
S/M
Sb0.
30.
11−
0.87
1.3E
-07
−0.
731.
0E-0
4
4.37
510.
3551
[M+
H]
Lys
oPC
(17:
0/0:
0)St
anda
rd0.
30.
18−
0.90
1.3E
-08
−0.
781.
5E-0
5
4.80
510.
3917
[M+
H]
Lys
oPC
(O-1
8:0/
0:0)
MS/
MS
0.3
0.11
−0.
966.
9E-1
3−
0.75
5.9E
-05
4.39
508.
3749
[M+
H]
Lys
oPC
(P-1
8:0/
0:0)
MS/
MS
0.2
0.09
−0.
871.
4E-0
7−
0.74
8.7E
-05
4.66
524.
3714
[M+
H]
Lys
oPC
(18:
0/0:
0)St
anda
rd0.
30.
08−
0.83
1.4E
-06
−0.
731.
1E-0
4
4.54
524.
3718
[M+
H]+
Lys
oPC
(0:0
/18:
0)M
S/M
S0.
20.
08−
0.95
1.9E
-11
−0.
694.
2E-0
4
4.96
538.
3838
[M+
H]
Lys
oPC
(19:
0/0:
0)St
anda
rd0.
30.
15−
0.88
7.5E
-08
−0.
703.
0E-0
4
5.26
552.
3993
[M+
H]+
Lys
oPC
(20:
0/0:
0)St
anda
rd0.
40.
13−
0.92
1.3E
-09
−0.
631.
7E-0
3
5.86
580.
4316
[M+
H]
Lys
oPC
(22:
0)D
atab
ase
0.6
0.14
−0.
941.
8E-1
0−
0.69
3.7E
-04
Metabolomics. Author manuscript; available in PMC 2012 November 06.

$waterm
ark-text$w
atermark-text
$waterm
ark-text
Gonzalez et al. Page 26
RT
m/z
ION
ID m
etab
olit
eC
onfi
denc
eaF
old
chan
geSD
CD
SdA
LT
d
rhoe
P v
alue
frh
oeP
val
uef
6.46
608.
4629
[M+
H]
Lys
oPC
(24:
0)D
atab
ase
0.8
0.22
−0.
764.
1E-0
5−
0.38
8.4E
-02
4.81
550.
3853
[M+
H]
Lys
oPC
(20:
1/0:
0)M
S/M
S0.
20.
07−
0.96
4.7E
-12
−0.
694.
3E-0
4
5.38
578.
4156
[M+
H]+
Lys
oPC
(22:
1/0:
0)M
S/M
Sb0.
40.
13−
0.92
2.3E
-09
−0.
763.
9E-0
5
5.96
606.
4473
[M+
H]+
Lys
oPC
(24:
1/0:
0)M
S/M
Sb0.
40.
12−
0.96
1.2E
-12
−0.
693.
7E-0
4
4.28
522.
3562
[M+
H]+
Lys
oPC
(18:
1/0:
0)St
anda
rd0.
50.
13−
0.87
1.4E
-07
−0.
676.
3E-0
4
4.44
548.
3699
[M+
H]
Lys
oPC
(20:
2/0:
0)M
S/M
S0.
40.
12−
0.82
2.4E
-06
−0.
702.
6E-0
4
4.09
518.
3254
[M+
H]
Lys
oPC
(18:
3)D
atab
ase
0.3
0.11
−0.
855.
0E-0
7−
0.72
1.6E
-04
3.98
518.
3219
[M+
H]
Lys
oPC
(18:
3)D
atab
ase
0.3
0.13
−0.
854.
0E-0
7−
0.70
2.6E
-04
3.99
544.
3407
[M+
H]+
Lys
oPC
(20:
4/0:
0)M
S/M
S0.
60.
21−
0.86
3.5E
-07
−0.
676.
0E-0
4
7.61
716.
5239
[M+
H]+
PE(1
6:0/
18:2
)M
S/M
S13
.77.
760.
791.
4E-0
50.
764.
2E-0
5
4.25
438.
2967
[M+
H]
Lys
oPE
(P-1
6:0)
MS/
MS
0.3
0.15
−0.
822.
4E-0
6−
0.88
5.8E
-08
4.07
454.
2922
[M+
H]+
Lys
oPE
(16:
0)M
S/M
S3.
41.
360.
857.
1E-0
70.
791.
2E-0
5
4.52
482.
3227
[M+
H]+
Lys
oPE
(18:
0)M
S/M
S3.
11.
470.
764.
1E-0
50.
749.
0E-0
5
4.64
482.
3237
[M+
H]+
Lys
oPE
(18:
0)M
S/M
S2.
40.
840.
756.
4E-0
50.
823.
8E-0
6
3.93
478.
2927
[M+
H]+
Lys
oPE
(18:
2)M
S/M
S5.
71.
350.
791.
4E-0
50.
901.
5E-0
8
3.97
502.
2924
[M+
H]+
Lys
oPE
(20:
4)M
S/M
S5.
51.
960.
731.
0E-0
40.
893.
3E-0
8
3.97
526.
2932
[M+
H]
Lys
oPE
(22:
6)D
atab
ase
6.7
2.92
0.75
5.4E
-05
0.78
2.1E
-05
6.50
675.
5420
[M+
H]
SM(d
18:1
/14:
0)M
S/M
S0.
60.
14−
0.86
3.8E
-07
−0.
815.
9E-0
6
6.75
689.
5582
[M+
H]
SM(d
18:1
/15:
0)M
S/M
S0.
50.
15−
0.93
4.1E
-10
−0.
831.
7E-0
6
6.99
703.
5782
[M+
H]+
SM (
d18:
1/16
:0)
MS/
MS
0.5
0.11
−0.
921.
3E-0
9−
0.80
7.2E
-06
7.49
731.
6091
[M+
H]+
SM (
d18:
1/18
:0)
MS/
MS
0.7
0.20
−0.
763.
6E-0
5−
0.68
4.7E
-04
0.87
150.
0572
[M+
H]+
Met
hion
ine
Stan
dard
3.8
1.79
0.85
4.4E
-07
0.80
9.8E
-06
0.61
116.
0698
[M+
H]+
Prol
ine
Stan
dard
3.6
1.99
0.83
1.9E
-06
0.79
1.5E
-05
0.98
182.
0792
[M+
H]+
Tyr
osin
eSt
anda
rd10
.04.
360.
831.
8E-0
60.
848.
2E-0
7
0.59
120.
0647
[M+
H]+
Thr
eoni
neSt
anda
rd2.
61.
380.
857.
1E-0
70.
823.
4E-0
6
a Met
abol
ites
conf
irm
ed b
y M
S/M
S or
sta
ndar
d ar
e in
dica
ted
b Reg
ioch
emis
try
assi
gned
bas
ed o
n th
e el
utio
n or
der
c Ave
rage
Fol
d C
hang
e an
d st
anda
rd d
evia
tion,
Gal
N-
vers
us s
alin
e- tr
eate
d ra
ts
Metabolomics. Author manuscript; available in PMC 2012 November 06.
$waterm
ark-text$w
atermark-text
$waterm
ark-text
Gonzalez et al. Page 27d C
orre
latio
n an
alys
is w
ith L
iver
dam
age
indi
cato
rs (
CD
S sc
ore
and
seru
m A
LT
act
ivity
)
e Spea
rman
's r
ank
corr
elat
ion
coef
fici
ent G
alN
- ve
rsus
sal
ine-
trea
ted
rats
f F-di
stri
butio
n pr
obab
ility
Metabolomics. Author manuscript; available in PMC 2012 November 06.