Regional Geotechnical Mapping Employing Kriging on ... - MDPI
15
applied sciences Article Regional Geotechnical Mapping Employing Kriging on Electronic Geodatabase Muhammad Usman Arshid * and M. A. Kamal Department of Civil Engineering, University of Engineering and Technology, Taxila 47050, Pakistan; [email protected] * Correspondence: [email protected]; Tel.: +92-321-7877-466 Received: 24 September 2020; Accepted: 19 October 2020; Published: 29 October 2020 Featured Application: The development of a regional geotechnical map allows quick and easily obtaining information regarding soil formation and allowable bearing capacity. In addition, this map will help in preliminary studies, feasibility studies, and land use policies. Abstract: A regional geotechnical map was developed by employing kriging using spatial and s geostatistical analysis tools. Many studies have been carried out in the field of topography, digital elevation modeling, agriculture, geological, crop, and precipitation mapping. However, no significant contribution to the development of geotechnical mapping has been made. For the appraisal of a geotechnical map, extensive field explorations were carried out throughout the geotechnically diversified plateau spread over an area of approximately 23,000 km 2 . In total, 450 soil samples were collected from 75 data stations to determine requisite index properties and soil classification for the subsequent allowable bearing capacity evaluation. The formatted test results, along with associated geospatial information, were uploaded to ArcMap, which created an initial input electronic database. The kriging technique of geostatistical analysis was determined to be more feasible for generating a geotechnical map. The developed map represents the distribution of soil in the region as per the engineering classification system, allowable bearing capacity, and American Association of State Highway and Transportation Officials (AASHTO) subgrade rating for 1.5-, 3.0-, and 4.5-m depths. The accuracy of the maps generated using kriging interpolation technique under spatial analyst tools was verified by comparing the values in the generated surface with the actual values measured at randomly selected validation points. The database was primarily created for the appraisal of geotechnical maps and can also be used for preliminary geotechnical investigations, which saves the cost of soil investigations. In addition, this approach allows establishing useful correlations among the geotechnical properties of soil. Keywords: GIS in geotechnical; geotechnical mapping; Potohar Plateau; geostatistical analysis 1. Introduction Geotechnical investigation is considered to be a pre-requisite for any civil engineering project. It ensures the safe execution of the project and improves its feasibility, planning, and design phases. There is an increasing challenge for geotechnical engineers to quantify ground properties by considering potential variability between the sampling points. To assess the variability of soil properties at a site, it is essential to consider the correlation structure of soil properties. This study was meant to be an aid by providing an electronic geodatabase and ready-to-use geotechnical map for an economical preliminary investigation. This approach may reduce the cost and time required for such investigations and provides reasonable accuracy. A comparable work has been carried out in the field of topography, digital elevation modeling, and agriculture soil mapping. Geological, crop health, and precipitation Appl. Sci. 2020, 10, 7625; doi:10.3390/app10217625 www.mdpi.com/journal/applsci
-
Upload
khangminh22 -
Category
Documents
-
view
0 -
download
0
Transcript of Regional Geotechnical Mapping Employing Kriging on ... - MDPI
applied sciences
Article
Regional Geotechnical Mapping Employing Krigingon Electronic Geodatabase
Muhammad Usman Arshid * and M. A. Kamal
Department of Civil Engineering, University of Engineering and Technology, Taxila 47050, Pakistan;[email protected]* Correspondence: [email protected]; Tel.: +92-321-7877-466
Received: 24 September 2020; Accepted: 19 October 2020; Published: 29 October 2020�����������������
Featured Application: The development of a regional geotechnical map allows quick and easilyobtaining information regarding soil formation and allowable bearing capacity. In addition,this map will help in preliminary studies, feasibility studies, and land use policies.
Abstract: A regional geotechnical map was developed by employing kriging using spatial and sgeostatistical analysis tools. Many studies have been carried out in the field of topography, digitalelevation modeling, agriculture, geological, crop, and precipitation mapping. However, no significantcontribution to the development of geotechnical mapping has been made. For the appraisal ofa geotechnical map, extensive field explorations were carried out throughout the geotechnicallydiversified plateau spread over an area of approximately 23,000 km2. In total, 450 soil samples werecollected from 75 data stations to determine requisite index properties and soil classification for thesubsequent allowable bearing capacity evaluation. The formatted test results, along with associatedgeospatial information, were uploaded to ArcMap, which created an initial input electronic database.The kriging technique of geostatistical analysis was determined to be more feasible for generatinga geotechnical map. The developed map represents the distribution of soil in the region as per theengineering classification system, allowable bearing capacity, and American Association of StateHighway and Transportation Officials (AASHTO) subgrade rating for 1.5-, 3.0-, and 4.5-m depths.The accuracy of the maps generated using kriging interpolation technique under spatial analysttools was verified by comparing the values in the generated surface with the actual values measuredat randomly selected validation points. The database was primarily created for the appraisal ofgeotechnical maps and can also be used for preliminary geotechnical investigations, which saves thecost of soil investigations. In addition, this approach allows establishing useful correlations amongthe geotechnical properties of soil.
Keywords: GIS in geotechnical; geotechnical mapping; Potohar Plateau; geostatistical analysis
1. Introduction
Geotechnical investigation is considered to be a pre-requisite for any civil engineering project.It ensures the safe execution of the project and improves its feasibility, planning, and design phases.There is an increasing challenge for geotechnical engineers to quantify ground properties by consideringpotential variability between the sampling points. To assess the variability of soil properties at a site,it is essential to consider the correlation structure of soil properties. This study was meant to be anaid by providing an electronic geodatabase and ready-to-use geotechnical map for an economicalpreliminary investigation. This approach may reduce the cost and time required for such investigationsand provides reasonable accuracy. A comparable work has been carried out in the field of topography,digital elevation modeling, and agriculture soil mapping. Geological, crop health, and precipitation
Appl. Sci. 2020, 10, 7625; doi:10.3390/app10217625 www.mdpi.com/journal/applsci
Appl. Sci. 2020, 10, 7625 2 of 15
mapping are also of interest to the researchers. However, in the literature, there are no significantcontributions to the appraisal of geotechnical mapping. Engineering soil classification is not onlyimportant for preliminary recommendations on the feasibility of proposed projects but also plays a vitalrole while selecting identified material sources for the proposed projects. The American Association ofState Highways and Transportation Official (AASHTO) classifies soils on the basis of their relativesuitability as a subgrade material, which ranges from excellent to poor (A-1–A-7, in descending order).This rating considerably affects the selection of routes and alignment of motorways and highways.In addition, subgrade rating greatly affects the cost of these megaprojects. Subgrade rating can evenlead to the selection or rejection of a particular route for the proposed highway. In addition, it canidentify potential problems on a specific route. The well-developed maps containing information onengineering classification and subgrade rating can serve as an excellent tool for engineering planers.The generation of such maps requires an extensive exposure to soil formation, geological processes,topographic features, field exploration, and laboratory testing along with a reliable data analysis,interpretive and mapping tools. Thus, a desk study was performed, which evaluated the availabletopographic, administrative, and precipitation data, location, and route of water bodies in the area.
In total, 75 locations were selected for drilling and collection of samples to determine requisiteproperties to be incorporated into the proposed geotechnical map. Reconnaissance survey wasconducted on the sites chosen to acquire initial information about ground condition, e.g. visual soilclassification, observation of geological features through examination of outcrops, tentative water table,suitable equipment for drilling at each site, equipment access to the selected site, nature of nearby waterbodies if any, and social and cultural issues of the area. The reconnaissance outcome was systematicallycompiled. Finally, the exact location of 75 sites was selected for boring and collection of samples in amesh grip pattern scattered throughout the geotechnically diversified plateau spread over an area ofapproximately 23,000 km2. In total, 450 soil samples were collected from 75 data stations to determinerequisite index properties and to be used for subsequent engineering evaluations. Laboratory testswere performed according to relevant American Society for Testing and Materials (ASTM) standards,and the results were compiled to create a database for further processing.
ArcGIS is an emerging software for the analysis of datasets. It consists of diversified techniquesfor the interpretation, analysis, interpolation, and extrapolation of parameters. The test results wereconverted to form a geodatabase and uploaded to the ArcMap software. Among the numerousavailable data interpolation techniques, the kriging technique of geostatistical analysis was determinedto be more suitable for the evaluation of target geotechnical mapping. Kriging is a geostatisticalinterpolation technique that considers both the distance and degree of variation between known datapoints when estimating values in unknown areas. A kriging estimate is a weighted linear combinationof the known sample values around the location to be estimated. The weighted average of the dataavailable on nodes fixes the weight of all the nodes on the basis of the spatial variation and distance fromthe cell under consideration to determine the output value for each cell. The main strength of krigingis its unbiasedness and ability to predict the spatial distribution of uncertainty [1,2]. The validation ofgenerated maps was carried out through confirmatory tests at arbitrary selected additional ten points.
Input parameters for modeling and mapping soil properties often consist of samples frompreselected spatial locations, although samples are collected at several different soil depth intervals.However, it may be of interest or the conditions may require to assess the properties of soil at thelocations other than the sampled locations or between the sampled locations. It is the task of the dataanalyst to put the data together in such a way that useful and reliable conclusions can be drawn for thesoil depths of practical interest [3]. The effect of spatial variation on geotechnical properties of soil hasbeen studied, and depositional environment has been reported to affect these properties [4]. The spatialmodeling of geotechnical parameters has been utilized to assess the geotechnical properties by creating3D models for the construction of the Lavrion Technological and Cultural Park [5]. Soil stratigraphicprofiles were generated by employing algorithms that use individual cone penetration test (CPT)sounding as an input. These stratigraphic profiles have been reported to reduce ambiguity in generated
Appl. Sci. 2020, 10, 7625 3 of 15
profiles [6]. Memory-based learners and machine learning algorithms were determined to performbetter than other regression analysis techniques, as reported in [7,8].
The probabilistic approach has been ranked higher than deterministic approaches in geotechnicalengineering owing to its better incorporation of uncertainty. Geotechnical uncertainty can be quantifiedthrough the statistical analysis of the database or on the basis of the judgment of an engineer performingthe analysis [9]. A 2D Bayesian compressive sampling approach is developed to address uncertaintiesin the interpretation of spatially varying smaller geodatabase; this approach is compared with thekriging interpolation method for geostatistical analysis described in [10,11]. The site variabilitymodeling of cone penetration resistance has been determined to facilitate geotechnical engineers tobetter understand site conditions and produce a design with higher reliability [12]. A framework topredict soil behavior by modeling two significant sources of uncertainty, which are the measurementerror and spatial variability, has been developed [13].
The prediction of various soil properties or soil classes on the basis of soil sampling over smallarea by employing numerical modeling techniques reduces their effectiveness owing to limitedspatial variability incorporation. Digital soil mapping is an emerging technique to overcome theabove-mentioned limitation in soil surveys [14]. Different approaches have been employed to model soildepth in France, and multi-resolution kriging has been reported to produce smoother maps comparedto straightforward digital soil mapping and regression modeling [15]. The Illinois State GeologicalSurvey (ISGS) has illustrated the workflow for the generation of 3D geologic mapping in ArcScene [16].Geotechnical and geological characterization of a region in Portugal and geophysical and geotechnicalapproaches for micro-zonation studies for Hispaniola Island has also been appraised [17,18].
An ordinary kriging technique has also been used to generate top sand thickness and seabedsurface [19]. The prediction of soil properties from terrain attributes using various forms of thekriging regression analysis technique has been reported to perform well [20,21]. Kriging has beenevaluated as an unbiased and least error-prone optimum reserve estimation method to reduce or avoidambiguities in plotting geological cross-sections on the basis of engineering geological properties anddata from exploratory holes [22]. Among the eight data interpolation techniques available under thespatial analyst tool in the ArcMap software, the inverse distance weighting (IDW) method has beenreported to produce more accurate zonation maps. Standard penetration resistance maps for variousdepths have been generated and compared with the actually measured values for Surfers’ Paradise inAustralia [23]. The mapping of soil properties is a time consuming and costly process, especially fordiverse topographic conditions [24]. The estimations of soil moisture content using ordinary kriging,IDW, kriging with external drift (KED), and spline were compared, and KED has been reported toproduce better results [25,26].
The engineering properties required to correlate with their parent materials irrespective of thediversity in the soil and the parent materials have been reported and are assumed to be applicablefor all types of parent materials [27]. Multicriteria decision analysis (MCDA) has been performedusing GIS software to develop geotechnical micro-zonation models using various soil properties [28].The geotechnical database has been processed using GIS to generate soil types and standard penetrationresistance maps to ease data interpretation [29]. Most of the soil investigations are being carried outwithout the use of GIS in this region. The current study on the geotechnically diversified region isthe first of its kind. This work is an effort to introduce the integration of GIS-based field explorationsand subsequent development of geotechnical maps, which has not been practiced in the region.A correlation between Standard Penetration Test (SPT) N values and index properties of soil wasevaluated using artificial neural networks and another correlation between relative compaction andallowable bearing capacity has also been appraised
The development of a regional geotechnical map provides a quick and easily obtaining insightregarding soil formation and allowable bearing capacity. In addition, this map will help in preliminarystudies, feasibility studies, and land use policies.
Appl. Sci. 2020, 10, 7625 4 of 15
2. Materials and Methods
In the first phase, available data related to topography, geologic settings, precipitation, and landuse patterns were explored. Concise discussion on these parameters is presented to establish a baselinefor field explorations.
2.1. Geography
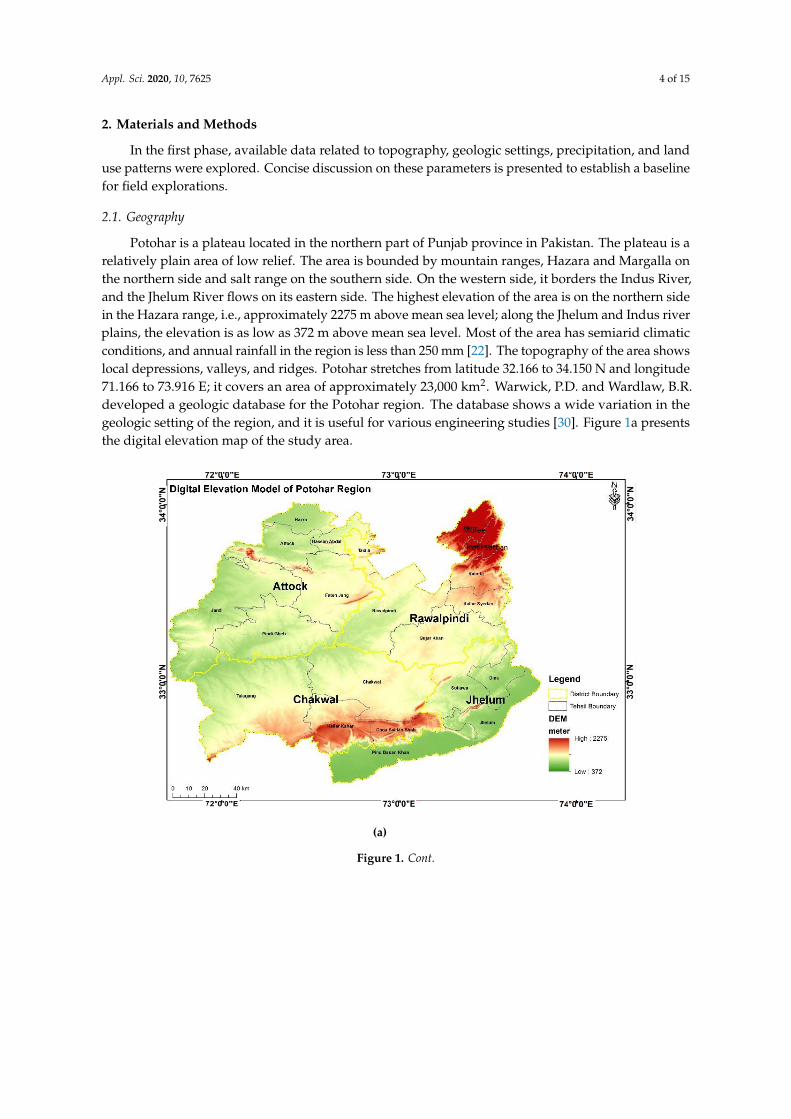
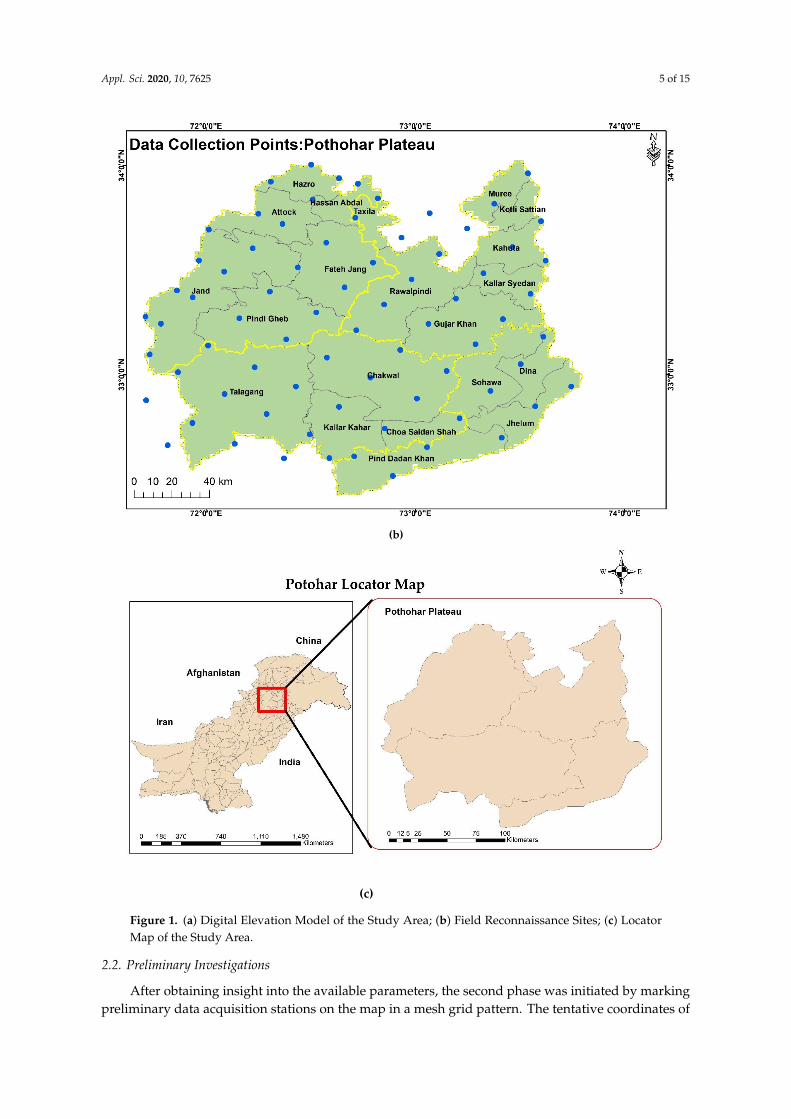
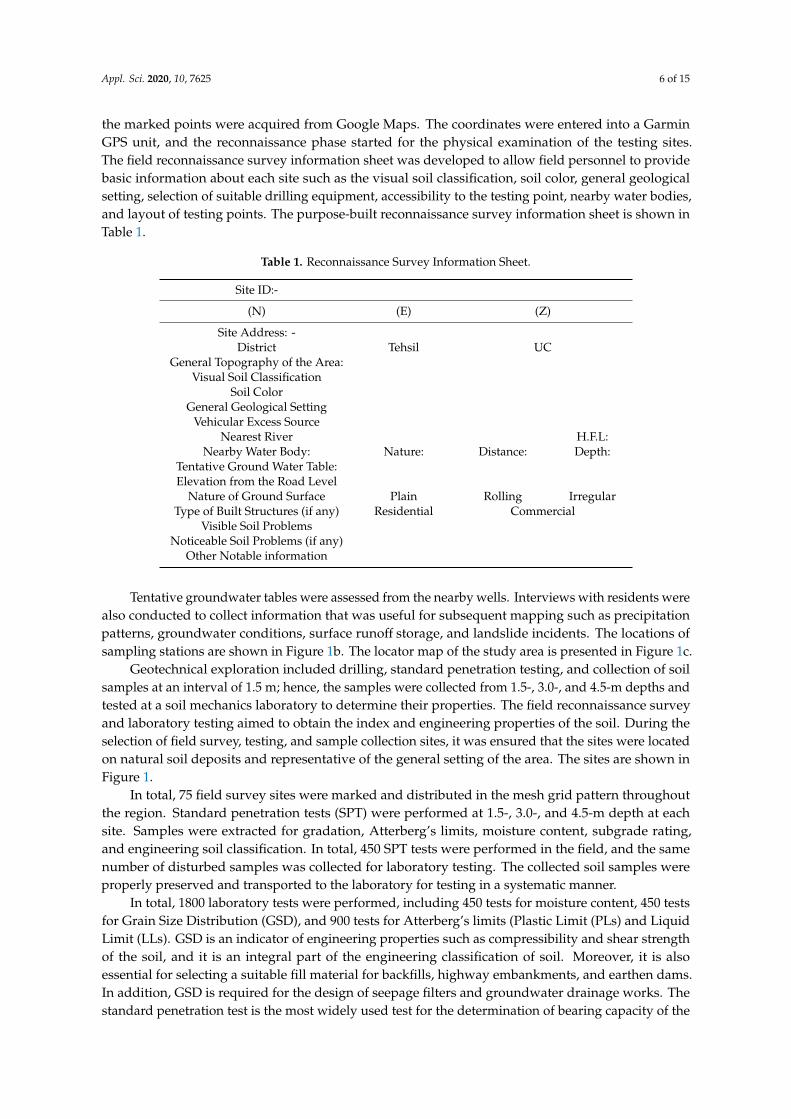
Potohar is a plateau located in the northern part of Punjab province in Pakistan. The plateau is arelatively plain area of low relief. The area is bounded by mountain ranges, Hazara and Margalla onthe northern side and salt range on the southern side. On the western side, it borders the Indus River,and the Jhelum River flows on its eastern side. The highest elevation of the area is on the northern sidein the Hazara range, i.e., approximately 2275 m above mean sea level; along the Jhelum and Indus riverplains, the elevation is as low as 372 m above mean sea level. Most of the area has semiarid climaticconditions, and annual rainfall in the region is less than 250 mm [22]. The topography of the area showslocal depressions, valleys, and ridges. Potohar stretches from latitude 32.166 to 34.150 N and longitude71.166 to 73.916 E; it covers an area of approximately 23,000 km2. Warwick, P.D. and Wardlaw, B.R.developed a geologic database for the Potohar region. The database shows a wide variation in thegeologic setting of the region, and it is useful for various engineering studies [30]. Figure 1a presentsthe digital elevation map of the study area.
1
(a)
Figure 1. Cont.
Appl. Sci. 2020, 10, 7625 5 of 15
1
(b)
2 of 10
(c)
Figure 1. (a) Digital Elevation Model of the Study Area; (b) Field Reconnaissance Sites; (c) Locator Map of
the Study Area
Figure 2. Transformation of data
Figure 1. (a) Digital Elevation Model of the Study Area; (b) Field Reconnaissance Sites; (c) LocatorMap of the Study Area.
2.2. Preliminary Investigations
After obtaining insight into the available parameters, the second phase was initiated by markingpreliminary data acquisition stations on the map in a mesh grid pattern. The tentative coordinates of
Appl. Sci. 2020, 10, 7625 6 of 15
the marked points were acquired from Google Maps. The coordinates were entered into a GarminGPS unit, and the reconnaissance phase started for the physical examination of the testing sites.The field reconnaissance survey information sheet was developed to allow field personnel to providebasic information about each site such as the visual soil classification, soil color, general geologicalsetting, selection of suitable drilling equipment, accessibility to the testing point, nearby water bodies,and layout of testing points. The purpose-built reconnaissance survey information sheet is shown inTable 1.
Table 1. Reconnaissance Survey Information Sheet.
Site ID:-
(N) (E) (Z)
Site Address: -District Tehsil UC
General Topography of the Area:Visual Soil Classification
Soil ColorGeneral Geological Setting
Vehicular Excess SourceNearest River H.F.L:
Nearby Water Body: Nature: Distance: Depth:Tentative Ground Water Table:Elevation from the Road Level
Nature of Ground Surface Plain Rolling IrregularType of Built Structures (if any) Residential Commercial
Visible Soil ProblemsNoticeable Soil Problems (if any)
Other Notable information
Tentative groundwater tables were assessed from the nearby wells. Interviews with residents werealso conducted to collect information that was useful for subsequent mapping such as precipitationpatterns, groundwater conditions, surface runoff storage, and landslide incidents. The locations ofsampling stations are shown in Figure 1b. The locator map of the study area is presented in Figure 1c.
Geotechnical exploration included drilling, standard penetration testing, and collection of soilsamples at an interval of 1.5 m; hence, the samples were collected from 1.5-, 3.0-, and 4.5-m depths andtested at a soil mechanics laboratory to determine their properties. The field reconnaissance surveyand laboratory testing aimed to obtain the index and engineering properties of the soil. During theselection of field survey, testing, and sample collection sites, it was ensured that the sites were locatedon natural soil deposits and representative of the general setting of the area. The sites are shown inFigure 1.
In total, 75 field survey sites were marked and distributed in the mesh grid pattern throughoutthe region. Standard penetration tests (SPT) were performed at 1.5-, 3.0-, and 4.5-m depth at eachsite. Samples were extracted for gradation, Atterberg’s limits, moisture content, subgrade rating,and engineering soil classification. In total, 450 SPT tests were performed in the field, and the samenumber of disturbed samples was collected for laboratory testing. The collected soil samples wereproperly preserved and transported to the laboratory for testing in a systematic manner.
In total, 1800 laboratory tests were performed, including 450 tests for moisture content, 450 testsfor Grain Size Distribution (GSD), and 900 tests for Atterberg’s limits (Plastic Limit (PLs) and LiquidLimit (LLs). GSD is an indicator of engineering properties such as compressibility and shear strengthof the soil, and it is an integral part of the engineering classification of soil. Moreover, it is alsoessential for selecting a suitable fill material for backfills, highway embankments, and earthen dams.In addition, GSD is required for the design of seepage filters and groundwater drainage works. Thestandard penetration test is the most widely used test for the determination of bearing capacity of the
Appl. Sci. 2020, 10, 7625 7 of 15
soil, while Atterberg’s limits are required for the engineering classification of fine-grained soil, mix,dusty coarse-grained soils, and AASHTO subgrade ratings. After the execution of the field survey,field and laboratory test results were processed to evaluate the parameters shown in Table 2.
Table 2. Outlines of Geodatabase Input Parameters.
Sr. No. Input Parameters Max. Value Min. Value
1 Grain Size 75 mm 0.08 mm2 Atterberg’s Limit (LL) 48.148 03 Atterberg’s Limit (PL) 27.77 04 Engineering Classification of Soil CL GP5 AASHTO Subgrade Rating A-1-a A-76 Standard Penetration Resistance 100 57 Allowable Bearing Capacity 11.343 0.49
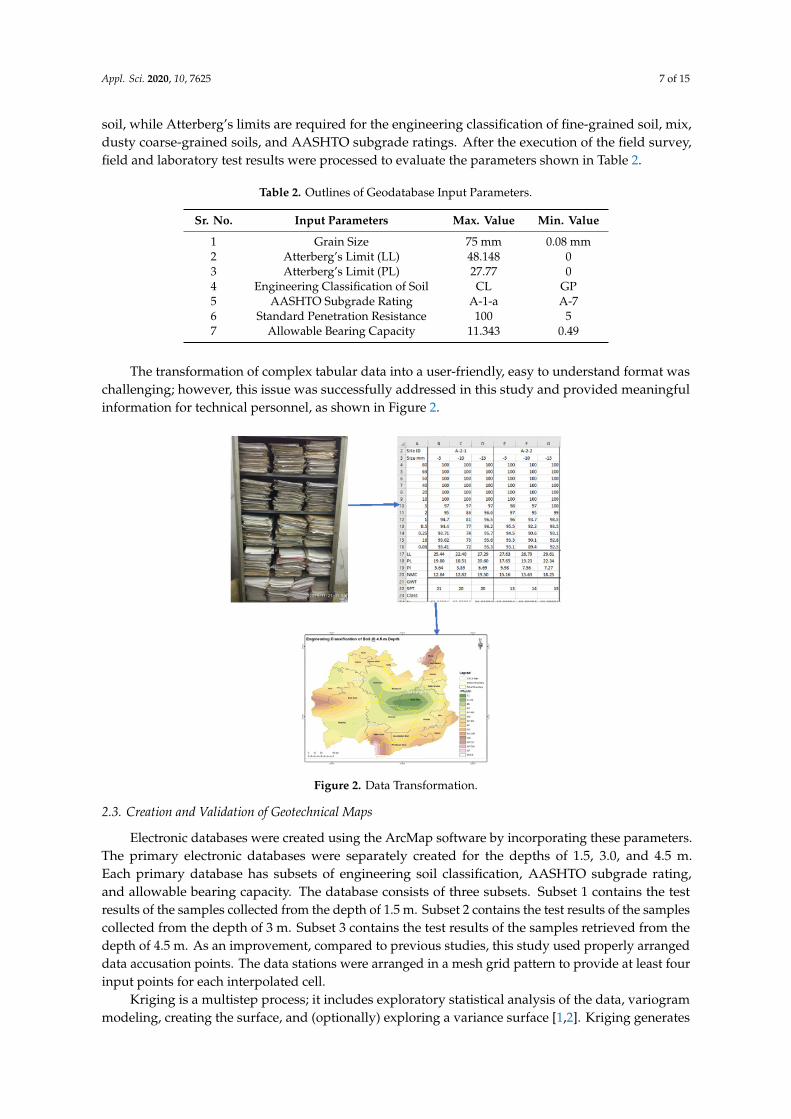
The transformation of complex tabular data into a user-friendly, easy to understand format waschallenging; however, this issue was successfully addressed in this study and provided meaningfulinformation for technical personnel, as shown in Figure 2.
Appl. Sci. 2020, 10, x FOR PEER REVIEW 6 of 15
Table 2. Outlines of Geodatabase Input Parameters.
Sr. No. Input Parameters Max. Value Min. Value 1 Grain Size 75 mm 0.08 mm 2 Atterberg’s Limit (LL) 48.148 0 3 Atterberg’s Limit (PL) 27.77 0 4 Engineering Classification of Soil CL GP 5 AASHTO Subgrade Rating A-1-a A-7 6 Standard Penetration Resistance 100 5 7 Allowable Bearing Capacity 11.343 0.49
The transformation of complex tabular data into a user-friendly, easy to understand format was challenging; however, this issue was successfully addressed in this study and provided meaningful information for technical personnel, as shown in Figure 2.
Figure 2. Data Transformation.
2.3. Creation and Validation of Geotechnical Maps
Electronic databases were created using the ArcMap software by incorporating these parameters. The primary electronic databases were separately created for the depths of 1.5, 3.0, and 4.5 m. Each primary database has subsets of engineering soil classification, AASHTO subgrade rating, and allowable bearing capacity. The database consists of three subsets. Subset 1 contains the test results of the samples collected from the depth of 1.5 m. Subset 2 contains the test results of the samples collected from the depth of 3 m. Subset 3 contains the test results of the samples retrieved from the depth of 4.5 m. As an improvement, compared to previous studies, this study used properly arranged data accusation points. The data stations were arranged in a mesh grid pattern to provide at least four input points for each interpolated cell.
Kriging is a multistep process; it includes exploratory statistical analysis of the data, variogram modeling, creating the surface, and (optionally) exploring a variance surface [1,2]. Kriging generates an estimated surface from a scattered set of points with z-values. Kriging assumes that the distance or direction between sample points reflects a spatial correlation that can be used to explain variation in the surface. The kriging tool fits a mathematical function to a specified number of points, or all points within a specified radius, to determine the output value for each location. The semivariogram depicts the spatial autocorrelation of the measured sample points.. The goal is to achieve the best fit,
Figure 2. Data Transformation.
2.3. Creation and Validation of Geotechnical Maps
Electronic databases were created using the ArcMap software by incorporating these parameters.The primary electronic databases were separately created for the depths of 1.5, 3.0, and 4.5 m.Each primary database has subsets of engineering soil classification, AASHTO subgrade rating,and allowable bearing capacity. The database consists of three subsets. Subset 1 contains the testresults of the samples collected from the depth of 1.5 m. Subset 2 contains the test results of the samplescollected from the depth of 3 m. Subset 3 contains the test results of the samples retrieved from thedepth of 4.5 m. As an improvement, compared to previous studies, this study used properly arrangeddata accusation points. The data stations were arranged in a mesh grid pattern to provide at least fourinput points for each interpolated cell.
Kriging is a multistep process; it includes exploratory statistical analysis of the data, variogrammodeling, creating the surface, and (optionally) exploring a variance surface [1,2]. Kriging generates
Appl. Sci. 2020, 10, 7625 8 of 15
an estimated surface from a scattered set of points with z-values. Kriging assumes that the distance ordirection between sample points reflects a spatial correlation that can be used to explain variation inthe surface. The kriging tool fits a mathematical function to a specified number of points, or all pointswithin a specified radius, to determine the output value for each location. The semivariogram depictsthe spatial autocorrelation of the measured sample points. The goal is to achieve the best fit, as well asincorporate our knowledge of the phenomenon in the model. By considering soil anisotropy, kriginghas been reported to produce reliable predictions [29].
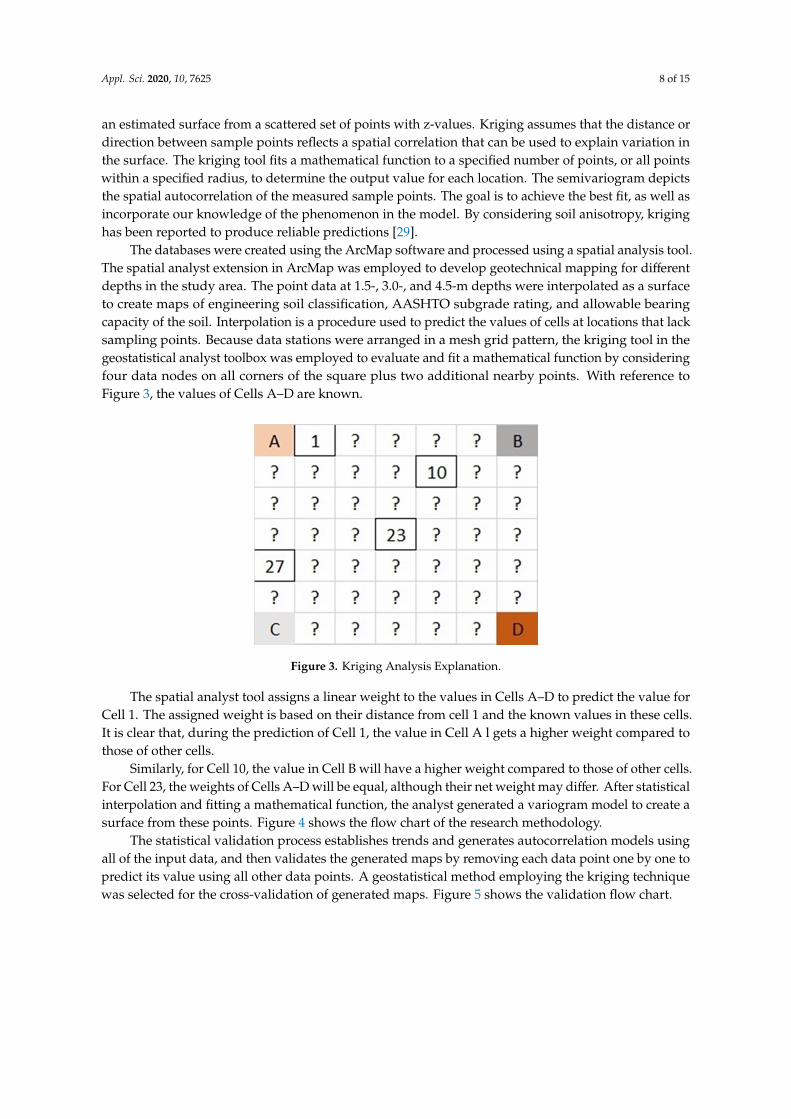
The databases were created using the ArcMap software and processed using a spatial analysis tool.The spatial analyst extension in ArcMap was employed to develop geotechnical mapping for differentdepths in the study area. The point data at 1.5-, 3.0-, and 4.5-m depths were interpolated as a surfaceto create maps of engineering soil classification, AASHTO subgrade rating, and allowable bearingcapacity of the soil. Interpolation is a procedure used to predict the values of cells at locations that lacksampling points. Because data stations were arranged in a mesh grid pattern, the kriging tool in thegeostatistical analyst toolbox was employed to evaluate and fit a mathematical function by consideringfour data nodes on all corners of the square plus two additional nearby points. With reference toFigure 3, the values of Cells A–D are known.
Appl. Sci. 2020, 10, x FOR PEER REVIEW 7 of 15
as well as incorporate our knowledge of the phenomenon in the model. By considering soil anisotropy, kriging has been reported to produce reliable predictions [29].
The databases were created using the ArcMap software and processed using a spatial analysis tool. The spatial analyst extension in ArcMap was employed to develop geotechnical mapping for different depths in the study area. The point data at 1.5-, 3.0-, and 4.5-m depths were interpolated as a surface to create maps of engineering soil classification, AASHTO subgrade rating, and allowable bearing capacity of the soil. Interpolation is a procedure used to predict the values of cells at locations that lack sampling points. Because data stations were arranged in a mesh grid pattern, the kriging tool in the geostatistical analyst toolbox was employed to evaluate and fit a mathematical function by considering four data nodes on all corners of the square plus two additional nearby points. With reference to Figure 3, the values of Cells A–D are known.
Figure 3. Kriging Analysis Explanation.
The spatial analyst tool assigns a linear weight to the values in Cells A–D to predict the value for Cell 1. The assigned weight is based on their distance from cell 1 and the known values in these cells. It is clear that, during the prediction of Cell 1, the value in Cell A l gets a higher weight compared to those of other cells.
Similarly, for Cell 10, the value in Cell B will have a higher weight compared to those of other cells. For Cell 23, the weights of Cells A–D will be equal, although their net weight may differ. After statistical interpolation and fitting a mathematical function, the analyst generated a variogram model to create a surface from these points. Figure 4 shows the flow chart of the research methodology.
Figure 3. Kriging Analysis Explanation.
The spatial analyst tool assigns a linear weight to the values in Cells A–D to predict the value forCell 1. The assigned weight is based on their distance from cell 1 and the known values in these cells.It is clear that, during the prediction of Cell 1, the value in Cell A l gets a higher weight compared tothose of other cells.
Similarly, for Cell 10, the value in Cell B will have a higher weight compared to those of other cells.For Cell 23, the weights of Cells A–D will be equal, although their net weight may differ. After statisticalinterpolation and fitting a mathematical function, the analyst generated a variogram model to create asurface from these points. Figure 4 shows the flow chart of the research methodology.
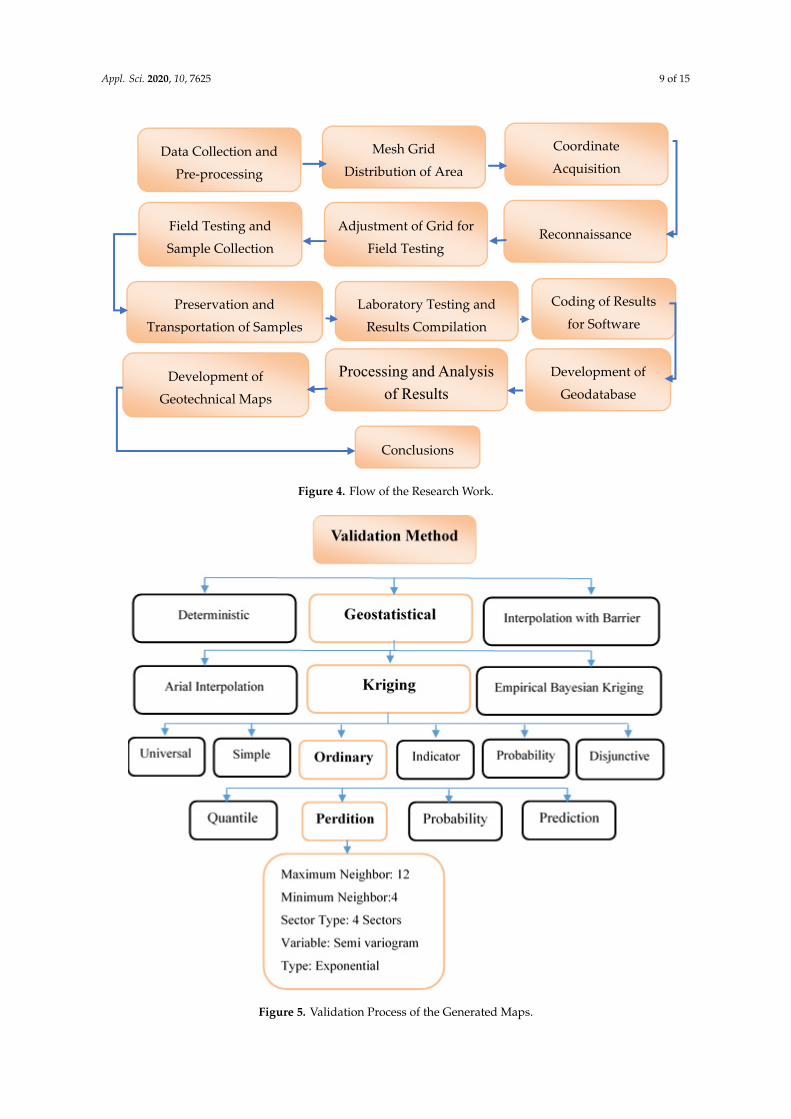
The statistical validation process establishes trends and generates autocorrelation models usingall of the input data, and then validates the generated maps by removing each data point one by one topredict its value using all other data points. A geostatistical method employing the kriging techniquewas selected for the cross-validation of generated maps. Figure 5 shows the validation flow chart.
Appl. Sci. 2020, 10, 7625 9 of 15
Appl. Sci. 2020, 10, x FOR PEER REVIEW 8 of 15
Figure 4. Flow of the Research Work.
The statistical validation process establishes trends and generates autocorrelation models using all of the input data, and then validates the generated maps by removing each data point one by one to predict its value using all other data points. A geostatistical method employing the kriging technique was selected for the cross-validation of generated maps. Figure 5 shows the validation flow chart.
Data Collection and
Pre-processing
Mesh Grid
Distribution of Area
Coordinate
Acquisition
Reconnaissance Adjustment of Grid for
Field Testing
Conclusions
Laboratory Testing and
Results Compilation
Preservation and
Transportation of Samples
Field Testing and
Sample Collection
Processing and Analysis of Results
Development of
Geotechnical Maps
Coding of Results
for Software
Development of
Geodatabase
Figure 4. Flow of the Research Work.Appl. Sci. 2020, 10, x FOR PEER REVIEW 9 of 15
Figure 5. Validation Process of the Generated Maps.
3. Results and Discussion
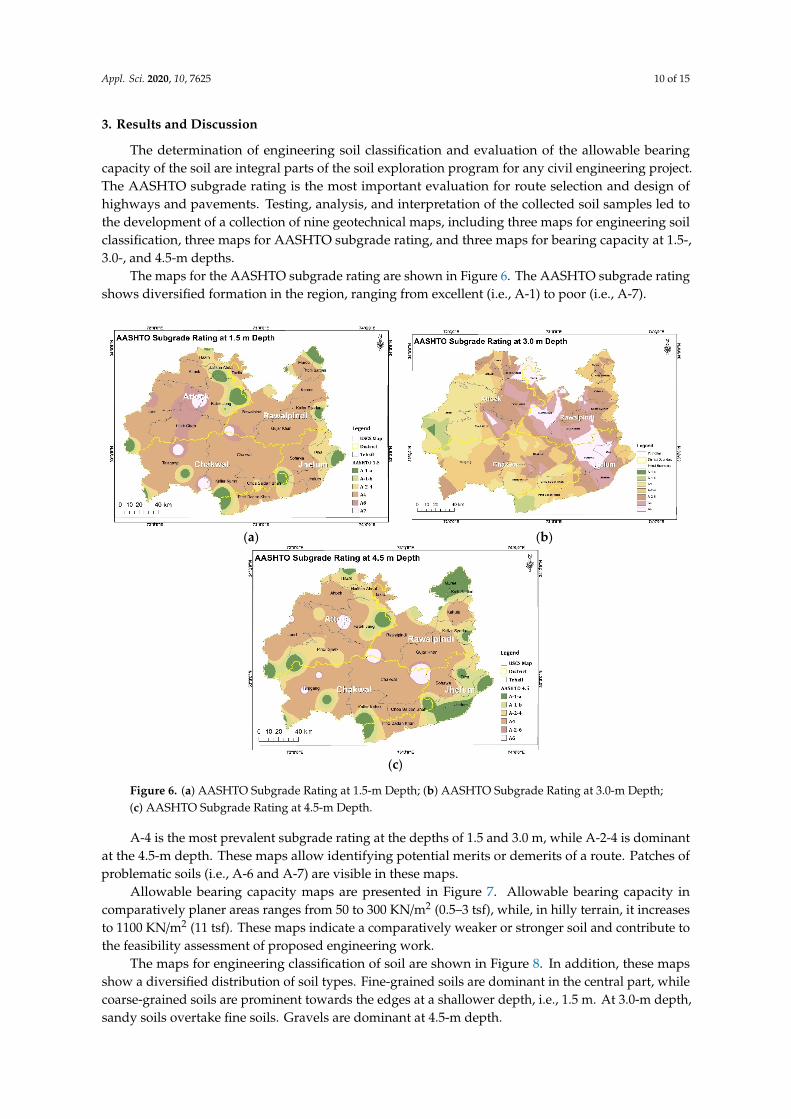
The determination of engineering soil classification and evaluation of the allowable bearing capacity of the soil are integral parts of the soil exploration program for any civil engineering project. The AASHTO subgrade rating is the most important evaluation for route selection and design of highways and pavements. Testing, analysis, and interpretation of the collected soil samples led to the development of a collection of nine geotechnical maps, including three maps for engineering soil classification, three maps for AASHTO subgrade rating, and three maps for bearing capacity at 1.5-, 3.0-, and 4.5-m depths.
The maps for the AASHTO subgrade rating are shown in Figure 6. The AASHTO subgrade rating shows diversified formation in the region, ranging from excellent (i.e., A-1) to poor (i.e., A-7).
Figure 5. Validation Process of the Generated Maps.
Appl. Sci. 2020, 10, 7625 10 of 15
3. Results and Discussion
The determination of engineering soil classification and evaluation of the allowable bearingcapacity of the soil are integral parts of the soil exploration program for any civil engineering project.The AASHTO subgrade rating is the most important evaluation for route selection and design ofhighways and pavements. Testing, analysis, and interpretation of the collected soil samples led tothe development of a collection of nine geotechnical maps, including three maps for engineering soilclassification, three maps for AASHTO subgrade rating, and three maps for bearing capacity at 1.5-,3.0-, and 4.5-m depths.
The maps for the AASHTO subgrade rating are shown in Figure 6. The AASHTO subgrade ratingshows diversified formation in the region, ranging from excellent (i.e., A-1) to poor (i.e., A-7).Appl. Sci. 2020, 10, x FOR PEER REVIEW 10 of 15
(a) (b)
(c)
Figure 6. (a) AASHTO Subgrade Rating at 1.5-m Depth; (b) AASHTO Subgrade Rating at 3.0-m Depth; (c) AASHTO Subgrade Rating at 4.5-m Depth.
A-4 is the most prevalent subgrade rating at the depths of 1.5 and 3.0 m, while A-2-4 is dominant at the 4.5-m depth. These maps allow identifying potential merits or demerits of a route. Patches of problematic soils (i.e., A-6 and A-7) are visible in these maps.
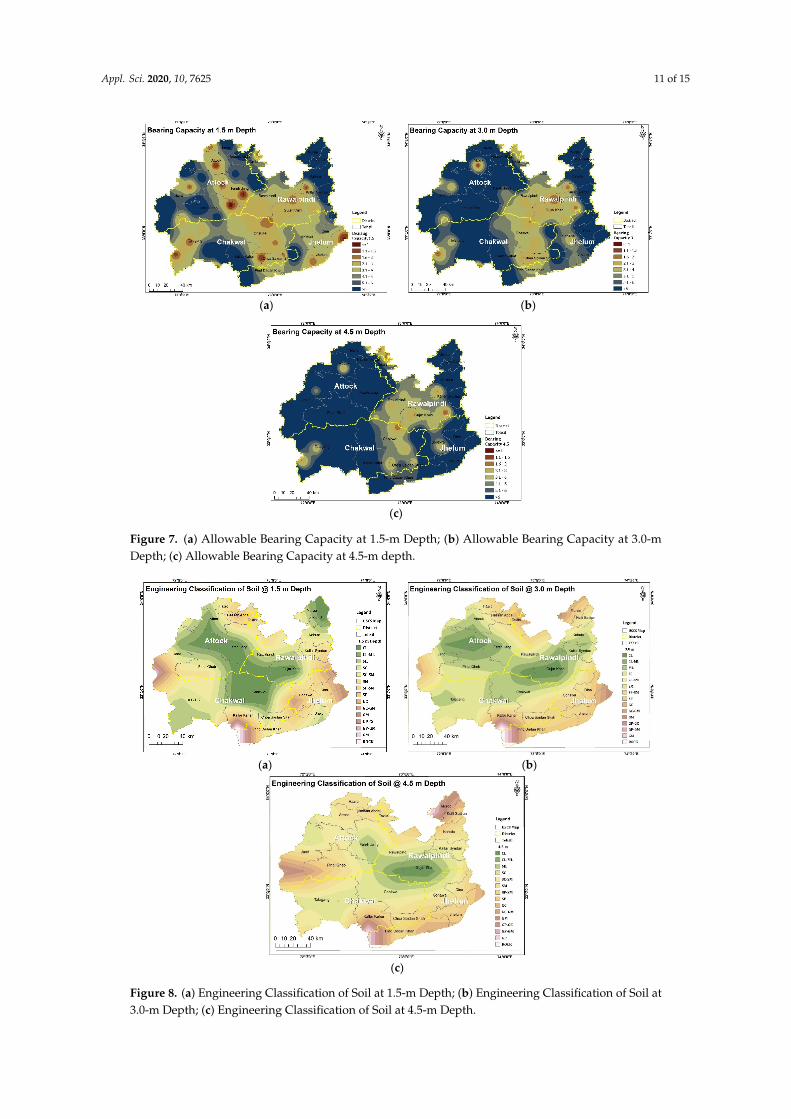
Allowable bearing capacity maps are presented in Figure 7. Allowable bearing capacity in comparatively planer areas ranges from 50 to 300 KN/m2 (0.5–3 tsf), while, in hilly terrain, it increases to 1100 KN/m2 (11 tsf). These maps indicate a comparatively weaker or stronger soil and contribute to the feasibility assessment of proposed engineering work.
(a) (b)
Figure 6. (a) AASHTO Subgrade Rating at 1.5-m Depth; (b) AASHTO Subgrade Rating at 3.0-m Depth;(c) AASHTO Subgrade Rating at 4.5-m Depth.
A-4 is the most prevalent subgrade rating at the depths of 1.5 and 3.0 m, while A-2-4 is dominantat the 4.5-m depth. These maps allow identifying potential merits or demerits of a route. Patches ofproblematic soils (i.e., A-6 and A-7) are visible in these maps.
Allowable bearing capacity maps are presented in Figure 7. Allowable bearing capacity incomparatively planer areas ranges from 50 to 300 KN/m2 (0.5–3 tsf), while, in hilly terrain, it increasesto 1100 KN/m2 (11 tsf). These maps indicate a comparatively weaker or stronger soil and contribute tothe feasibility assessment of proposed engineering work.
The maps for engineering classification of soil are shown in Figure 8. In addition, these mapsshow a diversified distribution of soil types. Fine-grained soils are dominant in the central part, whilecoarse-grained soils are prominent towards the edges at a shallower depth, i.e., 1.5 m. At 3.0-m depth,sandy soils overtake fine soils. Gravels are dominant at 4.5-m depth.
Appl. Sci. 2020, 10, 7625 11 of 15
Appl. Sci. 2020, 10, x FOR PEER REVIEW 10 of 15
(a) (b)
(c)
Figure 6. (a) AASHTO Subgrade Rating at 1.5-m Depth; (b) AASHTO Subgrade Rating at 3.0-m Depth; (c) AASHTO Subgrade Rating at 4.5-m Depth.
A-4 is the most prevalent subgrade rating at the depths of 1.5 and 3.0 m, while A-2-4 is dominant at the 4.5-m depth. These maps allow identifying potential merits or demerits of a route. Patches of problematic soils (i.e., A-6 and A-7) are visible in these maps.
Allowable bearing capacity maps are presented in Figure 7. Allowable bearing capacity in comparatively planer areas ranges from 50 to 300 KN/m2 (0.5–3 tsf), while, in hilly terrain, it increases to 1100 KN/m2 (11 tsf). These maps indicate a comparatively weaker or stronger soil and contribute to the feasibility assessment of proposed engineering work.
(a) (b) Appl. Sci. 2020, 10, x FOR PEER REVIEW 11 of 15
(c)
Figure 7. (a) Allowable Bearing Capacity at 1.5-m Depth; (b) Allowable Bearing Capacity at 3.0-m Depth; (c) Allowable Bearing Capacity at 4.5-m depth.
The maps for engineering classification of soil are shown in Figure 8. In addition, these maps show a diversified distribution of soil types. Fine-grained soils are dominant in the central part, while coarse-grained soils are prominent towards the edges at a shallower depth, i.e., 1.5 m. At 3.0-m depth, sandy soils overtake fine soils. Gravels are dominant at 4.5-m depth.
(a) (b)
(c)
Figure 8. (a) Engineering Classification of Soil at 1.5-m Depth; (b) Engineering Classification of Soil at 3.0-m Depth; (c) Engineering Classification of Soil at 4.5-m Depth.
This gradual change in the gradation of soils agrees with the weathering phenomenon. Top layers are more weathered than deeper layers. This observation is also an indication of a gravity
Figure 7. (a) Allowable Bearing Capacity at 1.5-m Depth; (b) Allowable Bearing Capacity at 3.0-mDepth; (c) Allowable Bearing Capacity at 4.5-m depth.
Appl. Sci. 2020, 10, x FOR PEER REVIEW 10 of 15
(c)
Figure 7. (a) Allowable Bearing Capacity at 1.5-m Depth; (b) Allowable Bearing Capacity at 3.0-m Depth; (c) Allowable Bearing Capacity at 4.5-m depth.
The maps for engineering classification of soil are shown in Figure 8. In addition, these maps show a diversified distribution of soil types. Fine-grained soils are dominant in the central part, while coarse-grained soils are prominent towards the edges at a shallower depth, i.e., 1.5 m. At 3.0-m depth, sandy soils overtake fine soils. Gravels are dominant at 4.5-m depth.
(a) (b)
(c)
Figure 8. (a) Engineering Classification of Soil at 1.5-m Depth; (b) Engineering Classification of Soil at 3.0-m Depth; (c) Engineering Classification of Soil at 4.5-m Depth.
This gradual change in the gradation of soils agrees with the weathering phenomenon. Top layers are more weathered than deeper layers. This observation is also an indication of a gravity depositional deposit. The developed map is the first of its kind; it incorporates geotechnical properties of the region.
This tool is ready to be used as a design aid, especially for feasibility studies, and to improve rough cost estimates. The accuracy of maps generated using the kriging interpolation technique
Figure 8. (a) Engineering Classification of Soil at 1.5-m Depth; (b) Engineering Classification of Soil at3.0-m Depth; (c) Engineering Classification of Soil at 4.5-m Depth.

Appl. Sci. 2020, 10, 7625 12 of 15
This gradual change in the gradation of soils agrees with the weathering phenomenon. Top layersare more weathered than deeper layers. This observation is also an indication of a gravity depositionaldeposit. The developed map is the first of its kind; it incorporates geotechnical properties of the region.
This tool is ready to be used as a design aid, especially for feasibility studies, and to improverough cost estimates. The accuracy of maps generated using the kriging interpolation technique underspatial analyst tools was verified in two layers. Initially, a geostatistical wizard was employed tovalidate maps. First, the cross-validation process established trends and generated autocorrelationmodels using all of the input data; then, it performed validation by removing each data point one byone to predict its value using all other data points. The statistical regression function (RF) and thecomparison of predicted and measured values are shown in Figure 9. The average standard error forthe measured and predicted values is determined as 0.145, 0.237, and 2.396 for AASHTO, bearingcapacity, and Engineering Classification (USCS) maps, respectively. Root mean square was 0.031, 0.064,and 1.858 for AASHTO, bearing capacity, and USCS, respectively.
Appl. Sci. 2020, 10, x FOR PEER REVIEW 12 of 15
depositional deposit. The developed map is the first of its kind; it incorporates geotechnical properties of the region.
This tool is ready to be used as a design aid, especially for feasibility studies, and to improve rough cost estimates. The accuracy of maps generated using the kriging interpolation technique under spatial analyst tools was verified in two layers. Initially, a geostatistical wizard was employed to validate maps. First, the cross-validation process established trends and generated autocorrelation models using all of the input data; then, it performed validation by removing each data point one by one to predict its value using all other data points. The statistical regression function (RF) and the comparison of predicted and measured values are shown in Figure 9. The average standard error for the measured and predicted values is determined as 0.145, 0.237, and 2.396 for AASHTO, bearing capacity, and Engineering Classification (USCS) maps, respectively. Root mean square was 0.031, 0.064, and 1.858 for AASHTO, bearing capacity, and USCS, respectively.
(a) (b)
(c)
Figure 9. (a) Statistical Evaluation of AASHTO Map; (b) Statistical Evaluation of Allowable Bearing Capacity Map; (c) Statistical Evaluation of Engineering Soil Classification Map.
To assess the accuracy of generated maps for the unseen data, another innovative technique was employed by collecting additional samples from 10 additional field survey sites and comparing the actual test results with the corresponding values in the developed maps. The statistical comparison of generated and measured cell values is shown in Figure 10.
Figure 9. (a) Statistical Evaluation of AASHTO Map; (b) Statistical Evaluation of Allowable BearingCapacity Map; (c) Statistical Evaluation of Engineering Soil Classification Map.
To assess the accuracy of generated maps for the unseen data, another innovative technique wasemployed by collecting additional samples from 10 additional field survey sites and comparing theactual test results with the corresponding values in the developed maps. The statistical comparison ofgenerated and measured cell values is shown in Figure 10.
The obtained results show that the kriging technique adequately maps the geotechnical parameters,and these parameters are similar to original measurements. From a geotechnical engineering point ofview, the interpolated values were acceptable for the feasibility and planning stages of infrastructure

Appl. Sci. 2020, 10, 7625 13 of 15
development projects. In addition, these maps supplement each other and further strengthen thederived conclusions from individual maps. The capability of the ArcMap software to house a1-TB-file database can considerably reduce the hazardous management of conventional printed databoxes. The database can be further converted into meaningful and ready-to-use technical information.Upon the closure of megaprojects, storage of files and data boxes remains troublesome; typically,these data, which are worth millions of rupees, are destroyed owing to the inability to physically managethem. Without the ability to manage data electronically, the quality of works suffers, and hundreds ofmillions of rupees worth of data is lost forever. Millions of rupees can be saved if the geotechnical datawere properly managed and represented. This study is an effort to create an electronic database andgenerate ready-to-use maps in three spheres of geotechnical engineering.
Appl. Sci. 2020, 10, x FOR PEER REVIEW 13 of 15
(a) (b)
(c)
Figure 10. (a) Validation of AASHTO Map Using Unseen Data; (b) Validation of Allowable Bearing Capacity Map Using Unseen Data; (c) Validation of Engineering Classification of Soil Map Using Unseen Data.
The obtained results show that the kriging technique adequately maps the geotechnical parameters, and these parameters are similar to original measurements. From a geotechnical engineering point of view, the interpolated values were acceptable for the feasibility and planning stages of infrastructure development projects. In addition, these maps supplement each other and further strengthen the derived conclusions from individual maps. The capability of the ArcMap software to house a 1-TB-file database can considerably reduce the hazardous management of conventional printed data boxes. The database can be further converted into meaningful and ready-to-use technical information. Upon the closure of megaprojects, storage of files and data boxes remains troublesome; typically, these data, which are worth millions of rupees, are destroyed owing to the inability to physically manage them. Without the ability to manage data electronically, the quality of works suffers, and hundreds of millions of rupees worth of data is lost forever. Millions of rupees can be saved if the geotechnical data were properly managed and represented. This study is an effort to create an electronic database and generate ready-to-use maps in three spheres of geotechnical engineering.
After extensive field exploration, a regional geotechnical map was developed using the kriging analysis technique, which is available under spatial analyst tools of the ArcGIS software. The distribution of field survey sites in a grid pattern is also an innovative approach, which provides uniformly spaced samples for subsequent evaluations.
4. Conclusions
The geotechnical maps developed in this study demonstrate various geotechnical properties in the region. They represent the spatial distribution of soil in the region as per the engineering classification ofsoils, AASHTO subgrade rating, and allowable bearing capacity for 1.5-, 3.0-, and 4.5-m depths.
The developed electronic database can be extended to evaluate correlations between the geotechnical properties of soil. For example, the relationship between gradation and bearing capacity
Figure 10. (a) Validation of AASHTO Map Using Unseen Data; (b) Validation of Allowable BearingCapacity Map Using Unseen Data; (c) Validation of Engineering Classification of Soil Map UsingUnseen Data.
After extensive field exploration, a regional geotechnical map was developed using thekriging analysis technique, which is available under spatial analyst tools of the ArcGIS software.The distribution of field survey sites in a grid pattern is also an innovative approach, which providesuniformly spaced samples for subsequent evaluations.
4. Conclusions
The geotechnical maps developed in this study demonstrate various geotechnical properties in theregion. They represent the spatial distribution of soil in the region as per the engineering classificationofsoils, AASHTO subgrade rating, and allowable bearing capacity for 1.5-, 3.0-, and 4.5-m depths.
The developed electronic database can be extended to evaluate correlations between thegeotechnical properties of soil. For example, the relationship between gradation and bearing capacityof soil, the correlation between soil types and bearing capacity, and the correlation between physicalproperties and engineering properties of soil can be developed. The developed database may alsofacilitate the training and testing of machine learning algorithms for prediction purposes. A-4 is the
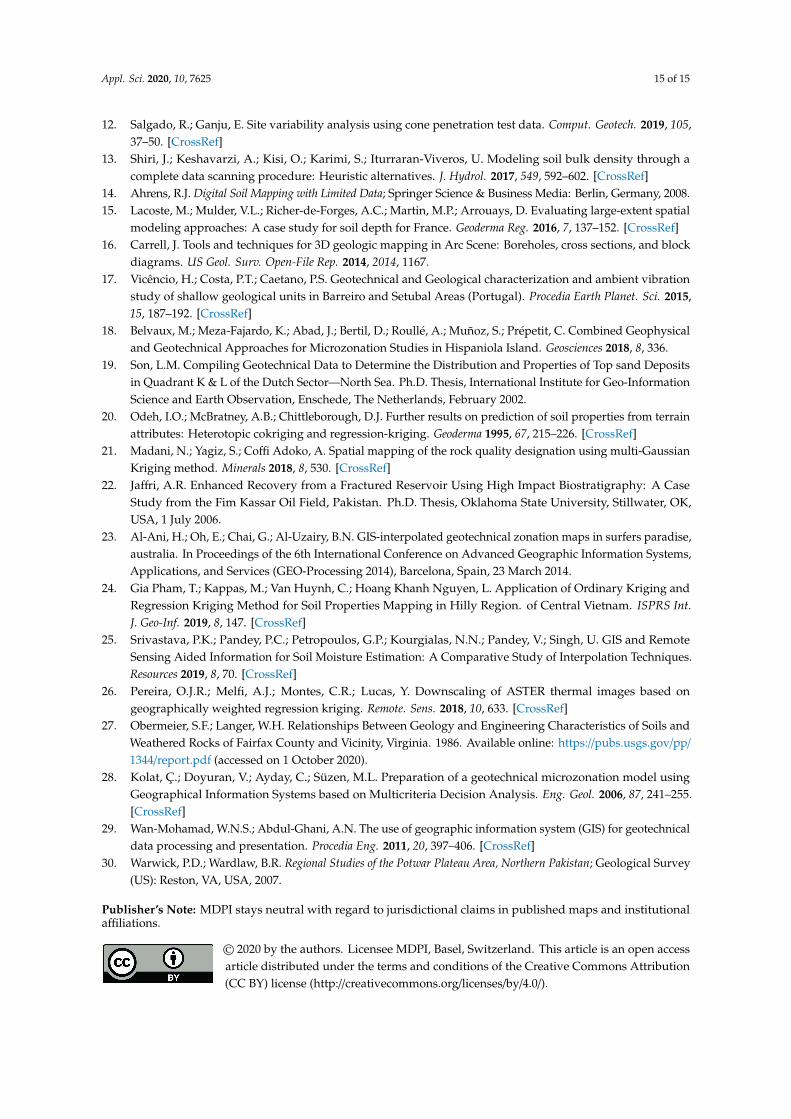
Appl. Sci. 2020, 10, 7625 14 of 15
most prevalent subgrade rating at the depths of 1.5 and 3.0 m, while A-2-4 is dominating at 4.5-mdepth. These maps allow identifying potential merits or demerits of a route because the patches ofproblematic soils (i.e., A-6 and A-7) are visible in these maps; these soils are unsuitable as supporting orconstruction materials, and these types of soil have to be removed from the site, owing to their swellingpotential and collapsible behavior. Allowable bearing capacity in comparatively plain areas rangesfrom 1 to 3 tsf, while, in hilly terrain, it ranges from 3 to 9 tsf. Although kriging is now a commonlyemployed technique in environmental and social sciences, its suitability for geotechnical interpolations(especially for this region) was evaluated in this study. It is concluded that kriging statistical analysis isa reliable technique for the generation of geotechnical properties using available data points.
The absence of GIS-based geotechnical mapping is a particular issue for this study site, andgeotechnical data are managed primarily in printed form in this region. The developed geotechnicalmaps will decrease the time and cost required for the preliminary investigation of large-scale projectsand serve as a ready-to-use database for low rise residential units because preliminary foundationdesign recommendations (e.g., type of foundation, tentative allowable bearing capacity, and probabledepth of foundations) may be determined using these maps. The selection of suitable routes forhighways by avoiding patches of poor subgrade ratings can also be performed. These maps can serveas a tool for the selection of suitable borrow areas (by showing excellent to good subgrade rating) forhighway embankments. The outcome of this study simplifies the screening process of available sitesfor a particular project without requiring considerable financial implications.
Author Contributions: Conceptualization, M.U.A. and M.A.K.; methodology, M.U.A.; software, M.U.A.;validation, M.A.K., formal analysis, M.U.A.; investigation M U Arshid resources, M.A.K.; data curation,M.U.A.; writing—original draft preparation, M.U.A.; writing—review and editing, M.A.K.; visualization, M.U.A.;supervision, M.A.K.; project administration, M.A.K.; and funding acquisition, M.A.K. All authors have read andagreed to the published version of the manuscript.
Funding: This research was funded by The University of Engineering and Technology Taxila, Pakistan.
Conflicts of Interest: The authors declare no conflict of interest.
References
1. Burrough, P. Soil information systems. In Geographical Information Systems: Principles and Applications;Longman and Wiley: New York, NY, USA, 1991.
2. Chan, C.L.; Low, B.K. Reliability analysis of laterally loaded piles involving nonlinear soil and pile behavior.J. Geotech. Geoenviron. Eng. 2009, 135, 431–443. [CrossRef]
3. Orton, T.G.; Pringle, M.J.; Bishop, T.F.A. A one-step approach for modelling and mapping soil propertiesbased on profile data sampled over varying depth intervals. Geoderma 2016, 262, 174–186. [CrossRef]
4. Chung, S.G.; Ryu, C.K.; Jo, K.Y.; Huh, D.Y. Geological and geotechnical characteristics of marine clays at theBusan new port. Mar. Georesources Geotechnol. 2005, 23, 235–251. [CrossRef]
5. Sotiropoulos, N.; Benardos, A.; Mavrikos, A. Spatial modelling for the assessment of geotechnical parameters.Procedia Eng. 2016, 165, 334–342. [CrossRef]
6. Ganju, E.; Prezzi, M.; Salgado, R. Algorithm for generation of stratigraphic profiles using cone penetrationtest data. Comput. Geotech. 2017, 90, 73–84. [CrossRef]
7. Wu, J.L.; Hung, M.H. Fast MAP-based super-resolution algorithm using multilevel interpolation andreconstruction. J. Chin. Inst. Eng. 2012, 35, 711–722. [CrossRef]
8. Dangal, S.R.; Sanderman, J.; Wills, S.; Ramirez-Lopez, L. Accurate and Precise Prediction of Soil Propertiesfrom a Large Mid-Infrared Spectral Library. Soil Syst. 2019, 3, 11. [CrossRef]
9. Army, U.S. Introduction to probability and reliability methods for use in geotechnical engineering. Eng. Tech.Lett. 1955, 1110-2, 547.
10. Zhao, T.; Hu, Y.; Wang, Y. Statistical interpretation of spatially varying 2D geo-data from sparse measurementsusing Bayesian compressive sampling. Eng. Geol. 2018, 246, 162–175. [CrossRef]
11. Wang, D.; Fang, S.; Yang, Z.; Wang, L.; Tang, W.; Li, Y.; Tong, C. A regional mapping method for oilseed rapebased on HSV transformation and spectral features. ISPRS Int. J. Geo-Inf. 2018, 7, 224. [CrossRef]
Appl. Sci. 2020, 10, 7625 15 of 15
12. Salgado, R.; Ganju, E. Site variability analysis using cone penetration test data. Comput. Geotech. 2019, 105,37–50. [CrossRef]
13. Shiri, J.; Keshavarzi, A.; Kisi, O.; Karimi, S.; Iturraran-Viveros, U. Modeling soil bulk density through acomplete data scanning procedure: Heuristic alternatives. J. Hydrol. 2017, 549, 592–602. [CrossRef]
14. Ahrens, R.J. Digital Soil Mapping with Limited Data; Springer Science & Business Media: Berlin, Germany, 2008.15. Lacoste, M.; Mulder, V.L.; Richer-de-Forges, A.C.; Martin, M.P.; Arrouays, D. Evaluating large-extent spatial
modeling approaches: A case study for soil depth for France. Geoderma Reg. 2016, 7, 137–152. [CrossRef]16. Carrell, J. Tools and techniques for 3D geologic mapping in Arc Scene: Boreholes, cross sections, and block
diagrams. US Geol. Surv. Open-File Rep. 2014, 2014, 1167.17. Vicêncio, H.; Costa, P.T.; Caetano, P.S. Geotechnical and Geological characterization and ambient vibration
study of shallow geological units in Barreiro and Setubal Areas (Portugal). Procedia Earth Planet. Sci. 2015,15, 187–192. [CrossRef]
18. Belvaux, M.; Meza-Fajardo, K.; Abad, J.; Bertil, D.; Roullé, A.; Muñoz, S.; Prépetit, C. Combined Geophysicaland Geotechnical Approaches for Microzonation Studies in Hispaniola Island. Geosciences 2018, 8, 336.
19. Son, L.M. Compiling Geotechnical Data to Determine the Distribution and Properties of Top sand Depositsin Quadrant K & L of the Dutch Sector—North Sea. Ph.D. Thesis, International Institute for Geo-InformationScience and Earth Observation, Enschede, The Netherlands, February 2002.
20. Odeh, I.O.; McBratney, A.B.; Chittleborough, D.J. Further results on prediction of soil properties from terrainattributes: Heterotopic cokriging and regression-kriging. Geoderma 1995, 67, 215–226. [CrossRef]
21. Madani, N.; Yagiz, S.; Coffi Adoko, A. Spatial mapping of the rock quality designation using multi-GaussianKriging method. Minerals 2018, 8, 530. [CrossRef]
22. Jaffri, A.R. Enhanced Recovery from a Fractured Reservoir Using High Impact Biostratigraphy: A CaseStudy from the Fim Kassar Oil Field, Pakistan. Ph.D. Thesis, Oklahoma State University, Stillwater, OK,USA, 1 July 2006.
23. Al-Ani, H.; Oh, E.; Chai, G.; Al-Uzairy, B.N. GIS-interpolated geotechnical zonation maps in surfers paradise,australia. In Proceedings of the 6th International Conference on Advanced Geographic Information Systems,Applications, and Services (GEO-Processing 2014), Barcelona, Spain, 23 March 2014.
24. Gia Pham, T.; Kappas, M.; Van Huynh, C.; Hoang Khanh Nguyen, L. Application of Ordinary Kriging andRegression Kriging Method for Soil Properties Mapping in Hilly Region. of Central Vietnam. ISPRS Int.J. Geo-Inf. 2019, 8, 147. [CrossRef]
25. Srivastava, P.K.; Pandey, P.C.; Petropoulos, G.P.; Kourgialas, N.N.; Pandey, V.; Singh, U. GIS and RemoteSensing Aided Information for Soil Moisture Estimation: A Comparative Study of Interpolation Techniques.Resources 2019, 8, 70. [CrossRef]
26. Pereira, O.J.R.; Melfi, A.J.; Montes, C.R.; Lucas, Y. Downscaling of ASTER thermal images based ongeographically weighted regression kriging. Remote. Sens. 2018, 10, 633. [CrossRef]
27. Obermeier, S.F.; Langer, W.H. Relationships Between Geology and Engineering Characteristics of Soils andWeathered Rocks of Fairfax County and Vicinity, Virginia. 1986. Available online: https://pubs.usgs.gov/pp/
1344/report.pdf (accessed on 1 October 2020).28. Kolat, Ç.; Doyuran, V.; Ayday, C.; Süzen, M.L. Preparation of a geotechnical microzonation model using
Geographical Information Systems based on Multicriteria Decision Analysis. Eng. Geol. 2006, 87, 241–255.[CrossRef]
29. Wan-Mohamad, W.N.S.; Abdul-Ghani, A.N. The use of geographic information system (GIS) for geotechnicaldata processing and presentation. Procedia Eng. 2011, 20, 397–406. [CrossRef]
30. Warwick, P.D.; Wardlaw, B.R. Regional Studies of the Potwar Plateau Area, Northern Pakistan; Geological Survey(US): Reston, VA, USA, 2007.
Publisher’s Note: MDPI stays neutral with regard to jurisdictional claims in published maps and institutionalaffiliations.
© 2020 by the authors. Licensee MDPI, Basel, Switzerland. This article is an open accessarticle distributed under the terms and conditions of the Creative Commons Attribution(CC BY) license (http://creativecommons.org/licenses/by/4.0/).