CHAPTER 4—GEOTECHNICAL - USDA Forest Service
30
GEO-HAZ Consulting Geology and Slope Stability of Crestone, CO Snodgrass Mountain Ski Area March 2008 Crested Butte, CO CHAPTER 4—GEOTECHNICAL 1 CHAPTER 4—GEOTECHNICAL This chapter describes geotechnical topics such as the installation and monitoring of landslide monitor stakes (rebars), inclinometers, and testing of earth materials. Drilling methods for piezometers are described in Chapter 6 (Groundwater Hydrology). 4.1 Methods 4.1.1 Landslide Monitoring Pins In 1995, the RCE (1995) geologic hazards report identified the East Slide as the most potentially hazardous area on Snodgrass. Immediately thereafter, Schmusser Gordon Meyer (SGM) placed 9 rebar stakes on this area of the mountain in order to monitor future surface movement (Test 1 through Test 9 on Fig. 4-1). The stakes were 18” lengths of ½” diameter rebar, pounded vertically into the ground until their stickup was only 2-3”. The location of the rebar top was then measured via a survey-grade GPS. Stake locations were first surveyed on 17-NOV-1995, and then at roughly 1-year intervals through August 2007, except for 1998 and 1999, when no measurements were made. A map showing these initial 9 rebar stakes (labeled Test 1 through Test 9) along with later ones is shown in Appendix 4-1, along with all the measurements from Nov. 1995 through August 2007. Test 1 was located on a stable ridge of Mancos Shale to the east of the Snodgrass landslide area, and was presumably sited there to serve as a stable reference unaffected by landslide movement. During the early stages of this geologic study in late 2006, it became apparent that we needed additional landslide monitor stakes on the southeast slope of Snodgrass, away from the 9 stakes placed near the East Slide in 1995. Therefore, from 6 to 8-NOV-2006, SGM placed an additional 10 stakes (Test 10 through Test 19) to the west and north of the East Slide. These stakes have only been remeasured once, on 6-AUG-2007. In late Fall 2007 SGM placed an additional two pins (Tests 20, 21) on the East Slide flanking Test 4. 4.1.2 Inclinometers All of the inclinometer holes were drilled using a Dietrich D-50 track- mounted auger drill rig with a 6-inch diameter solid stem auger system. The boreholes were not logged because (except for I-SG5) they were all adjacent to piezometer holes that were logged and sampled (see details in Chapter 6). In compliance with the Decision Memo (USFS, 2007), the cuttings from the drilling activities were placed back in the borehole and/or contoured around the vicinity of the borehole. Boreholes were completed through the landslide deposits to the top of the Mancos Shale at a minimum, and if possible, as far into the shale as the rig could penetrate before refusal. This is because we anticipated that the basal landslide failure plane lay at or near the basal contact of landslide deposits lying atop Mancos Shale bedrock. After hole completion, we installed snap-lock, 85 mm- diameter inclinometer casing from Slope Indicator Company. The “A” set of
-
Upload
khangminh22 -
Category
Documents
-
view
1 -
download
0
Transcript of CHAPTER 4—GEOTECHNICAL - USDA Forest Service

GEO-HAZ Consulting Geology and Slope Stability ofCrestone, CO Snodgrass Mountain Ski Area
March 2008 Crested Butte, CO
CHAPTER 4—GEOTECHNICAL 1
CHAPTER 4—GEOTECHNICAL
This chapter describes geotechnical topics such as the installation and monitoring of landslide monitor stakes (rebars), inclinometers, and testing of earth materials. Drilling methods for piezometers are described in Chapter 6 (Groundwater Hydrology).
4.1 Methods4.1.1 Landslide Monitoring PinsIn 1995, the RCE (1995) geologic hazards report identified the East Slide
as the most potentially hazardous area on Snodgrass. Immediately thereafter,Schmusser Gordon Meyer (SGM) placed 9 rebar stakes on this area of themountain in order to monitor future surface movement (Test 1 through Test 9 on Fig. 4-1). The stakes were 18” lengths of ½” diameter rebar, pounded vertically into the ground until their stickup was only 2-3”. The location of the rebar top was then measured via a survey-grade GPS.
Stake locations were first surveyed on 17-NOV-1995, and then at roughly 1-year intervals through August 2007, except for 1998 and 1999, when no measurements were made. A map showing these initial 9 rebar stakes (labeled Test 1 through Test 9) along with later ones is shown in Appendix 4-1, along with all the measurements from Nov. 1995 through August 2007.
Test 1 was located on a stable ridge of Mancos Shale to the east of the Snodgrass landslide area, and was presumably sited there to serve as a stable reference unaffected by landslide movement.
During the early stages of this geologic study in late 2006, it became apparent that we needed additional landslide monitor stakes on the southeastslope of Snodgrass, away from the 9 stakes placed near the East Slide in 1995.Therefore, from 6 to 8-NOV-2006, SGM placed an additional 10 stakes (Test 10 through Test 19) to the west and north of the East Slide. These stakes have only been remeasured once, on 6-AUG-2007. In late Fall 2007 SGM placed an additional two pins (Tests 20, 21) on the East Slide flanking Test 4.
4.1.2 InclinometersAll of the inclinometer holes were drilled using a Dietrich D-50 track-
mounted auger drill rig with a 6-inch diameter solid stem auger system. The boreholes were not logged because (except for I-SG5) they were all adjacent to piezometer holes that were logged and sampled (see details in Chapter 6). In compliance with the Decision Memo (USFS, 2007), the cuttings from the drilling activities were placed back in the borehole and/or contoured around the vicinity of the borehole.
Boreholes were completed through the landslide deposits to the top of the Mancos Shale at a minimum, and if possible, as far into the shale as the rig could penetrate before refusal. This is because we anticipated that the basal landslide failure plane lay at or near the basal contact of landslide deposits lying atop Mancos Shale bedrock. After hole completion, we installed snap-lock, 85 mm-diameter inclinometer casing from Slope Indicator Company. The “A” set of

GEO-HAZ Consulting Geology and Slope Stability ofCrestone, CO Snodgrass Mountain Ski Area
March 2008 Crested Butte, CO
CHAPTER 4—GEOTECHNICAL 2
grooves was oriented in the upslope-downslope direction. Due to the presence of the end cap on the bottom of the casing, the casing would tend to “float” when it penetrated the water table. To get the casing to settle to the bottom of the drilled hole, we filled the casing with water to give it negative buoyancy. After the casing was set to the hole bottom, it was then cemented with grout from bottom to ground surface, following the grout mixture recommendations of Slope Indicator Company.
Inclinometer surveys were performed using a Slope Indicator Company vertical inclinometer system owned by GEO-HAZ, and operated by Ms. Deborah Green, principal of Tilford & Green consultants (Placitas, New Mexico). The inclinometer probe was 2.0 ft long and a 100 ft-long cable was used. The probe was lowered to the bottom of the water-filled casing and allowed to calibrate to temperature for 10 minutes. The probe was then slowly raised to the ground surface, with successive tilt readings made on 2 ft centers. We performed 2 initial surveys of each inclinometer and checked their respective CHECKSUMS. If these were consistent and within factory-prescribed error limits, we did not perform a 3rd initial survey. All initial surveys were performed between 24-JUL-2007 and 20-SEP-2007. Resurveys were made on inclinometers I-2, I-4, and I-8in late September 2007.
Table 4-1. Dates and numbers of initial and repeat inclinometer surveys on Snodgrass.
Inclinometer Initial Survey Repeat Surveys
I-2 24-25 JUL 2007 (n=3) 20 SEP 2007 (n=1)
I-4 24-25 JUL 2007 (n=3) 20 SEP 2007 (n=1)
I-8 25 JUL 2007 (n=3) 20 SEP 2007 (n=1)
I-11 19 SEP 2007 (n=2)
I-13 19 SEP 2007 (n=2)
I-16 19 SEP 2007 (n=2)
I-SG5 20 SEP 2007 (n=2)
4.1.3 Material TestingMaterial testing was performed on split-spoon samples from boreholes, and on grab samples from test trenches. All testing was performed by Professional Services Industries (PSI) in Thornton, CO. Split-spoon samples were collected in a standard 1.25-inch diameter drive tube and were about 12 inches long, but in some cases where rocks were sparse or absent, we used the larger California sampler tube.
Hand-carved grab samples were collected from the two 10 ft-deepbackhoe trenches on the lower East Slide, and included shear zones and landslide deposits.
Bulk Density: PSI used the xxx method to measure bulk density.Cohesion and friction angle: for most split-spoon samples, PSI used the direct shear method on remolded samples. For the hand-carved samples, PSI tested

GEO-HAZ Consulting Geology and Slope Stability ofCrestone, CO Snodgrass Mountain Ski Area
March 2008 Crested Butte, CO
CHAPTER 4—GEOTECHNICAL 3
Fig. 4-1. Location map of the 19 landslide survey pins (labeled Test x in blue) and inclinometers (labeled I-x in black) on the SE slope of Snodgrass Mountain. Contour interval is 5 ft. Large black lines and numbers show GHUs.

GEO-HAZ Consulting Geology and Slope Stability ofCrestone, CO Snodgrass Mountain Ski Area
March 2008 Crested Butte, CO
CHAPTER 4—GEOTECHNICAL 4
undisturbed samples in direct shear, oriented to shear along the preexisting shear fabric.
4.2 Landslide Monitoring Pins Results
4.2.1 Pins Installed in 1994 (Test 1 through Test 9)In 1995 Schmuser-Gordon-Meyer (SGM) placed 9 rebar survey stakes on
lower Snodgrass to monitor any surface slope movement. Of these 9 stakes, 2 were on stable bedrock and 7 were on landslide deposits. Of the 7 stakes on landslide deposits, 5 were located on the East Slide, which in 1995 was thought to be the only young slide on the mountain (Fig. 2-12). The stakes have been remeasured nearly every year in the Fall, from 1996 to 2007. In this section we discuss only the stake movement up to the Fall 2006 resurvey.
The Fall 2007 resurvey, which occurred on 6-AUG-2007, displays a very weird result, in that all 9 original pins (and additionally, all 10 new pins) are shifted northward about 0.06 ft, and a lesser amount to either E or W. This shift results in most of the survey stakes moving uphill between 2006 and 2007,although the pattern is not consistent with the local slopes to the SE. In other words, some pins apparently moved NW (upslope) and gained elevation, whereas others moved in a similar direction and lost elevation. The apparenthorizontal movement thus contradicts most of the elevation change data. Thisshift is very different from the pattern of the preceding 10 years, and is always northward whether the pins are on landslide or bedrock, steep or gentle slopes, etc. We surmise that this consistent shift results from some type of calibration error by the surveyors, but GEO-HAZ has no method of correcting it. Therefore, the discussion below omits the Fall 2007 resurvey data.
Fig. 4-3 and Table 4-2 show that 7 of the 9 stakes have moved in the SEdirection, 1 stake moved SW, and 1 moved E, in an amount that is larger than the expected measurement error (ca. 0.1 ft). The largest displacement is that of stake 4, located in the center of GHU 5B, which moved 0.82 ft between 1995 and 2006, in the direction S30E (parallel to the fall line). Other stakes moved 0.59 ft (stake 2), 0.34 ft (stake 3), and 0.3 ft (stake 1), all in the direction of the local fall line. All of these movements exceed the measurement error, estimated by SGM as approximately 0.1 ft.Table 4-2. Net movement of landslide monitoring stakes, 1995-2006, listed by stake number.
Stake no. GHU/ polygon Age Movement (ft) Direction
1 Km bedrock N/A1
0.30 S20E
2 5B/ 34 Qlsiy 0.59 S26E
3 2/ 12 Qls 0.34 S20W
4 5B/ 36 Qlsy 0.82 S30E
0.232
S70E5 1B/ 1 Qefy
0.143
S20E
6 5A/ 30 Qlsi 0.50 S40E
7 5A/ e Scarp of 30 (Qlsi) 0.27 S50E
8 1B/ 6 Qlsio 0.06 S45 E
9 Tp bedrock N/A 0.043
E1 not applicable, because substrate is not a landslide. Stake movement in bedrock must be due to shallow soil creep;
2
from 1995 to 2000;3 from 2004 to 2006

GEO-HAZ Consulting Geology and Slope Stability ofCrestone, CO Snodgrass Mountain Ski Area
March 2008 Crested Butte, CO
CHAPTER 4—GEOTECHNICAL 5
Fig. 4-2. Landslide and GHU map of lower Snodgrass, showing the locations of survey stakes 2-9 (large blue numbers) installed by SGM in Nov. 1995, and stakes 10-19 (orange squares and large numbers), installed bySGM in Oct. 2006. For the newer stakes, a decimal number of x.2 means that the stake was relocated to avoid tree canopy cover.

GEO-HAZ Consulting Geology and Slope Stability ofCrestone, CO Snodgrass Mountain Ski Area
March 2008 Crested Butte, CO
CHAPTER 4—GEOTECHNICAL 6
Fig. 4-3. Position data for landslide monitoring stakes 1-5, from 1995 to 2006. Year of measurement is in red. Circles denote approximate measurement uncertainty (0.1 ft). Yellow arrow shows length and bearing of net movement vector.

GEO-HAZ Consulting Geology and Slope Stability ofCrestone, CO Snodgrass Mountain Ski Area
March 2008 Crested Butte, CO
CHAPTER 4—GEOTECHNICAL 7
Of the 9 stakes, 7 (stakes 1-7) have a net movement between 1995 and 2006 of roughly 0.3-0.8 ft, with an average of 0.46 ft. This equates to an average movement rate of 0.042 ft/yr, or 0.5 inch/yr.
This movement could have two possible explanations. The first explanation is that movement is due to surface creep caused by freezing and thawing of the surface soil. If this is the case, then the stakes that moved the farthest should be the ones where the local ground surface slope is steepest. Based on a preliminary examination of the data, there is not a strong correlation movement and slope angle (Table 4-3),although we only measured the slope angle at 4 of the 9 stakes.
Table 4-4. Net movement of landslide monitoring stakes, 1995-2006, listed in order of increasing age of underlying landslides.
Stakeno.
GHU/ polygon Age Movement (ft) Direction surface slope & direction(degrees)
4 5B/ 36 Qlsy 0.82 S30E 8°, S70E5 1B/ 1 Qefy 0.23
2S70E 20°
2 5B/ 34 Qlsiy 0.59 S26E
6 5A/ 30 Qlsi 0.50 S40E7 5A/ e Scarp of 30
(Qlsi)0.27 S50E 23°, S60E
3 2/ 12 Qls 0.34 S20W8 1B/ 6 Qlsio 0.06 S45 E 9°
1 Km bedrock N/A1
0.30 S20E
9 Tp bedrock N/A 0.043
E1 not applicable, because substrate is not a landslide. Stake movement in bedrock must be due to shallow
soil creep; 2 from 1995 to 2000;
3 from 2004 to 2006
The second explanation is that movement reflects deep-seated creep on the entire 30-50 ft-thick landslide deposit underlying the stake. If this is the case, then we would expect the most movement on the youngest landslides, and the least on the oldest landslides. So far, that correlation seems weakly supported by the data in Table 2-4, which shows that: (1) the largest movements tend to have occurred on the younger landslides, but (2) there are numerous exceptions to the trend, including stakes on Mancos Shale bedrock that have moved up to 0.3 ft over 11 years. That amount of movement either reflects shallow creep of regolith over bedrock on a slope, or a systematic drift in the GPS calibration over 11 years. Nevertheless, it cannot represent landslide movement.
4.2.2 Pins Installed in 2006 (Test 10 through Test 19)On 6-NOV-2006 we installed an additional 10 rebar stakes in areas to the west
and north of the 1995 stakes (Figs. 4-1, 4-2). These new stakes expand the coverage of the monitoring network to cover all GHUs 1-5. These stakes have only been resurveyed once, on 6-AUG-2007, so we only have 9 months of movement data.
Unfortunately, all of these stakes show an identical apparent movement of ca. 0.06 ft to the N, resulting in an apparent increase in elevation for nearly every stake. As previously discussed, this pattern likely results from a systematic surveying error. The

GEO-HAZ Consulting Geology and Slope Stability ofCrestone, CO Snodgrass Mountain Ski Area
March 2008 Crested Butte, CO
CHAPTER 4—GEOTECHNICAL 8
fact that the movement is so consistent among the 10 pins, suggests that there has no downslope movement of any pin greater than the measurement error (0.1 ft).
4.2.3 Pins Installed in 2007 (Test 20-21)During a field review of the East Slide in Fall 2007, we noticed that in the vicinity
of Test 4 (which displays the largest movement of any stake), the USFS boundary fence had been bowed out in the downslope direction. In this area, the surface of the East Slide (polygon 36, Qlsu) is composed of two bouldery ridges trending downslope (SE), and an intervening sediment-filled swale. Test 4 is located in the swale. We further noticed that the fenceline was considerably more bowed where it crossed the swale, than where it crossed the two bouldery ridges. Thus, the possibility arose that some part of the 0.82 ft of cumulative downslope movement of Test 4 might be due to surficial soil creep in the swale, rather than movement of the entire landslide.
To test this hypothesis, we added one additional monitor stake on the crest of each ridge flanking Test 4. If these new stakes show identical movement with Test 4, then movement of the entire slide is indicated. Conversely, if the two new stakes show significantly less movement than test 4, it is likely their movement reflects landslide movement, and Test 4 reflects landslide movement plus additional surficial soil creep.
Because the two new pins (Test 20, 21) were installed late in 2007, and have not yet been resurveyed, so we will not know the results of this test until summer of 2008.
4.2.4 Fence posts surveyed in 2007As described above, a N-S fence crosses the approximate center of the NW-SE-
trending East Slide, crossing the entire width of the East Slide at about a 45-degreeangle (black line on Figs. 4-1, 4-2). This fence parallels the USFS boundary but lies about 50 ft from it. The fence presented an opportunity to detect movement of the East Slide since the fence was constructed (roughly 70-80 yrs ago; J. Norton, pers. commun., 2007).
The fence is composed of 2 types of posts, treated wooden 8x8s (railroad ties), and steel T-posts. Along much of the fence, the wooden 8x8s are tilted significantly downslope, whereas the T-posts between them are either untilted, or tilted to a lesser angle. This pattern suggests that the wooden posts are significantly older than the T-posts.
In October 2007 SGM surveyed the position of the bases of the 101 fenceposts that comprise this N-S fenceline. Of this number, 43 posts are on the East Slide.Approximate GPS point accuracy is 0.1 ft, per personnel communication with Schmuser Gordon Meyer. Deviation of the surveyed bottom of each fencepost was measured in MapInfo GIS perpendicular to the (inferred) original straight fence line.
As can be seen on a close-up map (Fig. 4-4), the fenceline is not a straight linetoday, either off the Slide or on it. Compared to a straight line drawn across the Slide, there are 4 zones of differing deviation from a straight line, described below from S to N (Fig. 4-5).

GEO-HAZ Consulting Geology and Slope Stability ofCrestone, CO Snodgrass Mountain Ski Area
March 2008 Crested Butte, CO
CHAPTER 4—GEOTECHNICAL 9
Zone of Small or Upslope Deviations: The southernmost 140 ft of the fence displays either no deviation from a straight line, or small deviations to the upslope side of the straight line. Because we do not believe that the fence has actually moved uphill, we interpret the deviations in this zone as indicative of either as-built inaccuracies in post placement, survey error, or both.
Southern Bulge: Over the next 200 ft the fence describes a broad bulge in the downslope direction. In the center of the bulge posts have a maximum deviation from the straight line of nearly 4 ft (Fig. 4-5). The southern bulge is approximately coincident with the sediment-filled swale (Fig. 4-4) which contains monitor stake Test 4.
Central Zone of Small Deviations: In the next 120 ft of fence, post deviations slowly decrease to a low point of zero in the center of the zone. Unlike the other zones, in this zone the fence descends nearly straight down the local fall line, rather than across the slope.
Northern Bulge: The final 220 ft of the fence describes another downward bulge-deviation from a straight line, which reaches a maximum deviation of 6 ft. This bulge decreases to zero (by definition) at the NE margin of the East Slide.
In addition to these short-wavelength deviations, there is an overall long-wavelengthdeviation that increases from SW to NE, and 5-ft misalignment of the fence across the NE margin of the East Slide. Both the long-wavelength deviation and the misalignment could be the result of a non-straight original fence configuration. Alternatively, they could be explained by deep-seated deformation of an originally straight fence, as discussed below.

GEO-HAZ Consulting Geology and Slope Stability ofCrestone, CO Snodgrass Mountain Ski Area
March 2008 Crested Butte, CO
CHAPTER 4—GEOTECHNICAL 10
Fig. 4-4. Map of surveyed fenceposts (crosses) along the fenceline crossing the East Slide. Straight line is added to show amount and sense of deviations of fenceposts from a straight line. The central sediment-filled swale is outlined by blue dotted lines, and contains monitor stake Test 4, which has moved 0.82 ft SE between 1995 and 2006. Survey point numbers in red bold indicate the 4 largest deviations in each bulge area; posts in the zone of central small deviations are also bolded.

GEO-HAZ Consulting Geology and Slope Stability ofCrestone, CO Snodgrass Mountain Ski Area
March 2008 Crested Butte, CO
CHAPTER 4—GEOTECHNICAL 11
Fig. 4-5. Deviation of fence post locations from a straight line, as a function of distance of the post from the SW edge of the East Slide. Deviations were measured perpendicular to the straight line. Deformation zones correspond with those shown in Fig. 4-4 and described in the text.
4.2.4.1 Interpretation of the fence post deviation patternBecause we do not know the original, as-built shape of the fenceline, there are at
least 5 hypotheses to explain its present shape. Below we describe each hypothesis, how we tested it, and the results of the test. Several of these hypotheses are related, and thus not totally independent.
Hypothesis 1: the fenceline was originally straight between the surveyed endpoints
(3091 at South, 3145 at North).Test 1: fenceposts can only move downhill by soil creep or slide movement. If any posts
are uphill of the straight line between the endpoints, then either they have moved uphill (unlikely), OR, the line was not originally straight, OR there is surveying error.Result of Test 1: compared to a straight line between the endpoints, 32 of the 101 fenceposts on the East Slide (and south of it) lie uphill of that line. It is physically unlikely that 1/3 of the fenceposts could have moved uphill from their original positions.Conclusion: Hypothesis is FALSE; the original fence was not a straight line between
the surveyed endpoints. [Note: Unfortunately, because this hypothesis is false, and the

GEO-HAZ Consulting Geology and Slope Stability ofCrestone, CO Snodgrass Mountain Ski Area
March 2008 Crested Butte, CO
CHAPTER 4—GEOTECHNICAL 12
fenceline is now deformed in a complex manner, it is impossible to know precisely the original configuration of the fenceline].
Hypothesis 2: the fenceline was NOT originally straight between the surveyed
endpoints (3091 at South, 3145 at North). The northernmost 2 points (3146, 3147) are clearly discordant with all of those to the south. The southernmost 12 points (3080-3091) define a line with a different bearing than the remainder of the line. The remaining 87 points on the fenceline are assumed to have originally defined a straight line. In addition, the first post south of the East Slide (3079) is assumed to be stationary; if this assumption is not made, movement of fenceposts on the East Slide becomes unbounded. Finally, the first post north of the East Slide has moved, as have all points to the north (3106-3139), which form a bow-shaped pattern, due to shallow soil creep to the SW on the steep moraine slope (there is no landslide there). In order for this creep to decrease to zero at the crest of the lateral moraine (point 3139), post 3105 must have moved 4.1 ft perpendicular to the fenceline. This requires that the N-most post on the East Slide (3104) has moved 0.85 ft downhill.Test 2: this hypothesis cannot be rigorously tested, because the original fence configuration is unknown. However, these assumptions minimize the amount of downslope movement predicted for fenceposts on the East Slide.
Hypothesis 3: Assuming that Hypothesis 2 is true, all deviations of the central 87 fenceposts from a straight line result from deep-seated movement of the East Slide in the approximate direction S50E.Test 3: if deep-seated movement along a consistent vector were responsible for moving
the fenceposts, they would all be moved approximately the same amount, to the SE, away from the original straight line. For example, in rigid block movement, all the posts on the slide mass would have moved the same distance in the same SE direction, and there be would be a sudden, major misalignment of fenceposts across both margins of the East Slide.Result of Test 3: There is no sudden, major misalignment of posts across the southern
slide margin, but there is a ca. 4 ft misalignment across the northern margin. In addition,the posts on the East Slide have not been moved a consistent distance along the length of the fence, but display a complex deviation pattern from the (inferred) straight line. This deviation pattern can be subdivided into an 4 “short wavelength” anomalies: (1) an asymmetrical Northern Bulge in the downslope direction, (2) a central area of small deviations, (3) an asymmetrical Southern Bulge in the downslope direction, and (4) decreasing deviations to the south slide margin (Fig. 4-4). The Southern Bulge iscoincident with a slopewash-filled trough in the center of the slide mass.Conclusion: Hypothesis is MOSTLY FALSE; the observed deviations of the fenceposts from a straight line are too complex to result from rigid slab-type movement of the entire East Slide block. However, there may be some rigid shear across the northern margin. This margin is the wettest margin, since the stream drainage from most of the East Slide travels down this marginal gully.
Hypothesis 4: Assuming that Hypothesis 2 is true, all deviations of the central 87 fenceposts from a straight line result from shallow, surficial soil creep.

GEO-HAZ Consulting Geology and Slope Stability ofCrestone, CO Snodgrass Mountain Ski Area
March 2008 Crested Butte, CO
CHAPTER 4—GEOTECHNICAL 13
Test 4a: if shallow soil creep were responsible for moving the fenceposts, they would all be moved in the direction of the local slope, and possibly, in an amount proportional to the sine of the slope.Result of Test 4a: The central area of low deviations coincides with a part of the fence
that is going straight down the local fall line. In contrast, the two bulges coincide with parts of the fence that are perpendicular to the local fall line. This pattern suggests that the movement of fenceposts is strongly influenced by the local slope direction.
Test 4b: if shallow soil creep were responsible for moving the fenceposts, they should be tilted in the direction of the movement, and older (wooden) posts should be tilted more than younger (steel) posts.Result of Test 4b: In the two bulges, the larger the deviation of the posts from the
straight line, the more they are tilted downslope; wooden posts are tilted much more than the steel posts.Conclusion: Hypothesis is TRUE; the observed deviations of the fenceposts from a straight line coincide with changes in the relative orientation of the fenceline versus the local fall line, AND the observed tilt of the fenceposts coincides with the amount of deviation from a straight line.
Hypothesis 5: Assuming that Hypothesis 2 is true, deviations of the central 87 fenceposts from a straight line result from both block movement of the East Slide and
shallow, surficial soil creep.Test 4: unexplained residuals from Tests 3 and 4 suggest that locally, both styles of
deformation may be occurring. Result of Test 4: The pattern of fencepost deviations on the East Slide mainly
coincides with the local slope direction. However, regardless of where the original fence line is postulated to be, there is a 4 ft misalignment across the north boundary of the East Slide. If this is not an original feature of the fence, it implies block movement.Conclusion: Most of the short-wavelength deviations can be explained as the result of
shallow soil creep. However, there is also a long-wavelength trend where deviations increase from south to north. This pattern can be interpreted as the entire slide block moving SE, hinged at the south lateral margin, with increasing displacement (4 ft? since the fence was built; ca 70-80 yrs) toward the north lateral margin. Such differential movement might be explained by a higher water table beneath the north margin gully.
IN CONCLUSION: The deviations of the central 87 fenceposts from a straight line mayresult from both shallow, surficial soil creep, AND a hinge-type block movement of the East Slide. As shown by the results of hypothesis tests 2-4, the short-wavelengthdeviations of the fenceline are NOT likely original features or the result of deep-seatedmovement of the East Slide. In contrast, the long-wavelength deviation trend is not likely to reflect local soil creep, either; if it is not an original fence feature (?), it must representdeeper-seated block movement of the East Slide.
The magnitudes of these movements over the past 70-80 years yield long-termmaximum surface creep rates ranging from 6 ft/70-80yrs (0.075-0.086 ft/yr) given the maximum size of the Northern Bulge, to 10 ft/70-80 yrs (0.13-0.14 ft/yr) for the Northern
GEO-HAZ Consulting Geology and Slope Stability ofCrestone, CO Snodgrass Mountain Ski Area
March 2008 Crested Butte, CO
CHAPTER 4—GEOTECHNICAL 14
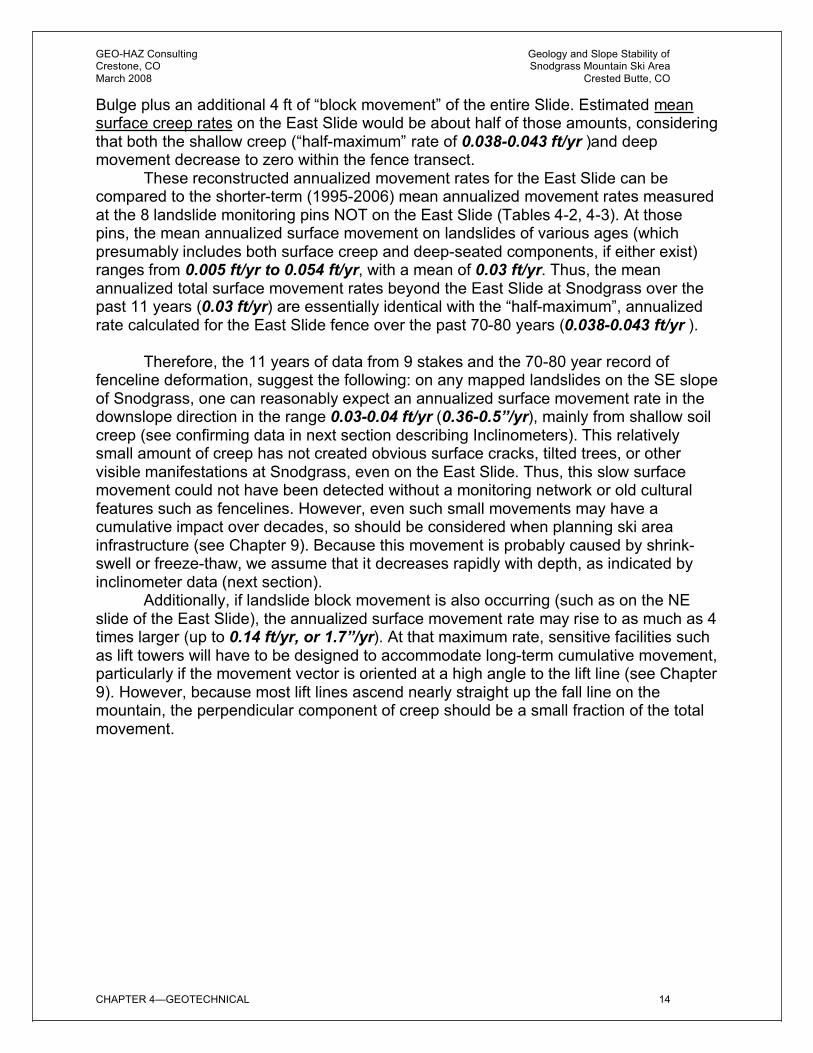
Bulge plus an additional 4 ft of “block movement” of the entire Slide. Estimated meansurface creep rates on the East Slide would be about half of those amounts, considering that both the shallow creep (“half-maximum” rate of 0.038-0.043 ft/yr )and deep movement decrease to zero within the fence transect.
These reconstructed annualized movement rates for the East Slide can be compared to the shorter-term (1995-2006) mean annualized movement rates measured at the 8 landslide monitoring pins NOT on the East Slide (Tables 4-2, 4-3). At those pins, the mean annualized surface movement on landslides of various ages (which presumably includes both surface creep and deep-seated components, if either exist) ranges from 0.005 ft/yr to 0.054 ft/yr, with a mean of 0.03 ft/yr. Thus, the meanannualized total surface movement rates beyond the East Slide at Snodgrass over the past 11 years (0.03 ft/yr) are essentially identical with the “half-maximum”, annualized rate calculated for the East Slide fence over the past 70-80 years (0.038-0.043 ft/yr ).
Therefore, the 11 years of data from 9 stakes and the 70-80 year record of fenceline deformation, suggest the following: on any mapped landslides on the SE slope of Snodgrass, one can reasonably expect an annualized surface movement rate in the downslope direction in the range 0.03-0.04 ft/yr (0.36-0.5”/yr), mainly from shallow soil creep (see confirming data in next section describing Inclinometers). This relatively small amount of creep has not created obvious surface cracks, tilted trees, or other visible manifestations at Snodgrass, even on the East Slide. Thus, this slow surface movement could not have been detected without a monitoring network or old cultural features such as fencelines. However, even such small movements may have a cumulative impact over decades, so should be considered when planning ski area infrastructure (see Chapter 9). Because this movement is probably caused by shrink-swell or freeze-thaw, we assume that it decreases rapidly with depth, as indicated byinclinometer data (next section).
Additionally, if landslide block movement is also occurring (such as on the NEslide of the East Slide), the annualized surface movement rate may rise to as much as 4times larger (up to 0.14 ft/yr, or 1.7”/yr). At that maximum rate, sensitive facilities such as lift towers will have to be designed to accommodate long-term cumulative movement,particularly if the movement vector is oriented at a high angle to the lift line (see Chapter9). However, because most lift lines ascend nearly straight up the fall line on the mountain, the perpendicular component of creep should be a small fraction of the total movement.

GEO-HAZ Consulting Geology and Slope Stability ofCrestone, CO Snodgrass Mountain Ski Area
March 2008 Crested Butte, CO
CHAPTER 4—GEOTECHNICAL 15
4.3 Inclinometer Results
Of the 8 inclinometers installed in late July 2007, only 3 received repeat surveys by before the snow fell in Fall, 2007. We did not expect that detectable motion would occur in the 2 dry months since installation, given the lack of surface evidence for ongoing movement, so these 3 resurveys (I-2, I-4, and I-8) were performed mainly as a training exercise. At all 3 inclinometers, the A0 direction points directly downslope, A180 points directly upslope, and B0 and B180 are perpendicular to the left and right of theA0 direction, respectively.
4.3.1 Inclinometer I-2Inclinometer I-2 is located next to piezometer PZ-2 in the lower part of the
Chicken Bone area, on a slide mapped as Qlsi. Inclinometer depth was limited to 21 ft BGS, due to drill rig refusal at that depth on Mancos Shale.
The 2-month repeat survey shows no deflections of the borehole, within the accuracy of the inclinometer (Fig. 4-6). This was the expected result, given the age of the landslide (Qlsi), the short time period covered, and fact that the probe CheckSums on the initial and repeat surveys were similar (Table 4-.
4.3.2 Inclinometer I-4
Inclinometer I-4 is located on the small Qlsy just east of Ken’s Crux (polygon 22), next to piezometer PZ-4. Inclinometer depth was limited to 42 ft BGS, due to drill rig refusal at that depth on Mancos Shale.
The SEP-2007 repeat survey shows 2 deflections have occurred since July. The first is a deflection of 0.05” in the downslope (A0) direction, which is limited to the upper 2 ft of the casing (Fig. 4-7). This deflection probably indicates surface soil creep. Anannualized rate of movement based on this 2-month value would be 0.3”/yr, or 0.025ft/yr. By comparison, this value is in the range of long-term observed surface creep rates from landslide monitor pins in the area.
The second deflection is a persistent tilt of the entire casing in the B180 direction,amounting to a cumulative 0.09”. At I-4, the B180 direction is perpendicular to the local fall line. This tilt is consistent throughout the 42 ft of the casing, and resembles the biasshift error of Cornforth (2006, p. 78-79; also called zero shift or offset error, or the “windshield wiper” effect). The most common cause of a bias shift error is widely different CheckSums between two consecutive surveys. Unlike I-2, where CheckSums were very similar between the initial and repeat surveys, on I-4 the B-axis checksum was quite large (-40.4) on the 1 initial survey, much larger than the B-axis checksum of the repeat survey (-11.3; Table 4-5). We suspect that this is the cause if the “windshieldwiper effect”.
We plan to resurvey all the inclinometers in May 2008 as soon as the snow melts, and at I-4 will ensure that checksums for the June-08 resurveys are compatible with those of the July-07 survey; this should eliminate bias shift error from subsequentsurvey comparisons.

GEO-HAZ Consulting Geology and Slope Stability ofCrestone, CO Snodgrass Mountain Ski Area
March 2008 Crested Butte, CO
CHAPTER 4—GEOTECHNICAL 16
Fig. 4-6. Repeat inclinometer surveys of I-2, between 25-JULY-2005 and 20-SEP-2007.Vertical line at center is the reference line from the base survey. Depths shown are below TOC; subtract 4 ft for depth BGS. Black circles show relative shape deviations detected on 20-SEP-2007. On A axis, positive deflections are in A0 (downslope) direction. On B axis, positive deflections are in the B0 direction (to the left looking downslope).

GEO-HAZ Consulting Geology and Slope Stability ofCrestone, CO Snodgrass Mountain Ski Area
March 2008 Crested Butte, CO
CHAPTER 4—GEOTECHNICAL 17
Fig. 4-7. Repeat inclinometer surveys of I-4, between 25-JULY-2005 and 20-SEP-2007.Vertical line at center is the reference line from the base survey. Depths shown are below TOC; subtract 4 ft for depth BGS. Black circles show relative shape deviations detected on 20-SEP-2007. On A axis, positive deflections are in A0 (downslope) direction. On B axis, positive deflections are in the B0 direction (to the left looking downslope).
GEO-HAZ Consulting Geology and Slope Stability ofCrestone, CO Snodgrass Mountain Ski Area
March 2008 Crested Butte, CO
CHAPTER 4—GEOTECHNICAL 18
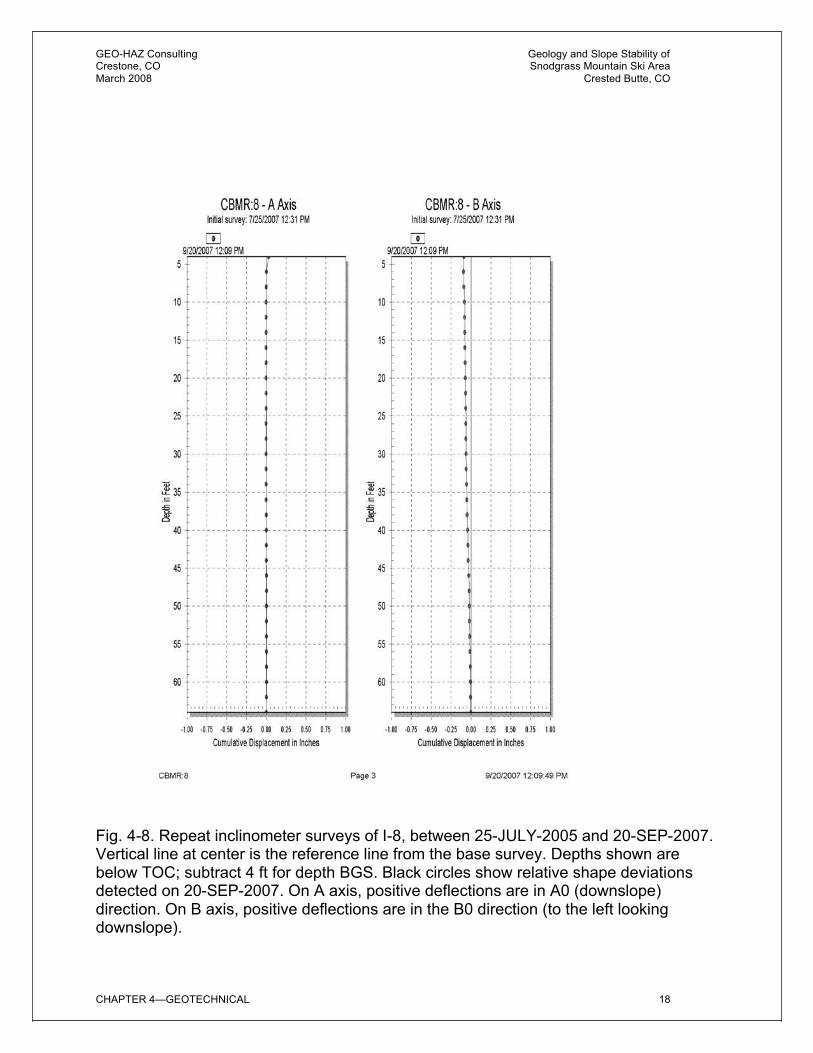
Fig. 4-8. Repeat inclinometer surveys of I-8, between 25-JULY-2005 and 20-SEP-2007.Vertical line at center is the reference line from the base survey. Depths shown are below TOC; subtract 4 ft for depth BGS. Black circles show relative shape deviationsdetected on 20-SEP-2007. On A axis, positive deflections are in A0 (downslope) direction. On B axis, positive deflections are in the B0 direction (to the left looking downslope).

GEO-HAZ Consulting Geology and Slope Stability ofCrestone, CO Snodgrass Mountain Ski Area
March 2008 Crested Butte, CO
CHAPTER 4—GEOTECHNICAL 19
Table 4-5. CheckSums of the initial and repeat surveys of Inclinometers I-2, I-4, and I-8. Bold values indicate significant differences, which are the probable cause of the small apparent tilts of I-4 and I-8..
Inclinometer INITIAL SURVEY REPEAT SURVEY
Parameters A Checksum B Checksum A Checksum B Checksum
I-2 Mean 6.8 -12.0 6.3 -15.3
Std. Dev. 2.4 5.0 2.5 5.5
I-4 Mean 7.3 -40.4 6.9 -11.3Std. Dev. 1.6 4.2 1.6 4.2
I-8 Mean 7.6 -36.5 8.0 -8.3Std. Dev. 2.1 6.0 1.8 5.6
4.3.4 Inclinometer I-8Inclinometer I-8 is located near the center of the Western Slide Complex, just
downslope of the Bike Trail and adjacent to piezometer PZ-8. Inclinometer depth was limited to 60 ft BGS, due to drill rig refusal at that depth on Mancos Shale.
The SEP-2007 repeat survey shows 2 deflections have occurred since July. The first is a deflection of 0.04” in the downslope (A0) direction, which is limited to the upper 2 ft of the casing (Fig. 4-8). This deflection may indicate surface soil creep. An annualized rate of movement based on this 2-month value would be 0.24”/yr, or 0.02ft/yr. By comparison, this value is in the range of long-term observed surface creep rates from landslide monitor pins in the area.
The second deflection is a persistent tilt of the entire casing in the B180 direction, amounting to a cumulative 0.1”. At I-8, the B180 direction is parallel to contours and points toward a small drainage on the eastern edge of a large flat meadow. This tilt is consistent throughout the 60 ft of the casing, and resembles the bias shift error of Cornforth (2006, p. 78-79; also called zero shift or offset error, or the “windshield wiper” effect). The most common cause of a bias shift error is widely different CheckSums between two consecutive surveys. Like on I-4, on I-8 the B-axis checksums were quite large (-37.3, -36.4, -36.5) on all 3 initial surveys, much larger than the B-axis checksum of the repeat survey (-8.3; Table 4-5). We suspect that this is the cause if the “windshield wiper effect”.
We plan to resurvey all the inclinometers in May 2008 as soon as the snow melts, and at I-8 will ensure that checksums for the June-08 resurveys are compatible with those of the July-07 survey; this should eliminate bias shift error from the comparison of future surveys.
4.4 Material Properties of Landslide and Non-Landslide Deposits
4.4.1 Previous Geotechnical StudiesOnly two previous geotechnical studies have been performed on Snodgrass. The
first was performed by Resource Consultants & Engineers in 1995 (RCE, 1995)specifically to look at slope stability of the SE slope of Snodgrass. They collected 48 split-spoon drive samples from their 5 boreholes at Snodgrass (SG-1 through SG-5), but these samples were discarded in 1995 without being measured for density or strength.

GEO-HAZ Consulting Geology and Slope Stability ofCrestone, CO Snodgrass Mountain Ski Area
March 2008 Crested Butte, CO
CHAPTER 4—GEOTECHNICAL 20
Their report does contain SPT blow counts and Unified Soil Class for all 48 samples, however.
A few years later Lambert & Associates (1998) performed a geotechnical study for the Reserve subdivision, which was to be built on the lower east slope of Snodgrass Mountain near Gothic Road. Based on 28 test borings they performed 8 swell-consolidation tests and 3 California Bearing Ratio tests. In addition, they derived these geotechnical parameters for 5 split-spoon samples drawn from 3 materials (Pinedale till,colluvium, and weathered shale): dry density, moisture content, peak internal angle of friction, and peak cohesion (Table 4-4).
Table 4-6. Geotechnical data from the Lambert & Associates 1998 report.
Boring Depth(ft)
Dry Density (pcf)
MoistureContent (%)
Pk. Internal angle of friction (°)
Pk.Cohesion(psf)
Deposit1
9 3 91 9.3 20 250 Qpt
22 4 90 11.2 20 230 Qpt
18 4 101 8.2 11 110 Qc?
27 4 111 10.3 22 345 Qc?
27 9 114 8.0 26 875 Wx shale1 Qpt, Pinedale till; Qc?, inferred colluvium; Wx shale, weathered Mancos Shale
The data indicate consistent properties for shallow Pinedale till (density 90-91pcf, peak friction angle 20°, peak cohesion 230-250 psf). The inferred colluvium samples are more variable, probably resulting from different source areas or processes. Weathered Mancos Shale displays a higher density, friction angle, and cohesion than the Quaternary deposits, as expected.
Additional geotechnical data were collected by CTL Thompson (1999, 2000) on the East Trade Parcel on the eastern slope of Mt. Crested Butte. The East Trade Parcel contains Quaternary and bedrock deposits very similar to those of Snodgrass Mountain. According to this data (Table 4-5), competent Mancos Shale yields significantly higher strengths than the weathered shale measured by Lambert & Associates.

GEO-HAZ Consulting Geology and Slope Stability ofCrestone, CO Snodgrass Mountain Ski Area
March 2008 Crested Butte, CO
CHAPTER 4—GEOTECHNICAL 21
Table 4-5. Summary of selected geotechnical test data from CTL Thompson studies on Mt. Crested Butte.GEOTECHNICAL SAMPLES FROM East Trade Parcel on Mt. Crested Butte
Shear Strength--undisturbed, direct shear
Shear Strength--remolded,direct shear
Shear Strength-- remolded,triax UU
reference Texture Friction-deg Cohesion-psf Friction-deg Cohesion-psfFriction-deg Cohesion-psf
CTL Thompson 1999 sandy clay 29 800 38 1000 29 800
page 13 silty gravelly clay 41 0 43 300 35 400
average valuesclaystonebedrock nd nd 39 750 28 900
actual sample, TP-3 Mancos Shale 40 peak 750 peak
39 residual 750 residual
actual sample, TP-25 clay, silty, gravelly 45 peak 260 peak
43 residual 290 residual
actual sample, TP-11 clay, sandy 41 peak 980 peak
38 residual 1040 residual
actual sample, TH-9B clay, sandy 32 peak 1330 peak
33 residual 1050 residual
actual sample, TH-11 clay, sandy 25 peak 540 peak
24 residual 530 residual
actual sample, TH-27clay, silty, gravelly 38 peak 590 peak
41 residual 0 residual
Residual Friction Residual cohesion peak friction peak cohesion
CTL Thompson 1999 sandy clay 33-38 200-400 24-29 200-400
page 14 silty gravelly clay 38-43 0 30-35 100-200
values used inclaystonebedrock 34-39 200-400 23-28 200-400
slope stability analysesResidualFriction
ResidualCohesion
CTL Thompson 2000 fill 24 200
Section C, page 2 sandy clay 24 200
values used in silty gravelly clay 30 100
slope stability analyses

GEO-HAZ Consulting Geology and Slope Stability ofCrestone, CO Snodgrass Mountain Ski Area
March 2008 Crested Butte, CO
CHAPTER 4—GEOTECHNICAL 22
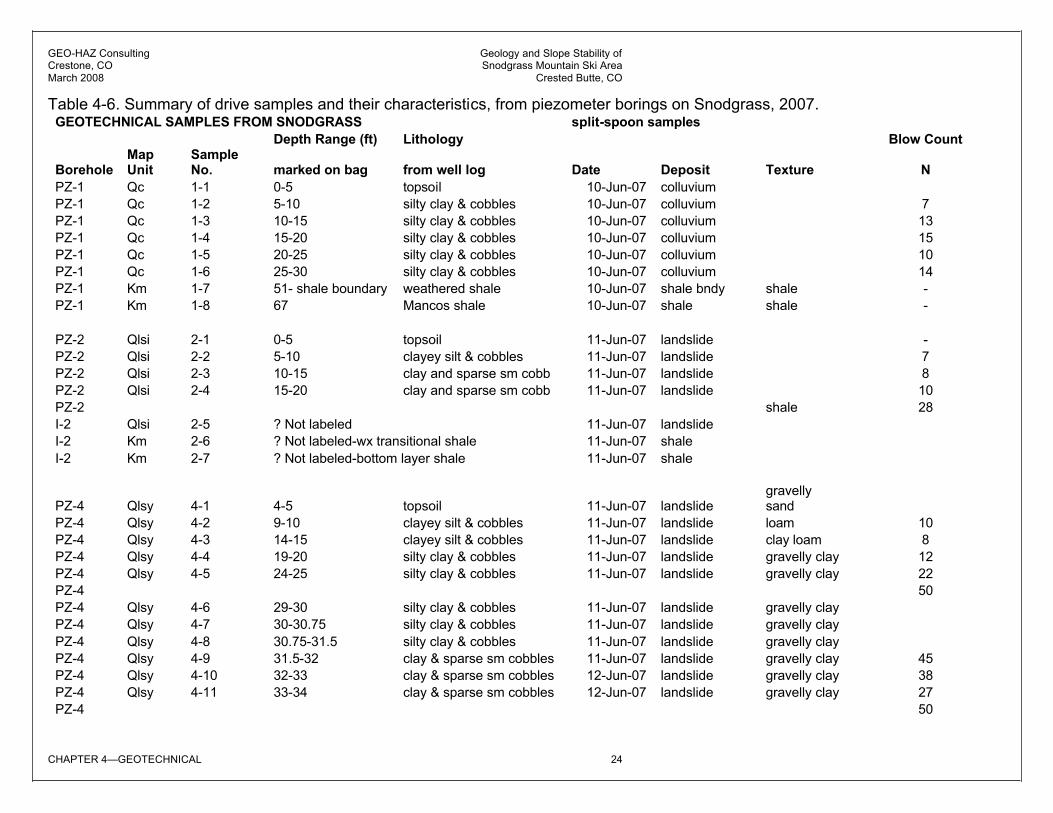
In the following sections we describe the density and shear strength of 7 types of earth materials that occur in our slope stability cross-sections (Chapter 8). Not all materials occur in each cross-section. The listing of all drive samples and theiraccompanying blow counts is given in Table 4-6. Densities are in table 4-7, and strengths in Table 4-8.
4.4.2 Pinedale till (map unit Qpt)We did not sample Pinedale till for geotechnical testing, because it was not
present in most of our stability cross-section. Instead, we assign values to unit Qpt based on values from Lambert & Associates (1998) and CTL Thompson (1999, 2000).
4.4.2.1 DensityDry densities range from 90-91 pcf at depths of 3-4 ft (Lambert & Associates,
1998). For this study, we assume a wet density of 131 pcf.
Table 4-6. Density and strength test results from this study, for major geologic units from Snodgrass Mountain.
Peak ResidualGeologic Unit/ CROSS-SECTION/ sample*
Wet Unit Weight(pcf) **
Dry Unit Weight (pcf)
Friction(degrees)
Cohesion(psf)
Friction(degrees)
Cohesion(psf)
Qpt/ WEST/ 13-7 131 116.5 30.6 870 13.8 330
Qpt/ CENTRAL/ 14-7 118 107.7 45.5 170 - -
Qot/ CENTRAL/ 14-9 135 121.7 46.3 0 19.2 140
Qefy/ CENTRAL/ 6-6 122 112.2 42 0 23.1 0
Qlsy/ EAST/ UT-10 110 101 25.3 560 18.7 170
Qlsio/ WEST/ 9-8 130 116.9 27.5 390 25.2 190
Shear zone/ EAST/ LT-1 121 106.2 40.3 150 22.5 0
Wx shale/ WEST/ 8-11 128 111.2 40 50 11.7 260
Wx shale/ CENTRAL/ 1-7 126 115 33.2 350 17.9 74
Km/ WEST/ 8-13 127 108.1 29.8 150 10.5 120
Km/ CENTRAL/ 4-15 96 93.4 39.5 0.0 10.5 0.0
* Qpt, Pinedale till; Qot, older till; Qefy, young earthflow; Qlsy, young landslide; Qlsio, intermediate-oldlandslide; shear zone, 10-40 cm-thick shear zones exposed in trenches; Wx shale, weathered shale; Km, Mancos Shale; samples list piezometer number followed by sample number (see Table 4-6).**Samples were soaked a minimum of 24 hours each.
4.4.2.2 StrengthFor till, Lambert & Associates (1998) cite a peak friction angle of 20° and
cohesion of 230-250 psf. On Mt. Crested Butte the “silty gravelly clay” tested by CTL Thompson (1999, 2000) is probably mostly till, according to the geologic map of Gaskill et al (1991). For their stability analyses, CTL (1999) used peak friction=30-35° and cohesion=100-200 psf, whereas CTL (2000) used a residual friction of 30° and cohesion of 100 psf. For this study, we assume a peak friction of 25° (conservative) and cohesion of 150 psf.

GEO-HAZ Consulting Geology and Slope Stability ofCrestone, CO Snodgrass Mountain Ski Area
March 2008 Crested Butte, CO
CHAPTER 4—GEOTECHNICAL 23
4.4.3 Older TillInferred “older till” exists in the subsurface of some profiles (e.g., Central Line, S Half).
4.4.3.1 DensityDry density is 122 pcf and wet density is 135 pcf.
4.4.3.2 StrengthBased on direct shear tests performed after the manner of Blake et al (2002),
peak friction and cohesion are 46° and 0 psf, and residual friction and cohesion are 19° and 140 psf.
4.4.4 Landslide DepositsWe collected 78 drive samples from landslide deposits at Snodgrass (Table 4-6),
but only tested representative samples from the three geophysics/slope stability transects (West Line, Central Line, East Line).
4.4.4.1 DensityTo estimate the material properties of landslide deposits, we tested Young
Landslide Deposits (Qlsy; 1 sample) and also Intermediate-Old Landslide Deposits(Qlsio; 1 sample). As expected, the older landslides were denser (117 pcf dry, 130 pcf wet) than the young landslides (101 pcf dry, 110 pcf wet).
4.4.4.2 Strengths (peak and residual)Young landslide deposits had peak friction and cohesion of 25°/ 560 psf and
residual friction and cohesion of 19°/170 psf. In comparison, older landslides wereslightly stronger (peak friction/cohesion of 28°/390; residual friction/cohesion of 25°/190).
GEO-HAZ Consulting Geology and Slope Stability ofCrestone, CO Snodgrass Mountain Ski Area
March 2008 Crested Butte, CO
CHAPTER 4—GEOTECHNICAL 24
Table 4-6. Summary of drive samples and their characteristics, from piezometer borings on Snodgrass, 2007.GEOTECHNICAL SAMPLES FROM SNODGRASS split-spoon samples
Depth Range (ft) Lithology Blow Count
BoreholeMapUnit
SampleNo. marked on bag from well log Date Deposit Texture N
PZ-1 Qc 1-1 0-5 topsoil 10-Jun-07 colluvium
PZ-1 Qc 1-2 5-10 silty clay & cobbles 10-Jun-07 colluvium 7
PZ-1 Qc 1-3 10-15 silty clay & cobbles 10-Jun-07 colluvium 13
PZ-1 Qc 1-4 15-20 silty clay & cobbles 10-Jun-07 colluvium 15
PZ-1 Qc 1-5 20-25 silty clay & cobbles 10-Jun-07 colluvium 10
PZ-1 Qc 1-6 25-30 silty clay & cobbles 10-Jun-07 colluvium 14
PZ-1 Km 1-7 51- shale boundary weathered shale 10-Jun-07 shale bndy shale -
PZ-1 Km 1-8 67 Mancos shale 10-Jun-07 shale shale -
PZ-2 Qlsi 2-1 0-5 topsoil 11-Jun-07 landslide -
PZ-2 Qlsi 2-2 5-10 clayey silt & cobbles 11-Jun-07 landslide 7
PZ-2 Qlsi 2-3 10-15 clay and sparse sm cobb 11-Jun-07 landslide 8
PZ-2 Qlsi 2-4 15-20 clay and sparse sm cobb 11-Jun-07 landslide 10
PZ-2 shale 28
I-2 Qlsi 2-5 ? Not labeled 11-Jun-07 landslide
I-2 Km 2-6 ? Not labeled-wx transitional shale 11-Jun-07 shale
I-2 Km 2-7 ? Not labeled-bottom layer shale 11-Jun-07 shale
PZ-4 Qlsy 4-1 4-5 topsoil 11-Jun-07 landslidegravellysand
PZ-4 Qlsy 4-2 9-10 clayey silt & cobbles 11-Jun-07 landslide loam 10
PZ-4 Qlsy 4-3 14-15 clayey silt & cobbles 11-Jun-07 landslide clay loam 8
PZ-4 Qlsy 4-4 19-20 silty clay & cobbles 11-Jun-07 landslide gravelly clay 12
PZ-4 Qlsy 4-5 24-25 silty clay & cobbles 11-Jun-07 landslide gravelly clay 22
PZ-4 50
PZ-4 Qlsy 4-6 29-30 silty clay & cobbles 11-Jun-07 landslide gravelly clay
PZ-4 Qlsy 4-7 30-30.75 silty clay & cobbles 11-Jun-07 landslide gravelly clay
PZ-4 Qlsy 4-8 30.75-31.5 silty clay & cobbles 11-Jun-07 landslide gravelly clay
PZ-4 Qlsy 4-9 31.5-32 clay & sparse sm cobbles 11-Jun-07 landslide gravelly clay 45
PZ-4 Qlsy 4-10 32-33 clay & sparse sm cobbles 12-Jun-07 landslide gravelly clay 38
PZ-4 Qlsy 4-11 33-34 clay & sparse sm cobbles 12-Jun-07 landslide gravelly clay 27
PZ-4 50

GEO-HAZ Consulting Geology and Slope Stability ofCrestone, CO Snodgrass Mountain Ski Area
March 2008 Crested Butte, CO
CHAPTER 4—GEOTECHNICAL 25
PZ-4 56
PZ-4 Qlsy 4-12 38.5-39 clay & sparse sm cobbles 12-Jun-07 shear zone? sandy clay 10
PZ-4 Qlsy 4-13 39.75-40 clay & sparse sm cobbles 12-Jun-07 shear zone sandy clay
PZ-4 Km-wx 4-14 41-41.5 Km 12-Jun-07 Km shale
PZ-4 Km 4-15 41.5-42 Km 12-Jun-07 Km shale
PZ-5 Qlsi 5-1 0-5 topsoil 13-Jun-07 landslide -
PZ-5 Qlsi 5-2 5-10 topsoil 13-Jun-07 landslide 20 (6 -7')
PZ-5 Qlsi 5-3 10-15 silty clay & cobb, some gr 13-Jun-07 landslide 12 (11-12')
PZ-5 Qlsi 5-4 15-20 silty clay & cobb, some gr 13-Jun-07 landslide 9 (16-17')
PZ-5 Qlsi 5-5 20-25 silty clay & cobb, some gr 13-Jun-07 landslide 10 (21-22')
PZ-5 Qlsi 5-6 25-30 silty clay & cobb, some gr 13-Jun-07 landslide
PZ-5 Qlsi 5-7 30-35 silty clay & cobb, some gr 13-Jun-07 landslide 25 (31-32')
PZ-6 Qefy 6-1 0-5 topsoil 16-Jun-07 landslide -
PZ-6 Qefy 6-2 5-10 topsoil 16-Jun-07 landslide 20 (6-7')
PZ-6 Qefy 6-3 10-15 silty clay & cobb, some gr 16-Jun-07 landslide 14 (11-12')
PZ-6 Qefy 6-4 15-20 silty clay & cobb, some gr 16-Jun-07 landslide 29 (16-17')
PZ-6 Qefy 6-5 20-25 silty clay & cobb, some gr 16-Jun-07 landslide 48 (21-22')
PZ-6 Qefy 6-6 25-27 silty clay & cobb, some gr 16-Jun-07 landslide 15 (26-27')
PZ-6 21 (31-32')
PZ-6 Qefy 6-7 85 Km 16-Jun-07 Km shale -
PZ-8 Qlsi 8-1 0-5 topsoil & cobbles 18-Jun-07 landslide -
PZ-8 Qlsi 8-2 5-10 topsoil & cobbles 18-Jun-07 landslide 27 (6-7')
PZ-8 Qlsi 8-3 10-15 topsoil & cobbles 18-Jun-07 landslide 15 (11-12')
PZ-8 Qlsi 8-4 15-20 silty clay & cobb, some gr 18-Jun-07 landslide 16 (16-17')
PZ-8 Qlsi 8-5 20-25 silty clay & cobb, some gr 18-Jun-07 landslide 19 (21-22')
PZ-8 Qlsi 8-6 25-30 silty clay & cobb, some gr 18-Jun-07 landslide 21 (26-27')
PZ-8 Qlsi 8-7 30.25-31clay & very sm sparse cobb 18-Jun-07 landslide 19 (31-32')
PZ-8 Qlsi 8-8 31-35clay & very sm sparse cobb 18-Jun-07 landslide
PZ-8 Qlsi 8-9 35-40clay & very sm sparse cobb 18-Jun-07 landslide 36 (36-37')
PZ-8 Qlsi 8-10 40-45clay & very sm sparse cobb 18-Jun-07 landslide 30 (41-42')

GEO-HAZ Consulting Geology and Slope Stability ofCrestone, CO Snodgrass Mountain Ski Area
March 2008 Crested Butte, CO
CHAPTER 4—GEOTECHNICAL 26
PZ-8 Qlsi 8-11 45-50clay & very sm sparse cobb 18-Jun-07 shear zone/ wx shale 35 (46-47')
PZ-8 Qlsi 8-12 50-55 wx shale 18-Jun-07 shale 37 (51-52')
PZ-8 Qlsi 8-13 52 wx shale 18-Jun-07 shale -
PZ-8 Qlsi 8-14 55.5-56.5 wx shale 18-Jun-07 shale
PZ-8 Qlsi 8-15 56.5-57 Km 18-Jun-07 shale >50 (refusal) (56-56.5')
PZ-8 Qlsi 8-16 60 Km 18-Jun-07 shale >50 (refusal) (60-60.5')
PZ-9 Qlsi 9-1 0-5 Topsoil and cobbles 17-Jun-07 landslide -
PZ-9 Qlsi 9-2 5-10 Topsoil and cobbles 17-Jun-07 landslide 14 (6-7')
PZ-9 Qlsi 9-3 10-15
Silty clay and cobbles, some gravel, scattered boulders 17-Jun-07 landslide 10 (11-12')
PZ-9 Qlsi 9-4 15-20 “ 17-Jun-07 landslide 12 (16-17')
PZ-9 Qlsi 9-5 20-25 “ 17-Jun-07 landslide 7 (21-22')
PZ-9 Qlsi 9-6 25-30 “ 17-Jun-07 landslide 15 (26-27')
PZ-9 Qlsi 9-7 30-35 Mud and medium cobbles 17-Jun-07 landslide 32 (31-32')
PZ-9 Qlsi 9-8 35-37 “ 17-Jun-07 landslide 23 (36-37')
PZ-11 Qlsy 11-1 0-5 Topsoil and cobbles 29-Jul-07 landslide -
PZ-11 Qlsy 11-2 5-10 “ 29-Jul-07 landslide -
PZ-11 Qlsy 11-3 10-15Clayey silt and cobbles, some gravel 29-Jul-07 landslide 8 (11-12')
PZ-11 Qlsy 11-4 15-20 Silty clay and cobbles 29-Jul-07 landslide 6 (16-17')
PZ-11 Qlsy 11-5 20-25 “ 29-Jul-07 landslide 9 (21-22')
PZ-11 Qlsy 11-6 25-30 “ 29-Jul-07 landslide 14 (26-27')
PZ-11 Qlsy 11-7 30-35 “ 29-Jul-07 landslide 16 (31-32')
PZ-11 Qlsy 11-8 35-40 “ 29-Jul-07 landslide 26 (36-37')
PZ-11 Wx shale 46 (41-42')
PZ-11 Qlsy 11-9 42-43 “ 29-Jul-07 landslide?
PZ-11 shale shaleNo Drive (in shale; 45-
47')
PZ-11 Qlsy 11-10 50-52 “ 29-Jul-07 shale 58 (50-51')
PZ-11 “ >50 (refusal) (51-51.5')
PZ-12 Qefo 12-1 0-5 Topsoil and cobbles 28-Jul-07 landslide -
PZ-12 Qefo 12-2 5-10 Silty clay and cobbles, 28-Jul-07 landslide 11 (6-7')

GEO-HAZ Consulting Geology and Slope Stability ofCrestone, CO Snodgrass Mountain Ski Area
March 2008 Crested Butte, CO
CHAPTER 4—GEOTECHNICAL 27
some gravel, scattered boulders
PZ-12 Qefo 12-3 10-15 “ 28-Jul-07 landslide 9 (11-12')
PZ-12 Qefo 12-4 15-20 “ 28-Jul-07 landslide rock? 36 (16-17')
PZ-12 Qefo 12-5 20-25 “ 28-Jul-07 landslide 12 (21-22')
PZ-12 Qefo 12-6 25-30 “ 28-Jul-07 landslide 16 (26-27')
PZ-13 Qefo 13-1 0-5 Topsoil and cobbles 24-Jul-07 landslide -
PZ-13 Qefo 13-2 5-10 Gravelly silt and cobbles 24-Jul-07 landslide rock? 27 (6-7')
PZ-13 Qefo 13-3 10-15Silty clay and cobbles, some gravel 24-Jul-07 landslide 7 (11-12')
PZ-13 Qefo 13-4 15-20 “ 24-Jul-07 landslide 13 (16-17')
PZ-13 Qefo 13-5 20-25 “ 24-Jul-07 landslide 5 (21-22')
PZ-13 Qefo 13-6 25-30 “ 24-Jul-07 landslide 21 (25-27')
PZ-13 Qefo 13-7 30-35 “ 24-Jul-07 landslide 15 (31-32')
PZ-13 Qefo 13-8 35-36 “ 24-Jul-07 landslide 11 (36-37')
PZ-14 Qpt 14-1 0-5 Topsoil and cobbles 27-Jul-07 till -
PZ-14 Qpt 14-2 5-10 “ 27-Jul-07 till 31 (6-7')
PZ-14 Qpt 14-3 10-15
Silty clay and cobbles, some gravel, scattered boulders 27-Jul-07 till rock? 25 (11-12')
PZ-14 Qpt 14-4 15-20 “ 27-Jul-07 till 20 (16-17')
PZ-14 Qpt 14-5 20-25 “ 27-Jul-07 till 17 (21-22')
PZ-14 Qpt 14-6 25-30 “ 27-Jul-07 till rock? 32 (26-27')
PZ-14 Qpt 14-7 30-35Saturated small to medium cobbles 27-Jul-07 outwash rock? 48 (31-32')
PZ-14 Qlso 14-8 35-40 “ 27-Jul-07 landslide 21 (36-37')
PZ-14 Qlso 14-9 40-45 “ 27-Jul-07 landslide 17 (41-42')
PZ-14 Qlso 14-10 45-50 Clay and cobbles 27-Jul-07 landslide 12 (46-47')
PZ-14 no sample “ 26 (51-52')
PZ-15 15-1 5-6Clayey silt and cobbles, little gravel 14-Nov-06 till? n.a.
PZ-15 15-2 5-10 “ 14-Nov-06 till? n.a.
PZ-15 15a-3 10-15 “ 14-Nov-06 till? n.a.
PZ-15 15a-4 15-20 “ 14-Nov-06 till? n.a.

GEO-HAZ Consulting Geology and Slope Stability ofCrestone, CO Snodgrass Mountain Ski Area
March 2008 Crested Butte, CO
CHAPTER 4—GEOTECHNICAL 28
PZ-15 15a-5 20-22 “ 14-Nov-06 till? n.a.
PZ-15 15a-6 27-30 “ 14-Nov-06 shale? shale chips n.a.
PZ-15 15a-7 35 Weathered shale 14-Nov-06 shale? shale chips n.a.
PZ-15 15a-8 39-40 “ 14-Nov-06 shale? shale chips n.a.
PZ-15 15a-9 45 shale 14-Nov-06 shale? n.a.
PZ-16 Qlsy 16-1 10Clayey silt and cobbles, little gravel 14-Nov-06 landslide 20 (11-12')
PZ-16 Qlsy 16-2 15 “ 14-Nov-06 landslide 19 (16-17')
PZ-16 “ 13 (20-21')
PZ-16 “ rock? >50 (refusal) (21-21.5')
PZ-16 Qlsy 16-3 25 “ 14-Nov-06 landslide 28 (26-27')
PZ-16 Qlsy 16-4 30 “ 14-Nov-06 landslide 21 (31-32')
PZ-16 Qlsy 16-5 35 “ 14-Nov-06 landslide 27 (36-37')
PZ-16 Qlsy 16-6 40 shale 14-Nov-06 shale? shale chips 28 (41-42')
56 (46-47')

GEO-HAZ Consulting Geology and Slope Stability ofCrestone, CO Snodgrass Mountain Ski Area
March 2008 Crested Butte, CO
CHAPTER 4—GEOTECHNICAL 29
4.4.5 Landslide Shear ZonesWe collected 2 drive samples and 6 hand-carved trench samples from landslide
shear zones at Snodgrass. However, we only tested one representative sample (most of the 6 trench samples were duplicates of a few shear zones).
4.4.5.1 DensityDry density was 106 pcf and wet density was 121 pcf.
4.4.5.2 Strength (residual)Due to the inclusion of sand in all the sampled shear zones, strengths were
comparable to those of tills and landslide deposits. For the tested sample from shear zone SZ-2 in the lower trench, peak friction/cohesion were 40°/150 psf and residual friction/cohesion were 23°/0 psf.
4.4.6 Tertiary porphyryWe did not collect any samples from Tertiary porphyry at Snodgrass because
porphyry mainly occurs in our stability cross-sections as detached, “floating” masses within landslides. For those few instances where the basal rock in a cross-section might be Tp rather than Km, we assume “typical” strength values for quartz monzonite fromthe Society for Mining, Metallurgy, and Exploration website:(http://books.smenet.org/Surf_Min_2ndEd/sm-ch06-sc08-ss00-tbl004.cfm)..
4.4.6.1 DensityFor this study, we assume a typical density of 165 pcf (granite and similar
intrusives).
4.4.6.2 StrengthFor this study, we assume a peak strength of 31° and cohesion of 2000 psf.
We do not use a residual strength, because we do not think that failure planesenter Tp, as long as there is adjacent, much weaker Km to fail.
4.4.7 Weathered ShaleWe collected 6 drive samples from weathered Mancos Shale at Snodgrass
(Table 4-6), but only tested representative samples from the two of thegeophysics/slope stability transects (West Slide, Middle Slide).
4.4.7.1 DensityDry densities range from 111-115 pcf and wet densities from 126-128 pcf.
4.4.7.2 StrengthPeak friction/cohesion ranged from 33°/350 psf to 40°/50 psf, whereas residual friction/cohesion ranged from 12°/260 psf to 18°/74 psf. As explained in Chapter 8, we used the composite minimum values (12°/74 psf) in the stability analysis.

GEO-HAZ Consulting Geology and Slope Stability ofCrestone, CO Snodgrass Mountain Ski Area
March 2008 Crested Butte, CO
CHAPTER 4—GEOTECHNICAL 30
4.4.8 Competent Mancos ShaleWe collected 14 drive samples from competent Mancos Shale at Snodgrass
(Table 4-6), but only tested representative samples from the three geophysics/slope stability transects (West Slide, Middle Slide, East Slide).
4.4.8.1 DensityTested densities were variable, ranging from 108 pcf dry/ 127 pcf wet, to 93 pcf
dry and 96 pcf wet.
Table 4-7. Densities and strengths of weathered and unweathered Mancos Shale from This Study and the other nearby consulting reports.
Peak ResidualUnit/ Section/ Sample/Reference
Wet Unit Weight(pcf)
SaturatedUnit Weight (pcf)
Friction(degrees)
Cohesion(psf)
Friction(degrees)
Cohesion(psf)
Wx shale/ WEST/ 8-11/ THIS STUDY
128 111.2 40 50 11.7 260
Wx shale/ CENTRAL/ 1-7/THIS STUDY
126 115 33.2 350
Km/ WEST/ 8-13. THIS STUDY
127 108.1 29.8 150 10.5 120
Km/ CENTRAL/ 4-15/ THISSTUDY
96 93.4 39.5 0.0 10.5 0.0
Km/ CTL Thompson, 1999 Direct shear 40 750 39 750Triaxial 28 900
Used in CTL analyses 23-28 200-400 34-39 200-400
4.4.8.2 StrengthThe strength values to use for Mancos Shale are among the most critical values
in our stability analyses (Chapter 8). As shown in Table 4-7, our peak strengths (30-40°)are similar to those obtained by CTL Thompson (1999; 28-40°) from sites on Mt. Crested Butte. However, our residual strengths (10.5-11.7°) are much lower than peakstrengths (30-40°). These residual strengths were obtained by repetitive shearing of a sample in the direct shear box under constant normal stress, until residual strengths no longer decreased with additional shearing (after the method of Blake et al., 2002, p. 45-46). In that sense, they might be termed “ultimate” residual strengths. We consider the use of these low values conservative.