
MAPPING OF EVAPOTRANSPIRATION ZONESIN INDIA USING GIS
17
MAPPING OF EVAPOTRANSPIRATION ZONES IN INDIA USING GIS M.V.S.S.Giridhar 1* and B. Satyanarayana 1 Centre for Water Resources, Institute of Science and Technology, JNTU, Kukatpally, Hyderabad email:[email protected] G. K. Viswanadh 2 Department of Civil Engineering, J.N.T.U. College of Engineering, JNT University, Hyderabad email:[email protected] Abstract Several studies showed that the Penman method is superior, when the required data are available and reliable to all other commonly used methods for estimating ET o under varying locations and climatic conditions. More physically based FAO-56 Penman–Monteith (PM) combination method yields consistently more accurate ET 0 estimates across a wide range of climates. Methodologies on crop water requirements were reviewed at international level to advice on the revision and update of procedures for estimating ET o and the panel of experts recommended the adoption of the FAO-56 Penman - Monteith combination method as standard. Hence for the present study, the same method was chosen as the standard method for the calculation of reference evapotranspiration. Monthly normal climatic parameters like maximum temperature, minimum temperature, minimum relative humidity, maximum relative humidity, wind speed and sunshine duration was colleted for 167 locations in all over India. Reference evapotranspiration was calculated for all locations in the India using FAO-56 Penman Monteith method. Climatic zones were prepared using Arc. GIS 9.1 software. Reference evapotranspiration zones were demarcated through out the India based on daily ET o values. These ET o zones will be useful to calculate daily crop water requirement in that
Transcript of MAPPING OF EVAPOTRANSPIRATION ZONESIN INDIA USING GIS
MAPPING OF EVAPOTRANSPIRATION ZONES IN INDIA USING GIS
M.V.S.S.Giridhar1* and B. Satyanarayana1Centre for Water Resources, Institute of Science and Technology,
JNTU, Kukatpally, Hyderabademail:[email protected]
G. K. Viswanadh2Department of Civil Engineering, J.N.T.U. College of Engineering, JNT
University, Hyderabademail:[email protected]
Abstract
Several studies showed that the Penman method is superior,when the required data are available and reliable to allother commonly used methods for estimating ETo undervarying locations and climatic conditions. More physicallybased FAO-56 Penman–Monteith (PM) combination methodyields consistently more accurate ET0 estimates across awide range of climates. Methodologies on crop waterrequirements were reviewed at international level toadvice on the revision and update of procedures forestimating ETo and the panel of experts recommended theadoption of the FAO-56 Penman - Monteith combinationmethod as standard. Hence for the present study, the samemethod was chosen as the standard method for thecalculation of reference evapotranspiration. Monthlynormal climatic parameters like maximum temperature,minimum temperature, minimum relative humidity, maximumrelative humidity, wind speed and sunshine duration wascolleted for 167 locations in all over India. Referenceevapotranspiration was calculated for all locations in theIndia using FAO-56 Penman Monteith method. Climatic zoneswere prepared using Arc. GIS 9.1 software. Referenceevapotranspiration zones were demarcated through out theIndia based on daily ETo values. These ETo zones will beuseful to calculate daily crop water requirement in that
particular area. Further, it will be useful for accurateestimation of surface runoff. Maximum daily referenceevapotranspiration was varying from 4.71mm to 11.17mm atBhaunagar and Indore respectively. Minimum daily referenceevapotranspiration varies from 0.61mm to 2.47mm atSrinagar and Darjeeling respectively. Maximum referenceevapotranspiration was observed in the month of May andminimum reference evapotranspiration was observed in themonth of January.
1*Conference Speaker
Introduction
Evapotranspiration (ET) represents the major consumptiveuse of irrigation water and rainfall on agricultural land.Transpiration (T) is the portion of ET that flows throughthe plant system, it is the main component of ET thatimpacts the ET yield relationship. Nevertheless, theevaporation (E) component within and outside the cropgrowing season can be a significant component of the totalET. Given the increased competition for water, it isimportant to search for new ways to conserve water and/orto use it more efficiently. Land surfaceevapotranspiration ET transfers large volumes of waterfrom soil evaporation and vegetation transpiration to theatmosphere. Quantifying the consumption of water overlarge areas and within irrigated projects is important forwater rights management, water resources planning,hydrologic water balances, and water regulation. Spatialestimates of ET are essential components of generalcirculation and hydrologic models Wigmosta et al. 1994;Betts et al. 1997 and ET is used to infer soil moisture, avaluable input to weather and flood forecast models.Traditionally, ET from agricultural fields has beenestimated by multiplying a weather-based reference ET by acrop coefficient Kc determined according to the crop typeand growth stage. These ET maps i.e., images provide themeans to quantify ET on a field by field basis in terms ofboth the rate and spatial distribution. The ET images showa progression of ET during the year or growing season aswell as its spatial distribution. These applications havebeen made to estimate water budgets for hydrologicmodeling; monitor compliance with water rights; supportwater resources planning; estimated aquifer depletion;support groundwater model calibration and operation;estimated water use by irrigated agriculture, estimatedhistorical water use for water rights transfers andevaluate relative performance of an irrigation canalcompany by comparing ET0 with diversions. (Monteith 1965),(Shih et al 1981), (Amatya et al 1995), (Ahmed 1999),(Sudeer Reddy 2001), (George et al. 2002), (Giridhar et al2004) and (Lakshman et al 2006) found that the FAO-56Penman-Monteith method is the more reliable method to
calculate the ET0 for all climatic conditions. Theobjective of the present study is to develop referenceevapotranspiration (ET0) maps for India on monthly basis.
Study Area
India covering an area of 3.28 million sq kms, it is theseventh largest country in the world. The mainland ofIndia extends between 8º 4' N and 37º 6’ North Latitudeand 68º 7’ and 97º 25’East Longitudes. The Tropic ofCancer 23º 30’ N divides India almost into two halves. Theland frontier of the country is 15, 200 km and the totallength of the coastline is over 7,500kms. India can bedivided mainly into four climatic zones namely Alpine,Subtropical, Tropical and Arid. Alpine Zone: This climatezone can be experienced in the high altitudes ofHimalayas. In this region there are high climaticfluctuations due to steep altitude variations. Differenttypes of climatic zones can be seen in this region. If onthe foothills occur subtropical climate there is AlpineTundra Zone to greet you on the higher altitudes. SubTropical: This zone is prevalent in most of the northernpart of India. It can be called as the typical Indianclimate. Summers are hot and wet while in wintertemperature may drop down to freezing point in higherranges. Rainfall is common in summer season whereaswinters are cold and dry. Tropical: It can be divided intotwo sub types viz, Tropical Wet Monsoon and Tropical Dry.The characteristics of Tropical Wet Monsoon includeaverage temperature, which normally does not fall below18ºC, accompanied by average to high rainfall. In TropicalDry type rainfall is not so common. Arid: High temperatureand low rainfall are marked features of this climaticzone. It is prevalent in western part of the country andincludes large part of Rajasthan. The temperature in thiszone may shoot up to as high as 50ºC in summer.
Estimation of Reference Evapotranspiration (ET0)
Reference Evapotranspiration refers to loss of water fromthe land and water surfaces of catchment due to thecombined processes of evaporation and transpiration. In
this model, Reference Evapotranspiration is considered totake place from Interception storage, Upper zone storage,Lower zone storage, Streams and lakes surface, and Groundwater storage. Daily ET0 was estimated from FAO-56 Penman-Monteith method using the software. The FAO56-PM equationas given by FAO irrigation and Drainage Paper No.56 in(Allen et al 1998) has been used as given in equation (1).The software developed by (Viswanadh et al 2004) is usedto calculate reference evapotranspiration for the presentstudy. The ET0 thus calculated is taken as input to proposeevapotranspiration ranges for all over India on monthlybasis.
(1)ETo= reference evapotranspiration (mm d-1); =slope ofvapour pressure curve (kPa 0C-1); Rn=mean daily netradiation (MJ m-2.d-1); G=soil heat flux (MJ m-2.d-1); = psychometric constant (0.0671kPa oC-1); T=mean daily airtemperature at 2m height [(Tmax+ Tmin)/2,oC]; U2 = wind speedat 2m height (m.s-1); es = saturation vapour pressure(kPa). ET0(H)=ET0 estimated by the Hargreaves equation (mmday-1), Ra = extraterrestrial radiation (mm day-
1), Tmax = daily maximum temperature (oC), Tmin = dailyminimum temperature (oC) and ed = vapour pressure at duepoint temp.
Preparation of ET maps using GIS
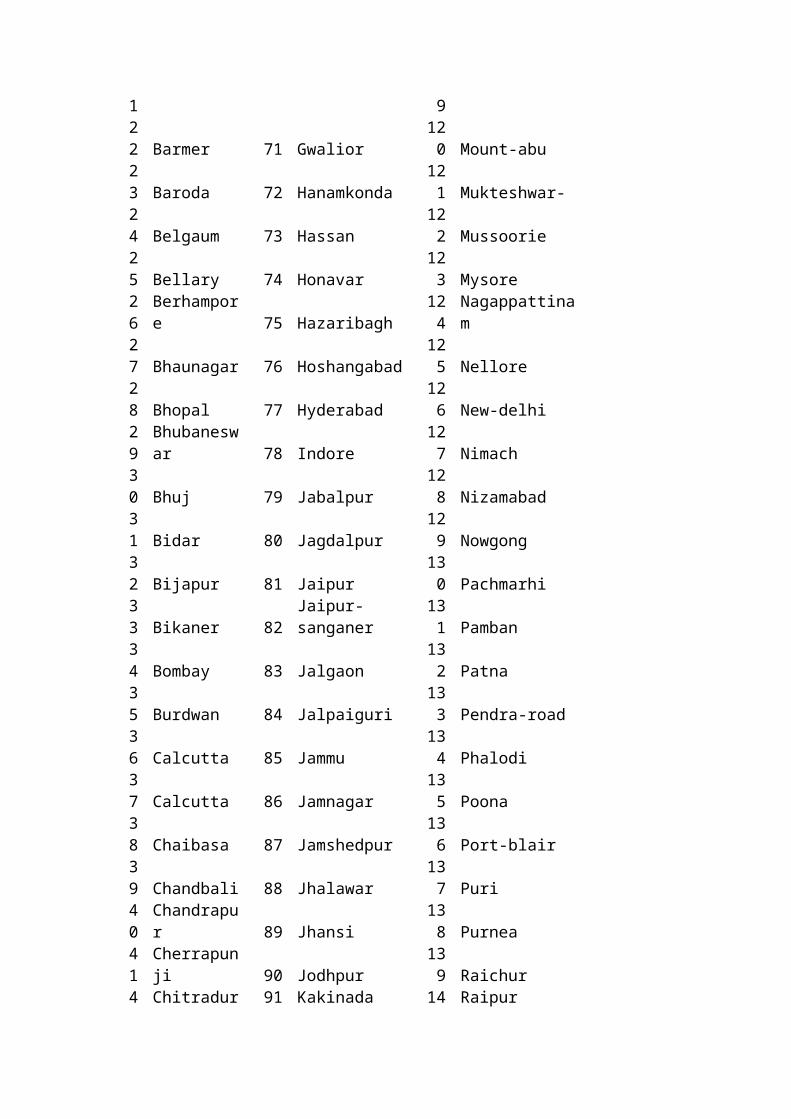
Meteorological database such as normal maximumtemperature, minimum temperature, sunshine hours, relativehumidity, wind speed and rainfall has been generated forall 167 locations in India on monthly basis. Mean monthlyreference evapotranspiration (mm/day) has been calculatedusing FAO-56 Penman Monteith method for all meteorologicalstations. 167 meteorological stations in India were listedin Table.1. The latitude and longitude values for theabove stations were collected and the geo-reference pointsfor the same were registered and rectified in GIS 9.1
software. Mean monthly meteorological data and referenceevapotranspiration values have been exported to GISenvironment to build the topology. Referenceevapotranspiration maps were then prepared for all overIndia on monthly basis. These ETo values estimated fromFAO-56 Penman-Monteith method were further classified into5 ranges. The variation of normal ReferenceEvapotranspiration with time within the climatic zonesavailable in India i.e Alpine, Subtropical, Tropical andArid has been analyzed.
Results and Discussion
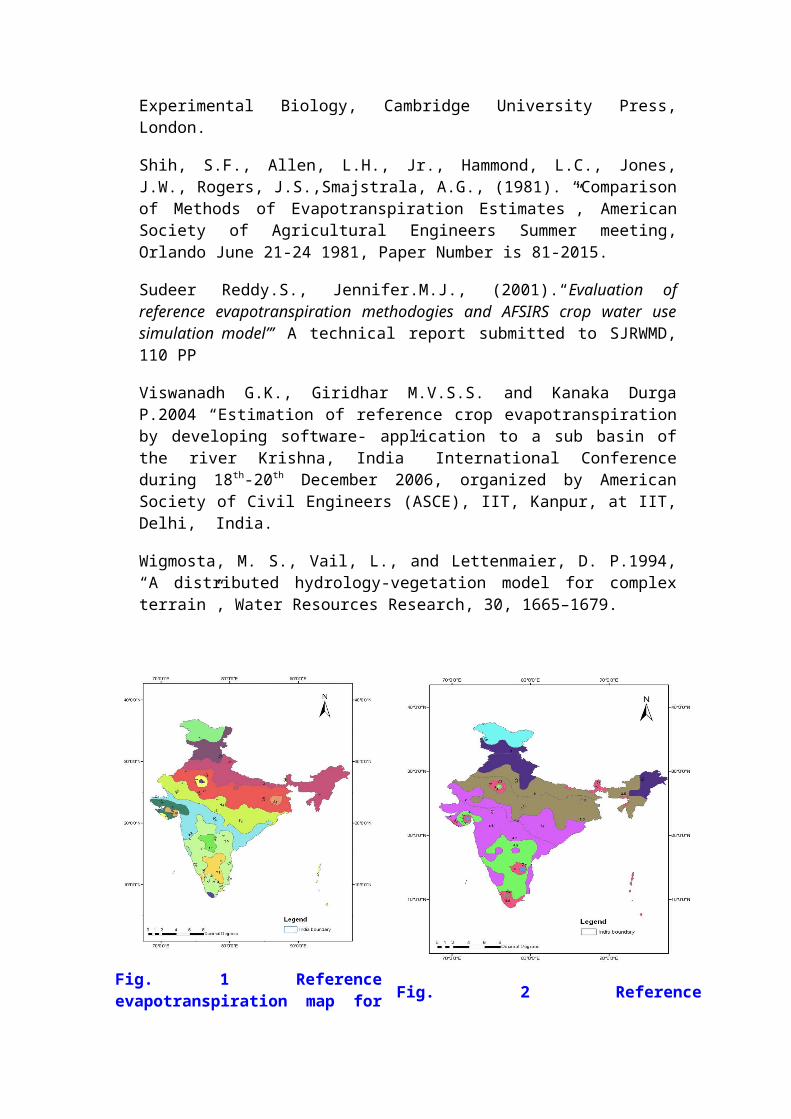
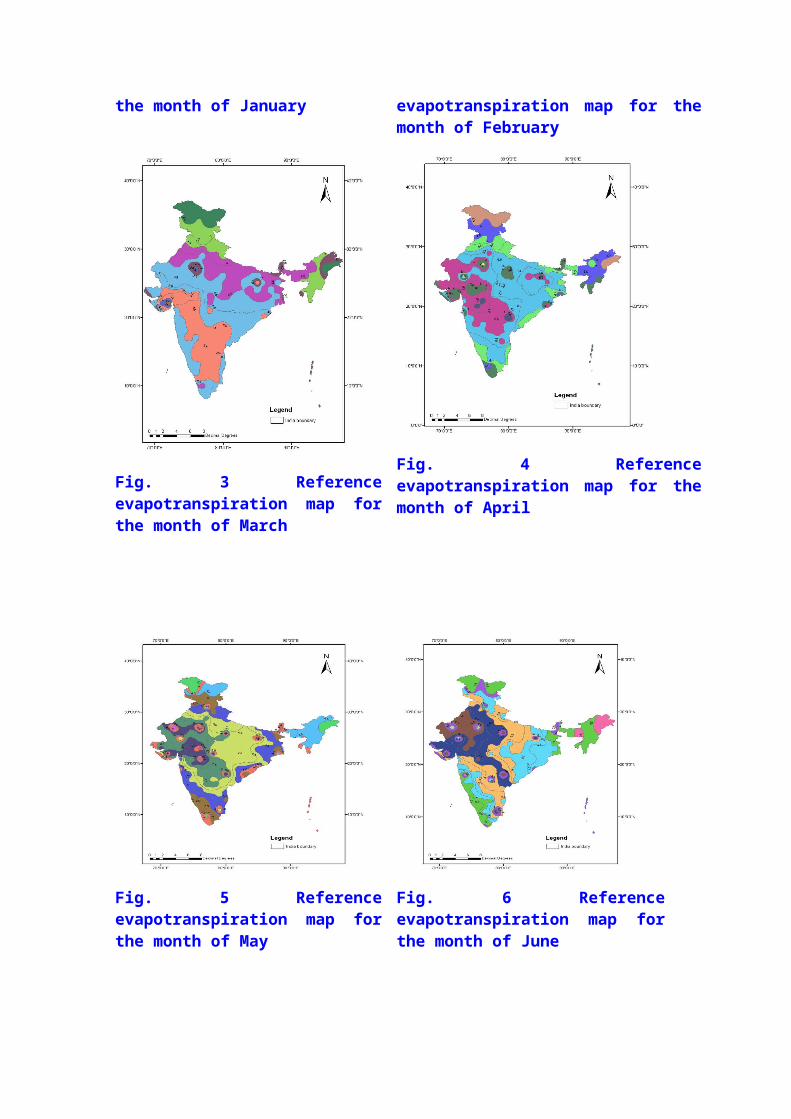
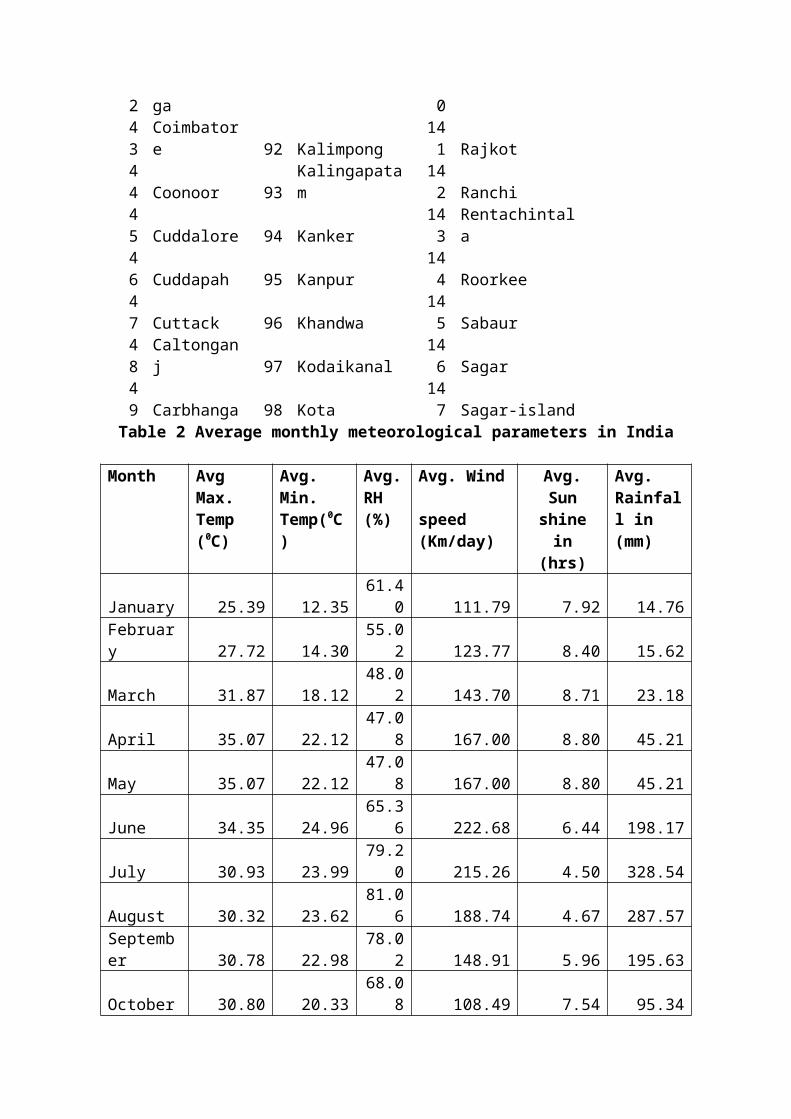
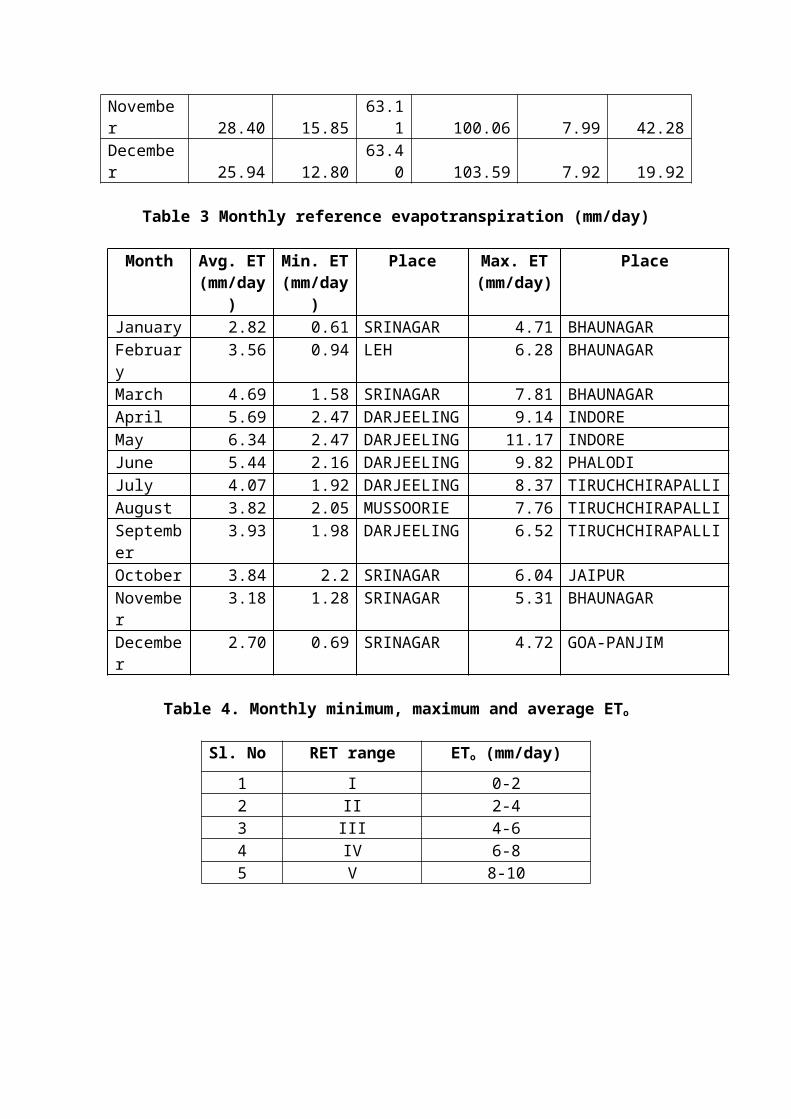
Normal monthly meteorological variables such as maximumtemperature, minimum temperature, sunshine hours, relativehumidity and wind speed were converted to average monthlyvariables for India as shown in Table. 2. Mean monthlyreference evapotranspiration (mm/day) has been calculatedusing FAO-56 Penman-Monteith method. From the calculatednormal monthly reference evapotranspiration (ETo), averageETo was calculated. Table 3 contains Average ET, Minimum ETand Maximum ET in mm per day along with the correspondingplace of occurrence. Total Five ETo ranges were framed andshown in Table.4. Monthly ETo ranges were developed in GISenvironment and shown in Figures from 1 to 12 based onmonthly normal reference evapotranspiration values.
The variation of normal Reference Evapotranspiration withtime within the climatic zones has been analyzed andpresented in Table 5. Variation of ET ranges with in theclimatic zones during a year has been graphicallypresented in Fig.13.
In the Alpine climatic zone, Reference Evapotranspirationvaried from range I to III from January to December. RangeII persisted for seven months namely February to April andJune to October in this climatic zone. ETo values werefound to occur in Range I in months of January, Novemberand December, and Range III in the months of May and Junecoinciding with the summer months.
In the Sub Tropical climatic zone, ETo varied from range Ito IV from January to December. Range II dominated forseven months namely February and March and June toNovember in this climatic zone. ETo values were found tooccur in Range I in months of January and December, RangeIII in the months of April and June, and Range IV in themonth of May coinciding with peak summer.
In the Tropical climatic zone, ETo varied from range II toIV from January to December. In this climatic zone also,range II continued for six months namely January, Augustto December. ETo values were found to occur in Range III inmonths of February, March and June, whereas summer monthsof April to June experienced ETo values in the range IV.
In the arid climatic zone, ETo varied from range II to Vfrom January to December. In this climatic zone, range IIIoccupied Five months namely February, March and August toOctober. ETo values were found to occur in Range II inmonths of January, November and December, Range III in themonths of February, March and August to October. ETo valuesof the months April and July fell in the Range IV where asthe ETo values of peak summer months fell in the Range V.
ConclusionsPrepared maps shall be useful in the areas of agriculture,ecological and water resources management. The calculatedmaximum daily reference evapotranspiration was found tovary from 4.71mm to 11.17mm at Bhaunagar and Indorerespectively. The calculated minimum daily referenceevapotranspiration varied from 0.61mm to 2.47mm atSrinagar and Darjeeling respectively. Maximum referenceevapotranspiration has been observed to occur in the monthof May and minimum reference evapotranspiration in themonth of January. In the Alpine climatic zone, ReferenceEvapotranspiration varied from range I to III from Januaryto December. In the Sub Tropical climatic zone, ETo variedfrom range I to IV from January to December. In theTropical climatic zone, ETo varied from range II to IV fromJanuary to December. In the arid climatic zone, ETo variedfrom range II to V from January to December.
References
Ahmed, S.A.H., (1999). “Grass ET estimates using Penmantype equations in Central Sudan”, Journal of Irrigation andDrainage engineering, Vol.125 No.6: 324-329, ASCE.
Allen, R.G., Periera, L.S., Raes, D., Smith, M., (1998).“Crop evapotranspiration: Guidelines for computing croprequirements”. Irrigation and Drainage Paper No. 56, FAO, Rome,Italy, 300 pp.
Amatya, D.M., Skaggs, R.W., Gregory, J.D., (1995).“Comparison of methods for estimating REF-ET”, Journalof Irrigation and Drainage Engineering, Vol.121, No.6:427-435, ASCE.
Betts, A. K., Chen, F., Mitchell, K. E., and Janjic, Z.I. 1997 “Assessment of the land surface and boundarylayer models in two operational versions of the NCEP ETamodel using FIFE data” Mon. Weather Rev., 125, 2896–2916.
George, B.A., Reddy, B.R.S., Raghuswamy, N.S.,Wallender,W.,(2002). “Decision support system forestimating reference evapotranspiration”, Journal ofIrrigation and Drainage Engineering, Vol.128, No.1: 1-10,February, ASCE.
Giridhar,M.V.S.S., Viswnadh G.K., and Kanaka Durga. P.,2004 “Comparison of reference evapotranspirationequations in Andhra Pradesh, India” Pros ofinternational conference at Omaha, Nebraska, U.S.A.,organized by ASCE, EWRI, during 21st-25th March 2006.
Lakshman Nandagiri and Gicy M.Kovoor (2006) “Performanceevaluation of reference evapotranspiration equationsacross a range of Indian conditions” J. Irrig. andDrain. Engg., Volume 132,Issue 3, pp.238-249.
Monteith J. L. (1965) Evaporation and environment. InThe State and Movement of Water in Living Organisms.Proceedings of the 19th Symposium, Society of
Experimental Biology, Cambridge University Press,London.
Shih, S.F., Allen, L.H., Jr., Hammond, L.C., Jones,J.W., Rogers, J.S.,Smajstrala, A.G., (1981). “Comparisonof Methods of Evapotranspiration Estimates”, AmericanSociety of Agricultural Engineers Summer meeting,Orlando June 21-24 1981, Paper Number is 81-2015.
Sudeer Reddy.S., Jennifer.M.J., (2001).“Evaluation ofreference evapotranspiration methodogies and AFSIRS crop water usesimulation model”’ A technical report submitted to SJRWMD,110 PP
Viswanadh G.K., Giridhar M.V.S.S. and Kanaka DurgaP.2004 “Estimation of reference crop evapotranspirationby developing software- application to a sub basin ofthe river Krishna, India” International Conferenceduring 18th-20th December 2006, organized by AmericanSociety of Civil Engineers (ASCE), IIT, Kanpur, at IIT,Delhi, India.
Wigmosta, M. S., Vail, L., and Lettenmaier, D. P.1994,“A distributed hydrology-vegetation model for complexterrain”, Water Resources Research, 30, 1665–1679.
Fig. 1 Referenceevapotranspiration map for Fig. 2 Reference
the month of January evapotranspiration map for themonth of February
Fig. 3 Referenceevapotranspiration map forthe month of March
Fig. 4 Referenceevapotranspiration map for themonth of April
Fig. 5 Referenceevapotranspiration map forthe month of May
Fig. 6 Referenceevapotranspiration map forthe month of June
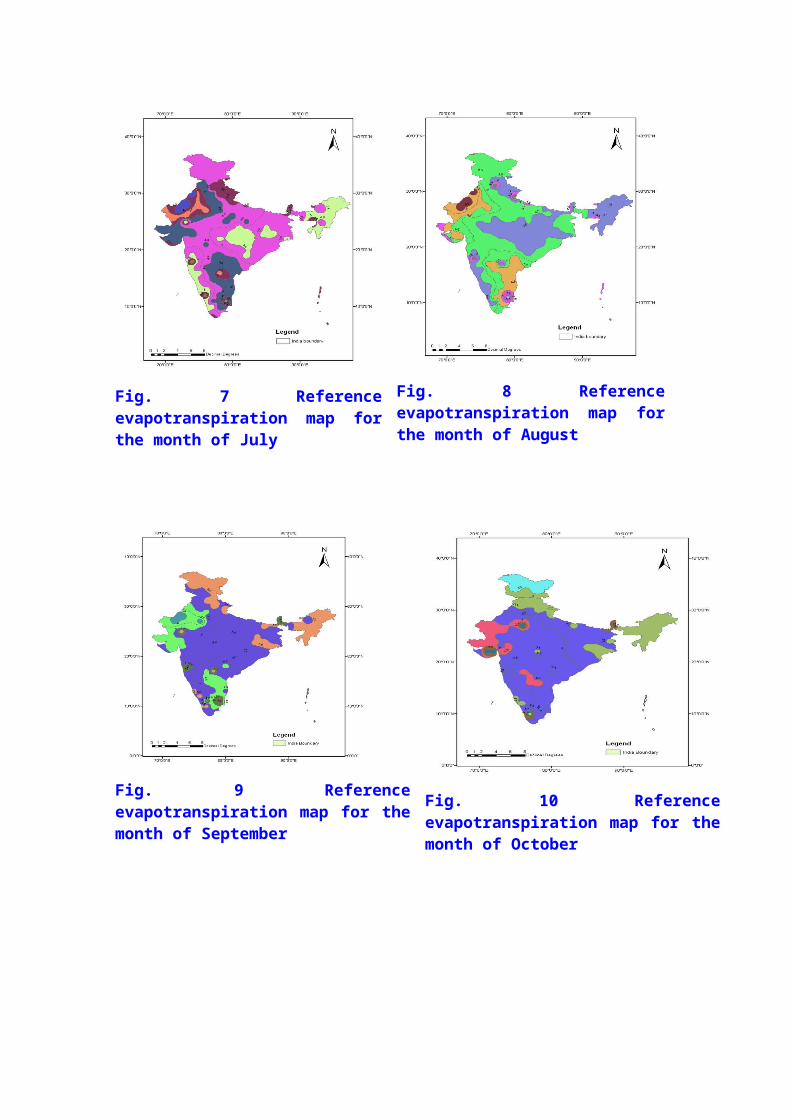
Fig. 7 Referenceevapotranspiration map forthe month of July
Fig. 8 Referenceevapotranspiration map forthe month of August
Fig. 9 Referenceevapotranspiration map for themonth of September
Fig. 10 Referenceevapotranspiration map for themonth of October

Fig. 11 Referenceevapotranspiration map for themonth of November
Fig. 12 Referenceevapotranspiration map for themonth of December
0
1
2
3
4
5
6
Jan Feb M ar Apr M ay Jun Jul Aug Sep Oct Nov Dec
ET Zon
e
Alpine Sub TropicalTropicalArid
Fig. 13 Variation of ET ranges with in the climatic zonesduring a year
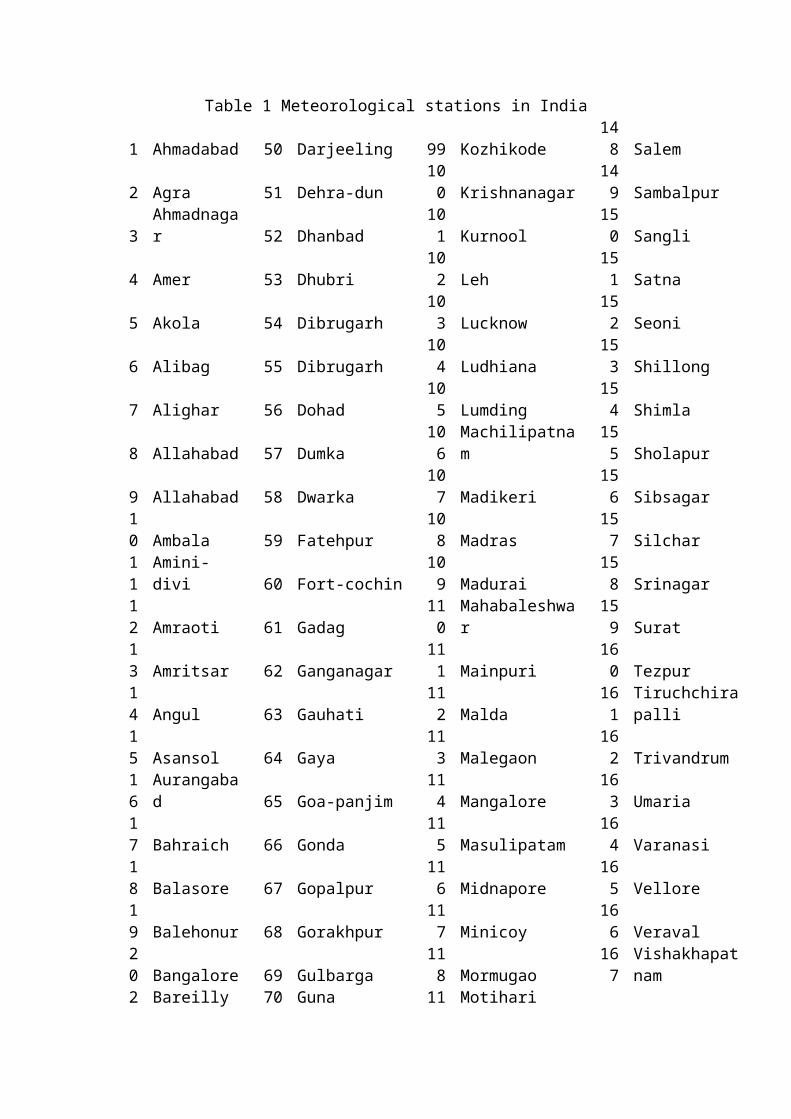
Table 1 Meteorological stations in India
1 Ahmadabad 50 Darjeeling 99 Kozhikode148 Salem
2 Agra 51 Dehra-dun100 Krishnanagar
149 Sambalpur
3Ahmadnagar 52 Dhanbad
101 Kurnool
150 Sangli
4 Amer 53 Dhubri102 Leh
151 Satna
5 Akola 54 Dibrugarh103 Lucknow
152 Seoni
6 Alibag 55 Dibrugarh104 Ludhiana
153 Shillong
7 Alighar 56 Dohad105 Lumding
154 Shimla
8 Allahabad 57 Dumka106
Machilipatnam
155 Sholapur
9 Allahabad 58 Dwarka107 Madikeri
156 Sibsagar
10 Ambala 59 Fatehpur
108 Madras
157 Silchar
11
Amini-divi 60 Fort-cochin
109 Madurai
158 Srinagar
12 Amraoti 61 Gadag
110
Mahabaleshwar
159 Surat
13 Amritsar 62 Ganganagar
111 Mainpuri
160 Tezpur
14 Angul 63 Gauhati
112 Malda
161
Tiruchchirapalli
15 Asansol 64 Gaya
113 Malegaon
162 Trivandrum
16
Aurangabad 65 Goa-panjim
114 Mangalore
163 Umaria
17 Bahraich 66 Gonda
115 Masulipatam
164 Varanasi
18 Balasore 67 Gopalpur
116 Midnapore
165 Vellore
19 Balehonur 68 Gorakhpur
117 Minicoy
166 Veraval
20 Bangalore 69 Gulbarga
118 Mormugao
167
Vishakhapatnam
2 Bareilly 70 Guna 11 Motihari
1 922 Barmer 71 Gwalior
120 Mount-abu
23 Baroda 72 Hanamkonda
121 Mukteshwar-
24 Belgaum 73 Hassan
122 Mussoorie
25 Bellary 74 Honavar
123 Mysore
26
Berhampore 75 Hazaribagh
124
Nagappattinam
27 Bhaunagar 76 Hoshangabad
125 Nellore
28 Bhopal 77 Hyderabad
126 New-delhi
29
Bhubaneswar 78 Indore
127 Nimach
30 Bhuj 79 Jabalpur
128 Nizamabad
31 Bidar 80 Jagdalpur
129 Nowgong
32 Bijapur 81 Jaipur
130 Pachmarhi
33 Bikaner 82
Jaipur-sanganer
131 Pamban
34 Bombay 83 Jalgaon
132 Patna
35 Burdwan 84 Jalpaiguri
133 Pendra-road
36 Calcutta 85 Jammu
134 Phalodi
37 Calcutta 86 Jamnagar
135 Poona
38 Chaibasa 87 Jamshedpur
136 Port-blair
39 Chandbali 88 Jhalawar
137 Puri
40
Chandrapur 89 Jhansi
138 Purnea
41
Cherrapunji 90 Jodhpur
139 Raichur
4 Chitradur 91 Kakinada 14 Raipur
2 ga 043
Coimbatore 92 Kalimpong
141 Rajkot
44 Coonoor 93
Kalingapatam
142 Ranchi
45 Cuddalore 94 Kanker
143
Rentachintala
46 Cuddapah 95 Kanpur
144 Roorkee
47 Cuttack 96 Khandwa
145 Sabaur
48
Caltonganj 97 Kodaikanal
146 Sagar
49 Carbhanga 98 Kota
147 Sagar-island
Table 2 Average monthly meteorological parameters in India
Month Avg Max. Temp (0C)
Avg. Min. Temp(0C)
Avg.RH (%)
Avg. Wind
speed (Km/day)
Avg.Sun
shinein
(hrs)
Avg. Rainfall in (mm)
January 25.39 12.3561.4
0 111.79 7.92 14.76February 27.72 14.30
55.02 123.77 8.40 15.62
March 31.87 18.1248.0
2 143.70 8.71 23.18
April 35.07 22.1247.0
8 167.00 8.80 45.21
May 35.07 22.1247.0
8 167.00 8.80 45.21
June 34.35 24.9665.3
6 222.68 6.44 198.17
July 30.93 23.9979.2
0 215.26 4.50 328.54
August 30.32 23.6281.0
6 188.74 4.67 287.57September 30.78 22.98
78.02 148.91 5.96 195.63
October 30.80 20.3368.0
8 108.49 7.54 95.34
November 28.40 15.85
63.11 100.06 7.99 42.28
December 25.94 12.80
63.40 103.59 7.92 19.92
Table 3 Monthly reference evapotranspiration (mm/day)
Month Avg. ET(mm/day
)
Min. ET(mm/day
)
Place Max. ET(mm/day)
Place
January 2.82 0.61 SRINAGAR 4.71 BHAUNAGARFebruary
3.56 0.94 LEH 6.28 BHAUNAGAR
March 4.69 1.58 SRINAGAR 7.81 BHAUNAGARApril 5.69 2.47 DARJEELING 9.14 INDOREMay 6.34 2.47 DARJEELING 11.17 INDOREJune 5.44 2.16 DARJEELING 9.82 PHALODIJuly 4.07 1.92 DARJEELING 8.37 TIRUCHCHIRAPALLIAugust 3.82 2.05 MUSSOORIE 7.76 TIRUCHCHIRAPALLISeptember
3.93 1.98 DARJEELING 6.52 TIRUCHCHIRAPALLI
October 3.84 2.2 SRINAGAR 6.04 JAIPURNovember
3.18 1.28 SRINAGAR 5.31 BHAUNAGAR
December
2.70 0.69 SRINAGAR 4.72 GOA-PANJIM
Table 4. Monthly minimum, maximum and average ETo
Sl. No RET range ETo (mm/day)1 I 0-22 II 2-43 III 4-64 IV 6-85 V 8-10
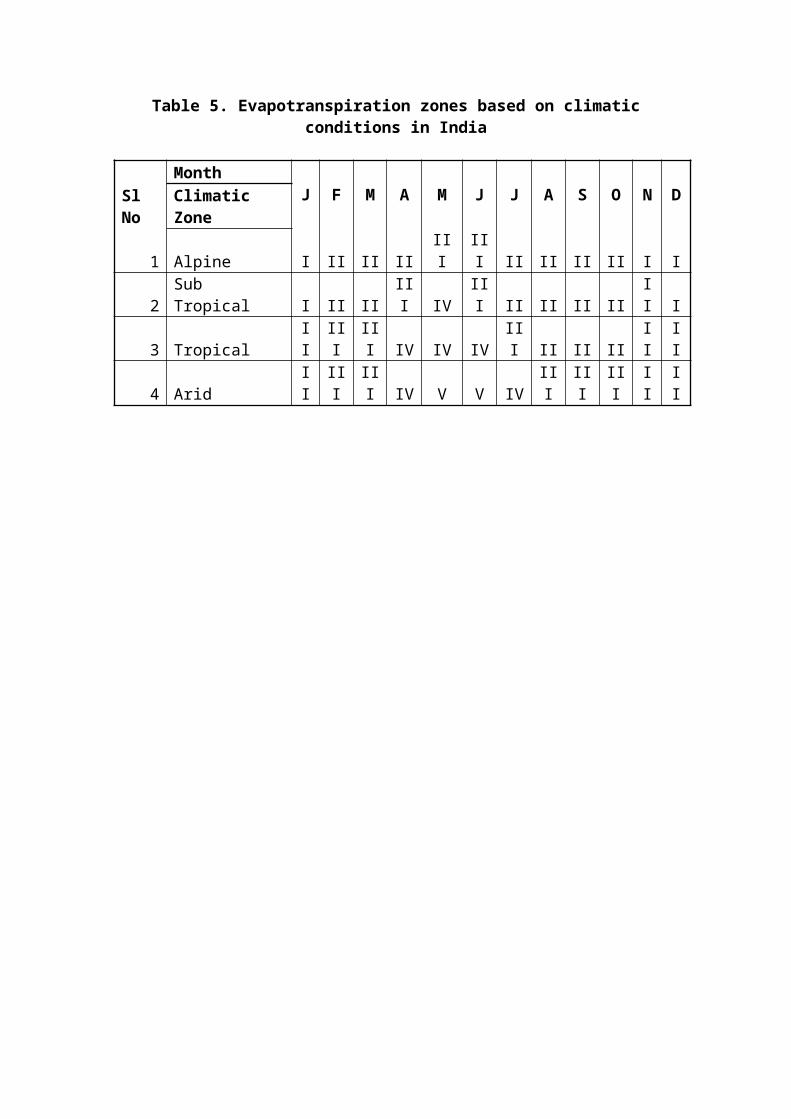
Table 5. Evapotranspiration zones based on climaticconditions in India
Sl No
MonthJ F M A M J J A S O N DClimatic
Zone
1 Alpine I II II IIIII
III II II II II I I
2Sub Tropical I II II
III IV
III II II II II
II I
3 TropicalII
III
III IV IV IV
III II II II
II
II
4 AridII
III
III IV V V IV
III
III
III
II
II