Mapping the spatial distribution of forest fire danger using GIS
13
int. j. geographical information systems, 1996, vol. 10, no. 3, 333± 345 Research Article Mapping the spatial distribution of forest ® re danger using GIS EMILIO CHUVIECO and JAVIER SALAS Departmento de Geografõ  a, Universidadde Alcala de Henares Colegios, 2 28801Alcala de Henares, Spain (Received 9 November 1993; accepted 19 July 1994) Abstract. A geographical information system (GIS) is proposed as a suitable tool for mapping the spatial distribution of forest ® re danger. Using a region severely a ected by forest ® res in Central Spain as the study area, topography, meteorological data, fuel models and human-caused risk were mapped and incorp- orated within a GIS. Three danger maps were generated: probability of ignition, fuel hazard and human risk, and all of them were overlaid in an integrated ® re danger map, based upon the criteria established by the Spanish Forest Service. GIS make it possible to improve our knowledge of the geographical distribution of ® re danger, which is crucial for suppression planning (particularly when hotshot crews are involved) and for elaborating regional ® re defence plans. 1. Introduction Forest ® res are a major concern in Spain, as well as in other Mediterranean countries, because of the environmental and human losses they cause. A total of 2 410916ha were a ected by ® res in Spain between 1980 and 1989, with losses totalling 443450million pesetas (more than 3000million ECU: ICONA 1991). Spain has the largest area of burned land within Europe, both because it is the most forested country within the European Mediterranean basin, and because it has the largest average burned area per ® re. However, considering the whole extent of forest land, Spain has a lower percentage of burned forest (0´9 per cent) than France (1´2 per cent), Italy (1´9 per cent) or Portugal (2´4 per cent) (Ve lez 1992). Factors related to both climate and human activity help explain the high incidence of forest ® res in the Mediterranean region: 1. Climate produces a long period of plant stress during the summer drought, which translates as low plant moisture and, as a result, high ¯ ammability. 2. Land use patterns have changed in Spain in the last thirty years. Traditionally, land use was balanced and ® re was used to improve grassland yields, but now many people have migrated to the cities and shrubs now cover much of the former grassland, increasing the amount of available fuel. On the other hand, urban residents use forested areas for recreational purposes, which together with careless agricultural practices, causes many ® res (ICONA 1991). 2. Use of GIS in forest ® re danger studies Creating a ® re danger index involves taking into account a wide range of factors, most commonly weather, fuel, and topography (Deeming et al . 1978, Delabraze 1982). (To avoid confusion in forest ® re terminology we have used ® re danger, ® re 0269± 3798/96 $12´00 Ñ 1996 Taylor & Francis Ltd.
Transcript of Mapping the spatial distribution of forest fire danger using GIS
int. j. geographical information systems, 1996, vol. 10, no. 3, 333± 345
Research Article
Mapping the spatial distribution of forest ® re danger using GIS
EMILIO CHUVIECO and JAVIER SALAS
Departmento de Geografõ a, Universidad de Alcala de Henares Colegios, 228801 Alcala de Henares, Spain
(Received 9 November 1993; accepted 19 July 1994)
Abstract. A geographical information system (GIS) is proposed as a suitabletool for mapping the spatial distribution of forest ® re danger. Using a regionseverely a ected by forest ® res in Central Spain as the study area, topography,meteorological data, fuel models and human-caused riskwere mappedand incorp-orated within a GIS. Three danger maps were generated: probability of ignition,fuel hazard and human risk, and all of them were overlaid in an integrated ® redanger map, based upon the criteria established by the Spanish Forest Service.GIS make it possible to improve our knowledge of the geographical distributionof ® re danger, which is crucial for suppression planning (particularlywhen hotshotcrews are involved) and for elaborating regional ® re defence plans.
1. Introduction
Forest ® res are a major concern in Spain, as well as in other Mediterraneancountries, because of the environmental and human losses they cause. A total of2410916ha were a ected by ® res in Spain between 1980 and 1989, with lossestotalling 443450million pesetas (more than 3000million ECU: ICONA 1991). Spainhas the largest area of burned land within Europe, both because it is the mostforested country within the European Mediterranean basin, and because it has thelargest average burned area per ® re. However, considering the whole extent of forestland, Spain has a lower percentage of burned forest (0 9 per cent) than France (1 2per cent), Italy (1 9 per cent) or Portugal (2 4 per cent) (Ve lez 1992). Factors relatedto both climate and human activity help explain the high incidence of forest ® res inthe Mediterranean region:
1. Climate produces a long period of plant stress during the summer drought,which translates as low plant moisture and, as a result, high ¯ ammability.
2. Land use patterns have changed in Spain in the last thirty years. Traditionally,land use was balanced and ® re was used to improve grassland yields, but nowmany people have migrated to the cities and shrubs now cover much of theformer grassland, increasing the amount of available fuel. On the other hand,urban residents use forested areas for recreational purposes, which togetherwith careless agricultural practices, causes many ® res (ICONA 1991).
2. Use of GIS in forest ® re danger studies
Creating a ® re danger index involves taking into account a wide range of factors,most commonly weather, fuel, and topography (Deeming et al. 1978, Delabraze1982). (To avoid confusion in forest ® re terminology we have used ® re danger, ® re
0269± 3798/96 $12 00 Ñ 1996 Taylor & Francis Ltd.

E. Chuvieco and J. Salas334
hazard and ® re risk as in Merril and Alexander, 1987). In dealing with all thesefactors, several variables must be considered, and their spatial integration may beimproved using a GIS, where both analytical and geographical relations are takeninto account.
Several GIS applications have been developed in the last decade to improvemanagement of forest ® res. Three major topics have been covered: ® re dangermapping, fuel management, and ® re e ects assessment. In the ® rst topic, di erentauthors have demonstrated the capacity of GIS to improve the spatial analysis of® re danger indices which are used for ® re-prevention and pre-suppression planning.The indices are mainly based on meteorological data (temperature, humidity, precip-itation), which are usually gathered from only a few weather stations although theyare used to estimate the conditions a ecting large territories. Therefore, it is assumedthat the stations properly characterise the spatial diversity of weather. Unfortunately,most of the time this assumption is far from true, because the weather stations arelocated in urban areas, at low elevations, and consequently do not represent condi-tions a ecting forest land well. GIS provides tools for spatial interpolation of weatherdata, and so a more complete view of the geographical diversity of ® re danger canbe obtained.
GIS can also spatially integrate several hazard variables, such as vegetation,topography, soil and ® re history, which are only considered from sample areas intraditional ® re danger systems. This capacity has been used to generate locallyoriented GIS-based danger models which cover a small area at high resolution(typically from 50 to 100 m grid size) (Cosentino et al. 1981, Brass et al. 1983, Burganand Shasby 1984, Gum 1985, Yool et al. 1985, Root et al. 1986, van Wyngarden andDixon, 1989). However, there is some experience with global, low resolution, ® redanger models (Werth et al. 1985; McKinley et al. 1985).
The critical point of these systems is the vegetation layer. Several studies havefound a close correlation between the spread and intensity of the ® re and fuelcharacteristics, such as size, plant moisture, compactness and density (Rothermel1983, Burgan and Rothermel 1984). Fire behaviour models have been developed fordi erent forest fuel types (Deeming et al. 1978, Andrews 1986). Several papers haveexplored the use of satellite remote sensing to generate data for these fuel modelsthrough digital image processing, using Landsat-MSS or TM images (Rabii 1979,Shasby et al. 1981, Salazar 1982, Agee and Pickford 1985), and NOAA-AVHRR(Miller and Johnston 1985, Sadowski and Westover 1986). Other variables frequentlyused for these GIS-based danger indices are weather information, topography and® re history (Brass et al. 1983, Yool et al. 1985, Chuvieco and Congalton 1989).
The following criteria are used for the combination of these variables:
(i) Use of qualitative criteria for assigningdanger values fromthe cross-relationsof the di erent variables (Brass et al. 1983, Yool et al. 1985)
(ii) Adaptation of standard danger indices, such as the U.S. National FireDanger Rating System (Agee and Pickford 1985) or some modules ofBEHAVE (Woods and Gossette 1992)
(iii) Creation of new danger models, based upon the selective weighting of thedanger variables (Chuvieco and Congalton 1989; Vliegher 1992)
(iv) Creation of locally-oriented models, where danger weights for each variableare obtained from multiple regressions computed for that particular area(Chou 1992).

Mapping the spatial distribution of forest ® re danger 335
Most of these models do not include the spatial distribution of human riskbecause of the di culty in modelling ® re-related activities, such as recreation andarson. This risk factor is particularly important for Mediterranean countries, wheremost of the ® res are caused by human activity. An approach to solving this di cultyhas been to model the spatial distribution of human risk indirectly, based uponauxiliary variables like accessibility and ® re incidence (Chuvieco and Congalton1989, Vega-GarcõÂ a et al. 1993).
GIS have also been applied to other ® re management topics. The most promisingare the location of look-out towers (Pawlina et al. 1990), dispatch planning (Salazarand Power 1988), ecological evolution after ® re (Lowell and Astroch 1989), and ® regrowth simulation (Davis and Burrows 1990, Vasconcelos and Guertin 1992).
3. Objectives
This paper presents a methodology for ® re danger mapping using GIS. In orderto simulate real conditions as closely as possible and provide an operational basiswe have employed the ® re danger system presently used by the Spanish ForestService (ICONA 1988). Our purpose was to map the spatial distribution of thedi erent components used in this system, as well as to integrate them in a simpleindex. We chose the variables which were most permanently associated with ® redanger, such as topography, fuel types and human activity. The spatial distributionof weather data was generated taking into account the topography of the study areaand using both interpolation and extrapolation techniques.
This method is an improvement of a previous GIS application to ® re dangermapping (Chuvieco and Congalton 1989). The earlier version considered ® ve vari-ables: vegetation, slope, aspect, elevation and human risk using a selective weightingstructure. Some re® nements are presented here to make the model more operational.These can be summarized as follows: new variables (illumination, texture, weatherdata), more objective criteria for weighting danger variables, and a new scheme forintegrating the variables into the synthetic ® re danger index.
4. Study area
The study area is located 150km west of the city of Madrid (® gure 1). It includes588sqkm of very rough terrain. Elevations range from 400 to 2000m, and the area
Figure 1. The study area.

E. Chuvieco and J. Salas336
is divided by Sierra de Gredos in the central mountains of the Iberian peninsula.Vegetation in mountain areas is mainly formed by Pinus pinaster and Pinus pinea,with some zones where Castanea sativa and Quercus pyrenaica are more common.Several types of xerophytic shrubs cover the higher elevations: Cytisus purgansand Retama sphaerocarpa are the most frequent. Lowlands include Quercus ilexrotundi folia and resinous shrubs such as Cistus laurifolius and Cistus ladanifer.
The climate of this area is characterized by mild temperatures (mean annualbetween 8ß and 14ß C) and medium-to-high rainfall (between 500 and 1500mm).Topography causes great variety in the area, with higher rainfall on the South slopes.Like most of central Spain, an intense summer drought a ects this area. Only 10per cent of the annual rain falls in summer (July, August and September), and mostof it is caused by severe storms. Temperatures above 30ß C are also fairly common,especially on the Southern slopes.
According to these characteristics, there is a high potential danger of forest ® rein the summer season. Indeed this area has been very severely a ected by ® res. Mostof them are caused by human activity, either carelessness or arson, but once startedthey are favoured by the steep slopes, highly ¯ ammable vegetation and intensesummer drought.
5. Structure of the ® re danger index
The structure of the ® re danger index used in this paper is summarized in ® gure 2.It is based in the system presently used by ICONA, the Spanish institution in chargeof forest ® re defence. ICONA’s system takes into account three di erent components:
1. Weather Danger Index (WDI). The most operational of these indices is theWDI (ICONA 1988, 1990b), which is computed three times per day for a set ofweather stations covering the main wildland areas of the country in order to organizesuppression resources. The WDI includes two factors: probability of ignition (PI)and wind. The former estimates the likelihood of ® ne dead fuel ignition. Its computa-tion is based on air temperature and relative humidity, plus fuel conditions (itstopographic situationand exposure). Wind velocity and dryness are considered alongwith PI to establish three danger categories: low-moderate, high and extreme.
Figure 2. The framework of the forest ® re risk model.
Mapping the spatial distribution of forest ® re danger 337
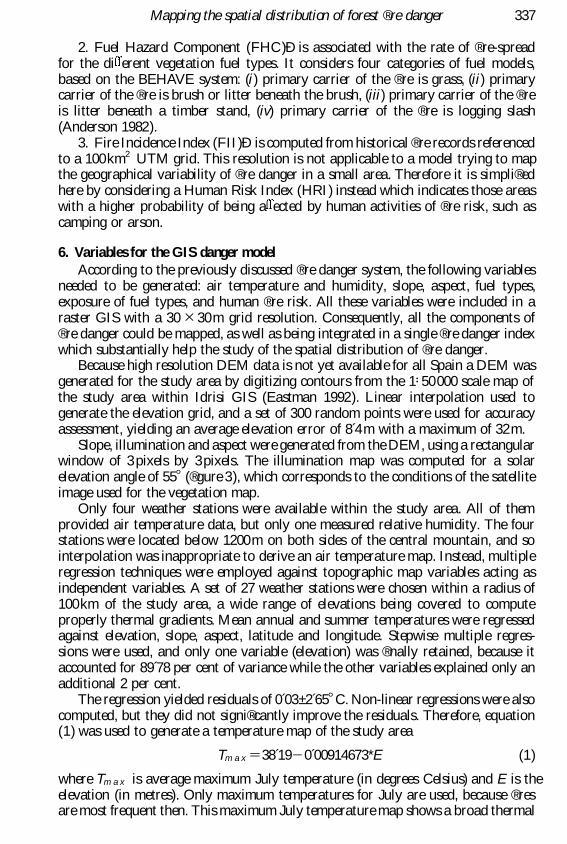
2. Fuel Hazard Component (FHC)Ð is associated with the rate of ® re-spreadfor the di erent vegetation fuel types. It considers four categories of fuel models,based on the BEHAVE system: (i) primary carrier of the ® re is grass, (ii) primarycarrier of the ® re is brush or litter beneath the brush, (iii) primary carrier of the ® reis litter beneath a timber stand, (iv) primary carrier of the ® re is logging slash(Anderson 1982).
3. Fire Incidence Index (FII)Ð is computed from historical ® re records referencedto a 100km2 UTM grid. This resolution is not applicable to a model trying to mapthe geographical variability of ® re danger in a small area. Therefore it is simpli® edhere by considering a Human Risk Index (HRI) instead which indicates those areaswith a higher probability of being a ected by human activities of ® re risk, such ascamping or arson.
6. Variables for the GIS danger model
According to the previously discussed ® re danger system, the following variablesneeded to be generated: air temperature and humidity, slope, aspect, fuel types,exposure of fuel types, and human ® re risk. All these variables were included in araster GIS with a 30 Ö 30m grid resolution. Consequently, all the components of® re danger could be mapped, as well as being integrated in a single ® re danger indexwhich substantially help the study of the spatial distribution of ® re danger.
Because high resolution DEM data is not yet available for all Spain a DEM wasgenerated for the study area by digitizing contours from the 1550000 scale map ofthe study area within Idrisi GIS (Eastman 1992). Linear interpolation used togenerate the elevation grid, and a set of 300 random points were used for accuracyassessment, yielding an average elevation error of 8 4m with a maximum of 32m.
Slope, illumination and aspect were generated from the DEM, using a rectangularwindow of 3pixels by 3pixels. The illumination map was computed for a solarelevation angle of 55ß (® gure 3), which corresponds to the conditions of the satelliteimage used for the vegetation map.
Only four weather stations were available within the study area. All of themprovided air temperature data, but only one measured relative humidity. The fourstations were located below 1200m on both sides of the central mountain, and sointerpolation was inappropriate to derive an air temperature map. Instead, multipleregression techniques were employed against topographic map variables acting asindependent variables. A set of 27 weather stations were chosen within a radius of100km of the study area, a wide range of elevations being covered to computeproperly thermal gradients. Mean annual and summer temperatures were regressedagainst elevation, slope, aspect, latitude and longitude. Stepwise multiple regres-sions were used, and only one variable (elevation) was ® nally retained, because itaccounted for 89 78 per cent of variance while the other variables explained only anadditional 2 per cent.
The regression yielded residuals of 0 03± 2 65ß C. Non-linear regressions were alsocomputed, but they did not signi® cantly improve the residuals. Therefore, equation(1) was used to generate a temperature map of the study area
Tm a x =38 19Õ 0 00914673*E (1)
where Tm a x is average maximum July temperature (in degrees Celsius) and E is theelevation (in metres). Only maximum temperatures for July are used, because ® resare most frequent then. This maximum July temperature map shows a broad thermal

E. Chuvieco and J. Salas338
Figure 3. Illumination image at 55ß solar elevation angle. Mountain range of Sierra deGredos is evident in the centre of the study area.
contrast between the valleys and the highest areas (® gure 4) of as much as 14ß Cfrom the elevation range of 1600m.
Relative air humidity, could not be generated by regression techniques, becausefew of the weather stations measured this variable. Consequently, they were extrapol-ated from simple bioclimatological models (Hungerford et al. 1989) which requireelevation data for the whole study area, water pressure at dew point temperature
Figure 4. Average July maximum temperature of the study area estimated with linearregression.

Mapping the spatial distribution of forest ® re danger 339
and current temperature from a base weather station. Relative humidity is estimatedfor the other cells from the thermal gradient and the hydrostatic equation. A uniformatmosphere and a constant absolute humidity are assumed. Estimation errors forsummer air humidity using one test weather station were under 1 per cent.
The third variable to be considered in the ICONA’s danger index was vegetation.From a forest ® re danger perspective, vegetation must be classi® ed according to fueltypes. ICONA has developed a photographic key of fuel models for the Spanishlandscapes (ICONA 1990a), which adapts the ones developed for the BEHAVEprogramme (Anderson 1982, Burgan and Rothermel 1984). As this programmemainly considers surface ® res, fuel types are de® ned by understorey vegetation,instead of vegetation canopy and this greatly complicates their discrimination fromremote sensing data. The study area contained the following fuel models: (1) shortgrass, (2) grass and litter understorey, (4) tall shrub, (5) brush, (6) dormant brush,(7) brush beneath a timber stand, and (9) litter.
The fuel-type map was generated from six non-thermal bands of a LandsatThematic Mapper image from July 1988 which were geometrically corrected tomatch the topographic variables using 20ground control points and cubic convolu-tion. Because of the di culties in discriminating among the fuel types on the basisof spectral information only (Rabii 1979), elevation slope and illumination wereintegrated with the Landsat spectral bands as well as two texture images to accountfor the spatial variability of vegetation types.
Both supervised and unsupervised classi® cation strategies were adopted. Finally,a mixed procedure was selected for generating the fuel-type map. A set of 144test® elds were veri® ed on the ® eld for accuracy assessment. The overall accuracy was75per cent, with a kappa value of 0 7.
Two approaches can be taken to deriving the human risk index (HRI). Thespatial distribution of hazardous human activities can be examined. Some factors ofhuman risk are spatially concrete, such as recreation and dry grass burning, whichtend to be associated with particular areas. However, some of the most signi® -cant human-related factors, such as arson, do not have a clear spatial pattern.Therefore, complete mapping of human risk factors is very complex. Alternativelythe spatial pattern of human risk can be derived from the location of ® re ignitionsites, because most of the ® res in the study area are man caused. Here, thereforeHRI is found by computing a contingency table between ® re ignition sites, asdescribed by ® re records, and the total area of these places (table 1). Unfortunately,® re records use very general terms to locate the ® re source, for example, near aroad’ or close to a trail’. This is taken to be within a 30m corridor from any road,
Table 1. Location of 286 ® re ignition sources in the past 15 years.
RecreationalRoads Trails areas Others Total
Number of Fires 77 45 13 161 296Surface covered (in percentage) 1 9 8 7 0 5 88 9 100Expected ® res* 5 6 25 8 1 5 2631 296
(*) Expected ® res were calculated as a proportion of the total number of ® res and the areacovered in each location.
Computed chi-squared is 1897 which is signi® cant at 99 per cent con® dence level.

E. Chuvieco and J. Salas340
Table 2. Weights assigned to the Human Risk Index (HRI).
Location Risk weight
Roads 23Recreational areas 14Trails 3No pathways 1
trail or recreational area, which had previously been digitized from the 1550000topographic maps.
The Chi-squared value was found to be signi® cant at 99 per cent probability,with a contingency coe cient (cà ) of 0 894. Therefore, the spatial association betweenhuman-caused ® res and accessibility to wildland areas was proven. Our HRI wasbased on this observation. Weights were obtained from the relations between thepercentage of ® re number versus percentage of total area. Zones without roads andtrails had a weight of 1, while the other extreme, road corridors were assigned avalue of 23, because ® res startednear these zones are 23 times more frequent (table 2).
7. Fire danger map
The Fire Danger map is derived from integration of these variables began withderiving the WDI. As stated above, the WDI has two components: (i ) probability ofignition (PI), and (ii) wind speed and direction. Wind data have not been includedin the present research because, (i ) no direct dataare available for the zone, (ii) modelsof wind propagation are still quite limited (Zack 1989), and (iii) wind is very dynamicover time, and therefore it is very di cult to select signi® cant average values.
The process for the PI map started with the air temperature and relative airhumidity maps using a set of tables derived from ICONA (1988), base fuel moisturewas computed for every cell of the study area. This base moisture was calculatedfrom air temperature and relative humidity. Afterwards, this base fuel moisture wascorrected by considering local topography and fuel exposure (proportion of shade),again using the ICONA tables. This correction depends on the fuel moisture base,and considers two categories of slope (under 30 per cent and above 30 per cent),four classes of aspect (North, South, West and East), and two fuel exposures (exposedand covered). To apply these corrections within the GIS, slope and aspect mapswere recoded to the intervals proposed by ICONA and fuel exposure was obtainedfrom the fuel type map by considering the presence or absence of tree cover.
Final calculation of PI needed another table provided by ICONA, which requiredthe corrected fuel moisture, air temperature and fuel exposure. Final values of PI inthe study area ranked from 100per cent to 50per cent. High probability valuesindicate the most dangerous situation. The predominance of these high values isobviously related to the speci® c weather conditions used in calculating the base fuelmoisture. The spatial distribution of PI is clearly related to topographic conditions,which also in¯ uence vegetation. A strong contrast between the valleys and Sierra deGredos is evident.
It is quite important to note that GIS techniques have made it possible to takeinto account the topographic and vegetation diversity of the study area for computingPI values. Within a conventional framework, the base and corrected fuel moisturewould have been computed from the characteristics of just a single point (the weather

Mapping the spatial distribution of forest ® re danger 341
Table 3. Estimation of rate of spread for di erent fuel types.
Mainand Haines AMA and Local conditionsAnderson (1982) (1983) Tragsatec (1993) (1993)*
Fuelmodel Rank ROS Rank ROS Rank ROS Rank ROS
1 1 39 0 6 10 5 2 91 0 2 39 02 3 17 5 4 12 9 3 51 0 3 14 04 2 37 5 1 86 4 1 1380 1 51 05 6 9 0 2 27 9 6 24 0 6 9 06 4 15 0 5 12 0 4 34 0 4 14 07 5 10 0 3 15 0 5 29 0 5 11 09 7 3 7 7 2 4 7 7 0 7 3 0
ROS=Rate of Spread (metres/minutes). For fuel model description, see text.(*) Local conditions are based on BEHAVE calculations for our study area and the
weather data used in this project.
station), and as a result a single PI value would have de® ned the whole study area.Using GIS, we can obtain a basic insight into the geographical distribution of boththe danger variables and the PI, even when a single weather station is used as theprimary data source.
The second component of the Danger Index is the Fuel Hazard Component(FHC). The FHC is derived from the fuel types map. In order to calculate a syntheticdanger index, this map had to be converted from a nominal to an interval scale.This conversion is based on the estimated rate of spread of the di erent fuel types.The most generally used model for calculating rate of spread is based on theBEHAVE programme (Rothermel 1983). In table 3 di erent rates of spread estima-tions are presented for the fuel types of our study area under diverse weatherconditions. We have also included the results of running BEHAVE on our fuel typeswith the previously reported weather data. The results are fairly similar to otherresearch with the exception of the work by Main and Haines (1983). Since theseauthors operated in very di erent environmental conditions from ours, this deviationis probably not signi® cant. Therefore, our results are good indicators of the rate ofspread for the di erent fuel types in our climate. Final weights for each fuel typewere calculated proportionally to its rate of spread, scaling down from the mostdangerous, model 4 (shrub), which was assigned a value of 10 (table 4).
The Human Risk Index (HRI) was obtained using corridors of 30 meters fromany road and trail in the study area and combined with all recreational areas within
Table 4. Weights assigned to the Fuel Hazard Component (FHC).
Fuel model ROS Hazard value
1 39 7 62 14 2 74 51 10 05 9 1 86 14 2 77 11 2 29 3 0 6
ROS=Rate of Spread (metres/minutes)

E. Chuvieco and J. Salas342
forest land. The HRI was organized into four groups (table 2) with weights propor-tional to frequency of ® re starts versus area covered for each accessibility category.
Final integration of the three components (PI, FHC and HRI) to generate theFire Danger Index (FDI) was performed using (2)
FDI=PI/10*FHC+HRI (2)
The ® rst two factors, the PI and the FHC are multiplicative, following the ICONAcriteria. We decided to include HRI, which is not presently used by ICONA, as anadditive factor, because it is less spatially continuous than the other two. Forestrypersonnel with ICONA agree with this formula.
The FDI was calculated on a cell by cell basis, and generated a danger map overthe entire study area. The geographical distribution of ® re danger shows the spatialrelationships of the main variables associated with the starting or spreading of the® re. The whole range of ® re danger values was recoded to four categories (extreme,high, moderate and low) to make map production easier (® gure 5). Higher valuesare found in the valleys of the study area, because they include the most criticalmeteorological conditions (higher temperatures, lower relative humidity) and presentthe most dangerous fuel models (pastures and tall shrub). Road and path corridorsare also evident, especially on the pine covered southern slopes of Sierra de Gredos,where the associated corridors increase the danger from moderate to high.
This map shows the spatial distribution of ® re danger when a high hazardscenario is considered, because of the temperature and air humidity values we usedas a basis for calculations. Similar maps might be generated for speci® c days or forlonger periods. In these cases, daily or average danger maps respectively might alsobe produced.
8. Accuracy assessment
As we did not try to introduce a new ® re danger model, validation of results isrelated to the performance of the model itself. According to ICONA’s statistics,
Figure 5. Final Fire risk map: (1) Low, (2) Moderate, (3) High and (4) Extreme risk.

Mapping the spatial distribution of forest ® re danger 343
during the summer of 1993 more than 96 per cent of ® res larger than 500ha haveoccurred in high to extreme danger conditions (levels 2 and 3 of the ICONA’s ® redanger system). These data refer to the WDI, which is one of the main componentsof the model presented in this paper. No validation data are available on thereliability of FHC andthe HRI to predict spatial distribution of ® re danger. However,as the FHC is based on BEHAVE calculations, which are generally accepted as goodpredictors of rate of spread, and the HRI relies on ® re statistics, both can be assumedto be closely related to ® re danger. Unfortunately for the validation process, butluckily for the landscape itself, the study area has not been a ected by large forest® res recently and consequently no spatial accuracy assessment could be done.
9. Conclusions
The methodology outlined in this paper o ers a simple approach to obtain ® redanger maps, by considering the spatial distribution of factors a ecting the startingor spreading of a ® re. The actual implementation of this method may be done in afew weeks, using low-cost software.
Fire danger maps are quite relevant for prevention and suppression purposes.They can help to design regional ® re defense plans, which include fuel managementpractices and vigilance controls, such as ® re-break design, dispatch, prescribed burn-ing, look-out tower location, etc. The method is cost e ective and makes it possibleto cover a whole territory with good spatial resolution, something that is not feasiblewith traditional ® re danger methods. Also the GIS generated for this model can alsobe used for other purposes, such as training hotshot crews when they are not familiarwith the ® re area.
Acknowledgments
This research was funded by the Servicio Nacional de Defensa contra IncendiosForestales of the Spanish Forest Service (ICONA), institution in charge of forest ® redefense. The authors wish to thank Ricardo Ve lez for his suggestions for the modeldesign. Partial funding was also obtained from the MINERVE-1 project, funded bythe Environment program of the European Community (DG-XII). We also wish tothank C.F. Warren of the I.C.E. at the University of Alcala de Henares for herlinguistic assistance.
ReferencesAgee, J. K. and Pickford, S. G. 1985, Vegetation and fuel mapping of North Cascades
National Park. Final Report, College of Forest Resources. Seattle.AMA and Tragsatec., 1993, Plan de proteccio n contra incendios de los ecosistemas forestales
de la Comunidad Auto noma de Madrid, unpublished, Madrid.Anderson, H. E., 1982, Aids to determining fuel models for estimating ® re behavior, USDA
Forest Service, Ogden, UT.Andrews, P. L., 1986, BEHAVE. Fire behavior prediction and fuel modelling system. Burn
subsystem, USDA Forest Service, Ogden, UT.Brass, J., Likens, W. C., and Thornhill, R. R., 1983, Wildland Inventory for Douglas and
Carson City Counties, Nevada, Using Landsat and Digital Terrain Data, NASATechnical Paper 2137, Mo et Field.
Burgan, R. E., and Rothermel, R. C., 1984, BEHAVE: Fire Behavior Prediction and FuelModelling System. Fuel Subsystem, USDA Forest Service. Ogden, Utah.
Burgan, R.E., and Shasby, M. B., 1984, Mapping broad-area ® re potential from digital fuel,terrain, and weather data. Journal of Forestry, 82, 228± 31.
Chou, Y. H., 1992, Management of wild® res with a Geographical Information System.International Journal of Geographic Information Systems, 6, 123± 40.

E. Chuvieco and J. Salas344
Chuvieco, E., and Congalton, R. G., 1989, Application of remote sensing and GeographicInformation Systems to forest ® re hazard mapping. Remote Sensing of Environment,29, 147± 59.
Cosentino, M. J., Woodcock, C. E., and Franklin, J., 1981, Scene analysis for wildland® re-fuel characteristics in a Mediterranean climate. In Proceedings of 15th InternationalSymposium on Remote Sensing of Environment (Ann Arbor, MI, ERIM), pp. 635± 46.
Davis, F. W., and Burrows, D. A., 1990, Spatial simulation of ® re regime in Mediterraneanclimate landscapes, Draft Manuscript. Unpublished report.
Deeming, J. E., Burgan, R. E., and Cohen, J. D., 1978, The National Fire-Danger RatingSystem, U.S. Department of Agriculture, Forest Service, Ogden, UT.
Delabraze, P., 1982, Les criteries d’evaluation des risques d’incendies de forets. In Forest ® reprevention and control. Martinus Nijho /Junk Publications, The Hague: pp. 62± 76.
Eastman, R., 1992, IDRISI. A Grid-based Geographic Analysis System, v. 4.0, Clark University,Graduate School of Geography, Worcester.
Gum, P. W., 1985, Computerization of ® re dispatch utilizing satellite imagery OkanoganProject’. In Proceedings of the Pecora X Symposium (Bethesda, MD: ASPRS),pp. 315± 25.
Hungerford, R. D., Nemani, R. R., Running, S. W., and Coughlan, J. C., 1989, MTCLIM:A Mountain Microclimate Simulation Model, Research Paper INT-414, U.S.Department of Agriculture, Forest Service, Ogden.
ICONA, 1988, Experimentacio n de un nuevo sistema para determinacio n del peligro deincendios forestales derivado de los combustibles. Instrucciones de ca lculo, ICONA,Area de Defensa contra Incendios Forestales, Madrid.
ICONA, 1990a, Clave fotogra ® ca para la identi® cacio n de modelos combustibles. ICONA,Area de Defensa contra Incendios Forestales, Madrid.
ICONA, 1990b, V Curso Superior sobre defensa contra incendios forestales. ICONA, Areade Defensa contra Incendios Forestales, Madrid.
ICONA, 1991, Los incendios forestales en EspanÄ a durante 1990. Ministerio de Agricultura,Pesca y Alimentacio n, Madrid.
Lowell, K. E., and Astroh, J. H., 1989, Vegetative succession and controlled ® re in a gladesecosystem. International Journal of Geographic Information Systems, 3, 69± 81.
Main, W. A., and Haines, D. A., 1983, Determining appropriate fuel models from ® eldobservations and a ® re characteristics chart. Seventh National Conference on Fire andForest Meteorology, Fort Collins, pp. 47± 52.
McKinley, R. A., Chine, E. P., and Werth, L. F., 1985, Operational ® re fuels mapping withNOAA-AVHRR data. In Proceedings of the Pecora X Symposium (Bethesda, MD:ASPRS), pp. 295± 304.
Merril, D. F., and Alexander, M. E., 1987, Glossary of Forest Fire Management Terms(Ottawa, Ontario: National Research Council Canada), 4th Edition.
Miller, W. and Johnston, D. 1985. Comparison of ® re fuel maps produced using MSS andAVHRR data. In Proceedings of the Pecora X Symposium (Bethesda, MD: ASPRS),pp. 305± 314.
Pawlina, M. W., Buckley, D. J., and Strickland, R., 1990, Automation of visible areamapping for ® re detection lookouts. In Proceedings of the GIS’90 Symposium,Vancouver, pp. 29± 46.
Rabii, H. A., 1979, An Investigation of the Utility of Landsat-2 MSS Data to the Fire-DangerRating Area, and Forest Fuel Analysis within Crater Lake National Park, Oregon,Oregon State University, Ph.D. dissertation.
Root, R. R., Stitt, S. C. F., Nyquist, M. O., Waggoner, G. S., and Agee, J. K., 1986,Vegetation and ® re fuel models mapping of North Cascades National Park. ACSM-ASPRS Annual Convention. Technical Papers, (Bethesda, MD: ACSM-ASPRS), vol3, 78± 85.
Rothermel, R. C., 1983, How to predict the spread and intensity of forest and range ® res,USDA Forest Service. Ogden, UT.
Sadowski, F. G., and Westover, D. E., 1986, Monitoring the ® re-danger hazard of Nebraskarangelands with AVHRR data. Proceedings of 10th Canadian Symposium on RemoteSensing, Edmonton, pp. 355± 63.

Mapping the spatial distribution of forest ® re danger 345
Salazar, L. A., 1982, Remote Sensing Techniques Aid in Preattack Planning for FireManagement, Report, Paci® c Southwest Forest and Range Experiment Station,Berkeley.
Salazar, L. A., and Power, J. D., 1988, Three-dimensional representations for ® re manage-ment planning: a demonstration. In Proceedings of GIS’88, San Antonio, TX. Vol. 2,pp. 948± 960.
Shasby, M. B., Burgan, R. E., and Johnson, R. R., 1981, Broad area forest fuels andtopography mapping using digital Landsat and terrain data. Proceedings of 7thInternational Symposium on Machine Processing of Remotely Sensed Data, WestLafayette, pp. 529± 537.
van Wyngarden, R., and Dixon, R., 1989, Application of GIS to model forest ® re rate ofspread, In Proceedings of Challenge for the 1990’s GIS, Ottawa pp. 967± 977.
Vasconcelos, M., and Guertin, D. P., 1992, FIREMAP. Simulation of ® re growth with aGeographic Information System. International Journal of Wildland Fire, 2, 87± 96.
Vega-GARCIÂ A, C., Woodard, P. M., and Lee, B., 1993, Geographic and temporal factors thatseem to explain human-caused ® re occurrence in Whitecourt forest, Alberta. InProceedings of the GIS’93 Symposium, Vancouver, pp. 115± 119.
Ve’lez, R., 1992, Recent history of forest ® res in the Mediterranean region. Forest FiresDanger and Management. In Proceedings of European School of Climatology andNatural Hazards, Porto Carras (in press).
Vliegher, B. M. de, 1992, Risk assessment for environmental degradation caused by ® resusing remote sensing and GIS in a Mediterranean region (South Euboia, CentralGreece). In Proceedings of the Integrated Geological Applications of Remote Sensing(IGARSS ’92) Conference, Houston, pp. 44± 47.
Werth, L. F., McKinley, R. A., and Chine, E. P., 1985, The use of wildland ® re fuel mapsproduced with NOAA-AVHRR scanner data. In Proceedings of the Pecora XSymposium, (Bethesda, MD.: ASPRS), pp. 326± 331.
Woods, J. A., and Gossette, F., 1992, A Geographic Information System for brush ® re hazardmanagement, In Proceedings of ACSM-ASPRS Annual Convention, Washington,pp. 56± 65.
Yool, S. R., Eckhardt, D. W., Estes, J. E., and Cosentino, M. J., 1985, Describing thebrush® re hazard in southern California. Annals of the Association of AmericanGeographers, 75, 417± 430.
Zack, J. A., 1989, Integration of Geographic Information Systems with a diagnostic wind® eld model in complex terrain for ® re management, M.S. Thesis, University ofCalifornia Riverside.